Embed Size (px)
Citation preview
AASHTOWare BrM 5.2.3 Deterioration and LCCA
April 26, 2017 Mesa, Arizona
BrM Help Desk AASHTOWareBridge.com
[email protected] JIRA tickets: bridgeware.atlassian.net
Josh Johnson, PE TAM Lead Engineer [email protected]
• Contact • Element
Deterioration • NBI/Component
Deterioration • NBI Conversion • LCCA
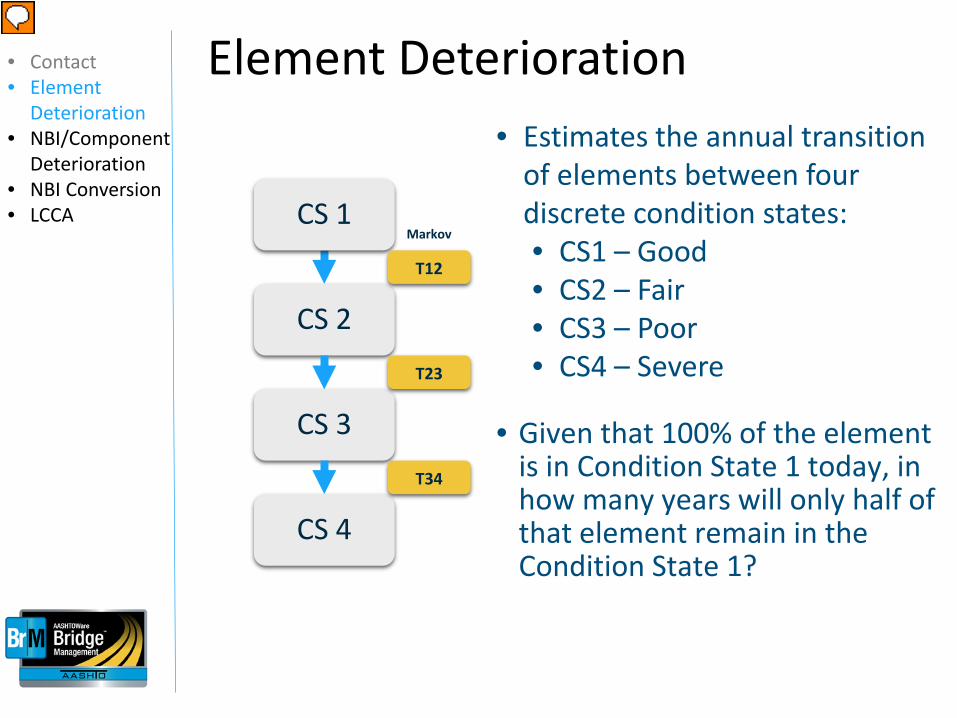
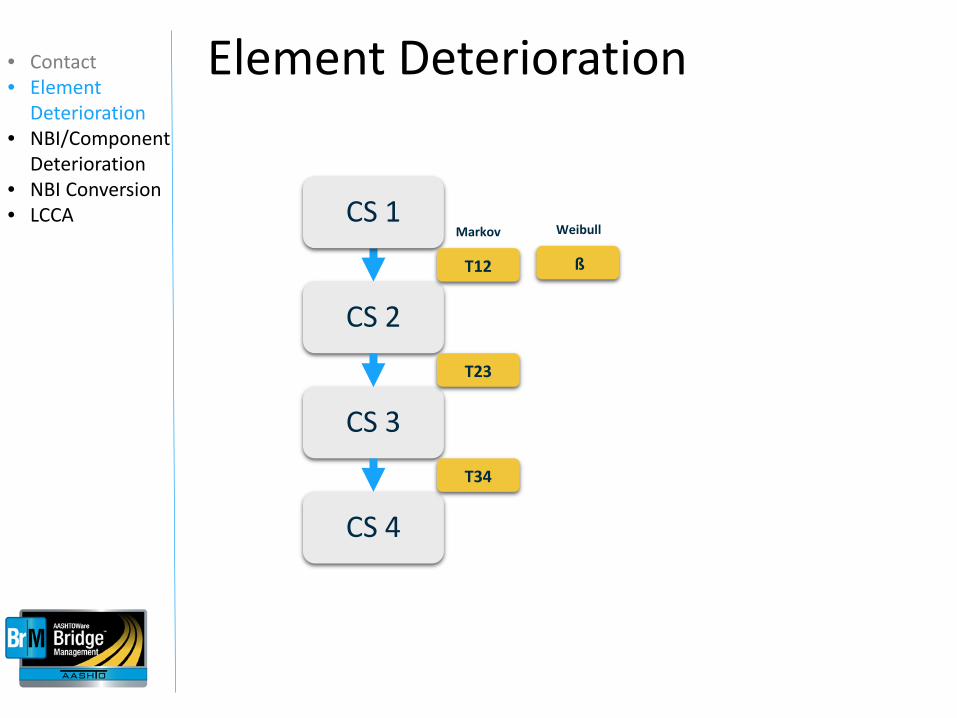
Element Deterioration
CS 1
CS 2
CS 3
CS 4
T12
T23
T34
Markov
• Estimates the annual transition of elements between four discrete condition states: • CS1 – Good • CS2 – Fair • CS3 – Poor • CS4 – Severe
• Given that 100% of the element
is in Condition State 1 today, in how many years will only half of that element remain in the Condition State 1?
• Contact • Element
Deterioration • NBI/Component
Deterioration • NBI Conversion • LCCA
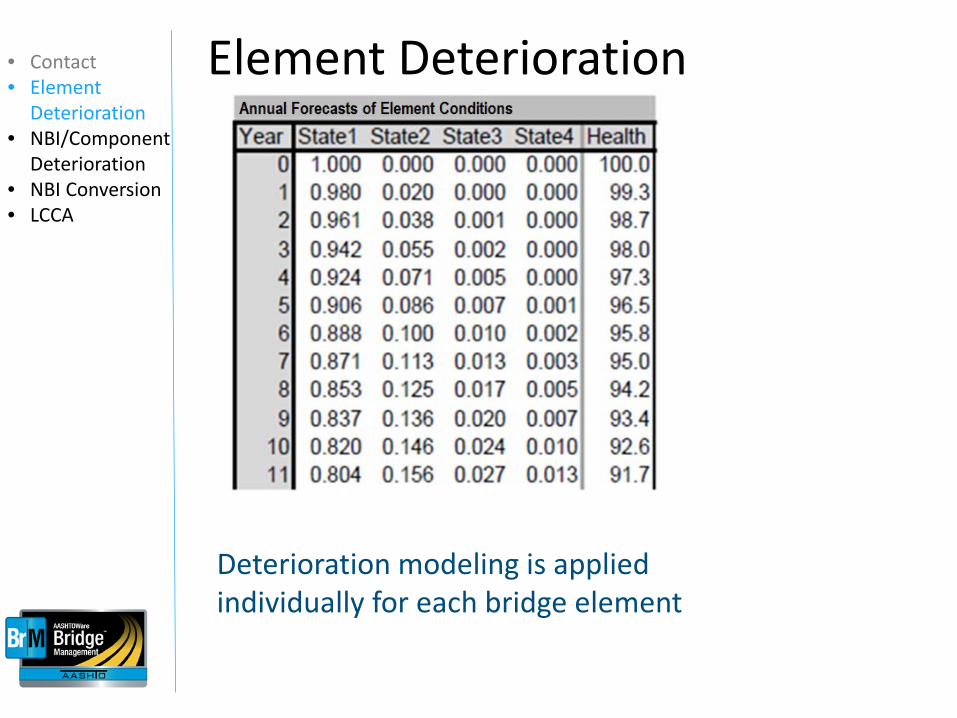
Deterioration modeling is applied individually for each bridge element
• Contact • Element
Deterioration • NBI/Component
Deterioration • NBI Conversion • LCCA
Element Deterioration
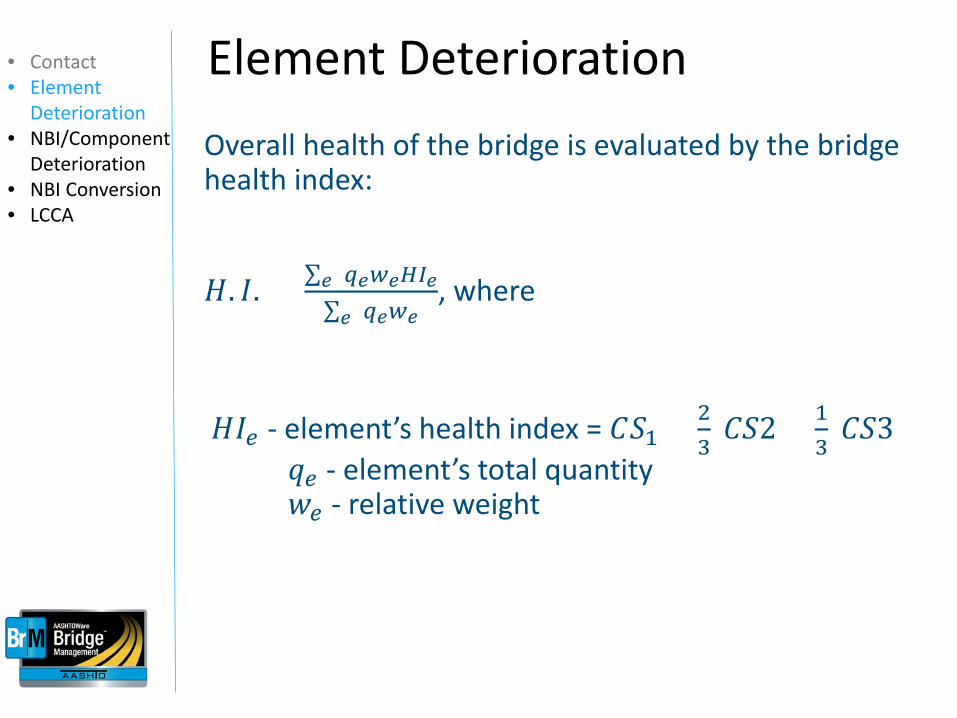
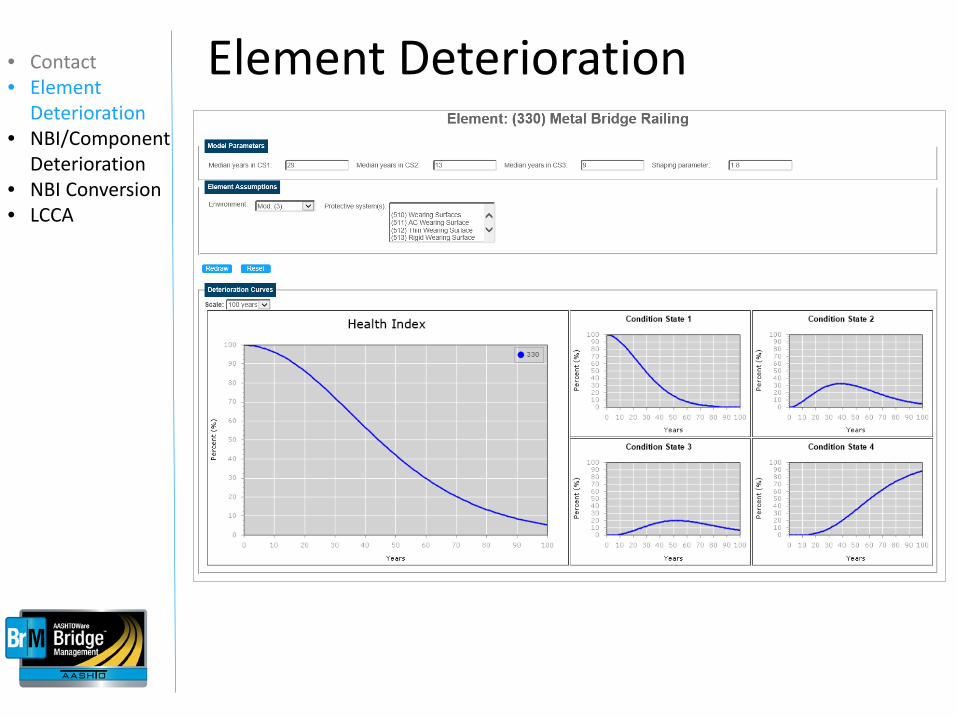
Overall health of the bridge is evaluated by the bridge health index:
𝐻𝐻. 𝐼𝐼. = ∑ 𝑞𝑞𝑒𝑒𝑤𝑤𝑒𝑒𝐻𝐻𝐼𝐼𝑒𝑒𝑒𝑒∑ 𝑞𝑞𝑒𝑒𝑤𝑤𝑒𝑒𝑒𝑒
, where 𝐻𝐻𝐼𝐼𝑒𝑒 - element’s health index = 𝐶𝐶𝑆𝑆1 + 2
3 𝐶𝐶𝑆𝑆𝐶 + 1
3 𝐶𝐶𝑆𝑆𝐶
𝑞𝑞𝑒𝑒 - element’s total quantity 𝑤𝑤𝑒𝑒 - relative weight
• Contact • Element
Deterioration • NBI/Component
Deterioration • NBI Conversion • LCCA
Element Deterioration
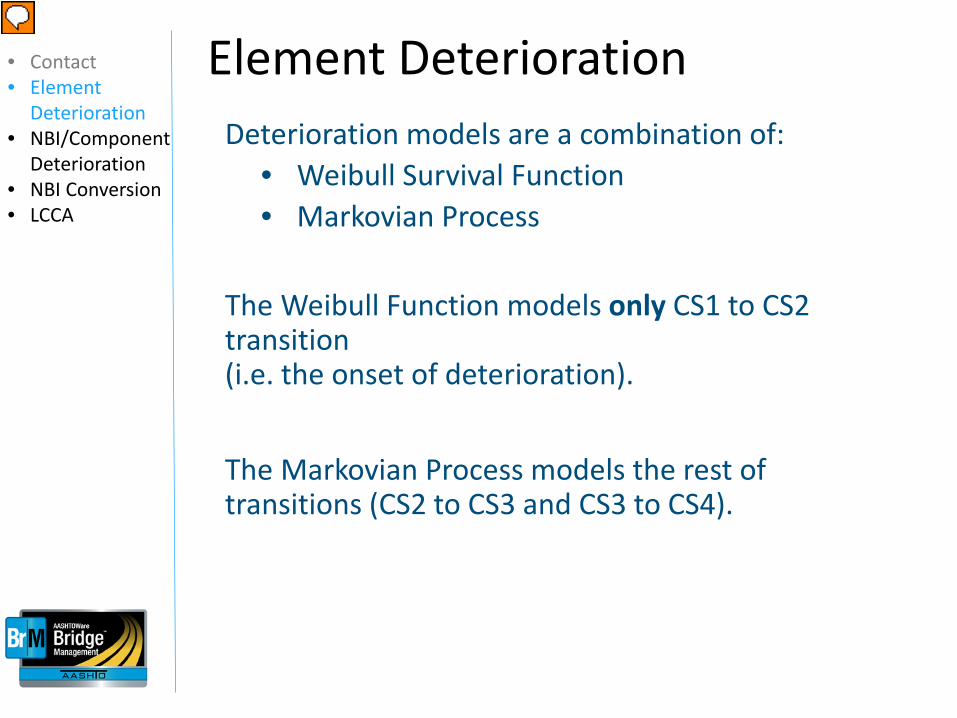
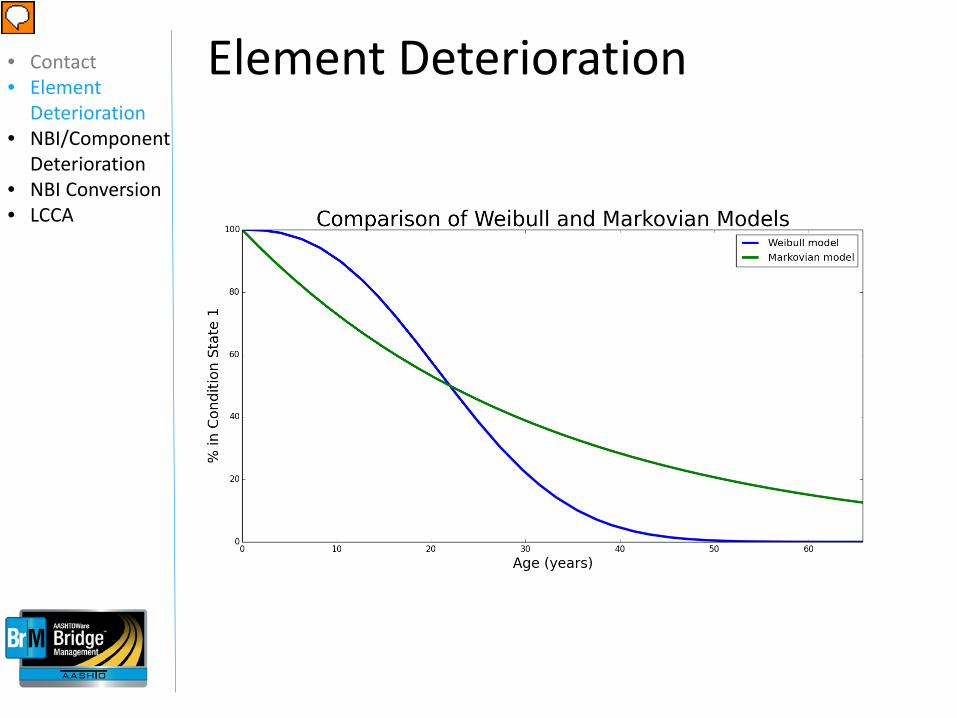
Deterioration models are a combination of: • Weibull Survival Function • Markovian Process
The Weibull Function models only CS1 to CS2 transition (i.e. the onset of deterioration). The Markovian Process models the rest of transitions (CS2 to CS3 and CS3 to CS4).
• Contact • Element
Deterioration • NBI/Component
Deterioration • NBI Conversion • LCCA
Element Deterioration
ß
Weibull CS 1
CS 2
CS 3
CS 4
T12
T23
T34
Markov
Element Deterioration • Contact • Element
Deterioration • NBI/Component
Deterioration • NBI Conversion • LCCA
Element Deterioration • Contact • Element
Deterioration • NBI/Component
Deterioration • NBI Conversion • LCCA
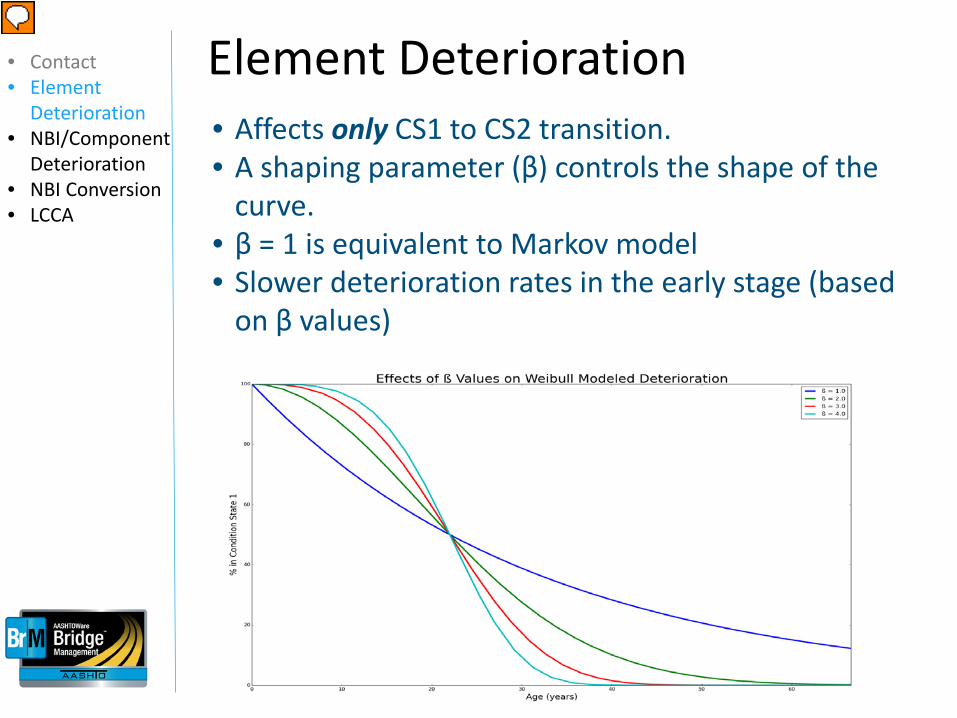
• Affects only CS1 to CS2 transition. • A shaping parameter (β) controls the shape of the
curve. • β = 1 is equivalent to Markov model • Slower deterioration rates in the early stage (based
on β values)
Element Deterioration • Contact • Element
Deterioration • NBI/Component
Deterioration • NBI Conversion • LCCA
Element Deterioration • Contact • Element
Deterioration • NBI/Component
Deterioration • NBI Conversion • LCCA
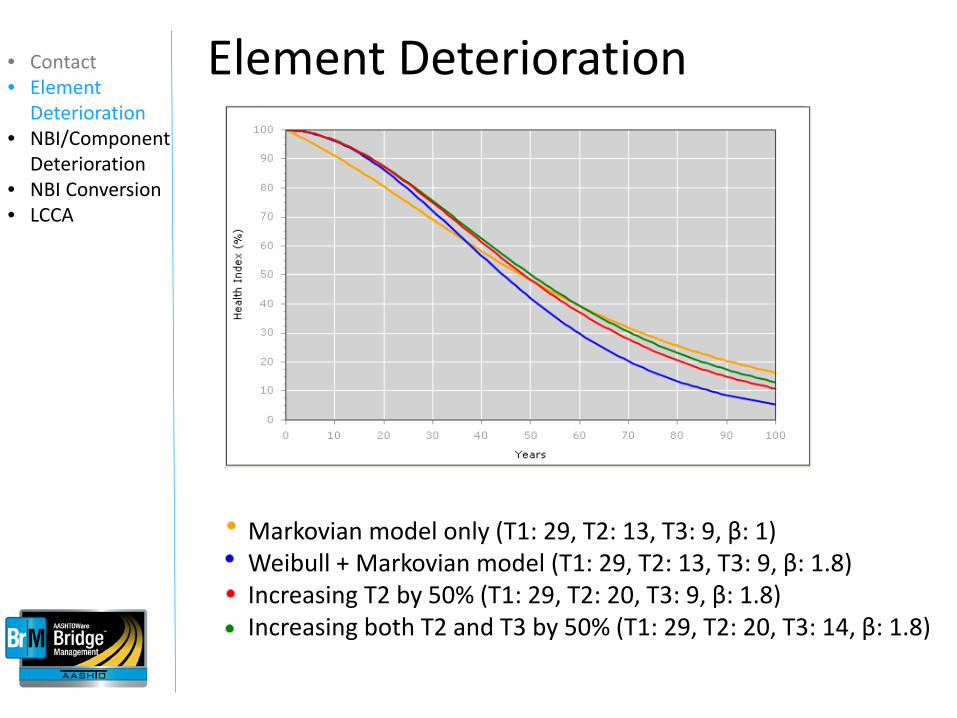
Markovian model only (T1: 29, T2: 13, T3: 9, β: 1) Weibull + Markovian model (T1: 29, T2: 13, T3: 9, β: 1.8) Increasing T2 by 50% (T1: 29, T2: 20, T3: 9, β: 1.8) Increasing both T2 and T3 by 50% (T1: 29, T2: 20, T3: 14, β: 1.8)
Element Deterioration • Contact • Element
Deterioration • NBI/Component
Deterioration • NBI Conversion • LCCA
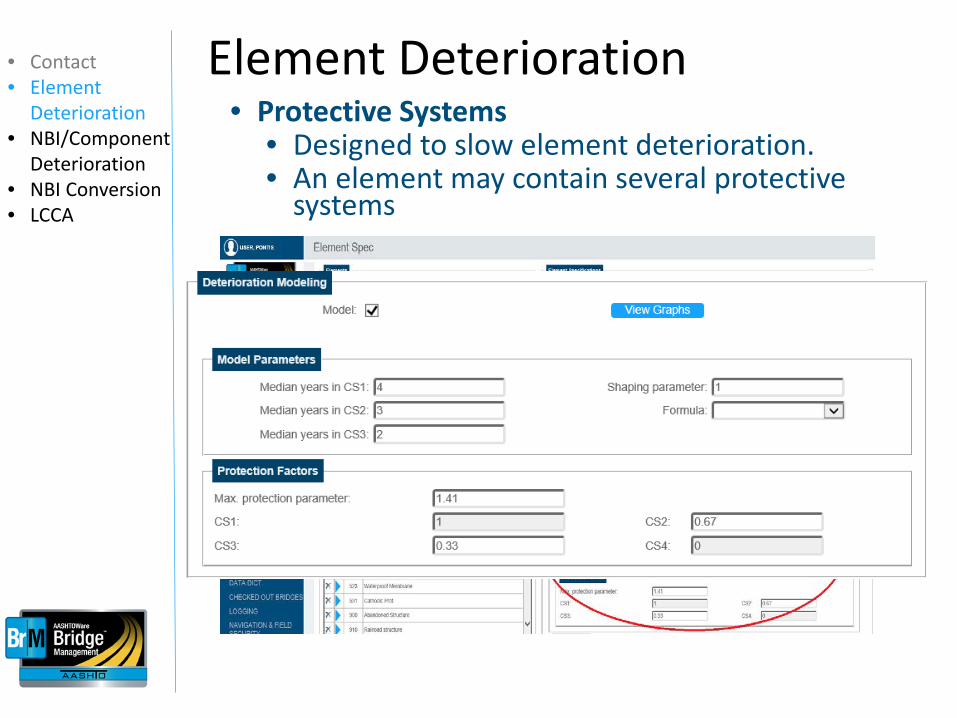
• Protective Systems • Designed to slow element deterioration. • An element may contain several protective
systems
Element Deterioration • Contact • Element
Deterioration • NBI/Component
Deterioration • NBI Conversion • LCCA
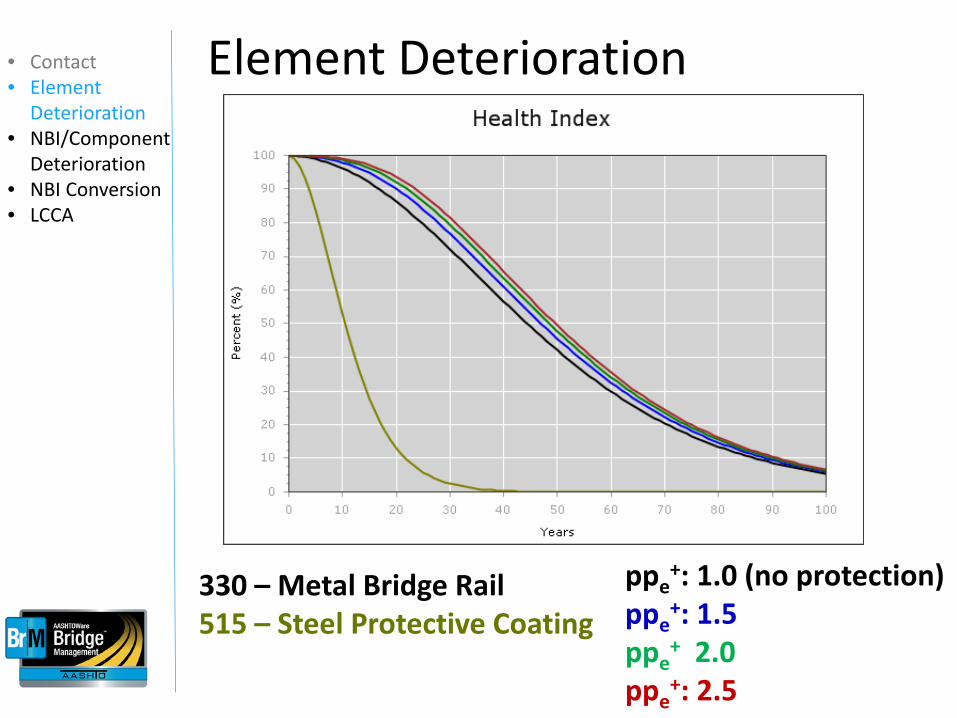
330 – Metal Bridge Rail 515 – Steel Protective Coating
Element Deterioration • Contact • Element
Deterioration • NBI/Component
Deterioration • NBI Conversion • LCCA
ppe+: 1.0 (no protection)
ppe+: 1.5
ppe+ 2.0
ppe+: 2.5
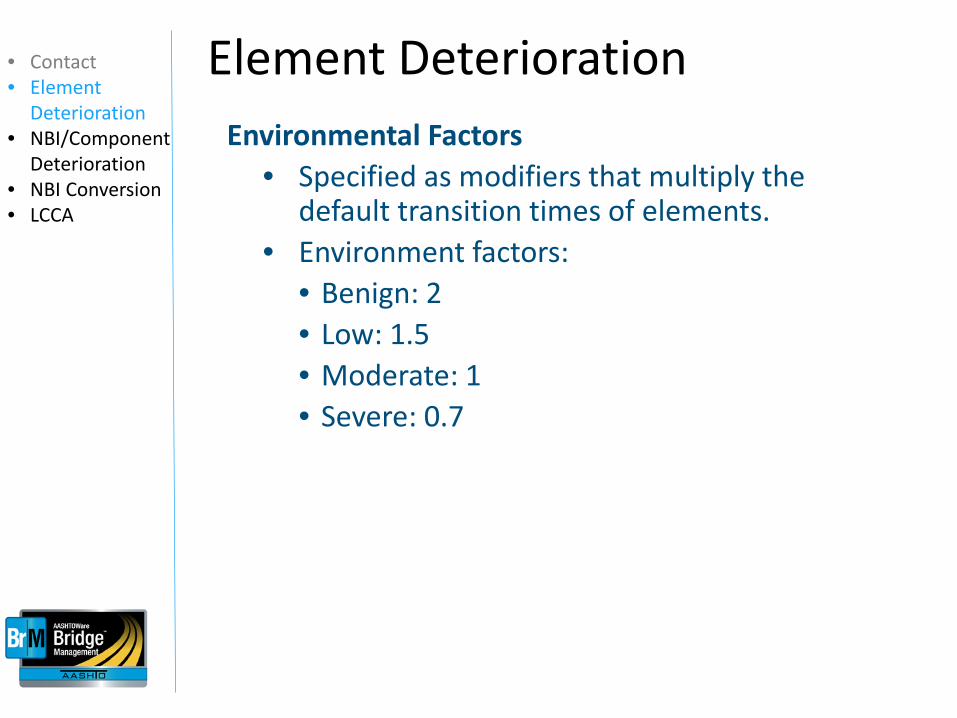
Environmental Factors • Specified as modifiers that multiply the
default transition times of elements. • Environment factors:
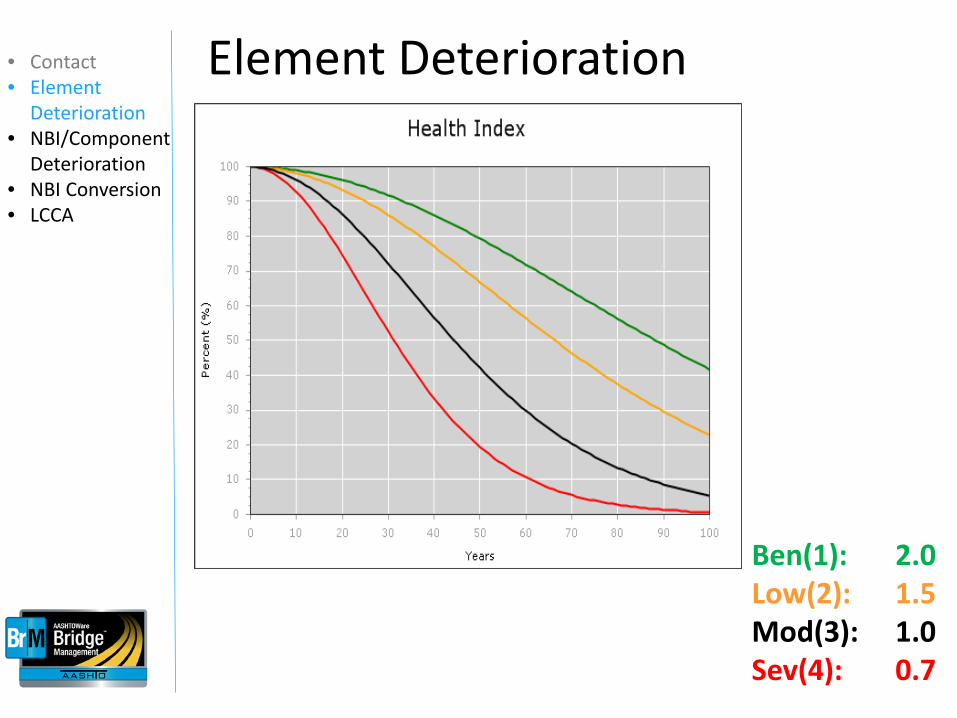
• Benign: 2 • Low: 1.5 • Moderate: 1 • Severe: 0.7
Element Deterioration • Contact • Element
Deterioration • NBI/Component
Deterioration • NBI Conversion • LCCA
Element Deterioration • Contact • Element
Deterioration • NBI/Component
Deterioration • NBI Conversion • LCCA
Ben(1): 2.0 Low(2): 1.5 Mod(3): 1.0 Sev(4): 0.7
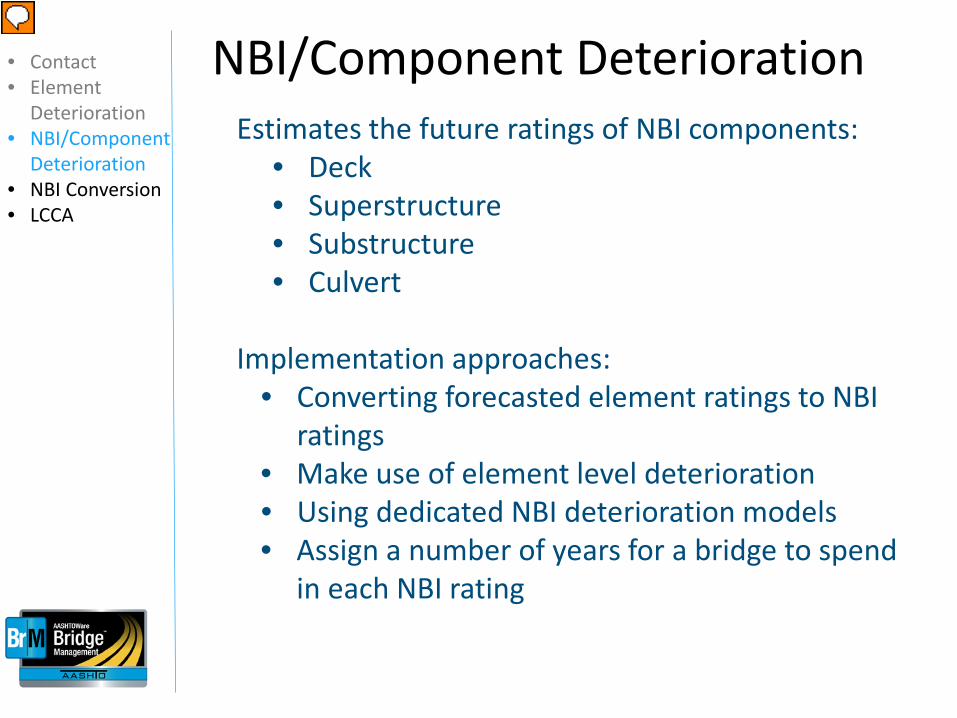
Estimates the future ratings of NBI components: • Deck • Superstructure • Substructure • Culvert
Implementation approaches: • Converting forecasted element ratings to NBI
ratings • Make use of element level deterioration • Using dedicated NBI deterioration models • Assign a number of years for a bridge to spend
in each NBI rating
NBI/Component Deterioration • Contact • Element
Deterioration • NBI/Component
Deterioration • NBI Conversion • LCCA
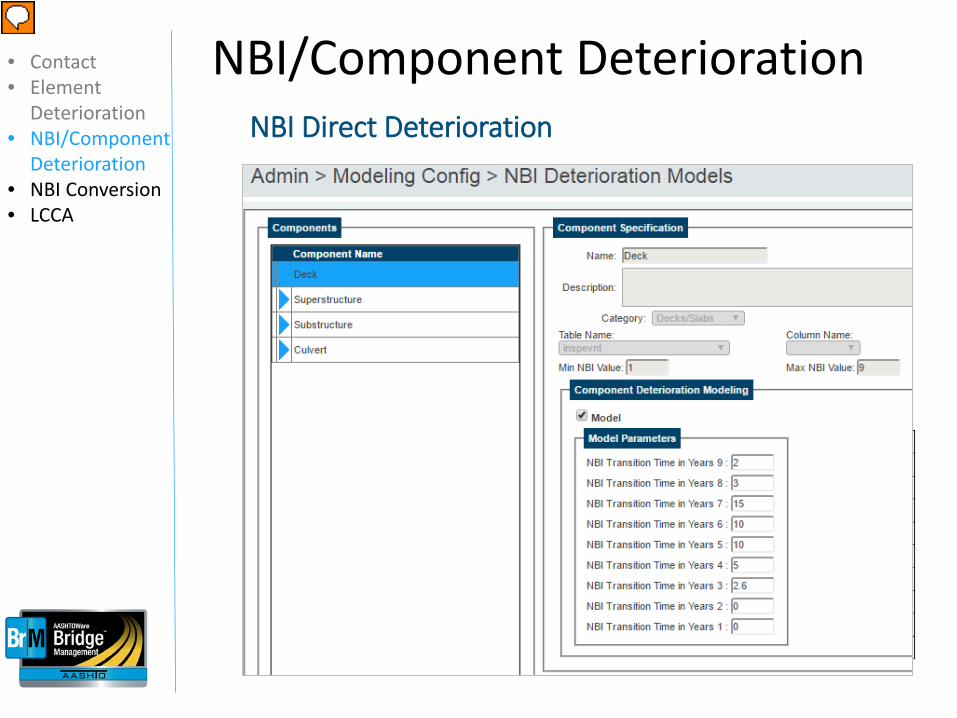
NBI Years 9 1 8 3 7 6 6 8 5 8 4 10 3 2 1
NBI Direct Deterioration
NBI/Component Deterioration • Contact • Element
Deterioration • NBI/Component
Deterioration • NBI Conversion • LCCA
NBI/Component Deterioration • Contact • Element
Deterioration • NBI/Component
Deterioration • NBI Conversion • LCCA
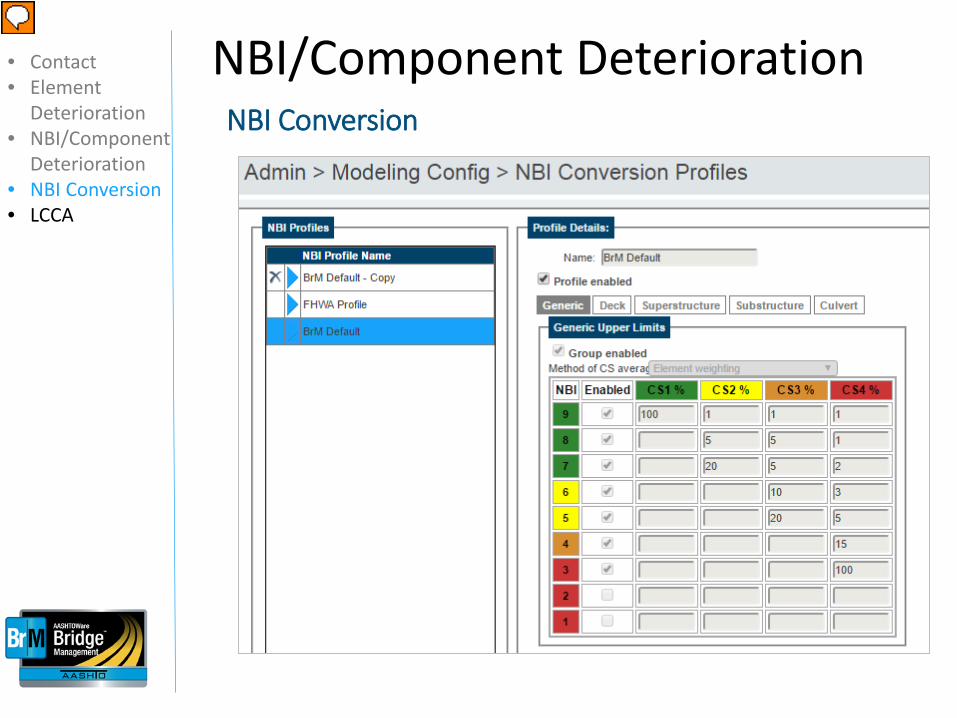
NBI Conversion
Maximum Allowed NBI CS 1 % CS 2 % CS 3 % CS 4 % 9 100 0 0 0 8 100 5 5 1 7 100 20 5 2 6 100 100 10 3 5 100 100 20 5 4 100 100 100 15 3 100 100 100 100 2 100 100 100 100 1 100 100 100 100
NBI/Component Deterioration • Contact • Element
Deterioration • NBI/Component
Deterioration • NBI Conversion • LCCA
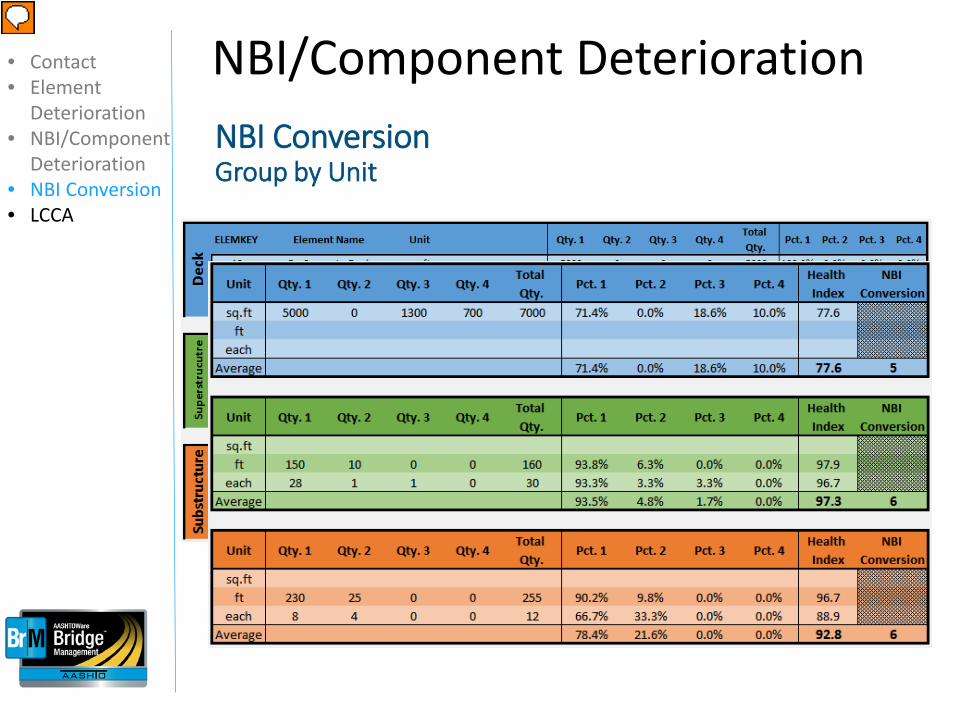
NBI Conversion Group by Unit
NBI/Component Deterioration • Contact • Element
Deterioration • NBI/Component
Deterioration • NBI Conversion • LCCA
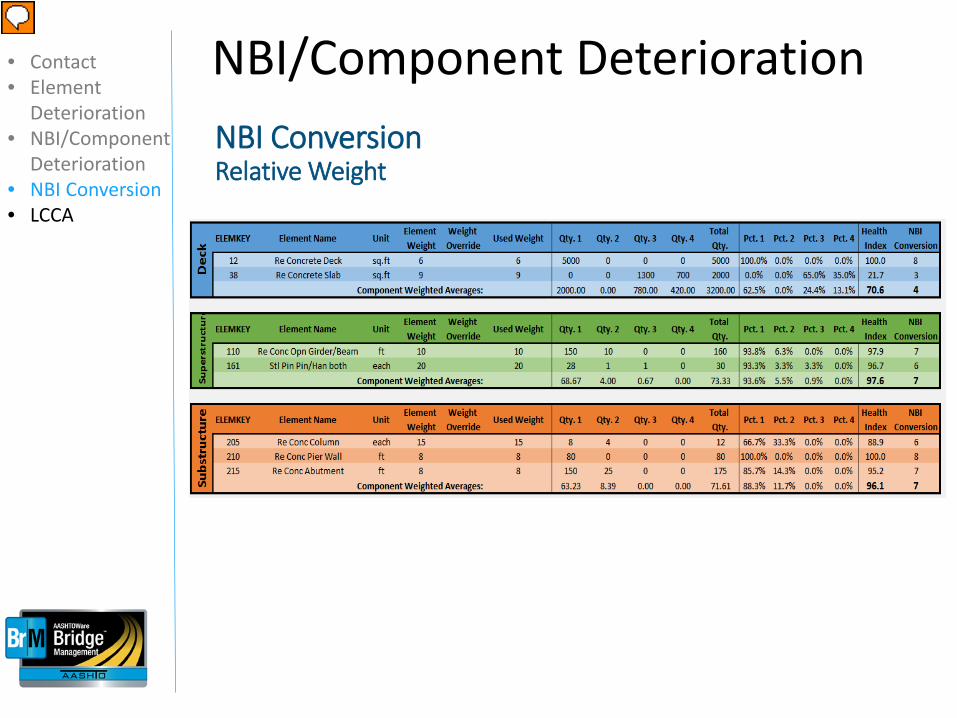
NBI Conversion Relative Weight
NBI/Component Deterioration • Contact • Element
Deterioration • NBI/Component
Deterioration • NBI Conversion • LCCA
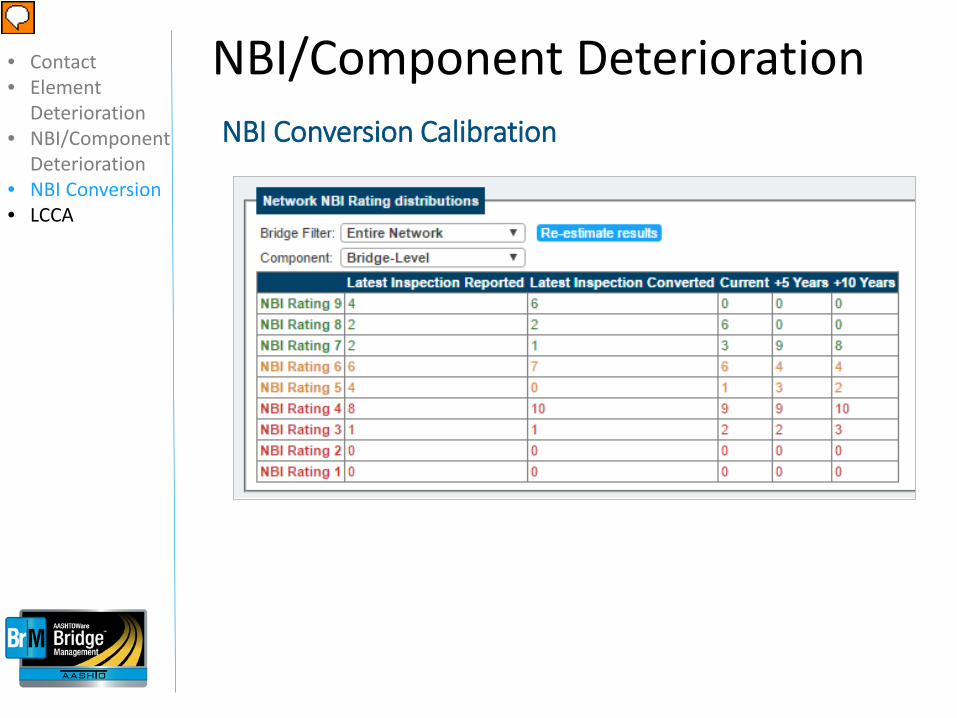
NBI Conversion Calibration
NBI/Component Deterioration • Contact • Element
Deterioration • NBI/Component
Deterioration • NBI Conversion • LCCA
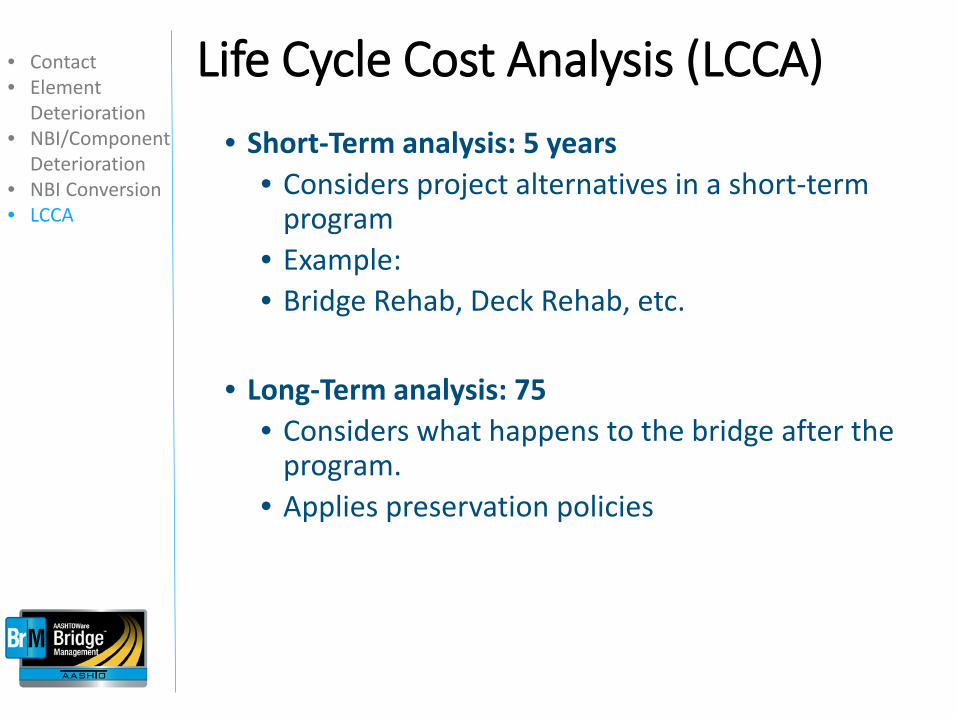
Life Cycle Cost Analysis (LCCA) • Short-Term analysis: 5 years
• Considers project alternatives in a short-term program
• Example: • Bridge Rehab, Deck Rehab, etc.
• Long-Term analysis: 75
• Considers what happens to the bridge after the program.
• Applies preservation policies
• Contact • Element
Deterioration • NBI/Component
Deterioration • NBI Conversion • LCCA
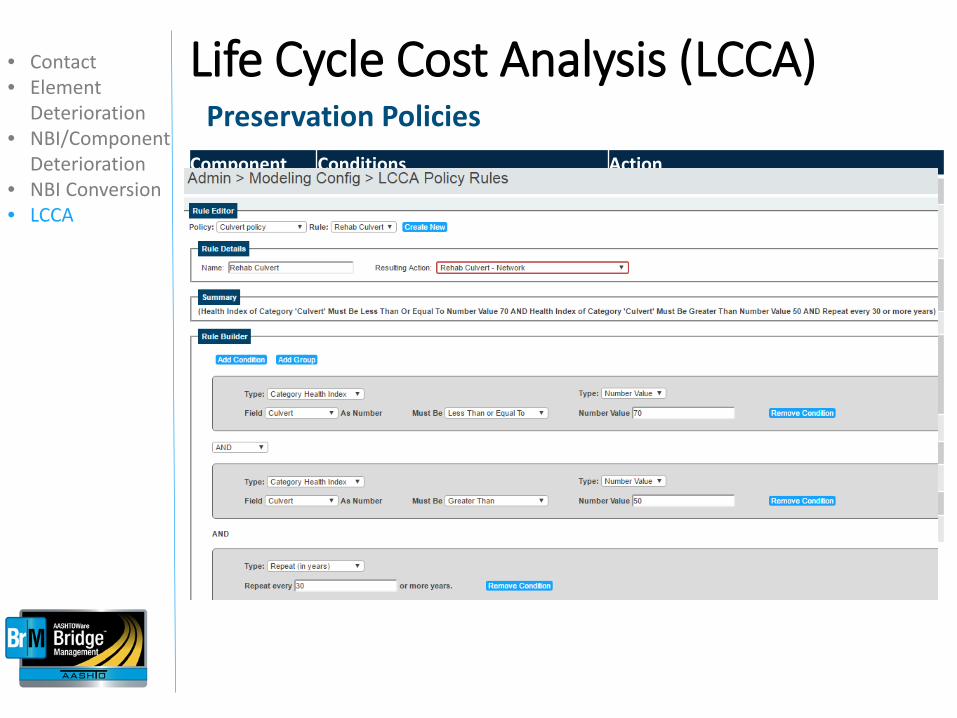
Preservation Policies Life Cycle Cost Analysis (LCCA) • Contact
• Element Deterioration
• NBI/Component Deterioration
• NBI Conversion • LCCA
Component Conditions Action Deck Deck NBI = 6 Epoxy Overlay (Thin Bonded Polymer)
Deck Deck NBI = 5 Concrete Deck Overlay (Polyester Concrete Overlay)
Deck Deck NBI <=4 and Super NBI >= 5 and Sub NBI >= 5 Deck replacement
Super (515) - Steel Protective Coating < 40 and (107) Steel Opn Girder/Beam > 60
Paint
Super (107) Steel Opn Girder/Beam < 50 Repair Beams Sub Substructure HI < 50 Substructure Rehab Bridge Super NBI <= 4 or Sub NBI <= 4 Bridge Replacement
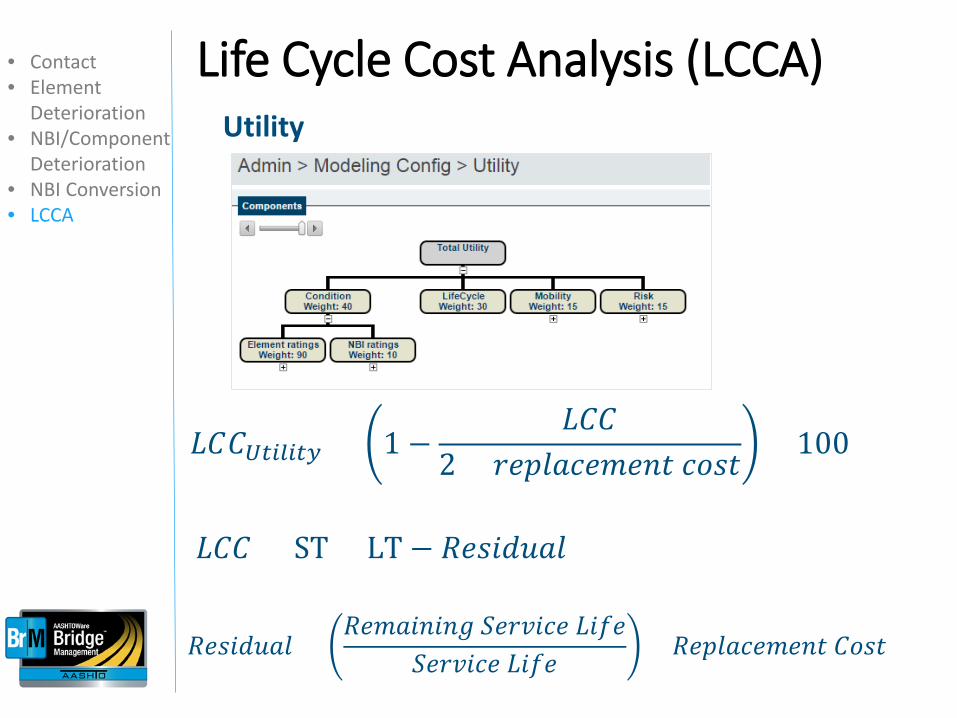
Utility
𝐿𝐿𝐶𝐶𝐶𝐶𝑈𝑈𝑈𝑈𝑈𝑈𝑈𝑈𝑈𝑈𝑈𝑈𝑈𝑈 = 1 −𝐿𝐿𝐶𝐶𝐶𝐶
𝐶 × 𝑟𝑟𝑟𝑟𝑟𝑟𝑟𝑟𝑟𝑟𝑟𝑟𝑟𝑟𝑟𝑟𝑟𝑟𝑟𝑟𝑟𝑟 𝑟𝑟𝑐𝑐𝑐𝑐𝑟𝑟× 100
𝐿𝐿𝐶𝐶𝐶𝐶 = ST + LT − 𝑅𝑅𝑟𝑟𝑐𝑐𝑅𝑅𝑅𝑅𝑅𝑅𝑟𝑟𝑟𝑟
𝑅𝑅𝑟𝑟𝑐𝑐𝑅𝑅𝑅𝑅𝑅𝑅𝑟𝑟𝑟𝑟 =𝑅𝑅𝑟𝑟𝑟𝑟𝑟𝑟𝑅𝑅𝑟𝑟𝑅𝑅𝑟𝑟𝑅𝑅 𝑆𝑆𝑟𝑟𝑟𝑟𝑆𝑆𝑅𝑅𝑟𝑟𝑟𝑟 𝐿𝐿𝑅𝑅𝐿𝐿𝑟𝑟
𝑆𝑆𝑟𝑟𝑟𝑟𝑆𝑆𝑅𝑅𝑟𝑟𝑟𝑟 𝐿𝐿𝑅𝑅𝐿𝐿𝑟𝑟× 𝑅𝑅𝑟𝑟𝑟𝑟𝑟𝑟𝑟𝑟𝑟𝑟𝑟𝑟𝑟𝑟𝑟𝑟𝑟𝑟𝑟𝑟 𝐶𝐶𝑐𝑐𝑐𝑐𝑟𝑟
Life Cycle Cost Analysis (LCCA) • Contact • Element
Deterioration • NBI/Component
Deterioration • NBI Conversion • LCCA
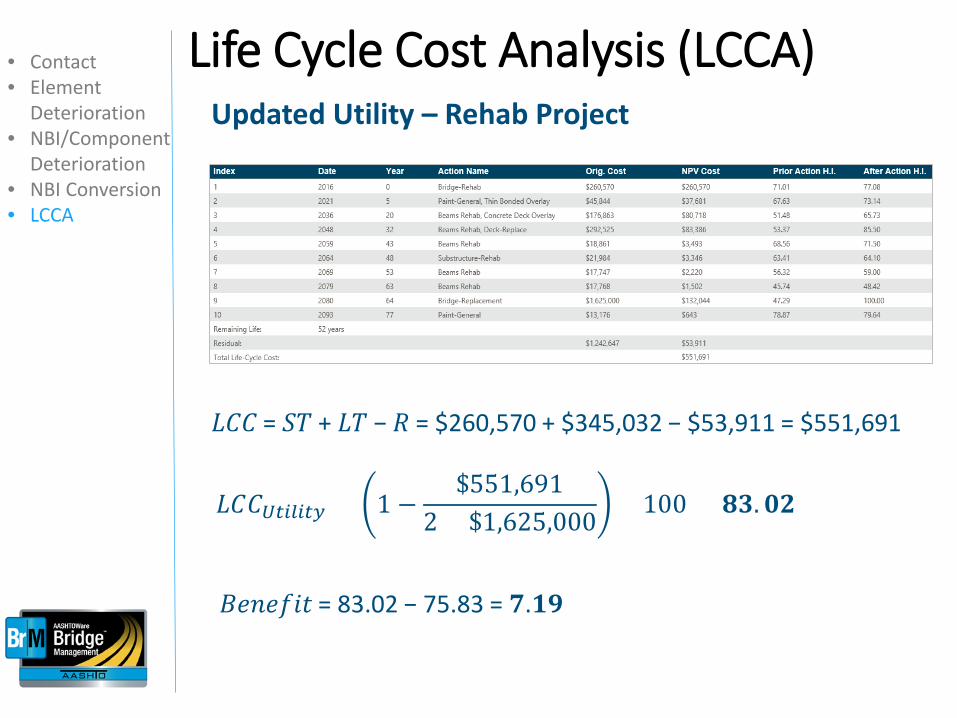
Life Cycle Cost Analysis (LCCA) Updated Utility – Rehab Project
𝐿𝐿𝐶𝐶𝐶𝐶 = 𝑆𝑆𝑇𝑇 + 𝐿𝐿𝑇𝑇 − 𝑅𝑅 = $260,570 + $345,032 − $53,911 = $551,691
𝐿𝐿𝐶𝐶𝐶𝐶𝑈𝑈𝑈𝑈𝑈𝑈𝑈𝑈𝑈𝑈𝑈𝑈𝑈𝑈 = 1 −$551,691
𝐶 × $1,6𝐶5,000× 100 = 𝟖𝟖𝟖𝟖.𝟎𝟎𝟎𝟎
𝐵𝐵𝑟𝑟𝑟𝑟𝑟𝑟𝐿𝐿𝑅𝑅𝑟𝑟 = 83.02 − 75.83 = 𝟕𝟕.𝟏𝟏𝟗𝟗
• Contact • Element
Deterioration • NBI/Component
Deterioration • NBI Conversion • LCCA

BrM Help Desk AASHTOWareBridge.com
[email protected] JIRA tickets: bridgeware.atlassian.net
Josh Johnson, PE TAM Lead Engineer [email protected]