Embed Size (px)
Citation preview
STAFF EXHIBIT 30
Iii ~3 ~c~ ~ ,/2~1/( ~ A~ANLJEAD/TM-79
1ID9MFW an-W~bM9AC1TW , -M WWW
Potential Health Impacts from Range Fires atAberdeen Proving Ground, Maryland,
DOCKETEDUSNRC
October 25, 2007 (2:00pm)
OFFICE OF SECRETARYRULEMAKINGS AND
ADJUDICATIONS STAFF
Docket No. 40-8838-ML
IE CEIVEI)DMAY
ct"J
LCo
OD,
Environmental Assessment Division
Argonne National Laboratory
Operated by The University of Chicago,under Contract W-31-109-Eng-38, for the
United States Department of Energy
ad
- DMSBBON S TE~A3\ Approv,,e~d fo ulca PUBUCs
DjtibuL,-r6 Uumi
Argonne National Laboratory
Argonne National Laboratory, with facilities In the states of Illinois and Idaho, Isowned by the United States Government, and operated by the Universityof Chicago under the provisions of a contract with the Depaftment of Energy.
This technical memo Is a product of Argonne's Environmental AssessmentDivision (EAD). For information on the division's scientific and engineeringactivities, contact
Director, Environmental Assessment Division*Argonne National LaboratoryArgonne, Illinois 60439-4815Telephone (630) 252-3107
Presented in this technical memo are preliminary results of ongoing work orwork that is more limited In scope and depth than that described in formalreports Issued by the EAD.
Publishing support services were provided by Argonne's Informationand Publishing Division (for more information, see IPD's home page:http://www.ipd.anl.gov,/).
Disclaimer
This report was prepared as an account of work sponsored by an agency ofthe United States Governmernt. Neither the United Statbs Government norany agency thereof, nor any of their employees, makes any warranty,express or Implied, or assumes any legal liability or responsibility for theaccuracy, completeness, or. usefulness of any Information, apparatus,product, or process disclosed, or represents that Its use would not Infringeprivatelyowned rights. Reference herein to any specific commercialproduct, process, or service by trade name, trademark, manufacturer, orotherwise, does not necessarily constitute or Imply Its endorsement,recommendation, or favoring by the United States Government or anyagency thereof. The views and opinions of authors expressed herein do notnecessarily state or reflect those of the United States Government or anyagency thereof.
Reproduced directly from the best available copy.
Available to DOE and DOE contractors from the Offideof Scientific and Technical Information, P.O. Box 62,Oak Ridge, TN 37831; prices available from(423) 576-8401.
Avaijabie to tne public from the Nationai Technica;Informatior, Service, US. Department of Commerce,5285 Port Royal Road. Springfield, VA 22161
ANLIEAD/T M-79
Potential Health Impacts from Range Fires atAberdeen Proving Ground, Maryland
by G.P. Williams, A.M. Hermes,* A.J. Policastro, H.M. Hartmann, and D. Tomasko
Environmental Assessment Division,Argonne National Laboratory, 9700 South Cass Avenue, Argonne, Illinois 60439
DISTRIBUlON OF THIS DOCU1', IS UN.UM MASTER
March 199B
Prepared for the U.S. Army, Directorate of Safety, Health, and EnvironmentAberdeen Proving Ground, Maryland
'Haries is currantii affiliahted with Environmenialp esource Managemen!, Inc., Houston, Texas,
CONTENTS
NOTATION ........................................ .......... vii
ABSTRACT ................................. ........................... 1
I INTRODUCTION ..................................................... 3
2 ENVIRONMENTAL SETTING ........................................ 5
2.1 Climate and Meteorology ........................................ 52.2 Soil 6....................................... .......... 62.3 Vegetation 6................................................. 6
3 FIRES A T A PG ........ ............................................... 9
3.1 L ocations ........................................................ 93.2 Size ....................................................... 93.3 D uration ........................................................ 103.4 Number and Frequency ......................................... 10
4 CONTAMINANTS OF CONCERN ........................................ 12
4.1 Soil C oncentrations ............................................... 124.2 Chemicals Released from Burning Vegetation ......................... 144.3 Chemicals Released from UXO Detonation ...... .................. 15
5 CHEMICAL CHARACTERISTICS ...................................... 16
5.1 A rsenic ......................................................... 165.2 L ead ........................................................... 165.3 D epleted Uranium .......................................... ..... 175.4 Trichloroethylene ......... .............. ...................... 185.5 DDT ...................................................... 195.6 M ustard ......... ............................................... 195.7 Phosgene ................................. ............ 20
6 BIOMASS INFORMATION/ VEGETATION SURVEYS ..................... 21
7 PLAN-T UPTAKE AND RELEASE MODELS ........ 23
7.1 Estimating Plant Uptake of Chemicals .... .......................... 237,1.1 Uptake of Inorganic Contaminants .....7.1.2 Upta:e of Organic Cont-inants .............................. 26
7.2 Total Contaminant Release in a Fire ......... ....................... ,
,..Ill
CONTENTS (Cont.)
8 FIREPLUME MODEL ............................................. 28
8.1 Fire Scenarios ............................................... 288.2 FIREPLUME Calculations ........................... 318.3 Soil Deposition from Plume-Borne Contaminants .................... 33
9 UXO RELEASE SCENARIOS ........................................... 35
9.1 D2PC Model ....................................... ......... 359.2 D2PC Calculations ............................................ 369.3 UXO Release Results .............................................. 36
10 RISK ANALY SIS ........ ........ I .......................... ......... 37
10.1 Screening Action Levels for Chemical Contaminants in Air ................ 3710.1.1 L ead ..................................................... . 3910.1.2 Mustard .............................................. 41
.10.1.3 Phosgene ............................................. 4210.1.4 Depleted Uranium ...................................... .43
10.2 Comparison of Calculated Plume Values with Screening Levels ........... 4310.2.1 Inhalation Pathway ....................................... 4310.2.2 Soil Deposition ............. ....................... 46
II DISCUSSION OF RESULTS .......................................... 47
12 RECOMMENDATIONS ............................................ 50
13 REFERENCES ......................... .......................... 52
APPENDIX A: FIREPLUME Model Results .................................... A-I
APPENDIX B: Emission Factors for Burning Vegetation ..... ..................... B-I
A PPENDIX C: Figures ..................................................... C-I
TABLES
I Vegetation and Land Cover Areas at APG .. ....... .......... 7
2 Cover Types and Current Range Areas ...... .......... 8
h!,
TABLES (Cont.)
3 Contaminant Concentrations in Soil at APG ............................ 13
4 Source Values for Chemicals Released from Burning Vegetation ................ 15
5 Total Biomass Available for Consumption in Fire - Forest and Field Areas ....... 22
6 Plant Uptake Parameters ............................................. 25
7 Estimated Total Amounts of Contaminants of Concern Released from a25-Acre Fire in Forest or Field Areas .................... 27........27
8 Point of Maximum Ground-Level Contaminant Concentration Downwind of aFire on the Basis of FIREPLUME Modeling Results .......................... 31
9 Maximum Contaminant Concentrations at Ground Level for A, D, and EAtmospheric Stability Classes in Forest and Field Fires as Predicted by the'FIREPLUME Dispersion Model ..................................... 33
10 Maximum Predicted Contaminant Concentrations in Soil from Depositionand Corresponding Action Levels .......................................... 34
11 Inhalation Toxicity Values for Contaminants of Concern ....................... 40
12 Screening Action Levels for Contaminants in Air ........................... 41
13 Maximum Contaminant Release Concentrations as Predicted byFIREPLUME Compared with Action Levels ................................ 44
A. 1 Predicted Normalized Ground-Level Concentrations for Forest Fire,Stability Class A .................................................. A-4
A.2 Predicted Normalized Ground-Level Concentrations for Forest Fire,Stability Class D ............................................ A-5
A.3 Predicted Normalized Ground-Level Concentrations for Forest Fire,Stability Class E ........... .......................................... A -6
A-4 Predicted Normalized Ground-Level Concentrations for Field Fire,Stability C lass A ........... .......................................... A -7
A.5 Predicted Normalized Ground-Level Concentrations for Field Fire,Stability Class A .................................................. .A-8
TABLES (Cont.)
A,6 Predicted Normalized Ground-Level Concentrations for Field Fire,Stability Class E .................. ......................... ...... . A-9
B, 1 Emission Concentrations of Constituents in SmokeCondensates of Various Fuels ............................................ B-4
FIGURES
I Map of Aberdeen Proving Ground and Surrounding Area ...................... C-3
2 Locations of Firing Ranges at APG ................ ................. C-4
3 Soil Types at APG - 1927 .............................................. C-5
4 Vegetative Cover Types at APG .......................................... C-6
5 Locations of Past Range Fires at APG ..................................... C-7
6 Location of Range Fires at Spesutie Island Portion of APG ..................... C-8
7 Locations of Range Fires at Aberdeen Area of APG ........................... C-9
8. Location of Range Fires at Edgewood Area of APG ........................... C-10
9 Size Distribution of Reported Range Fires at APG ............................ C-1l
10 Locations of Potential Contaminant Source Sites in the J-Field Study Area ........ C-12
11 Pathways of Contaminants from Testing Projects ........................ C-13
12 Cross Section of Smoke Plume for Stability Class A Conditions ................ C-14
13 Cross Section of Smoke Plume for Stability Class D Conditions ................. C-15
14 Cross Section of Smoke Plume for Stability Class E Conditions ............... C-16
15 Map Showing Distribution of Predicted Ground-Level Arsenic Concentrations .... C-17
Vi
-Wrai--ra - - - 1ý IR Eq -
NOTATION
ACRONYMS
AA Aberdeen AreaAPG Aberdeen Proving GroundATSDR Agency for Toxic Substances and Disease RegistryCR plant-to-soil contaminant concentration ratioDSHE Directorate of Safety, Health, and EnvironmentEA Edgewood AreaGPC General Physics CorporationMCLDM Monte Carlo Lagrangian Dispersion ModelNBC nuclear, biological, and chemicalNPL National Priorities ListPEL permissible exposure levelRAB Restoration Advisory BoardRfC reference concentrationRfD reference doseRPDG Robbins Point Demolition GroundTBP Toxic Burning PitsUXO unexploded ordnance
CHEMICALS
As arsenicCG carbonyl chloride (COC12) (phosgene)DDT dichlorodiphenyltrichloroethaneDU depleted uraniumHD mustard (agent)Pb leadTCE trichloroethyleneU uranium
UNITS OF MEASURE
cal calorie(s) cm centimeter(s)Ci curie(s) cm3 cubic centimeter(s)pCi microcurie(s) d day(s)pCi picocurie(s) •C degree(s) Celsius
v;,
fl
ft2
g
in.kgkinLdLm
fool (feet)square foot (feet)gram(s)inch(es)kilogram(s)kilometer(s)liter(s)deciliter(s)meter(s)
Pmm 3
mg
miD
mphppmS
micrometer(s)cubic meter(s)milligram(s)mile(s)minute(s)mile(s) per hourpart(s) per millionsecond(s)
yr year(s)
viii
I
POTENTIAL HEALTH IMPACTS FROM RANGE FIRES ATABERDEEN PROVING GROUND, MARYLAND
by
G.P. Williams, A.M. Hermes, AJ. Policastro,H.M. Hartmann, and D. Tomasko
ABSTRACT
This study uses atmospheric dispersion computer models to evaluate thepotential for human health impacts from exposure to contaminants that could bedispersed by fires on the testing ranges at Aberdeen Proving Ground, Maryland.It was designed as a screening study and does not estimate actual human healthrisks. Considered are five contaminants possibly present in the soil and vegetationfrom past human activities at APG - lead, arsenic, trichloroethylene (TCE),depleted uranium (DU), and dichlorodiphenyltrichloroethane (DDT); and twochemical warfare agents that could be released from unexploded ordnance roundsheated in a range fire - mustard and phosgene. For comparison, dispersion oftwo naturally occurring compounds that could be released by burning ofuncontaminated vegetation - vinyl acetate and 2-furaldehyde - is also
examined. Data from previous studies on soil contamination at APG are used inconjunction with conservative estimates about plant uptake of contaminants,atmospheric conditions, and size and frequency' of range fires at APG to estimatedispersion and possible human exposure. The results are compared withU.S. Environmental Protection Agency action levels. The comparisons indicatethat for all of the anthropogenic contaminants except arsenic and mustard,exposure levels would be at least an order of magnitude lower than thecorresponding action levels. Because of the compoundingly conservative natureof the assumptions made, we conclude that the potential for significant humanhealth risks from range fires is low. We recommend that future efforts be directedat fire management and control, rather than at conducting additional studies tomore accurately estimate actual human health risk from range fires.

2
3
I INTRODUCTION
Aberdeen Proving Ground (APG), a major U.S. Army, testing facility, is located at thenorthern end of Chesapeake Bay, mostly in Harford County, Maryland. Two small sections on thewestern edge of the installation are in Baltimore County, Maryland (Figure 1).3 Kent County,Maryland, is across the bay to the east, and Cecil County, Maryland, is north of APG. Baltimore, thenearest major city, is about 10 mi (16 kin) west of the northwestern boundary of APG.
APG has a long history as a U.S. Army site for testing artillery and other ordnance, militaryvehicles, and a variety of other military equipment. The site also includes the principal U.S. Armymechanical maintenance training facilities and serves as the home base for the Maryland NationalGuard. More than 70 tenant organizations with more than 300 individual mission activities arelocated at APG.
In the testing and training range areas at APG, fires are occasionally caused by ordnancefiring or lightning strikes. Because of APG's long history of weapons testing, there is concern thatcontaminants have accumulated in the soils and vegetation and could be transported in the smokeplumes produced by such fires to pose a health risk to exposed individuals on and off the site. Thisstudy considers the mobilization, transport, and deposition of contaminants produced by range firesand potential health risks of those contaminants. Sources of contamination include residues in andon vegetation from previous weapons testing and chemicals released from burning uncontaminatedvegetation and detonation of unexploded ordnance (UXO). Contaminants of concern for this studywere selected in consultation with APG personnel and public oversight groups and include arsenic(As), lead (Pb), depleted uranium (DU), trichloroethylene (TCE), dichlorodiphenyltrichloroethane(DDT), vinyl acetate, 2-furaldehyde, and mustard and phosgene chemical agents in UXO.
Although this study did evaluate potential human health risks, the primary objective wasto conduct a broad screening to identify important physical and chemical processes that might impacthuman health and to determine whether a need exists to collect more data or to further study theimpact of range fires on-human health. In this study, information from previous research at APG wascombined with computer modeling to generate a credible worst-case scenario and determine an upperbound for the human health risks that might result from range fires.
Because this study is preliminary and designed to determine the need for a more refinedapproach, the modeling did not calculate total risk to the population surrounding APG. However,a comparison of the predicted downwind contaminant concentrations to the screening guidelineconcentrations for each cheiIcal allows the generation of preliminary impact assessments forreceptors on and off APG. The bounding-case scenarios modeled consider a "most-exposed"
All figures appear at the end of the document in Appendix C
4
individual located at the, point of highest contaminant concentration for the duration of thei Thissame receptor would also be present at the point of highest concentration for all subsequent fires.
The remainder of this document discusses the environmental setting at APG, source termsfor potential contamination, transport modeling for the contaminants of concern, and comparisonsof model-predicted exposure levels with screening action levels based on human health risk.
The environmental setting at APG, as it relates to this study, is summarized in Section 2,and information on characteristics of range fires at the facility is provided in Section 3. Contaminantsof concern are identified in Section 4, and their chemical characteristics are outlined in Section 5.Sections 6 and 7 present information on biomass and plant uptake of contaminants that is used in thecalculation of contaminant releases during a range fire. Modeling of contaminant releases fromburning of contaminated and uncontaminated vegetation is discussed and results presented inSection 8, and similar information for release of chemical agent contaminants from UXO during arange fire is presented in Section 9. Potential human health risks from the calculated contaminantreleases are discussed in Section 10. Section 11 discusses the study results, and Section 12 presentsthe investigators' recommendations. Finally, references cited in the report are listed in Section 13.Supporting data are presented in Appendix A (FIREPLUME Model Results) and Appendix B(Emission Factors for Burning Vegetation). Figures and illustrations cited in the text are presentedin Appendix C.
5
2 ENVIRONMENTAL SETTING
APG consists of two main areas: the Aberdeen Area (AA) and the Edgewood Area (EA)(Figure 1). Both areas were acquired by the government in 1917. Ammunition testing began at theAberdeen Area in 1918; more than 400,000 rounds of ammunition were test fired that year. DuringWorld War II, the reservation grew with the acquisition of about 5,000 acres at Spesutie Island andthe present Churchville Test Area. The Aberdeen Area now includes approximately 25,000 acres andconsists of three major subareas: the headquarters and research area, the training and support area,and the test range area. The latter area comprises about 80-85% of the Aberdeen Area and includes46 firing ranges (Figure 2), impact areas, vehicular test courses, and munitions storage areas (Davis1990).
The Edgewood Area includes Gunpowder Neck peninsula between the Bush andGunpowder Rivers (Figure 1), comprising about 10,000 acres. Carroll Island and Grace's Quarterin Baltimore County are also part of the Edgewood Area and cover an additional 1,200 acres. TheEdgewood Area was acquired by the government in 1917 and was first known as GunpowderReservation. It became the Edgewood Arsenal in 1918. The installation was designed'to producechemical warfare agents and included gas manufacturing facilities, shell-filling plants, barracks, andartillery ranges. Most of its initial chemical production activities ended with the end of World War IDuring World War II, chemical manufacturing was reinstituted, and new manufacturing facilitieswere developed. Following the war, manufacturing activities at Edgewood were reduced, andresearch and development missions were emphasized.
Land use in the Edgewood Area is less structured and more spatially disjointed that in theAberdeen Area. Major functional areas include five firing ranges, a cantonment area, an industrialarea, a training area, and a research and development area.
In total, the firing ranges at APG cover approximately 33,000 acres, of which 12,000 acresare covered by water, 4,000 acres are swampy, and 17,000 acres are vegetated uplands. Vegetationcontrol is practiced only along roadways and at firing points; however, 400 acres are routinelycleared to facilitate recovering ordnance rounds (Rynders 1995).
2.1 CLIMATE AND METEOROLOGY
The climate at APG is humid, continental. It is characteristically warm, temperate, andrainy; there is no dry season. The summer months have frequent afternoon and eveningthunderstorms associated with the warm, moist air from the south. Yearly precipitation averagesabout 42 in. (Davis 1990). Prevailing winds are from the west to northwest, except in the summer
6
months, when the winds are. more southerly. The average wind speed is 10 mph; velocities of
between 50 and 60 mph occur only during severe thunderstorms (Davis 1990).
2.2 SOIL
Soils at APG are deep and moderately well drained to well drained. Soils that dominate theupland areas are Sassafras, Elkton, Beltsville, Loamy and Clayey Land, and Matapeake-MattapexSeries (Figure 3). The material beneath the surficial soils ranges from sandy, loamy, gravelly, toclayey (Hlohowskyj et al. 1996). Because of high precipitation and the draining capacity of the soils,contaminants could leach through the soil profile and be less available for plant uptake.
Some localized areas of soil at APG are highly contaminated with chemicals such as metals(Jastrow 1995; Hlohowskyj et al. 1996). Before the inception of APG, the land areas were usedprimarily for agriculture. Some agricultural activities, such as fertilization, may have led to low-levelchemical contamination of the soil, depending on the type and quantity of fertilizers and pesticidesused. Additional contamination has occurred because of years of weapons testing and-munitionsdisposal operations. Chemical contamination of the soil in some areas is significant and exceeds stateor federal standards (.Directorate of Safety, Health, and Environment [DSHE] 1994). Areas with suchcontamination are localized and associated with past range operations. Although the full extent ofsoil contamination is not known, the soil quality in several 'locations at APG has been wellcharacterized.
2.3 VEGETATION
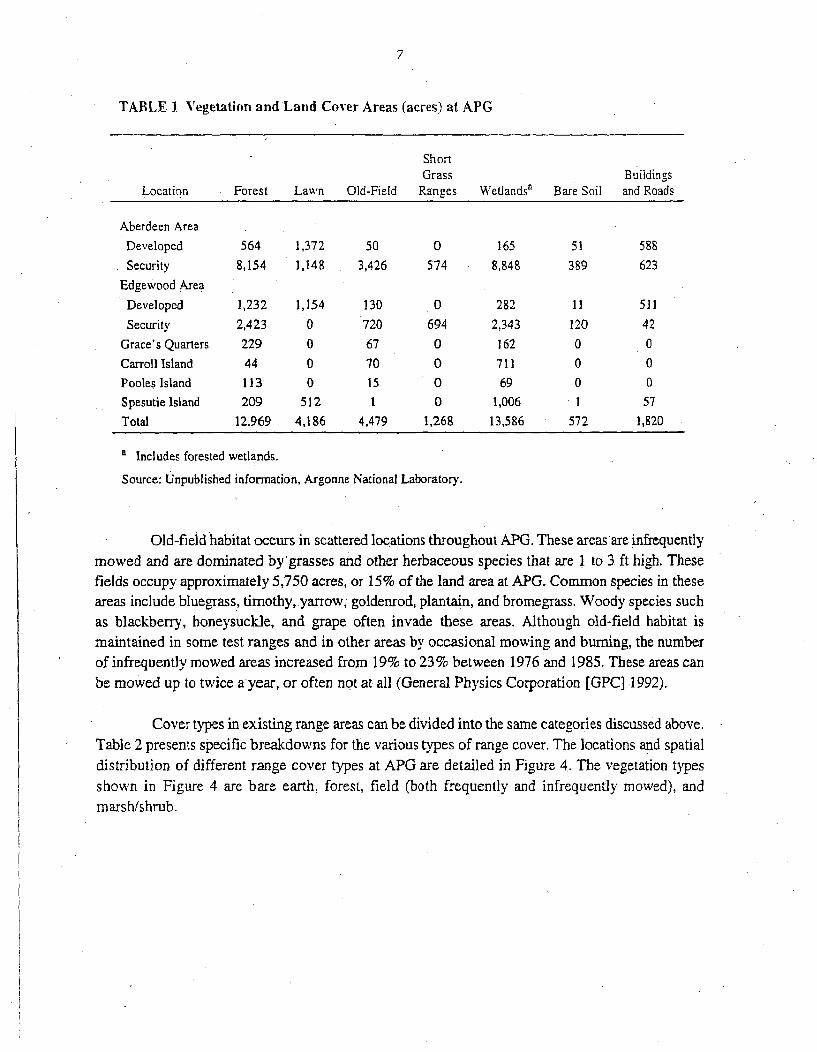
APG can be divided functionally into two types of zones: security zones (range and testtrack areas) and developed zones (cantonment, industrial, training, and research and developmentareas), Large portions of the security zones are not actively landscaped or significantly disturbed bymission activities and contain a variety of terrestrial, wetland, and aquatic vegetation (SWCA 1994).The developed zones in both the Aberdeen Area and the Edgewood Area contain a total of about7,800 acres of landscaped lawns, buildings, airfields, golf courses, and troop training areas. Theextent of vegetative cover types for the various areas at APG is detailed in Table 1.
Much of the Aberdeen Area consists of wetland and forest, although all of.the other covertypes are also present to some extent. The Edgew'od Area is also covered primarily with wetlandsand forests. Most of the forested land is within security zones and consists of typical easternhardwood, pine, and scrub pine species. Approximately 13,000 acres of APG is forested. The mostcommon trees are oak, sweetgum, maple, cherry, and ioblolly pine (Davis 1990). These forestscontain mostly medium to large trees (15- to 2_4-.i,- diameter al breasi hei-ht [about 4 ft]). Many ofthese trees are mature and generally lack an understory (U.S. Department of the Army 1987).
RMOMPOWN - Now*
7
TABLE 1 Vegetation and Land Cover Areas (acres) at APG
ShortGrass Buildines
Location Forest Lawn Old-Field Ranges Wetlands' Bare Soil and Roads
Aberdeen Area
Developed 564 1,372 50 0 165 51 588
Security 8,154 1,148 3,426 574 8,848 389 623
Edgewood Area
Developed 1,232 1,154 130 0 282 11 511
Security 2,423 0 720 694 2,343 120 42
Grace's Quarters 229 0 67 0 162 0 0
Carroll Island 44 0 70 0 711 0 0
Pooles Island 113 0 15 0 69 0 0
Spesutie Island 209 512 1 0 1,006 1 57
Total 12,969 4,186 4,479 1,268 13,586 572 1,820
' Includes forested wetlands.
Source: Unpublished information, Argonne National Laboratory.
Old-field habitat occurs in scattered locations throughout APG. These areasare infrequentlymowed and are dominated by'grasses and other herbaceous species that are I to 3 ft high. Thesefields occupy approximately 5,750 acres, or 15% of the land area at APG. Common species in theseareas include bluegrass, timothy, yarrow, goldenrod, plantain, and bromegrass. Woody species suchas blackberry, honeysuckle, and grape often invade these areas. Although old-field habitat ismaintained in some test ranges and in other areas by occasional mowing and burning, the numberof infrequently mowed areas increased from 19% to 23% between 1976 and 1985. These areas canbe mowed up to twice a year, or often not at all (General Physics Corporation [GPC] 1992).
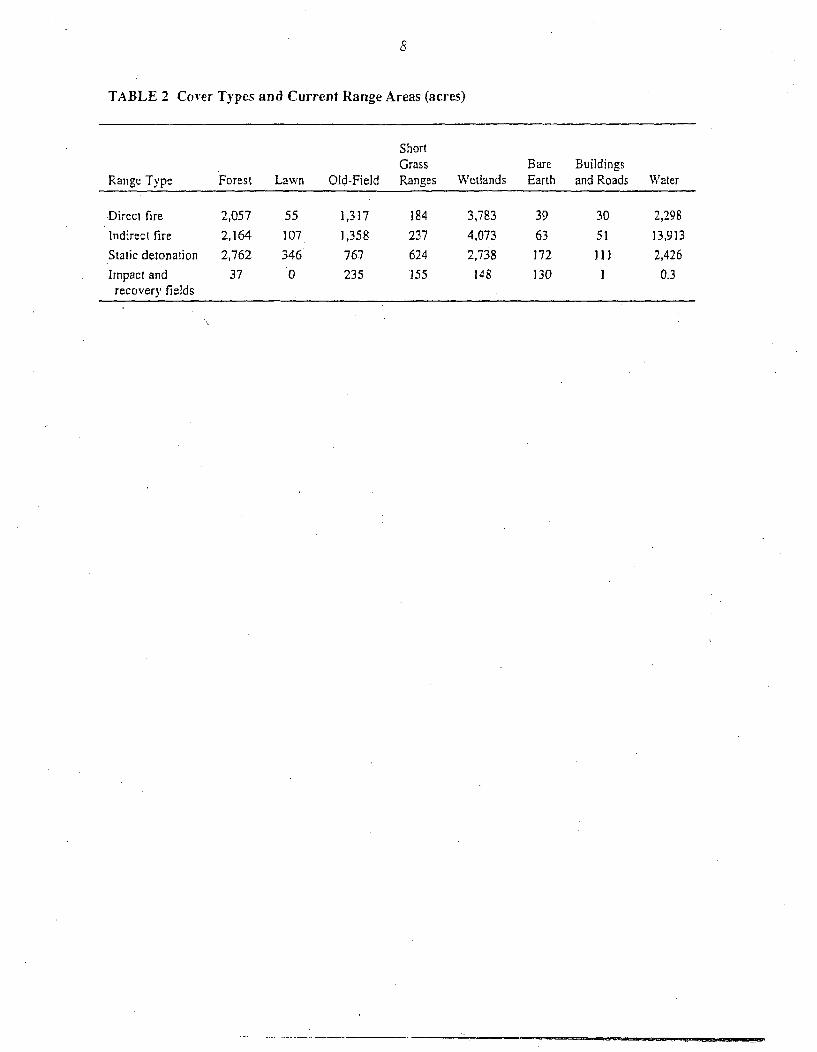
Cover types in existing range areas can be divided into the same categories discussed above.Table 2 presents specific breakdowns for the various types of range cover. The locations and spatialdistribution of different range cover types at APG are detailed in Figure 4. The vegetation typesshown in Figure 4 are bare earth, forest, field (both frequently and infrequently mowed), andmarsh/shrub.
8
TABLE 2 Cover Types and Current Range Areas (acres)
ShortGrass Bare Buildings
Range Type Forest Lawn Old-Field Ranges Wetlands Earth and Roads Water
Direct fire 2,057 55 1,317 184 3,783 39 30 2,298
Indirect fire 2,164 107 1,358 237 4,073 63 51 13,913
Static detonation 2,762 346 767 624 2,738 172 111 2,426
Impact and 37 0 235 155 148 130 1 0.3recovery' fields
9
3 FIRES AT APG
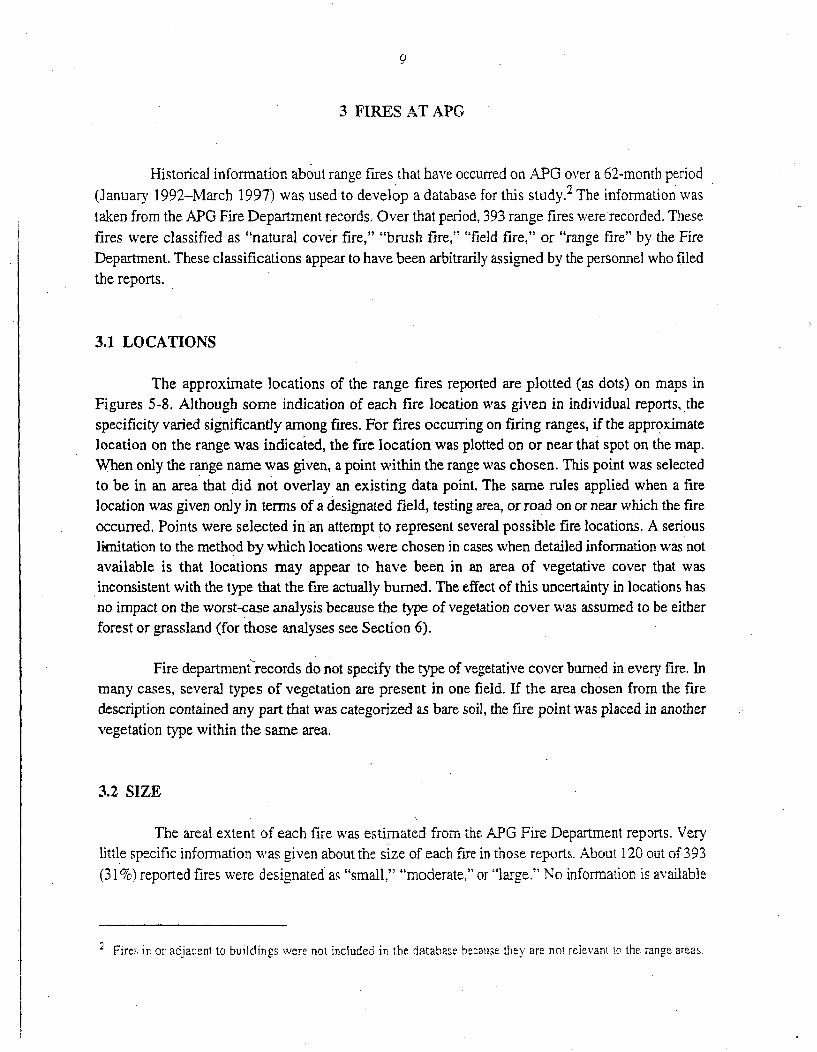
Historical information about range fires that have occurred on APG over a 62-month period(January 1992-March 1997) was used to develop a database for this study.2 The information wastaken from the APG Fire Department records. Over that period, 393 range fires were recorded. Thesefires were classified as "natural cover fire," "brush fire," "field fire," or "range fire" by the FireDepartment. These classifications appear to have been arbitrarily assigned by the personnel who filedthe reports.
3.1 LOCATIONS
The approximate locations of the range fires reported are plotted (as dots) on maps inFigures 5-8. Although some indication of each fire location was given in individual reports, thespecificity varied significantly among fires. For fires occurring on firing ranges, if the approximatelocation on the range was indicated, the fire location was plotted on or near that spot on the map.When only the range name was given, a point within the range was chosen. This point was selectedto be in an area that did not overlay an existing data point. The same rules applied when a firelocation was given only in terms of a designated field, testing area, or road on or near which the fireoccurred. Points were selected in an attempt to represent several possible fire locations. A seriouslimitation to the method by which locations were chosen in cases when detailed information was notavailable is that locations may appear to have been in an area of vegetative cover that wasinconsistent with the type that the fire actually burned. The effect of this uncertainty in locations hasno impact on the worst-case analysis because the type of vegetation cover was assumed to be eitherforest or grassland (for those analyses see Section 6).
Fire department-records do not specify3 the type of vegetative cover burned in every fire. Inmany cases, several types of vegetation are present in one field. If the area chosen from the firedescription contained any part that was categorized as bare soil, the fire point was placed in anothervegetation type within the same area.
3.2 SIZE
The areal extent of each fire was estimated from the APG Fire Department reports, Verylittle specific information was given about the size of each fire in those reports. About 120 out of 393(31%) reported fires were designated as "small." "moderate," or "large." No information is available
2 FireF, in or adjacent to buildings were not included in the database bezause they are not relevant to the range areas.
10
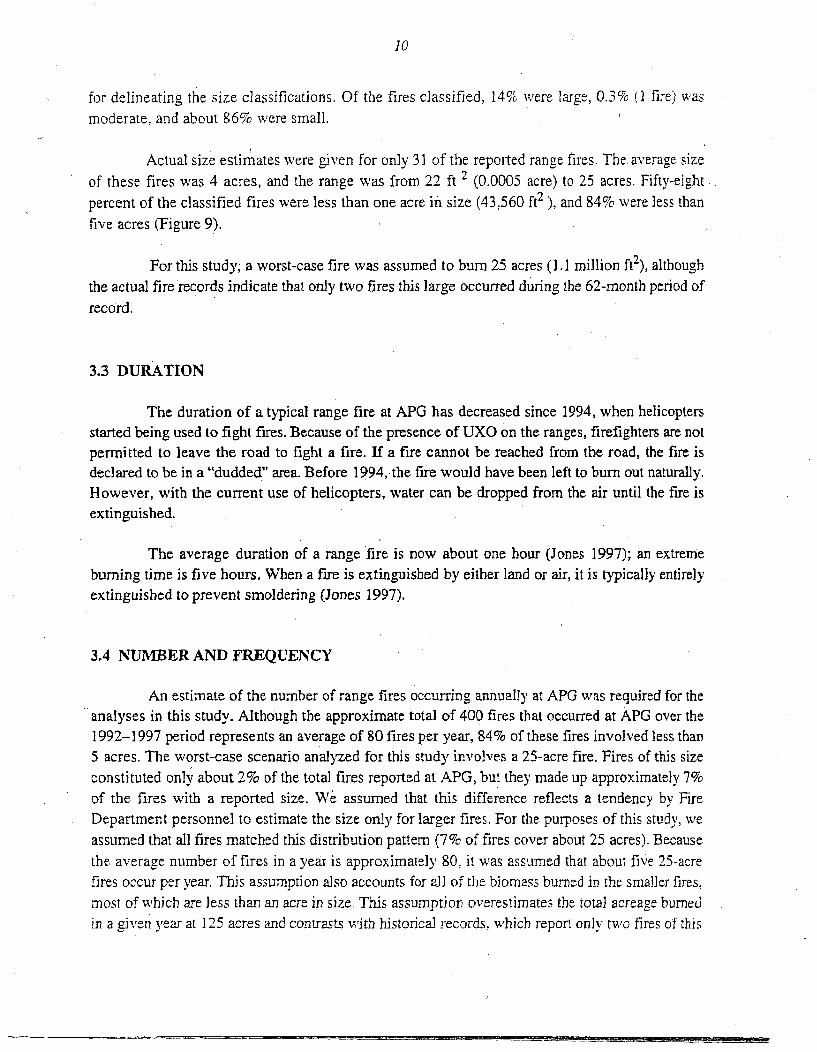
for delineating the size classifications. Of the fires classified, 14% were large, 0.3% (1 fire) wasmoderate, and about 86% were small.
Actual size estimates were given for only 31 of the reported range fires. The average sizeof these fires was 4 acres, and the range was from 22 ft 2 (0.0005 acre) to 25 acres. Fifty-eightpercent of the classified fires were less than one acre in size (43,560 ft2 ), and 84% were less thanfive acres (Figure 9).
For this study, a worst-case fire was assumed to bum 25 acres (1.1 million ft2), althoughthe actual fire records indicate that only two fires this large occurred during the 62-month period ofrecord.
3.3 DURATION
The duration of a typical range fire at APG has decreased since 1994, when helicoptersstarted being used to fight fires. Because of the presence of UXO on the ranges, firefighters are notpermitted to leave the road to fight a fire. If a fire cannot be reached from the road, the fire isdeclared to be in a "dudded" area. Before 1994, the fire would have been left to burn out naturally.
However, with the current use of helicopters, water can be dropped from the air until the fire isextinguished.
The average duration of a range fire is now about one hour (Jones 1997); an extremeburning time is five hours. When a fire is extinguished by either land or air, it is typically entirely
extinguished to prevent smoldering (Jones 1997).
3.4 NUMBER AND FREQUENCY
An estimate of the number of range fires occurring annually at APG was required for theanalyses in this study. Although the approximate total of 400 fires that occurred at APG over the
1992-1997 period represents an average of 80 fires per year, 84% of these fires involved less than5 acres. The worst-case scenario analyzed for this study involves a 25-acre fire. Fires of this size
constituted only about 2%7 of the total fires reported at APG, but they made up approximately 7%
of the fires with a reported size. We assumed that this difference reflects a tendency by FireDepartment personnel to estimate the size only for larger fires. For the purposes of this study, we
assumed that all fires matched this distribution pattern (7% of fires cover about 25 acres). Becausethe average number of fires in a year is approximately 80, it was assumed that about five 25-acre
fires occur per year. This assumption also accounts for all of the biomass burned in the smaller fires,
most of which are less than an acre in size. This assumption overestimates the total acreage burned
in a given year at 125 acres and contrasts with historical records, which report only two fires of this
II
size during the 62-month study period. As detailed in Section 7.2, 'the total acreage burned by a fireis the most significant input into the models used for this study because the most exposed individualis assumed to be present at the point of highest contaminant concentration for the entire duration ofeach fire,
J 2
4 CONTAMINANTS OF CONCERN
Five chemical contaminants derived from range activities (arsenic, lead, DU, TCE, andDDT) and two contaminants released by burning uncontaminated vegetation (2-furaldehyde andvinyl acetate) were. examined in this study. In addition, two chemical agents (mustard and phosgene)were also evaluated.
The two chemical agents would be released from UXO on the ranges if the UXO items were"cooked off' or detonated by the heat generated during a range fire. Unlike the other contaminants,
these- chemical agents were not assumed to have entered the vegetation. Instead, the maximumcredible release of each chemical from one ordnance round was estimatedin consultation with APGemployees (Anderson 1997). These amounts were then used as input into a contaminant transportand dispersion model, D2PC, often used by the Army for calculating contaminant release andtransport for such occurrences.
Although actually an unknown factor, the frequency with which unexploded roundsdetonate or rupture during a range fire is expected to be small for at least two reasons. First, largeareas of the ranges are covered by water or swamps, which insulate unexploded rounds from heat.Second, rounds lying on a dry surface will probably not be exposed to the fire for enough time topermit heat transfer through the shell casing to cause heat-sensitive areas to reach sufficiently hightemperatures to 'detonate or rupture.
For this study, the temperature of the fire was assumed to be sufficient to detonate theunexploded rounds. No effort was made to determine the probability that a given type of fire wouldcook-off a UXO round. As a worst-case scenario, the probability of this occurrence was assumed tobe 1.0. APG Fire Department records do not indicate that any chemical agent rounds have actuallybeen detonated by range fires during the study period; therefore, the actual probability of such anoccurrence is likely to be significantly below the value of 1.0 that we assumed for this study.
4.1 SOIL CONCENTRATIONS
Chemical contaminants of concern assumed to be found in and on vegetation at APGinclude lead, arsenic, TCE, DU, and DDT. For the purpose of this study, it was necessary to estimatethe amounts of such chemicals that would be released during a range fire, Information on the soilconcentrations of these chemicals was used in these estimates. The information was obtained fromseveral studies previously completed at APG, The concentrations used in this study' are listed inTable 3. These values represent high, but realistic, concentrations known for APG soils.
13
For several reasons, J-Field waschosen as the representative site for obtainingcontaminant levels for lead and arsenic. J-Fieldis heavily contaminated with metals, extensivesoil contamination and vegetation data areavailable, and plant-uptake studies for severalof the contaminants of concern have beenconducted at J-Field.
J-Field is located on the southern endof the Gunpowder Neck peninsula within theEdgewood Area of APG (Figure 1). Since the1940s, J-Field has been the location of manyopen burning and detonation activities forAPG. Figure 10 illustrates the locations ofchemical contaminant sources at J-Field.Sampling at J-Field has shown that the soils arehighly contaminated with many inorganiccompounds (mostly metals) and organiccompounds (Yuen et al. 1996).
Samples of soil and plants wereanalyzed for contaminant levels in a bio-
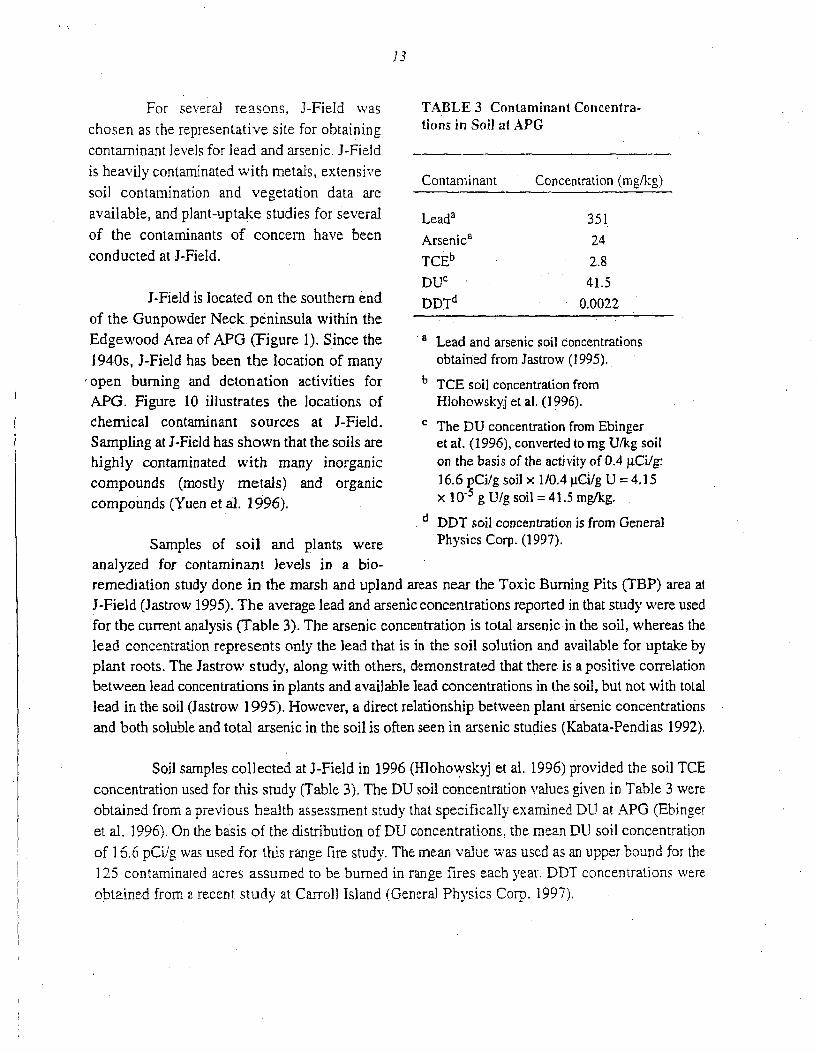
TABLE 3 Contaminant Concentra-tions in Soil at APG
Contaminant Concentration (mg/kg)
Leada 351
Arsenic' 24
TCEb 2.8
DUc 41.5
DDTd 0.0022
a Lead and arsenic soil concentrations
obtained from Jastrow (1995).b TCE soil concentration from
Hlohowskyj et al. (1996).The DU concentration from Ebinger
et al. (1996), converted to mg U/kg soilon the basis of the activity of 0.4 g.tCi/g:16.6 pCi/g soil x 1/0.4 ptCi/g U = 4.15x 10⁻⁵ g U/g soil = 41.5 mg/kg.
d DDT soil concentration is from General
Physics Corp. (1997).
remediation study done in the marsh and upland areas near the Toxic Burning Pits (TBP) area atJ-Field (Jastrow 1995). The average lead and arsenic concentrations reported in that study were usedfor the current analysis (Table 3). The arsenic concentration is total arsenic in the soil, whereas thelead concentration represents only the lead that is in the soil solution and available for uptake byplant roots. The Jastrow study, along with others, demonstrated that there. is a positive correlationbetween lead concentrations in plants and available lead concentrations in the soil, but not with totallead in the soil (Jastrow 1995). However, a direct relationship between plant arsenic concentrationsand both soluble and total arsenic in the soil is often seen in arsenic studies (Kabata-Pendias 1992).
Soil samples collected at J-Field in 1996 (Hlohowskyj et al. 1996) provided the soil TCEconcentration used for this study (Table 3). The DU soil concentration values given in Table 3 wereobtained from a previous health assessment study that specifically examined DU at APG (Ebingeret al. 1996). On the basis of the distribution of DU concentrations, the mean DU soil concentrationof 16.6 pCilg was used for this range fire study. The mean value was used as an upper bound for the1.25 contaminated acres assumed to be burned in range fires each year. DDT concentrations wereobtained from a recent study at Carroll Island (General Physics Corp. 1997).
14
Other lead, arsenic, and TCE values are also reported in the Remedial Investigation Reportfor J-Field (Yuen at al. 1996) and other studies performed for the entire APG. The averagecontaminant concentrations given in those reports are consistently lower than the values given inTable 3. On the other hand, individual samples exceeding the values listed in Table 3 were alsoreported. Of note were the extremely high concentrations found inside the TBP of J-Field. Thesehigh values from the TBP were considered to be overly conservative for use in this study for severalreasons: (1) areas contaminated to this degree are smaller than the 125-acre area assumed in ourstudy to be burned each year, (2) the TBP area is considered the most contaminated area of J-Field,and possibly of the entire Aberdeen Area, and thus is not representative of conditions elsewhere atAPG, (3) none of the-metal contamination was present in extractable form, and (4) the highest soilconcentrations were often found in areas that do not sustain vegetation and would not, therefore, bereleasing contaminants through burning of vegetation.
4.2 CHEMICALS RELEASED FROM BURNING VEGETATION
The two chemicals released during burning of uncontaminated vegetation that couldproduce notable health concerns if emitted in sufficiently high concentrations are 2-furaldehyde andvinyl acetate (Table 4). Information about chemical releases from burning uncontaminated vegetation(Appendix B) was obtained from a study measuring such emissions on a per unit of biomass basis(McKenzie et al. 1995). Separate estimates of contaminant releases were made for forest and fieldland cover types on the basis of release amounts calculated for burning wood and litter, respectively.Because these data were not specifically obtained for the forest type found at APG, all of the releaseamounts were multiplied by a factor of five to provide conservative estimates for the vegetationoccurring at APG (Richards 1997).
Relative to the release of contaminants of concern from burning contaminated vegetation,all of the arsenic, lead, TCE, DU, and DDT present in a plant was assumed to be released during arange fire. The amount of each contaminant present in the vegetation was estimated by using theplant uptake ratios discussed in Sections 5 and 7. This assumption (release of all contaminants froma plant) means that no residual metal contamination would be left in the ash; all the metal would bereleased to the fire plume. The assumption was also made that the fire would not degrade or destroythe organic contaminants. These assumptions result in release estimates for these contaminants thatare higher than might actually be expected to occur. On the other hand, these assumptions ignore anybreakdown products that might be harmful. Ignoring breakdown products was considered to bejustifiable because any quantities of breakdown products would be at lower concentrations than theparent chemical.
15
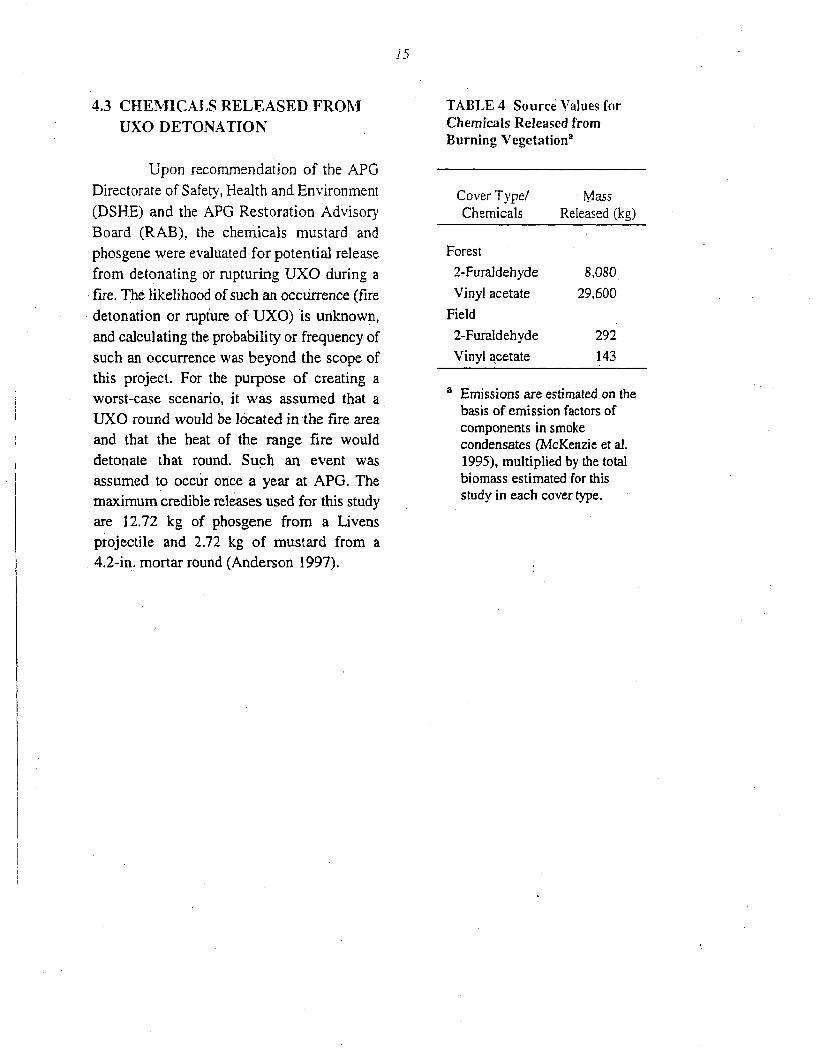
4.3 CREMICALS RELEASED FROMUXO DETONATION
Upon recommendation of the APGDirectorate of Safety, Health and Environment(DSHE) and the APG Restoration AdvisoryBoard (RAB), the chemicals mustard andphosgene were evaluated for potential releasefrom detonating or rupturing UXO during afire. The likelihood of such an occurrence (firedetonation or rupture of UXO) is unknown,and calculating the probability or frequency ofsuch an occurrence was beyond the scope ofthis project. For the purpose of creating aworst-case scenario, it was assumed that aUXO round would be located in the fire areaand that the heat of the range fire woulddetonate that round. Such an event wasassumed to occur once a year at APG. Themaximum credible releases used for this studyare 12.72 kg of phosgene from a Livensprojectile and 2.72 kg of mustard from a4.2-in. mortar round (Anderson 1997).
TABLE 4 Source Values forChemicals Released fromBurning Vegetation'
Cover Type/ MassChemicals Released (kg)
Forest
2-Furaldehyde 8,080
Vinyl acetate 29,600Field
2-Furaldehyde 292Vinyl acetate 143
a Emissions are estimated. on the
basis of emission factors ofcomponents in smokecondensates (McKenzie et al.1995), multiplied by the totalbiomass estimated for thisstudy in each cover type.
J6
5 CHEMICAL CHARACTERISTICS
The following sections describe the chemical properties of the seven contaminants ofconcern in this analysis: arsenic, lead, depleted uranium, trichloroethylene (TCE), dichlorodiphenyl-trichloroethane (DDT), mustard agent, and phosgene.
5.1 ARSENIC
Arsenic exists in four different oxidation states in the natural environment; it typicallyoccurs in the divalent state in soil solution. Behaving similarly tophosphate, it is fixed (taken froma readily available form to a less readily available form) in the soil by iron, aluminum, and calcium(Berry and Wallace 1974; Dvorak et al. 1978).
Arsenic moves down through the soil column with leaching water in sandy soils. The strongsorption by clays, hydroxides, and organic matter greatly limits this migration (Kabata-Pendias1992). Background arsenic concentrations at APG range from 0.25 to 3.7 mg/kg (JCF-KaiserEngineers 1995). Arsenic soil contamination at the TBP area may be the result of the disposal anddecontamination of lewisite and adamasite - chemical agents used during WWI (Hlohowskyj et al.1996). Uptake of arsenic by plants has been perceived as a passive process in which the arsenicmoves along with water flow into the plant. As a result, linear relationships between plantconcentrations and soil concentrations have been observed for both total and soluble forms of themetal. With increasing concentrations of arsenic in the soil, the highest arsenic concentrations withinthe plant are found in old leaves and roots (Kabata-Pendias 1992).
Arsenic toxicity depends on its chemical form and oxidation state, inorganic formsgenerally being more toxic than organic forms (Eisler 1988a). In humans, high oral doses (e.g.,greater than about 0.3 ppm in food or water) can cause a variety of adverse health effects, such asirritation of the stomach and intestines, decreased production of blood cells, and abnormal heartrhythms. Doses greater than about 60 ppm can cause death (ATSDR 1993a). Chronic low-level oralexposures are associated with increased incidence of cancer of the liver, bladder, kidney, and lung;increased lung cancer incidence is also associated with inhalation of inorganic arsenic. Inorganicarsenic is classified as a known human carcinogen by the U.S. Environmental Protection Agency(EPA 1997).
5.2 LEAD
Lead is a common contaminant at munition demolition sites. At J-Field, it is widelydistributed in the Pushout Areas of the TBP (Hiohowskyj et al. 1996).
17
Lead is much less mobile than other metals, such as arsenic, and is typically unavailable toplants. Relative metal solubility decreases with increasing total metal content of the soil and highersoil pH because a decrease in soil pH (increase in soil acidity) also decreases the adsorption of metalto soil particles, thereby making the metal more mobile and possibly more available for plant uptake
(Kabata-Pendias 1992).
Lead often moves down through the soil column with water, but generally remains bound
within the top few feet of soil. The characteristic localization of this metal near the soil surface often
depends on the accumulation of organic matter, which binds the metal, at shallow depths (Yuen et
al. 1996).
Plants are able to uptake lead from the soil when it is in solution. Generally, a directrelationship exists between an increasing amount of lead in the plant tissue and the amount ofavailable, or soluble lead, in the soil solution (Kabata-Pendias 1992; Jastrow 1995). Lead typicallyaccumulates in the roots of plants, with very limited translocation to plant tops. Results of studies
of Phragmites australis at J-Field corroborated the direct relationship between plant leadconcentrations and available lead in the soil. The calculated plant:soil concentration ratios are up to
an order of magnitude higher for roots than plant tops, emphasizing the limited translocation of leadto aboveground plant parts (Jastrow 1995).
Lead deposition on plant surfaces usually does not affect transpiration across a plant'slipophilic surface; however, lead volatilization may decrease during a fire (Eisler 1988b). Because
of precipitation, however, the lead deposited on these plant surfaces could be removed shortly afterdeposition, and volatilization would not be affected.
Reported effects of lead poisoning in mammals include altered structure and function inkidneys, bones, and the hematopoietic (blood-forming) and central nervous systems, as wellbiochemical, histopathological, teratogenic, and reproductive effects (Eisler 1988b). High oral orinhalation doses of lead can cause anemia, severely damage the brain and kidneys, damage the malereproductive system, and cause abortions (ATSDR 1993b). Chronic lower-level exposures causepremature births and decreased mental ability in exposed infants and children. Exposures to someinorganic lead compounds have been associated with kidney tumors in rats and mice; inorganic lead
compounds are classified as probable human carcinogens by the EPA (1997).
5.3 DEPLETED URANIUM
Depleted uranium (DU) is the waste product of uranium enrichment processes and isdefined as uranium that has less than 0.711% of the isotope uranium-235. DU consists principally
of uranium-238. with trace amounts of uranium-235. Although it is less radioactive than natural
18
uranium, DU metal is pyrophoric (able to ignite spontaneously) and extremely dense (Los AlamosNational L.aboratory 1996), Military specifications require that DU used by the Department of theDefense (DOD) must have 0.334% or less uranium-235, and DU actually used by the DOD has only
0.2% uranium-235 (Rynders 1995).
The DU at APG is derived from the testing of penetrators made of depleted uranium. Thistesting began in the 1970s. Test firing has been primarily limited to the B,3 Range and Ford's Farmat APG; initial studies were performed primarily for antitank munitions..Testing in 1990 involvedthe firing of approximately 9,000 rounds (Davis 1990). The penetrators used in the testing arecomposed of 99.25% uranium and 0.75% titanium, by weight, and are constructed of an alloy
material called Stallaboy (Davis 1990).
Potential threats to human health from DU are radioactivity and toxic chemical hazards,with the chemical hazards posing the highest risk (Davis 1990). If inhaled in soluble form,compounds of DU can cause chemical toxicitr..t the kidney. Radioactive dangers are less forcompounds of DU than for natural uranium. jOe gram of natural uranium emits 0.68 VCi of
- radiation, while DU emits 0.36 pCi of radiation per gram.his difference is due mostly to theremoval of radioactive products during the enrichment processes that produce DU (Davis 1990).
5.4 TRICHLOROETHYLENE
Trichloroethylene, also trichloroethene, TCE, or TRCLE,- is a volatile, halogenatedhydrocarbon that was selected as the example solvent for this study. The halogenation of thischemical makes it less flammable, more stable, more hydrophobic, and more troublesomeenvironmentally than other hydrocarbons (Mackay 1991). Its main danger may be a result of its highaffinity to partition out of water and into target organisms. This affinity is shown by the compound'soctanol-water partition coefficient, or the concentration of the chemical in octanol divided by theconcentration of the chemical in water (Travis and Arms 1988). This ratio, which for TCE is 240,serves as a measure of a chemical's lipophilicity, or tendency to partition out of water and into lipids.The higher this ratio, or the more lipophilic a chemical, the greater its chances of passing through
the lipid barrier surrounding a plant.
Unlike metals, a major factor with organic contaminants is the age of the contamination,especially for chlorinated solvents like TCE. These -contaminants may be affected byphytodegradation, which is the plant-assisted breakdown of the chemical to less or nontoxicdegradation products, as well as in-situ degradation in the soil water.
Studies show a direct relationship between the amount of water available to a plant and theuptake of TCE and/or its metabolites (Kabata-Pendias 1992). Uptake of organic compounds fromsoil by plants is mainly affected by three parameters: (1) the physicochemical properties of the
19
compound, (2) the environmental conditions, and (3) the plant characteristics. Assuming that theenvironmental conditions and plant types are constant across APG, water uptake generally will bethe determining factor for the uptake of TCE. Increased water flow increases bulk transport througha plant because of evapotranspiration, which is the driving force behind translocation.
TCE is hydrophobic, and only trace amounts of the compound will dissolve in water.Persistent in nature, its half-life depends entirely on the existing form, which in turn depends on themicrobes present. Health hazards associated with TCE include headaches and dizziness when it isinhaled, even in moderate amounts. Animals chronically exposed to TCE can have enlarged livers.TCE has been classified as a possible or probable human carcinogen by the EPA (1996).
5.5 DDT
For this study, the anthropogenic pesticide tested was 4,4'-DDT. The source of thischemical at APG was previously widespread spraying for insects and other pests. This source hasbeen eliminated because the use of DDT has been banned in the United States since 1972.
The process of DDT breakdown in the soil is not completely understood, and someuncertainty exists about the time required for it to occur. Certain studies have indicated that theeffective half-life for DDT in the soil is two years; other studies indicate that breakdown of thiscompound may take more than 15 years. DDT can evaporate from the soil surface and enter the air,or be broken down by the sun (photolysis) and certain microorganisms. DDT does not move readilyin the environment, especially in the soil, where it is readily adsorbed to soil particles. It can,however, be taken up by some plants growing in contaminated soils (ATSDR 1992a). DDTvolatilizes more readily than its breakdown products and has an estimated volatilization half-life of100 days (Sleicher and Hopcraft 1984).
DDT and its breakdown products enter the body primarily through ingestion, depending onthe concentration in the food consumed. Small amounts can enter the body through the air. However,the particles are usually too large to cross into the lungs and are typically coughed up. DDT exposuregenerally results in detrimental effects to the nervous system. However, these effects are seen at veryhigh concentrations (on the order of 571 ppm). No effects have been seen in people exposed toamounts up to 22 ppm for 18 months (ATSDR 1992a). DDT is classified as a probable humancarcinogen by the EPA (1997).
5.6 MUSTARD
Mustard (HD) is a blister agent that has delayed effects. Most of the HD in mustard--c-ta-i_.n -u-.! oIL is a•ltr -l 1 tha 4wa difillpdrl hef re loading a d tho-•,,fnrP .... .. nr ... . " r' - ....
20
HD that is confined for a lona time in sealed containers can undergo thermal degradation to1,4-dithiane and 1,2-dichloroethane (Bell et al. 1927). The thermal decomposition products of HDincrease with time during storage.
The melting point of mustard (58 'F) is high enough that for portions of the year it will bea solid and unable to flow through holes in corroded containers, Even above this melting point, HDmay not readily move through corrosion holes, because of the formation of a polymer skin at thewater/organic interface.
The primary acute effects of mustard are severe irritation of the eyes and respiratory tractand blistering of the skin. Inhalation and dermal exposure are the primary pathways of concern,because mustard degrades very quickly in water. The Department of Health and Human Services andthe International Agency for Research on Cancer have classified mustard as carcinogenic (ATSDR1992b).
5.7 PHOSGENE
Phosgene, CG, or carbonyl chloride (COCI2) is an extremely volatile chemical that reactswith water to form hydrogen chloride and carbon dioxide with a half-life of 0.12 second. Therefore,CG can only survive long term in a sealed container. The main toxic effect of phosgene exposure ispulmonary edema (abnormal accumulation of fluid in the lungs), which often proves fatal.
21
6 BIOMASS INFORMALTION! VEGETATION SURVEYS
The total quantity of contaminants mobilized by a fire depends on the type of vegetationin the area in which the fire occurs and the types and concentrations of contaminants present in theaboveground plant parts. This section describes the biomass available for contaminant mobilization;Section 7 describes the potential plant uptake for organic and inorganic contaminants of concern.
Biomass estimates were made for the different vegetation types in which fires have occurredat APG. Because of large uncertainties, the various cover types previously described in Tables 1 and2 were combined into two categories: forest and field.
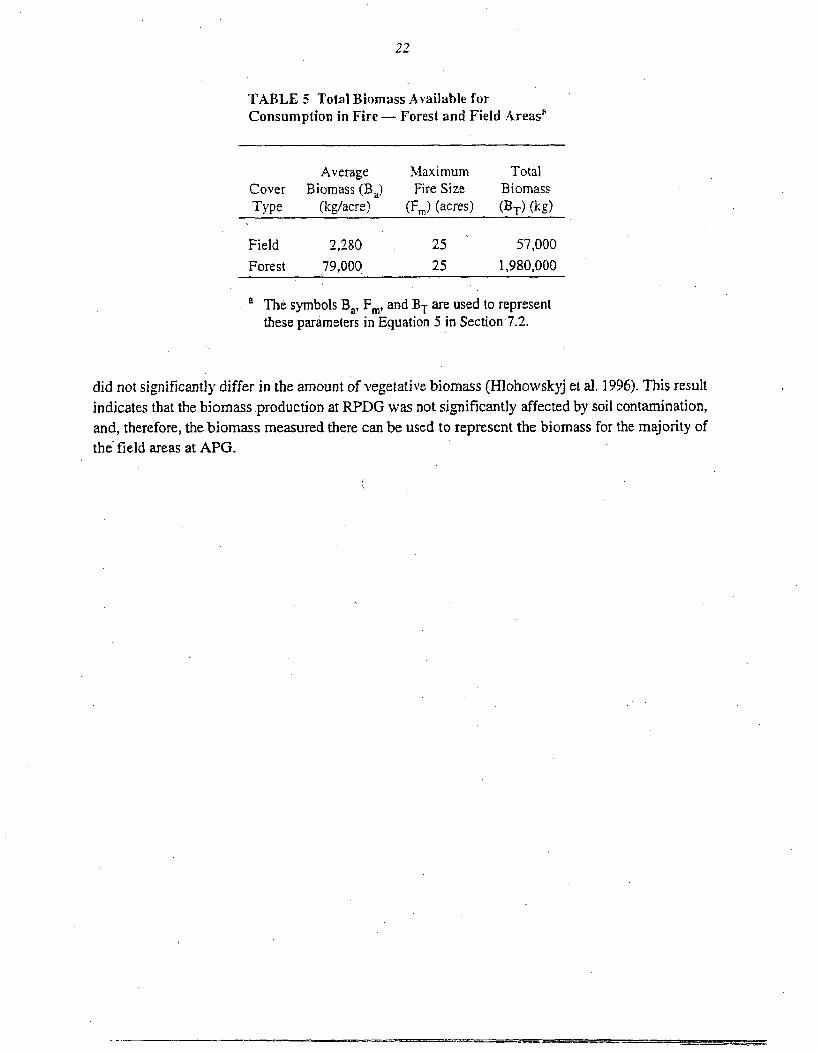
Because specific information on forest biomass was not available for APG, the data neededfor this analysis were estimated on the basis of a typical southeastern United States deciduous forest.Because of the abundance of sweetgum and red maple in the APG area, the representative forest typechosen was defined as "Mixed Hardwood" dominated by the "Acer-Nyssa association." An averageaboveground biomass of 7.9 x 10⁴ kg/acre has been estimated for this forest type (Barbour andBillings 1988). For the purposes of this study, 100% of the available biomass was assumed to beconsumed by the fire. We assumed that no residues from the contaminants would remain in the ashfrom the fire. The total amount of forest biomass available for consumption in each fire wasestimated on the basis of a fire covering 25 acres; details are provided in Table 5.
All vegetation other than forest was classified as field for biomass calculations. Fieldbiomass estimates were based on previous upland biomass samples taken from J-Field byHlohowskyj et al. (1996). Field vegetation includes grass species, reeds (typical of marsh andshrub/marsh areas), shrubs, forbs, and other herbaceous species. Data were taken from samples infive areas: the Toxic Burning Pits, South Beach Trench, Robbins Point Demolition Ground, RobbinsPoint Tower Site, and the Riot Control Pit. The values were averaged for each of the five areas. Themaximum average biomass (2,280 kg/acre) was measured at the Robbins Point Demolition Ground(RPDG) (Hlohowskyj et al. 1996). The low frequency of mowing in this area (about once a year)permits more biomass to accumulate and increases plant exposure to soil contaminants over that inareas that are more frequently mowed. For this study, all of the field biomass available (Table 5) wasassumed to be consumed by the fire, again leaving no contaminant residues in the ash.
Because the biomass information being used is from a heavily contaminated area (J-Field),the question could arise whether the vegetation biomass might be less because of the presence ofcontamination and its impact on plant growth. As a control, a reference point in an uncontaminatedarea was chosen to compare biomass production in areas with and without soil contamination(Hlohowskyj et al. 1996). The control study area is in Gunpowder Falls• State Park. It was selectedbecause of its similar natural soil conditions and mowing regimen, A Mann-Whitney similarity test
co7pe1.e n -÷•'-' ' indic ate t Rbbis P•t , Demolition -,r,-,,,md and the reference point)f1,~~ V • tIU•~L u i Jr. ! tL •[ kk [, dIti••lV . -
22
TABLE 5 Total Biomass Available forConsumption in Fire - Forest and Field Areas'
Average Maximum TotalCover Biomass (Ba) Fire Size BiomassType (kg/acre) (F,) (acres) (BT) (kg)
Field 2,280 25 57,000
Forest 79,000 25 1,980,000
a The symbols B.a Fm, and BT are used to representthese parameters in Equation 5 in Section 7.2.
did not significantly differ in the amount of vegetative biomass (Hlohowskyj et a]. 1996). This result
indicates that the biomass production at RPDG was not significantly affected by soil contamination,
and, therefore, the biomass measured there can be used to represent the biomass for the majority of
the field areas at APG.
23
7 PLANT UPTAKE AND RELEASE MODELS
The following sections discuss the methods used to estimate plant uptake of thecontaminants of concern and the subsequent release of those contaminants during a range fire.
7.1 ESTIMATING PLANT UPTAKE OF CHEMICALS
Soil contaminants can be taken up by plant roots :and possibly translocated to abovegroundplant tissues (Figure 11). A less significant contribution to total plant contamination can arise fromsplashing of contaminants in the soil onto plant surfaces by rain (rainsplash). Although equationsexist to estimate contamination by rainsplash, the quantities were considered negligible for this caseand were, therefore, excluded from our calculations.
Contaminant concentrations in plant tissue were estimated on the basis of known soilconcentrations, mathematical uptake models from studies reported in the literature, and field studiesdone at J-Field (Jastrow 1995). Determining the amount of a contaminant that a plant uptakes is anextremely complex task. Uptake depends on the contaminant's state and characteristics, thephysiological parameters of the plant, and the soil and atmospheric conditions (Dvorak et al. 1978;Kabata-Pendias 1992; Hope 1995; Jastrow 1995). The uptake ratios used for this study are in theform of plant:soil uptake ratios. This methodology assumes' a linear relationship betweencontaminant values in the soil and values in the plant tissue. This method may overestimate theuptake at high soil contamination levels, because uptake ratios may be nonlinear. Uptake ratios maybe higher for lower soil concentrations and decrease as soil concentrations increase. Any unknownparameters needed for estimating plant uptake were assumed to have values that would result inreasonable maximum uptake.
7.1.1 Uptake of Inorganic Contaminants
Man, plants have the ability to uptake metals, even those not required as nutrients. In somecases, plants can also accumulate contaminants in their tissue. To uptake and accumulate a metal,plants chelate the metal, which makes it less toxic to the plant, and then move the metal from theroots to the shoots, The highest concentration of metals is generally found in plant roots (Jastrow1995; Kabata-Pendias 1992), but concentrations in aboveground shoots can be higher. Previous fieldstudies at i-Field did not indicate the presence of any plants thai. had contaminant concert ai in
excess of the soil Values. This study focuses on the aboveground plant parts and contaminantconcentrations because they are subject to burning in a range fire.
24
The following equation (from Hlohowskyj et al. 1996) was used to estimate theconcentrations of arsenic, lead, and DU in the aboveground plant parts:
C = CRxC , (1)
where
C p= contaminant concentration in plant tissue (mg/kg),
CR - plant-to-soil concentration ratio, and
Cs = contaminant concentration in the soil (mg/kg).
The concentration ratio, CR, is defined as the ratio of the average concentration of thecontaminant in the plant to the average contaminant concentration in the soil (Dvorak et al. 1978).This method is widely used to estimate plant concentrations on the basis of known soil values. Thisprocedure is commonly used for preliminary studies when detailed plant and soil samples are notavailable for more sophisticated models. The ratio, however, does not incorporate the differencesin soil pH, soil type, cation exchange capacity, plant species, and other environmental conditions thatmight be different from those used to obtain the CR values. The CR values themselves depend onthe type of inorganic compound, as well as on environmental conditions. The highest ratiosconsistent with APG field conditions were chosen for this study. The assumptions of this uptakemodel (Vaughn et al. 1975) are as follows:
" CR values depend on the available contaminant concentration.
• CR generally decreases with increasing soil concentration.
° CR appears to reach a maximum at a low level (< 1 ppm), when saturationkinetics are applied, and decreases beyond this point.
6 CR values assume that uptake is entirely an energy-dependent process inwhich plants accumulate ions from solution against a concentration gradient.
Uptake of a contaminant from the soil remains constant, in excess of theindividual saturation point for the plant and chemical. Thus, plant tissueconcentrations estimated using this model may exceed actual maximum valuesfor the plant.
25
The CR values used here (Table 6) for lead and arsenic (0.45 and 0.14, respectively) weretaken from studies by Hodgson (1970). These values are more conserative by an order of magnitudethan those listed in the Chemical Database for Multimedia Environmental Assessment System(Strenge and Peterson 1989), which gives values of 0.068 and 0.02 for lead and arsenic, respectively.
Concentration ratios derived from actual plant and soil lead concentrations measured atJ-Field confirm the conservative nature of the ratio chosen for lead. In the J-Field bioremediationstudy, the ratios range from 0.013 to 0.065 for Phragmites australis, a common reed that is knownto have high uptake ratios. This ratio is far below the CR of 0.45 for lead used in this study (Jastrow1995). Although even larger values were available from Vaughn et al. (1975), they were rejected forthis study because (1) Vaughn's values were for plants grown under laboratory, hydrophobicconditions and cannot be applied to field conditions, and (2) actual field data are an order ofmagnitude below the values used for this study.
Higher total plant CR values were used for this study as an upper-bound estimate of plant.uptake and reflect root values, even though only the aboveground portion of the plant will be burned.The aboveground plant tissues typically have lower CR values than the total plant values used in thisstudy. This fact is particularly important for estimating lead uptake,,because extensive research inthe behavior of lead indicates that it accumulates mainly in the roots and nodules, with very littleactually translocated to the plant tops (Kabata-Pendias 1992; Jastrow 1995; and Hlohowskyj et al.1996). Thus, the total plant accumulation is typically much higher than the amount of thecontaminant that is available for burning. The ratios calculated in the. Jastrow (1995) study were anorder of magnitude higher for the roots than those for the shoots.
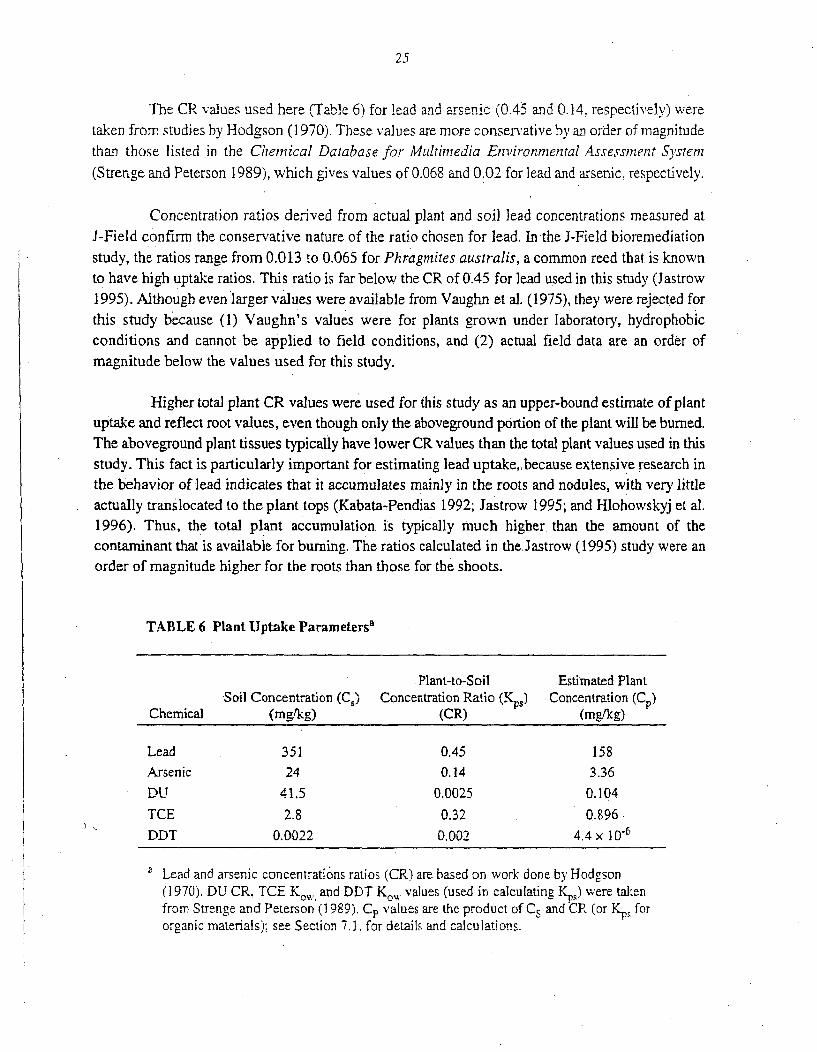
TABLE 6 Plant Uptake Parametersa
Plant-to-Soil Estimated PlantSoil Concentration (C,) Concentration Ratio (K.,) Concentration (Cp)
Chemical (mg/kg) (CR) (mg/kg)
Lead 351 0.45 158Arsenic 24 0.14 3.36DU 41,5 0.0025 0.104TCE 2.8 0.32 0.896DDT 0.0022 0.002 4.4 x 10.6
Lead and arsenic concentrations ratios (CR.) are based on work done by Hodgson(1970). DU CR, TCE K,., and DDT K,, values (used in calculating Kp-) were takenfrom Strenge and Peterson (1989), Cp values are the product of Cs and CR (or Kp. fororganic materials); see Section 7.1. for details and calculations.
26
The CR used for DU is 0.0025 (Strenge and Peterson 1989; NCRP 1984; Ebinger et a].1996). All isotopes from uranium-233 to uraniiim-239 were'listed with the same uptake ratio, Thesame caveats and assumptions detailed above also apply to CR values for DU.
7.1.2 Uptake of Organic Contaminants
Estimated uptakes for the two organic contaminants (TCE and DDT) were calculated witha model in which.CR is replaced by Kps. KP, is similar to CR and is a function of the octanol-waterpartition coefficient (Kow) of the organic contaminant. This model can be expressed as (Hope 1995):
C,, .- =KxC (2)
K =7.7xK0,,-0.58 (3)
where
C = contaminant concentration in the plant (mg/kg),
Cs = contaminant concentration in the soil (mg/kg), and
Kps = plant-soil partition coefficient for soil to above-ground plant parts(unitless).
The Kw value for TCE is 240 (Strenge and Peterson 1989), which gives a Ks value of0.32. The Kow for DDT is. 1.6x10⁶ (Strenge and Peterson 1989); the associated KP, value is 0.002.
7.2 TOTAL CONTAMINANT RELEASE IN A FIRE
To estimate the total amount of contamination released during a 25-acre range fire, thecalculated plant contaminant concentrations were combined with the vegetation biomass informationand fire data (Table 7). The total mass of contaminant released during a fire was calculated with thefollowing equation:
CT= CPxBT, (4)
where
B7 = B".XTM
27
and
CT = total contaminant release (kg),
C = estimated plant concentration (mg/kg),
BT = total biomass (kg),
132= average biomass amount (kg/acre), and
Fm = maximum size of fire (25 acres).
As mentioned previously, a bounding-case fire was assumed to consume all of the availablebiomass and release all of the contaminants contained in the plant tissues. The fire was assumed tobe 100% efficient, with no contamination left after the burn.
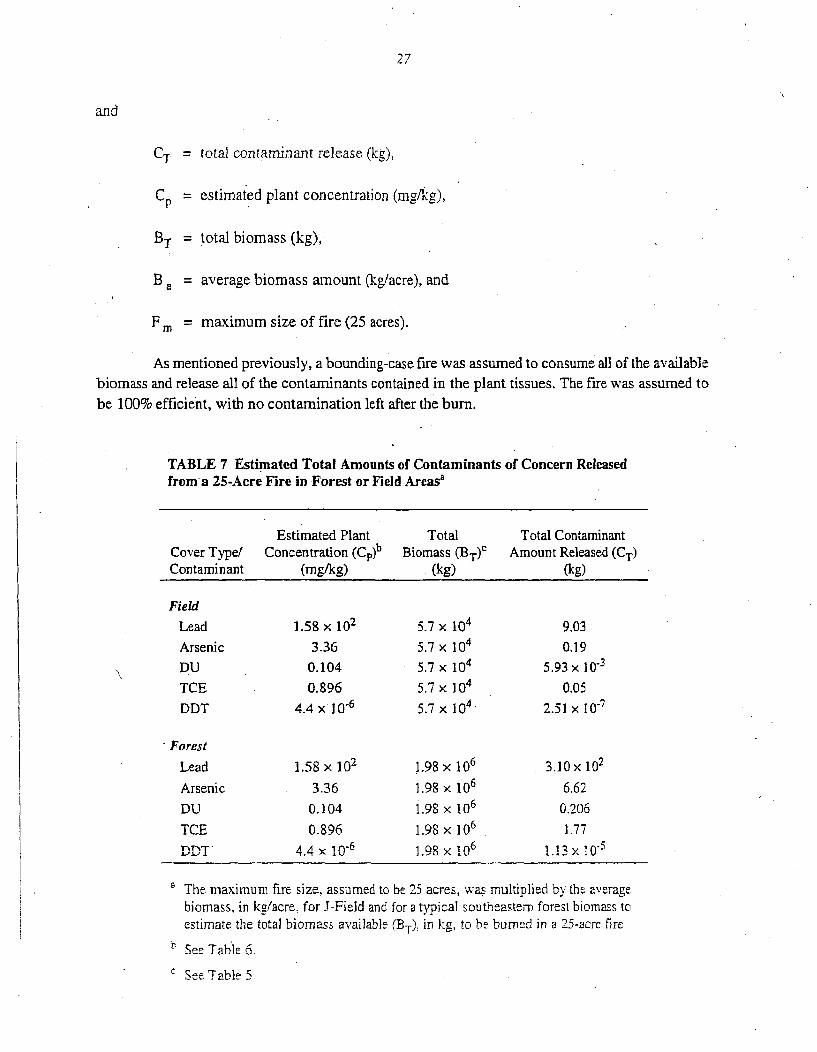
TABLE 7 Estimated Total Amounts of Contaminants of Concern Releasedfroma 25-Acre Fire in Forest or Field Areasa
Estimated Plant Total Total ContaminantCover Type/ Concentration (Cp)b Biomass (BT)c Amount Released (CT)Contaminant (mg/kg) (kg) (kg)
FieldLead 1.58 x 10' 5.7 x 10⁴ 9.03
Arsenic 3.36 5.7 x 10⁴ 0.19DU 0.104 5.7 x 10⁴ 5.93 x l0"'TCE 0.896 5.7 X 10⁴ 0.05
DDT 4.4 x 10⁻⁶ 5.7 x 10"' 2.51 x 10⁷
Forest
Lead 1.58 x 10² 1.98 x 10⁶ 3.10 x 10²
Arsenic 3.36 1.98 x 10⁶ 6.62DU 0.104 1.98 x 10⁶ 0.206
TCE 0.896 1.98 x 10⁶ 1.77
DDT 4'4 X 10⁻⁶ 1.98 x 10⁶ 1.3 x 0.5
The maximum fire size, assumed to be 25 acres, was multiplied by the averagebiomass, in kg/acre, for J-Field and for a typical southeastern forest biomass toestimate the total biomass available (BT), in kg, to be burned in a 25-acre fire
b See Table 6.
C See 7ablet 5
28
8 FIREPLUME MODEL
The computer model FIREPLUMiE (Brown et al. 1997) was used to estimate contaminantconcentrations in smoke plumes originating from range fires. FIREPLUME is an extension of the
Monte Carlo Lagrangian Dispersion Model (MCLDM) developed over the past 10 years to evaluateatmospheric dispersion of contaminants. MCLDM was originally developed to predict dispersionof military smoke (fog oil and hexachloroethane) from generators and smoke pots located near theground; the model was later extended to include all passive releases. The evolution of the presentmodel began with a study of dispersion under convective conditions that can arise during, a fire(Liljegren 1989). Results of the Monte Carlo model developed for that application compared wellwith available field and laboratory data for such conditions. A particularly valuable feature of the
model was its ability to match the rising centerline phenomenon that has been observed with plumesfrom surface releases under convective conditions (e.g., water tank data by Willis and Deardorff[1974]). Brown (1997) extended the model to treat dispersion in stable and near-neutral conditionsand refined the Monte Carlo modeling in the surface layer to obtain a better estimate of ground-levelconcentrations.
The current version of FIREPLUME predicts ground-level concentrations resulting fromreleases of hazardous materials from instantaneously discharged thermals, fires, orpassive releases.Releases during smoldering or cool-down phases of fires can also be included. The FIREPLUMEmodel consists of two parts: a Monte Carlo dispersion model and a puff dispersion model. TheMonte Carlo portion estimates dispersion of both buoyant and nonbuoyant releases in theatmospheric boundary layer. The puff dispersion model is a post-processor to the Monte Carlomodel. The puff model uses MCLDM-generated estimates of vertical dispersion, together withstandard Gaussia-n. r elati6riiiis for horiz6ntal dispe-rsibid, t6 estfimate the ground-level conceritratiO1-for a time-dependent release rate and a specific averaging time. For time-varying releases, the puffmodel is required because MCLDM provides only steady-state results (Brown 1997).
8.1 FIRE SCENARIOS
Because of the presence of high fuel moisture, high ambient humidities, and a primarilydeciduous forest canopy at APG, forest fires there are generally smaller than those that occur inwestern forests. As a result, these fires at APG have the potential to affect areas irmmediatelydownwind of the fire location with high concentrations of fire combustion products.
To estimate any adverse risk to APG personnel and the public from a range fire, a scenariowas developed that represents a conservative, yet realistic, consequence of a fire started by lightning,artillery firing, or other accidental means. The conservative approach was selected to define thehighest average concentrations for the contaminants of concern expected to occur downwind of a fire
29
of realistic size in comparison with fires that have actually occurred. The conservatism built into thisanalysis defines a bounding case scenario and, therefore, overestimates potential impacts from anyone individual fire.
The primary fire scenario is represented by a 100-m line source of fire occurring in either25 acres of forest or grassland. It is assumed that the APG Fire Department uses helicopter waterdrops to extinguish the fire within one hour of ignition, after the fire consumes the entire 25 acres.Emission rates of toxic pollutants were estimated from data for burning vegetation and from theamounts of toxins expected in plants at APG. In these fires, some smoldering of the fire remnantswill occur before the Fire Department arrives and after the fire is extinguished. However, for thisanalysis the assumption was made that the fire completely consumes all available biomass andreleases all available contaminants ,during this one-hour period, mobilizing the entire mass ofcontaminants present in the biomass burned.
The FIREPLUMIE model requires information on site meteorology. Because it was unclearat the outset of the study which atmospheric conditions would constitute the worst case, thefollowing meteorological conditions were considered:
a Class A stability, representing a case with low wind speed and strong verticalmixing, typical of a clear summer afternoon with low winds;
• Class D stability, representing neutral conditions (on the slightly stable side),typical of late afternoon or early morning overcast periods with moderatewinds; and
a Class E stability, representing a nighttime case with partial cloud cover andmoderate winds.
It is important to note that strongly stable nighttime conditions, such as those representedby F stability, are not the worst case because under those conditions fire plumes rise above theatmospheric boundary layer and do not disperse back down to ground level until fumigation of theboundary layer about an hour after sunrise. Although a case of F stability was evaluated in ouranalysis, the results were not included in the report because resulting ground-level concentrationsof contaminants were well below those predicted for the other cases.
The fire temperature assumed for both the grassland and forest cases was 175°C. Theinstantaneous diameter of the line source was assumed to be 7.5 m and 15 mn, respectively, for theforest and grassland fires. Twenty-minute and 60-minute averages of pollutant, concentrations wereestimated at various downwind points from the fire, Calcalated center-line values for thecontaminants of concern are discussed in Section 8.2. Parameters were chosen to match likely fieldconditions that woujd result in the. highest peak contaminant cun.:tentrations. The cool Mir
30
temperature would produce a smoke plume that would noi rise as high or undergo as muchdispersion as a plume from a hotter fire. The small source area would result in a more concentratedplume, yielding higher maximum calculated ground-level concentration values.
Validation of the FIREPLUME results was based on a favorable comparison of calculatedvalues with the following observed field conditions:
The plume rise over the immediate fire location (i.e., within a few hundredmeters of the source) is between 30 and 60 m for most cases. This predictionqualitatively matches the average height of about 45 m observed by APGfirefighters. Of course, the plume rises higher than 45 m farther downwindand at locations off the APG site.
Residents on the eastern shore'of Chesapeake Bay can smell the smoke as theplume passes by their homes. This phenomenon occurs as the plume dispersesback to ground level after rising because of atmospheric turbulence. Theresults of the calculations (Section 8.2) indicate that for the forest fire case,Class E atmospheric stability provides the most rapid return of the plume toground level (known as plume touchdown) (-750 m from the fire location),and that Class D stability provides the most rapid touchdown for the grasslandcase (< 300 m). For all cases, significant plume material was present at groundlevel within 1,200 m of the fire location, indicating that persons farther than1,200 m from the fire (including those on the eastern shore) would smellsmoke.
* Plume-stheds-are sornietiffies s-ehi 10-15 kif doWnhWi-d of the fire locatiOn-during stable conditions when the fire plume rises beyond the region of strongshear-generated turbulence near the ground. The same effect can occur during
- the-mid-to-late- aftermoon-when-a-buoyant-plume-penetrates-the--inversioncapping the atmospheric boundary layer, trapping material in a thin layerimmediately above the inversion. This effect is not observed in the morningand early afternoon because the inversion is actively growing during thisperiod. Because the FIREPLUM4E model only calculates concentrations withinthe atmospheric boundary layer, the model does not directly predict thesephenomena. However, the model is consistent with lhe atmospheric boundarylayer physics responsible for these effects.
31
8.2 FIREPLUMIE CALCULATIONS
The different meteorological conditions for the three atmospheric stabilities (Classes A, D.and E) used for the FIREPLUME calculations produced unique plume estimates for each case, asseen in the cross-sectional diagrams shown in Fiures 12-14. As shown in these figures, the assumedwindspeeds were 2, 5, and 3 m/s for Classes A, D, and E, respectively. These figures illustrate thepreviously discussed rising centerline of the plumes. Each smoke plume initially rises as it movesdownwind from the fire, making the ground concentrations close or equal to zero for some distanceaway from the fire, As the plume disperses back toward the ground because of atmosphericturbulence, the ground concentrations increase, reach a maximum at a distance 1, and then, becauseof mixing and dispersion, decrease at points farther downwind.
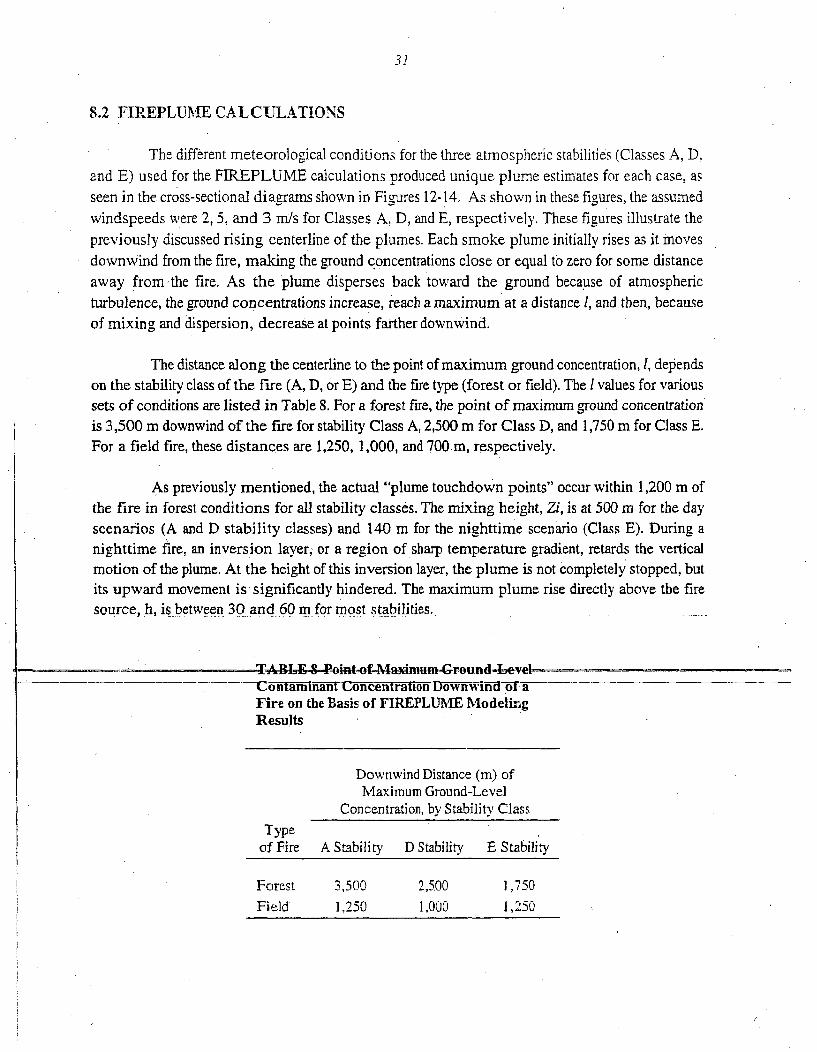
The distance along the centerline to the point of maximum ground concentration, 1, dependson the stability class of the fire (A, D, or E) and the fire type (forest or field). The I values for varioussets of conditions are listed in Table 8. For a forest fire, the point of maximum ground concentrationis 3,500 m downwind of the fire for stability Class A, 2,500 m for Class D, and 1,750 m for Class E.For a field fire, these distances are 1,250, 1,000, and 700.m, respectively.
As previously mentioned, the actual "plume touchdown points" occur within 1,200 m ofthe fire in forest conditions for all stability classes. The mixing height, Zi, is at 500 m for the dayscenarios (A and D stability classes) and 140 m for the nighttime scenario (Class E). During anighttime fire, an inversion layer, or a region of sharp temperature gradient, retards the verticalmotion of the plume. At the height of this inversion layer, the plume is not completely stopped, butits upward movement is significantly hindered. The maximum plume rise directly above the firesource, h, is between 30 and 60 m. for most stabilities.
TABLE-Point-of-Ma~imum-Ground4LevelC n-Contam-af-Concentration Downwi-d -o-f -a -Fire on the Basis of FIREPLUMIE ModelingResults
Downwind Distance (m) ofMaximum Ground-Level
Concentration, by Stability ClassType
of Fire A Stability D Stability E Stability
Forest 3,500 2,500 1 ,750
Field 1,250 1,000 1,250
32
FIREPLUME concentrations were predicted from 0 to 20,000 m downwind of the fire.
Because the predicted concentrations are time dependent, average contaminant concentrations werecalculated for 20- and 60-minute intervals (20- and 60-minute moving averages), For generality,
FTREPLUME calculates a normalized contaminant concentration, that is, the contamiinanlconcentration at a point (X,Y) divided by its initial concentration (C(X=0,Y=0)). Tabulated values
of the average time-normalized concentrations are given in Appendix A.
Using the centerline concentrations (Y=0), we calculated additional concentrations atdistances from 0 to 3,000 m perpendicular to the centerline by assuming that as the plume travels
downwind, it expands laterally and maintains a Gaussian profile (Turner 1969). That is,
C(X,Y) = C(X,Y=O)e (6)
where
X = downwind distance,
Y = perpendicular distance from the centerline, and
Ox,y = standard deviation in the Gaussian plume.
Tabulated values for the plume's standard deviation as a function of X and Y are given inAppendix A. As indicated in that appendix, as the plume moves downwind, its width and, hence,
standard deviation (Ox,y) increase.
Because FIREPLUME calculates the normalized concentration of a contaminant in a plume,-ctua•auncentrmiatins qzc ar tined by multiplying this ngormalized concentration by the initial
contarmnant concentration (T-b-e--7)PThb-nximum-ground--level-conentrations-predicted-byFIREPLUME for the contaminants of concern along the centerline are listed in Table 9 for both the
20- and 60-minute time-averaging periods. The 20-minute values for E stability produced the highestpredicted ground-level concentrations for both forest and field fire scenarios. The calculationsindicate that a forest fire would produce higher concentrations than a field fire for all of the
contaminants.
Figures 15 illustrates an aerial view of predicted ground concentrations of the smokeplumes on a map of A-PG. Figure 15 represents a Class E stability forest fire on the Aberdeen Area
between the. Main Front Area and Trench Warfare ranges, where approximately 20% of the reportedfires occurred. The figure shows the 20-minute averaged ground-level con centratiors for arsenic in
the fire plume. The plume's direction coincides with prevailing APG winds that transport the
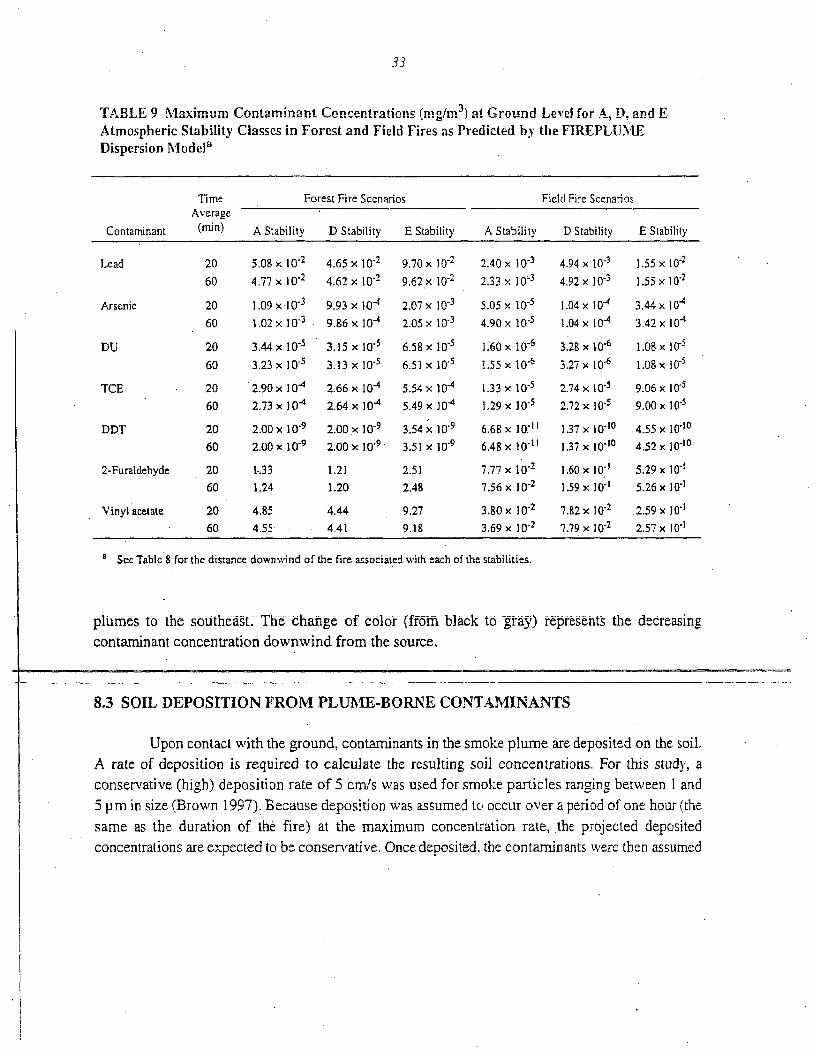
33
TABLE 9 Maximum Contaminant Concentrations (mg/ 3) at Ground Level for A, D, and EAtmospheric Stability Classes in Forest and Field Fires as Predicted by the FIREPLUMIEDispersion Modela
Time Forest Fire Scenarios Field Fire ScenariosAverage
Contaminant (rain) A Stability D Stability E Stability A Stability D Stability E Stability
Lead 20 5,08 x 10.2 4.65 x 10⁻² 9.70 x 10"2 2.40 x 10⁻³ 4.94 x 10⁻³ 1.55 x 10⁻²
60 4.77 x 10⁻² 4.62 x 10⁻² 9.62x 10.2 2.33 x 10⁻³ 4.92 x 10⁻³ 1.55 x 10"'
Arsenic 20 1.09 X 10"3 9.93 x 10⁻⁴ 2.07 x 10"' 5.05 x 10⁻⁵ 1.04 x 10⁻⁴ 3.44 x 10⁻⁴
60 1.02 x 10⁻³ 9.86 x 10⁴ 2.05 x 10⁻³ 4.90 x 10.5 1.04 x 10⁴ 3.42 x 10⁴
DU 20 3.44 x 10⁻⁵ 3.15 x 10⁻⁵ 6.58 x 10-' 1.60 x 10⁻⁶ 3128 x 10-6 1.08 x 10.5
60 3.23 x 10⁵ 3.13 x 10⁻⁵ 6.51 x 10⁻⁵ 1.55 x 10⁻⁶ 3.27 x 10⁻⁶ 1.08 x 10.O
TCE 20 2.90 x 10 4 2.66 x 10 -4 5.54 x 10⁴ 1.33 x 10⁻⁵ 2.74 x 10⁻⁵ 9.06 x 10⁻⁵
60 2.73 x 10⁻⁴ 2.64 x 10⁻⁴ 5.49 x ]04 1.29 x 10⁻⁵ 2.72 x 10⁻⁵ 9.00 x 10"5
DDT 20 2.00 x 10⁻⁹ 2.00 x 10⁻⁹ 3.54 x 10.9 6.68 x 10-" 1.37 x 10.10 4.55 x 10.10
60 2,00 x 10"9 2.00 x 10"9 3.51 x 10⁹ 6.48 x 10 -" 1.37 x 10.10 4.52 x 10-0
2-Furaldehyde 20 1..33 1.21 2.51 7.77 x 10⁻² 1.60 x 10.1 5.29 x 10"1
60 1.24 1.20 2.48 7.56 x 10⁻² 1.59 x 10"1 5.26 x 10"1
Vinyl acetate 20 4.85 4.44 9.27 3.80 x 10⁻² 7.82 x 10⁻² 2.59 x 10⁻¹
60 4.55 4.41 9.18 3.69 x 10⁻² 7.79 x 10⁻² 2.57 X 10⁻¹
* See Tablc'S for the distance downwind of the fire associated with each of the stabilities.
phlmes to the sotithedtt.- Thi- change of Colo. (ff6mi black to g'aY) rePresents the decreasingcontaminant concentration downwind from the source.
8.3 SOIL DEPOSITION FROM PLUME-BORNE CONTAMINANTS
Upon contact with the ground, contaminants in the smoke plume are deposited on the soil,A rate of deposition is required to calculate the resulting soil concentrations. For this study, aconservative (high) deposition rate of 5 cm/s was used for smoke particles ranging between 1 and5 pm in size (Brown 1997), Because deposition was assumed to occur over a period of one hour (thesame as the duration of the fire) at the maximum concentration rate, the projected depositedconcentrations are expected to be conservative. Once deposited, the contaminants were then assumed
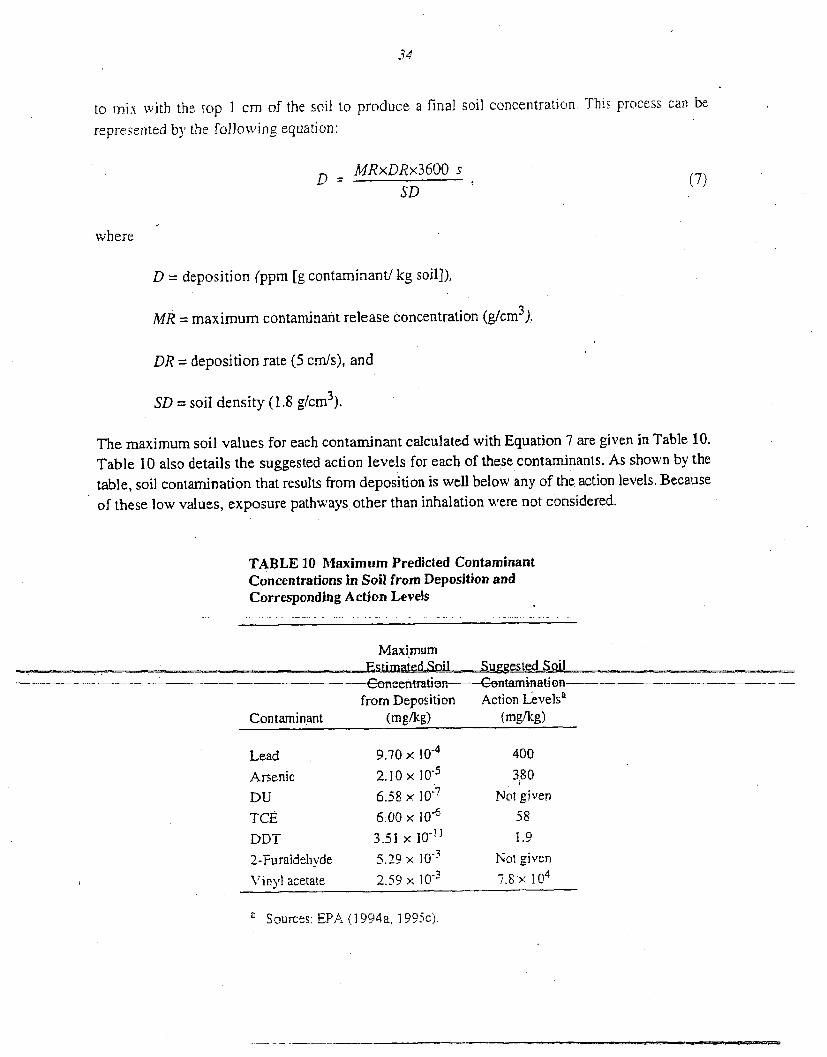
34
to mix with the. top I cm of the soil to produce a final soil concentration. This process can be
represented by the following equation:
MRxDRx3600 s
SD (7)
where
D = deposition (ppm [g contaminant/ kg soil]),
MR = maximum contaminant release concentration (g/cm 3),
DR = deposition rate (5 cmls), and
SD = soil density (1.8 g/cm 3).
The maximum soil values for each contaminant calculated with Equation 7 are given in Table 10.Table 10 also details the suggested action levels for each of these contaminants. As shown by thetable, soil contamination that results from deposition is well below any of the action levels. Becauseof these low values, exposure pathways other than inhalation were not considered.
TABLE 10 Maximum Predicted ContaminantConcentrations in Soil from Deposition andCorresponding Action Levels
MaximumFsriLmated-SiL
-Concentration--from Deposition
(mg/kg)
-u2---trndSolo
Action Levelsa(mg/k~g)Contaminant
Lead 9.70 x 10⁻⁴ 400
Arsenic 2.10 x 10.5 380
DU 6.58 x 1027 Not givenTCE 6.00 x 10⁻⁶ 58
DDT 3.51 x IT" 1.9
2-Furaldehyde 5.29 x 10⁻³ Not given
Vinyl acetate 2.59 x 10³ 7.8x 10⁴
' Sources: EPA (1994a, 1995c).
35
9 UXO RELEASE SCENARIOS
The UXO release scenario for this study matches as closely as possible the actual range firemodeling scenario. For this scenario, a round of UXO is assumed to "cook-off' during a range fire,releasing chemical warfare agent. This agent is carried up with the rising plume from the range fireand reaches some maximum concentration level downwind of the fire. This scenario results in lowerconcentrations than would result if the UXO round was detonated without a fire present, because therising plume from the fire would carry the agent aloft and mix and disperse it before it came incontact with the ground. As described in Section 4.3, the maximum credible release from one UXOround is 12.72 kg of phosgene from a Livens projectile and 2.72 kg of mustard from a 4.2-in. mortar.
The release of agent from the selected rounds in an event assumed to occur once a year wasmodeled with both the FIREPLUME and the D2PC codes. FIREPLUME predicted maximum releaseconcentrations of 4.6 x 10⁻³ mg/m 3 and 2.2 x 10⁻² mg/m 3 for mustard gas and phosgene,respectively. The corresponding concentrations predicted by D2PC were 3.4 x 10⁻³ mg/m3 formustard and 1.6 x 10⁻² mg/m3 for phosgene.
9.1 D2PC MODEL
A review of nuclear, biological, and chemical agent (NBC) models in 1996 by DODrecommended that D2PC be used in modeling accidental chemical agent releases from chemicalagent depots (Gibbs and Miller 1996). This model has been used by the Army for the past 10 yearsin various forms, starting with the earlier-developed D2 model.
D2PC predicts the dispersion of chemical agents for accident scenarios involving a varietyof-fifflcnls, agents, Wnd ffitletie"eIe4.enditon Tho I ce-ide - gt-iip zieach case on the basis of Gaussian dispersion theory. A recently developed puff version of the modelallows each puff from the release to be sent downwind as the wind changes with time. The olderD2PC cigar-shaped plume has been used to make predictions for this fire case because time-dependent wind information is used here. A bounding case analysis is needed to evaluate the impactsif a phosgene- or mustard-containing round releases its contents during a range fire. The D2PCmodel predicts the impacts of a UXo agent in a fire and its downwind consequences. The model ismenu-driven and requests information on the site, weather, munition, agent, and type of release,including explosion. Predictions can be made in terms of concentration or dosage contours.
The D2PC model uses a different approach than that used in FIREPLUME (Section 8.2),F-MEPLUME uses modern bounda7r-laver meteorological methods, while the D2PC model uses thetraditional Pasquill-Gifford stability class approach. The FIREPLUME model has an infinite number
f. me~teorologic , conditions that could be represented; the D2PC has a finite number of
36
meteorological conditions because of the classification of atmospheric con~ditions into A-F stabilityclasses.
9.2 D2PC CALCULATIONS
The D2PC model was run for both the phosgene and mustard UXO cases. In the releasescenarios, an explosion of the UXO (caused by heat from the range fire) leads to the release of theagent. The agent was treated as a tracer in the dispersion analysis. The fire option was used in theD2PC model. Reasonable assumptions as to fire diameter and caloric heat rate(cal/s) of the fire were
required; the model used those inputs to predict plume rise and downwind dispersion of the agent.
The presence of the fire led to buoyant rise of the plume, which helped reduce impacts at groundlevel. The plume rise predicted by D2PC was similar to the rise predicted by the FIREPLUME runsfor toxic Chemical releases. This similarity would be expected because the fire provides thepredominant buoyancy in both toxic chemical and UXO release cases. Predictions were averagedover one hour to match the duration of the fires assumed for this study (Jones 1997),
The D2PC model provided results in both the D and E stability cases, which were also usedin the FIREPLUME runs. D2PC could not make predictions for the A stability case; -however,impacts for that case would be low because of the strong mixing that occurs during such atmosphericconditions. In the D2PC runs, the D and E stability cases led to maximum concentrations that wereslightly lower than those predicted by FIREPLUME. D2PC was expected to be more conservativethan FIREPLUME since D2PC's modeling methodology is less complex and D2PC was developedto provide conservative estimates of plume predictions. In this use, however, D2PC appears to yield
results very similar to those of FIREPLUME, although slightly less conservative.
9.3 UXO RELEASE RESULTS
The results from the FIREPLUME model and the D2PC model agree to within 40%, withFIREPLUME predicting higher concentrations for both mustard and phosgene (4.6 x 10⁻³ mg/m 3
and 2.2 x 10⁻² mg/m 3, respectively, compared with D2PC results of 3.4 x 10³ mg/m3 for mustardand 1.6 x 10⁻² mg/m3 for phosgene). For the purposes of this study, we feel that FIREPLUME doesa better job of modeling the convective transport of the agents due to the fire, D2PC was notdesigned to address these types of scenarios, although, as the results show, it does predict valuesclose to those we feel are correct. The calculated UXO concentrations are compared with screeninglevels in Section 10.2.
37
10 RISK ANALYSIS
Because this study is a preliminary assessment of possible risks to human health resultingfrom range fires at APG, risk assessments were performed only for the inhalation exposure pathway.That pathway provides the most direct impact to an exposed receptor, and calculating the risk for thatexposure pathway provides an indication of the significance of other potential pathways that couldbe included in future studies. Other pathways, such as ingestion, are deemed to present low riskbecause of the low estimated soil contamination that would result from the fires.
Risk assessment calculations typically evaluate carcinogenic (cancer).and noncarcinogenic(noncancerous) risks in terms of risk factors and hazard indices, respectively. In evaluating impactsat a National Priority List (NPL) site, the EPA (1990) has established an acceptable risk range of1 x 10'4 to 1 x 10⁶ (i.e., one in 10,000 to one in 1,000,000); acceptable hazard indices have valuesless than 1.0. Rather than calculating the actual risk values and hazard indices associated with thecontaminants of concern, for this study we calculated screening action levels. These values, asdiscussed in Section 10.1, represent the maximum airborne contaminant concentrations for singlecontaminants that would result in acceptable risk values and hazard indices. Concentrations less thanthe screening action level are considered to present negligible risk of human health impacts.However, the screening action levels address toxicity for individual contaminants only. Calculationof the potential (if any) for additive or synergistic effects from exposures to multiple contaminantsis considered beyond the scope of this study.
10.1 -SCREENING ACTIONLEVELS FOR CHEMICAL CONTAMINANTS IN AIR
The screening action levels for air concentrations of the contaminants of concern were
U dt6PGtrint--d-ge--rc eb. tho•gon
uncertainties in exposure and/or toxicity existed, the methods and assumptions used in calculatingthe screening action levels were designed to ensure that the potential for adverse health impactswould not be underestimated.
The screening action levels for noncarcinogenic chemical contaminants in air werecalculated as threshold-level concentrations below which adverse human health effects would beunlikely. For chemicals kMown or suspected of causing cancer in humans, a range of screening actionlevel concentrations was developed corresponding to increased lifetime cancer risks of between1 in 10,000 and I in 1,000,000 (EPA i 990). The modeled air concentrations at the exposure locationof the human receptor being evaluated were compared with screening action level concentrations todete =,one if adverse health impacts mi ght be expected.
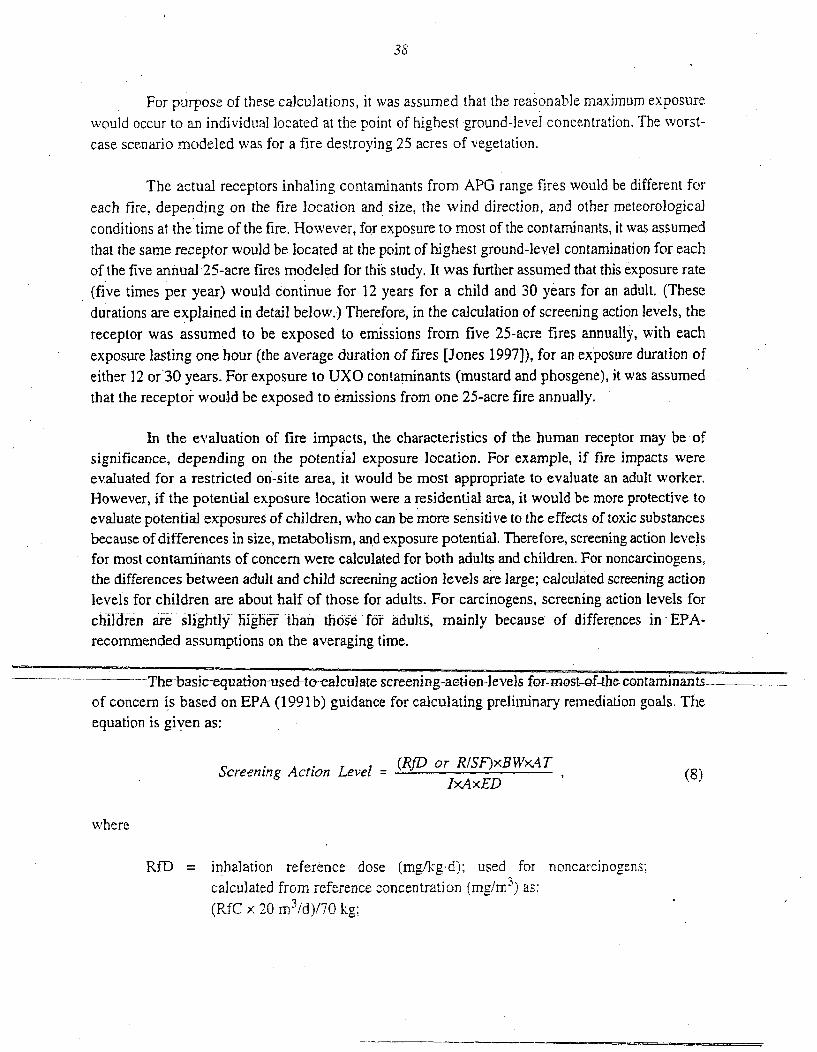
38
For purpose of these calculations, it was assumed that the reasonable maximum exposure
would occur to an individual located at the point of highest ground-level concentration. The worst-
case scenario modeled was for a fire destroying 25 acres of vegetation.
The actual receptors inhaling contaminants from APG range fires would be different for
each fire, depending on the fire location and size, the wind direction, and other meteorologicalconditions at the time of the fire. However, for exposure to most of the contaminants, it was assumedthat the same receptor would be located at the point of highest ground-level contamination for eachof the five annual 25-acre fires modeled for this study. It was further assumed that this exposure rate
(five times per year) would continue for 12 years for a child and 30 years for an adult. (Thesedurations are explained in detail below.) Therefore, in the calculation of screening action levels, the
receptor was assumed to be exposed to emissions from five 25-acre fires annually, with eachexposure lasting one hour (the average duration of fires [Jones 1997]), for an exposure duration of
either 12 or'30 years. For exposure to UXO contaminants (mustard and phosgene), it was assumedthat the receptor would be exposed to emissions from one 25-acre fire annually.
In the evaluation of fire impacts, the characteristics of the human receptor may be ofsignificance, depending on the potential exposure location. For example, if fire impacts wereevaluated for a restricted on-site area, it would be most appropriate to evaluate an adult worker.However, if the potential exposure location were a residential area, it would be more protective toevaluate potential exposures of children, who can be more sensitive to the effects of toxic substancesbecause of differences in size, metabolism, and exposure potential. Therefore, screening action levelsfor most contaminants of concern were calculated for both adults and children. For noncarcinogens,the differences between adult and child screening action levels are large; calculated screening actionlevels for children are about half of those for adults. For carcinogens, screening action levels forchi!dren are slightly_ highe-- thian -those for a-dults,- mainly because of differences in -EPA,recommended assumptions on the averaging time.
----The-basic-equationrused-o-talculate-screening-aetion-levels-for-most-of-the-contaminants-- -
of concern is based on EPA (1991 b) guidance for calculating preliminary remediation goals. Theequation is given as:
Screening Action Level = (RfD or R/SFnxBWXATIxAxED (8)
where
RfD = inhalation reference dose (mg/kg.d); used for noncarcinogens;calculated from reference concentration (mg/rn3) as:(RfC x 20 m3/d)/70 kg;
39
R = acceptable risk level for carcinogens: range of 10-6 to I0-';
SF = slope factor (mg/kg.d)-1 , used for carcinogens;
BW = body weight: 70 kg for adult, 24 kg average for child age 0-12 yr
(recommended values from EPA 1995a);
AT = averaging time: 30 yr x 365 diyr (noncarcinogens-adult); 12 yr x365 d/yr (noncarcinogens-child); 70 yr x 365 d/yr (carcinogens-adult orchild);
= inhalation rate: 1.7 m3/h for adult, 1.2 m3/h for child (recommendedvalues for individuals at moderate activity levels, EPA 1995a);
A =absorption factor: default of 1; and
ED = exposure duration: 1 h/d x 5 d/yr x 30 yr (adult); 1 h/d x 5 d/yr x 12 yr(child) (for UXO contaminants, 1 d/yr was used).
Exposure assumptions were based on guidance available from EPA documents (EPA 1989,1991a, 1995a),
Reference concentrations or slope factors for most of the contaminants of concern(Section 4) are available from the EPA (1995b, 1996, 1997) (as listed in Table 11). Exceptionsinclude lead, mustard, phosgene, and uranium. The methods used to calculate screening action levelsfor these exception substances are discussed below. Screening action levels for all of thecontaminants of concern are given in Table 12.
10.1.1 Lead
Lead is ubiquitous in the environment, found at varying levels in water, soil, food,household products such as paint and some older cooking utensils, and in the air. Because leadabsorption can occur from exposure to any of these sources, the EPA has developed a model toaccount for expected background exposures to lead when evaluating any new potential source of leadexposure (EPA 1994b). This model estimates lead concentrations in blood associated with varyingexposure levels for children up to 7 years old, the most sensitive potentially exposed population. Forour analysis, the EPA model was run with default assumptions on intake of lead from water, soil,
food , and othr sources. The assumed ih-alation 1-ate as set to 1.2 m. /h. a rate consistent with
moderate activity levels in children (EPA 1995a).
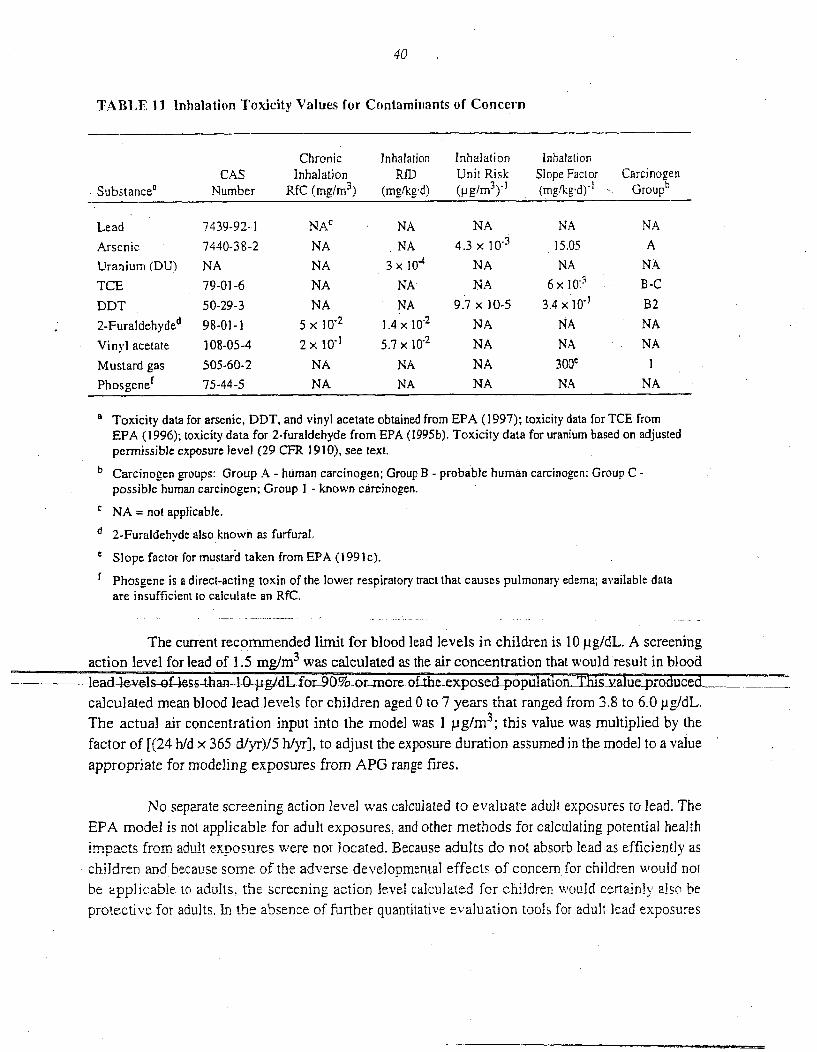
40
TABLE I I Inhalation Toxicity Values for Contaminants of Concern
Chronic Inhalation Inhalation InhalationCAS Inhalation RfD Unit Risk Slope Factor Carcinogen
Substance' Number RfC (mg/m 3) (mgfkgd) (pg/m3y) (mg.g'd)"1 Groupb
Lead 7439-92-1 NAc NA NA NA NA
Arsenic 7440-38-2 NA NA 4.3 x 10⁻³ 15.05 A
Uranium (DU) NA NA 3 x 10⁻⁴ NA NA NA
TCE 79-01-6 NA NA NA 6 x 10- 3 B-C
DDT 50-29-3 NA NA 9.7 x 10⁻⁵ 3.4 x 10" B2
2-Furaldehyded 98_01_1 5 x 10-' 1.4 x 10.2 NA NA NA
Vinyl acetate 108-05-4 2 x 10⁻¹ 5.7 x 10.2 NA NA NA
Mustard gas 505-60-2 NA NA NA 3 00e 1
Phosgenef 75-44-5 NA NA NA NA NA
Toxicity data for arsenic, DDT, and vinyl acetate obtained from EPA (1997); toxicity data for TCE fromEPA (1996); toxicity data for 2-furaldehyde from EPA (1995b). Toxicity data for uranium based on adjustedpermissible exposure level (29 CFR 1910), see text.
b Carcinogen groups: Group A - human carcinogen; Group B - probable human carcinogen; Group C -
possible human carcinogen; Group I - known carcinogen.
C NA = not applicable.
d 2-Furaldehyde also known as furfural.
Slope factor for mustard taken from EPA (1991 c).
f Phosgene is a direct-acting toxin of the lower respiratory tract that causes pulmonary edema; available dataare insufficient to calculate an RfC.
The current recommended limit for blood lead levels in children is 10 Pg/dL. A screeningaction level for lead of 1.5 mg/m3 was calculated as the air concentration that would result in blood
---ead-level sof--ess-than-1-O-p-gIdL-for-90%-or-more ofthe-exposed-p opulation-This-valuep-roduced-. .......calculated mean blood leadlevels for children aged 0 to 7 years that ranged from 3.8 to 6.0 pg/dL.The actual air concentration input into the model was 1 pg/mr3 ; this value was multiplied by the
factor of [(24 h/d x 365 d/yr)/5 h/yr], to adjust the exposure duration assumed in the model to a valueappropriate for modeling exposures from APG range fires.
No separate screening action level was calculated to evaluate adult exposures to lead. The
EPA model is not applicable for adult exposures, and other methods for calculating potential health
impacts from adult exposures were not located. Because adults do not absorb lead as efficiently as
children and because some of the adverse developmental effects of concern for children would not
be applicable to adults, the screening action level calculated for children would certainly also be
protective for adults. In the absence of further quantitative evaluation tools for adult lead exposures
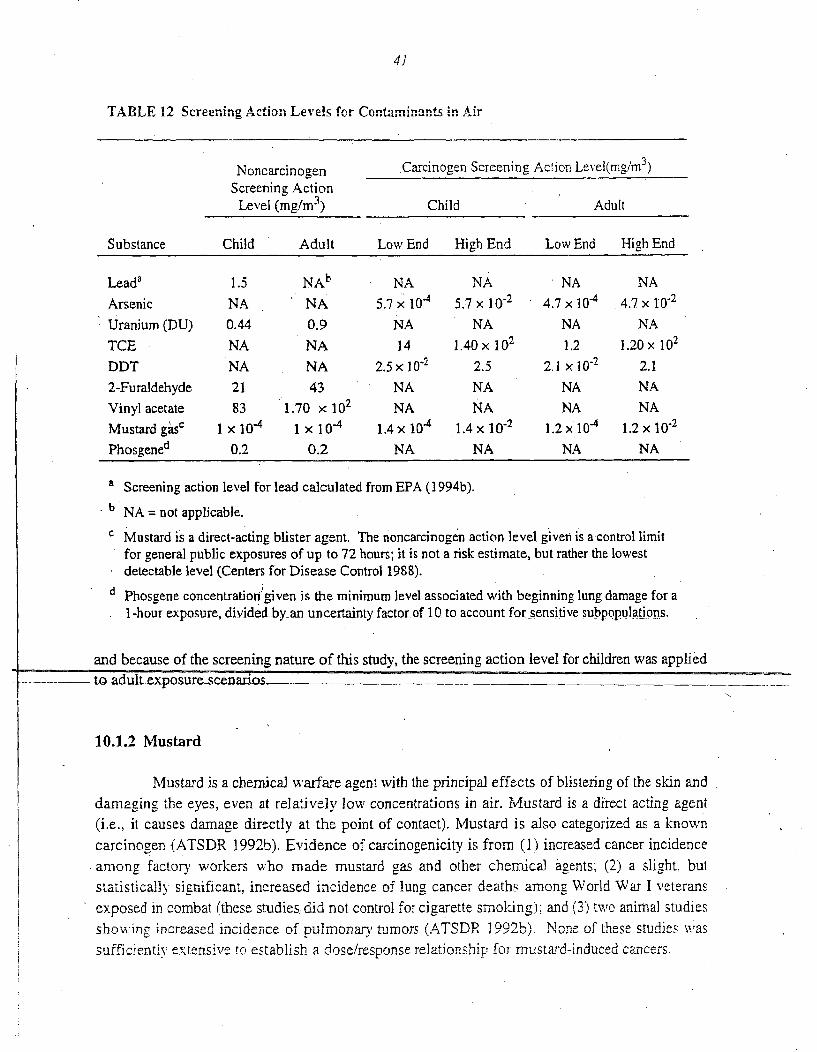
41
TABLE 12 Screening Action Levels for Contaminants in Air
Noncarcinogen Carcinogen Screening Action Level(mg/m 3)
Screening ActionLevel (mg/m 3) Child Adult
Substance Child Adult Low End High End Low End High End
Leada 1.5 NAb NA NA NA NA
Arsenic NA NA 5.7 x 10⁻⁴ 5.7 x 10⁻² 4.7 x 10⁻⁴ 4.7 x 10'
Uranium (DU) 0.44 0.9 NA NA NA NA
TCE NA NA 14 1.40 x 10² 1.2 1.20 x 10²
DDT NA NA 2.5 x 10⁻² 2.5 2.1 x10"2 2.1
2-Furaldehyde 21 43 NA NA NA NA
Vinyl acetate 83 1.70 x 10² NA NA NA NA
Mustard gase I x 104 1 x 10⁻⁴ 1.4x 10⁴ 1.4x 10⁻² 1.2x 10⁴ 1.2x 10"2
Phosgened 0.2 0.2 NA NA NA NA
a Screening action level for lead calculated from EPA (1994b).
b NA = not applicable.
C Mustard is a direct-acting blister agent. The noncarcinogen action level given is a control limit
for general public exposures of up to 72 hours; it is not a risk estimate, but rather the lowestdetectable level (Centers for Disease Control 1988).
d Phosgene concentration given is the minimum level associated with beginning lung damage fora
1-hour exposure, divided.by-an uncertainty factor of 10 to account for sensitive subpopulations.
and because of the screening nature of this study, the screening action level for children was appliedI-
-- to-a-oult-exposure-scenarios
10.1.2 Mustard
Mustard is a chemical warfare agent with the principal effects of blistering of the skin anddamaging the eyes, even at relatively low concentrations in air. Mustard is a direct acting agent(i.e., it causes damage directly at the point of contact). Mustard is also categorized as a knowncarcinogen (ATSDR 1992b). Evidence of carcinogenicity is from (1) increased cancer incidenceamong factory workers who made mustard gas and other chemical agents; (2) a slight, bulstatistically significant, increased incidence of lung cancer deaths among World War I veteransexposed in combat (these studies, did not control for cigarette smoking); and (3) two animal studies..hnwin,2 increased incidence of pulmonary, tumors (ATSDR ,1992b,. Non-. of these studies Wassufficiently extensive to establish a dose/response relationship for mustard-induced cancers:
42
AlIthough mustard is considered to be a carcinogen, the available data have generally been
considered inadequate to estimate the carcinogenic potency (i.e., carcinogenic risk) of mustard (CDC
1988; ATSDR 1992b). Neither is information on mustard toxicity and carcinogenicity available
through EPA's IRIS and HEAST databases. Nonetheless, because of a need to estimate potentialrisks to populations residing near military sulfur mustard stockpile locations, the EPA did use theavailable (and inadequate) data to estimate a carcinogenic potency of 300 (mg/kg-d)-1 for mustard
(EPA 1991 c). The accuracy of risks estimates generated using this value must be considered highly
uncertain.
No reference dose for evaluating potential noncarcinogenic effects is available for mustard
through EPA's IRIS or HEAST databases. The Centers for Disease Control (CDC) evaluated the
available toxicity data for mustard and established a control limit of 0.0001 mg/m 3 for generalpopulation exposures of up to 72 hours (CDC 1988). The control limit is not a risk-based value;rather, it is the lowest detectable level of mustard in air. The control limit can be compared with the
lowest level observed to cause adverse noncarcinogenic effects. A recent work summarizing theextensive human and animal acute exposure data reports that the maximum safe exposure level thatwould not result in damage to the eyes or skin would be 50 mg min/m 3 (Marrs et al. 1996). Thisvalue corresponds to a concentration of 0.83 mg/m 3 for a 1-hour exposure duration. Therefore, thecontrol limit established by CDC has a safety margin against acute effects of about 8,000(0.830/.0001) for a I-hour exposure period.
10.1.3 Phosgene
Phosgene is a chemical warfare agent whose principal toxicologic effect is causingpulmonary edema (abnormal accumulation of fluid in the lungs). High exposure ieveis (e.g.., leiels
greater than about 800 mg/m3) cause almost immediate death. At lower exposure levels (betweenrOtaudS mg n rnmente snptms- •n n q, es.andthr oat. paiagr"itnessn
o- the cb-st, coughing, and--horfness of-bre--eah-These•ýy-m-pto-tm xgmrally-end-withiw5-or- ý-
l0 minutes of exposure and are followed by a "latent" phase lasting 1 to 24 hours, during which nosymptoms are apparent. The latent phase ends when pulmonary edema becomes sufficient tointerfere with respiration; symptoms include shortness of breath and a productive (often. bloody)cough. Without immediate medical attention, death may occur because of a lack of sufficientcirculation and oxygen throughout the body. If the patient recovers from the edema, antibiotictherapy is needed to ensure that pneumonia does not occur. Similar to mustard gas, phosgene is a
direct-acting toxin in the lower airway passages of the lungs; it does not get past the pulmonarycirculation. The EPA has concl]ud•t•haLt dat on to"ic effectS of chronic low-level phosgene.
exposures are insufficient to calculate a reference concentration or dose.
Although no reference dose has been calculated for phosgene, researchers have concluded
that no significant human health effects ha-ve been found at phi-Sg., e air concentra.. ons b.lo....
43
0. 1 ppim (EPA 1986). This "no-effect" level is fairly consistent with a calculated level based on areport of the minimum concentration of 30 ppm-min associated with beginning lung damage (EPA1986). This level corresponds to a concentration of 0.5 ppm (2 mg/mr3) for a 1-hour exposure.. Theair screening action level of 0.2 mg/mr3 cited in Section 10.2 (Table 13). also incorporates anuncertainty factor of 10 to account for possible sensitive subpopulations.
10.1.4 Depleted Uranium
No inhalation reference concentration is currently available for uranium from standard EPAsources. To assess the potential risk from inhalation of uranium and its compounds, an interimreference concentration was developed from the proposed U.S. Department of Labor permissibleexposure level (PEL) for uranium (29 CFR Part 1910, Subpart Z, 1991). The proposed 8-hour time-weighted-average PEL for soluble uranium compounds is 0.05 mg/r 3 . This value was converted toan assumed inhalation reference dose value (in mg/kg.d) for an adult worker on the basis of aninhalation rate of 9.6 m3/workday and a body weight of 70 kg, which resulted in an interim workerinhalation reference dose of 0.014 mg/kg-d. To generate an interim inhalation reference dose for thegeneral public, the worker value was adjusted to account for increased exposure duration of thegeneral public (assumed 168 hours exposure per week instead of 40 hours per week); an additionaluncertainty factor of 10 was used to account for sensitive subpopulations in the general public. Theseassumptions and factors resulted in an interim inhalation reference dose value for uranium for thegeneral public of 3 x 10⁻⁴ mg/kg.d, as shown in Table 11.
10.2 COMPARISON OF CALCULATED PLUME VALUESWITH SCREENING LEVELS
10.2.1 Inhalation Pathway
Table 13 summarizes the results of the comparison of calculated exposure levels for a "mostexposed individual" with the screening action levels developed for this study. This table is dividedinto two sections; the first section compares the results calculated for a field fire with the screeningaction levels, and the second section compares the results calculated for a forest fire. Comparisonsare included for both carcinogenic and noncarcinogenic risk and action levels for both children andadults, as appropriate.
Calculated exposure values for lead are about 100 times lower than the screening actionlevel for a child. There is no screening action 1 e.ve for adults.
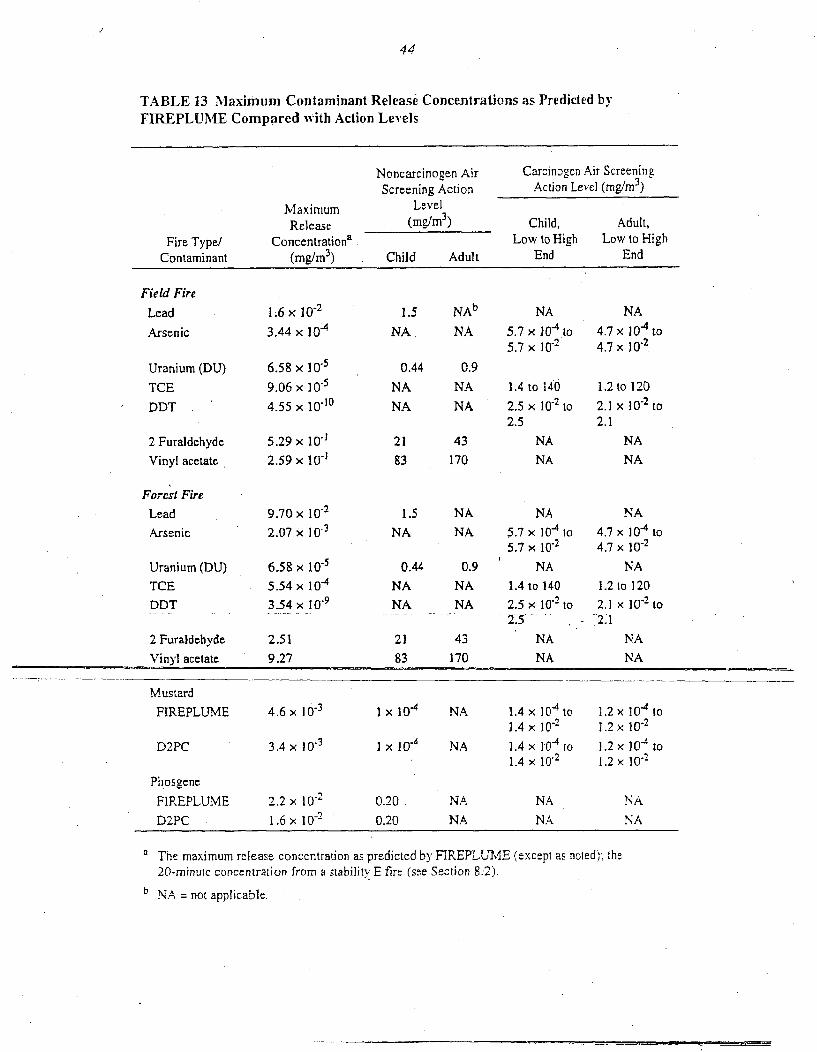
44
TABLE 13 Maximum Contaminant Release Concentrations as Predicted byFIREPLUME Compared with Action Levels
Noncarcinogen Air Carcinogen Air ScreeningScreening Action Action Level (mg/m 3)
Maximum LevelRelease (mg/m 3) Child, Adult,
Fire Type/ Concentrationa Low to High Low to High
Contaminant (mg/m3 ) Child Adult End End
Field Fire
Lead
Arsenic
Uranium (DU)
TCE
DDT
2 FuraldehydeVinyl acetate
Forest Fire
Lead
Arsenic
Uranium (DU)TCE
DDT
2 FuraldehydeVinyl acetate
1.6 x 10.2
3.44 x 10-'
6.58 x 10.5
9.06 x 10.5
4.55 x 10I°
5.29 x 10"'2.59 x 10.'
9.70 x 10-22.07 x l0
6.58 x 1055.54 x 10..4
3.54 x 10⁻⁹
2.51
9.27
1.5 NAb
NA NA
0.44NA
NA
0.9
NA
NA
NA5.7 x 10-4to5.7 x 10.2
1.4 to 140
2.5 x 10.2 to2.5
NA
NA21
83
43
170
NA
4.7 x 10⁴ to4.7 x 10.2
1.2 to 120
2.1 x 10.2 to2.1
NA
NA
NA
4.7 x 10⁴ to4.7 x 10-2
NA
1.2 to 120
2.1 x 10⁻² to2. 1
NA
NA
1.5 NA NANA NA 5.7 x 10⁻⁴ to
5.7 x 10²
0.44 0.9 NA
NA NA 1.4 to 140
NA NA 2.5 x 10.2 to2.5
21
83
43170
NANA
Mustard
FIREPLUME
D2PC
Phosgene
FIREPLUME
D2PC
4.6 x 10³
3.4 x ! -3
2.2 x 10-
1.6 x 10⁻²
1 x 10⁴ NA 1.4 x 10⁴ to1.4 x 10-2
l x 104 NA 1.4 x 10⁻⁴ to1.4 x 10-2
1.2 x 10..4 to1.2 x 10.2
1.2 x 10⁴ to1.2 x 10.2
NA
NA0.20
0.20
NA
NA
NA
NA
The maximum release concentration as predicted by FIREPLLJME (except as noted): the2r-minule concentration from a stability E fire (see Section 8.2).
b NA = not applicable.
45
A.rsenic is a carcinogen, and a range of screening action levels is given, The calculatedexposure for arsenic ishigher than the 10-6 risk level, but lower than the iO-4 risk level. However,even though this calculated exposure is above the 10,6 level, a number of the assumptions used incalculating this exposure are very conservative and it is the authors' judgment that actual exposurelevels would likely be significantly below this value. For example, we assumed that the most
exposed individual would be located at the point of highest concentration for each of the five annualfires for either 12 or 30 years for a child or an adult, respectively. In addition, the source term was
based on a single high value of contamination from the J-Field study. Actually, it is unlikely that any
25-acre site would have contamination levels this high over the entire area, and it is even moreunlikely that there are large enough areas with contamination levels this high to provide for five25-acre-fires a year for 12 or 30 years (1,500 acres of forested area contaminated at the high levelsof the Toxic Burning Pits Push-Out Area of J-Field for the 12-year duration of the child exposureor 3,750 acres for the 30-year adult exposure). For comparison, APG as a whole contains only13,000 total acres of forested area.
Calculated exposure levels for DU and TCE are orders of magnitude lower than thescreening action levels. The calculated DU level is approximately four orders of magnitude (10,000times) lower than the screening level, and the TCE level is four to six orders of magnitude (10,000
to 1,000,000 times) lower than the screening levels. Carcinogenic risk levels for DU where notcalculated because they are known to be lower than the noncarcinogenic risk (Davis 1990).
The two naturally occurring chemicals that are released from burning uncontaminatedvegetation (2-furaldehyde and vinyl acetate) are both below their screening action levels by factorsof about 10. Although a number of conservative assumptions apply to the levels calculated for thesechemicals (e.g., the number of exposures and the area required to be burned), the actual contaminantamounts estimated to be released by the burning vegetation are less conservative than that for theanthropogenic contaminants. The amounts of 2-furaldehyde and vinyl acetate released from a 25-acre
fire are likzly tc be w'ithi nodrf m;untad of thV ertiJhe elaswbl -L2 a mounits
of the anthropogenic contaminants released could be several orders of magnitu--debelow theestimated values.
Mustard is a carcinogen, and a range of screening action levels is given. The calculatedexposure for mustard is higher than the 10.6 risk level and lower than the 10-4 risk level. As was thecase for arsenic, several assumptions used in calculating the potential for mustard exposure areconservative. For example, the receptor was assumed to be located at the point of highest
concentration for an annual fire over a period of 12 or 30 years, Although the calculated mustardexposure level is also 50 times higher than the noncarcinogen screening action level given, thisaction level value is not entirely applicable to the 1-hour exposure scenario evaluated for this study.
The value of0•,0.,,1 ma/m3r is the control limit 'gven. bn the CDC for general population exposuresof up to 72 hours duration (CDC 1988). In addition, the control limit was not a risl:-based number
46
and appears to incorporate a very large safety factor over levels observed to cause noncarcinogenicadverse, effects (see Section 10.1.2).
10.2.2 Soil Deposition
Table 10 (Section 8.3) lists the results of soil deposition calculations. For these calculations,the deposition rate at the point of highest air concentration was used to determine soil deposition.We assumed a settling velocity of 5 cm/s, which is relatively high and provides total depositionestimates that should be higher than any experienced at APG.'We assumed that the deposited
contaminant mixed with the top 1 cm of soil and then calculated soil concentrations using thismixing assumption, as described in Section 8.3.
As shown in Table 10, the highest metal deposition occurs for lead, with a calculated soilconcentration of 9.7 x 10⁻⁴ mg/kg. This value is less than the risk-based concentration guideline,7.8 x 10-3 mg/kg, given by the EPA for residential soils (EPA 1994a, 1995c). The calculated arsenicconcentration is four orders of magnitude lower than the suggested levels, and all other chemicalsare even further below the suggested values.
On the basis of these preliminary deposition calculations, it appears that other exposurepathways, such as groundwater or ingestion, which would be expected to pose even lower risk thanthe inhalation pathway evaluated here, are not significant contributors to human health risk.
47
11 DISCUSSION OF RESULTS
This study was designed to determine if range fires at APG pose potential risks for adverseimpacts to human health. The study was not designed to calculate actual health risks from rangefires; the intent was, instead, to use conservative assumptions to compute approximate risks fromfires in contaminated areas in order to determine if further study was needed. Even with theconservative assumptions used in this screening survey, the exposure levels calculated in this studyare below screening action levels for all the contaminants but arsenic and mustard. Calculatedarsenic exposurelevels are between the 10-6 and 10-4 risk levels suggested as acceptable by the EPA.A best estimate of actual exposure levels would be several orders of magnitude below thosepresented in this study because of the compounding nature of the conservative assumptions used inour calculations. Some of the more conservative assumptions used in the present analysis are givenbelow:
We used plant uptake ratios that were 1 to 3 orders of magnitude (10 to 1,000
times) larger than field-measured values at J-Field, and these field measuredvalues were for the total plant (roots, stems, and leaves) of a species knownto have high metal uptake ratios. We then used these ratios to estimateaboveground concentrations (just leaves and stems) in grasses and trees, eventhough most plants have much higher values in the roots that in the leaves andstems. Actual uptake is probably 10 to 1,000 times lower than estimated here.
We estimated soil contaminant concentrations on the basis of the highestreasonable values known to occur at APG. These.values were assumed tooccur over sufficient area to burn 125 acres per year for either 12 or 30 years,although field data have not shown these highly contaminated areas to be this
below those used in the study. Actual values are probably 2 to 10 times lowerthan the values used here.
We estimated that five 25-acre fires would occur each year. This assumptionwas based on only the 30 fires for which size estimates were available in the
database. This number of fires is much higher than the observed number offires of this size that have occurred during the study period, which isapproximately one 25-acre fire every other year.
• We assumed that each of the five fires per year occurred in highly
contaminated areas.
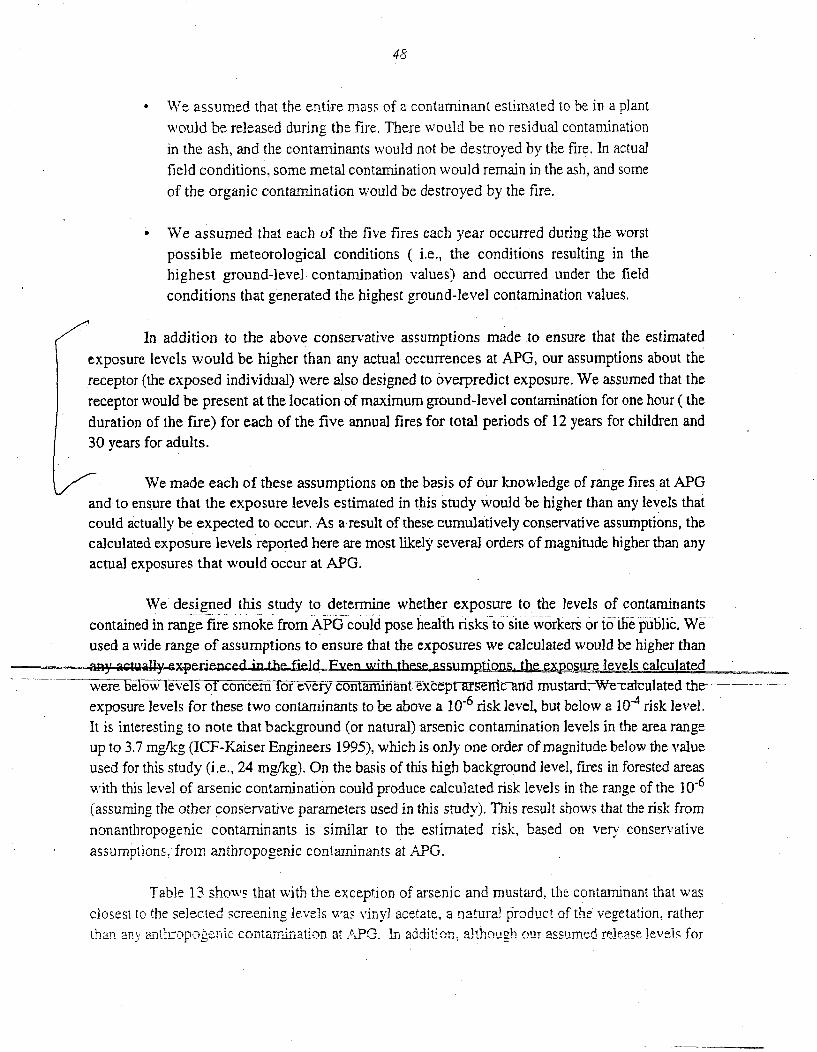
48
We assumed that the entire mass of a contaminant estimated to be in a plantwould be released during the fire. There would be no residual contamination
in the ash, and the contaminants would not be destroyed by the fire. In actualfield conditions, some metal contamination would remain in the ash, and someof the organic contamination would be destroyed by the fire.
We assumed that each of the five fires each year occurred during the worstpossible meteorological conditions ( i.e., the conditions resulting in thehighest ground-level, contamination values) and occurred under the fieldconditions that generated the highest ground-level contamination values.
In addition to the above conservative assumptions made to ensure that the estimatedexposure levels would be higher than any actual occurrences at APG, our assumptions about thereceptor (the exposed individual) were also designed to overpredict exposure. We assumed that thereceptor would be present at the location of maximum ground-level contamination for one hour ( theduration of the fire) for each of the five annual fires for total periods of 12 years for children and30 years for adults.
We made each of these assumptions on the basis of our knowledge of range fires at APGand, to ensure that the exposure levels estimated in this study would be higher than any levels thatcould actually be expected to occur. As a result of these cumulatively conservative assumptions, thecalculated exposure levels reported here are most likely several orders of magnitude higher than anyactual exposures that would occur at APG.
We designed this study to determine whether exposure to the levels of contaminantscontained in range fire smoke from APG coulId pose health risks to site workers or to-tho-e public. We-
used a wide range of assumptions to ensure that the exposures we calculated would be higher thanan,' act4,ly lpcened _ th• filcd PVepn with th~; r levels calculated
w.. .er•lo-w-l-evels 0o concern for evr-co-ntfa-inan exceptrs-euic--d-mustardWe-calculated-the-----exposure levels for these two contanminants to be above a 10-6 risk level, but below a 10-4 risk level.It is interesting to note that background (or natural) arsenic contamination levels in the area rangeup to 3.7 mg/kg (ICF-Kaiser Engineers 1995), which is only one order of magnitude below the valueused for this study (i.e., 24 mg/kg). On the basis of this high background level, fires in forested areaswith this level of arsenic contamination could produce calculated risk levels in the range of the 10-6
(assuming the other conservative parameters used in this study). This result shows that the risk fromnonanthropogenic contaminants is similar to the estimated risk, based on very conservativeassumptions, from anthropogenic contaminants at APG.
Table l 3 shows that with the exception of arsenic and mustard, the contaminant that wasclosest to the selected screening levels was vinyl acetate, a natural product of the vegetation, rather
tnanCanI.nrop . A DC- 1.,4 I- ,-1-, ,lt-,,nh JAI n -ase-d reelp.e levels for.. __ !.-k)~~~jc L IILCdl.U1L I1--.LP•JI *Li * *-x.l -. J JA .L •tt ..J•, ,j L .. ... ...
49
the natural vegetation chemicals are conservative, they are probably less conservative than theassumptions used for releases of the anthropogenic contaminants. Our assumptions for both natural
and anthropogeniccontaminants require 125 acres of forested area to burn each year. However, wefeel tha! the estimated release rates we used in our calculations for the natural chemicals are within
an order of magnitude (10 times) of the actual rates, while the estimated release rates we used forthe anthropogenic contaminants are probably several orders of magnitude above the actual release
levels. This finding suggests that the main source of human health risk from range fires at APG is
most likely from the release of natural substances from burning vegetation itself, rather than releaseof anthropogenic contaminants, and that APG should focus on fire control as a risk-reduction
method. Smaller, hotter fires (which occur on days when meteorological conditions do not result ina low plume that impacts the ground close to the fire), have much lower potential for human health
impacts.
The study results are linearly dependent on the amount of biomass available (fire size, firetype, and time of year), the amount of a contaminant in the biomass, and the number of acres burnedper year. If data were available for any of these parameters showing that actual values are lower thanthe values assumed in this report, the calculated ground-level exposure levels could be reducedproportionally. The effects of meteorological conditions and fire smoldering are not linear and wouldbe more difficult to predict.
It is our conclusion that this study shows that the risk of adverse health effects from rangefires at APG is extremely. small. The study also defines how various parameters affect theseestimated results and can help determine how to direct future studies to produce better estimates'ofactual health risks, rather than bounding calculations.
I
50
12 RECOMIVIENDATIONS
We conclude that this study demonstrates that range fires at APG do not pose significanthealth risks to the surrounding population or to APG workers. Some risk does exist, but we believethat the exposure levels calculated for this report represent an upper bound of such risk, rather thangood estimates of the actual exposures that might occur. It is our conclusion that while further studyof this problem could provide better estimates of the actual exposures at APG, such estimates arenot needed to evaluate the possibility of significant adverse health impacts. Nonetheless, if it isdeemed importahit to develop more accurate estimates of human health risk from range fires at APG,the following studies or actions are recommended:
I. A field sampling program to determine the ratio of soil contaminant levels to
aboveground plant concentrations. Such a study would provide data forimproving the estimate of plant uptake ratios. Plant material collected duringthis -study could be forwarded to the Forest Service Fite Laboratory for teststo determine the actual amount of a contaminant that would be released in afire.
2. A study that estimates actual population risk. This study would include winddirections, population distributions, and probability of occurrence for variousfire parameters.
3. A review of APG documents to compile an extensive database of soilcontamination values. These data would then be used to estimate extent and
levels of soil contamination and toi re tefih-e th-ep-oitn-tial source term o r ..
plant uptake. This literature study should result in a much lower source termthan tht one 'i- d in this screenng study and provide a more realisticassessment o f-ehle--el -ontaminatior-that-c cutd-b xected-in-forestedand grassland areas. Using this estimate, the-probability that a fire wouldoccur in an area with a contamination level above a given value could beestimated on the basis of the relative extent of the contaminated area and the
entire range area at APG.
4. A change in fire record-keeping procedures for the APG Fire Department.
Current records are designed for administrative uses and do not contain thedetailed information needed for these types of exposure studies. Data such asfire size, fire duration, wind directions, estimated plume rise and touch down,
fire material (grass, scrubs. wood, etc.), and fire behavior (e.g., smoldering,hot, etc.) would be beneficial for future studies.

5]
5. A study to evaluate other possible exposure pathways, such as exposure tocontaminated groundwater and contaminant ingestion,
We do not, however, recommend any study involving use of instrumentation to collect datafrom actual range fires at APG at this time. Sampling strategies, uncertainty in the source terms andmeteorology, and other factors would render data captured in such a study very difficult to evaluate.As part of the current study, we tried to correlate air samples collected during a separate range studyof DU contamination with our model results. However, we found that such correlation was notpossible. We recommend that if a study involving field sampling of actual fires is deemed necessary,(1) an extensive modeling effort should be used to help design the field sampling program and (2) anextensive field data collection effort to accurately define the source term should be undertaken beforeany field fire measurements are made.
52
13 REFERENCES
Anderson, A., 1997, Personal communication from Anderson to A.M. Hermes, Environmental
Assessment Division, Argonne National Laboratory, Argonne, 1l., Sept,
Agency for Toxic Substances and Disease Registry, 1992a, Toxicological Profile for DDT, DDE,and DDD, prepared by Clement International Corp. for U.S. Public Health Service.
Agency for Toxic Substances and Disease Registry, 1992b, Toxicological Profile for Mustard Gas,
TP-91/22, prepared by Clement International Corp. for U.S. Public Health Service, Sept.
Agency for Toxic Substances and Disease Registry, 1993a, Toxicological Profile for Arsenic,
TP-92/02, prepared by Life Systems Inc. under subcontract to Clement International Corporation for
U.S. Public Health Service, April.
Agency for Toxic Substances and Disease Registry, 1993b, Toxicological Profile for Lead,TP-92/12, prepared by Clement International Corp. for U.S. Public Health Service, April.
ATSDR - See Agency for Toxic Substances and Disease Registry.
Barbour, M.G., and W.D. Billings (eds.), 1988, North American Terrestrial Vegetation, CambridgeUniversity Press, New York, N.Y.
Bell, E.V., et al., 1927, "Decomposition of Some Halogenated SuIphides, and the Nature of the'Pol ,mn-eric' .Ethylei&e Suliphides," Journal of th--CheMical Society pp 1803-1809. ,
Berry, W.L., and A. Wallace, 1974, Trace Elements in the Environment - Their Role and Potential..................- Tvxicity-as-Related-to-Fossil-Fuels-ýA-Preliminary-Study,-Universityof-C-alifomia,-tLaboratory-of
Nuclear Medicine and Radiation Biology.
Brown, D.F., 1997, An Improved Methodology for Characterizing Atmospheric Boundary LayerTurbulence and Dispersion, Ph.D. thesis, University of Illinois, Urbana, ll.
Brown, D.F., et al., 1997, FIREPLUME Model for Plume Dispersion from Fires: Application toUranium Hexafluoride Cylinder Fires, A.NL/EAD/TM-69, Argonne, IEl., June.
Centers for Disease Control, 1988, "Final Recommendations for Protecting the Health and Safety.against Potential Adverse Effects of Long-Term Exposure to Low Doses of Agents GA, GB, VrX,Mustard Agent (H, HD, T) and Lewisite (L)," Department of Health and Human Services, FederalFRegist - 3(50):8 5 -4. c 15.
53
Davis, L.S., 1990, Environmental Assessment for Testing Uranium Penetrator ..4_tnitions at
U.S. Anny Combat Systems Test Activity, Aberdeen Proving Ground, Aberdeen, Md.
CDC - see Centers for Disease Control,
Directorate of Safety, Health and Environment, 1994, Installation Restoration Action Plan, Aberdeen
Proving Ground, Maryland, Jan.
DSHE - See Directorate of Safety, Health and Environment.
Dvorak, A.J., et al., 1978, Impacts of Coal-Fired Plants on Fish, Wildlife, and Their Habitats,FWS/OBS-78/29, prepared by Argonne National Laboratory, Argonne, Eli., for the Office of
Biological Services and Environmental Contaminants Evaluation, Fish and Wildlife Service,U.S. Department of the Interior.
Ebinger, M.H., et al., 1996, Long-Terr Fate of Depleted Uranium at Aberdeen and Yuma ProvingGround, Phase II: Human Health and Ecological Risk Assessments, LA 13156-MS, Los AlamosNational Laboratory, New Mexico.
Eisler, R., 1988a, Arsenic Hazards to Fish, Wildlife, and Invertebrates: A Synoptic Review,Biological Report 85 (1.11), U.S. Fish and Wildlife Service, Patuxent Center, Laurel, Md.
Eisler, R., 1988b, Lead Hazards to Fish, Wildlife, and Invertebrates: A Synoptic Review, BiologicalReport 85(1.12), U.S. Fish and Wildlife Service, Patuxent Wildlife Research Center, Laurel, Md.
EPA - See U.S. Environmental Protection Agency.
U.S. ArmyA-eFee Provin-gGro-und;Vo-lume I: OverallObjectives, Ma-agem-entH- r t-ao-als,-Strategies, and Suggested Projects, prepared for the U.S. Army, Aberdeen Proving Ground, Md.
General Physics Corporation, 1997, Carroll Island Stud), Area, Test Grid I Soil Sampling Results,prepared by General Physics Corporation, Edgewood, Md., for U.S. Army, Aberdeen Proving
Ground, Md.
Gibbs, R., and M. Miller, 1996, Chemical and Biological Modeling Process Action (PAT) ModelingSubgroup Final Report, prepared for the Assistant to the Secretary of Defense, Nuclear, Chemical,
and Biological, Chemical and Biological Matters. and Deputy Under Secretary of the ArmyOperations Research, U.S. Departm, nl, of Defense,. Washngton, D C'
54
Hlohowsk:yj, I., et al., 1996. Remedial Investigation Report for J-Field, Aberdeen Proving Ground,
Ma rland, Volume 3: Ecological Risk Assessment, Draft, Argonne National Laboratory,
Argonne, ill., Jan.
H.odgson, J.F., 1970, "Chemistry of Trace Elements in Soils with Reference to Trace Element
Concentration in Plants," pp. 45-58, in D.D. Hemphill (ed.), Proceedings of the University of
Missouri's 3rd Annual (1969) Conference on Trace Substances in Environmental Health, Vol. II,
University of Missouri Press, Columbia, Mo.
Hope, B.K., 1995, "A Review of Models for Estimating Terrestrial Ecological Receptor Exposure
to Chemical Contaminants," Chemosphere 30(12):2267-2287.
ICF-Kaiser Engineers, 1995, Reference Sampling and Analysis Program at the U.S. Army Aberdeen
Proving Ground, Soil, Sediment, and Surface Water Reference Data Report, prepared for U.S. Army
Environmental Center, Aberdeen Proving Ground, Md., July.
Jastrow, J.D., 1995, Feasibility of Using Plants to Assist in the Remediation of Heavy Metal
Contamination at J-Field, Aberdeen Proving Ground, Maryland, Argonne National Laboratory,
Argonne, ill.
Jones,' C., 1997, personal communication from Jones (Fire Chief, Aberdeen Proving Ground) to
A.M. Hermes (Argonne National Laboratory, Argonne, El.), July.
Kabata-Pendias, A., 1992, Trace Elements in Soils and Plants, 2nd ed., CRC Press, Inc., Ann Arbor,Mich.
Liljegren, J.C., 1989, The Atterbury-87 Field Stud), of Smoke Dispersion and a New Stochastic
Dispersion Model, Ph.D. thesis, Department of Mechanical Engineering, University of Illinois,...... ... -Urb an a; ~Ilf|__
Los Alamos National Laboratory, Long-Term Fate of Depleted Uranium at Aberdeen and Yuma
Proving Grounds, Phase 11: Human Health and Ecological Risk Assessments, LA-13156-MS,
Los Alamos National Laboratory, Albuquerque, N.M., Sept.
Mackay, D., 1991. Multimedia Environmental Models: The Fugacity Approach, Lewis Publishers,
Inc., Chelsea, Mich.
Marrs, T.C., et al., 1996, Chemical Warfare Agents, Toxicology and Treatment, John Wiley & Sons,
Ltd., West Sussex, England.
55
McKenzie. L.M., el al.. 19915, "Measurement and Modeling of Air Toxins from SmolderingCombustion of Biomass," Environmental Science and Technology 29(8):2047-2054.
National Council on Radiation Protection and Measurement, 1984, Radiological Assessment:Predicting the Transport, Bioaccumulation, and Uptake by Man of Radionuclides Released to theEnvironment, Report No. 76, National Council on Radiation Protection and Measurements.
NCRP - See National Council on Radiation Protection and Measurement.
Richards, G.M., 1997, personal communication from Richards (University of Illinois, Champaign-Urbana, 111.) to A. Policastro (Argonne National Laboratory,. Argonne, Ill.).
Rynders, D.G., 1995, Investigation of Depleted Uranium Offsite from a Military Ordnance Range:Potential Concentrations and Radiological Doses, thesis submitted to Oregon State University.
Sax, N.I., and R.J. Lewis, Sr., 1989, Dangerous Properties of Industrial Materials, 7th edition, VanNostrand Reinhold, New York, N.Y.
Sleicher, C., and J. Hopcraft, 1984, "Persistence of Pesticides in Surface Soil and Relation toSublimation," Environmental Science and Technology 18:514-518.
Strenge, D.L., and S.R. Peterson, 1989, Chemical Data Bases for the Multimedia EnvironmentalAssessment System (MEPAS): Version 1, PNL-7145, prepared by Pacific Northwest Laboratory forthe U.S. Department of Energy.
SWCA, Inc., 1994, Biological Assessment for Aberdeen Proving Ground, Maryland, final draft,prepared by SWCA, Inc., Environmental Consultants, Flagstaff, Ariz., for the Directorate of Safety,
Travis, C.C., and A.D. Arms, 1988, "Bioconcentration of Organics in Beef, Milk, and Vegetation,"Environmental Science and Technology 24:829-837.
Turner, D.B., 1969, Workbook of Atmospheric Deposition Estimates, AP-26, U.S. EnvironmentalProtection Agency, Office of Air Programs, Washington, D.C.
U.S. Department of the Army, 1987, Natural Resources Management Plan, Part II, Land-Management and Ground Maintenance, Aberdeen Proving Ground, Md.
U.S. Environmnentall Protection Ag1erncy, 1198 6. He1,alth, ASSes-sment Do-cument ~for Phosq g ene.ReiewDrafi, EPAJ600/8-86/022A, Office of Health and Environmental Assessment, Washington, D.C..Aug,
56
U.S. Environmental Protection Agency, 1989, Risk Assessment Guidance for Supeifund; Volume :
Human Health Evaluation Manual (Part A, Interim Final), EPA/540/1-89/001. Office of Emergency
and Remedial Response, Washington, D.C., Dec.
U.S. Environmental Protection Agency, 1990, "National Oil and Hazardous Substances Pollution
Contingency Plan; Final Rule (400 CFR Part 300)," Federal Register 55(35):6154-6176, Feb. 21.
U.S. Environmental Protection Agency, 1991 a, Risk Assessment Guidance for Superfund, Volume 1:
Human Health Evaluation Manual, Part A: Supplemental Guidance, "Standard Default Exposure
Factors," Interim Final, OSWER Directive 9285.6-03, Office of Emergency and Remedial
Response, Washington, D.C., March 25.
U.S. Environmental Protection Agency, 199 1b, Risk Assessment Guidance for Superfmd; Volume I
Human Health Evaluation Manual, Part B: Development of Risk-Based Preliminary Remediation
Goals, EPA/540/R-92!003, Office of Emergency and Remedial Response, Washington, D.C., Dec.
U.S. Environmental Protection Agency, 1991 c, Upper-Bound Quantitative Cancer Risk Estimate for
Populations Adjacent to Sulfur Mustard Incineration Facilities, EPA/600/8-911053, Office ofResearch and Development, Washington, D.C., July.
U.S. Environmental Protection Agency, I 994a "Risk-Based Concentration Table, Fourth Quarter
1994," Philadelphia, Pa.
U.S. Environmental Protection Agency, 1994b, Integrated Exposure Uptake Biokinetic (IEUBK)
Model, Version 0.99d, Washington, D.C., March 8.
U.S. Environmental Protection Agency, 1995a, Exposure Factors Handbook., Review Draft,EPA/600/P-95/002A, Office of Research and Development, Washington, D.C., June.
U.S. Environmental Protection Agency, 1995b, Health Effects Assessment Summary Tables FY 1995
Annual, EPA/540/R-95/036, Office of Solid Waste and Emergency Response, May.
U.S. Environmental Protection Agency, 1995c, "Risk-Based Concentration Table, July - December
1995," Philadelphia, Pa.
U.S. Environmental Protection Agency, 1996, Risk Assessment Issue Paper for Carcinogeniciry
'-formation for r7-ichlorot "ry"ene(CE (cRN 79-0=-1i Healtb R;sk Tcrhnical
Support Center, Washington, D.C.
U.S. Environmental Protection Agency, 1997, Integrated Risk inforwnation System, Office ofiResý.-aurch• and " ... ' . ...1op e t datah• ... .acctls d 'In Ftb.
57
Vaughn, B.E., et al, 1975, Review of the Potential Impact on Health and Environmental Quality
from Metals Entering the Environment as a Result of Coal Utilization, Battelle Energy ProgressReport, Pacific Northwest Laboratories-Battelle Memorial Institute, Richland, Wash.
Willis, D.J., and J.W. Deardorff, 1977, "A Laboratory Model of the Unstable Planetary Boundary
Layer," Journal of Atmospheric Sciences 31:1297-1307.
Yuen, C.R., et al., 1996, Remedial Investigation Report for J-Field, Aberdeen Proving Ground,Maryland; Volume 1: Remedial Investigation Results, Draft, Argonne National Laboratory, Argonne,ill.

58
A-]
APPENDIX A:
FIREPLUME MODEL RESULTS
I

A-2
APPENDIX A:
FIREPLUME MODEL RESULTS
This appendix contains the output data from the FIREPLUME model for the APG rangefires study. The concentrations given here are for six model runs (Tables A.l through A.6)'atmospheric stability classes A, D, and E, in both forest and field fire situations. Stability Arepresents conditions of low wind speed and strong vertical mixing, typical of a clear summerafternoon with low winds. Stability D represents neutral conditions (on the slightly stable side), aswould be typical of late afternoon or early morning overcast periods with moderate winds. Stability Erepresents a nighttime case with partial cloud cover and moderate winds. The specific parametersfor each scenario are listed (in footnotes) along with the corresponding output. The concentrationsare given in units of mg/m 3 per kg of contaminant release. To determine the final groundconcentrations from each plume in mg/m 3, the data were multiplied by the estimated totalcontaminant release, in kg, for each contaminant. The "sigma Y" values allow calculation ofconcentrations off the centerline, as detailed in Section 8.2.
I
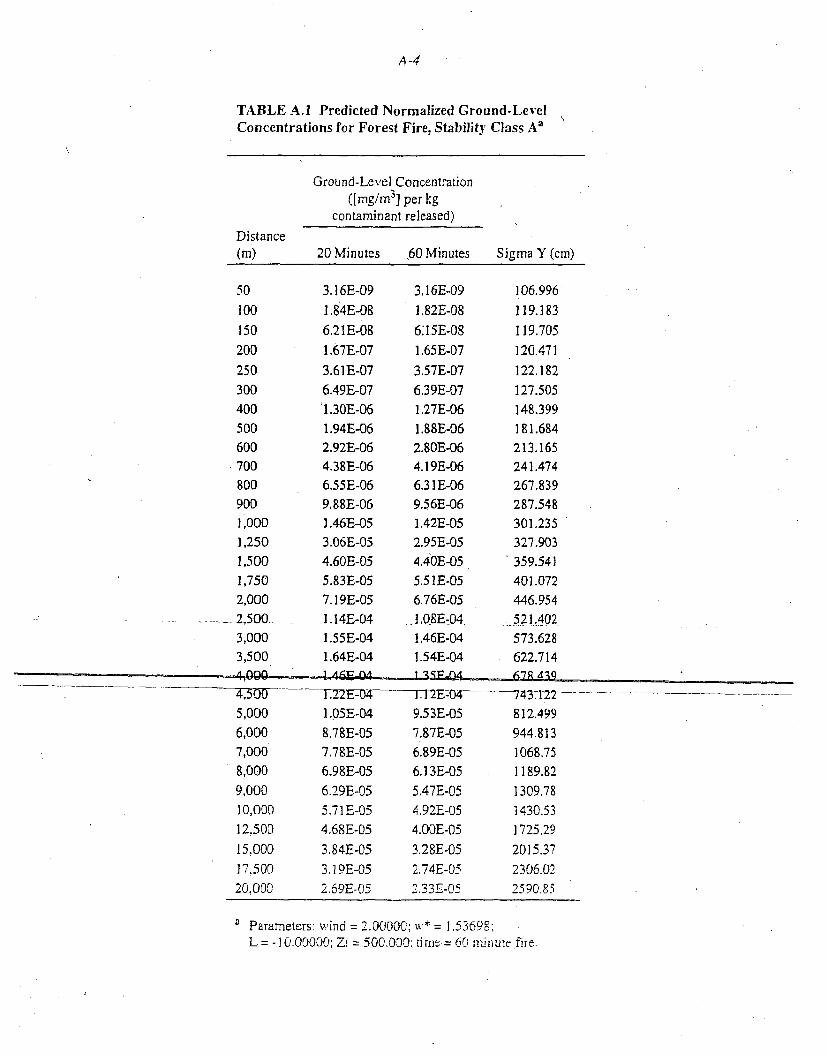
A -4
TABLE A.1 Predicted Normalized Ground-LevelConcentrations for Forest Fire, Stability Class A'
Ground-Level Concentration([mg/m 3] per kg
contaminant released)
Distance(m) 20 Minutes 60 Minutes Sigma Y (cm)
50 3.16E-09 3.16E-09100 1.84E-08 1.82E-08
150 6.21E-08 6:15E-08
200 1.67E-07 1.65E-07
250 3.61E-07 3.57E-07300 6.49E-07 6.39E-07400 1.30E-06 1.27E-06500 1.94E-06 1.88E-06600 2.92E-06 2.80E-06700 4.38E-06 4.19E-06800 6.55E-06 6.3 1E-06900 9.88E-06 9.56E-061,000 1.46E-05 1.42E-051,250 3.06E-05 2.95E-05
1,500 4.60E-05 4.40E-051,750 5.83E-05 5.51E-052,000 7.19E-05 6.76E-05
. 2,500 1.14E-04 t.08E-043,000 1.55E-04 1.46E-043,500 1.64E-04 1.54E-04
4nr16E '1-4,500 //22E--04 ---- 1A12EB:04-5,000 1 .05E-04 9.53E-056,000 8.78E-05 7.87E-057,000 7.78E-05 6.89E-058,000 6.98E-05 6.13E-059,000 6.29E-05 5.47E-05
10,000 5.71E-05 4.92E-0512,500 4.68E-05 4.00E-05
15,000 3.84E-05 3.28E-05
17,509 3.19E-05 2.74E-0520,000 2.69E-05 2.33E-05
106.996119.183119.705120.471122.182127.505148.399181.684213.165241.474267.839287.548301.235327.903359.541401.072446.954
: 521.402573.628622.714I?7R A•Q
~743_122--
812.499
944.8131068.751189.821309.78
1430.53
1725.29
2015.37
2306.02
2590.85
Parameters: wind 2.00000; w* = 1.53698:L = - 10,00000; Zi = 500.000; tirnme= 60 rrinute fire.
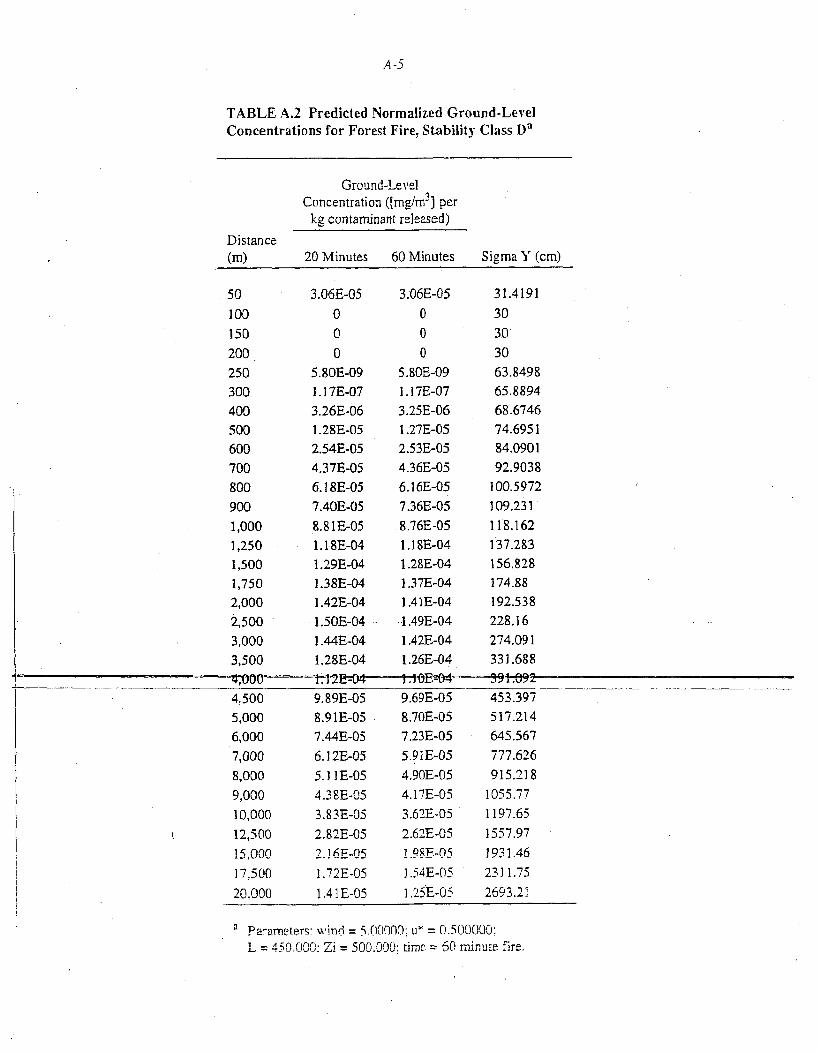
A-5
TABLE A.2 Predicted Normalized Ground-LevelConcentrations for Forest Fire, Stability Class D'
Ground-LevelConcentration ([mg/rn 3] per
kg contaminant released)
Distance(m) 20 Minutes 60 Minutes Sigma Y (cm)
501001502002503004005006007008009001,0001,2501,5001,7502,0002,5003,0003,500
3.06E-05000
5.80E-091.1 7E-073.26E-061.28E-052.54E-054.37E-056.18E-057.40E-058.8 1E-051.1 8E-041.29E-041.38E-041.42E-04
- 1.50E-041.44E-041.28E-04
3.06E-05000
5.80E-091. 17E-073.25E-061.27E-052.53E-054.36E-056.16E-057.36E-058.76E-051.1 8E-041.28E-041.37E-041.41E-041 .49E-041.42E-041.26E-04
31.419130303063.849865.889468.674674.695184.090192.9038
100.5972109.231118.162137.283156.828174.88192.538228.16274.091331.688
1 *-;z~--?..,t,uVVV I . I r I . i Vý_W_
4,5005,0006,0007,0008,0009,00010,00012,500!5,00017,50020.000
9.89E-058.9 1E-057.44E-056.12E-055.1 IE-054.3 8E-053.83E-052.82E-05_. 1 6F-F5
1.72E-051.41E-05
9.69"r-058 .70E-057 .23E-055.91E-054.90E-054.17E-053.62E-052.6'2E-051.98-F-05
1 .54E-05I .2•ýE-05
453.397
517.214
645.567
777.626
915.218
1055.77
1197.65
1557.971931.46
2311.75
2693.21
Paranetejrs- wind = 50.()0000: u* = 0.500000:
L = I 0.0n.: Zi = 500.000: time 60 minute fire.
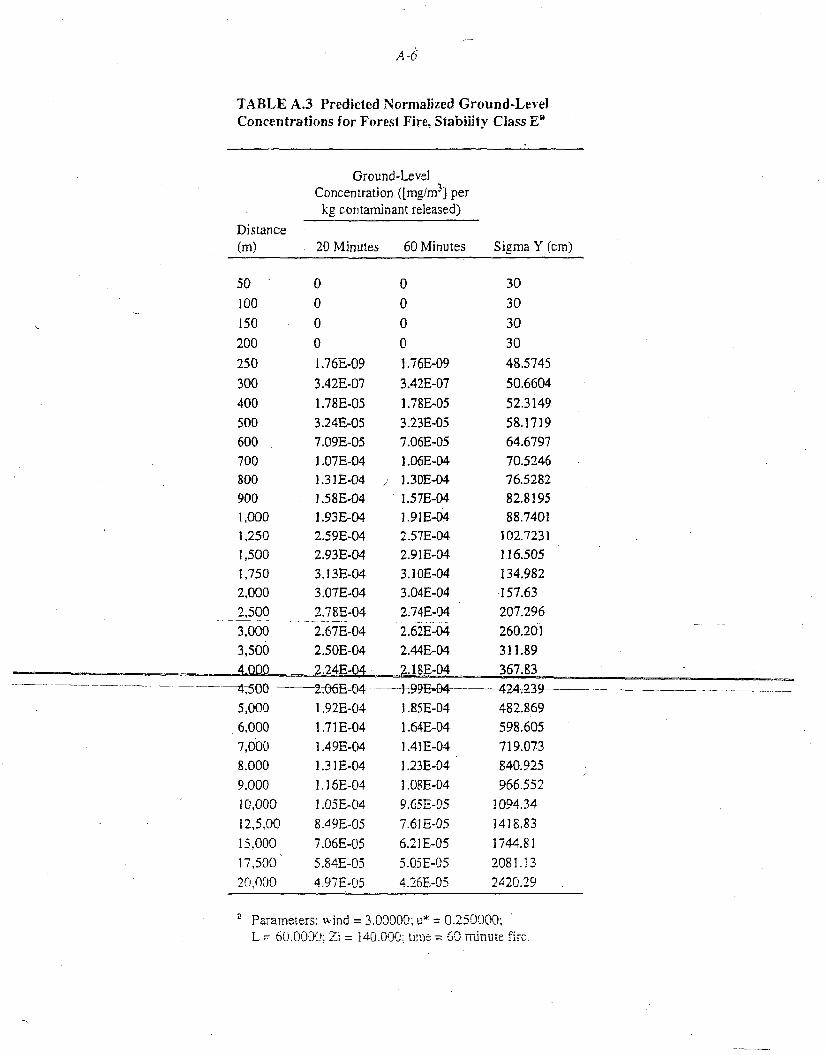
A-6
TABLE A.3 Predicted Normalized Ground-LevelConcentrations for Forest Fire, Stability Class E'
Ground-LevelConcentration ([mg/m 31 per
kg contaminant released)
Distance(m) 20 Minutes 60 Minutes Sigma Y (cm)
50 0 0 30
100 0 0 30
150 0 0 30
200 0 0 30250 1.76E-09 1.76E-09 48.5745
300 3.42E-07 3.42E-07 50.6604400 1.78E-05 1.78E-05 52.3149
500 3.24E-05 3.23E-05 58.1719600 7.09E-05 7.06E-05 64.6797700 1.07E-04 1.06E-04 70.5246800 1.31E-04 , 1.30E-04 76.5282900 1.58E-04 1.57E-04 82.81951,000 1.93E-04 1.91E-04 88.74011,250 2.59E-04 2.57E-04 102.7231
1,500 2.93E-04 2.91E-04 116.505
1,750 3,13E-04 3.10E-04 134.9822,000 3.07E-04 3.04E-04 157.632,500 2.78E-04 2.74E-04 207.2963,000 2.67E-04 2.62E-04 260.2013,500 2.50E-04 2.44E-04 311.894000 2.24E-04 2.18E-04 367.83
~~~44500---2.06E--04-~----±99E•--t-- ... 424.2-39--_ _ _-__
5,000 1.92E-04 1.85E-04 482.8696,000 1.71E-04 1.64E-04 598.6057,000 1.49E-04 1.41E-04 719.0738,000 1.31 E-04 1.23E-04 840.9259.000 1.16E-04 1.OSE-04 966.55210,000 1.05E-04 9.65E-05 1094.34
12,5,00 8.49E-05 7.61 E-05 1418.8315,000 7.06E-05 6.21E-05 1744.81
17,500 5.84E-05 5.05E-05 2081.13201,090 4,97E-05 4.26E-05 2420.29
Parameters: wind = 3.00000; u* = 0.250000;L = 60.000 Zi = 140, 0: time = 60 (-m .n...te Ci
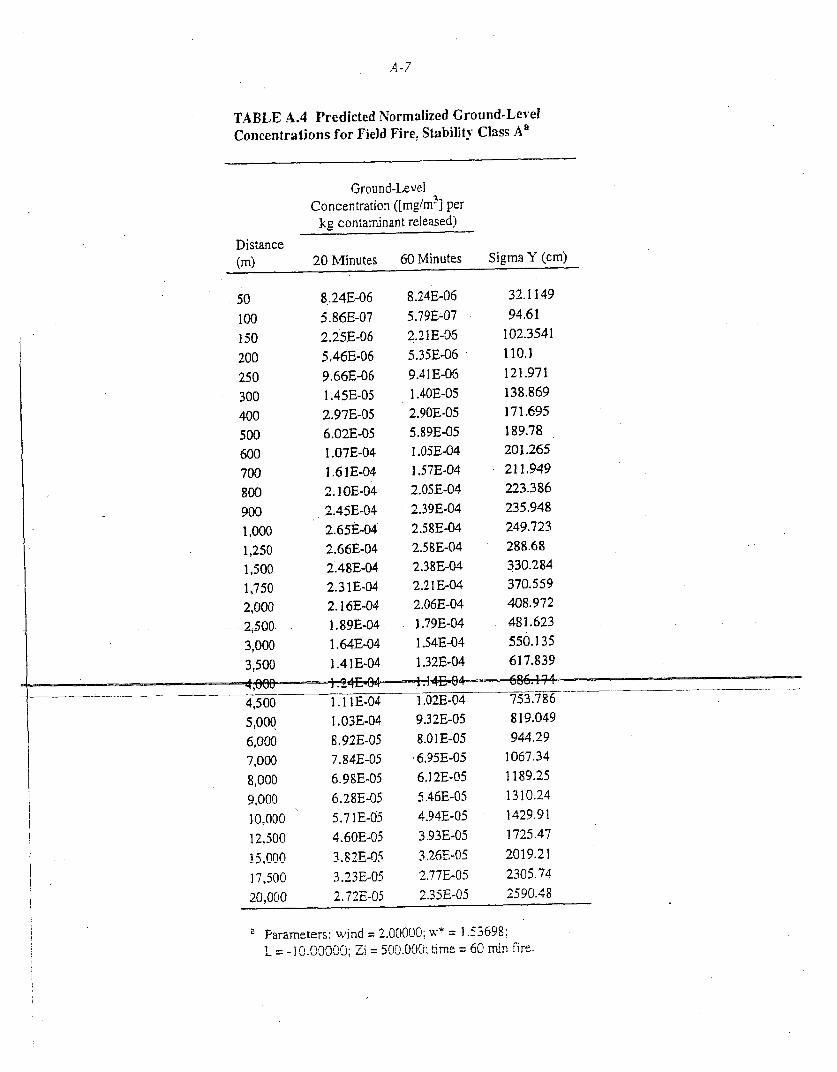
A-7
TABLE A.4 Predicted Normalized Ground-LevelConcentrations for Field Fire, Stability Class A'
Ground-LevelConcentration ([mg/rn3] per
kg contaminant released)Distance
(m) 20 Minutes 60 Minutes Sigma Y (cm)
50 8.24E-06 8.24E-06 32.1149
100 5.86E-07 5.79E&07 94.61
150 2.25E-06 2.21E-06 102.3541200 5.46E-06 5.35E-06 110.1250 9.66E-06 9.41E-06 121.971300 1.45E-05 1.40E-05 138.869
400 2.97E-05 2.90E-05 171.695500 6.02E-05 5.89E-05 189.78600 1.07E-04 1.05E-04 201.265
700 1.61E-04 1.57E-04 211.949800 2. 1 OE-04 2.05E-04 223.386
900 2.45E-04 2.39E-04 235.9481,000 2.65E-04 2.58E-04 249.7231,250 2.66E-04 2.58E-04 288.681,500 2.48E-04 2.38E-04 330.284
1,750 2.31E-04 2.21E-04 370.5592,000 2.16E-04 2.06E-04 408.972
... 2ý500 1.89E-04 1.79E-04 481.6233,000 1.64E-04 1.54E-04 550.1353,500 1.41E-04 1.32E-04 617.8394 ?,000 ... .1. -- •A104
4,500 1.I 1E-04 1.02E-04 753.786
5,000 1.03E-04 9.32E-05 819.0496,000 8.92E-05 8.01E-05 944.297,000 7.84E-05 6.95E-05 1067.348,000 6.98E-05 6.12E-05 1189.259,000 6.28E-05 5.46E-05 1310.24
10,000 5.7 1E-05 4.94E-05 1429.9112,500 4.60E-05 3.93E-05 1725.4715,000 3.82E-05 3.26E-05 2019.21
17,500 3.23E-05 2.77E-05 2305.7420,000 2.72E-05 2.35E-05 2590.48
a Parameters: wind = 2.00000; w* = 1.53698:I = rr,.nnrr;. = 7 500-0n0' time = 60 min fire.
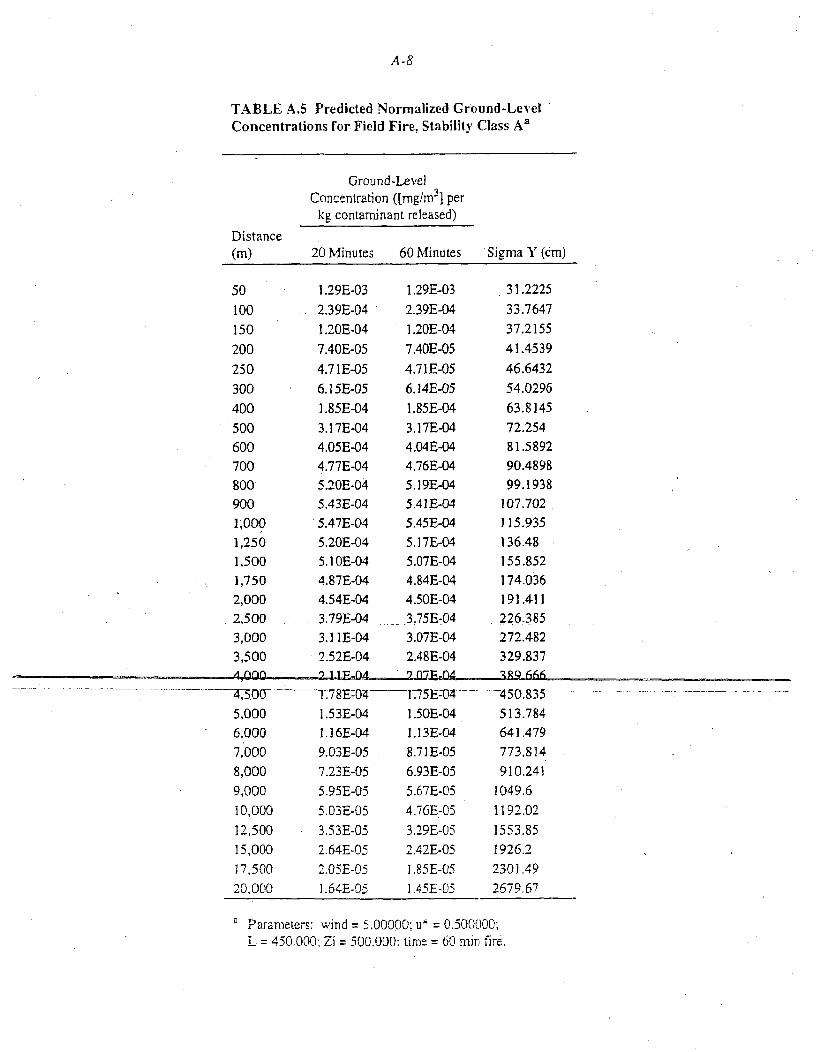
A-8
TABLE A.5 Predicted Normalized Ground-LevelConcentrations for Field Fire, Stability Class A'
Ground-LevelConcentration ([mg/m 3] per
kg contaminant released)
Distance(W) 20 Minutes 60 Minutes Sigma Y (cm)
50 1.29E-03 1.29E-03 31.2225
100 2.39E-04 2.39E-04 33.7647
150 1.20E-04 1.20E-04 37.2155
200 7.40E-05 7.40E-05 41.4539
250 4.71E-05 4.71E-05 46.6432
300 6.15E-05 6.14E-05 54.0296
400 1.85E-04 1.85E-04 63.8145
500 3.17E-04 3.17E-04 72.254
600 4.05E-04 4.04E-04 81.5892
700 4.77E-04 4.76E-04 90.4898
800 5.20E-04 5.19E-04 99.1938
900 5.43E-04 5.41E-04 107.702
1,000 5.47E-04 5.45E-04 115.935
1,250 5.20E-04 5.17E-04 136.48
1,500 5.1OE-04 5.07E-04 155.8521,750 4.87E-04 4.84E-04 174.036
2,000 4.54E-04 4.50E-04 191.411
2,500 3.79E-04 3.75E-04 226,'385
3,000 3.11 E-04 3.07E-04 272.482
3,500 2.52E-04 2.48E-04 329.837
.... .. ... .. .. ....... ..... -4,5 0-178E:04 - 1 7. 7 5 E--4...... 4- 5 0.835 . . .. . . . ... .. . . . .. . ..
5,000 1.53E-04 1.50E-04 513.784
6,000 1.16E-04 1.13E-04 641 .479
7,000 9.03E-05 8.7 1E-05 773.814
8,000 7.23E-05 6.93E-05 910.241
9,000 5.95E-05 5.67E-05 1049.6
10,000 5.03E-05 4.76E-05 1| 92.02
12,500 3.53E-05 3.29E-05 1553.85
15.000 2.64E-05 2.42E-05 1926.2
17,500 2.05E-05 1.85E-05 2301.49
20.000 1.64E-05 1.45E-05 2679.67
Parameters: wind = 5.00000; u* = 0.500000;= 450.000; Zi = 500.000; time = 60 mm fire.
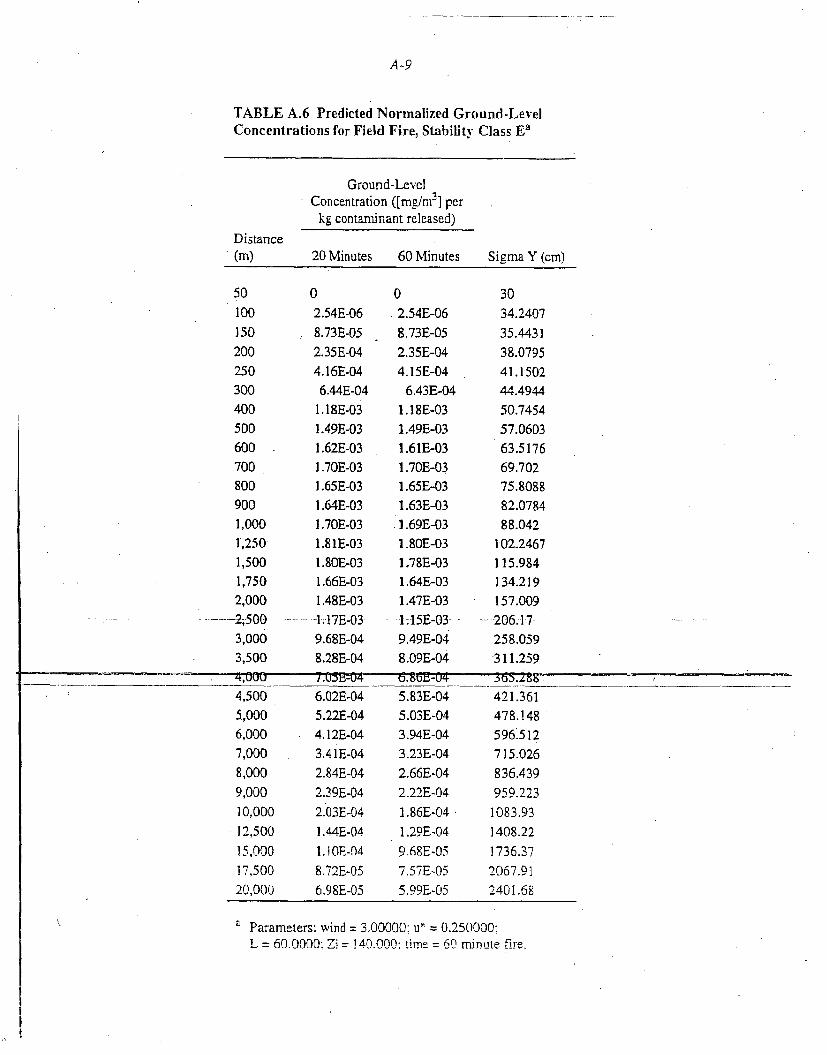
A-9
TABLE A.6 Predicted Normalized Ground-LevelConcentrations for Field Fire, Stability Class E'
Ground-LevelConcentration ([mg/m 3] per
kg contaminant released)
Distance(m) 20 Minutes 60 Minutes Sigma Y (cm)
501001502002503004005006007008009001,0001,2501,5001,7502,000
-2;,5003,0003,500
02.54E-06
8.73E-05
2.35E-04
4.16E-04
6.44E-04
1.18E-031.49E-03
1.62E-03
1.70E-03
1.65E-03
1.64E-03
1.70E-03
1.81E-03
1.80E-031.66E-03
1.48E-03
.... .17E-03
9.68E-04
8.28E-04
02.54E-06
8.73E-05
2.35E-04
4.15E-04
6.43E-04
1.18E-03
1.49E-03
1.61E-03
1.70E-03
1.65E-03
1.63E-03
1.69E-03
1.80E-03
1.78E-03
1.64E-03
1.47E-03
t1:5E-03
9.49E-04
8.09E-04
3034.240735.443138.079541.150244.494450.745457.060363.517669.70275.808882.078488.042
102.2467115.984134.219157.009206.17-258.059311.259
I .UJ-V,-U U. gO rUZUr+
4,5005,0006,000
7,000
8,000
9,000
10,000
12,500
15,000
17,500
20,000
6.02E-045.22E-044.12E-043.4 1E-042.84E-042.39E-042.03E-041.44E-041. 1 OE-048.72E-056.98E-05
5.83E-045.03E-04
3.94E-043 .23E-042.66E-042.22E-04
1 .86E-0410.29E-04
94.68E-05
7.57E-055 .99E-05
42- 1. 361478.148596.5127 15.0268 36.439959.2231083.931408.221736.372067.912401.68
a Parameters: wind = 3.00000: u0 0.250000:
L = 60.0000; Zi = lA4.000: time 60 minute fire.

A-1O
B-]
APPENDIX B:
EMISSION FACTORS FOR BURNING VEGETATION
.4-

B-2
B-3
APPENDIX B:
EMISSION FACTORS FOR BURNING VEGETATION
Table B.I lists chemical emission factors of components in smoke condensates fromburning uncontaminated vegetation at APG (McKenzie et al. 1995). The values given are releaseamounts (grams) per dry mass (kilogram) of fuel burned (g/kg). McKenzie et al. (1995) obtainedthese data by examining the organic emissions from buming vegetation from a ponderosa pine forestin Montana. Because the fires occurring at Aberdeen Proving Ground occur in southeasterndeciduous forests, the vegetation would differ from that found in the Montana forest. Therefore, onthe basis of a recommendation from a scientist involved in the Montana study (Richards 1997), allof the emission factors were multiplied by five to be conservative and account for any differences
in vegetation.
The emission factors were separated into the two categories to match the areas chosen forthig study - forested area and field area. The emission factors from "wood" were used to estimaterelease from a forest fire, and the factors were then multiplied by the total estimated biomassavailable to burn in a forest fire at APG. The emission factors from "litter". were used to representemissions from a field fire,.and these factors were then multiplied by the estimated total biomassavailable to be burned in a field fire at APG. Estimation of biomass amounts is discussed in
Section 6 and listed in Table 6.
Two of the chemicals released from burning biomass, 2-furaldehyde and vinyl acetate, wereexamined more closely in this study because they are suspected carcinogens.
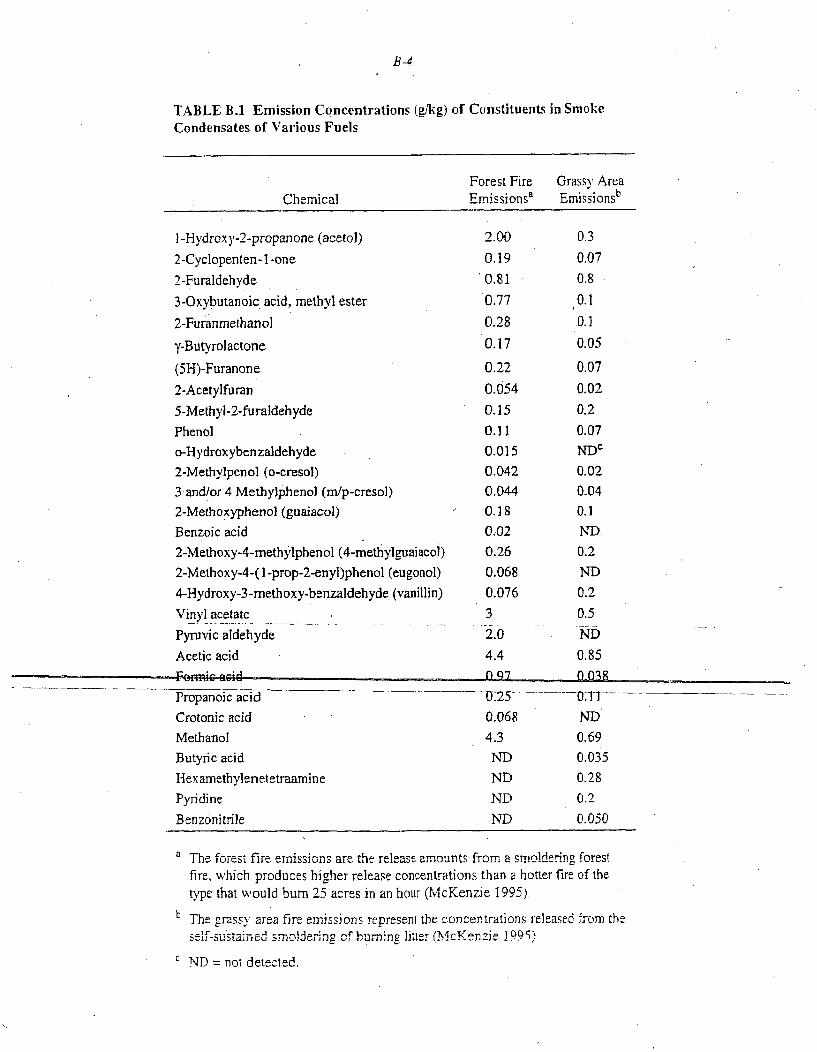
B-4
TABLE B.1 Emission Concentrations (glkg) of Constituents in SmokeCondensates of Various Fuels
Forest Fire Grassy AreaChemical Emissions' Emissionsb
I -Hydroxy-2-propanone (acetol) 2.00 0.3
2-Cyclopenten-1-one 0.19 0.07
2-Furaldehyde '0.81 0.8
3-Oxybutanoic acid, methyl ester 0.77 0.1
2-Furanmethanol 0.28 011
y-Butyrolactone 0.17 0.05
(5H)-Furanone 0.22 0.07
2-Acetylfuran 0.054 0.02
5-Methyl-2-furaldehyde 0.15 0.2
Phenol 0.11 0.07o-Hydroxybenzaldehyde 0.01 5 NDC
2-Methylpenol (o-cresol) 0.042 0.02
3and/or 4 Methylphenol (m/p-cresol) 0.044 0.04
2-Methoxyphenol (guaiacol) 0.18 0.1
Benzoic acid 0.02 ND2-Methoxy-4-methylphenol (4-methylguaiacol) 0.26 0.2
2-Methoxy-4-( 1-prop-2-enyl)phenol (eugonol) 0.068 ND
4-Hydroxy-3-methoxy-benzaldehyde (vanillin) 0.076 0.2
Vinyl acetate 3 0.5
Pymvic aldehyde 2.0 ND
Acetic acid 4.4 0.85Feri ~ d n0o7 fl.03
Propanoic acid 0G25 - 0.-l
Crotonic acid 0.068 ND
Methanol 4.3 0.69
Butyric acid ND 0.035
Hexamethylenetetraamine ND 0.28
Pyridine ND 0.2
Benzonitrile ND 0.050
The forest fire emissions are the release amounts from a smoldeing fores.fire, which produces higher release concentrations than a hotter fire of thetype that would bum 25 acres in an hour (McKenzie 1995).
The grassy area fire emissions represent the concentrations released from the
stff-sustali,,Cu SM1 4C-:erig hurnl-,E in T (mcKenzie. 199~5).. .deteced .,
SND =not detected.
B-5
REFERENCES FOR APPENDIX B
McKenzie, et al., 1995, "Measurement and Modeling of Air Toxins from Smoldering Combustion
of Biomass," Environmental Science and Technology 29(8):2047-2050,
Richards, G.M., 1997, personal communication from Richards (University of Illinois. Champaign-Urbana, Ill.) to A. Policastro (Argonne National Laboratory, Argonne, El1.).
*1

B-6
C-I
APPENDIX C:
FIGURES

C-2
1
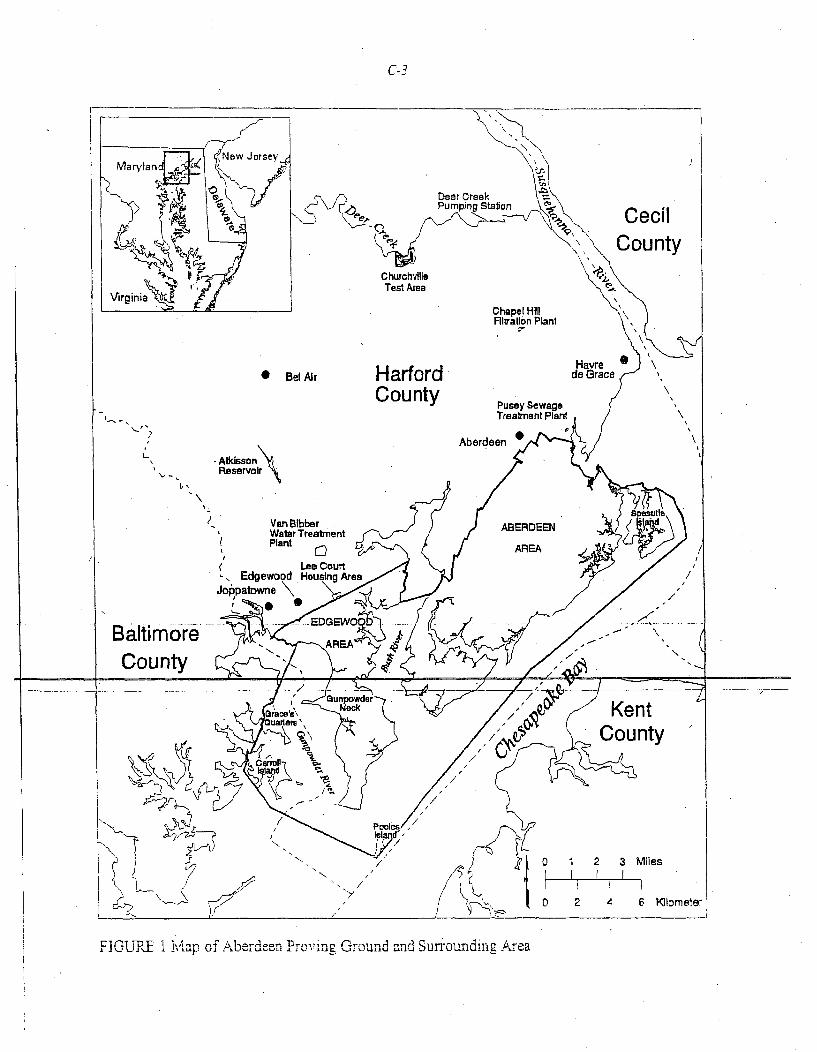
C-3
CecilCounty
ChurchvllleTest Area
Chapel HillFiltralion Plant
p,.
0 Bel Air HarfordCounty
Pusey SewageTreatment Plant
AberdeenIL.
-Atkisson\
V- Reservlr\
Vam ibberWater TreatmentPlant
ABERDEEN
AREA
BaltimnoreCounty
0 1 2 3 Miles
0 2 4 6 Kilometer
FIGUR TE I Map of AberIdee-n Proving Ground and Sunound ding Area
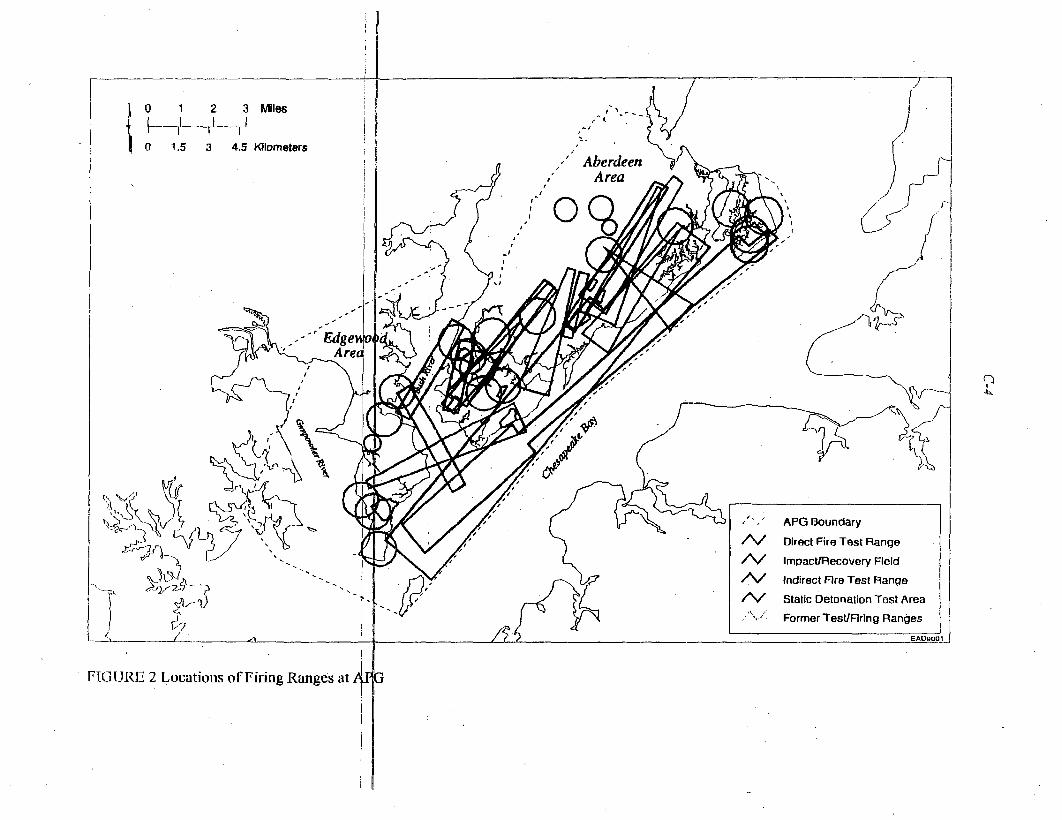
0 1 2 3 iWes
0 .5 3 4.5 fllometers Aed n,'Aberdeen
I I i
Areaa
Edges
A reo ,a.
,"-' APG Boundary
Direct Fire Test Range
/V/ Impact/Recovery Field
l* Indirect Fire Test Range
/'V Static Detonation Test Area
- Former Test/Firing Ranges
FltIYJRE 2 Locations of Firing Ranges at
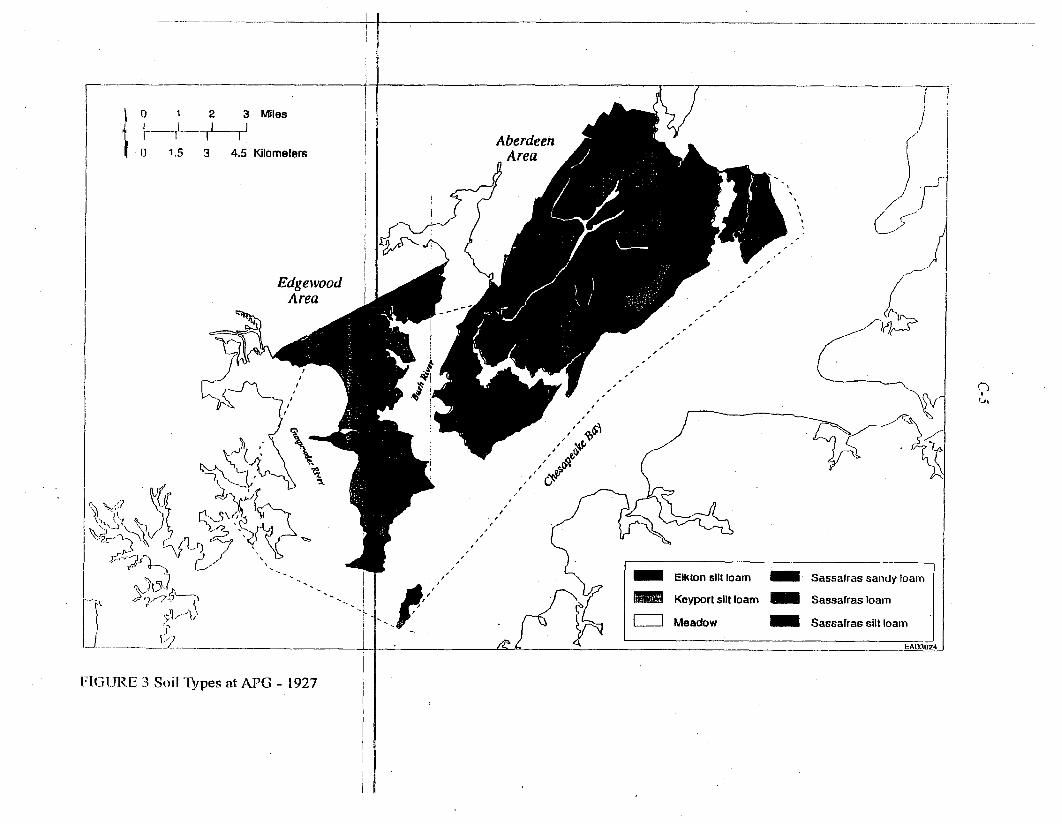
0 1 2 3 Mies AberdeenArea
EdgeivoodArea
*1~,*1
dC)
II
pElkton silt loam
Keyport silt loam
LII Meadow
Sassafras sandy loam
Sassafras loam
Sassafras silt loam
FIGURE 3 Soil Types at NPG - 1927
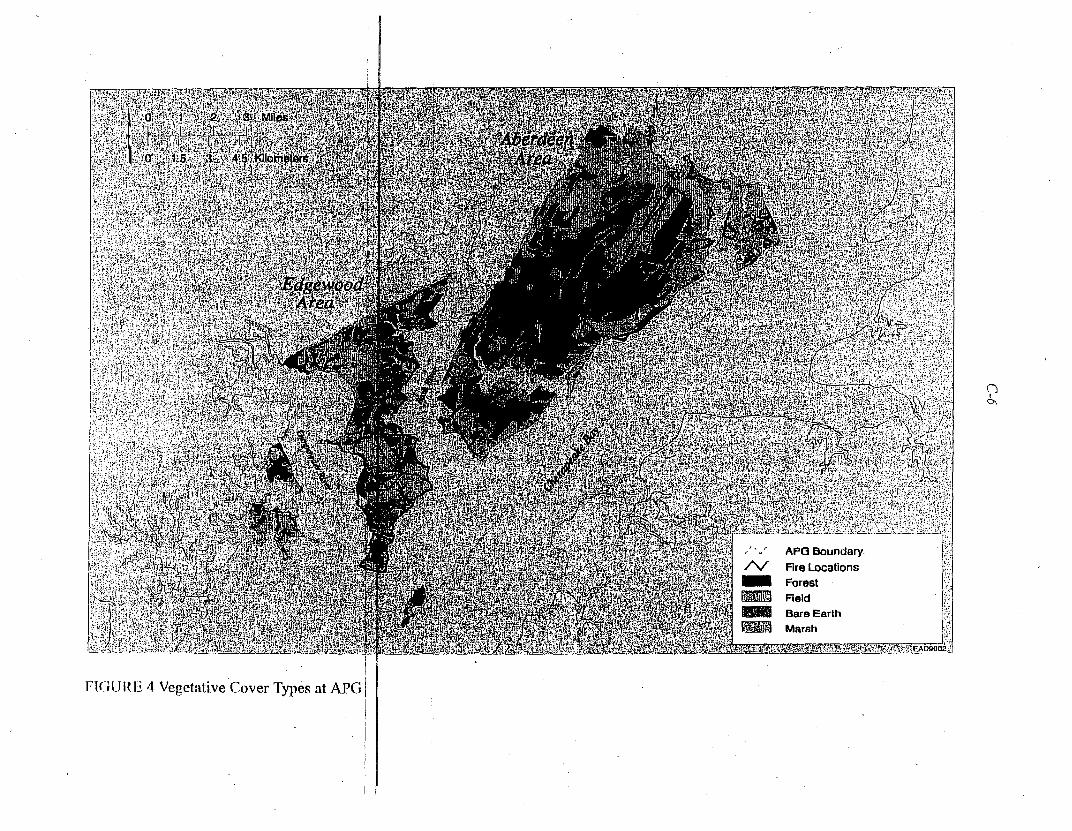
PAU. cp- 4
A irg. 7 gg
RE N;?14- IV _V"! f -ýlj "4'
RIB.
T
ISgg W-vW'.
V W W
ý"N
Wl-
Y'ý
V -
'00
?k V5 U%':
WAN, M, -RO APQ Boundary6ý mug L`5 -ý-Rq
014-k .4 ig
ý""A MZW, M
b", J11 Fire Locations
N
ForestETA-Y Field
Bare Earth
marshTIP.
C. A.j E A
FIGURE' , 4 Veget;tfive Cover Types at APG
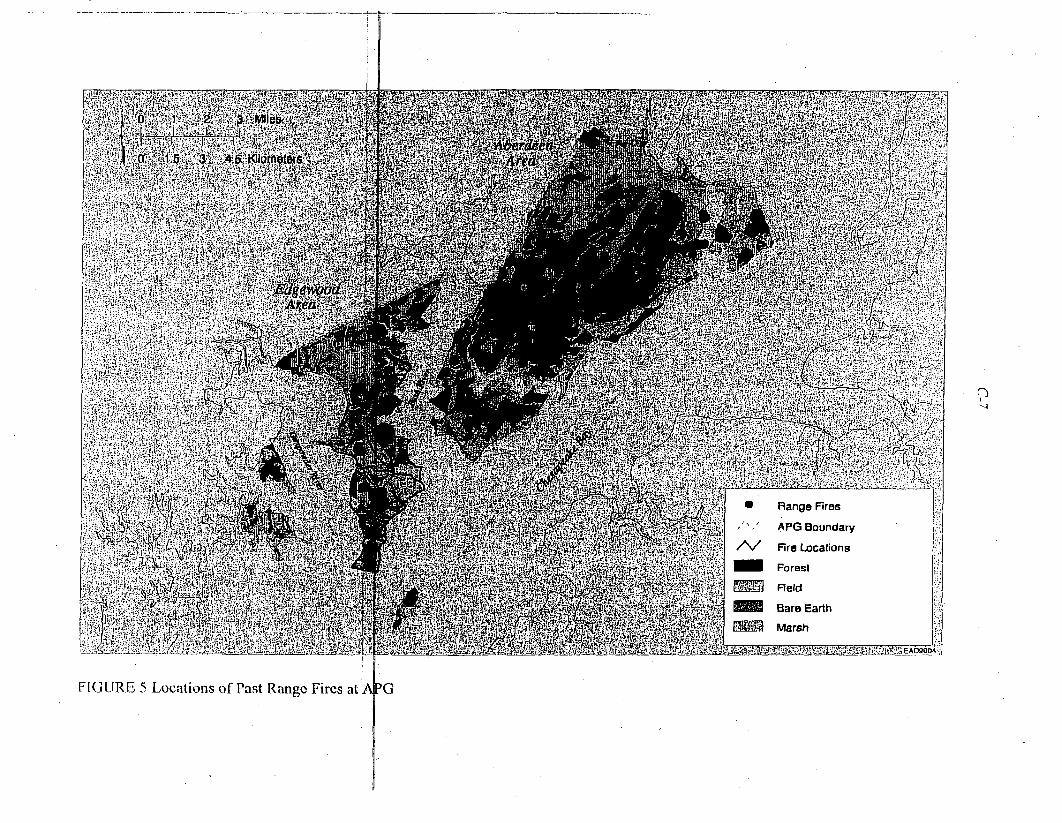
_ Range Fires
,"" •' . APG Boundary"
~ , A ~ * J ~ ~ ~ ./F.. F ire L o c a tio n s
di
hMarsh
FI(G UER 5 Locations of Past Range Fires at G
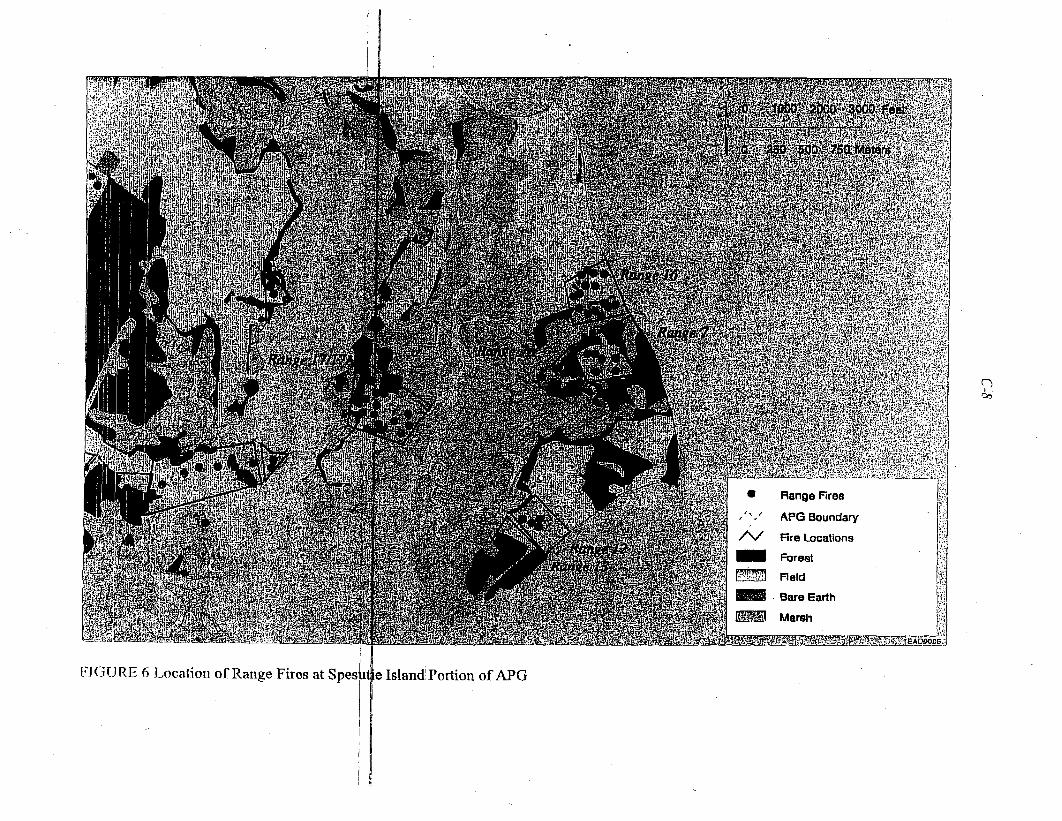
FMIURE 6 Location. of Range Fires at Spes{it ie Island Portion of APG
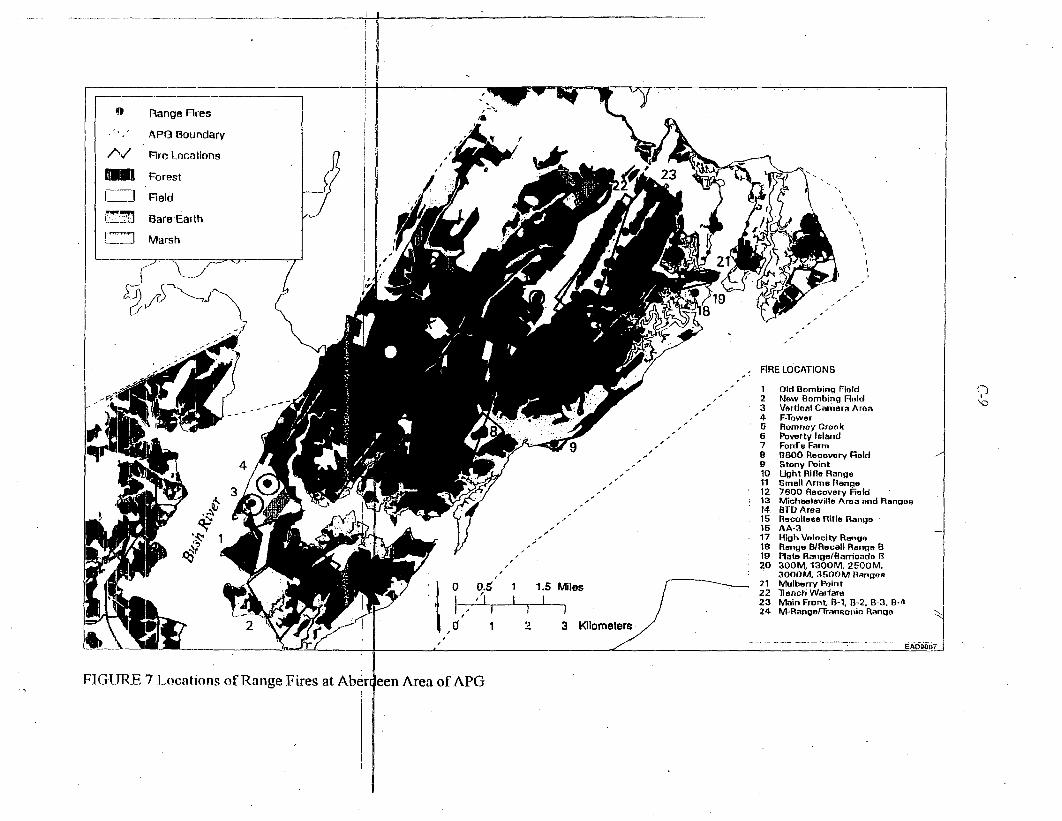
1:7 il
flange Fires
AP(3 Boundary
Fire Locations
Forest
Field
BareEarlh
Marsh
\I
A
I
!,AArý1A
FIRE LOCATIONS
1 Old Bombing Fie ld2 Now Bombing Fold3 Vertical Camera Area4 F-Tower5 Romney Creek6 Poverty Island7 Fonfe Farm9 0600 Recovery Feld9 Stony Point10 Light Rifle Range11 Small Arms Range12 7600 Recovery Field13 Micheoloville Area and Ranges14. BTD Area15 Recoiless Rifle Range16 AA-317 High Velocity Range18 Range /Reacall Range B19 Plate Range/Barricade B20 300M, 1300M. 2500M.
3000M. 3500M Ranges21 Mulberry Point22 Trench Warfare23 Main Front F3-1, B-2. B-3. 0-424 M-Rangs/Transonio Range
,...
I/1.5 Miles
1 2 3 KIlometers
FIGURE 7 Locations of Range Fires at of APG
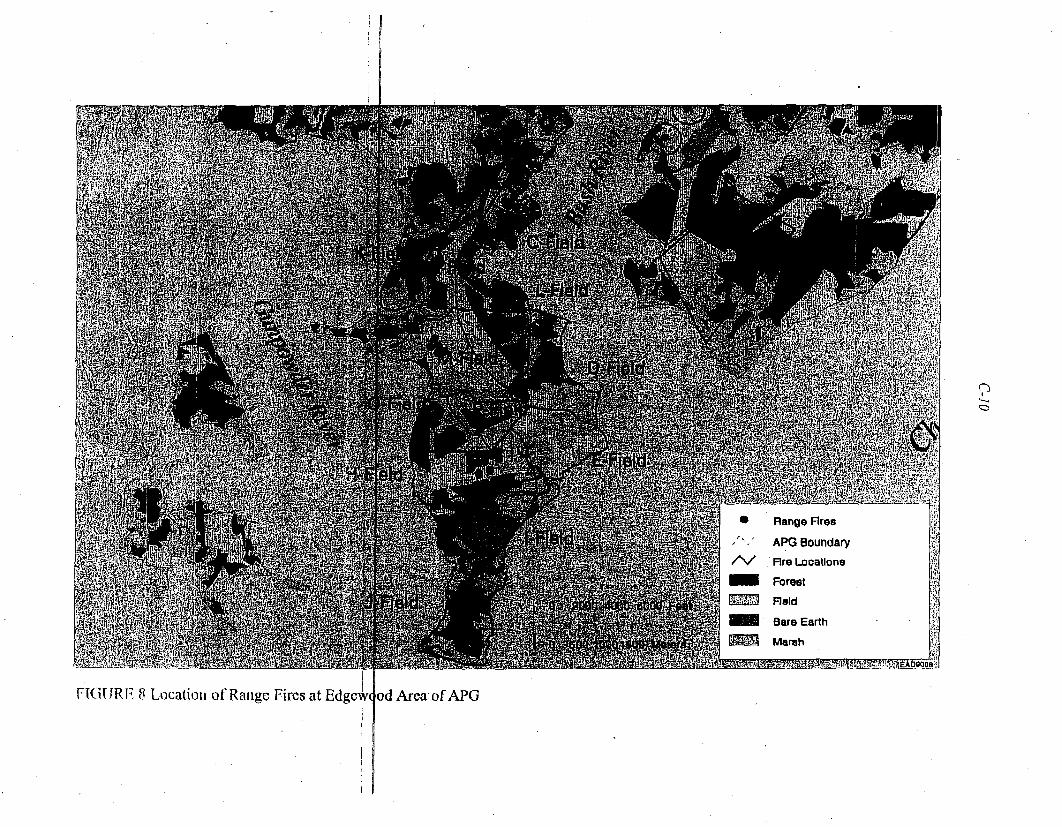
FI(R.i RE 8 Location of Range Fires at Edgc4 ( ,od Area of APG
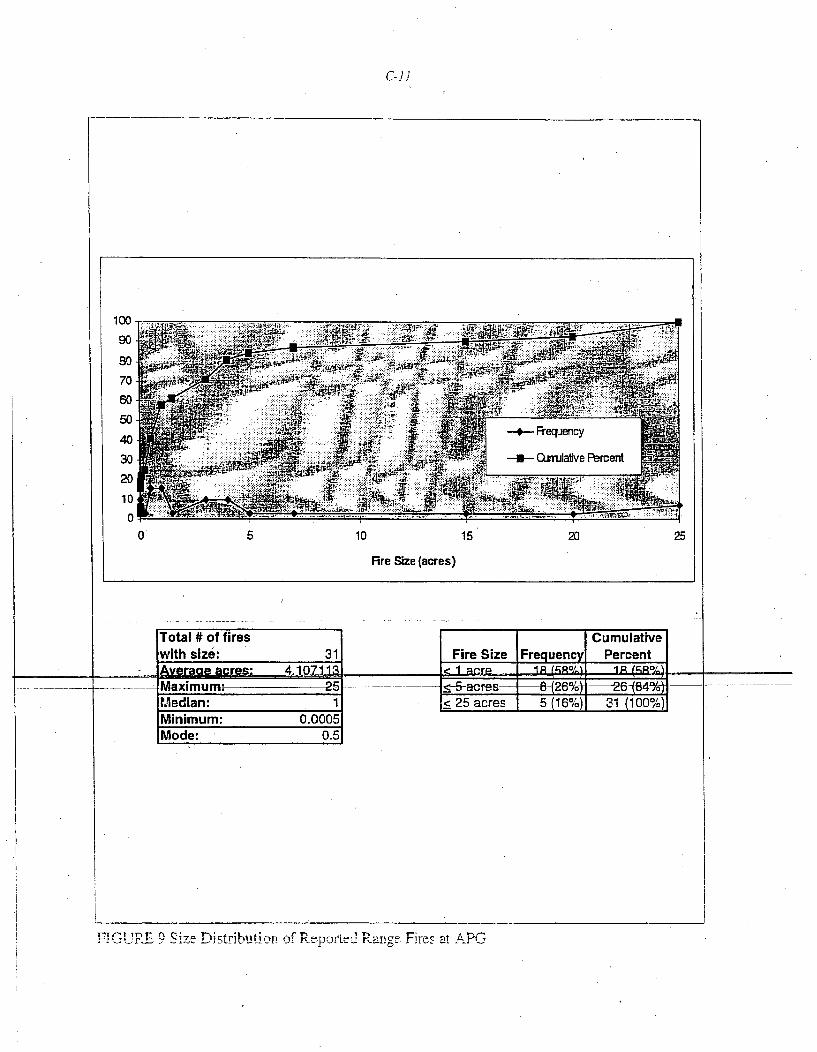
C-1]
100
300~~~ ~~ low E-0~~aieI~c~ .... -
5 0W5202
Fire Size (acres)
-4--
Total # of fireswith size: 31Average acres; 4.10143Maximum: -25Median: 1Minimum: 0.0005[Mode: 0.5
r I (aces It a MOOL'N I~ a IOL'i
CumulativeFire SizeFrequency Percent
1•-5-acres -- (26°- 26-B4%•< 25 acres 5 ý16%) 31 (100%)
TZ¶ 7r LitIrb).f r1 In~ T_ r% irs~
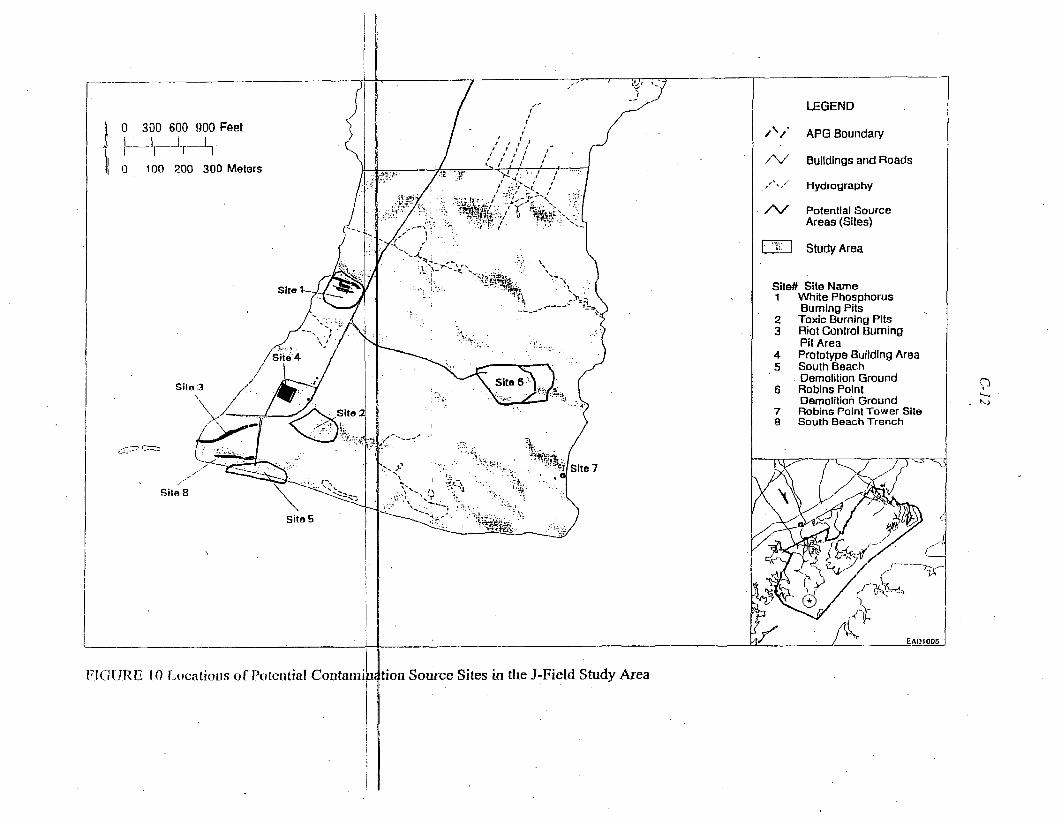
i 0 300 600 900 Feet0 100 200 300 Meters
LEGEND
/\," APG Boundary
7'v/ Buildings and Roads
, Hydrography
~N Potential SourceAreas (Sites)
E Study Area
Site# Site Name1 White Phosphorus
Burning Pits2 Toxic Burning Pits3 Riot Control Burning
Pit Area4 Prototype Building Area5 South Beach
Demolition Ground6 Robins Point
Demolition Ground7 Robins Point Tower Site8 South Beach Trench
Site :3 (7)
czz~
S -ite 8
Site 5
i(JURIE, 1.0 focations of Potential Source Sites in the J-Field Study Area
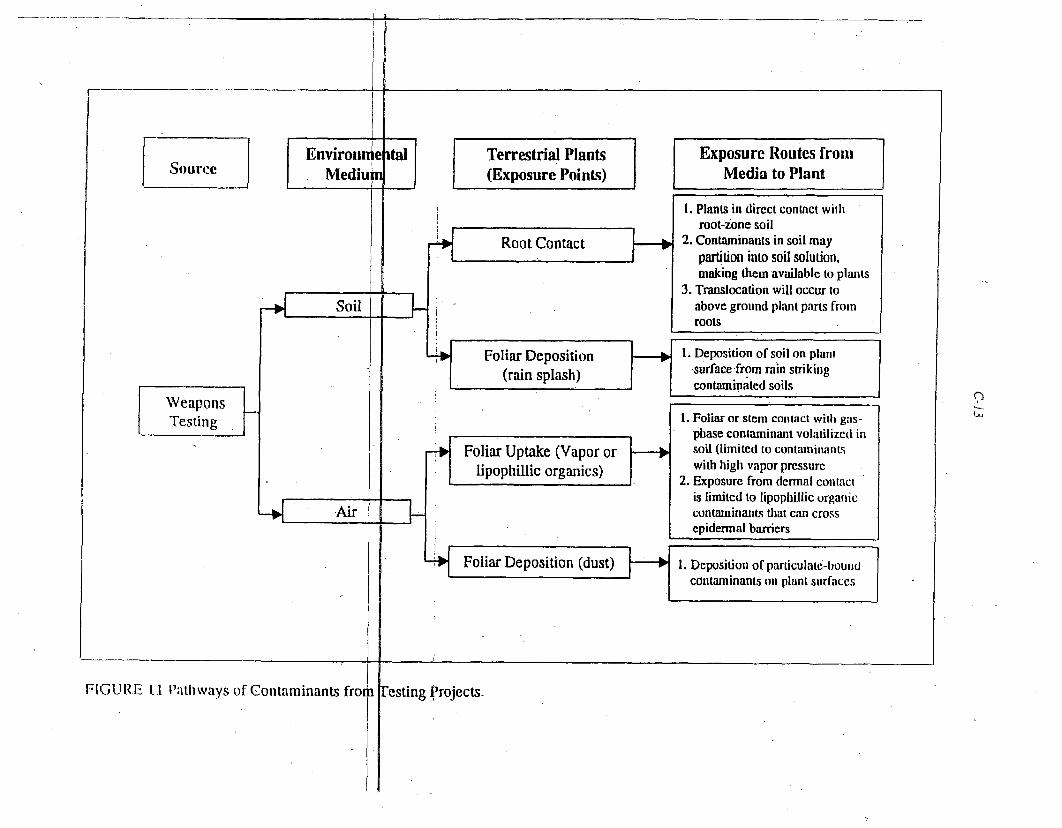
I I
Source
WeaponsTesting
EnvironiMediu
Ifa Terrestrial Plants(Exposure Points)
Exposure Routes fromMedia to Plant
Root Contact H1. Plants in direct contact with
root-zone soil2. Contaminants in soil may
partition into soil solution,making them available to plants
3. Translocation will occur toabove ground plant parts fromrootsE I
1. Deposition of soil on plantsurface from rain strikingcontaminated soils
4.-
Foliar Uptake (Vapor orlipophillic organics) K0
1. Foliar or stein contact with gas-phase contaminant volatilized insoil (limited to contaninantswith high vapor pressure
2. Exposure from dermal contactis limited to iipophillic organiccontaminants that can crossepidermal barriers
1. Deposition of particulate-boundcontaminants on plant surfaces|
.1
FIGURE I 1 Pathways of Contaminants frot projects-
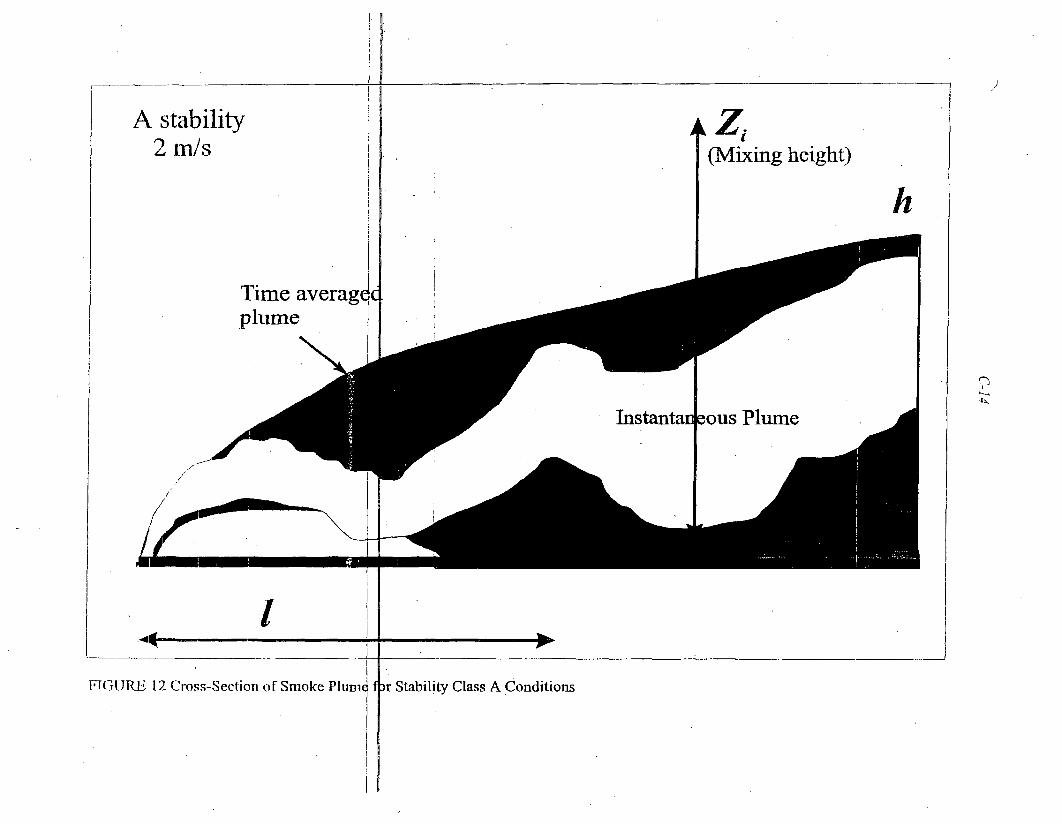
A stability2 m/s (Mixing height)
h
Time averagdcplume
Instantar ous Plume
Ip.-
FIG(IJRE 12 Cro,;s-Section of Smoke Pluni S:)r Stability Class A Conditions
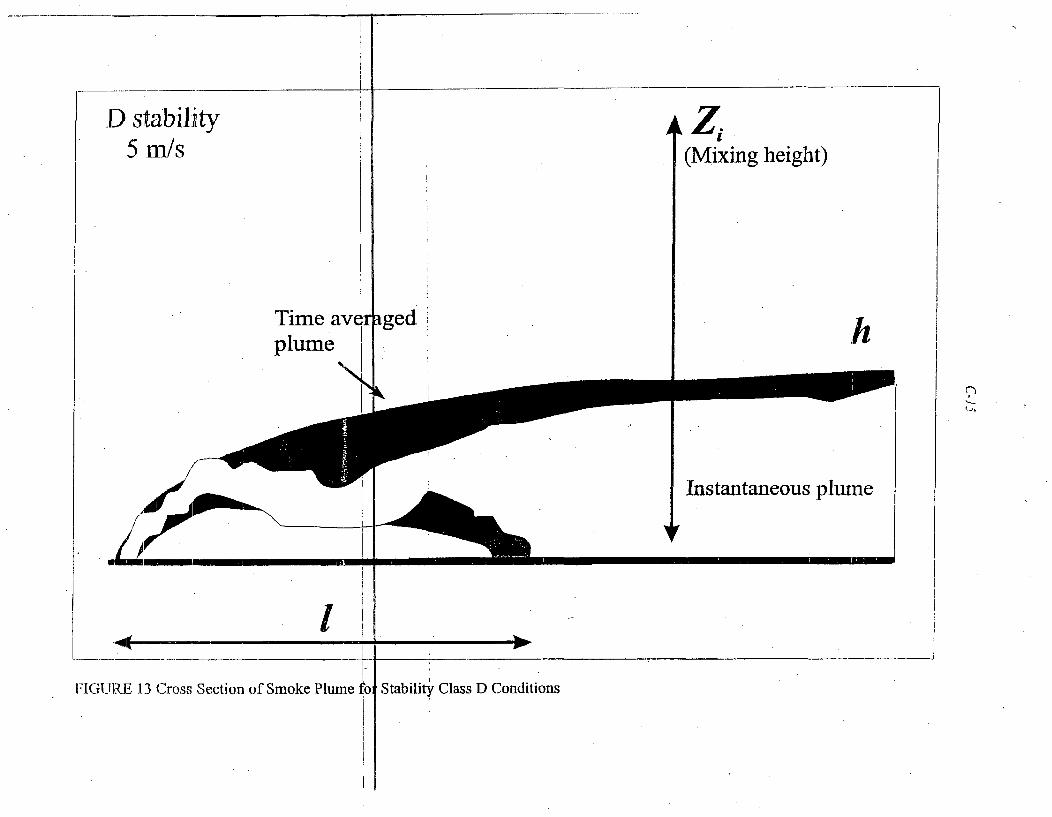
D stability5 mn/s
A(Mixing height)
Timeplume h
Instantaneous plume
FIGURE 13 Cross Section of Smoke Plume Stability Class D Conditions
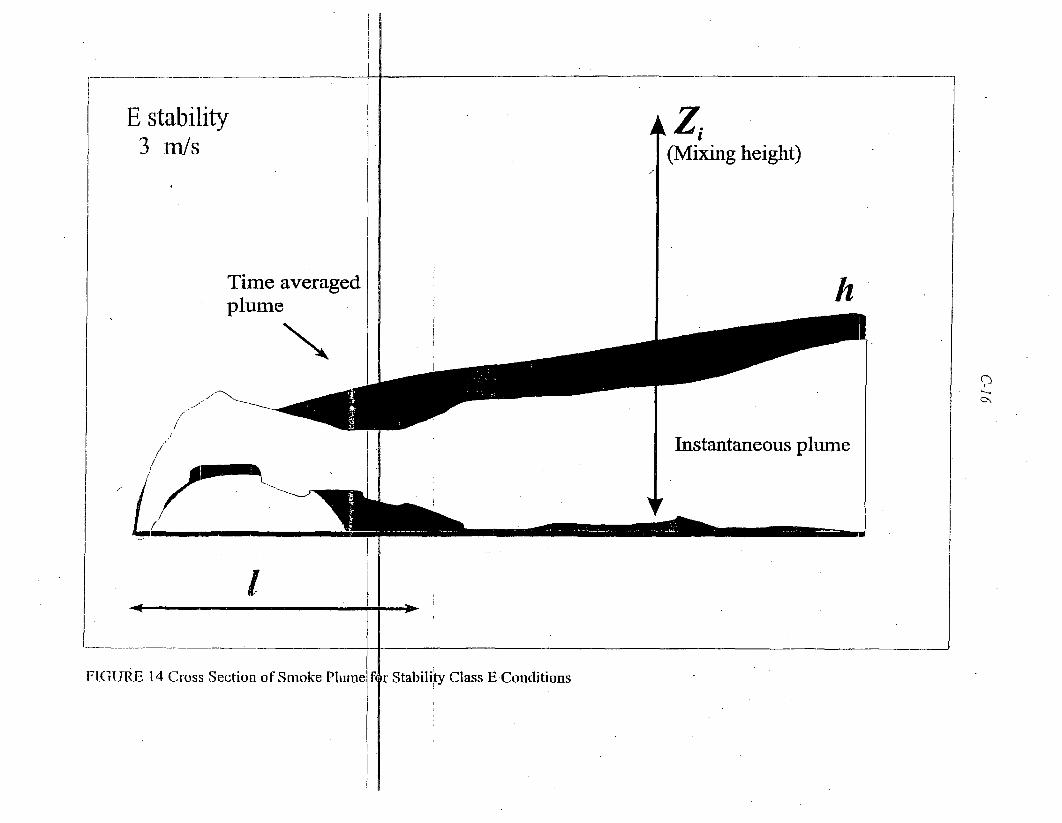
I i
E stability3 m/s
Time averagedplume
A(Mixing height)
h
K/r
/Instantaneous plume
i- I -~-
FIGURE 14 Cross Section. of Smoke Plume ir Stability Class E Conditions
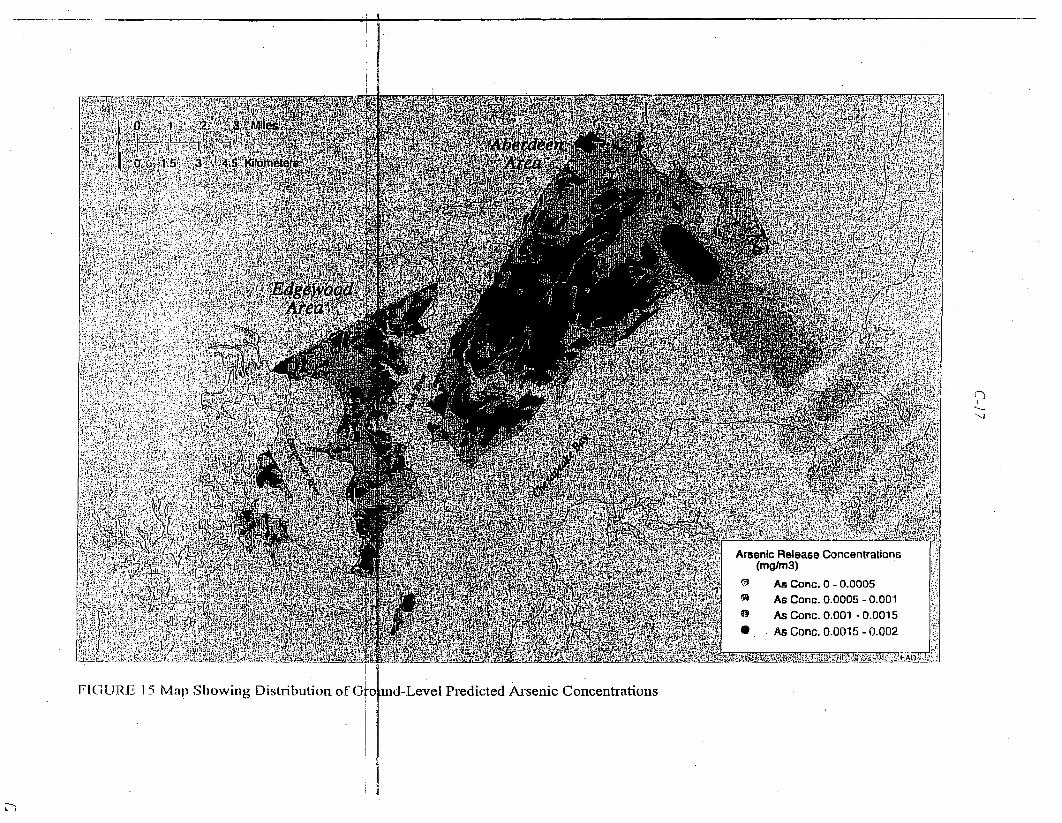
Arsenic Release Concentrations(mglm3)
M As Conc. 0 - 0.0005
S As Conc. 0.0005 - 0.001@ As Conc. 0.001 - 0.0015S As Conc. 0.0015 - 0.002
FIGU URE 15 Map Showing Distribution of (3'0 md-Level Predicted Arsenic Concentrations
M9800491 0
Report Number (14) .. !. / /TP"\ Icl
Pubi. Date'(11)Sponsor Code (18)?-O ,
UC Category (19) c DOQ--C/O
DOE