Embed Size (px)
Citation preview
Ž .Spectrochimica Acta Part B 55 2000 65]73
Absorbance vs. time curves at high heating rates inelectrothermal atomic absorption spectroscopy
G. TorsiU, F.N. Rossi, D. Melucci, P. Reschiglian, C. Locatelli,D. Di Cintio
Department of Chemistry ‘G. Ciamician’, Uni ersity of Bologna, Via F. Selmi 2, I-40126 Bologna, Italy
Received 15 April 1999; accepted 4 November 1999
Abstract
The absorbance vs. time curves that can be obtained in electrothermal atomic absorption spectroscopy with specialatomizers and high heating rates can show a very steep increase of the signal from the baseline at the beginning ofthe atomization step, followed by a more or less extended flat region and by an exponential decay. This type of curvecan be mathematically described by simple equations if rather drastic assumptions are made, i.e. if the atom supply isa delta function, if the absorbing species are homogeneously distributed in a plane at the center of a container ofconstant cross-section, and if the atom removal occurs only by diffusion. In this paper, some experimental curves arepresented which are in satisfactory agreement with the theoretical model, thus supporting the claim that, with ouratomization system and power supply, the existence of the flat region is indeed justified. With a new atomizer,specifically designed, it is possible to measure the diffusion coefficient of atoms in a gas at high temperature.However, for accurate measurements, the model must be refined and better measurements of the temperature of theatomizer must be obtained. Q 2000 Elsevier Science B.V. All rights reserved.
Keywords: Electrothermal atomic absorption spectroscopy; Spectroscopic constant
1. Introduction
The accepted model for describing absorbanceŽ .A vs. time curves in electrothermal atomic
Ž .absorption spectroscopy ETAAS is a convolu-
U Corresponding author. Fax: q39-051-209-9456.
tion integral of a source and removal functionsw x1,2 given by:
t9Ž . Ž . Ž . Ž .N t s S t9 R ty t9 d t9 1H0
Ž . Ž .where N t atom is the number of atoms pre-Ž . Ž .sent in the atomizer at time t s , S t is the rate
0584-8547r00r$ - see front matter Q 2000 Elsevier Science B.V. All rights reserved.Ž .PII: S 0 5 8 4 - 8 5 4 7 9 9 0 0 1 6 8 - 8
( )G. Torsi et al. r Spectrochimica Acta Part B: Atomic Spectroscopy 55 2000 65]7366
Ž . Ž .of atoms production supply function and R t isthe normalized removal function.
Ž . Ž .When S t is fast compared to R t , becomingŽ .at the limit a delta function, Eq. 1 can be
w xsimplified 2 as follows:
tŽ . Ž . Ž . Ž .N t sN 0 R t d t 2H0
Ž .where N 0 is the total number of atoms presentin the injected sample if there are no losses in thepre-atomization steps.
w xAs claimed in our previous papers 6]8,10 ,under the assumption that:
1. all atoms injected, at the beginning of theatomization step, are in the vapor state andhomogeneously distributed in a plane perpen-dicular to the optical source beam;
2. all atoms are found at the center of theŽ .atomizer initial conditions and the atom
concentration at its ends is always zeroŽ .boundary conditions which is equivalent tosay that the atoms are stable only inside it;and
3. only one-dimensional diffusion is consideredw xas the removal mechanism 3,4 ,
then the integral of the removal function can beeasily calculated by integrating the atoms densityalong the tube length as follows:
lŽ . Ž . Ž .R t s n x ,t d x 3H0
where n is the density of the analyte at position xand time t.
The solution of the above equation leads to twomathematical expressions, both giving equivalentresults. These expressions are series which pro-vide the desired accuracy by simply adding terms
w xin the calculations 3,5 .
4Ž . Ž .N t sN 0p
=2 2 eyŽ9 p 2 D t .r l 2
yŽp D t .r le yž 3
eyŽ2 5p 2 D t .r l 2
Ž .q ??? 4/5
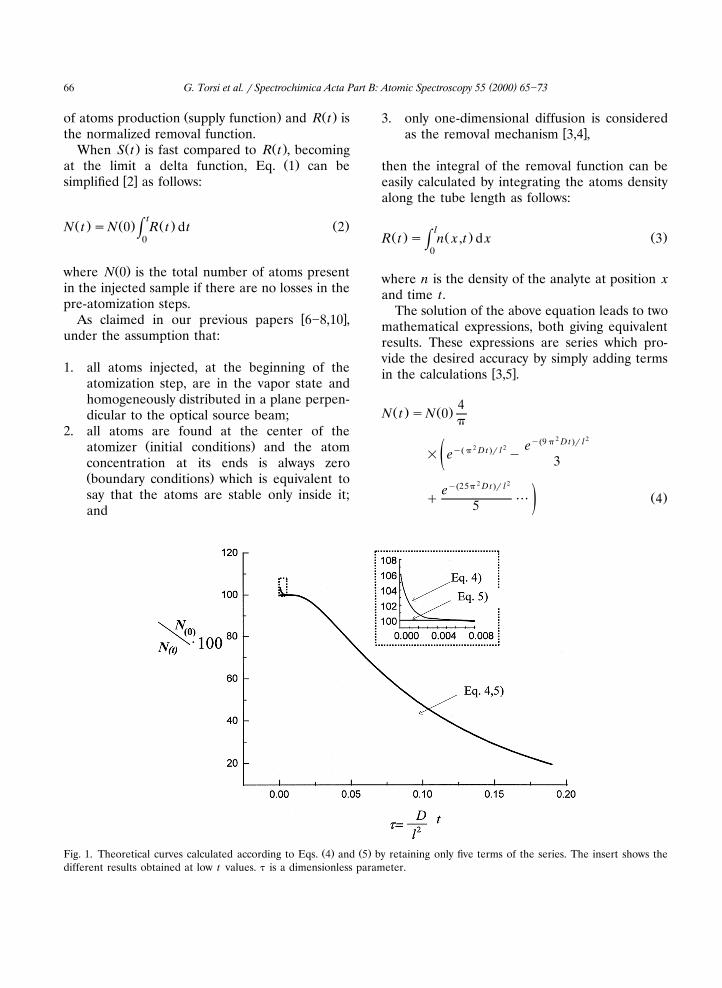
Ž . Ž .Fig. 1. Theoretical curves calculated according to Eqs. 4 and 5 by retaining only five terms of the series. The insert shows thedifferent results obtained at low t values. t is a dimensionless parameter.
( )G. Torsi et al. r Spectrochimica Acta Part B: Atomic Spectroscopy 55 2000 65]73 67
lŽ . Ž .N t sN 0 1y2 erfcž '4 Dt
3l Ž .q2 erfc ??? 5/'4 Dt
Ž 2 y1.In the above equations, D cm s is theŽ .diffusion coefficient of the atoms and l cm the
length of the graphite tube.Fig. 1 shows that there is no difference in anŽ . Ž .N t rN 0 vs. time curve at reasonably high val-
ues of t using five terms in both equations. OnŽ .the contrary, at low t, Eq. 4 results in higher
values than physically possible. Such deviation,which is due to the low number of terms used in
Ž .Eq. 4 , does not influence our results because, atŽ .low t, only Eq. 5 is used.
The experimental data to be compared with thetheoretical curve, are the absorbances measuredevery 9 ms with the Perkin-Elmer Model 1100BAtomic Spectrometer. This sampling period issufficiently low to prevent any distortion of thesignal at the heating rate used.
Ž .The experimental N t values are obtainedthrough the Lambert]Beer law, which in our case
takes the form:
Ž .N tŽ . Ž .A t sk 6S
Ž 2 y1.where k cm atom has been defined in ourprevious works as a spectroscopic constant andrepresents the optical cross-section of the atom. SŽ 2 . Žcm is the geometrical cross-section supposed
.constant of the atomizer. In the same way we canŽ . Ž .define A 0 together with N 0 which is the
Ž . Ž .asymptotic value of N t in Eq. 5 . The simplestŽ .form of Eq. 4 , i.e. when only the first term of the
series is retained, has been extensively used instudying the final portion of the A vs. time curvesobtained with commercial atomizers. In fact at
Ž .sufficiently high t, the other terms of Eq. 4approach zero, making the deviation of the real
Žsituation at ts0 from the ideal conditions allatoms are homogeneously distributed in a small
.volume at the center of the graphite tube lessand less important.
Ž .On the other hand, Eq. 5 has never been usedbecause sufficiently fast sources and appropriateatomizers were not available on the market and
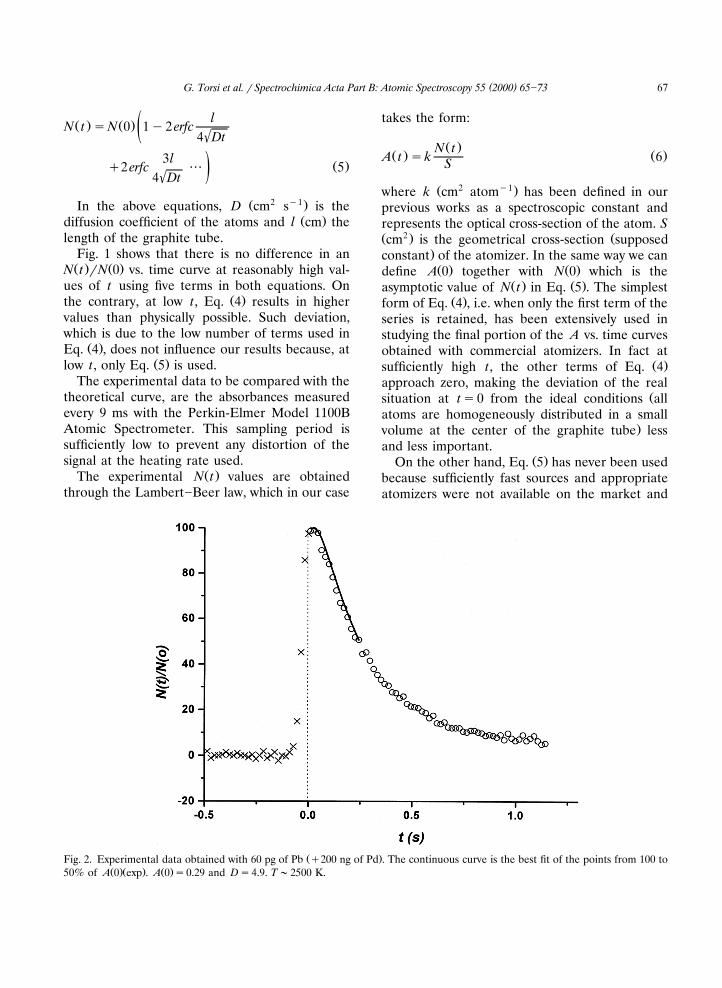
Ž .Fig. 2. Experimental data obtained with 60 pg of Pb q200 ng of Pd . The continuous curve is the best fit of the points from 100 toŽ .Ž . Ž .50% of A 0 exp . A 0 s0.29 and Ds4.9. T;2500 K.
( )G. Torsi et al. r Spectrochimica Acta Part B: Atomic Spectroscopy 55 2000 65]7368
therefore, no experimental data could be used totest the model. Indeed the experimental condi-
Ž .tions are rather demanding when Eq. 5 is used.These conditions can never be met but only moreor less closely approached, because the transfor-mation of the analyte from the condensed phaseon the atomizer surface to the vapor state fol-lowed by its homogeneous distribution in a smallvolume at the center of the atomizer, can neverbe as instantaneous as required by the model. Inthis interval of time, as can be seen from Fig. 2,A is steadily increasing up to a point where, moreor less clearly, it becomes constant.
This interval of time is a function of the heat-Žing rate, the physical state of the analyte as a
solid more or less dispersed or embedded in a.matrix on the surface of the atomizer , the final
temperature of the atomization step and espe-cially the physical characteristics of the analyte, inparticular its volatility. In fact, the limits of ourcurrent atomization system are such that the dataanalyzed in this paper are relevant only to volatileelements like Hg, Cd, Pb and Ag.
There are other elements of rather high volatil-ity like Tl and Bi that can certainly be studiedwith our instrumentation. However, our currentinterest lies in extending the method to thoseelements of medium and relatively low volatilitythrough atomizers of new design and throughdifferent modes of heating.
The aim of this paper is to present the compar-ison between the experimental curves and those
Ž .calculated from Eq. 5 obtained with the newŽ . Ž .Pb and old Hg and Ag atomizers in order toascertain how well the experimental data aredescribed by the rather simple model adopted.
Ž .Moreover, the asymptotic value A 0 thusobtained is used to evaluate the feasibility ofstandardless analysis, already proposed whencurves of this type are obtained. Finally, it will beshown how the experimental data can be con-sidered valid for the measurement of the diffu-sion coefficient of atoms at high temperature.
2. Experimental
The experimental data relevant to Hg and Ag
w xhave already been published 8 and are hereanalyzed with the new model.
The data analyzed with the new atomizer wereobtained in the same way as previously describedw x6,7 . They should give better curves for testingthe model, due to a more homogeneous tempera-ture distribution compared to the previous onesand a more defined value of its length l. The newatomizer is more similar to commercial atomizers,because it is fixed to a base and there is nochange of atomizer during one run. The geomet-rical dimensions are the same because the mostimportant part, i.e. the graphite tube, is the sameŽ ls36 mm; internal and external diameter 3.2
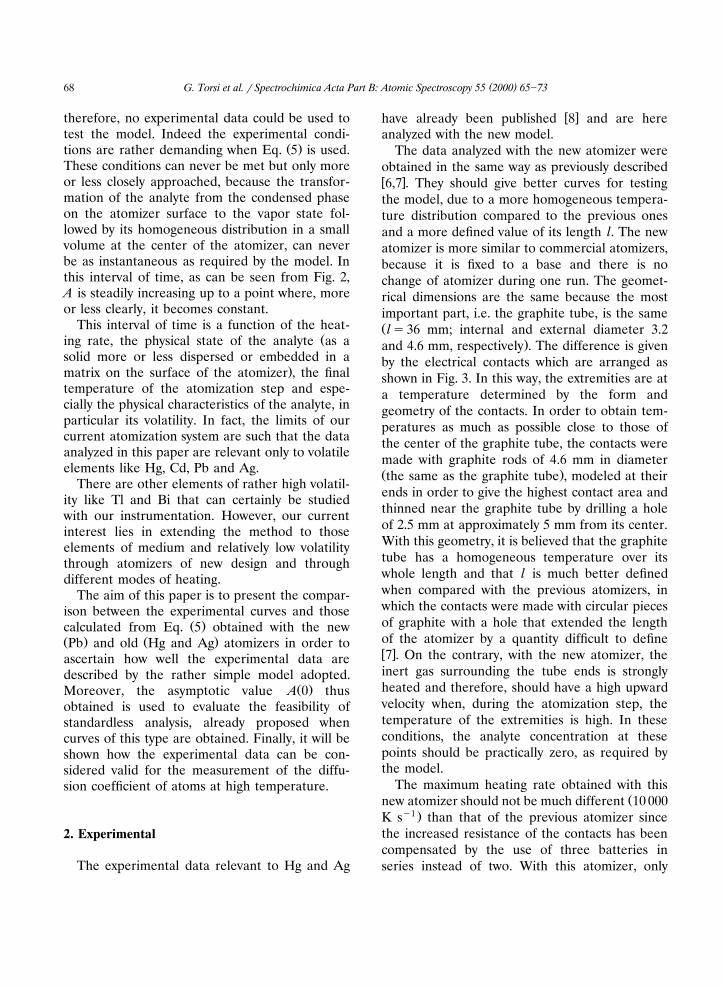
.and 4.6 mm, respectively . The difference is givenby the electrical contacts which are arranged asshown in Fig. 3. In this way, the extremities are ata temperature determined by the form andgeometry of the contacts. In order to obtain tem-peratures as much as possible close to those ofthe center of the graphite tube, the contacts weremade with graphite rods of 4.6 mm in diameterŽ .the same as the graphite tube , modeled at theirends in order to give the highest contact area andthinned near the graphite tube by drilling a holeof 2.5 mm at approximately 5 mm from its center.With this geometry, it is believed that the graphitetube has a homogeneous temperature over itswhole length and that l is much better definedwhen compared with the previous atomizers, inwhich the contacts were made with circular piecesof graphite with a hole that extended the lengthof the atomizer by a quantity difficult to definew x7 . On the contrary, with the new atomizer, theinert gas surrounding the tube ends is stronglyheated and therefore, should have a high upwardvelocity when, during the atomization step, thetemperature of the extremities is high. In theseconditions, the analyte concentration at thesepoints should be practically zero, as required bythe model.
The maximum heating rate obtained with thisŽnew atomizer should not be much different 10 000
y1 .K s than that of the previous atomizer sincethe increased resistance of the contacts has beencompensated by the use of three batteries inseries instead of two. With this atomizer, only
( )G. Torsi et al. r Spectrochimica Acta Part B: Atomic Spectroscopy 55 2000 65]73 69
Fig. 3. Sketch of the atomizer showing its side contacts.
graphite tubes of 36 mm length were used while,with the old atomizers, measurements were madewith graphite tubes of 36 and 50 mm in length.
Sample introduction, also in the case of thenew atomizer, was made with a bridge, whichcould slide on the rims of the Plexiglas base, towhich a 5-ml Gilson pipette was fastened. Thepipette tip was substituted by a Teflon tubing of 1mm external diameter. This tip could be insertedinside the graphite tube in order to deliver thesample solution at its center. All other conditions
w xwere those already described 6,7 .
3. Results and discussion
3.1. Best fit procedure
After having obtained an experimental curve,which is a series of A values as a function of
Ž .time, one must find the best values of A 0 and DŽ . Žwhich fit Eq. 5 the data of Fig. 2 were obtained
with the new atomizer and therefore l was con-.sidered constant and equal to 3.6 cm . The start-
ing values were chosen in the following way.
1. The points that were judged as belonging tothe part of the curve, after the beginning ofthe atomization step, where A is supposedpractically constant, were summed and aver-
Ž .Ž .aged. This value was called A 0 exp . Thereason why A is, in this interval, consideredonly practically constant follows from the fact
w Ž .xthat mathematically see Eq. 5 A is neverŽ .constant and A 0 is only an asymptotic value.
Ž .2. The starting time ts0 is taken as the timeŽ .Ž .of the first point at which AGA 0 exp .
3. The starting value of Drl 2 was determinedby the slope of the plot ln A vs. t in the
Ž .Ž .interval of A from 80 to 20% of A 0 exp byŽ .using Eq. 4 while retaining only the first
term.
The points used for the best fit were from ts0to the value of t at which A is a given, chosen
Ž .Ž .fraction of A 0 exp . The fitting program wasŽ .then run to obtain the best values of A 0 and
Drl 2. A difference no higher than 1% was foundŽ .Ž . Ž .between A 0 exp and A 0 if the plateau in the
atomization curve is recognizable and the finalŽ .Ž .point used is 20% higher than A 0 exp . The
values of Drl 2 were generally decreasing with anŽincrease of the number of points considered see
.Table 2 . Practically, for a fixed starting pointts0, no difference was found between the initialand final values when the starting values ofŽ .Ž . 2A 0 exp and Drl were changed by "20%. It is
obvious that, with this procedure, the most criti-cal choice is that of ts0.
3.2. Validation of the model
The validation of the model was accomplishedby comparing the experimental data with thetheoretical curves. Figs. 4 and 5 show the experi-mental data obtained in our laboratory with old
w xatomizers 7,8 together with the best-fit curvesobtained as described above. These data areshown here because only with these atomizersdata, at different tube lengths and at differentpressures, are available. It is clear that, apartfrom the expected steady increase of A at thebeginning of the atomization step, which cannotbe considered in the model adopted and is, there-
( )G. Torsi et al. r Spectrochimica Acta Part B: Atomic Spectroscopy 55 2000 65]7370
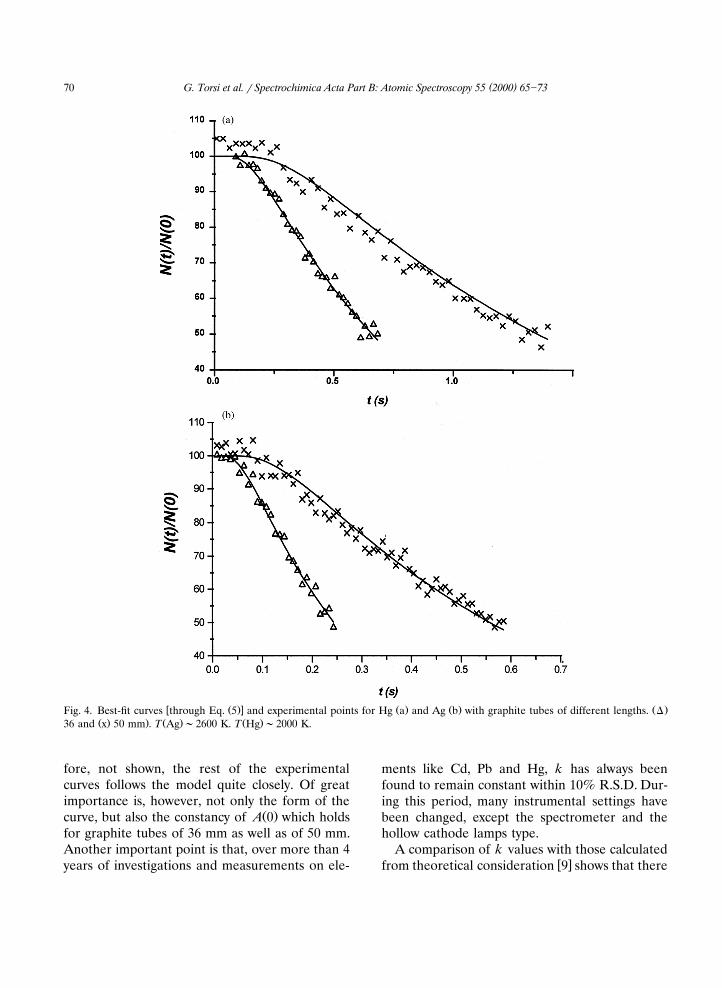
w Ž .x Ž . Ž . Ž .Fig. 4. Best-fit curves through Eq. 5 and experimental points for Hg a and Ag b with graphite tubes of different lengths. DŽ . . Ž . Ž .36 and x 50 mm . T Ag ;2600 K. T Hg ;2000 K.
fore, not shown, the rest of the experimentalcurves follows the model quite closely. Of greatimportance is, however, not only the form of the
Ž .curve, but also the constancy of A 0 which holdsfor graphite tubes of 36 mm as well as of 50 mm.Another important point is that, over more than 4years of investigations and measurements on ele-
ments like Cd, Pb and Hg, k has always beenfound to remain constant within 10% R.S.D. Dur-ing this period, many instrumental settings havebeen changed, except the spectrometer and thehollow cathode lamps type.
A comparison of k values with those calculatedw xfrom theoretical consideration 9 shows that there
( )G. Torsi et al. r Spectrochimica Acta Part B: Atomic Spectroscopy 55 2000 65]73 71
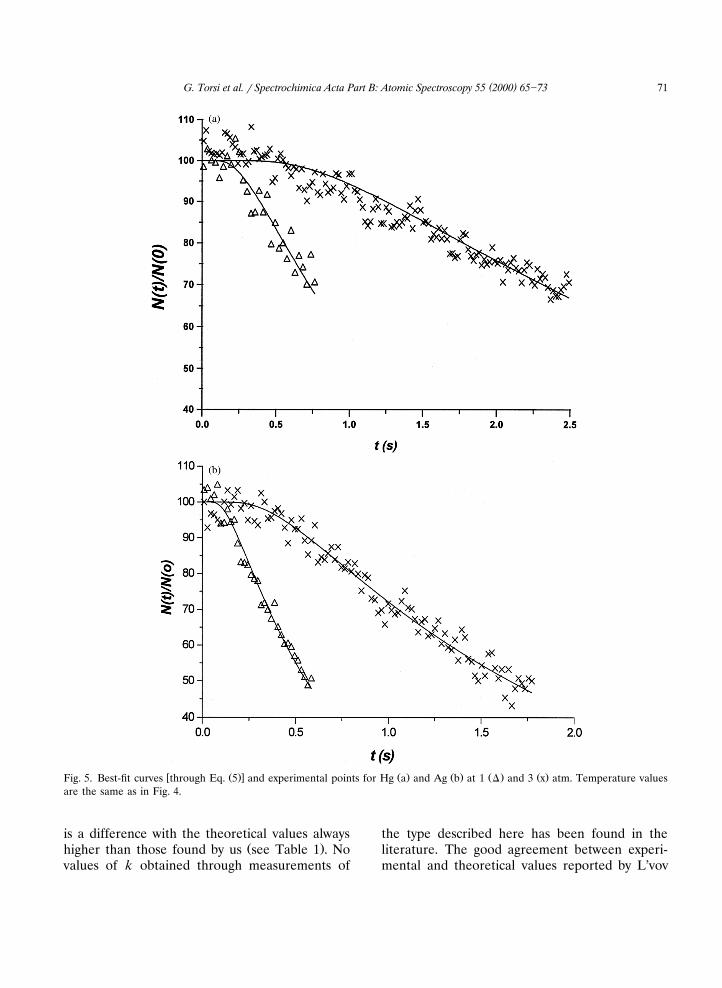
w Ž .x Ž . Ž . Ž . Ž .Fig. 5. Best-fit curves through Eq. 5 and experimental points for Hg a and Ag b at 1 D and 3 x atm. Temperature valuesare the same as in Fig. 4.
is a difference with the theoretical values alwaysŽ .higher than those found by us see Table 1 . No
values of k obtained through measurements of
the type described here has been found in theliterature. The good agreement between experi-mental and theoretical values reported by L’vov
( )G. Torsi et al. r Spectrochimica Acta Part B: Atomic Spectroscopy 55 2000 65]7372
Table 113 2 y1Ž .k values=10 cm atom
Element Theoretical values Experimental values
1 atm 3 atm 1 atm 1 atm 3 atma a a36 mm 50 mm 50 mm
Ag 7.5 3.6 6.7 3.1Cd 20 7.6 13 13 6.8Hg 0.17 0.09 0.06 0.07 0.07Pb 1.5 1.0 1.1
a Length of the graphite tube. Temperature(2500 K.
w x9 , where peak areas are considered, could beattributed to a combination of systematic errorsw x10 . The discrepancies between the theoreticaland the experimental data must, therefore, awaita more detailed knowledge of the line profiles ofthe source and the absorber. Another problemobserved with Hg and related to the line profile,is the practical constancy of k with pressurewhich is not explained by the accepted modeleven when the hyperfine structure of the line is
w xtaken into account 8 .
3.3. Measurements of D
As reported before, the value of D can becalculated from the experimental data obtainedwith the new atomizer. Table 2 collects a series ofD values, calculated using different portions ofthe same experimental curve. It is clear that thevalue of D is not constant. It is almost always
Ž .found that, using Eq. 5 , D decreases by increas-ing the number of points considered. The inter-pretation of this trend points to the inadequacy ofthe model, which assumes that all the atoms atts0 are homogeneously distributed in a plane atthe center of the atomizer and that diffusion isthe only removal mechanism. However, this can-not be true because, as already observed, there isan interval of time during which the atoms arevaporized and uniformly distributed. Moreover, aslong as the temperature of the atomizer wallsincreases, there will be a corresponding increasein the volume, with a not yet defined time lag, ofthe inert gas present, to which must be added afurther increase due to the gases formed duringthe atomization step. Therefore, the apparent
decrease of D can be explained as a decrease ofthe convection removal mechanism proportional
wŽ . x w x w xto dTrd t rT 11,12 . As already calculated 3w xand found 13,14 with other atomizers, the inci-
dence of convection, as seen by the change of Din the first three lines of Table 2, seems rathersmall also with our present system. At large times,convection should be practically negligible. Withthe current atomization system, any increase inthe temperature should stop after about 0.1 sŽ .plus the above cited time lag , assuming that thefinal temperature is 10008 higher than the ashingtemperature and the heating rate is 10 000 K sy1.The best points for measuring a true value of D
Ž .are, therefore, the middle points 80r20% of thecurve where the influence of convection and apotentially wrong choice of the baseline areminimized.
The values shown in Table 2 are in relativelysatisfactory agreement with those that can be
Table 22 y1 aŽ .D values cm s for Pb and Cd in Ar
Points used Pb Cd
(2700 K (2200 K (2100 K
b100]70% 5.6 4.3 3.6b100]50% 5.1 4.1 3.6b100]20% 5.1 3.9 3.6c80]20% 5.3 4.1 3.6c50]15% 5.1 4.2 3.7c30]10% 5.4 4.3 3.9
a w x Ž .The values calculated from L’vov 9 are: Pb 2700 K : 5.4;Ž . Ž .Pb 2200 K : 3.7; and Cd 2100 K : 4.6.b Ž .D from the best fit obtained using Eq. 5 .c Ž . ŽD from the slope obtained using Eq. 4 retaining only
.the first term .
( )G. Torsi et al. r Spectrochimica Acta Part B: Atomic Spectroscopy 55 2000 65]73 73
calculated by extrapolating data obtained at loww xtemperature 9 . It is, however, necessary to point
out that also the temperatures of the atomizationstep, given in Table 2, have a low accuracybecause of the rather long extrapolation used in
w xobtaining those values 15 . Moreover, it is dif-ficult to maintain a pyrometric system well cali-brated. A better and more meaningful compar-ison must therefore await for a more refinedmodel in which convection is taken into accountand the accuracy of the temperature measure-ment is improved.
On the other hand, it is worth stressing thatthese deficiencies are important only if a veryprecise value of D is sought, but are of little
Ž . Ž .relevance if one measures A 0 , since A 0 is notrelated to D. The importance, for us, of measur-
Ž .ing A 0 stems from the fact that, if there are noŽ .losses in the pre-atomization steps, then N 0 is
the number of atoms injected: as a consequence,provided that k is known, standardless analysis is
Ž .possible. As already mentioned, A 0 remainspractically constant in the fitting procedure, itsvariation being well within the noise level of ourmeasurements.
4. Conclusions
It has been shown that a simple model describ-ing the A vs. time curves, in which only diffusionis considered, gives good agreement with theexperimental curves obtained with our atomiza-tion system in ETAAS. The agreement is remark-
Ž .ably good for the values of A 0 while is not asgood for the diffusion coefficient D, due to thesimultaneous presence of convection as an addi-tional removal mechanism.
The data presented clearly support our claimŽ .that A 0 , found as the asymptotic value resulting
from a best-fit procedure, is given by the simulta-neous presence of all atoms injected in the opti-cal beam. As a consequence, the statement can
be made that the method proposed has the high-est sensitivity that can be obtained with this typeof measurement. Finally, once the spectroscopic
Ž .constant optical atomic cross-section of the lineunder study is known, standardless analysis ispossible.
Acknowledgements
We thank Prof. S. Paveri-Fontana and Prof. N.Omenetto for their helpful suggestions. This workhas been partially supported by the University of
Ž .Bologna Fund for Selected Research Topics .
References
w x1 S.L. Paveri-Fontana, G. Tessari, G. Torsi, Anal. Chem.Ž .46 1974 1032.
w x2 W.M.G.T. van den Broek, L. de Galan, Anal. Chem. 49Ž .1977 2176.
w x3 A.K. Gilmutdinov, I.S. Fishman, Spectrochim. Acta PartŽ .B 39 1984 171.
w x4 H. Falck, C. Schnurrer, Spectrochim. Acta Part B 44Ž .1989 759.
w x5 H.S. Carslaw, J.C. Jaeger, Conduction of Heat in Solids,Oxford Press, 1959, p. 53.
w x6 G. Torsi, P. Reschiglian, F. Fagioli, C. Locatelli, Spec-Ž .trochim. Acta Part B 48 1993 681.
w x7 G. Torsi, S. Valcher, P. Reschiglian, L. Cludi,Ž .L. Patauner, Spectrochim. Acta Part B 50 1995 1679.
w x8 F.N. Rossi, D. Melucci, C. Locatelli, P. Reschiglian, G.Torsi, A. Millemaggi, Fresenius J. Anal. Chem. 361Ž .1998 504.
w x Ž .9 B.V. L’vov, Spectrochim. Acta Part B 45 1990 633.w x10 G. Torsi, F. Fagioli, S. Landi, P. Reschiglian, C. Lo-
catelli, F.N. Rossi, D. Melucci, T. Bernardi, Spec-Ž .trochim. Acta Part B 53 1998 1847.
w x Ž .11 J.A. Holcombe, Spectrochim. Acta Part B 48 1983 609.w x12 S.L. Paveri-Fontana, G. Tessari, Prog. Anal. Atom.
Ž .Spectrosc. 7 1984 243.w x13 W. Frech, B.V. L’vov, Spectrochim. Acta Part B 48
Ž .1993 1371.w x14 C.M.M. Smith, J.M. Harnly, J. Anal. Atom. Spec. 10
Ž .1995 187.w x Ž . Ž .15 G. Torsi, G. Bergamini, Ann. Chim. Rome 79 1989
45.
![304 CHARACTERIZATION OF RNAs [22] [22] Absorbance Melting ... · 304 CHARACTERIZATION OF RNAs [22] [22] Absorbance Melting Curves of RNA By JOSEPH D. PUGLISl and IGNACIO TINOCO, JR](https://img.pdfslide.net/doc/110x75/5e3846006e653b56704ad96a/304-characterization-of-rnas-22-22-absorbance-melting-304-characterization.jpg)

![Research Article EVALUATION OF ANTI-INFLAMMATORY … · Percentage inhibition= [(absorbance of blank – absorbance of sample)/(absorbance of blank)]×100 1 In-vitro anti-inflammatory](https://img.pdfslide.net/doc/110x75/5e832a1607bd17145979ab05/research-article-evaluation-of-anti-inflammatory-percentage-inhibition-absorbance.jpg)