Embed Size (px)
Citation preview
ACCELERATING FINANCIAL INCLUSION IN SOUTH-EAST ASIA WITH DIGITAL FINANCEASIAN DEVELOPMENT BANK
TABLE OF CONTENTS
PREFACE 3
EXECUTIVE SUMMARY 4
1 INTRODUCTION 7
2 CURRENT SITUATION AND OPPORTUNITY 9
3 FRAMEWORK TO IDENTIFY BARRIERS TO FINANCIAL INCLUSION 11
4 IMPACT OF DIGITAL FINANCE 18
5 QUANTIFYING THE IMPACT OF DIGITAL IN FINANCIAL INCLUSION 41
6 SEGMENT-SPECIFIC INSIGHTS 43
7 COUNTRY-SPECIFIC INSIGHTS 50
8 CONCLUDING REMARKS 65
9 APPENDIX 67
2
PREFACE
Supporting financial sector development has been a strategic priority for ADB over the past
several decades because of the critical role the financial sector plays in facilitating economic
growth. ADB’s long-term strategic framework, “Strategy 2020,” emphasizes financial
inclusion as an essential part of financial sector development: Without access to formal
financial services, the unserved and underserved segments of society will be excluded from
growth and its benefits.1 Digital finance presents a potentially transformational opportunity
to advance financial inclusion.
ADB engaged Oliver Wyman and MicroSave to conduct the following study on the role
digital finance can play in accelerating financial inclusion, focusing on four Southeast Asian
markets – Indonesia, the Philippines, Cambodia, and Myanmar. This study – informed by
more than 80 stakeholder interviews across the four markets, extensive secondary research,
and economic analysis – is an endeavour to better understand and quantify the nature of
this impact.
Oliver Wyman is a global leader in management consulting with a specialization in
financial services. As a recognized thought leader in financial inclusion and digital finance,
Oliver Wyman has a strong body of client work covering a broad range of financial
institutions, regulators, and multilateral agencies.
MicroSave is a globally recognized research and consulting firm committed to promoting
financial access amongst low- and middle-income populations. With over two decades of on-
the-ground experience across Africa, Asia and the Pacific, MicroSave has worked with public
and private sector organizations to guide business strategies, re-engineer processes, and
develop customer-centric products.
1 ADB. 2008. “Strategy 2020: The Long-Term Strategic Framework of the Asian Development Bank,” 2008 – 2020. Manila; and ADB. 2014. “Midterm Review of Strategy 2020: Meeting the Challenges of a Transforming Asia and Pacific,” Manila
3
EXECUTIVE SUMMARY
Financial inclusion refers to the delivery of formal financial products and services to all
segments of a population irrespective of their economic situation. Between 2011 and 2014,
bank account ownership worldwide increased from 51% to 62%,2 showing significant
progress in extending access to formal financial services (FS), despite substantial imbalances
across geographic boundaries and between genders. Promoting the use of formal financial
services continues to be a challenge, and the depth of engagement varies with different
financial products: Only 18% of adults use a bank account to receive wages or pay utility bills,
and only 11% borrow from formal sources.
Our research focuses on financial exclusion in three segments: base of pyramid (BoP);
women; and micro, small, and medium enterprises (MSMEs). From our research, we
estimate that addressing this opportunity could increase Gross Domestic Product (GDP)
by between 9% and 14%, even in relatively large economies such as Indonesia and the
Philippines. The potential boost to GDP is as high as 32% in Cambodia. Making the most
of this opportunity could also help influence the future shape of the financial services
industry, particularly in smaller markets such as Cambodia and Myanmar, where only a
small percentage of the current needs for financial services are met by formal providers.
In Cambodia, for example, formal institutions meet only 16% of the demand for savings
facilities from people in the financial inclusion target segment.
Taking this opportunity will require action from regulators, public policymaking institutions,
and supply-side participants to address structural issues impeding financial services growth
in these segments. On the supply side, resource and investment mobilization continue to be
held up by the unattractive economics of serving the three segments. For target customers,
the solutions offered by the formal financial services sector often do not appear attractive
enough as alternatives to existing informal solutions – partly because of their low level of
financial literacy and overall awareness. For public policymaking institutions, the base-
of-pyramid population is challenging because there are often conflicts between social,
economic, and political priorities.
Our research finds that digital financial solutions could play a significant part in closing
gaps in financial inclusion. They could address about 40% of the volume of unmet demand
for payments services and 20% of the unmet credit needs in the BoP and MSME segments.
Digital finance alone cannot entirely close the gaps in financial inclusion. But we estimate
that the cumulative effect of digitally driven acceleration in financial inclusion could boost
GDP by 2% to 3% in markets like Indonesia and the Philippines, and 6% in Cambodia. For the
population earning less than $2 a day, that would translate to a 10% increase in income in
Indonesia and the Philippines, and an increase of around 30% in Cambodia.
2 Global Findex Database; Percentage of adult population with bank accounts
4
Digital solutions will have the most significant positive impact on financial inclusion in five
key areas:
• They can enable fast, low-cost, and convenient customer identification and verification processes – especially when powered by unique national identification numbers, a real-time verification infrastructure, and supporting regulatory frameworks such as tiered know-your-customer (KYC) schemes.
• They can meaningfully alter the economics of the supply side by addressing last-mile distribution and servicing issues through low-cost, widespread, digitally-enabled points of physical access such as mobile phones and point-of-sale (POS) devices.
• They are prevalent throughout the payments value chain and ecosystem. Digital government-to-person (G2P)3 payments and remittance flows can create the initial momentum for electronic payments, thereby supporting the development of viable supply-side business cases. These can be sustained and further developed through person-to-all (P2All)4 payments systems combined with interoperable networks and open application programming interface (API) platforms.
• They can significantly enhance access to credit by using alternative sources of data, such as payment transactions and telecoms data, as well as analytics. These improve customer profiling, credit risk assessment and fraud detection.
• Savings can be mobilized digitally through alternative, lower-cost origination and distribution channels and more-convenient product designs, such as mobile wallets connected to savings accounts and intuitive goal-based savings products. An easy KYC and onboarding process can also contribute.
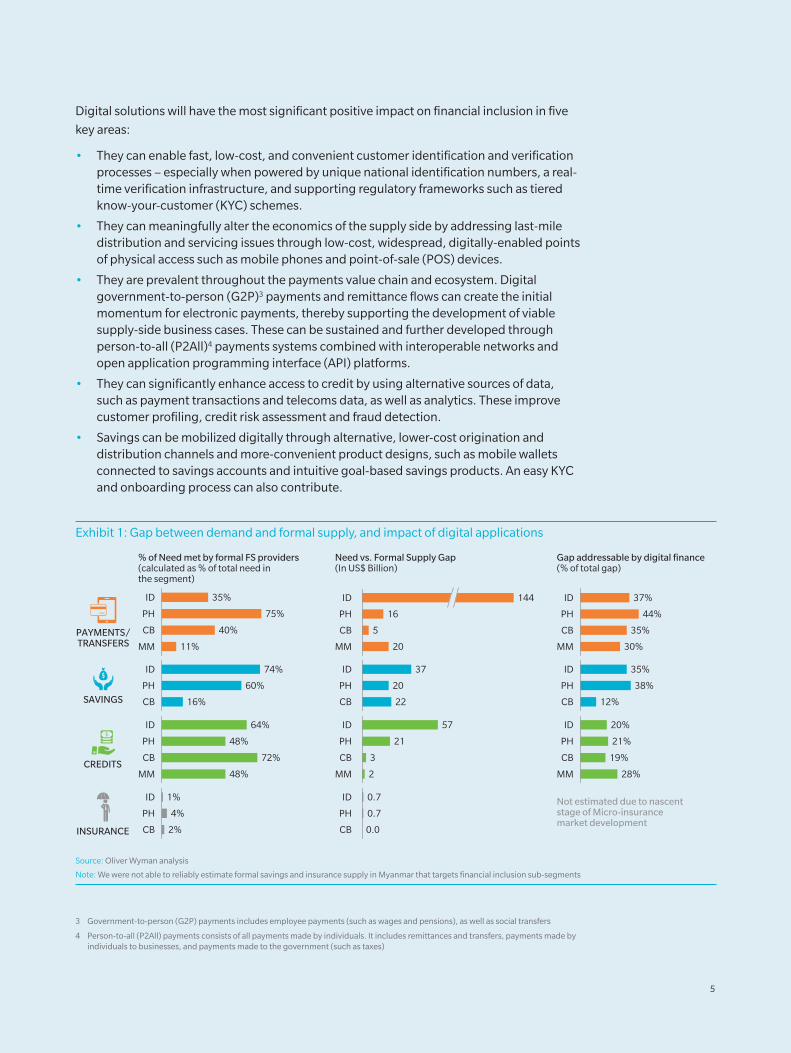
Exhibit 1: Gap between demand and formal supply, and impact of digital applications
Need vs. Formal Supply Gap(In US$ Billion)
PH 16
MM 20
CB 5
ID 144
PH 20
CB 22
ID 37
PH 21
MM 2
CB 3
ID 57
PH
CB
ID
0.7
0.0
0.7
Gap addressable by digital finance (% of total gap)
Not estimated due to nascentstage of Micro-insurancemarket development
PH
ID
12%CB
38%
35%
MM
CB 35%
ID
PH 44%
30%
37%
ID 20%
PH 21%
CB 19%
MM 28%
% of Need met by formal FS providers (calculated as % of total need inthe segment)
2%
4%
1%ID
PH
CB
PH
ID
MM
CB
75%
35%
11%
40%
PH
CB
ID
60%
74%
16%
48%
ID
PH
MM
CB
64%
48%
72%
SAVINGS
CREDITS
PAYMENTS/TRANSFERS
INSURANCE
Source: Oliver Wyman analysis
Note: We were not able to reliably estimate formal savings and insurance supply in Myanmar that targets financial inclusion sub-segments
3 Government-to-person (G2P) payments includes employee payments (such as wages and pensions), as well as social transfers
4 Person-to-all (P2All) payments consists of all payments made by individuals. It includes remittances and transfers, payments made by individuals to businesses, and payments made to the government (such as taxes)
5
Since much digital enablement will be driven by the supply side, regulatory and public policy
actions will play a significant role in creating a favourable environment. We see a particular
need for action in three areas. (See Section 4 for a more comprehensive list of specific
regulatory actions)
• Supply-side entry barriers: Create a level playing field by allowing collaboration and competition between traditional financial services players and new types of supply-side participant such as mobile network operators (MNOs).
• Suitable solution design and delivery: Develop a “safe space” for businesses to test new ideas in a live environment with a regulatory sandbox approach; provide clear guidance on the development and role of agent networks, and allow different supply-side operators to use these alternative channels; and promote frictionless payment channels and network infrastructure, for example by advocating and mandating interoperability between mobile money platforms.
• Shared vision: Produce a unified roadmap for financial inclusion in order to focus the efforts of various stakeholders; and put in place a governance mechanism to facilitate coordination and ensure accountability for action in all relevant government departments.
While digital innovation can provide a significant boost to financial inclusion, digital finance
also presents regulators with new challenges. They are charged with protecting consumers
in a rapidly changing and increasingly complex supply-side ecosystem, as well as dealing
with the growing risks related to data governance. The data generated by individuals’ digital
footprints is increasing exponentially and includes, for example, whom they call, what they
write in texts, whom they engage with on social media, what they buy, and which websites
they visit. This raises a variety of data governance issues relating to how data is accessed,
used, stored, and shared. Addressing these issues requires coordination between regulators.
The BoP is a particularly vulnerable segment given its low awareness of these issues, its
lack of alternative options (for accessing credit, for example), and the difficulty it has in
voicing grievances effectively. Public policy will play a vital role in consumer education and
protection, by articulating the responsibilities of supply-side participants through suitable
policies and regulations, as well as ensuring compliance.
6
1. INTRODUCTION
Financial inclusion means that all segments of a population – even those with the lowest
incomes – can access formal financial products and services. The financially excluded
comprise both the unbanked and the underbanked. While financial inclusion is often
measured as the percentage of the population with a bank account, in fact several
dimensions of financial inclusion need to be considered.
• Access to formal financial services does not necessarily imply making use of them. More than half (54%) of the adults in the poorest 40% of households remain unbanked. Access to credit from formal channels and use of insurance solutions are significantly lower. Only 18% of adults use a bank account to receive wages and pay utility bills. Just 27% of adults save formally and 11% borrow formally. Consequently, our analysis considers both the breadth and depth of financial inclusion, by quantifying unmet needs in payments, savings, credit, and insurance.
• Significant imbalances in financial inclusion exist within markets. Differences exist between regions, between urban and rural areas, and between men and women: Global data show that only 58% of women have an account, compared to 65% of men.5
Digital technology has already emerged as a game-changing enabler across many
industries, and is now beginning to create a similar impact in financial services. A 2016
report by Oliver Wyman estimates that digital technology could result in $1 trillion of
increased revenue and cost savings, equivalent to about 17% of global financial services
industry revenue.6 Digital financial services (DFS) have the potential to make a large impact
in financial inclusion, as already evidenced by progress in some African markets. In Tanzania,
for example, 17.3% of adults had a bank account in 2011, rising to 39.8%7 in 2014. The Bank
of Tanzania attributed the rise to innovation in the financial sector and, in particular, the
use of mobile phones to access financial services – there were 19 million active users in the
country as of the end of December 2015.8
In this paper, we focus specifically on areas where digital financial services have significant
potential to accelerate financial inclusion through their impact on existing business models.
We also provide recommendations for governments and regulatory authorities on how to
encourage the development of digital financial services to increase inclusion. In particular,
we examine financial inclusion at the base of the pyramid,9 for women, and for MSMEs in four
Southeast Asian markets: Indonesia, the Philippines, Cambodia, and Myanmar. Southeast
Asia was chosen as a geographic focus because the region represents a microcosm of the
emerging markets universe, with countries at various stages of development. The four
markets chosen for this study represent the diverse market structures and development
5 http://datatopics.worldbank.org/financialinclusion/indv-characteristics/gender
6 The financial services industry is worth US$5.7 trillion in revenues (Oliver Wyman 2016, “Modular Financial Services – the new shape of the industry”)
7 Global Findex database
8 http://allafrica.com/stories/201602120505.html
9 The base-of-the-pyramid segment has been defined as individuals earning less than $5 a day
7
stages we see across Southeast Asia. At one end, Indonesia is a major global economy, where
financial inclusion efforts have largely been driven by state-owned banks and the digital
economy has started to emerge. At the other end, Cambodia’s economy is one-fortieth
the size of Indonesia’s, and financial inclusion has largely been served by Microfinance
Institutions (MFIs). This allows us to draw out common themes that may resonate in other
emerging markets, as well as important market-specific nuances that may only apply to a
narrower group.
This paper is structured as follows:
• Quantifying the opportunity: Our approach quantifies the differences between supply and needs, showing the significant gaps between access to formal financial services and use of them.10
• Framework to identify barriers to financial inclusion: We apply a consistent evaluation framework to eight key barriers (both cross-product and product-specific) to identify challenges and constraints in each country.
• The impact of digital finance:11 We use value chain analysis in payments, savings, credit, and insurance to determine where digital innovation could have the most significant impact in breaking down barriers to financial inclusion. We also highlight how regulation and public policy can encourage these solutions.
• Quantifying the impact: We estimate how far the gap between needs and formal supply can be narrowed through digital innovation and the potential boost from financial inclusion to a country’s GDP.
• Country-level analysis: For each of the four countries selected, we estimate the potential impact of and analyse key barriers to financial inclusion, quantify the impact of digital finance, and recommend regulatory and public-policy enablers.
• Concluding remarks
10 Access refers to the ability of individuals or enterprises to obtain financial services, while usage refers to the frequency of access
11 Digital finance refers to the use of digital technology to disrupt and disintermediate, with the potential to disaggregate the banking value chain. (Refer to Section 4 for further details.)
8
2. CURRENT SITUATION AND OPPORTUNITY
Access to formal financial services has improved significantly, with worldwide account
ownership increasing from 51% to 62%12 between 2011 and 2014. However, access to
financial services does not necessarily imply deep engagement with providers: Only 27% of
adults worldwide have saved with a financial institution and 11% have borrowed from one.
We consider the breadth and depth of financial inclusion by quantifying the gap in financial
inclusion. This is defined as the mismatch between the formal supply13 of financial services
and the need14 for them in our target population segments across four categories: payments
and transfers, savings, credit, and insurance. In other words, the formal supply-needs gap
is the demand from our target population segments that is currently not served by formal
financial services.15 To see the relative size of this gap, we also compare it with the supply of
formal financial services to the entire population.
• Payments and transfers gap: This is the difference between the payments needs of a target segment and the current electronic payments volume linked to this segment. This gap amounts to more than $180 billion across the four focus countries. The Philippines has the lowest gap at 25%,16 as electronic payments there are relatively evolved. The government has made active efforts to drive a cash-light society through the 2020 E-Peso project and by disbursing most G2P payments through digital channels. In contrast, the payments gap in Indonesia exceeds 65%, as electronic G2P payments only constitute 16%17 of total government transfers, and most domestic remittances are still cash-based.
• Savings gap: This is the difference between the savings capacity18 of a target segment and the amount of savings in the segment mobilized through formal financial services providers. This totals more than $80 billion across the four countries. Indonesia has made the most progress on this front, and has a gap of only 25%. One reason for this is the historic focus of Bank BRI and BPRs19 on mobilizing micro-savings and savings in rural areas. Another is the more recent drive to mobilize low-cost basic accounts via agent banking, which was enabled by the Laku Pandai regulation.20 On the other hand, the Philippines has a gap of 40% and Cambodia a gap of 85%, and both markets are dominated by informal savings.21 Bank branch density is especially limited in Cambodia
12 Global Findex database; Percentage of adult population with bank accounts
13 Formal supply is defined as the current value of financial activities captured by the formal financial sector, using data provided from public sources such as central banks.
14 Need is defined as both formal demand and unmet or unrecognized needs based on a top-down estimation approach. For example, Payment Needs = Daily spend per capita * Target segment size
15 Further details on the methodology are provided in Appendix A
16 Calculated as percentage of total need in the segment
17 Global Findex Database
18 Savings capacity is calculated based on household income, the savings rate in the segment, and they share of such savings that is captured by formal and informal financial institutions.
19 BPRs (Bank Perkreditan Rakyat) refers to rural banks in Indonesia
20 Indonesia’s nationwide initiative to promote branchless banking. It was initiated by the government in order to increase the poorest segment of the population’s access to basic, no-minimum-balance bank accounts.
21 “Informal” savers refers to customers who do not save through a formal institution such as a bank or MFI, and instead save through informal groups such as the Rotating Savings and Credit Associations (ROSCAs) or Accumulated Savings and Credit Associations (ASCAs). Such informal savings arrangements accounted for 95% (Philippines) and 78% (Cambodia) of all savers in 2014. Source: Global Findex Database
9
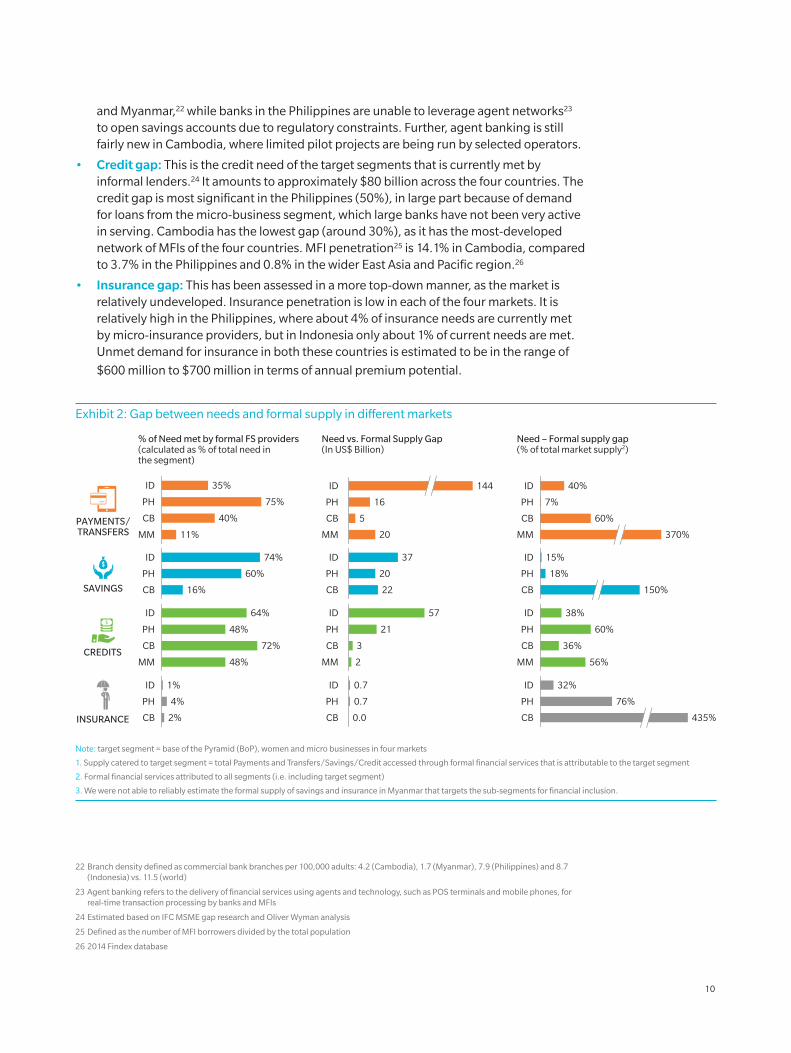
and Myanmar,22 while banks in the Philippines are unable to leverage agent networks23 to open savings accounts due to regulatory constraints. Further, agent banking is still fairly new in Cambodia, where limited pilot projects are being run by selected operators.
• Credit gap: This is the credit need of the target segments that is currently met by informal lenders.24 It amounts to approximately $80 billion across the four countries. The credit gap is most significant in the Philippines (50%), in large part because of demand for loans from the micro-business segment, which large banks have not been very active in serving. Cambodia has the lowest gap (around 30%), as it has the most-developed network of MFIs of the four countries. MFI penetration25 is 14.1% in Cambodia, compared to 3.7% in the Philippines and 0.8% in the wider East Asia and Pacific region.26
• Insurance gap: This has been assessed in a more top-down manner, as the market is relatively undeveloped. Insurance penetration is low in each of the four markets. It is relatively high in the Philippines, where about 4% of insurance needs are currently met by micro-insurance providers, but in Indonesia only about 1% of current needs are met. Unmet demand for insurance in both these countries is estimated to be in the range of
$600 million to $700 million in terms of annual premium potential.
Exhibit 2: Gap between needs and formal supply in different markets
Need vs. Formal Supply Gap(In US$ Billion)
PH 16
MM 20
CB 5
ID 144
PH 20
CB 22
ID 37
PH 21
MM 2
CB 3
ID 57
PH
CB
ID
0.7
0.0
0.7
% of Need met by formal FS providers (calculated as % of total need inthe segment)
2%
4%
1%ID
PH
CB
PH
ID
MM
CB
75%
35%
11%
40%
PH
CB
ID
60%
74%
16%
48%
ID
PH
MM
CB
64%
48%
72%
Need – Formal supply gap(% of total market supply2)
ID 38%
PH 60%
CB 36%
MM 56%
PH
ID
CB
76%
32%
435%
PH
ID
150%CB
18%
15%
MM
CB 60%
ID
PH 7%
370%
40%
SAVINGS
CREDITS
PAYMENTS/TRANSFERS
INSURANCE
Note: target segment = base of the Pyramid (BoP), women and micro businesses in four markets
1. Supply catered to target segment = total Payments and Transfers/Savings/Credit accessed through formal financial services that is attributable to the target segment
2. Formal financial services attributed to all segments (i.e. including target segment)
3. We were not able to reliably estimate the formal supply of savings and insurance in Myanmar that targets the sub-segments for financial inclusion.
22 Branch density defined as commercial bank branches per 100,000 adults: 4.2 (Cambodia), 1.7 (Myanmar), 7.9 (Philippines) and 8.7 (Indonesia) vs. 11.5 (world)
23 Agent banking refers to the delivery of financial services using agents and technology, such as POS terminals and mobile phones, for real-time transaction processing by banks and MFIs
24 Estimated based on IFC MSME gap research and Oliver Wyman analysis
25 Defined as the number of MFI borrowers divided by the total population
26 2014 Findex database
10
3. FRAMEWORK TO IDENTIFY BARRIERS TO FINANCIAL INCLUSION
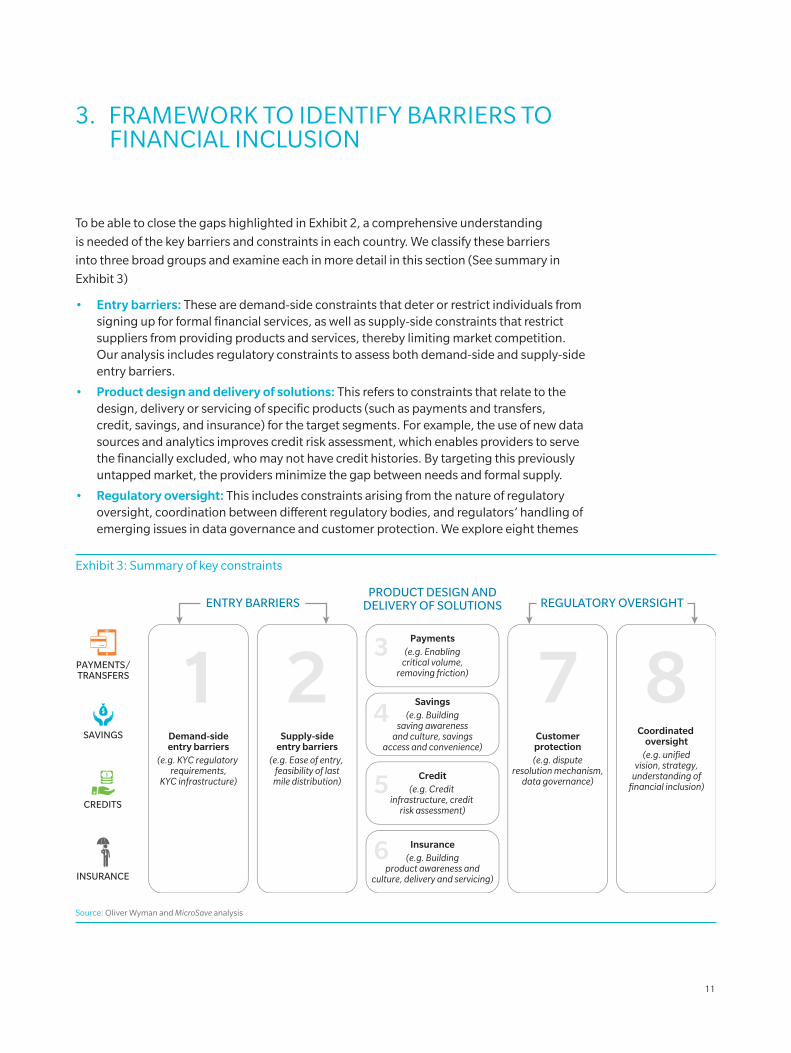
To be able to close the gaps highlighted in Exhibit 2, a comprehensive understanding
is needed of the key barriers and constraints in each country. We classify these barriers
into three broad groups and examine each in more detail in this section (See summary in
Exhibit 3)
• Entry barriers: These are demand-side constraints that deter or restrict individuals from signing up for formal financial services, as well as supply-side constraints that restrict suppliers from providing products and services, thereby limiting market competition. Our analysis includes regulatory constraints to assess both demand-side and supply-side entry barriers.
• Product design and delivery of solutions: This refers to constraints that relate to the design, delivery or servicing of specific products (such as payments and transfers, credit, savings, and insurance) for the target segments. For example, the use of new data sources and analytics improves credit risk assessment, which enables providers to serve the financially excluded, who may not have credit histories. By targeting this previously untapped market, the providers minimize the gap between needs and formal supply.
• Regulatory oversight: This includes constraints arising from the nature of regulatory oversight, coordination between different regulatory bodies, and regulators’ handling of emerging issues in data governance and customer protection. We explore eight themes
Exhibit 3: Summary of key constraints
SAVINGS
CREDITS
PAYMENTS/TRANSFERS
INSURANCE
PRODUCT DESIGN ANDDELIVERY OF SOLUTIONS
Demand-sideentry barriers
(e.g. KYC regulatory requirements,
KYC infrastructure)
1 2 7 83
4
5
6
Supply-sideentry barriers
(e.g. Ease of entry, feasibility of lastmile distribution)
Customerprotection(e.g. dispute
resolution mechanism,data governance)
Coordinated oversight
(e.g. unifiedvision, strategy,
understanding offinancial inclusion)
Payments(e.g. Enabling
critical volume,removing friction)
Savings(e.g. Building
saving awarenessand culture, savings
access and convenience)
Credit(e.g. Credit
infrastructure, credit risk assessment)
Insurance(e.g. Building
product awareness andculture, delivery and servicing)
ENTRY BARRIERS REGULATORY OVERSIGHT
Source: Oliver Wyman and MicroSave analysis
11

from these three groups, and then identify factors under each theme that can potentially impede financial inclusion. For each factor, we illustrate selected best practices and evaluate the extent to which these have been adopted in each of the four markets. A summary of our findings is presented in Exhibit 4, and more details are included in the country-level analyses in Section 6.
Exhibit 4: Analysis of key constraints: summary of country-level results
DEMAND-SIDECONSTRAINTS
Financial anddigital literacy
KYC regulatoryrequirements
KYC infrastructure
Cost and qualityof digital access
1. NFIS: National Financial Inclusion Survey
• Defined NFIS1 with DFS component and consistent rollout across the nation (both urban and rural)
• Majority of the population is financially and digitally literate
• Tiered KYC/Free look period/Cross-product KYC acceptance
• Digital account opening (e.g. signature) and digital archivingof KYC documents permitted
• Unique national ID with real time verification
• National IDs linked to FS accounts for electronic KYC and transaction authentication
• High degree of 3G network geographic coverage
• Low cost of data connection and consumption
AREA OFCONSTRAINTS
ENTRY BARRIERS
SUB-AREAOF CONSTRAINTS BEST PRACTICE EXAMPLES
1 23456
7 8
IND PHI CAM MYN
SUPPLY-SIDECONSTRAINTS
Clear andconsistent view onrole of Public andPrivate capital in FI
Regulator andpublic policyequivalence intreatment ofdi�erent players
Ease of entry(e.g. regulatoryand licensing requirements)
Cost of ongoingregulatory compliance
Minor constraint Major constraint
• Defined FI vision and guidelines, with support and regulations that promote parity across types of players engaged in DFS
• Objectively defined (rule based) role of di�erent types ofplayers (e.g. banks versus MFIs versus fintechs)
• All players treated equally and accorded equal opportunities
• Appropriate minimum capital requirements and unrestrictive sources of funding, streamlined and e�cient licensing process with reasonable licensing fees
• On-going licensing fee and other regulation complying costsare not a key concern of providers
Cost e�ectivenessof last mile distribution
• Availability of alternate distribution channels (e.g. agent network) to di�erent supply side players
• E�cient and available operating platform enabling agent to service provider and agent to customer
AREA OFCONSTRAINTS
SUB-AREAOF CONSTRAINTS BEST PRACTICE EXAMPLES
1 23456
7 8
IND PHI CAM MYN
Minor constraint Major constraint
12
PAYMENTS
SAVINGS
Enabling criticalvolume – G2Pand P2G
Enabling criticalvolume – P2All
Removing Friction– Interoperability
Removing Friction– Reliability
Extending access– Points ofphysical access
Extending access– Electronicaccess in last mile
AREA OFCONSTRAINTS
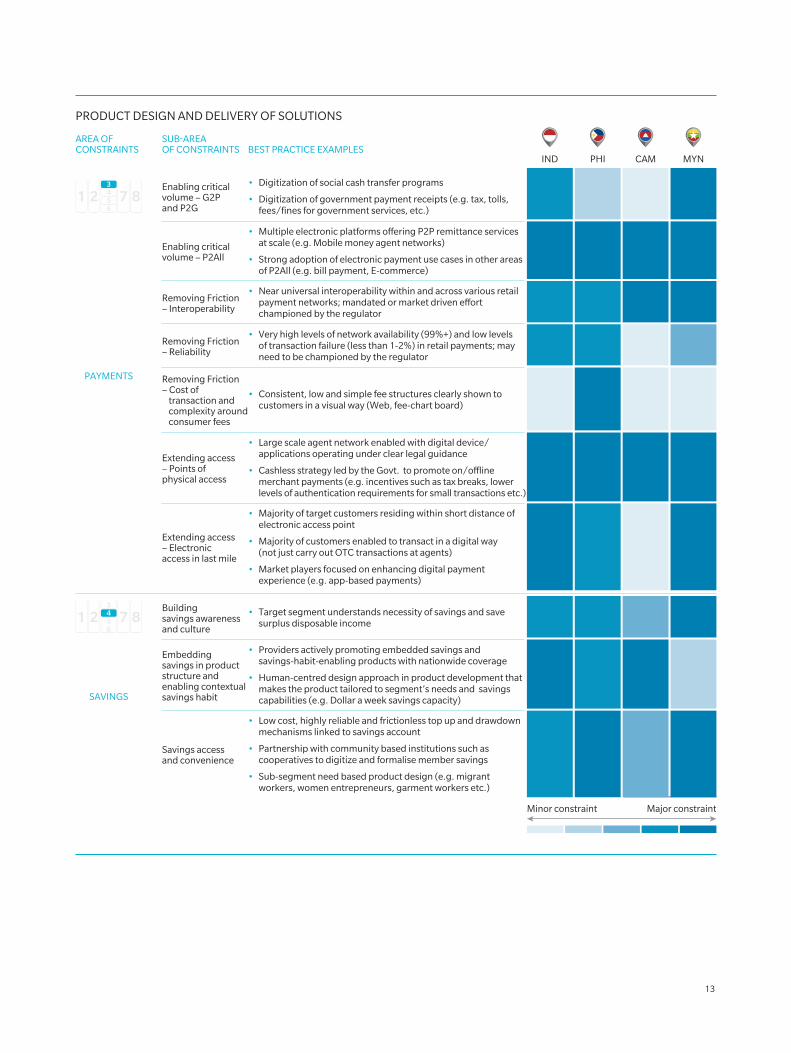
PRODUCT DESIGN AND DELIVERY OF SOLUTIONS
SUB-AREAOF CONSTRAINTS BEST PRACTICE EXAMPLES
• Digitization of social cash transfer programs
• Digitization of government payment receipts (e.g. tax, tolls, fees/fines for government services, etc.)
• Multiple electronic platforms o�ering P2P remittance servicesat scale (e.g. Mobile money agent networks)
• Strong adoption of electronic payment use cases in other areas of P2All (e.g. bill payment, E-commerce)
• Near universal interoperability within and across various retail payment networks; mandated or market driven e�ort championed by the regulator
• Very high levels of network availability (99%+) and low levelsof transaction failure (less than 1-2%) in retail payments; may need to be championed by the regulator
Removing Friction– Cost of
transaction and complexity around consumer fees
• Consistent, low and simple fee structures clearly shown to customers in a visual way (Web, fee-chart board)
• Large scale agent network enabled with digital device/ applications operating under clear legal guidance
• Cashless strategy led by the Govt. to promote on/o�ine merchant payments (e.g. incentives such as tax breaks, lower levels of authentication requirements for small transactions etc.)
• Majority of target customers residing within short distance of electronic access point
• Majority of customers enabled to transact in a digital way(not just carry out OTC transactions at agents)
• Market players focused on enhancing digital payment experience (e.g. app-based payments)
1 23456
7 8
1 23456
7 8
IND PHI CAM MYN
Minor constraint Major constraint
Buildingsavings awareness and culture
• Target segment understands necessity of savings and save surplus disposable income
Embeddingsavings in product structure and enabling contextual savings habit
• Providers actively promoting embedded savings and savings-habit-enabling products with nationwide coverage
• Human-centred design approach in product development that makes the product tailored to segment’s needs and savings capabilities (e.g. Dollar a week savings capacity)
Savings access and convenience
• Low cost, highly reliable and frictionless top up and drawdown mechanisms linked to savings account
• Partnership with community based institutions such as cooperatives to digitize and formalise member savings
• Sub-segment need based product design (e.g. migrantworkers, women entrepreneurs, garment workers etc.)
13
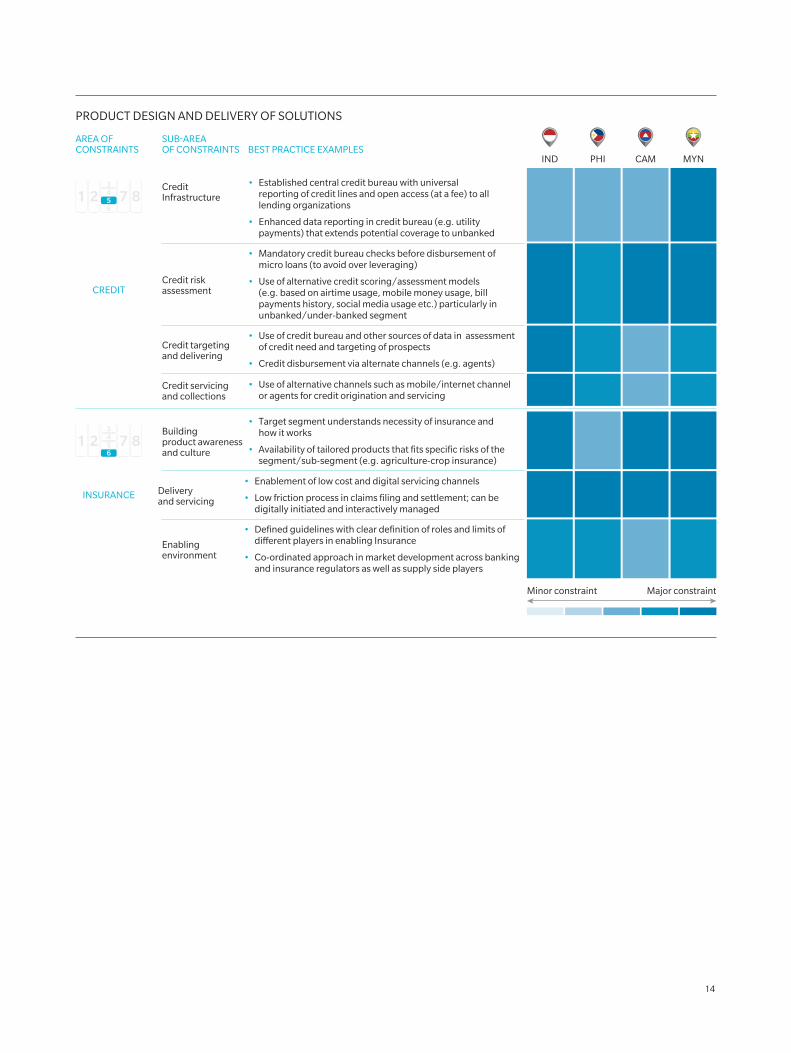
CREDIT
Credit Infrastructure
Deliveryand servicing
Enabling environment
AREA OFCONSTRAINTS
PRODUCT DESIGN AND DELIVERY OF SOLUTIONS
SUB-AREAOF CONSTRAINTS BEST PRACTICE EXAMPLES
• Established central credit bureau with universalreporting of credit lines and open access (at a fee) to alllending organizations
• Enhanced data reporting in credit bureau (e.g. utilitypayments) that extends potential coverage to unbanked
• Mandatory credit bureau checks before disbursement ofmicro loans (to avoid over leveraging)
• Use of alternative credit scoring/assessment models(e.g. based on airtime usage, mobile money usage, bill payments history, social media usage etc.) particularly in unbanked/under-banked segment
• Use of credit bureau and other sources of data in assessmentof credit need and targeting of prospects
• Credit disbursement via alternate channels (e.g. agents)
• Use of alternative channels such as mobile/internet channelor agents for credit origination and servicing
Buildingproduct awareness and culture
• Target segment understands necessity of insurance andhow it works
• Availability of tailored products that fits specific risks of the segment/sub-segment (e.g. agriculture-crop insurance)
• Enablement of low cost and digital servicing channels
• Low friction process in claims filing and settlement; can be digitally initiated and interactively managed
• Defined guidelines with clear definition of roles and limits of di�erent players in enabling Insurance
• Co-ordinated approach in market development across banking and insurance regulators as well as supply side players
Credit risk assessment
Credit targeting and delivering
Credit servicing and collections
1 23456
7 8
INSURANCE
1 23456
7 8
IND PHI CAM MYN
Minor constraint Major constraint
14
The overall assessment highlights considerable barriers in each markets across many of the eight
areas of constraints. But it is important to note that significant progress has been made in many
areas, and that there are ongoing initiatives that will address some of the remaining issues. In the
following paragraphs, we provide a brief, market-level summary of progress made so far and the
barriers that remain.
INDONESIA: Significant progress has been made through the Laku Pandai and e-money
initiatives27 to target the financially excluded, especially those in rural areas.28 Bank Indonesia
introduced e-money regulations in 2009, and followed up with a DFS pilot project in 2013.
E-money regulations were amended in 2014 to enable BUKU IV29 banks to partner with individual
entities. In addition, regulations for branchless banks were introduced by the Financial Services
Authority (OJK) in 2014. Bank-led models appear to dominate, with banks able to participate in
both e-money and Laku Pandai. MNOs and telco-led models are restricted to e-money.
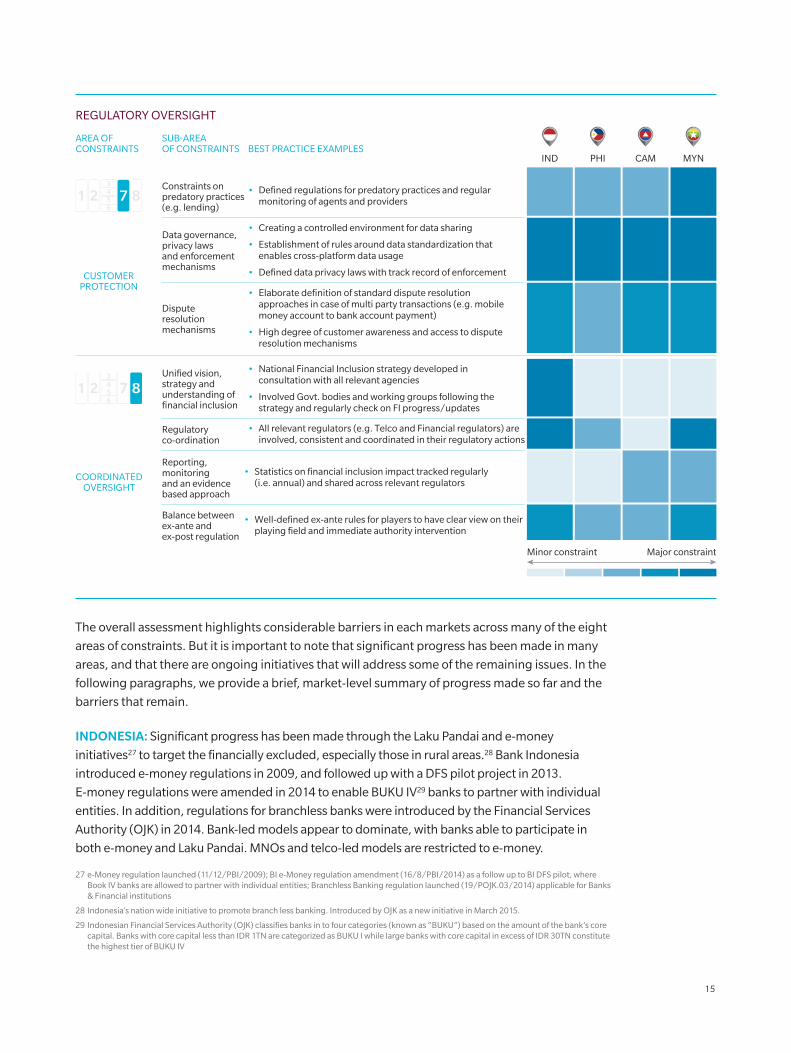
CUSTOMERPROTECTION
Constraints on predatory practices (e.g. lending)
AREA OFCONSTRAINTS
REGULATORY OVERSIGHT
SUB-AREAOF CONSTRAINTS BEST PRACTICE EXAMPLES
• Defined regulations for predatory practices and regular monitoring of agents and providers
• Creating a controlled environment for data sharing
• Establishment of rules around data standardization thatenables cross-platform data usage
• Defined data privacy laws with track record of enforcement
• Elaborate definition of standard dispute resolutionapproaches in case of multi party transactions (e.g. mobile money account to bank account payment)
• High degree of customer awareness and access to dispute resolution mechanisms
• National Financial Inclusion strategy developed inconsultation with all relevant agencies
• Involved Govt. bodies and working groups following the strategy and regularly check on FI progress/updates
Reporting, monitoringand an evidence based approach
Balance between ex-ante and ex-post regulation
Regulatory co-ordination
• All relevant regulators (e.g. Telco and Financial regulators) are involved, consistent and coordinated in their regulatory actions
• Statistics on financial inclusion impact tracked regularly(i.e. annual) and shared across relevant regulators
• Well-defined ex-ante rules for players to have clear view on their playing field and immediate authority intervention
Data governance, privacy lawsand enforcement mechanisms
Dispute resolution mechanisms
Unified vision, strategy and understanding of financial inclusion
1 23456
7 8
COORDINATEDOVERSIGHT
1 23456
7 8
IND PHI CAM MYN
Minor constraint Major constraint
27 e-Money regulation launched (11/12/PBI/2009); BI e-Money regulation amendment (16/8/PBI/2014) as a follow up to BI DFS pilot, where Book IV banks are allowed to partner with individual entities; Branchless Banking regulation launched (19/POJK.03/2014) applicable for Banks & Financial institutions
28 Indonesia’s nation wide initiative to promote branch less banking. Introduced by OJK as a new initiative in March 2015.
29 Indonesian Financial Services Authority (OJK) classifies banks in to four categories (known as “BUKU”) based on the amount of the bank’s core capital. Banks with core capital less than IDR 1TN are categorized as BUKU I while large banks with core capital in excess of IDR 30TN constitute the highest tier of BUKU IV
15
Indonesia has also made good progress in implementing the national ID programme
(e-KTP30), which covers 86% of the population, and it has detailed an ambitious plan to
digitize all social benefits payments by 2017. On the other hand, Indonesia lacks a unified
real-time ID database linked to financial services for electronic KYC and authentication
of transactions. Similarly, a lack of integration between e-money and Laku Pandai-based
solutions has confused both the supply side and end customers. Another major barrier
is the absence of the credit infrastructure required to underwrite small and micro loans,
which highlights the business case for alternative credit scoring using non-traditional data.
Coordination between regulators could also be improved, particularly on cross-industry
issues. One example of this is the Philippines, where the central bank has created a bank-
wide committee to coordinate financial inclusion programmes, including institutionalized
information sharing between departments in the central bank and with other agencies.31 In
addition, there are untapped but potentially suitable roles for MNOs in Indonesia, such as
driving mobile money platforms by leveraging their extensive distribution networks.
PHILIPPINES: There has been a consistent and coordinated effort by regulators and public
policy-setting institutions to drive financial inclusion. This was clearly articulated in the
National Strategy for Financial Inclusion 2015, and continues to be evaluated in an evidence-
based manner via the National Baseline Survey. The central bank has been active in its efforts
to increase financial inclusion. It has encouraged micro-savings32 and allowed banks to
expand their footprints by establishing micro-banking offices in areas where it may not be
economically feasible to open a full branch immediately.
The government has also achieved significant success in digitizing G2P and public-to-
government (P2G) payments. About 54% of disbursements are currently done electronically,
and the National Retail Payments System (NRPS) is going to provide the necessary policy
and technology framework for the interoperability of mobile money and e money services
offered by different players. However, progress in other areas has been held back by an
absence of unique National IDs, as well as cumbersome processes for KYC verification and
account activation (even though only one identification document is required). As a result,
customers often do not verify their e-money accounts, and prefer to conduct over-the-
counter (OTC) transactions. The depth of financial inclusion continues to be low: More than
40% of adults save money, but only about 30% of these do so with a bank.33 The regulator
could help address this issue by taking a more active role in creating an interoperable and
reliable retail payment network. Similarly, fast-track development of agent banking networks
could help deepen financial services access and integrate offerings across different supply-
side players, such as rural banks, MFIs, cooperatives, and pawnshops.
30 e-KTP (Electronic Kartu Tanda Penduduk) is the Unique National ID program of Indonesia, which maintains an online database of national IDs that can be used for identity verification purposes
31 http://www.afi-global.org/sites/default/files/publications/the_use_of_financial_inclusion_data_country_case_study_philippines.pdf
32 In 2010, the BSP issued Circular 694, which expanded microfinance products to include micro-deposits (also known as microfinance savings deposits). In May 2013, the BSP issued Circular 796, which amends the general features of micro-deposits by increasing the ADB to PHP 40,000 (US$927)
33 Bangko Sentral ng Pilipinas 2015 National Baseline Survey on Financial Inclusion
16
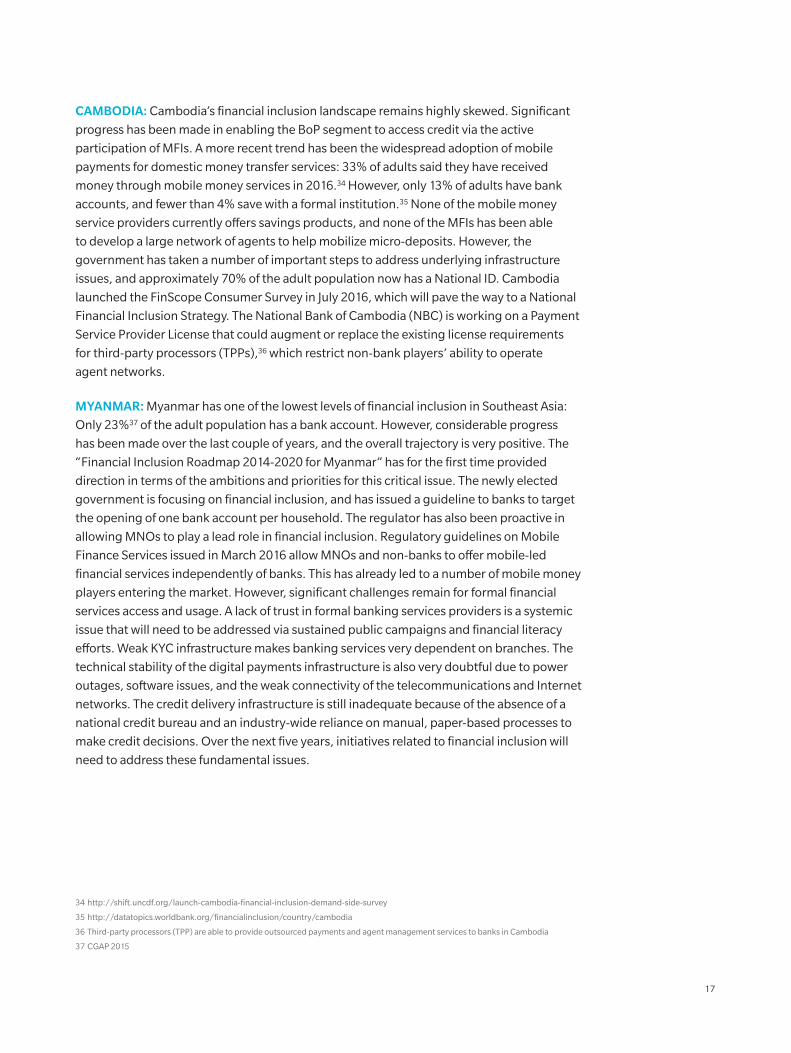
CAMBODIA: Cambodia’s financial inclusion landscape remains highly skewed. Significant
progress has been made in enabling the BoP segment to access credit via the active
participation of MFIs. A more recent trend has been the widespread adoption of mobile
payments for domestic money transfer services: 33% of adults said they have received
money through mobile money services in 2016.34 However, only 13% of adults have bank
accounts, and fewer than 4% save with a formal institution.35 None of the mobile money
service providers currently offers savings products, and none of the MFIs has been able
to develop a large network of agents to help mobilize micro-deposits. However, the
government has taken a number of important steps to address underlying infrastructure
issues, and approximately 70% of the adult population now has a National ID. Cambodia
launched the FinScope Consumer Survey in July 2016, which will pave the way to a National
Financial Inclusion Strategy. The National Bank of Cambodia (NBC) is working on a Payment
Service Provider License that could augment or replace the existing license requirements
for third-party processors (TPPs),36 which restrict non-bank players’ ability to operate
agent networks.
MYANMAR: Myanmar has one of the lowest levels of financial inclusion in Southeast Asia:
Only 23%37 of the adult population has a bank account. However, considerable progress
has been made over the last couple of years, and the overall trajectory is very positive. The
“Financial Inclusion Roadmap 2014-2020 for Myanmar” has for the first time provided
direction in terms of the ambitions and priorities for this critical issue. The newly elected
government is focusing on financial inclusion, and has issued a guideline to banks to target
the opening of one bank account per household. The regulator has also been proactive in
allowing MNOs to play a lead role in financial inclusion. Regulatory guidelines on Mobile
Finance Services issued in March 2016 allow MNOs and non-banks to offer mobile-led
financial services independently of banks. This has already led to a number of mobile money
players entering the market. However, significant challenges remain for formal financial
services access and usage. A lack of trust in formal banking services providers is a systemic
issue that will need to be addressed via sustained public campaigns and financial literacy
efforts. Weak KYC infrastructure makes banking services very dependent on branches. The
technical stability of the digital payments infrastructure is also very doubtful due to power
outages, software issues, and the weak connectivity of the telecommunications and Internet
networks. The credit delivery infrastructure is still inadequate because of the absence of a
national credit bureau and an industry-wide reliance on manual, paper-based processes to
make credit decisions. Over the next five years, initiatives related to financial inclusion will
need to address these fundamental issues.
34 http://shift.uncdf.org/launch-cambodia-financial-inclusion-demand-side-survey
35 http://datatopics.worldbank.org/financialinclusion/country/cambodia
36 Third-party processors (TPP) are able to provide outsourced payments and agent management services to banks in Cambodia
37 CGAP 2015
17
4. IMPACT OF DIGITAL FINANCE
Digital innovation has the potential to fundamentally change the provision of financial
services to the underserved BoP, female, and MSME segments. As well as impacting the
way in which traditional incumbents conduct their businesses, digital technology is being
adopted by new entrants. They have the potential to disrupt and disintermediate, thus
disaggregating the banking value chain. Examples of uses of the new technologies include:
• Alternative platforms, such as mobile phones and digital platforms, to enable last-mile access. These will be able to reach the financially excluded and people in rural areas without the need for physical bank branches.
• Alternative digital information, such as biometrics data, to verify customer identity for account opening and payment authorisation.
• Analysis of transactional and digital footprint data to generate insights to improve customer targeting and credit risk assessment.
• Mobile wallets developed by non-banks, such as MNOs, to improve the customer experience in savings and payments.
We believe there are five key areas where digital solutions can have a positive disruptive
impact on financial inclusion. However, the participation of new players, combined with
the proliferation of new data, could also create new challenges for regulatory oversight. We
categorise these impacts according to the framework in Exhibit 3.
ENTRY BARRIERS:
1. Demand-side entry constraints – Digitally enabled customer identification and verification: Digital solutions can enable fast, low-cost, and convenient customer identification and verification processes. This is especially so when the processes are powered by unique national IDs, a real-time verification infrastructure, and a supporting regulatory framework featuring tiered KYC and cross-product KYC. As an example, e-KYC in India, based on the Aadhaar 12-digit unique identity number, has reduced the time required for customer verification to less than a minute, from two to four weeks.
2. Supply-side entry barriers – Scalable delivery by tackling last-mile distribution: Digital technology can also meaningfully alter the supply side by addressing the problem of last-mile distribution and servicing. This can be done through alternative low-cost, widespread points of physical access that are digitally enabled, for example using mobile money or point of sale systems. A study by the Consultative Group to Assist the Poor (CGAP) estimated that digitally enabled last-mile delivery could reduce the distribution costs of lending and insurance products by between 15 and 30%.38
38 http://www.slideshare.net/CGAP/projecting-impact-of-nontraditional-data-and-advanced-analytics-on-delivery-costs
18
PRODUCT DESIGN AND DELIVERY OF SOLUTIONS:
3. Payments – End-to-end digitization in the flow, access, and infrastructure of retail payments: The payment value chain and ecosystem can be completely overhauled by end-to-end digitization. Digital G2P payments and remittance flows can create the initial momentum for electronic payments, thereby supporting the development of viable business cases. Development of P2All use cases combined with interoperable networks and open API platforms can help sustain and further develop digital retail payments. For example, Wing in Cambodia now processes a volume of transactions equivalent to about 50% of the country’s GDP through a mobile money network consisting of some 4,000 digitally connected agents. In doing so, it has reduced money transfer fees by between 40% and 80%.
4. Credit – Credit and fraud risk reduction via digitally-enabled data capture and analytics: Digital technology can significantly enhance access to credit through the use of alternative sources of data, such as data from payment transactions and telecoms providers, combined with analytics. These can improve customer profiling, credit risk assessment, and fraud detection. A number of Fintech players have been active in this space in the four focus markets, and are pursuing various approaches to risk assessment. Lenddo has been using data from digital footprints for fraud detection and credit risk assessment. TrustingSocial has been using telecoms data for similar purposes. EFL has followed an approach to the credit assessment of micro-borrowers based on psychometric tests.
5. Savings – Cost-effective mobilization of low-cost deposits through a digital access and service platform: Savings mobilization can be digitally activated by lower-cost alternative distribution channels, such as agents; more-convenient product designs, such as mobile wallets connected to savings accounts and goal-based savings products in the form of games; and an easy KYC and onboarding process. Indonesia’s Laku Pandai program has enabled banks to collect $3 billion in deposits from 1.1 million new customers in rural areas in less than a year. In Kenya, M-Shwari generated an active customer base of more than 5 million within one year of its savings product launch.
Outside these five areas of positive disruption, we also analysed the impact of digital finance
on insurance and regulatory oversight, and reached somewhat different conclusions.
6. Impact of digital finance on insurance: We recognise that there may be significant digital opportunities in micro-insurance. However, micro-insurance is still nascent in each of our focus markets, and most of the digital finance solutions in insurance are still in early pilot stages. We therefore believe that the impact of digital finance on micro-insurance and, in turn, its impact on financial inclusion in general will be limited over the next five years.
7. Impact on regulatory oversight - Data governance and customer protection: Digital finance presents new challenges for regulators because of the rapidly changing and more-complex supply-side ecosystem, as well as the increasing amounts of personal data generated in a more digital world. Both these trends make it harder to ensure consumer protection. Data governance and customer protection: Digital technology
19
is enabling business models based on insights drawn from vast amounts of data – for example credit risk assessment based on telecoms data. This use of data raises a variety of challenges that need to be addressed, related to data quality, accessibility, and security. The BoP is a particularly vulnerable market segment, given its members’ lower awareness of these issues, their lack of alternative options, and the difficulty they have in voicing complaints. Regulators need to play a lead role in this area by setting guidelines on data-sharing governance and limitations, encouraging customer-driven data permissioning platforms, and setting standard operating procedures for dispute resolution. These actions are particularly important given increasingly disaggregated value chains, in which multiple participants combine to provide customers with end solutions.
4.1. DEMAND-SIDE ENTRY CONSTRAINT – DIGITALLY ENABLED CUSTOMER IDENTIFICATION AND VERIFICATION
KYC is integral to the spread of formal financial services and the management of risks
associated with a globally integrated financial system. However, customer identification
and verification is often a challenge when no unique, universal customer ID exists, and
when infrastructure is inadequate to carry out the process in an efficient manner. This is
a significant barrier to greater access to and use of financial services. In the absence of
alternatives, prospective customers need to appear in person at the branch of a bank or
other financial services provider, often with a set of documents, just to open a basic savings
account. Even then, the process will not be completed for two or three weeks. Such a process
is inconvenient for customers, expensive for financial services providers, and still open to
significant risks – as human verification of identifying documents is far from fool-proof.
Digital technology can enable two alternative approaches, both better than the traditional
approach described above:
• Automated agent-enabled customer identification – where an agent is able to capture a customer’s identification documents digitally using a mobile application. The captured data is automatically verified against databases linked to the financial services provider’s back end platform.
• Automated individual-enabled customer identification – where an individual is able to submit identity proof, such as a fingerprint, remotely to a financial services provider. This enables verification of the customer’s identity in real time through links to national databases.
These approaches are illustrated in Exhibit 5, next page.
20
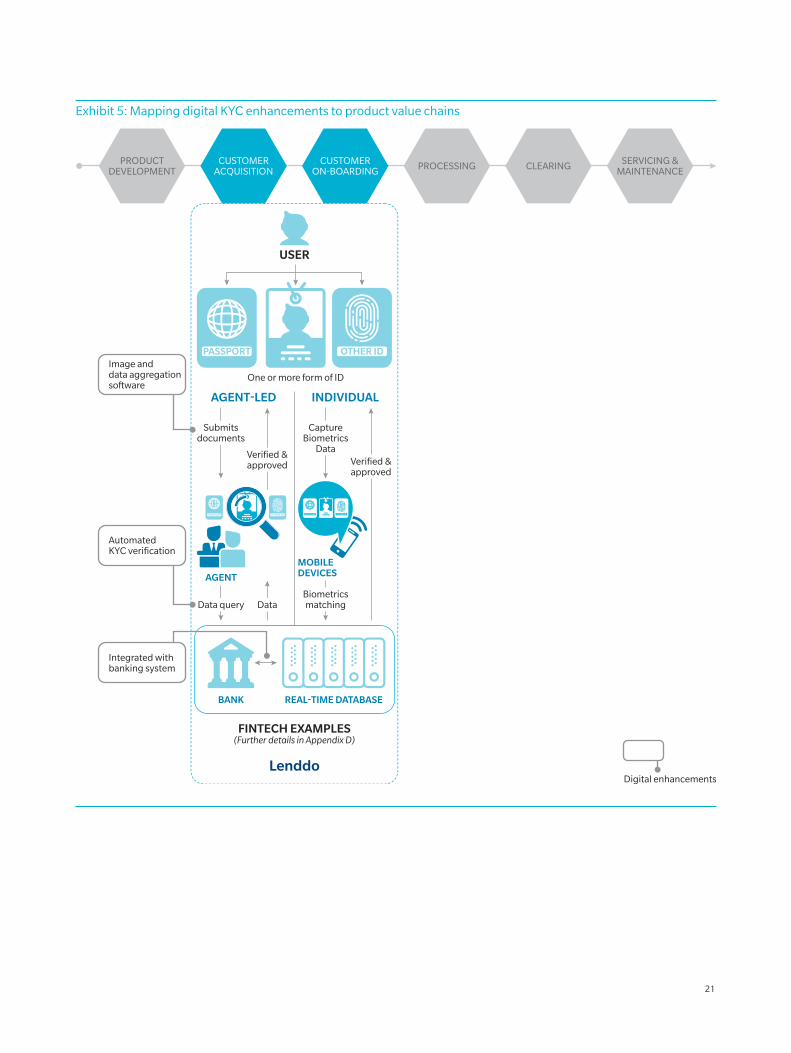
Exhibit 5: Mapping digital KYC enhancements to product value chains
CaptureBiometrics
Data
PRODUCTDEVELOPMENT
CUSTOMERACQUISITION
CUSTOMERON-BOARDING
One or more form of ID
Submitsdocuments
Data query
AutomatedKYC verification
BiometricsmatchingData
AGENT-LED
FINTECH EXAMPLES(Further details in Appendix D)
AGENT
MOBILEDEVICES
INDIVIDUAL
USER
PROCESSING CLEARING SERVICING & MAINTENANCE
PASSPORT OTHER ID
Verified &approved
Verified &approved
BANK REAL-TIME DATABASE
Image anddata aggregationsoftware
Integrated withbanking system
Digital enhancementsLenddo
21
There are three key benefits of digital KYC. First, automating the KYC process and integrating
public records with bank systems increase provider efficiency, and reduce the costs and
processing times in formal financial services. Second, individuals previously excluded due
to missing or limited formal documents can now be considered for KYC, since verification
is performed using both public records and non-traditional data sources. Third, the
robustness of digital KYC verification motivates regulators and providers to reduce onerous
KYC requirements.
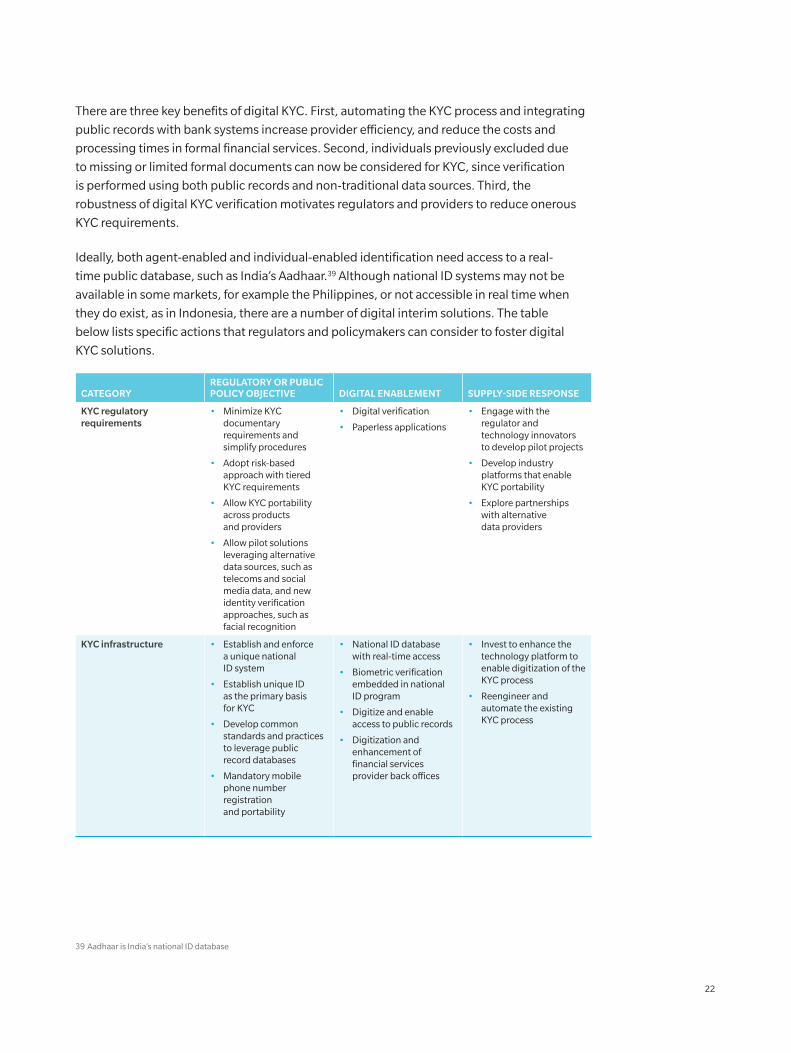
Ideally, both agent-enabled and individual-enabled identification need access to a real-
time public database, such as India’s Aadhaar.39 Although national ID systems may not be
available in some markets, for example the Philippines, or not accessible in real time when
they do exist, as in Indonesia, there are a number of digital interim solutions. The table
below lists specific actions that regulators and policymakers can consider to foster digital
KYC solutions.
CATEGORYREGULATORY OR PUBLIC POLICY OBJECTIVE DIGITAL ENABLEMENT SUPPLY-SIDE RESPONSE
KYC regulatory requirements
• Minimize KYC documentary requirements and simplify procedures
• Adopt risk-based approach with tiered KYC requirements
• Allow KYC portability across products and providers
• Allow pilot solutions leveraging alternative data sources, such as telecoms and social media data, and new identity verification approaches, such as facial recognition
• Digital verification
• Paperless applications
• Engage with the regulator and technology innovators to develop pilot projects
• Develop industry platforms that enable KYC portability
• Explore partnerships with alternative data providers
KYC infrastructure • Establish and enforce a unique national ID system
• Establish unique ID as the primary basis for KYC
• Develop common standards and practices to leverage public record databases
• Mandatory mobile phone number registration and portability
• National ID database with real-time access
• Biometric verification embedded in national ID program
• Digitize and enable access to public records
• Digitization and enhancement of financial services provider back offices
• Invest to enhance the technology platform to enable digitization of the KYC process
• Reengineer and automate the existing KYC process
39 Aadhaar is India’s national ID database
22
Indonesia has tried to tackle its KYC-related barrier by allowing banks to partner with agents
to conduct simplified KYC procedures for Laku Pandai accounts.40 Individuals are now able to
open accounts with just a letter from the local village officer. The regulator has also allowed
agents to capture customer documents digitally using mobile devices such as smartphones
and tablets. The documents are then uploaded directly to bank servers. However, the
absence of an integrated national ID database means that automated KYC cannot be
conducted in spite of Indonesia’s electronic national identity (e-KTP) program.
Indonesia’s progress is a contrast to the Philippines’ cumbersome customer identification
and verification process. Mobile money accounts can be opened with as many as 20 paper-
based IDs, all of which require a photo of the individual. Bank accounts can only be opened
personally at a branch. A few local governments have issued digital ID cards, but these
are small-scale initiatives that are not standardized, so the scale is limited. Furthermore,
the regulator has not yet permitted digital KYC procedures, and the infrastructure needed
for digital verification is lacking. Myanmar has a similar challenge, as no unique universal
national ID exists, and there is no public database that can be remotely accessed to verify
customers’ identity.
India is a recent, noteworthy example of how a unique, universal national ID project can
trigger rapid development of KYC infrastructure and regulations. A recent study on KYC
benchmarking and harmonisation conducted by MicroSave41 highlighted that e-KYC enabled
by India’s Aadhaar system could result in an estimated direct saving of over $1.5 billion42
over the next five years.43 Apart from substantial cost savings for banks and financial
institutions, Aadhaar-enabled e-KYC is significantly more efficient than current, paper-based
KYC. Traditional customer enrolment processes followed by banks mean it can take from
two to four weeks before an account is activated and all the KYC details have been verified
and stored. Using Aadhaar, e-KYC can enable bank accounts to be activated and readied for
transactions in a minute.
40 According to simplified KYC procedures, banks and agents must demand, at a minimum: a) full name, b) residential address and corresponding identity document, c) place and date of birth, and d) work details and supporting documents. But they do not require a photo ID
41 The benchmarking study covered a range of institutions, including banks, mobile operators, mobile money providers, and providers of semi-closed and open wallets
42 The savings potential can be viewed in the context of the $3.7 billion capital infusion into public sector banks that the Government of India has announced in the budget for the 2016-17 fiscal year. The infusion is intended to deal with their high level of non-performing assets and the twin-balance-sheet challenge
43 This estimate is conservative, considering that since August 2015 over 212 million new accounts have been opened under the PMJDY, India’s national mission for financial inclusion. As a result, new accounts will be opened at a lower rate in the foreseeable future
23
4.2. SUPPLY-SIDE ENTRY CONSTRAINT – SCALABLE DELIVERY BY TACKLING LAST-MILE DISTRIBUTION
A key challenge for the financially excluded is their inability to access formal financial
services through traditional banking infrastructure such as branches and ATMs. These are
typically concentrated in high-density urban areas, and are much more limited in rural areas.
Travel costs and opportunity loss add to the fees charged for banking services to present a
significant cost barrier for the BoP segment. In the Philippines, it takes an average of
26 minutes to reach a bank branch, and another 33 minutes waiting in a queue to
be served.44
Innovations in digital financial services could lower providers’ distribution and servicing
costs for basic financial services by making possible alternative platforms and channels, such
as mobile phones, point-of-sale devices, and agent networks. According to a study by CGAP,
the use of digital financial solutions can lower the delivery costs of lending and insurance
products by between 15% and 30%.45 Such cost reductions provide massive opportunities
for scaling up and reaching distant locations not previously served by financial services
providers. Bank BRI in Indonesia has rolled out more than 25,000 agents under its Laku
Pandai model in just one year, establishing five times the number of points of presence in
that time as it did branches over 50 years.
This is clearly an area of potential digital disruption, though we believe that the nature
and impact of last-mile distribution solutions are going to depend on specific products.
Disruption is likely to be faster and more significant in the case of payments than it is for
credit. Agent networks and point-of-sale terminals provide low-cost alternatives to branch
banking, offering services such as cash-in and cash-out, bill payment, account transfers,
credit disbursement, and collections. Agent networks can be built rapidly, as demonstrated
in Indonesia: 130,000 Laku Pandai agents have been added in just one year, compared to
about 20,00046 bank branches nationwide over decades of traditional banking. However,
the development of agent networks comes with additional operational risks. Operators must
recruit their agents and agent network managers carefully, and then train and supervise
them adequately. In addition, maintaining agent activity is a key challenge. Though there
are about 25,000 e-money agents in the Philippines, almost three times the number of bank
branches, a high proportion of them are dormant.
44 National Baseline Survey on Financial Inclusion 2015
45 http://www.slideshare.net/CGAP/projecting-impact-of-nontraditional-data-and-advanced-analytics-on-delivery-costs
46 World Bank: number of bank branches per 100,000 adults (11), adult population (age over 15, 177.7 million)
24
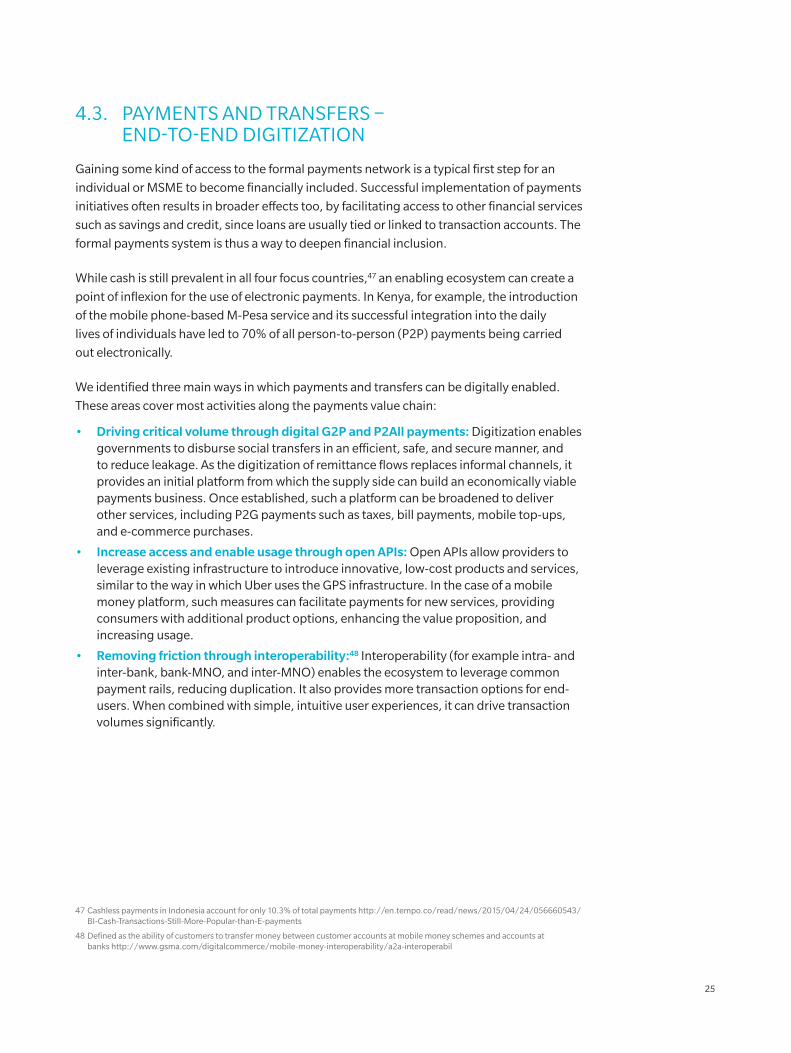
4.3. PAYMENTS AND TRANSFERS – END-TO-END DIGITIZATION
Gaining some kind of access to the formal payments network is a typical first step for an
individual or MSME to become financially included. Successful implementation of payments
initiatives often results in broader effects too, by facilitating access to other financial services
such as savings and credit, since loans are usually tied or linked to transaction accounts. The
formal payments system is thus a way to deepen financial inclusion.
While cash is still prevalent in all four focus countries,47 an enabling ecosystem can create a
point of inflexion for the use of electronic payments. In Kenya, for example, the introduction
of the mobile phone-based M-Pesa service and its successful integration into the daily
lives of individuals have led to 70% of all person-to-person (P2P) payments being carried
out electronically.
We identified three main ways in which payments and transfers can be digitally enabled.
These areas cover most activities along the payments value chain:
• Driving critical volume through digital G2P and P2All payments: Digitization enables governments to disburse social transfers in an efficient, safe, and secure manner, and to reduce leakage. As the digitization of remittance flows replaces informal channels, it provides an initial platform from which the supply side can build an economically viable payments business. Once established, such a platform can be broadened to deliver other services, including P2G payments such as taxes, bill payments, mobile top-ups, and e-commerce purchases.
• Increase access and enable usage through open APIs: Open APIs allow providers to leverage existing infrastructure to introduce innovative, low-cost products and services, similar to the way in which Uber uses the GPS infrastructure. In the case of a mobile money platform, such measures can facilitate payments for new services, providing consumers with additional product options, enhancing the value proposition, and increasing usage.
• Removing friction through interoperability:48 Interoperability (for example intra- and inter-bank, bank-MNO, and inter-MNO) enables the ecosystem to leverage common payment rails, reducing duplication. It also provides more transaction options for end-users. When combined with simple, intuitive user experiences, it can drive transaction volumes significantly.
47 Cashless payments in Indonesia account for only 10.3% of total payments http://en.tempo.co/read/news/2015/04/24/056660543/BI-Cash-Transactions-Still-More-Popular-than-E-payments
48 Defined as the ability of customers to transfer money between customer accounts at mobile money schemes and accounts at banks http://www.gsma.com/digitalcommerce/mobile-money-interoperability/a2a-interoperabil
25
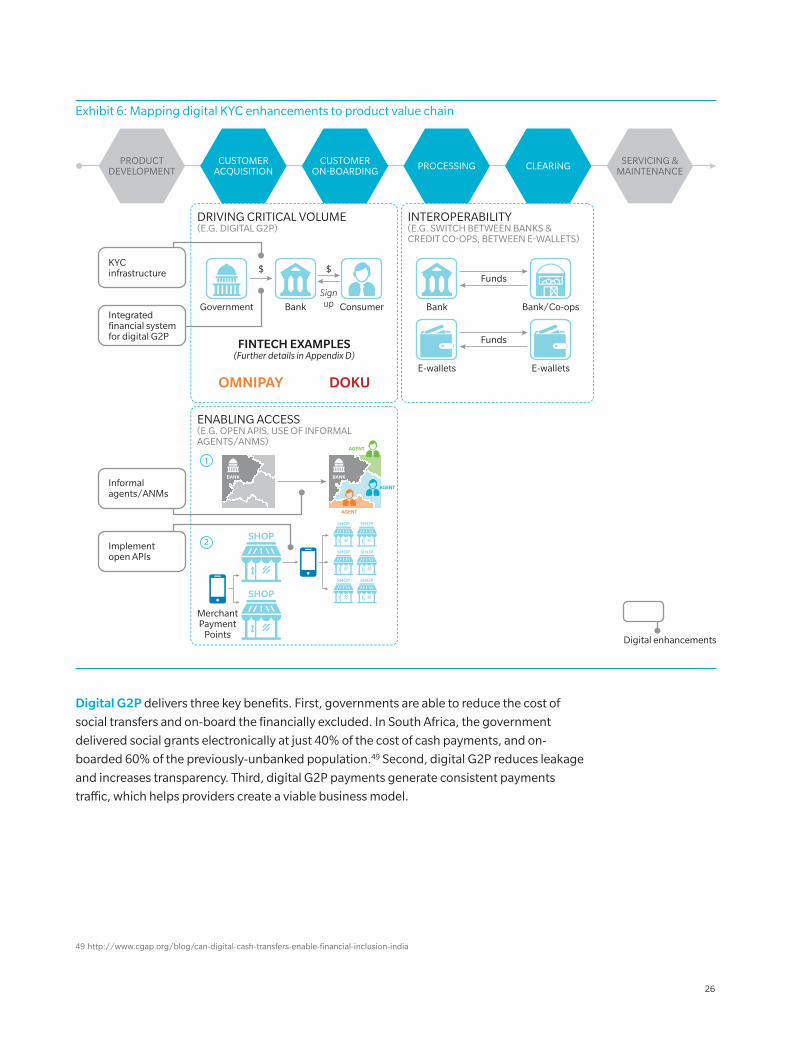
Digital G2P delivers three key benefits. First, governments are able to reduce the cost of
social transfers and on-board the financially excluded. In South Africa, the government
delivered social grants electronically at just 40% of the cost of cash payments, and on-
boarded 60% of the previously-unbanked population.49 Second, digital G2P reduces leakage
and increases transparency. Third, digital G2P payments generate consistent payments
traffic, which helps providers create a viable business model.
49 http://www.cgap.org/blog/can-digital-cash-transfers-enable-financial-inclusion-india
Exhibit 6: Mapping digital KYC enhancements to product value chain
PRODUCTDEVELOPMENT
CUSTOMERACQUISITION
CUSTOMERON-BOARDING
Government
MerchantPayment
Points
Bank Consumer Bank
$$
Signup
FINTECH EXAMPLES(Further details in Appendix D)
DRIVING CRITICAL VOLUME(E.G. DIGITAL G2P)
PROCESSING CLEARING SERVICING & MAINTENANCE
Funds
Funds
Informalagents/ANMs
KYCinfrastructure
Integratedfinancial systemfor digital G2P
Implementopen APIs
INTEROPERABILITY(E.G. SWITCH BETWEEN BANKS &CREDIT CO-OPS, BETWEEN E-WALLETS)
ENABLING ACCESS(E.G. OPEN APIS, USE OF INFORMALAGENTS/ANMS)
1
2
SHOP
SHOP
SHOP
SHOP
SHOP
SHOP
SHOP
SHOP
E-wallets
Bank/Co-ops
E-wallets
AGENT
AGENT
BANKBANK
AGENT
Digital enhancements
DOKUOMNIPAY
26
A substantial share of the target population for financial inclusion receives some form of
social welfare transfer in each of the four focus markets. For example, about 70 million adults
in Indonesia receive some sort of government benefit.50 In total, G2P payments account
for 84% of all government transfers in Indonesia. However, they are often cash-based.
Indonesia intends to leverage digital platforms for social transfers through its Laku Pandai
program, which is expected to reach rural areas and cover at least 75% of the population.
The Philippines has already achieved significant success in this dimension through strong
co-ordination between the Department of Social Welfare and the Development and
Land Bank: More than 50% of the country’s transfers are carried out digitally.51 However,
this opportunity has not been fully leveraged to develop a broader electronic payments
ecosystem. Most of the G2P payment accounts operate as one-way disbursement accounts:
Money is withdrawn from them, and they are not used for other electronic transactions.
India’s experience with G2P can be instructive for other developing economies with similar
government agendas. India has a huge social welfare state, with a budget of $43 billion
in 2015-16 for a range of subsidies. The Government of India has been leveraging national
digital IDs and payment systems across a range of G2P programmes to implement the direct
transfer of benefits. The aim is to limit outlays on subsidies through de-duplication and
efficiency. Among the early successes, savings of over $1.7 billion have been realized
by digitizing the cooking gas subsidy. It is estimated that recurring annual savings of over
$1.2 billion are possible under this programme.
The Indian government is now accelerating the implementation of larger G2P initiatives
that cover employment guarantees, pensions, food, and subsidies for fuel and fertilizers.
These are larger, more complex programmes, and they need to be designed and executed
appropriately to realize the envisioned savings and impact. Programmes like the Mahatma
Gandhi National Rural Employment Guarantee Scheme (MGNREGS), the world’s largest
public employment generation scheme with an annual budget of $6 billion, will need
improvements in governance and a significant overhaul of processes to achieve the
desired outcomes.
The task in India is a mammoth one. The rural population is large and relatively
disconnected, and the large bureaucracy requires coordination across central ministries
and departments, as well as 29 state governments. These challenges are not unique and
would apply to many other countries seeking to increase the efficiency and accountability of
their welfare payments. In India, three key elements converged to enable early success: an
enabling infrastructure, a business case for the G2P partners, and channels such as banks
and agents, which provide a delivery mechanism offering convenience to the customer and
which have adequate grievance redress mechanisms.52
50 http://www.tnp2k.go.id/en/frequently-asked-questions-faqs/unified-database/
51 Better than Cash Alliance 2015 – Philippines Country Diagnostics
52 CGAP. https://www.cgap.org/sites/default/files/Brief-From-Cash-to-Digital-Transfers-in-India-Feb-2015_0.pdf
27
Open APIs enable the private sector to build on public infrastructure and goods. For
example, a national ID system built with open APIs could enable providers to integrate their
systems for KYC. Multiple providers are integrating with the Aadhaar eKYC platform in India
using open APIs and offering a range of credit and P2P lending products. Dwolla is another
relevant example – a payments processing platform that provides money transfer services
and an open API that can integrate its services into other platforms.
Interoperability increases the number of transaction partners and payment options,
encouraging usage and yielding benefits to all stakeholders in the payments ecosystem.
Customers benefit from greater convenience and flexibility, while providers benefit
from sharing the cost of common infrastructure. Bangladesh’s B-Kash, for example, was
able to reach 11 million accounts in just 2.5 years53 thanks to network interoperability.
Interoperability also reduces costs. A 2008 World Bank study estimated that Brazil could
save 0.7% of GDP each year thanks to interoperability.54
Indonesia established the world’s first MNO interoperability agreement in 2013 between the
three main operators. This enables customers in a mobile money scheme in one network
to transact seamlessly with customers in another. In contrast, the lack of interoperability
between MNOs has been a major impediment to the adoption of e-payments in the
Philippines.55 Only recently, two major players, GCash and PayMaya, have started an
interoperability pilot project that may address this issue.
The table below lists specific actions that regulators and policymakers can consider to foster
end-to-end digitization in payments and transfers.
53 https://www.cgap.org/blog/bkash-bangladesh-what-explains-its-fast-start
54 https://www.cgap.org/blog/bkash-bangladesh-what-explains-its-fast-start
55 http://www.ifc.org/wps/wcm/connect/8d518d004799ebf1bb8fff299ede9589/IFC+Tanzania+Case+study+10_03_2015.pdf?MOD=AJPERES
28
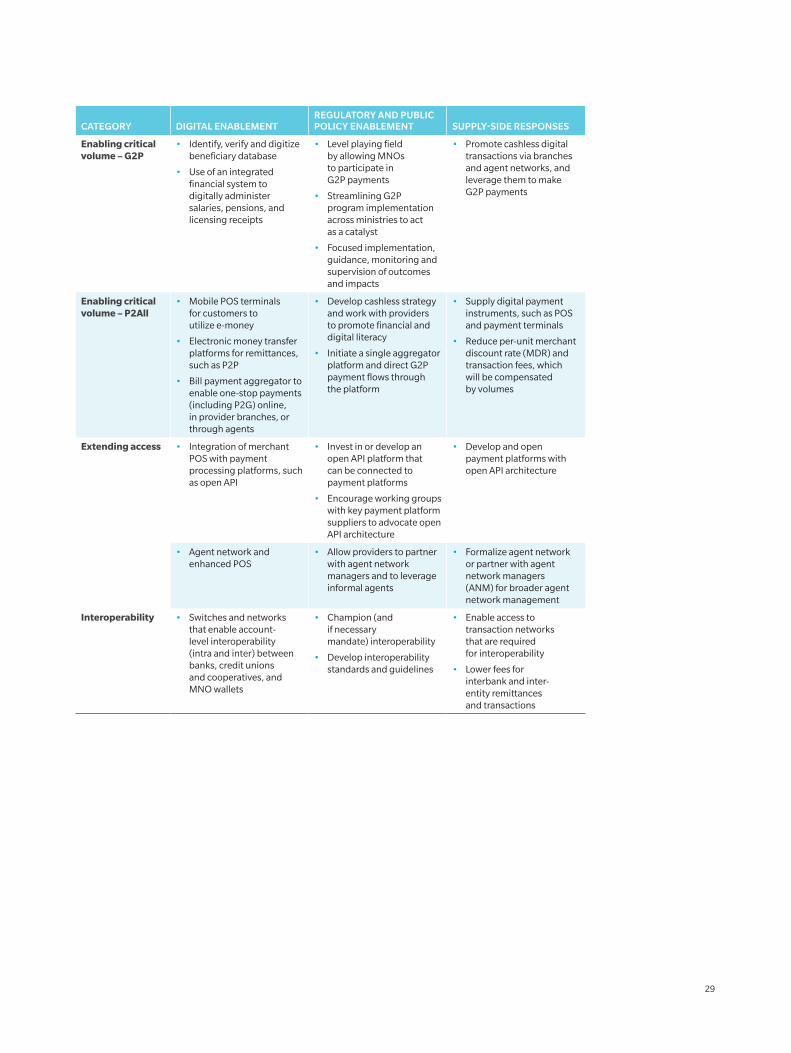
CATEGORY DIGITAL ENABLEMENTREGULATORY AND PUBLIC POLICY ENABLEMENT SUPPLY-SIDE RESPONSES
Enabling critical volume – G2P
• Identify, verify and digitize beneficiary database
• Use of an integrated financial system to digitally administer salaries, pensions, and licensing receipts
• Level playing field by allowing MNOs to participate in G2P payments
• Streamlining G2P program implementation across ministries to act as a catalyst
• Focused implementation, guidance, monitoring and supervision of outcomes and impacts
• Promote cashless digital transactions via branches and agent networks, and leverage them to make G2P payments
Enabling critical volume – P2All
• Mobile POS terminals for customers to utilize e-money
• Electronic money transfer platforms for remittances, such as P2P
• Bill payment aggregator to enable one-stop payments (including P2G) online, in provider branches, or through agents
• Develop cashless strategy and work with providers to promote financial and digital literacy
• Initiate a single aggregator platform and direct G2P payment flows through the platform
• Supply digital payment instruments, such as POS and payment terminals
• Reduce per-unit merchant discount rate (MDR) and transaction fees, which will be compensated by volumes
Extending access • Integration of merchant POS with payment processing platforms, such as open API
• Invest in or develop an open API platform that can be connected to payment platforms
• Encourage working groups with key payment platform suppliers to advocate open API architecture
• Develop and open payment platforms with open API architecture
• Agent network and enhanced POS
• Allow providers to partner with agent network managers and to leverage informal agents
• Formalize agent network or partner with agent network managers (ANM) for broader agent network management
Interoperability • Switches and networks that enable account-level interoperability (intra and inter) between banks, credit unions and cooperatives, and MNO wallets
• Champion (and if necessary mandate) interoperability
• Develop interoperability standards and guidelines
• Enable access to transaction networks that are required for interoperability
• Lower fees for interbank and inter-entity remittances and transactions
29
4.4. CREDIT – RISK REDUCTION VIA ADDITIONAL DATA AND ANALYTICS
Access to credit enables investment in human capital and businesses, and has the potential
to reduce inequality in society and drive economic growth. However, commercial banks
often have limited appetite to offer credit to BoP individuals and MSMEs for a variety
of reasons:
• Lenders often struggle to understand the risk profiles of people who are less integrated into the financial system, due to a lack of customer data with which to assess creditworthiness. For example, the people may have no credit file, no track record of using financial services, and no verifiable information about themselves.
• Some members of the population are ineligible to access formal credit because they lack a lack of formal income, required identification, or collateral. These barriers also drive gender imbalances in access to credit.
• People living in rural areas typically have less access to physical banking infrastructure, because the density of branches is significantly lower. Consequently, they face a higher opportunity cost to reach a formal lender, because of the time taken to travel.
Faced with limited options, unbanked and underbanked people often turn to informal
channels, where they may be charged significantly higher interest rates and are vulnerable
to exploitation by the less-scrupulous business practices of unregulated players.
The introduction of branchless banking, often accompanied by simplified KYC requirements,
enables providers to leverage agent networks and target rural populations. However,
credit access remains challenging for three key reasons. First, in the case of individual
micro-finance loans, there is not yet any proven alternative to the manual underwriting
performed by credit officers. They live and work in these areas, and can thus use their local
knowledge when underwriting credit. Second, the presence of a credit bureau does not
necessarily translate into the availability of credit data. For example, the public credit bureau
in the Philippines is at an early stage of development and private bureaus cover only 9% of
the adult population.56 Third, the lack of formal documents limits credit access, because
providers are unable to verify a customer’s identity or their source and level of income.
Hence, providers restrict loans to minimize fraud and credit risk.
We have identified two key enhancements through which the traditional credit value chain
(as it applies to our target segments) can be digitally disrupted. (See Exhibit 7)
56 http://compendium.mastercard.com/app/SKU_pdfs/alternativeData.pdf
30
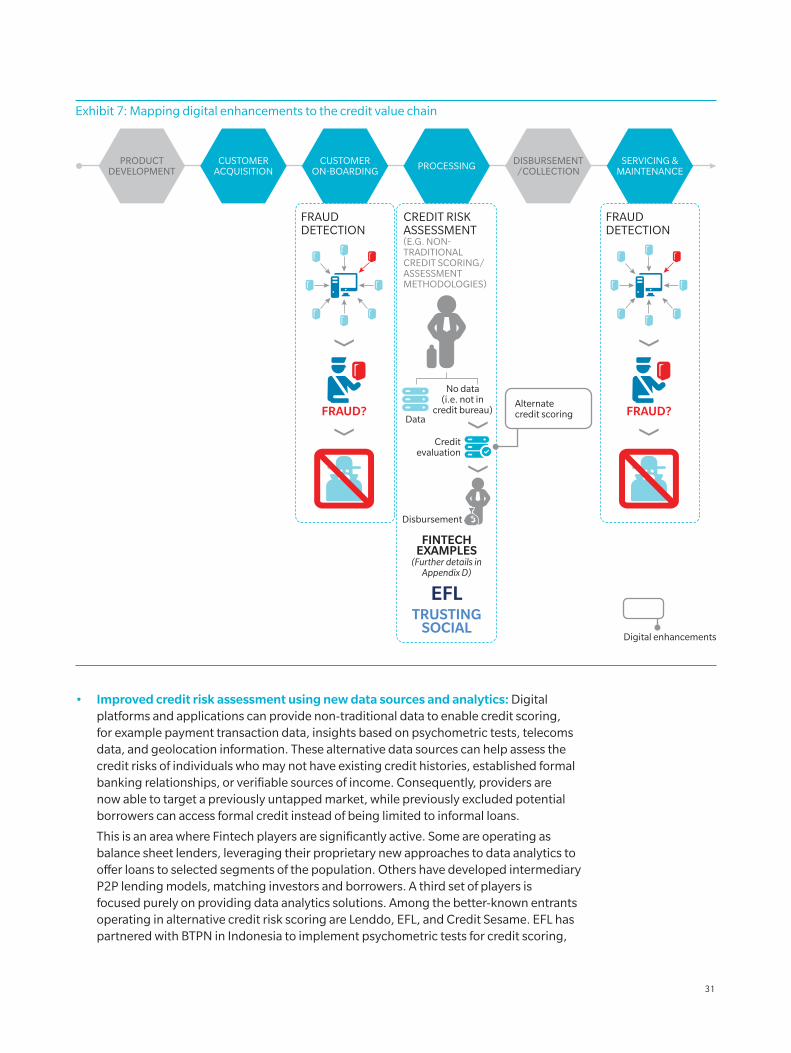
• Improved credit risk assessment using new data sources and analytics: Digital platforms and applications can provide non-traditional data to enable credit scoring, for example payment transaction data, insights based on psychometric tests, telecoms data, and geolocation information. These alternative data sources can help assess the credit risks of individuals who may not have existing credit histories, established formal banking relationships, or verifiable sources of income. Consequently, providers are now able to target a previously untapped market, while previously excluded potential borrowers can access formal credit instead of being limited to informal loans.
This is an area where Fintech players are significantly active. Some are operating as balance sheet lenders, leveraging their proprietary new approaches to data analytics to offer loans to selected segments of the population. Others have developed intermediary P2P lending models, matching investors and borrowers. A third set of players is focused purely on providing data analytics solutions. Among the better-known entrants operating in alternative credit risk scoring are Lenddo, EFL, and Credit Sesame. EFL has partnered with BTPN in Indonesia to implement psychometric tests for credit scoring,
Exhibit 7: Mapping digital enhancements to the credit value chain
PRODUCTDEVELOPMENT
CUSTOMERACQUISITION
CUSTOMERON-BOARDING PROCESSING DISBURSEMENT
/COLLECTIONSERVICING &
MAINTENANCE
Alternatecredit scoring
FINTECHEXAMPLES
(Further details inAppendix D)
EFLTRUSTING
SOCIAL
No data(i.e. not in
credit bureau)
Disbursement
Creditevaluation
Data
CREDIT RISKASSESSMENT(E.G. NON-TRADITIONALCREDIT SCORING/ASSESSMENT METHODOLOGIES)
FRAUDDETECTION
FRAUD?
FRAUDDETECTION
FRAUD?
Digital enhancements
31
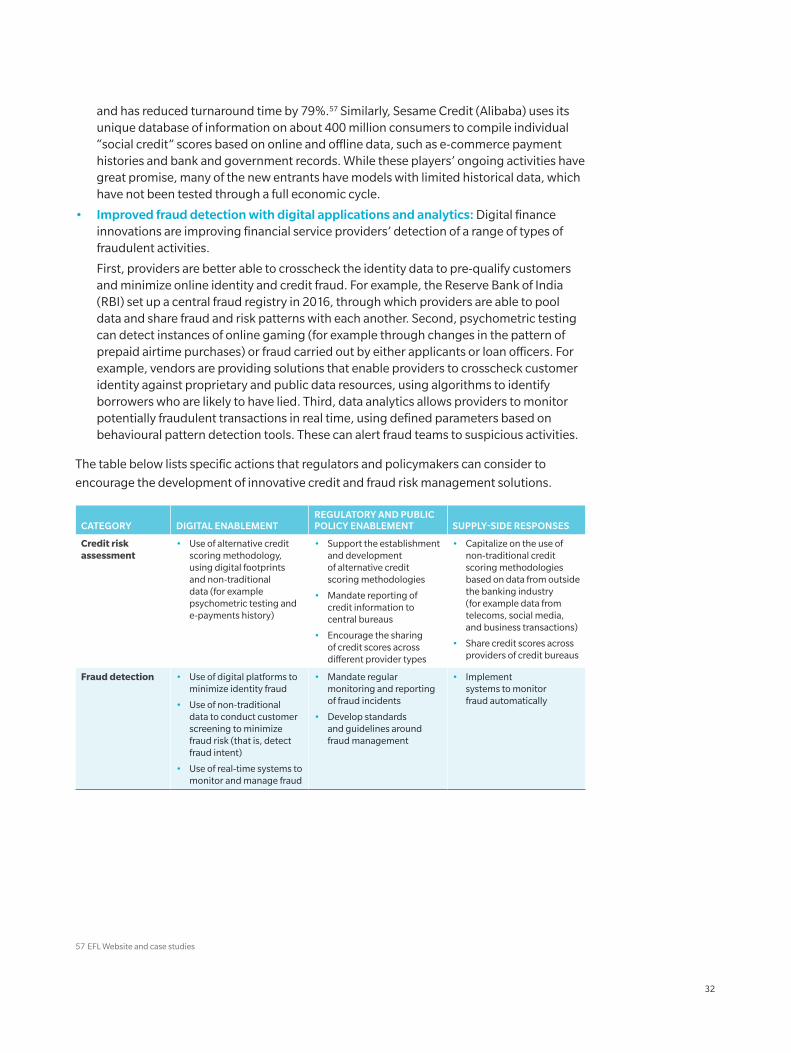
and has reduced turnaround time by 79%.57 Similarly, Sesame Credit (Alibaba) uses its unique database of information on about 400 million consumers to compile individual “social credit” scores based on online and offline data, such as e-commerce payment histories and bank and government records. While these players’ ongoing activities have great promise, many of the new entrants have models with limited historical data, which have not been tested through a full economic cycle.
• Improved fraud detection with digital applications and analytics: Digital finance innovations are improving financial service providers’ detection of a range of types of fraudulent activities.
First, providers are better able to crosscheck the identity data to pre-qualify customers and minimize online identity and credit fraud. For example, the Reserve Bank of India (RBI) set up a central fraud registry in 2016, through which providers are able to pool data and share fraud and risk patterns with each another. Second, psychometric testing can detect instances of online gaming (for example through changes in the pattern of prepaid airtime purchases) or fraud carried out by either applicants or loan officers. For example, vendors are providing solutions that enable providers to crosscheck customer identity against proprietary and public data resources, using algorithms to identify borrowers who are likely to have lied. Third, data analytics allows providers to monitor potentially fraudulent transactions in real time, using defined parameters based on behavioural pattern detection tools. These can alert fraud teams to suspicious activities.
The table below lists specific actions that regulators and policymakers can consider to
encourage the development of innovative credit and fraud risk management solutions.
CATEGORY DIGITAL ENABLEMENTREGULATORY AND PUBLIC POLICY ENABLEMENT SUPPLY-SIDE RESPONSES
Credit risk assessment
• Use of alternative credit scoring methodology, using digital footprints and non-traditional data (for example psychometric testing and e-payments history)
• Support the establishment and development of alternative credit scoring methodologies
• Mandate reporting of credit information to central bureaus
• Encourage the sharing of credit scores across different provider types
• Capitalize on the use of non-traditional credit scoring methodologies based on data from outside the banking industry (for example data from telecoms, social media, and business transactions)
• Share credit scores across providers of credit bureaus
Fraud detection • Use of digital platforms to minimize identity fraud
• Use of non-traditional data to conduct customer screening to minimize fraud risk (that is, detect fraud intent)
• Use of real-time systems to monitor and manage fraud
• Mandate regular monitoring and reporting of fraud incidents
• Develop standards and guidelines around fraud management
• Implement systems to monitor fraud automatically
57 EFL Website and case studies
32
4.5. SAVINGS – COST-EFFECTIVE MOBILIZATION
By saving in the formal financial system, individuals can safeguard their money, earn a
financial return, smooth their expense flows, reduce their dependence on credit, and build
up account balances to enable them to deal better with shocks (for example to cope with
unexpected emergencies such as family illnesses).
However, the BoP segment typically does not save formally for a variety of reasons. These
include bureaucracy (dealing with banks), cost, and physical (and in some cases even
cultural) barriers. This issue is most clearly seen in Cambodia, which has the lowest rate of
formal saving of the four countries. While 69% of the population has saved money in the
past year, only 10% saved at a financial institution.58 However, it became apparent through
anecdotal evidence that most low-income Cambodians participate in “Ton Tin” – local
rotating savings and credit associations (or ROSCAs). Members of these long-standing
informal groups commit small amounts of surplus cash on the basis of trust. In return,
members get access to a pool of capital in times of need and the promise of more-lucrative59
monthly interest than that offered by the banks.
We identify the following key ways through which digital technology can help to disrupt the
savings value chain:
• Increase access to savings products: Providers can offer access to broader segments of the population through mobile devices. By linking dedicated savings accounts to mobile money or e-wallets, users now can access a savings account at a licensed deposit-taking institution and earn interest. The account can be automatically topped up using mobile money or cash stored in e-wallets. Similarly, money can easily be transferred out for payments using mobile or e-money.
• Increase cash-in and cash-out points: Agent networks enable individuals to access additional outlets for cash-in and cash-out. They can be supported by digital technology to enable providers to monitor liquidity in real time so as to ensure that agents do not run out of cash. This has had an impact in Indonesia following the introduction of basic savings accounts (“TabunganKu”), with more than 12 million new accounts opening in the first four years of the scheme (up to April 2014).60 Also, the branchless banking program (Laku Pandai), piloted in 2013 and rolled out in 2014, has resulted in 1.1 million new customers.61 Consequently, the proportion of Indonesians saving at a financial institution increased from 15% in 2011 to 27% in 2014. The Philippines, by contrast, does not have similar initiatives, and the percentage of the population that saved at a financial institution was flat at 15% in both 2011 and 2014.
58 2015 FinScope Consumer Survey (Cambodia)
59 As compared to the 2% to 2.5% per annum offered at banks.
60 http://siteresources.worldbank.org/EXTFINANCIALSECTOR/Resources/282884-1339624653091/8703882-1339624678024/8703850-1412710292190/Driving-Indonesian-FinInclusion-through-Basic-Savings-Accounts.pdf (April 2014)
61 http://www.thejakartapost.com/news/2016/01/05/ojk-invites-more-players-join-branchless-banking-program.html
33
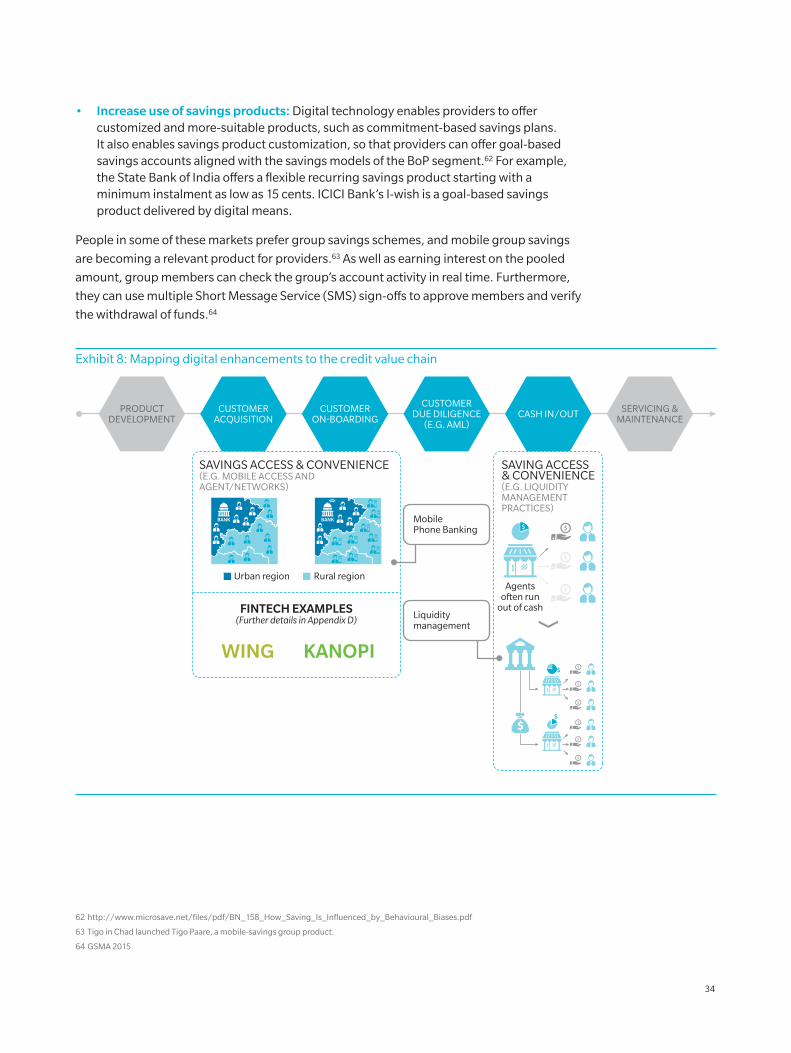
• Increase use of savings products: Digital technology enables providers to offer customized and more-suitable products, such as commitment-based savings plans. It also enables savings product customization, so that providers can offer goal-based savings accounts aligned with the savings models of the BoP segment.62 For example, the State Bank of India offers a flexible recurring savings product starting with a minimum instalment as low as 15 cents. ICICI Bank’s I-wish is a goal-based savings product delivered by digital means.
People in some of these markets prefer group savings schemes, and mobile group savings
are becoming a relevant product for providers.63 As well as earning interest on the pooled
amount, group members can check the group’s account activity in real time. Furthermore,
they can use multiple Short Message Service (SMS) sign-offs to approve members and verify
the withdrawal of funds.64
62 http://www.microsave.net/files/pdf/BN_158_How_Saving_Is_Influenced_by_Behavioural_Biases.pdf
63 Tigo in Chad launched Tigo Paare, a mobile-savings group product.
64 GSMA 2015
Exhibit 8: Mapping digital enhancements to the credit value chain
PRODUCTDEVELOPMENT
CUSTOMERACQUISITION
CUSTOMERON-BOARDING
CUSTOMERDUE DILIGENCE
(E.G. AML)CASH IN/OUT SERVICING &
MAINTENANCE
Agentsoften run
out of cashLiquiditymanagement
SAVINGS ACCESS & CONVENIENCE(E.G. MOBILE ACCESS ANDAGENT/NETWORKS)
FINTECH EXAMPLES(Further details in Appendix D)
WING KANOPI
BANKBANK
Urban region Rural region
SAVING ACCESS& CONVENIENCE(E.G. LIQUIDITYMANAGEMENTPRACTICES)
MobilePhone Banking
34
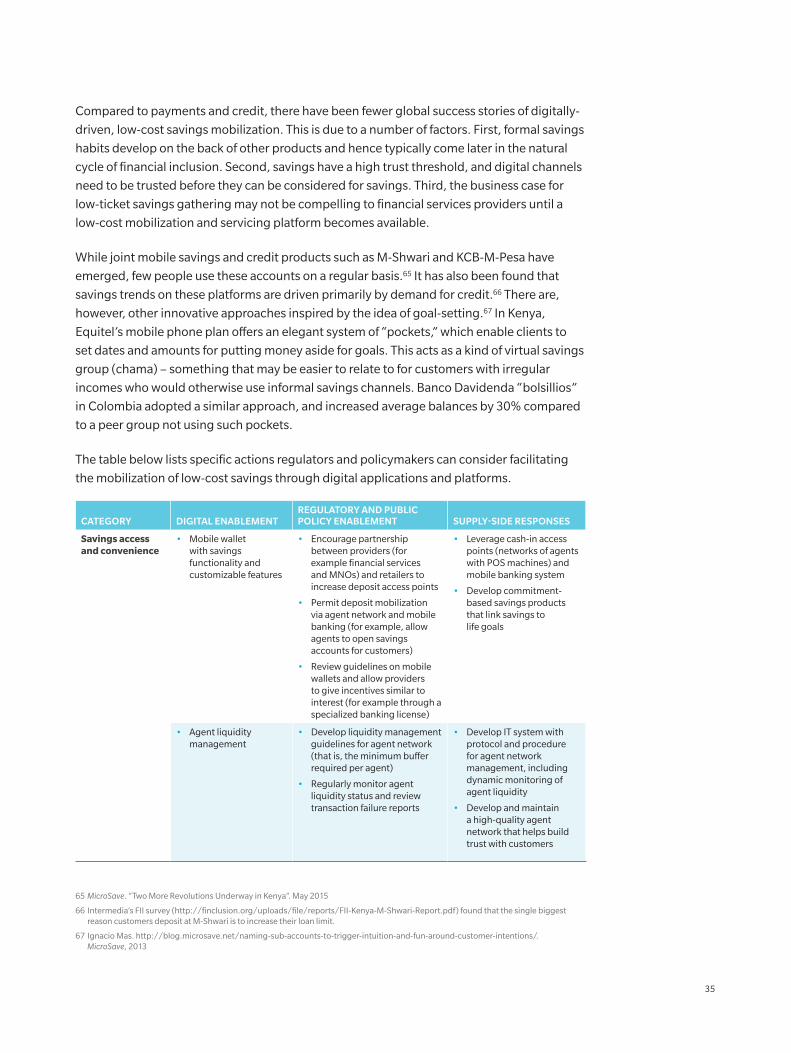
Compared to payments and credit, there have been fewer global success stories of digitally-
driven, low-cost savings mobilization. This is due to a number of factors. First, formal savings
habits develop on the back of other products and hence typically come later in the natural
cycle of financial inclusion. Second, savings have a high trust threshold, and digital channels
need to be trusted before they can be considered for savings. Third, the business case for
low-ticket savings gathering may not be compelling to financial services providers until a
low-cost mobilization and servicing platform becomes available.
While joint mobile savings and credit products such as M-Shwari and KCB-M-Pesa have
emerged, few people use these accounts on a regular basis.65 It has also been found that
savings trends on these platforms are driven primarily by demand for credit.66 There are,
however, other innovative approaches inspired by the idea of goal-setting.67 In Kenya,
Equitel’s mobile phone plan offers an elegant system of “pockets,” which enable clients to
set dates and amounts for putting money aside for goals. This acts as a kind of virtual savings
group (chama) – something that may be easier to relate to for customers with irregular
incomes who would otherwise use informal savings channels. Banco Davidenda “bolsillios”
in Colombia adopted a similar approach, and increased average balances by 30% compared
to a peer group not using such pockets.
The table below lists specific actions regulators and policymakers can consider facilitating
the mobilization of low-cost savings through digital applications and platforms.
CATEGORY DIGITAL ENABLEMENTREGULATORY AND PUBLIC POLICY ENABLEMENT SUPPLY-SIDE RESPONSES
Savings access and convenience
• Mobile wallet with savings functionality and customizable features
• Encourage partnership between providers (for example financial services and MNOs) and retailers to increase deposit access points
• Permit deposit mobilization via agent network and mobile banking (for example, allow agents to open savings accounts for customers)
• Review guidelines on mobile wallets and allow providers to give incentives similar to interest (for example through a specialized banking license)
• Leverage cash-in access points (networks of agents with POS machines) and mobile banking system
• Develop commitment-based savings products that link savings to life goals
• Agent liquidity management
• Develop liquidity management guidelines for agent network (that is, the minimum buffer required per agent)
• Regularly monitor agent liquidity status and review transaction failure reports
• Develop IT system with protocol and procedure for agent network management, including dynamic monitoring of agent liquidity
• Develop and maintain a high-quality agent network that helps build trust with customers
65 MicroSave. “Two More Revolutions Underway in Kenya”. May 2015
66 Intermedia’s FII survey (http://finclusion.org/uploads/file/reports/FII-Kenya-M-Shwari-Report.pdf) found that the single biggest reason customers deposit at M-Shwari is to increase their loan limit.
67 Ignacio Mas. http://blog.microsave.net/naming-sub-accounts-to-trigger-intuition-and-fun-around-customer-intentions/. MicroSave, 2013
35
4.6. IMPACT OF DIGITAL FINANCE ON INSURANCE
We recognise that there may be significant digital opportunities in micro-insurance.
However, the micro-insurance segment is still at an early stage of development in each of
the focus markets we studied, and most of the digital insurance solutions are still in the early
stages of pilot runs. We therefore believe that the impact of digital finance on insurance and,
in turn, that of insurance on financial inclusion overall will be limited over the next five years.
There is potential demand from millions of people for insurance products designed and
custom-delivered for low-income segments, particularly where state support networks are
underdeveloped. For example, in Asia, insurance coverage levels are less than 5%.68 Mobile
insurance – that is, micro-insurance services offered through mobile phones – is emerging
as a medium that could accelerate growth. An estimated 20 million clients have been served
in the past four or five years.69 The biggest gain mobile technology offers micro-insurance
is the capacity to make up for the lack of traditional economic infrastructure in developing
economies, which has limited the spread of insurance products. Increased process efficiency,
through reduced turnaround times and paper load, makes low-value, high-volume
transactions more viable. Ultimately, these cost savings increase affordability and allow
insurance to reach a larger client base.
THE NEW FACE OF INSURANCE
Mobile Network Operators (MNOs) already offer a total of more than 120 insurance services
in 33 emerging markets. As seen below from the different payment models available,
the role of MNOs has become more strategic over time. MNOs now play across the value
chain: They are responsible for branding, marketing, and shaping products, as well as for
servicing the customer relationship. Their reach across the value chain is also reflected by
their acquisitions of insurance licenses and their strategic investments and partnerships
with technical service providers (TSPs). Examples of these include Telenor’s investment in
MicroEnsure to establish a joint venture in Asia, and Tigo’s group-wide partnership with
BIMA in South Africa.
68 MicroSave analysis and websites of providers
69 MicroSave analysis and websites of providers
36
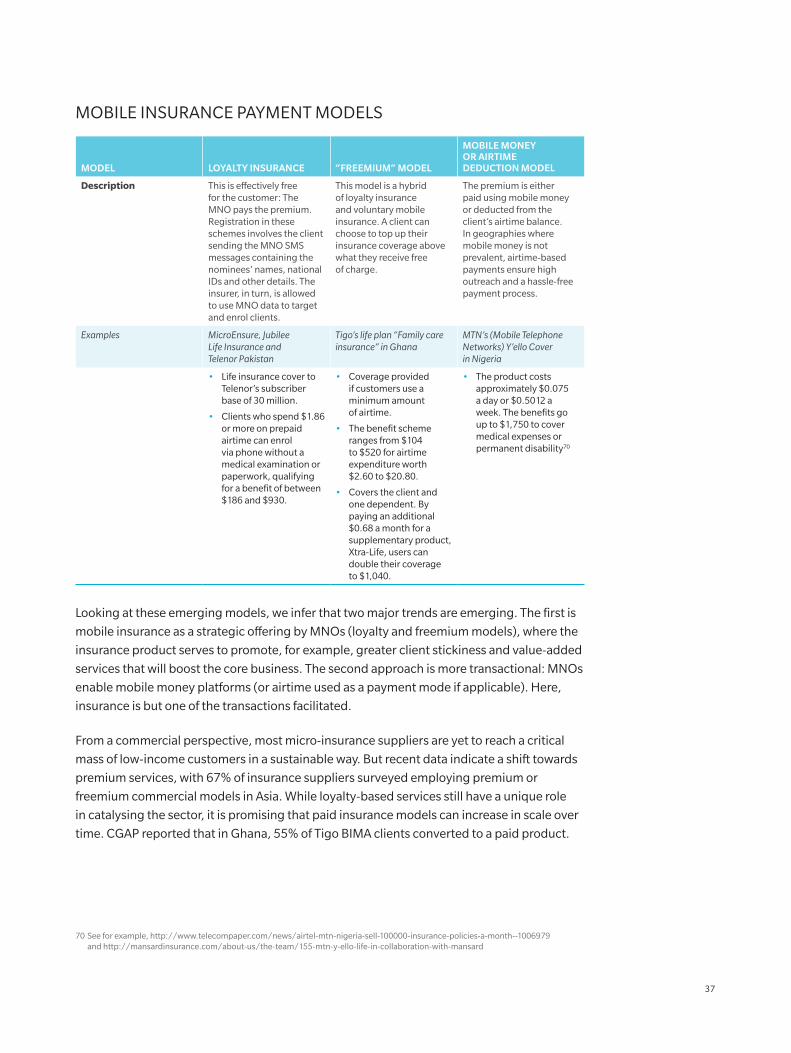
MOBILE INSURANCE PAYMENT MODELS
MODEL LOYALTY INSURANCE “FREEMIUM“ MODEL
MOBILE MONEY OR AIRTIME DEDUCTION MODEL
Description This is effectively free for the customer: The MNO pays the premium. Registration in these schemes involves the client sending the MNO SMS messages containing the nominees’ names, national IDs and other details. The insurer, in turn, is allowed to use MNO data to target and enrol clients.
This model is a hybrid of loyalty insurance and voluntary mobile insurance. A client can choose to top up their insurance coverage above what they receive free of charge.
The premium is either paid using mobile money or deducted from the client’s airtime balance. In geographies where mobile money is not prevalent, airtime-based payments ensure high outreach and a hassle-free payment process.
Examples MicroEnsure, Jubilee Life Insurance and Telenor Pakistan
Tigo’s life plan “Family care insurance” in Ghana
MTN’s (Mobile Telephone Networks) Y’ello Cover in Nigeria
• Life insurance cover to Telenor’s subscriber base of 30 million.
• Clients who spend $1.86 or more on prepaid airtime can enrol via phone without a medical examination or paperwork, qualifying for a benefit of between $186 and $930.
• Coverage provided if customers use a minimum amount of airtime.
• The benefit scheme ranges from $104 to $520 for airtime expenditure worth $2.60 to $20.80.
• Covers the client and one dependent. By paying an additional $0.68 a month for a supplementary product, Xtra-Life, users can double their coverage to $1,040.
• The product costs approximately $0.075 a day or $0.5012 a week. The benefits go up to $1,750 to cover medical expenses or permanent disability70
Looking at these emerging models, we infer that two major trends are emerging. The first is
mobile insurance as a strategic offering by MNOs (loyalty and freemium models), where the
insurance product serves to promote, for example, greater client stickiness and value-added
services that will boost the core business. The second approach is more transactional: MNOs
enable mobile money platforms (or airtime used as a payment mode if applicable). Here,
insurance is but one of the transactions facilitated.
From a commercial perspective, most micro-insurance suppliers are yet to reach a critical
mass of low-income customers in a sustainable way. But recent data indicate a shift towards
premium services, with 67% of insurance suppliers surveyed employing premium or
freemium commercial models in Asia. While loyalty-based services still have a unique role
in catalysing the sector, it is promising that paid insurance models can increase in scale over
time. CGAP reported that in Ghana, 55% of Tigo BIMA clients converted to a paid product.
70 See for example, http://www.telecompaper.com/news/airtel-mtn-nigeria-sell-100000-insurance-policies-a-month--1006979 and http://mansardinsurance.com/about-us/the-team/155-mtn-y-ello-life-in-collaboration-with-mansard
37
REGULATORY CHALLENGES OF MOBILE INSURANCE AND CUSTOMER PROTECTION
The role of regulatory entities is first and foremost to protect the interests of customers.
This role becomes more critical when the customers come from low-income population
segments. The introduction of a new interface, new players, and new partnerships between
multiple actors (insurers, MNOs and TSPs) means that mobile insurance customers face
greater risks than when they purchase regular, non-digital micro-insurance products. There
are regulatory and supervisory challenges due to dealing with new business models and
because several regulatory bodies might be involved.
In mobile insurance, there are essentially three challenges:
1. Regulatory arbitrage:
Mobile insurance often engages more than one regulator: the central bank or chief financial regulator controlling financial transactions, the insurance regulator, and the telecoms regulator. This leads to possible conflicts between the regulators over payments, consumer protection principles, infrastructure, agents, and processes. The result can be a sense of confusion for market players, which may incentivize some to take undue advantage of it to implement processes that conflict with consumer interests. Hence, there is an emerging need for greater dialogue and coordination amongst regulators in order to keep up with these ‘disruptive models’, to ensure transparency and to safeguard consumers’ interests.
2. New types of players and partnership models disrupting the insurance value chain:
As a disruptive technology, mobile insurance is leading new intermediaries to enter the insurance value chain, such as BIMA and MicroEnsure, which provide third-party technical services. It is a challenge to manage the dealings of these entities with more-traditional players like insurers and MNOs. The story of Ecolife is a precautionary tale for regulators. Ecolife, a Zimbabwean mobile insurance offering, was launched by a partnership between First Mutual Life (an insurer), Econet (an MNO), and Trustco (the technical-support provider). The product grew to cover nearly 20% of the adult population of Zimbabwe within a short period. However, the product had to be called off abruptly due to a dispute between Econet and Trustco. Overnight, 1.6 million people lost their coverage. As a result, insurance suffered a serious loss of reputation and trust.
So regulators need to consider how to regulate such emerging partnerships, and to ensure that client interests are safeguarded when such partnerships sour. Clear exit guidelines could be drawn up, using ideas like a living will.
38
3. Other protection challenges driven by digital processes:
The digital interface creates consumer protection risks that need to be recognized by regulators. These include:71
A. Lack of transparency on terms and costs due to the limits imposed by the digital mechanism – notably that an SMS can only contain 160 characters
B. Fraudulent usage of SIM cards shared by different people and the hacking of phones and accounts
C. Data privacy and protection
D. Inadequate and unclear consumer recourse for complaints and disputes
E. Increased risk of consumer detriment72 due to the digital sales process: a poor choice of product when they are sold by non-insurance sales staff; or a lack of effort in sales
F. Technology and internet weaknesses, such as low connectivity and server breakdown
G. Lack of access to physical support infrastructure, making grievance redressal a challenge for low-income customers: They may not be comfortable with call centres and staff may not speak the local language; or they may not have access to smart phones to engage with Internet sites
H. Mobile money or airtime balances may be debited incorrectly
I. Concerns over loss of cover if a customer loses their phone or changes their phone number
71 Adapted from “The emergence of Responsible Digital Finance” (Zimmerman, 2014) and from https://www.responsiblefinanceforum.org/wp-content/uploads/140828_CGAP-Presentation.pdf http://www.smartcampaign.org/storage/documents/Tools_and_Resources/EoS_Risk_identification_and_analysis_vSA_AR_LT.pdf
72 Consumer detriment is defined as “consumers purchasing on price without considering the difference in quality of product and post-sale charges; the sale of add-on products; and firms manufacturing products that are of little use to the customers who buy them” (Friel, 2012).
39
4.7. REGULATORY OVERSIGHT – DATA GOVERNANCE AND CUSTOMER PROTECTION
While digital innovation can provide a significant boost to financial inclusion, digital
finance presents regulators with new challenges for achieving their objective of consumer
protection. The supply-side ecosystem is changing rapidly and growing more complex,
and risks are increasing related to data governance. In an increasingly digital world, there
is an exponential increase in data generated by individuals’ digital footprints. This includes
information on whom they call, what they write in texts, whom they engage with on social
media, and which websites they visit. The increase in data raises a variety of data governance
issues relating to how data is accessed, used, stored, and shared. The BoP is a particularly
vulnerable segment given its low awareness of these issues, its lack of alternative options (for
example to access credit), and its challenges in effectively voicing grievances. Public policy
will have a vital role in consumer education and protection. Suitable policies and regulations
will be essential to articulate the responsibilities of supply-side participants and to ensure
compliance. Specifically, guidelines will be needed on dispute resolution management, data
standards and protocols, control mechanisms, and reporting requirements.
40
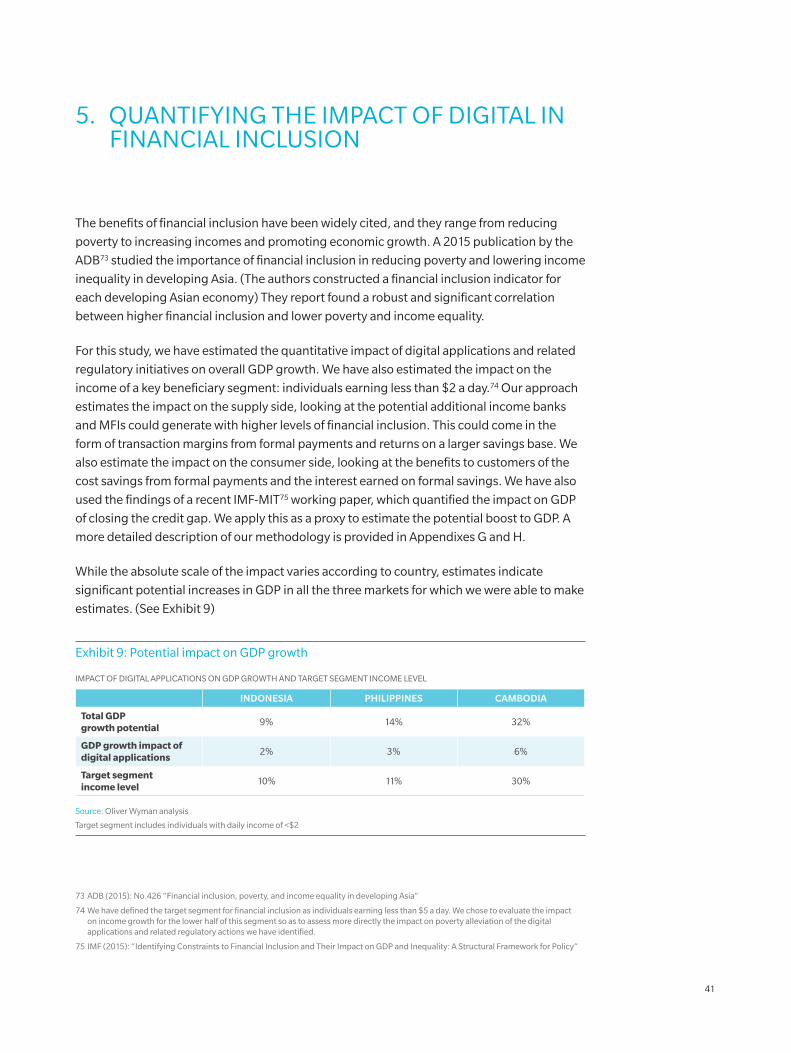
5. QUANTIFYING THE IMPACT OF DIGITAL IN FINANCIAL INCLUSION
The benefits of financial inclusion have been widely cited, and they range from reducing
poverty to increasing incomes and promoting economic growth. A 2015 publication by the
ADB73 studied the importance of financial inclusion in reducing poverty and lowering income
inequality in developing Asia. (The authors constructed a financial inclusion indicator for
each developing Asian economy) They report found a robust and significant correlation
between higher financial inclusion and lower poverty and income equality.
For this study, we have estimated the quantitative impact of digital applications and related
regulatory initiatives on overall GDP growth. We have also estimated the impact on the
income of a key beneficiary segment: individuals earning less than $2 a day.74 Our approach
estimates the impact on the supply side, looking at the potential additional income banks
and MFIs could generate with higher levels of financial inclusion. This could come in the
form of transaction margins from formal payments and returns on a larger savings base. We
also estimate the impact on the consumer side, looking at the benefits to customers of the
cost savings from formal payments and the interest earned on formal savings. We have also
used the findings of a recent IMF-MIT75 working paper, which quantified the impact on GDP
of closing the credit gap. We apply this as a proxy to estimate the potential boost to GDP. A
more detailed description of our methodology is provided in Appendixes G and H.
While the absolute scale of the impact varies according to country, estimates indicate
significant potential increases in GDP in all the three markets for which we were able to make
estimates. (See Exhibit 9)
Exhibit 9: Potential impact on GDP growth
IMPACT OF DIGITAL APPLICATIONS ON GDP GROWTH AND TARGET SEGMENT INCOME LEVEL
INDONESIA PHILIPPINES CAMBODIA
Total GDP growth potential
9% 14% 32%
GDP growth impact of digital applications
2% 3% 6%
Target segment income level
10% 11% 30%
Source: Oliver Wyman analysis
Target segment includes individuals with daily income of <$2
73 ADB (2015): No.426 “Financial inclusion, poverty, and income equality in developing Asia”
74 We have defined the target segment for financial inclusion as individuals earning less than $5 a day. We chose to evaluate the impact on income growth for the lower half of this segment so as to assess more directly the impact on poverty alleviation of the digital applications and related regulatory actions we have identified.
75 IMF (2015): “Identifying Constraints to Financial Inclusion and Their Impact on GDP and Inequality: A Structural Framework for Policy”
41
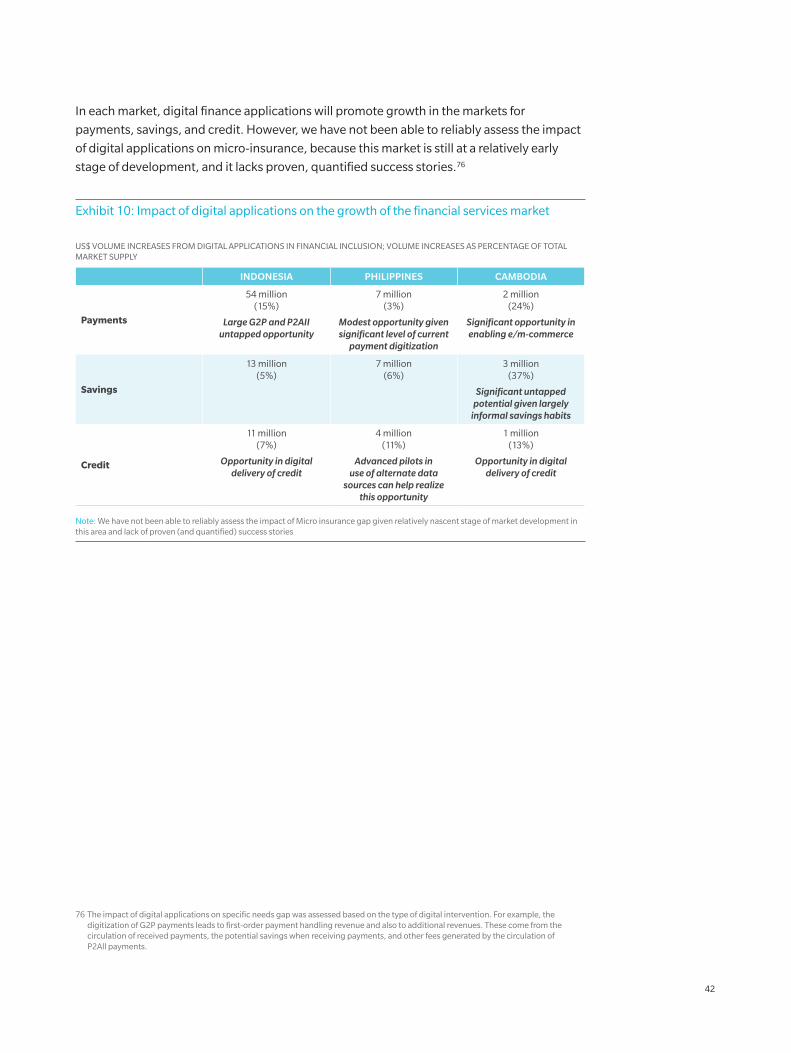
In each market, digital finance applications will promote growth in the markets for
payments, savings, and credit. However, we have not been able to reliably assess the impact
of digital applications on micro-insurance, because this market is still at a relatively early
stage of development, and it lacks proven, quantified success stories.76
Exhibit 10: Impact of digital applications on the growth of the financial services market
US$ VOLUME INCREASES FROM DIGITAL APPLICATIONS IN FINANCIAL INCLUSION; VOLUME INCREASES AS PERCENTAGE OF TOTAL MARKET SUPPLY
INDONESIA PHILIPPINES CAMBODIA
Payments
54 million (15%)
Large G2P and P2AII untapped opportunity
7 million (3%)
Modest opportunity given significant level of current
payment digitization
2 million (24%)
Significant opportunity in enabling e/m-commerce
Savings
13 million (5%)
7 million (6%)
3 million (37%)
Significant untapped potential given largely
informal savings habits
Credit
11 million (7%)
Opportunity in digital delivery of credit
4 million (11%)
Advanced pilots in use of alternate data
sources can help realize this opportunity
1 million (13%)
Opportunity in digital delivery of credit
Note: We have not been able to reliably assess the impact of Micro insurance gap given relatively nascent stage of market development in this area and lack of proven (and quantified) success stories
76 The impact of digital applications on specific needs gap was assessed based on the type of digital intervention. For example, the digitization of G2P payments leads to first-order payment handling revenue and also to additional revenues. These come from the circulation of received payments, the potential savings when receiving payments, and other fees generated by the circulation of P2All payments.
42
6. SEGMENT-SPECIFIC INSIGHTS
Previous sections of this report primarily drew out general observations about how far digital
technology can boost financial inclusion. This section provides insights on two specific
segments: women and MSMEs. It details the constraints they face, some potential solutions
from digital finance, and recommendations for regulatory initiatives.
6.1. WOMEN
More women now have access to formal financial services than ever before. Female account
ownership worldwide increased from 47% in 2011 to 58% in 2014.77 The gender gap in
account ownership has also narrowed over time, and now stands at 7% points globally
and 4% points in East Asia and the Pacific. According to 2014 data from Findex, the gender
gap has actually reversed in Indonesia (minus 3%) and the Philippines (minus 13%), so the
percentage of women who own accounts in these markets is higher than that of men.
While this progress is significant, one should not infer that women have achieved the
same level of financial inclusion as men. First, there is still a significant gender gap in basic
financial access in many parts of the world. Myanmar, for example, has a significant gender
gap in account ownership (11%), as does South Asia (18%). Second, as we broaden our
perspective from account ownership to financial services needs and usage, significant
gender-related challenges remain. A recent study in Indonesia by IFC and USAID78 found
that 40% of women managing SMEs perceived bank procedures for the extension of credit
as too complicated, compared with just 28% of male managers. From supply-side interviews
conducted during the course of this study, we identified a general lack of focus on women in
the development of financial services solutions.
77 Global Findex database
78 “Women-owned SMEs in Indonesia: A Golden opportunity for Local Financial Institutions”
43
We identified three substantive gender-related issues during the course of this study:
• Difficulty in meeting loan eligibility criteria: While lending policies followed by banks are gender-neutral, unintended gender biases follow from the nature of the credit policy rules and requirements generally in place. For example, most lending to SMEs is based on collateral. Because of the gender gap in asset ownership, it is difficult for women to secure a loan without a male asset owner in her family co-signing the loan document. Women are less likely to own their business site than men: Data from Indonesia indicates that 43% of men own their business sites, compared with only 35% of women. Women are also less likely than men to have land in their name. Recent data is not available for most countries, but 2004 data from Viet Nam showed a gender gap of 20%79 in agricultural land ownership, and 2010 data from Bangladesh showed a gap of 42%.
• Lack of customized products and services: The supply side tends not to develop products and solutions specifically for women. There is also a related lack of understanding and appreciation of challenges specific to women. For example, family responsibilities and cultural practices may create time pressures that restrict a woman’s ability to travel to a branch to make loan repayments. A doorstep payment pickup service or some other alternative may be a significant convenience for women but not as valuable to men. However, there is little evidence that such nuances are appreciated by the financial services industry. A 2016 IFC survey of banking service expectations showed that 54% of respondents prefer female banking agents over male. However, the same survey found that 97% of agents currently are men.
• Gender gap in technology access: A 2015 GSMA study found that women are on average 14% less likely to own a mobile phone than men.80 As seen in Indonesia, women also have a lower adoption rate of digital technology: 47% do not use a computer at all, compared to 40% of men.81 To complicate matters further, women have lower levels of financial literacy. Only 20 to 25% of women were evaluated as “well versed” in financial services in the Baseline Financial Literacy Survey conducted by OJK in Indonesia in 2013. As a result of these factors, women may not be able to take full advantage of digital financial service offerings.
79 FAO database on Gender and Land Rights
80 http://www.gsmamobileeconomy.com/GSMA_Global_Mobile_Economy_Report_2015.pdf
81 IFC 2016 “Women-owned SMEs in Indonesia: A Golden Opportunity for Local Financial Institutions”
44
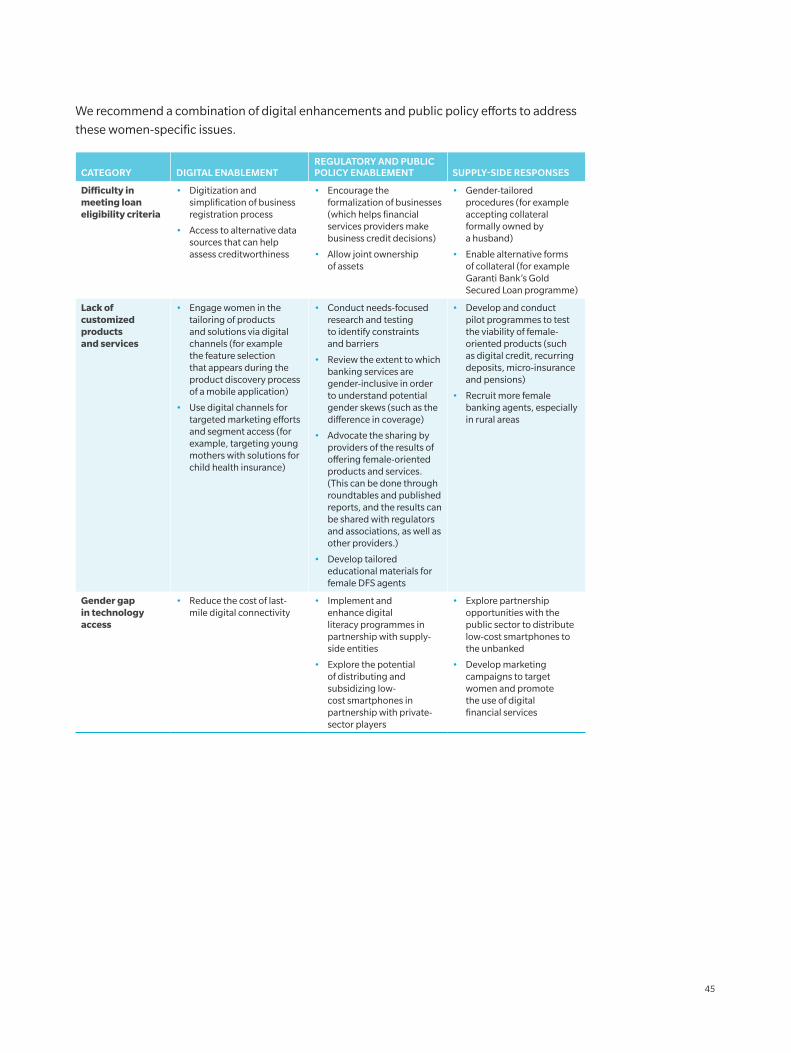
We recommend a combination of digital enhancements and public policy efforts to address
these women-specific issues.
CATEGORY DIGITAL ENABLEMENTREGULATORY AND PUBLIC POLICY ENABLEMENT SUPPLY-SIDE RESPONSES
Difficulty in meeting loan eligibility criteria
• Digitization and simplification of business registration process
• Access to alternative data sources that can help assess creditworthiness
• Encourage the formalization of businesses (which helps financial services providers make business credit decisions)
• Allow joint ownership of assets
• Gender-tailored procedures (for example accepting collateral formally owned by a husband)
• Enable alternative forms of collateral (for example Garanti Bank’s Gold Secured Loan programme)
Lack of customized products and services
• Engage women in the tailoring of products and solutions via digital channels (for example the feature selection that appears during the product discovery process of a mobile application)
• Use digital channels for targeted marketing efforts and segment access (for example, targeting young mothers with solutions for child health insurance)
• Conduct needs-focused research and testing to identify constraints and barriers
• Review the extent to which banking services are gender-inclusive in order to understand potential gender skews (such as the difference in coverage)
• Advocate the sharing by providers of the results of offering female-oriented products and services. (This can be done through roundtables and published reports, and the results can be shared with regulators and associations, as well as other providers.)
• Develop tailored educational materials for female DFS agents
• Develop and conduct pilot programmes to test the viability of female-oriented products (such as digital credit, recurring deposits, micro-insurance and pensions)
• Recruit more female banking agents, especially in rural areas
Gender gap in technology access
• Reduce the cost of last-mile digital connectivity
• Implement and enhance digital literacy programmes in partnership with supply-side entities
• Explore the potential of distributing and subsidizing low-cost smartphones in partnership with private-sector players
• Explore partnership opportunities with the public sector to distribute low-cost smartphones to the unbanked
• Develop marketing campaigns to target women and promote the use of digital financial services
45
We have seen a number of successful examples of digitally driven financial inclusion
initiatives that target women. These case studies highlight the economic viability of such
solutions, so other providers can offer their own versions. We have listed three examples
below. Each has features that have proven popular with women, though the products are not
only for women.
• Telenor “Easypaisa – Kushaal Beema” (Pakistan): Kushaal Beema is a feature of the regular Easypaisa account that incentivizes higher balances. The product is a non-interest bearing account with a minimum balance of $20, which offers life and accidental death insurance of up to $9,850. The product incentivizes customers to save because the insurance cover is tiered, and increases with the savings balance. Clients also have the flexibility to nominate an insured person (through their name and national ID) separate from the account owner. This product’s embedded insurance feature is aligned with women’s needs and their concerns for the stability and security of their families.
• KBS Local Bank “Daily and Weekly Savings” (India): This product emphasizes the power of incremental small savings to build larger sums, and helps to build discipline. Women can be flexible about what and how much they deposit, and they can easily access the services, as deposits can be collected at their doorsteps. This feature is particularly well suited for women, because they often have part-time jobs where cash flow is seasonal or volatile.
• Banco Davidenda “bolsillios” (Colombia): The bank introduced a “pockets” functionality, through which clients set up to four time-determined goals every month. Clients are able to alter settings and track their progress anytime. This feature increased
average balances by 30% compared to a non-pocket peer group.
46
6.2. MSMEs
MSMEs typically employ the vast majority of working adults in an economy and contribute a
significant share of its GDP. For Asia Pacific it is estimated that they employ 96% of working
adults and contribute 42% of GDP.82 Like all businesses, MSMEs need access to capital
and credit in order to operate and expand. Spreading credit access to MSMEs has been a
cornerstone of financial sector development policy in most emerging economies, including
the markets we have focused on. For example, Indonesia initiated a public credit guarantee
scheme for MSMEs called People’s Business Credit (KUR) in 2007, which guarantees
between 70% and 80% of credit granted. In the Philippines, banks are required to set aside
10% of their loan books for MSMEs.83
In spite of such efforts, MSMEs continue to be held back by a significant gap between their
financing needs and the available supply. A survey conducted by the World Bank revealed
that 41% of SMEs in least-developed countries (LDCs) report access to finance as a major
constraint impeding their growth and development.84 An Indonesia-wide survey conducted
by Oliver Wyman in 2014 revealed that 44% of transitioning microenterprises85 located
in rural Indonesia86 do not currently have any outstanding loan. Of these, 35% said they
needed a loan but did not have access to one, while another 30% said they were likely to
need to borrow in the foreseeable future.
While the MSME financing gap has been the subject of much public policy debate and
economic analysis, the revenue opportunities MSMEs offer in funding and payments have
often been overlooked. We estimate that about 700,000 SMEs in Indonesia together take up
more than 40% of the total low-cost retail and SME funding available on the market.
MSMEs’ financial services product and solution gaps differ according to the size of the
business. Micro businesses generally face the most acute credit gaps, but many of them may
be difficult to serve because of the challenges involved in accessing them and underwriting
their credit risk. Established SMEs are relatively well covered by formal financial services
providers, but they often need financing on flexible terms to manage their working capital
gaps. This segment should also be a natural target for value-added services provided via
digital platforms. Between these is the “missing middle,” which has significant unmet needs,
as these businesses are often excluded by both MFIs focusing on micro businesses and
banks focusing on established SMEs.
82 Asia SME finance monitor 2014
83 http://www.oecd.org/cfe/smes/adb-oecd-study-enhancing-financial-accessibility-smes.pdf
84 http://www.worldbank.org/en/results/2013/04/05/msme-finance-expanding-opportunities-and-creating-jobs
85 Businesses with monthly revenue of 10 rupiah to 100 million rupiah
86 Refers to rural Kabupaten: regions with a population less than 500,000 and where more than 70% of the population is classified as rural by the Indonesia Bureau of Statistics
47
Below are more-detailed descriptions of the different needs and available formal supply in
MSME sub-segments.
• Micro (businesses with $10,000 to $100,000 in annual turnover): These businesses often struggle to access credit from commercial banks because of their lack of credible financial statements, limited assets to use as collateral, and lack of banking and credit history. This segment is mainly served by MFIs, as they have less-strict collateral policies, do not require borrowers to have previous banking or credit experience, and have deep local access that is critical to serving the segment. It is worth mentioning that BRI in Indonesia is a notable exception to this general observation, showing that commercial banks can also seize the opportunities in this segment if they develop a focused business model.
• Missing middle (defined as businesses with $100,000 to $1 million in annual turnover87): Thesegment is often overlooked, as it is too large for MFIs and too small for banks. A 2016 report by Oliver Wyman estimates that lack of access to Indonesia’s missing middle represents a lost opportunity of $130 billion to the broader Indonesian economy (approximately 14% of GDP).
While missing-middle businesses are larger and more likely to be formally registered, they share a number of challenges with micro businesses. Financial statements are often available but hardly reliable. Past credit was often with informal lenders and MFIs, so the data is not available to formal financial services providers for credit underwriting. Also, their banking histories are generally limited. This segment has been specifically targeted by some emerging alternative digital-financing platforms. New, on-balance-sheet digital lenders and marketplace lending platforms have emerged to offer credit to this segment on easier and more flexible terms in countries like the People’s Republic of China, India, and Indonesia. These credit arrangements are often underwritten on the basis of newer or more-granular data sources, such as transaction-level payments data, which are still not commonly used by commercial banks.
• Established SMEs (defined as businesses with $1 million to $5 million in annual turnover): These businesses are generally well banked and have access to formal credit. However, they should be the natural target for value-added services provided via digital platforms.
87 Oliver Wyman 2016: “Time for marketplace lending”
48
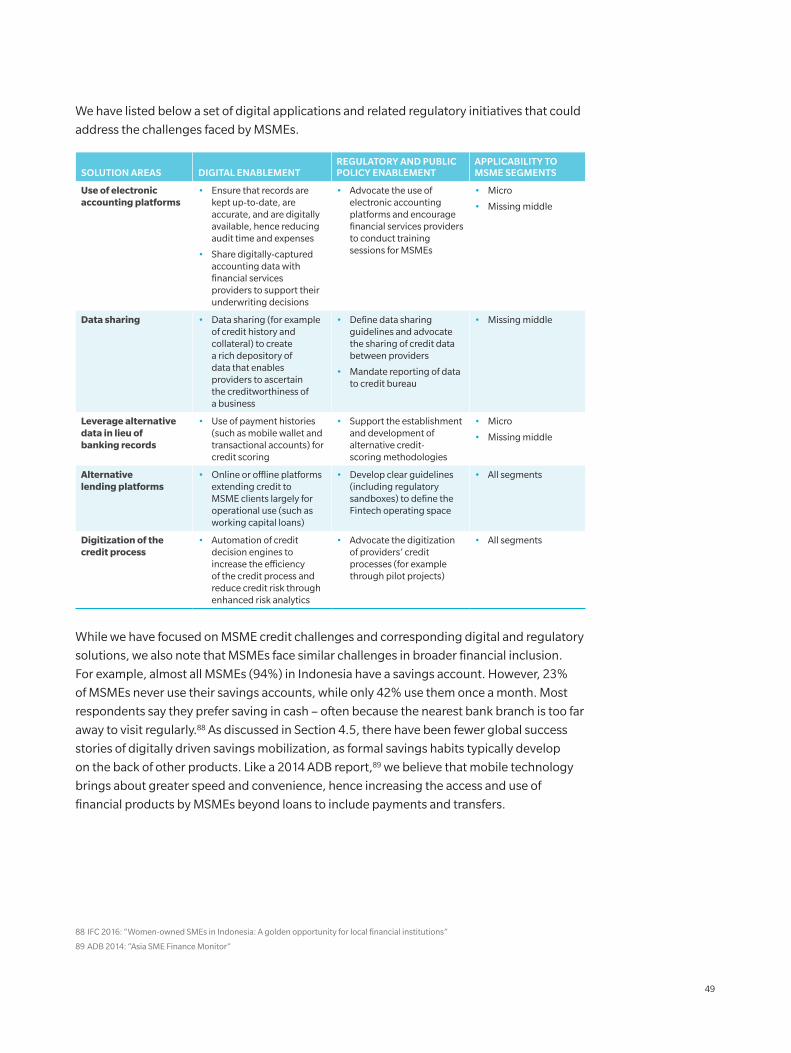
We have listed below a set of digital applications and related regulatory initiatives that could
address the challenges faced by MSMEs.
SOLUTION AREAS DIGITAL ENABLEMENTREGULATORY AND PUBLIC POLICY ENABLEMENT
APPLICABILITY TO MSME SEGMENTS
Use of electronic accounting platforms
• Ensure that records are kept up-to-date, are accurate, and are digitally available, hence reducing audit time and expenses
• Share digitally-captured accounting data with financial services providers to support their underwriting decisions
• Advocate the use of electronic accounting platforms and encourage financial services providers to conduct training sessions for MSMEs
• Micro
• Missing middle
Data sharing • Data sharing (for example of credit history and collateral) to create a rich depository of data that enables providers to ascertain the creditworthiness of a business
• Define data sharing guidelines and advocate the sharing of credit data between providers
• Mandate reporting of data to credit bureau
• Missing middle
Leverage alternative data in lieu of banking records
• Use of payment histories (such as mobile wallet and transactional accounts) for credit scoring
• Support the establishment and development of alternative credit-scoring methodologies
• Micro
• Missing middle
Alternative lending platforms
• Online or offline platforms extending credit to MSME clients largely for operational use (such as working capital loans)
• Develop clear guidelines (including regulatory sandboxes) to define the Fintech operating space
• All segments
Digitization of the credit process
• Automation of credit decision engines to increase the efficiency of the credit process and reduce credit risk through enhanced risk analytics
• Advocate the digitization of providers’ credit processes (for example through pilot projects)
• All segments
While we have focused on MSME credit challenges and corresponding digital and regulatory
solutions, we also note that MSMEs face similar challenges in broader financial inclusion.
For example, almost all MSMEs (94%) in Indonesia have a savings account. However, 23%
of MSMEs never use their savings accounts, while only 42% use them once a month. Most
respondents say they prefer saving in cash – often because the nearest bank branch is too far
away to visit regularly.88 As discussed in Section 4.5, there have been fewer global success
stories of digitally driven savings mobilization, as formal savings habits typically develop
on the back of other products. Like a 2014 ADB report,89 we believe that mobile technology
brings about greater speed and convenience, hence increasing the access and use of
financial products by MSMEs beyond loans to include payments and transfers.
88 IFC 2016: “Women-owned SMEs in Indonesia: A golden opportunity for local financial institutions”
89 ADB 2014: “Asia SME Finance Monitor”
49
7. COUNTRY-SPECIFIC INSIGHTS
This section provides summary findings from the four countries that we studied: Indonesia,
the Philippines, Cambodia, and Myanmar. We analyse the supply gap at country level, and
summarize the results of the barrier analysis. We list key constraints and how they might be
addressed through digital finance solutions. We also propose regulatory and supply-side
responses that could enable these digital enhancements. Each country-specific sub-section
concludes with an impact assessment, including the effect on GDP growth.
7.1. INDONESIA
Of the four focus countries, Indonesia is the largest market and has the largest untapped
opportunities. Indonesia has stepped up efforts in financial inclusion and made significant
progress over the last five years. Account ownership increased from 20% to 36% in the three
years to 2014.90 However, significant gaps still remain: Informal service providers continue to
dominate the financial inclusion landscape, with 59% of savings and 77% of borrowing still
conducted informally; nearly half (45%) of all micro businesses say they have underserved
credit needs.
We estimate that Indonesia’s GDP could increase by more than 8% if the financial inclusion
gap were closed. Digital enablement can be a powerful part of this solution. We estimate
that corresponding digital applications and related regulatory initiatives could boost GDP
by about 2%, produce more than $50 billion in additional electronic payment flows, trigger
more than $11 billion in additional credit uptake, and mobilize $13 billion of savings.
7.1.1. ANALYSIS OF THE GAP BETWEEN NEEDS AND FORMAL SUPPLY
We have assessed Indonesia’s needs and formal supply in payments, savings, credit,
and insurance.
In payments and transfers the gap exceeds $140 billion, with only 35% of the target
segment’s needs currently met. The level of payment digitization is fairly limited: Only 16%
of government transfers are paid into a recipient’s account at a financial services provider
or mobile wallet.91 Domestic remittances remain mostly cash-based, and only 36% are
received through a financial institution or mobile wallet. It is heartening to note that the
government and regulator are now aggressively pursuing the digitization of G2P payments.
This may help provide critical volume in electronic payment flows and eventually lead to the
development of an electronic payments ecosystem.
90 2014 Findex database
91 Global Findex database 2014 dataset
50
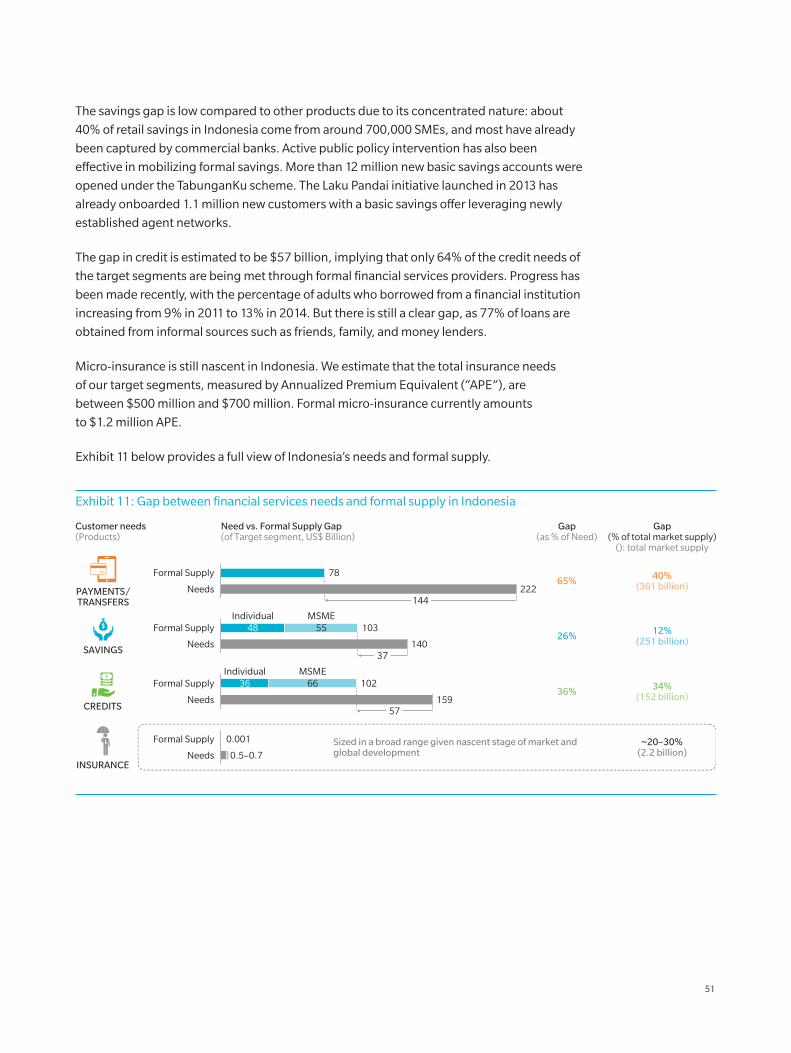
The savings gap is low compared to other products due to its concentrated nature: about
40% of retail savings in Indonesia come from around 700,000 SMEs, and most have already
been captured by commercial banks. Active public policy intervention has also been
effective in mobilizing formal savings. More than 12 million new basic savings accounts were
opened under the TabunganKu scheme. The Laku Pandai initiative launched in 2013 has
already onboarded 1.1 million new customers with a basic savings offer leveraging newly
established agent networks.
The gap in credit is estimated to be $57 billion, implying that only 64% of the credit needs of
the target segments are being met through formal financial services providers. Progress has
been made recently, with the percentage of adults who borrowed from a financial institution
increasing from 9% in 2011 to 13% in 2014. But there is still a clear gap, as 77% of loans are
obtained from informal sources such as friends, family, and money lenders.
Micro-insurance is still nascent in Indonesia. We estimate that the total insurance needs
of our target segments, measured by Annualized Premium Equivalent (“APE”), are
between $500 million and $700 million. Formal micro-insurance currently amounts
to $1.2 million APE.
Exhibit 11 below provides a full view of Indonesia’s needs and formal supply.
Exhibit 11: Gap between financial services needs and formal supply in Indonesia
~20–30%(2.2 billion)
12%(251 billion)
34%(152 billion)
40%(361 billion)
36%
26%
65%
Customer needs(Products)
Needs
Formal Supply
222
78
SAVINGS
CREDITS
PAYMENTS/TRANSFERS
INSURANCE
Need vs. Formal Supply Gap(of Target segment, US$ Billion)
Gap(as % of Need)
Gap(% of total market supply)
(): total market supply
Sized in a broad range given nascent stage of market and global development0.5–0.7
0.001
Individual MSME
MSMEIndividual
Formal Supply
Needs
Needs
Formal Supply
140
1035548
Formal Supply
Needs
1026636
159
144
37
57
51
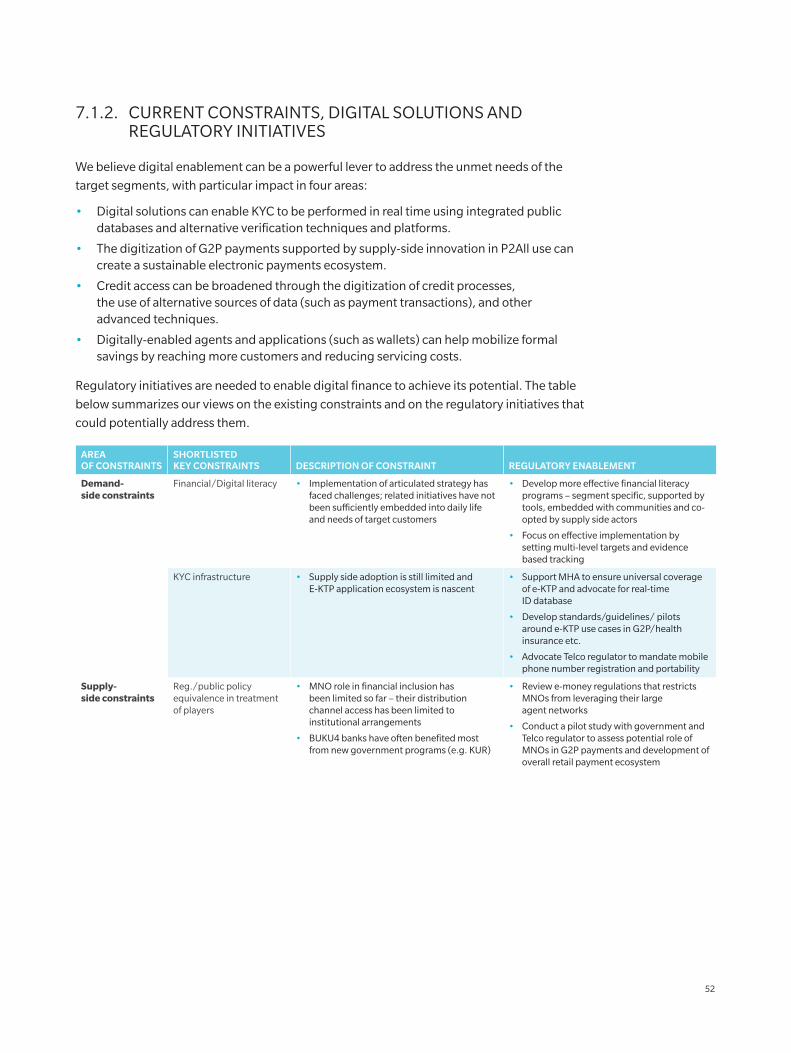
7.1.2. CURRENT CONSTRAINTS, DIGITAL SOLUTIONS AND REGULATORY INITIATIVES
We believe digital enablement can be a powerful lever to address the unmet needs of the
target segments, with particular impact in four areas:
• Digital solutions can enable KYC to be performed in real time using integrated public databases and alternative verification techniques and platforms.
• The digitization of G2P payments supported by supply-side innovation in P2All use can create a sustainable electronic payments ecosystem.
• Credit access can be broadened through the digitization of credit processes, the use of alternative sources of data (such as payment transactions), and other advanced techniques.
• Digitally-enabled agents and applications (such as wallets) can help mobilize formal savings by reaching more customers and reducing servicing costs.
Regulatory initiatives are needed to enable digital finance to achieve its potential. The table
below summarizes our views on the existing constraints and on the regulatory initiatives that
could potentially address them.
AREA OF CONSTRAINTS
SHORTLISTED KEY CONSTRAINTS DESCRIPTION OF CONSTRAINT REGULATORY ENABLEMENT
Demand-side constraints
Financial/Digital literacy • Implementation of articulated strategy has faced challenges; related initiatives have not been sufficiently embedded into daily life and needs of target customers
• Develop more effective financial literacy programs – segment specific, supported by tools, embedded with communities and co-opted by supply side actors
• Focus on effective implementation by setting multi-level targets and evidence based tracking
KYC infrastructure • Supply side adoption is still limited and E-KTP application ecosystem is nascent
• Support MHA to ensure universal coverage of e-KTP and advocate for real-time ID database
• Develop standards/guidelines/ pilots around e-KTP use cases in G2P/health insurance etc.
• Advocate Telco regulator to mandate mobile phone number registration and portability
Supply-side constraints
Reg./public policy equivalence in treatment of players
• MNO role in financial inclusion has been limited so far – their distribution channel access has been limited to institutional arrangements
• BUKU4 banks have often benefited most from new government programs (e.g. KUR)
• Review e-money regulations that restricts MNOs from leveraging their large agent networks
• Conduct a pilot study with government and Telco regulator to assess potential role of MNOs in G2P payments and development of overall retail payment ecosystem
52
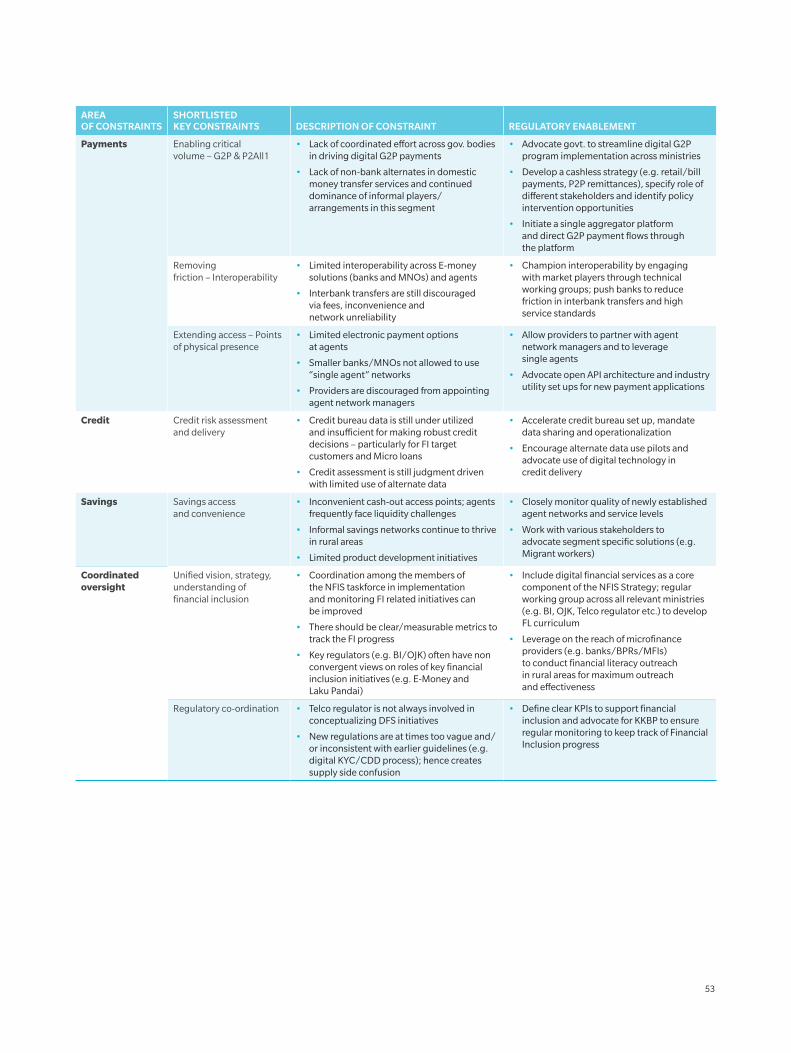
AREA OF CONSTRAINTS
SHORTLISTED KEY CONSTRAINTS DESCRIPTION OF CONSTRAINT REGULATORY ENABLEMENT
Payments Enabling critical volume – G2P & P2All1
• Lack of coordinated effort across gov. bodies in driving digital G2P payments
• Lack of non-bank alternates in domestic money transfer services and continued dominance of informal players/ arrangements in this segment
• Advocate govt. to streamline digital G2P program implementation across ministries
• Develop a cashless strategy (e.g. retail/bill payments, P2P remittances), specify role of different stakeholders and identify policy intervention opportunities
• Initiate a single aggregator platform and direct G2P payment flows through the platform
Removing friction – Interoperability
• Limited interoperability across E-money solutions (banks and MNOs) and agents
• Interbank transfers are still discouraged via fees, inconvenience and network unreliability
• Champion interoperability by engaging with market players through technical working groups; push banks to reduce friction in interbank transfers and high service standards
Extending access – Points of physical presence
• Limited electronic payment options at agents
• Smaller banks/MNOs not allowed to use “single agent” networks
• Providers are discouraged from appointing agent network managers
• Allow providers to partner with agent network managers and to leverage single agents
• Advocate open API architecture and industry utility set ups for new payment applications
Credit Credit risk assessment and delivery
• Credit bureau data is still under utilized and insufficient for making robust credit decisions – particularly for FI target customers and Micro loans
• Credit assessment is still judgment driven with limited use of alternate data
• Accelerate credit bureau set up, mandate data sharing and operationalization
• Encourage alternate data use pilots and advocate use of digital technology in credit delivery
Savings Savings access and convenience
• Inconvenient cash-out access points; agents frequently face liquidity challenges
• Informal savings networks continue to thrive in rural areas
• Limited product development initiatives
• Closely monitor quality of newly established agent networks and service levels
• Work with various stakeholders to advocate segment specific solutions (e.g. Migrant workers)
Coordinated oversight
Unified vision, strategy, understanding of financial inclusion
• Coordination among the members of the NFIS taskforce in implementation and monitoring FI related initiatives can be improved
• There should be clear/measurable metrics to track the FI progress
• Key regulators (e.g. BI/OJK) often have non convergent views on roles of key financial inclusion initiatives (e.g. E-Money and Laku Pandai)
• Include digital financial services as a core component of the NFIS Strategy; regular working group across all relevant ministries (e.g. BI, OJK, Telco regulator etc.) to develop FL curriculum
• Leverage on the reach of microfinance providers (e.g. banks/BPRs/MFIs) to conduct financial literacy outreach in rural areas for maximum outreach and effectiveness
Regulatory co-ordination • Telco regulator is not always involved in conceptualizing DFS initiatives
• New regulations are at times too vague and/or inconsistent with earlier guidelines (e.g. digital KYC/CDD process); hence creates supply side confusion
• Define clear KPIs to support financial inclusion and advocate for KKBP to ensure regular monitoring to keep track of Financial Inclusion progress
53
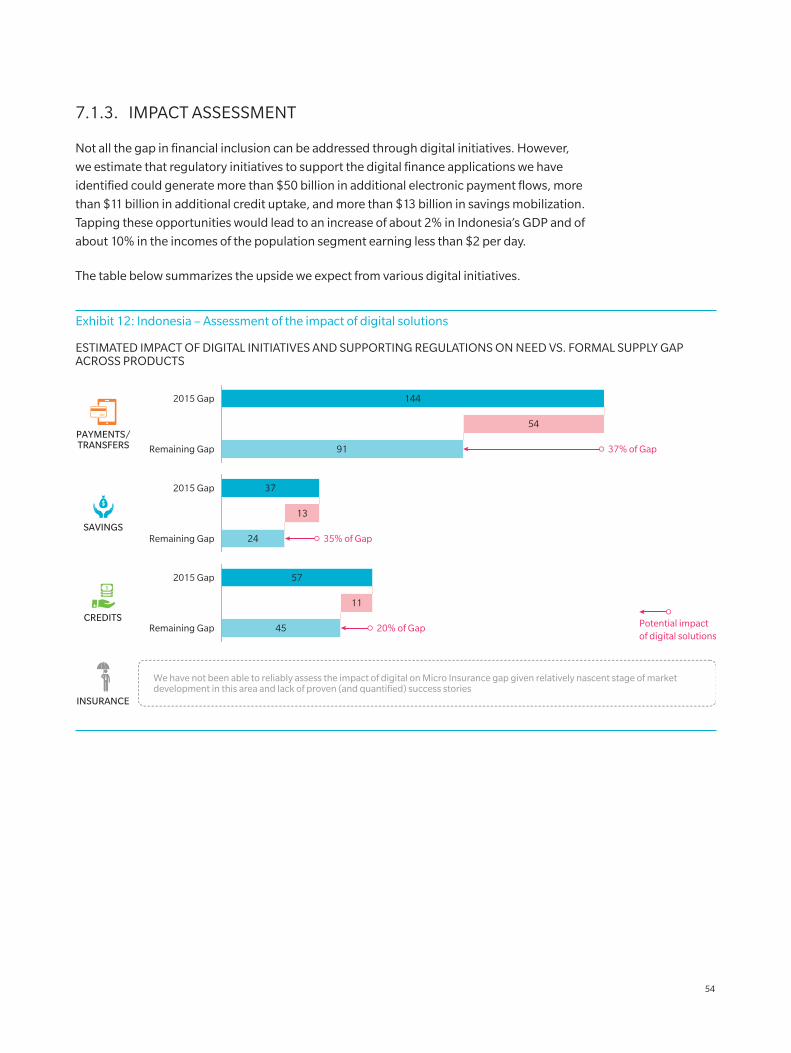
7.1.3. IMPACT ASSESSMENT
Not all the gap in financial inclusion can be addressed through digital initiatives. However,
we estimate that regulatory initiatives to support the digital finance applications we have
identified could generate more than $50 billion in additional electronic payment flows, more
than $11 billion in additional credit uptake, and more than $13 billion in savings mobilization.
Tapping these opportunities would lead to an increase of about 2% in Indonesia’s GDP and of
about 10% in the incomes of the population segment earning less than $2 per day.
The table below summarizes the upside we expect from various digital initiatives.
Exhibit 12: Indonesia – Assessment of the impact of digital solutions
Remaining Gap
2015 Gap
91
144
Remaining Gap
2015 Gap
24
37
SAVINGS
CREDITS
PAYMENTS/TRANSFERS
INSURANCE
We have not been able to reliably assess the impact of digital on Micro Insurance gap given relatively nascent stage of market development in this area and lack of proven (and quantified) success stories
54
13
Remaining Gap
2015 Gap
45
57
11
37% of Gap
35% of Gap
20% of Gap Potential impactof digital solutions
ESTIMATED IMPACT OF DIGITAL INITIATIVES AND SUPPORTING REGULATIONS ON NEED VS. FORMAL SUPPLY GAP ACROSS PRODUCTS
54
7.2. PHILIPPINES
The Philippines has been a regional leader in recognizing financial inclusion as an economic
development priority and putting it at the centre of financial sector development. In spite
of the efforts made over the last decade, access and usage of financial services continue
to be limited in many parts of the archipelago. Only 28% of adults in the Philippines have
a bank account; 92 only about 15% save any money with a formal financial institution over
a 12-month period; and only 10% borrow money from a formal financial institution over a
similar time period.
We estimate that the Philippines’ GDP could increase by more than 14% if the financial
inclusion gap were closed. Digital enablement can be a powerful part of this solution. We
estimate that corresponding digital applications and related regulatory initiatives could
boost GDP by about 3%, produce more than $6 billion in additional electronic payment
flows, lead to more than $4 billion in additional credit uptake, and mobilize more than $7
billion in savings.
7.2.1. ANALYSIS OF THE GAP BETWEEN NEEDS AND FORMAL SUPPLY
We have assessed needs and formal supply for the Philippines in payments, savings, credit,
and insurance.
In payments and transfers, the gap between needs and formal supply gap is $16 billion, with
75% of the target segments’ needs already met via some form electronic payments solution.
The Philippines has a relatively advanced electronic payments landscape. The government
has made active efforts to promote a cash-light society through its 2020 E-Peso project. It
has also directed most G2P payments through digital channels: About 46% of G2P payments
are transferred digitally, and 70% of remittances are being sent or received via electronic
channels, compared to an average of 18% in East Asia and the Pacific.93
The gap for savings is about $20 billion. There is still a high reliance on informal channels
such as ROSCA,3 which account for 78% of all savings. The share of adults who save at a
financial institution has not risen in recent years, remaining at only about 15% between 2011
and 2014.94
92 Global Findex Database
93 USAID and IFC report
94 Global Findex database
55
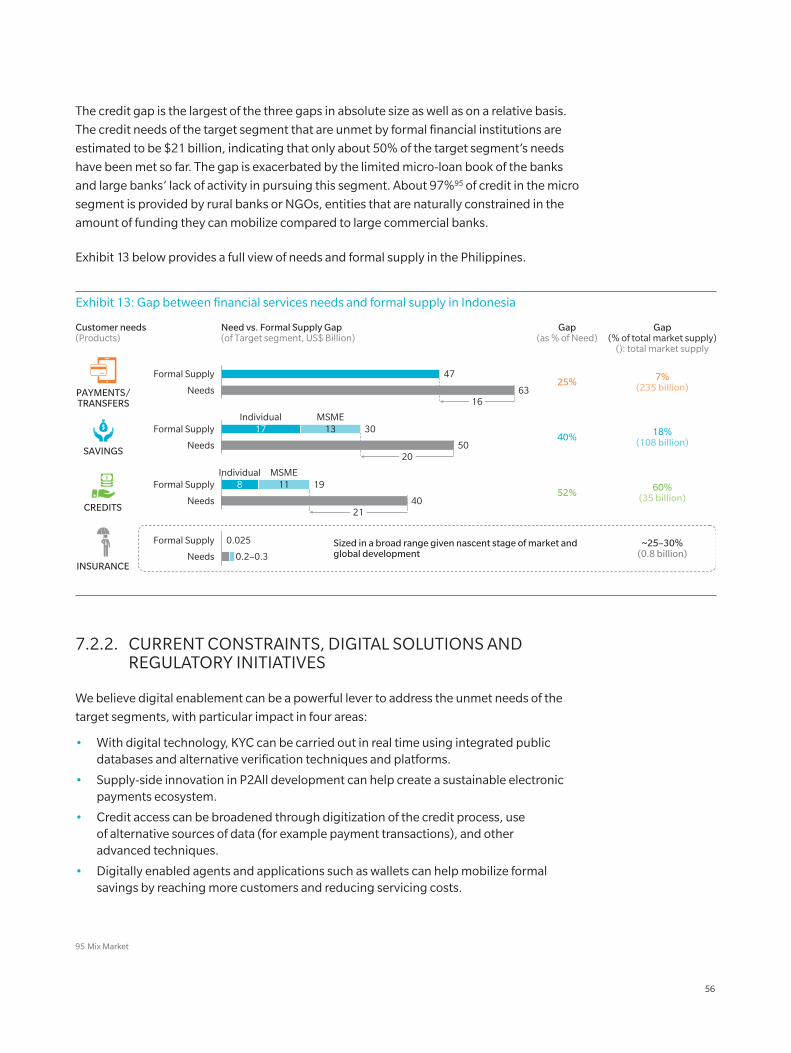
The credit gap is the largest of the three gaps in absolute size as well as on a relative basis.
The credit needs of the target segment that are unmet by formal financial institutions are
estimated to be $21 billion, indicating that only about 50% of the target segment’s needs
have been met so far. The gap is exacerbated by the limited micro-loan book of the banks
and large banks’ lack of activity in pursuing this segment. About 97%95 of credit in the micro
segment is provided by rural banks or NGOs, entities that are naturally constrained in the
amount of funding they can mobilize compared to large commercial banks.
Exhibit 13 below provides a full view of needs and formal supply in the Philippines.
95 Mix Market
Exhibit 13: Gap between financial services needs and formal supply in Indonesia
~25–30%(0.8 billion)
18%(108 billion)
60%(35 billion)
7%(235 billion)
52%
40%
25%
Customer needs(Products)
Needs
Formal Supply
63
47
SAVINGS
CREDITS
PAYMENTS/TRANSFERS
INSURANCE
Need vs. Formal Supply Gap(of Target segment, US$ Billion)
Gap(as % of Need)
Gap(% of total market supply)
(): total market supply
Sized in a broad range given nascent stage of market and global development0.2–0.3
0.025
Individual MSME
MSMEIndividual
Formal Supply
Needs
Needs
Formal Supply
50
301317
Formal Supply
Needs
19118
40
16
20
21
7.2.2. CURRENT CONSTRAINTS, DIGITAL SOLUTIONS AND REGULATORY INITIATIVES
We believe digital enablement can be a powerful lever to address the unmet needs of the
target segments, with particular impact in four areas:
• With digital technology, KYC can be carried out in real time using integrated public databases and alternative verification techniques and platforms.
• Supply-side innovation in P2All development can help create a sustainable electronic payments ecosystem.
• Credit access can be broadened through digitization of the credit process, use of alternative sources of data (for example payment transactions), and other advanced techniques.
• Digitally enabled agents and applications such as wallets can help mobilize formal savings by reaching more customers and reducing servicing costs.
56
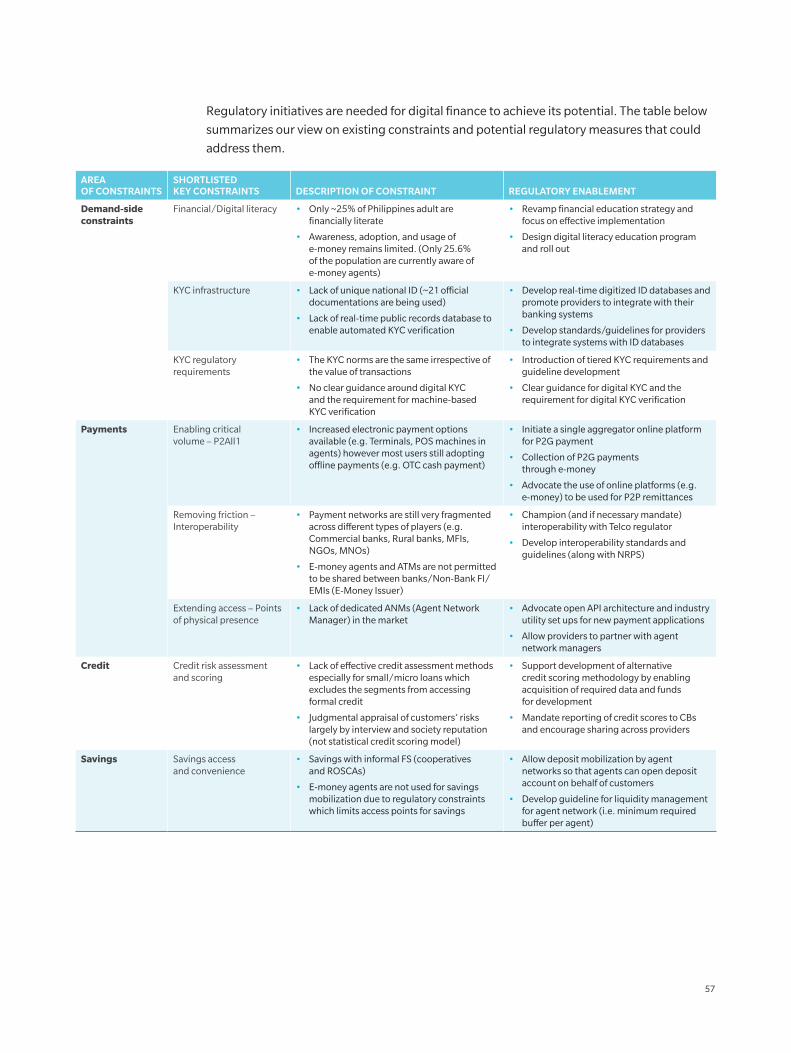
Regulatory initiatives are needed for digital finance to achieve its potential. The table below
summarizes our view on existing constraints and potential regulatory measures that could
address them.
AREA OF CONSTRAINTS
SHORTLISTED KEY CONSTRAINTS DESCRIPTION OF CONSTRAINT REGULATORY ENABLEMENT
Demand-side constraints
Financial/Digital literacy • Only ~25% of Philippines adult are financially literate
• Awareness, adoption, and usage of e-money remains limited. (Only 25.6% of the population are currently aware of e-money agents)
• Revamp financial education strategy and focus on effective implementation
• Design digital literacy education program and roll out
KYC infrastructure • Lack of unique national ID (~21 official documentations are being used)
• Lack of real-time public records database to enable automated KYC verification
• Develop real-time digitized ID databases and promote providers to integrate with their banking systems
• Develop standards/guidelines for providers to integrate systems with ID databases
KYC regulatory requirements
• The KYC norms are the same irrespective of the value of transactions
• No clear guidance around digital KYC and the requirement for machine-based KYC verification
• Introduction of tiered KYC requirements and guideline development
• Clear guidance for digital KYC and the requirement for digital KYC verification
Payments Enabling critical volume – P2All1
• Increased electronic payment options available (e.g. Terminals, POS machines in agents) however most users still adopting offline payments (e.g. OTC cash payment)
• Initiate a single aggregator online platform for P2G payment
• Collection of P2G payments through e-money
• Advocate the use of online platforms (e.g. e-money) to be used for P2P remittances
Removing friction – Interoperability
• Payment networks are still very fragmented across different types of players (e.g. Commercial banks, Rural banks, MFIs, NGOs, MNOs)
• E-money agents and ATMs are not permitted to be shared between banks/Non-Bank FI/ EMIs (E-Money Issuer)
• Champion (and if necessary mandate) interoperability with Telco regulator
• Develop interoperability standards and guidelines (along with NRPS)
Extending access – Points of physical presence
• Lack of dedicated ANMs (Agent Network Manager) in the market
• Advocate open API architecture and industry utility set ups for new payment applications
• Allow providers to partner with agent network managers
Credit Credit risk assessment and scoring
• Lack of effective credit assessment methods especially for small/micro loans which excludes the segments from accessing formal credit
• Judgmental appraisal of customers’ risks largely by interview and society reputation (not statistical credit scoring model)
• Support development of alternative credit scoring methodology by enabling acquisition of required data and funds for development
• Mandate reporting of credit scores to CBs and encourage sharing across providers
Savings Savings access and convenience
• Savings with informal FS (cooperatives and ROSCAs)
• E-money agents are not used for savings mobilization due to regulatory constraints which limits access points for savings
• Allow deposit mobilization by agent networks so that agents can open deposit account on behalf of customers
• Develop guideline for liquidity management for agent network (i.e. minimum required buffer per agent)
57
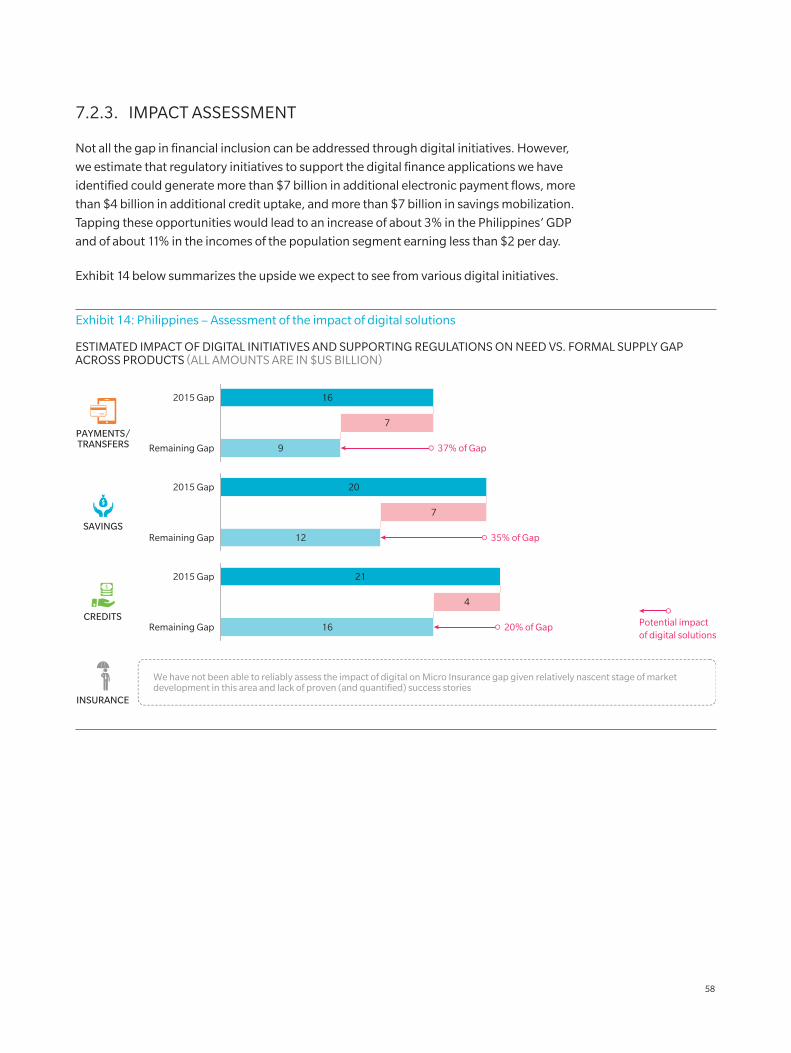
7.2.3. IMPACT ASSESSMENT
Not all the gap in financial inclusion can be addressed through digital initiatives. However,
we estimate that regulatory initiatives to support the digital finance applications we have
identified could generate more than $7 billion in additional electronic payment flows, more
than $4 billion in additional credit uptake, and more than $7 billion in savings mobilization.
Tapping these opportunities would lead to an increase of about 3% in the Philippines’ GDP
and of about 11% in the incomes of the population segment earning less than $2 per day.
Exhibit 14 below summarizes the upside we expect to see from various digital initiatives.
Exhibit 14: Philippines – Assessment of the impact of digital solutions
Remaining Gap
2015 Gap
9
16
Remaining Gap
2015 Gap
12
20
SAVINGS
CREDITS
PAYMENTS/TRANSFERS
INSURANCE
We have not been able to reliably assess the impact of digital on Micro Insurance gap given relatively nascent stage of marketdevelopment in this area and lack of proven (and quantified) success stories
7
7
Remaining Gap
2015 Gap
16
21
4
37% of Gap
35% of Gap
20% of Gap
ESTIMATED IMPACT OF DIGITAL INITIATIVES AND SUPPORTING REGULATIONS ON NEED VS. FORMAL SUPPLY GAP ACROSS PRODUCTS (ALL AMOUNTS ARE IN $US BILLION)
Potential impactof digital solutions
58
7.3. CAMBODIA
Cambodia’s progress in financial inclusion has yielded mixed results so far. On one hand,
only 13%96 of Cambodian adults have a bank account and only 4% save money with a
formal financial institution over a 12-month period. On the other, 28% of Cambodian adults
borrowed money from a formal financial institution over the same period, a rapid increase
from 19.5% in 2011. This rise been driven by a rapid expansion of the MFI sector in Cambodia
over the last decade.
We estimate that Cambodia’s GDP could increase by more than 32% if the financial inclusion
gap were closed. Digital enablement can be a powerful part of this solution. We estimate
that corresponding digital applications and related regulatory initiatives could boost GDP
by about 6%, produce more than $1.7 billion in additional electronic payment flows, lead
to more than $2.5 billion in additional credit uptake, and mobilize more than $500 million
in savings.
7.3.1. ANALYSIS OF THE GAP BETWEEN NEEDS AND FORMAL SUPPLY
We have assessed Cambodia’s needs and formal supply in payments, savings, credit,
and insurance.
In payments and transfers the gap between needs and formal supply is about $5 billion,
or about 60% of the segment’s financial services needs. The transition from cash to digital
money is in its early stages in Cambodia. Most recent progress has been driven by transfer
platforms based on mobile money. WING is a notable example of success, with an active
customer base of more than 300,000 and an agent base of more than 3,000.
The gap between needs and formal supply is most significant in the case of savings. The
total gap is estimated to be $22.5 billion, implying that only about 16% of the segment’s
need are currently met by formal financial services providers. Of all savers, 95% choose
to save informally, and only selected MFIs are deposit-taking institutions. Those MFIs that
do take deposits primarily focus on mobilizing those from more affluent customers in
urban locations.
The gap between needs and formal supply is a modest 28% in credit, indicating an
opportunity of $3 billion still unmet by formal financial institutions. Strong development of
the MFI sector has led to fast growth in micro credit in Cambodia. The total MFI loan portfolio
is three times the size of the total volume of retail loans from banks. More than 60% of the
adult population indicate they are borrowing from at least one MFI.97
Exhibit 15 provides a full view of Cambodia’s needs and formal supply.
96 Global Findex Database
97 Based on “Study on the Drivers of Over-Indebtedness of Microfinance Borrowers in Cambodia” (BlueOrchard, Incofin and OikoCredit, Cambodia Institute of Development Study) [2013]
59
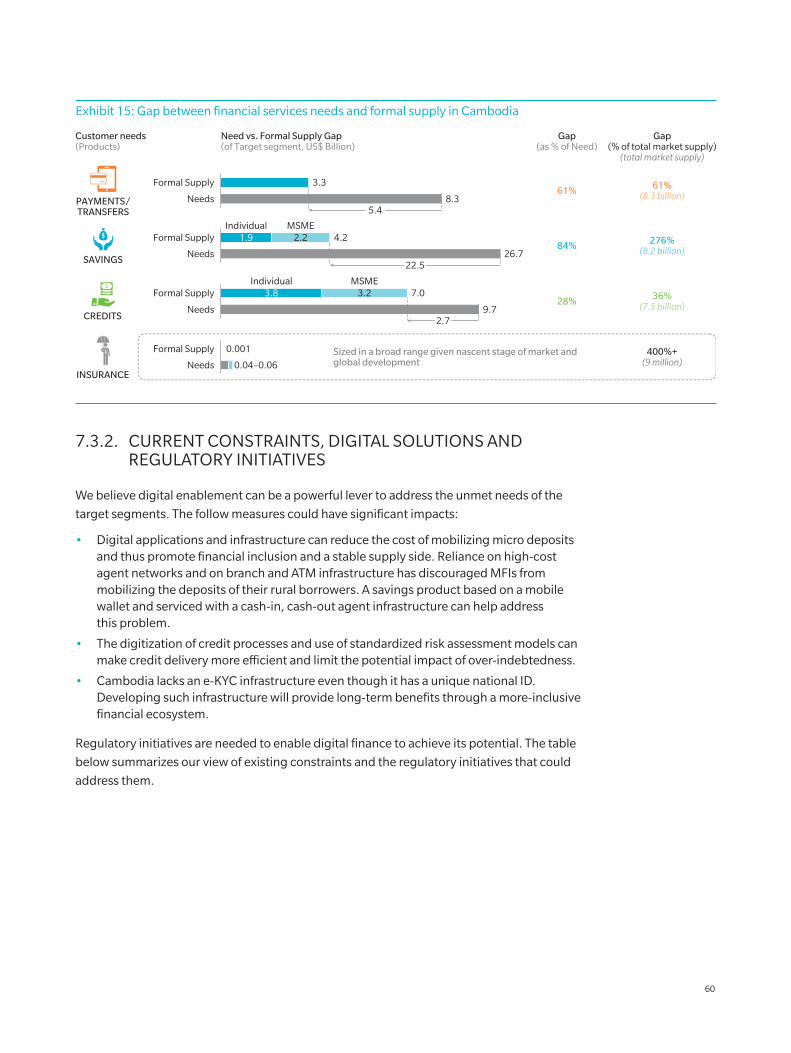
7.3.2. CURRENT CONSTRAINTS, DIGITAL SOLUTIONS AND REGULATORY INITIATIVES
We believe digital enablement can be a powerful lever to address the unmet needs of the
target segments. The follow measures could have significant impacts:
• Digital applications and infrastructure can reduce the cost of mobilizing micro deposits and thus promote financial inclusion and a stable supply side. Reliance on high-cost agent networks and on branch and ATM infrastructure has discouraged MFIs from mobilizing the deposits of their rural borrowers. A savings product based on a mobile wallet and serviced with a cash-in, cash-out agent infrastructure can help address this problem.
• The digitization of credit processes and use of standardized risk assessment models can make credit delivery more efficient and limit the potential impact of over-indebtedness.
• Cambodia lacks an e-KYC infrastructure even though it has a unique national ID. Developing such infrastructure will provide long-term benefits through a more-inclusive financial ecosystem.
Regulatory initiatives are needed to enable digital finance to achieve its potential. The table
below summarizes our view of existing constraints and the regulatory initiatives that could
address them.
Exhibit 15: Gap between financial services needs and formal supply in Cambodia
400%+(9 million)
276%(8.2 billion)
36%(7.5 billion)
61%(8.3 billion)
28%
84%
61%
Customer needs(Products)
Needs
Formal Supply
8.3
3.3
SAVINGS
CREDITS
PAYMENTS/TRANSFERS
INSURANCE
Need vs. Formal Supply Gap(of Target segment, US$ Billion)
Gap(as % of Need)
Gap(% of total market supply)
(total market supply)
Sized in a broad range given nascent stage of market and global development0.04–0.06
0.001
Individual MSME
MSMEIndividual
Formal Supply
Needs
Needs
Formal Supply
26.7
4.22.21.9
Formal Supply
Needs
7.03.23.8
9.7
5.4
22.5
2.7
60
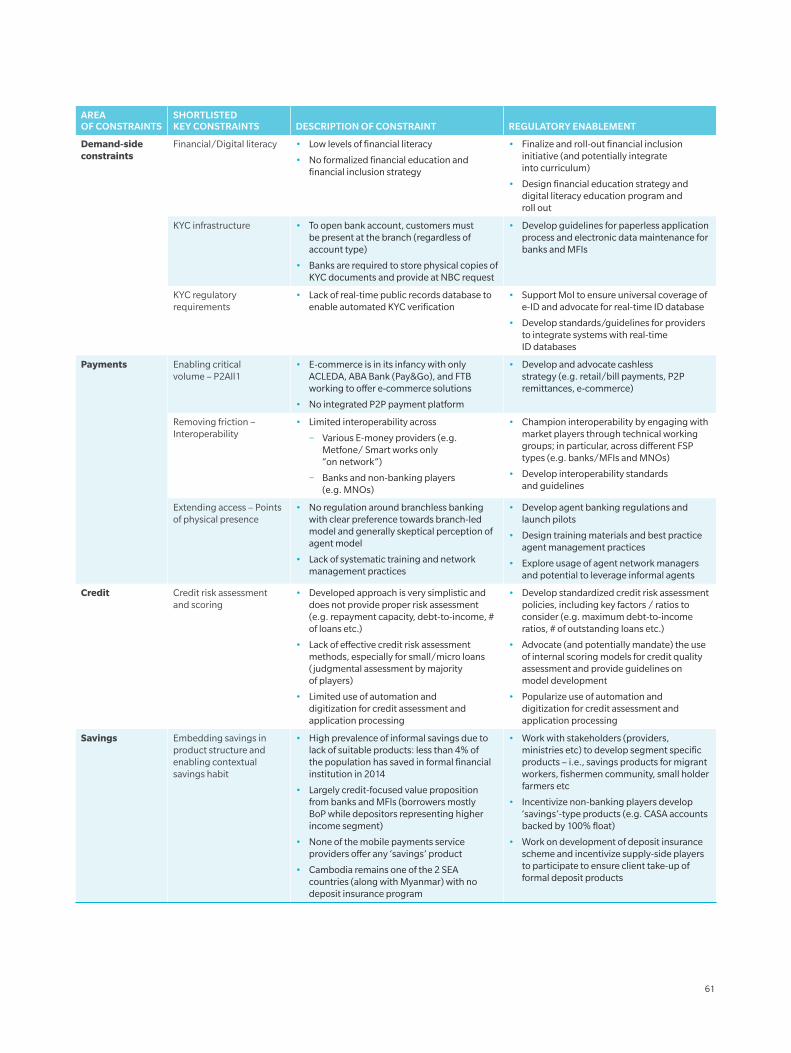
AREA OF CONSTRAINTS
SHORTLISTED KEY CONSTRAINTS DESCRIPTION OF CONSTRAINT REGULATORY ENABLEMENT
Demand-side constraints
Financial/Digital literacy • Low levels of financial literacy
• No formalized financial education and financial inclusion strategy
• Finalize and roll-out financial inclusion initiative (and potentially integrate into curriculum)
• Design financial education strategy and digital literacy education program and roll out
KYC infrastructure • To open bank account, customers must be present at the branch (regardless of account type)
• Banks are required to store physical copies of KYC documents and provide at NBC request
• Develop guidelines for paperless application process and electronic data maintenance for banks and MFIs
KYC regulatory requirements
• Lack of real-time public records database to enable automated KYC verification
• Support MoI to ensure universal coverage of e-ID and advocate for real-time ID database
• Develop standards/guidelines for providers to integrate systems with real-time ID databases
Payments Enabling critical volume – P2All1
• E-commerce is in its infancy with only ACLEDA, ABA Bank (Pay&Go), and FTB working to offer e-commerce solutions
• No integrated P2P payment platform
• Develop and advocate cashless strategy (e.g. retail/bill payments, P2P remittances, e-commerce)
Removing friction – Interoperability
• Limited interoperability across
− Various E-money providers (e.g. Metfone/ Smart works only “on network”)
− Banks and non-banking players (e.g. MNOs)
• Champion interoperability by engaging with market players through technical working groups; in particular, across different FSP types (e.g. banks/MFIs and MNOs)
• Develop interoperability standards and guidelines
Extending access – Points of physical presence
• No regulation around branchless banking with clear preference towards branch-led model and generally skeptical perception of agent model
• Lack of systematic training and network management practices
• Develop agent banking regulations and launch pilots
• Design training materials and best practice agent management practices
• Explore usage of agent network managers and potential to leverage informal agents
Credit Credit risk assessment and scoring
• Developed approach is very simplistic and does not provide proper risk assessment (e.g. repayment capacity, debt-to-income, # of loans etc.)
• Lack of effective credit risk assessment methods, especially for small/micro loans (judgmental assessment by majority of players)
• Limited use of automation and digitization for credit assessment and application processing
• Develop standardized credit risk assessment policies, including key factors / ratios to consider (e.g. maximum debt-to-income ratios, # of outstanding loans etc.)
• Advocate (and potentially mandate) the use of internal scoring models for credit quality assessment and provide guidelines on model development
• Popularize use of automation and digitization for credit assessment and application processing
Savings Embedding savings in product structure and enabling contextual savings habit
• High prevalence of informal savings due to lack of suitable products: less than 4% of the population has saved in formal financial institution in 2014
• Largely credit-focused value proposition from banks and MFIs (borrowers mostly BoP while depositors representing higher income segment)
• None of the mobile payments service providers offer any ‘savings’ product
• Cambodia remains one of the 2 SEA countries (along with Myanmar) with no deposit insurance program
• Work with stakeholders (providers, ministries etc) to develop segment specific products – i.e., savings products for migrant workers, fishermen community, small holder farmers etc
• Incentivize non-banking players develop ‘savings’-type products (e.g. CASA accounts backed by 100% float)
• Work on development of deposit insurance scheme and incentivize supply-side players to participate to ensure client take-up of formal deposit products
61
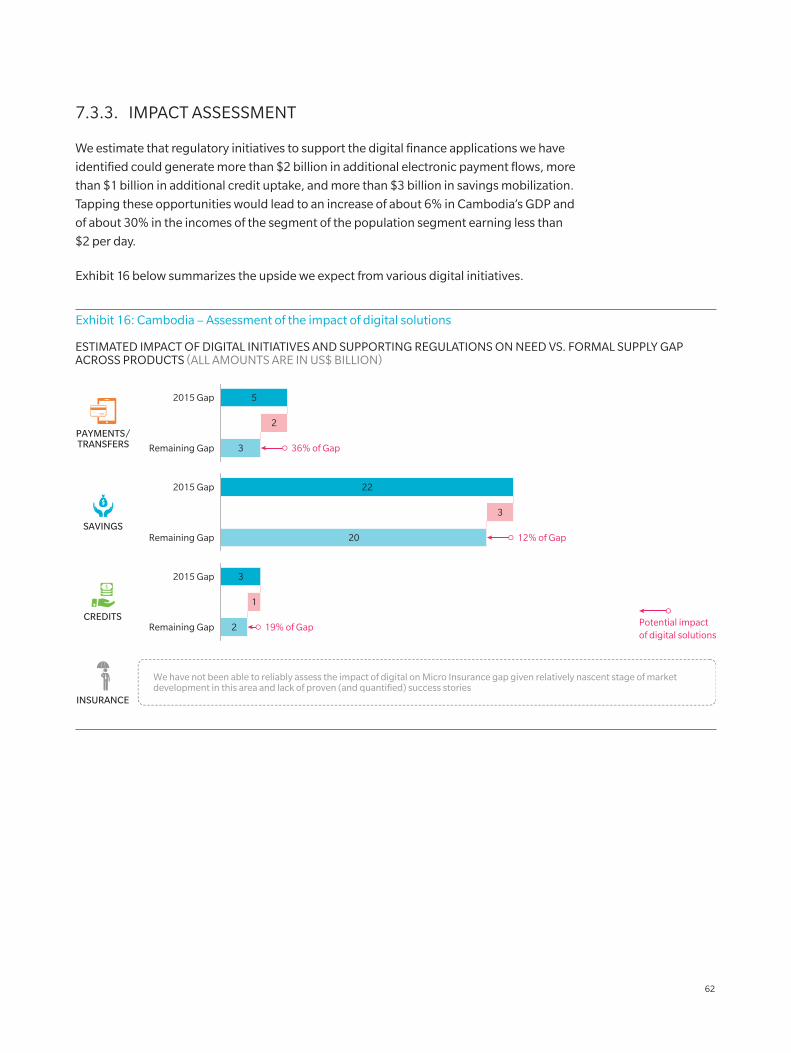
7.3.3. IMPACT ASSESSMENT
We estimate that regulatory initiatives to support the digital finance applications we have
identified could generate more than $2 billion in additional electronic payment flows, more
than $1 billion in additional credit uptake, and more than $3 billion in savings mobilization.
Tapping these opportunities would lead to an increase of about 6% in Cambodia’s GDP and
of about 30% in the incomes of the segment of the population segment earning less than
$2 per day.
Exhibit 16 below summarizes the upside we expect from various digital initiatives.
Exhibit 16: Cambodia – Assessment of the impact of digital solutions
Remaining Gap
2015 Gap
3
5
Remaining Gap
2015 Gap
20
22
SAVINGS
CREDITS
PAYMENTS/TRANSFERS
INSURANCE
We have not been able to reliably assess the impact of digital on Micro Insurance gap given relatively nascent stage of marketdevelopment in this area and lack of proven (and quantified) success stories
2
3
Remaining Gap
2015 Gap
2
3
1
36% of Gap
12% of Gap
19% of Gap
ESTIMATED IMPACT OF DIGITAL INITIATIVES AND SUPPORTING REGULATIONS ON NEED VS. FORMAL SUPPLY GAP ACROSS PRODUCTS (ALL AMOUNTS ARE IN US$ BILLION)
Potential impactof digital solutions
62
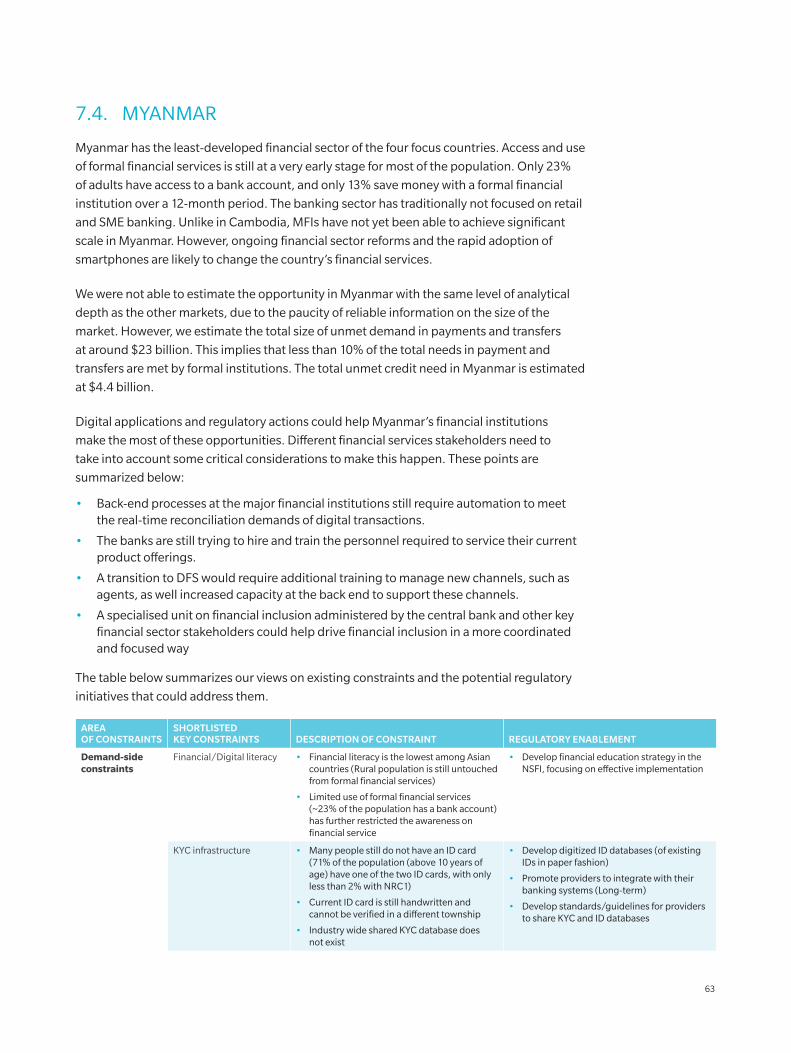
7.4. MYANMAR
Myanmar has the least-developed financial sector of the four focus countries. Access and use
of formal financial services is still at a very early stage for most of the population. Only 23%
of adults have access to a bank account, and only 13% save money with a formal financial
institution over a 12-month period. The banking sector has traditionally not focused on retail
and SME banking. Unlike in Cambodia, MFIs have not yet been able to achieve significant
scale in Myanmar. However, ongoing financial sector reforms and the rapid adoption of
smartphones are likely to change the country’s financial services.
We were not able to estimate the opportunity in Myanmar with the same level of analytical
depth as the other markets, due to the paucity of reliable information on the size of the
market. However, we estimate the total size of unmet demand in payments and transfers
at around $23 billion. This implies that less than 10% of the total needs in payment and
transfers are met by formal institutions. The total unmet credit need in Myanmar is estimated
at $4.4 billion.
Digital applications and regulatory actions could help Myanmar’s financial institutions
make the most of these opportunities. Different financial services stakeholders need to
take into account some critical considerations to make this happen. These points are
summarized below:
• Back-end processes at the major financial institutions still require automation to meet the real-time reconciliation demands of digital transactions.
• The banks are still trying to hire and train the personnel required to service their current product offerings.
• A transition to DFS would require additional training to manage new channels, such as agents, as well increased capacity at the back end to support these channels.
• A specialised unit on financial inclusion administered by the central bank and other key financial sector stakeholders could help drive financial inclusion in a more coordinated and focused way
The table below summarizes our views on existing constraints and the potential regulatory
initiatives that could address them.
AREA OF CONSTRAINTS
SHORTLISTED KEY CONSTRAINTS DESCRIPTION OF CONSTRAINT REGULATORY ENABLEMENT
Demand-side constraints
Financial/Digital literacy • Financial literacy is the lowest among Asian countries (Rural population is still untouched from formal financial services)
• Limited use of formal financial services (~23% of the population has a bank account) has further restricted the awareness on financial service
• Develop financial education strategy in the NSFI, focusing on effective implementation
KYC infrastructure • Many people still do not have an ID card (71% of the population (above 10 years of age) have one of the two ID cards, with only less than 2% with NRC1)
• Current ID card is still handwritten and cannot be verified in a different township
• Industry wide shared KYC database does not exist
• Develop digitized ID databases (of existing IDs in paper fashion)
• Promote providers to integrate with their banking systems (Long-term)
• Develop standards/guidelines for providers to share KYC and ID databases
63
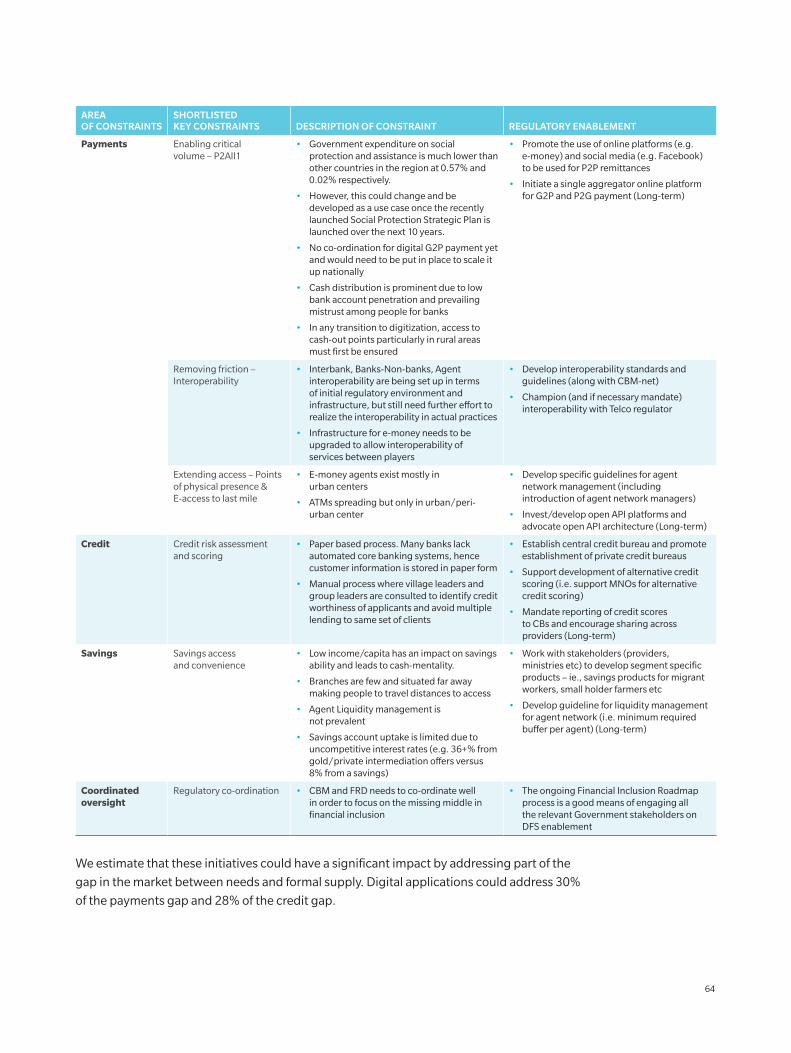
AREA OF CONSTRAINTS
SHORTLISTED KEY CONSTRAINTS DESCRIPTION OF CONSTRAINT REGULATORY ENABLEMENT
Payments Enabling critical volume – P2All1
• Government expenditure on social protection and assistance is much lower than other countries in the region at 0.57% and 0.02% respectively.
• However, this could change and be developed as a use case once the recently launched Social Protection Strategic Plan is launched over the next 10 years.
• No co-ordination for digital G2P payment yet and would need to be put in place to scale it up nationally
• Cash distribution is prominent due to low bank account penetration and prevailing mistrust among people for banks
• In any transition to digitization, access to cash-out points particularly in rural areas must first be ensured
• Promote the use of online platforms (e.g. e-money) and social media (e.g. Facebook) to be used for P2P remittances
• Initiate a single aggregator online platform for G2P and P2G payment (Long-term)
Removing friction – Interoperability
• Interbank, Banks-Non-banks, Agent interoperability are being set up in terms of initial regulatory environment and infrastructure, but still need further effort to realize the interoperability in actual practices
• Infrastructure for e-money needs to be upgraded to allow interoperability of services between players
• Develop interoperability standards and guidelines (along with CBM-net)
• Champion (and if necessary mandate) interoperability with Telco regulator
Extending access – Points of physical presence & E-access to last mile
• E-money agents exist mostly in urban centers
• ATMs spreading but only in urban/peri-urban center
• Develop specific guidelines for agent network management (including introduction of agent network managers)
• Invest/develop open API platforms and advocate open API architecture (Long-term)
Credit Credit risk assessment and scoring
• Paper based process. Many banks lack automated core banking systems, hence customer information is stored in paper form
• Manual process where village leaders and group leaders are consulted to identify credit worthiness of applicants and avoid multiple lending to same set of clients
• Establish central credit bureau and promote establishment of private credit bureaus
• Support development of alternative credit scoring (i.e. support MNOs for alternative credit scoring)
• Mandate reporting of credit scores to CBs and encourage sharing across providers (Long-term)
Savings Savings access and convenience
• Low income/capita has an impact on savings ability and leads to cash-mentality.
• Branches are few and situated far away making people to travel distances to access
• Agent Liquidity management is not prevalent
• Savings account uptake is limited due to uncompetitive interest rates (e.g. 36+% from gold/private intermediation offers versus 8% from a savings)
• Work with stakeholders (providers, ministries etc) to develop segment specific products – ie., savings products for migrant workers, small holder farmers etc
• Develop guideline for liquidity management for agent network (i.e. minimum required buffer per agent) (Long-term)
Coordinated oversight
Regulatory co-ordination • CBM and FRD needs to co-ordinate well in order to focus on the missing middle in financial inclusion
• The ongoing Financial Inclusion Roadmap process is a good means of engaging all the relevant Government stakeholders on DFS enablement
We estimate that these initiatives could have a significant impact by addressing part of the
gap in the market between needs and formal supply. Digital applications could address 30%
of the payments gap and 28% of the credit gap.
64
8. CONCLUDING REMARKS
Accelerating financial inclusion is a national policy priority in the four Southeast Asian
markets we studied, namely Indonesia, the Philippines, Cambodia, and Myanmar. While
progress has been made in recent years, much remains to be done. Our analysis points to
very significant gaps for all four primary financial services – payments, savings, credit, and
insurance – for people at the base of the pyramid, for women and for MSMEs.
To accelerate financial inclusion, action is needed from regulators, public policymaking
institutions, and supply-side participants to address the structural issues that are impeding
the spread of financial services to these segments of the population. The unattractive
economics of serving them continues to be a challenge for the supply side in terms of
resource and investment mobilization. For the target customers, the solutions on offer are
often not attractive alternatives to the current informal solutions. Moreover, they are held
back by a low level of financial literacy and overall awareness. For public policymaking
institutions, the base-of-the-pyramid segment is challenging, as social, economic, and
political priorities often conflict.
We estimate that addressing this opportunity could increase GDP by between 9% and 14%,
even in relatively large economies such as Indonesia and the Philippines. In Cambodia, the
potential boost to GDP could be more than 30%. These GDP growth opportunities justify
the strategic priority placed on financial inclusion, even before one considers the positive
impact on the quality of life and income of people who are currently financially excluded.
For those earning less than $2 per day, we estimated that 10% increases in income would be
achievable in Indonesia and the Philippines, and a 50% increase in Cambodia.
Digital finance, through its impact on banking value chains, can provide solutions to the
key challenges for financial inclusion. In the five areas where digital finance will be most
significant, we concluded that it could not entirely close the gap between needs and formal
supply, but could reduce it. In the base of pyramid and MSME segments, we estimate that
digital finance could address up to 40% of the gap in payments volume and 20% of unmet
credit needs. We estimate that the cumulative effects of such digitally driven financial
inclusion could boost GDP by 2% to 3% in markets like Indonesia and the Philippines and
6% in Cambodia. In Myanmar, the potential is likely greater, but data limitations preclude a
numerical estimate.
65
Much digital enablement will be driven by the supply side, so regulators and public
policymakers have a critical role in creating a favourable environment for innovation in
digital finance. Through more than 80 interviews with supply-side operators, regulators
and policymakers, we identified the specific barriers to financial inclusion in each market,
and found parallels between the markets and lessons that applied to all of them. We identify
three broad areas in which the authorities should play an active role to promote digital
finance in order to accelerate financial inclusion:
• Managing supply-side entry barriers: Create a level playing field by allowing both traditional financial services players and new participants (such as MNOs) to collaborate and compete.
• Enabling suitable solution design and delivery: Develop a “safe space” for businesses to test out new ideas in a live environment using a regulatory sandbox; develop clear guidance on the development and role of agent networks, and allow different supply-side operators to leverage these alternative channels; and drive the creation of frictionless payment channels and network infrastructure, for example by advocating or mandating interoperability between mobile money platforms.
• Creating a shared vision: Produce a roadmap for financial inclusion to focus the efforts of various stakeholders, put in place a governance mechanism to facilitate coordination, and ensure stakeholder accountability.
The opportunity to accelerate financial inclusion through digital finance is clear, and the
impact would be very significant on both the lives of financially excluded people and the
broader economy. Regulators and policymakers have critical roles to play in supporting and
enabling this digital innovation. At the same time, however, digital finance is also increasing
the complexity of the financial services ecosystem by disaggregating traditional value chains
and enabling new, non-bank entrants to participate. It is imperative that policymakers
remain aware of not only the opportunities afforded by digital finance but also the risks
arising from this increased complexity. In particular, they need to be aware of the exponential
increase in data generated by individuals and used by supply-side operators. Consumer
protection, especially for those individuals new to formal financial services, needs to remain
front and centre.
66
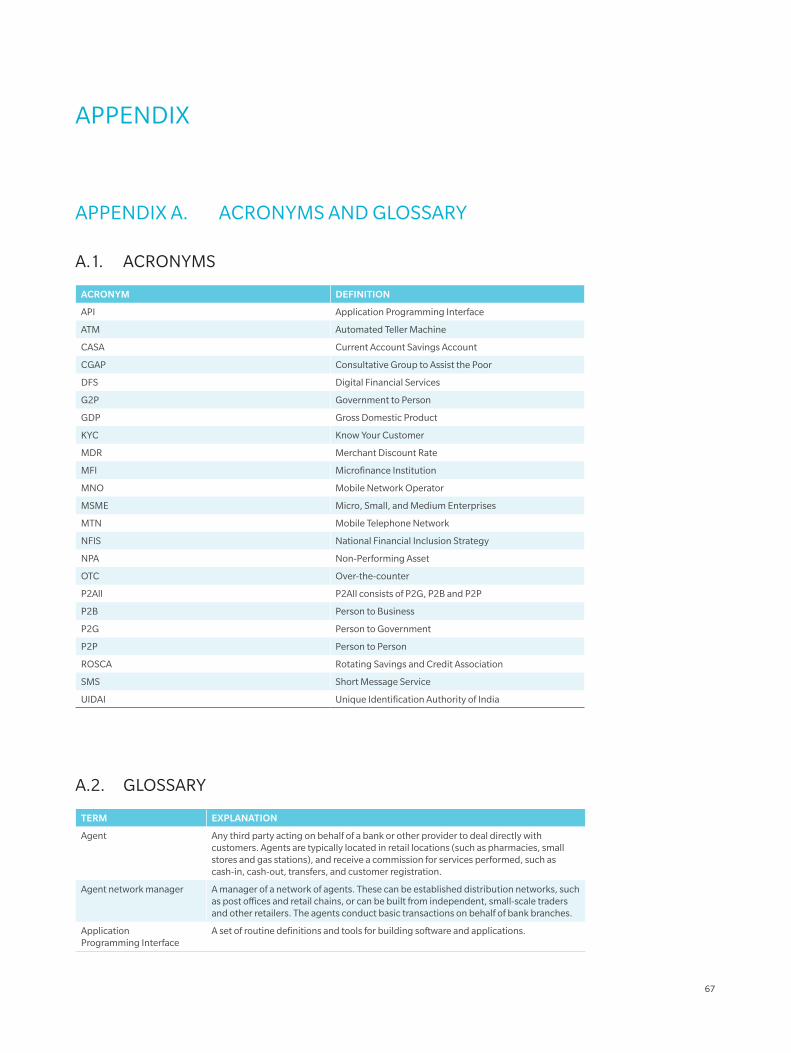
APPENDIX
APPENDIX A. ACRONYMS AND GLOSSARY
A.1. ACRONYMS
ACRONYM DEFINITION
API Application Programming Interface
ATM Automated Teller Machine
CASA Current Account Savings Account
CGAP Consultative Group to Assist the Poor
DFS Digital Financial Services
G2P Government to Person
GDP Gross Domestic Product
KYC Know Your Customer
MDR Merchant Discount Rate
MFI Microfinance Institution
MNO Mobile Network Operator
MSME Micro, Small, and Medium Enterprises
MTN Mobile Telephone Network
NFIS National Financial Inclusion Strategy
NPA Non-Performing Asset
OTC Over-the-counter
P2All P2All consists of P2G, P2B and P2P
P2B Person to Business
P2G Person to Government
P2P Person to Person
ROSCA Rotating Savings and Credit Association
SMS Short Message Service
UIDAI Unique Identification Authority of India
A.2. GLOSSARY
TERM EXPLANATION
Agent Any third party acting on behalf of a bank or other provider to deal directly with customers. Agents are typically located in retail locations (such as pharmacies, small stores and gas stations), and receive a commission for services performed, such as cash-in, cash-out, transfers, and customer registration.
Agent network manager A manager of a network of agents. These can be established distribution networks, such as post offices and retail chains, or can be built from independent, small-scale traders and other retailers. The agents conduct basic transactions on behalf of bank branches.
Application Programming Interface
A set of routine definitions and tools for building software and applications.
67
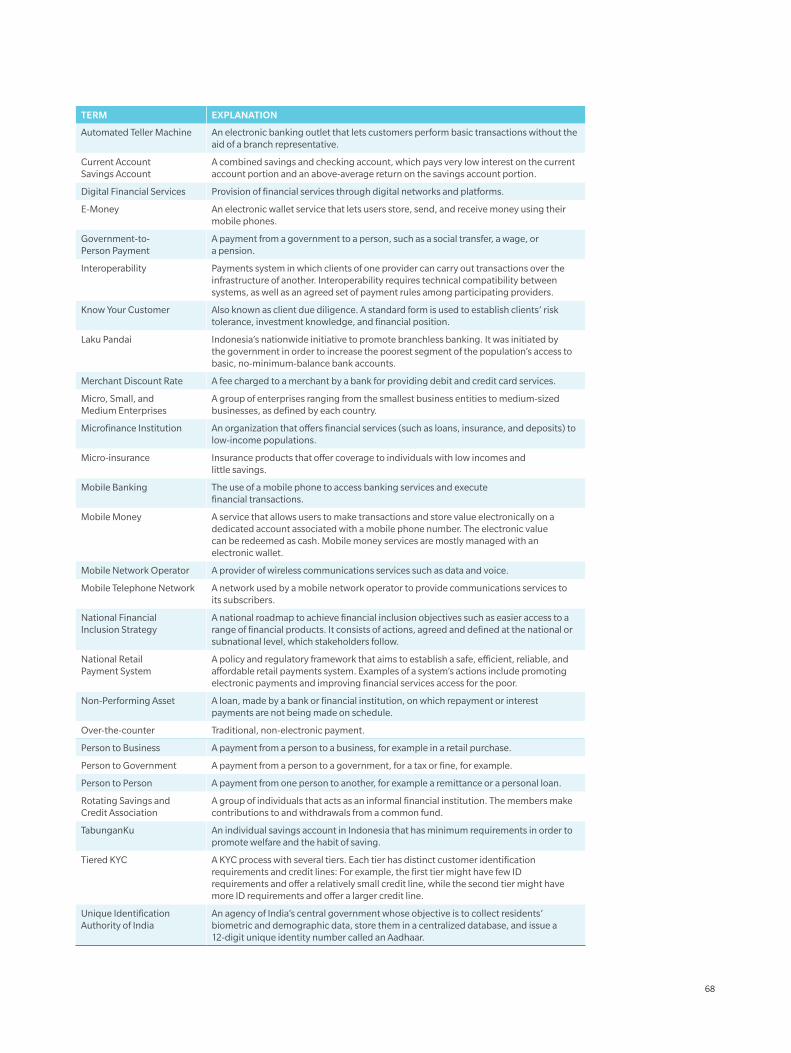
TERM EXPLANATION
Automated Teller Machine An electronic banking outlet that lets customers perform basic transactions without the aid of a branch representative.
Current Account Savings Account
A combined savings and checking account, which pays very low interest on the current account portion and an above-average return on the savings account portion.
Digital Financial Services Provision of financial services through digital networks and platforms.
E-Money An electronic wallet service that lets users store, send, and receive money using their mobile phones.
Government-to-Person Payment
A payment from a government to a person, such as a social transfer, a wage, or a pension.
Interoperability Payments system in which clients of one provider can carry out transactions over the infrastructure of another. Interoperability requires technical compatibility between systems, as well as an agreed set of payment rules among participating providers.
Know Your Customer Also known as client due diligence. A standard form is used to establish clients’ risk tolerance, investment knowledge, and financial position.
Laku Pandai Indonesia’s nationwide initiative to promote branchless banking. It was initiated by the government in order to increase the poorest segment of the population’s access to basic, no-minimum-balance bank accounts.
Merchant Discount Rate A fee charged to a merchant by a bank for providing debit and credit card services.
Micro, Small, and Medium Enterprises
A group of enterprises ranging from the smallest business entities to medium-sized businesses, as defined by each country.
Microfinance Institution An organization that offers financial services (such as loans, insurance, and deposits) to low-income populations.
Micro-insurance Insurance products that offer coverage to individuals with low incomes and little savings.
Mobile Banking The use of a mobile phone to access banking services and execute financial transactions.
Mobile Money A service that allows users to make transactions and store value electronically on a dedicated account associated with a mobile phone number. The electronic value can be redeemed as cash. Mobile money services are mostly managed with an electronic wallet.
Mobile Network Operator A provider of wireless communications services such as data and voice.
Mobile Telephone Network A network used by a mobile network operator to provide communications services to its subscribers.
National Financial Inclusion Strategy
A national roadmap to achieve financial inclusion objectives such as easier access to a range of financial products. It consists of actions, agreed and defined at the national or subnational level, which stakeholders follow.
National Retail Payment System
A policy and regulatory framework that aims to establish a safe, efficient, reliable, and affordable retail payments system. Examples of a system’s actions include promoting electronic payments and improving financial services access for the poor.
Non-Performing Asset A loan, made by a bank or financial institution, on which repayment or interest payments are not being made on schedule.
Over-the-counter Traditional, non-electronic payment.
Person to Business A payment from a person to a business, for example in a retail purchase.
Person to Government A payment from a person to a government, for a tax or fine, for example.
Person to Person A payment from one person to another, for example a remittance or a personal loan.
Rotating Savings and Credit Association
A group of individuals that acts as an informal financial institution. The members make contributions to and withdrawals from a common fund.
TabunganKu An individual savings account in Indonesia that has minimum requirements in order to promote welfare and the habit of saving.
Tiered KYC A KYC process with several tiers. Each tier has distinct customer identification requirements and credit lines: For example, the first tier might have few ID requirements and offer a relatively small credit line, while the second tier might have more ID requirements and offer a larger credit line.
Unique Identification Authority of India
An agency of India’s central government whose objective is to collect residents’ biometric and demographic data, store them in a centralized database, and issue a 12-digit unique identity number called an Aadhaar.
68
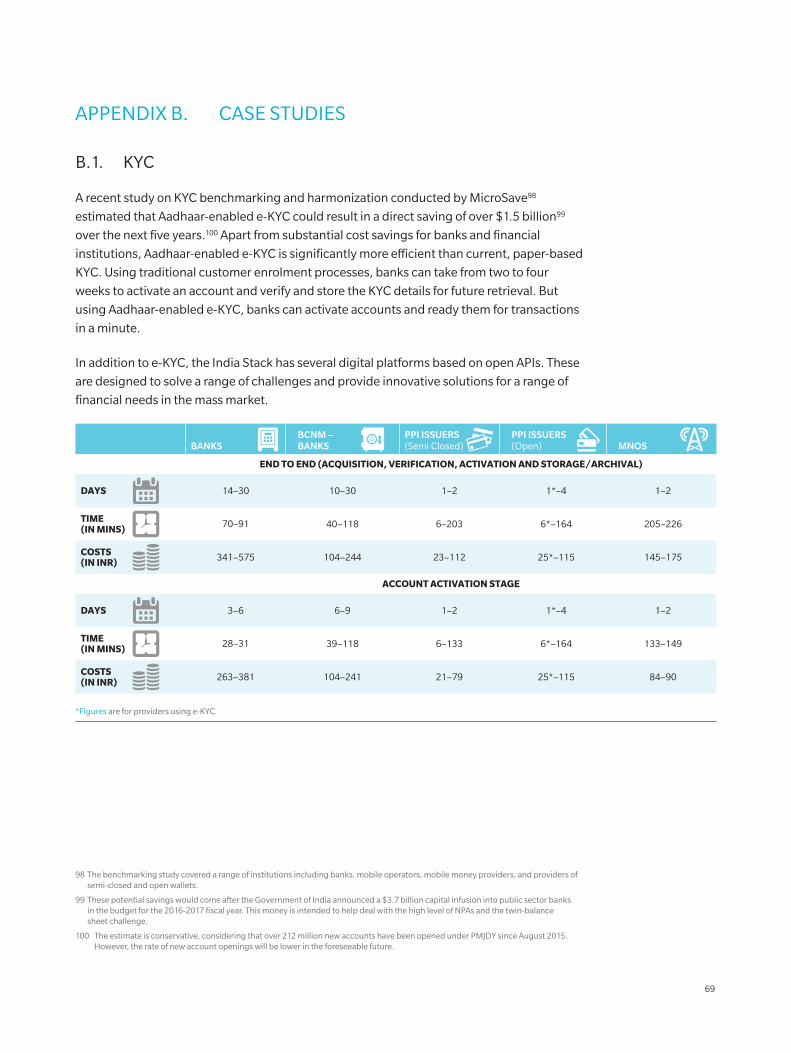
APPENDIX B. CASE STUDIES
B.1. KYC
A recent study on KYC benchmarking and harmonization conducted by MicroSave98
estimated that Aadhaar-enabled e-KYC could result in a direct saving of over $1.5 billion99
over the next five years.100 Apart from substantial cost savings for banks and financial
institutions, Aadhaar-enabled e-KYC is significantly more efficient than current, paper-based
KYC. Using traditional customer enrolment processes, banks can take from two to four
weeks to activate an account and verify and store the KYC details for future retrieval. But
using Aadhaar-enabled e-KYC, banks can activate accounts and ready them for transactions
in a minute.
In addition to e-KYC, the India Stack has several digital platforms based on open APIs. These
are designed to solve a range of challenges and provide innovative solutions for a range of
financial needs in the mass market.
98 The benchmarking study covered a range of institutions including banks, mobile operators, mobile money providers, and providers of semi-closed and open wallets.
99 These potential savings would come after the Government of India announced a $3.7 billion capital infusion into public sector banks in the budget for the 2016-2017 fiscal year. This money is intended to help deal with the high level of NPAs and the twin-balance sheet challenge.
100 The estimate is conservative, considering that over 212 million new accounts have been opened under PMJDY since August 2015. However, the rate of new account openings will be lower in the foreseeable future.
BANKS
END TO END (ACQUISITION, VERIFICATION, ACTIVATION AND STORAGE/ARCHIVAL)
14–30 10–30 1–2 1–21*–4
40–118 6–203 205–2266*–164
104–244 23–112 145–17525*–115
70–91
341–575
DAYS
TIME(IN MINS)
COSTS(IN INR)
BCNM –BANKS
PPI ISSUERS(Semi Closed)
PPI ISSUERS(Open) MNOS
ACCOUNT ACTIVATION STAGE
3–6 6–9 1–2 1–21*–4
39–118 6–133 133–1496*–164
104–241 21–79 84–9025*–115
28–31
263–381
DAYS
TIME(IN MINS)
COSTS(IN INR)
*Figures are for providers using e-KYC
69
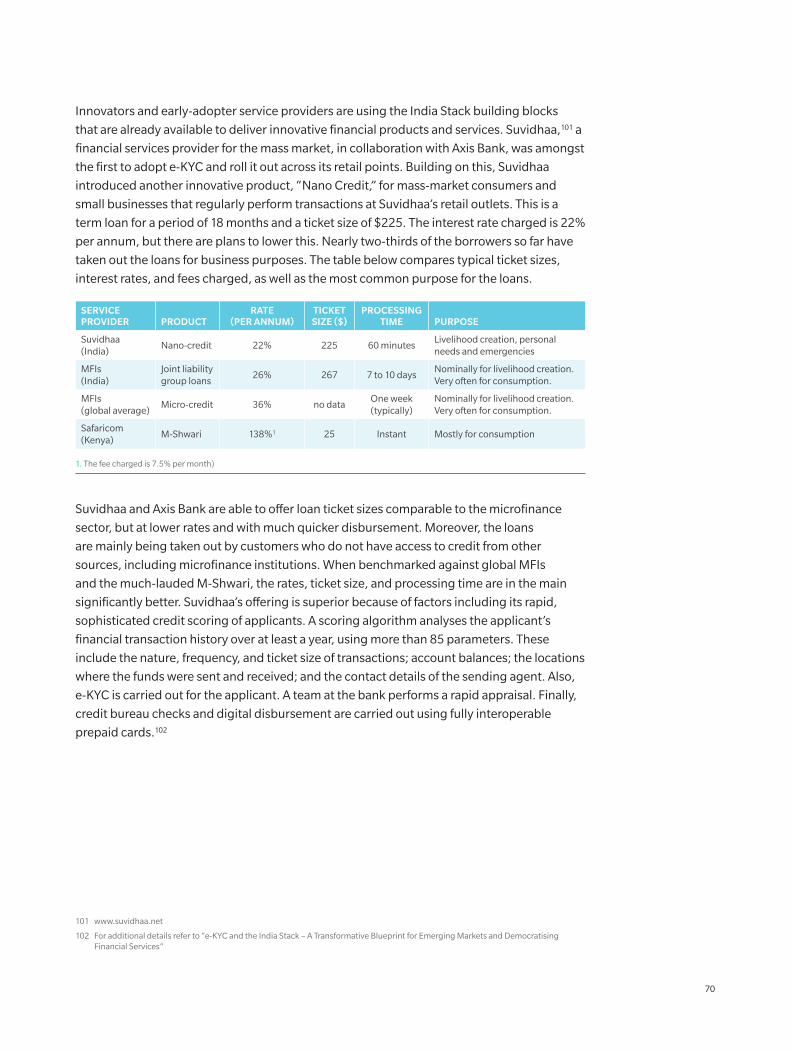
Innovators and early-adopter service providers are using the India Stack building blocks
that are already available to deliver innovative financial products and services. Suvidhaa,101 a
financial services provider for the mass market, in collaboration with Axis Bank, was amongst
the first to adopt e-KYC and roll it out across its retail points. Building on this, Suvidhaa
introduced another innovative product, “Nano Credit,” for mass-market consumers and
small businesses that regularly perform transactions at Suvidhaa’s retail outlets. This is a
term loan for a period of 18 months and a ticket size of $225. The interest rate charged is 22%
per annum, but there are plans to lower this. Nearly two-thirds of the borrowers so far have
taken out the loans for business purposes. The table below compares typical ticket sizes,
interest rates, and fees charged, as well as the most common purpose for the loans.
SERVICE PROVIDER PRODUCT
RATE (PER ANNUM)
TICKET SIZE ($)
PROCESSING TIME PURPOSE
Suvidhaa (India)
Nano-credit 22% 225 60 minutesLivelihood creation, personal needs and emergencies
MFIs (India)
Joint liability group loans
26% 267 7 to 10 daysNominally for livelihood creation. Very often for consumption.
MFIs (global average)
Micro-credit 36% no dataOne week (typically)
Nominally for livelihood creation. Very often for consumption.
Safaricom (Kenya)
M-Shwari 138%1 25 Instant Mostly for consumption
1. The fee charged is 7.5% per month)
Suvidhaa and Axis Bank are able to offer loan ticket sizes comparable to the microfinance
sector, but at lower rates and with much quicker disbursement. Moreover, the loans
are mainly being taken out by customers who do not have access to credit from other
sources, including microfinance institutions. When benchmarked against global MFIs
and the much-lauded M-Shwari, the rates, ticket size, and processing time are in the main
significantly better. Suvidhaa’s offering is superior because of factors including its rapid,
sophisticated credit scoring of applicants. A scoring algorithm analyses the applicant’s
financial transaction history over at least a year, using more than 85 parameters. These
include the nature, frequency, and ticket size of transactions; account balances; the locations
where the funds were sent and received; and the contact details of the sending agent. Also,
e-KYC is carried out for the applicant. A team at the bank performs a rapid appraisal. Finally,
credit bureau checks and digital disbursement are carried out using fully interoperable
prepaid cards.102
101 www.suvidhaa.net
102 For additional details refer to “e-KYC and the India Stack – A Transformative Blueprint for Emerging Markets and Democratising Financial Services”
70
B.2. BKASH
Bangladesh’s leading mobile financial services provider, bKash, has acquired 21 million users
in just four years. This is equivalent to about 12.5% of the country’s population and includes
many people who were previously financially excluded. bKash enables rural migrants living
in cities to transfer money home safely. An estimated 80% of rickshaw riders in Dhaka use
the service regularly, according to the central bank governor. bKash has reduced transfer
processing time from the 15 days it used to take via the postal service to a matter of seconds.
Customers are also able to conduct cash-in and cash-out operations at convenient locations
through bKash’s network of about 120,000 agents. These features enabled bKash to clear
more than 1 billion transactions in 2015 alone and add 1 million new customers every month.
B.3. TIMIZA
Timiza is a digital credit product offered to Airtel Money’s existing customers in Tanzania.
Established in 2014, Timiza has extended loans to half of its mobile money customer base
(that is 2 million people) in just two years. Timiza enables customers to apply for a loan
without having to hold savings and make deposits. Moreover, the loan limit is increased each
time a loan is repaid, helping customers to build a credit history.
71
APPENDIX C. BIBLIOGRAPHIES
“Airtel, MTN Nigeria sell 100,000 insurance policies a month.” Telecompaper. April 9,
2014. https://www.telecompaper.com/news/airtel-mtn-nigeria-sell-100000-insurance-policies-a-
month--1006979
Alatabani, Alwaleed, and Putra Arsana. Driving Indonesian Financial Inclusion
through Basic Savings Account. Technical Note. Financial Sector Development, The
World Bank. July 2014. http://siteresources.worldbank.org/EXTFINANCIALSECTOR/
Resources/282884-1339624653091/8703882-1339624678024/8703850-1412710292190/Driving-
Indonesian-FinInclusion-through-Basic-Savings-Accounts.pdf
Allchin, Chriss, Matt Austen, Aaron Fine, and Ted Moynihan. Modular Financial Services -
The New Shape of the Industry. Publication. Financial Services, Oliver Wyman. January
2016. http://www.oliverwyman.com/content/dam/oliver-wyman/global/en/2016/jan/
OliverWyman_ModularFS_final.pdf
Amianti, Grace D. OJK invites more players to join branchless banking program. Publication.
The Jakarta Post. January 5, 2016. http://www.thejakartapost.com/news/2016/01/05/ojk-invites-
more-players-join-branchless-banking-program.html
Arenaza, Sonia. Potential risks to clients when using Digital Financial Services - An analysis
report to inform the Evolution of the Client Protection Standards. Report. Smart Campaign &
Accion Channels and Technology. September 2014. http://www.smartcampaign.org/storage/
documents/Tools_and_Resources/EoS_Risk_identification_and_analysis_vSA_AR_LT.pdf
Banerjee, Shweta S. “Can Digital Cash Transfers Enable Financial Inclusion in India?”
CGAP - Advancing financial inclusion to improve the lives of the poor (web log), February 19,
2015. http://www.cgap.org/blog/can-digital-cash-transfers-enable-financial-inclusion-india
Banerjee, Shweta S. From Cash to Digital Transfers in India: The Story So Far. Issue brief.
CGAP - Consultative Group to Assist the Poor. February 2015. https://www.cgap.org/sites/
default/files/Brief-From-Cash-to-Digital-Transfers-in-India-Feb-2015_0.pdf
Bangko Sentral ng Pilipinas, AFI Financial Inclusion Data Working Group, and Global
Partnership for Financial Inclusion. The Use of Financial Inclusion Data Country Case Study:
Philippines - Policy on Micro-deposits. Publication. January 2014. http://www.afi-global.org/
sites/default/files/publications/the_use_of_financial_inclusion_data_country_case_study_
philippines.pdf
Bangko Sentral ng Pilipinas. National Baseline Survey on Financial Inclusion. Report.
Inclusive Financial Advocacy Staff (IFAS), Bangko Sentral ng Pilipinas. 2015. http://www.bsp.
gov.ph/downloads/publications/2015/NBSFIFullReport.pdf
72
Beck, Steven, Lucia Cusmano, Sunniya Durrani-Jamal, Paul Holden, Niny Khor, Iota K. Nassr,
Virginia Robano, and Shigehiro Shinozaki. ADB–OECD Study on Enhancing Financial
Accessibility for SMEs - Lesson from Recent Crises. Publication. 2014. https://www.oecd.
org/cfe/smes/adb-oecd-study-enhancing-financial-accessibility-smes.pdf
Cull, Robert, Tilman Ehrbeck, and Nina Holle. Financial Inclusion and Development:
Recent Impact Evidence. Publication no. 92. Focus Notes, CGAP - Consultative Group to
Assist the Poor. April 2014. https://www.cgap.org/sites/default/files/FocusNote-Financial-
Inclusion-and-Development-April-2014.pdf
CGAP - Consultative Group to Assist the Poor. December 22, 2014. Projecting Impact of
Non-Traditional Data and Advanced Analytics on Delivery Costs . Presentation. http://
www.slideshare.net/CGAP/projecting-impact-of-nontraditional-data-and-advanced-analytics-
on-delivery-costs
Chen, Greg. “BKash Bangladesh: What Explains its Fast Start?” CGAP - Advancing
financial inclusion to improve the lives of the poor (web log), August 4, 2014. https://www.
cgap.org/blog/bkash-bangladesh-what-explains-its-fast-start
Chopra, Puneet, Rajde Paresh, Vivek Gupta, Priyank Mishra, and Akshat Pathak. “E-KYC and
the India Stack – A Transformative Blueprint for Emerging Markets.” MicroSave (web log),
March 2016. http://blog.microsave.net/e-kyc-and-the-india-stack-a-transformative-blueprint-
for-emerging-markets/
Dabla-Norris, Era, Yan Ji, Robert Townsend, and D. Filiz Unsal. Identifying Constraints to
Financial Inclusion and Their Impact on GDP and Inequality: A Structural Framework for
Policy. Working paper no. 15/22. Strategy, Policy, and Review Department , International
Monetary Fund (IMF). January 27, 2015. https://www.imf.org/external/pubs/ft/wp/2015/
wp1522.pdf
Dalle, Rumbadi, and Amirullah. “BI: Cash Transactions Still More Popular than
E-payments.” Tempo - Economy & Business. April 24, 2015. http://en.tempo.co/read/
news/2015/04/24/056660543/%20BI-Cash-Transactions-Still-More-Popular-than-E-payments
“Data & Analysis | Publications | Explore Content.” Welcome to MIX Market! | MIX.
http://www.themix.org/mixmarket
Sponsors: MetLife Foundation, MasterCard Foundation, CGAP, Citi Foundation
Demirgüç-Kunt, Asli, and Ross Levine. Finance, Financial Sector Policies, and Long-Run
Growth. Working paper no. 11. Commission on Growth and Development, The World Bank.
2008. http://siteresources.worldbank.org/EXTPREMNET/Resources/489960-1338997241035/
Growth_Commission_Working_Paper_11_Finance_Financial_Sector_Policies_Long_Run_
Growth.pdf
73
Ekberg, Jason, Ritwik Ghosh, and Iwan Kurniawan. Time For Marketplace Lending.
Publication. Financial Services, Oliver Wyman and Modalku. April 2016. http://www.
oliverwyman.com/content/dam/oliver-wyman/global/en/2016/apr/Time_For_Marketplace_
Lending.pdf
“Exploring the Gender and Land Rights Database (GLRD).” Gender and Land Rights
Database | FAO | Food and Agriculture Organization of the United Nations. http://www.fao.
org/gender-landrights-database/en/
“Financial Inclusion Data/Global Findex.” Financial Inclusion Data. http://datatopics.
worldbank.org/financialinclusion/indv-characteristics/gender
“Financial Inclusion Data/Global Findex - Cambodia.” http://datatopics.worldbank.org/
financialinclusion/country/cambodia
“Global Financial Inclusion (Global Findex) Database.” Global Financial Inclusion (Global
Findex) Database | Data. http://data.worldbank.org/data-catalog/financial_inclusion
GSMA. “Account to Account (A2A) Interoperability | Digital Commerce.” Digital
Commerce. 2016. http://www.gsma.com/digitalcommerce/mobile-money/a2a-interoperability
GSMA. The Mobile Economy. Report. GSMA. 2015. http://www.gsma.com/mobileeconomy/
global/2015/
Indonesia. Bank Indonesia. Peraturan Bank Indonesia Nomor: 11/12/PBI/2009 Tentang
Uang Elektronik (Electronic Money). April 13, 2009. http://www.bi.go.id/id/peraturan/sistem-
pembayaran/Documents/f3bde247515e4d60b50955db31f8d91epbi_111209.pdf
Indonesia. Bank Indonesia. Peraturan Bank Indonesia Nomor: 16/8/PBI/2014 Tentang
Perubahan Atas Peraturan Bank Indonesia Nomor: 11/12/PBI/2009 Tentang Uang
Elektronik (Electronic Money). April 8, 2014. http://www.bi.go.id/id/peraturan/sistem-
pembayaran/Documents/PBI%20No.16_8_PBI_2014.pdf
Grossman, Jeremiah, and Paul Khalil Nelson. Digital Finance for Development. Report. U.S.
Global Development Lab, USAID. October 31, 2013. https://static.globalinnovationexchange.
org/asset/document/Digital_Finance_Handbook_-_Complete_Vesion_-_v11.pdf
Hokans, James, Leesa Shrader, Wajiha Ahmed, and Anatoly Jing Gusto. Development
Results Focused Research Program - Country Diagnostic: Philippines. Report.
Department of Budget and Management, Better Than Cash Alliance. July 2015. https://www.
betterthancash.org/tools-research/case-studies/country-diagnostic-the-philippines
Japhta, Rubin, Prashant Murthy, Yopie Fahmi, and Anastassiya Marina. Women-owned
SMEs in Indonesia: A Golden Opportunity for Local Financial Institutions. Edited by Aarti
Gupta. Market Research Study. IFC and USAID, Frankfurt School of Finance & Management.
March 2016. https://www.ifc.org/wps/wcm/connect/677906e9-398d-45c1-8f87-84e503292f50/
SME Indonesia Final_Eng.pdf?MOD=AJPERES
74
“Kependudukan - bps.go.id.” - the Indonesia Bureau of Statistics. https://www.bps.go.id/
Subjek/view/id/12#subjekViewTab1|accordion-daftar-subjek1
Koblanck, Anna. Achieving Interoperability IN MOBILE FINANCIAL SERVICES -
Tanzania Case Study. Report. International Finance Corporation (IFC), World Bank Group.
March 10, 2015. https://www.ifc.org/wps/wcm/connect/8d518d004799ebf1bb8fff299ede9589/
IFC Tanzania Case study 10_03_2015.pdf?MOD=AJPERES
Launch of Cambodia Financial Inclusion Demand Side Survey. Report. SHIFT - Shaping
Inclusive Finance Transformations, UN Capital Develpoment Fund (UNCDF). July 13,
2016. http://shift.uncdf.org/launch-cambodia-financial-inclusion-demand-side-survey
Levine, Ross, Philippe Aghion, and Steven Durlauf. Finance and Growth: Theory and
Evidence. Handbook of Economic Growth, Chapter 12. Department of Economics, Brown
University. 2005. http://faculty.haas.berkeley.edu/ross_levine/Papers/Forth_Book_Durlauf_
FinNGrowth.pdf
Liv, Dannet. Study on the Drivers of Over-Indebtedness of Microfinance Borrowers in
Cambodia: An In-depth Investigation of Saturated Areas. Report. Cambodia Institute of
Development Study, Blue Orchard, Incofin, Oiko Credit. April 16, 2013. http://www.oikocredit.
coop/k/news/view/23918/462/over-indebtedness-of-microfinance-borrowers-in-cambodia.html
Maposa, Obert. FinScope Consumer Survey Kingdom of Cambodia 2015. Report. UN
Capital Develpoment Fund (UNCDF). July 2016. http://www.finmark.org.za/wp-content/
uploads/2016/07/finscope-consumer-survey-kingdom-of-cambodia.pdf
Mas, Ignacio. “Naming Sub-Accounts to Trigger Intuition (and Fun) Around Customer
Intentions.” MicroSave (web log), July 2013. http://blog.microsave.net/naming-sub-accounts-
to-trigger-intuition-and-fun-around-customer-intentions/
McCourtie, Simone D. “Micro, Small, and Medium Enterprise (MSME) Finance.” World
Bank. April 5, 2013. http://www.worldbank.org/en/results/2013/04/05/msme-finance-
expanding-opportunities-and-creating-jobs
McEvoy, Michael J., and Tirthankar Chakraborty. Enabling financial inclusion through
“alternative data”. Publication. MasterCard Advisors. 2014. http://compendium.mastercard.
com/app/SKU_pdfs/alternativeData.pdf
Mirzoyants-McKnight, Anastasia, Dr., and William Attfield. Value-added Financial Services
in Kenya: M-Shwari. Report. Research Program, InterMedia & Financial Inclusion Insights
(FII). January 2015. http://finclusion.org/uploads/file/reports/FII-Kenya-M-Shwari-Report.pdf
Mukherjee, Premasis, Akhand Tiwari, and Anup Singh. How Saving Is Influenced by
Behavioural Biases. Briefing Note #158. MicroSave. March 2015. http://www.microsave.net/
files/pdf/BN_158_How_Saving_Is_Influenced_by_Behavioural_Biases.pdf
75
Park, Cyn-Young, and Rogelio V. Mercado, Jr. Financial Inclusion, Poverty, and Income
Inequality in Developing Asia. Working paper no. 426. January 2015. https://www.adb.org/
sites/default/files/publication/153143/ewp-426.pdf
Philippines. Office of the Governor. Circular No. 694 Series of 2010 - Amendment of
Regulations on the Establishment of Other Banking Offices and Notes to Microfinance.
October 14, 2010. http://www.bsp.gov.ph/downloads/regulations/attachments/2010/c694.pdf
Philippines. Office of the Governor. Circular No. 796 Series of 2013 - Amendments to
Appendix 45 (Notes on Microfinance) of Section X361 of the Manual of Regulation for
Banks. May 3, 2013. http://www.bsp.gov.ph/downloads/regulations/attachments/2013/c796.pdf
Shinozaki, Shigehiro, Tanner Chaiken, Shreyans Jain, Konstantin Dorofev, Connie T. Delos
Santos, and Junray Bautista. Asia SME Finance Monitor 2014. Report. Asian Development
Bank. July 1, 2014. https://www.adb.org/sites/default/files/publication/173205/asia-sme-finance-
monitor2014.pdf
Suvidhaa | Prepaid Recharge, Bill Payment and Bill Management. www.suvidhaa.net
“Tanzania: Central Bank Sets 80 Percent Financial Inclusion Target.” AllAfrica.com. February
12, 2016. http://allafrica.com/stories/201602120505.html
“UNIFIED DATABASE.” UNIFIED DATABASE - Frequently Asked Questions (FAQs) : National
Team for the Acceleration of Poverty Reduction (TNP2K). http://www.tnp2k.go.id/en/frequently-
asked-questions-faqs/unified-database/
World Development Indicators | World DataBank. http://databank.worldbank.org/data/
reports.aspx?Code=IDN&id=556d8fa6&report_name=Popular_countries&populartype=count
ry&ispopular=y
Wright, Graham. “Two More Revolutions Underway in Kenya.” MicroSave (web log), May
2015. http://blog.microsave.net/two-more-revolutions-underway-in-kenya-2/
Zimmerman, Jamie M. “The Emergence of Responsible Digital Finance.” Center for Financial
Inclusion (web log), July 21, 2014. https://cfi-blog.org/2014/07/21/the-emergence-of-responsible-
digital-finance/
76
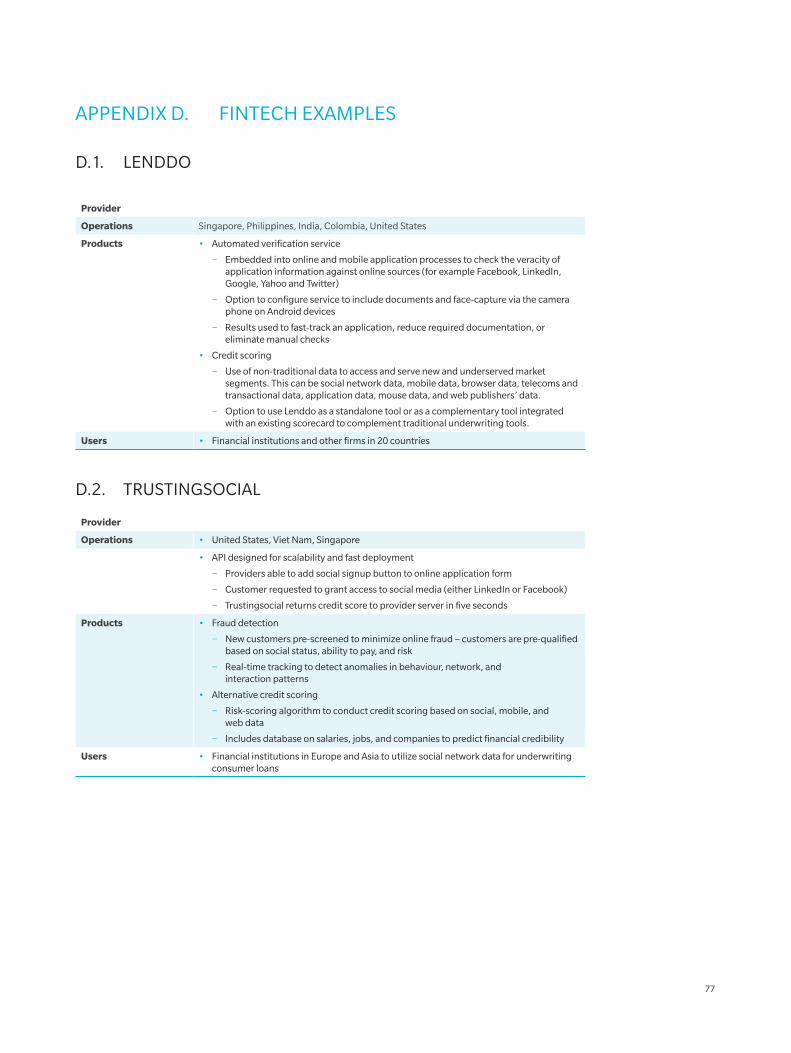
APPENDIX D. FINTECH EXAMPLES
D.1. LENDDO
Provider
Operations Singapore, Philippines, India, Colombia, United States
Products • Automated verification service
− Embedded into online and mobile application processes to check the veracity of application information against online sources (for example Facebook, LinkedIn, Google, Yahoo and Twitter)
− Option to configure service to include documents and face-capture via the camera phone on Android devices
− Results used to fast-track an application, reduce required documentation, or eliminate manual checks
• Credit scoring
− Use of non-traditional data to access and serve new and underserved market segments. This can be social network data, mobile data, browser data, telecoms and transactional data, application data, mouse data, and web publishers’ data.
− Option to use Lenddo as a standalone tool or as a complementary tool integrated with an existing scorecard to complement traditional underwriting tools.
Users • Financial institutions and other firms in 20 countries
D.2. TRUSTINGSOCIAL
Provider
Operations • United States, Viet Nam, Singapore
• API designed for scalability and fast deployment
− Providers able to add social signup button to online application form
− Customer requested to grant access to social media (either LinkedIn or Facebook)
− Trustingsocial returns credit score to provider server in five seconds
Products • Fraud detection
− New customers pre-screened to minimize online fraud – customers are pre-qualified based on social status, ability to pay, and risk
− Real-time tracking to detect anomalies in behaviour, network, and interaction patterns
• Alternative credit scoring
− Risk-scoring algorithm to conduct credit scoring based on social, mobile, and web data
− Includes database on salaries, jobs, and companies to predict financial credibility
Users • Financial institutions in Europe and Asia to utilize social network data for underwriting consumer loans
77
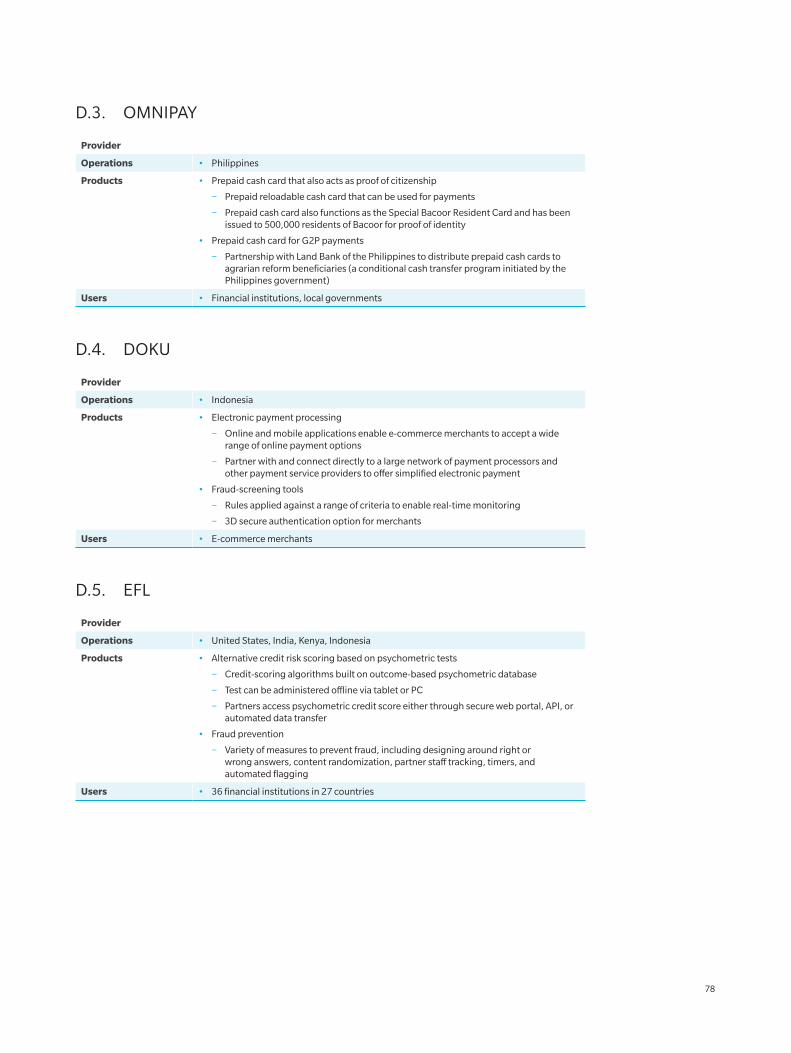
D.3. OMNIPAY
Provider
Operations • Philippines
Products • Prepaid cash card that also acts as proof of citizenship
− Prepaid reloadable cash card that can be used for payments
− Prepaid cash card also functions as the Special Bacoor Resident Card and has been issued to 500,000 residents of Bacoor for proof of identity
• Prepaid cash card for G2P payments
− Partnership with Land Bank of the Philippines to distribute prepaid cash cards to agrarian reform beneficiaries (a conditional cash transfer program initiated by the Philippines government)
Users • Financial institutions, local governments
D.4. DOKU
Provider
Operations • Indonesia
Products • Electronic payment processing
− Online and mobile applications enable e-commerce merchants to accept a wide range of online payment options
− Partner with and connect directly to a large network of payment processors and other payment service providers to offer simplified electronic payment
• Fraud-screening tools
− Rules applied against a range of criteria to enable real-time monitoring
− 3D secure authentication option for merchants
Users • E-commerce merchants
D.5. EFL
Provider
Operations • United States, India, Kenya, Indonesia
Products • Alternative credit risk scoring based on psychometric tests
− Credit-scoring algorithms built on outcome-based psychometric database
− Test can be administered offline via tablet or PC
− Partners access psychometric credit score either through secure web portal, API, or automated data transfer
• Fraud prevention
− Variety of measures to prevent fraud, including designing around right or wrong answers, content randomization, partner staff tracking, timers, and automated flagging
Users • 36 financial institutions in 27 countries
78
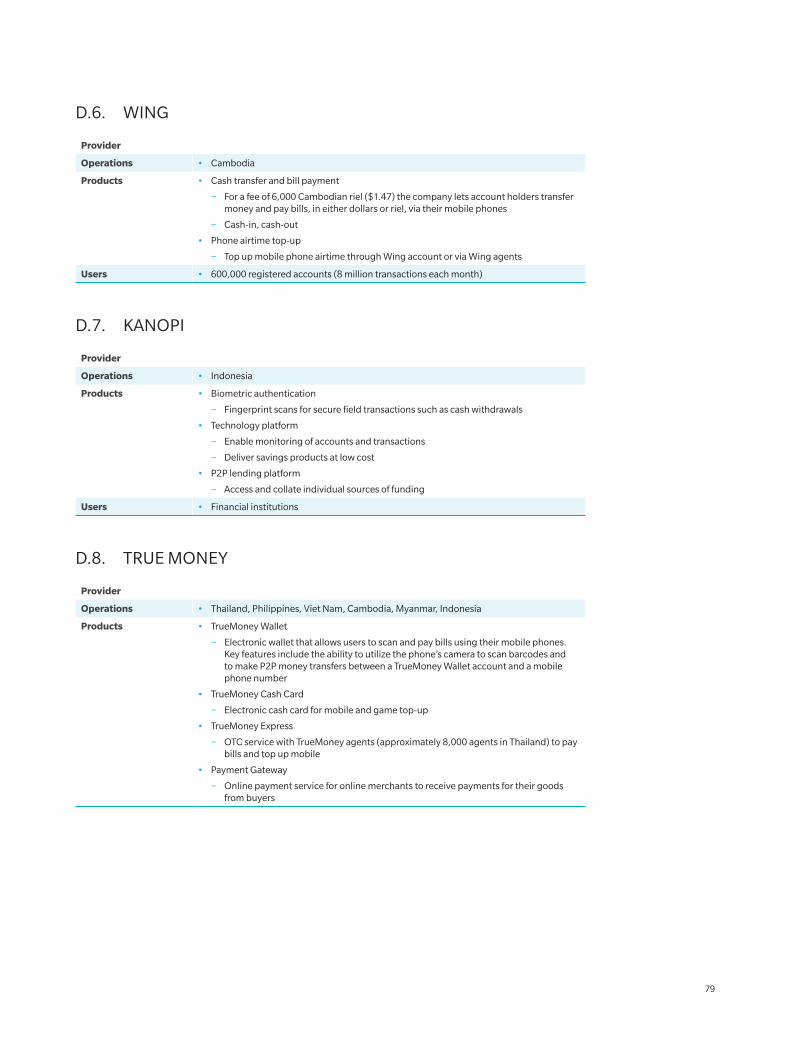
D.6. WING
Provider
Operations • Cambodia
Products • Cash transfer and bill payment
− For a fee of 6,000 Cambodian riel ($1.47) the company lets account holders transfer money and pay bills, in either dollars or riel, via their mobile phones
− Cash-in, cash-out
• Phone airtime top-up
− Top up mobile phone airtime through Wing account or via Wing agents
Users • 600,000 registered accounts (8 million transactions each month)
D.7. KANOPI
Provider
Operations • Indonesia
Products • Biometric authentication
− Fingerprint scans for secure field transactions such as cash withdrawals
• Technology platform
− Enable monitoring of accounts and transactions
− Deliver savings products at low cost
• P2P lending platform
− Access and collate individual sources of funding
Users • Financial institutions
D.8. TRUE MONEY
Provider
Operations • Thailand, Philippines, Viet Nam, Cambodia, Myanmar, Indonesia
Products • TrueMoney Wallet
− Electronic wallet that allows users to scan and pay bills using their mobile phones. Key features include the ability to utilize the phone’s camera to scan barcodes and to make P2P money transfers between a TrueMoney Wallet account and a mobile phone number
• TrueMoney Cash Card
− Electronic cash card for mobile and game top-up
• TrueMoney Express
− OTC service with TrueMoney agents (approximately 8,000 agents in Thailand) to pay bills and top up mobile
• Payment Gateway
− Online payment service for online merchants to receive payments for their goods from buyers
79
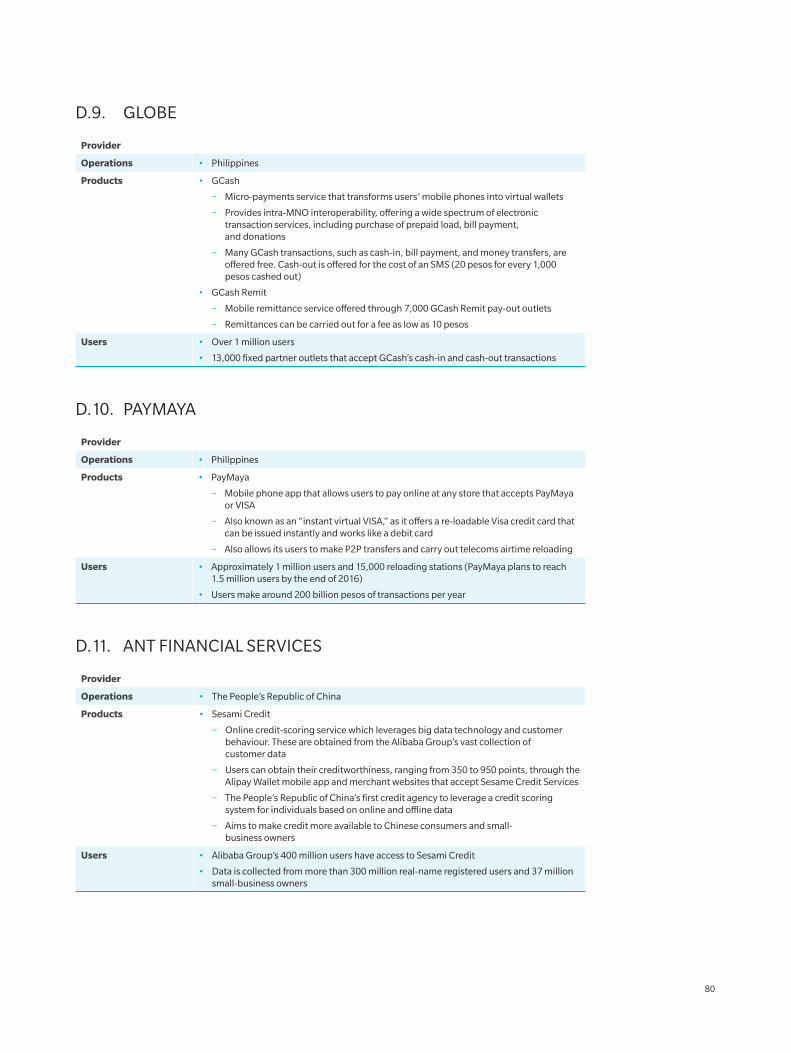
D.9. GLOBE
Provider
Operations • Philippines
Products • GCash
− Micro-payments service that transforms users’ mobile phones into virtual wallets
− Provides intra-MNO interoperability, offering a wide spectrum of electronic transaction services, including purchase of prepaid load, bill payment, and donations
− Many GCash transactions, such as cash-in, bill payment, and money transfers, are offered free. Cash-out is offered for the cost of an SMS (20 pesos for every 1,000 pesos cashed out)
• GCash Remit
− Mobile remittance service offered through 7,000 GCash Remit pay-out outlets
− Remittances can be carried out for a fee as low as 10 pesos
Users • Over 1 million users
• 13,000 fixed partner outlets that accept GCash’s cash-in and cash-out transactions
D.10. PAYMAYA
Provider
Operations • Philippines
Products • PayMaya
− Mobile phone app that allows users to pay online at any store that accepts PayMaya or VISA
− Also known as an “instant virtual VISA,” as it offers a re-loadable Visa credit card that can be issued instantly and works like a debit card
− Also allows its users to make P2P transfers and carry out telecoms airtime reloading
Users • Approximately 1 million users and 15,000 reloading stations (PayMaya plans to reach 1.5 million users by the end of 2016)
• Users make around 200 billion pesos of transactions per year
D.11. ANT FINANCIAL SERVICES
Provider
Operations • The People’s Republic of China
Products • Sesami Credit
− Online credit-scoring service which leverages big data technology and customer behaviour. These are obtained from the Alibaba Group’s vast collection of customer data
− Users can obtain their creditworthiness, ranging from 350 to 950 points, through the Alipay Wallet mobile app and merchant websites that accept Sesame Credit Services
− The People’s Republic of China’s first credit agency to leverage a credit scoring system for individuals based on online and offline data
− Aims to make credit more available to Chinese consumers and small-business owners
Users • Alibaba Group’s 400 million users have access to Sesami Credit
• Data is collected from more than 300 million real-name registered users and 37 million small-business owners
80
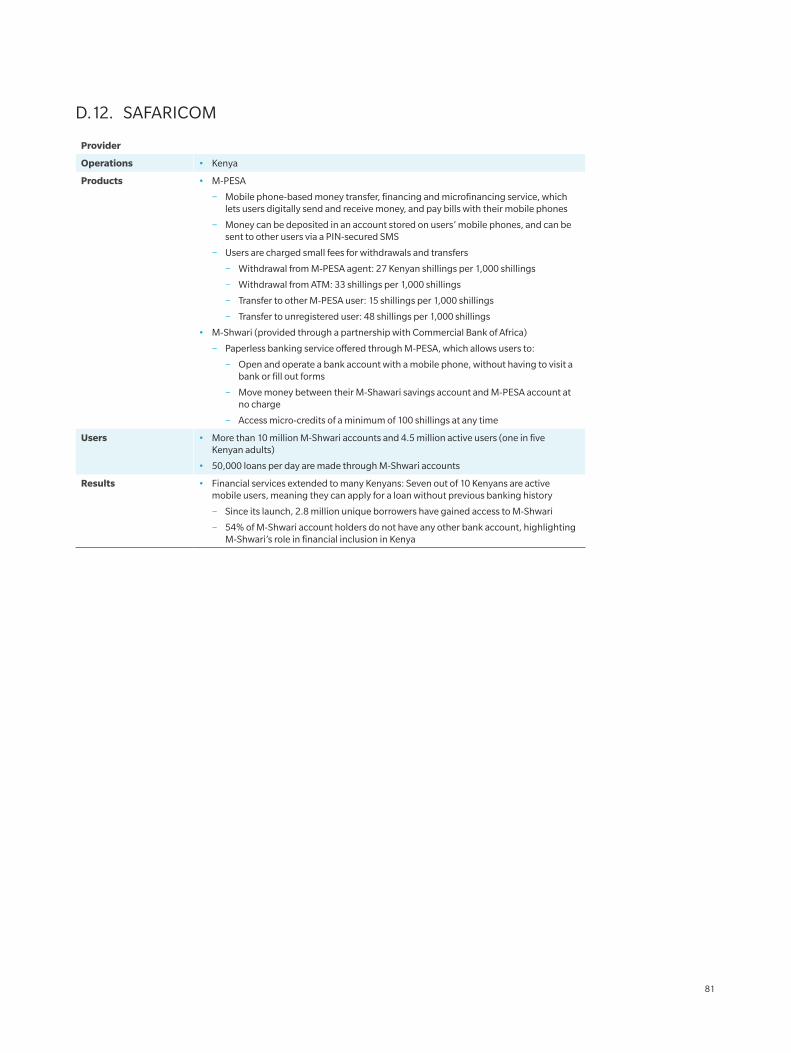
D.12. SAFARICOM
Provider
Operations • Kenya
Products • M-PESA
− Mobile phone-based money transfer, financing and microfinancing service, which lets users digitally send and receive money, and pay bills with their mobile phones
− Money can be deposited in an account stored on users’ mobile phones, and can be sent to other users via a PIN-secured SMS
− Users are charged small fees for withdrawals and transfers
− Withdrawal from M-PESA agent: 27 Kenyan shillings per 1,000 shillings
− Withdrawal from ATM: 33 shillings per 1,000 shillings
− Transfer to other M-PESA user: 15 shillings per 1,000 shillings
− Transfer to unregistered user: 48 shillings per 1,000 shillings
• M-Shwari (provided through a partnership with Commercial Bank of Africa)
− Paperless banking service offered through M-PESA, which allows users to:
− Open and operate a bank account with a mobile phone, without having to visit a bank or fill out forms
− Move money between their M-Shawari savings account and M-PESA account at no charge
− Access micro-credits of a minimum of 100 shillings at any time
Users • More than 10 million M-Shwari accounts and 4.5 million active users (one in five Kenyan adults)
• 50,000 loans per day are made through M-Shwari accounts
Results • Financial services extended to many Kenyans: Seven out of 10 Kenyans are active mobile users, meaning they can apply for a loan without previous banking history
− Since its launch, 2.8 million unique borrowers have gained access to M-Shwari
− 54% of M-Shwari account holders do not have any other bank account, highlighting M-Shwari’s role in financial inclusion in Kenya
81
APPENDIX E. LIST OF STAKEHOLDERS INTERVIEWED
This publication reflects the ideas and contributions of many individuals, gleaned through
interviews, conference calls, and document reviews. The project team would like to offer its
special gratitude to industry experts who graciously shared their time and insights during
the preparation of this report.
KARTUKUASURANSIACA
EFLBTPN BANK
DANAMON
BANK ANDARA
ADIRA FINANCE KINARA
UANGTEMAN BANK INDONESIA
INDONESIA FINANCIAL SERVICES AUTHORITYDOKU
PERMATA BANK
KANOPIINDONESIA
MEKAR
E-MITRA INDONESIA
BINA ARTHA
AXIATA
VASHAM
TELKOMSEL
LPEM FEB UIUNIVERSITAS INDONESIA
MAMPU AFI
MANDIRI
INDOSAT
INDONESIA
8 VILLAGES
LENDDO BRIDGE
BANGKO SENTRAL NG PILIPINAS
MYNT
USAID BANCNETUNION BANK
TAO
NATCCO NETWORK
PAYSWITCH
LANDBANK GRAMEEN BANK
WOMEN’S BUSINESS COUNCIL PHILIPPINES
PLDT
OIKO CREDIT
BAYAD CENTER
CARD BANK, INC.
PINOYME
PHILIPPINES
ASAOMNIPAY
AYALA
PIDS
BPISMARTPESA
PHILIPPINES
IMTFI
82
BIMA
RACHA
ENTREPRENEURS DU MONDE
AMK
BIMA
GOOD RETURN
BLUE ORCHARD CARE
MINISTRY OF ECONOMY AND FINANCEHATTHA KAKSEKAR LIMITED
OXFAM
PRASAC MICROFINANCE INSTITUTIONACLEDA BANK PLCPHILIPBANK
KREDIT MICROFINANCE INSTITUITION PLC
CBCCREDIT BUREAU CAMBODIA
WINGINCOFIN
FTB
CAMBODIA MICROFINANCE ASSOCIATION
CAMBODIA
CELLCARD
UNCDF
PACT
MOAI
CB BANKWAVE MONEY
FINANCIAL REGULATORY DEPARTMENT
CENTRAL BANK OF MYANMAR
AYA BANK
MYANMAR
WORLDVISION
83
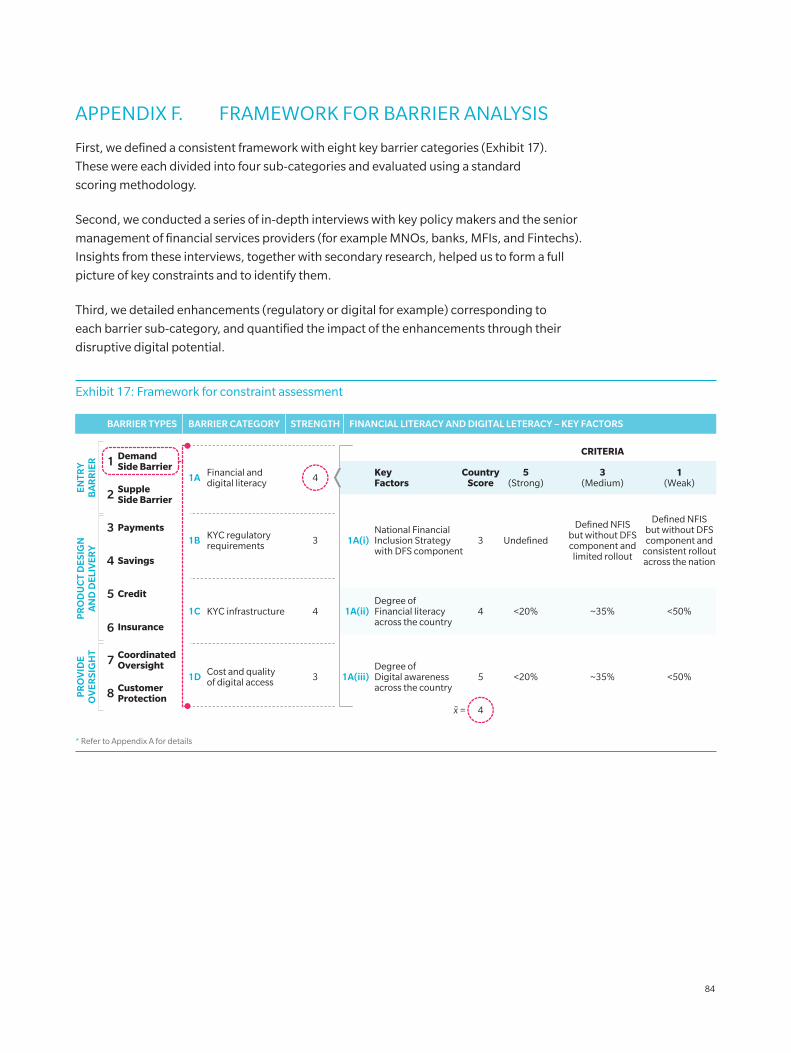
APPENDIX F. FRAMEWORK FOR BARRIER ANALYSIS
First, we defined a consistent framework with eight key barrier categories (Exhibit 17).
These were each divided into four sub-categories and evaluated using a standard
scoring methodology.
Second, we conducted a series of in-depth interviews with key policy makers and the senior
management of financial services providers (for example MNOs, banks, MFIs, and Fintechs).
Insights from these interviews, together with secondary research, helped us to form a full
picture of key constraints and to identify them.
Third, we detailed enhancements (regulatory or digital for example) corresponding to
each barrier sub-category, and quantified the impact of the enhancements through their
disruptive digital potential.
Exhibit 17: Framework for constraint assessment
BARRIER TYPES
ENTR
YB
AR
RIE
RP
RO
VID
EO
VER
SIG
HT
1A(iii)
CRITERIA
4
Degree ofDigital awarenessacross the country
SuppleSide Barrier
BARRIER CATEGORY STRENGTH FINANCIAL LITERACY AND DIGITAL LETERACY – KEY FACTORS
3 5
KeyFactors
CountryScore
5(Strong)
3(Medium)
1(Weak)
<20% ~35% <50%
PR
OD
UC
T D
ESIG
NA
ND
DEL
IVER
Y
1A(i)
1A(ii)
National FinancialInclusion Strategywith DFS component
3
Degree ofFinancial literacyacross the country
4 4
1D
1A Financial anddigital literacy
Cost and qualityof digital access
1C
1B KYC regulatoryrequirements
KYC infrastructure
3
<20%
Undefined
Defined NFISbut without DFScomponent and
limited rollout
Defined NFISbut without DFScomponent and
consistent rolloutacross the nation
~35% <50%
Payments
Savings
Credit
Insurance
CoordinatedOversight
CustomerProtection
4=
DemandSide Barrier1
2
3
4
5
6
7
8
* Refer to Appendix A for details
84
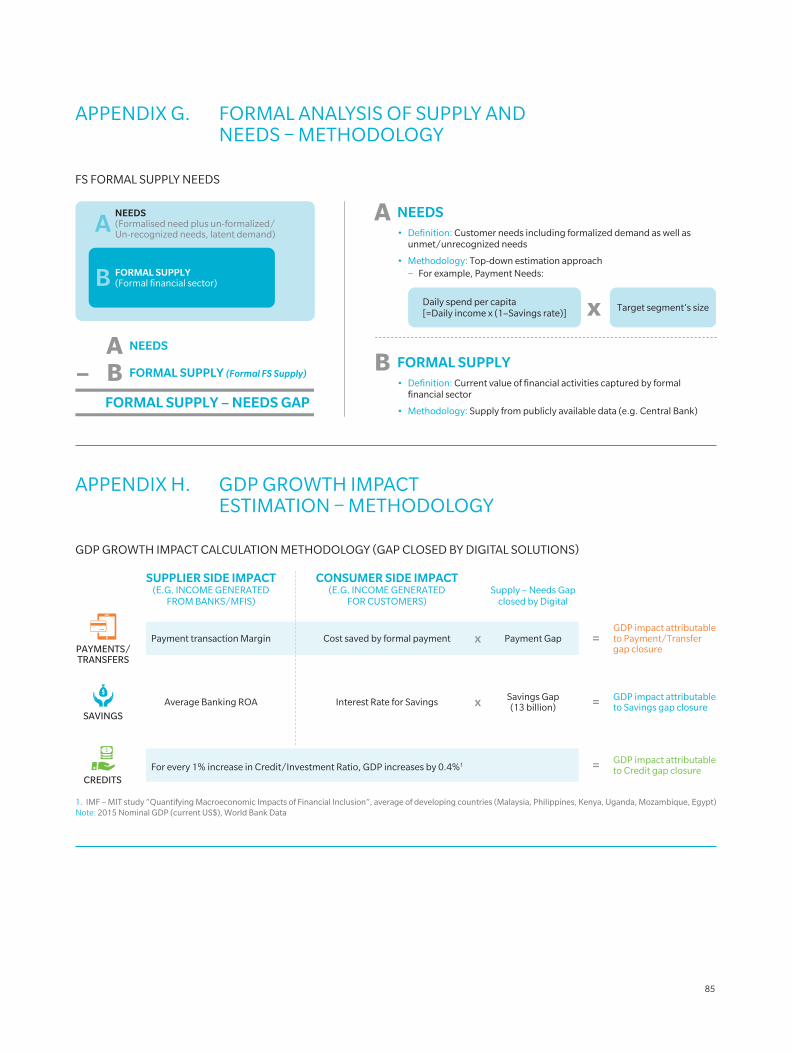
A NEEDS
B– FORMAL SUPPLY (Formal FS Supply)
FORMAL SUPPLY – NEEDS GAP
ANEEDS(Formalised need plus un-formalized/ Un-recognized needs, latent demand)
FORMAL SUPPLY(Formal financial sector)
FS FORMAL SUPPLY NEEDS
• Definition: Customer needs including formalized demand as well as unmet/unrecognized needs
• Methodology: Top-down estimation approach− For example, Payment Needs:
xDaily spend per capita[=Daily income x (1–Savings rate)]
Target segment’s size
NEEDS
B• Definition: Current value of financial activities captured by formal
financial sector
• Methodology: Supply from publicly available data (e.g. Central Bank)
FORMAL SUPPLY
B
A
GDP GROWTH IMPACT CALCULATION METHODOLOGY (GAP CLOSED BY DIGITAL SOLUTIONS)
SUPPLIER SIDE IMPACT(E.G. INCOME GENERATED
FROM BANKS/MFIS)
CONSUMER SIDE IMPACT(E.G. INCOME GENERATED
FOR CUSTOMERS)Supply – Needs Gap
closed by Digital
SAVINGS
CREDITS
PAYMENTS/TRANSFERS
Payment transaction Margin
Average Banking ROA
Cost saved by formal payment
Interest Rate for Savings
Payment Gap
Savings Gap(13 billion)x
x
For every 1% increase in Credit/Investment Ratio, GDP increases by 0.4%1
1. IMF – MIT study “Quantifying Macroeconomic Impacts of Financial Inclusion”, average of developing countries (Malaysia, Philippines, Kenya, Uganda, Mozambique, Egypt)Note: 2015 Nominal GDP (current US$), World Bank Data
GDP impact attributableto Payment/Transfergap closure
GDP impact attributableto Savings gap closure
GDP impact attributableto Credit gap closure
=
=
=
APPENDIX G. FORMAL ANALYSIS OF SUPPLY AND NEEDS – METHODOLOGY
APPENDIX H. GDP GROWTH IMPACT ESTIMATION – METHODOLOGY
85
About Asian Development Bank
ADB’s vision is an Asia and Pacific region free of poverty. Its mission is to help its developing member countries reduce poverty and improve the quality of life of their people. Despite the region’s many successes, it remains home to a large share of the world’s poor. ADB is committed to reducing poverty through inclusive economic growth, environmentally sustainable growth, and regional integration.
Based in Manila, ADB is owned by 67 members, including 48 from the region. Its main instruments for helping its developing member countries are policy dialogue, loans, equity investments, guarantees, grants, and technical assistance.
6 ADB Avenue, Mandaluyong City, 1550 Metro Manila, Philippines Tel: +63 2 632 4444; Fax: +63 2 636 2444 www.adb.org
Oliver Wyman is a global leader in management consulting that combines deep industry knowledge with specialized expertise in strategy, operations, risk management, and organization transformation.
For more information please contact the marketing department by email at [email protected] or by phone at one of the following locations:
ASIA PACIFIC EMEA AMERICAS
+65 6510 9700 +44 20 7333 8333 +1 212 541 8100
www.oliverwyman.com
This report was commissioned by ADB and is prepared by Oliver Wyman with substantial contributions from MicroSave. Each of Oliver Wyman and MicroSave retain their rights to their respective data, products, materials, trademarks, methodologies, methods of analysis, tools and techniques that have existed prior to this report or developed independently thereof and have been incorporated into this report.
This report is not investment advice and should not be relied on for such advice or as a substitute for consultation with professional accountants, tax, legal or financial advisors. Oliver Wyman has made every effort to use reliable, up-to-date and comprehensive information and analysis, but all information is provided without warranty of any kind, express or implied. Oliver Wyman disclaims any responsibility to update the information or conclusions in this report. Oliver Wyman accepts no liability for any loss arising from any action taken or refrained from as a result of information contained in this report or any reports or sources of information referred to herein, or for any consequential, special or similar damages even if advised of the possibility of such damages. The report is not an offer to buy or sell securities or a solicitation of an offer to buy or sell securities.
© 2017 Asian Development Bank
The views expressed in this publication are those of the authors and do not necessarily reflect the views and policies of the Asian Development Bank (ADB) or its Board of Governors or the governments they represent.
ADB does not guarantee the accuracy of the data included in this publication and accepts no responsibility for any consequence of their use. The mention of specific companies or products of manufacturers does not imply that they are endorsed or recommended by ADB in preference to others of a similar nature that are not mentioned.
By making any designation of or reference to a particular territory or geographic area, or by using the term “country” in this document, ADB does not intend to make any judgments as to the legal or other status of any territory or area.
ISBN 978-92-9257-713-1ISBN 978-92-9257-714-8http://dx.doi.org/10.22617/RPT178622-2