Embed Size (px)
Citation preview

Accelerating shrinkage of Patagonian glaciers from theLittle Ice Age (��AD1870) to 2011
B.J. DAVIES, N.F. GLASSERInstitute for Geography and Earth Sciences, Aberystwyth University, Aberystwyth, UK
E-mail: [email protected]
ABSTRACT. We used Little Ice Age (LIA) trimlines and moraines to assess changes in South Americanglaciers over the last ��140 years. We determined the extent and length of 640 glaciers during the LIA(��AD 1870) and 626 glaciers (the remainder having entirely disappeared) in 1986, 2001 and 2011. Thecalculated reduction in glacierized area between the LIA and 2011 is 4131 km2 (15.4%), with 660 km2
(14.2%) being lost from the Northern Patagonia Icefield (NPI), 1643 km2 (11.4%) from the SouthernPatagonia Icefield (SPI) and 306 km2 (14.4%) from Cordillera Darwin. Latitude, size and terminalenvironment (calving or land-terminating) exert the greatest control on rates of shrinkage. Small,northerly, land-terminating glaciers shrank fastest. Annual rates of area loss increased dramatically after2001 for mountain glaciers north of 5288 S and the large icefields, with the NPI and SPI now shrinking at9.4 km2 a–1 (0.23%a–1) and 20.5 km2 a–1 (0.15%a–1) respectively. The shrinkage of glaciers between528 S and 548 S accelerated after 1986, and rates of shrinkage from 1986 to 2011 remained steady.Icefield outlet glaciers, isolated glaciers and ice caps south of 548 S shrank faster from 1986 to 2001 thanthey did from 2001 to 2011.
1. INTRODUCTION1.1. RationaleThe glaciers of the Patagonian Andes and Tierra del Fuegoregion are currently shrinking rapidly. Regional assessmentsof glacier shrinkage are, however, only short-term becausethey are limited by the temporal availability of satelliteobservations (�40 years), aerial photography (�60 years) anddetailed cartography (�60 years) required to produce accur-ate reconstructions of former glacier extent. Furthermore,inventories and assessments of modern glacier change inPatagonia have generally been restricted to individualglaciers (e.g. Harrison and Winchester, 2000; Stuefer andothers, 2007) or geographically limited to one or two of thelarge icefields (e.g. Rivera and Cassassa, 2004; Bown andRivera, 2007; Chen and others, 2007; Schneider and others,2007; Lopez and others, 2010; Willis and others, 2011).Large parts of the southern Andes still lack detailedinventories (Masiokas and others, 2009a). There are nodetailed assessments that encompass the entire region,covering both historically documented shrinkage and re-motely sensed observations of change in recent decades. Thispaper therefore aims, firstly, to establish rates of glaciershrinkage from the Little Ice Age (LIA) to the present dayacross southern South America, and secondly, to determinehow rates of shrinkage changed through the late 20th andearly 21st centuries.
We here present a long (140 years) and spatially wide(2000 km in length) record of glacier change in SouthAmerica (41–568 S) by calculating changes in glacier lengthand area between the end of the LIA (�AD 1870) and theyears 1986, 2001 and 2011, with some limited additionaldata from 1975. This is the first study to compare length andarea changes since the LIAwith change in recent decades forthe whole study region. We also analyse spatial and temporalvariability in glacier change and the controls thereupon. Ourdata are available from the Global Land Ice Measurementsfrom Space (GLIMS) database (www.glims.org).
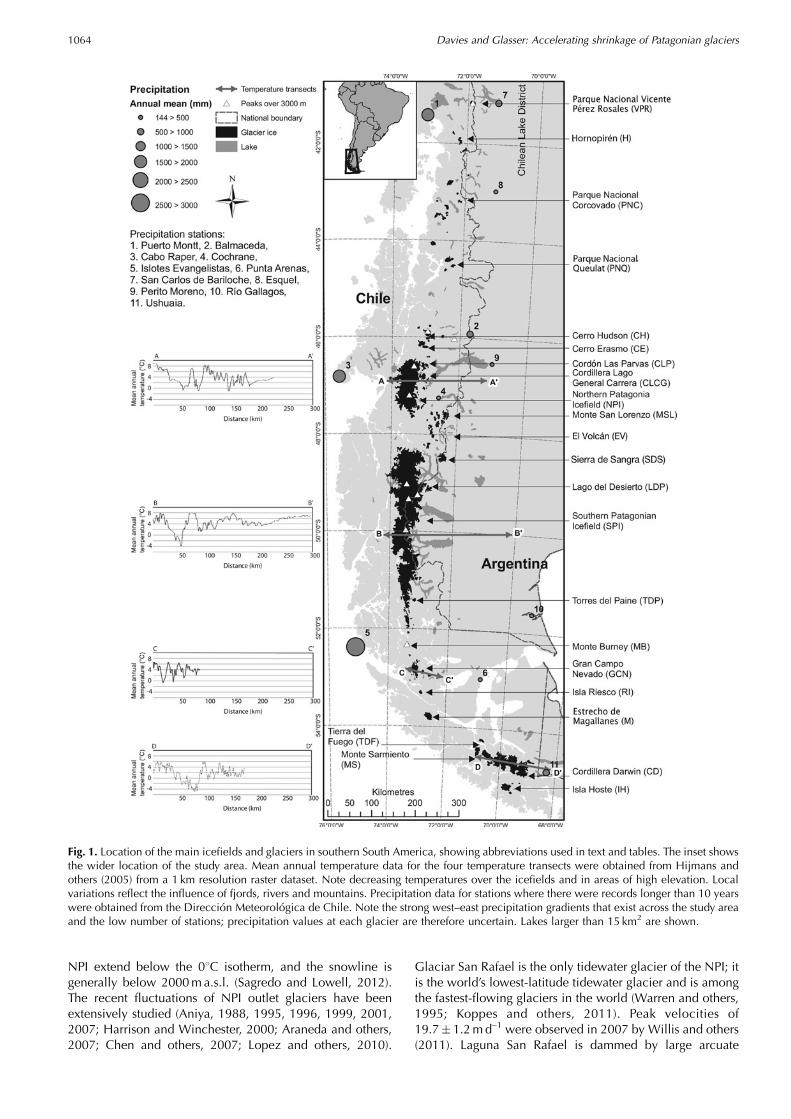
1.2. Study areaThe Andes is the longest continental mountain range in theworld, stretching 7000 km along the coast of South Americaand reaching almost 7000ma.s.l. In our study area, themountains reach a maximum of 4000ma.s.l., decreasing to1500–2000m in southernmost South America. Between388 S and 568 S there are four major ice masses (the Northernand Southern Patagonia Icefields, Gran Campo Nevado(GCN) and Cordillera Darwin) and numerous snow- and ice-capped volcanoes and icefields (Fig. 1). Our study areafocuses on the Patagonian Andes and Tierra del Fuego, from418 S to 568 S. This region has been the subject of numerousdetailed local studies covering glacier behaviour overvarious timescales, and there is good historical and geo-morphological evidence for glacier fluctuations since theLIA (summarized by Masiokas and others, 2009a).
The Chilean Lake District (38–428 S) is characterized byshrinking glaciers on active volcanic cones, with frequentash deposition insulating the ice. These volcano ice capshave been thinning since observations began in 1961, withmore rapid thinning from 1981 to 1998. Their negativemass balances were caused by decreased precipitationand upper-tropospheric warming over the last 30 years(Bown and Rivera, 2007). Equilibrium-line altitudes (ELAs)are at �1600m at 438 S (Rivera and others, 2012). Glaciersnorth of 428 S receive higher precipitation during wintermonths than glaciers between 428 S and 498 S (Sagredo andLowell, 2012).
The Northern Patagonia Icefield (NPI) covers an area of�4200 km2 at 478 S (Fig. 2a). Its survival at such a lowlatitude is attributed to a large volume of precipitation (up to10 000mmw.e. a–1) and to the cool temperatures associatedwith the high elevation of the Andes (Rott and others, 1998;Michel and Rignot, 1999; see temperature transects inFig. 1). The NPI is characterized by high ablation rates, steepmass-balance and precipitation gradients and high icevelocities (Lopez and others, 2010). The glaciers of the
Journal of Glaciology, Vol. 58, No. 212, 2012 doi: 10.3189/2012JoG12J026 1063
NPI extend below the 08C isotherm, and the snowline isgenerally below 2000ma.s.l. (Sagredo and Lowell, 2012).The recent fluctuations of NPI outlet glaciers have beenextensively studied (Aniya, 1988, 1995, 1996, 1999, 2001,2007; Harrison and Winchester, 2000; Araneda and others,2007; Chen and others, 2007; Lopez and others, 2010).
Glaciar San Rafael is the only tidewater glacier of the NPI; itis the world’s lowest-latitude tidewater glacier and is amongthe fastest-flowing glaciers in the world (Warren and others,1995; Koppes and others, 2011). Peak velocities of19.7� 1.2md–1 were observed in 2007 by Willis and others(2011). Laguna San Rafael is dammed by large arcuate
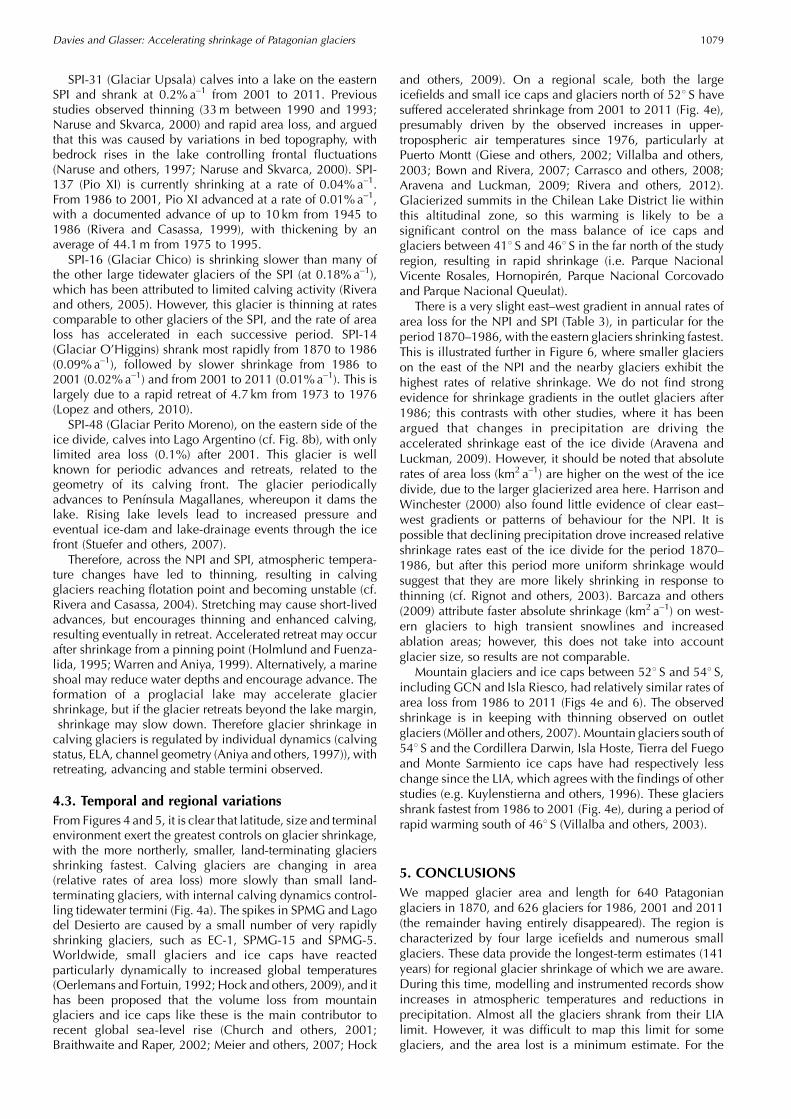
Fig. 1. Location of the main icefields and glaciers in southern South America, showing abbreviations used in text and tables. The inset showsthe wider location of the study area. Mean annual temperature data for the four temperature transects were obtained from Hijmans andothers (2005) from a 1 km resolution raster dataset. Note decreasing temperatures over the icefields and in areas of high elevation. Localvariations reflect the influence of fjords, rivers and mountains. Precipitation data for stations where there were records longer than 10 yearswere obtained from the Direccion Meteorologica de Chile. Note the strong west–east precipitation gradients that exist across the study areaand the low number of stations; precipitation values at each glacier are therefore uncertain. Lakes larger than 15 km2 are shown.
Davies and Glasser: Accelerating shrinkage of Patagonian glaciers1064
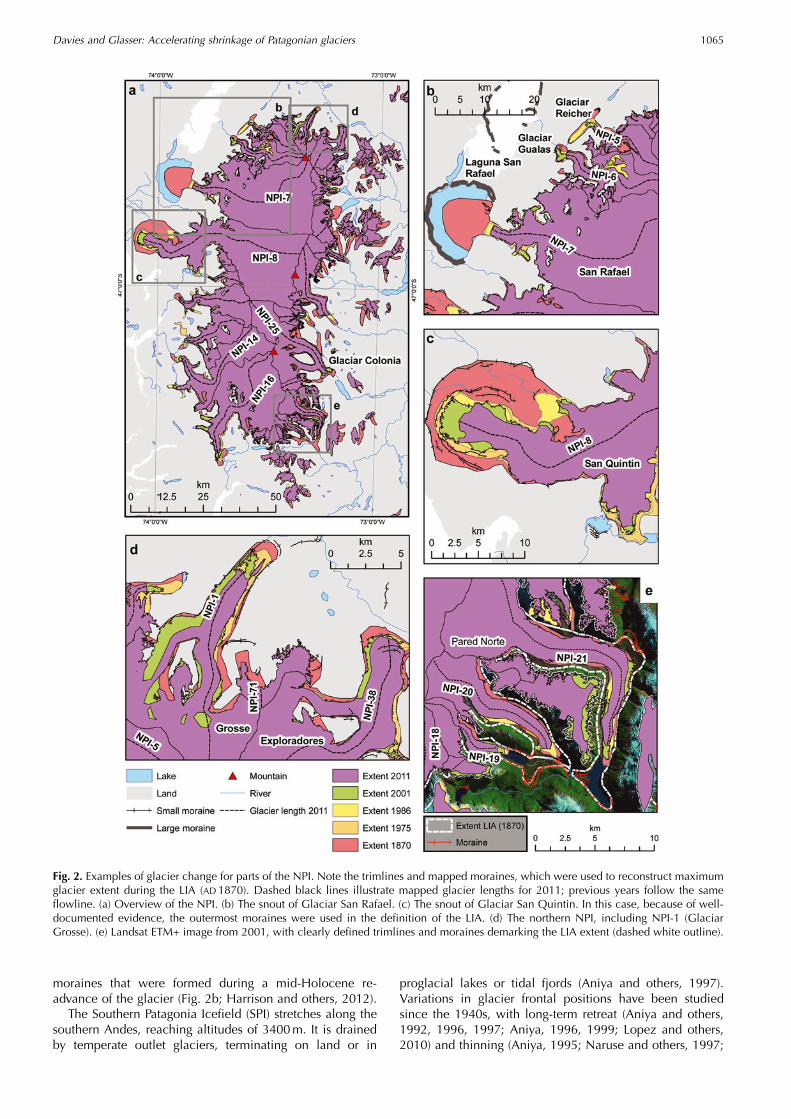
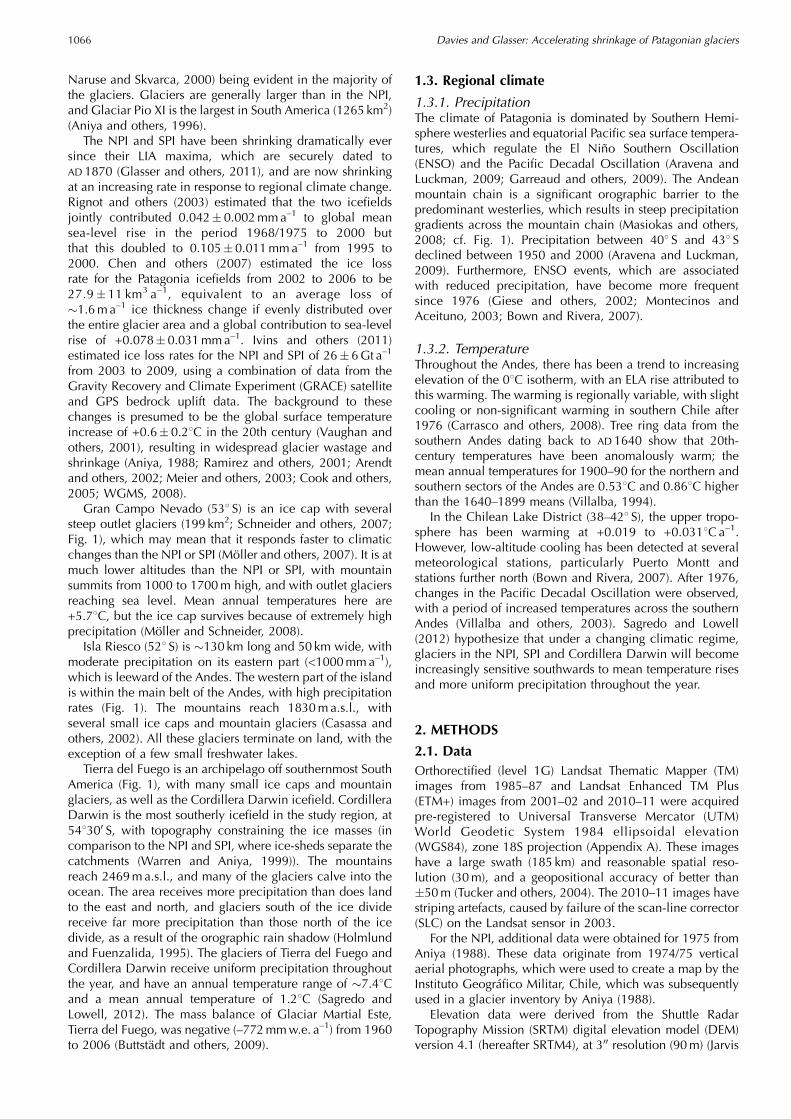
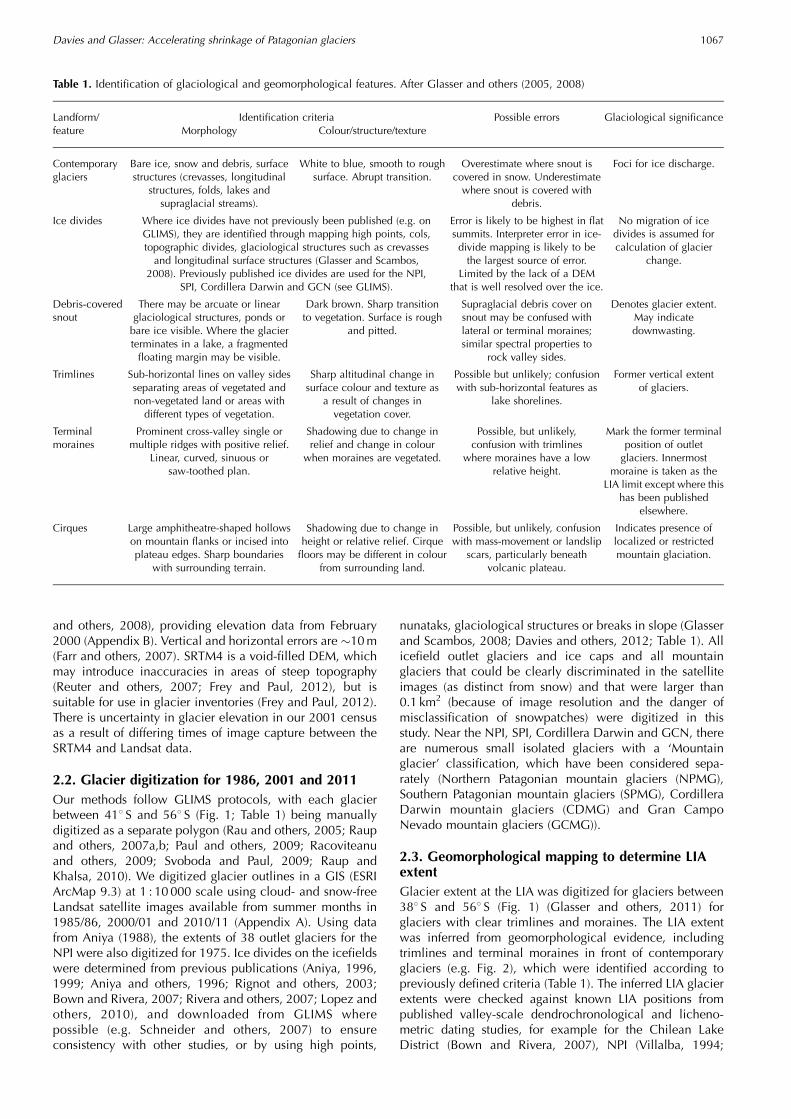
moraines that were formed during a mid-Holocene re-advance of the glacier (Fig. 2b; Harrison and others, 2012).
The Southern Patagonia Icefield (SPI) stretches along thesouthern Andes, reaching altitudes of 3400m. It is drainedby temperate outlet glaciers, terminating on land or in
proglacial lakes or tidal fjords (Aniya and others, 1997).Variations in glacier frontal positions have been studiedsince the 1940s, with long-term retreat (Aniya and others,1992, 1996, 1997; Aniya, 1996, 1999; Lopez and others,2010) and thinning (Aniya, 1995; Naruse and others, 1997;
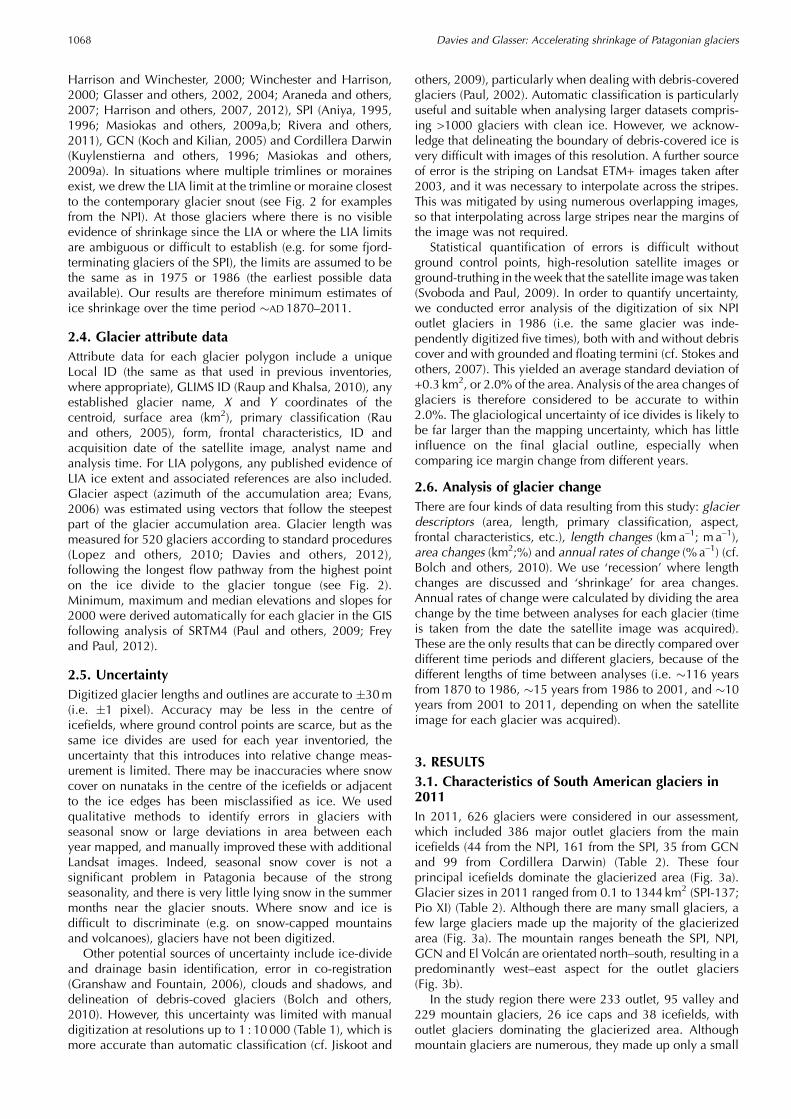
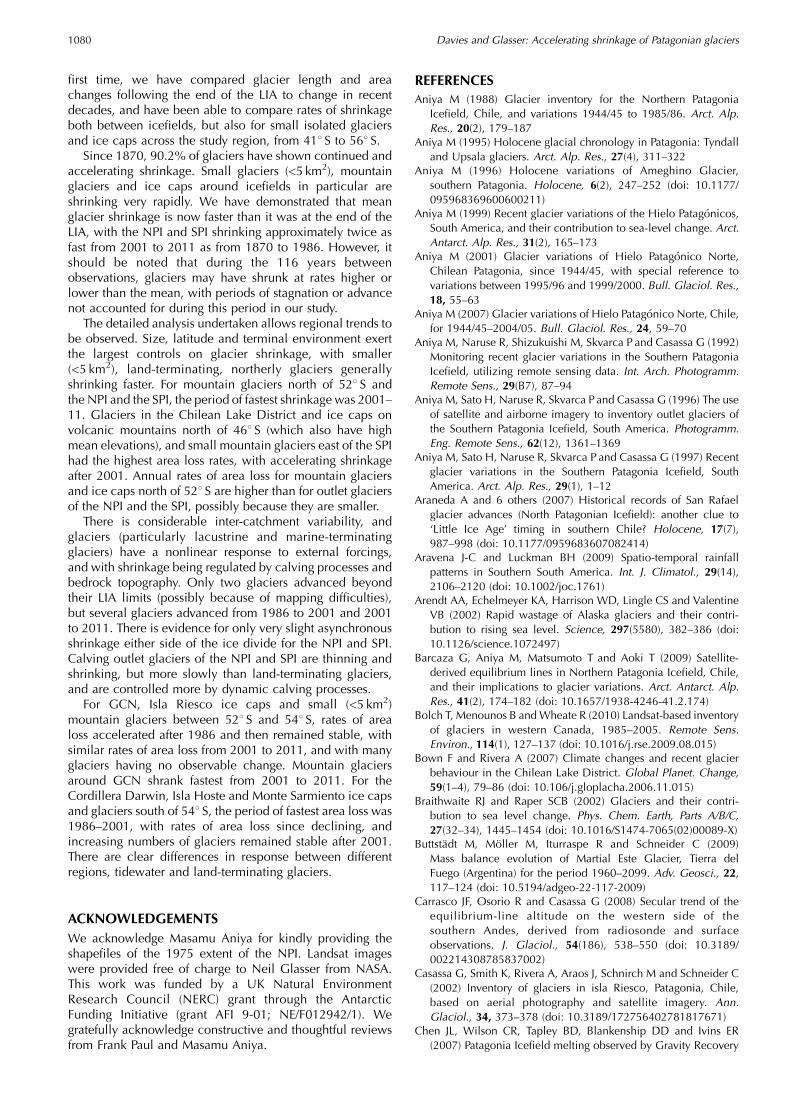
Fig. 2. Examples of glacier change for parts of the NPI. Note the trimlines and mapped moraines, which were used to reconstruct maximumglacier extent during the LIA (AD 1870). Dashed black lines illustrate mapped glacier lengths for 2011; previous years follow the sameflowline. (a) Overview of the NPI. (b) The snout of Glaciar San Rafael. (c) The snout of Glaciar San Quintin. In this case, because of well-documented evidence, the outermost moraines were used in the definition of the LIA. (d) The northern NPI, including NPI-1 (GlaciarGrosse). (e) Landsat ETM+ image from 2001, with clearly defined trimlines and moraines demarking the LIA extent (dashed white outline).
Davies and Glasser: Accelerating shrinkage of Patagonian glaciers 1065
Naruse and Skvarca, 2000) being evident in the majority ofthe glaciers. Glaciers are generally larger than in the NPI,and Glaciar Pio XI is the largest in South America (1265 km2)(Aniya and others, 1996).
The NPI and SPI have been shrinking dramatically eversince their LIA maxima, which are securely dated toAD 1870 (Glasser and others, 2011), and are now shrinkingat an increasing rate in response to regional climate change.Rignot and others (2003) estimated that the two icefieldsjointly contributed 0.042� 0.002mma–1 to global meansea-level rise in the period 1968/1975 to 2000 butthat this doubled to 0.105�0.011mma–1 from 1995 to2000. Chen and others (2007) estimated the ice lossrate for the Patagonia icefields from 2002 to 2006 to be27.9�11 km3 a–1, equivalent to an average loss of�1.6ma–1 ice thickness change if evenly distributed overthe entire glacier area and a global contribution to sea-levelrise of +0.078�0.031mma–1. Ivins and others (2011)estimated ice loss rates for the NPI and SPI of 26�6Gt a–1
from 2003 to 2009, using a combination of data from theGravity Recovery and Climate Experiment (GRACE) satelliteand GPS bedrock uplift data. The background to thesechanges is presumed to be the global surface temperatureincrease of +0.6� 0.28C in the 20th century (Vaughan andothers, 2001), resulting in widespread glacier wastage andshrinkage (Aniya, 1988; Ramirez and others, 2001; Arendtand others, 2002; Meier and others, 2003; Cook and others,2005; WGMS, 2008).
Gran Campo Nevado (538 S) is an ice cap with severalsteep outlet glaciers (199 km2; Schneider and others, 2007;Fig. 1), which may mean that it responds faster to climaticchanges than the NPI or SPI (Moller and others, 2007). It is atmuch lower altitudes than the NPI or SPI, with mountainsummits from 1000 to 1700m high, and with outlet glaciersreaching sea level. Mean annual temperatures here are+5.78C, but the ice cap survives because of extremely highprecipitation (Moller and Schneider, 2008).
Isla Riesco (528 S) is �130 km long and 50 km wide, withmoderate precipitation on its eastern part (<1000mma–1),which is leeward of the Andes. The western part of the islandis within the main belt of the Andes, with high precipitationrates (Fig. 1). The mountains reach 1830ma.s.l., withseveral small ice caps and mountain glaciers (Casassa andothers, 2002). All these glaciers terminate on land, with theexception of a few small freshwater lakes.
Tierra del Fuego is an archipelago off southernmost SouthAmerica (Fig. 1), with many small ice caps and mountainglaciers, as well as the Cordillera Darwin icefield. CordilleraDarwin is the most southerly icefield in the study region, at548300 S, with topography constraining the ice masses (incomparison to the NPI and SPI, where ice-sheds separate thecatchments (Warren and Aniya, 1999)). The mountainsreach 2469ma.s.l., and many of the glaciers calve into theocean. The area receives more precipitation than does landto the east and north, and glaciers south of the ice dividereceive far more precipitation than those north of the icedivide, as a result of the orographic rain shadow (Holmlundand Fuenzalida, 1995). The glaciers of Tierra del Fuego andCordillera Darwin receive uniform precipitation throughoutthe year, and have an annual temperature range of �7.48Cand a mean annual temperature of 1.28C (Sagredo andLowell, 2012). The mass balance of Glaciar Martial Este,Tierra del Fuego, was negative (–772mmw.e. a–1) from 1960to 2006 (Buttstadt and others, 2009).
1.3. Regional climate
1.3.1. PrecipitationThe climate of Patagonia is dominated by Southern Hemi-sphere westerlies and equatorial Pacific sea surface tempera-tures, which regulate the El Nino Southern Oscillation(ENSO) and the Pacific Decadal Oscillation (Aravena andLuckman, 2009; Garreaud and others, 2009). The Andeanmountain chain is a significant orographic barrier to thepredominant westerlies, which results in steep precipitationgradients across the mountain chain (Masiokas and others,2008; cf. Fig. 1). Precipitation between 408 S and 438 Sdeclined between 1950 and 2000 (Aravena and Luckman,2009). Furthermore, ENSO events, which are associatedwith reduced precipitation, have become more frequentsince 1976 (Giese and others, 2002; Montecinos andAceituno, 2003; Bown and Rivera, 2007).
1.3.2. TemperatureThroughout the Andes, there has been a trend to increasingelevation of the 08C isotherm, with an ELA rise attributed tothis warming. The warming is regionally variable, with slightcooling or non-significant warming in southern Chile after1976 (Carrasco and others, 2008). Tree ring data from thesouthern Andes dating back to AD1640 show that 20th-century temperatures have been anomalously warm; themean annual temperatures for 1900–90 for the northern andsouthern sectors of the Andes are 0.538C and 0.868C higherthan the 1640–1899 means (Villalba, 1994).
In the Chilean Lake District (38–428 S), the upper tropo-sphere has been warming at +0.019 to +0.0318Ca–1.However, low-altitude cooling has been detected at severalmeteorological stations, particularly Puerto Montt andstations further north (Bown and Rivera, 2007). After 1976,changes in the Pacific Decadal Oscillation were observed,with a period of increased temperatures across the southernAndes (Villalba and others, 2003). Sagredo and Lowell(2012) hypothesize that under a changing climatic regime,glaciers in the NPI, SPI and Cordillera Darwin will becomeincreasingly sensitive southwards to mean temperature risesand more uniform precipitation throughout the year.
2. METHODS
2.1. DataOrthorectified (level 1G) Landsat Thematic Mapper (TM)images from 1985–87 and Landsat Enhanced TM Plus(ETM+) images from 2001–02 and 2010–11 were acquiredpre-registered to Universal Transverse Mercator (UTM)World Geodetic System 1984 ellipsoidal elevation(WGS84), zone 18S projection (Appendix A). These imageshave a large swath (185 km) and reasonable spatial reso-lution (30m), and a geopositional accuracy of better than�50m (Tucker and others, 2004). The 2010–11 images havestriping artefacts, caused by failure of the scan-line corrector(SLC) on the Landsat sensor in 2003.
For the NPI, additional data were obtained for 1975 fromAniya (1988). These data originate from 1974/75 verticalaerial photographs, which were used to create a map by theInstituto Geografico Militar, Chile, which was subsequentlyused in a glacier inventory by Aniya (1988).
Elevation data were derived from the Shuttle RadarTopography Mission (SRTM) digital elevation model (DEM)version 4.1 (hereafter SRTM4), at 300 resolution (90m) (Jarvis
Davies and Glasser: Accelerating shrinkage of Patagonian glaciers1066
and others, 2008), providing elevation data from February2000 (Appendix B). Vertical and horizontal errors are �10m(Farr and others, 2007). SRTM4 is a void-filled DEM, whichmay introduce inaccuracies in areas of steep topography(Reuter and others, 2007; Frey and Paul, 2012), but issuitable for use in glacier inventories (Frey and Paul, 2012).There is uncertainty in glacier elevation in our 2001 censusas a result of differing times of image capture between theSRTM4 and Landsat data.
2.2. Glacier digitization for 1986, 2001 and 2011Our methods follow GLIMS protocols, with each glacierbetween 418 S and 568 S (Fig. 1; Table 1) being manuallydigitized as a separate polygon (Rau and others, 2005; Raupand others, 2007a,b; Paul and others, 2009; Racoviteanuand others, 2009; Svoboda and Paul, 2009; Raup andKhalsa, 2010). We digitized glacier outlines in a GIS (ESRIArcMap 9.3) at 1 : 10 000 scale using cloud- and snow-freeLandsat satellite images available from summer months in1985/86, 2000/01 and 2010/11 (Appendix A). Using datafrom Aniya (1988), the extents of 38 outlet glaciers for theNPI were also digitized for 1975. Ice divides on the icefieldswere determined from previous publications (Aniya, 1996,1999; Aniya and others, 1996; Rignot and others, 2003;Bown and Rivera, 2007; Rivera and others, 2007; Lopez andothers, 2010), and downloaded from GLIMS wherepossible (e.g. Schneider and others, 2007) to ensureconsistency with other studies, or by using high points,
nunataks, glaciological structures or breaks in slope (Glasserand Scambos, 2008; Davies and others, 2012; Table 1). Allicefield outlet glaciers and ice caps and all mountainglaciers that could be clearly discriminated in the satelliteimages (as distinct from snow) and that were larger than0.1 km2 (because of image resolution and the danger ofmisclassification of snowpatches) were digitized in thisstudy. Near the NPI, SPI, Cordillera Darwin and GCN, thereare numerous small isolated glaciers with a ‘Mountainglacier’ classification, which have been considered sepa-rately (Northern Patagonian mountain glaciers (NPMG),Southern Patagonian mountain glaciers (SPMG), CordilleraDarwin mountain glaciers (CDMG) and Gran CampoNevado mountain glaciers (GCMG)).
2.3. Geomorphological mapping to determine LIAextentGlacier extent at the LIA was digitized for glaciers between388 S and 568 S (Fig. 1) (Glasser and others, 2011) forglaciers with clear trimlines and moraines. The LIA extentwas inferred from geomorphological evidence, includingtrimlines and terminal moraines in front of contemporaryglaciers (e.g. Fig. 2), which were identified according topreviously defined criteria (Table 1). The inferred LIA glacierextents were checked against known LIA positions frompublished valley-scale dendrochronological and licheno-metric dating studies, for example for the Chilean LakeDistrict (Bown and Rivera, 2007), NPI (Villalba, 1994;
Table 1. Identification of glaciological and geomorphological features. After Glasser and others (2005, 2008)
Landform/feature
Identification criteria Possible errors Glaciological significanceMorphology Colour/structure/texture
Contemporaryglaciers
Bare ice, snow and debris, surfacestructures (crevasses, longitudinal
structures, folds, lakes andsupraglacial streams).
White to blue, smooth to roughsurface. Abrupt transition.
Overestimate where snout iscovered in snow. Underestimatewhere snout is covered with
debris.
Foci for ice discharge.
Ice divides Where ice divides have not previously been published (e.g. onGLIMS), they are identified through mapping high points, cols,topographic divides, glaciological structures such as crevassesand longitudinal surface structures (Glasser and Scambos,
2008). Previously published ice divides are used for the NPI,SPI, Cordillera Darwin and GCN (see GLIMS).
Error is likely to be highest in flatsummits. Interpreter error in ice-divide mapping is likely to bethe largest source of error.
Limited by the lack of a DEMthat is well resolved over the ice.
No migration of icedivides is assumed forcalculation of glacier
change.
Debris-coveredsnout
There may be arcuate or linearglaciological structures, ponds orbare ice visible. Where the glacierterminates in a lake, a fragmentedfloating margin may be visible.
Dark brown. Sharp transitionto vegetation. Surface is rough
and pitted.
Supraglacial debris cover onsnout may be confused withlateral or terminal moraines;similar spectral properties to
rock valley sides.
Denotes glacier extent.May indicatedownwasting.
Trimlines Sub-horizontal lines on valley sidesseparating areas of vegetated andnon-vegetated land or areas withdifferent types of vegetation.
Sharp altitudinal change insurface colour and texture as
a result of changes invegetation cover.
Possible but unlikely; confusionwith sub-horizontal features as
lake shorelines.
Former vertical extentof glaciers.
Terminalmoraines
Prominent cross-valley single ormultiple ridges with positive relief.
Linear, curved, sinuous orsaw-toothed plan.
Shadowing due to change inrelief and change in colour
when moraines are vegetated.
Possible, but unlikely,confusion with trimlines
where moraines have a lowrelative height.
Mark the former terminalposition of outletglaciers. Innermost
moraine is taken as theLIA limit except where this
has been publishedelsewhere.
Cirques Large amphitheatre-shaped hollowson mountain flanks or incised intoplateau edges. Sharp boundaries
with surrounding terrain.
Shadowing due to change inheight or relative relief. Cirquefloors may be different in colour
from surrounding land.
Possible, but unlikely, confusionwith mass-movement or landslip
scars, particularly beneathvolcanic plateau.
Indicates presence oflocalized or restrictedmountain glaciation.
Davies and Glasser: Accelerating shrinkage of Patagonian glaciers 1067
Harrison and Winchester, 2000; Winchester and Harrison,2000; Glasser and others, 2002, 2004; Araneda and others,2007; Harrison and others, 2007, 2012), SPI (Aniya, 1995,1996; Masiokas and others, 2009a,b; Rivera and others,2011), GCN (Koch and Kilian, 2005) and Cordillera Darwin(Kuylenstierna and others, 1996; Masiokas and others,2009a). In situations where multiple trimlines or morainesexist, we drew the LIA limit at the trimline or moraine closestto the contemporary glacier snout (see Fig. 2 for examplesfrom the NPI). At those glaciers where there is no visibleevidence of shrinkage since the LIA or where the LIA limitsare ambiguous or difficult to establish (e.g. for some fjord-terminating glaciers of the SPI), the limits are assumed to bethe same as in 1975 or 1986 (the earliest possible dataavailable). Our results are therefore minimum estimates ofice shrinkage over the time period �AD 1870–2011.
2.4. Glacier attribute dataAttribute data for each glacier polygon include a uniqueLocal ID (the same as that used in previous inventories,where appropriate), GLIMS ID (Raup and Khalsa, 2010), anyestablished glacier name, X and Y coordinates of thecentroid, surface area (km2), primary classification (Rauand others, 2005), form, frontal characteristics, ID andacquisition date of the satellite image, analyst name andanalysis time. For LIA polygons, any published evidence ofLIA ice extent and associated references are also included.Glacier aspect (azimuth of the accumulation area; Evans,2006) was estimated using vectors that follow the steepestpart of the glacier accumulation area. Glacier length wasmeasured for 520 glaciers according to standard procedures(Lopez and others, 2010; Davies and others, 2012),following the longest flow pathway from the highest pointon the ice divide to the glacier tongue (see Fig. 2).Minimum, maximum and median elevations and slopes for2000 were derived automatically for each glacier in the GISfollowing analysis of SRTM4 (Paul and others, 2009; Freyand Paul, 2012).
2.5. UncertaintyDigitized glacier lengths and outlines are accurate to �30m(i.e. �1 pixel). Accuracy may be less in the centre oficefields, where ground control points are scarce, but as thesame ice divides are used for each year inventoried, theuncertainty that this introduces into relative change meas-urement is limited. There may be inaccuracies where snowcover on nunataks in the centre of the icefields or adjacentto the ice edges has been misclassified as ice. We usedqualitative methods to identify errors in glaciers withseasonal snow or large deviations in area between eachyear mapped, and manually improved these with additionalLandsat images. Indeed, seasonal snow cover is not asignificant problem in Patagonia because of the strongseasonality, and there is very little lying snow in the summermonths near the glacier snouts. Where snow and ice isdifficult to discriminate (e.g. on snow-capped mountainsand volcanoes), glaciers have not been digitized.
Other potential sources of uncertainty include ice-divideand drainage basin identification, error in co-registration(Granshaw and Fountain, 2006), clouds and shadows, anddelineation of debris-coved glaciers (Bolch and others,2010). However, this uncertainty was limited with manualdigitization at resolutions up to 1 : 10 000 (Table 1), which ismore accurate than automatic classification (cf. Jiskoot and
others, 2009), particularly when dealing with debris-coveredglaciers (Paul, 2002). Automatic classification is particularlyuseful and suitable when analysing larger datasets compris-ing >1000 glaciers with clean ice. However, we acknow-ledge that delineating the boundary of debris-covered ice isvery difficult with images of this resolution. A further sourceof error is the striping on Landsat ETM+ images taken after2003, and it was necessary to interpolate across the stripes.This was mitigated by using numerous overlapping images,so that interpolating across large stripes near the margins ofthe image was not required.
Statistical quantification of errors is difficult withoutground control points, high-resolution satellite images orground-truthing in the week that the satellite image was taken(Svoboda and Paul, 2009). In order to quantify uncertainty,we conducted error analysis of the digitization of six NPIoutlet glaciers in 1986 (i.e. the same glacier was inde-pendently digitized five times), both with and without debriscover and with grounded and floating termini (cf. Stokes andothers, 2007). This yielded an average standard deviation of+0.3 km2, or 2.0% of the area. Analysis of the area changes ofglaciers is therefore considered to be accurate to within2.0%. The glaciological uncertainty of ice divides is likely tobe far larger than the mapping uncertainty, which has littleinfluence on the final glacial outline, especially whencomparing ice margin change from different years.
2.6. Analysis of glacier changeThere are four kinds of data resulting from this study: glacierdescriptors (area, length, primary classification, aspect,frontal characteristics, etc.), length changes (km a–1; m a–1),area changes (km2;%) and annual rates of change (% a–1) (cf.Bolch and others, 2010). We use ‘recession’ where lengthchanges are discussed and ‘shrinkage’ for area changes.Annual rates of change were calculated by dividing the areachange by the time between analyses for each glacier (timeis taken from the date the satellite image was acquired).These are the only results that can be directly compared overdifferent time periods and different glaciers, because of thedifferent lengths of time between analyses (i.e. �116 yearsfrom 1870 to 1986, �15 years from 1986 to 2001, and �10years from 2001 to 2011, depending on when the satelliteimage for each glacier was acquired).
3. RESULTS3.1. Characteristics of South American glaciers in2011In 2011, 626 glaciers were considered in our assessment,which included 386 major outlet glaciers from the mainicefields (44 from the NPI, 161 from the SPI, 35 from GCNand 99 from Cordillera Darwin) (Table 2). These fourprincipal icefields dominate the glacierized area (Fig. 3a).Glacier sizes in 2011 ranged from 0.1 to 1344 km2 (SPI-137;Pio XI) (Table 2). Although there are many small glaciers, afew large glaciers made up the majority of the glacierizedarea (Fig. 3a). The mountain ranges beneath the SPI, NPI,GCN and El Volcan are orientated north–south, resulting in apredominantly west–east aspect for the outlet glaciers(Fig. 3b).
In the study region there were 233 outlet, 95 valley and229 mountain glaciers, 26 ice caps and 38 icefields, withoutlet glaciers dominating the glacierized area. Althoughmountain glaciers are numerous, they made up only a small
Davies and Glasser: Accelerating shrinkage of Patagonian glaciers1068
proportion of the glacierized area (8.3%; Fig. 3c). Many of thevalley or outlet glaciers have a compound basin (numerouscirques or catchment areas) or compound basins, where twocompound basin drainage systems merge (Fig. 3d; Rau andothers, 2005). The majority (526) of the glaciers surveyedterminate on land, although 100 have calving termini (35marine and 65 lacustrine).
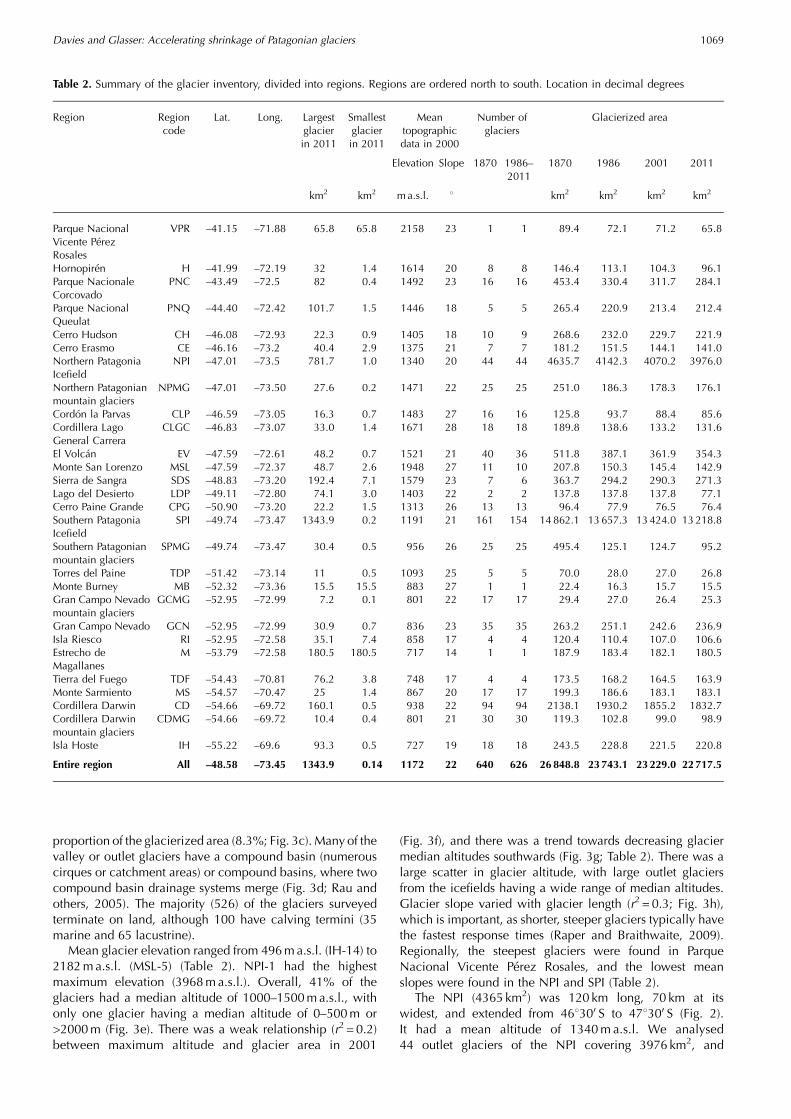
Mean glacier elevation ranged from 496ma.s.l. (IH-14) to2182ma.s.l. (MSL-5) (Table 2). NPI-1 had the highestmaximum elevation (3968ma.s.l.). Overall, 41% of theglaciers had a median altitude of 1000–1500ma.s.l., withonly one glacier having a median altitude of 0–500m or>2000m (Fig. 3e). There was a weak relationship (r2 = 0.2)between maximum altitude and glacier area in 2001
(Fig. 3f), and there was a trend towards decreasing glaciermedian altitudes southwards (Fig. 3g; Table 2). There was alarge scatter in glacier altitude, with large outlet glaciersfrom the icefields having a wide range of median altitudes.Glacier slope varied with glacier length (r2 = 0.3; Fig. 3h),which is important, as shorter, steeper glaciers typically havethe fastest response times (Raper and Braithwaite, 2009).Regionally, the steepest glaciers were found in ParqueNacional Vicente Perez Rosales, and the lowest meanslopes were found in the NPI and SPI (Table 2).
The NPI (4365 km2) was 120 km long, 70 km at itswidest, and extended from 468300 S to 478300 S (Fig. 2).It had a mean altitude of 1340m a.s.l. We analysed44 outlet glaciers of the NPI covering 3976 km2, and
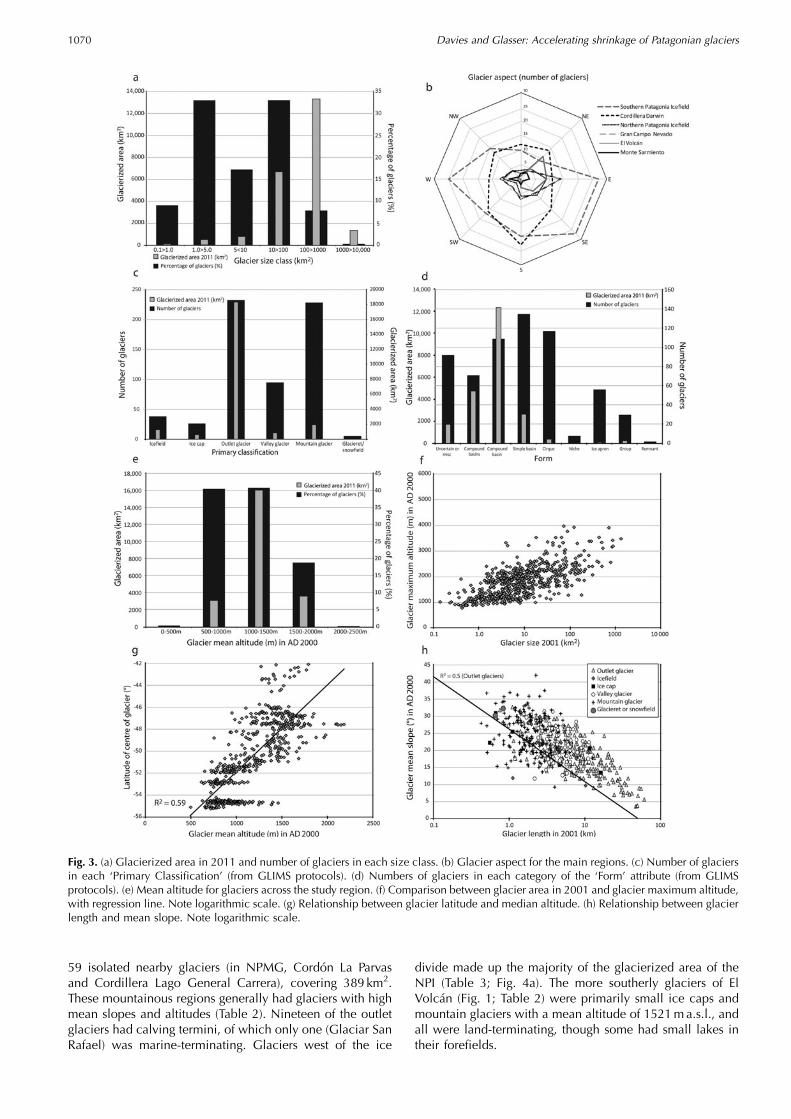
Table 2. Summary of the glacier inventory, divided into regions. Regions are ordered north to south. Location in decimal degrees
Region Regioncode
Lat. Long. Largestglacierin 2011
Smallestglacierin 2011
Meantopographicdata in 2000
Number ofglaciers
Glacierized area
Elevation Slope 1870 1986–2011
1870 1986 2001 2011
km2 km2 ma.s.l. 8 km2 km2 km2 km2
Parque NacionalVicente PerezRosales
VPR –41.15 –71.88 65.8 65.8 2158 23 1 1 89.4 72.1 71.2 65.8
Hornopiren H –41.99 –72.19 32 1.4 1614 20 8 8 146.4 113.1 104.3 96.1Parque NacionaleCorcovado
PNC –43.49 –72.5 82 0.4 1492 23 16 16 453.4 330.4 311.7 284.1
Parque NacionalQueulat
PNQ –44.40 –72.42 101.7 1.5 1446 18 5 5 265.4 220.9 213.4 212.4
Cerro Hudson CH –46.08 –72.93 22.3 0.9 1405 18 10 9 268.6 232.0 229.7 221.9Cerro Erasmo CE –46.16 –73.2 40.4 2.9 1375 21 7 7 181.2 151.5 144.1 141.0Northern PatagoniaIcefield
NPI –47.01 –73.5 781.7 1.0 1340 20 44 44 4635.7 4142.3 4070.2 3976.0
Northern Patagonianmountain glaciers
NPMG –47.01 –73.50 27.6 0.2 1471 22 25 25 251.0 186.3 178.3 176.1
Cordon la Parvas CLP –46.59 –73.05 16.3 0.7 1483 27 16 16 125.8 93.7 88.4 85.6Cordillera LagoGeneral Carrera
CLGC –46.83 –73.07 33.0 1.4 1671 28 18 18 189.8 138.6 133.2 131.6
El Volcan EV –47.59 –72.61 48.2 0.7 1521 21 40 36 511.8 387.1 361.9 354.3Monte San Lorenzo MSL –47.59 –72.37 48.7 2.6 1948 27 11 10 207.8 150.3 145.4 142.9Sierra de Sangra SDS –48.83 –73.20 192.4 7.1 1579 23 7 6 363.7 294.2 290.3 271.3Lago del Desierto LDP –49.11 –72.80 74.1 3.0 1403 22 2 2 137.8 137.8 137.8 77.1Cerro Paine Grande CPG –50.90 –73.20 22.2 1.5 1313 26 13 13 96.4 77.9 76.5 76.4Southern PatagoniaIcefield
SPI –49.74 –73.47 1343.9 0.2 1191 21 161 154 14 862.1 13657.3 13424.0 13218.8
Southern Patagonianmountain glaciers
SPMG –49.74 –73.47 30.4 0.5 956 26 25 25 495.4 125.1 124.7 95.2
Torres del Paine TDP –51.42 –73.14 11 0.5 1093 25 5 5 70.0 28.0 27.0 26.8Monte Burney MB –52.32 –73.36 15.5 15.5 883 27 1 1 22.4 16.3 15.7 15.5Gran Campo Nevadomountain glaciers
GCMG –52.95 –72.99 7.2 0.1 801 22 17 17 29.4 27.0 26.4 25.3
Gran Campo Nevado GCN –52.95 –72.99 30.9 0.7 836 23 35 35 263.2 251.1 242.6 236.9Isla Riesco RI –52.95 –72.58 35.1 7.4 858 17 4 4 120.4 110.4 107.0 106.6Estrecho deMagallanes
M –53.79 –72.58 180.5 180.5 717 14 1 1 187.9 183.4 182.1 180.5
Tierra del Fuego TDF –54.43 –70.81 76.2 3.8 748 17 4 4 173.5 168.2 164.5 163.9Monte Sarmiento MS –54.57 –70.47 25 1.4 867 20 17 17 199.3 186.6 183.1 183.1Cordillera Darwin CD –54.66 –69.72 160.1 0.5 938 22 94 94 2138.1 1930.2 1855.2 1832.7Cordillera Darwinmountain glaciers
CDMG –54.66 –69.72 10.4 0.4 801 21 30 30 119.3 102.8 99.0 98.9
Isla Hoste IH –55.22 –69.6 93.3 0.5 727 19 18 18 243.5 228.8 221.5 220.8
Entire region All –48.58 –73.45 1343.9 0.14 1172 22 640 626 26 848.8 23743.1 23229.0 22717.5
Davies and Glasser: Accelerating shrinkage of Patagonian glaciers 1069
59 isolated nearby glaciers (in NPMG, Cordon La Parvasand Cordillera Lago General Carrera), covering 389 km2.These mountainous regions generally had glaciers with highmean slopes and altitudes (Table 2). Nineteen of the outletglaciers had calving termini, of which only one (Glaciar SanRafael) was marine-terminating. Glaciers west of the ice
divide made up the majority of the glacierized area of theNPI (Table 3; Fig. 4a). The more southerly glaciers of ElVolcan (Fig. 1; Table 2) were primarily small ice caps andmountain glaciers with a mean altitude of 1521ma.s.l., andall were land-terminating, though some had small lakes intheir forefields.
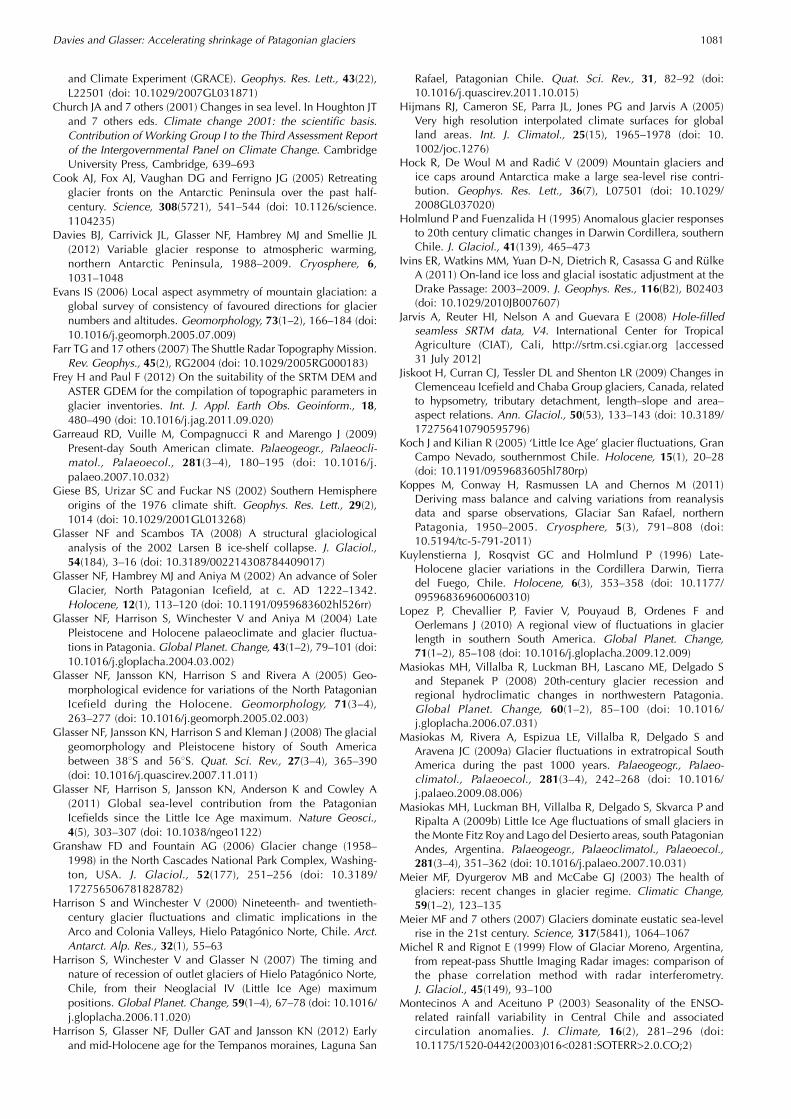
Fig. 3. (a) Glacierized area in 2011 and number of glaciers in each size class. (b) Glacier aspect for the main regions. (c) Number of glaciersin each ‘Primary Classification’ (from GLIMS protocols). (d) Numbers of glaciers in each category of the ‘Form’ attribute (from GLIMSprotocols). (e) Mean altitude for glaciers across the study region. (f) Comparison between glacier area in 2001 and glacier maximum altitude,with regression line. Note logarithmic scale. (g) Relationship between glacier latitude and median altitude. (h) Relationship between glacierlength and mean slope. Note logarithmic scale.
Davies and Glasser: Accelerating shrinkage of Patagonian glaciers1070

Fig. 4. (a) Glacierized area and rates of area loss for the NPI and SPI, with calving and land-terminating glaciers shown separately. (b) Rate ofchange 2001–11 against latitude, with glaciers divided into size classes. (c) Rate of glacier shrinkage 2001–11 against glacier mean altitude,with glaciers divided into size classes. (d) Rate of glacier shrinkage 2001–11 against glacier mean slope, with glaciers divided into sizeclasses. (e) Rate of change for each region over three time periods. For Lago del Desierto (LDP) and Southern Patagonian mountain glaciers(starred), the anomalously high shrinkage rates are given in the figure. See Table 2 for abbreviations.
Davies and Glasser: Accelerating shrinkage of Patagonian glaciers 1071

The SPI was the largest icefield (13 219 km2), andstretched north–south for 400 km, from 488 S to 528 S alongthe southern Andes, with widths of 30–70 km and a meanaltitude of 1191ma.s.l. In our assessment, it was drained by154 outlet and simple basin glaciers with 45 nearby isolatedglaciers (in SPMG, Lago del Desierto, Cerro Paine Grandeand Torres del Paine) covering 278 km2. Its area was againdominated by glaciers west of the ice divide (Table 3), butwith several large outlet glaciers draining eastwards. Of theoutlet glaciers, 54 had calving termini, and they accountedfor 10 945 km2, or 83% of the total area (Fig. 4a).
GCN (528400–528550 S) was the smallest ice cap(262 km2), with 35 glaciers (of which 4 calved into lakes),and was 24 km long and 16 km wide. It was surroundedby 17 small mountain glaciers and ice caps. CordilleraDarwin (1931 km2) was the southernmost icefield(548300 S) and was 90 km long and 30 km wide. Therewere 99 glaciers, of which 66 were outlet glaciers(covering 408 km2). Ten of these had calving termini.There were 18 small isolated glaciers nearby, including7 valley glaciers, and there were 6 small icefields and icecaps nearby.
Table 3. Glacier change for the NPI and SPI
Ice divide Number of glaciers Glacierized area2011
Change Rate of change
1870–1986 1986–2001 2001–11 1870–1986 1986–2001 2001–11
km2 % % % %a–1 %a–1 %a–1
NPI West 19 2962.5 –8.8 –1.9 –2.4 –0.08 –0.12 –0.24NPI East 25 1013.5 –15.5 –1.4 –2.2 –0.13 –0.09 –0.22SPI West 73 8417.4 –5.9 –1.9 –1.4 –0.05 –0.13 –0.14SPI East 81 4801.4 –11.0 –1.3 –1.8 –0.09 –0.09 –0.18
Table 4. Area change, percentage change and annual rates of change in each region and time period. N refers to the number of glaciersshrinking fastest in this period. For region codes see Table 2
Region 1870–2011 1870–1986 1986–2001 2001–11
Area change Rate of change Area change Rate of change N Area change Rate of change N Area change Rate of change N
km2 % km2 a–1 %a-1 km2 % km2 a–1 %a–1 km2 % km2 a–1 %a–1 km2 % km2 a–1 %a–1
VPR –23.6 –26.3 –0.1 –0.19 –17.3 –19.3 –0.1 –0.17 0 –1.0 –1.3 –0.1 –0.09 0 –5.3 –7.5 –0.5 –0.75 1H –50.3 –34.3 –0.3 –0.24 –33.3 –22.7 –0.3 –0.20 0 –8.8 –7.8 –0.6 –0.52 1 –8.1 –7.8 –0.8 –0.78 7PNC –169.3 –37.3 –1.1 –0.26 –123.0 –27.1 –1.1 –0.23 1 –18.8 –5.7 –1.3 –0.38 3 –27.5 –8.8 –2.8 –0.88 12PNQ –53.0 –20.0 –0.4 –0.14 –44.5 –16.8 –0.4 –0.14 1 –7.4 –3.4 –0.5 –0.22 4 –1.1 –0.5 –0.1 –0.05 0CH –46.7 –17.4 –0.3 –0.12 –36.5 –13.6 –0.3 –0.12 1 –2.4 –1.0 –0.2 –0.07 2 –7.8 –3.4 –0.8 –0.34 5CE –40.2 –22.2 –0.3 –0.16 –29.7 –16.4 –0.3 –0.14 2 –7.3 –4.8 –0.5 –0.32 3 –3.2 –2.2 –0.3 –0.22 2NPI* –659.7 –14.2 –4.3 –0.10 –493.4 –10.6 –4.3 –0.09 3 –72.1 –1.7 –4.8 –0.12 6 –94.1 –2.3 –9.4 –0.23 14NPMG –75.0 –29.9 –0.6 –0.21 –64.8 –25.8 –0.6 –0.22 13 –8.0 –4.3 –0.5 –0.29 8 –2.2 –1.2 –0.2 –0.12 4CLP –40.2 –31.9 –0.3 –0.23 –32.1 –25.6 –0.3 –0.22 4 –5.3 –5.6 –0.4 –0.37 6 –2.8 –3.1 –0.3 –0.31 5CLGC –58.2 –30.7 –0.4 –0.22 –51.2 –27.0 –0.4 –0.23 8 –5.4 –3.9 –0.4 –0.26 7 –1.6 –1.2 –0.2 –0.12 3EV –157.5 –30.8 –1.1 –0.22 –124.7 –24.4 –1.1 –0.21 12 –25.1 –6.5 –1.7 –0.43 18 –7.7 –2.1 –0.8 –0.21 5MSL –64.9 –31.2 –0.5 –0.22 –57.5 –27.7 –0.5 –0.24 3 –4.9 –3.2 –0.3 –0.22 5 –2.6 –1.8 –0.3 –0.18 2SDS –92.4 –25.4 –0.6 –0.18 –69.5 –19.1 –0.6 –0.16 0 –3.9 –1.3 –0.3 –0.09 2 –19.0 –6.5 –1.9 –0.65 4LDP –60.7 –44.1 0.0 –0.31 0.0 0.0 0.0 0.00 0 0.0 0.0 0.0 0.00 0 –60.7 –44.1 –6.1 –4.41 2CPG –20.0 –20.7 –0.2 –0.15 –18.4 –19.1 –0.2 –0.17 4 –1.5 –1.9 –0.1 –0.13 4 –0.1 –0.1 0.0 –0.01 0SPI –1643.3 –11.1 –10.4 –0.08 –1204.8 –8.1 –10.4 –0.07 51 –233.3 –1.7 –15.6 –0.11 39 –205.2 –1.5 –20.5 –0.15 59SPMG –400.3 –80.8 –3.2 –0.57 –370.3 –74.7 –3.2 –0.64 20 –0.5 –0.4 0.0 –0.03 0 –29.5 –23.7 –2.9 –2.37 4TDP –43.2 –61.7 –0.4 –0.44 –42.0 –60.0 –0.4 –0.52 3 –0.9 –3.3 –0.1 –0.22 1 –0.3 –1.0 0.0 –0.10 1MB –7.0 –31.1 –0.1 –0.22 –6.2 –27.5 –0.1 –0.24 0 –0.6 –3.6 0.0 –0.24 1 –0.2 –1.4 0.0 –0.14 0GCMG –4.1 –13.9 0.0 –0.10 –2.3 –8.0 0.0 –0.07 2 –0.7 –2.5 0.0 –0.17 3 –1.1 –4.0 –0.1 –0.40 4GCN –26.3 –10.0 –0.1 –0.07 –12.1 –4.6 –0.1 –0.04 2 –8.5 –3.4 –0.6 –0.23 11 –5.6 –2.3 –0.6 –0.23 10RI –13.9 –11.5 –0.1 –0.08 –10.1 –8.4 –0.1 –0.07 0 –3.4 –3.1 –0.2 –0.21 3 –0.4 –0.4 0.0 –0.04 1M –7.5 –4.0 0.0 –0.03 –4.6 –2.4 0.0 –0.02 0 –1.3 –0.7 –0.1 –0.05 0 –1.6 –0.9 –0.2 –0.09 1TDF –9.6 –5.5 0.0 –0.04 –5.3 –3.1 0.0 –0.03 1 –3.7 –2.2 –0.2 –0.15 3 –0.6 –0.4 –0.1 –0.04 0MS –16.2 –8.1 –0.1 –0.06 –12.7 –6.4 –0.1 –0.05 5 –3.5 –1.9 –0.2 –0.12 8 0.0 0.0 0.0 0.00 2CD –305.5 –14.3 –1.8 –0.10 –207.9 –9.7 –1.8 –0.08 33 –75.0 –3.9 –5.0 –0.26 29 –22.5 –1.2 –2.3 –0.12 16CDMG –20.4 –9.3 0.0 –0.07 –16.5 –6.0 0.0 –0.05 7 –3.7 –3.2 0.0 –0.21 9 –0.1 –0.3 0.0 –0.03 0IH –22.7 –9.3 –0.1 –0.07 –14.7 –6.0 –0.1 –0.05 4 –7.3 –3.2 –0.5 –0.21 7 –0.7 –0.3 –0.1 –0.03 1
All –4131.3 –15.4 –26.8 –0.11 –3105.6 –11.6 –26.8 –0.10 180 –514.1 –2.2 –34.3 –0.14 183 –511.5 –2.2 –51.2 –0.22 165
For the NPI, 20 glaciers shrank fastest between 1975 and 1986.
Davies and Glasser: Accelerating shrinkage of Patagonian glaciers1072
3.2. Changes in glacier length and area from 1870 to20113.2.1. General trendsA total of 640 glaciers were digitized from 1870 from 408 Sto 568 S (Figs 4–6; Table 4). Of these, 626 remained in 1986.Overall, 90.2% of the glaciers shrank between 1870 and
2011, 0.3% advanced and 9.5% showed no change. Despitesome small advances, which are generally short-term andlimited to tidewater glaciers, all regions have sufferedextensive glacier surface area loss. For the SPI and easternNPI, the greatest rates of shrinkage were observed in land-terminating glaciers (Fig. 4a). Glacier shrinkage from 2001
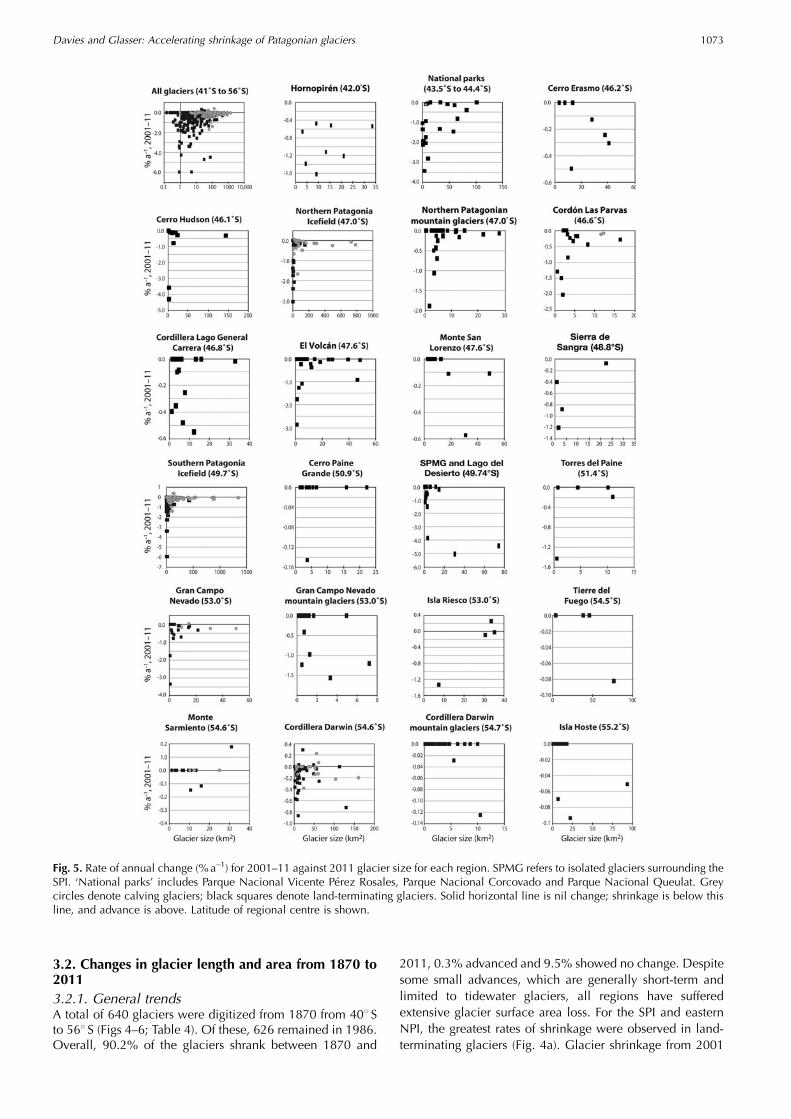
Fig. 5. Rate of annual change (%a–1) for 2001–11 against 2011 glacier size for each region. SPMG refers to isolated glaciers surrounding theSPI. ‘National parks’ includes Parque Nacional Vicente Perez Rosales, Parque Nacional Corcovado and Parque Nacional Queulat. Greycircles denote calving glaciers; black squares denote land-terminating glaciers. Solid horizontal line is nil change; shrinkage is below thisline, and advance is above. Latitude of regional centre is shown.
Davies and Glasser: Accelerating shrinkage of Patagonian glaciers 1073
to 2011 was greatest in glaciers less than 5 km2 in size, whilethose greater than 100 km2 had particularly slow rates ofshrinkage (Fig. 4b). Rates of shrinkage were highest in themost northerly glaciers, with most glaciers shrinking.Latitudinal gradients are also emphasized, with nearly allglaciers from 418 S to 448 S shrinking, small glaciers from448 S to 538 S also shrinking, and with little shrinkage inglaciers from 548 S to 568 S (Fig. 4b). Mean glacier altitudeand slope (Fig. 4c and d) had little control on glaciershrinkage in Patagonia.
Annualized rates of shrinkage across South Americaincreased for each time period measured (Table 4; Fig. 4e),with overall rates of shrinkage twice as rapid for 2001–11 asfor 1870–1986 (0.10%a–1 for 1870–1986, 0.14%a–1 for1986–2001 and 0.22%a–1 for 2001–11). Across the studyarea, percentage change per annum was greatest for 1870–1986 for 212 glaciers, for 1986–2001 for 172 glaciers and
for 2001–11 for 155 glaciers. Across the study region,14 glaciers extant during the LIA had disappeared entirely by1986, mostly around the SPI.
3.2.2. Mountain glaciersIn general, rates of change were highest for 2001–11 in themore northerly locations (Parque Nacional Vicente PerezRosales, Hornopiren, Parque Nacional Corcovado, CerroHudson and SPMG; Figs 4e and 5), and for 1986–2001 inthe more southerly locations (e.g. Cordillera Darwin, IslaHosta, Monte Sarmiento, Isla Riesco and Tierra del Fuego;Fig. 1 for locations). North of 468 S, most of the small, land-terminating glaciers are rapidly shrinking, and the rate ofarea loss is accelerating (Figs 1, 4b and e and 5). Indeed, theice caps of the Chilean Lake District experienced some ofthe highest rates of area loss in the area from 2001 to 2011(Fig. 5; Table 4). Although there is little clear statistical
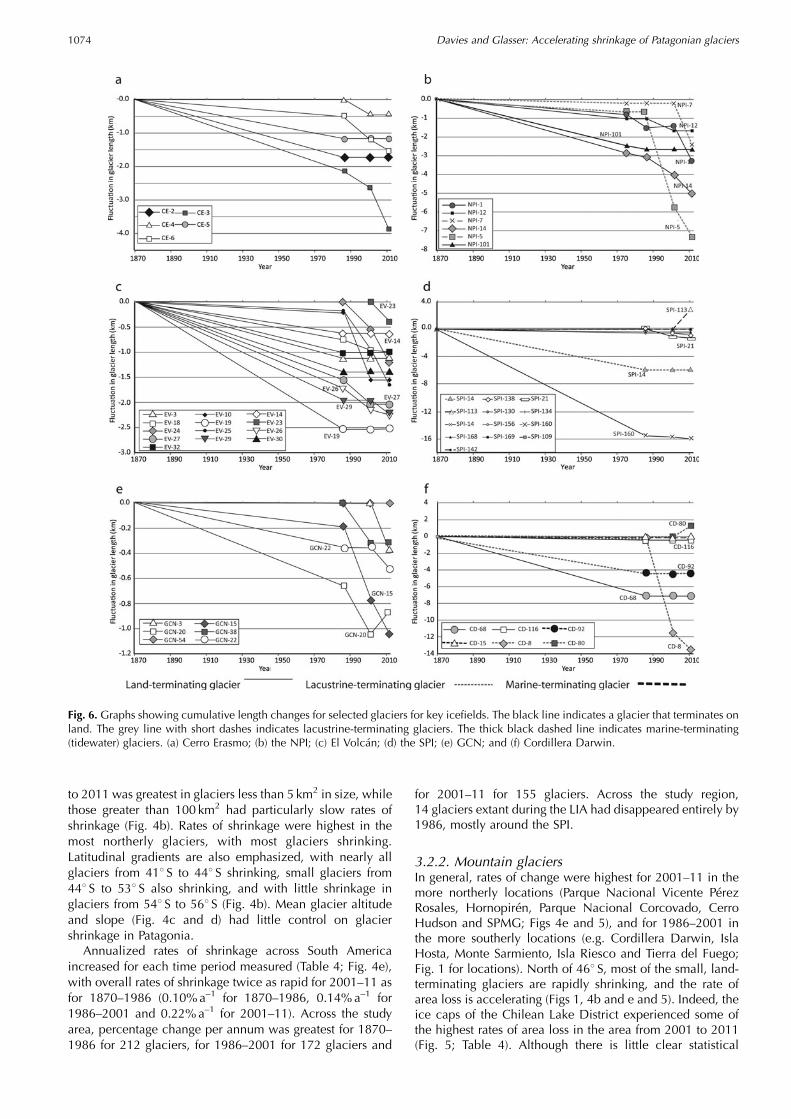
Fig. 6. Graphs showing cumulative length changes for selected glaciers for key icefields. The black line indicates a glacier that terminates onland. The grey line with short dashes indicates lacustrine-terminating glaciers. The thick black dashed line indicates marine-terminating(tidewater) glaciers. (a) Cerro Erasmo; (b) the NPI; (c) El Volcan; (d) the SPI; (e) GCN; and (f) Cordillera Darwin.
Davies and Glasser: Accelerating shrinkage of Patagonian glaciers1074
relationship between glacierized area and rate of shrinkage,glaciers north of 528 S show increased relative rates ofshrinkage. Of 16 glaciers in the Parque Nacional Corcovado,11 shrank fastest from 2001 to 2011, 3 from 1986 to 2001,and 2 from 1870 to 1986. These more northerly glaciers alsotend to be higher, steeper and smaller (Figs 3g and 4b),which may result in shorter response times.
Between 528 S and 468 S, rates of area loss were alsogenerally higher from 2001 to 2011, although with morevariation. For the seven mountain glaciers of Cerro Erasmo,steady and accelerating glacier length recession wasobserved (Fig. 6a). All glaciers receded, but distances variedbetween 0.5 and 5.6 km. Around the NPI, mountain glaciersreceded rapidly between 1870 and 1986. For example,CLGC-6 receded 7.1 km (60ma–1) during this period, butthereafter length did not change. Northern Patagonianmountain glaciers (NPMG) had a total area loss of 1.2%from 2001 to 2011, Cordon La Parvas mountain glaciers lost3.2%, and Cordillera Lago General Carrera glaciers lost1.2% (Table 4).
Length fluctuations of 32 glaciers were measured for ElVolcan. Some glaciers receded rapidly from 1870 to 1986 buthave since remained stable (e.g. EV-14 (0.6 km, or 5ma–1),EV-19 (2.5 km, or 22ma–1), EV-30 (1.4 km, or 12ma–1) andEV-32 (1.0 km, or 9ma–1)), but most have steadily receded(Fig. 6c). The glaciers that receded fastest were EV-37(63ma–1 from 1986 to 2001), EV-22 (118ma–1 from 2001 to2011), EV-24 (66ma–1 from 2001 to 2011) and EV-28(22ma–1 from 1870 to 1986). Rates of area loss peaked from1986 to 2001 and then declined (Table 4).
For SPI mountain glaciers, the largest areal changes from2001 to 2011 were for SPMG-5 (–3.83%), SPMG-15(–5.03%), SPMG-7 (–1.12%) and EC-1 (–4.41%). Glaciersaround the SPI, particularly south and east of the mainicefield, shrank very rapidly after 2001 (Fig. 4e). From 2001to 2011, the Lago del Desierto region had a reduction inglacier area of 44%, SPMG of 26.8% and Lago del Desiertoof 6.5% (Table 4). For these regions, rates of area change areseveral orders of magnitude greater after 2001 (2.37%a–1 forSPMG) compared with 1870–1986. However, the mountainsof El Condor are heavily snow-covered, which may inducean overestimation of glacierized area in 2001. There are alsono trimlines or moraines mapped in this region, so LIAextents cannot be estimated.
Between 528 S and 548 S there is more variation, withGCN mountain glaciers shrinking fastest after 2001, whilethe Monte Burney ice cap and Isla Riesco glaciers shrankfastest from 1986 to 2001 (Fig. 4e). From 2001 to 2011, onlytwo mountain glaciers around GCN shrank, with the otherglaciers remaining stationary (Fig. 5). In Isla Riesco from2001 to 2011, one glacier advanced (RI-1; 0.26%a–1) andonly one shrank significantly (RI-4; 1.33%a–1). Mountainglaciers south of 548 S (Tierra del Fuego, Monte Sarmiento,Cordillera Darwin mountain glaciers and Isla Hoste)generally shrank fastest from 1986 to 2001, and show littlechange since 2001 (cf. Figs 4e and 5).
3.2.3. Northern Patagonia Icefield (NPI)Almost all glaciers (98.1%) in the NPI shrank between 1870and 2011. Length fluctuations were measured for 38 NPIglaciers, and showed a general trend of increasing recession(Fig. 6b). Several glaciers were stable from 1986 to 2001, butreceded from 2001 to 2011 (e.g. NPI-21 (Pared Norte;112m a–1), NPI-20 (Pared Sur; 189m a–1) and NPI-2
(112ma–1)). Still others receded at steadily increasing rates(e.g. NPI-10 (Strindberg) and NPI-14). NPI-7 (San Rafael;lagoonal) receded by 9.6 km (83ma–1) between 1870 and1986, and by a further 1.2 km by 1990, whereupon themargin stabilized.
The highest rates of shrinkage east of the NPI ice dividewere for land-terminating glaciers. West of the ice divide,the highest rates of shrinkage were observed in calvingglaciers, which also occupy a larger area (Fig. 4a). The largeareal losses of the NPI from 1870 to 2011 were dominatedby a small number of large glaciers. These include NPI-7(San Rafael; 11.5%), NPI-8 (San Quintin; 14.6%) and NPI-25(Colonia; 12.9%) (Fig. 2). Glaciers east of the ice divideshrank by 2.2% from 2001 to 2011 (Table 3), compared with2.4% for glaciers to the west. Four glaciers had small, short-term advances (NPI-14 from 1975 to 1986; NPI-32 from1986 to 2001; NPI-18 and NPI-86 from 2001 to 2011).
Overall, annual rates of area loss for 2001–11 (0.23%a–1)were twice as high as those for 1870–1986 (0.09%a–1)(Fig. 4e), with similar rates both west and east of the icedivide (Table 3). However, more glaciers shrank fastest from1975 to 1986 than from 2001 to 2011 (Table 4). The rapid2001–11 areal shrinkage of NPI-1 (Grosse; 1.69%a–1), NPI-6(Gualas; 0.97%a–1), NPI-16 (HPN-4; 0.26%a–1) and NPI-25(Colonia; 0.15% a–1) dominates the trend observed inFigure 4e, but in general, the small glaciers fringing theicefield shrank fastest (Figs 4, 5 and 6a). The period of mostrapid shrinkage of the other glaciers varies, from 1870–1986(e.g. NPI-7 (San Rafael; 0.09%a–1)) to 1975–86 (e.g. NPI-8(San Quintin; 0.23% a–1)) to 1986–2001 (e.g. NPI-14(0.23%a–1), NPI-12 (Benito; 0.33%a–1) and NPI-5 (Reicher;0.77%a–1)) (Figs 2b and c and 7a). It is also clear from thescatter plots in Figure 5 that calving glaciers are currentlyshrinking less rapidly (as a percentage of their area perannum) than land-terminating glaciers. Indeed, Figure 4ashows that land-terminating glaciers have relative rates ofarea loss much higher than calving glaciers, both east andwest of the ice divide, with land-terminating glaciers east ofthe ice divide shrinking at 0.27%a–1 from 2001 to 2011,compared with 0.11%a–1 for calving glaciers. However, itshould be noted that these large calving glaciers have lost themost area in absolute terms and are still shrinking rapidly.
3.2.4. Southern Patagonia Icefield (SPI)For the SPI, 96.5% of the glaciers shrank between 1870 and2011, with the majority (59 of 154) shrinking fastest from2001 to 2011. The length fluctuations of 157 glaciers showlarge but variable linear recession from their LIA maxima(e.g. SPI-14 (O’Higgins; 16.0 km by 2011; lacustrine) andSPI-1 (Jorge Montt; 10.0 km by 2001 followed by a small2001–11 advance of 0.5 km)). Several large glaciers shrankparticularly fast between 2001 and 2011 (e.g. SPI-142(Occidental; 216ma–1), SPI-179 (76m a–1) and SPI-22(157ma–1)) (Fig. 6d).
The largest relative area changes (1870–2011) weregenerally from the smaller outlet glaciers, such as SPI-26(82.4%), SPI-177 (85.8%) and SPI-169 (93.2%). The largeroutlet glaciers have also lost surface area from 1870 to 2011(e.g. from SPI-1 (Jorge Montt; 12.6%), SPI-14 (O’Higgins;10.9%), SPI-31 (Upsala; 19.7%) and SPI-142 (Occidental;11.5%)). Three glaciers advanced from 1986 to 2001 (SPI-137 (2.1 km2), SPI-198 (2.4 km2) and SPI-77 (0.3 km2)) andthree from 2001 to 2011 (SPI-113 (4.9 km2), SPI-109(0.6 km2) and SPI-45 (4.9 km2)); in the case of SPI-113, the
Davies and Glasser: Accelerating shrinkage of Patagonian glaciers 1075
advance from 2001 to 2011 was beyond 1870 limits.However, it is difficult to determine the 1870 limit for fjord-type glaciers without moraines (e.g. SPI-113).
Overall, annual rates of shrinkage for the SPI were morethan twice as rapid for 2001–11 (0.15%a–1) as for 1870–1986 (0.07%a–1; Fig. 4e), but this result is again dominatedby a small number of outlet glaciers (Figs 5 and 6b),
particularly those south of the main icefield, such as SPI-70(1.22%a–1), SPI-149 (6.37%a–1) and SPI-199 (1.95%a–1)(Figs 6 and 7b). Although some calving outlet glaciers areshrinking rapidly (e.g. SPI-141 (0.22% a–1), SPI-145(1.02%a–1) and SPI-31 (Upsala; 19.7%a–1)), in general,small, land-terminating glaciers are experiencing the high-est annual rates of shrinkage (Figs 5 and 6). Across the SPI,
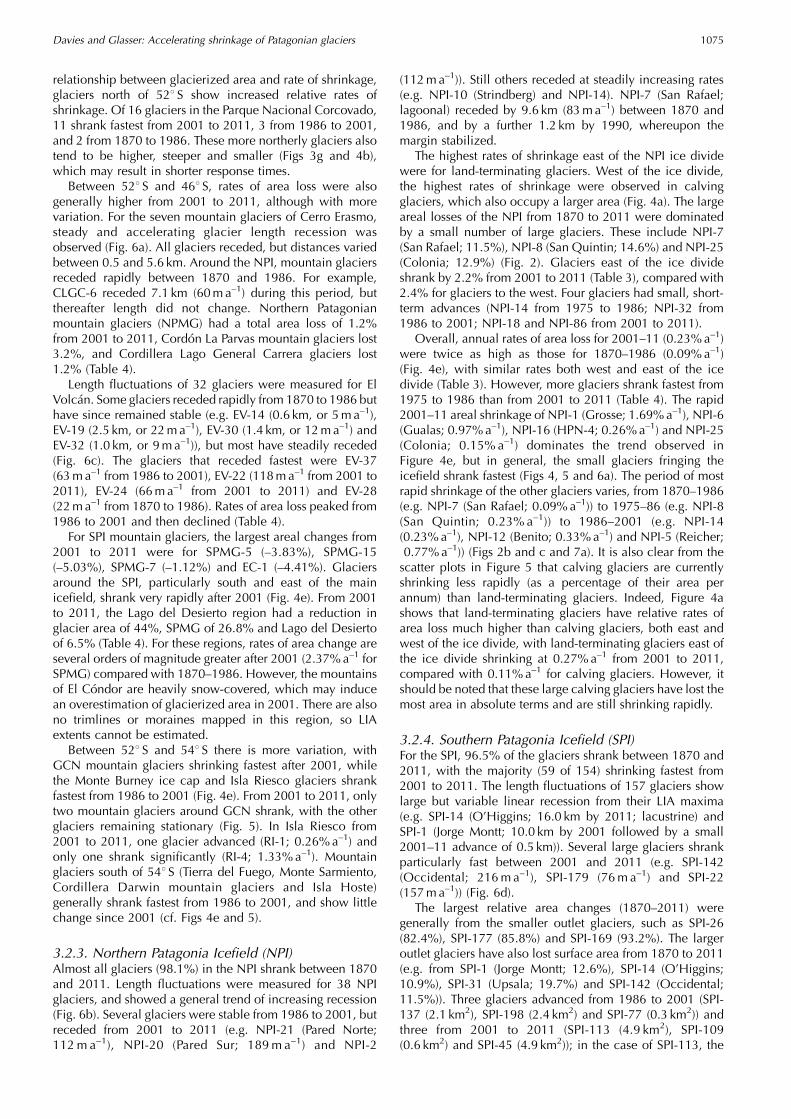
Fig. 7. Map of key icefields showing overall glacier shrinkage, 1870–2011. Glacier extent in 1870 is shown in white. Lakes larger than15 km2 are also shown.
Davies and Glasser: Accelerating shrinkage of Patagonian glaciers1076
glaciers on the east of the ice divide had slightly higherannual rates of shrinkage (Table 3), with land-terminatingglaciers shrinking at rates of 0.29%a–1 from 2001 to 2011,compared with 0.08%a–1 for calving glaciers west of theice divide (Fig. 4a). Figure 7b illustrates the highly variablebut rapid area loss in small glaciers around the fringes of
the SPI, with particular large glaciers also losing surfacearea. Rates of area loss are increasing around the SPI, withmost glaciers experiencing their highest rates of area lossfrom 2001 to 2011 (Fig. 8b; Table 4). For most of theremaining glaciers, the period of fastest area loss was1986–2001.
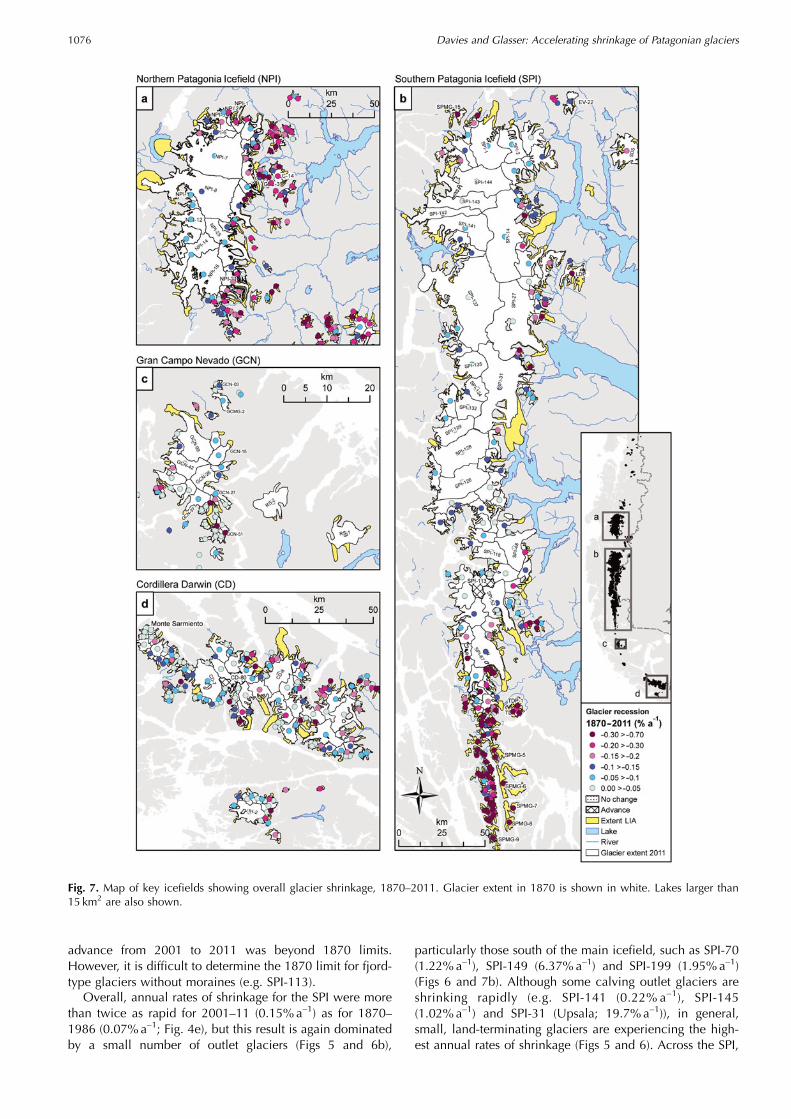
Fig. 8. Map of key icefields, illustrating period of fastest shrinkage. Glaciers in dark purple shrank fastest between 2001 and 2011, lightpurple between 1986 and 2001, bright green between 1975 and 1986, and light green between 1870 and 1986. Glaciers in red advancedand glaciers in orange did not change. Glacier outlines are from 2011. Lakes larger than 15 km2 are also shown.
Davies and Glasser: Accelerating shrinkage of Patagonian glaciers 1077
3.2.5. Gran Campo Nevado (GCN)Around the GCN, 19 glaciers (36.5%) exhibited no change,33 (63.5%) shrank and none advanced from 1870 to 2011.The 31 glaciers of GCN for which length wasmeasured show,in general, recession, with various glaciers receding atdifferent rates during each time period (Fig. 6e). While themountain glaciers around GCN shrank rapidly after 2001,rates of area loss for land-terminating outlet glaciers haveremained steady (Fig. 4e). Althoughmost glaciers shrank fromtheir LIA maxima, the highest annual rates of shrinkage wereobserved in small glaciers (Figs 5 and 6c). In total, 11 glaciersshrank fastest from 1986 to 2001, and 10 from 2001 to 2011(Table 4). Annual rates of shrinkage were similar from 1986 to2011 (0.23%a–1; Table 4; Figs 4e and 8c). The glaciers losingarea fastest from 2001 to 2011 were GCN-03 (2.22%a–1),GCN-27 (1.17%a–1) and GCN-51 (5.53%a–1). The largeoutlet glaciers had smaller rates of relative annual area loss(e.g. GCN-26 (0.53%a–1) and GCN-42 (0.37%a–1)) (Fig. 7c).
3.2.6. Cordillera DarwinThe numbers of shrinking glaciers in Cordillera Darwin fellfrom 77.5% for 1870–1986, to 39.5% for 1986–2001, to31.8% for 2001–11, with many glaciers showing no changefrom 2001 to 2011. Glacier length was measured for 107glaciers in Cordillera Darwin, with most receding until1986, and with little frontal change after this. Some calvingglaciers had small advances between 1986 and 2011 (e.g.CD-80 (1.3 km from 2001 to 2011; further than its 1986limit)). A lack of moraines makes the 1870 limit difficult tomap. In contrast, CD-8, also marine-terminating, recededrapidly from 1986 to 2001 (756ma–1), after which recessionslowed (202ma–1 from 2001 to 2011) (Fig. 6f).
Many glaciers had little or no shrinkage from 1870 to2011, and the glaciers with the highest annual rates weresmall and land-terminating (Figs 5 and 7c). Outlet glaciers ofCordillera Darwin had their highest rates of area loss from1986 to 2001 (Figs 4e and 8d). Overall, rates of area losswere more than twice as high for 1986–2001 (0.26%a–1) asfor 1870–1986 (0.08%a–1), but shrinkage rates fell to0.12%a–1 after 2001 (Table 4; Fig. 4e). The number ofglaciers that shrank fastest from 1986 to 2001 was 29,compared with 16 from 2001 to 2011 (Table 4).
The outlet glaciers of the nearby Monte Sarmiento andIsla Hoste ice caps show similar patterns, frequently withlow rates of shrinkage (Figs 5 and 7d). Overall, for both icecaps, the period of fastest area loss was 1986–2001, withmany glaciers having no observable change after 2001(Figs 5 and 8d; Table 4). It is again the small, land-terminating glaciers that are shrinking fastest (cf. Fig. 5).
4. DISCUSSION
4.1. Comparison with previous inventoriesOur calculated area for the NPI of 3976 km2 in 2011 and4070 km2 in 2001 is similar to the previous estimate of atotal ice area of 3953 km2 in 2001 made by Rivera andothers (2007). Our calculated area for the contemporary SPIof 13 219 km2 in 2011 also fits with the previous estimate forthis icefield of 13 000 km2 (Aniya, 1999). For GCN, ourcalculated area of 243 km2 in 2001 fits well with thecalculated area of Schneider and others (2007) of 252.6 km2
in 2002. Differences may be because we included more ofthe surrounding glaciers in our study.
Our data lend independent support to the assertion ofRignot and others (2003) and Glasser and others (2011) thatthe Patagonian icefields are shrinking at an increasingrate. Our calculated rates of area loss from the NPI suggestthat there was an increase in annual area loss rates from0.09%a–1 in the 116 years between AD1870 and 1986, to0.12%a–1 in the 15 years between 1986 and 2001, to0.23%a–1 from 2001 to 2011 (Table 4).
4.2. Calving dynamics and asynchronous glacierchangeThe acceleration in relative rates of area loss for the NPI from2001 to 2011 was dominated by the smaller land-terminat-ing glaciers (Figs 4e and 5). The shrinkage of marine- andlacustrine-terminating glaciers is highly variable, andreflects a dynamic and nonlinear response to multiplefactors. For example, NPI-1, NPI-6, NPI-16 and NPI-25terminate in freshwater lakes, and had particularly rapidrates of area loss. NPI-1, however, ablates not by calving butby rapid thinning and surface melting, with large supragla-cial ponds (personal communication from M. Aniya, 2012).The fragmented snout of NPI-16 is difficult to define, whichmay induce an error in assessing the shrinkage. Supraglacialdebris cover insulates the glacier from solar radiation and soaffects ablation rates (Scherler and others, 2011). Forexample, slow shrinkage of NPI-1 (Glaciar Grosse) prior to2001 was attributed to insulation by thick debris cover(Aniya, 2001). The floating terminus of NPI-6 (GlaciarGualas) advanced from 1996 to 1999, possibly as a result ofstretching (Aniya, 2001). This stretching was followed bymore rapid shrinkage from 2001 to 2011, driven by rapidcalving induced by large, deep, water-filled crevasses.
NPI-7 (Glaciar San Rafael), NPI-8 (Glaciar San Quintin)and NPI-5 (Glaciar Reicher) (Figs 2, 7 and 8) shrank mostrapidly from 1870 to 1986, 1986 to 2001 and 1986 to 2001respectively. These lacustrine-terminating glaciers are thelargest of the NPI and have widely different accumulation–area ratios. They have shown repeated stillstands, advancesand retreats since the 1920s (Winchester and Harrison,1996; Aniya, 2007, Araneda and others, 2007; Lopez andothers, 2010). Glaciar San Rafael currently has a highvelocity and is thinning extensively (Willis and others,2011). Steady thinning of the glacier surface could induceperiodic flotation and rapid retreat, followed by groundingand stabilization (Aniya, 2007). An advance reported from1992 to 1999 for Glaciar San Rafael (Aniya, 2001) explainsthe reduced area loss rates observed from 1986 to 2001.Glaciar San Quintin terminated on land until 1991, whenshrinkage led to the formation of a lake in the former glacierbasin, into which it now calves (Rivera and others 2007;Willis and others, 2011). Large-scale shrinkage was ob-served in Glaciar Reicher from 1996 to 1999 (Aniya, 2001),before the glacier appeared to reach a new equilibrium.NPI-12 (Glaciar Benito) and NPI-13 (HPN-1) are boththinning rapidly and accelerated in speed between 2007and 2011 (Willis and others, 2011). Neither glacier hasshown significant shrinkage in this period.
For the SPI, the acceleration of shrinkage post-2001 isdominated by smaller fringing glaciers (Figs 4e, 5, 7b and8b). However, the majority of the large outlet glaciersdraining the SPI calve into freshwater lakes or fjords, withhighly variable behaviour in each catchment basin (Aniya,1995; Fig. 8d). Dynamical changes in the calving glaciers ofthe SPI are discussed below.
Davies and Glasser: Accelerating shrinkage of Patagonian glaciers1078
SPI-31 (Glaciar Upsala) calves into a lake on the easternSPI and shrank at 0.2%a–1 from 2001 to 2011. Previousstudies observed thinning (33m between 1990 and 1993;Naruse and Skvarca, 2000) and rapid area loss, and arguedthat this was caused by variations in bed topography, withbedrock rises in the lake controlling frontal fluctuations(Naruse and others, 1997; Naruse and Skvarca, 2000). SPI-137 (Pio XI) is currently shrinking at a rate of 0.04%a–1.From 1986 to 2001, Pio XI advanced at a rate of 0.01%a–1,with a documented advance of up to 10 km from 1945 to1986 (Rivera and Casassa, 1999), with thickening by anaverage of 44.1m from 1975 to 1995.
SPI-16 (Glaciar Chico) is shrinking slower than many ofthe other large tidewater glaciers of the SPI (at 0.18%a–1),which has been attributed to limited calving activity (Riveraand others, 2005). However, this glacier is thinning at ratescomparable to other glaciers of the SPI, and the rate of arealoss has accelerated in each successive period. SPI-14(Glaciar O’Higgins) shrank most rapidly from 1870 to 1986(0.09%a–1), followed by slower shrinkage from 1986 to2001 (0.02%a–1) and from 2001 to 2011 (0.01%a–1). This islargely due to a rapid retreat of 4.7 km from 1973 to 1976(Lopez and others, 2010).
SPI-48 (Glaciar Perito Moreno), on the eastern side of theice divide, calves into Lago Argentino (cf. Fig. 8b), with onlylimited area loss (0.1%) after 2001. This glacier is wellknown for periodic advances and retreats, related to thegeometry of its calving front. The glacier periodicallyadvances to Penınsula Magallanes, whereupon it dams thelake. Rising lake levels lead to increased pressure andeventual ice-dam and lake-drainage events through the icefront (Stuefer and others, 2007).
Therefore, across the NPI and SPI, atmospheric tempera-ture changes have led to thinning, resulting in calvingglaciers reaching flotation point and becoming unstable (cf.Rivera and Casassa, 2004). Stretching may cause short-livedadvances, but encourages thinning and enhanced calving,resulting eventually in retreat. Accelerated retreat may occurafter shrinkage from a pinning point (Holmlund and Fuenza-lida, 1995; Warren and Aniya, 1999). Alternatively, a marineshoal may reduce water depths and encourage advance. Theformation of a proglacial lake may accelerate glaciershrinkage, but if the glacier retreats beyond the lake margin,shrinkage may slow down. Therefore glacier shrinkage incalving glaciers is regulated by individual dynamics (calvingstatus, ELA, channel geometry (Aniya and others, 1997)), withretreating, advancing and stable termini observed.
4.3. Temporal and regional variationsFrom Figures 4 and 5, it is clear that latitude, size and terminalenvironment exert the greatest controls on glacier shrinkage,with the more northerly, smaller, land-terminating glaciersshrinking fastest. Calving glaciers are changing in area(relative rates of area loss) more slowly than small land-terminating glaciers, with internal calving dynamics control-ling tidewater termini (Fig. 4a). The spikes in SPMG and Lagodel Desierto are caused by a small number of very rapidlyshrinking glaciers, such as EC-1, SPMG-15 and SPMG-5.Worldwide, small glaciers and ice caps have reactedparticularly dynamically to increased global temperatures(Oerlemans and Fortuin, 1992; Hock and others, 2009), and ithas been proposed that the volume loss from mountainglaciers and ice caps like these is the main contributor torecent global sea-level rise (Church and others, 2001;Braithwaite and Raper, 2002; Meier and others, 2007; Hock
and others, 2009). On a regional scale, both the largeicefields and small ice caps and glaciers north of 528 S havesuffered accelerated shrinkage from 2001 to 2011 (Fig. 4e),presumably driven by the observed increases in upper-tropospheric air temperatures since 1976, particularly atPuerto Montt (Giese and others, 2002; Villalba and others,2003; Bown and Rivera, 2007; Carrasco and others, 2008;Aravena and Luckman, 2009; Rivera and others, 2012).Glacierized summits in the Chilean Lake District lie withinthis altitudinal zone, so this warming is likely to be asignificant control on the mass balance of ice caps andglaciers between 418 S and 468 S in the far north of the studyregion, resulting in rapid shrinkage (i.e. Parque NacionalVicente Rosales, Hornopiren, Parque Nacional Corcovadoand Parque Nacional Queulat).
There is a very slight east–west gradient in annual rates ofarea loss for the NPI and SPI (Table 3), in particular for theperiod 1870–1986, with the eastern glaciers shrinking fastest.This is illustrated further in Figure 6, where smaller glacierson the east of the NPI and the nearby glaciers exhibit thehighest rates of relative shrinkage. We do not find strongevidence for shrinkage gradients in the outlet glaciers after1986; this contrasts with other studies, where it has beenargued that changes in precipitation are driving theaccelerated shrinkage east of the ice divide (Aravena andLuckman, 2009). However, it should be noted that absoluterates of area loss (km2 a–1) are higher on the west of the icedivide, due to the larger glacierized area here. Harrison andWinchester (2000) also found little evidence of clear east–west gradients or patterns of behaviour for the NPI. It ispossible that declining precipitation drove increased relativeshrinkage rates east of the ice divide for the period 1870–1986, but after this period more uniform shrinkage wouldsuggest that they are more likely shrinking in response tothinning (cf. Rignot and others, 2003). Barcaza and others(2009) attribute faster absolute shrinkage (km2 a–1) on west-ern glaciers to high transient snowlines and increasedablation areas; however, this does not take into accountglacier size, so results are not comparable.
Mountain glaciers and ice caps between 528 S and 548 S,including GCN and Isla Riesco, had relatively similar rates ofarea loss from 1986 to 2011 (Figs 4e and 6). The observedshrinkage is in keeping with thinning observed on outletglaciers (Moller and others, 2007). Mountain glaciers south of548 S and the Cordillera Darwin, Isla Hoste, Tierra del Fuegoand Monte Sarmiento ice caps have had respectively lesschange since the LIA, which agrees with the findings of otherstudies (e.g. Kuylenstierna and others, 1996). These glaciersshrank fastest from 1986 to 2001 (Fig. 4e), during a period ofrapid warming south of 468 S (Villalba and others, 2003).
5. CONCLUSIONSWe mapped glacier area and length for 640 Patagonianglaciers in 1870, and 626 glaciers for 1986, 2001 and 2011(the remainder having entirely disappeared). The region ischaracterized by four large icefields and numerous smallglaciers. These data provide the longest-term estimates (141years) for regional glacier shrinkage of which we are aware.During this time, modelling and instrumented records showincreases in atmospheric temperatures and reductions inprecipitation. Almost all the glaciers shrank from their LIAlimit. However, it was difficult to map this limit for someglaciers, and the area lost is a minimum estimate. For the
Davies and Glasser: Accelerating shrinkage of Patagonian glaciers 1079
first time, we have compared glacier length and areachanges following the end of the LIA to change in recentdecades, and have been able to compare rates of shrinkageboth between icefields, but also for small isolated glaciersand ice caps across the study region, from 418 S to 568 S.
Since 1870, 90.2% of glaciers have shown continued andaccelerating shrinkage. Small glaciers (<5 km2), mountainglaciers and ice caps around icefields in particular areshrinking very rapidly. We have demonstrated that meanglacier shrinkage is now faster than it was at the end of theLIA, with the NPI and SPI shrinking approximately twice asfast from 2001 to 2011 as from 1870 to 1986. However, itshould be noted that during the 116 years betweenobservations, glaciers may have shrunk at rates higher orlower than the mean, with periods of stagnation or advancenot accounted for during this period in our study.
The detailed analysis undertaken allows regional trends tobe observed. Size, latitude and terminal environment exertthe largest controls on glacier shrinkage, with smaller(<5 km2), land-terminating, northerly glaciers generallyshrinking faster. For mountain glaciers north of 528 S andthe NPI and the SPI, the period of fastest shrinkage was 2001–11. Glaciers in the Chilean Lake District and ice caps onvolcanic mountains north of 468 S (which also have highmean elevations), and small mountain glaciers east of the SPIhad the highest area loss rates, with accelerating shrinkageafter 2001. Annual rates of area loss for mountain glaciersand ice caps north of 528 S are higher than for outlet glaciersof the NPI and the SPI, possibly because they are smaller.
There is considerable inter-catchment variability, andglaciers (particularly lacustrine and marine-terminatingglaciers) have a nonlinear response to external forcings,and with shrinkage being regulated by calving processes andbedrock topography. Only two glaciers advanced beyondtheir LIA limits (possibly because of mapping difficulties),but several glaciers advanced from 1986 to 2001 and 2001to 2011. There is evidence for only very slight asynchronousshrinkage either side of the ice divide for the NPI and SPI.Calving outlet glaciers of the NPI and SPI are thinning andshrinking, but more slowly than land-terminating glaciers,and are controlled more by dynamic calving processes.
For GCN, Isla Riesco ice caps and small (<5 km2)mountain glaciers between 528 S and 548 S, rates of arealoss accelerated after 1986 and then remained stable, withsimilar rates of area loss from 2001 to 2011, and with manyglaciers having no observable change. Mountain glaciersaround GCN shrank fastest from 2001 to 2011. For theCordillera Darwin, Isla Hoste and Monte Sarmiento ice capsand glaciers south of 548 S, the period of fastest area loss was1986–2001, with rates of area loss since declining, andincreasing numbers of glaciers remained stable after 2001.There are clear differences in response between differentregions, tidewater and land-terminating glaciers.
ACKNOWLEDGEMENTSWe acknowledge Masamu Aniya for kindly providing theshapefiles of the 1975 extent of the NPI. Landsat imageswere provided free of charge to Neil Glasser from NASA.This work was funded by a UK Natural EnvironmentResearch Council (NERC) grant through the AntarcticFunding Initiative (grant AFI 9-01; NE/F012942/1). Wegratefully acknowledge constructive and thoughtful reviewsfrom Frank Paul and Masamu Aniya.
REFERENCESAniya M (1988) Glacier inventory for the Northern Patagonia
Icefield, Chile, and variations 1944/45 to 1985/86. Arct. Alp.Res., 20(2), 179–187
Aniya M (1995) Holocene glacial chronology in Patagonia: Tyndalland Upsala glaciers. Arct. Alp. Res., 27(4), 311–322
Aniya M (1996) Holocene variations of Ameghino Glacier,southern Patagonia. Holocene, 6(2), 247–252 (doi: 10.1177/095968369600600211)
Aniya M (1999) Recent glacier variations of the Hielo Patagonicos,South America, and their contribution to sea-level change. Arct.Antarct. Alp. Res., 31(2), 165–173
Aniya M (2001) Glacier variations of Hielo Patagonico Norte,Chilean Patagonia, since 1944/45, with special reference tovariations between 1995/96 and 1999/2000. Bull. Glaciol. Res.,18, 55–63
Aniya M (2007) Glacier variations of Hielo Patagonico Norte, Chile,for 1944/45–2004/05. Bull. Glaciol. Res., 24, 59–70
Aniya M, Naruse R, Shizukuishi M, Skvarca P and Casassa G (1992)Monitoring recent glacier variations in the Southern PatagoniaIcefield, utilizing remote sensing data. Int. Arch. Photogramm.Remote Sens., 29(B7), 87–94
Aniya M, Sato H, Naruse R, Skvarca Pand Casassa G (1996) The useof satellite and airborne imagery to inventory outlet glaciers ofthe Southern Patagonia Icefield, South America. Photogramm.Eng. Remote Sens., 62(12), 1361–1369
Aniya M, Sato H, Naruse R, Skvarca P and Casassa G (1997) Recentglacier variations in the Southern Patagonia Icefield, SouthAmerica. Arct. Alp. Res., 29(1), 1–12
Araneda A and 6 others (2007) Historical records of San Rafaelglacier advances (North Patagonian Icefield): another clue to‘Little Ice Age’ timing in southern Chile? Holocene, 17(7),987–998 (doi: 10.1177/0959683607082414)
Aravena J-C and Luckman BH (2009) Spatio-temporal rainfallpatterns in Southern South America. Int. J. Climatol., 29(14),2106–2120 (doi: 10.1002/joc.1761)
Arendt AA, Echelmeyer KA, Harrison WD, Lingle CS and ValentineVB (2002) Rapid wastage of Alaska glaciers and their contri-bution to rising sea level. Science, 297(5580), 382–386 (doi:10.1126/science.1072497)
Barcaza G, Aniya M, Matsumoto T and Aoki T (2009) Satellite-derived equilibrium lines in Northern Patagonia Icefield, Chile,and their implications to glacier variations. Arct. Antarct. Alp.Res., 41(2), 174–182 (doi: 10.1657/1938-4246-41.2.174)
Bolch T, Menounos B andWheate R (2010) Landsat-based inventoryof glaciers in western Canada, 1985–2005. Remote Sens.Environ., 114(1), 127–137 (doi: 10.1016/j.rse.2009.08.015)
Bown F and Rivera A (2007) Climate changes and recent glacierbehaviour in the Chilean Lake District. Global Planet. Change,59(1–4), 79–86 (doi: 10.106/j.gloplacha.2006.11.015)
Braithwaite RJ and Raper SCB (2002) Glaciers and their contri-bution to sea level change. Phys. Chem. Earth, Parts A/B/C,27(32–34), 1445–1454 (doi: 10.1016/S1474-7065(02)00089-X)
Buttstadt M, Moller M, Iturraspe R and Schneider C (2009)Mass balance evolution of Martial Este Glacier, Tierra delFuego (Argentina) for the period 1960–2099. Adv. Geosci., 22,117–124 (doi: 10.5194/adgeo-22-117-2009)
Carrasco JF, Osorio R and Casassa G (2008) Secular trend of theequilibrium-line altitude on the western side of thesouthern Andes, derived from radiosonde and surfaceobservations. J. Glaciol., 54(186), 538–550 (doi: 10.3189/002214308785837002)
Casassa G, Smith K, Rivera A, Araos J, Schnirch M and Schneider C(2002) Inventory of glaciers in isla Riesco, Patagonia, Chile,based on aerial photography and satellite imagery. Ann.Glaciol., 34, 373–378 (doi: 10.3189/172756402781817671)
Chen JL, Wilson CR, Tapley BD, Blankenship DD and Ivins ER(2007) Patagonia Icefield melting observed by Gravity Recovery
Davies and Glasser: Accelerating shrinkage of Patagonian glaciers1080
and Climate Experiment (GRACE). Geophys. Res. Lett., 43(22),L22501 (doi: 10.1029/2007GL031871)
Church JA and 7 others (2001) Changes in sea level. In Houghton JTand 7 others eds. Climate change 2001: the scientific basis.Contribution of Working Group I to the Third Assessment Reportof the Intergovernmental Panel on Climate Change. CambridgeUniversity Press, Cambridge, 639–693
Cook AJ, Fox AJ, Vaughan DG and Ferrigno JG (2005) Retreatingglacier fronts on the Antarctic Peninsula over the past half-century. Science, 308(5721), 541–544 (doi: 10.1126/science.1104235)
Davies BJ, Carrivick JL, Glasser NF, Hambrey MJ and Smellie JL(2012) Variable glacier response to atmospheric warming,northern Antarctic Peninsula, 1988–2009. Cryosphere, 6,1031–1048
Evans IS (2006) Local aspect asymmetry of mountain glaciation: aglobal survey of consistency of favoured directions for glaciernumbers and altitudes. Geomorphology, 73(1–2), 166–184 (doi:10.1016/j.geomorph.2005.07.009)
Farr TG and 17 others (2007) The Shuttle Radar Topography Mission.Rev. Geophys., 45(2), RG2004 (doi: 10.1029/2005RG000183)
Frey H and Paul F (2012) On the suitability of the SRTM DEM andASTER GDEM for the compilation of topographic parameters inglacier inventories. Int. J. Appl. Earth Obs. Geoinform., 18,480–490 (doi: 10.1016/j.jag.2011.09.020)
Garreaud RD, Vuille M, Compagnucci R and Marengo J (2009)Present-day South American climate. Palaeogeogr., Palaeocli-matol., Palaeoecol., 281(3–4), 180–195 (doi: 10.1016/j.palaeo.2007.10.032)
Giese BS, Urizar SC and Fuckar NS (2002) Southern Hemisphereorigins of the 1976 climate shift. Geophys. Res. Lett., 29(2),1014 (doi: 10.1029/2001GL013268)
Glasser NF and Scambos TA (2008) A structural glaciologicalanalysis of the 2002 Larsen B ice-shelf collapse. J. Glaciol.,54(184), 3–16 (doi: 10.3189/002214308784409017)
Glasser NF, Hambrey MJ and Aniya M (2002) An advance of SolerGlacier, North Patagonian Icefield, at c. AD 1222–1342.Holocene, 12(1), 113–120 (doi: 10.1191/0959683602hl526rr)
Glasser NF, Harrison S, Winchester V and Aniya M (2004) LatePleistocene and Holocene palaeoclimate and glacier fluctua-tions in Patagonia. Global Planet. Change, 43(1–2), 79–101 (doi:10.1016/j.gloplacha.2004.03.002)
Glasser NF, Jansson KN, Harrison S and Rivera A (2005) Geo-morphological evidence for variations of the North PatagonianIcefield during the Holocene. Geomorphology, 71(3–4),263–277 (doi: 10.1016/j.geomorph.2005.02.003)
Glasser NF, Jansson KN, Harrison S and Kleman J (2008) The glacialgeomorphology and Pleistocene history of South Americabetween 388S and 568S. Quat. Sci. Rev., 27(3–4), 365–390(doi: 10.1016/j.quascirev.2007.11.011)
Glasser NF, Harrison S, Jansson KN, Anderson K and Cowley A(2011) Global sea-level contribution from the PatagonianIcefields since the Little Ice Age maximum. Nature Geosci.,4(5), 303–307 (doi: 10.1038/ngeo1122)
Granshaw FD and Fountain AG (2006) Glacier change (1958–1998) in the North Cascades National Park Complex, Washing-ton, USA. J. Glaciol., 52(177), 251–256 (doi: 10.3189/172756506781828782)
Harrison S and Winchester V (2000) Nineteenth- and twentieth-century glacier fluctuations and climatic implications in theArco and Colonia Valleys, Hielo Patagonico Norte, Chile. Arct.Antarct. Alp. Res., 32(1), 55–63
Harrison S, Winchester V and Glasser N (2007) The timing andnature of recession of outlet glaciers of Hielo Patagonico Norte,Chile, from their Neoglacial IV (Little Ice Age) maximumpositions. Global Planet. Change, 59(1–4), 67–78 (doi: 10.1016/j.gloplacha.2006.11.020)
Harrison S, Glasser NF, Duller GAT and Jansson KN (2012) Earlyand mid-Holocene age for the Tempanos moraines, Laguna San
Rafael, Patagonian Chile. Quat. Sci. Rev., 31, 82–92 (doi:10.1016/j.quascirev.2011.10.015)
Hijmans RJ, Cameron SE, Parra JL, Jones PG and Jarvis A (2005)Very high resolution interpolated climate surfaces for globalland areas. Int. J. Climatol., 25(15), 1965–1978 (doi: 10.1002/joc.1276)
Hock R, De Woul M and Radic V (2009) Mountain glaciers andice caps around Antarctica make a large sea-level rise contri-bution. Geophys. Res. Lett., 36(7), L07501 (doi: 10.1029/2008GL037020)
Holmlund P and Fuenzalida H (1995) Anomalous glacier responsesto 20th century climatic changes in Darwin Cordillera, southernChile. J. Glaciol., 41(139), 465–473
Ivins ER, Watkins MM, Yuan D-N, Dietrich R, Casassa G and RulkeA (2011) On-land ice loss and glacial isostatic adjustment at theDrake Passage: 2003–2009. J. Geophys. Res., 116(B2), B02403(doi: 10.1029/2010JB007607)
Jarvis A, Reuter HI, Nelson A and Guevara E (2008) Hole-filledseamless SRTM data, V4. International Center for TropicalAgriculture (CIAT), Cali, http://srtm.csi.cgiar.org [accessed31 July 2012]
Jiskoot H, Curran CJ, Tessler DL and Shenton LR (2009) Changes inClemenceau Icefield and Chaba Group glaciers, Canada, relatedto hypsometry, tributary detachment, length–slope and area–aspect relations. Ann. Glaciol., 50(53), 133–143 (doi: 10.3189/172756410790595796)
Koch J and Kilian R (2005) ‘Little Ice Age’ glacier fluctuations, GranCampo Nevado, southernmost Chile. Holocene, 15(1), 20–28(doi: 10.1191/0959683605hl780rp)
Koppes M, Conway H, Rasmussen LA and Chernos M (2011)Deriving mass balance and calving variations from reanalysisdata and sparse observations, Glaciar San Rafael, northernPatagonia, 1950–2005. Cryosphere, 5(3), 791–808 (doi:10.5194/tc-5-791-2011)
Kuylenstierna J, Rosqvist GC and Holmlund P (1996) Late-Holocene glacier variations in the Cordillera Darwin, Tierradel Fuego, Chile. Holocene, 6(3), 353–358 (doi: 10.1177/095968369600600310)
Lopez P, Chevallier P, Favier V, Pouyaud B, Ordenes F andOerlemans J (2010) A regional view of fluctuations in glacierlength in southern South America. Global Planet. Change,71(1–2), 85–108 (doi: 10.1016/j.gloplacha.2009.12.009)
Masiokas MH, Villalba R, Luckman BH, Lascano ME, Delgado Sand Stepanek P (2008) 20th-century glacier recession andregional hydroclimatic changes in northwestern Patagonia.Global Planet. Change, 60(1–2), 85–100 (doi: 10.1016/j.gloplacha.2006.07.031)
Masiokas M, Rivera A, Espizua LE, Villalba R, Delgado S andAravena JC (2009a) Glacier fluctuations in extratropical SouthAmerica during the past 1000 years. Palaeogeogr., Palaeo-climatol., Palaeoecol., 281(3–4), 242–268 (doi: 10.1016/j.palaeo.2009.08.006)
Masiokas MH, Luckman BH, Villalba R, Delgado S, Skvarca P andRipalta A (2009b) Little Ice Age fluctuations of small glaciers inthe Monte Fitz Roy and Lago del Desierto areas, south PatagonianAndes, Argentina. Palaeogeogr., Palaeoclimatol., Palaeoecol.,281(3–4), 351–362 (doi: 10.1016/j.palaeo.2007.10.031)
Meier MF, Dyurgerov MB and McCabe GJ (2003) The health ofglaciers: recent changes in glacier regime. Climatic Change,59(1–2), 123–135
Meier MF and 7 others (2007) Glaciers dominate eustatic sea-levelrise in the 21st century. Science, 317(5841), 1064–1067
Michel R and Rignot E (1999) Flow of Glaciar Moreno, Argentina,from repeat-pass Shuttle Imaging Radar images: comparison ofthe phase correlation method with radar interferometry.J. Glaciol., 45(149), 93–100
Montecinos A and Aceituno P (2003) Seasonality of the ENSO-related rainfall variability in Central Chile and associatedcirculation anomalies. J. Climate, 16(2), 281–296 (doi:10.1175/1520-0442(2003)016<0281:SOTERR>2.0.CO;2)
Davies and Glasser: Accelerating shrinkage of Patagonian glaciers 1081
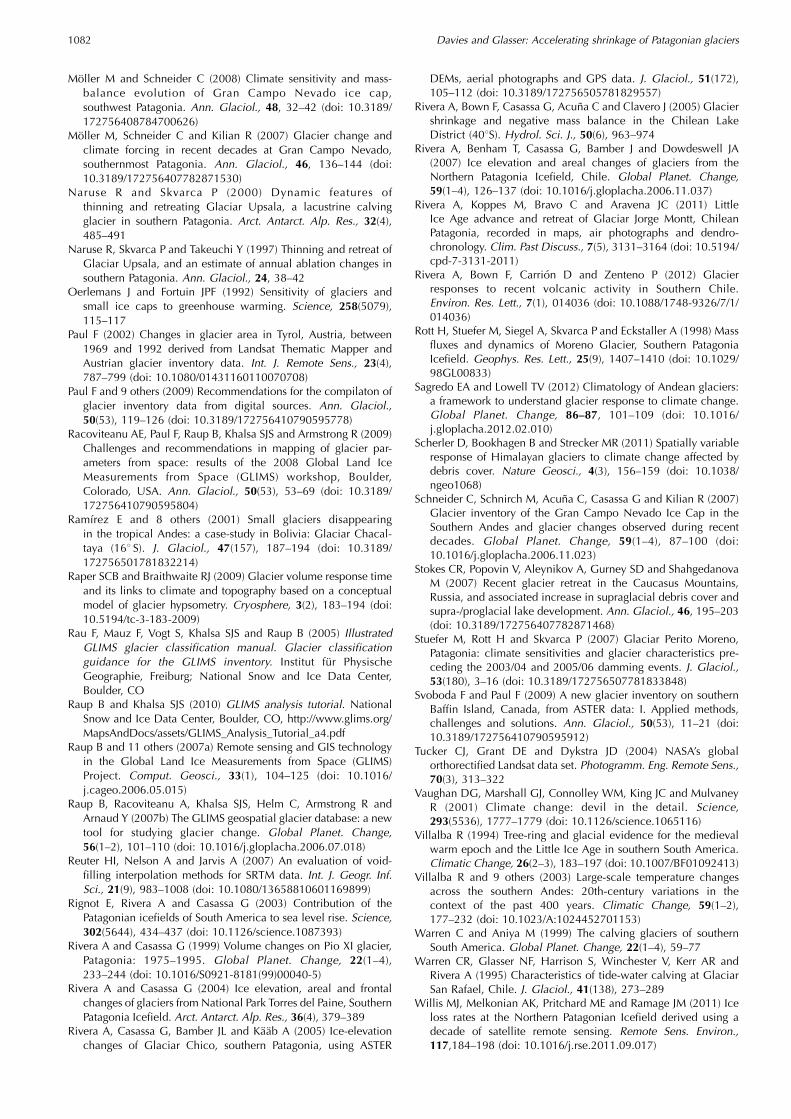
Moller M and Schneider C (2008) Climate sensitivity and mass-balance evolution of Gran Campo Nevado ice cap,southwest Patagonia. Ann. Glaciol., 48, 32–42 (doi: 10.3189/172756408784700626)
Moller M, Schneider C and Kilian R (2007) Glacier change andclimate forcing in recent decades at Gran Campo Nevado,southernmost Patagonia. Ann. Glaciol., 46, 136–144 (doi:10.3189/172756407782871530)
Naruse R and Skvarca P (2000) Dynamic features ofthinning and retreating Glaciar Upsala, a lacustrine calvingglacier in southern Patagonia. Arct. Antarct. Alp. Res., 32(4),485–491
Naruse R, Skvarca P and Takeuchi Y (1997) Thinning and retreat ofGlaciar Upsala, and an estimate of annual ablation changes insouthern Patagonia. Ann. Glaciol., 24, 38–42
Oerlemans J and Fortuin JPF (1992) Sensitivity of glaciers andsmall ice caps to greenhouse warming. Science, 258(5079),115–117
Paul F (2002) Changes in glacier area in Tyrol, Austria, between1969 and 1992 derived from Landsat Thematic Mapper andAustrian glacier inventory data. Int. J. Remote Sens., 23(4),787–799 (doi: 10.1080/01431160110070708)
Paul F and 9 others (2009) Recommendations for the compilaton ofglacier inventory data from digital sources. Ann. Glaciol.,50(53), 119–126 (doi: 10.3189/172756410790595778)
Racoviteanu AE, Paul F, Raup B, Khalsa SJS and Armstrong R (2009)Challenges and recommendations in mapping of glacier par-ameters from space: results of the 2008 Global Land IceMeasurements from Space (GLIMS) workshop, Boulder,Colorado, USA. Ann. Glaciol., 50(53), 53–69 (doi: 10.3189/172756410790595804)
Ramırez E and 8 others (2001) Small glaciers disappearingin the tropical Andes: a case-study in Bolivia: Glaciar Chacal-taya (168 S). J. Glaciol., 47(157), 187–194 (doi: 10.3189/172756501781832214)
Raper SCB and Braithwaite RJ (2009) Glacier volume response timeand its links to climate and topography based on a conceptualmodel of glacier hypsometry. Cryosphere, 3(2), 183–194 (doi:10.5194/tc-3-183-2009)
Rau F, Mauz F, Vogt S, Khalsa SJS and Raup B (2005) IllustratedGLIMS glacier classification manual. Glacier classificationguidance for the GLIMS inventory. Institut fur PhysischeGeographie, Freiburg; National Snow and Ice Data Center,Boulder, CO
Raup B and Khalsa SJS (2010) GLIMS analysis tutorial. NationalSnow and Ice Data Center, Boulder, CO, http://www.glims.org/MapsAndDocs/assets/GLIMS_Analysis_Tutorial_a4.pdf
Raup B and 11 others (2007a) Remote sensing and GIS technologyin the Global Land Ice Measurements from Space (GLIMS)Project. Comput. Geosci., 33(1), 104–125 (doi: 10.1016/j.cageo.2006.05.015)
Raup B, Racoviteanu A, Khalsa SJS, Helm C, Armstrong R andArnaud Y (2007b) The GLIMS geospatial glacier database: a newtool for studying glacier change. Global Planet. Change,56(1–2), 101–110 (doi: 10.1016/j.gloplacha.2006.07.018)
Reuter HI, Nelson A and Jarvis A (2007) An evaluation of void-filling interpolation methods for SRTM data. Int. J. Geogr. Inf.Sci., 21(9), 983–1008 (doi: 10.1080/13658810601169899)
Rignot E, Rivera A and Casassa G (2003) Contribution of thePatagonian icefields of South America to sea level rise. Science,302(5644), 434–437 (doi: 10.1126/science.1087393)
Rivera A and Casassa G (1999) Volume changes on Pio XI glacier,Patagonia: 1975–1995. Global Planet. Change, 22(1–4),233–244 (doi: 10.1016/S0921-8181(99)00040-5)
Rivera A and Casassa G (2004) Ice elevation, areal and frontalchanges of glaciers from National Park Torres del Paine, SouthernPatagonia Icefield. Arct. Antarct. Alp. Res., 36(4), 379–389
Rivera A, Casassa G, Bamber JL and Kaab A (2005) Ice-elevationchanges of Glaciar Chico, southern Patagonia, using ASTER
DEMs, aerial photographs and GPS data. J. Glaciol., 51(172),105–112 (doi: 10.3189/172756505781829557)
Rivera A, Bown F, Casassa G, Acuna C and Clavero J (2005) Glaciershrinkage and negative mass balance in the Chilean LakeDistrict (408S). Hydrol. Sci. J., 50(6), 963–974
Rivera A, Benham T, Casassa G, Bamber J and Dowdeswell JA(2007) Ice elevation and areal changes of glaciers from theNorthern Patagonia Icefield, Chile. Global Planet. Change,59(1–4), 126–137 (doi: 10.1016/j.gloplacha.2006.11.037)
Rivera A, Koppes M, Bravo C and Aravena JC (2011) LittleIce Age advance and retreat of Glaciar Jorge Montt, ChileanPatagonia, recorded in maps, air photographs and dendro-chronology. Clim. Past Discuss., 7(5), 3131–3164 (doi: 10.5194/cpd-7-3131-2011)
Rivera A, Bown F, Carrion D and Zenteno P (2012) Glacierresponses to recent volcanic activity in Southern Chile.Environ. Res. Lett., 7(1), 014036 (doi: 10.1088/1748-9326/7/1/014036)
Rott H, Stuefer M, Siegel A, Skvarca P and Eckstaller A (1998) Massfluxes and dynamics of Moreno Glacier, Southern PatagoniaIcefield. Geophys. Res. Lett., 25(9), 1407–1410 (doi: 10.1029/98GL00833)
Sagredo EA and Lowell TV (2012) Climatology of Andean glaciers:a framework to understand glacier response to climate change.Global Planet. Change, 86–87, 101–109 (doi: 10.1016/j.gloplacha.2012.02.010)
Scherler D, Bookhagen B and Strecker MR (2011) Spatially variableresponse of Himalayan glaciers to climate change affected bydebris cover. Nature Geosci., 4(3), 156–159 (doi: 10.1038/ngeo1068)
Schneider C, Schnirch M, Acuna C, Casassa G and Kilian R (2007)Glacier inventory of the Gran Campo Nevado Ice Cap in theSouthern Andes and glacier changes observed during recentdecades. Global Planet. Change, 59(1–4), 87–100 (doi:10.1016/j.gloplacha.2006.11.023)
Stokes CR, Popovin V, Aleynikov A, Gurney SD and ShahgedanovaM (2007) Recent glacier retreat in the Caucasus Mountains,Russia, and associated increase in supraglacial debris cover andsupra-/proglacial lake development. Ann. Glaciol., 46, 195–203(doi: 10.3189/172756407782871468)
Stuefer M, Rott H and Skvarca P (2007) Glaciar Perito Moreno,Patagonia: climate sensitivities and glacier characteristics pre-ceding the 2003/04 and 2005/06 damming events. J. Glaciol.,53(180), 3–16 (doi: 10.3189/172756507781833848)
Svoboda F and Paul F (2009) A new glacier inventory on southernBaffin Island, Canada, from ASTER data: I. Applied methods,challenges and solutions. Ann. Glaciol., 50(53), 11–21 (doi:10.3189/172756410790595912)
Tucker CJ, Grant DE and Dykstra JD (2004) NASA’s globalorthorectified Landsat data set. Photogramm. Eng. Remote Sens.,70(3), 313–322
Vaughan DG, Marshall GJ, Connolley WM, King JC and MulvaneyR (2001) Climate change: devil in the detail. Science,293(5536), 1777–1779 (doi: 10.1126/science.1065116)
Villalba R (1994) Tree-ring and glacial evidence for the medievalwarm epoch and the Little Ice Age in southern South America.Climatic Change, 26(2–3), 183–197 (doi: 10.1007/BF01092413)
Villalba R and 9 others (2003) Large-scale temperature changesacross the southern Andes: 20th-century variations in thecontext of the past 400 years. Climatic Change, 59(1–2),177–232 (doi: 10.1023/A:1024452701153)
Warren C and Aniya M (1999) The calving glaciers of southernSouth America. Global Planet. Change, 22(1–4), 59–77
Warren CR, Glasser NF, Harrison S, Winchester V, Kerr AR andRivera A (1995) Characteristics of tide-water calving at GlaciarSan Rafael, Chile. J. Glaciol., 41(138), 273–289
Willis MJ, Melkonian AK, Pritchard ME and Ramage JM (2011) Iceloss rates at the Northern Patagonian Icefield derived using adecade of satellite remote sensing. Remote Sens. Environ.,117,184–198 (doi: 10.1016/j.rse.2011.09.017)
Davies and Glasser: Accelerating shrinkage of Patagonian glaciers1082
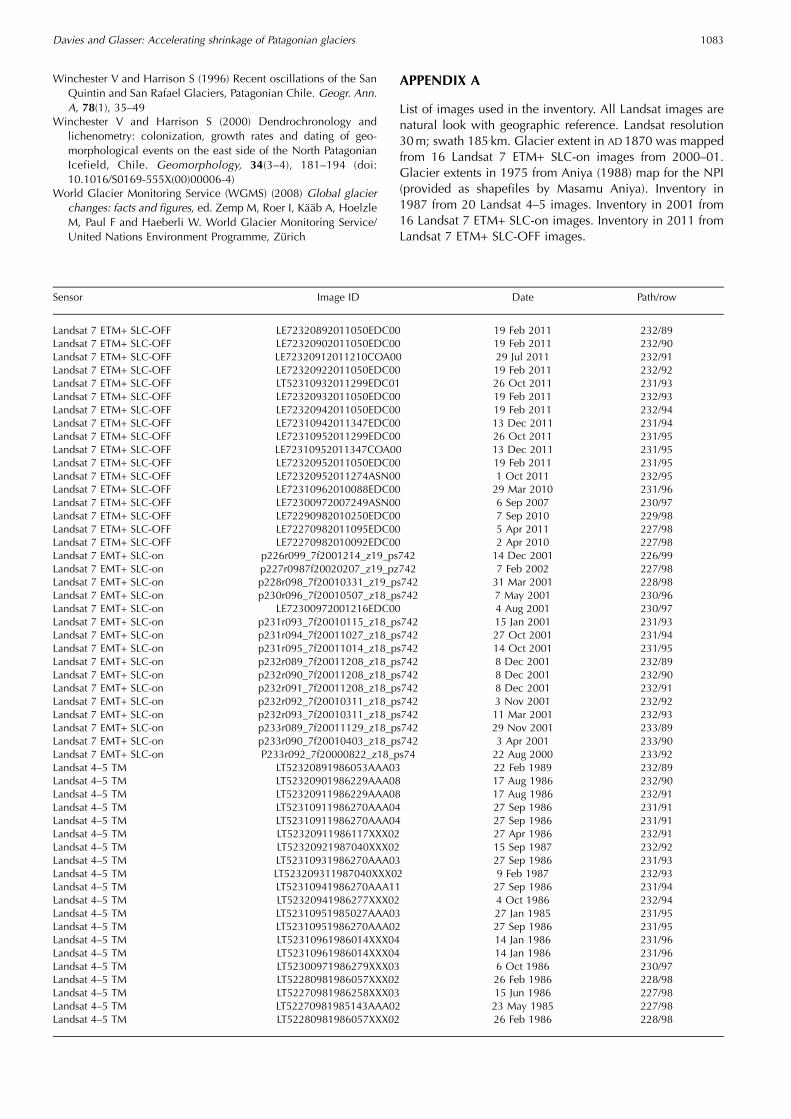
Winchester V and Harrison S (1996) Recent oscillations of the SanQuintin and San Rafael Glaciers, Patagonian Chile. Geogr. Ann.A, 78(1), 35–49
Winchester V and Harrison S (2000) Dendrochronology andlichenometry: colonization, growth rates and dating of geo-morphological events on the east side of the North PatagonianIcefield, Chile. Geomorphology, 34(3–4), 181–194 (doi:10.1016/S0169-555X(00)00006-4)
World Glacier Monitoring Service (WGMS) (2008) Global glacierchanges: facts and figures, ed. Zemp M, Roer I, Kaab A, HoelzleM, Paul F and Haeberli W. World Glacier Monitoring Service/United Nations Environment Programme, Zurich
APPENDIX A
List of images used in the inventory. All Landsat images arenatural look with geographic reference. Landsat resolution30m; swath 185 km. Glacier extent in AD 1870 was mappedfrom 16 Landsat 7 ETM+ SLC-on images from 2000–01.Glacier extents in 1975 from Aniya (1988) map for the NPI(provided as shapefiles by Masamu Aniya). Inventory in1987 from 20 Landsat 4–5 images. Inventory in 2001 from16 Landsat 7 ETM+ SLC-on images. Inventory in 2011 fromLandsat 7 ETM+ SLC-OFF images.
Sensor Image ID Date Path/row
Landsat 7 ETM+ SLC-OFF LE72320892011050EDC00 19 Feb 2011 232/89Landsat 7 ETM+ SLC-OFF LE72320902011050EDC00 19 Feb 2011 232/90Landsat 7 ETM+ SLC-OFF LE72320912011210COA00 29 Jul 2011 232/91Landsat 7 ETM+ SLC-OFF LE72320922011050EDC00 19 Feb 2011 232/92Landsat 7 ETM+ SLC-OFF LT52310932011299EDC01 26 Oct 2011 231/93Landsat 7 ETM+ SLC-OFF LE72320932011050EDC00 19 Feb 2011 232/93Landsat 7 ETM+ SLC-OFF LE72320942011050EDC00 19 Feb 2011 232/94Landsat 7 ETM+ SLC-OFF LE72310942011347EDC00 13 Dec 2011 231/94Landsat 7 ETM+ SLC-OFF LE72310952011299EDC00 26 Oct 2011 231/95Landsat 7 ETM+ SLC-OFF LE72310952011347COA00 13 Dec 2011 231/95Landsat 7 ETM+ SLC-OFF LE72320952011050EDC00 19 Feb 2011 231/95Landsat 7 ETM+ SLC-OFF LE72320952011274ASN00 1 Oct 2011 232/95Landsat 7 ETM+ SLC-OFF LE72310962010088EDC00 29 Mar 2010 231/96Landsat 7 ETM+ SLC-OFF LE72300972007249ASN00 6 Sep 2007 230/97Landsat 7 ETM+ SLC-OFF LE72290982010250EDC00 7 Sep 2010 229/98Landsat 7 ETM+ SLC-OFF LE72270982011095EDC00 5 Apr 2011 227/98Landsat 7 ETM+ SLC-OFF LE72270982010092EDC00 2 Apr 2010 227/98Landsat 7 EMT+ SLC-on p226r099_7f2001214_z19_ps742 14 Dec 2001 226/99Landsat 7 EMT+ SLC-on p227r0987f20020207_z19_pz742 7 Feb 2002 227/98Landsat 7 EMT+ SLC-on p228r098_7f20010331_z19_ps742 31 Mar 2001 228/98Landsat 7 EMT+ SLC-on p230r096_7f20010507_z18_ps742 7 May 2001 230/96Landsat 7 EMT+ SLC-on LE72300972001216EDC00 4 Aug 2001 230/97Landsat 7 EMT+ SLC-on p231r093_7f20010115_z18_ps742 15 Jan 2001 231/93Landsat 7 EMT+ SLC-on p231r094_7f20011027_z18_ps742 27 Oct 2001 231/94Landsat 7 EMT+ SLC-on p231r095_7f20011014_z18_ps742 14 Oct 2001 231/95Landsat 7 EMT+ SLC-on p232r089_7f20011208_z18_ps742 8 Dec 2001 232/89Landsat 7 EMT+ SLC-on p232r090_7f20011208_z18_ps742 8 Dec 2001 232/90Landsat 7 EMT+ SLC-on p232r091_7f20011208_z18_ps742 8 Dec 2001 232/91Landsat 7 EMT+ SLC-on p232r092_7f20010311_z18_ps742 3 Nov 2001 232/92Landsat 7 EMT+ SLC-on p232r093_7f20010311_z18_ps742 11 Mar 2001 232/93Landsat 7 EMT+ SLC-on p233r089_7f20011129_z18_ps742 29 Nov 2001 233/89Landsat 7 EMT+ SLC-on p233r090_7f20010403_z18_ps742 3 Apr 2001 233/90Landsat 7 EMT+ SLC-on P233r092_7f20000822_z18_ps74 22 Aug 2000 233/92Landsat 4–5 TM LT52320891986053AAA03 22 Feb 1989 232/89Landsat 4–5 TM LT52320901986229AAA08 17 Aug 1986 232/90Landsat 4–5 TM LT52320911986229AAA08 17 Aug 1986 232/91Landsat 4–5 TM LT52310911986270AAA04 27 Sep 1986 231/91Landsat 4–5 TM LT52310911986270AAA04 27 Sep 1986 231/91Landsat 4–5 TM LT52320911986117XXX02 27 Apr 1986 232/91Landsat 4–5 TM LT52320921987040XXX02 15 Sep 1987 232/92Landsat 4–5 TM LT52310931986270AAA03 27 Sep 1986 231/93Landsat 4–5 TM LT523209311987040XXX02 9 Feb 1987 232/93Landsat 4–5 TM LT52310941986270AAA11 27 Sep 1986 231/94Landsat 4–5 TM LT52320941986277XXX02 4 Oct 1986 232/94Landsat 4–5 TM LT52310951985027AAA03 27 Jan 1985 231/95Landsat 4–5 TM LT52310951986270AAA02 27 Sep 1986 231/95Landsat 4–5 TM LT52310961986014XXX04 14 Jan 1986 231/96Landsat 4–5 TM LT52310961986014XXX04 14 Jan 1986 231/96Landsat 4–5 TM LT52300971986279XXX03 6 Oct 1986 230/97Landsat 4–5 TM LT52280981986057XXX02 26 Feb 1986 228/98Landsat 4–5 TM LT52270981986258XXX03 15 Jun 1986 227/98Landsat 4–5 TM LT52270981985143AAA02 23 May 1985 227/98Landsat 4–5 TM LT52280981986057XXX02 26 Feb 1986 228/98
Davies and Glasser: Accelerating shrinkage of Patagonian glaciers 1083

APPENDIX BList of NASA SRTM DEM V4.1 tiles downloaded for thisstudy from http://srtm.csi.cgiar.org. These images have aswath of 225 km and a resolution of 90m. All images datefrom February 2000.2009.
Path/row Path/row
srtm_21–22 srtm_23_21srtm_21_23 srtm_23_22srtm_22_21 srtm_23_23srtm_22_22 srtm_23_24srtm_22_23 srtm_24_23srtm_22_24
MS received 6 February 2012 and accepted in revised form 27 July 2012
Davies and Glasser: Accelerating shrinkage of Patagonian glaciers1084