Embed Size (px)
Citation preview
Accessing & Mapping ACS Data
Case Study: Private School Enrollment Rates
ACS Data Users Conference Pre-Meeting Workshop
Jeanne Gobalet, Ph.D.
Lapkoff & Gobalet Demographic Research, Inc.
Saratoga, California
www.demographers.com
May 11, 2015
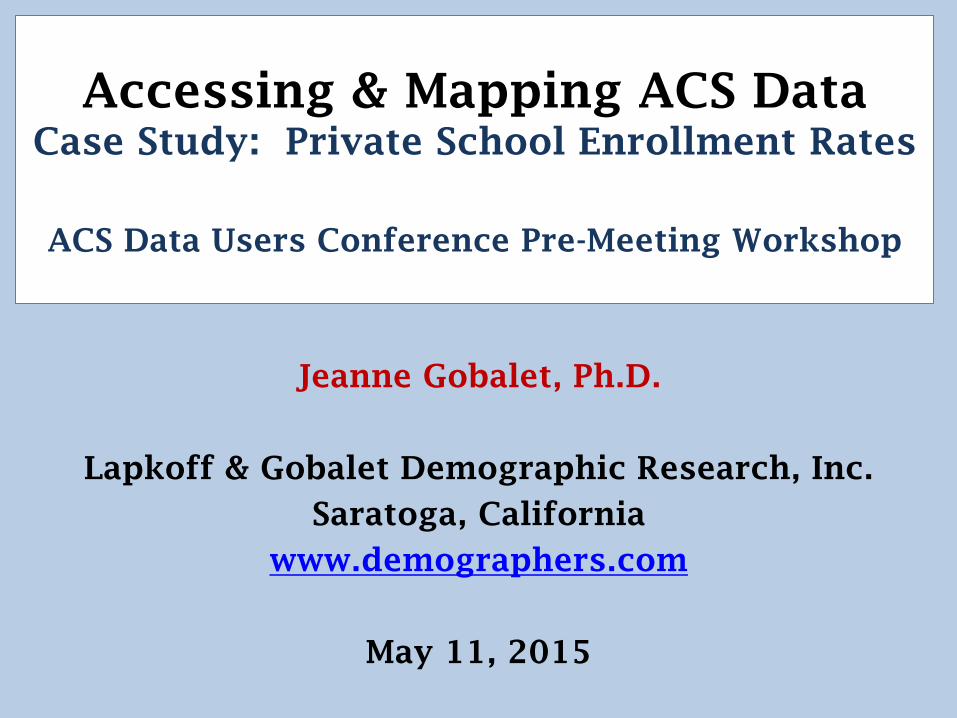
Agenda
• How to locate and download ACS
estimates
– Case Study: private school enrollment rates in
three California K-12 school districts
• Preparing data for mapping
• Mapping example
• Conclusions
2
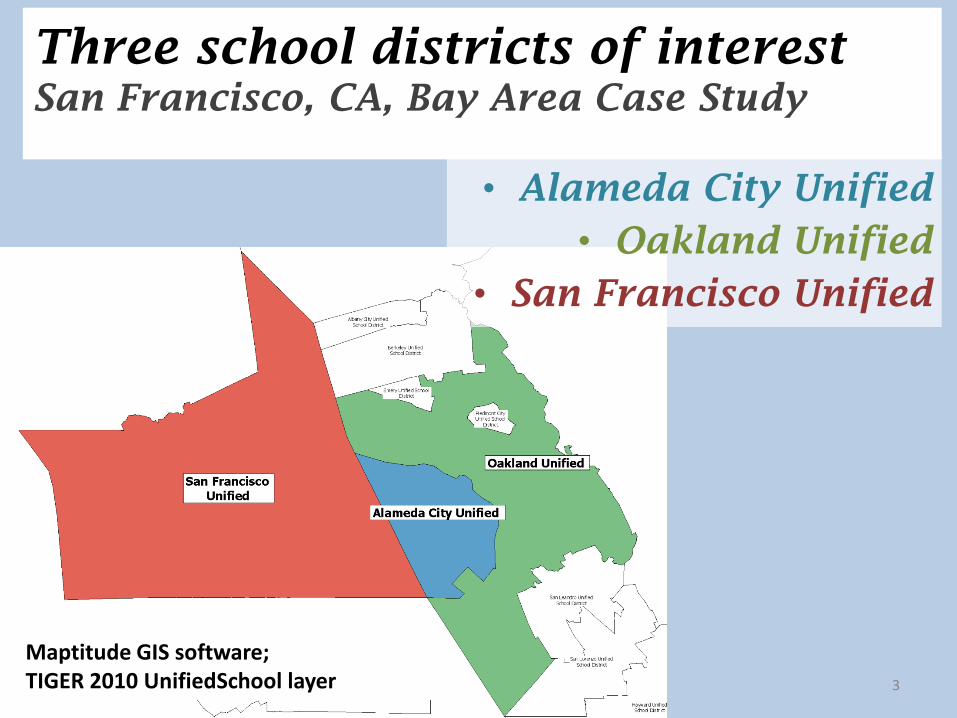
Three school districts of interest
San Francisco, CA, Bay Area Case Study
• Alameda City Unified
• Oakland Unified
• San Francisco Unified
Maptitude GIS software; TIGER 2010 UnifiedSchool layer 3
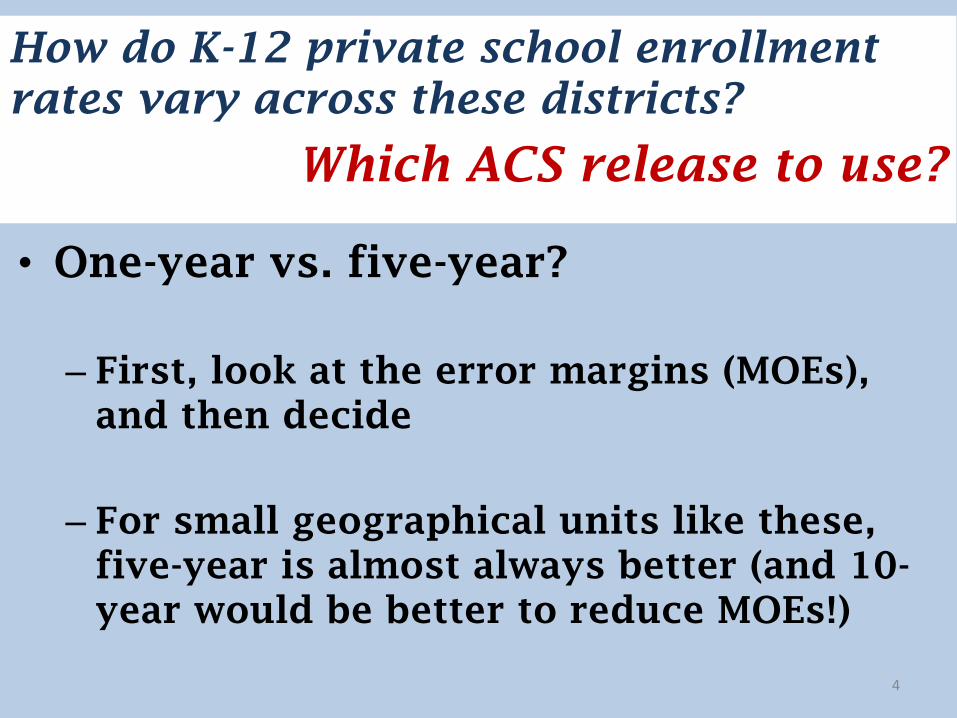
How do K-12 private school enrollment
rates vary across these districts?
Which ACS release to use?
• One-year vs. five-year?
– First, look at the error margins (MOEs),
and then decide
– For small geographical units like these,
five-year is almost always better (and 10-
year would be better to reduce MOEs!)
4
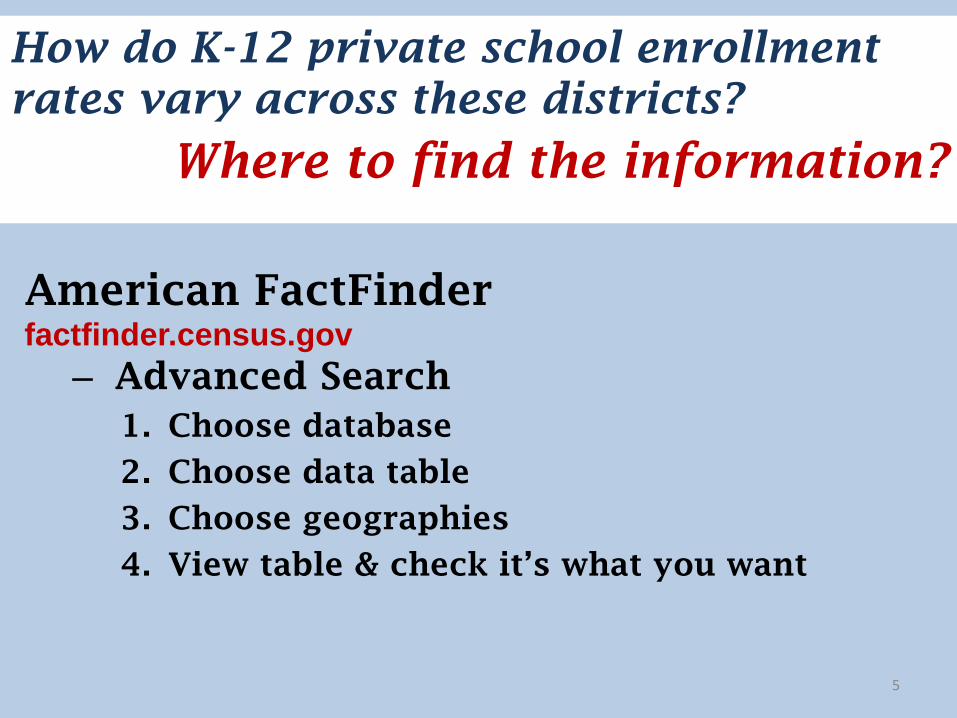
How do K-12 private school enrollment
rates vary across these districts?
Where to find the information?
American FactFinder
factfinder.census.gov
– Advanced Search
1. Choose database
2. Choose data table
3. Choose geographies
4. View table & check it’s what you want
5
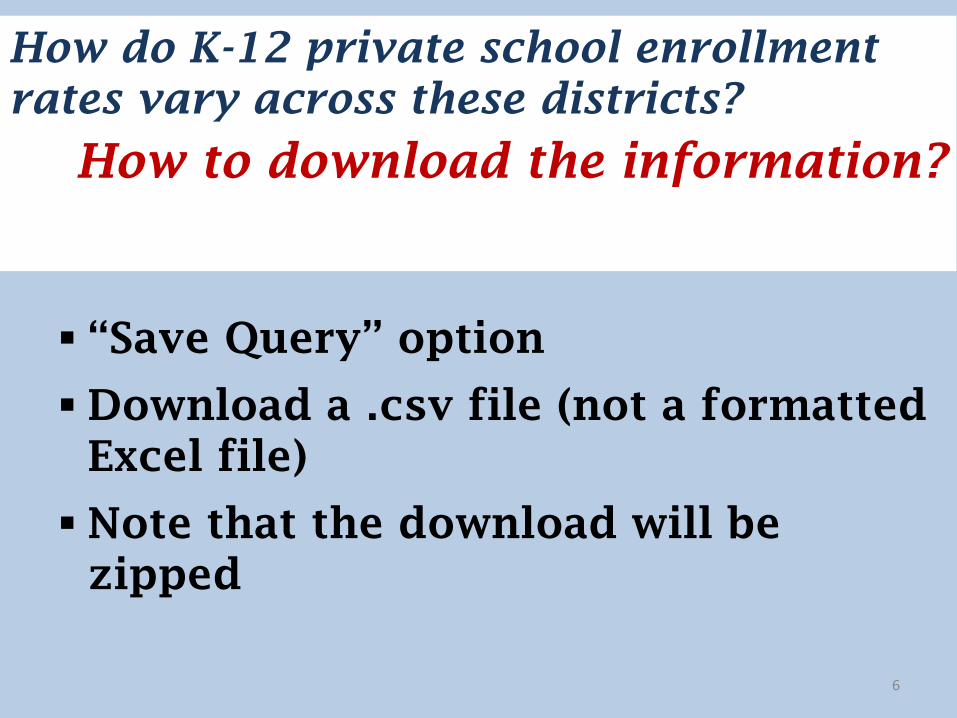
How do K-12 private school enrollment
rates vary across these districts?
How to download the information?
“Save Query” option
Download a .csv file (not a formatted
Excel file)
Note that the download will be
zipped
6
Web Break
American FactFinder
http://factfinder.census.gov/faces/nav/jsf/pages/index.xhtml
7
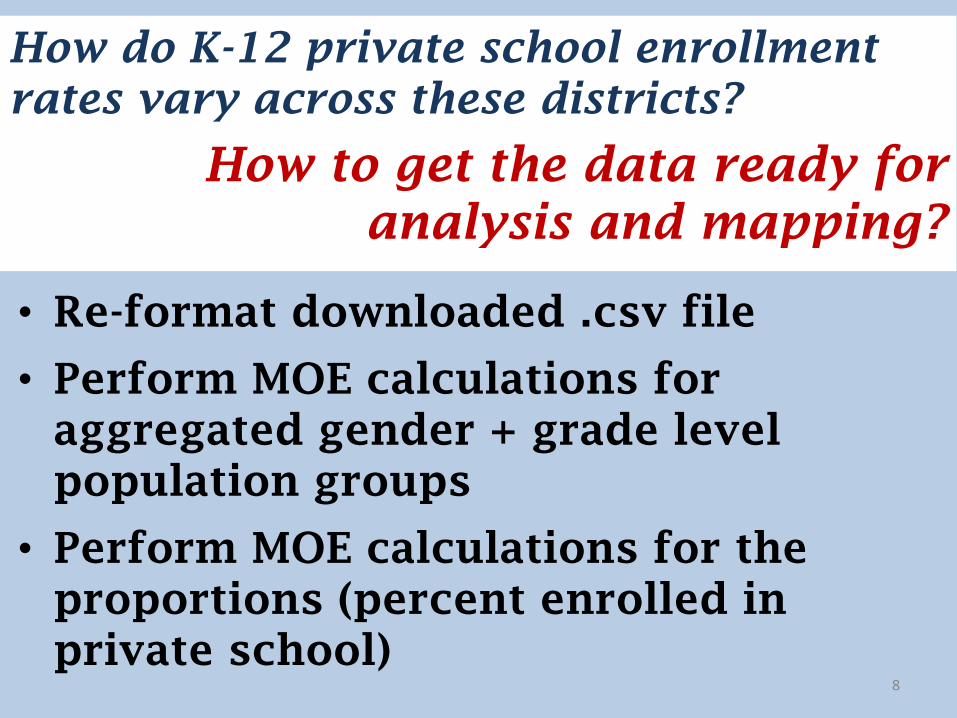
How do K-12 private school enrollment
rates vary across these districts?
How to get the data ready for
analysis and mapping?
• Re-format downloaded .csv file
• Perform MOE calculations for
aggregated gender + grade level
population groups
• Perform MOE calculations for the
proportions (percent enrolled in
private school)
8
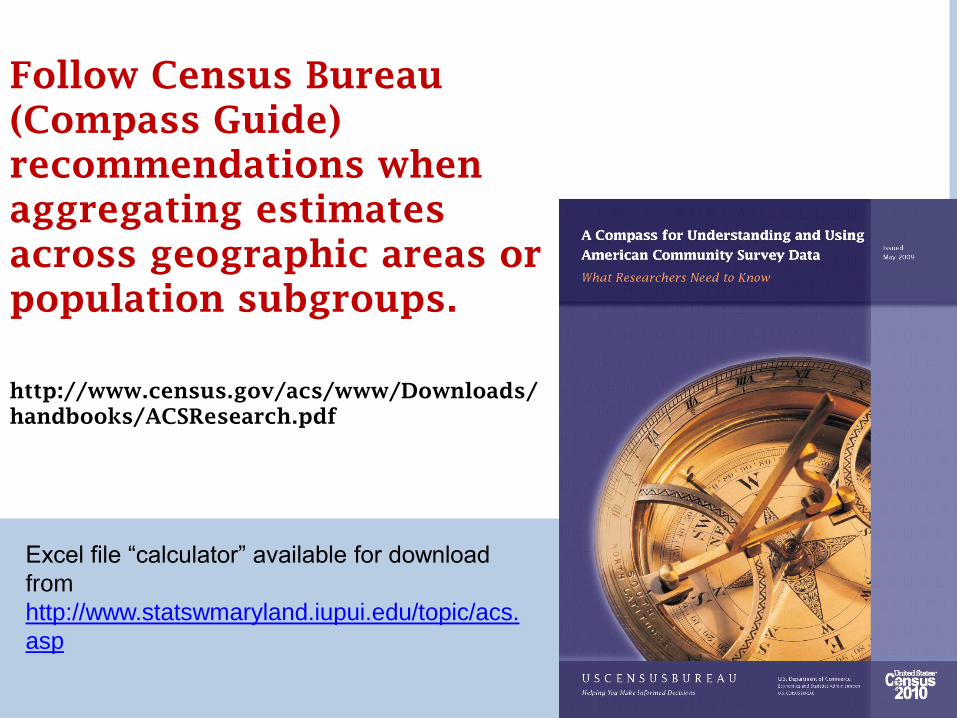
Follow Census Bureau
(Compass Guide)
recommendations when
aggregating estimates
across geographic areas or
population subgroups.
http://www.census.gov/acs/www/Downloads/
handbooks/ACSResearch.pdf
Excel file “calculator” available for download
from
http://www.statswmaryland.iupui.edu/topic/acs.
asp
9
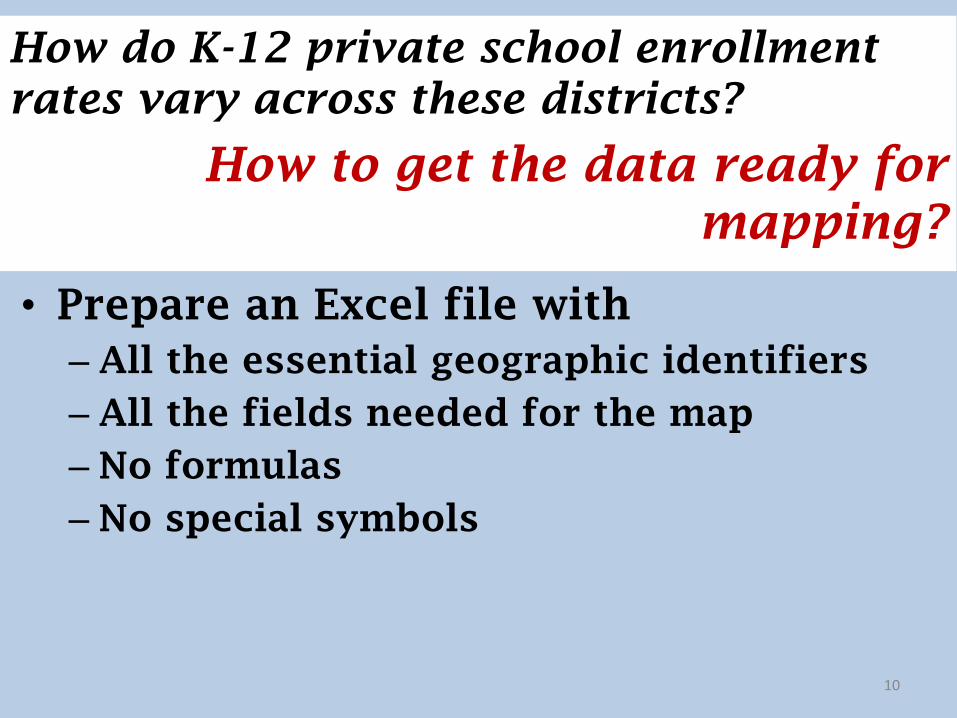
How do K-12 private school enrollment
rates vary across these districts?
How to get the data ready for
mapping?
• Prepare an Excel file with
– All the essential geographic identifiers
– All the fields needed for the map
– No formulas
– No special symbols
10
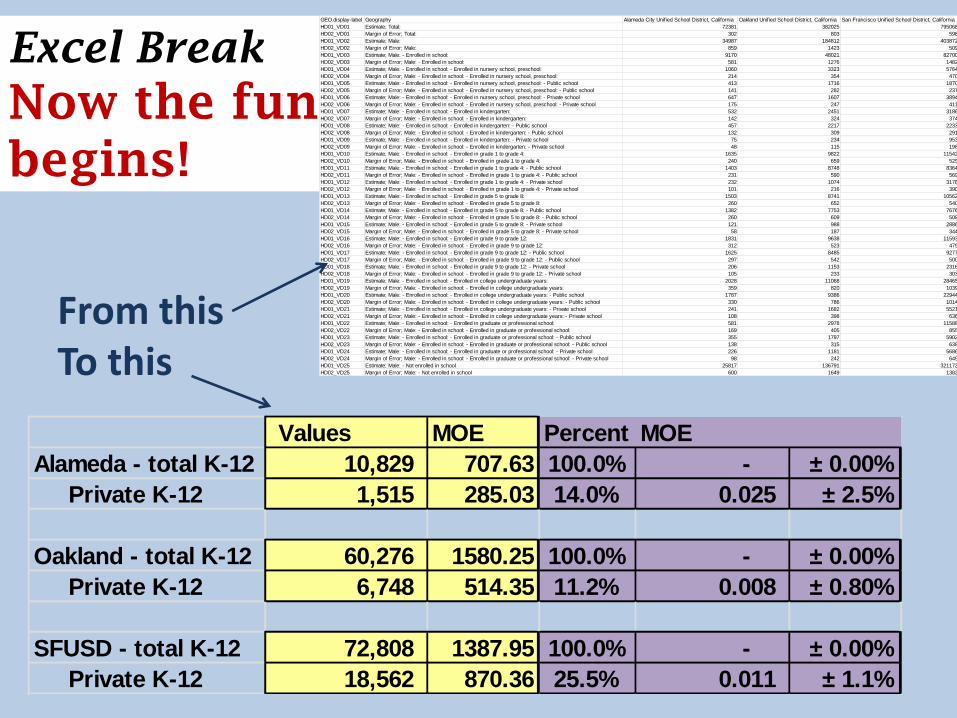
Excel Break
Now the fun
begins!
11
Values MOE Percent MOE
Alameda - total K-12 10,829 707.63 100.0% - ± 0.00%
Private K-12 1,515 285.03 14.0% 0.025 ± 2.5%
Oakland - total K-12 60,276 1580.25 100.0% - ± 0.00%
Private K-12 6,748 514.35 11.2% 0.008 ± 0.80%
SFUSD - total K-12 72,808 1387.95 100.0% - ± 0.00%
Private K-12 18,562 870.36 25.5% 0.011 ± 1.1%
GEO.display-label Geography Alameda City Unified School District, California Oakland Unified School District, California San Francisco Unified School District, California
HD01_VD01 Estimate; Total: 72381 382025 795068
HD02_VD01 Margin of Error; Total: 302 803 598
HD01_VD02 Estimate; Male: 34987 184812 403872
HD02_VD02 Margin of Error; Male: 859 1423 509
HD01_VD03 Estimate; Male: - Enrolled in school: 9170 48021 82700
HD02_VD03 Margin of Error; Male: - Enrolled in school: 581 1276 1482
HD01_VD04 Estimate; Male: - Enrolled in school: - Enrolled in nursery school, preschool: 1060 3323 5764
HD02_VD04 Margin of Error; Male: - Enrolled in school: - Enrolled in nursery school, preschool: 214 354 470
HD01_VD05 Estimate; Male: - Enrolled in school: - Enrolled in nursery school, preschool: - Public school 413 1716 1870
HD02_VD05 Margin of Error; Male: - Enrolled in school: - Enrolled in nursery school, preschool: - Public school 141 282 237
HD01_VD06 Estimate; Male: - Enrolled in school: - Enrolled in nursery school, preschool: - Private school 647 1607 3894
HD02_VD06 Margin of Error; Male: - Enrolled in school: - Enrolled in nursery school, preschool: - Private school 175 247 411
HD01_VD07 Estimate; Male: - Enrolled in school: - Enrolled in kindergarten: 532 2451 3186
HD02_VD07 Margin of Error; Male: - Enrolled in school: - Enrolled in kindergarten: 142 324 374
HD01_VD08 Estimate; Male: - Enrolled in school: - Enrolled in kindergarten: - Public school 457 2217 2233
HD02_VD08 Margin of Error; Male: - Enrolled in school: - Enrolled in kindergarten: - Public school 132 309 291
HD01_VD09 Estimate; Male: - Enrolled in school: - Enrolled in kindergarten: - Private school 75 234 953
HD02_VD09 Margin of Error; Male: - Enrolled in school: - Enrolled in kindergarten: - Private school 48 115 198
HD01_VD10 Estimate; Male: - Enrolled in school: - Enrolled in grade 1 to grade 4: 1635 9822 11542
HD02_VD10 Margin of Error; Male: - Enrolled in school: - Enrolled in grade 1 to grade 4: 240 659 529
HD01_VD11 Estimate; Male: - Enrolled in school: - Enrolled in grade 1 to grade 4: - Public school 1403 8748 8364
HD02_VD11 Margin of Error; Male: - Enrolled in school: - Enrolled in grade 1 to grade 4: - Public school 231 590 569
HD01_VD12 Estimate; Male: - Enrolled in school: - Enrolled in grade 1 to grade 4: - Private school 232 1074 3178
HD02_VD12 Margin of Error; Male: - Enrolled in school: - Enrolled in grade 1 to grade 4: - Private school 101 216 390
HD01_VD13 Estimate; Male: - Enrolled in school: - Enrolled in grade 5 to grade 8: 1503 8741 10562
HD02_VD13 Margin of Error; Male: - Enrolled in school: - Enrolled in grade 5 to grade 8: 260 652 540
HD01_VD14 Estimate; Male: - Enrolled in school: - Enrolled in grade 5 to grade 8: - Public school 1382 7753 7676
HD02_VD14 Margin of Error; Male: - Enrolled in school: - Enrolled in grade 5 to grade 8: - Public school 260 609 508
HD01_VD15 Estimate; Male: - Enrolled in school: - Enrolled in grade 5 to grade 8: - Private school 121 988 2886
HD02_VD15 Margin of Error; Male: - Enrolled in school: - Enrolled in grade 5 to grade 8: - Private school 58 187 344
HD01_VD16 Estimate; Male: - Enrolled in school: - Enrolled in grade 9 to grade 12: 1831 9638 11593
HD02_VD16 Margin of Error; Male: - Enrolled in school: - Enrolled in grade 9 to grade 12: 312 523 479
HD01_VD17 Estimate; Male: - Enrolled in school: - Enrolled in grade 9 to grade 12: - Public school 1625 8485 9277
HD02_VD17 Margin of Error; Male: - Enrolled in school: - Enrolled in grade 9 to grade 12: - Public school 297 542 500
HD01_VD18 Estimate; Male: - Enrolled in school: - Enrolled in grade 9 to grade 12: - Private school 206 1153 2316
HD02_VD18 Margin of Error; Male: - Enrolled in school: - Enrolled in grade 9 to grade 12: - Private school 105 233 303
HD01_VD19 Estimate; Male: - Enrolled in school: - Enrolled in college undergraduate years: 2028 11068 28465
HD02_VD19 Margin of Error; Male: - Enrolled in school: - Enrolled in college undergraduate years: 359 820 1039
HD01_VD20 Estimate; Male: - Enrolled in school: - Enrolled in college undergraduate years: - Public school 1787 9386 22944
HD02_VD20 Margin of Error; Male: - Enrolled in school: - Enrolled in college undergraduate years: - Public school 330 786 1014
HD01_VD21 Estimate; Male: - Enrolled in school: - Enrolled in college undergraduate years: - Private school 241 1682 5521
HD02_VD21 Margin of Error; Male: - Enrolled in school: - Enrolled in college undergraduate years: - Private school 108 398 636
HD01_VD22 Estimate; Male: - Enrolled in school: - Enrolled in graduate or professional school: 581 2978 11588
HD02_VD22 Margin of Error; Male: - Enrolled in school: - Enrolled in graduate or professional school: 169 405 855
HD01_VD23 Estimate; Male: - Enrolled in school: - Enrolled in graduate or professional school: - Public school 355 1797 5902
HD02_VD23 Margin of Error; Male: - Enrolled in school: - Enrolled in graduate or professional school: - Public school 138 315 638
HD01_VD24 Estimate; Male: - Enrolled in school: - Enrolled in graduate or professional school: - Private school 226 1181 5686
HD02_VD24 Margin of Error; Male: - Enrolled in school: - Enrolled in graduate or professional school: - Private school 98 242 649
HD01_VD25 Estimate; Male: - Not enrolled in school 25817 136791 321172
HD02_VD25 Margin of Error; Male: - Not enrolled in school 600 1649 1382
From this To this
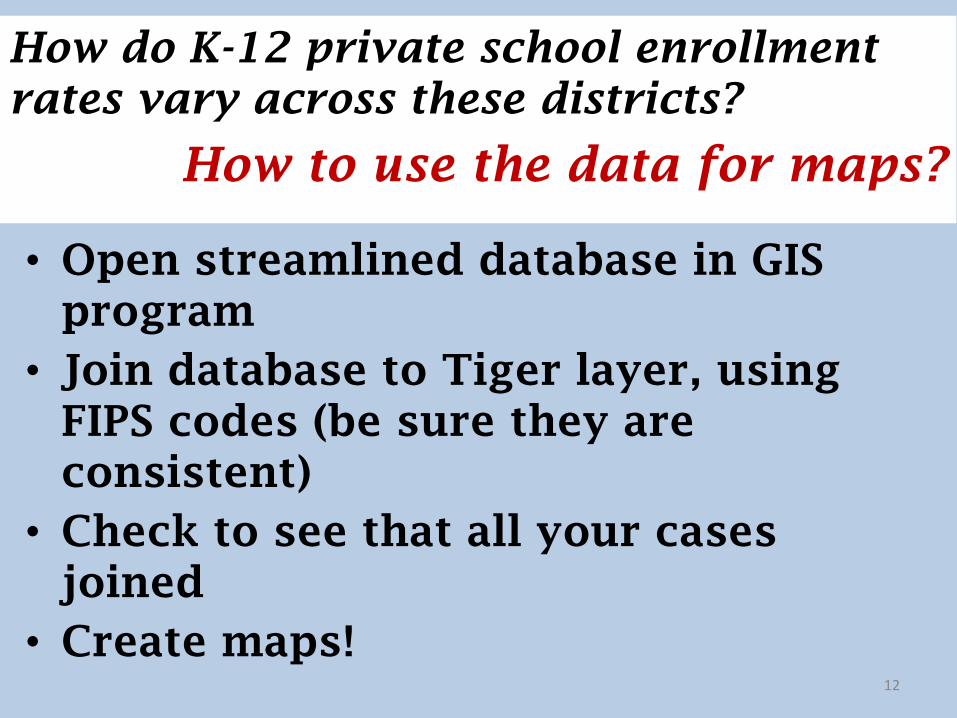
How do K-12 private school enrollment
rates vary across these districts?
How to use the data for maps?
• Open streamlined database in GIS
program
• Join database to Tiger layer, using
FIPS codes (be sure they are
consistent)
• Check to see that all your cases
joined
• Create maps!
12
GIS Break
13
14
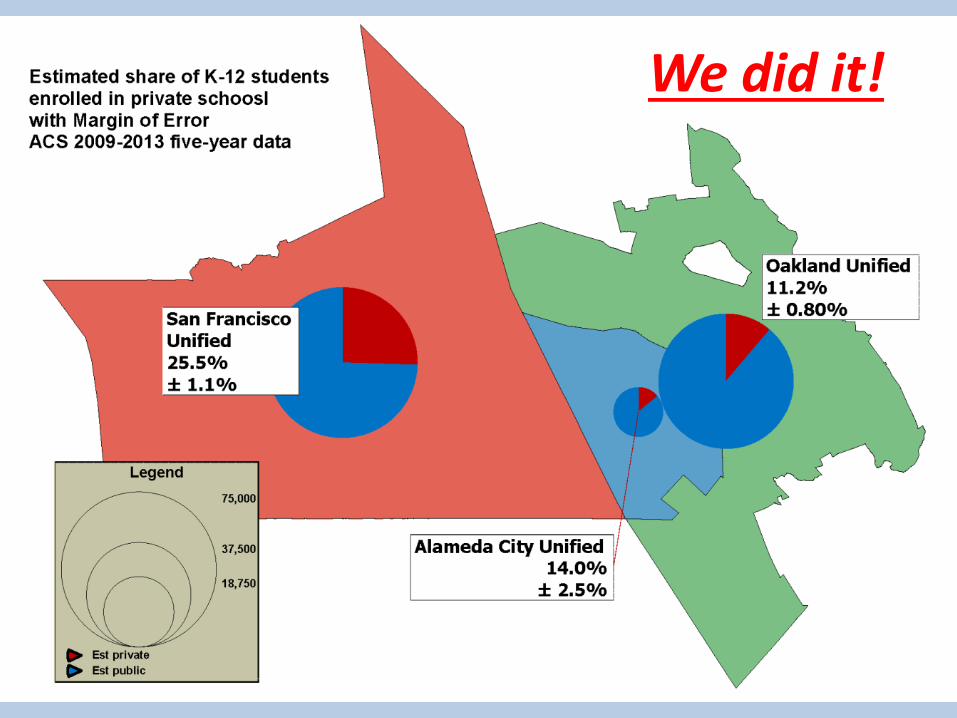
We did it!
Conclusions
ACS estimates can be downloaded from
American FactFinder and then mapped.
But it’s really complicated to use the ACS
estimates properly if you’re going to
combine population groups or geographies
(and even if you’re not).
Jeanne Gobalet
Lapkoff & Gobalet Demographic
Research, Inc.
www.demographers.com
15