Embed Size (px)
Citation preview
Journal of Public Economics 89 (2005) 761ndash796
wwwelseviercomlocateeconbase
Accountability incentives and behavior the impact
of high-stakes testing in the Chicago Public Schools
Brian A Jacob
Harvard University and NBER John F Kennedy School of Government 79 JFK Street
Cambridge MA 02138 United States
Received 22 January 2004 received in revised form 26 August 2004 accepted 26 August 2004
Available online 5 November 2004
Abstract
The recent federal education bill No Child Left Behind requires states to test students in grades 3
to 8 each year and to judge school performance on the basis of these test scores While intended to
maximize student learning there is little empirical evidence about the effectiveness of such policies
This study examines the impact of an accountability policy implemented in the Chicago Public
Schools in 1996ndash1997 Using a panel of student-level administrative data I find that math and
reading achievement increased sharply following the introduction of the accountability policy in
comparison to both prior achievement trends in the district and to changes experienced by other
large urban districts in the mid-west However for younger students the policy did not increase
performance on a state-administered low-stakes exam An item-level analysis suggests that the
observed achievement gains were driven by increases in test-specific skills and student effort I also
find that teachers responded strategically to the incentives along a variety of dimensionsmdashby
increasing special education placements preemptively retaining students and substituting away from
low-stakes subjects like science and social studies
D 2004 Elsevier BV All rights reserved
JEL classification I20 I28 J24
Keywords Accountability Incentives Student achievement
0047-2727$ -
doi101016j
Tel +1
E-mail add
see front matter D 2004 Elsevier BV All rights reserved
jpubeco200408004
617 384 7968
ress brian_jacobharvardedu
BA Jacob Journal of Public Economics 89 (2005) 761ndash796762
1 Introduction
In January 2002 President Bush signed the No Child Left Behind Act of 2001
(NCLB) ushering in a new era of educational accountability NCLB strengthens a
movement toward accountability in education that has been gathering momentum for
nearly a decade Statutes in 25 states now explicitly link student promotion or
graduation to performance on state or district assessments while 18 states reward
teachers and administrators on the basis of exemplary student performance and 20
states sanction school staff on the basis of poor student performance (Quality Counts
2002) Indeed accountability policies dwarf all other education reforms in scope For
example of the nearly 53 million children attending elementary and secondary
schools in the country only 60000 used vouchers to attend a private school and
580000 others attended a charter school (Howell and Peterson 2002 CER 2002)
whereas the accountability program in Texas alone impacts approximately 36 million
students and the policies in Chicago and New York City affect an additional 15
million students
The notion behind test-based accountability is that it will provide students teachers
and administrators an incentive to work harder as well as help identify struggling
students and schools Advocates claim that accountability will improve student
performance by raising motivation increasing parent involvement and improving
curriculum and pedagogy Economic theory however suggests that high-powered
incentives may lead to unwanted distortions For example Holmstrom and Milgrom
(1991) show that incentive schemes based on objective criteria will lead agents to focus
on the most easily observable aspects of a multi-dimensional task Based on similar
logic critics have argued that such policies will cause teachers to shift resources away
from low-stakes subjects neglect infra-marginal students and ignore critical aspects of
learning that are not explicitly tested
Despite its increasing popularity within education there is little empirical evidence
on test-based accountability (also referred to as high-stakes testing) This paper seeks
to fill the gap by examining a test-based accountability policy that was implemented
in Chicago Public Schools (ChiPS) in 1997 The ChiPS is an excellent case study for
several reasons First Chicago was one of the first large urban districts to implement
high-stakes testing allowing one to track student outcomes for up to 4 years Second
detailed student level data is available for all ChiPS students with unique student
identification numbers that allow one to track individual students over time examine
a variety of outcomes and explore the heterogeneity of effects across various
subgroups Third the Chicago policy resembles accountability programs being
implemented throughout the country incorporating incentives for both students and
teachers
I explore three fundamental questions about the ways in which students and
teachers responded to the accountability policy (1) Does high-stakes testing increase
student achievement (2) If so what factors are driving the improvements in
performance Critics of test-based accountability often argue it will simply increase
test-preparation activities thus improving test-specific skills at the expense of more
general skills and producing achievement gains that do not generalize to alternative
BA Jacob Journal of Public Economics 89 (2005) 761ndash796 763
outcome measures1 (3) Do teachers and administrators respond strategically to high-
stakes testing Accountability policies provide an incentive for teachers to de-emphasize
subjects not included in the accountability program and to exclude low-ability students
from the official test-taking pool (perhaps by placing them in special education or bilingual
programs or encouraging them to stay home on the day of the exam)
I find that math and reading scores on the high-stakes exam increased sharply following
the introduction of the accountability policy These gains were substantially larger than
would have been predicted by prior achievement trends in Chicago and were substantially
larger than the achievement changes experienced by other urban districts in Illinois and in
other large mid-western cities Moreover the pattern of achievement gains is consistent
with the incentives provided by the policy with low-achieving schools showing
substantially larger gains than other schools However for younger students the policy
did not increase performance on a state-administered low-stakes exam suggesting that the
achievement gains may have been driven by an increase in skill emphasized
predominantly on the high-stakes exam An item-level analysis provides additional
evidence that achievement gains were driven in large part by increases in test-specific
skills and student effort Finally the results suggest that teachers responded strategically to
the incentives along a variety of dimensionsmdashby increasing special education placements
preemptively retaining students and substituting away from low-stakes subjects like
science and social studies
These findings provide strong empirical support for general incentive theories
particularly the notion of multi-tasking (Holmstrom and Milgrom 1991) Moreover the
fact that the effects appear more robust for older students (for whom the individual
incentives were greatest) suggests that student-oriented accountability may be an
important complement to school-oriented accountability policies Overall these results
suggest that high-stakes testing has the potential to improve student learning but may also
lead to some undesired strategic responses on the part of teachers including a narrowing of
teaching to focus on the set of skills emphasized on the high-stakes test
The remainder of this paper is organized as follows Section 2 reviews the existing
literature on high-stakes testing and provides some background on the Chicago policy
Section 3 discusses the empirical strategy and Section 4 describes the data Sections 5ndash7
present the main findings and Section 8 concludes
2 Background
21 Prior research on high-stakes testing
The evidence on school-based accountability programs and student performance is
decidedly mixed Several studies of high school graduation exams have found a
1 Achievement gains may also be due to increases in cheating on the part of students teachers or
administrators While Jacob and Levitt (2003) found that instances of classroom cheating increased substantially
following the introduction of high-stakes testing in Chicago they estimate that cheating increases could only
explain an extremely small part of the test score gains since 1996ndash1997
BA Jacob Journal of Public Economics 89 (2005) 761ndash796764
positive association between student achievement and such exams (Bishop 1998
Frederisksen 1994 Neill and Gayler 1998 Winfield 1990) but studies with better
controls for prior student achievement find no achievement effects (Jacob 2001)
Richards and Sheu (1992) found modest improvements in student achievement after the
implementation of a school-based accountability policy in South Carolina in 1984 but
Ladd (1999) found that a school-based accountability program in Dallas during the
early 1990s had few achievement benefits (see also Clotfelter and Ladd 1996) Smith
and Mickelson (2000) found that a similar program in Charlotte-Mecklenburg did not
increase the academic performance of students relative to the state average Several
studies note that Texas students have made substantial achievement gains since the
implementation of that statersquos accountability program (Grissmer and Flanagan 1998
Grissmer et al 2000 Haney 2000 Klein et al 2000 Toenjes et al 2000 Deere and
Strayer 2001)
In contrast to the mixed findings regarding achievement effects there is a growing
body of evidence that educators respond strategically to test-based accountability Figlio
and Getzler (2002) and Cullen and Reback (2002) find that schools respond to
accountability policies by classifying more students as special needs or limited English
proficient (LEP) thereby removing them from the test-taking pool Koretz and Barron
(1998) find survey evidence that elementary teachers in Kentucky shifted the amount of
time devoted to math and science across grades to correspond with the subjects tested in
each grade Deere and Strayer (2001) found evidence that Texas schools have substituted
across outputs in the face of the Texas Assessment of Academic Skills (TAAS) system
focusing on high-stakes subjects and low-achieving students2 Various studies suggest
that test preparation associated with high-stakes testing may artificially inflate achieve-
ment producing gains that are not generalizable to other exams (Linn et al 1990
Shepard 1990 Koretz et al 1991 Koretz and Barron 1998 Stecher and Barron 1999
Klein et al 2000)
22 High-stakes testing in Chicago
In 1996 the ChiPS introduced a comprehensive accountability policy designed to
raise academic achievement The first component of the policy focused on holding
students accountable for learning by ending a practice commonly known as bsocialpromotionQ whereby students are advanced to the next grade regardless of ability or
achievement level Under the new policy students in third sixth and eighth grades are
required to meet minimum standards in reading and mathematics on the Iowa Test of
Basic Skills (ITBS) in order to advance to the next grade3 Students who do not meet
the standard are required to attend a 6-week summer school program after which they
2 Deere and Strayer (2001) focus on TAAS gains though Grissmer and Flanagan (1998) make a similar point
regarding NAEP gains3 The social promotion policy was actually introduced in Spring 1996 for eighth grade students although it is
not clear how far in advance students and teachers knew about this policy In general the results presented here
remain the same whether one considers the eighth grade policy to have been implemented in 1996 or 1997 Thus
for simplicity I use 1997 as the starting point for all grades
BA Jacob Journal of Public Economics 89 (2005) 761ndash796 765
retake the exams Those who pass move on to the next grade those who fail this second
exam are required to repeat the grade Note that eighth graders who failed to meet the
promotional requirements were not able to graduate elementary school and move with
their cohort to high school Conversations with students and teachers indicate that this
provided eighth grade students with a particularly strong incentive to improve their
achievement
In conjunction with the social promotion policy the ChiPS also instituted a policy
designed to hold teachers and schools accountable for student achievement Under this
policy schools in which fewer than 15 of students scored at or above national norms
on the ITBS reading exam were placed on probation If they did not exhibit sufficient
improvement these schools could be reconstituted which involved the dismissal or
reassignment of teachers and school administrators In 1996ndash1997 71 elementary
schools serving over 45000 students were placed on academic probation4 While ChiPS
has only recently closed any elementary schools teachers and administrators in
probation schools as early as 1997 reported being extremely worried about their job
security and staff in other schools reported a strong desire to avoid probation (Jacob
et al 2004) An early analysis of the policy indicated large achievement gains
(Roderick et al 2002) but some subsequent analyses have cast doubt on these
findings (Bryk 2003)5
3 Empirical strategy
While the Chicago school reforms are by no means a clean experiment they do
provide distinct policy changes that one can exploit to examine the impact of test-based
accountability It is useful to begin by considering exactly how the Chicago policies may
have affected student achievement The first type of treatment involves the incentives
provided by the existence of sanctions for poor performance For example one might
believe that the prospect of sanctions (ie summer school andor retention for students
and probation for schools) for low performance may lead to higher achievement by
increasing student effort raising parent participation or improving curriculum and
pedagogy The second type of treatment involves the sanctions themselves One might
think for example that attending summer school or repeating a grade may influence an
individual studentrsquos performance just as receiving services under probation may improve
a schoolrsquos aggregate achievement
4 Probation schools received some additional resources and were more closely monitored by ChiPS staff5 The findings presented in this paper are consistent with Roderick et al (2002) which finds a positive impact
of the Chicago policy on ITBS scores but different from Bryk (2003) which finds less evidence of ITBS effects
Jacob (2003) explores several potential explanations for the differences among these papers While differences in
sample time period and estimation may explain some of the difference it is likely that the difference is driven by
the fact that Bryk (2003) includes a control for prior achievement with a one-year lag As explained in footnote 10
in this paper when examining later cohorts this specification bover-controlsQ insofar as these prior achievement
scores may themselves have been influenced by the accountability policy For this reason the results presented in
Bryk (2003) do not capture the bfullQ effect of the accountability policy
BA Jacob Journal of Public Economics 89 (2005) 761ndash796766
This analysis focuses on the effect of the incentives both because prior research
suggests that the sanctions themselves had little impact on student performance (Jacob and
Lefgren 2004ab) and because this allows the cleanest analysis6 Still there are several
challenges to identifying the causal impact of the incentives First one might be worried
that the composition of students has changed substantially during the period in which the
policy was implemented (eg influx of immigrants return of middle-class to the public
schools) Second one might be concerned about changes at the state or national level that
occurred at the same time as the policy (eg state of federal policies to reduce class size or
mandate higher quality teachers improvements in the economy) Finally one might be
worried about other policies or programs in Chicago whose impact was felt at the same
time as high-stakes testing7
To address these challenges I employ two complementary strategies First I use
longitudinal student-level data from Chicago to examine changes in achievement for
various groups of students following the introduction of the policy Second I use a panel
of district-level data to compare achievement trends in Chicago to those in other large
mid-western cities that did not institute comparable accountability policies over this time
period I focus primarily on students in the grades 3 6 and 8 (ie the bgate-keepingQgrades where students were subject to the individual promotion incentives) The
estimates should thus be interpreted as the combined effect of the student-level
promotion incentive as well as the school-level accountability incentive While one
would ideally like to disentangle these effects the compositional changes in non-gate
grades (ie 4 5 and 7) make a rigorous comparison of student versus school-level
incentives difficult8
The availability of longitudinal student-level data allows me to overcome many of the
threats to identification I am able to control for observable changes in student composition
by including a rich set of student school and neighborhood characteristics Moreover
because achievement data is available back to 1990 (6 years prior to the introduction of the
policy) I am also able to account for pre-existing achievement trends within the ChiPS I
will look for a sharp increase in achievement (a break in trend) following the introduction
of high-stakes testing as evidence of a policy effect This short interrupted time-series
design accounts for changes in observable characteristics as well as any unobservable
changes that would have influenced student achievement in a gradual continuous manner
6 Jacob and Lefgren (2004b) examined the resource and monitoring effects of probation using a regression
discontinuity design that compared the performance of students in schools that just made the probation cutoff with
those that just missed the cutoff They found that the additional resources and monitoring provided by probation
had no impact on math or reading achievement Using a similar identification strategy that compared students on
either side of the cutoff for promotion Jacob and Lefgren (2004a) found that the summer school and retention
programs had a modest positive effect for third graders that faded over time but no effect for sixth graders7 This includes programs implemented at the same time as high-stakes testing as well as programs
implemented earlier whose effects are manifest at the same time as the accountability policy was instituted (eg
an increase in full-day kindergarten that began during the early 1990s)8 Because the lowest-achieving third and sixth graders were retained beginning in 1997 the subsequent
cohorts in grades 4 5 and 7 will be composed of substantially higher-achieving students Moreover many of the
fourth fifth and seventh graders in the later cohorts will have attended summer school which may have
influenced subsequent student performance particularly in the case of students attending summer school in the
third grade
BA Jacob Journal of Public Economics 89 (2005) 761ndash796 767
(Ashenfelter 1978)9 Note that this is essentially a difference-in-difference estimator
where the first difference is a student-level gain (due to the controls for prior achievement)
and the second difference is the change in Chicago from pre-policy to post-policy The size
and scope of the accountability policy in Chicago mitigates concern about other district-
wide programs that might have been implemented at the same time as HST10
Specifically I will estimate the following regression model separately for each grade
and subject
yist frac14 HS1tTHORNd1thorn HS2tTHORNd2thorn HS3tTHORNd3thorn HS4tTHORNd4thorn YeartTHORNcthornXistb1thornZstb2thorn eistethethethethetheth1THORN
where y is an achievement score for individual i in school s in year (cohort) t X is a vector
of student characteristics Z is a vector of school and neighborhood characteristics Year
serves as a linear time trend HS1ndashHS4 are binary variables indicating the 4 years following
the introduction of high-stakes testing and e is a stochastic error term The inclusion of
separate indicators for each post-policy year not only ensures that the linear trend is only
estimated off of pre-policy data but also allows me to trace out the effect of the policy over
time The covariates include not only student school and neighborhood demographic
characteristics but also measures of prior student achievement in both reading and math11
The drsquos in Eq (1) reflect the average effect of the accountability policy in each year
Insofar as the incentives may be more or less binding for students at different
9 The inclusion of a linear trend implicitly assumes that any previous reforms or changes would have
continued with the same marginal effectiveness in the future If this assumption is not true the estimates may be
biased In addition this aggregate trend assumes that there are no school-level composition changes in Chicago I
test this assumption by including school-specific fixed effects and school-specific trends in certain specifications
and find comparable results10 While there were smaller programs introduced in Chicago after 1996 these were generally part (or a direct
result) of the accountability policy The only significant and distinct programspolicies introduced at roughly the
same time as high-stakes testing were a large program of school construction and capital improvement and a
modest salary increase for teachers as part of contract renegotiations (a 7 real salary increase for elementary
teachers from 1995 to 2000) While there is little evidence to suggest that such factors influence student
achievement I will not be able to separately identify these effects from the effect of high-stakes testing11 Specifically the covariates include age race gender racegender interactions guardian bilingual status
special education placement prior math and reading achievement school demographics (including enrollment
racial composition percent free lunch percent with limited English proficiency and mobility rate) demographic
characteristics of the studentTs home census tract (including median household income crime rate percent of
residents who own their own homes percent of female-headed household mean education level unemployment
rate percent below poverty percent managers or professionals and percent who are living in the same house for 5
years) and indicators of the form of the exam given in a particular year (to account for differences in difficulty
across forms) Prior achievement is measured by math and reading scores 3 years prior to the base year (ie at
t3) I include third order polynomials in prior both math and reading prior achievement in order to account for
any non-linear relationship between past and current test scores (Students begin testing in first or second grade
so test scores at t3 are not available for third graders For this grade I use second grade test scores as a measure
of prior achievement although using first grade scores yields comparable results) Prior achievement at t3 is
used to ensure that the prior achievement measures are not endogenousmdashthat is taken after the introduction of the
accountability policy For example because the 1999 cohort of sixth graders experienced high-stakes testing
beginning in 1997 one would not want to include their fourth or fifth grade scores in the estimation (For the
2000 cohort test scores at t3 are endogenous as well As a practical matter however it does not appear to make
any difference whether one uses prior achievement at t3 or t4 so I have used t3 in order to include as many
cohorts as possible)
BA Jacob Journal of Public Economics 89 (2005) 761ndash796768
achievement levels however the effects may vary considerably To capture this type of
interaction I estimate specifications such as
yist frac14 HSt4Lowiseth THORNd1 thorn Lowiseth THORNd2 thorn HSteth THORNd3 thorn Yeart4Lowiseth THORNc1 thorn Yearteth THORNc2thorn Xistb1 thorn Zstb2 thorn eist eth2THORN
where HS is an indicator for a high-stakes (ie post-policy) year and Low is an
indicator that takes on a value of one for studentrsquos with low achievement prior to the
introduction of the accountability policy12
An additional concern involves selective attrition Some students do not take the
achievement test because they are absent on the exam day or because they are exempt from
testing due to placement in certain bilingual or special education programs Other students
in bilingual or special education programs are required to take the exam but their scores are
not reported meaning that they are not subject to the social promotion policy and their
scores do not contribute to the determination of their schoolrsquos probation status While there
was no change in the proportion of students tested following the introduction of the
accountability policy there was a slight increase in the percent of students whose scores
were excluded for official reporting purposes an issue explored in detail in Section 713
Insofar as these students have low unobserved ability estimates based on the sample of
students who were tested and whose scores were reported might be biased upward
Fortunately I have data on all students who were tested (not simply those whose scores
were included for official reporting purposes) allowing me to account for any non-random
selection out of the reporting pool Estimates shown in Table 4 indicate identical results
regardless of whether one uses all tested students or only those whose scores were reported
A related concern involves the impact of grade retention Following the
introduction of the policy to end social promotion roughly 7ndash15 of the lowest-
achieving students in grades 3 6 and 8 were retained in grade which substantially
changed the student composition in these grades and will lead one to understate the
impact of the accountability policy For this reason the main estimates only include
students enrolled in their current grade for the first time although estimates
including retained students yield qualitatively similar findings (see Table 4)1415 In
12 In practice I also estimate models that allow for differential effects by school-level achievement If one
believes that the policy should have no impact on high-achieving students or schools the coefficient d1 in Eq (2)
may be interpreted as the causal impact of the policy (ie the third difference estimator) However for reasons
discussed below there are reasons to believe that the policy may have influenced all students to a certain degree
so these estimates will be interpreted simply as capturing the heterogeneity of treatment effects13 There is no significant change in the percent of students leaving the ChiPS (to move to other districts to
transfer to private schools or to drop out of school) following the introduction of the accountability policy14 Note that I do not completely exclude retained students from the analysis These students are included in
the sample when they were enrolled in the grade for the first time (eg a student who attended sixth grade in 1997
and 1998 would be included as part of the 1997 cohort but not the 1998 cohort)15 While focusing on first-timers allows a consistent comparison across time it is still possible that the
composition changes generated by the social promotion policy could have affected the performance of students in
later cohorts For example if first-timers in the 1998 and 1999 cohorts were in classes with a large number of low-
achieving students who had been retained in the previous year they might perform lower than otherwise
expected This would bias the estimates downward
BA Jacob Journal of Public Economics 89 (2005) 761ndash796 769
addition the main estimates include controls for student age to account for prior grade
retention (in non-gate grades) which appears to have increased slightly under the
accountability policy16
One drawback to this interrupted time-series strategy is that it does not account for
time-varying effects that would have influenced student achievement in a sharp or
discontinuous manner One might be particularly concerned about unobservable changes
on the state or national level effecting student performance For example the National
Assessment of Educational Progress (NAEP) indicates that student achievement nation-
wide increased roughly 025 standard deviations in math during the 1990s although there
was no gain in reading17 Also if there is substantial heterogeneity in the responses to the
policy then the achievement changes may appear more gradual and be harder to
differentiate from other trends in the system
I attempt to address these concerns using a panel of achievement data on other large
mid-western cities outside of Illinois (eg St Louis Milwaukee Cincinnati) (See
Appendix B for a more detailed description of this data) I estimate variations of the
following specification
ydt frac14 HS1teth THORNd1 thorn HS2teth THORNd2 thorn HS3teth THORNd3 thorn HS4teth THORNd4 thorn gd thorn dt thorn CZdt thorn edt eth3THORN
where y is the average reading or math score for district d at time t HS1ndashHS4 are binary
variables indicating the year following the introduction of high-stakes testing in Chicago
g are district fixed effects are district-specific linear time trends and Z is a vector of
time-varying district characteristics This too is essentially a difference-in-difference
estimator where the first difference is time (before vs after 1997 the year the
accountability policy was introduced in Chicago) and the second difference is a
comparison of districts (ie between Chicago and the control districts)18
4 Data
This study utilizes detailed student-record data from the ChiPS that includes student
identifiers that allow one to track individuals over time The primary measure of student
17 Authorrsquos calculation based on data available from the National Center of Education Statistics
(wwwncesedgov) using a weighted average of black white and Hispanic achievement to match the racial
composition in the ChiPS18 Bryk (2003) notes that the ChiPS has shifted testing dates to later in the school year over the past decade
which would bias the policy effect upward However an examination of the testing dates from 1990 to 2000
reveals that the largest shift took place from 1990 to 1992 and test dates have changed less than three weeks
during the period of this study (1993ndash2000) and have recently moved earlier in the school-year
16 The ChiPS has an open enrollment policy that permits within-district school choice for students (see
Cullen et al in press) While choice generally takes place at entry grades (kindergarten and ninth grade) one
might be concerned that the accountability policy increased student mobility which could influence the estimated
achievement effects relative to a system that does not permit school transfers In practice however it turns out
that student mobility rates did not increase substantially following the introduction of the accountability policy
(see also Jacob and Lefgren 2004b) and Eq (1) includes a school-level measure of student mobility to account
for any changes in mobility that did take place
BA Jacob Journal of Public Economics 89 (2005) 761ndash796770
achievement is the Iowa Test of Basic Skills (ITBS) a standardized multiple-choice
exam developed and published by the Riverside Company Student scores are
standardized (separately by grade using the 1993 student-level mean and standard
deviation) in order to compare results across grade level and interpret the magnitude of
the effects
The primary sample used in this analysis consists of students who were in third
sixth and eighth grade from 1993 to 2000 who were tested and whose scores were
reported As noted in the previous section for most analyses I limit the sample to
students enrolled in a grade for the first time In order to have sufficient prior
achievement data for all students I further limit the analysis to cohorts beginning in
1993 I delete observations with missing demographic information (b2 of the
sample) To avoid dropping students with missing prior achievement data I impute
prior achievement using other observable student characteristics and create a variable
indicating that the achievement data for that student was imputed 19 Finally note
that while the data set includes information on prior achievement scores for each student
the data is not structured as a student-level panel In other words the analysis file consists
of only one observation per student (see Appendix A for summary statistics on the
sample)
5 Did high-stakes testing increase student achievement in Chicago
If the accountability policy had a positive impact on student achievement we would
expect ITBS scores to increase starting in 1997 Fig 1 shows unadjusted math and reading
achievement trends in Chicago from 1990 to 2000 combining the data from grades 3 6
and 8 and standardizing student test scores using the 1990 student-level mean and
standard deviation Following a slight decline in the early 1990s test scores increased in
1993 and remained relatively constant until 1995 or 1996 after which they began to
increase20 To control for changes in student composition and prior achievement levels
Fig 2 plots the predicted versus observed achievement scores for successive cohorts of
Chicago students from 1993 to 2000 based on the model shown in Eq (1) The trends
suggest that neither observable changes in student composition nor pre-existing trends in
Chicago can explain the substantial improvement in student performance since 1997 By
2000 observed math and reading scores are roughly 030 and 020 standard deviations
higher than predicted
To provide a more precise estimate of the effects Table 1 presents OLS estimates
corresponding to Eq (1) Note first that the policy effect appears to be smaller for the first
19 Dropping students with missing prior achievement data yields comparable results20 The jump in 1993 is likely due to a new form of the ITBS introduced that year The ChiPS administered
several different forms of the ITBS throughout the 1990s rotating the forms so that identical forms were never
administered in 2 consecutive years I include form effects in the main estimates to account for this As an
additional robustness check I show that using only cohorts that took the same formmdash1994 1996 and 1998 or
1993 1995 and 2000mdashyields comparable results
Fig 1 Unadjusted ITBS achievement trends in Chicago 1990ndash2000 The sample includes 3rd 6th and 8th grade
students from 1990 to 2000 excluding retainees and students whose scores were not reported The scores are
standardized separately for each grade using the 1990 student-level mean and standard deviation
BA Jacob Journal of Public Economics 89 (2005) 761ndash796 771
cohort (the 1997 group) to experience accountability This is consistent with the fact that
the later cohorts experienced more of the btreatmentQ and with the possibility that students
and teachers may have become more efficient at responding to the policy over time It is
not possible to distinguish between these hypotheses because the policy was implemented
district-wide in 1996ndash1997 In addition it appears that the effects are somewhat larger for
math than reading This is consistent with a number of education evaluations that show
larger effects in math than reading presumably because reading achievement is
determined by a host of family and other non-school factors while math achievement is
determined largely by school21
While these estimates capture the combined effect of the student and school
incentives they do provide some indirect evidence on the relative importance of these
21 One additional factor is important to note in interpreting these results The estimates for the latter cohorts
may be biased because of compositional changes resulting from grade retention For example the 1999 and 2000
eighth grade cohorts will not include any students who were retained as sixth graders in 1997 or 1998 because
they will not have reached the eighth grade by this time (These students will be included in the sample when they
do enroll in this grade) To the extent that retention is correlated with unobservable student characteristics that
directly affect achievement this will bias the estimates This concern is mitigated in the case of Chicago because
retention was decided largely on the basis of an objective and observable test-score cutoff In fact Jacob and
Lefgren (2004a) found little difference between OLS and IV estimates of summer school and grade retention
suggesting that there may not be much significant correlation (conditional on prior achievement and other
observable characteristics) However even if they were not retained a proportion of the students in these cohorts
will have attended summer school as sixth graders which Jacob and Lefgren (2004a) show to increase subsequent
achievement Therefore it is best to interpret these coefficients for the later cohorts as upper bounds on the
incentive effect of the policy
Fig 2 Observed vs predicted achievement levels in Chicago 1993ndash2000 The sample includes 3rd 6th and 8th
grade students from 1993 to 2000 excluding retainees and students whose scores were not reported The scores
are standardized separately for each grade using the 1993 student-level mean and standard deviation The
predicted scores are derived from an OLS regression on pre-policy cohorts (1993 to 1996) that includes controls
for student school and neighborhood demographics as well as prior student achievement and a linear time trend
BA Jacob Journal of Public Economics 89 (2005) 761ndash796772
factors Table 1 suggests that the effects were considerably larger for eighth grade students
which is consistent with the fact that eighth graders faced the largest incentives (they
cannot move to high school with their peers if they fail to meet the promotional
Table 1
OLS estimates of ITBS math and reading achievement in Chicago
Dependent variable standardized ITBS score
Reading Math
3rd grade
2000 cohort 0186 (0033) 0263 (0037)
1999 cohort 0212 (0028) 0190 (0031)
1998 cohort 0173 (0019) 0213 (0021)
1997 cohort 0026 (0018) 0081 (0019)
6th grade
2000 cohort 0161 (0022) 0326 (0027)
1999 cohort 0118 (0018) 0154 (0023)
1998 cohort 0212 (0014) 0243 (0017)
1997 cohort 0085 (0012) 0088 (0014)
8th grade
2000 cohort 0240 (0024) 0459 (0026)
1999 cohort 0192 (0021) 0485 (0022)
1998 cohort 0197 (0015) 0306 (0015)
1997 cohort 0100 (0013) 0318 (0014)
Includes controls for demographics prior
achievement and pre-existing trends
Yes Yes
Includes students in the specified grades from 1993 to 2000 Control variables not shown include age race
gender racegender interactions guardian bilingual status special education placement prior math and reading
achievement school demographics (including enrollment racial composition percent free lunch percent with
limited English proficiency and mobility rate) demographic characteristics of the studentrsquos home census tract
(including median household income crime rate percent of residents who own their own homes percent of
female-headed household mean education level unemployment rate percent below poverty percent managers or
professionals and percent who are living in the same house for five years) and test form See text for details on the
exact specification Robust standard errors that account for the correlation of errors within schools are shown in
parentheses
BA Jacob Journal of Public Economics 89 (2005) 761ndash796 773
standards)22 To gain some additional insight on this matter one can focus on the first year
of the policy since it is not contaminated by compositional changes Doing so one finds
little difference in effects across grades 3ndash7 suggesting that for younger students the
student-oriented incentives had little impact23
To account for unobserved time-varying factors at the state andor national level one
can compare achievement trends in Chicago relative to other large mid-western cities Fig
3 shows that the Chicago and comparison group trends track each other remarkably well
from 1993 to 1996 and then begin to diverge in 1997 Math and reading achievement in the
23 An alternative explanation is that students in grades 4 5 and 7 incorrectly believed that they were subject
to the promotional requirements (see Roderick and Engel 2001) Another explanation rests on indivisibilities in
production within elementary schools Finally it is possible that the first year effects were somewhat anomalous
perhaps because students and teachers were still adjusting to the policy or because the form change that year may
have affected grades differentially
22 This result must be interpreted with caution since some observers have questioned whether the grade
equivalent metric can be compared across grades (Petersen et al 1989 Hoover 1984) Roderick et al (2002)
attempt to correct for this and find similar results
Fig 3 Achievement trends in Chicago vs other large urban school districts in the Midwest 1990ndash2000 The
achievement series for large Midwestern cities includes data for all tested elementary grades in Cincinnati Gary
Indianapolis St Louis and Milwaukee The sample includes all grades from 3 to 8 for which test score data was
available and only includes students whose tests scores were reported Test scores are standardized separately by
gradesubjectdistrict using the student-level mean and standard deviation for the earliest available year
BA Jacob Journal of Public Economics 89 (2005) 761ndash796774
Table 2
OLS estimates of achievement trends in Chicago and other mid-western cities
Independent variables Dependent variable standardized achievement score
Math Reading
Chicago 0039 (0056) 1794 (6303) 0048 (0034) 295 (3295)
1997ndash2000 0022 (0038) 0015 (0048) 0003 (0023) 0032 (0026)
Chicago(1997ndash2000) 0364 (0061) 0330 (0136) 0253 (0037) 0235 (0076)
Fixed effects for each district
and grade
Yes Yes Yes Yes
Pre-existing trends for Chicago
and other districts
No Yes No Yes
Number of observations 131 131 131 131
Observations are district-level averages by grade subject and year Scores are standardized using the mean and
standard deviation for the earliest available year for that grade and subject The comparison cities include
Cincinnati Gary Indianapolis Milwaukee and St Louis
BA Jacob Journal of Public Economics 89 (2005) 761ndash796 775
comparison districts fluctuates somewhat but remains relatively constant from 1996 to
2000 In contrast the achievement levels in Chicago rise sharply over this period Table 2
presents the OLS estimates from Eq (3) where the outcome measure is district-level
average achievement standardized using the student-level mean and standard deviation
from the earliest possible year for each gradesubjectdistrict These results suggest that
the accountability policy in Chicago increased student math achievement by roughly 033
standard deviations and reading achievement by 024 standard deviations
If the improvements in student achievement were caused by the accountability policy
one might expect them to vary across students and schools24 In particular one might
expect marginal students and schools to show the largest achievement gains since the
policy will be binding for them and they will likely feel that they have a reasonable chance
of meeting the standard To examine the heterogeneity of achievement effects Table 3
shows OLS estimates based on the specification in Eq (2) Prior student achievement is
based on the average math and reading score 3 years prior to the baseline test year (eg
fifth grade scores for the eighth grade cohorts)25 Prior school achievement is based on the
percent of students in the school in 1995 that met national norms on the reading exam26
25 Second grade test scores are used to determine prior achievement for third graders since this is the first year
that the majority of students take the standardized achievement exams
24 In order for teachers and administrators to translate these incentives into differential achievement effects
several conditions must hold First production must be divisible That is schools must be able to focus attention
on certain students and not others perhaps by providing individualized instruction If schools rely on class- or
school-wide initiatives such as curriculum changes test preparation or student motivation then they may not be
able to effectively target specific students Second the main effect of teacher or student effort must be large
relative to that of initial ability or the interaction between effort and initial ability If teacher effort has a
substantially larger effect on high ability students than low ability students then HST may result in larger gains
for higher ability students despite the structure of the incentives Finally schools must be able to clearly
distinguish between high and low ability students While this may seem trivial given the prevalence of
achievement testing in schools sampling variation and measurement error in achievement exams may expand the
group of students viewed as bmarginalQ by teachers and students
26 The results are robust to classifying school risk on the basis of achievement in other pre-policy years
Table 3
Heterogeneity of effects by student and school prior achievement
Independent variables Dependent variable ITBS scores
Math Reading
3rd grade 6th grade 8th grade 3rd grade 6th grade 8th grade
Model 1
High-stakes (HS) 0094
(0010)
0153
(0010)
0250
(0013)
0071
(0008)
0156
(0007)
0117
(0010)
Model 2
High-stakes (HS) 0070
(0019)
0036
(0018)
0142
(0019)
0008
(0017)
0038
(0015)
0015
(0015)
HS(studentb10th percentile) 0006
(0018)
0009
(0016)
0110
(0020)
0038
(0019)
0001
(0017)
0147
(0020)
HS(student in 10ndash25th percentile) 0007
(0015)
0027
(0012)
0005
(0013)
0032
(0014)
0035
(0013)
0145
(0013)
HS(student in 26ndash50th percentile) 0002
(0014)
0012
(0010)
0037
(0011)
0055
(0013)
0041
(0011)
0095
(0010)
HS(school had b20 students
above the 50th percentile)
0044
(0026)
0159
(0024)
0176
(0034)
0096
(0022)
0144
(0020)
0083
(0026)
HS(school had 20ndash40 students
above the 50th percentile)
0005
(0024)
0081
(0026)
0078
(0027)
0063
(0020)
0079
(0020)
0008
(0020)
The sample includes first-time included students in cohorts 1993ndash1999 for grades 3 and 6 and cohorts 1993ndash
1998 for grade 8 School prior achievement is based on 1995 reading scores Student prior achievement is based
on the average of a studentrsquos reading and math score 3 years earlier for grades 6 and 8 and 1 year earlier for grade
3 The control variables are the same as those used in Table 1 Robust standard errors that account for the
correlation of errors within school are shown in parentheses
BA Jacob Journal of Public Economics 89 (2005) 761ndash796776
The latest cohorts are excluded from the sample because these students will have
experienced previous retentions which may bias the results
Model 1 provides the average effect for all students in all of the post-policy cohorts
providing a baseline from which to compare the other results Model 2 shows how the
effects vary across student and school risk level Note that the omitted category includes
the highest ability students (those who scored above the 50th percentile in prior years) in
the highest achieving schools (schools where at least 40 of students were meeting
national norms in prior years) The prior achievement categories are chosen to roughly
correspond to the cutoffs for social promotion and probation although the results are
robust to changes in the category definitions
Looking across all grades and subjects several broad patterns become apparent First
students in low-performing schools seem to have fared considerably better under the
policy than comparable peers in higher-performing schools In sixth grade math for
example students in the schools where fewer than 20 of students had been meeting
national norms in previous years gained 0159 standard deviations more than comparable
peers in schools where over 40 of students had been meeting national norms This
makes sense since the accountability policy imposed much greater incentives on low-
performing schools that were at a real risk of probation
Table 4
Sensitivity analysis
Specification Dependent variable
ITBS math score ITBS reading score
Baseline 0306 (0016) 0197 (0015)
Including students who were tested but whose scores were not
counted for official reporting purposes (non-reported students)
0304 (0016) 0193 (0015)
Including students who were in the grade for the second or third time
(retained students)
0309 (0016) 0194 (0015)
Including both non-reported and retained students 0310 (0016) 0193 (0015)
Including both non-reported and retained students and imputing
scores for students who did not take the ITBS (impute to the 25th
percentile of cohort and school)
0311 (0013) 0197 (0015)
Including both non-reported and retained students and imputing
scores for students who did not take the ITBS (impute to the 10th
percentile of cohort and school)
0321 (0016) 0203 (0015)
No pre-existing achievement trend 0257 (0011) 0177 (0010)
No controls for prior achievement 0253 (0020) 0138 (0019)
No controls for prior achievement or pre-existing achievement trends 0365 (0012) 0301 (0012)
Add school fixed effects 0299 (0016) 0193 (0015)
Common Form Imdashonly include the 1994 1996 and 1998 cohorts that
all took ITBS Form L (no trend)
0252 (0011) 0164 (0009)
Common Form IImdashonly include the 1994 1996 and 1998 cohorts that
all took ITBS Form L (with trend)
0215 (0019) 0139 (0016)
For the sake of brevity the estimates shown in the cells above are the effects of high-stakes testing on the 1998
eighth grade cohort Results are comparable for other grades and cohorts and are available upon request from the
author
BA Jacob Journal of Public Economics 89 (2005) 761ndash796 777
Second students who had been scoring at the 10thndash50th percentile in the past fared
better than their classmates who had either scored below the 10th percentile or above the
50th percentile This is consistent with the incentives imposed on at-risk students by the
policy to end social promotion Moreover the effect for marginal students appears
somewhat stronger in reading than math suggesting that there may be more intentional
targeting of individual students in reading than in math or that there is greater divisibility
in the production of reading achievement However it is also important to note that the
differential effects of student prior ability are considerably smaller than the differential
effects of prior school achievement This suggests that responses to the accountability
policy took place at the school level rather than the individual student level27
To test the sensitivity of the findings presented in the previous sections Table 4 presents
comparable estimates for a variety of different specifications and samples For simplicity I
only present results for the 1998 eighth grade cohort28 Row 1 shows the baseline
estimates The next three rows show that the results are not sensitive to including students
who either were in that grade for the second time (eg retained students) or whose test
28 The sensitivity results are comparable for the other grades and cohorts Tables available from author upon
request
27 This result may also be due to measurement error although this seems somewhat less likely because the
student prior achievement measure is an average of two exam scoresmdashmath and readingmdashand similar results
were obtained using a measure composed of several earlier years of test data
BA Jacob Journal of Public Economics 89 (2005) 761ndash796778
scores were not included for official reporting purposes because of a special education or
bilingual classification Rows 5 and 6 expand the sample even further including students
with missing outcome data and instead imputing test scores using different rules The
inclusion of these students does not change the results Rows 7 to 9 examine the
robustness of the findings to the exclusion of prior test score data andor pre-existing
achievement trends finding that neither of these alternative specifications substantially
change the results Row 10 presents estimates that include school fixed effects and obtains
similar results indicating that the composition of schools in Chicago did not change
appreciably over this time period Finally rows 11 and 12 estimate the findings using only
the 1994 1996 and 1998 cohorts all of which took Form L of the ITBS This should
control for any changes in form difficulty that may confound the results We see that while
the results shrink somewhat they are still statistically significant and large in magnitude
6 What factors are driving the improvements in performance in Chicago
Even if a positive causal relationship between high-stakes testing and student
achievement can be established it is important to understand what factors are driving the
improvements in performance Critics of test-based accountability often argue that the
Fig 4 (a) IGAP achievement trends in Chicago 19931998 Sample includes all first-time students in each grade
who took the IGAP math exam Scores are standardized using the 1993 mean and 1994 student-level standard
deviation (b) IGAP achievement trends in Chicago 19931998 Chicago averages exclude retained students
District averages are standardized separately using the 1993 state mean and across standard deviation in the state
The value shown above is the difference in the standardized score for each year A complete list of the comparison
districts can be found in the text
Fig 4 (continued)
BA Jacob Journal of Public Economics 89 (2005) 761ndash796 779
primary impact of high-stakes testing is to increase the time spent on test-specific
preparation activities which could improve test-specific skills at the expense of more
general skills Others argue that test score gains reflect student motivation on the day of the
exam While many of these responses are not directly observable this section attempts to
shed some light on the factors driving the achievement gains in Chicago first by comparing
student performance across exams and then by examining the test score improvements
across items
BA Jacob Journal of Public Economics 89 (2005) 761ndash796780
61 The role of general skills
Even the most comprehensive achievement exam can only cover a fraction of the
possible skills and topics within a particular domain Because all standardized tests differ
to some extent in format and content one would not expect gains on one test to be
completely reflected in performance changes on another exam Differential changes in
student effort across exams also complicate the comparison of performance trends from
one test to another Nonetheless it is instructive to compare achievement changes on the
high-stakes exam to changes on alternate tests since this will provide information on the
extent to which improvements in general versus test-specific skills were driving the
observed test score gains
Under the Chicago accountability policy student promotion and school probation are
based entirely on the Iowa Test of Basic Skills (ITBS) an exam that has been administered
by the district for many years However during the 1990s Chicago students also took a
state-administered achievement exam known as the Illinois Goals Assessment Program
(IGAP)While it is not possible to directly compare the content of the two exams because the
IGAP is not publicly released a review of sample items and other test documentation
suggests that the exams are generally comparable although the IGAP math exam may place
somewhat greater emphasis on critical thinking and less emphasis on computation29
Ideally one would like to compare ITBS and IGAP performance in both mathematics
and reading comprehension over the same time period Unfortunately student-level IGAP
data is only available from 1994 to 1998 although school level data is available for
199330 Moreover technical problems with the IGAP reading exam limit its comparability
over time (Pearson and Shanahan 1998) For this reason the analysis of Chicago trends
focuses on math achievement
If the accountability policy operated by increasing general skills or a broad enough range
of specific skills the observed ITBS gains in Chicago should be reflected in the IGAP
trends Fig 4a shows IGAP math performance in Chicago from 1993 to 1998 for students in
each grade for the first time (ie comparable to the sample used for the ITBS analysis)
While student performance improved over this period in all grades it appears that only in
eighth grade did achievement increase (relative to the pre-existing trend) after the
introduction of the accountability policy31 In fact third grade IGAP performance seems
to have decreased relative to trend under high-stakes testing The top panel of Table 5
presents OLS estimates of the effect of high-stakes testing on IGAP and ITBS scores in
29 Both are timed multiple-choice tests It appears that the IGAP math exam has fewer straight computation
questions and that such questions are asked in the context of a sentence or word problem The IGAP reading
exam appears to be more difficult and more heavily weighted toward critical thinking skills than the ITBS exam
insofar as it has a fewer number of longer passages questions with multiple correct responses and questions
asking students to compare passages30 School level IGAP data is available starting in 1990 but changes in the scaling of the exam in 1993
prevent one from comparing scores in 1990ndash1992 to later years In 1999 Illinois introduced a new exam the
Illinois Student Assessment Test (ISAT) Because the ISAT and IGAP have not been equated it is not possible to
compare achievement levels before and after 199831 Recall that the student promotion incentives were introduced in 1996 for eighth grade students but not
until 1997 for third and sixth grade students
Table 5
The impact of test-based accountability on a low-stakes achievement exam
Panel A trends within Chicago
ITBS math score IGAP math score
3rd grade 6th grade 8th grade 3rd grade 6th grade 8th grade
Unadjusted difference (postpre)
(1) 0094 (0012) 0227 (0011) 0258 (0011) 0224 (0013) 0249 (0013) 0211 (0013)
Including controls and prior trend
(2) 0005 (0020) 0111 (0015) 0219 (0023) 0130 (0024) 0015 (0018) 0260 (0027)
Number of
observations
(students)
116949 120706 110629 108326 113523 117303
Panel B Chicago relative to other urban districts in Illinois
IGAP math score IGAP reading score
3rd grade 6th grade 8th grade 3rd grade 6th grade 8th grade
Unadjusted difference-in-difference
(3) 0204 (0021) 0200 (0020) 0110 (0021) 0209 (0019) 0138 (0016) 0121 (0018)
Including controls and district-specific trends
(4) 0017 (0036) 0034 (0035) 0164 (0051) 0004 (0027) 018 (0034) 0211 (0040)
Number of
observations
(schools)
4071 3560 2930 4071 3560 2930
In the top panel the unit of observation is the student and the sample includes cohorts 1994ndash1998 The
specification corresponds to Eq (1) and the estimates shown are the average effects for all post-policy cohorts
with standard errors clustered to account for the correlation of students within schools In the bottom panel the
sample includes all elementary schools in Chicago and 34 comparison districts in Illinois in the period 1993ndash1998
(see Appendix B for greater detail) The unit of analysis is the grade-school-year and the dependent variable is the
average IGAP score standardized by the 1993 Illinois state mean and the 1994 student level standard deviation in
Chicago (to be comparable with the student level results) The control variables include percent black percent
Hispanic percent Asian percent Native American percent low-income and percent limited English proficient
The regressions are weighted by the number of students enrolled in the school Robust standard errors that
account for the correlation of errors within districts are shown in parentheses
BA Jacob Journal of Public Economics 89 (2005) 761ndash796 781
Chicago based on the cohorts from 1994 to 1998 and derived from a specification
comparable to Eq (1) As a basis for comparison columns 1ndash3 present estimates of the
ITBS effects (the coefficients reflect the average effects across all included post-policy
years)32 Columns 4ndash6 show the effect of high-stakes testing on math IGAP scores in
Chicago The estimates suggest that relative to trend high-stakes testing led to a decline in
IGAP scores among third graders of roughly 013 standard deviations had no effect on
scores among sixth graders and increased eighth grade scores by roughly 026 standard
deviations
32 These estimates are roughly comparable to those presented in Table 1 The estimates for third grade differ
because student performance dropped noticeably from 1993 to 1994 for this cohort leading the 1994ndash1996 trend
to be considerably steeper than the trend from 1993 to 1996
BA Jacob Journal of Public Economics 89 (2005) 761ndash796782
To test the robustness of these results one can compare IGAP trends in Chicago to
those in other urban districts in Illinois This not only accounts for any statewide factors
that might have impact IGAP performance over this period but also allows one to
examine reading performance since the equating problems with the IGAP reading exam
influenced all districts in the state Fig 4b shows IGAP achievement trends in Chicago
relative to other urban districts in Illinois from 1993 to 1998 (see Appendix B for details
on the construction of comparison districts) Chicago students scored between 040 and
080 standard deviations below students in other urban districts in 1993 but this
achievement gap appears to have narrowed during the mid-1990s However only in eighth
grade does there appear to be any improvement (relative to the prior trend) under the
accountability regime The bottom panel of Table 5 shows OLS estimates of the
relationship between high-stakes testing and performance on the low-stakes achievement
exam derived from a specification like Eq (3) Consistent with the student level results
this analysis suggests that high-stakes testing in Chicago had no effect on IGAP
performance among third and sixth graders but did increase IGAP scores in eighth for
reading as well as math33
Together with the earlier results these findings seem to suggest that the
accountability policy in Chicago led to a broad-based improvement in student
performance for older students but primarily led to an increase in test-specific skills
among younger students There are several caveats to this interpretation First
because the IGAP results only focus on the initial years of the program it is possible
that later cohorts may have experienced more general improvements (a plausible
scenario given the larger ITBS gains experienced by these cohorts) Second to the
extent that the introduction of high-stakes testing based on the ITBS lowered student
test-day effort on the IGAP the IGAP estimates presented above may be biased
downward
Perhaps most importantly however there is reason to believe that the IGAP was
viewed as a moderate-stakes exam prior to the introduction of the accountability
policy in Chicago (eg student-level test scores were reported to parents school-level
results were published in local newspapers and the state had begun to use IGAP
results to place schools on a bwatch-listQ) The fact that IGAP scores in Chicago were
improving since the early-to-mid-1990s suggests that students and teachers may have
been responding to these incentives In this context the introduction of the Chicago
accountability policy in 1997 may be viewed as shifting the relative importance of
the two exams This would suggest that the IGAP trends may not provide a clean
counterfactual with which to assess changes in general skills and specifically that the
IGAP results may understate the improvements in general skills among Chicago
students More generally however this further reinforces the conclusion that students
and teachers are quite responsive to such incentives and respond by focusing on the
particular exam used for accountability purposes
33 As with the ITBS low-achieving schools made larger gains on the IGAP than high-achieving schools
under the accountability policy although even the bottom-achieving schools did not experience the dramatic
achievement gains on the IGAP as they did on the ITBS for either sets of estimates in Table 5 (additional tables
available from the author upon request)
BA Jacob Journal of Public Economics 89 (2005) 761ndash796 783
62 The role of specific skills
If the ITBS gains were not driven primarily by an increase in general skills it is possible
that they were the result of improvements in ITBS-specific skills34 To the extent that the
disproportionately large ITBS gains were driven by ITBS-specific curriculum alignment
or test preparation we might expect to see the largest gains on ITBS items that are easy
to teach andor relatively common on the ITBS In math these include questions that
test computation and basic number concepts (eg arithmetic with negative and positive
numbers ordering numbers in sequence using place value and scientific notation etc)
Table 6 presents OLS estimates of the relationship between high-stakes testing and ITBS
math achievement by item type in which the unit of analysis is grade-year-item The sample
includes grades 3 6 and 8 By focusing on only those cohorts that took Form L (ie the
1994 1996 and 1998 cohorts) this analysis allows one to compare student performance on
identical questions over time The dependent variable is the proportion of students who
answered the item correctly in the particular year Note that these specifications also include
controls for grade and item difficulty to account for the correlation between item type
position and difficulty (eg the fact that the more difficult items are often included at the end
of the exam and that certain types of questions are inherently more difficult for students)35
Column 1 classifies questions into two groupsmdashthose testing basic skills such as math
computation and number concepts and those testing more complex skills such as
estimation data interpretation and problem-solving (ie word problems) Students in
1998 were 17 percentage points more likely to correctly answer questions involving
complex skills in comparison to cohorts in 1994 and 1996 The comparable improvement
for questions testing basic skills was 39 percentage points suggesting that under
accountability students improved more than twice as much in basic skills as compared with
more complex skills Column 2 separates items into five categoriesmdashcomputation number
concept data interpretation estimation and problem-solvingmdashand shows the same pattern
In column 3 the items are classified into very detailed categories providing even more
information on the relative gains within the math exam Student performance on items
involving whole number computation (the omitted category) increased 35 percentage
points Interestingly the point estimates suggest that students improved even moremdashnearly
57 percentage pointsmdashon items involving computation with fractions (though the
difference is only marginally significant) Questions testing knowledge of probability
and statistics also appear to have made relatively large gains In contrast students appear to
have made no improvement on questions involving estimating compensation (problems
involving currency) and the effective use of various strategies to solve word-problems and
very little (if any) improvement on items involving multiple-step word problems
measurement and interpreting relationships shown in charts graphs or tables
35 The item difficulty measures are the percentage of students correctly answering the item in a nationally
representative sample used by the test publisher to norm the exam Interactions between item difficulty and the
accountability regime (1998 cohort) are included as well The coefficients on the item difficultyhigh-stakes
interactions are generally insignificant
34 Based on analysis of teacher survey data Tepper (2002) concluded that ITBS-specific test preparation and
curriculum alignment increased following the introduction of the accountability policy
Table 6
The relationship between item type position and improvement on the ITBS math exam
Independent variables Dependent variable=proportion of students answering the item correctly
(1) (2) (3)
1998 cohort 0017 (0011) 0015 (0014) 0035 (0013)
Basic skills1998 0022 (0005)
Math computation1998 0025 (0008)
Whole numbers1998
Decimals1998 0000 (0010)
Fractions1998 0022 (0017)
Number concepts1998 0023 (0008)
Equations and inequalities1998 0002 (0015)
Fractions decimals percents1998 0004 (0013)
Geometry1998 0002 (0013)
Measurement1998 0028 (0016)
Numeration and operations1998 0001 (0011)
Probability and statistics1998 0011 (0018)
Other skills1998
Estimation1998 0003 (0012)
Compensation1998 0043 (0012)
Order of magnitude1998 0013 (0015)
Standard rounding1998 0002 (0011)
Data analysis1998 0006 (0013)
Compare quantiles1998 0018 (0015)
Interpret relationships1998 0024 (0012)
Read amounts1998 0002 (0016)
Problem solving1998
Multiple step1998 0023 (0012)
Use strategies1998 0032 (0014)
Single step1998 0017 (0013)
2nd quintile of the exam1998 0001 (0001) 0001 (0008) 0002 (0008)
3rd quintile of the exam1998 0001 (0008) 0002 (0008) 0002 (0008)
4th quintile of the exam1998 0011 (0008) 0008 (0011) 0008 (0011)
5th quintile of the exam1998 0006 (0009) 0003 (0012) 0002 (0012)
Number of observations 1038 1038 1038
R2 0960 0962 0962
The sample consists of all tested and included students in grades 3 6 and 8 in years 1994 1996 and 1998 The
units of observation are itemyear proportions reflecting the proportion of students answering the item correctly
in that year Other covariates included but not shown main effects for grade item difficulty item position item
type and interactions for item difficulty1998
BA Jacob Journal of Public Economics 89 (2005) 761ndash796784
Table 7 presents similar estimates for reading The first column includes no indicator for
item type while columns 2 and 3 include increasingly more detailed item-type
classifications Unlike math it appears that the improvements in reading performance
were distributed equally across question type This analysis suggests that test preparation
may have played a large role in the math gains but was perhaps less important in reading
improvement One reason may be that it is relatively easier to teach specific math skills
whereas reading instruction in the elementary grades may focus largely on phonics practice
reading or other activities that are not specifically geared to particular test items Another
explanation is that reading skills are more likely than math skills to be learned out of school
Table 7
The relationship between item type position and improvement on the ITBS reading exam
Dependent variable=proportion of students answering the item
correctly
(1) (2) (3)
1998 0036 (0028) 0036 (0028) 0045 (0031)
Construct factual meaning1998 0000 (0009)
Literal meaning of words1998 0009 (0020)
Understand factual information1998 0004 (0014)
Construct inferential meaning1998 0001 (0009)
Draw conclusions1998 0009 (0014)
Infer feelings traits motives of
characters1998
0001 (0016)
Representapply information1998 0003 (0019)
Construct evaluative meaning1998
Authorrsquos attitude purpose
viewpoint1998
0001 (0018)
Determine main idea1998
Interpret non-literal language1998 0008 (0020)
Structure mood style tone1998 0014 (0019)
2nd quintile of the exam1998 0000 (0011) 0000 (0011) 000 (0011)
3rd quintile of the exam1998 0013 (0012) 0013 (0012) 0013 (0012)
4th quintile of the exam1998 0015 (0012) 0015 (0012) 0013 (0012)
5th quintile of the exam1998 0031 (0014) 0031 (0014) 0029 (0014)
Number of observations 387 387 387
R2 0958 0959 963
The sample consists of all tested and included students in grades 3 6 and 8 in years 1994 1996 and 1998 The
units of observation are itemyear proportions reflecting the proportion of students answering the item correctly
in that year Other covariates included but not shown main effects for grade item difficulty item position item
type and interactions for item difficulty1998
BA Jacob Journal of Public Economics 89 (2005) 761ndash796 785
63 The role of effort
Student effort is another likely candidate for explaining the large ITBS gains Interview
and survey data provide evidence that students particularly those in sixth and eighth grades
were acutely aware of and worried about the accountability mandates (Tepper 2002
Roderick and Engel 2001 Jacob Stone and Roderick forthcoming) If the consequences
associated with ITBS performance led students to concentrate more during the exam or
caused teachers to ensure optimal testing conditions for the exam test scores may have
increased regardless of changes in general or test-specific skills36
Test completion is one indicator of effort Prior to the introduction of high-stakes testing
roughly 20 of students left items blank on the ITBS reading exam and nearly 38 left
items blank on the math exam despite the fact that there was no penalty for guessing37 If
we believe that ITBS gains were due largely to guessing we might expect the percent of
36 This might also be considered an effect of better testing conditions Figlio and Winicki (in press) present
evidence that schools attempt to enhance testing conditions by altering the content of meals served to students
during testing37 The math exam consists of three subsections and is thus roughly three times as long as the reading exam
BA Jacob Journal of Public Economics 89 (2005) 761ndash796786
questions answered to increase but the percent of questions answered correctly (as a
percent of all answered questions) to remain constant or perhaps even decline However
from 1994 to 1998 the percent of questions answered increased by 1ndash15 percentage
points while the percent correct as a fraction of the percent answered increased by 4ndash5
percentage points suggesting that the higher completion rates were not due entirely to
guessing This pattern is true even among the lowest achieving students who left the
greatest number of items blank prior to the accountability policy Even if we were to
assume that the increase in item completion is due entirely to random guessing
however guessing could only explain 10ndash15 of the observed ITBS gains
While increased guessing cannot explain a significant portion of the ITBS gains other
forms of effort may play a larger role Insofar as there is a tendency for children to bgive upQtoward the end of the exammdasheither leaving items blank or filling in answers randomlymdashan
increase in effort may lead to a disproportionate increase in performance on items at the end
of the exam One might describe this type of effort as test staminamdashthe ability to continue
working and concentrating throughout the entire exam In order to identify test stamina
effects the estimates in Tables 6 and 7 include variables indicating the item positionmdash
specifically dummy variables denoting into which quintile of the exam the item falls The
results are mixed In math we see no relationship between item position and improvement
under accountability perhaps because the math exam is divided into several sections each
of which is relatively short In reading on the other hand student performance on items at
the end of the exam increased significantly more than performance on items at the beginning
of the exam In column 1 for example we see that under the accountability policy students
improved 36 percentage points on items in the first quintile of the exam compared with 67
percentage points on items in the final quintile (note that this is conditional on item
difficulty since items tend to get progressively difficult on the exam) This suggests that
effort may have played a role in the ITBS gains seen under high-stakes testing
7 Did educators respond strategically to high-stakes testing
Given the consequences attached to test performance in certain subjects one might
expect teachers and students to shift resources and attention toward subjects included in
the accountability program We can examine this by comparing trends in math and reading
achievement after the introduction of high-stakes testing with test score trends in social
studies and science subjects that are not included in the Chicago accountability policy
Unfortunately science and social studies exams are not given in every grade and the
grades in which these exams are given has changed over time For this reason we must
limit the analysis to grades four and eight from 1995 to 199838
38 For eighth grade we compare achievement in the 1996 and 1998 cohorts in order (i) to compare scores on
comparable test forms and (ii) to avoid picking up test score gains due solely to increasing familiarity with a new
exam There is a considerable literature showing that test scores increase sharply the second year an exam is given
because teachers and students have become more familiar with the content of the exam See Koretz (1996) For
fourth grade we do not use the 1998 cohort because of the compositional changes due to third grade retentions in
1997 Instead we compare achievement gains from 1996 to 1997
Table 8
Differential effects on low vs high-stakes subjects
Independent variables Dependent variables ITBS score
Math Reading Science Social studies
Model 1
High-stakes (HS) 0234 (0009) 0172 (0008) 0075 (0008) 0050 (0007)
Model 2
High-stakes (HS) 0206 (0017) 0084 (0017) 0074 (0018) 0044 (0018)
HS(studentb10th percentile) 0030 (0023) 0014 (0022) 0081 (0022) 0069 (0022)
HS(student in 10ndash25th percentile) 0040 (0017) 0018 (0015) 0065 (0017) 0058 (0017)
HS(student in 26ndash50th percentile) 0028 (0014) 0014 (0013) 0032 (0015) 0029 (0015)
HS(school had b20 students above
the 50th percentile)
0083 (0022) 0097 (0020) 0035 (0022) 0030 (0023)
HS(school had 20ndash40 students above
the 50th percentile)
0002 (0022) 0056 (0020) 0015 (0022) 0025 (0021)
Cells contain OLS estimates based on comparisons of the 1996 and 1998 cohorts for grade 8 and the 1996 and
1997 cohorts for grade 4 controlling for the student school and neighborhood demographics described in the
notes to Table 1 ITBS scores are standardized separately by grade and subject using the 1996 student-level mean
and standard deviation Estimates in the top row are based a model with no interactions The estimates in the
subsequent rows are based on a single regression model that includes interactions between high-stakes testing and
student or school prior achievement with high ability students in high-achieving schools as the omitted category
Robust standard errors that account for the correlations of errors within schools are shown in parentheses
BA Jacob Journal of Public Economics 89 (2005) 761ndash796 787
Table 8 shows that achievement gains in math and reading were roughly two to four
times larger than gains in science and social studies although science and social studies
scores also increased under high-stakes testing The distribution of effects is also
somewhat different for low vs high-stakes subjects In math and reading students in low-
achieving schools experienced greater gains but conditional on school achievement low-
ability students appeared to make only slightly larger gains than their peers In science and
social studies on the other hand low ability students showed significantly lower gains
than their higher-achieving peers while school achievement had little if any effect on
science and social studies performance This suggests that schools may have shifted
resources across subjects particularly for low-achieving students which is consistent with
findings by Koretz and Barron (1998) and Deere and Strayer (2001)
Under the accountability policy teachers have an incentive to dissuade low-achieving
students from taking the exam andor to place low-achieving students in bilingual or
special education programs so that their scores do not bcountQ against the school39 Table 9shows OLS estimates of the change in testing reporting and special education placement
under the accountability regime derived from a specification like Eq (1) that includes
controls for student school and neighborhood demographics (including prior achieve-
39 Schools are not explicitly judged on the percentage of their students who take the exams although it is
likely that a school with an unusually high fraction of students who miss the exam would come under scrutiny by
the central office In a recent descriptive analysis of testing patterns in Chicago Easton et al (2000 2001) found
that the percent of ChiPS students who are tested and included for reporting purposes during the 1990s although
they attribute this decline to an increase in bilingual testing policy discussed in section 4
Table 9
OLS estimates of the effect of high-stakes testing on testing score reporting and special education placement
All students Students in the bottom quartile of the
national achievement distribution
All
schools
Bottom
schools
Middle
schools
Top
schools
Bottom
schools
Middle
schools
Top
schools
Dependent variable special education
High-stakes 0010
(0002)
0016
(0003)
0008
(0004)
0003
(0006)
0036
(0005)
0021
(0008)
0019
(0018)
Baseline mean 0132 0125 0137 0146 0204 0281 0492
Dependent variable tested and scores reported
High-stakes 0001
(0004)
0005
(0005)
0002
(0009)
0009
(0006)
0016
(0007)
0022
(0009)
0008
(0021)
Baseline Mean 0867 0870 0860 0870 0799 0732 0528
Dependent variable tested
High-stakes 0006
(0003)
0004
(0003)
0006
(0005)
0004
(0004)
0005
(0005)
0019
(0007)
0011
(0013)
Baseline mean 0962 0958 0961 0980 0950 0952 0965
Number of observations 294113 152180 96127 44267 77721 35423 6582
The sample includes all non-bilingual first-time students in grades 3 6 and 8 from 1994 to 1998 The baseline
mean is the average for the 1994ndash1996 cohorts and the coefficient on high-stakes reflects the average effect for the
1997ndash1998 cohorts Control variables are the same as those described in the notes to Table 1 fully interacted with
grade Robust standard errors that account for the correlation of errors within schools are shown in parentheses
BA Jacob Journal of Public Economics 89 (2005) 761ndash796788
ment) as well as pre-existing trends40 The sample is limited to the period from 1994 to
1998 because some special education and reporting data is not available for the 1993
cohort and estimates for the 1999 and 2000 cohorts are likely to be confounded by earlier
grade retention41 Bilingual students are also excluded from this analysis since changes in
the bilingual policy are confounded with the introduction of high-stakes testing 42 The
results shown here pool grades 3 6 and 8 since the effects are comparable across these
grades (tables available from author upon request)43
The results suggest that the accountability policy increased the proportion of students in
special education but had no effect on the proportion of students who took the standardized
40 Probit estimates evaluated at the mean yield comparable results41 Students who were previously in special education were more likely to have received waivers from the
accountability policy and thus more likely to appear in the 1999 or 2000 cohorts One alternative would be to
control for special education placement at t3 or t4 but data is not available this far back for the earlier cohorts42 Prior to 1997 the ITBS scores of all bilingual students who took the standardized exams were included for
official reporting purposes During this time ChiPS testing policy required students enrolled in bilingual
programs for more than 3 years to take the ITBS but teachers were given the option to test other bilingual
students According to school officials many teachers were reluctant to test bilingual students fearing that their
low scores would reflect poorly on the school Beginning in 1997 ChiPS began excluding the ITBS scores of
students who had been enrolled in bilingual programs for 3 or fewer years to encourage teachers to test these
students for diagnostic purposes In 1999 the ChiPS began excluding the scores of fourth year bilingual students
as well but also began requiring third-year bilingual students to take the ITBS exams43 The estimates shown here come from fully interacted models that allow all of the coefficients to differ for
each grade
BA Jacob Journal of Public Economics 89 (2005) 761ndash796 789
achievement exams Focusing on the first column in the top panel we see that participation
in special education increased by one percentage point (roughly 8) following the
introduction of high-stakes testing Columns 2ndash4 indicate that these increases were largest
within low-achieving schools Columns 4ndash7 show the estimates separately by school
achievement level but only for those students whose prior achievement put them at risk for
special education placement (ie students in the bottom quartile of the national achievement
distribution) Consistent with the incentives provided under the accountability regime
special education rates increased the most among low-achieving students in low-achieving
schoolsmdasha gain of 36 percentage points (roughly 18) Given that the test scores of many
special education students are not counted toward the schoolrsquos overall rating one would
expect that the changes in special education rates would coincide with a decrease in the
proportion of students whose scores count44 The estimates in the middle panel show that
bottom- and middle-tier schools were significantly less likely to bcountQ the test scores oflow-achieving students under high-stakes testing In contrast the results in the bottom
panel show that the accountability policy did not have a significant effect on the likelihood
students were tested suggesting that teachers and administrators did not begin actively
dissuading low-achieving students from taking the achievement exams
Another way for teachers to shield low-achieving students from the accountability
mandates is to preemptively retain themmdashthat is hold them back before they enter grade
3 6 or 8 By doing so teachers allow these children to mature and gain an additional
year of learning before moving to the next grade and facing the high-stakes exam Thus
even in grades not directly affected by the promotional policy retention rates may have
increased under high-stakes testing45 Table 10 presents OLS estimates of the effect of
high-stakes testing on grade retention in these grades for the 1994ndash2000 cohorts which
were as above derived from a specification like Eq (1) that includes controls for student
school and neighborhood demographics (including prior achievement) as well as pre-
existing trends46
The top panel shows the results for grades 1 and 2 The estimates in column 1 indicate that
high-stakes testing increased the grade retention among these students by 23 percentage
45 Roderick et al (2000) found that retention rates in kindergarten first and second grades started to rise in
1996 and jumped sharply in 1997 among first and second graders Building on this earlier work the analysis here
(a) controls for changes in student composition and pre-existing trends (b) explicitly examines heterogeneity
across students and schools and (c) examines similar trends in grades 4 5 and 7
44 The decision whether the test scores of a special education student count toward the schoolrsquos rating
depends on the specific nature of the learning disability
46 The one key difference in these specifications is that the 1996 cohort is included in the post-policy group
because the outcome (ie grade retention) reflects a decision that took place the following yearmdashie the decision
regarding grade retention that teachers made for the 1996 cohort determined the studentrsquos grade in 1997 Because
the policy was announced in 1996 teachers who were concerned about particular students facing the new
standards in 1997 were likely to preemptively retain them in 1996 effective for the 1997 (ie 1996ndash1997)
school-year However estimates based only on the 1997ndash2000 cohorts yield comparable results as do Probit
estimates evaluated at the mean (tables available from the author upon request) Also the effects across grades
within the two categories were comparable A final note on the specification is that the estimates for students in
grades 1ndash2 do not include controls for prior achievement since many students do not take the kindergarten and
first grade exams For these grades low-achieving students were identified based on predicted achievement from
a model that included the set of demographics described earlier along with test scores when available
Table 10
OLS estimates of the effect of high-stakes testing on grade retention in grades not directly affected by the social
promotion policy
Dependent variable retained in the same grade in the following year
All students Students in the bottom quartile of the
national achievement distribution
All
schools
Bottom
schools
Middle
schools
Top
schools
Bottom
schools
Middle
schools
Top
schools
Sample grades 1ndash2
High-stakes 0023
(0004)
0039
(0007)
0010
(0006)
0017
(0006)
0055
(0010)
0016
(0009)
0043
(0014)
Baseline mean 0036 0037 0037 0029 0053 0057 0059
Number of observations 532627 238326 210918 76091 138519 109074 22678
Sample grades 4 5 and 7
High-stakes 0017
(0002)
0024
(0003)
0013
(0003)
0012
(0004)
0034
(0005)
0018
(0005)
0037
(0011)
Baseline mean 0013 0014 0013 0009 0019 0020 0022
Number of observations 673488 286293 269172 112068 147477 109569 19932
The sample includes all first-time students in these grades from 1994 to 2000 The baseline mean is the average
for the 1993ndash1995 cohorts and the coefficient on high-stakes reflects the average effect for the 1996ndash2000
cohorts Control variables are the same as those described in the notes to Table 1 fully interacted with grade
Robust standard errors that account for the correlation of errors within schools are shown in parentheses
BA Jacob Journal of Public Economics 89 (2005) 761ndash796790
points or roughly 64 given the baseline rate of 36 Consistent with the incentives
provided by the accountability policy the increases were largest among the lowest-
achieving schools Interestingly there were also large increases among bottom quartile
students in the top achieving schools In the bottom panel we see similar patterns for
students in grades 4 5 and 7 Retention rates in these grades increased approximately 130
under the accountability policy Indeed among low-achieving students in the bottom
schools the rates increased by nearly 180
Overall these results suggest that teachers responded strategically to the accountability
policy particularly in terms of special education placement and grade retention It is less
clear however whether these responses were optimal from the perspective of maximizing
student learning While many educators believe that special education and grade retention
have negative impacts on student performance there is little convincing evidence on either
issue47 Two results hint that the teacher responses may not have been as detrimental to
student learning as the prior education literature suggestsmdashspecial education rates
among bottom quartile students prior to the accountability policy were considerably
higher in top schools than bottom schools and the increase in grade retention among
bottom quartile students was nearly as large in high-achieving schools as in low-
achieving schools
47 There is little good evidence on the long-term causal impact of either intervention since most studies are
plagued by selection bias Two recent studies that attempt to address these issues include Hanushek et al (1998)
which finds that special education has a modest positive impact on achievement and Jacob and Lefgren (2004a)
who find that grade retention has a mixed effect on student achievement
BA Jacob Journal of Public Economics 89 (2005) 761ndash796 791
8 Conclusions
The passage of No Child Left Behind ensures that test-based accountability will be a
pervasive force in elementary and secondary education for years to come Yet despite the
growing importance of high-stakes testing there is limited empirical evidence on its
impact This paper seeks to provide some evidence on the topic by examining the test-
based accountability program implemented in Chicago Utilizing detailed enrollment and
achievement data for successive cohorts of elementary students I am able not only to
examine the impact of the high-stakes testing on student achievement but also to explore
the factors driving changes in student performance and to test for strategic responses on
the part of teachers
The results of this analysis suggest that the high-stakes testing policy led to
substantial increases in math and reading performance on the high-stakes test The test
score gains in Chicago were on the order of 020ndash030 standard deviations roughly
comparable to the effects of the Tennessee STAR class size reduction program that
lowered class size in the early elementary grades from 22 to 15 students (Krueger
2000) However for younger students I find no comparable increase in student test
scores on the lower-stakes state-administered IGAP exam An item-level analysis
indicates that the improvements on the high-stakes test were driven largely by an
increase in specific skills (ie computation skills in the case of math) and student effort
(particularly on the reading exam) Finally it appears that teachers responded
strategically to the incentives along a variety of dimensionsmdashby increasing special
education placements preemptively retaining students and substituting away from low-
stakes subjects like science and social studies
These findings provide strong empirical support for general incentive theories
particularly the notion of multi-tasking (Holmstrom and Milgrom 1991) Moreover the
results belie the view espoused by many policy-makers that teachers and schools are
impervious to change However it is less clear how to evaluate high-stakes testing as a
school reform strategy based on these results Because the achievement gains are driven
largely by increases in skills emphasized on the ITBS exam (at least among younger
students) an assessment of the policy depends largely on how one values these skills and
how much one believes that there has been a decrease in other skills that are not assessed
on standardized achievement exams The accountability policy also led to modest
increases in special education placement and grade retention though it is not yet clear
whether the responses will help or harm students in the long-run Overall these results
suggest that high-stakes testing has the potential to substantially improve student
learning but may also lead to some strategic responses on the part of teachers which
educators and policymakers will need to understand and account for in developing
accountability policies in the future
Acknowledgements
I would like to thank the Chicago Public Schools the Illinois State Board of
Education and the Consortium on Chicago School Research for providing the data used
BA Jacob Journal of Public Economics 89 (2005) 761ndash796792
in this study I am grateful to Peter Arcidiacono Anthony Bryk Susan Dynarski
Carolyn Hill Robert LaLonde Lars Lefgren Steven Levitt Helen Levy Susan Mayer
Melissa Roderick Robin Tepper and seminar participants at various institutions for
helpful comments and suggestions Jenny Huang provided excellent research assistance
Funding for this research was provided by the Spencer Foundation All remaining
errors are my own
Appendix A
Summary statistics
Variables Low-stakes
(1993ndash1996)
High-stakes
(1997ndash2000)
Student outcomes
Tested 0888 0917
Tested and scores reported 0807 0752
Tested (excluding bilingual students) 0958 0962
Tested and scores reported (excluding bilingual students) 0866 0839
In special education 0116 0139
ITBS math score (GEs relative to national norm)a 064 024
ITBS reading score (GErsquos relative to national norm)a 092 058
Accountability policyb
Percent who failed to meet promotional criteria in May 0393
Percent retained or in transition center next year 0078
Percent attending school on academic probation 0108
Student demographics
Prior math achievement (GEs relative to national norm)c 060 043
Prior reading achievement (GEs relative to national norm)c 091 072
Male 0505 0507
Black 0544 0536
Hispanic 0305 0326
Agea 11839 11719
Living in foster care 0032 0051
Free or reduced price lunch 0795 0861
In bilingual program (currently or in the past) 0331 0359
Select neighborhood characteristicsd
Median HH income 22700 23276
Managersprofessionals (of those working) 0169 0169
Poverty rate 0269 0254
not working 0407 0402
Female headed HH 0406 0391
Number of observations 370210 397057
The sample includes students in grades 3 6 and 8 from 1993 to 2000 who were not missing demographic
information aExcludes retainees (ie students attending the grade for the second or third time) bIncludes students
in 1997 to 2000 cohorts although the promotional criteria changed somewhat over this period cExcludes students
in grade 3 since sufficient prior achievement measures were not available dBased on the census tract in which the
student was living with data taken from the 1990 census
BA Jacob Journal of Public Economics 89 (2005) 761ndash796 793
Appendix B
B1 Comparison districts in Illinois
The data for these districts was drawn from breport cardsQ compiled by the Illinois State
Board of Education which provides average IGAP scores by grade and subject as well as
background information on schools and districts In total there were 840 elementary
school districts in Illinois in 1990 To identify comparable districts I first determined
which districts were in the top decile in terms of the percent of students receiving free or
reduced price lunch percent minority students and total enrollment and in the bottom
decile in terms of average student achievement (averaged over third sixth and eighth
grade reading and math scores based on 1990 data) Chicago ranked first in terms of
enrollment 12th in terms of percent of low-income and minority students and 830th in
student achievement I defined the Illinois comparison group to include all districts that
fell into the bottom decile in at least three out of four of the categories Using this
criterion the following 34 districts were included (see table below) I experimented with
several different inclusion criteria and found that the results of the analysis were not
sensitive to the specific districts chosen In the analyses comparing Chicago to these
districts I controlled for the following time-varying district characteristics percent black
percent Hispanic percent Asian percent Native American percent low-income percent
limited English proficient average daily attendance mobility rate school enrollment
pupilndashteacher ratio log(average teacher salary) log(per pupil expenditures) percent of
teachers with a BA degree and the percent of teachers with a MA degree or higher
ALTON COMM UNIT SCHOOL
DIST 11
EGYPTIAN COMM UNIT SCH
DIST 5
NORTH CHICAGO SCHOOL
DIST 187
AURORA EAST UNIT SCHOOL
DIST 131
FAIRMONT SCHOOL
DISTRICT 89
PEORIA SCHOOL DISTRICT
150
BLUE ISLAND SCHOOL DIST
130
GEN GEO PATTON SCHOOL
DIST 133
POSEN-ROBBINS EL SCH
DIST 143-5
BROOKLYN UNIT DISTRICT
188
HARVEY SCHOOL DISTRICT
152
PRAIRIE-HILLS ELEM SCH
DIST 144
CAHOKIA COMM UNIT SCH
DIST 187
HAZEL CREST SCHOOL DIST
152-5
ROCK ISLAND SCHOOL
DISTRICT 41
CAIRO UNIT SCHOOL
DISTRICT 1
JOLIET SCHOOL DIST 86 SOUTH HOLLAND SCHOOL
DIST 151
CHICAGO HEIGHTS SCHOOL
DIST 170
KANKAKEE SCHOOL DIST
111
SPRINGFIELD SCHOOL
DISTRICT 186
CICERO SCHOOL DISTRICT 99 LARAWAY C C SCHOOL DIST
70C
VENICE COMM UNIT
SCHOOL DIST 3
DANVILLE C C SCHOOL DIST
118
MADISON COMM UNIT SCH
DIST 12
W HARVEY-DIXMOOR PUB
SCH DIST147
DECATUR SCHOOL DISTRICT
61
MAYWOOD-MELROSE
PARK-BROADVIEW
WAUKEGAN C U SCHOOL
DIST 60
EAST CHICAGO HGHTS SCH
DIST 169
MERIDIAN C U SCH DISTRICT
101
ZION SCHOOL DISTRICT 6
EAST ST LOUIS SCHOOL
DIST 189
BA Jacob Journal of Public Economics 89 (2005) 761ndash796794
B2 Comparison districts outside Illinois
To identify plausible comparisons outside of Chicago I searched for districts that
met the following selection criteria (1) they served large cities in the Midwest (2)
they did not enact a test-based accountability policy during the mid-to-late-1990s and
(3) they administered standardized achievement exams to at least some elementary
grades on an annual basis during this time period and were willing to release this data
The following five districts met these criteria and were included in the analysis (with
the name of the achievement exam as well as years and grades for which achievement
data was available in shown in parentheses) Cincinnati OH (Ohio Proficiency Test
1996ndash2000 grades 4 6 8) Gary IN (CTBS-45 1994ndash2000 grades 3 6 8)
Indianapolis IN (CTBS-45 1993ndash2000 grades 3 6 8) Milwaukee WI (Wisconsin
Knowledge and Concepts Test 1996ndash2000 grades 4 8) and St Louis MO (SAT-89
1993ndash2000 grades 1 5 6) In the analysis district-level averages are standardized
using the student-level mean and standard deviation from the earliest possible year for
each gradesubjectdistrict
References
Ashenfelter O 1978 Estimating the effect of training programs on earnings The Review of Economics and
Statistics 60 (1) 47ndash57
Bishop J 1998 Do curriculum-based external exit exam systems enhance student achievement Consortium For
Policy Research In Education University of Pennsylvania Graduate School of Education Philadelphia
Bryk A 2003 No child left behind Chicago style In Peterson P West M (Eds) No Child Left Behind The
Politics and Practice of School Accountability Brookings Institution Washington DC
Center For Education Reform 2002 National Charter School Directory Washington DC
Clotfelter C Ladd H 1996 Recognizing and rewarding success in public schools In Ladd H (Ed)
Holding Schools Accountable Performance-Based Reform in Education The Brookings Institution
Washington DC
Cullen J Reback R 2002 Tinkering toward accolades school gaming under a performance accountability
system Working paper University of Michigan
Cullen J Jacob B Levitt S in press The impact of school choice on student outcomes an analysis of the
Chicago Public Schools Journal of Public Economics
Deere D Strayer W 2001 Putting schools to the test school accountability incentives and behavior Working
paper Department of Economics Texas AampM University
Easton J Rosenkranz T et al 2000 Annual CPS test trend review 1999 Consortium on Chicago School
Research Chicago
Easton J Rosenkranz T et al 2001 Annual CPS test trend review 2000 Consortium on Chicago School
Research Chicago
Figlio D Getzle L 2002 Accountability ability and disability gaming the system Working paper University
of Florida
Figlio D Winicki J in press Food for thought The effects of school accountability on school nutrition
Journal of Public Economics
Frederisksen N 1994 The Influence of Minimum Competency Tests on Teaching and Learning Educational
Testing Service Policy Information Center Princeton NJ
Grissmer D Flanagan A 1998 Exploring Rapid Achievement Gains in North Carolina and Texas National
Education Goals Panel Washington DC
Grissmer D et al 2000 Improving Student Achievement What NAEP Test Scores Tell Us RAND Santa
Monica CA MR-924-EDU
BA Jacob Journal of Public Economics 89 (2005) 761ndash796 795
Haney W 2000 The myth of the Texas miracle in education Education Policy Analysis Archives 8
(41)
Hanushek E Kain J Rivkin S 1998 Does special education raise academic achievement for students with
disabilities NBER Working Paper 6690
Holmstrom B Milgrom P 1991 Multitask principal-agent analyses incentive contracts asset ownership and
job design Journal of Law Economics and Organization 7 24ndash52
Hoover HD 1984 The most appropriate scores for measuring educational development in the elementary
schools GErsquos Educational Measurement Issues and Practice 8ndash18 (Winter)
Howell W Peterson P 2002 The Education Gap Vouchers and Urban Schools Brookings Institution Press
Washington DC
Jacob B 2001 Getting tough The impact of mandatory high school graduation exams on student outcomes
Educational Evaluation and Policy Analysis 23 (2) 99ndash122
Jacob B 2003 A closer look at achievement gains under high-stakes testing in Chicago In Peterson P West
M (Eds) No Child Left Behind The Politics and Practice of School Accountability Brookings Institution
Washington DC
Jacob B Levitt S 2003 Rotten apples an investigation of the prevalence and predictors of teacher cheating
Quarterly Journal of Economics CXVIII (3) 843ndash878
Jacob B Lefgren L 2004a Remedial education and student achievement a regression-discontinuity analysis
Review of Economics and Statistics LXXXVI (1) 226ndash244
Jacob B Lefgren L 2004b The impact of teacher training on student achievement quasi-experimental
evidence from school reform efforts in Chicago Journal of Human Resources 39 (1) 50ndash79
Jacob R Stone S Roderick M 2000 Ending social promotion the effects on teachers and students
Consortium on Chicago School Research Chicago
Klein S Hamilton L et al 2000 What Do Test Scores in Texas Tell Us RAND Santa Monica CA
Koretz D 1996 Using student assessments for educational accountability In Hanushek E Jorgensen D
(Eds) Improving Americarsquos Schools The Role of Incentives National Academy Press Washington DC
Koretz D Barron S 1998 The Validity of Gains in Scores on the Kentucky Instructional Results Information
System (KIRIS) RAND Santa Monica CA
Koretz D Linn R et al 1991 The Effects of High-Stakes Testing Preliminary Evidence About Generalization
Across Tests American Educational Research Association Chicago
Krueger A 2000 Economic considerations and class size Working Paper 447 Industrial Relations Section
Princeton University
Ladd H 1999 The Dallas School accountability and incentive program an evaluation of its impacts on student
outcomes Economics of Education Review 18 1ndash16
Linn R Graue M et al 1990 Comparing state and district results to national norms the validity of the claim
that dEveryone is above averageT Educational Measurement Issues and Practice 9 (3) 5ndash14
Neill M Gayler K 1998 Do high stakes graduation tests improve learning outcomes Using state-level NAEP
data to evaluate the effects of mandatory graduation tests High Stakes K-12 Testing Conference Teachers
College Columbia University
Pearson D Shanahan T 1998 The reading crisis in Illinois a ten year retrospective of IGAP Illinois Reading
Council Journal 26 (3) 60ndash67
Petersen NS Kolen MJ Hoover HD 1989 Scaling norming and equating Handbook of Educational
Measurement (3rd edition)
Richards C Sheu TM 1992 The South Carolina school incentive reward program a policy analysis
Economics of Education Review 11 (1) 71ndash86
Roderick M Engel M 2001 The grasshopper and the ant motivational responses of low-achieving students to
high-stakes testing Educational Evaluation and Policy Analysis 23 (3) 197ndash227
Roderick M Jacob B Bryk A 2002 The impact of high-stakes testing in Chicago on student achievement in
promotional gate grades Educational Evaluation and Policy Analysis 24 (4) 333ndash358
Roderick M Nagaoka J et al 2000 Update ending social promotion Consortium on Chicago School
Research Chicago
Shepard L 1990 Inflated test score gains is the problem old norms or teaching the test Educational
Measurement Issues and Practice 9 (3) 15ndash22
BA Jacob Journal of Public Economics 89 (2005) 761ndash796796
Smith S Mickelson R 2000 All that glitters is not gold school reform in Charlotte-Mecklenburg Educational
Evaluation and Policy Analysis 22 (2) 101ndash127
Stecher B Barron S 1999 Quadrennial Milepost Accountability Testing In Kentucky Center for the Study of
Evaluation University of California Los Angeles
Tepper R 2002 The influence of high-stakes testing on instructional practice in Chicago Doctoral dissertation
Harris Graduate School of Public Policy University of Chicago
Toenjes L Dworkin AG Lorence J Hill AN 2000 The lone star gamble high stakes testing accountability
and student achievement in Texas and Houston Mimeo The Sociology of Education Research Group
(SERG) Department of Sociology University of Texas
Winfield LF 1990 School competency testing reforms and student achievement exploring a national
perspective Educational Evaluation and Policy Analysis 12 (2) 157ndash173
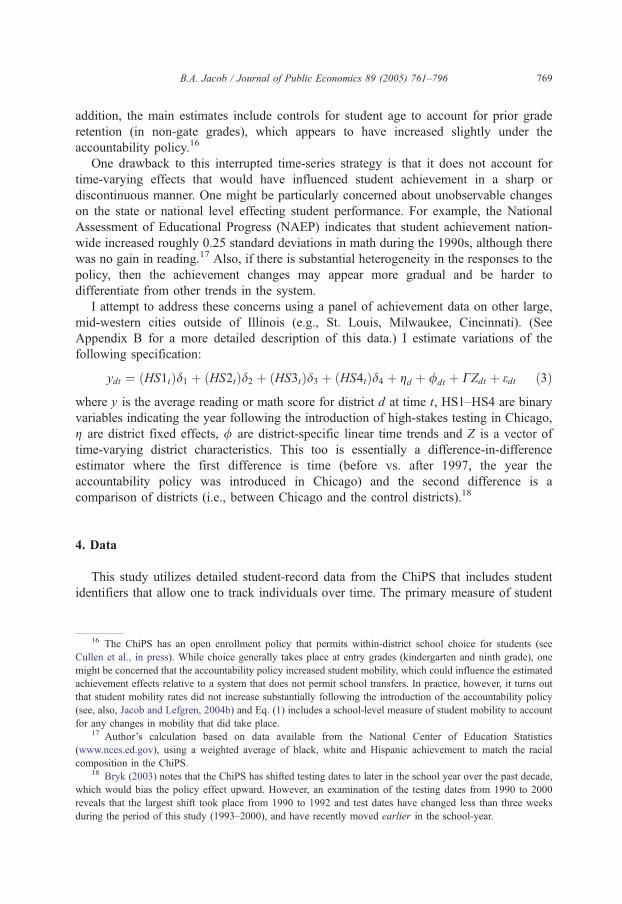
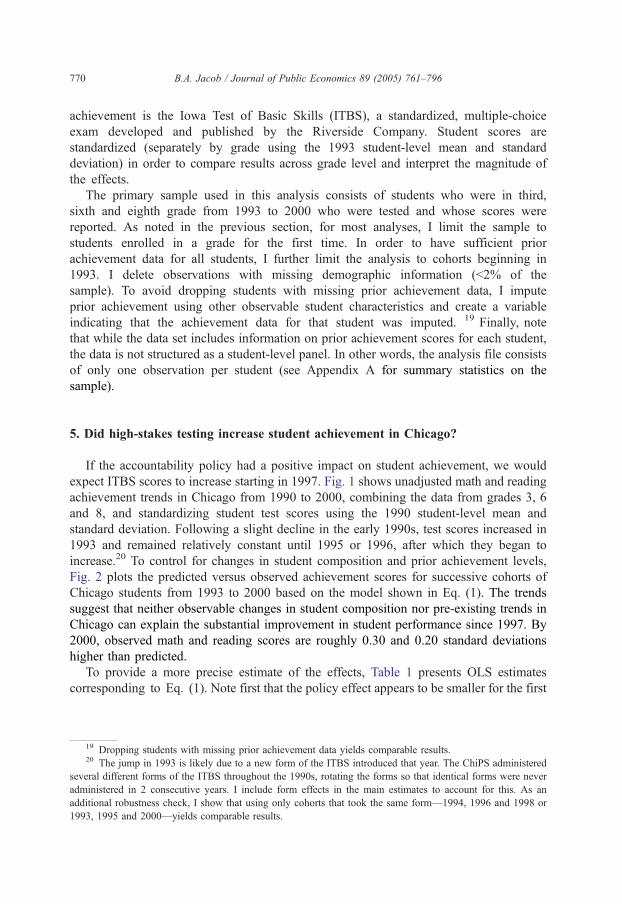
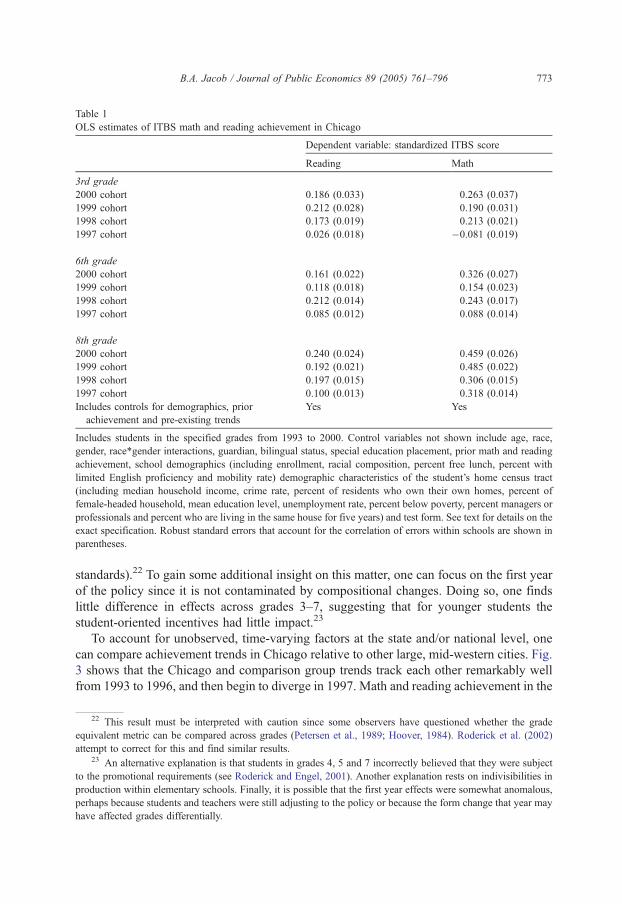
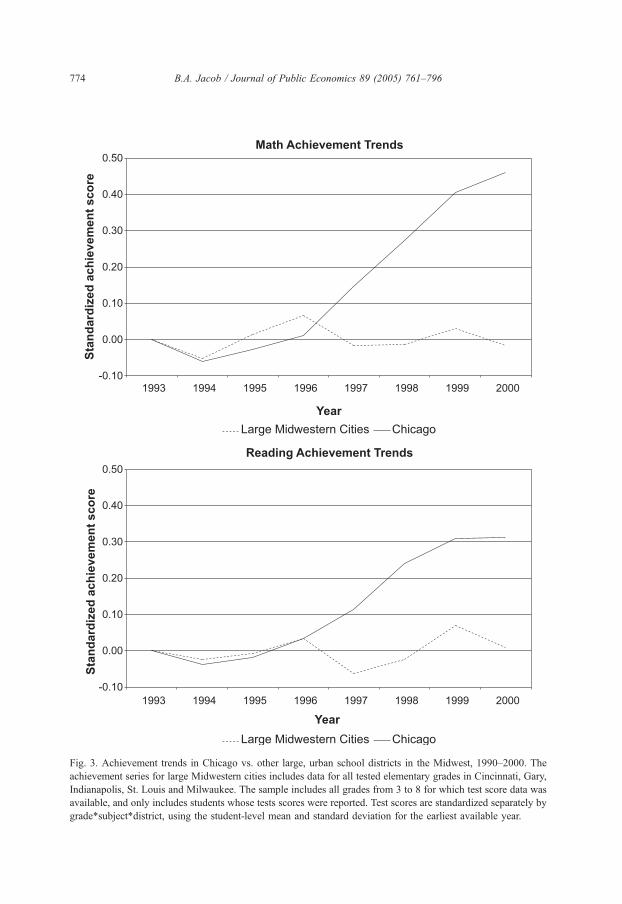
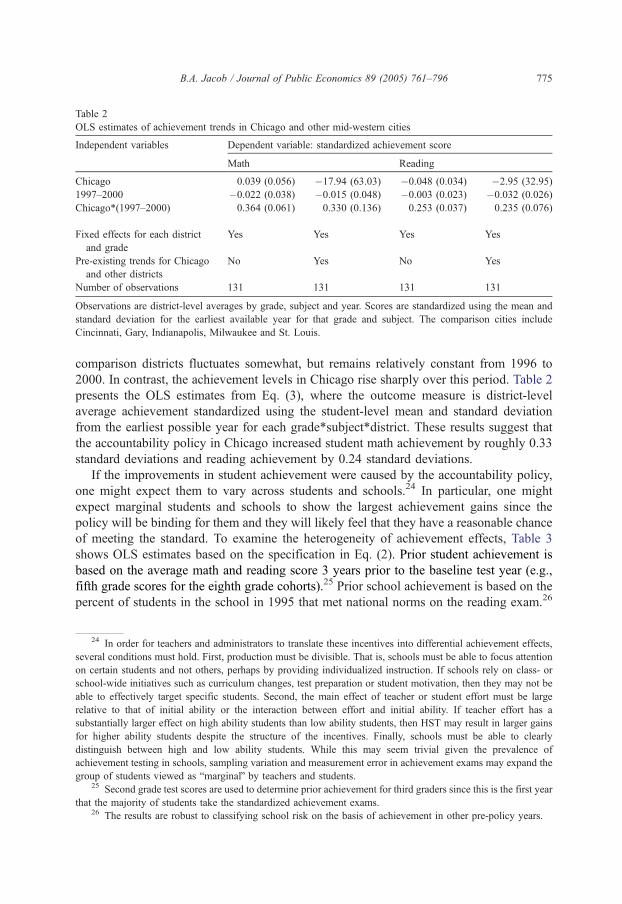
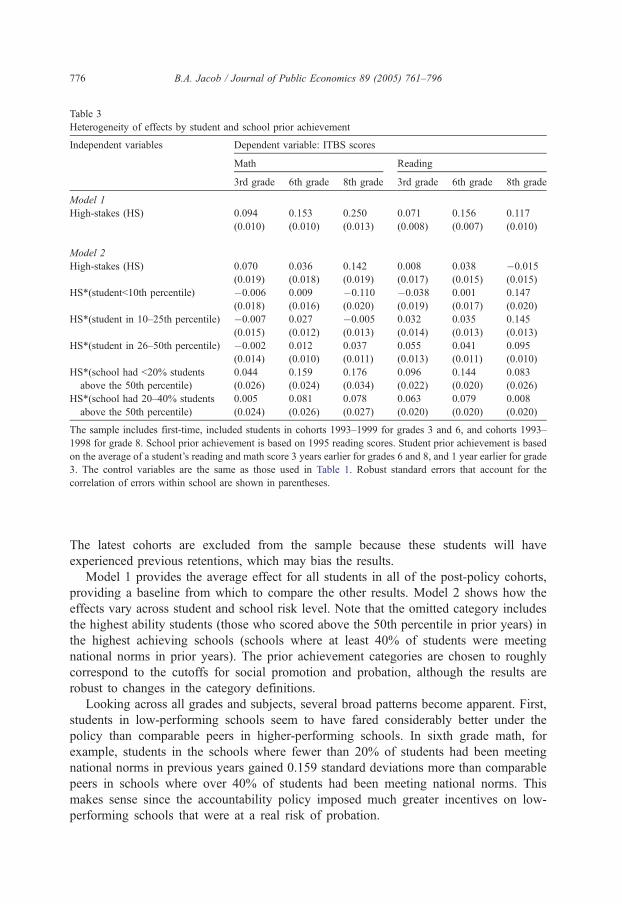
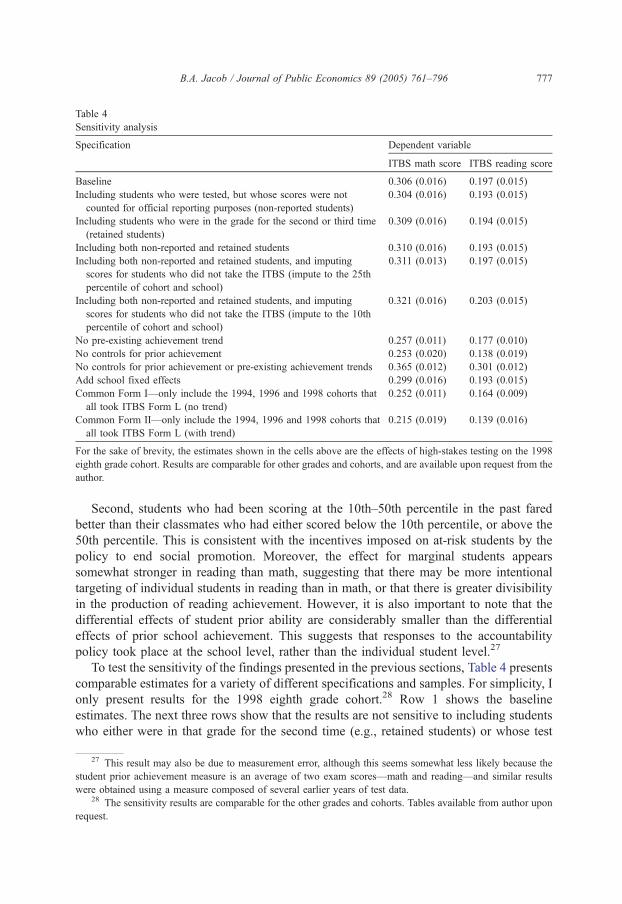
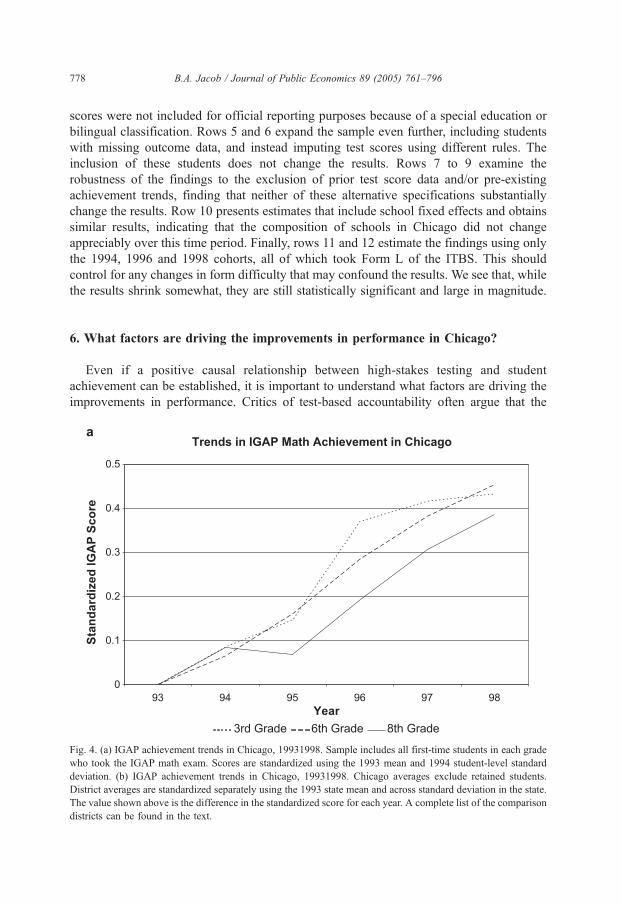
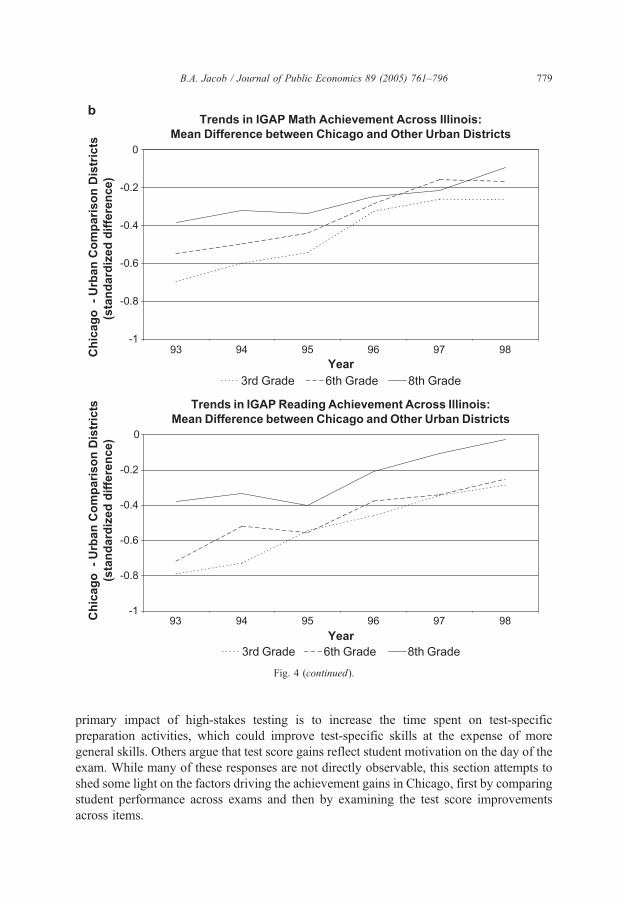
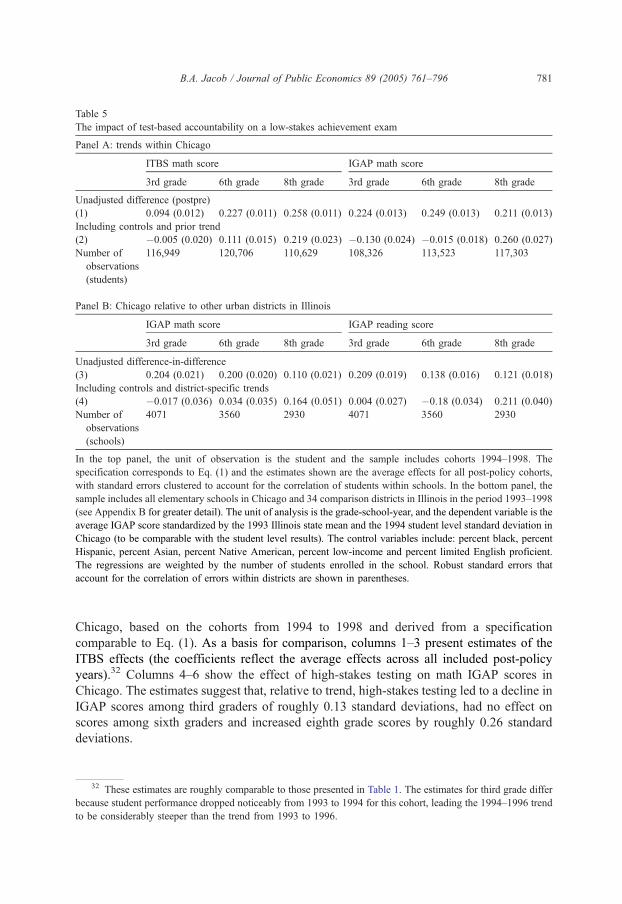
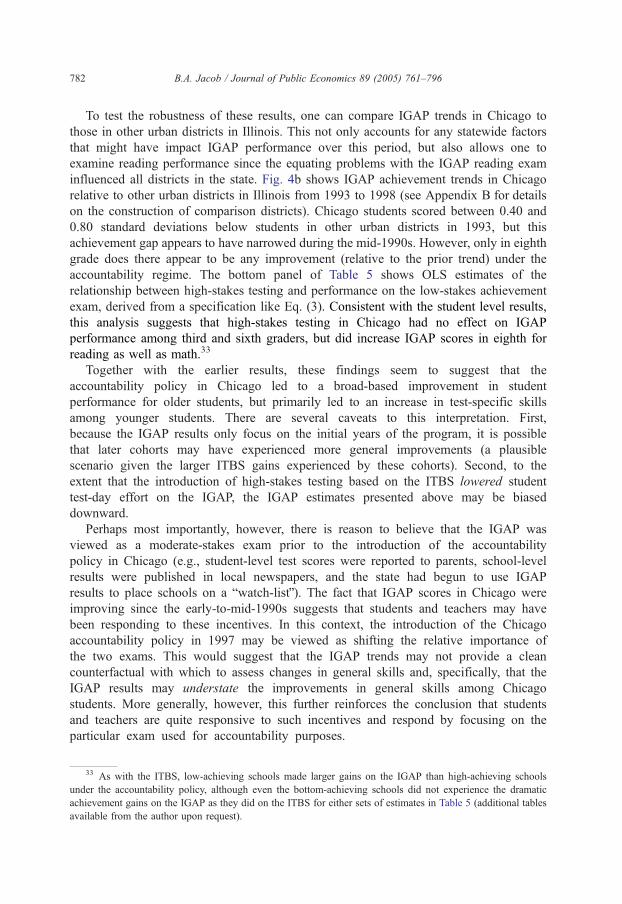
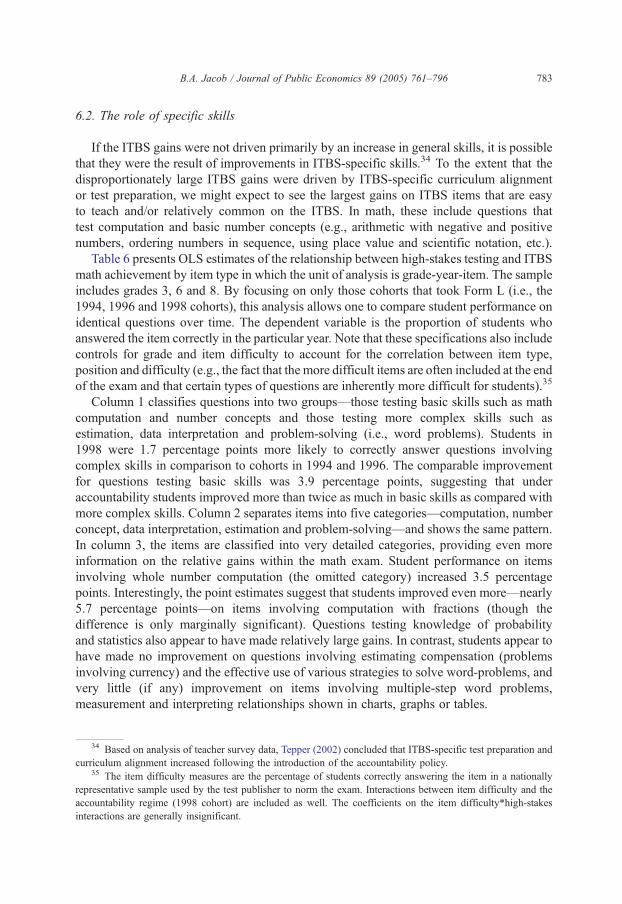
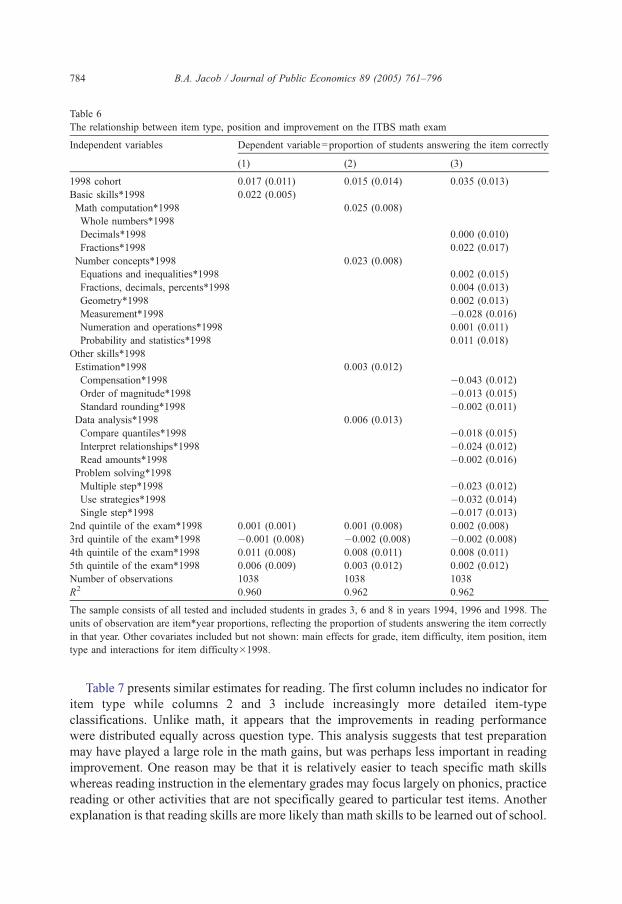
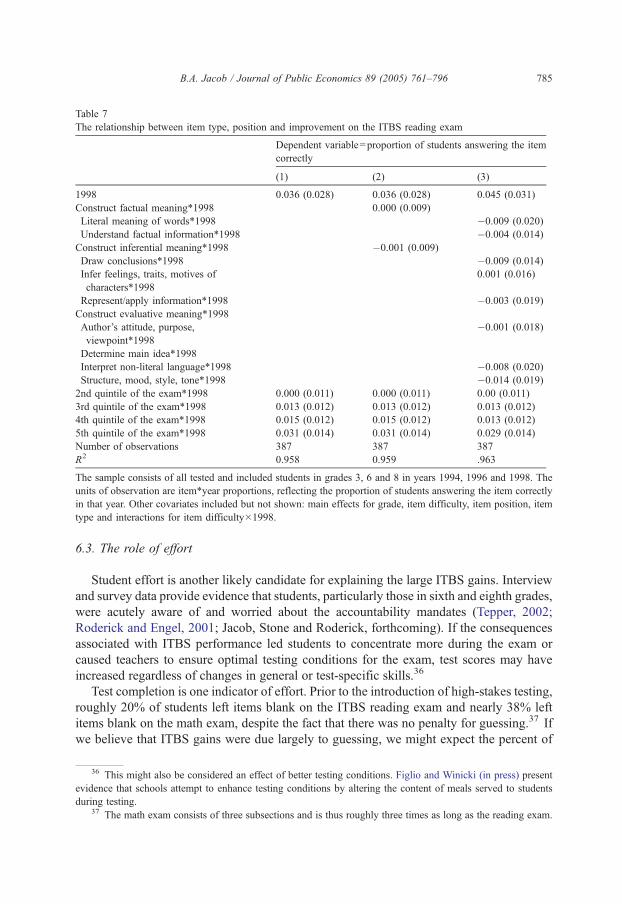
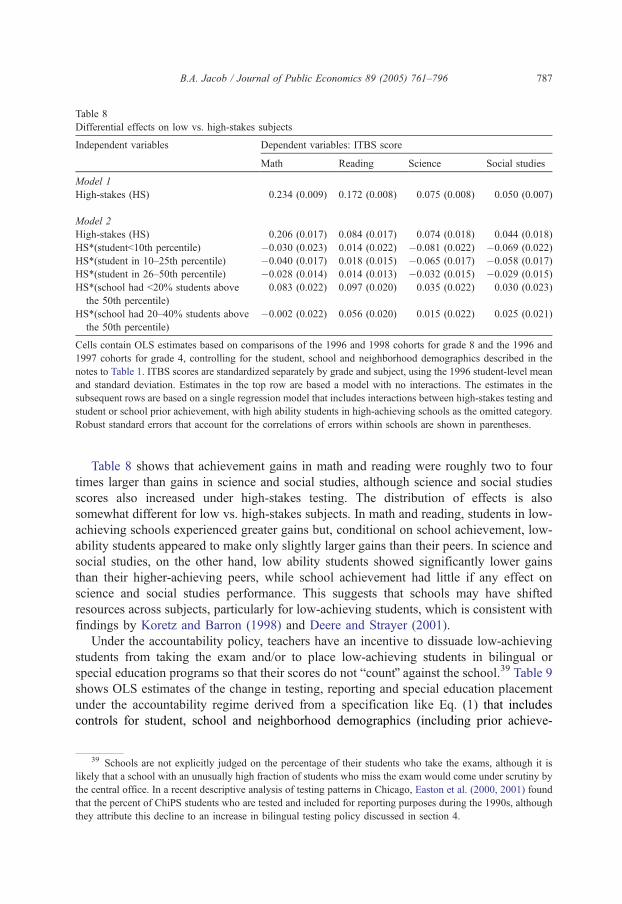
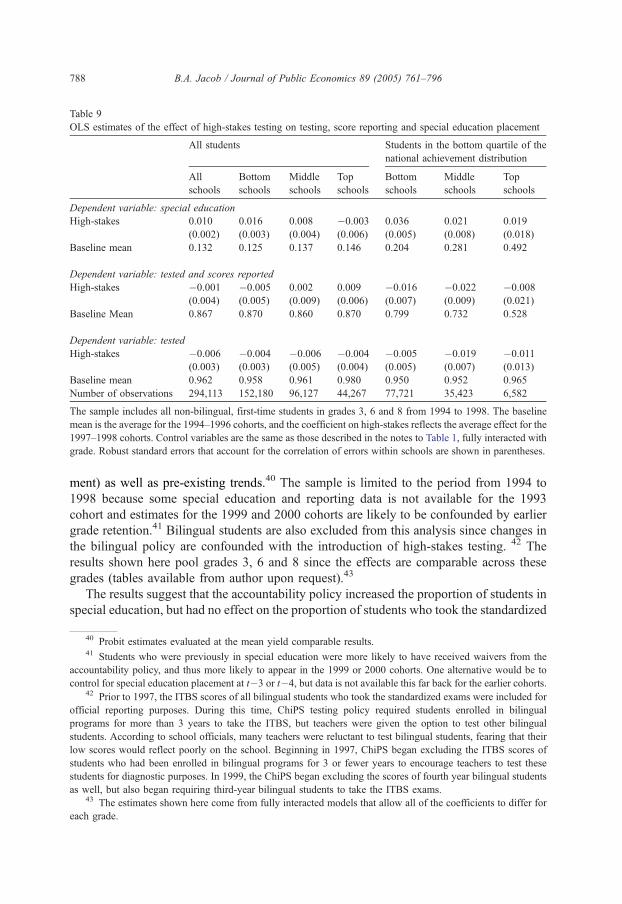
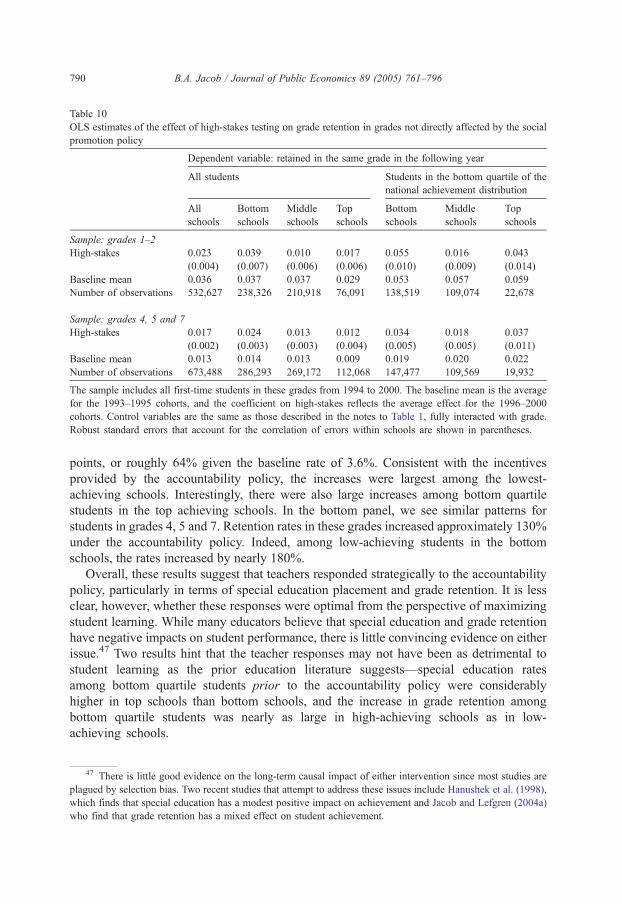
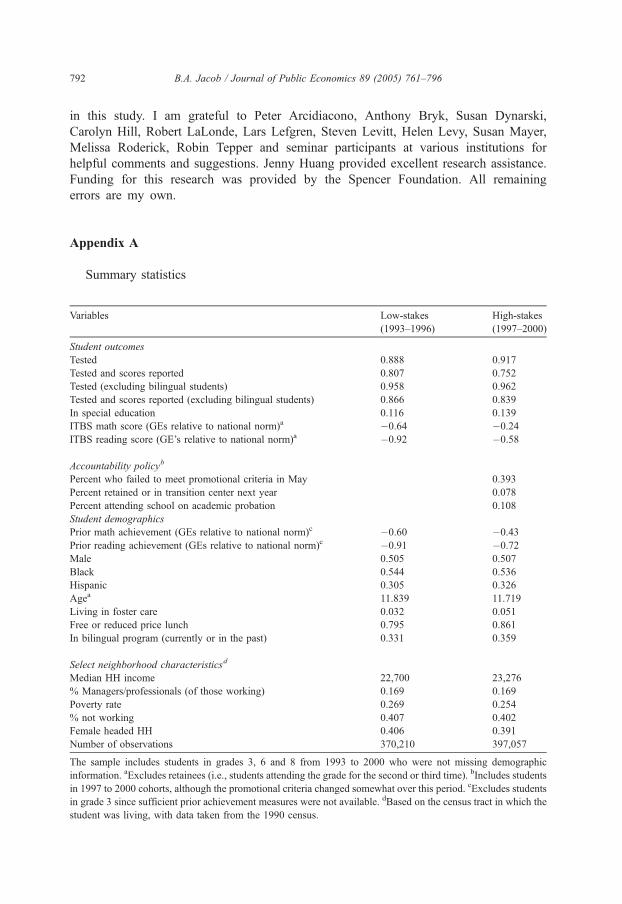