Embed Size (px)
Citation preview
Accounting for Management:
Concepts and Tools
Publication Date: May 2016
Accounting for Management: Concepts and Tools
Copyright 2016 by
DELTACPE LLC
All rights reserved. No part of this course may be reproduced in any form or by any means, without permission
in writing from the publisher.
The author is not engaged by this text or any accompanying lecture or electronic media in the rendering of legal,
tax, accounting, or similar professional services. While the legal, tax, and accounting issues discussed in this
material have been reviewed with sources believed to be reliable, concepts discussed can be affected by
changes in the law or in the interpretation of such laws since this text was printed. For that reason, the accuracy
and completeness of this information and the author's opinions based thereon cannot be guaranteed. In
addition, state or local tax laws and procedural rules may have a material impact on the general discussion. As a
result, the strategies suggested may not be suitable for every individual. Before taking any action, all references
and citations should be checked and updated accordingly.
This publication is designed to provide accurate and authoritative information in regard to the subject matter
covered. It is sold with the understanding that the publisher is not engaged in rendering legal, accounting, or
other professional service. If legal advice or other expert advice is required, the services of a competent
professional person should be sought.
—-From a Declaration of Principles jointly adopted by a committee of the American Bar Association and a
Committee of Publishers and Associations.
Course Description
A primer on the basic theoretical concepts and the practical procedures of financial record keeping and
reporting, and the use of financial and cost data in managerial decision making. It provides an understanding
and working knowledge of the fundamentals of financial and managerial accounting that can be put to practical
application in day-to-day jobs of managers. It also concentrates on providing a working vocabulary for
communication. Topics include accounting principles and reporting trends, accounting conventions and systems,
interpretation and analysis of financial statements; cast flow statement; break-even analysis; activity-based
costing (ABC); responsibility accounting; budget for profit planning; short-term and long-term investment
decision making. A list of computer software for accounting, ABC, and budgeting is presented.
Field of Study Accounting
Level of Knowledge Basic to Intermediate
Prerequisite None
Advanced Preparation None
Table of Contents Chapter 1: Introduction to Accounting ............................................................................................ 1
Learning Objectives: ...................................................................................................................................1
Nature and Scope of Accounting .................................................................................................................1
Accounting: The Basis for Decision Making ........................................................................................................................ 2
The Major Areas of Accounting ...................................................................................................................2
Private Accounting .............................................................................................................................................................. 2
Public Accounting ................................................................................................................................................................ 2
Governmental Accounting .................................................................................................................................................. 2
Major Accounting Rule-Making Organizations .............................................................................................3
American Institute of CPAs ................................................................................................................................................. 3
Financial Accounting Standards Board (FASB) .................................................................................................................... 3
Securities and Exchange Commission (SEC) ........................................................................................................................ 3
The International Accounting Standards Board (IASB) ....................................................................................................... 4
Public Company Accounting Oversight Board (PCAOB) ...................................................................................................... 4
Governmental Accounting Standards Board (GASB)........................................................................................................... 4
Other Organizations ............................................................................................................................................................ 4
The Global Trends and Developments in Financial Reporting .......................................................................4
The Basic Accounting Principles ..................................................................................................................5
Historical Cost ..................................................................................................................................................................... 5
Conservatism....................................................................................................................................................................... 5
Consistency ......................................................................................................................................................................... 5
Comparability ...................................................................................................................................................................... 5
Going Concern ..................................................................................................................................................................... 6
Matching ............................................................................................................................................................................. 6
Realization ........................................................................................................................................................................... 6
Accrual ................................................................................................................................................................................ 6
Materiality ........................................................................................................................................................................... 6
Disclosure ............................................................................................................................................................................ 6
Objectivity ........................................................................................................................................................................... 6
Timeliness ........................................................................................................................................................................... 7
Relevant .............................................................................................................................................................................. 7
Stable Dollar ........................................................................................................................................................................ 7
Accounting Period ............................................................................................................................................................... 7
Entity ................................................................................................................................................................................... 7
The Concept of the Business Entity .............................................................................................................7
Sole Proprietorship ............................................................................................................................................................. 7
Partnership .......................................................................................................................................................................... 8
Corporation ......................................................................................................................................................................... 8
Presenting Accounting Information through Financial Statements ...............................................................8
Balance Sheet ...................................................................................................................................................................... 8
Owners’ Equity .................................................................................................................................................................... 9
Income Statement ............................................................................................................................................................... 9
Statement of Cash Flows ................................................................................................................................................... 10
Chapter 1 Review Questions ............................................................................................................................................. 11
Chapter 2: Understanding the Financial Statements ...................................................................... 13
Learning Objectives: ................................................................................................................................. 13
The Income Statement and Balance Sheet ................................................................................................ 13
Revenue ............................................................................................................................................................................ 14
Expenses............................................................................................................................................................................ 14
Net Income (Loss) ............................................................................................................................................................. 14
Assets ................................................................................................................................................................................ 15
Liabilities ........................................................................................................................................................................... 15
Equity ................................................................................................................................................................................ 16
The Statement of Cash Flows .................................................................................................................... 18
FASB Requirements ........................................................................................................................................................... 19
Accrual Basis of Accounting .............................................................................................................................................. 19
Operating Activities ........................................................................................................................................................... 20
Investing Activities ............................................................................................................................................................ 20
Financing Activities ........................................................................................................................................................... 20
Notes to Financial Statements .................................................................................................................. 21
Summary ........................................................................................................................................................................... 22
Chapter 2 Review Questions ............................................................................................................................................. 23
Chapter 3: Recording Financial Information and Accounting Conventions ...................................... 24
Learning Objectives: ................................................................................................................................. 24
Double Entry and the Accounting Equation ............................................................................................... 25
The Accounting Equation .................................................................................................................................................. 25
The Account ...................................................................................................................................................................... 29
Ledger ............................................................................................................................................................................... 30
A Chart of Accounts .......................................................................................................................................................... 30
The System of Debits and Credits .............................................................................................................. 32
The "How and Why" of Debits and Credits ................................................................................................ 33
Journals ................................................................................................................................................... 33
Types of Depreciation Methods ................................................................................................................ 33
Straight-Line Method ........................................................................................................................................................ 34
Sum-of-the-Years'-Digits (SYD) Method ............................................................................................................................ 34
Double-Declining-Balance (DDB) Method ......................................................................................................................... 35
Units of Production Method ............................................................................................................................................. 36
Which Method to Use ....................................................................................................................................................... 36
Summary ........................................................................................................................................................................... 37
Chapter 3 Review Questions ............................................................................................................................................. 38
Chapter 4: Analysis of the Financial Statements ............................................................................ 39
Learning Objectives: ................................................................................................................................. 39
Who Uses Financial Analysis? ................................................................................................................... 39
Internal Managers ............................................................................................................................................................. 39
External Users ................................................................................................................................................................... 40
Horizontal and Vertical Analysis........................................................................................................................................ 40
Financial Statement Analysis .................................................................................................................... 40
Trend Analysis ................................................................................................................................................................... 40
Ratio Analysis........................................................................................................................................... 45
Liquidity Analysis ............................................................................................................................................................... 46
Working Capital ................................................................................................................................................................. 47
Accounts-Receivable Ratios .............................................................................................................................................. 48
Inventory Ratios ................................................................................................................................................................ 49
Interrelationship of Liquidity and Activity to Earnings ...................................................................................................... 50
Measuring a Company’s Ability to Pay Its Long-Term Debt .............................................................................................. 50
Profitability Ratios ............................................................................................................................................................. 52
Earnings per Share ............................................................................................................................................................ 54
Evaluating Stock as an Investment .................................................................................................................................... 55
Book Value and Market Value for Selected Companies.................................................................................................... 56
Limitations of Ratio Analysis ..................................................................................................................... 56
Summary ........................................................................................................................................................................... 57
Chapter 4 Review Questions ............................................................................................................................................. 58
Chapter 5: What Is Management Accounting? .............................................................................. 60
Learning Objectives: ................................................................................................................................. 60
Financial Accounting versus Management Accounting ............................................................................... 60
The Work of Management ........................................................................................................................ 61
Cost Accounting versus Management Accounting ..................................................................................... 61
Controllership .......................................................................................................................................... 62
Managerial Accounting in the New Production Environment ..................................................................... 64
Total Quality Management and Quality Costs .................................................................................................................. 64
Continuous Improvement (CI) and Benchmarking ............................................................................................................ 65
Business Process Reengineering (BPR).............................................................................................................................. 65
Just-in-Time and Lean Production..................................................................................................................................... 65
Theory of Constraints (TOC) and Bottlenecks Management ............................................................................................ 66
Cost Classifications and Profit Concepts .................................................................................................... 66
Costs by Management Function ................................................................................................................ 67
Product Costs and Period Costs ................................................................................................................. 69
Direct Costs and Indirect Costs .................................................................................................................. 69
Direct Costs of Nonmanufacturing Firms .......................................................................................................................... 70
Variable Costs, Fixed Costs, and Mixed Costs............................................................................................. 70
Unit Costs and Total Costs ........................................................................................................................ 71
Unit ................................................................................................................................................ 72
Costs for Planning, Control, and Decision Making ...................................................................................... 72
Merchandising vs Manufacturing Organizations ........................................................................................ 74
Income Statements and Balance Sheets - Manufacturer ............................................................................ 76
The Contribution Income Statement ......................................................................................................... 78
Chapter 5 Review Questions ............................................................................................................................................. 80
Chapter 6: Product Costing Methods: Job Order Costing, Process Costing, And Activity-Based
Costing ........................................................................................................................................... 82
Learning Objectives: ................................................................................................................................. 82
Job Order Costing and Process Costing Compared ..................................................................................... 83
DIFFERENCES BETWEEN JOB ORDER COSTING AND PROCESS COSTING ............................................. 83
Job Order Costing ..................................................................................................................................... 83
Job Cost Records ...................................................................................................................................... 84
Factory Overhead Application................................................................................................................... 87
Predetermined Factory Overhead Rate ............................................................................................................................ 88
Disposition of Under- and Over-Applied Overhead .......................................................................................................... 88
Plantwide versus Departmental Overhead Rates ............................................................................................................. 89
TOTAL PRODUCT COSTS AND PROFITS ............................................................................................. 91
Activity-Based Costing .............................................................................................................................. 91
Composition of Product Cost .................................................................................................................... 92
First-Stage Procedure ........................................................................................................................................................ 94
Second-Stage Procedure ................................................................................................................................................... 94
Using Activity-Based Costing To Make Marketing Decisions ....................................................................... 97
A List of Activity-Based Costing (ABC) Software ......................................................................................... 98
Chapter 6 Review Questions ............................................................................................................................................. 99
Chapter 7: Cost Behavior and Cost-Volume-Profit Analysis .......................................................... 100
Learning Objectives: ............................................................................................................................... 100
A Further Look at Costs by Behavior ........................................................................................................ 101
Types of Fixed Costs - Committed or Discretionary .................................................................................. 102
Analysis of Mixed (Semi-variable) Costs .................................................................................................. 103
Relevant Range ............................................................................................................................................................... 103
Engineering Analysis ............................................................................................................................... 103
Account Analysis .................................................................................................................................... 104
The High-Low Method ............................................................................................................................ 104
Questions Answered by CVP Analysis ...................................................................................................... 107
Contribution Margin (CM) ............................................................................................................................................... 107
Break-Even Analysis ............................................................................................................................... 108
Graphical Approach......................................................................................................................................................... 109
Determination of Target Income Volume ....................................................................................................................... 109
Impact of Income Taxes .................................................................................................................................................. 110
Margin of Safety .............................................................................................................................................................. 110
Present ......................................................................................................................................... 112
Proposed ...................................................................................................................................... 112
Difference ..................................................................................................................................... 112
Sales Mix Analysis .................................................................................................................................. 112
Deluxe .................................................................................................................................................... 113
Standard ................................................................................................................................................ 113
Chapter 7 Review Questions ........................................................................................................................................... 114
Chapter 8: Budgeting and Standard Cost Systems ....................................................................... 115
Learning Objectives: ............................................................................................................................... 115
Types of Budgets .................................................................................................................................... 115
The Sales Budget ............................................................................................................................................................. 117
Monthly Cash Collections from Customers ..................................................................................................................... 118
The Production Budget ................................................................................................................................................... 119
Inventory Purchases – Merchandising Firm .................................................................................................................... 120
The Cash Budget ............................................................................................................................................................. 120
The Budgeted Income Statement ................................................................................................................................... 122
The Budgeted Balance Sheet .......................................................................................................................................... 122
Financial Modeling: Computer-Based and Spreadsheet Models for Budgeting ............................................................ 123
Standard Costs and Variance Analysis ..................................................................................................... 123
General Model for Variance Analysis ...................................................................................................... 124
Materials Variances ......................................................................................................................................................... 124
Labor Variances ............................................................................................................................................................... 125
Variable Overhead Variances .......................................................................................................................................... 126
Nonfinancial Performance Measures ...................................................................................................... 127
Budgeting and Planning Software ........................................................................................................... 128
Chapter 8 Review Questions ........................................................................................................................................... 129
Chapter 9: Responsibility Accounting .......................................................................................... 131
Learning Objectives: ............................................................................................................................... 131
Responsibility Accounting and Responsibility Center ............................................................................... 131
Control of Profit Centers ......................................................................................................................... 133
Segmental Reporting for Profit Centers ................................................................................................... 133
Control of Investment Centers ................................................................................................................ 135
Rate of Return on Investment (ROI) ........................................................................................................ 135
Operating assets ........................................................................................................................... 136
The Breakdown of ROI -- Du Pont Formula ..................................................................................................................... 136
ROI and Profit Planning ................................................................................................................................................... 139
Residual Income (RI) ............................................................................................................................... 141
Residual Income and Economic Value Added ................................................................................................................. 141
Investment Decisions under ROI and RI ................................................................................................... 142
Chapter 9 Review Questions ........................................................................................................................................... 143
Chapter 10: Relevant Costs and Short-Term Decisions ................................................................. 145
Learning Objectives: ............................................................................................................................... 145
Relevant Costs Defined ........................................................................................................................... 145
Pricing a Special Order ............................................................................................................................ 146
Outsourcing: The Make or Buy Decision .................................................................................................. 147
The Sell-or-Process-Further Decision ....................................................................................................... 148
Keeping or Dropping a Product Line ........................................................................................................ 149
Product Mix Decisions in the Presence of Limited Resources ................................................................... 151
Theory of Constraints ............................................................................................................................. 152
You Should Remember.................................................................................................................................................... 152
Chapter 10 Review Questions ......................................................................................................................................... 154
Chapter 11: Capital Budgeting Decisions ..................................................................................... 156
Learning Objectives: ............................................................................................................................... 156
What Are the Features of Investment Projects? ...................................................................................... 156
Understanding the Concept of Time Value of Money ............................................................................... 157
What Is Present Value - How Much Money Is Worth Now? ........................................................................................... 157
Present Value of Mixed Streams of Cash Flows .............................................................................................................. 158
Present Value of an Annuity ........................................................................................................................................... 158
How Do You Measure Investment Worth? .............................................................................................. 159
Payback Period ................................................................................................................................................................ 159
Accounting Rate of Return .............................................................................................................................................. 160
Internal Rate of Return ................................................................................................................................................... 160
Net Present Value ........................................................................................................................................................... 161
NPV versus IRR: Mutually Exclusive Projects .................................................................................................................. 162
Chapter 11 Review Questions ......................................................................................................................................... 163
Glossary ........................................................................................................................................ 164
Index ............................................................................................................................................ 170
Appendix ...................................................................................................................................... 172
Review Question Answers ............................................................................................................. 174
Chapter 1 Review Questions ........................................................................................................................................... 174
Chapter 2 Review Questions ........................................................................................................................................... 177
Chapter 3 Review Questions ........................................................................................................................................... 178
Chapter 4 Review Questions ........................................................................................................................................... 180
Chapter 5 Review Questions ........................................................................................................................................... 182
Chapter 6 Review Questions ........................................................................................................................................... 184
Chapter 7 Review Questions ........................................................................................................................................... 186
Chapter 8 Review Questions ........................................................................................................................................... 187
Chapter 9 Review Questions ........................................................................................................................................... 189
Chapter 10 Review Questions ......................................................................................................................................... 190
Chapter 11 Review Questions ......................................................................................................................................... 192
PREFACE
Accounting for Management is a basic survey course specifically designed for managers and business owners. Each
accounting subject is presented in a clear and concise manner that enables a beginning learner to quickly grasp and
understand the topic under discussion. This course provides students with their first practical exposure to such
accounting topics as fundamental accounting concepts and tools, financial statements, and managerial use of
accounting information. The goals of the course are threefold:
1. It provides an understanding and working knowledge of the fundamentals of financial and managerial
accounting that can be put to practical application in day-to-day jobs of managers.
2. It also concentrates on providing a working vocabulary for communication.
3. It uses the solved problems approach, with emphasis on the practical application of accounting
concepts, tools, and methodology.
1
Chapter 1: Introduction to Accounting
Learning Objectives:
After completing this section, you should be able to:
Recognize the primary statements used and the key areas of accounting.
Recognize major accounting rule-making organizations.
Identify the global focus in financial reporting.
Identify the basic accounting principles.
Identify the different types of business entities.
The basic objective of financial accounting is to provide information about economic entities to interested
parties. Interested parties include investors, creditors, managers, unions, and government agencies. Financial
information typically takes the form of financial statement. It also includes prospectuses, internal control
certifications, valuations, budgets, and forecasts. Management accounting, on the other hand, is concerned
primarily with providing information to internal managers who are charged with planning and controlling the
operations of the firm and making a variety of management decisions.
Nature and Scope of Accounting
Financial statements, which consist of a balance sheet, an income statement, a statement of cash flows, and a
statement of owner’s/or stockholder’s equity, are used to evaluate the financial condition of an enterprise.
Financial reporting and analysis is of particular interest to creditors, potential and current stockholders,
management, government agencies, customers, and labor. Creditors are primarily interested in the ability of the
company to meet its current and long-term debts. Stockholders are more interested in the present and future
profitability of the enterprise. Management usually focuses on the trend in net earnings and makes decisions
concerning possible changes in the existing capital structure in an attempt to maximize profits. The Internal
Revenue Service might use the financial statements to determine whether the enterprise is paying its fair share
2
of taxes, while other branches of the government use the information to study economic trends in the industry.
Customers are concerned that the company will be financially able to maintain a steady source of supply and
meet all of its commitments. Finally, labor might use the statements to formulate realistic (or unrealistic) wage
proposals.
Accounting: The Basis for Decision Making
Accounting provides the information required to make business decisions to accomplish the entity’s financial
goals. If a business is to be successful, it must generate earnings that are sufficient to meet the objectives of
profitability and liquidity. Management may also have other goals such as product improvement and the
expansion of operations. To accomplish these objectives, management must select among various alternatives
and must also study their consequences. The information generated by the accounting records, together with
analysis of such data, is the basis on which virtually all business decisions are made.
The Major Areas of Accounting
The major areas of accounting are private, public, and governmental accounting.
Private Accounting
Private accounting deals with the private sector. The accountant working in private industry is employed by a
single enterprise. An accountant may be employed as a controller or chief financial officer. Job responsibilities
may include preparing budgets and departmental reports, and reviewing the work of the accounting staff. The
accountant may also have other functions, such as running the business, hiring managers, setting financial
objectives, and ensuring that company policies are followed.
Public Accounting
Public accounting refers to work performed by independent certified public accounting firms. Some accountants
keep books and records of organizations that are too small to employ their own accounting department. Others
perform the function of auditing-the independent review of the financial records of a business. Public
accountants may also be called upon to design accounting systems and prepare tax returns for their clients. An
accountant must pass a rigorous professional examination and satisfy working experience requirements to
obtain a license to practice as a certified public accountant (CPA).
Governmental Accounting
Governmental accounting refers to the functions performed by accountants for federal, state, and local
agencies. However, accounting for governmental activities requires a somewhat different approach because the
profit motive is absent from most governmental agencies. Other nonprofit entities, such as universities,
3
hospitals, and churches, also follow a system of accounting procedures that are similar to governmental
accounting.
Major Accounting Rule-Making Organizations
Accounting theory provides the framework for the practice of accounting. Generally, accepted accounting
principles (GAAP) constitute the framework for acceptable accounting practice at a given period of time. These
standards are continually revised as business conditions change. A number of organizations are instrumental in
developing accounting standards in the United States.
American Institute of CPAs
The American Institute of Certified Public Accountants (AICPA) is the national accounting organization composed
of practicing Certified Public Accountants, government officials who are CPAs, and college professors. In 1959,
the AICPA created the Accounting Principles Board (APB), which sought to promote proper accounting principles
and to resolve inconsistencies in virtually all areas of accounting practice. The board issued thirty-one
accounting opinions, some of which are still in use today in the accounting profession. Upon the APB’s
dissolution in 1973, the Financial Accounting Standards Board (FASB) was created. The AICPA also issues
Statements on Auditing Standards, which set forth the requirements to be followed by independent CPAs when
conducting audits of their clients’ financial statements.
Financial Accounting Standards Board (FASB)
The Financial Accounting Standards Board (FASB) is the most important body for developing rules on accounting
practice. This independent body has been designated by the Securities and Exchange Commission to issue the
Statements of Financial Accounting Standards. The FASB organizes these statements including any amendments,
interpretations, or other references to them into a topical U.S. GAAP compendium called an American Standard
Codification (ASC). This codification, which is available through the FASB website, makes it easy to find all
references to a particular topic, such as revenues, in one place.
Securities and Exchange Commission (SEC)
The Securities and Exchange Commission (SEC) is an independent regulatory agency of the United States
government created to administer the Securities Act of 1933, the Securities Exchange Act of 1934, and several
other regulatory Acts. The SEC issues Accounting Series Releases, which contain the requirements regarding the
content of financial statements and the reporting standards to be followed. All corporations that offer securities
for sale to the public must file audited financial statements annually with the SEC.
4
The International Accounting Standards Board (IASB)
The International Accounting Standards Board (IASB), which issues international financial reporting standards
(IFRS), is becoming increasingly important because of the acceptance of its standards in many financial markets
throughout the world. The SEC now allows foreign companies to use these standards in the United States rather
than having to convert their statements to U.S. GAAP. However, the SEC postponed indefinitely any
consideration of allowing U.S. public companies to use IFRS.
Public Company Accounting Oversight Board (PCAOB)
The Public Company Accounting Oversight Board (PCAOB), a governmental body created by the Sarbanes-Oxley Act,
regulates the accounting profession and has wide powers to determine the standards that auditors must follow and to
discipline them if they do not. The PCAOB regulates audits of public companies registered with the SEC.
Governmental Accounting Standards Board (GASB)
The mission of the Governmental Accounting Standards Board is to establish and improve standards of state and
local governmental accounting and financial reporting that will result in useful information for users of financial
reports and guide and educate the public, including issuers, auditors, and users of those financial reports.
Other Organizations
The Internal Revenue Service (IRS), which derives its authority from the Internal Revenue Code, exerts a very
strong influence on accounting practice. Note that good accounting procedures are not necessarily good tax
practice. Since tax considerations are an integral part of the managerial decision process, the CPA must reconcile
sound financial reporting requirements (financial accounting) with Internal Revenue Code regulations (tax
accounting). Other influential bodies that encourage research and development of sound accounting practices
include the American Institute of Certified Public Accountants (AICPA), the American Accounting Association (AAA),
the Institute of Management Accounting (IMA), and the various state societies of certified public accountants.
The Global Trends and Developments in Financial
Reporting
Although the SEC postponed measures that could have merged US GAAP and International Financial Reporting
Standards (IFRS) for all US companies, there are still forces moving financial reporting more and more toward
globalized standards. Further, across the world the focus is changing. The accounting may provide security; the
reporting provides the information. Users may not be as interested in the financial reporting or accounting
conventions toward which the world is in the process of now converging. That is because users may not use the
traditional financial statements themselves, preferring instead to put much greater weight on the non-financial
information that will be part of a new business reporting model, or to generate their own financial reports
5
New Financial Reporting Focus
Accounting has become overly complex.
Companies lose faith.
Investors need clearer information.
Reporting needs to become clearer.
Greater weight on the non-financial data.
Internal drivers favored.
Upturn in narrative information.
The Basic Accounting Principles
To understand financial statements, one must understand generally accepted accounting principles. The
purpose of these standards is to guide accountants in measuring and reporting the financial events that make up
the life of the business. The information must be relevant, reliable, and comparable. The accounting standards
and concepts used in the preparation of financial statements are as follows:
Historical Cost
Assets acquired, as well as liabilities incurred by an enterprise, must be recorded at their cost. When costs
benefit more than one period, they must be allocated over the period benefited.
Conservatism
Conservatism means that an accountant should anticipate no profits, but anticipate all losses. Where use of the
most appropriate accounting treatment is uncertain, or in making estimates, the favored accounting treatment
should be that which understates rather than overstates income or net assets (assets minus liabilities).
Consistency
The usefulness of accounting information is increased when the information is presented in a manner consistent
with that used in prior periods. To achieve consistency over a period of reporting years, companies must follow
the same accounting practices from period to period. The application of consistent accounting principles also
prevents income manipulation by management.
Comparability
The comparability principle requires that financial information be measured and reported in a comparable
manner from company to company and from period to period. If there is an absence of comparability, it should
be disclosed.
6
Going Concern
It is assumed that an entity is a going concern and will continue indefinitely unless there is evidence to the
contrary. Under this assumption, accountants must record assets at their original cost and not at what they
would be sold for if the company were to go out of business.
Matching
For income to be stated fairly, all expenses incurred in generating the income must be recorded in that same
period as revenues. For example, the sale of merchandise must be offset by the actual cost of the goods sold.
Realization
A business should record at the time services are rendered to customers or goods are sold or delivered to
customers. Thus, revenue is to be recorded when earned and not when the cash payment is actually received.
Accrual
A business recognizes revenue in the period in which it is earned and deducts expenses in the same period the
expenses are incurred in generating this revenue. Revenue is not necessarily recognized when cash is received
and expense is not necessary incurred when cash is paid.
Materiality
An item is material if its inclusion in the financial statements would influence or change the judgment of a
reasonable person. If the information would have no impact on the decision-maker, it is not deemed material.
The issue is one of relative size and importance. The basis for a materiality judgment is generally not sufficient
unless the nature of the item, the circumstances in which the judgment has to be made, and the magnitude of
the item are all considered.
Disclosure
Financial statements should be presented in a manner that will reasonably assure a complete understanding of
all relevant accounting information useful for decision making. Financial information that would influence a
reader’s judgment should be disclosed in the body of the financial statements, the footnotes, or supplementary
schedules included as part of the financial statements.
Objectivity
Accounting data should be both (a) objectively determined, and (b) verifiable. This means that the accounting
data may be confirmed by any outside independent observer. The statements should also be neutral in that the
accounting data has not been manipulated to favor one interested user over another.
7
Timeliness
The financial information derived from the accounting system should be received promptly after the end of the
reporting period to be useful in making business decisions. In some cases, the timeliness requirement may
require the accountant to prepare reports on a prearranged schedule such as on a daily, weekly, or monthly
basis.
Relevant
To be relevant, the financial statements must contain information that would make a difference in the user’s
decision-making process. If the information found in the financial statements has no bearing on the decision of
the interested party, it is irrelevant to that decision. Relevant information helps investors, bankers, and creditors
make decisions about the past, present, and future performance of the enterprise.
Stable Dollar
In the United States, accountants have chosen to ignore the effects of inflation and deflation by adopting the
assumption that the dollar remains reasonably stable. Therefore, historical cost is used to record the cost of
assets purchased and liabilities assumed.
Accounting Period
This assumption acknowledges the necessity of providing accounting information on a periodic and timely basis
so that it is useful in decision making. Financial statements may be prepared on a monthly, quarterly (interim),
or annual basis.
Entity
The business entity concept assumes that a business enterprise is separated and distinct from its owners or
shareholders and from other businesses. This distinction exists regardless of the legal form of the enterprise.
The Concept of the Business Entity
The business entity concept treats all businesses as separate and distinct economic units. These entities may be
organized as sole proprietorships, partnerships, or corporations.
Sole Proprietorship
A sole proprietorship is an unincorporated business owned by one individual. This person is entitled to all
profits, absorbs all losses, and is personally liable for the debts of the business. This form of enterprise is
8
common to small retail shops, service enterprises, and professional practices in medicine, law, and public
accounting.
Partnership
A partnership is an organization consisting of two or more individuals who contractually agree to participate on
a joint venture and to share profits and losses in a predetermined ratio (usually equally). All partners are also
personally liable for the debts of the partnership. Many CPA firms are organized as partnerships. Decreases in
the capital accounts of either sole proprietorships or partnerships are caused by withdrawals by owners or
operating losses.
Corporation
A corporation is organized in accordance with state or federal statutes and is a separate legal entity from its
shareholders or owners. Each shareholder is personally liable only to the extent of his or her investment (stock)
in the corporation. Distributions of profits from a corporation are called dividends. The important role of the
corporation in our economy is based upon such advantages as the ability to raise large amounts of capital, the
free transferability of shares of ownership, and the limited personal liability enjoyed by the shareholders.
Although sole proprietorships are the most common form of doing business, corporations are the dominant
economic form in terms of revenue earned.
Presenting Accounting Information through Financial
Statements
Balance Sheet
The balance sheet is a detailed statement of the accounting equation. It summarizes the assets, liabilities, and
owner’s equity of a business at a specific time. To be of maximum value to creditors, analysts, and investors, a
balance sheet should be classified. This means that balance sheet items must be organized so as to
communicate the relevant information to the user. The financial position of a company can be determined from
a listing of the assets (economic resources), liabilities (obligations owed to creditors), and capital (owners’
equity).
The accounting equation
The accounting equation may be presented as follows:
Assets = Liabilities + Owners’ Equity
The two sides of the equation must always be in balance.
9
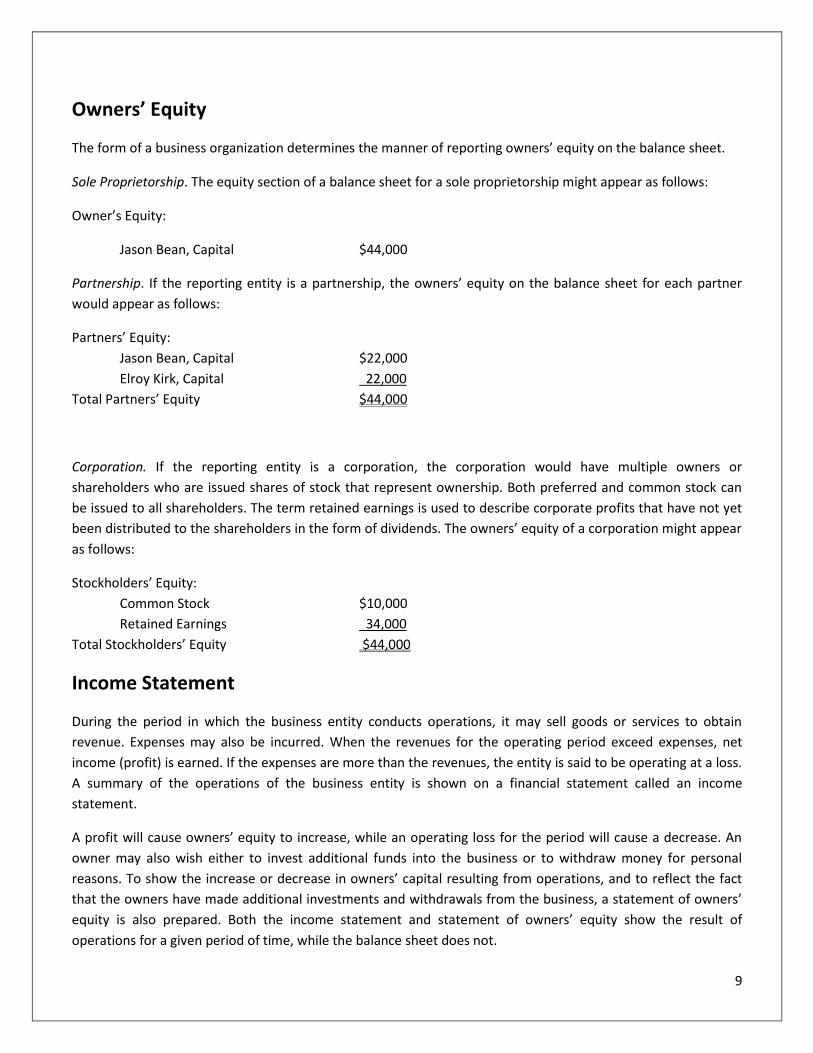
Owners’ Equity
The form of a business organization determines the manner of reporting owners’ equity on the balance sheet.
Sole Proprietorship. The equity section of a balance sheet for a sole proprietorship might appear as follows:
Owner’s Equity:
Jason Bean, Capital $44,000
Partnership. If the reporting entity is a partnership, the owners’ equity on the balance sheet for each partner
would appear as follows:
Partners’ Equity:
Jason Bean, Capital $22,000
Elroy Kirk, Capital 22,000
Total Partners’ Equity $44,000
Corporation. If the reporting entity is a corporation, the corporation would have multiple owners or
shareholders who are issued shares of stock that represent ownership. Both preferred and common stock can
be issued to all shareholders. The term retained earnings is used to describe corporate profits that have not yet
been distributed to the shareholders in the form of dividends. The owners’ equity of a corporation might appear
as follows:
Stockholders’ Equity:
Common Stock $10,000
Retained Earnings 34,000
Total Stockholders’ Equity $44,000
Income Statement
During the period in which the business entity conducts operations, it may sell goods or services to obtain
revenue. Expenses may also be incurred. When the revenues for the operating period exceed expenses, net
income (profit) is earned. If the expenses are more than the revenues, the entity is said to be operating at a loss.
A summary of the operations of the business entity is shown on a financial statement called an income
statement.
A profit will cause owners’ equity to increase, while an operating loss for the period will cause a decrease. An
owner may also wish either to invest additional funds into the business or to withdraw money for personal
reasons. To show the increase or decrease in owners’ capital resulting from operations, and to reflect the fact
that the owners have made additional investments and withdrawals from the business, a statement of owners’
equity is also prepared. Both the income statement and statement of owners’ equity show the result of
operations for a given period of time, while the balance sheet does not.
10
Statement of Cash Flows
A statement of cash flows is also required every time a company prepares an income statement. The primary
purpose of the statement of cash flows is to provide information about a company’s cash receipts and cash
payments during an accounting period. A secondary purpose of the statement is to provide information about
the company’s operating, investing, and financing activities.
11
Chapter 1 Review Questions
1. The basic financial statements include a balance sheet, income statement, and statement of activities. True or
False?
2. What is the primary purpose of the balance sheet?
A. To reflect the fair value of the firm’s assets at some moment in time
B. To show assets, liabilities, and equity
C. To show the status of the firm’s assets in case of forced liquidation of the firm
D. To reflect the firm’s potential for growth in stock values in the stock market
3. The primary current source of generally accepted accounting principles for nongovernmental U.S. entities is the
American Institute of Certified Public Accountants (AICPAs). True or False?
4. The fundamental goal of ______________________ is the development of uniform financial reporting
standards across the world.
A. Securities and Exchange Commission (SEC)
B. International Accounting Standards Board (IASB)
C. Governmental Accounting Standards Board (GASB)
D. American Institute of CPAs
5. The best indication of an enterprise's present and continuing ability to generate favorable cash flows is
information about enterprise earnings based on cash basis of accounting. True or False?
6. Materiality is one of the pervasive concepts in financial reporting. Which of the following statements is true with
regard to materiality?
A. Materiality judgments generally may be based solely on the magnitude of the item.
B. The nature and magnitude of an item as well as the circumstances in which the judgment has to be
made are integral aspects of a materiality judgment.
C. Relevant items are always material.
12
D. Materiality judgments generally may be made without consideration of the magnitude of the item
involved.
7. What concept is demonstrated by the continuation of an accounting entity in the absence of evidence to the
contrary?
A. Accounting entity
B. Consistency
C. Going concern
D. Substance over form
8. In which legal form of business organization do the owners of the business enjoy limited liability?
A. Partnership
B. Corporation
C. Sole proprietorship
D. Oligopoly
9. What is an objective of financial reporting?
A. Providing information useful to investors, creditors, management, labor, and government agencies, and
other users for decision making
B. Assessing the adequacy of internal control
C. Evaluating management results compared with standards
D. Providing information on compliance with established procedures
10. Which of the following is NOT considered to be an advantage of organizing a business as a sole proprietorship?
A. Is easy and inexpensive to organize
B. Allows freedom of action for the entrepreneur
C. Provides strong incentives to manage the business efficiently
D. Allows the proprietor to carry out all basic management functions
13
Chapter 2: Understanding the Financial Statements
Learning Objectives:
After completing this section, you should be able to:
Recognize the primary purpose and use of different accounting financial statements.
Identify the format of the income statement.
Managers should have a good understanding of the company in order to make an informed judgment on the
financial position and operating performance of the entity. The balance sheet, the income statement, and the
statement of cash flows are the primary documents analyzed to determine the company's financial condition.
The balance sheets gives the company's position in terms of its assets, liabilities, and equity or net worth, while
the income statement gives the company's sources of revenue, expenses, and net income. The statement of
cash flows allows you to analyze the company's sources and uses of cash. These financial statements are
included in the annual report.
A business entity is an economic unit that enters into business transactions that must be recorded, summarized,
and reported. Each business must have a separate set of accounting records and a separate set of financial
statements. The financial statements are the means of conveying to management and to interested outsiders a
concise picture of the value and profitability of the business for a given period of time. An examination of what
can be gained from these statements, and wherein the pitfalls lie, is useful in setting up a program or strategy
for planning and controlling profits.
The Income Statement and Balance Sheet
The income statement measures operating performance for a specified time period (like for the year ended
December 31, 20X7). The income statement shows the revenue, expenses, and net income (or loss) for a period of
definition of each element as follows.
14
Revenue
Revenue arises from the sale of merchandise (as by retail business), or the performance of services for a customer
or a client (as by a lawyer). Revenue from sales of merchandise or sales of services are often identified merely as
sales. Other terms used to identify sources of revenue include professional fees, commission revenue, and fares
earned. When revenue is earned it results in an increase in either Cash or Accounts Receivable.
Expenses
Expenses result from performing those functions necessary to generate revenue. The amount of an expense is
either equal to the cost of goods sold, the value of the services received (e.g., salary expense), or the expenditures
necessary for conducting business operations (e.g. rent expense), during the period.
Net Income (Loss)
Net Income, also called profits or earnings, is the amount by which total revenue exceeds total expenses for the
reporting period. It should be noted that revenue does not necessarily mean receipt of cash and expense does not
automatically imply a cash payment. Note that net income and net cash flow (cash receipts less cash payments) are
different. For example, taking out a bank loan will generate cash but this is not revenue since merchandise has not
been sold nor have services been provided. Further, capital has not been altered because of the loan.
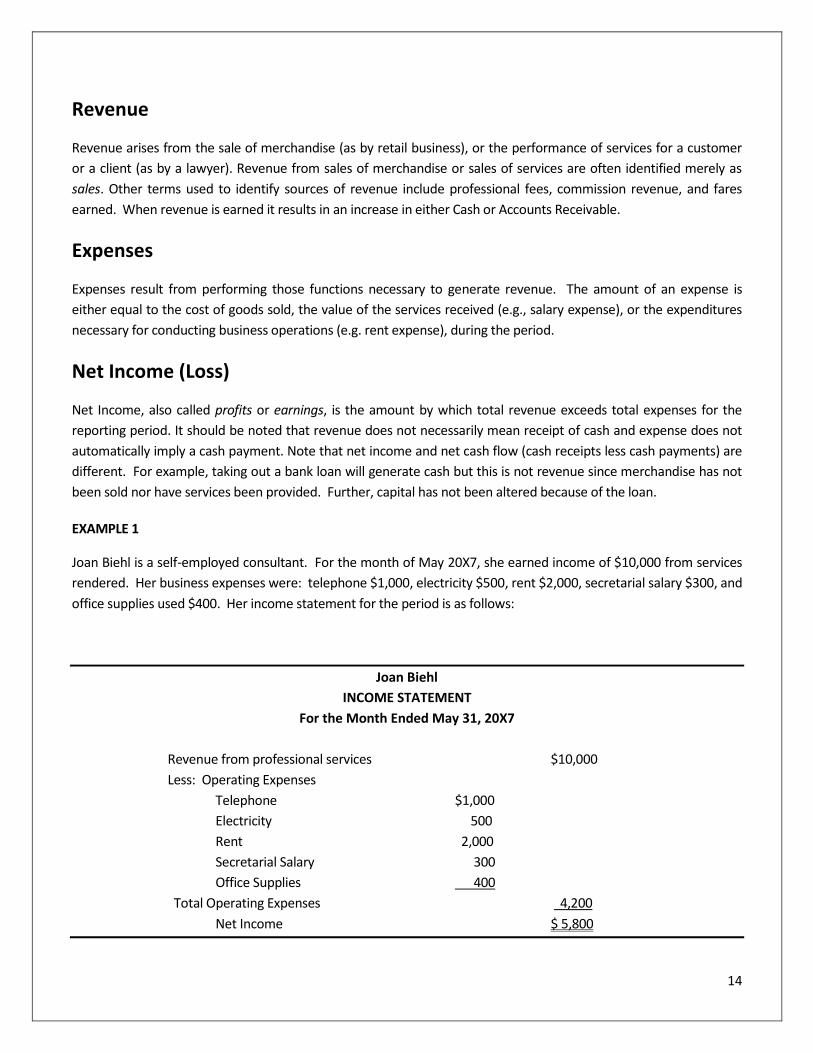
EXAMPLE 1
Joan Biehl is a self-employed consultant. For the month of May 20X7, she earned income of $10,000 from services
rendered. Her business expenses were: telephone $1,000, electricity $500, rent $2,000, secretarial salary $300, and
office supplies used $400. Her income statement for the period is as follows:
Joan Biehl
INCOME STATEMENT
For the Month Ended May 31, 20X7
Revenue from professional services $10,000
Less: Operating Expenses
Telephone $1,000
Electricity 500
Rent 2,000
Secretarial Salary 300
Office Supplies 400
Total Operating Expenses 4,200
Net Income $ 5,800
15
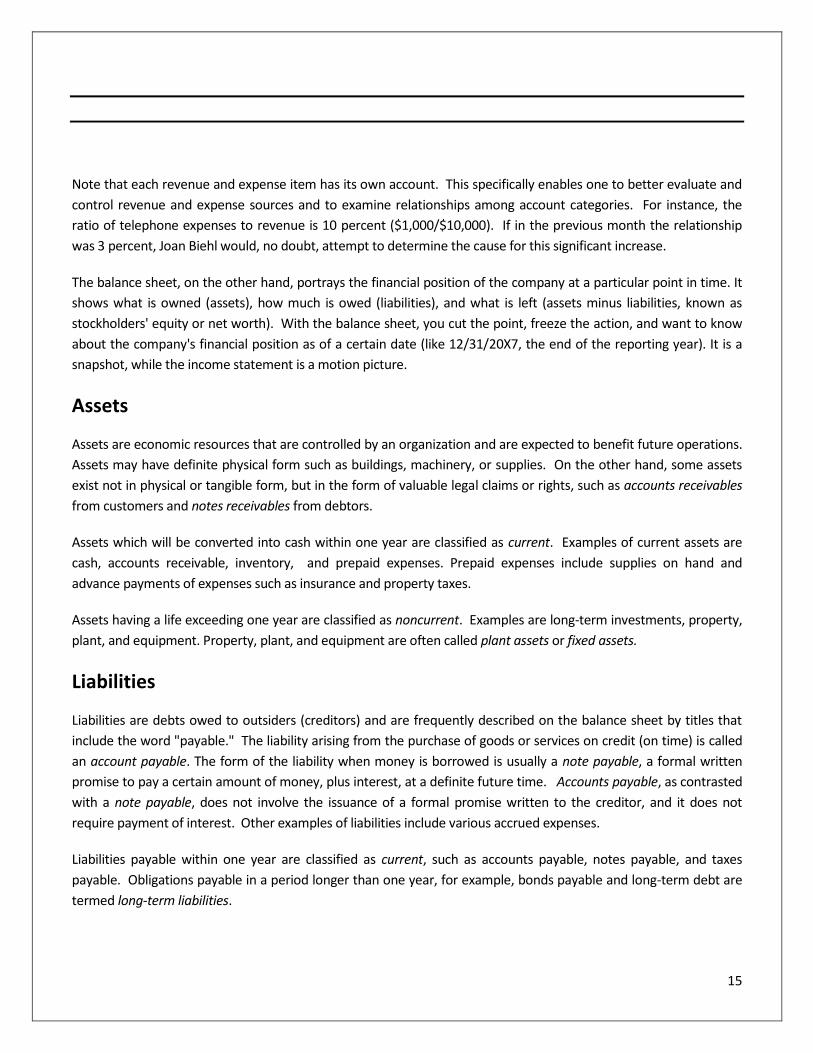
Note that each revenue and expense item has its own account. This specifically enables one to better evaluate and
control revenue and expense sources and to examine relationships among account categories. For instance, the
ratio of telephone expenses to revenue is 10 percent ($1,000/$10,000). If in the previous month the relationship
was 3 percent, Joan Biehl would, no doubt, attempt to determine the cause for this significant increase.
The balance sheet, on the other hand, portrays the financial position of the company at a particular point in time. It
shows what is owned (assets), how much is owed (liabilities), and what is left (assets minus liabilities, known as
stockholders' equity or net worth). With the balance sheet, you cut the point, freeze the action, and want to know
about the company's financial position as of a certain date (like 12/31/20X7, the end of the reporting year). It is a
snapshot, while the income statement is a motion picture.
Assets
Assets are economic resources that are controlled by an organization and are expected to benefit future operations.
Assets may have definite physical form such as buildings, machinery, or supplies. On the other hand, some assets
exist not in physical or tangible form, but in the form of valuable legal claims or rights, such as accounts receivables
from customers and notes receivables from debtors.
Assets which will be converted into cash within one year are classified as current. Examples of current assets are
cash, accounts receivable, inventory, and prepaid expenses. Prepaid expenses include supplies on hand and
advance payments of expenses such as insurance and property taxes.
Assets having a life exceeding one year are classified as noncurrent. Examples are long-term investments, property,
plant, and equipment. Property, plant, and equipment are often called plant assets or fixed assets.
Liabilities
Liabilities are debts owed to outsiders (creditors) and are frequently described on the balance sheet by titles that
include the word "payable." The liability arising from the purchase of goods or services on credit (on time) is called
an account payable. The form of the liability when money is borrowed is usually a note payable, a formal written
promise to pay a certain amount of money, plus interest, at a definite future time. Accounts payable, as contrasted
with a note payable, does not involve the issuance of a formal promise written to the creditor, and it does not
require payment of interest. Other examples of liabilities include various accrued expenses.
Liabilities payable within one year are classified as current, such as accounts payable, notes payable, and taxes
payable. Obligations payable in a period longer than one year, for example, bonds payable and long-term debt are
termed long-term liabilities.
16
Equity
Equity is a residual claim against the assets of the business after the total liabilities are deducted. Capital is the term
applied to the owner's equity in the business. Other commonly used terms for capital are owner's equity and net
worth. In a sole proprietorship, there is only one capital account since there is only one owner. In a partnership, a
capital account exists for each owner. In a corporation, capital represents the stockholders' equity, which equals the
capital stock issued plus the accumulated earnings of the business (called retained earnings). There are two types of
capital stock--common stock and preferred stock. Common stock entitles its owners to voting rights, while
preferred stock does not. Preferred stock entitles its owners to priority in the receipt of dividends and in repayment
of capital in the event of corporate dissolution.
EXAMPLE 2
The equity of the owners of the business is quite similar to the equity commonly referred to with respect to home
ownership. If you were to buy a house for $150,000 by putting down 20 percent, i.e., $30,000 of your own money
and borrowing $120,000 from a bank, you would say that your equity in the $150,000 house was $30,000.
The balance sheet may be prepared either in report form or account form. In the report form, assets, liabilities, and
capital are listed vertically. In the account form, assets are listed on the left side and liabilities and capital on the
right side.
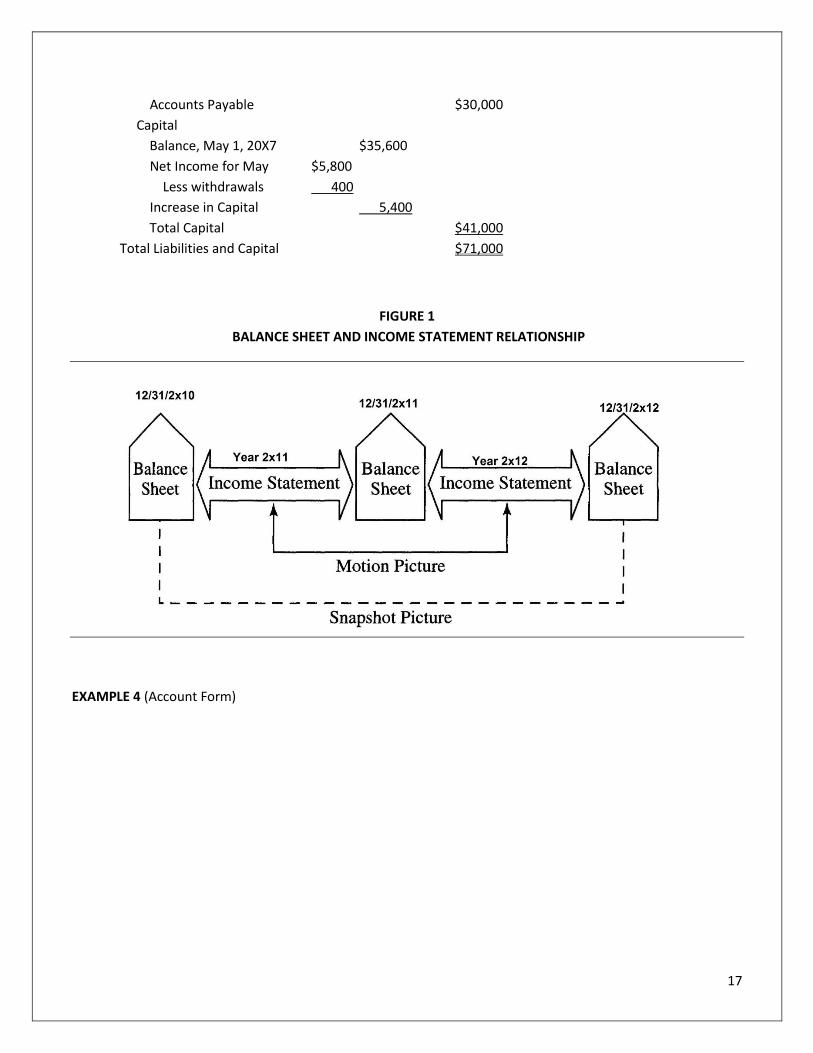
From the examples given, it is evident that there is a tie-in between the income statement and the balance sheet.
Biehl's net income of $5,800 (last item in her income statement from Example 1) is added to capital in her balance
sheet in the above example. In effect, the income statement serves as the bridge between two consecutive balance
sheets. Further, the net balance of the income statement accounts is used to adjust the Capital Account.
Figure 1 shows the relationship between the income statement and the balance sheet. In fact, the income
statement serves as a bridge between the two consecutive balance sheets.
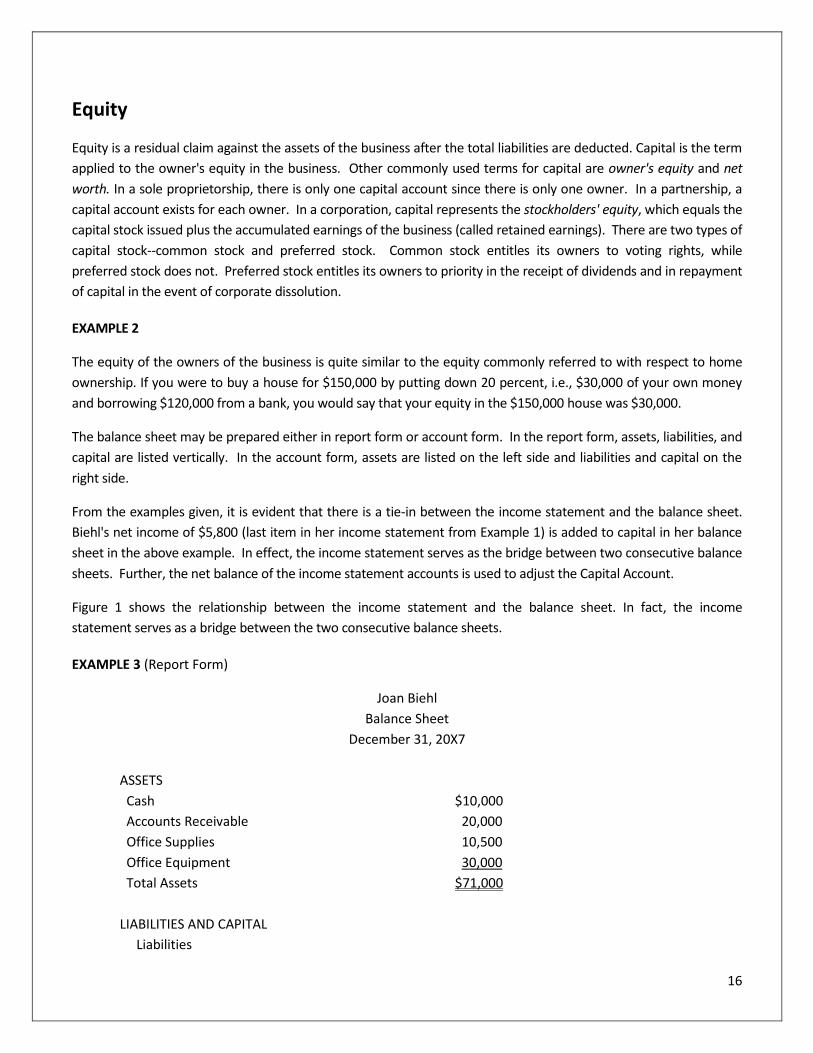
EXAMPLE 3 (Report Form)
Joan Biehl
Balance Sheet
December 31, 20X7
ASSETS
Cash $10,000
Accounts Receivable 20,000
Office Supplies 10,500
Office Equipment 30,000
Total Assets $71,000
LIABILITIES AND CAPITAL
Liabilities
17
Accounts Payable $30,000
Capital
Balance, May 1, 20X7 $35,600
Net Income for May $5,800
Less withdrawals 400
Increase in Capital 5,400
Total Capital $41,000
Total Liabilities and Capital $71,000
FIGURE 1
BALANCE SHEET AND INCOME STATEMENT RELATIONSHIP
EXAMPLE 4 (Account Form)
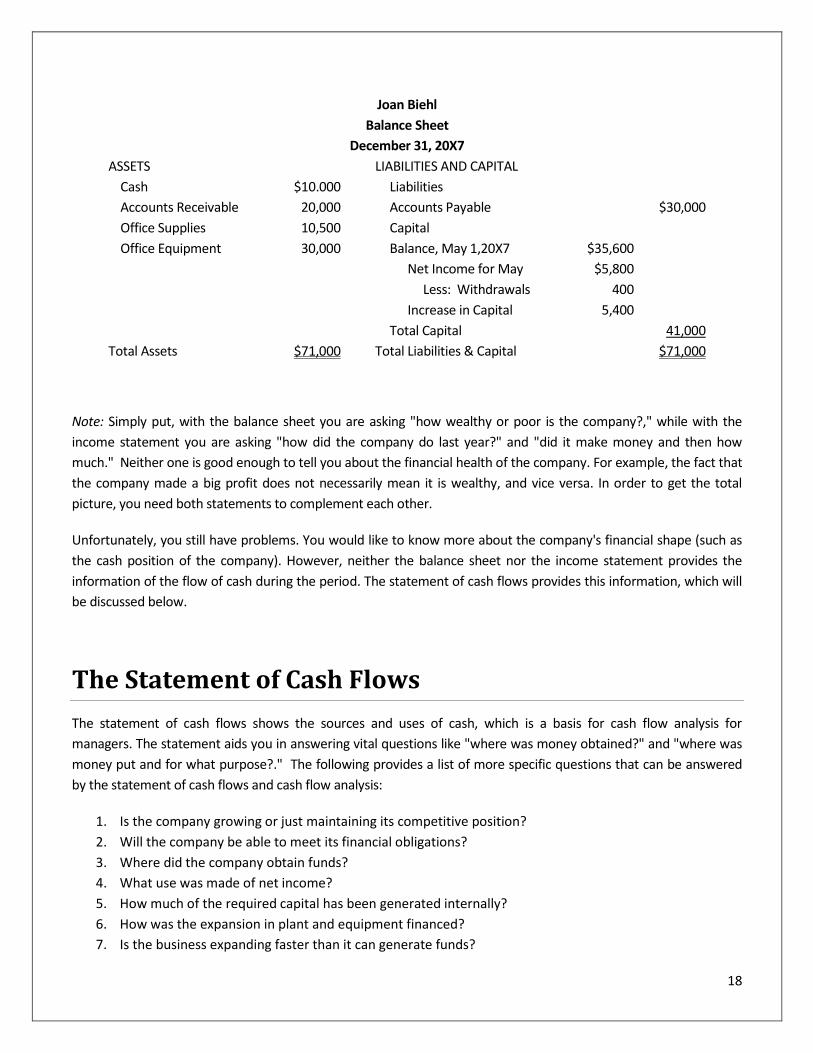
18
Joan Biehl
Balance Sheet
December 31, 20X7
ASSETS LIABILITIES AND CAPITAL
Cash $10.000 Liabilities
Accounts Receivable 20,000 Accounts Payable $30,000
Office Supplies 10,500 Capital
Office Equipment 30,000 Balance, May 1,20X7 $35,600
Net Income for May $5,800
Less: Withdrawals 400
Increase in Capital 5,400
Total Capital 41,000
Total Assets $71,000 Total Liabilities & Capital $71,000
Note: Simply put, with the balance sheet you are asking "how wealthy or poor is the company?," while with the
income statement you are asking "how did the company do last year?" and "did it make money and then how
much." Neither one is good enough to tell you about the financial health of the company. For example, the fact that
the company made a big profit does not necessarily mean it is wealthy, and vice versa. In order to get the total
picture, you need both statements to complement each other.
Unfortunately, you still have problems. You would like to know more about the company's financial shape (such as
the cash position of the company). However, neither the balance sheet nor the income statement provides the
information of the flow of cash during the period. The statement of cash flows provides this information, which will
be discussed below.
The Statement of Cash Flows
The statement of cash flows shows the sources and uses of cash, which is a basis for cash flow analysis for
managers. The statement aids you in answering vital questions like "where was money obtained?" and "where was
money put and for what purpose?." The following provides a list of more specific questions that can be answered
by the statement of cash flows and cash flow analysis:
1. Is the company growing or just maintaining its competitive position?
2. Will the company be able to meet its financial obligations?
3. Where did the company obtain funds?
4. What use was made of net income?
5. How much of the required capital has been generated internally?
6. How was the expansion in plant and equipment financed?
7. Is the business expanding faster than it can generate funds?
19
8. Is the company's dividend policy in balance with its operating policy?
Is the company's cash position sound and what effect will it have on the market price of stock?
Cash is vital to the operation of every business. How management utilizes the flow of cash can determine a firm's
success or failure. Financial managers must control their company's cash flow so that bills can be paid on time and
extra dollars can be put into the purchase of inventory and new equipment or invested to generate additional
earnings.
FASB Requirements
Management and external interested parties have always recognized the need for a cash flow statement. Therefore,
in recognition of the fact that cash flow information is an integral part of both investment and credit decisions, the
Financial Accounting Standards Board (FASB) has issued ASC 230, Statement of Cash Flows. A statement of cash
flows is required as part of a full set of financial statements of all business entities (both publicly held) and not-for-
profit organizations. A statement of cash flows reports the cash receipts, payments, and net change in cash on hand
resulting from the operating, investing, and financing activities of an enterprise during a given period. The
presentation reconciles beginning and ending cash balances.
Accrual Basis of Accounting
Under Generally Accepted Accounting Principles (GAAP), most companies use the accrual basis of accounting. This
method requires that revenue be recorded when earned and that expenses be recorded when incurred. Revenue
may include credit sales that have not yet been collected in cash and expenses incurred that may not have been
paid in cash. Thus, under the accrual basis of accounting, net income will generally not indicate the net cash flow
from operating activities. To arrive at net cash flow from operating activities, it is necessary to report revenues and
expenses on a cash basis. This is accomplished by eliminating those transactions that did not result in a
corresponding increase or decrease in cash on hand.
EXAMPLE 5
During 20X7, the Eastern Electric Supply Corporation earned $2,100,000 in credit sales, of which $100,000 remained
uncollected as of the end of the calendar year. Cash that was actually collected by the corporation in 20X7 can be
calculated as follows:
Credit sales $2,100,000
Less: Credit sales uncollected at year end 100,000
Actual cash collected $2,000,000
A statement of cash flows focuses only on transactions involving the cash receipts and disbursements of a company.
As previously stated, the statement of cash flows classifies cash receipts and cash payments into operating,
investing, and financing activities.
20
Operating Activities
Operating activities include all transactions that are not investing or financing activities. They relate to income
statement items and the cash effects of transactions that make up the income statement. Thus cash received from
the sale of goods or services, including the collection or sale of trade accounts and notes receivable from customers,
interest received on loans, and dividend income are to be treated as cash from operating activities. Cash paid to
acquire materials for the manufacture of goods for resale, rental payments to landlords, payments to employees as
compensation, and interest paid to creditors are classified as cash outflows for operating activities.
Investing Activities
Investing activities include cash inflows from the sale of property, plant, and equipment used in the production of
goods and services, debt instruments or equity of other entities, and the collection of principal on loans made to
other enterprises. Cash outflows under this category may result from the purchase of plant and equipment and
other productive assets, debt instruments or equity of other entities, and the making of loans to other enterprises.
Financing Activities
The financing activities of an enterprise involve the sale of a company's own preferred and common stock, bonds,
mortgages, notes, and other short- or long-term borrowings. Cash outflows classified as financing activities include
the repayment of short- and long-term debt, the reacquisition of treasury stock, and the payment of cash dividends.
EXAMPLE 6
The following information pertains to Liverpool Sugar Corporation during 20X7
1. The company had $1,004,000 in cash receipts from the sale of goods. Cash payments to acquire materials
for the manufacture of goods totaled $469,000, its payments on accounts and notes payable amounted to
$12,000, and it paid $136,000 in federal and state taxes.
2. The company sold all of its stock investment in Redondo Food Corporation, an unrelated entity, for
$100,000. It then bought a new plant and equipment for $676,000.
3. In 20X7, the company sold $300,000 of its 10%, ten-year bonds. It also issued another $50,000,000 in
preferred stock in return for land and buildings. The company paid a cash dividend of $36,000.
4. The company had a $198,000 cash balance at the beginning of the year.
The statement cash flows for the company would be presented as follows:
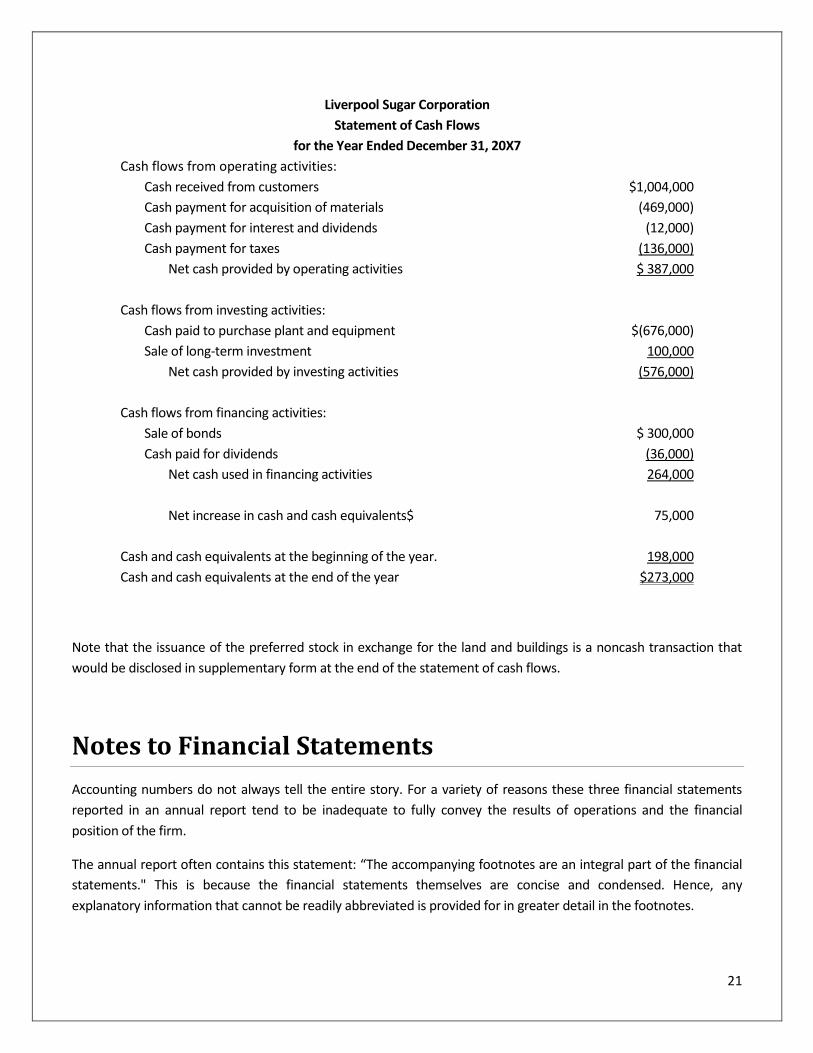
21
Liverpool Sugar Corporation
Statement of Cash Flows
for the Year Ended December 31, 20X7
Cash flows from operating activities:
Cash received from customers $1,004,000
Cash payment for acquisition of materials (469,000)
Cash payment for interest and dividends (12,000)
Cash payment for taxes (136,000)
Net cash provided by operating activities $ 387,000
Cash flows from investing activities:
Cash paid to purchase plant and equipment $(676,000)
Sale of long-term investment 100,000
Net cash provided by investing activities (576,000)
Cash flows from financing activities:
Sale of bonds $ 300,000
Cash paid for dividends (36,000)
Net cash used in financing activities 264,000
Net increase in cash and cash equivalents$ 75,000
Cash and cash equivalents at the beginning of the year. 198,000
Cash and cash equivalents at the end of the year $273,000
Note that the issuance of the preferred stock in exchange for the land and buildings is a noncash transaction that
would be disclosed in supplementary form at the end of the statement of cash flows.
Notes to Financial Statements
Accounting numbers do not always tell the entire story. For a variety of reasons these three financial statements
reported in an annual report tend to be inadequate to fully convey the results of operations and the financial
position of the firm.
The annual report often contains this statement: “The accompanying footnotes are an integral part of the financial
statements." This is because the financial statements themselves are concise and condensed. Hence, any
explanatory information that cannot be readily abbreviated is provided for in greater detail in the footnotes.
22
Footnotes provide detailed information regarding financial statement figures, accounting policies, explanatory data
such as mergers and stock options, and furnish any additional necessary disclosure. Examples of footnote
disclosures, as required by GAAP, are accounting methods and estimates such as inventory pricing, pension fund
and profit sharing arrangements, terms of characteristics of long-term debt, particulars of lease agreements,
contingencies, and tax matters.
The footnotes appear at the end of the financial statements and explain the figures in those statements. Footnote
information may be in both quantitative and qualitative terms. An example of quantitative information is the fair
market value of pension plan assets. An example of a qualitative disclosure is a lawsuit against the company. It is
essential that the reader carefully evaluate footnote information to derive an informed opinion about the
company's financial health and operating performance.
Summary
The traditional accounting statements--balance sheet, income statement and the newly required statement of cash
flows--have been and will continue to be the most important tools for both management and outsiders for use in
gauging the financial condition of a business. As a later chapter will show, additional insights in the performance of
the business can be gained by using ratio analysis. Importance in cash flow cannot be emphasized enough and much
of the chapter was devoted to this topic.
In viewing the various figures on financial statements, the footnotes to a statement must be considered an integral
part of the statement. Failure to consider the additional facts set forth by footnotes may lead to erroneous
conclusions.
23
Chapter 2 Review Questions
1. A statement of cash flows is to be presented in general purpose external financial statements by all business
enterprises and not-for-profit organizations. True or False?
2. How can a statement of cash flows help users of financial statements?
A. It helps them evaluate a firm’s liquidity, solvency, and financial flexibility.
B. It helps them evaluate a firm’s economic resources and obligations.
C. It helps them determine a firm’s components of income from operations.
D. It helps them determine whether insiders have sold or purchased the firm’s stock.
3. A financial statement includes all of the following items: net income, depreciation, operating activities, and
financial activities. What financial statement is this?
A. Balance sheet
B. Income statement
C. Statement of cash flows
D. Statement of shareholders’ equity
4. What is the purpose of information presented in notes to the financial statements?
A. To provide disclosures required by generally accepted accounting principles
B. To correct improper presentation in the financial statements
C. To provide recognition of amounts not included in the totals of the financial statements
D. To present management's responses to auditor comments
24
Chapter 3: Recording Financial Information and
Accounting Conventions
Learning Objectives:
After completing this section, you should be able to:
Recognize the double entry system and the accounting equation.
Recognize the system of debits and credits.
Identify different depreciation methods and calculate depreciation rates.
Financial decisions are usually formulated on the basis of information generated by the accounting system of the
firm. Proper interpretation of the data requires an understanding of the concepts and rules underlying such
systems, the convention adopted in recording information, and the limitation inherent in the information
presented.
The transactions of most businesses are numerous and complex, affecting many different items appearing on
the financial statements. Therefore, a formal system of classification and recording is required for timely
financial reporting and managerial needs. The aim of this chapter is to introduce the formal classification system
of financial information commonly called double-entry accounting. By acquiring background information about
this system, you will be able to more clearly understand the basic structure of the financial statements that were
discussed in the previous chapter.
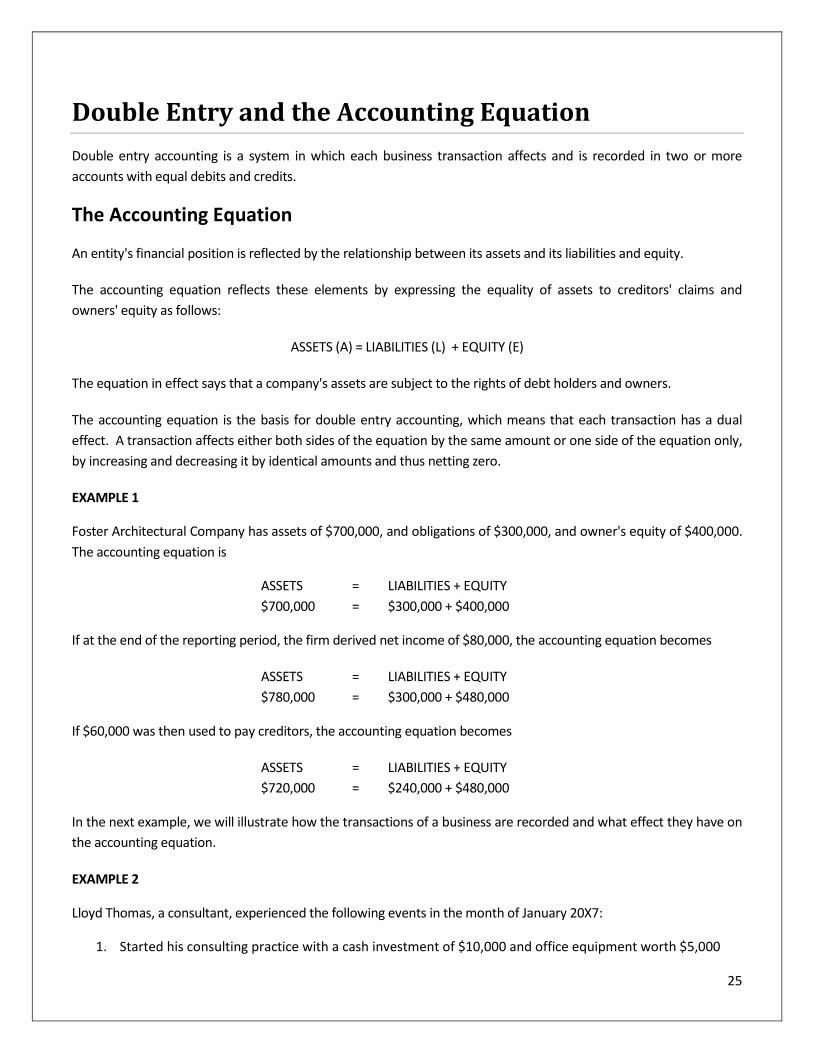
25
Double Entry and the Accounting Equation
Double entry accounting is a system in which each business transaction affects and is recorded in two or more
accounts with equal debits and credits.
The Accounting Equation
An entity's financial position is reflected by the relationship between its assets and its liabilities and equity.
The accounting equation reflects these elements by expressing the equality of assets to creditors' claims and
owners' equity as follows:
ASSETS (A) = LIABILITIES (L) + EQUITY (E)
The equation in effect says that a company's assets are subject to the rights of debt holders and owners.
The accounting equation is the basis for double entry accounting, which means that each transaction has a dual
effect. A transaction affects either both sides of the equation by the same amount or one side of the equation only,
by increasing and decreasing it by identical amounts and thus netting zero.
EXAMPLE 1
Foster Architectural Company has assets of $700,000, and obligations of $300,000, and owner's equity of $400,000.
The accounting equation is
ASSETS = LIABILITIES + EQUITY
$700,000 = $300,000 + $400,000
If at the end of the reporting period, the firm derived net income of $80,000, the accounting equation becomes
ASSETS = LIABILITIES + EQUITY
$780,000 = $300,000 + $480,000
If $60,000 was then used to pay creditors, the accounting equation becomes
ASSETS = LIABILITIES + EQUITY
$720,000 = $240,000 + $480,000
In the next example, we will illustrate how the transactions of a business are recorded and what effect they have on
the accounting equation.
EXAMPLE 2
Lloyd Thomas, a consultant, experienced the following events in the month of January 20X7:
1. Started his consulting practice with a cash investment of $10,000 and office equipment worth $5,000
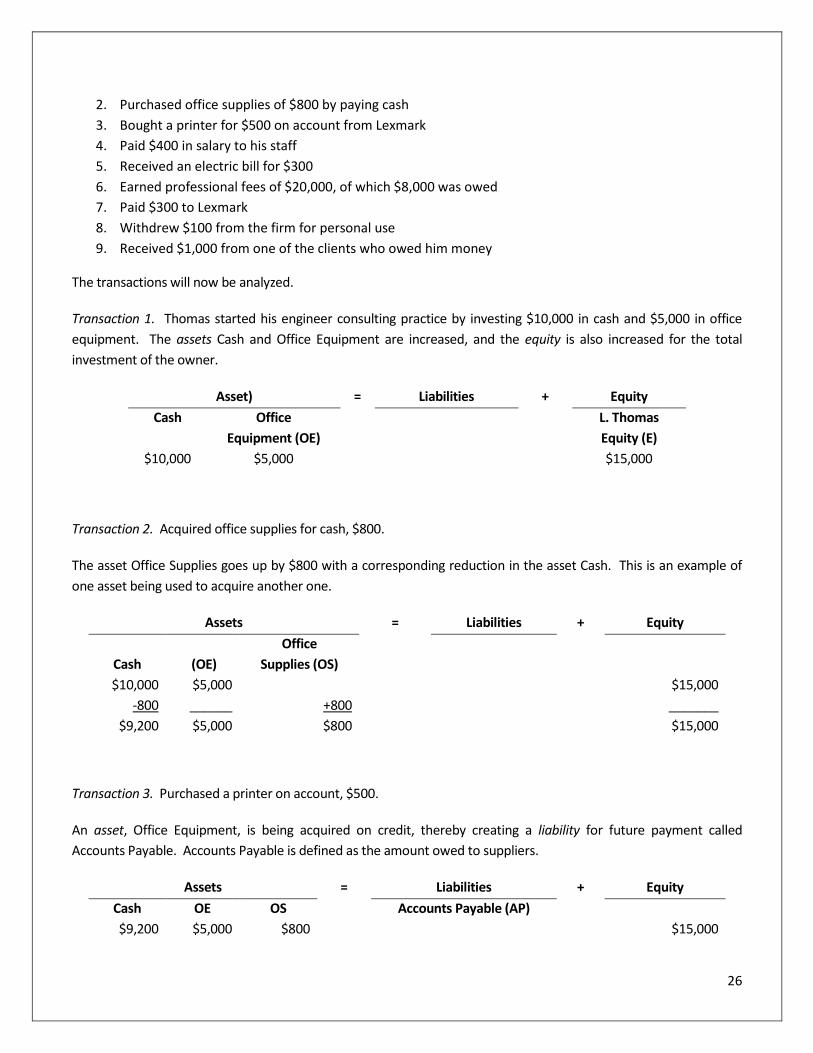
26
2. Purchased office supplies of $800 by paying cash
3. Bought a printer for $500 on account from Lexmark
4. Paid $400 in salary to his staff
5. Received an electric bill for $300
6. Earned professional fees of $20,000, of which $8,000 was owed
7. Paid $300 to Lexmark
8. Withdrew $100 from the firm for personal use
9. Received $1,000 from one of the clients who owed him money
The transactions will now be analyzed.
Transaction 1. Thomas started his engineer consulting practice by investing $10,000 in cash and $5,000 in office
equipment. The assets Cash and Office Equipment are increased, and the equity is also increased for the total
investment of the owner.
Asset) = Liabilities + Equity
Cash Office
Equipment (OE)
L. Thomas
Equity (E)
$10,000 $5,000 $15,000
Transaction 2. Acquired office supplies for cash, $800.
The asset Office Supplies goes up by $800 with a corresponding reduction in the asset Cash. This is an example of
one asset being used to acquire another one.
Assets = Liabilities + Equity
Cash (OE)
Office
Supplies (OS)
$10,000 $5,000 $15,000
-800 ______ +800 _______
$9,200 $5,000 $800 $15,000
Transaction 3. Purchased a printer on account, $500.
An asset, Office Equipment, is being acquired on credit, thereby creating a liability for future payment called
Accounts Payable. Accounts Payable is defined as the amount owed to suppliers.
Assets = Liabilities + Equity
Cash OE OS Accounts Payable (AP)
$9,200 $5,000 $800 $15,000
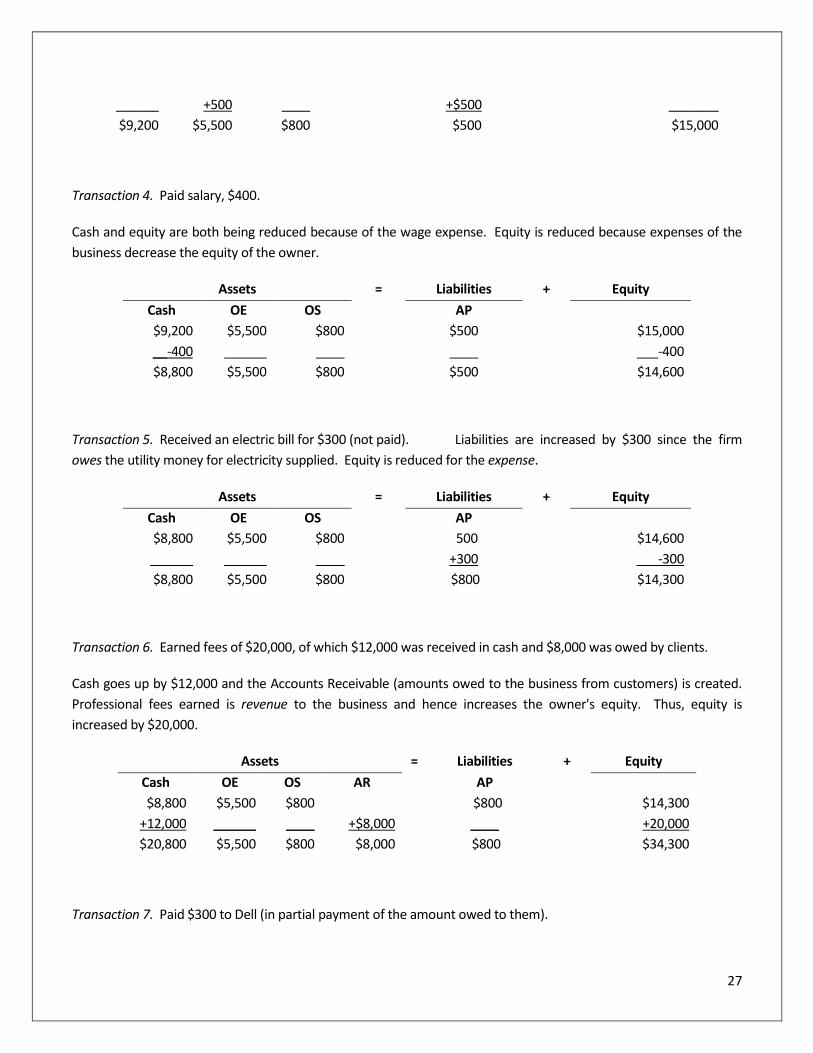
27
______ +500 ____ +$500 _______
$9,200 $5,500 $800 $500 $15,000
Transaction 4. Paid salary, $400.
Cash and equity are both being reduced because of the wage expense. Equity is reduced because expenses of the
business decrease the equity of the owner.
Assets = Liabilities + Equity
Cash OE OS AP
$9,200 $5,500 $800 $500 $15,000
__-400 ______ ____ ____ ___-400
$8,800 $5,500 $800 $500 $14,600
Transaction 5. Received an electric bill for $300 (not paid). Liabilities are increased by $300 since the firm
owes the utility money for electricity supplied. Equity is reduced for the expense.
Assets = Liabilities + Equity
Cash OE OS AP
$8,800 $5,500 $800 500 $14,600
______ ______ ____ +300 ___-300
$8,800 $5,500 $800 $800 $14,300
Transaction 6. Earned fees of $20,000, of which $12,000 was received in cash and $8,000 was owed by clients.
Cash goes up by $12,000 and the Accounts Receivable (amounts owed to the business from customers) is created.
Professional fees earned is revenue to the business and hence increases the owner's equity. Thus, equity is
increased by $20,000.
Assets = Liabilities + Equity
Cash OE OS AR AP
$8,800 $5,500 $800 $800 $14,300
+12,000 ______ ____ +$8,000 ____ +20,000
$20,800 $5,500 $800 $8,000 $800 $34,300
Transaction 7. Paid $300 to Dell (in partial payment of the amount owed to them).
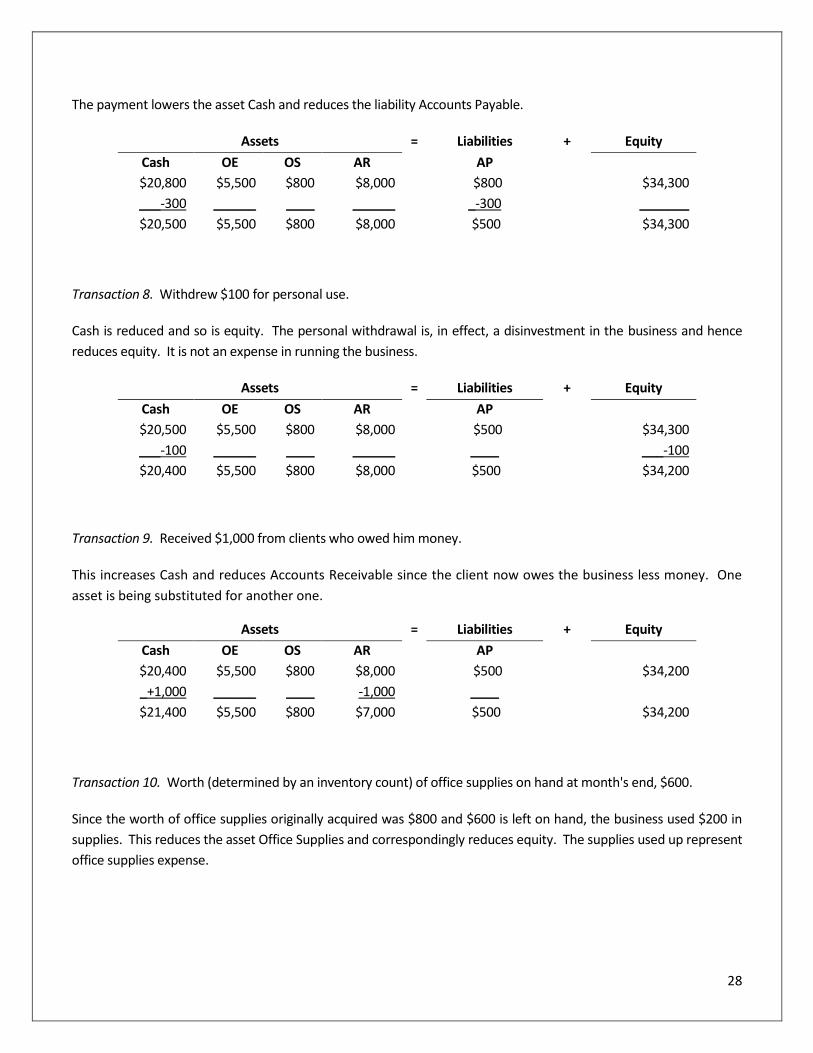
28
The payment lowers the asset Cash and reduces the liability Accounts Payable.
Assets = Liabilities + Equity
Cash OE OS AR AP
$20,800 $5,500 $800 $8,000 $800 $34,300
___-300 ______ ____ ______ _-300 _______
$20,500 $5,500 $800 $8,000 $500 $34,300
Transaction 8. Withdrew $100 for personal use.
Cash is reduced and so is equity. The personal withdrawal is, in effect, a disinvestment in the business and hence
reduces equity. It is not an expense in running the business.
Assets = Liabilities + Equity
Cash OE OS AR AP
$20,500 $5,500 $800 $8,000 $500 $34,300
___-100 ______ ____ ______ ____ ___-100
$20,400 $5,500 $800 $8,000 $500 $34,200
Transaction 9. Received $1,000 from clients who owed him money.
This increases Cash and reduces Accounts Receivable since the client now owes the business less money. One
asset is being substituted for another one.
Assets = Liabilities + Equity
Cash OE OS AR AP
$20,400 $5,500 $800 $8,000 $500 $34,200
_+1,000 ______ ____ -1,000 ____
$21,400 $5,500 $800 $7,000 $500 $34,200
Transaction 10. Worth (determined by an inventory count) of office supplies on hand at month's end, $600.
Since the worth of office supplies originally acquired was $800 and $600 is left on hand, the business used $200 in
supplies. This reduces the asset Office Supplies and correspondingly reduces equity. The supplies used up represent
office supplies expense.
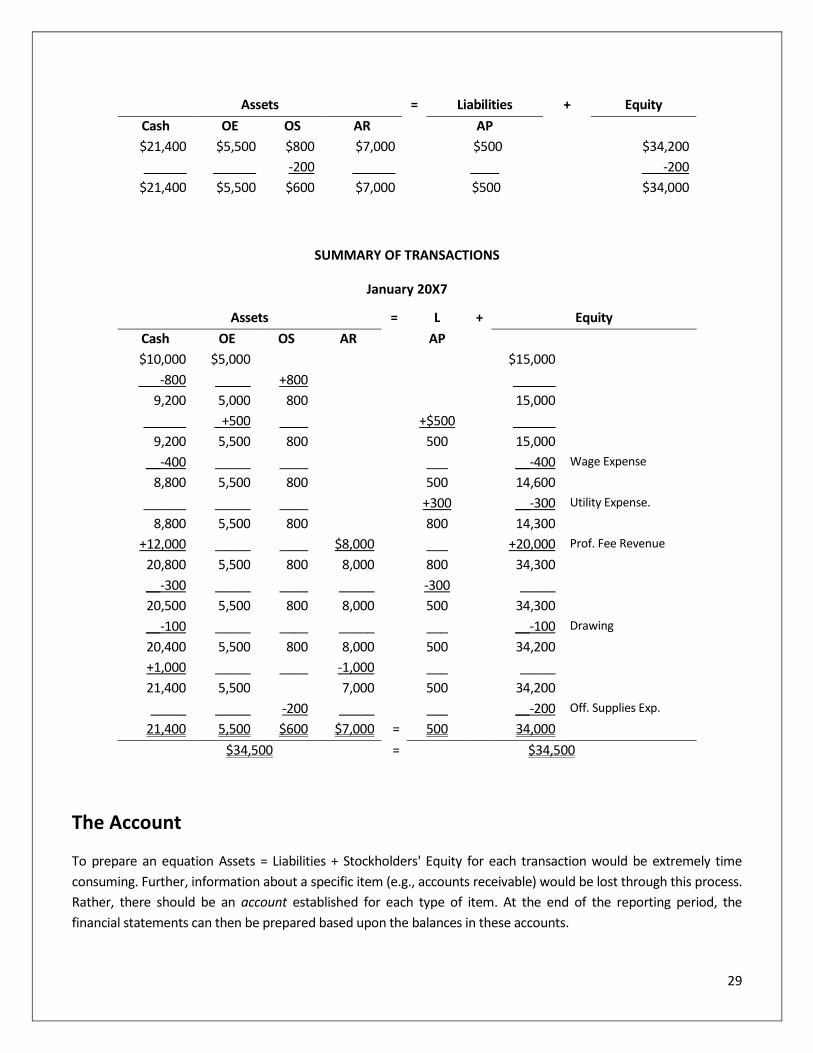
29
Assets = Liabilities + Equity
Cash OE OS AR AP
$21,400 $5,500 $800 $7,000 $500 $34,200
______ ______ -200 ______ ____ ___-200
$21,400 $5,500 $600 $7,000 $500 $34,000
SUMMARY OF TRANSACTIONS
January 20X7
Assets = L + Equity
Cash OE OS AR AP
$10,000 $5,000 $15,000
___-800 _____ +800 ______
9,200 5,000 800 15,000
______ _+500 ____ +$500 ______
9,200 5,500 800 500 15,000
__-400 _____ ____ ___ __-400 Wage Expense
8,800 5,500 800 500 14,600
______ _____ ____ +300 __-300 Utility Expense.
8,800 5,500 800 800 14,300
+12,000 _____ ____ $8,000 ___ +20,000 Prof. Fee Revenue
20,800 5,500 800 8,000 800 34,300
__-300 _____ ____ _____ -300 _____
20,500 5,500 800 8,000 500 34,300
__-100 _____ ____ _____ ___ __-100 Drawing
20,400 5,500 800 8,000 500 34,200
+1,000 _____ ____ -1,000 ___ _____
21,400 5,500 7,000 500 34,200
_____ _____ -200 _____ ___ __-200 Off. Supplies Exp.
21,400 5,500 $600 $7,000 = 500 34,000
$34,500 = $34,500
The Account
To prepare an equation Assets = Liabilities + Stockholders' Equity for each transaction would be extremely time
consuming. Further, information about a specific item (e.g., accounts receivable) would be lost through this process.
Rather, there should be an account established for each type of item. At the end of the reporting period, the
financial statements can then be prepared based upon the balances in these accounts.
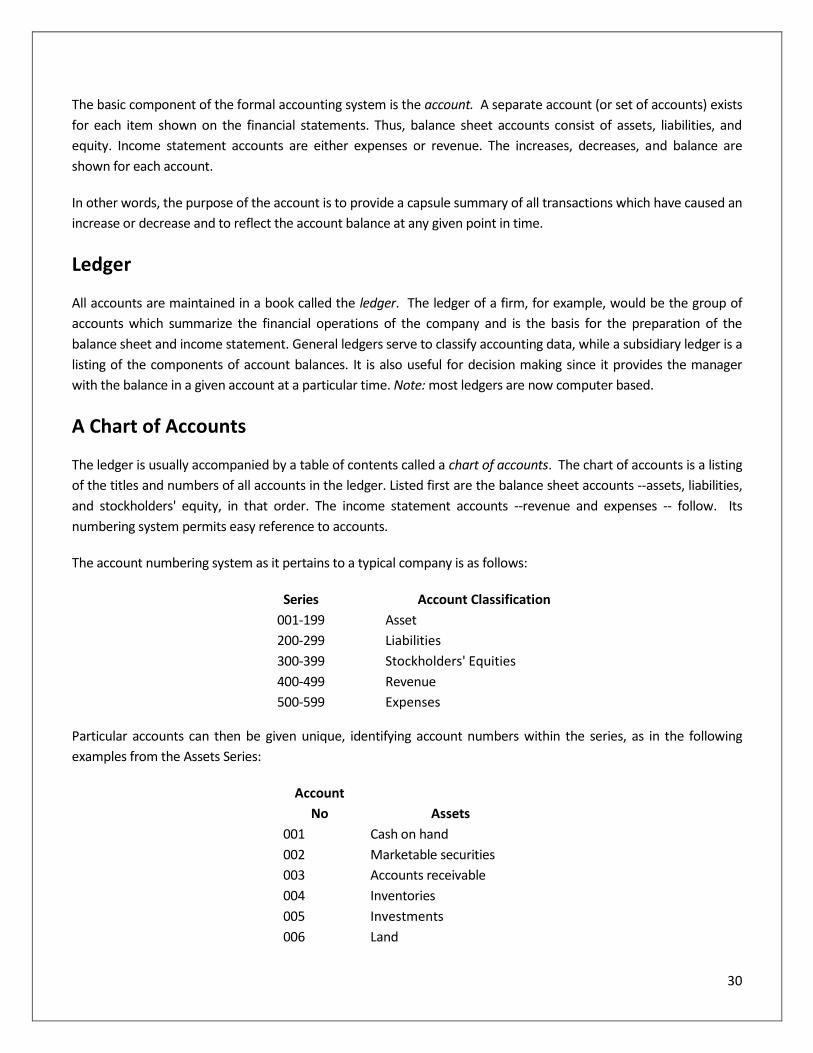
30
The basic component of the formal accounting system is the account. A separate account (or set of accounts) exists
for each item shown on the financial statements. Thus, balance sheet accounts consist of assets, liabilities, and
equity. Income statement accounts are either expenses or revenue. The increases, decreases, and balance are
shown for each account.
In other words, the purpose of the account is to provide a capsule summary of all transactions which have caused an
increase or decrease and to reflect the account balance at any given point in time.
Ledger
All accounts are maintained in a book called the ledger. The ledger of a firm, for example, would be the group of
accounts which summarize the financial operations of the company and is the basis for the preparation of the
balance sheet and income statement. General ledgers serve to classify accounting data, while a subsidiary ledger is a
listing of the components of account balances. It is also useful for decision making since it provides the manager
with the balance in a given account at a particular time. Note: most ledgers are now computer based.
A Chart of Accounts
The ledger is usually accompanied by a table of contents called a chart of accounts. The chart of accounts is a listing
of the titles and numbers of all accounts in the ledger. Listed first are the balance sheet accounts --assets, liabilities,
and stockholders' equity, in that order. The income statement accounts --revenue and expenses -- follow. Its
numbering system permits easy reference to accounts.
The account numbering system as it pertains to a typical company is as follows:
Series Account Classification
001-199 Asset
200-299 Liabilities
300-399 Stockholders' Equities
400-499 Revenue
500-599 Expenses
Particular accounts can then be given unique, identifying account numbers within the series, as in the following
examples from the Assets Series:
Account
No Assets
001 Cash on hand
002 Marketable securities
003 Accounts receivable
004 Inventories
005 Investments
006 Land
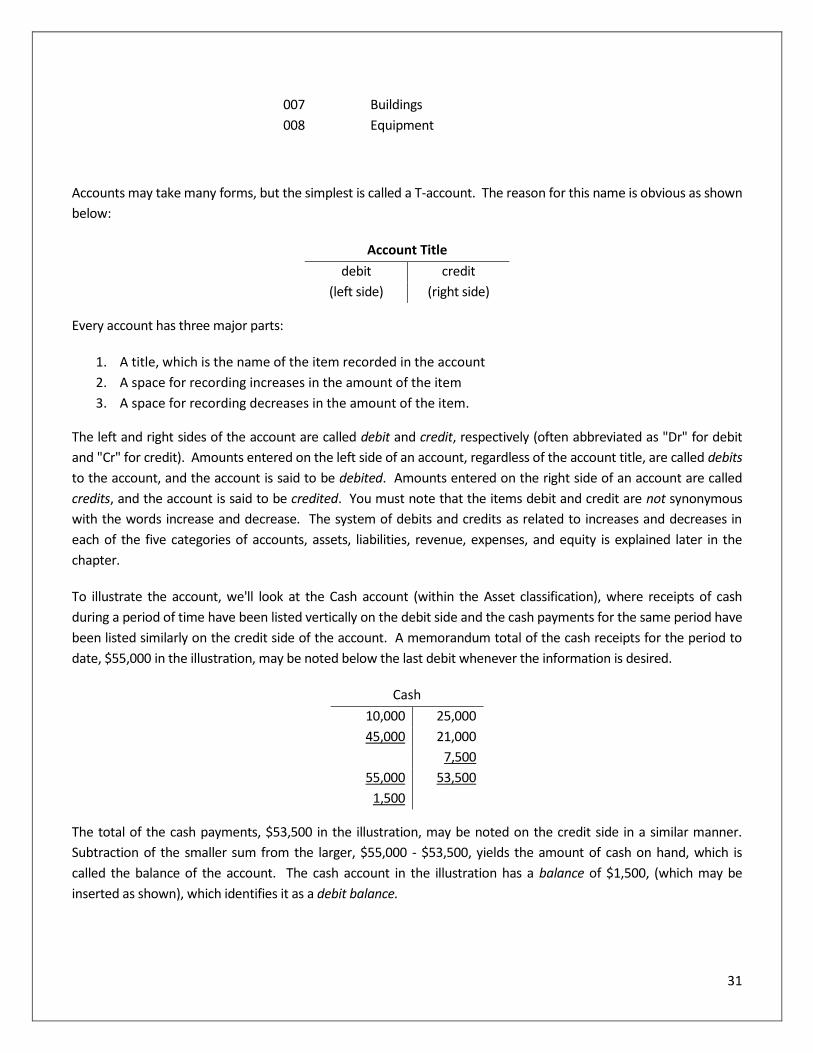
31
007 Buildings
008 Equipment
Accounts may take many forms, but the simplest is called a T-account. The reason for this name is obvious as shown
below:
Account Title
debit credit
(left side) (right side)
Every account has three major parts:
1. A title, which is the name of the item recorded in the account
2. A space for recording increases in the amount of the item
3. A space for recording decreases in the amount of the item.
The left and right sides of the account are called debit and credit, respectively (often abbreviated as "Dr" for debit
and "Cr" for credit). Amounts entered on the left side of an account, regardless of the account title, are called debits
to the account, and the account is said to be debited. Amounts entered on the right side of an account are called
credits, and the account is said to be credited. You must note that the items debit and credit are not synonymous
with the words increase and decrease. The system of debits and credits as related to increases and decreases in
each of the five categories of accounts, assets, liabilities, revenue, expenses, and equity is explained later in the
chapter.
To illustrate the account, we'll look at the Cash account (within the Asset classification), where receipts of cash
during a period of time have been listed vertically on the debit side and the cash payments for the same period have
been listed similarly on the credit side of the account. A memorandum total of the cash receipts for the period to
date, $55,000 in the illustration, may be noted below the last debit whenever the information is desired.
Cash
10,000 25,000
45,000 21,000
7,500
55,000 53,500
1,500
The total of the cash payments, $53,500 in the illustration, may be noted on the credit side in a similar manner.
Subtraction of the smaller sum from the larger, $55,000 - $53,500, yields the amount of cash on hand, which is
called the balance of the account. The cash account in the illustration has a balance of $1,500, (which may be
inserted as shown), which identifies it as a debit balance.
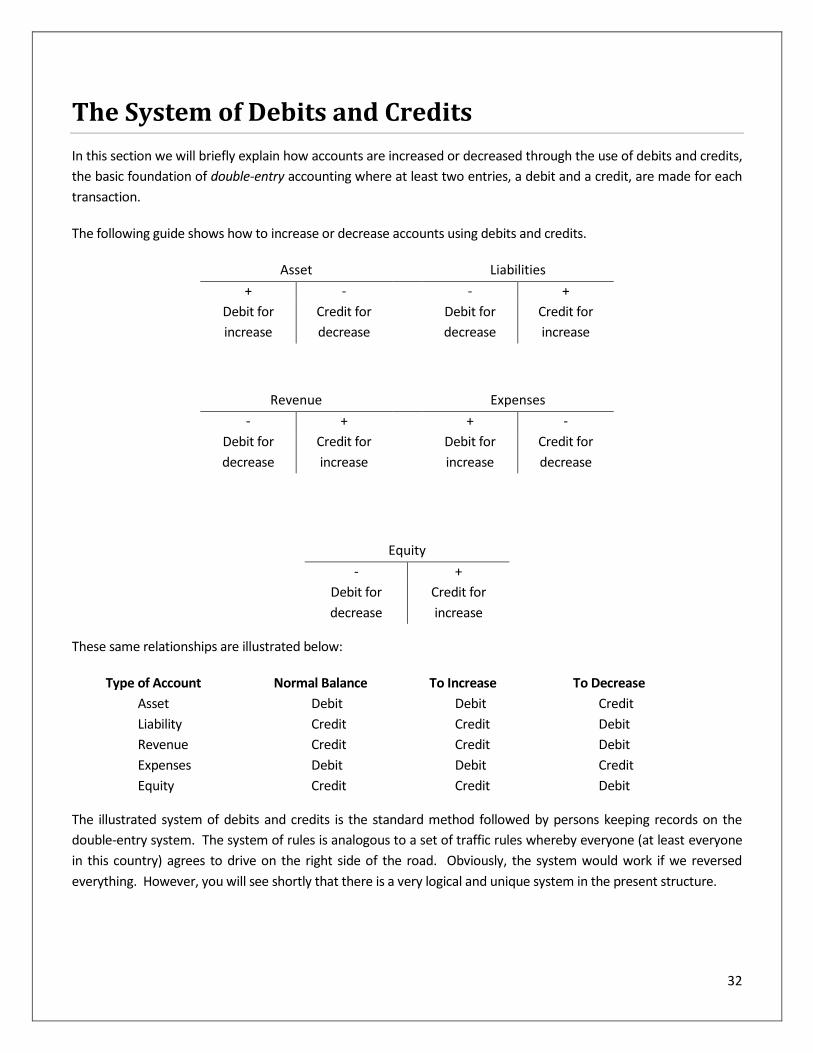
32
The System of Debits and Credits
In this section we will briefly explain how accounts are increased or decreased through the use of debits and credits,
the basic foundation of double-entry accounting where at least two entries, a debit and a credit, are made for each
transaction.
The following guide shows how to increase or decrease accounts using debits and credits.
Asset Liabilities
+ - - +
Debit for
increase
Credit for
decrease
Debit for
decrease
Credit for
increase
Revenue Expenses
- + + -
Debit for
decrease
Credit for
increase
Debit for
increase
Credit for
decrease
Equity
- +
Debit for
decrease
Credit for
increase
These same relationships are illustrated below:
Type of Account Normal Balance To Increase To Decrease
Asset Debit Debit Credit
Liability Credit Credit Debit
Revenue Credit Credit Debit
Expenses Debit Debit Credit
Equity Credit Credit Debit
The illustrated system of debits and credits is the standard method followed by persons keeping records on the
double-entry system. The system of rules is analogous to a set of traffic rules whereby everyone (at least everyone
in this country) agrees to drive on the right side of the road. Obviously, the system would work if we reversed
everything. However, you will see shortly that there is a very logical and unique system in the present structure.
33
The "How and Why" of Debits and Credits
Recall the fundamental accounting equation:
ASSETS (A) = LIABILITIES (L) + EQUITY (E)
In addition to this equation there is another fundamental accounting concept or rule:
Debits must always equal Credits
This means that whenever a financial transaction is recorded in the accounting record one account (or accounts)
must be debited and another account (or accounts) must be credited to obtain an equal amount. It was noted
earlier that all accounts have two sides, a debit side and a credit side. The purpose is to record increases on one side
and decreases on the other.
Journals
For simplicity, the entries used in the previous section were made directly in the general ledger accounts. However,
this process does not furnish the data required about a given transaction nor is listing of transactions in
chronological order possible on T-accounts. These deficiencies are overcome through the use of a journal. The
journal is the book of original entry in which transactions are entered on a daily basis in chronological order. This
process is called journalizing.
The data are then transferred from the journal to the ledger by debiting and crediting the particular accounts
involved. This process is called posting. The P.R. (Posting Reference) column is used for the ledger account number
after the posting from the journal to the ledger takes place. This provides a cross reference between journal and
ledger. There exist different types of journals that may be grouped into the categories of (1) general journals and (2)
specialized journals. The latter is used when there are many repetitive transactions (e.g., sales or payroll).
Types of Depreciation Methods
Depreciation is an important issue in accounting policy and financial management. It requires an explicit discussion
since its treatment has a considerable bearing on cash, reported earnings, tax liabilities incurred, and facilities
investment decisions.
Depreciation is the decline in economic potential of fixed assets (with the exception of land) originating from wear
and tear, deterioration, and obsolescence. Accounting for depreciation involves the process of spreading the cost of
an asset over its useful life.
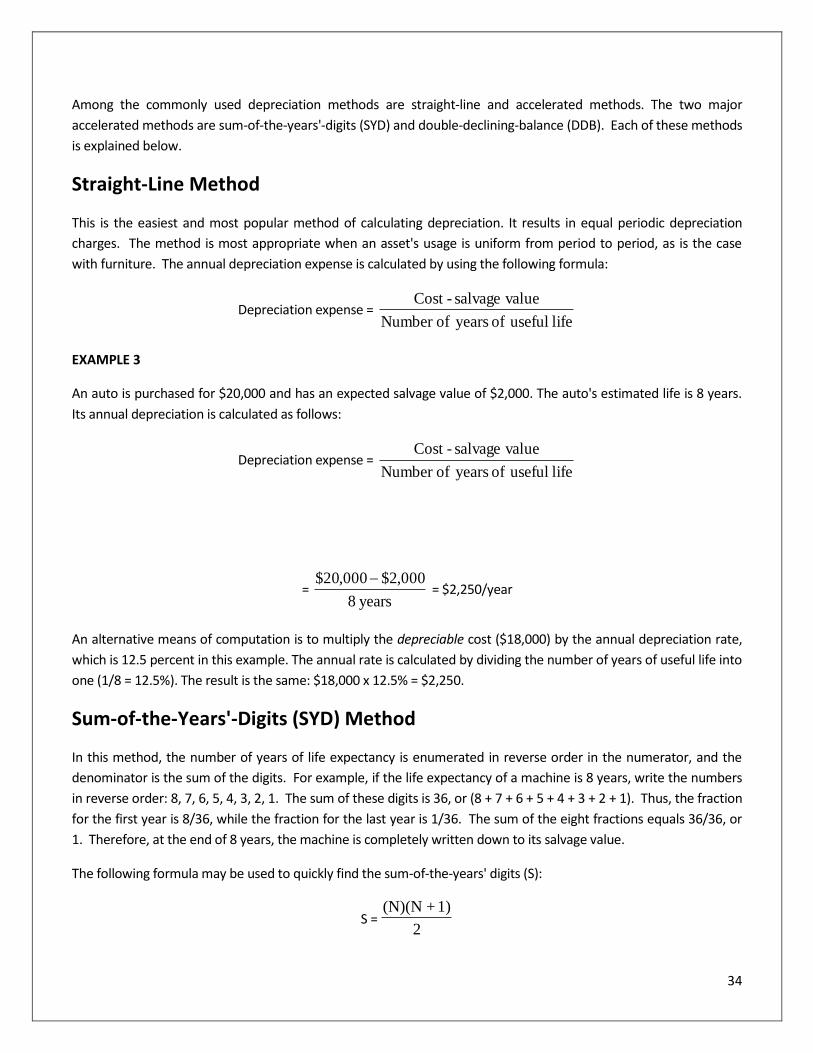
34
Among the commonly used depreciation methods are straight-line and accelerated methods. The two major
accelerated methods are sum-of-the-years'-digits (SYD) and double-declining-balance (DDB). Each of these methods
is explained below.
Straight-Line Method
This is the easiest and most popular method of calculating depreciation. It results in equal periodic depreciation
charges. The method is most appropriate when an asset's usage is uniform from period to period, as is the case
with furniture. The annual depreciation expense is calculated by using the following formula:
Depreciation expense = life useful of years ofNumber
valuesalvage -Cost
EXAMPLE 3
An auto is purchased for $20,000 and has an expected salvage value of $2,000. The auto's estimated life is 8 years.
Its annual depreciation is calculated as follows:
Depreciation expense = life useful of years ofNumber
valuesalvage -Cost
= years 8
000,2$000,20$ = $2,250/year
An alternative means of computation is to multiply the depreciable cost ($18,000) by the annual depreciation rate,
which is 12.5 percent in this example. The annual rate is calculated by dividing the number of years of useful life into
one (1/8 = 12.5%). The result is the same: $18,000 x 12.5% = $2,250.
Sum-of-the-Years'-Digits (SYD) Method
In this method, the number of years of life expectancy is enumerated in reverse order in the numerator, and the
denominator is the sum of the digits. For example, if the life expectancy of a machine is 8 years, write the numbers
in reverse order: 8, 7, 6, 5, 4, 3, 2, 1. The sum of these digits is 36, or (8 + 7 + 6 + 5 + 4 + 3 + 2 + 1). Thus, the fraction
for the first year is 8/36, while the fraction for the last year is 1/36. The sum of the eight fractions equals 36/36, or
1. Therefore, at the end of 8 years, the machine is completely written down to its salvage value.
The following formula may be used to quickly find the sum-of-the-years' digits (S):
S = (N)(N +1)
2
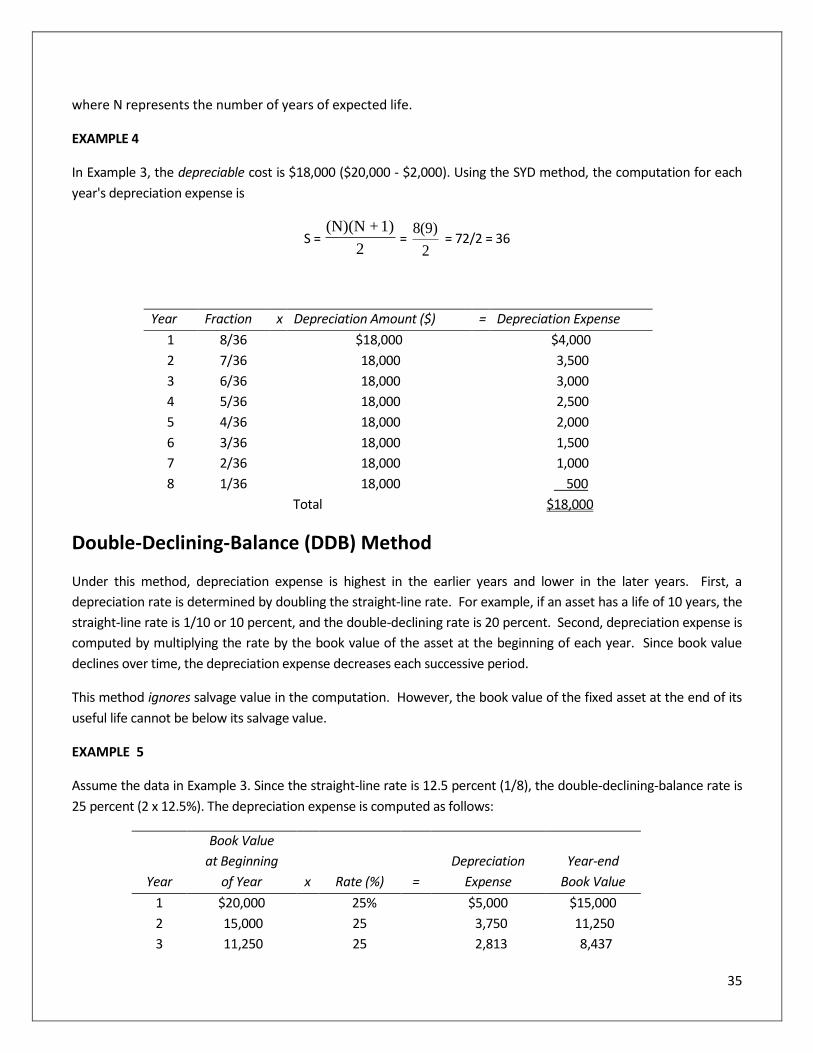
35
where N represents the number of years of expected life.
EXAMPLE 4
In Example 3, the depreciable cost is $18,000 ($20,000 - $2,000). Using the SYD method, the computation for each
year's depreciation expense is
S = (N)(N +1)
2 =
2
)9(8 = 72/2 = 36
Year Fraction x Depreciation Amount ($) = Depreciation Expense
1 8/36 $18,000 $4,000
2 7/36 18,000 3,500
3 6/36 18,000 3,000
4 5/36 18,000 2,500
5 4/36 18,000 2,000
6 3/36 18,000 1,500
7 2/36 18,000 1,000
8 1/36 18,000 500
Total $18,000
Double-Declining-Balance (DDB) Method
Under this method, depreciation expense is highest in the earlier years and lower in the later years. First, a
depreciation rate is determined by doubling the straight-line rate. For example, if an asset has a life of 10 years, the
straight-line rate is 1/10 or 10 percent, and the double-declining rate is 20 percent. Second, depreciation expense is
computed by multiplying the rate by the book value of the asset at the beginning of each year. Since book value
declines over time, the depreciation expense decreases each successive period.
This method ignores salvage value in the computation. However, the book value of the fixed asset at the end of its
useful life cannot be below its salvage value.
EXAMPLE 5
Assume the data in Example 3. Since the straight-line rate is 12.5 percent (1/8), the double-declining-balance rate is
25 percent (2 x 12.5%). The depreciation expense is computed as follows:
Book Value
at Beginning Depreciation Year-end
Year of Year x Rate (%) = Expense Book Value
1 $20,000 25% $5,000 $15,000
2 15,000 25 3,750 11,250
3 11,250 25 2,813 8,437
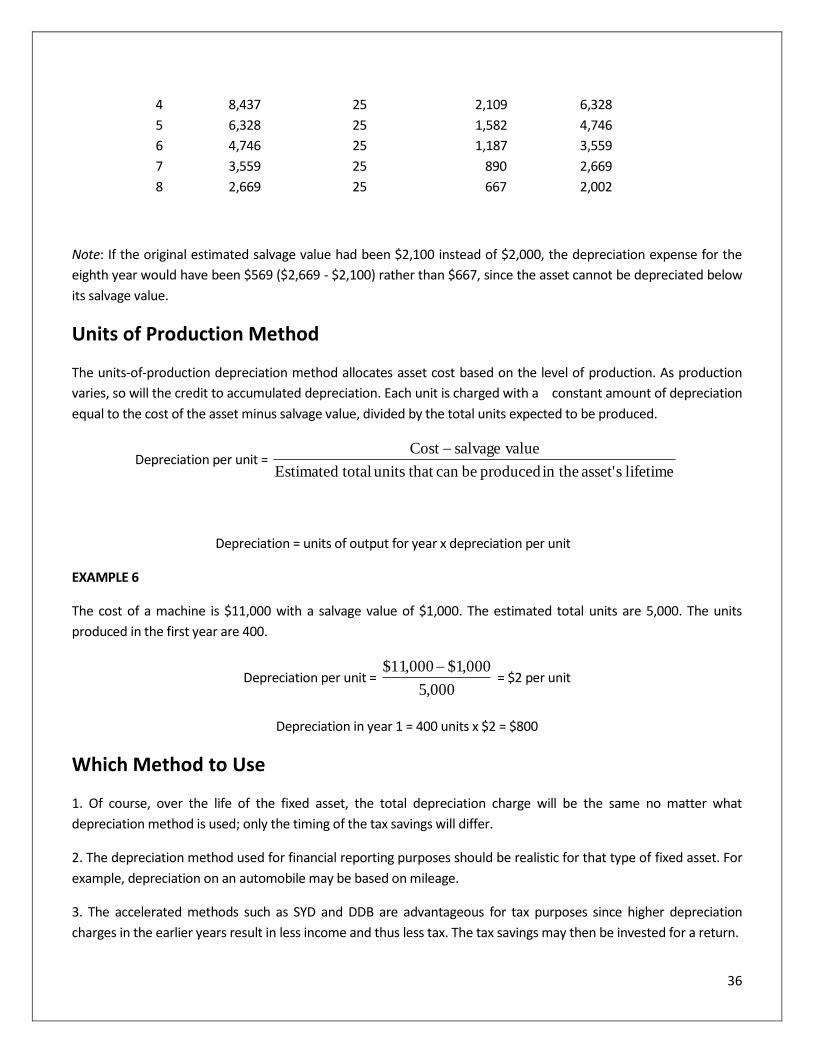
36
4 8,437 25 2,109 6,328
5 6,328 25 1,582 4,746
6 4,746 25 1,187 3,559
7 3,559 25 890 2,669
8 2,669 25 667 2,002
Note: If the original estimated salvage value had been $2,100 instead of $2,000, the depreciation expense for the
eighth year would have been $569 ($2,669 - $2,100) rather than $667, since the asset cannot be depreciated below
its salvage value.
Units of Production Method
The units-of-production depreciation method allocates asset cost based on the level of production. As production
varies, so will the credit to accumulated depreciation. Each unit is charged with a constant amount of depreciation
equal to the cost of the asset minus salvage value, divided by the total units expected to be produced.
Depreciation per unit = lifetime sasset' in the produced becan that units totalEstimated
value salvageCost
Depreciation = units of output for year x depreciation per unit
EXAMPLE 6
The cost of a machine is $11,000 with a salvage value of $1,000. The estimated total units are 5,000. The units
produced in the first year are 400.
Depreciation per unit = 000,5
000,1$000,11$ = $2 per unit
Depreciation in year 1 = 400 units x $2 = $800
Which Method to Use
1. Of course, over the life of the fixed asset, the total depreciation charge will be the same no matter what
depreciation method is used; only the timing of the tax savings will differ.
2. The depreciation method used for financial reporting purposes should be realistic for that type of fixed asset. For
example, depreciation on an automobile may be based on mileage.
3. The accelerated methods such as SYD and DDB are advantageous for tax purposes since higher depreciation
charges in the earlier years result in less income and thus less tax. The tax savings may then be invested for a return.
37
Summary
Financial decisions are usually based on the basis of accounting information generated by the accounting system.
The chapter introduced a formal classification system, known as double entry accounting. To facilitate a basic
understanding of this system, various accounting tools and concepts were covered with numerical examples. The
depreciation policies adopted by an entity have significant implications for reported earnings, tax liabilities, cash
positions, and capital investment decisions.
38
Chapter 3 Review Questions
1. What does the term "double-entry system" refer to?
A. The use of real and nominal accounts
B. The recording of each transaction in two parts
C. The use of two journals
D. The use of a journal and a ledger
2. What is a chart of accounts?
A. A flowchart of all transactions
B. An accounting procedures manual
C. A journal
D. A list of names of all account titles
3. What function do general ledgers serve in the accounting process?
A. Reporting
B. Summarizing
C. Classifying
D. Recording
4. What is a subsidiary ledger?
A. A listing of the components of account balances.
B. A backup system to protect against record destruction.
C. A listing of account balances just before closing entries are prepared.
D. All accounts of a subsidiary.
5. What factor must be present to use the units-of-production method of depreciation?
A. Total units to be produced can be estimated
B. Production is constant over the life of the asset
C. Repair costs increase with use
D. Obsolescence is expected
39
Chapter 4: Analysis of the Financial Statements
Learning Objectives:
After completing this section, you should be able to:
Recognize the benefits of financial statement analysis, and how key ratios are applied.
Distinguish among trend analysis, vertical analysis, and horizontal analysis.
Recognize various ratios used in financial analysis.
Accounting can be thought of as the art of creating scorecards for business operations. It translates raw data
into a set of objective numbers integrated into financial statements that provide information about the firm’s
profits, performance, problems and future prospects. Financial analysis is the study of the relationships among
these financial numbers; it helps users to identify the major strengths and weaknesses of a business enterprise.
Who Uses Financial Analysis?
The techniques of financial analysis are important to two groups: internal users and external users, such as
investors and banks.
Internal Managers
Internal managers analyze the financial statements to determine whether the company is earning an adequate
return on its assets. They also use financial ratios as “flags” to indicate potential areas of strength or weakness.
Many financial analysts use rule-of-thumb measurements for key financial ratios. For example, most analysts
feel that a current ratio (current assets divided by current liabilities) of two to one is acceptable for most
businesses. However, while a company may meet or even surpass this ratio, the financial statements might
indicate that an increasing proportion of the current assets consist of accounts receivable that have been
outstanding for more than 30 days. Slow payments might require management to change its credit policy by
40
shortening the credit period or by implementing a more effective cash-collection policy. Internal management
also uses this “number-crunching” process to decide how much inventory is to be held at any one time or
whether to merge with or acquire another company.
External Users
External users include investors, creditors, unions, and prospective employees. Investors might use the financial
statements to study whether there is an adequate profit margin or a favorable return on assets. The financial
health of the company, as perceived by investors, will affect the market price of the company’s stock, cost of
financing, and bond rating. For creditors, financial statements indicate a company’s ability to repay a loan. A
union will study the financial statements to evaluate their wage and pension demands when their old contract
with management expires. Finally, students and other job seekers might analyze a company’s financial
statements to determine career opportunities.
Horizontal and Vertical Analysis
Financial statement analysis includes horizontal analysis (percentage change over the years) and vertical analysis
(percentage relationship within one year). Sources of financial information include a company’s annual financial
report, SEC filings, financial reference books put out by such firms as Dun & Bradstreet, trade publications, and
financial newspapers such as the Wall Street Journal.
An analyst also studies industry norms. This measurement indicates how a company is performing in
comparison with other companies in the same industry. Unfortunately, there are limitations to the use of this
method. First, one company in the same industry might be involved in manufacturing and selling a product in
large quantities at the wholesale level, while another enterprise might only sell at the retail level to the public.
Second, each enterprise might use a different accounting method for financial reporting purposes. For example,
one company might value its ending inventory according to the FIFO method, while a competitor might use LIFO.
In addition, the two companies might use a different accounting method for recording depreciation. The
cumulative effect of the use of different accounting methods might make a comparison of net income and fixed-
asset valuation of little importance.
Financial Statement Analysis
The financial community uses several methods for evaluating the financial health of an enterprise. These
methods include trend analysis, horizontal and vertical analysis, and ratio analysis.
Trend Analysis
Trend analysis indicates in which direction a company is headed. Trend percentages are computed by taking a
base year and assigning its figures as a value of 100. Figures generated in subsequent years are expressed as
percentages of base-year numbers.
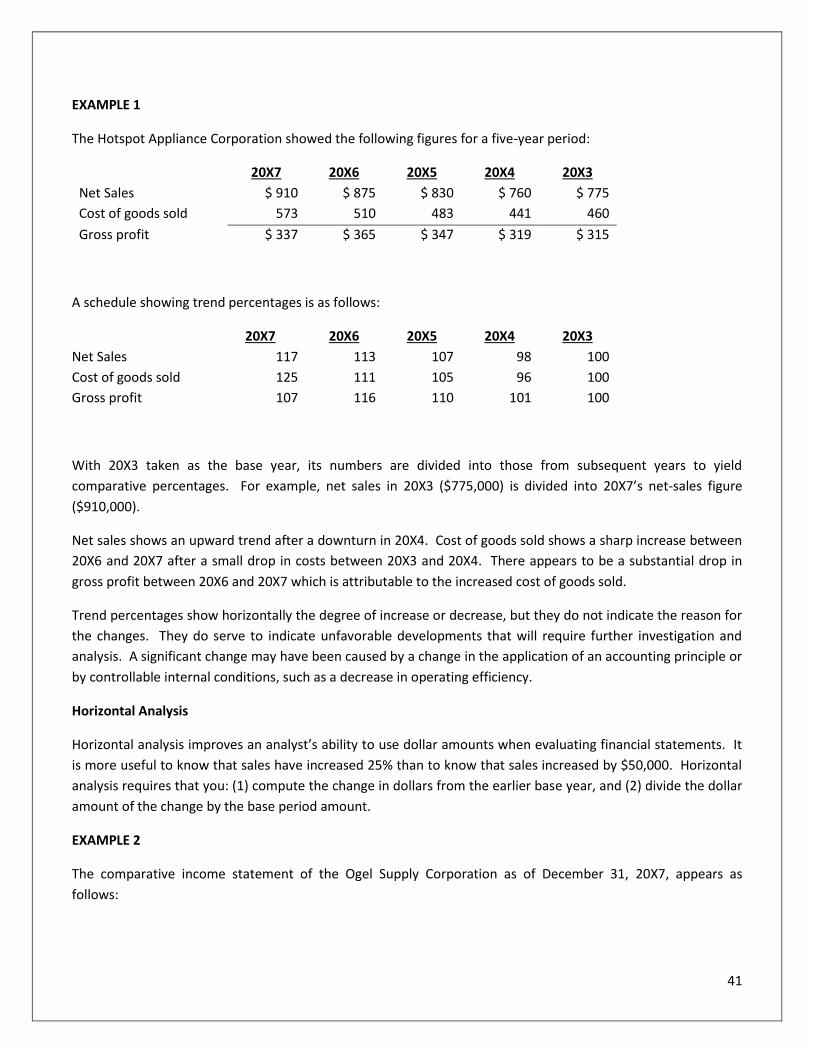
41
EXAMPLE 1
The Hotspot Appliance Corporation showed the following figures for a five-year period:
20X7 20X6 20X5 20X4 20X3
Net Sales $ 910 $ 875 $ 830 $ 760 $ 775
Cost of goods sold 573 510 483 441 460
Gross profit $ 337 $ 365 $ 347 $ 319 $ 315
A schedule showing trend percentages is as follows:
20X7 20X6 20X5 20X4 20X3
Net Sales 117 113 107 98 100
Cost of goods sold 125 111 105 96 100
Gross profit 107 116 110 101 100
With 20X3 taken as the base year, its numbers are divided into those from subsequent years to yield
comparative percentages. For example, net sales in 20X3 ($775,000) is divided into 20X7’s net-sales figure
($910,000).
Net sales shows an upward trend after a downturn in 20X4. Cost of goods sold shows a sharp increase between
20X6 and 20X7 after a small drop in costs between 20X3 and 20X4. There appears to be a substantial drop in
gross profit between 20X6 and 20X7 which is attributable to the increased cost of goods sold.
Trend percentages show horizontally the degree of increase or decrease, but they do not indicate the reason for
the changes. They do serve to indicate unfavorable developments that will require further investigation and
analysis. A significant change may have been caused by a change in the application of an accounting principle or
by controllable internal conditions, such as a decrease in operating efficiency.
Horizontal Analysis
Horizontal analysis improves an analyst’s ability to use dollar amounts when evaluating financial statements. It
is more useful to know that sales have increased 25% than to know that sales increased by $50,000. Horizontal
analysis requires that you: (1) compute the change in dollars from the earlier base year, and (2) divide the dollar
amount of the change by the base period amount.
EXAMPLE 2
The comparative income statement of the Ogel Supply Corporation as of December 31, 20X7, appears as
follows:
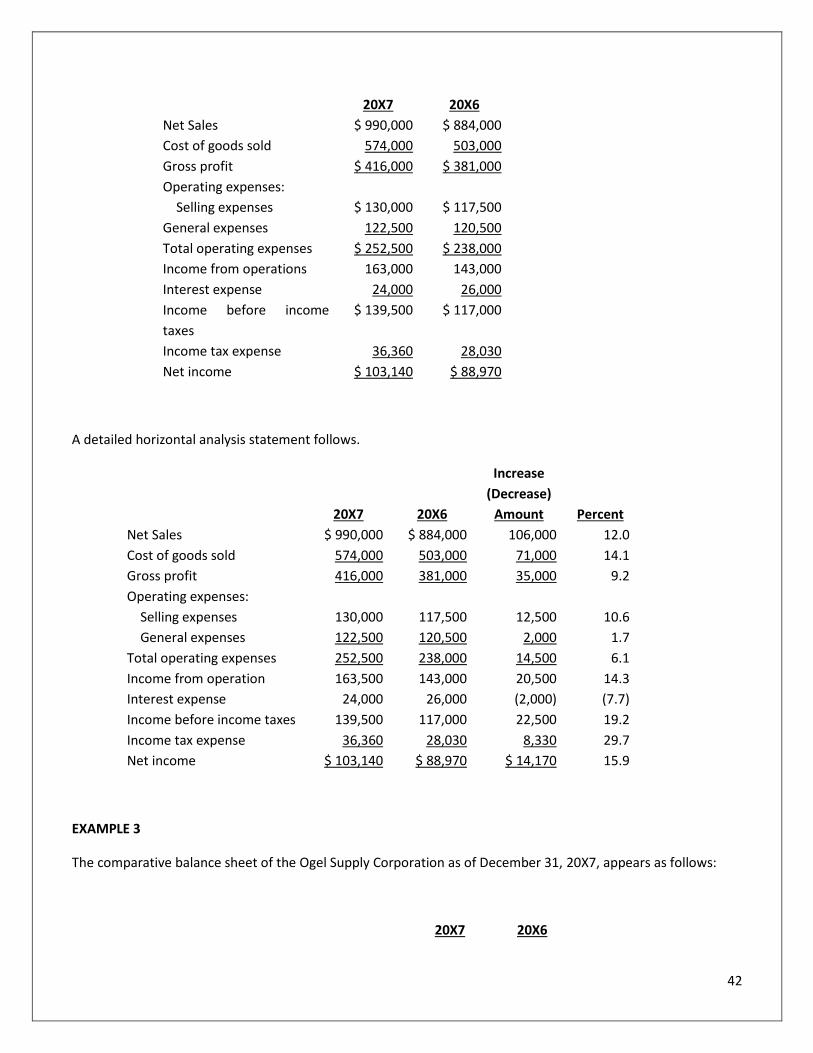
42
20X7 20X6
Net Sales $ 990,000 $ 884,000
Cost of goods sold 574,000 503,000
Gross profit $ 416,000 $ 381,000
Operating expenses:
Selling expenses $ 130,000 $ 117,500
General expenses 122,500 120,500
Total operating expenses $ 252,500 $ 238,000
Income from operations 163,000 143,000
Interest expense 24,000 26,000
Income before income
taxes
$ 139,500 $ 117,000
Income tax expense 36,360 28,030
Net income $ 103,140 $ 88,970
A detailed horizontal analysis statement follows.
Increase
(Decrease)
20X7 20X6 Amount Percent
Net Sales $ 990,000 $ 884,000 106,000 12.0
Cost of goods sold 574,000 503,000 71,000 14.1
Gross profit 416,000 381,000 35,000 9.2
Operating expenses:
Selling expenses 130,000 117,500 12,500 10.6
General expenses 122,500 120,500 2,000 1.7
Total operating expenses 252,500 238,000 14,500 6.1
Income from operation 163,500 143,000 20,500 14.3
Interest expense 24,000 26,000 (2,000) (7.7)
Income before income taxes 139,500 117,000 22,500 19.2
Income tax expense 36,360 28,030 8,330 29.7
Net income $ 103,140 $ 88,970 $ 14,170 15.9
EXAMPLE 3
The comparative balance sheet of the Ogel Supply Corporation as of December 31, 20X7, appears as follows:
20X7 20X6
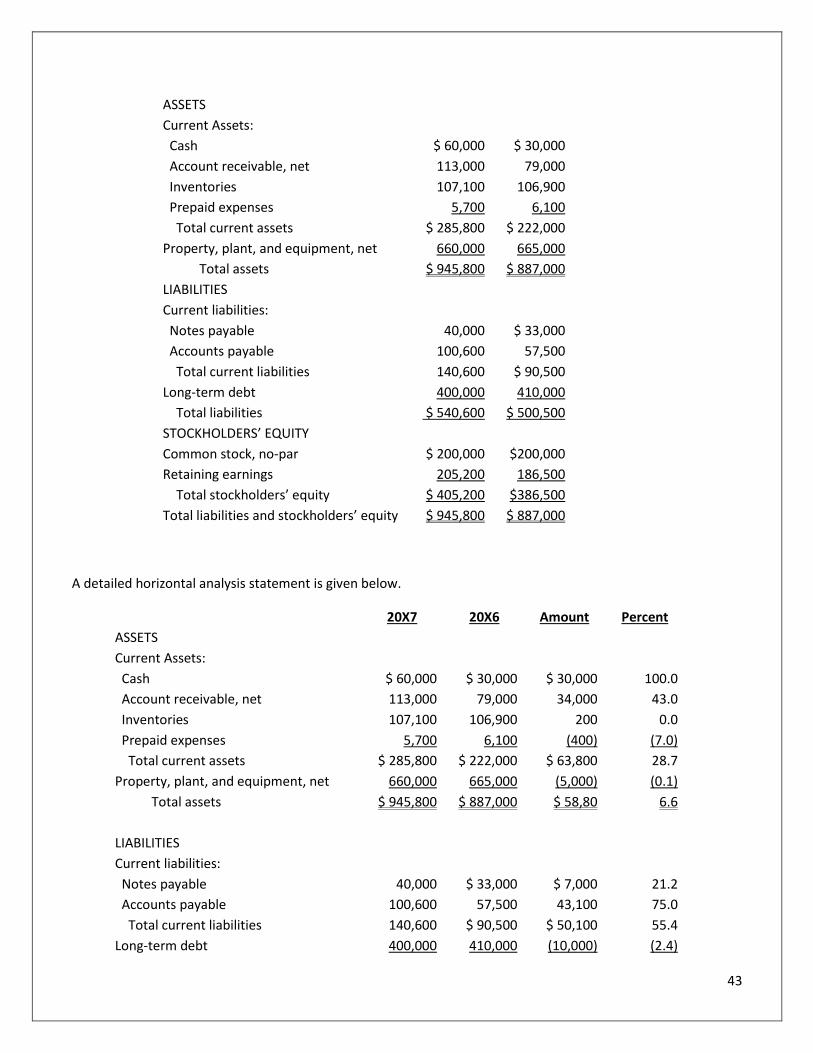
43
ASSETS
Current Assets:
Cash $ 60,000 $ 30,000
Account receivable, net 113,000 79,000
Inventories 107,100 106,900
Prepaid expenses 5,700 6,100
Total current assets $ 285,800 $ 222,000
Property, plant, and equipment, net 660,000 665,000
Total assets $ 945,800 $ 887,000
LIABILITIES
Current liabilities:
Notes payable 40,000 $ 33,000
Accounts payable 100,600 57,500
Total current liabilities 140,600 $ 90,500
Long-term debt 400,000 410,000
Total liabilities $ 540,600 $ 500,500
STOCKHOLDERS’ EQUITY
Common stock, no-par $ 200,000 $200,000
Retaining earnings 205,200 186,500
Total stockholders’ equity $ 405,200 $386,500
Total liabilities and stockholders’ equity $ 945,800 $ 887,000
A detailed horizontal analysis statement is given below.
20X7 20X6 Amount Percent
ASSETS
Current Assets:
Cash $ 60,000 $ 30,000 $ 30,000 100.0
Account receivable, net 113,000 79,000 34,000 43.0
Inventories 107,100 106,900 200 0.0
Prepaid expenses 5,700 6,100 (400) (7.0)
Total current assets $ 285,800 $ 222,000 $ 63,800 28.7
Property, plant, and equipment, net 660,000 665,000 (5,000) (0.1)
Total assets $ 945,800 $ 887,000 $ 58,80 6.6
LIABILITIES
Current liabilities:
Notes payable 40,000 $ 33,000 $ 7,000 21.2
Accounts payable 100,600 57,500 43,100 75.0
Total current liabilities 140,600 $ 90,500 $ 50,100 55.4
Long-term debt 400,000 410,000 (10,000) (2.4)
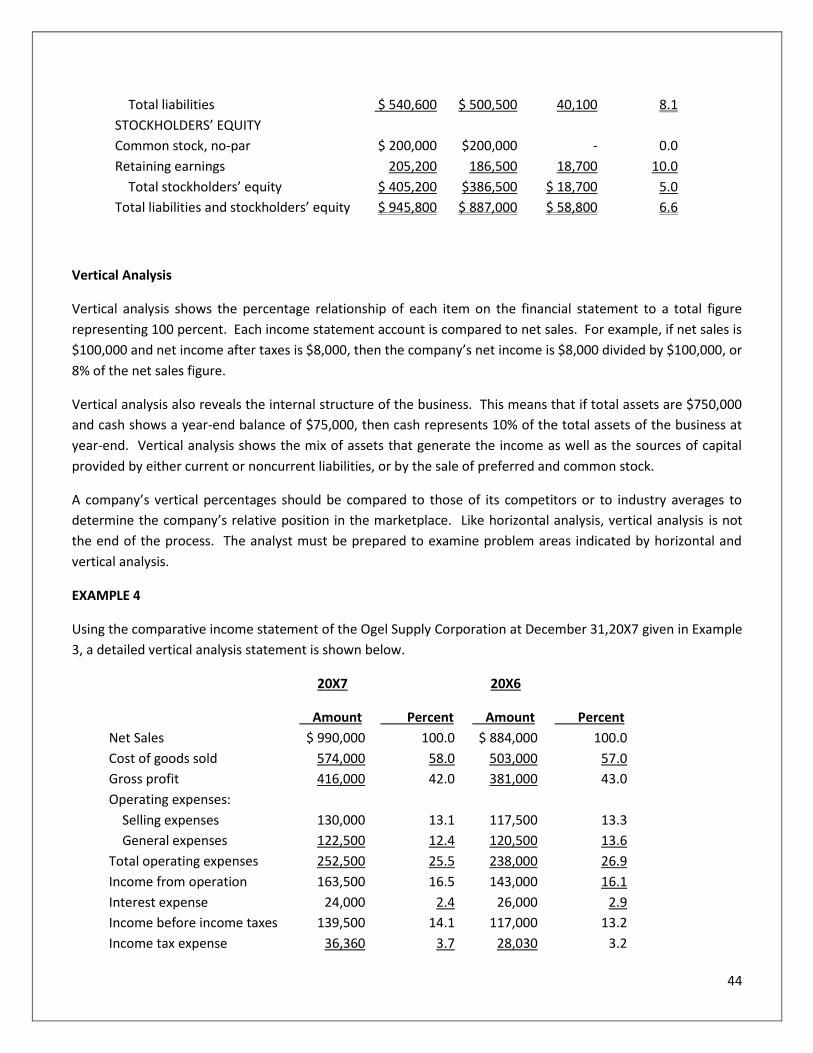
44
Total liabilities $ 540,600 $ 500,500 40,100 8.1
STOCKHOLDERS’ EQUITY
Common stock, no-par $ 200,000 $200,000 - 0.0
Retaining earnings 205,200 186,500 18,700 10.0
Total stockholders’ equity $ 405,200 $386,500 $ 18,700 5.0
Total liabilities and stockholders’ equity $ 945,800 $ 887,000 $ 58,800 6.6
Vertical Analysis
Vertical analysis shows the percentage relationship of each item on the financial statement to a total figure
representing 100 percent. Each income statement account is compared to net sales. For example, if net sales is
$100,000 and net income after taxes is $8,000, then the company’s net income is $8,000 divided by $100,000, or
8% of the net sales figure.
Vertical analysis also reveals the internal structure of the business. This means that if total assets are $750,000
and cash shows a year-end balance of $75,000, then cash represents 10% of the total assets of the business at
year-end. Vertical analysis shows the mix of assets that generate the income as well as the sources of capital
provided by either current or noncurrent liabilities, or by the sale of preferred and common stock.
A company’s vertical percentages should be compared to those of its competitors or to industry averages to
determine the company’s relative position in the marketplace. Like horizontal analysis, vertical analysis is not
the end of the process. The analyst must be prepared to examine problem areas indicated by horizontal and
vertical analysis.
EXAMPLE 4
Using the comparative income statement of the Ogel Supply Corporation at December 31,20X7 given in Example
3, a detailed vertical analysis statement is shown below.
20X7 20X6
Amount Percent Amount Percent
Net Sales $ 990,000 100.0 $ 884,000 100.0
Cost of goods sold 574,000 58.0 503,000 57.0
Gross profit 416,000 42.0 381,000 43.0
Operating expenses:
Selling expenses 130,000 13.1 117,500 13.3
General expenses 122,500 12.4 120,500 13.6
Total operating expenses 252,500 25.5 238,000 26.9
Income from operation 163,500 16.5 143,000 16.1
Interest expense 24,000 2.4 26,000 2.9
Income before income taxes 139,500 14.1 117,000 13.2
Income tax expense 36,360 3.7 28,030 3.2
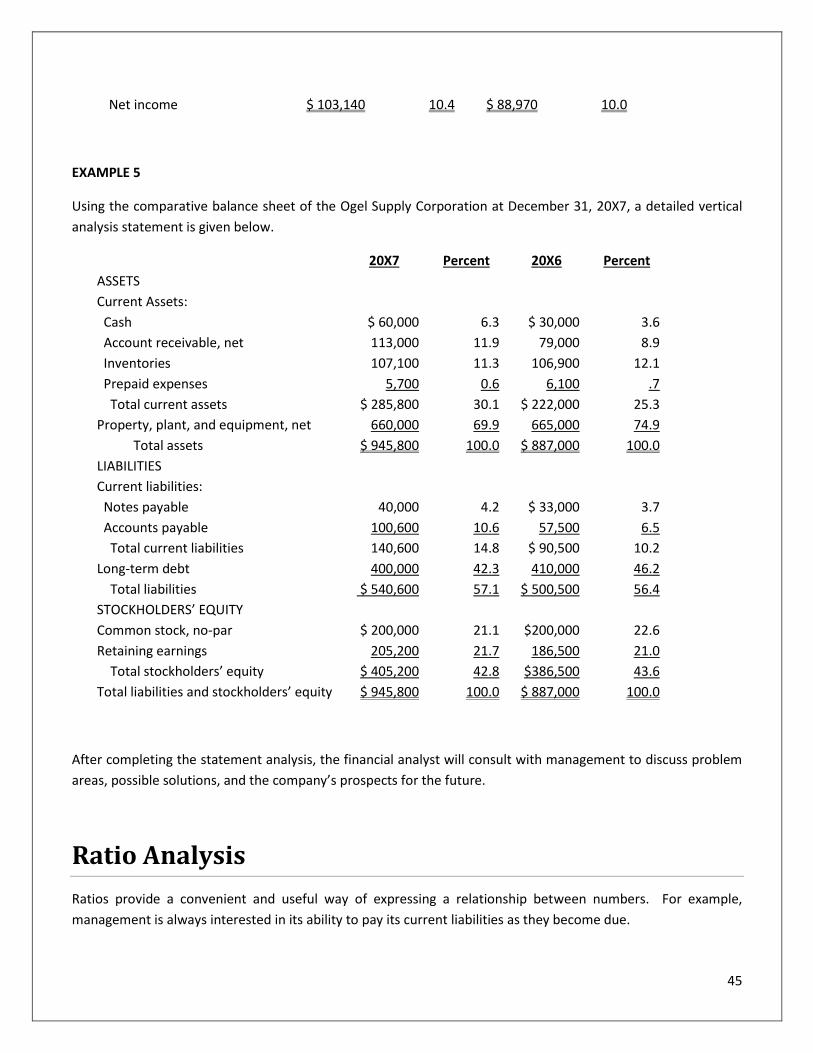
45
Net income $ 103,140 10.4 $ 88,970 10.0
EXAMPLE 5
Using the comparative balance sheet of the Ogel Supply Corporation at December 31, 20X7, a detailed vertical
analysis statement is given below.
20X7 Percent 20X6 Percent
ASSETS
Current Assets:
Cash $ 60,000 6.3 $ 30,000 3.6
Account receivable, net 113,000 11.9 79,000 8.9
Inventories 107,100 11.3 106,900 12.1
Prepaid expenses 5,700 0.6 6,100 .7
Total current assets $ 285,800 30.1 $ 222,000 25.3
Property, plant, and equipment, net 660,000 69.9 665,000 74.9
Total assets $ 945,800 100.0 $ 887,000 100.0
LIABILITIES
Current liabilities:
Notes payable 40,000 4.2 $ 33,000 3.7
Accounts payable 100,600 10.6 57,500 6.5
Total current liabilities 140,600 14.8 $ 90,500 10.2
Long-term debt 400,000 42.3 410,000 46.2
Total liabilities $ 540,600 57.1 $ 500,500 56.4
STOCKHOLDERS’ EQUITY
Common stock, no-par $ 200,000 21.1 $200,000 22.6
Retaining earnings 205,200 21.7 186,500 21.0
Total stockholders’ equity $ 405,200 42.8 $386,500 43.6
Total liabilities and stockholders’ equity $ 945,800 100.0 $ 887,000 100.0
After completing the statement analysis, the financial analyst will consult with management to discuss problem
areas, possible solutions, and the company’s prospects for the future.
Ratio Analysis
Ratios provide a convenient and useful way of expressing a relationship between numbers. For example,
management is always interested in its ability to pay its current liabilities as they become due.
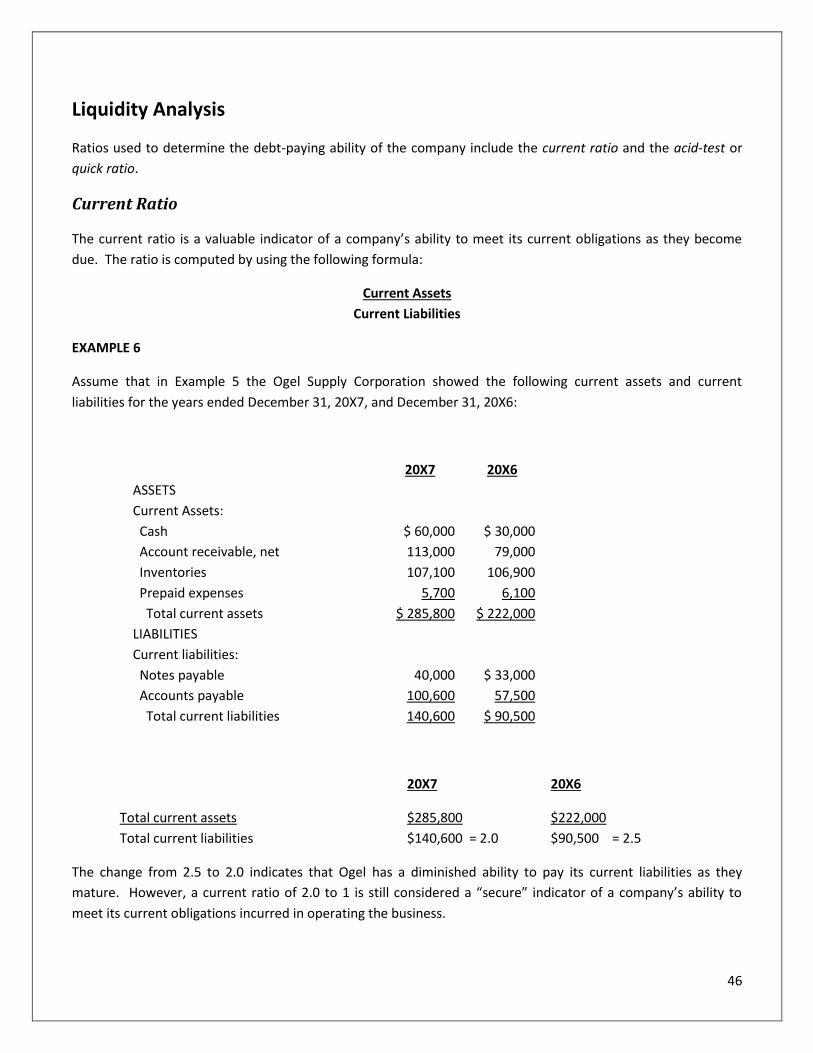
46
Liquidity Analysis
Ratios used to determine the debt-paying ability of the company include the current ratio and the acid-test or
quick ratio.
Current Ratio
The current ratio is a valuable indicator of a company’s ability to meet its current obligations as they become
due. The ratio is computed by using the following formula:
Current Assets
Current Liabilities
EXAMPLE 6
Assume that in Example 5 the Ogel Supply Corporation showed the following current assets and current
liabilities for the years ended December 31, 20X7, and December 31, 20X6:
20X7 20X6
ASSETS
Current Assets:
Cash $ 60,000 $ 30,000
Account receivable, net 113,000 79,000
Inventories 107,100 106,900
Prepaid expenses 5,700 6,100
Total current assets $ 285,800 $ 222,000
LIABILITIES
Current liabilities:
Notes payable 40,000 $ 33,000
Accounts payable 100,600 57,500
Total current liabilities 140,600 $ 90,500
20X7 20X6
Total current assets $285,800 $222,000
Total current liabilities $140,600 = 2.0 $90,500 = 2.5
The change from 2.5 to 2.0 indicates that Ogel has a diminished ability to pay its current liabilities as they
mature. However, a current ratio of 2.0 to 1 is still considered a “secure” indicator of a company’s ability to
meet its current obligations incurred in operating the business.
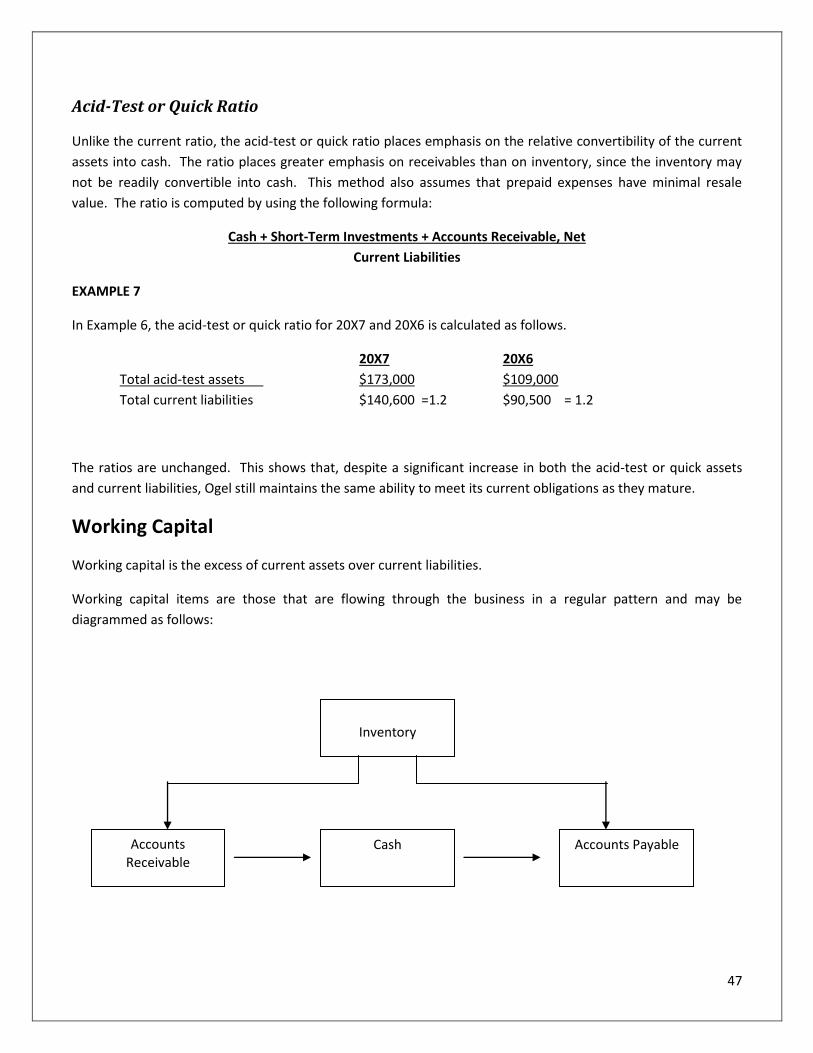
47
Acid-Test or Quick Ratio
Unlike the current ratio, the acid-test or quick ratio places emphasis on the relative convertibility of the current
assets into cash. The ratio places greater emphasis on receivables than on inventory, since the inventory may
not be readily convertible into cash. This method also assumes that prepaid expenses have minimal resale
value. The ratio is computed by using the following formula:
Cash + Short-Term Investments + Accounts Receivable, Net
Current Liabilities
EXAMPLE 7
In Example 6, the acid-test or quick ratio for 20X7 and 20X6 is calculated as follows.
20X7 20X6
Total acid-test assets $173,000 $109,000
Total current liabilities $140,600 =1.2 $90,500 = 1.2
The ratios are unchanged. This shows that, despite a significant increase in both the acid-test or quick assets
and current liabilities, Ogel still maintains the same ability to meet its current obligations as they mature.
Working Capital
Working capital is the excess of current assets over current liabilities.
Working capital items are those that are flowing through the business in a regular pattern and may be
diagrammed as follows:
Inventory
Accounts Receivable
Cash Accounts Payable
48
EXAMPLE 8
In Example 6, working capital for 20X7 and 20X6 is:
(a)
20X7 20X6
Total currents assets $285,800 $222,000
Total current liabilities $140,600 $ 90,500
Working capital $145,200 $131,500
(b) The change from $131,500 to $145,200 indicates that Ogel has increased its working capital, which Ogel
must now decide whether it is making effective use of. For example, should any excess working capital be used
to purchase short-term income-producing investments?
Accounts-Receivable Ratios
Accounts-receivable ratios are composed of the accounts receivable turnover and the collection period, which is
the number of days the receivables are held.
Accounts-Receivable Turnover
The accounts-receivable turnover is the number of times accounts receivable are collected during the year. The
turnover equals net credit sales (if not available, then total sales) divided by the average accounts receivable.
Average accounts receivable is usually determined by adding the beginning accounts receivable to the ending
accounts receivable and dividing by two. However, average accounts receivable may be arrived at with greater
accuracy on a quarterly or monthly basis, particularly for a seasonal business. Unfortunately, this information is
typically known only to management. Using data for the shortest time period will provide the most reliable
ratio.
The higher the accounts-receivable turnover, the more successfully the business collects cash. However, an
excessively high ratio may signal an excessively stringent credit policy, with management not taking advantage
of the potential profit by selling to customers with greater risk. Note that here, too, before changing its credit
policy, management has to consider the profit potential versus the inherent risk in selling to more marginal
customers. For example, bad debt losses will increase when credit policies are liberalized to include riskier
customers.
The formula for determining the accounts-receivable turnover is expressed as follows:
Net Credit Sales
Average Net Accounts Receivable
EXAMPLE 9
The Ogel Supply Corporation showed the following accounts-receivable totals for the years ended December 31,
20X7, and December 31, 20X6:
49
20X7 20X6
Current assets:
Accounts receivable, net 113,000 79,000
Assume sales of $990,000 for 20X7. Calculating the accounts-receivable turnover for 20X7 yields:
Average accounts receivable = ($113,000+$79,000) / 2 = $96,000
Sales $990,000
Average accounts receivable = $96,000 = 10.3
Days-Sales-in-Receivables
The days-sales-in-receivables determines how many days’ sales remain in accounts receivable. It is also called
the receivables collection period. The determination is a two-step process. First, divide the net sales by 365
days to determine the sales amount for an average day. Then divide this figure into the average net accounts
receivable.
EXAMPLE 10
The days-sales-in-receivables the Ogel Supply Corporation is computed as follows.
Step one:
Net sales $990,000
365 days = 365 = $2,712
Step two:
Average net accounts receivable $96,000
One day’s sales = $2,712 = 35.4 days
Inventory Ratios
A company with excess inventory is tying up funds that could be invested elsewhere for a return. Inventory
turnover is a measure of the number of times a company sells its average level of inventory during the year. A
high turnover indicates an ability to sell the inventory, while a low number indicates an inability. A low
inventory turnover may lead to inventory obsolescence and high storage and insurance costs. The formula for
determining inventory turnover is:
Cost of Goods Sold
Average Inventory
EXAMPLE 11
50
The Ogel Supply Corporation showed the following inventory amounts for the years ended December 31, 20X7,
and December 31, 20X6:
Current assets: 20X7 20X6
Inventories 107,100 106,900
If cost of goods sold is $574,000 for 20X7, the inventory turnover for 20X7 is calculated as follows.
Average inventories = ($107,100 + $106,900) / 2 = $107,000
Cost of goods sold $574,000
Average inventories = $107,000 = 5.4
Interrelationship of Liquidity and Activity to Earnings
There is a trade-off between liquidity risk and return. Liquidity risk is reduced by holding more current assets
than noncurrent assets. There will be less of a return, however, because the return rate on current assets (i.e.,
marketable securities) is usually less than the return rate on productive fixed assets. Further, excessive liquidity
may mean that management has not been aggressive enough in finding attractive capital-investment
opportunities. There should be a balance between liquidity and return.
High profitability does not automatically mean a strong cash flow. Cash problems may exist even with a high net
income due to maturing debt and the need for asset replacement, among other reasons. For instance, it is
possible that a growth business may have a decline in liquidity because cash is needed to finance an expanded
sales base.
Measuring a Company’s Ability to Pay Its Long-Term Debt
A corporation with a large amount of debt runs a greater risk of insolvency than one with a large amount of
preferred or common stock outstanding. The reason is that payment of interest is mandatory, while the
payment of dividends is discretionary with the corporation’s board of directors. Individuals and banks that
purchase the long-term notes and bonds issued by an enterprise take a special interest in a business’s ability to
repay its debt plus interest. Two key methods used to measure a company’s ability to pay its legal obligations
(solvency) as they become due are the debt ratio and the times-interest-earned ratio.
Debt Ratio
The debt ratio indicates how much of the company’s assets were obtained by the issuance of debt. If the ratio is
1, it means that all of the firm’s assets were financed by the issuance of debt. If the ratio is 0.6, it means that
60% of the company’s assets were financed by debt. The formula for the debt ratio is:
Total Liabilities
Total Assets
EXAMPLE 12
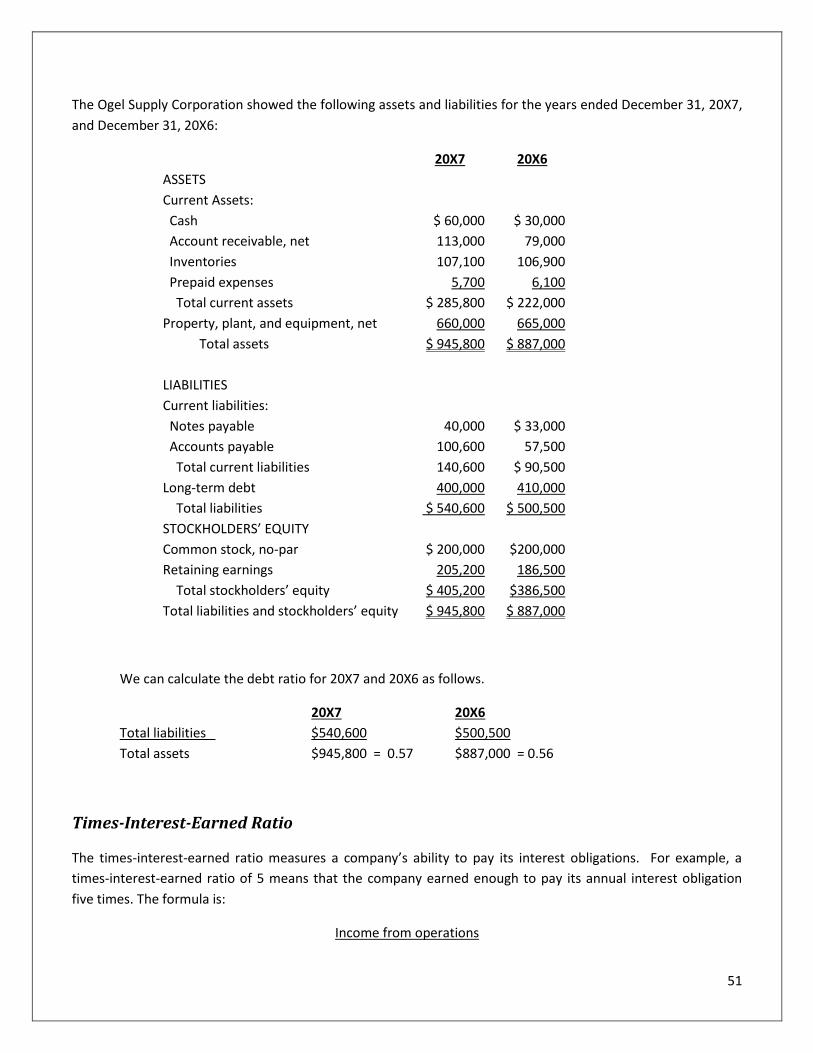
51
The Ogel Supply Corporation showed the following assets and liabilities for the years ended December 31, 20X7,
and December 31, 20X6:
20X7 20X6
ASSETS
Current Assets:
Cash $ 60,000 $ 30,000
Account receivable, net 113,000 79,000
Inventories 107,100 106,900
Prepaid expenses 5,700 6,100
Total current assets $ 285,800 $ 222,000
Property, plant, and equipment, net 660,000 665,000
Total assets $ 945,800 $ 887,000
LIABILITIES
Current liabilities:
Notes payable 40,000 $ 33,000
Accounts payable 100,600 57,500
Total current liabilities 140,600 $ 90,500
Long-term debt 400,000 410,000
Total liabilities $ 540,600 $ 500,500
STOCKHOLDERS’ EQUITY
Common stock, no-par $ 200,000 $200,000
Retaining earnings 205,200 186,500
Total stockholders’ equity $ 405,200 $386,500
Total liabilities and stockholders’ equity $ 945,800 $ 887,000
We can calculate the debt ratio for 20X7 and 20X6 as follows.
20X7 20X6
Total liabilities $540,600 $500,500
Total assets $945,800 = 0.57 $887,000 = 0.56
Times-Interest-Earned Ratio
The times-interest-earned ratio measures a company’s ability to pay its interest obligations. For example, a
times-interest-earned ratio of 5 means that the company earned enough to pay its annual interest obligation
five times. The formula is:
Income from operations
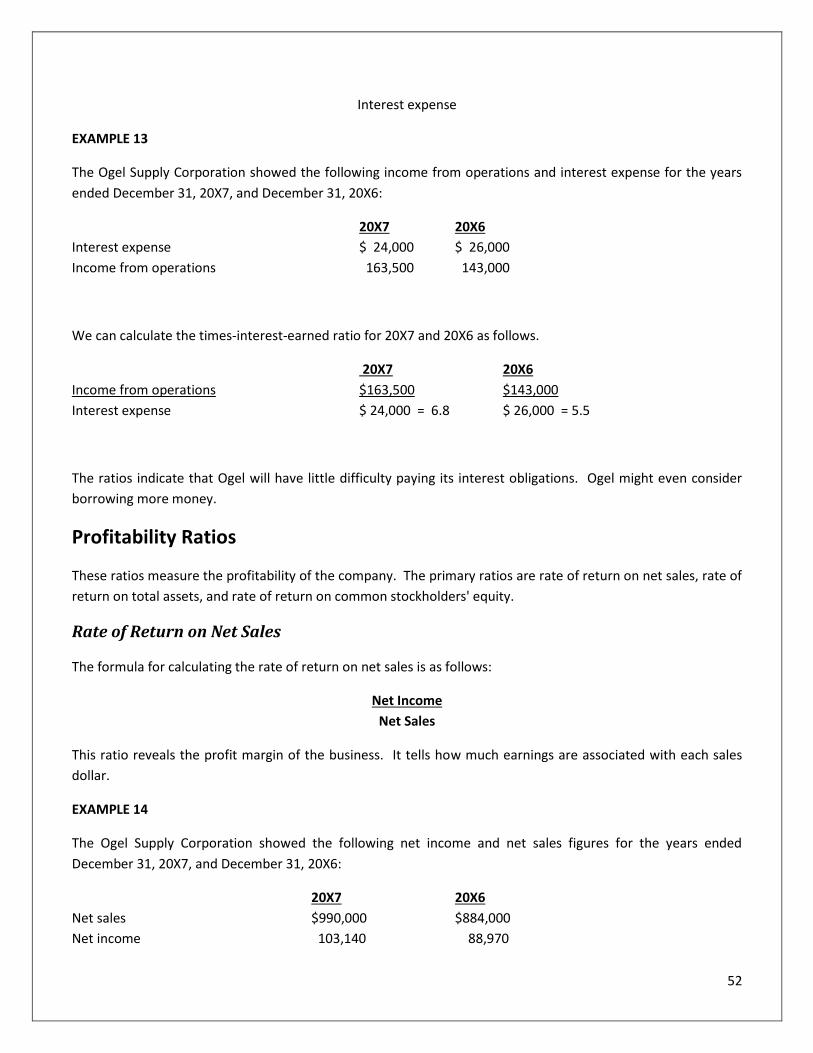
52
Interest expense
EXAMPLE 13
The Ogel Supply Corporation showed the following income from operations and interest expense for the years
ended December 31, 20X7, and December 31, 20X6:
20X7 20X6
Interest expense $ 24,000 $ 26,000
Income from operations 163,500 143,000
We can calculate the times-interest-earned ratio for 20X7 and 20X6 as follows.
20X7 20X6
Income from operations $163,500 $143,000
Interest expense $ 24,000 = 6.8 $ 26,000 = 5.5
The ratios indicate that Ogel will have little difficulty paying its interest obligations. Ogel might even consider
borrowing more money.
Profitability Ratios
These ratios measure the profitability of the company. The primary ratios are rate of return on net sales, rate of
return on total assets, and rate of return on common stockholders' equity.
Rate of Return on Net Sales
The formula for calculating the rate of return on net sales is as follows:
Net Income
Net Sales
This ratio reveals the profit margin of the business. It tells how much earnings are associated with each sales
dollar.
EXAMPLE 14
The Ogel Supply Corporation showed the following net income and net sales figures for the years ended
December 31, 20X7, and December 31, 20X6:
20X7 20X6
Net sales $990,000 $884,000
Net income 103,140 88,970
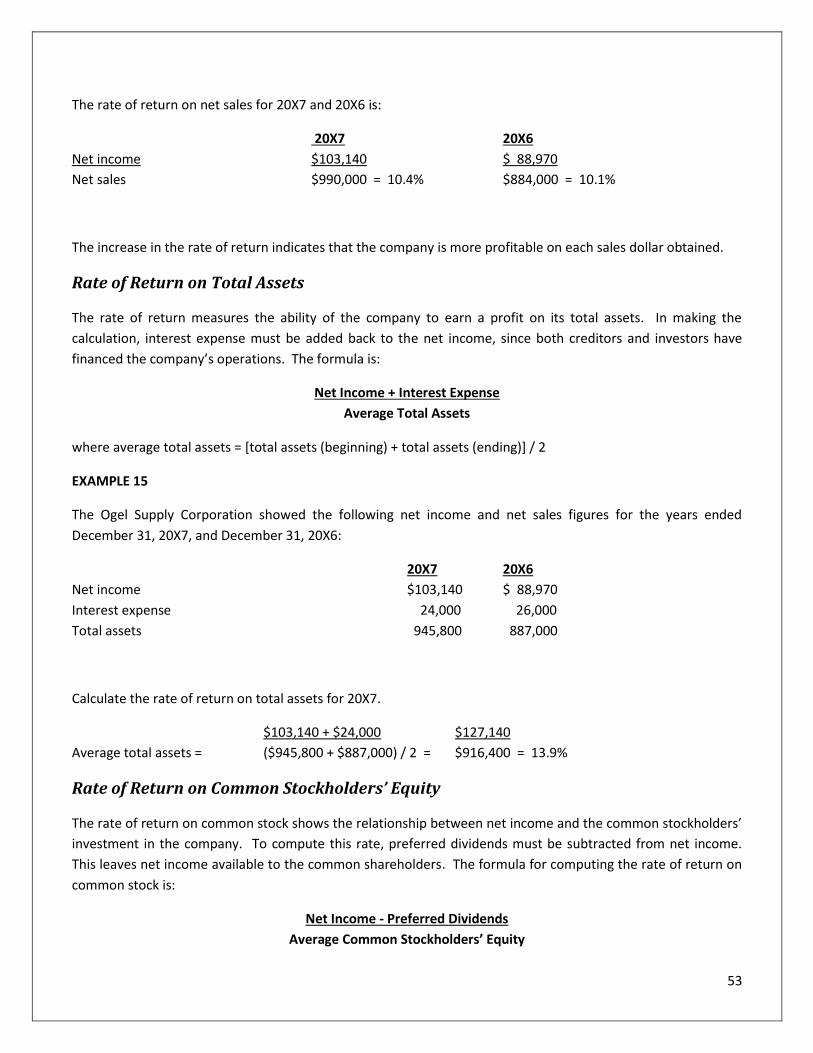
53
The rate of return on net sales for 20X7 and 20X6 is:
20X7 20X6
Net income $103,140 $ 88,970
Net sales $990,000 = 10.4% $884,000 = 10.1%
The increase in the rate of return indicates that the company is more profitable on each sales dollar obtained.
Rate of Return on Total Assets
The rate of return measures the ability of the company to earn a profit on its total assets. In making the
calculation, interest expense must be added back to the net income, since both creditors and investors have
financed the company’s operations. The formula is:
Net Income + Interest Expense
Average Total Assets
where average total assets = [total assets (beginning) + total assets (ending)] / 2
EXAMPLE 15
The Ogel Supply Corporation showed the following net income and net sales figures for the years ended
December 31, 20X7, and December 31, 20X6:
20X7 20X6
Net income $103,140 $ 88,970
Interest expense 24,000 26,000
Total assets 945,800 887,000
Calculate the rate of return on total assets for 20X7.
$103,140 + $24,000 $127,140
Average total assets = ($945,800 + $887,000) / 2 = $916,400 = 13.9%
Rate of Return on Common Stockholders’ Equity
The rate of return on common stock shows the relationship between net income and the common stockholders’
investment in the company. To compute this rate, preferred dividends must be subtracted from net income.
This leaves net income available to the common shareholders. The formula for computing the rate of return on
common stock is:
Net Income - Preferred Dividends
Average Common Stockholders’ Equity
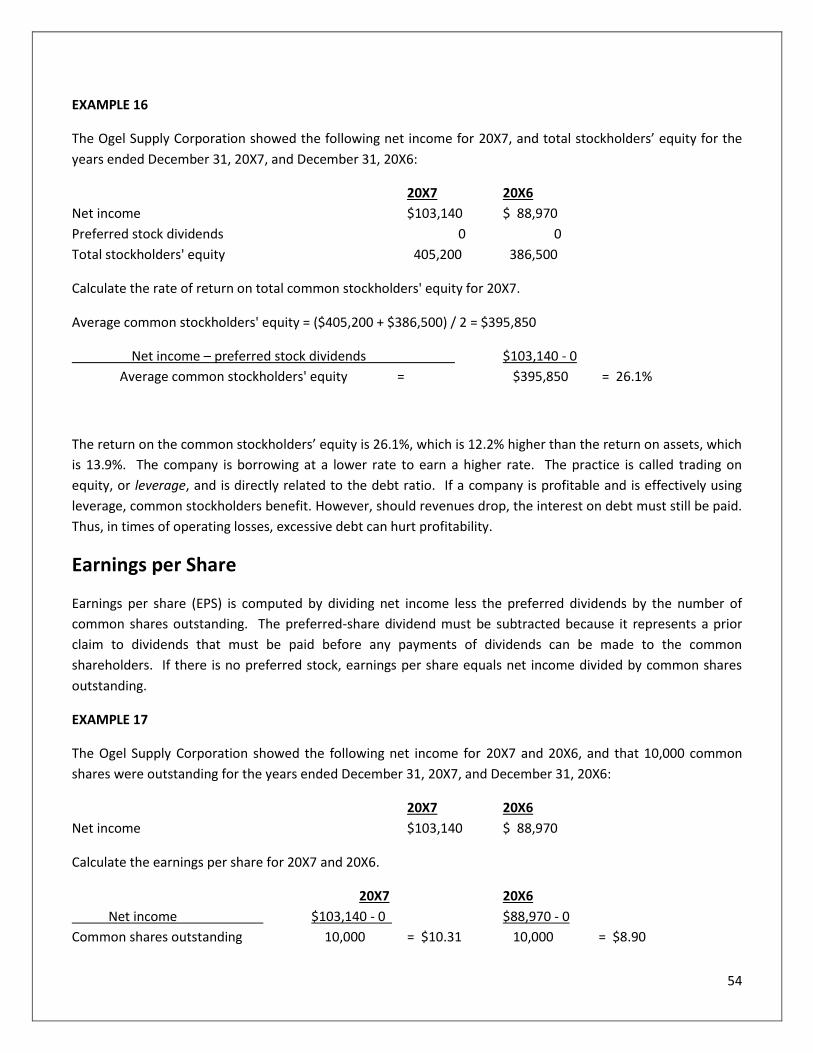
54
EXAMPLE 16
The Ogel Supply Corporation showed the following net income for 20X7, and total stockholders’ equity for the
years ended December 31, 20X7, and December 31, 20X6:
20X7 20X6
Net income $103,140 $ 88,970
Preferred stock dividends 0 0
Total stockholders' equity 405,200 386,500
Calculate the rate of return on total common stockholders' equity for 20X7.
Average common stockholders' equity = ($405,200 + $386,500) / 2 = $395,850
Net income – preferred stock dividends $103,140 - 0
Average common stockholders' equity = $395,850 = 26.1%
The return on the common stockholders’ equity is 26.1%, which is 12.2% higher than the return on assets, which
is 13.9%. The company is borrowing at a lower rate to earn a higher rate. The practice is called trading on
equity, or leverage, and is directly related to the debt ratio. If a company is profitable and is effectively using
leverage, common stockholders benefit. However, should revenues drop, the interest on debt must still be paid.
Thus, in times of operating losses, excessive debt can hurt profitability.
Earnings per Share
Earnings per share (EPS) is computed by dividing net income less the preferred dividends by the number of
common shares outstanding. The preferred-share dividend must be subtracted because it represents a prior
claim to dividends that must be paid before any payments of dividends can be made to the common
shareholders. If there is no preferred stock, earnings per share equals net income divided by common shares
outstanding.
EXAMPLE 17
The Ogel Supply Corporation showed the following net income for 20X7 and 20X6, and that 10,000 common
shares were outstanding for the years ended December 31, 20X7, and December 31, 20X6:
20X7 20X6
Net income $103,140 $ 88,970
Calculate the earnings per share for 20X7 and 20X6.
20X7 20X6
Net income $103,140 - 0 $88,970 - 0
Common shares outstanding 10,000 = $10.31 10,000 = $8.90
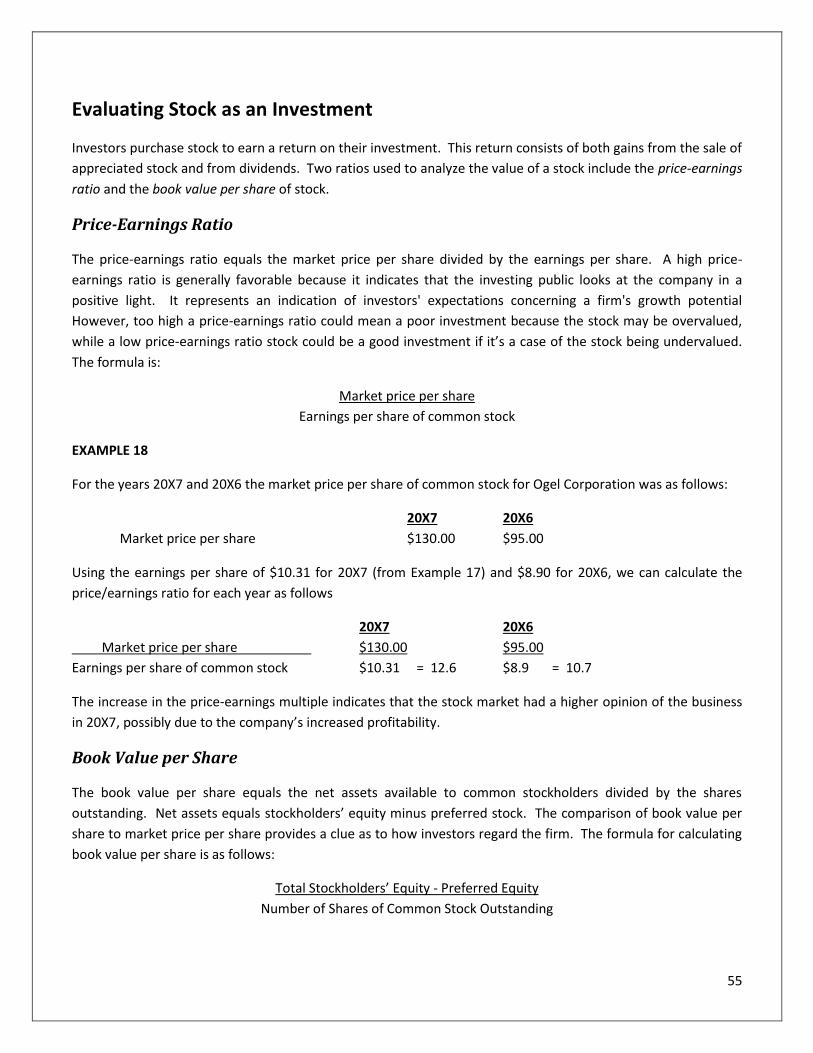
55
Evaluating Stock as an Investment
Investors purchase stock to earn a return on their investment. This return consists of both gains from the sale of
appreciated stock and from dividends. Two ratios used to analyze the value of a stock include the price-earnings
ratio and the book value per share of stock.
Price-Earnings Ratio
The price-earnings ratio equals the market price per share divided by the earnings per share. A high price-
earnings ratio is generally favorable because it indicates that the investing public looks at the company in a
positive light. It represents an indication of investors' expectations concerning a firm's growth potential
However, too high a price-earnings ratio could mean a poor investment because the stock may be overvalued,
while a low price-earnings ratio stock could be a good investment if it’s a case of the stock being undervalued.
The formula is:
Market price per share
Earnings per share of common stock
EXAMPLE 18
For the years 20X7 and 20X6 the market price per share of common stock for Ogel Corporation was as follows:
20X7 20X6
Market price per share $130.00 $95.00
Using the earnings per share of $10.31 for 20X7 (from Example 17) and $8.90 for 20X6, we can calculate the
price/earnings ratio for each year as follows
20X7 20X6
Market price per share $130.00 $95.00
Earnings per share of common stock $10.31 = 12.6 $8.9 = 10.7
The increase in the price-earnings multiple indicates that the stock market had a higher opinion of the business
in 20X7, possibly due to the company’s increased profitability.
Book Value per Share
The book value per share equals the net assets available to common stockholders divided by the shares
outstanding. Net assets equals stockholders’ equity minus preferred stock. The comparison of book value per
share to market price per share provides a clue as to how investors regard the firm. The formula for calculating
book value per share is as follows:
Total Stockholders’ Equity - Preferred Equity
Number of Shares of Common Stock Outstanding
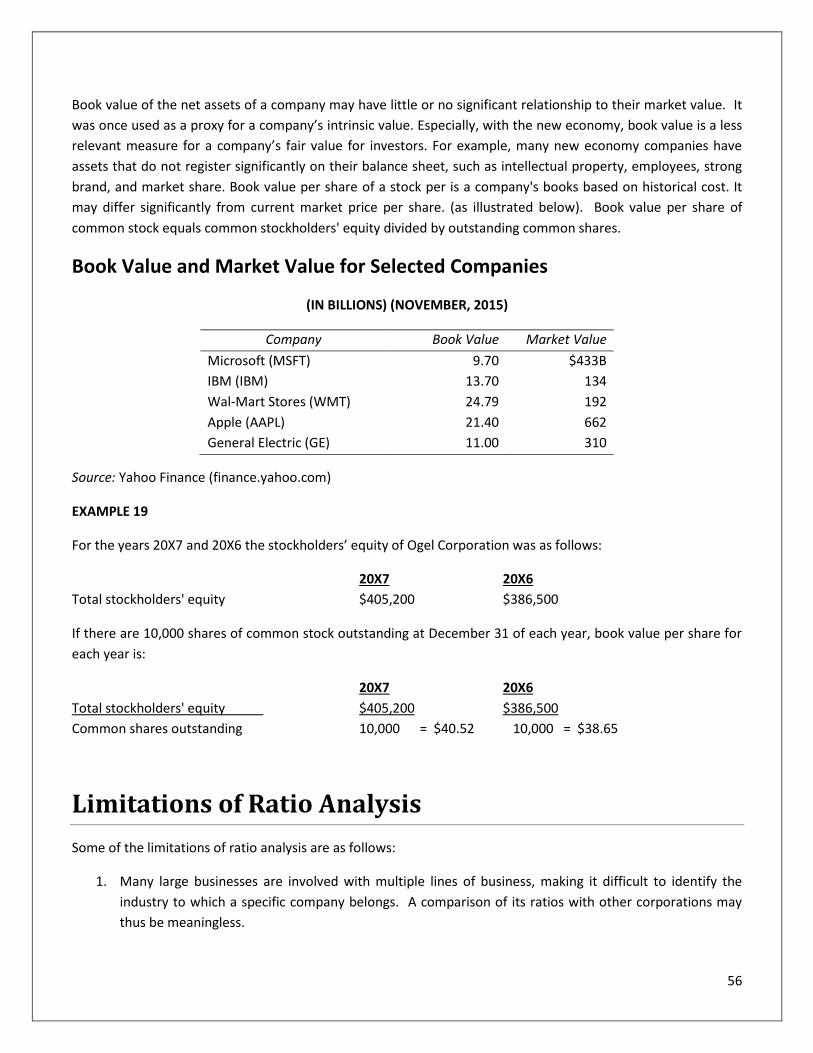
56
Book value of the net assets of a company may have little or no significant relationship to their market value. It
was once used as a proxy for a company’s intrinsic value. Especially, with the new economy, book value is a less
relevant measure for a company’s fair value for investors. For example, many new economy companies have
assets that do not register significantly on their balance sheet, such as intellectual property, employees, strong
brand, and market share. Book value per share of a stock per is a company's books based on historical cost. It
may differ significantly from current market price per share. (as illustrated below). Book value per share of
common stock equals common stockholders' equity divided by outstanding common shares.
Book Value and Market Value for Selected Companies
(IN BILLIONS) (NOVEMBER, 2015)
Company Book Value Market Value
Microsoft (MSFT) 9.70 $433B
IBM (IBM) 13.70 134
Wal-Mart Stores (WMT) 24.79 192
Apple (AAPL) 21.40 662
General Electric (GE) 11.00 310
Source: Yahoo Finance (finance.yahoo.com)
EXAMPLE 19
For the years 20X7 and 20X6 the stockholders’ equity of Ogel Corporation was as follows:
20X7 20X6
Total stockholders' equity $405,200 $386,500
If there are 10,000 shares of common stock outstanding at December 31 of each year, book value per share for
each year is:
20X7 20X6
Total stockholders' equity $405,200 $386,500
Common shares outstanding 10,000 = $40.52 10,000 = $38.65
Limitations of Ratio Analysis
Some of the limitations of ratio analysis are as follows:
1. Many large businesses are involved with multiple lines of business, making it difficult to identify the
industry to which a specific company belongs. A comparison of its ratios with other corporations may
thus be meaningless.
57
2. Accounting and operating practices differ among companies, which can distort the ratios and make
comparisons meaningless. For example, the use of different inventory-valuation methods would affect
inventory and asset-turnover ratios.
3. Industry averages published by financial advisory services are only approximations. Therefore the
company may have to look at the ratios of its major competitors if such ratios are available.
4. Financial statements are based on historical costs and do not consider inflation.
5. Management may hedge or exaggerate its financial figures. Hence, certain ratios will not be accurate
indicators.
6. A ratio does not describe the quality of its components. For example, the current ratio may be high but
inventory may consist of obsolete merchandise.
7. Ratios are static and do not take into account future trends.
Summary
Financial statement analysis is an attempt to work with reported financial figures in order to determine a
company’s financial strengths and weaknesses. Most analysts favor certain ratios and ignore others. Each ratio
should be compared to industry norms and analyzed in light of past trends. Financial analysis also calls for an
awareness of the impact of inflation and deflation on reported income. Management must also recognize that
alternate methods of financial reporting may allow firms with equal performance to report different results.
58
Chapter 4 Review Questions
1. What type of ratio is rate of return on net sales?
A. Profitability ratio
B. Activity ratio
C. Liquidity ratio
D. Leverage ratio
2. Book value per share represents the amount of shareholders' equity assigned to each outstanding share of
common stock. Which one of the following statements about book value per common share is correct?
A. Market price per common share usually approximates book value per common share.
B. Book value per common share can be misleading because it is based on historical cost.
C. A market price per common share that is greater than book value per common share is an indication of
an overvalued stock.
D. Book value per common share is the amount that would be paid to shareholders if the company were
sold to another company.
3. Which one of the following statements about the price-earnings (P-E) ratio is correct?
A. A company with high growth opportunities ordinarily has a high P-E ratio.
B. A P-E ratio has more meaning when a firm has losses than when it has profits.
C. A P-E ratio has more meaning when a firm has abnormally low profits in relation to its asset base.
D. A P-E ratio expresses the relationship between a firm's market price and its net sales.
4. Financial ratio analysis has no limitation when it comes to comparing financial fitness among firms. True or False?
5. In computing inventory turnover, the preferred base to use is the sales base because it is more likely to reflect a
change in trend. True or False?
6. What does the times-interest-earned ratio indicate?
A. Debt-paying capacity (Solvency)
B. Liquidity
59
C. Asset management
D. Profitability
7. What is a firm’s receivables collection period equal to?
A. The inventory conversion period
B. The cash conversion cycle
C. The day's-sales-in-receivables (day’s sales outstanding)
D. The inventory divided by average daily sales
8. A company has 100,000 outstanding common shares with a market value of $20 per share. Dividends of $2
per share were paid in the current year, and the enterprise has a dividend-payout ratio of 40%. What is the
price-to-earnings ratio of the company?
A. 2.5
B. 4
C. 10
D. 50
60
Chapter 5: What Is Management Accounting?
Learning Objectives:
After completing this section, you should be able to:
Recognize the benefits of and applications of management accounting and different management
systems.
Identify how to classify different costs in management accounting.
Management accounting, as defined by the Institute of Management Accountants (IMA), is the process of
identification, measurement, accumulation, analysis, preparation, interpretation, and communication of
financial information, which is used by management to plan, evaluate, control, and make decisions within an
organization. It ensures the appropriate use of and accountability for an organization's resources.
Financial Accounting versus Management Accounting
Financial accounting is mainly concerned with the historical aspects of external reporting; that is, providing
financial information to outside parties such as investors, creditors, and governments. To protect those outside
parties from being misled, financial accounting is governed by what are called generally accepted accounting
principles (GAAP).
Management accounting, on the other hand, is concerned primarily with providing information to internal
managers who are charged with planning and controlling the operations of the firm and making a variety of
management decisions. Due to its internal use within a company, management accounting is not subject to
generally accepted accounting principles (GAAP). As defined by the Financial Accounting Standards Board
(FASB), GAAP is the conventions, rules, and procedures necessary to define accounting practice for external
reporting at a particular time.
The differences between financial and management accounting are summarized below:
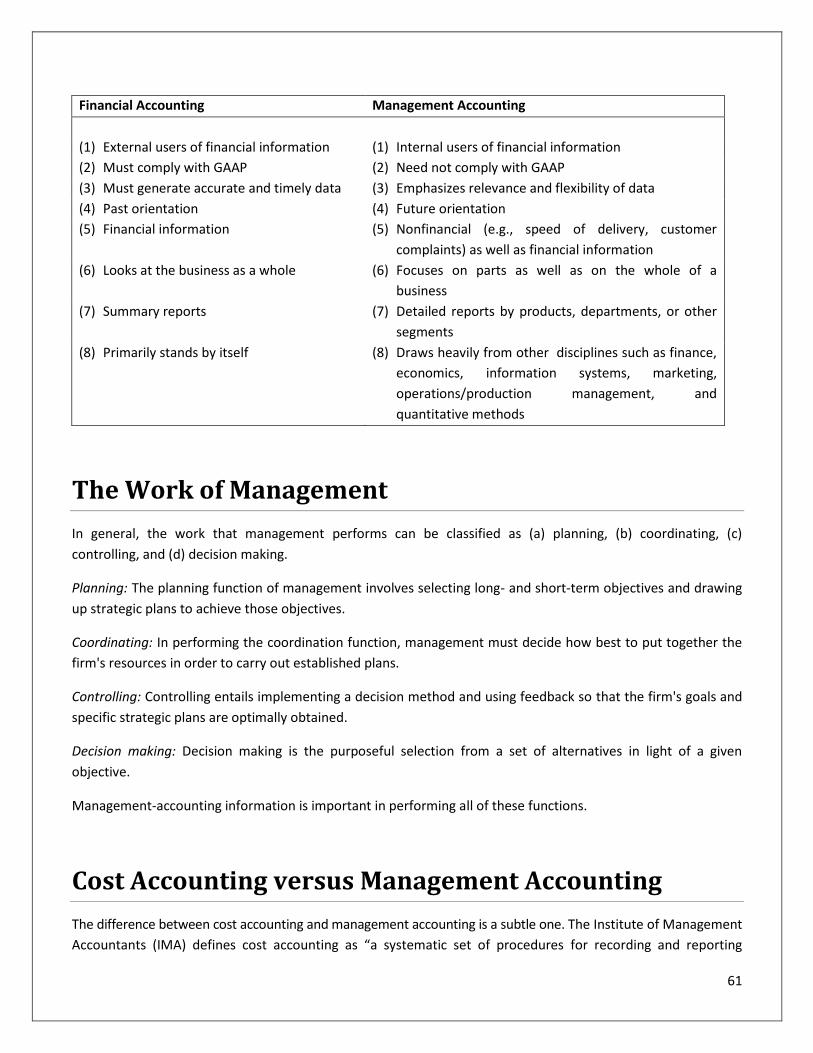
61
Financial Accounting Management Accounting
(1) External users of financial information (1) Internal users of financial information
(2) Must comply with GAAP (2) Need not comply with GAAP
(3) Must generate accurate and timely data (3) Emphasizes relevance and flexibility of data
(4) Past orientation (4) Future orientation
(5) Financial information (5) Nonfinancial (e.g., speed of delivery, customer
complaints) as well as financial information
(6) Looks at the business as a whole (6) Focuses on parts as well as on the whole of a
business
(7) Summary reports (7) Detailed reports by products, departments, or other
segments
(8) Primarily stands by itself (8) Draws heavily from other disciplines such as finance,
economics, information systems, marketing,
operations/production management, and
quantitative methods
The Work of Management
In general, the work that management performs can be classified as (a) planning, (b) coordinating, (c)
controlling, and (d) decision making.
Planning: The planning function of management involves selecting long- and short-term objectives and drawing
up strategic plans to achieve those objectives.
Coordinating: In performing the coordination function, management must decide how best to put together the
firm's resources in order to carry out established plans.
Controlling: Controlling entails implementing a decision method and using feedback so that the firm's goals and
specific strategic plans are optimally obtained.
Decision making: Decision making is the purposeful selection from a set of alternatives in light of a given
objective.
Management-accounting information is important in performing all of these functions.
Cost Accounting versus Management Accounting
The difference between cost accounting and management accounting is a subtle one. The Institute of Management
Accountants (IMA) defines cost accounting as “a systematic set of procedures for recording and reporting
62
measurements of the cost of manufacturing goods and performing services in the aggregate and in detail. It
includes methods for recognizing, classifying, allocating, aggregating and reporting such costs and comparing
them with standard costs.”
Management accounting as defined by the IMA is a profession that involves partnering in management decision
making, devising planning and performance management systems, and providing expertise in financial reporting and
control to assist management in the formulation and implementation of an organization's strategy." Simply stated,
management accounting is the accounting used for the planning, control, decision-making, and strategic
management activities of an organization.
From this definition of cost accounting and the IMA's definition of management accounting, one thing is clear: the
major function of cost accounting is cost accumulation for inventory valuation and income determination.
Management accounting, however, emphasizes the use of the financial and cost data for planning, control,
decision-making, and strategic management purposes.
EXAMPLE 1
Management accounting typically does not deal with the details of how costs are accumulated and how unit costs
are computed for inventory valuation and income determination. Although unit cost data are used for pricing and
other managerial decisions, the method of computation itself is not a major topic of management accounting but
rather for cost accounting.
Controllership
The chief management accountant or the chief accounting executive of an organization is called the controller (often
called comptroller, especially in the government sector). The controller is in charge of the accounting department.
The controller's authority is basically staff authority in that the controller's office gives advice and service to other
departments. But at the same time, the controller has line authority over members of his or her department such as
internal auditors, bookkeepers, budget analysts, etc. (See Figure 1 for an organization chart of a controllership
situation).
In a large firm, the financial responsibilities are carried out by the treasurer, controller, and financial vice president,
often called a chief financial officer (CFO). The financial vice president is involved with financial policymaking and
planning. He or she supervises all phases of financial activity and serves as the financial advisor to the board of
directors.
Figure 1 shows an organization chart of the finance structure within a company. Note that the controller and
treasurer report to the vice president of finance. The treasurer is responsible for managing corporate assets and
liabilities, planning the finances, budgeting capital, financing the business, formulating credit policy, and managing
the investment portfolio. The controller is basically concerned with internal matters, namely financial and cost
accounting, taxes, budgeting, and control functions. Figure 2 presents the controller's functions.
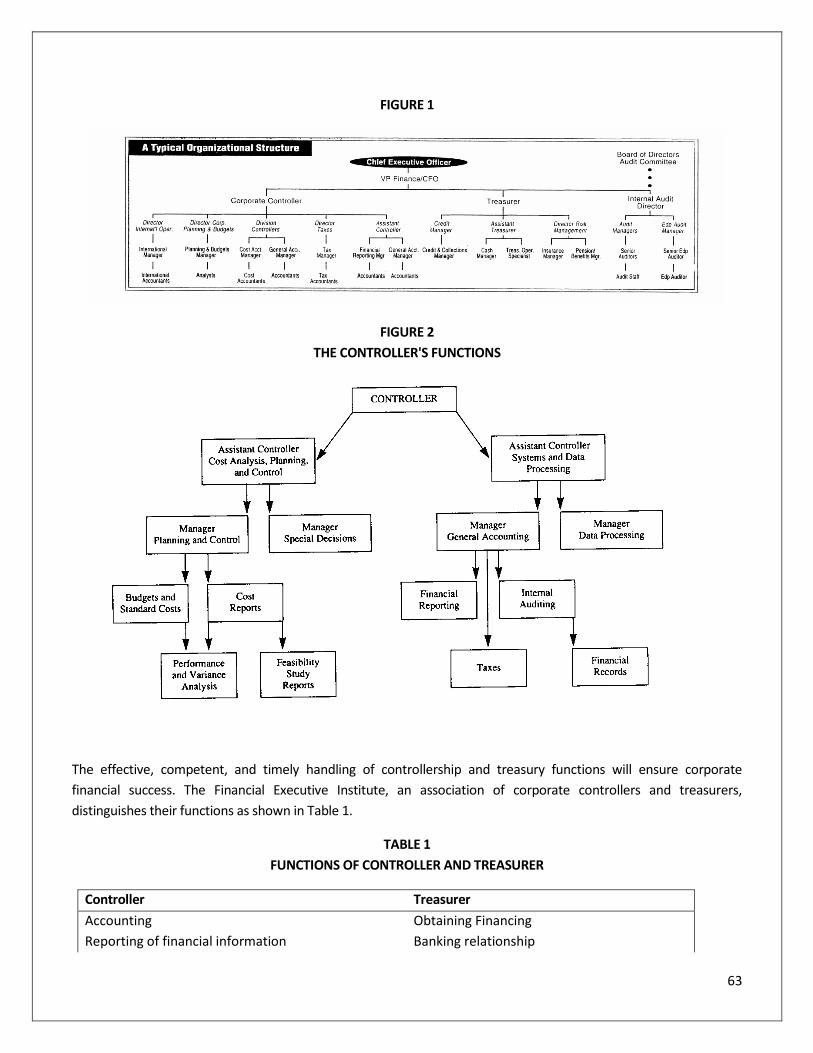
63
FIGURE 1
FIGURE 2
THE CONTROLLER'S FUNCTIONS
The effective, competent, and timely handling of controllership and treasury functions will ensure corporate
financial success. The Financial Executive Institute, an association of corporate controllers and treasurers,
distinguishes their functions as shown in Table 1.
TABLE 1
FUNCTIONS OF CONTROLLER AND TREASURER
Controller Treasurer
Accounting Obtaining Financing
Reporting of financial information Banking relationship
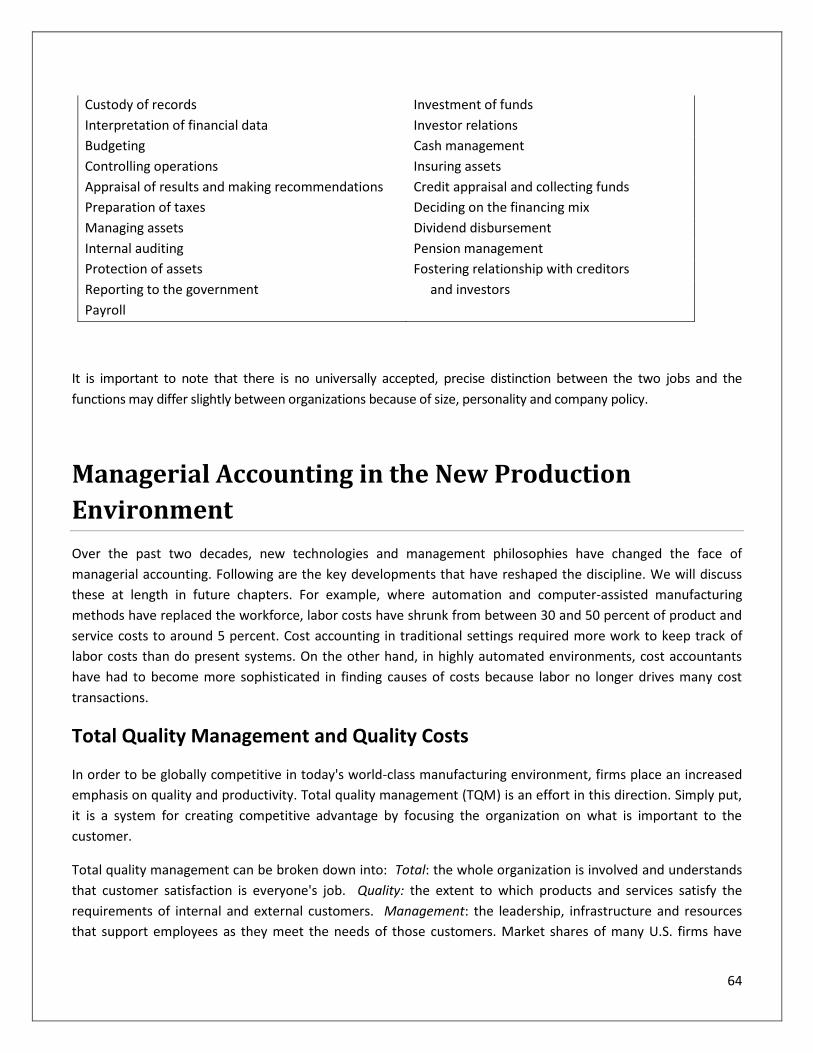
64
Custody of records Investment of funds
Interpretation of financial data Investor relations
Budgeting Cash management
Controlling operations Insuring assets
Appraisal of results and making recommendations Credit appraisal and collecting funds
Preparation of taxes Deciding on the financing mix
Managing assets Dividend disbursement
Internal auditing Pension management
Protection of assets Fostering relationship with creditors
Reporting to the government and investors
Payroll
It is important to note that there is no universally accepted, precise distinction between the two jobs and the
functions may differ slightly between organizations because of size, personality and company policy.
Managerial Accounting in the New Production
Environment
Over the past two decades, new technologies and management philosophies have changed the face of
managerial accounting. Following are the key developments that have reshaped the discipline. We will discuss
these at length in future chapters. For example, where automation and computer-assisted manufacturing
methods have replaced the workforce, labor costs have shrunk from between 30 and 50 percent of product and
service costs to around 5 percent. Cost accounting in traditional settings required more work to keep track of
labor costs than do present systems. On the other hand, in highly automated environments, cost accountants
have had to become more sophisticated in finding causes of costs because labor no longer drives many cost
transactions.
Total Quality Management and Quality Costs
In order to be globally competitive in today's world-class manufacturing environment, firms place an increased
emphasis on quality and productivity. Total quality management (TQM) is an effort in this direction. Simply put,
it is a system for creating competitive advantage by focusing the organization on what is important to the
customer.
Total quality management can be broken down into: Total: the whole organization is involved and understands
that customer satisfaction is everyone's job. Quality: the extent to which products and services satisfy the
requirements of internal and external customers. Management: the leadership, infrastructure and resources
that support employees as they meet the needs of those customers. Market shares of many U.S. firms have
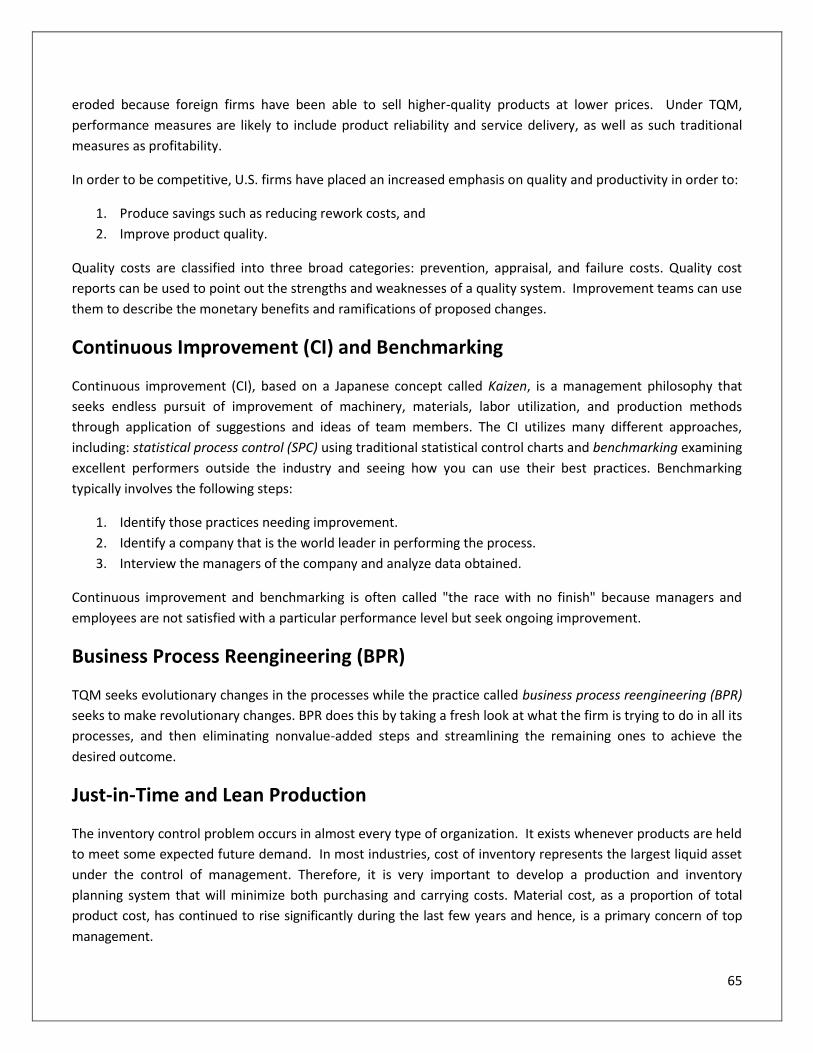
65
eroded because foreign firms have been able to sell higher-quality products at lower prices. Under TQM,
performance measures are likely to include product reliability and service delivery, as well as such traditional
measures as profitability.
In order to be competitive, U.S. firms have placed an increased emphasis on quality and productivity in order to:
1. Produce savings such as reducing rework costs, and
2. Improve product quality.
Quality costs are classified into three broad categories: prevention, appraisal, and failure costs. Quality cost
reports can be used to point out the strengths and weaknesses of a quality system. Improvement teams can use
them to describe the monetary benefits and ramifications of proposed changes.
Continuous Improvement (CI) and Benchmarking
Continuous improvement (CI), based on a Japanese concept called Kaizen, is a management philosophy that
seeks endless pursuit of improvement of machinery, materials, labor utilization, and production methods
through application of suggestions and ideas of team members. The CI utilizes many different approaches,
including: statistical process control (SPC) using traditional statistical control charts and benchmarking examining
excellent performers outside the industry and seeing how you can use their best practices. Benchmarking
typically involves the following steps:
1. Identify those practices needing improvement.
2. Identify a company that is the world leader in performing the process.
3. Interview the managers of the company and analyze data obtained.
Continuous improvement and benchmarking is often called "the race with no finish" because managers and
employees are not satisfied with a particular performance level but seek ongoing improvement.
Business Process Reengineering (BPR)
TQM seeks evolutionary changes in the processes while the practice called business process reengineering (BPR)
seeks to make revolutionary changes. BPR does this by taking a fresh look at what the firm is trying to do in all its
processes, and then eliminating nonvalue-added steps and streamlining the remaining ones to achieve the
desired outcome.
Just-in-Time and Lean Production
The inventory control problem occurs in almost every type of organization. It exists whenever products are held
to meet some expected future demand. In most industries, cost of inventory represents the largest liquid asset
under the control of management. Therefore, it is very important to develop a production and inventory
planning system that will minimize both purchasing and carrying costs. Material cost, as a proportion of total
product cost, has continued to rise significantly during the last few years and hence, is a primary concern of top
management.
66
Just-in-Time (JIT) is a demand-pull system. Demand for customer output (not plans for using input resources)
triggers production. Production activities are "pulled", not "pushed," into action. JIT production, in its purest
sense, is buying and producing in very small quantities just in time for use. JIT production is part of a "lean
production" philosophy that has been credited for the success of' many Japanese companies. Lean production
eliminates inventory between production departments, making the quality and efficiency of production the
highest priority. Lean production requires the flexibility to change quickly from one product to another. It
emphasizes employee training and participation in decision-making. The development of just-in-time production
and purchasing methods also affects cost-accounting systems. Firms using just-in-time methods keep
inventories to a minimum. If inventories are low, accountants can spend less time on inventory valuation for
external reporting.
Theory of Constraints (TOC) and Bottlenecks Management
The theory of constraints (TOC) views a business as a linked sequence of processes that transforms inputs into
salable outputs, like a chain. To improve the strength of the chain, a TOC company identifies the weakest link,
which is the constraint. TOC exploits constraints so that throughput is maximized and inventories and operating
costs are minimized. It then develops a specific approach to manage constraints to support the objective of
continuous improvement.
Bottlenecks occur whenever demand (at least temporarily) exceeds capacity. For example, although a legal
secretary has enough total time to do all her wordprocessing, she may be given several jobs in quick succession,
so that a queue (waiting line) builds up. This is a bottleneck, which delays the other activities waiting for the
wordprocessing to be finished. TOC seeks to maximize “throughput” by
1. Larger lot sizes at bottleneck work stations, to avoid time lost on changeovers;
2. Small transfer batches—forwarding a small batch of work to the next work station, so that the next
operation can begin before the entire lot is finished at the preceding work station; and
3. Rules for inserting buffer stock before or after certain bottlenecks.
Cost Classifications and Profit Concepts
In financial accounting, the term cost is defined as a measurement, in monetary terms, of the amount of resources
used for some purpose. In managerial accounting, the term cost is used in many different ways. That is, there are
different types of costs used for different purposes. Some costs are useful and required for inventory valuation and
income determination. Some costs are useful for planning, budgeting, and cost control. Still others are useful for
making short-term and long-term decisions. A profit concept, contribution margin, which is extremely useful to
managers, is also introduced.
Costs can be classified into various categories, according to:
1. Their management functions
67
a. Manufacturing costs
Direct materials
Direct labor
Factory overhead
b. Nonmanufacturing (operating) costs
Selling costs
General and administrative costs
2. Their timing of charges against sales revenue
a. Product costs
b. Period costs
3. Their ease of traceability
a. Direct costs
b. Indirect costs
4. Their behavior in accordance with changes in activity
a. Variable costs
b. Fixed costs
c. Mixed (semivariable) costs
5. Their degree of averaging
a. Total costs
b. Unit (average) costs
6. Their relevance to planning, control and decision making
a. Sunk costs
b. Incremental costs
c. Relevant costs
d. Out-of-pocket costs
e. Opportunity costs
f. Controllable and noncontrollable costs
g. Standard costs
We will discuss each of the cost categories in the remainder of this chapter.
Costs by Management Function
In a manufacturing firm, costs are divided into two major categories, by the functional activities they are associated
with: (1) manufacturing costs and (2) nonmanufacturing costs, also called operating expenses.
MANUFACTURING COSTS. Manufacturing costs are those costs associated with the manufacturing activities of the
company. Manufacturing costs are subdivided into three categories: direct materials, direct labor, and factory
overhead. Direct materials (also called raw materials) are all materials that become an integral part of the finished
product. Examples are the steel used to make an automobile and the wood to make furniture. Glues, nails, and
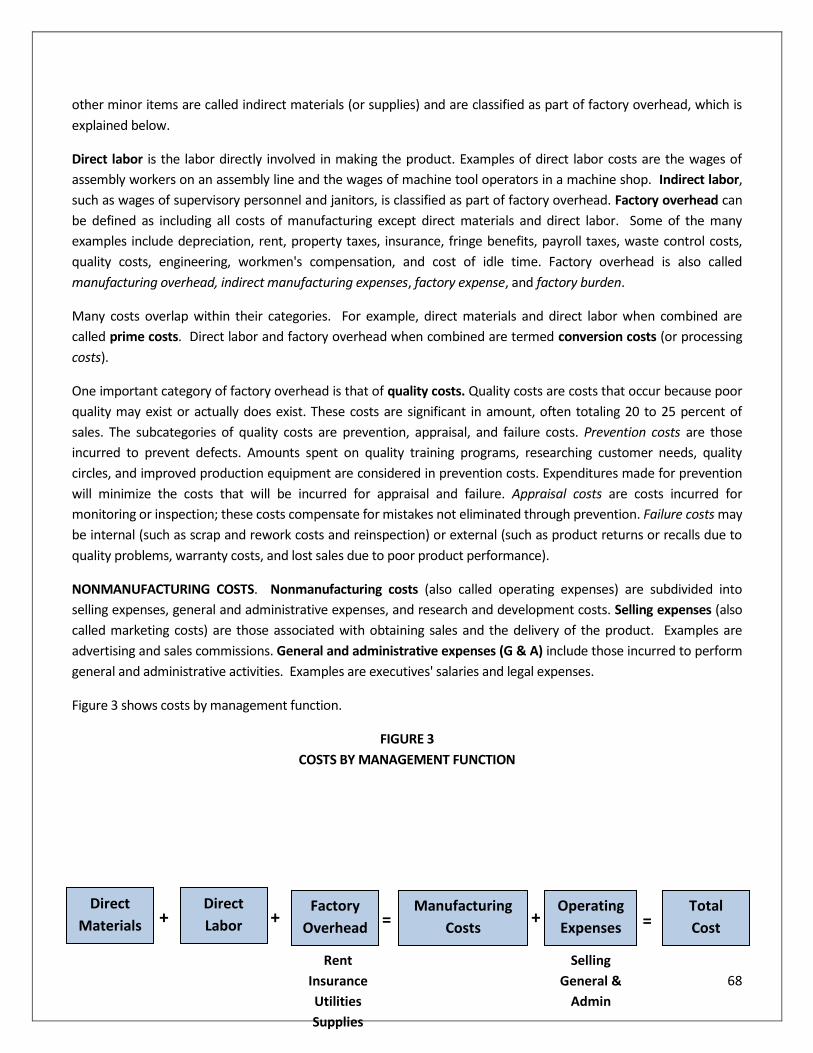
68
other minor items are called indirect materials (or supplies) and are classified as part of factory overhead, which is
explained below.
Direct labor is the labor directly involved in making the product. Examples of direct labor costs are the wages of
assembly workers on an assembly line and the wages of machine tool operators in a machine shop. Indirect labor,
such as wages of supervisory personnel and janitors, is classified as part of factory overhead. Factory overhead can
be defined as including all costs of manufacturing except direct materials and direct labor. Some of the many
examples include depreciation, rent, property taxes, insurance, fringe benefits, payroll taxes, waste control costs,
quality costs, engineering, workmen's compensation, and cost of idle time. Factory overhead is also called
manufacturing overhead, indirect manufacturing expenses, factory expense, and factory burden.
Many costs overlap within their categories. For example, direct materials and direct labor when combined are
called prime costs. Direct labor and factory overhead when combined are termed conversion costs (or processing
costs).
One important category of factory overhead is that of quality costs. Quality costs are costs that occur because poor
quality may exist or actually does exist. These costs are significant in amount, often totaling 20 to 25 percent of
sales. The subcategories of quality costs are prevention, appraisal, and failure costs. Prevention costs are those
incurred to prevent defects. Amounts spent on quality training programs, researching customer needs, quality
circles, and improved production equipment are considered in prevention costs. Expenditures made for prevention
will minimize the costs that will be incurred for appraisal and failure. Appraisal costs are costs incurred for
monitoring or inspection; these costs compensate for mistakes not eliminated through prevention. Failure costs may
be internal (such as scrap and rework costs and reinspection) or external (such as product returns or recalls due to
quality problems, warranty costs, and lost sales due to poor product performance).
NONMANUFACTURING COSTS. Nonmanufacturing costs (also called operating expenses) are subdivided into
selling expenses, general and administrative expenses, and research and development costs. Selling expenses (also
called marketing costs) are those associated with obtaining sales and the delivery of the product. Examples are
advertising and sales commissions. General and administrative expenses (G & A) include those incurred to perform
general and administrative activities. Examples are executives' salaries and legal expenses.
Figure 3 shows costs by management function.
FIGURE 3
COSTS BY MANAGEMENT FUNCTION
+ = + + =
Direct
Materials
Direct
Labor Factory
Overhead
Manufacturing
Costs
Operating
Expenses
Total
Cost
Rent
Insurance
Utilities
Supplies
Selling
General &
Admin
69
Product Costs and Period Costs
By their timing of charges against revenue or by whether they are inventoriable, costs are classified into: (a)
product costs and (b) period costs.
Product costs are inventoriable costs, identified as part of inventory on hand. They are treated as an asset until the
goods they are assigned to are sold. At that time they become the expense, cost of goods sold. All manufacturing
costs are product costs.
Product Cost Asset Expense
(inventory) (cost of goods sold)
GAAP and income tax regulations require that firms treat all manufacturing costs as product costs for external
financial reporting using full absorption costing (also called absorption costing). Using full absorption costing, the
firm assigns a unit's variable manufacturing cost plus a share of fixed manufacturing costs to each unit produced.
Thus the total of units manufactured "fully absorbs" manufacturing costs. (The variable-fixed classification of costs is
explained later).
Period costs are all expired costs that are not necessary for production and hence are charged against sales
revenues in the period in which the revenue is earned. Firms treat all nonmanufacturing costs--selling, general and
administrative expenses, and research and development costs--as period costs.
Period costs —————— Expense
Direct Costs and Indirect Costs
Costs may be viewed as either direct or indirect in terms of the extent that they are traceable to a particular cost
object. A cost object is any item for which the manager wishes to measure cost. Jobs, product lines, departments,
divisions, sales territories, or units produced are typical cost objects. Direct costs can be directly traceable to the
costing object. For example, if the object of costing under consideration is a product line, then the materials and
labor involved in the manufacture of the line would both be direct costs.
Factory overhead items are all indirect costs since they are not directly identifiable to any particular product line.
Costs shared by different departments, products, or jobs, called common costs or joint costs, are also indirect costs.
National advertising that benefits more than one product and sales territory is an example of an indirect cost.
Accountants may allocate them on some arbitrary basis to specific products or departments.
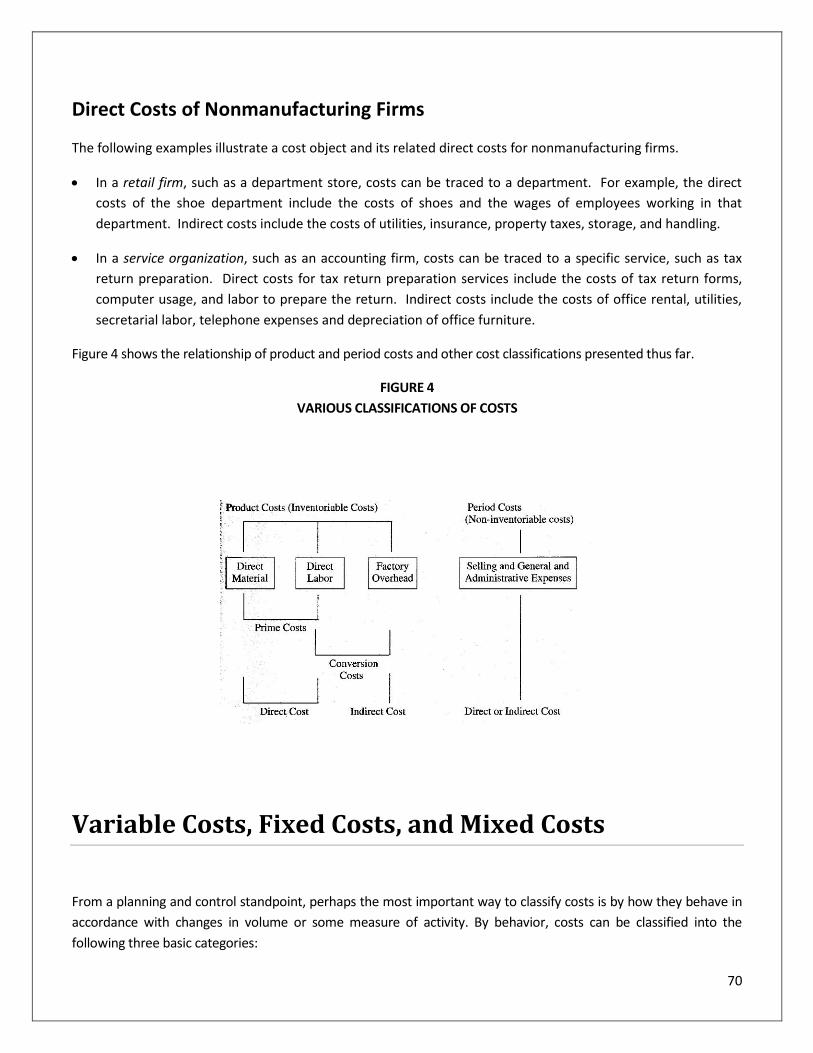
70
Direct Costs of Nonmanufacturing Firms
The following examples illustrate a cost object and its related direct costs for nonmanufacturing firms.
In a retail firm, such as a department store, costs can be traced to a department. For example, the direct
costs of the shoe department include the costs of shoes and the wages of employees working in that
department. Indirect costs include the costs of utilities, insurance, property taxes, storage, and handling.
In a service organization, such as an accounting firm, costs can be traced to a specific service, such as tax
return preparation. Direct costs for tax return preparation services include the costs of tax return forms,
computer usage, and labor to prepare the return. Indirect costs include the costs of office rental, utilities,
secretarial labor, telephone expenses and depreciation of office furniture.
Figure 4 shows the relationship of product and period costs and other cost classifications presented thus far.
FIGURE 4
VARIOUS CLASSIFICATIONS OF COSTS
Variable Costs, Fixed Costs, and Mixed Costs
From a planning and control standpoint, perhaps the most important way to classify costs is by how they behave in
accordance with changes in volume or some measure of activity. By behavior, costs can be classified into the
following three basic categories:
71
Variable costs are costs that vary in total in direct proportion to changes in activity. Examples are direct materials
and gasoline expense based on mileage driven. Fixed costs are costs that remain constant in total regardless of
changes in activity. Examples are rent, insurance, and taxes.
Mixed (or semi-variable) costs are costs that vary with changes in volume but, unlike variable costs, do not vary in
direct proportion. In other words, these costs contain both a variable component and a fixed component. Examples
are the rental of a delivery truck, where a fixed rental fee plus a variable charge based on mileage is made; and
power costs, where the expense consists of a fixed amount plus a variable charge based on consumption.
Costs by behavior will be examined further in a later chapter. The breakdown of costs into their variable
components and their fixed components is important in many areas of management accounting, such as flexible
budgeting, break-even analysis, and short-term decision making.
Unit Costs and Total Costs
For external reporting and pricing purposes, accountants are frequently interested in determining the unit (average)
cost per unit of product or service. The unit cost is simply the average cost, which is the total costs divided by the
total volume in units. Alternatively, the unit cost is the sum of (a) the variable cost per unit, and (b) the fixed cost per
unit. It is important to realize that the unit cost declines as volume increases since the total fixed costs that are
constant over a range of activity are being spread over a larger number of units.
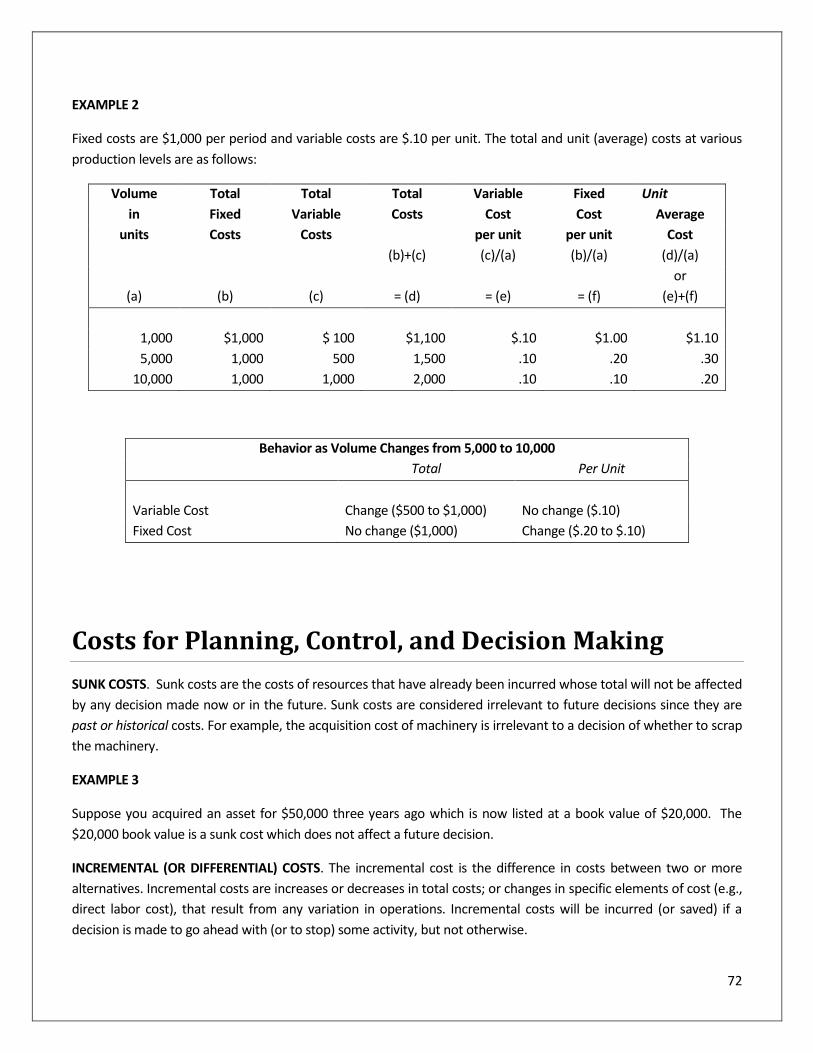
72
EXAMPLE 2
Fixed costs are $1,000 per period and variable costs are $.10 per unit. The total and unit (average) costs at various
production levels are as follows:
Volume Total Total Total Variable Fixed Unit
in Fixed Variable Costs Cost Cost Average
units Costs Costs per unit per unit Cost
(b)+(c) (c)/(a) (b)/(a) (d)/(a)
or
(a) (b) (c) = (d) = (e) = (f) (e)+(f)
1,000 $1,000 $ 100 $1,100 $.10 $1.00 $1.10
5,000 1,000 500 1,500 .10 .20 .30
10,000 1,000 1,000 2,000 .10 .10 .20
Behavior as Volume Changes from 5,000 to 10,000
Total Per Unit
Variable Cost Change ($500 to $1,000) No change ($.10)
Fixed Cost No change ($1,000) Change ($.20 to $.10)
Costs for Planning, Control, and Decision Making
SUNK COSTS. Sunk costs are the costs of resources that have already been incurred whose total will not be affected
by any decision made now or in the future. Sunk costs are considered irrelevant to future decisions since they are
past or historical costs. For example, the acquisition cost of machinery is irrelevant to a decision of whether to scrap
the machinery.
EXAMPLE 3
Suppose you acquired an asset for $50,000 three years ago which is now listed at a book value of $20,000. The
$20,000 book value is a sunk cost which does not affect a future decision.
INCREMENTAL (OR DIFFERENTIAL) COSTS. The incremental cost is the difference in costs between two or more
alternatives. Incremental costs are increases or decreases in total costs; or changes in specific elements of cost (e.g.,
direct labor cost), that result from any variation in operations. Incremental costs will be incurred (or saved) if a
decision is made to go ahead with (or to stop) some activity, but not otherwise.
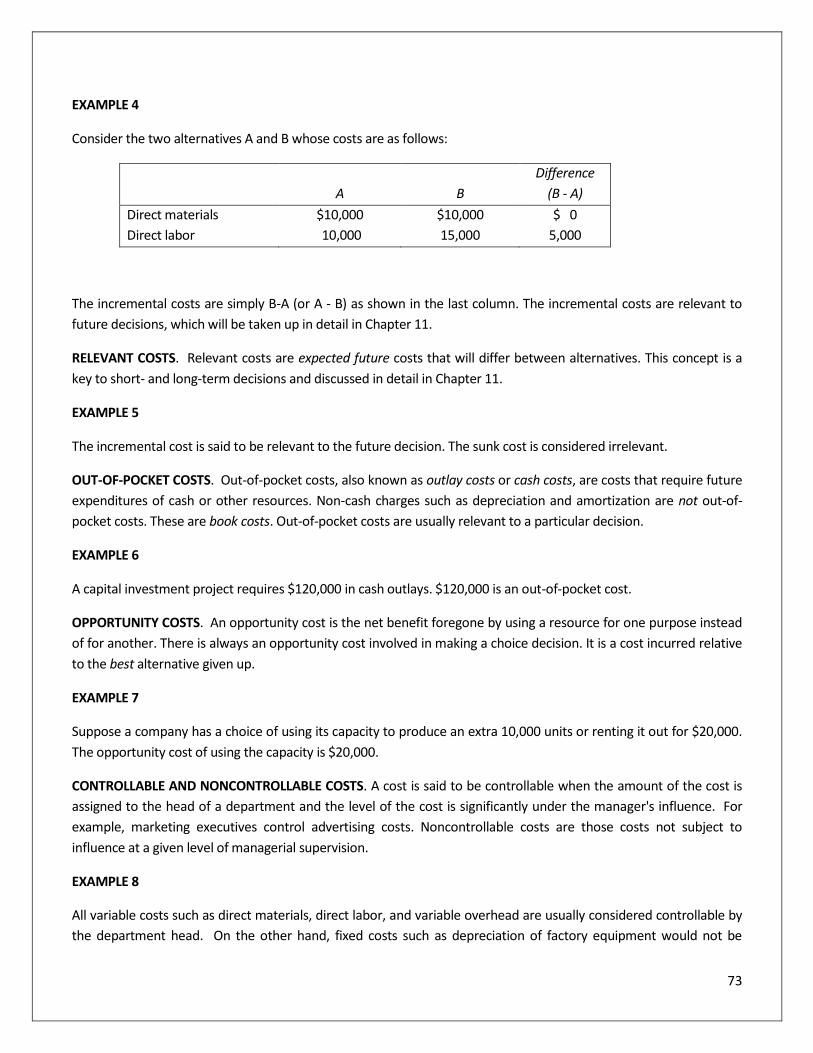
73
EXAMPLE 4
Consider the two alternatives A and B whose costs are as follows:
A
B
Difference
(B - A)
Direct materials $10,000 $10,000 $ 0
Direct labor 10,000 15,000 5,000
The incremental costs are simply B-A (or A - B) as shown in the last column. The incremental costs are relevant to
future decisions, which will be taken up in detail in Chapter 11.
RELEVANT COSTS. Relevant costs are expected future costs that will differ between alternatives. This concept is a
key to short- and long-term decisions and discussed in detail in Chapter 11.
EXAMPLE 5
The incremental cost is said to be relevant to the future decision. The sunk cost is considered irrelevant.
OUT-OF-POCKET COSTS. Out-of-pocket costs, also known as outlay costs or cash costs, are costs that require future
expenditures of cash or other resources. Non-cash charges such as depreciation and amortization are not out-of-
pocket costs. These are book costs. Out-of-pocket costs are usually relevant to a particular decision.
EXAMPLE 6
A capital investment project requires $120,000 in cash outlays. $120,000 is an out-of-pocket cost.
OPPORTUNITY COSTS. An opportunity cost is the net benefit foregone by using a resource for one purpose instead
of for another. There is always an opportunity cost involved in making a choice decision. It is a cost incurred relative
to the best alternative given up.
EXAMPLE 7
Suppose a company has a choice of using its capacity to produce an extra 10,000 units or renting it out for $20,000.
The opportunity cost of using the capacity is $20,000.
CONTROLLABLE AND NONCONTROLLABLE COSTS. A cost is said to be controllable when the amount of the cost is
assigned to the head of a department and the level of the cost is significantly under the manager's influence. For
example, marketing executives control advertising costs. Noncontrollable costs are those costs not subject to
influence at a given level of managerial supervision.
EXAMPLE 8
All variable costs such as direct materials, direct labor, and variable overhead are usually considered controllable by
the department head. On the other hand, fixed costs such as depreciation of factory equipment would not be
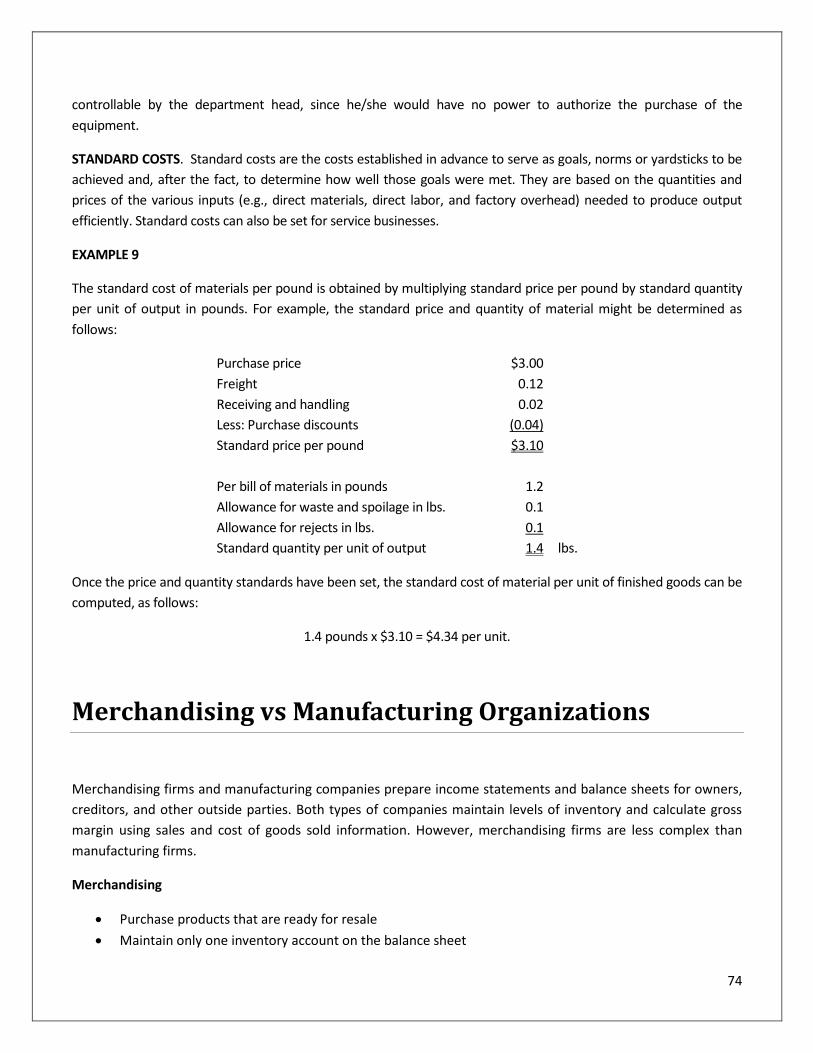
74
controllable by the department head, since he/she would have no power to authorize the purchase of the
equipment.
STANDARD COSTS. Standard costs are the costs established in advance to serve as goals, norms or yardsticks to be
achieved and, after the fact, to determine how well those goals were met. They are based on the quantities and
prices of the various inputs (e.g., direct materials, direct labor, and factory overhead) needed to produce output
efficiently. Standard costs can also be set for service businesses.
EXAMPLE 9
The standard cost of materials per pound is obtained by multiplying standard price per pound by standard quantity
per unit of output in pounds. For example, the standard price and quantity of material might be determined as
follows:
Purchase price $3.00
Freight 0.12
Receiving and handling 0.02
Less: Purchase discounts (0.04)
Standard price per pound $3.10
Per bill of materials in pounds 1.2
Allowance for waste and spoilage in lbs. 0.1
Allowance for rejects in lbs. 0.1
Standard quantity per unit of output 1.4 lbs.
Once the price and quantity standards have been set, the standard cost of material per unit of finished goods can be
computed, as follows:
1.4 pounds x $3.10 = $4.34 per unit.
Merchandising vs Manufacturing Organizations
Merchandising firms and manufacturing companies prepare income statements and balance sheets for owners,
creditors, and other outside parties. Both types of companies maintain levels of inventory and calculate gross
margin using sales and cost of goods sold information. However, merchandising firms are less complex than
manufacturing firms.
Merchandising
Purchase products that are ready for resale
Maintain only one inventory account on the balance sheet
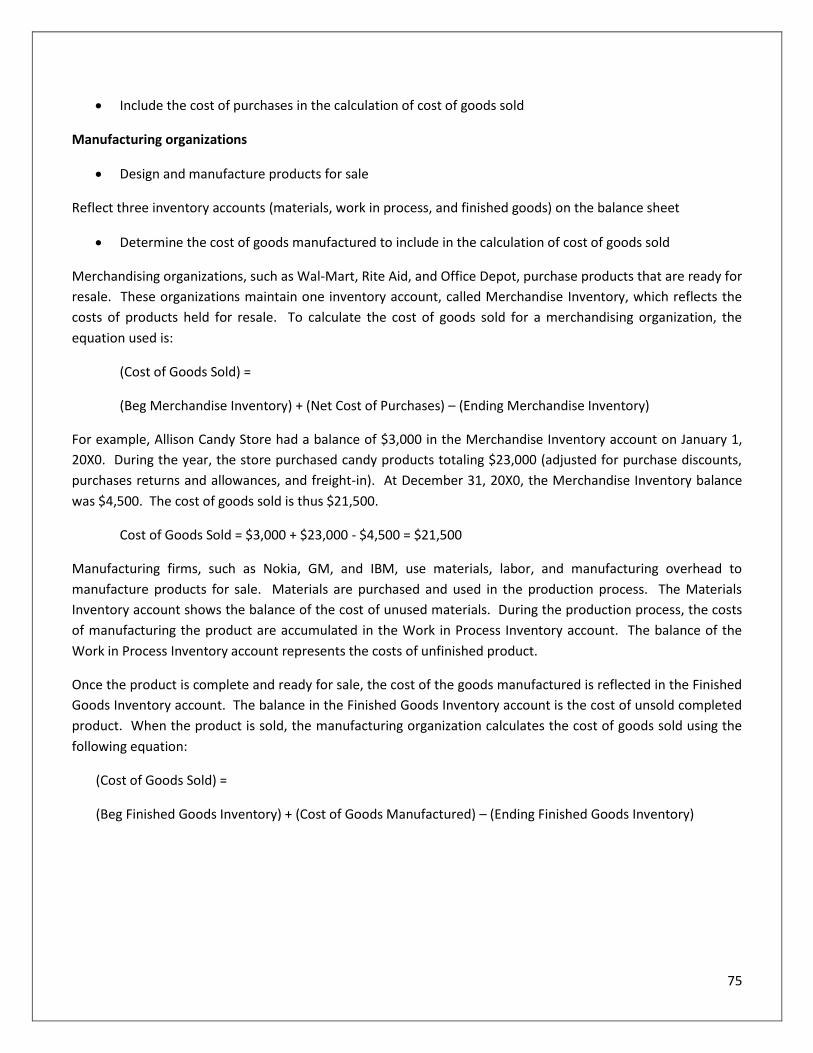
75
Include the cost of purchases in the calculation of cost of goods sold
Manufacturing organizations
Design and manufacture products for sale
Reflect three inventory accounts (materials, work in process, and finished goods) on the balance sheet
Determine the cost of goods manufactured to include in the calculation of cost of goods sold
Merchandising organizations, such as Wal-Mart, Rite Aid, and Office Depot, purchase products that are ready for
resale. These organizations maintain one inventory account, called Merchandise Inventory, which reflects the
costs of products held for resale. To calculate the cost of goods sold for a merchandising organization, the
equation used is:
(Cost of Goods Sold) =
(Beg Merchandise Inventory) + (Net Cost of Purchases) – (Ending Merchandise Inventory)
For example, Allison Candy Store had a balance of $3,000 in the Merchandise Inventory account on January 1,
20X0. During the year, the store purchased candy products totaling $23,000 (adjusted for purchase discounts,
purchases returns and allowances, and freight-in). At December 31, 20X0, the Merchandise Inventory balance
was $4,500. The cost of goods sold is thus $21,500.
Cost of Goods Sold = $3,000 + $23,000 - $4,500 = $21,500
Manufacturing firms, such as Nokia, GM, and IBM, use materials, labor, and manufacturing overhead to
manufacture products for sale. Materials are purchased and used in the production process. The Materials
Inventory account shows the balance of the cost of unused materials. During the production process, the costs
of manufacturing the product are accumulated in the Work in Process Inventory account. The balance of the
Work in Process Inventory account represents the costs of unfinished product.
Once the product is complete and ready for sale, the cost of the goods manufactured is reflected in the Finished
Goods Inventory account. The balance in the Finished Goods Inventory account is the cost of unsold completed
product. When the product is sold, the manufacturing organization calculates the cost of goods sold using the
following equation:
(Cost of Goods Sold) =
(Beg Finished Goods Inventory) + (Cost of Goods Manufactured) – (Ending Finished Goods Inventory)
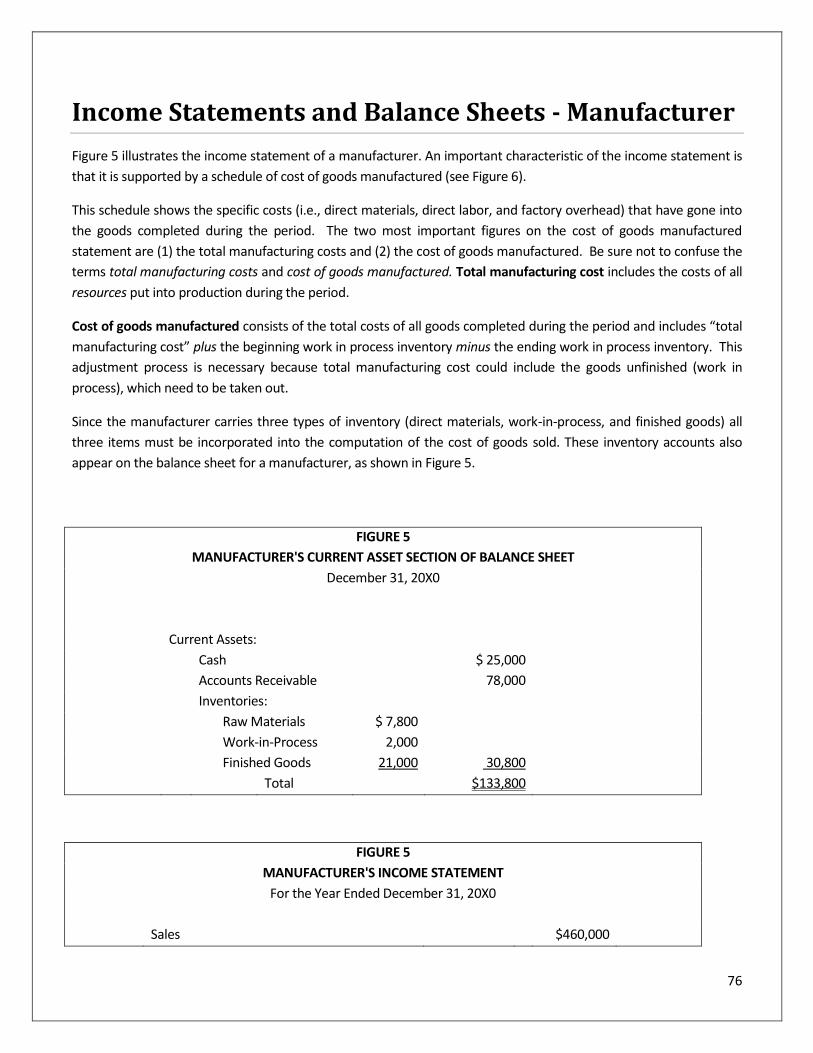
76
Income Statements and Balance Sheets - Manufacturer
Figure 5 illustrates the income statement of a manufacturer. An important characteristic of the income statement is
that it is supported by a schedule of cost of goods manufactured (see Figure 6).
This schedule shows the specific costs (i.e., direct materials, direct labor, and factory overhead) that have gone into
the goods completed during the period. The two most important figures on the cost of goods manufactured
statement are (1) the total manufacturing costs and (2) the cost of goods manufactured. Be sure not to confuse the
terms total manufacturing costs and cost of goods manufactured. Total manufacturing cost includes the costs of all
resources put into production during the period.
Cost of goods manufactured consists of the total costs of all goods completed during the period and includes “total
manufacturing cost” plus the beginning work in process inventory minus the ending work in process inventory. This
adjustment process is necessary because total manufacturing cost could include the goods unfinished (work in
process), which need to be taken out.
Since the manufacturer carries three types of inventory (direct materials, work-in-process, and finished goods) all
three items must be incorporated into the computation of the cost of goods sold. These inventory accounts also
appear on the balance sheet for a manufacturer, as shown in Figure 5.
FIGURE 5
MANUFACTURER'S CURRENT ASSET SECTION OF BALANCE SHEET
December 31, 20X0
Current Assets:
Cash $ 25,000
Accounts Receivable 78,000
Inventories:
Raw Materials $ 7,800
Work-in-Process 2,000
Finished Goods 21,000 30,800
Total $133,800
FIGURE 5
MANUFACTURER'S INCOME STATEMENT
For the Year Ended December 31, 20X0
Sales $460,000

77
Cost of goods sold:
Beginning finished goods inventory $ 18,000
Add: Cost of goods manufactured
(see Schedule, Figure 6)
261,000
Cost of goods available for sale $279,000
Less: Ending finished goods inventory
(21,000) $258,000
Gross margin $202,000
Less: Operating expenses
Selling and administrative expenses (70,000)
Net Income before taxes $132,000
FIGURE 6
MANUFACTURER'S
SCHEDULE OF COST GOODS MANUFACTURED
Direct materials:
Beginning inventory $ 23,000
Add: Purchases 64,000
Direct materials
available for use $87,000
Less: Ending inventory
(7,800)
Direct materials used
$ 79,200
Direct labor
45,000
Factory overhead:
Indirect labor $13,000
Indirect material 12,000
Factory utilities 10,500
Factory depreciation 10,800
Factory rent 12,000
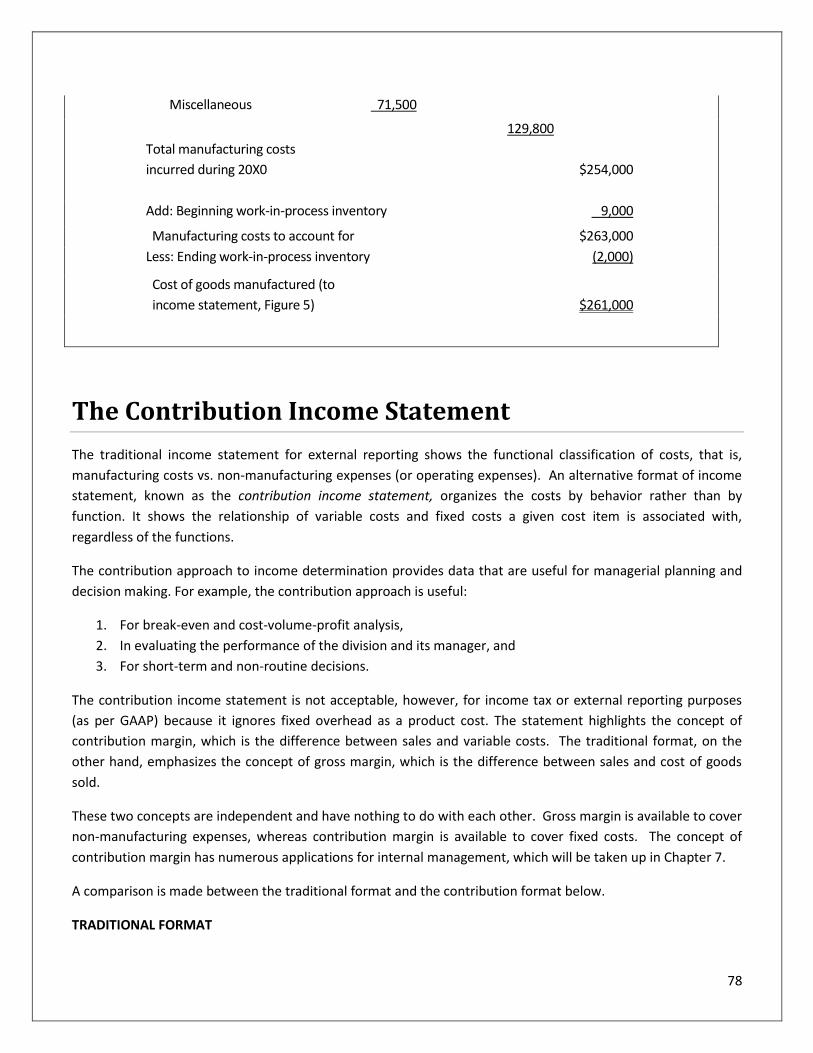
78
Miscellaneous 71,500
129,800
Total manufacturing costs
incurred during 20X0
$254,000
Add: Beginning work-in-process inventory 9,000
Manufacturing costs to account for $263,000
Less: Ending work-in-process inventory (2,000)
Cost of goods manufactured (to
income statement, Figure 5)
$261,000
The Contribution Income Statement
The traditional income statement for external reporting shows the functional classification of costs, that is,
manufacturing costs vs. non-manufacturing expenses (or operating expenses). An alternative format of income
statement, known as the contribution income statement, organizes the costs by behavior rather than by
function. It shows the relationship of variable costs and fixed costs a given cost item is associated with,
regardless of the functions.
The contribution approach to income determination provides data that are useful for managerial planning and
decision making. For example, the contribution approach is useful:
1. For break-even and cost-volume-profit analysis,
2. In evaluating the performance of the division and its manager, and
3. For short-term and non-routine decisions.
The contribution income statement is not acceptable, however, for income tax or external reporting purposes
(as per GAAP) because it ignores fixed overhead as a product cost. The statement highlights the concept of
contribution margin, which is the difference between sales and variable costs. The traditional format, on the
other hand, emphasizes the concept of gross margin, which is the difference between sales and cost of goods
sold.
These two concepts are independent and have nothing to do with each other. Gross margin is available to cover
non-manufacturing expenses, whereas contribution margin is available to cover fixed costs. The concept of
contribution margin has numerous applications for internal management, which will be taken up in Chapter 7.
A comparison is made between the traditional format and the contribution format below.
TRADITIONAL FORMAT
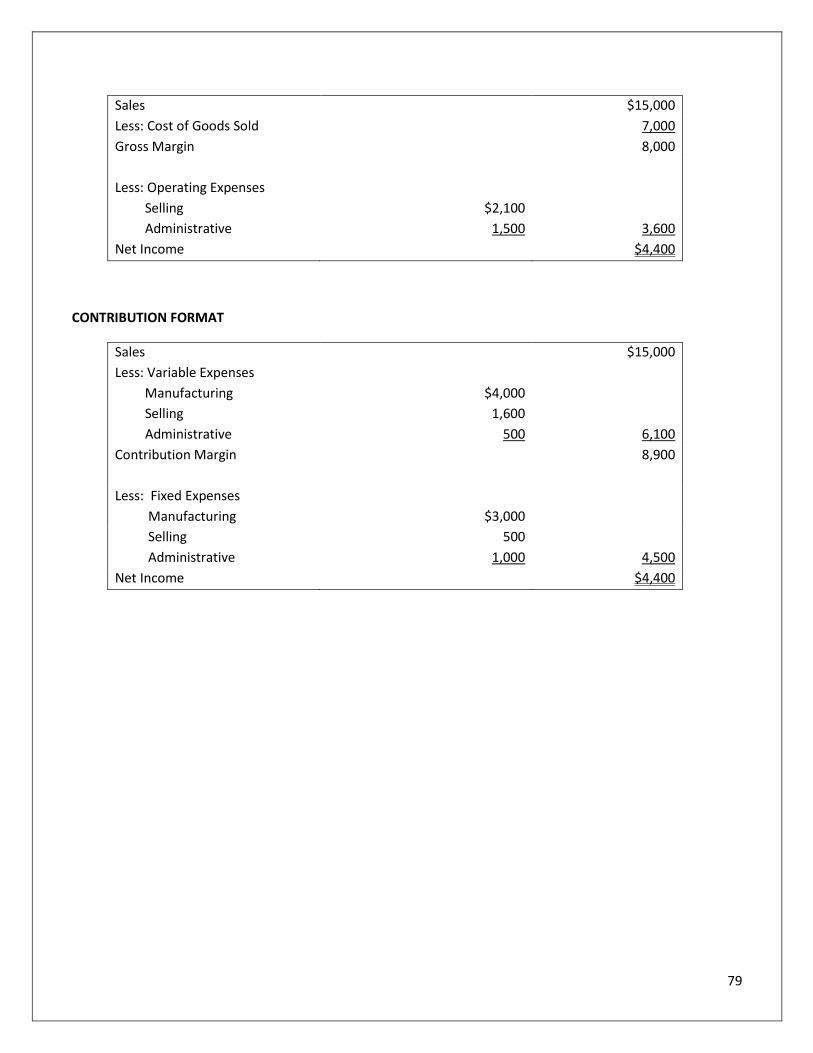
79
Sales $15,000
Less: Cost of Goods Sold 7,000
Gross Margin 8,000
Less: Operating Expenses
Selling $2,100
Administrative 1,500 3,600
Net Income $4,400
CONTRIBUTION FORMAT
Sales $15,000
Less: Variable Expenses
Manufacturing $4,000
Selling 1,600
Administrative 500 6,100
Contribution Margin 8,900
Less: Fixed Expenses
Manufacturing $3,000
Selling 500
Administrative 1,000 4,500
Net Income $4,400
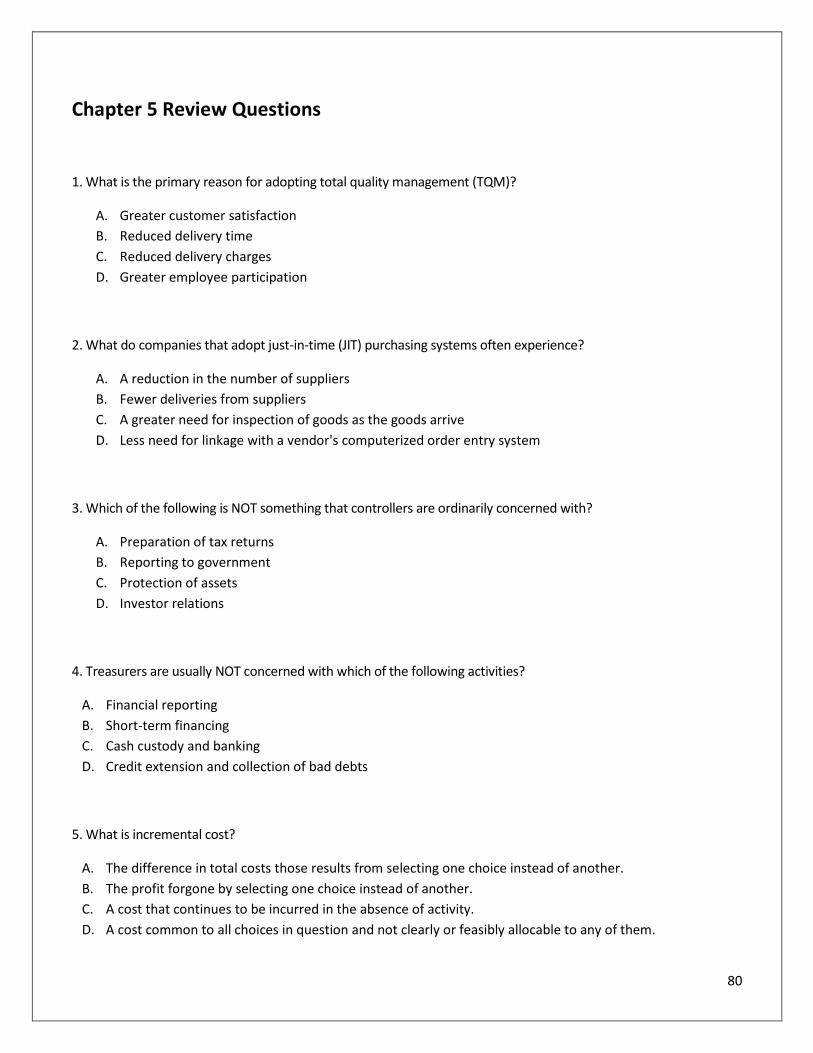
80
Chapter 5 Review Questions
1. What is the primary reason for adopting total quality management (TQM)?
A. Greater customer satisfaction
B. Reduced delivery time
C. Reduced delivery charges
D. Greater employee participation
2. What do companies that adopt just-in-time (JIT) purchasing systems often experience?
A. A reduction in the number of suppliers
B. Fewer deliveries from suppliers
C. A greater need for inspection of goods as the goods arrive
D. Less need for linkage with a vendor's computerized order entry system
3. Which of the following is NOT something that controllers are ordinarily concerned with?
A. Preparation of tax returns
B. Reporting to government
C. Protection of assets
D. Investor relations
4. Treasurers are usually NOT concerned with which of the following activities?
A. Financial reporting
B. Short-term financing
C. Cash custody and banking
D. Credit extension and collection of bad debts
5. What is incremental cost?
A. The difference in total costs those results from selecting one choice instead of another.
B. The profit forgone by selecting one choice instead of another.
C. A cost that continues to be incurred in the absence of activity.
D. A cost common to all choices in question and not clearly or feasibly allocable to any of them.
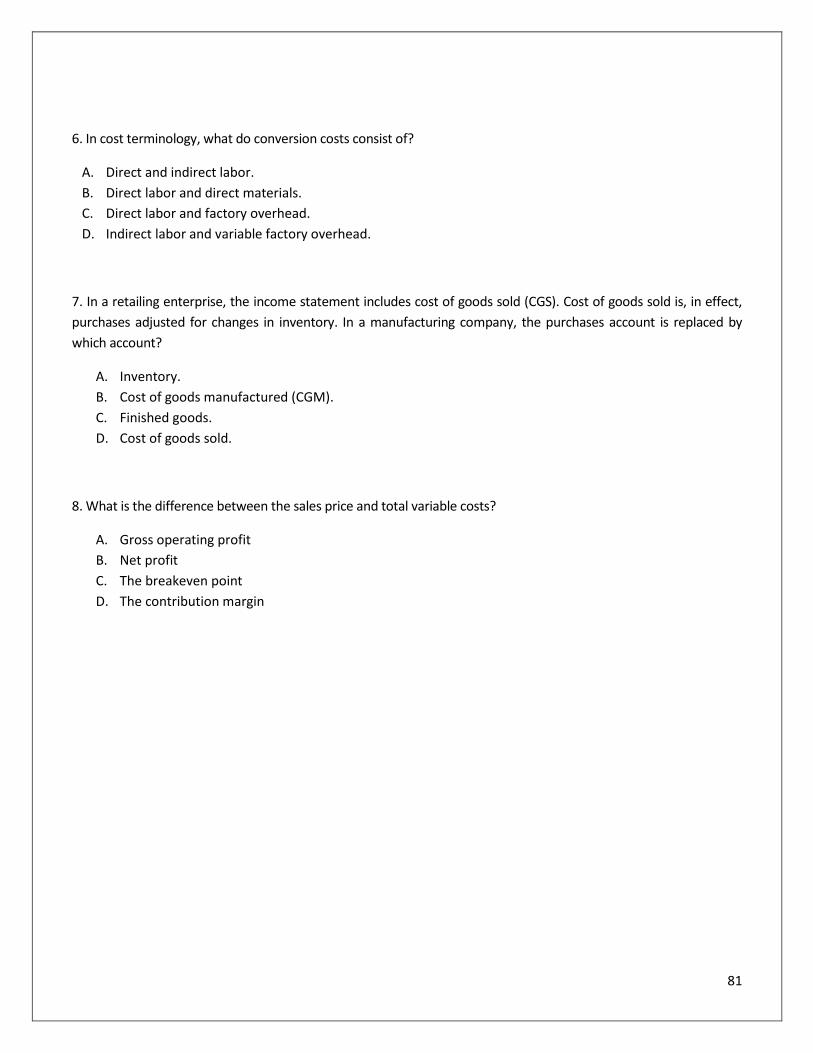
81
6. In cost terminology, what do conversion costs consist of?
A. Direct and indirect labor.
B. Direct labor and direct materials.
C. Direct labor and factory overhead.
D. Indirect labor and variable factory overhead.
7. In a retailing enterprise, the income statement includes cost of goods sold (CGS). Cost of goods sold is, in effect,
purchases adjusted for changes in inventory. In a manufacturing company, the purchases account is replaced by
which account?
A. Inventory.
B. Cost of goods manufactured (CGM).
C. Finished goods.
D. Cost of goods sold.
8. What is the difference between the sales price and total variable costs?
A. Gross operating profit
B. Net profit
C. The breakeven point
D. The contribution margin
82
Chapter 6: Product Costing Methods: Job Order Costing,
Process Costing, And Activity-Based Costing
Learning Objectives:
After completing this section, you should be able to:
Recognize basic assumptions and uses of different cost systems.
A cost accumulation system is a product costing system. This process accumulates manufacturing costs such as
materials, labor and factory overhead and assigns them to cost objectives, such as finished goods and
work-in-process. Product costing is necessary not only for inventory valuation and income determination but
also for establishing the unit sales price.
We will discuss the essentials of the cost accumulation system that is used to measure the manufacturing costs
of products. This is essentially a two-step process: (1) the measurement of costs that are applicable to
manufacturing operations during a given accounting period and (2) the assignment of these costs to products.
There are two basic approaches to cost accounting and accumulation: (1) Job order costing and (2) Process
costing
Using the traditional methods of assigning overhead costs to products, using a single predetermined overhead
rate based on any single activity measure, can produce distorted product costs. Activity-based costing (ABC)
attempts to get around this problem. An ABC system assigns costs to products based on the product’s use of
activities, not product volume. It has proved to produce more accurate product costing results in an
environment where there is diversity in product line and services coming out of the same shop.
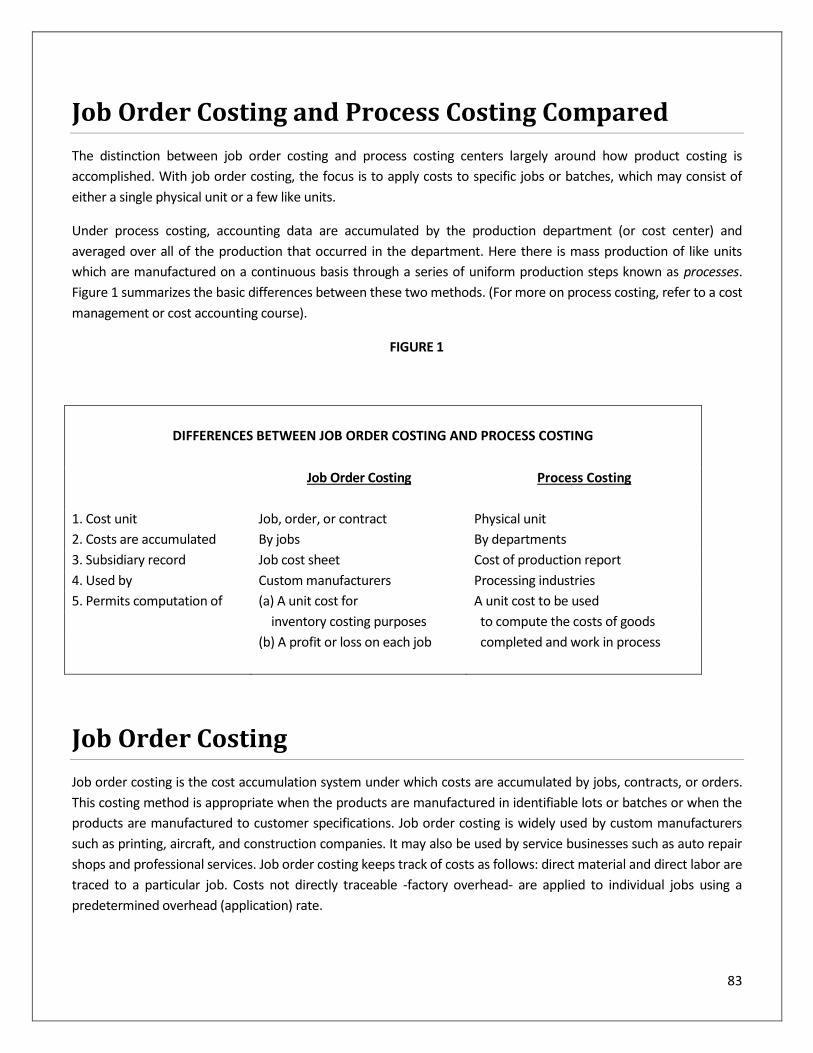
83
Job Order Costing and Process Costing Compared
The distinction between job order costing and process costing centers largely around how product costing is
accomplished. With job order costing, the focus is to apply costs to specific jobs or batches, which may consist of
either a single physical unit or a few like units.
Under process costing, accounting data are accumulated by the production department (or cost center) and
averaged over all of the production that occurred in the department. Here there is mass production of like units
which are manufactured on a continuous basis through a series of uniform production steps known as processes.
Figure 1 summarizes the basic differences between these two methods. (For more on process costing, refer to a cost
management or cost accounting course).
FIGURE 1
DIFFERENCES BETWEEN JOB ORDER COSTING AND PROCESS COSTING
Job Order Costing Process Costing
1. Cost unit Job, order, or contract Physical unit
2. Costs are accumulated By jobs By departments
3. Subsidiary record Job cost sheet Cost of production report
4. Used by Custom manufacturers Processing industries
5. Permits computation of (a) A unit cost for A unit cost to be used
inventory costing purposes to compute the costs of goods
(b) A profit or loss on each job
completed and work in process
Job Order Costing
Job order costing is the cost accumulation system under which costs are accumulated by jobs, contracts, or orders.
This costing method is appropriate when the products are manufactured in identifiable lots or batches or when the
products are manufactured to customer specifications. Job order costing is widely used by custom manufacturers
such as printing, aircraft, and construction companies. It may also be used by service businesses such as auto repair
shops and professional services. Job order costing keeps track of costs as follows: direct material and direct labor are
traced to a particular job. Costs not directly traceable -factory overhead- are applied to individual jobs using a
predetermined overhead (application) rate.
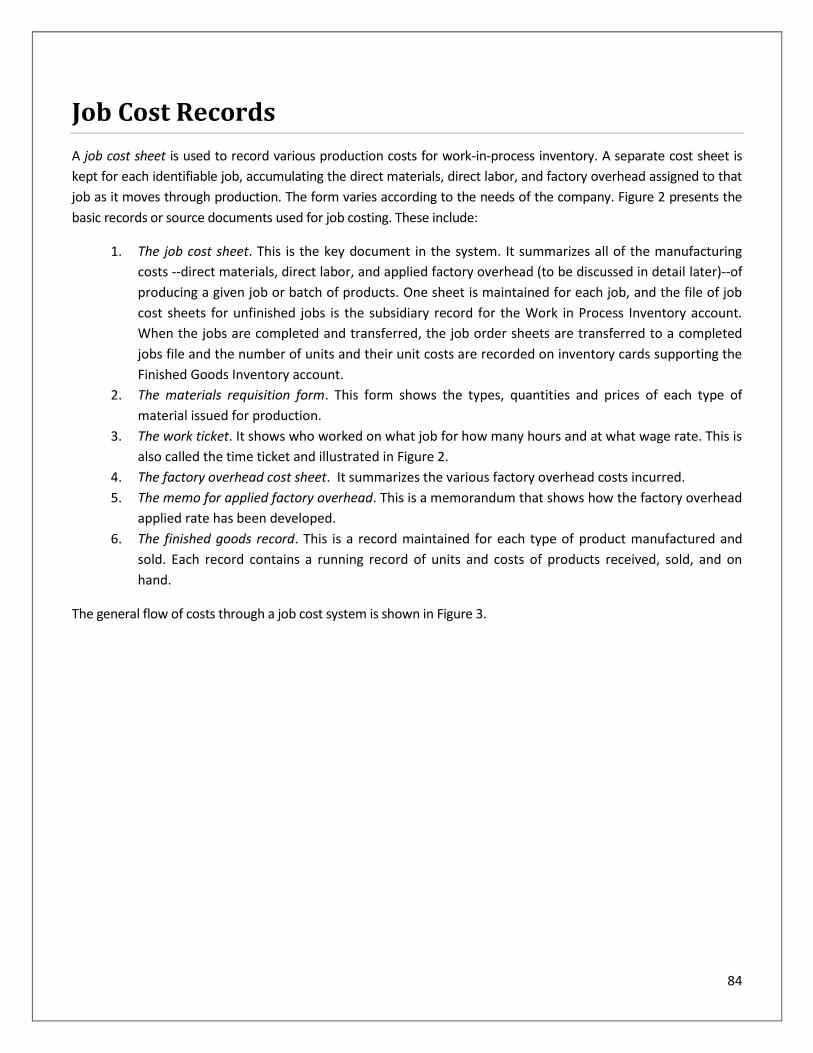
84
Job Cost Records
A job cost sheet is used to record various production costs for work-in-process inventory. A separate cost sheet is
kept for each identifiable job, accumulating the direct materials, direct labor, and factory overhead assigned to that
job as it moves through production. The form varies according to the needs of the company. Figure 2 presents the
basic records or source documents used for job costing. These include:
1. The job cost sheet. This is the key document in the system. It summarizes all of the manufacturing
costs --direct materials, direct labor, and applied factory overhead (to be discussed in detail later)--of
producing a given job or batch of products. One sheet is maintained for each job, and the file of job
cost sheets for unfinished jobs is the subsidiary record for the Work in Process Inventory account.
When the jobs are completed and transferred, the job order sheets are transferred to a completed
jobs file and the number of units and their unit costs are recorded on inventory cards supporting the
Finished Goods Inventory account.
2. The materials requisition form. This form shows the types, quantities and prices of each type of
material issued for production.
3. The work ticket. It shows who worked on what job for how many hours and at what wage rate. This is
also called the time ticket and illustrated in Figure 2.
4. The factory overhead cost sheet. It summarizes the various factory overhead costs incurred.
5. The memo for applied factory overhead. This is a memorandum that shows how the factory overhead
applied rate has been developed.
6. The finished goods record. This is a record maintained for each type of product manufactured and
sold. Each record contains a running record of units and costs of products received, sold, and on
hand.
The general flow of costs through a job cost system is shown in Figure 3.
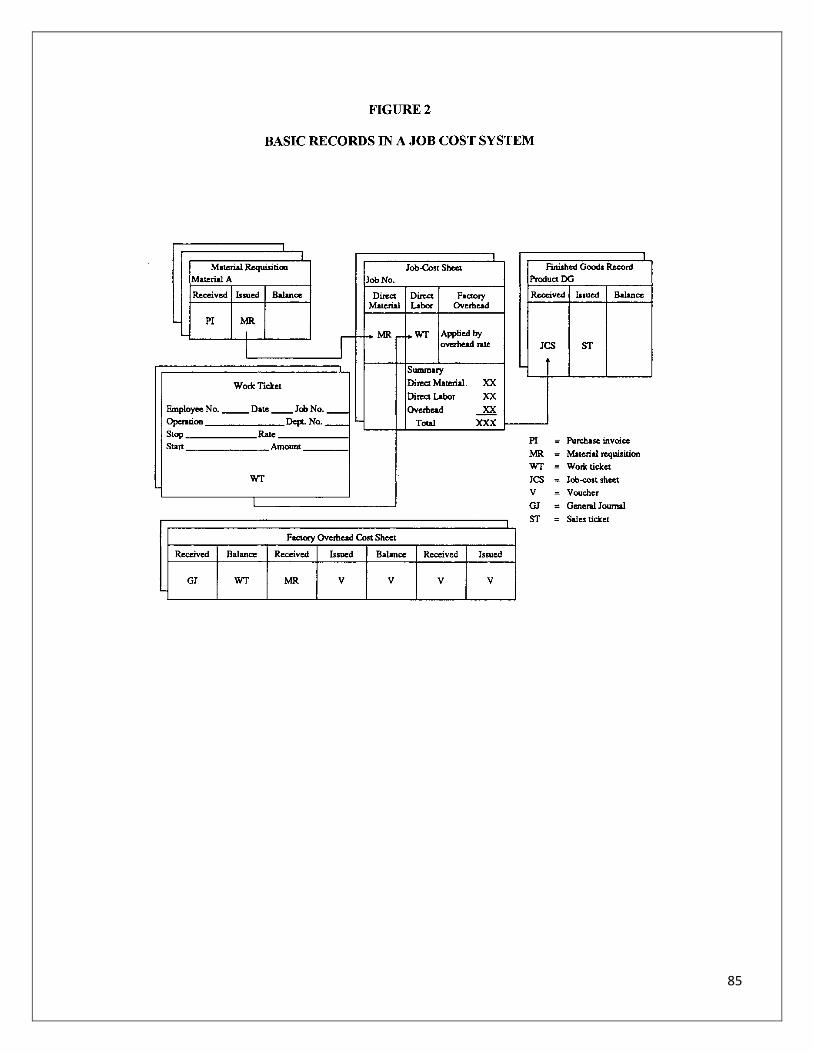
85
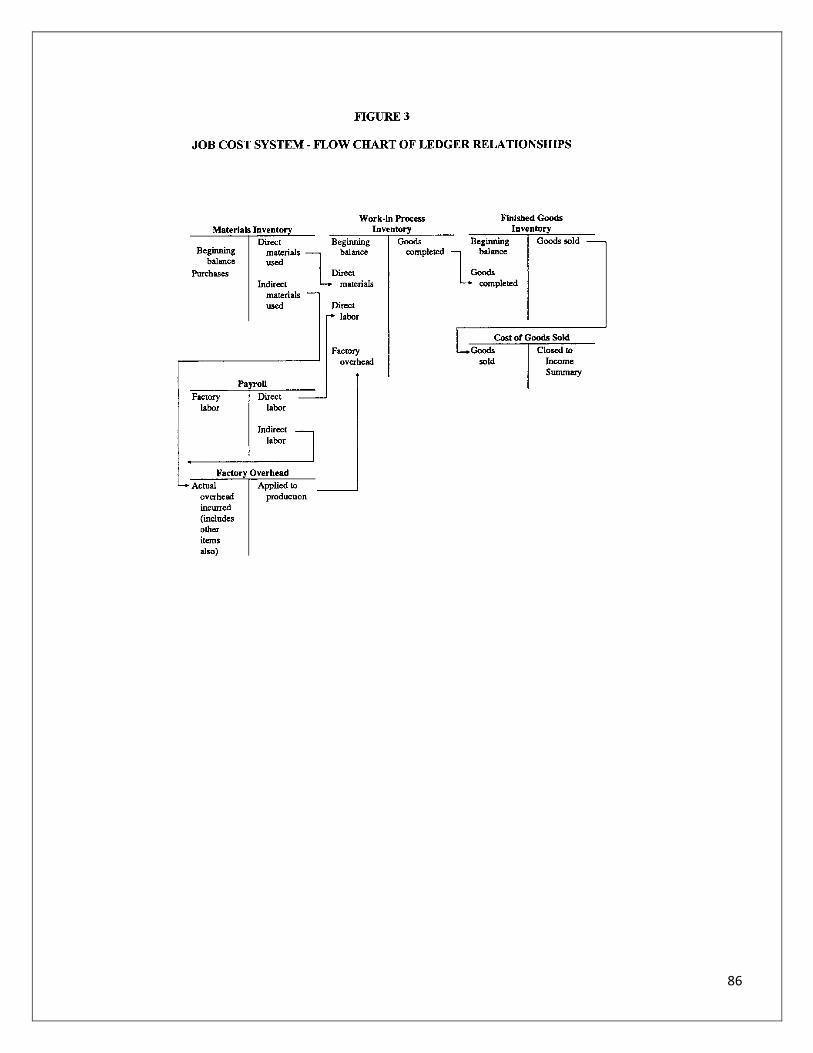
86
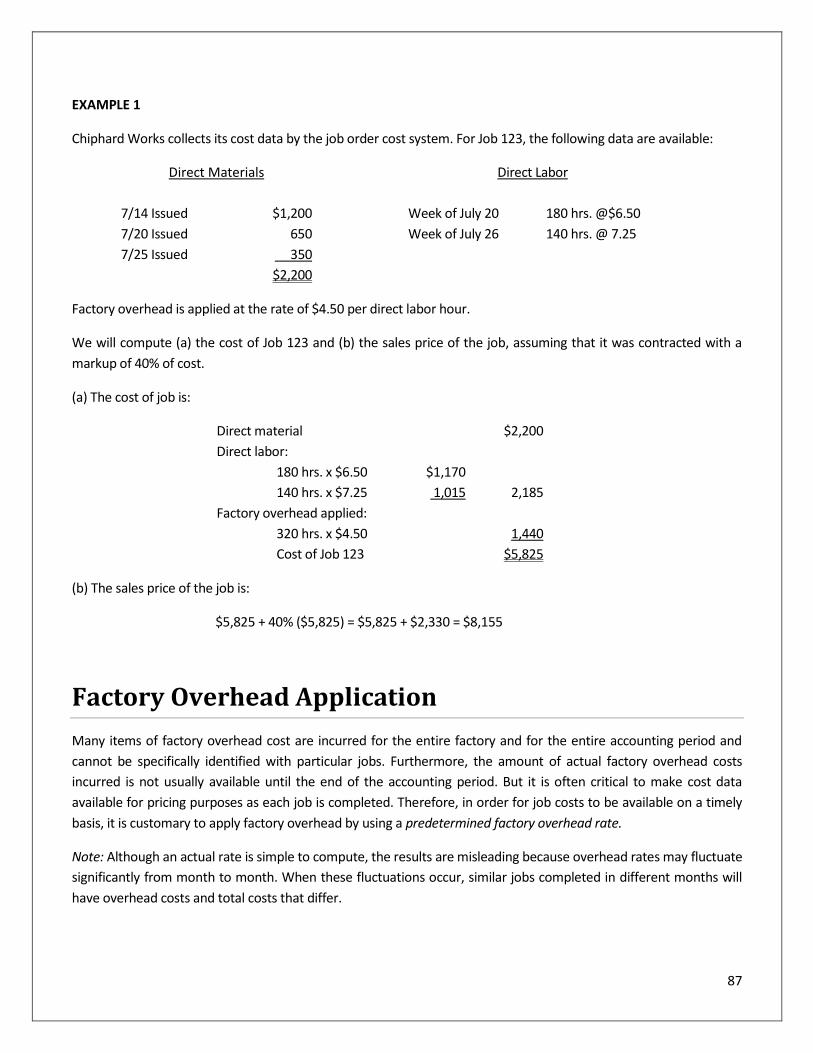
87
EXAMPLE 1
Chiphard Works collects its cost data by the job order cost system. For Job 123, the following data are available:
Direct Materials
Direct Labor
7/14 Issued $1,200 Week of July 20 180 hrs. @$6.50
7/20 Issued 650 Week of July 26 140 hrs. @ 7.25
7/25 Issued 350
$2,200
Factory overhead is applied at the rate of $4.50 per direct labor hour.
We will compute (a) the cost of Job 123 and (b) the sales price of the job, assuming that it was contracted with a
markup of 40% of cost.
(a) The cost of job is:
Direct material $2,200
Direct labor:
180 hrs. x $6.50 $1,170
140 hrs. x $7.25 1,015 2,185
Factory overhead applied:
320 hrs. x $4.50 1,440
Cost of Job 123 $5,825
(b) The sales price of the job is:
$5,825 + 40% ($5,825) = $5,825 + $2,330 = $8,155
Factory Overhead Application
Many items of factory overhead cost are incurred for the entire factory and for the entire accounting period and
cannot be specifically identified with particular jobs. Furthermore, the amount of actual factory overhead costs
incurred is not usually available until the end of the accounting period. But it is often critical to make cost data
available for pricing purposes as each job is completed. Therefore, in order for job costs to be available on a timely
basis, it is customary to apply factory overhead by using a predetermined factory overhead rate.
Note: Although an actual rate is simple to compute, the results are misleading because overhead rates may fluctuate
significantly from month to month. When these fluctuations occur, similar jobs completed in different months will
have overhead costs and total costs that differ.
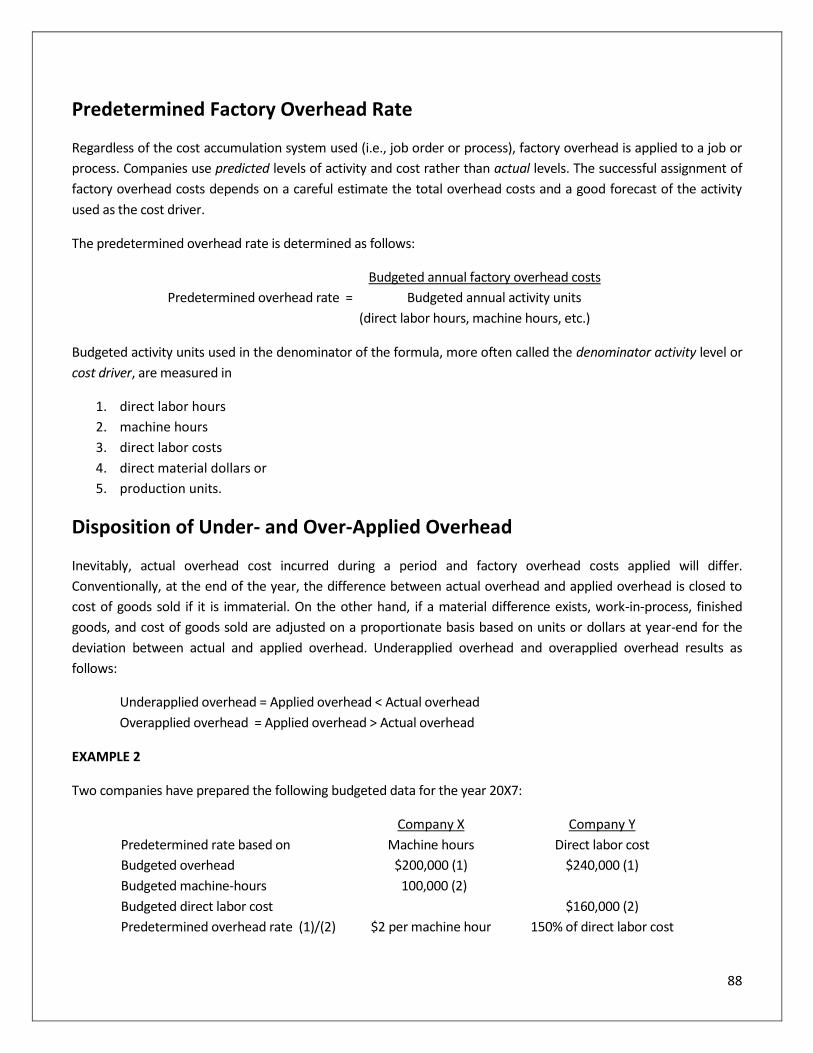
88
Predetermined Factory Overhead Rate
Regardless of the cost accumulation system used (i.e., job order or process), factory overhead is applied to a job or
process. Companies use predicted levels of activity and cost rather than actual levels. The successful assignment of
factory overhead costs depends on a careful estimate the total overhead costs and a good forecast of the activity
used as the cost driver.
The predetermined overhead rate is determined as follows:
Budgeted annual factory overhead costs
Predetermined overhead rate = Budgeted annual activity units
(direct labor hours, machine hours, etc.)
Budgeted activity units used in the denominator of the formula, more often called the denominator activity level or
cost driver, are measured in
1. direct labor hours
2. machine hours
3. direct labor costs
4. direct material dollars or
5. production units.
Disposition of Under- and Over-Applied Overhead
Inevitably, actual overhead cost incurred during a period and factory overhead costs applied will differ.
Conventionally, at the end of the year, the difference between actual overhead and applied overhead is closed to
cost of goods sold if it is immaterial. On the other hand, if a material difference exists, work-in-process, finished
goods, and cost of goods sold are adjusted on a proportionate basis based on units or dollars at year-end for the
deviation between actual and applied overhead. Underapplied overhead and overapplied overhead results as
follows:
Underapplied overhead = Applied overhead < Actual overhead
Overapplied overhead = Applied overhead > Actual overhead
EXAMPLE 2
Two companies have prepared the following budgeted data for the year 20X7:
Company X Company Y
Predetermined rate based on Machine hours Direct labor cost
Budgeted overhead $200,000 (1) $240,000 (1)
Budgeted machine-hours 100,000 (2)
Budgeted direct labor cost $160,000 (2)
Predetermined overhead rate (1)/(2) $2 per machine hour 150% of direct labor cost
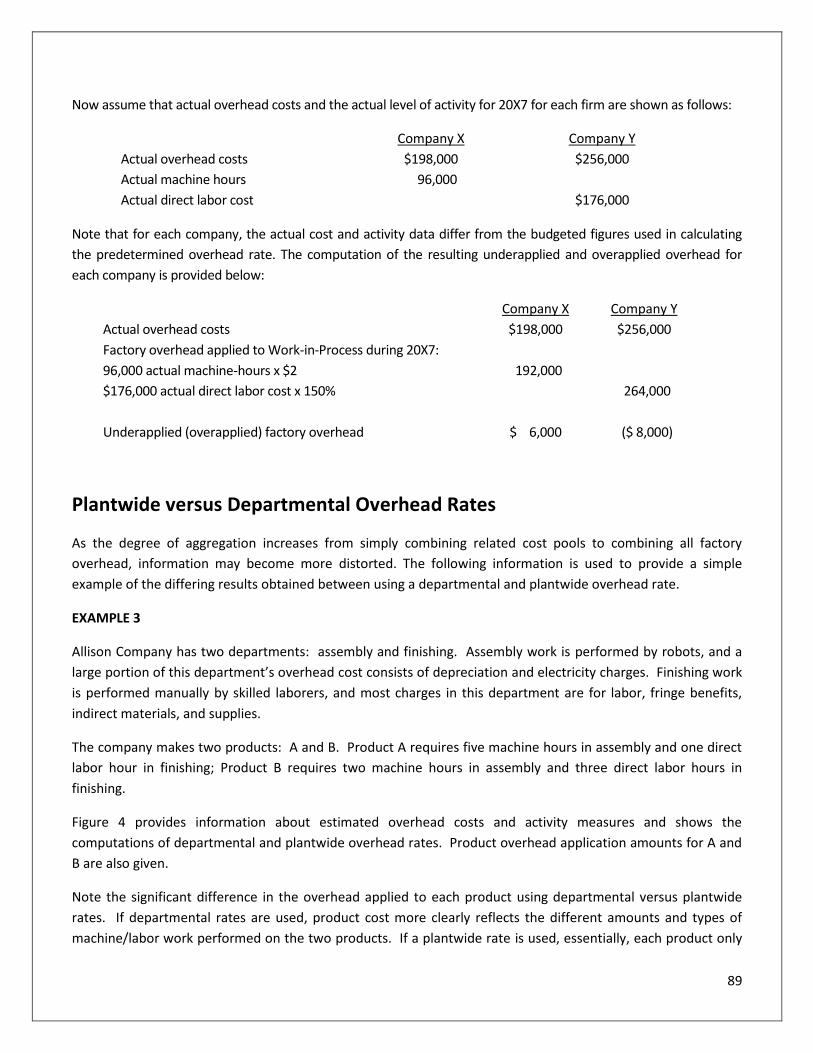
89
Now assume that actual overhead costs and the actual level of activity for 20X7 for each firm are shown as follows:
Company X Company Y
Actual overhead costs $198,000 $256,000
Actual machine hours 96,000
Actual direct labor cost $176,000
Note that for each company, the actual cost and activity data differ from the budgeted figures used in calculating
the predetermined overhead rate. The computation of the resulting underapplied and overapplied overhead for
each company is provided below:
Company X Company Y
Actual overhead costs $198,000 $256,000
Factory overhead applied to Work-in-Process during 20X7:
96,000 actual machine-hours x $2 192,000
$176,000 actual direct labor cost x 150%
264,000
Underapplied (overapplied) factory overhead $ 6,000 ($ 8,000)
Plantwide versus Departmental Overhead Rates
As the degree of aggregation increases from simply combining related cost pools to combining all factory
overhead, information may become more distorted. The following information is used to provide a simple
example of the differing results obtained between using a departmental and plantwide overhead rate.
EXAMPLE 3
Allison Company has two departments: assembly and finishing. Assembly work is performed by robots, and a
large portion of this department’s overhead cost consists of depreciation and electricity charges. Finishing work
is performed manually by skilled laborers, and most charges in this department are for labor, fringe benefits,
indirect materials, and supplies.
The company makes two products: A and B. Product A requires five machine hours in assembly and one direct
labor hour in finishing; Product B requires two machine hours in assembly and three direct labor hours in
finishing.
Figure 4 provides information about estimated overhead costs and activity measures and shows the
computations of departmental and plantwide overhead rates. Product overhead application amounts for A and
B are also given.
Note the significant difference in the overhead applied to each product using departmental versus plantwide
rates. If departmental rates are used, product cost more clearly reflects the different amounts and types of
machine/labor work performed on the two products. If a plantwide rate is used, essentially, each product only
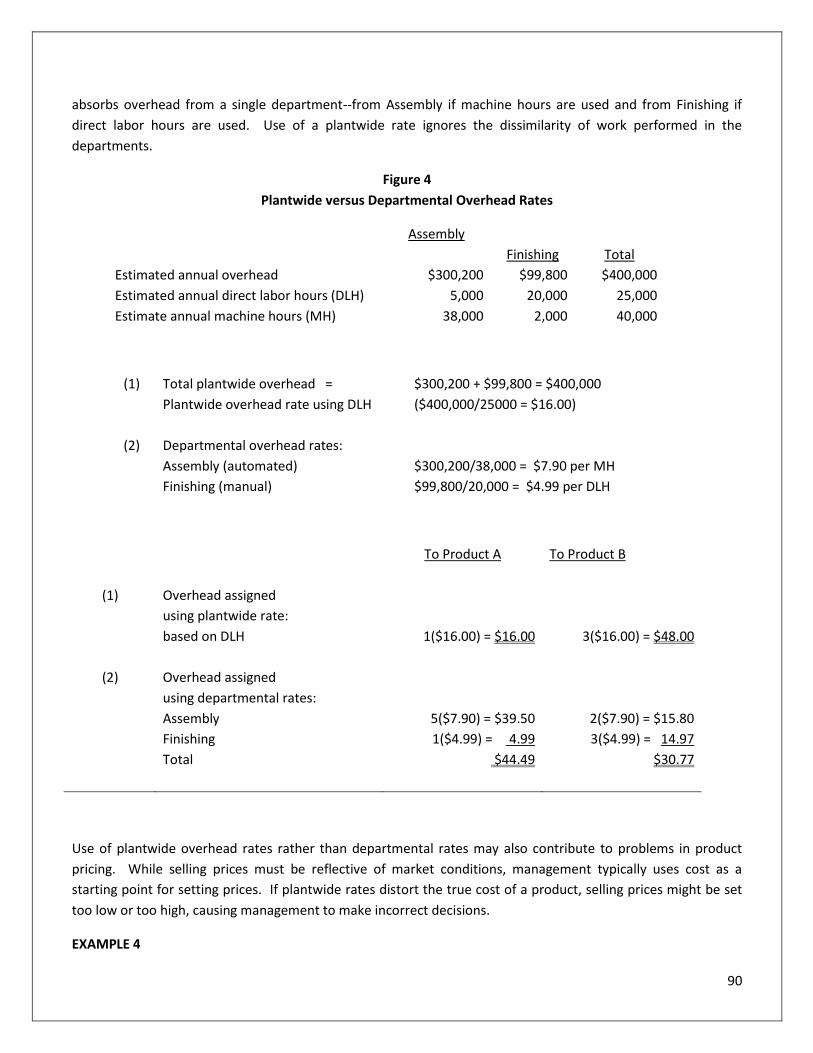
90
absorbs overhead from a single department--from Assembly if machine hours are used and from Finishing if
direct labor hours are used. Use of a plantwide rate ignores the dissimilarity of work performed in the
departments.
Figure 4
Plantwide versus Departmental Overhead Rates
Assembly
Finishing
Total
Estimated annual overhead $300,200 $99,800 $400,000
Estimated annual direct labor hours (DLH) 5,000 20,000 25,000
Estimate annual machine hours (MH) 38,000 2,000 40,000
(1) Total plantwide overhead = $300,200 + $99,800 = $400,000
Plantwide overhead rate using DLH ($400,000/25000 = $16.00)
(2) Departmental overhead rates:
Assembly (automated) $300,200/38,000 = $7.90 per MH
Finishing (manual) $99,800/20,000 = $4.99 per DLH
To Product A To Product B
(1) Overhead assigned
using plantwide rate:
based on DLH 1($16.00) = $16.00 3($16.00) = $48.00
(2) Overhead assigned
using departmental rates:
Assembly 5($7.90) = $39.50 2($7.90) = $15.80
Finishing 1($4.99) = 4.99 3($4.99) = 14.97
Total
$44.49 $30.77
Use of plantwide overhead rates rather than departmental rates may also contribute to problems in product
pricing. While selling prices must be reflective of market conditions, management typically uses cost as a
starting point for setting prices. If plantwide rates distort the true cost of a product, selling prices might be set
too low or too high, causing management to make incorrect decisions.
EXAMPLE 4
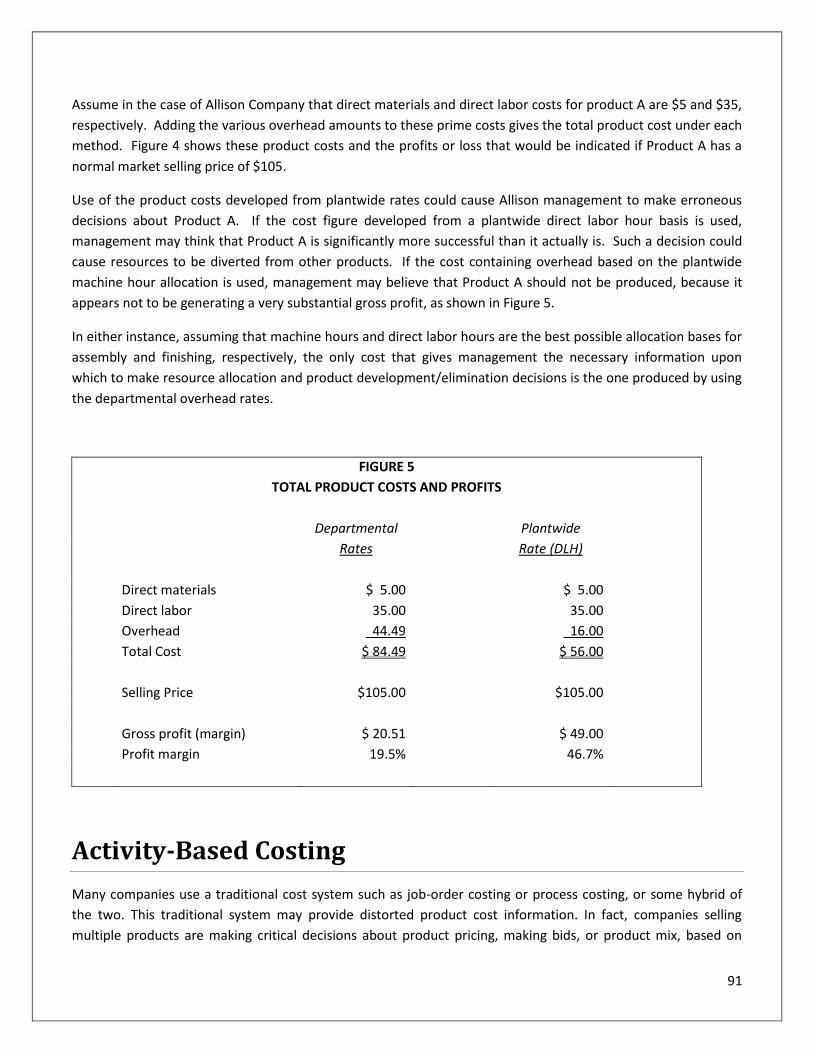
91
Assume in the case of Allison Company that direct materials and direct labor costs for product A are $5 and $35,
respectively. Adding the various overhead amounts to these prime costs gives the total product cost under each
method. Figure 4 shows these product costs and the profits or loss that would be indicated if Product A has a
normal market selling price of $105.
Use of the product costs developed from plantwide rates could cause Allison management to make erroneous
decisions about Product A. If the cost figure developed from a plantwide direct labor hour basis is used,
management may think that Product A is significantly more successful than it actually is. Such a decision could
cause resources to be diverted from other products. If the cost containing overhead based on the plantwide
machine hour allocation is used, management may believe that Product A should not be produced, because it
appears not to be generating a very substantial gross profit, as shown in Figure 5.
In either instance, assuming that machine hours and direct labor hours are the best possible allocation bases for
assembly and finishing, respectively, the only cost that gives management the necessary information upon
which to make resource allocation and product development/elimination decisions is the one produced by using
the departmental overhead rates.
FIGURE 5
TOTAL PRODUCT COSTS AND PROFITS
Departmental Plantwide
Rates Rate (DLH)
Direct materials $ 5.00 $ 5.00
Direct labor 35.00 35.00
Overhead 44.49 16.00
Total Cost $ 84.49 $ 56.00
Selling Price $105.00 $105.00
Gross profit (margin) $ 20.51 $ 49.00
Profit margin 19.5% 46.7%
Activity-Based Costing
Many companies use a traditional cost system such as job-order costing or process costing, or some hybrid of
the two. This traditional system may provide distorted product cost information. In fact, companies selling
multiple products are making critical decisions about product pricing, making bids, or product mix, based on
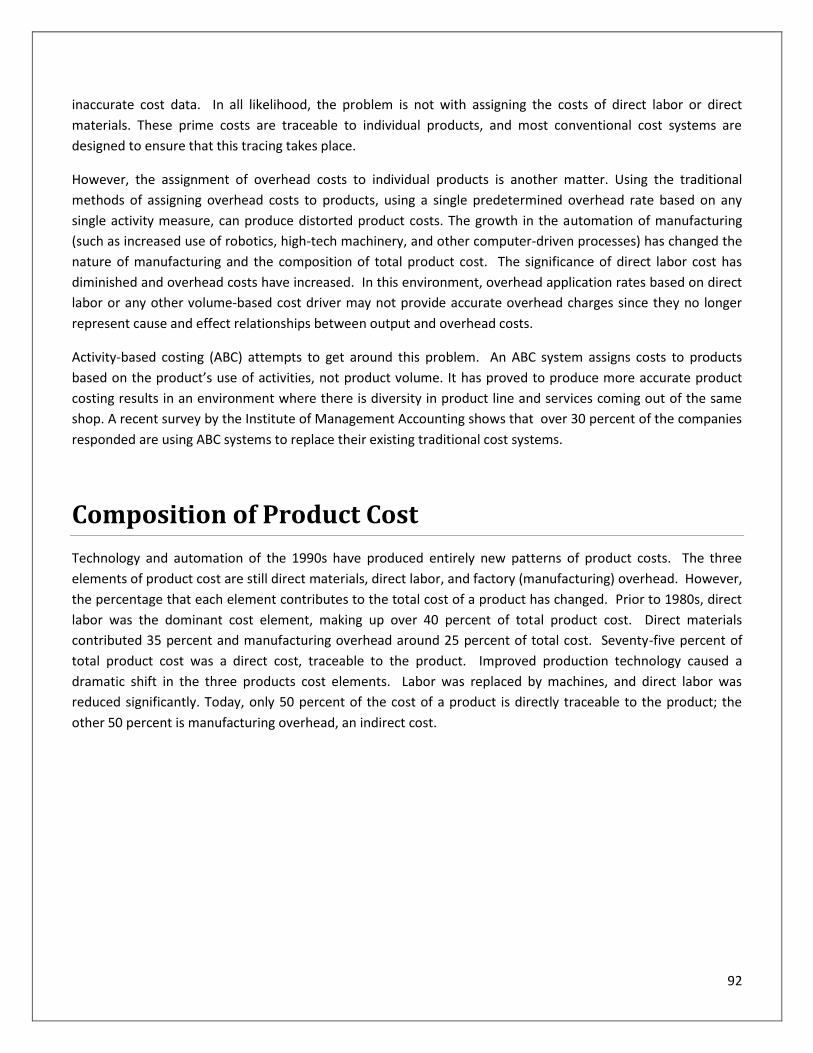
92
inaccurate cost data. In all likelihood, the problem is not with assigning the costs of direct labor or direct
materials. These prime costs are traceable to individual products, and most conventional cost systems are
designed to ensure that this tracing takes place.
However, the assignment of overhead costs to individual products is another matter. Using the traditional
methods of assigning overhead costs to products, using a single predetermined overhead rate based on any
single activity measure, can produce distorted product costs. The growth in the automation of manufacturing
(such as increased use of robotics, high-tech machinery, and other computer-driven processes) has changed the
nature of manufacturing and the composition of total product cost. The significance of direct labor cost has
diminished and overhead costs have increased. In this environment, overhead application rates based on direct
labor or any other volume-based cost driver may not provide accurate overhead charges since they no longer
represent cause and effect relationships between output and overhead costs.
Activity-based costing (ABC) attempts to get around this problem. An ABC system assigns costs to products
based on the product’s use of activities, not product volume. It has proved to produce more accurate product
costing results in an environment where there is diversity in product line and services coming out of the same
shop. A recent survey by the Institute of Management Accounting shows that over 30 percent of the companies
responded are using ABC systems to replace their existing traditional cost systems.
Composition of Product Cost
Technology and automation of the 1990s have produced entirely new patterns of product costs. The three
elements of product cost are still direct materials, direct labor, and factory (manufacturing) overhead. However,
the percentage that each element contributes to the total cost of a product has changed. Prior to 1980s, direct
labor was the dominant cost element, making up over 40 percent of total product cost. Direct materials
contributed 35 percent and manufacturing overhead around 25 percent of total cost. Seventy-five percent of
total product cost was a direct cost, traceable to the product. Improved production technology caused a
dramatic shift in the three products cost elements. Labor was replaced by machines, and direct labor was
reduced significantly. Today, only 50 percent of the cost of a product is directly traceable to the product; the
other 50 percent is manufacturing overhead, an indirect cost.
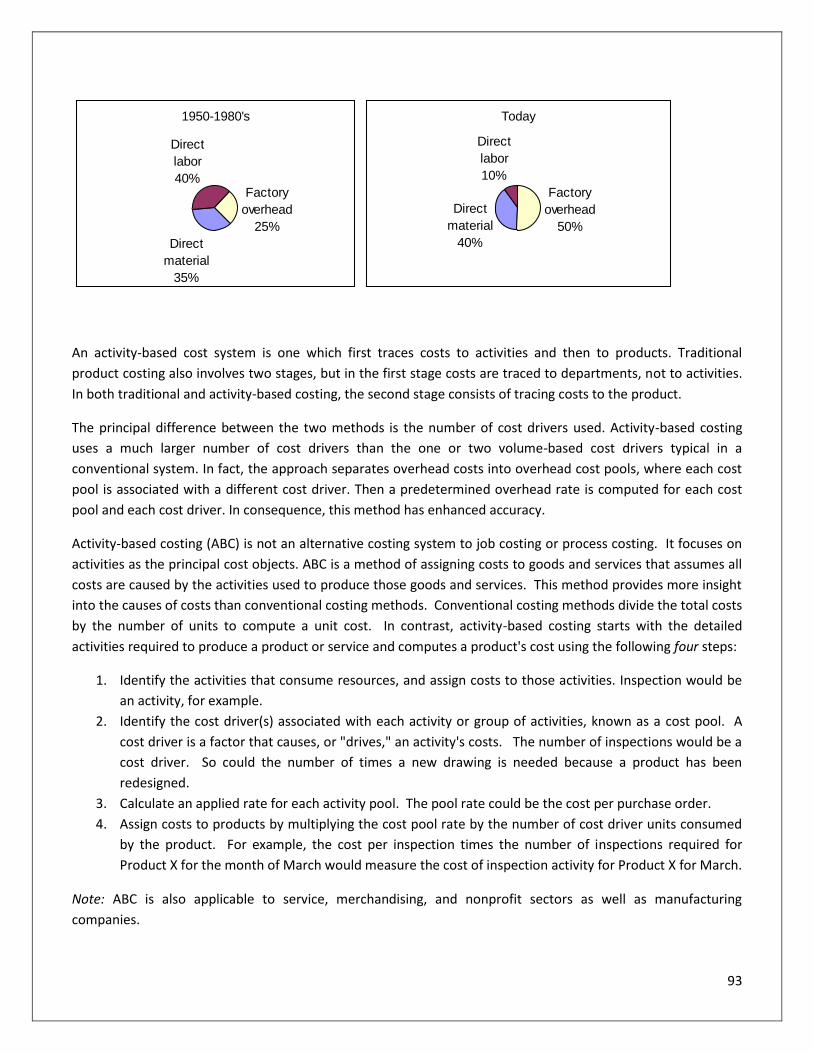
93
1950-1980's
Direct
material
35%
Direct
labor
40%Factory
overhead
25%
Today
Direct
material
40%
Direct
labor
10%
Factory
overhead
50%
An activity-based cost system is one which first traces costs to activities and then to products. Traditional
product costing also involves two stages, but in the first stage costs are traced to departments, not to activities.
In both traditional and activity-based costing, the second stage consists of tracing costs to the product.
The principal difference between the two methods is the number of cost drivers used. Activity-based costing
uses a much larger number of cost drivers than the one or two volume-based cost drivers typical in a
conventional system. In fact, the approach separates overhead costs into overhead cost pools, where each cost
pool is associated with a different cost driver. Then a predetermined overhead rate is computed for each cost
pool and each cost driver. In consequence, this method has enhanced accuracy.
Activity-based costing (ABC) is not an alternative costing system to job costing or process costing. It focuses on
activities as the principal cost objects. ABC is a method of assigning costs to goods and services that assumes all
costs are caused by the activities used to produce those goods and services. This method provides more insight
into the causes of costs than conventional costing methods. Conventional costing methods divide the total costs
by the number of units to compute a unit cost. In contrast, activity-based costing starts with the detailed
activities required to produce a product or service and computes a product's cost using the following four steps:
1. Identify the activities that consume resources, and assign costs to those activities. Inspection would be
an activity, for example.
2. Identify the cost driver(s) associated with each activity or group of activities, known as a cost pool. A
cost driver is a factor that causes, or "drives," an activity's costs. The number of inspections would be a
cost driver. So could the number of times a new drawing is needed because a product has been
redesigned.
3. Calculate an applied rate for each activity pool. The pool rate could be the cost per purchase order.
4. Assign costs to products by multiplying the cost pool rate by the number of cost driver units consumed
by the product. For example, the cost per inspection times the number of inspections required for
Product X for the month of March would measure the cost of inspection activity for Product X for March.
Note: ABC is also applicable to service, merchandising, and nonprofit sectors as well as manufacturing
companies.
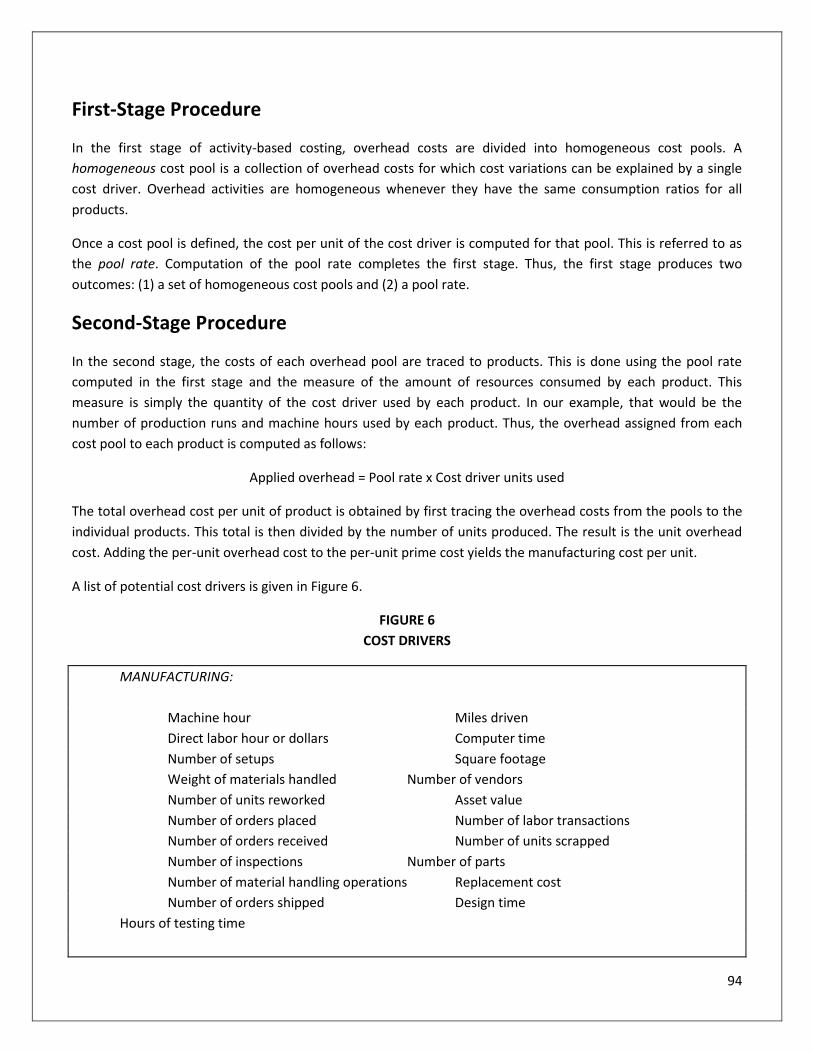
94
First-Stage Procedure
In the first stage of activity-based costing, overhead costs are divided into homogeneous cost pools. A
homogeneous cost pool is a collection of overhead costs for which cost variations can be explained by a single
cost driver. Overhead activities are homogeneous whenever they have the same consumption ratios for all
products.
Once a cost pool is defined, the cost per unit of the cost driver is computed for that pool. This is referred to as
the pool rate. Computation of the pool rate completes the first stage. Thus, the first stage produces two
outcomes: (1) a set of homogeneous cost pools and (2) a pool rate.
Second-Stage Procedure
In the second stage, the costs of each overhead pool are traced to products. This is done using the pool rate
computed in the first stage and the measure of the amount of resources consumed by each product. This
measure is simply the quantity of the cost driver used by each product. In our example, that would be the
number of production runs and machine hours used by each product. Thus, the overhead assigned from each
cost pool to each product is computed as follows:
Applied overhead = Pool rate x Cost driver units used
The total overhead cost per unit of product is obtained by first tracing the overhead costs from the pools to the
individual products. This total is then divided by the number of units produced. The result is the unit overhead
cost. Adding the per-unit overhead cost to the per-unit prime cost yields the manufacturing cost per unit.
A list of potential cost drivers is given in Figure 6.
FIGURE 6
COST DRIVERS
MANUFACTURING:
Machine hour Miles driven
Direct labor hour or dollars Computer time
Number of setups Square footage
Weight of materials handled Number of vendors
Number of units reworked Asset value
Number of orders placed Number of labor transactions
Number of orders received Number of units scrapped
Number of inspections Number of parts
Number of material handling operations Replacement cost
Number of orders shipped Design time
Hours of testing time
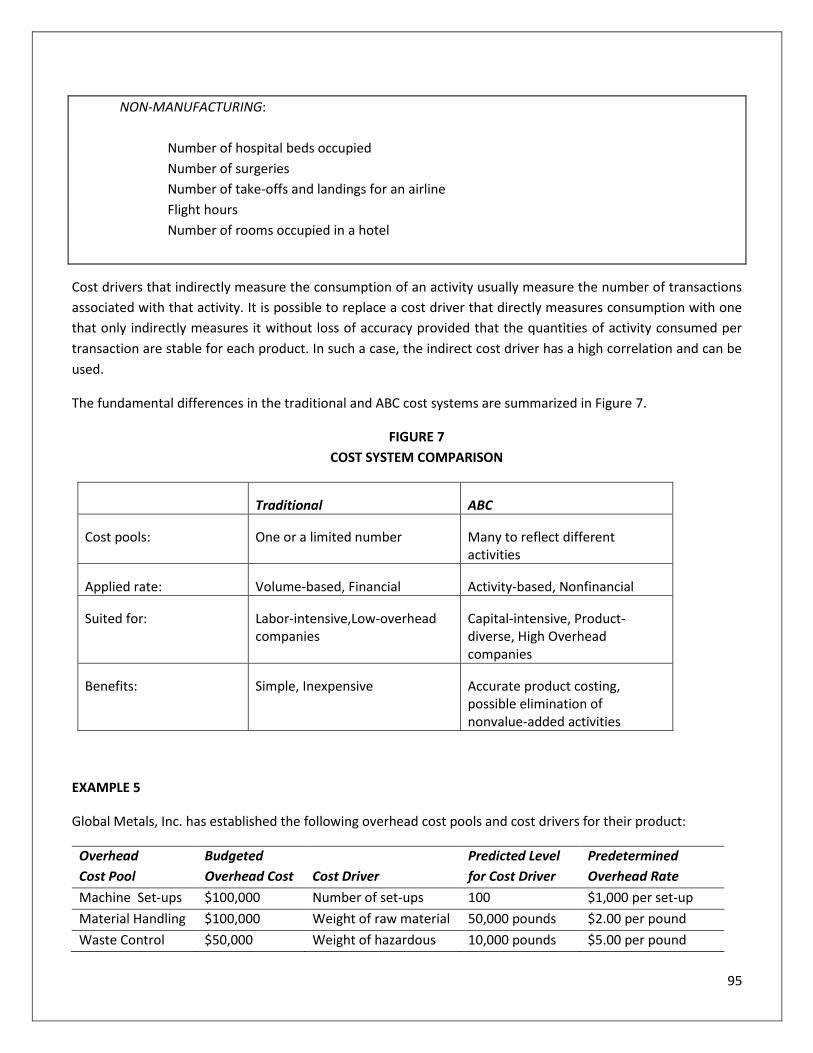
95
NON-MANUFACTURING:
Number of hospital beds occupied
Number of surgeries
Number of take-offs and landings for an airline
Flight hours
Number of rooms occupied in a hotel
Cost drivers that indirectly measure the consumption of an activity usually measure the number of transactions
associated with that activity. It is possible to replace a cost driver that directly measures consumption with one
that only indirectly measures it without loss of accuracy provided that the quantities of activity consumed per
transaction are stable for each product. In such a case, the indirect cost driver has a high correlation and can be
used.
The fundamental differences in the traditional and ABC cost systems are summarized in Figure 7.
FIGURE 7
COST SYSTEM COMPARISON
Traditional ABC
Cost pools: One or a limited number Many to reflect different activities
Applied rate: Volume-based, Financial Activity-based, Nonfinancial
Suited for: Labor-intensive, Low-overhead companies
Capital-intensive, Product-diverse, High Overhead companies
Benefits: Simple, Inexpensive Accurate product costing, possible elimination of nonvalue-added activities
EXAMPLE 5
Global Metals, Inc. has established the following overhead cost pools and cost drivers for their product:
Overhead Budgeted Predicted Level Predetermined
Cost Pool Overhead Cost Cost Driver for Cost Driver Overhead Rate
Machine Set-ups $100,000 Number of set-ups 100 $1,000 per set-up
Material Handling $100,000 Weight of raw material 50,000 pounds $2.00 per pound
Waste Control $50,000 Weight of hazardous 10,000 pounds $5.00 per pound
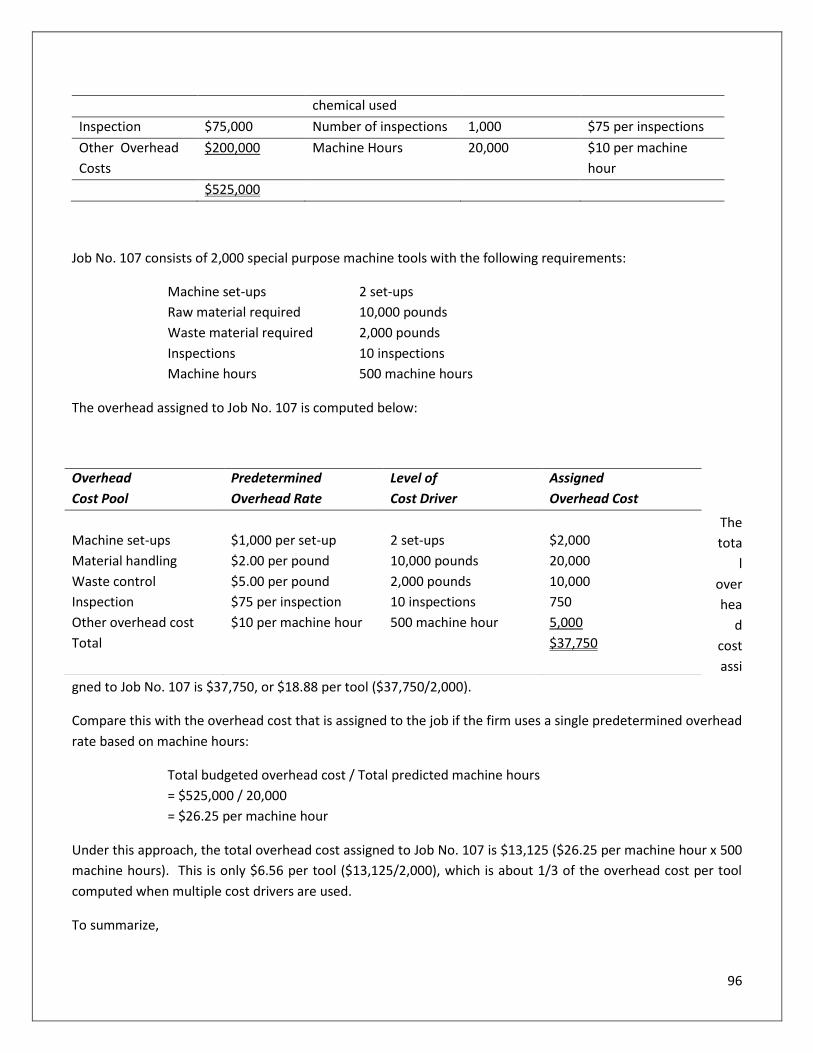
96
chemical used
Inspection $75,000 Number of inspections 1,000 $75 per inspections
Other Overhead
Costs
$200,000 Machine Hours 20,000 $10 per machine
hour
$525,000
Job No. 107 consists of 2,000 special purpose machine tools with the following requirements:
Machine set-ups 2 set-ups
Raw material required 10,000 pounds
Waste material required 2,000 pounds
Inspections 10 inspections
Machine hours 500 machine hours
The overhead assigned to Job No. 107 is computed below:
The
tota
l
over
hea
d
cost
assi
gned to Job No. 107 is $37,750, or $18.88 per tool ($37,750/2,000).
Compare this with the overhead cost that is assigned to the job if the firm uses a single predetermined overhead
rate based on machine hours:
Total budgeted overhead cost / Total predicted machine hours
= $525,000 / 20,000
= $26.25 per machine hour
Under this approach, the total overhead cost assigned to Job No. 107 is $13,125 ($26.25 per machine hour x 500
machine hours). This is only $6.56 per tool ($13,125/2,000), which is about 1/3 of the overhead cost per tool
computed when multiple cost drivers are used.
To summarize,
Overhead Predetermined Level of Assigned
Cost Pool Overhead Rate Cost Driver Overhead Cost
Machine set-ups $1,000 per set-up 2 set-ups $2,000
Material handling $2.00 per pound 10,000 pounds 20,000
Waste control $5.00 per pound 2,000 pounds 10,000
Inspection $75 per inspection 10 inspections 750
Other overhead cost $10 per machine hour 500 machine hour 5,000
Total $37,750
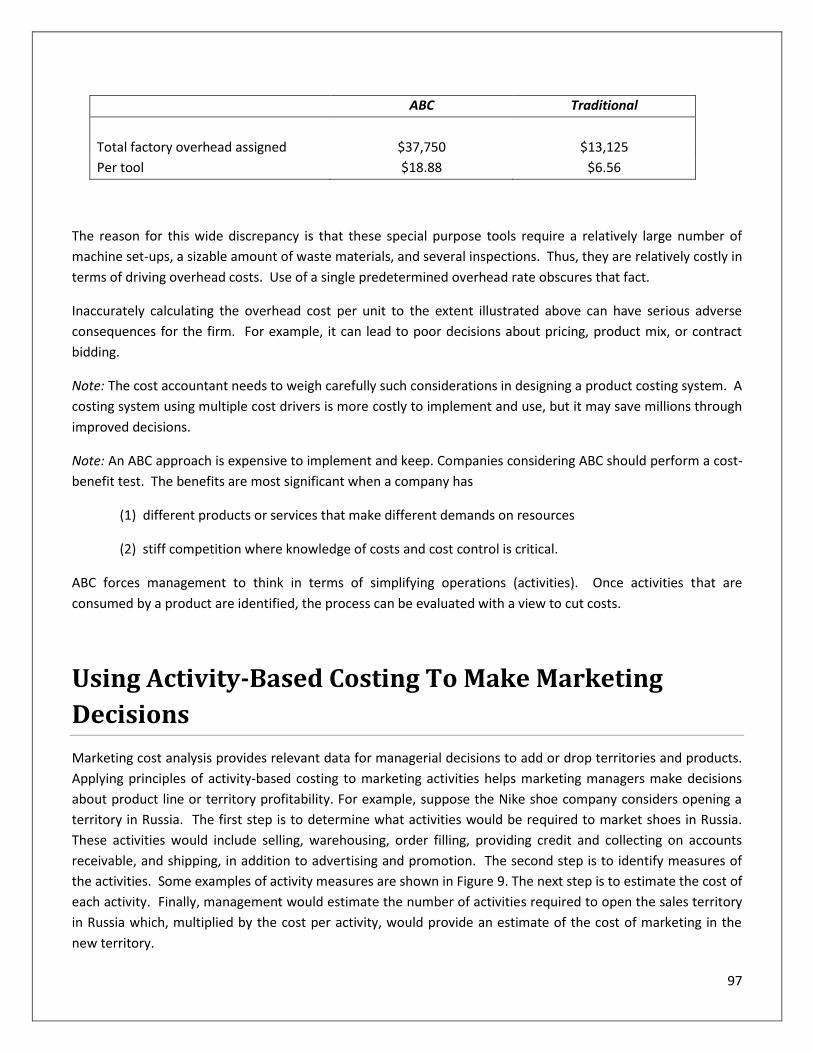
97
ABC Traditional
Total factory overhead assigned $37,750 $13,125
Per tool $18.88 $6.56
The reason for this wide discrepancy is that these special purpose tools require a relatively large number of
machine set-ups, a sizable amount of waste materials, and several inspections. Thus, they are relatively costly in
terms of driving overhead costs. Use of a single predetermined overhead rate obscures that fact.
Inaccurately calculating the overhead cost per unit to the extent illustrated above can have serious adverse
consequences for the firm. For example, it can lead to poor decisions about pricing, product mix, or contract
bidding.
Note: The cost accountant needs to weigh carefully such considerations in designing a product costing system. A
costing system using multiple cost drivers is more costly to implement and use, but it may save millions through
improved decisions.
Note: An ABC approach is expensive to implement and keep. Companies considering ABC should perform a cost-
benefit test. The benefits are most significant when a company has
(1) different products or services that make different demands on resources
(2) stiff competition where knowledge of costs and cost control is critical.
ABC forces management to think in terms of simplifying operations (activities). Once activities that are
consumed by a product are identified, the process can be evaluated with a view to cut costs.
Using Activity-Based Costing To Make Marketing
Decisions
Marketing cost analysis provides relevant data for managerial decisions to add or drop territories and products.
Applying principles of activity-based costing to marketing activities helps marketing managers make decisions
about product line or territory profitability. For example, suppose the Nike shoe company considers opening a
territory in Russia. The first step is to determine what activities would be required to market shoes in Russia.
These activities would include selling, warehousing, order filling, providing credit and collecting on accounts
receivable, and shipping, in addition to advertising and promotion. The second step is to identify measures of
the activities. Some examples of activity measures are shown in Figure 9. The next step is to estimate the cost of
each activity. Finally, management would estimate the number of activities required to open the sales territory
in Russia which, multiplied by the cost per activity, would provide an estimate of the cost of marketing in the
new territory.
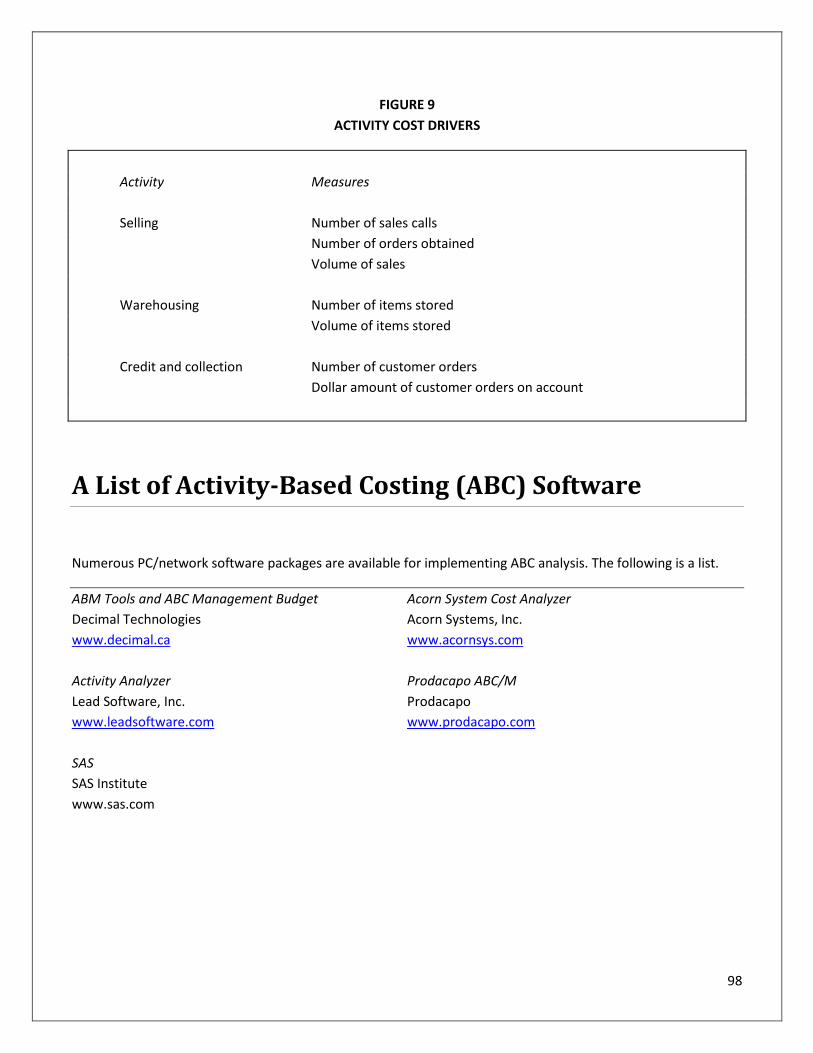
98
FIGURE 9
ACTIVITY COST DRIVERS
Activity Measures
Selling Number of sales calls
Number of orders obtained
Volume of sales
Warehousing Number of items stored
Volume of items stored
Credit and collection Number of customer orders
Dollar amount of customer orders on account
A List of Activity-Based Costing (ABC) Software
Numerous PC/network software packages are available for implementing ABC analysis. The following is a list.
ABM Tools and ABC Management Budget Acorn System Cost Analyzer
Decimal Technologies Acorn Systems, Inc.
www.decimal.ca www.acornsys.com
Activity Analyzer Prodacapo ABC/M
Lead Software, Inc. Prodacapo
www.leadsoftware.com www.prodacapo.com
SAS
SAS Institute
www.sas.com
99
Chapter 6 Review Questions
1. Companies characterized by the production of heterogeneous products will most likely use which of the following
methods for the purpose of averaging costs and providing management with unit cost data?
A. Process costing
B. Job-order costing
C. Direct costing
D. Absorption costing
2. Companies characterized by the production of basically homogeneous products will most likely use which of the
following methods for the purpose of averaging costs and providing management with unit-cost data?
A. Process costing
B. Job-order costing
C. Variable costing
D. Absorption costing
3. What is an accounting system that collects financial and operating data on the basis of the underlying nature and
extent of the cost drivers?
A. Activity-based costing
B. Target costing
C. Delivery cycle time costing
D. Variable costing
100
Chapter 7: Cost Behavior and Cost-Volume-Profit
Analysis
Learning Objectives:
After completing this section, you should be able to:
Identify the benefits of developing a cost-volume profit analysis.
Compute the sales necessary to break even or to achieve a target income.
Perform a variety of "what-if" analyses using the contribution approach.
Not all costs behave in the same way. There are certain costs that vary in proportion to changes in volume or
activity, such as labor hours and machine hours. There are other costs that do not change even though volume
changes. An understanding of cost behavior is helpful:
1. For break-even and cost-volume-profit analysis.
2. To appraise divisional performance.
3. For flexible budgeting.
4. To make short-term choice decisions
5. To make transfer decisions
Cost-volume-profit (CVP) analysis, together with cost behavior information, helps managerial accountants
perform many useful analyses. CVP analysis deals with how profit and costs change with a change in volume.
More specifically, it looks at the effects on profits of changes in such factors as variable costs, fixed costs, selling
prices, volume, and mix of products sold. By studying the relationships of costs, sales, and net income,
management is better able to cope with many planning decisions.
Break-even analysis, a branch of CVP analysis, determines the break-even sales. Break-even point, the financial
crossover point when revenues exactly match costs, does not show up in corporate earnings reports, but
managerial accountants find it an extremely useful measurement in a variety of ways.
101
A Further Look at Costs by Behavior
As was discussed in the previous chapter, depending on how a cost will react or respond to changes in the level
of activity, costs may be viewed as variable, fixed, or mixed (semi-variable). This classification is made within a
specified range of activity, called the relevant range. The relevant range is the volume zone within which the
behavior of variable costs, fixed costs, and selling prices can be predicted with reasonable accuracy.
VARIABLE COSTS. Variable costs, also known as engineered costs, vary in total with changes in volume or level
of activity. Examples of variable costs include the costs of direct materials, direct labor, and sales commissions.
The following factory overhead items fall in the variable cost category:
Variable Factory Overhead
Supplies Receiving Costs
Fuel and Power Overtime Premium
Spoilage and Defective Work
FIXED COSTS. Fixed costs do not change in total regardless of the volume or level of activity. Examples include
advertising expense, salaries, and depreciation. The following factory overhead items fall in the fixed cost
category:
Fixed Factory Overhead
Property Taxes Rent on Factory Building
Depreciation* Indirect labor
Insurance Patent Amortization
*Depreciation can be variable if it is based on units of production.
MIXED (SEMI-VARIABLE) COSTS. As previously discussed, mixed costs contain both a fixed element and a
variable one. Salespersons' compensation including salary and commission is an example. The following factory
overhead items may be considered mixed costs:
Mixed Factory Overhead
Supervision Maintenance and Repairs
Inspection Workmen’s Compensation Insurance
Service Department costs Employer's Payroll Taxes
Utilities Rental of Delivery Truck
Fringe Benefits Quality Costs
Cleanup costs
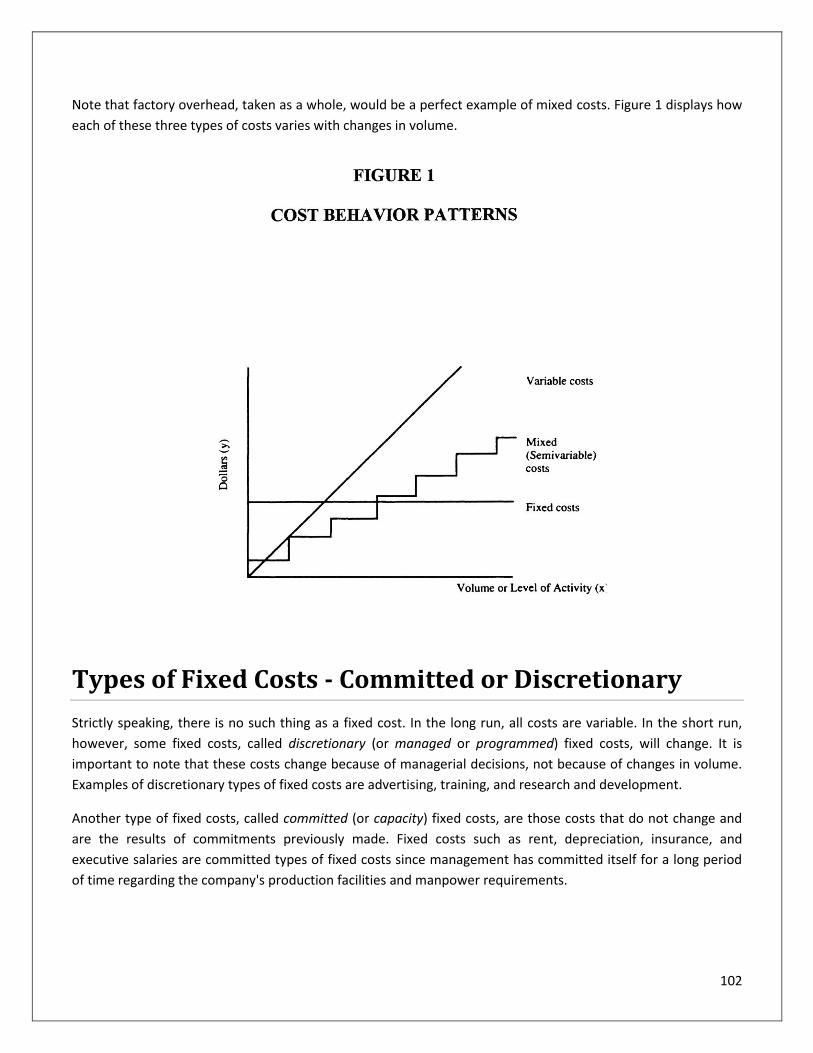
102
Note that factory overhead, taken as a whole, would be a perfect example of mixed costs. Figure 1 displays how
each of these three types of costs varies with changes in volume.
Types of Fixed Costs - Committed or Discretionary
Strictly speaking, there is no such thing as a fixed cost. In the long run, all costs are variable. In the short run,
however, some fixed costs, called discretionary (or managed or programmed) fixed costs, will change. It is
important to note that these costs change because of managerial decisions, not because of changes in volume.
Examples of discretionary types of fixed costs are advertising, training, and research and development.
Another type of fixed costs, called committed (or capacity) fixed costs, are those costs that do not change and
are the results of commitments previously made. Fixed costs such as rent, depreciation, insurance, and
executive salaries are committed types of fixed costs since management has committed itself for a long period
of time regarding the company's production facilities and manpower requirements.
103
Analysis of Mixed (Semi-variable) Costs
For planning, control, and decision making purposes, mixed costs need to be separated into their variable and
fixed components. Since the mixed costs contain both fixed and variable elements, the analysis takes the
following mathematical form, which is called a cost-volume formula (flexible budget formula or cost function):
y = a + bx
where y = the mixed cost to be broken up.
x = any given measure of activity (cost driver) such as direct labor hours, machine hours, or production
volume.
a = the fixed cost component.
b = the variable rate per unit of x.
Relevant Range
Management quite often use the notion of relevant range in estimating cost behavior. The relevant range is the
range of activity over which the company expects a set of cost behaviors to be consistent (or linear). For
example, if the relevant range of activity is between 10,000 and 20,000 units of cars, the auto maker assumes
that certain costs are fixed and while others are variable within that range.
Separating the mixed cost into its fixed and variable components is the same thing as estimating the parameter
values a and b in the cost-volume formula. There are several methods available to be used for this purpose
including engineering analysis, account analysis and the high-low method. They are discussed below.
Engineering Analysis
Engineering analysis measures cost behavior according to what costs should be, not by what costs have been. It
entails a systematic review of materials, labor, support services, and facilities needed for product and services.
Engineers use time and motion studies and similar engineering methods to estimate what costs should be from
engineers’ specifications of the inputs required to manufacture a unit of output or to perform a particular
service. This can be used for existing products or for new products similar to what has been produced before.
Disadvantages of this method are that it is prohibitively costly and often not timely. Further it is difficult to
estimate indirect costs. The engineering method is most useful when costs involved are variable costs, where
there is a clear input/output relation.
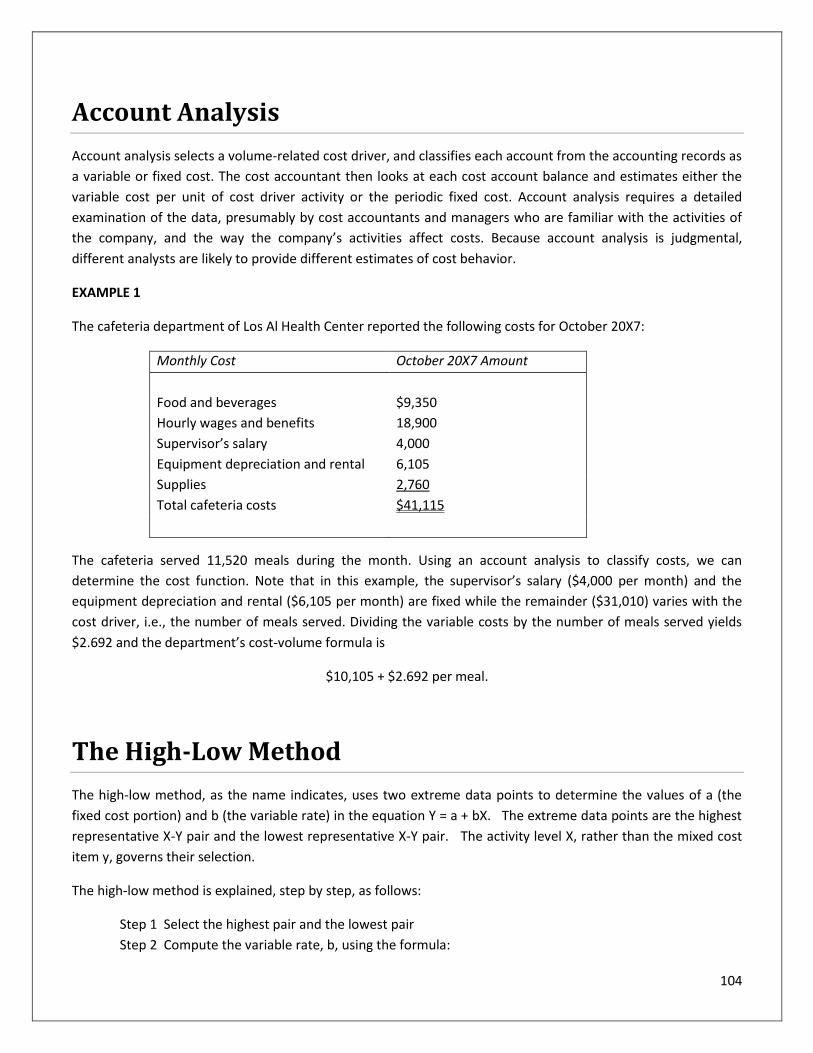
104
Account Analysis
Account analysis selects a volume-related cost driver, and classifies each account from the accounting records as
a variable or fixed cost. The cost accountant then looks at each cost account balance and estimates either the
variable cost per unit of cost driver activity or the periodic fixed cost. Account analysis requires a detailed
examination of the data, presumably by cost accountants and managers who are familiar with the activities of
the company, and the way the company’s activities affect costs. Because account analysis is judgmental,
different analysts are likely to provide different estimates of cost behavior.
EXAMPLE 1
The cafeteria department of Los Al Health Center reported the following costs for October 20X7:
Monthly Cost October 20X7 Amount
Food and beverages $9,350
Hourly wages and benefits 18,900
Supervisor’s salary 4,000
Equipment depreciation and rental 6,105
Supplies 2,760
Total cafeteria costs $41,115
The cafeteria served 11,520 meals during the month. Using an account analysis to classify costs, we can
determine the cost function. Note that in this example, the supervisor’s salary ($4,000 per month) and the
equipment depreciation and rental ($6,105 per month) are fixed while the remainder ($31,010) varies with the
cost driver, i.e., the number of meals served. Dividing the variable costs by the number of meals served yields
$2.692 and the department’s cost-volume formula is
$10,105 + $2.692 per meal.
The High-Low Method
The high-low method, as the name indicates, uses two extreme data points to determine the values of a (the
fixed cost portion) and b (the variable rate) in the equation Y = a + bX. The extreme data points are the highest
representative X-Y pair and the lowest representative X-Y pair. The activity level X, rather than the mixed cost
item y, governs their selection.
The high-low method is explained, step by step, as follows:
Step 1 Select the highest pair and the lowest pair
Step 2 Compute the variable rate, b, using the formula:
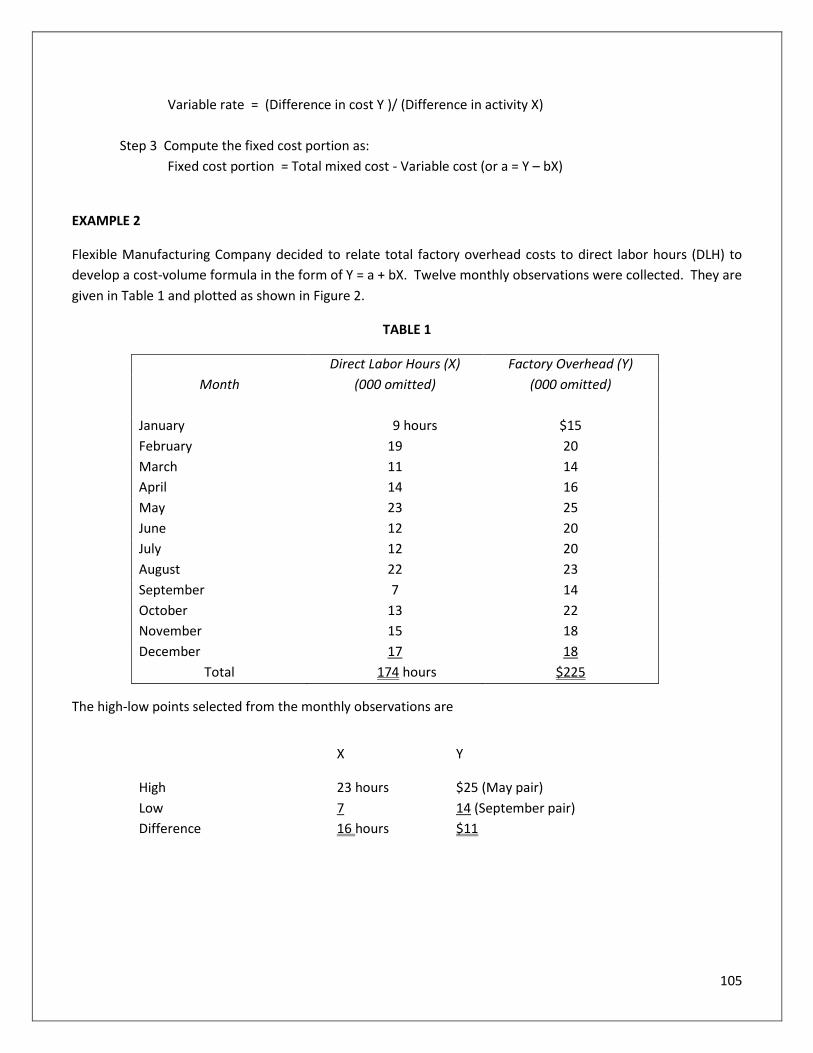
105
Variable rate = (Difference in cost Y )/ (Difference in activity X)
Step 3 Compute the fixed cost portion as:
Fixed cost portion = Total mixed cost - Variable cost (or a = Y – bX)
EXAMPLE 2
Flexible Manufacturing Company decided to relate total factory overhead costs to direct labor hours (DLH) to
develop a cost-volume formula in the form of Y = a + bX. Twelve monthly observations were collected. They are
given in Table 1 and plotted as shown in Figure 2.
TABLE 1
Direct Labor Hours (X) Factory Overhead (Y)
Month (000 omitted) (000 omitted)
January 9 hours $15
February 19 20
March 11 14
April 14 16
May 23 25
June 12 20
July 12 20
August 22 23
September 7 14
October 13 22
November 15 18
December 17 18
Total 174 hours $225
The high-low points selected from the monthly observations are
X Y
High 23 hours $25 (May pair)
Low 7 14 (September pair)
Difference 16 hours $11
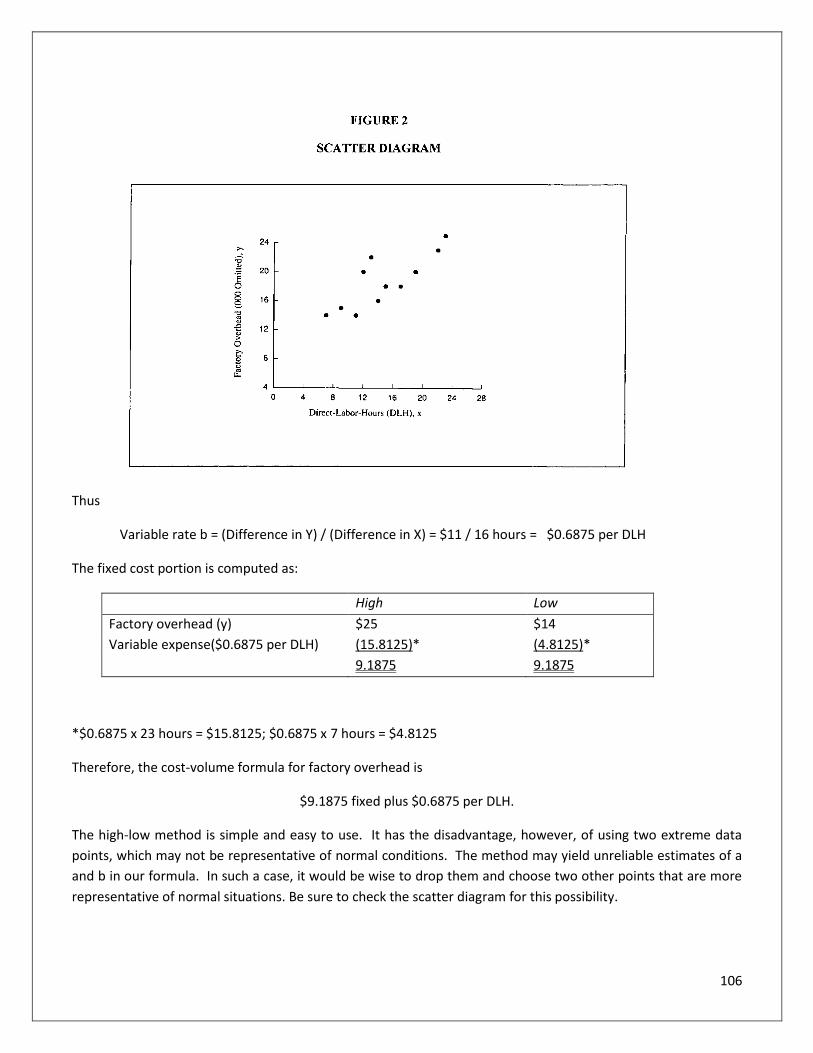
106
Thus
Variable rate b = (Difference in Y) / (Difference in X) = $11 / 16 hours = $0.6875 per DLH
The fixed cost portion is computed as:
High Low
Factory overhead (y) $25 $14
Variable expense($0.6875 per DLH) (15.8125)* (4.8125)*
9.1875 9.1875
*$0.6875 x 23 hours = $15.8125; $0.6875 x 7 hours = $4.8125
Therefore, the cost-volume formula for factory overhead is
$9.1875 fixed plus $0.6875 per DLH.
The high-low method is simple and easy to use. It has the disadvantage, however, of using two extreme data
points, which may not be representative of normal conditions. The method may yield unreliable estimates of a
and b in our formula. In such a case, it would be wise to drop them and choose two other points that are more
representative of normal situations. Be sure to check the scatter diagram for this possibility.
107
Note: The analyst must plot the observed data on a scatter diagram (also called a scattergraph or scatterplot).
The reason is that the relationship between y and x shows a linear pattern in order to justify the use of the linear
form y = a + bx.
Especially for the high-low method, with a scatter diagram (1) it is easier to locate the highest and lowest pairs
on the diagram than on the table and (2) it allows the analyst to ensure that the two points chosen are not
extreme outliners (i.e., they must be representative of the normal behavior).
Questions Answered by CVP Analysis
CVP analysis tries to answer the following questions:
a. What sales volume is required to break even?
b. What sales volume is necessary to earn a desired profit?
c. What profit can be expected on a given sales volume?
d. How would changes in selling price, variable costs, fixed costs, and output affect profits?
e. How would a change in the mix of products sold affect the break-even and target income volume and
profit potential?
Contribution Margin (CM)
For accurate CVP analysis, a distinction must be made between costs as being either variable or fixed. Mixed
costs must be separated into their variable and fixed components.
In order to compute the break-even point and perform various CVP analyses, note the following important
concepts.
CONTRIBUTION MARGIN (CM). The contribution margin is the excess of sales (S) over the variable costs (VC)
of the product or service. It is the amount of money available to cover fixed costs (FC) and to generate profit.
Symbolically, CM = S - VC.
UNIT CM. The unit CM is the excess of the unit selling price (p) less the unit variable cost (v). Symbolically, Unit
CM = p - v.
CM RATIO. The CM ratio is the contribution margin as a percentage of sales, i.e.,
CM Ratio = S
CM =
S
)VCS( = 1 -
S
VC
The CM ratio can also be computed using per-unit data as follows:
CM Ratio = p
CMUnit =
p
)vp( = 1 -
p
v
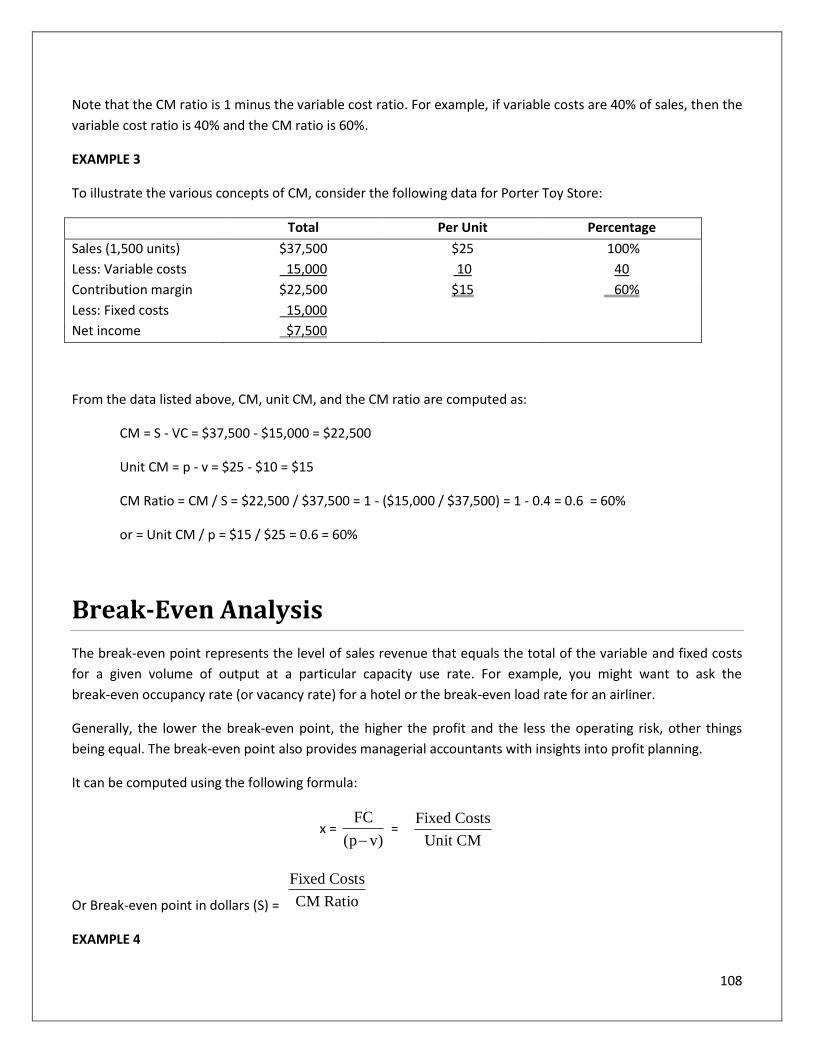
108
Note that the CM ratio is 1 minus the variable cost ratio. For example, if variable costs are 40% of sales, then the
variable cost ratio is 40% and the CM ratio is 60%.
EXAMPLE 3
To illustrate the various concepts of CM, consider the following data for Porter Toy Store:
Total Per Unit Percentage
Sales (1,500 units) $37,500 $25 100%
Less: Variable costs 15,000 10 40
Contribution margin $22,500 $15 60%
Less: Fixed costs 15,000
Net income $7,500
From the data listed above, CM, unit CM, and the CM ratio are computed as:
CM = S - VC = $37,500 - $15,000 = $22,500
Unit CM = p - v = $25 - $10 = $15
CM Ratio = CM / S = $22,500 / $37,500 = 1 - ($15,000 / $37,500) = 1 - 0.4 = 0.6 = 60%
or = Unit CM / p = $15 / $25 = 0.6 = 60%
Break-Even Analysis
The break-even point represents the level of sales revenue that equals the total of the variable and fixed costs
for a given volume of output at a particular capacity use rate. For example, you might want to ask the
break-even occupancy rate (or vacancy rate) for a hotel or the break-even load rate for an airliner.
Generally, the lower the break-even point, the higher the profit and the less the operating risk, other things
being equal. The break-even point also provides managerial accountants with insights into profit planning.
It can be computed using the following formula:
x = )vp(
FC
=
CMUnit
Costs Fixed
Or Break-even point in dollars (S) = Ratio CM
Costs Fixed
EXAMPLE 4
109
Using the same data given in Example 3, where unit CM = $25 - $10 = $15 and CM ratio = 60%, we get:
Break-even point in units = $15,000/$15 = 1,000 units
Break-even point in dollars = 1,000 units X $25 = $25,000
Or, alternatively, $15,000/0.6 = $25,000
Graphical Approach
The graphical approach to obtaining the break-even point is based on the so-called break-even (B-E) chart as
shown in Figure 2. Sales revenue, variable costs, and fixed costs are plotted on the vertical axis while volume, x,
is plotted on the horizontal axis. The break-even point is the point where the total sales revenue line intersects
the total cost line. The chart can also effectively report profit potentials over a wide range of activity and
therefore be used as a tool for discussion and presentation.
The profit-volume (P-V) chart as shown in Figure 3, focuses directly on how profits vary with changes in volume.
Profits are plotted on the vertical axis while units of output are shown on the horizontal axis. The P-V chart
provides a quick condensed comparison of how alternatives on pricing, variable costs, or fixed costs may affect
net income as volume changes. The P-V chart can be easily constructed from the B-E chart. Note that the slope
of the chart is the unit CM.
Determination of Target Income Volume
Besides determining the break-even point, CVP analysis determines the sales required to attain a particular
income level or target net income.
As a specific dollar amount, the formula is:
Target income sales volume = CMUnit
IncomeTarget Costs Fixed
EXAMPLE 5
Using the same data given in Example 3, assume that Porter Toy Store wishes to attain a target income of
$15,000 before tax.
The target income volume would be:
($15,000 + $15,000) / ($25 - $10) = $30,000 / $15 = 2,000 Units
110
Impact of Income Taxes
If target income (expressed as a specific dollar amount) is given on an after-tax basis, an adjustment is necessary
before we use the previous formula. The reason is that the profit target is expressed in before-tax terms.
Therefore, the after-tax target income must be first converted to a before-tax target, as follows:
Before-tax target income = Rate)Tax (1
IncomeTarget tax -After
EXAMPLE 6
Assume in Example 3 that Porter Toy Store wants to achieve an after-tax income of $6,000. The tax rate is 40
percent. Then, the first step is:
)4.01(
000,6$
= $10,000
The second step is to plug this figure into our regular formula as follows:
Target income volume = ($15,000 + $10,000) / 15 = 1,667 Units
Margin of Safety
The margin of safety is a measure of difference between the actual sales and the break-even sales. It is the
amount by which sales revenue may drop before losses begin, and is expressed as a percentage of expected
sales:
Margin of Safety = Sales Expected
Sales)Breakeven Sales (Expected
The margin of safety is used as a measure of operating risk. The larger the ratio, the safer the situation since
there is less risk of reaching the break-even point.
EXAMPLE 7
Assume Porter Toy Store projects sales of $35,000 with a break-even sales level of $25,000. The projected
margin of safety is:
($35,000 - $25,000) / $35,000 = 28.57%
FIGURE 2
BREAK-EVEN CHART
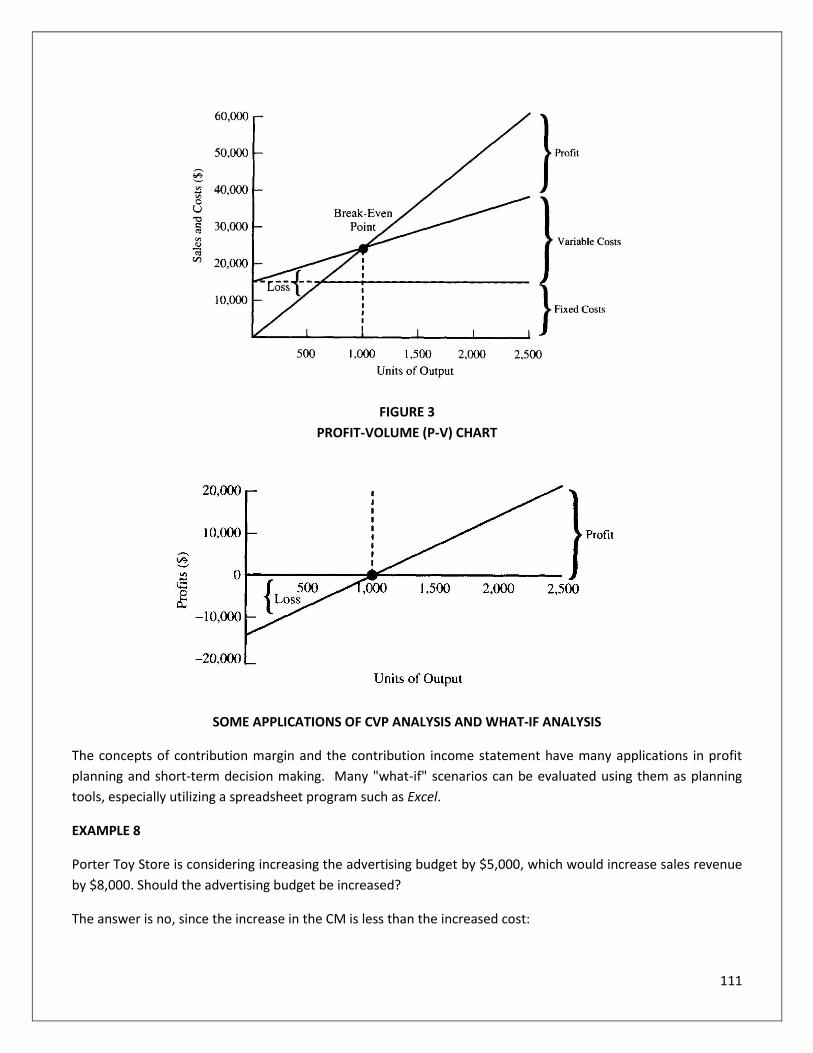
111
FIGURE 3
PROFIT-VOLUME (P-V) CHART
SOME APPLICATIONS OF CVP ANALYSIS AND WHAT-IF ANALYSIS
The concepts of contribution margin and the contribution income statement have many applications in profit
planning and short-term decision making. Many "what-if" scenarios can be evaluated using them as planning
tools, especially utilizing a spreadsheet program such as Excel.
EXAMPLE 8
Porter Toy Store is considering increasing the advertising budget by $5,000, which would increase sales revenue
by $8,000. Should the advertising budget be increased?
The answer is no, since the increase in the CM is less than the increased cost:
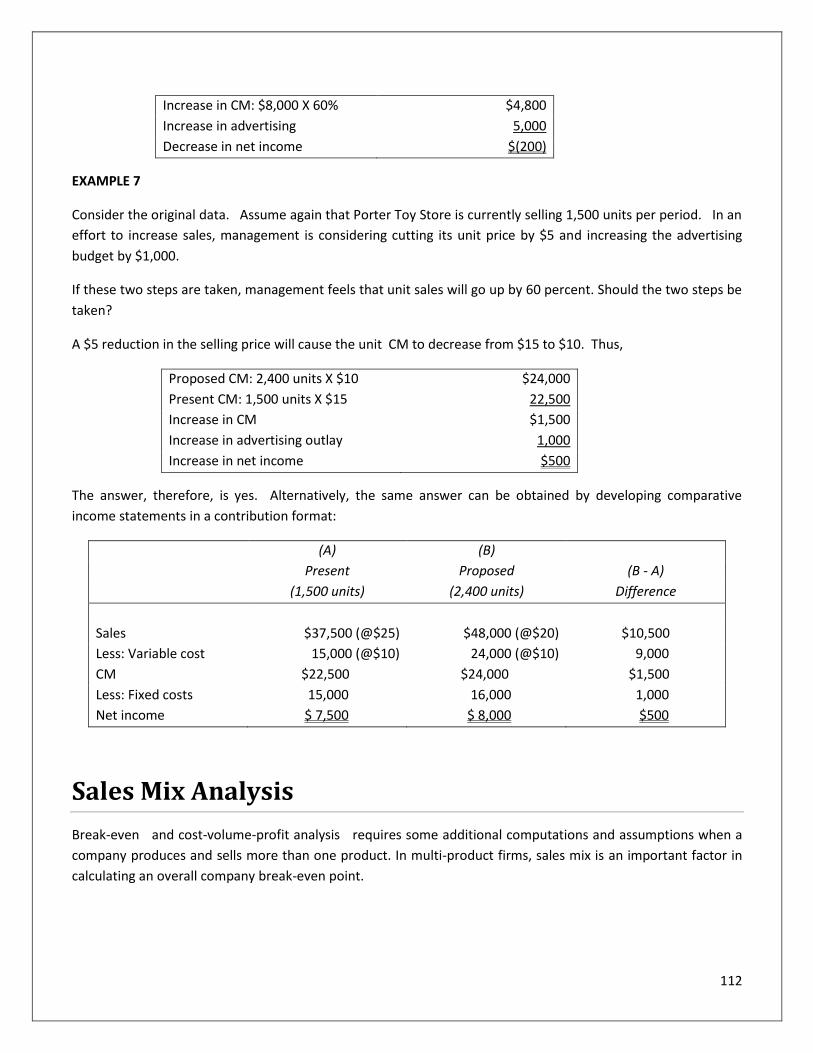
112
Increase in CM: $8,000 X 60% $4,800
Increase in advertising 5,000
Decrease in net income $(200)
EXAMPLE 7
Consider the original data. Assume again that Porter Toy Store is currently selling 1,500 units per period. In an
effort to increase sales, management is considering cutting its unit price by $5 and increasing the advertising
budget by $1,000.
If these two steps are taken, management feels that unit sales will go up by 60 percent. Should the two steps be
taken?
A $5 reduction in the selling price will cause the unit CM to decrease from $15 to $10. Thus,
Proposed CM: 2,400 units X $10 $24,000
Present CM: 1,500 units X $15 22,500
Increase in CM $1,500
Increase in advertising outlay 1,000
Increase in net income $500
The answer, therefore, is yes. Alternatively, the same answer can be obtained by developing comparative
income statements in a contribution format:
(A) (B)
Present Proposed (B - A)
(1,500 units) (2,400 units) Difference
Sales $37,500 (@$25) $48,000 (@$20) $10,500
Less: Variable cost 15,000 (@$10) 24,000 (@$10) 9,000
CM $22,500 $24,000 $1,500
Less: Fixed costs 15,000 16,000 1,000
Net income $ 7,500 $ 8,000 $500
Sales Mix Analysis
Break-even and cost-volume-profit analysis requires some additional computations and assumptions when a
company produces and sells more than one product. In multi-product firms, sales mix is an important factor in
calculating an overall company break-even point.
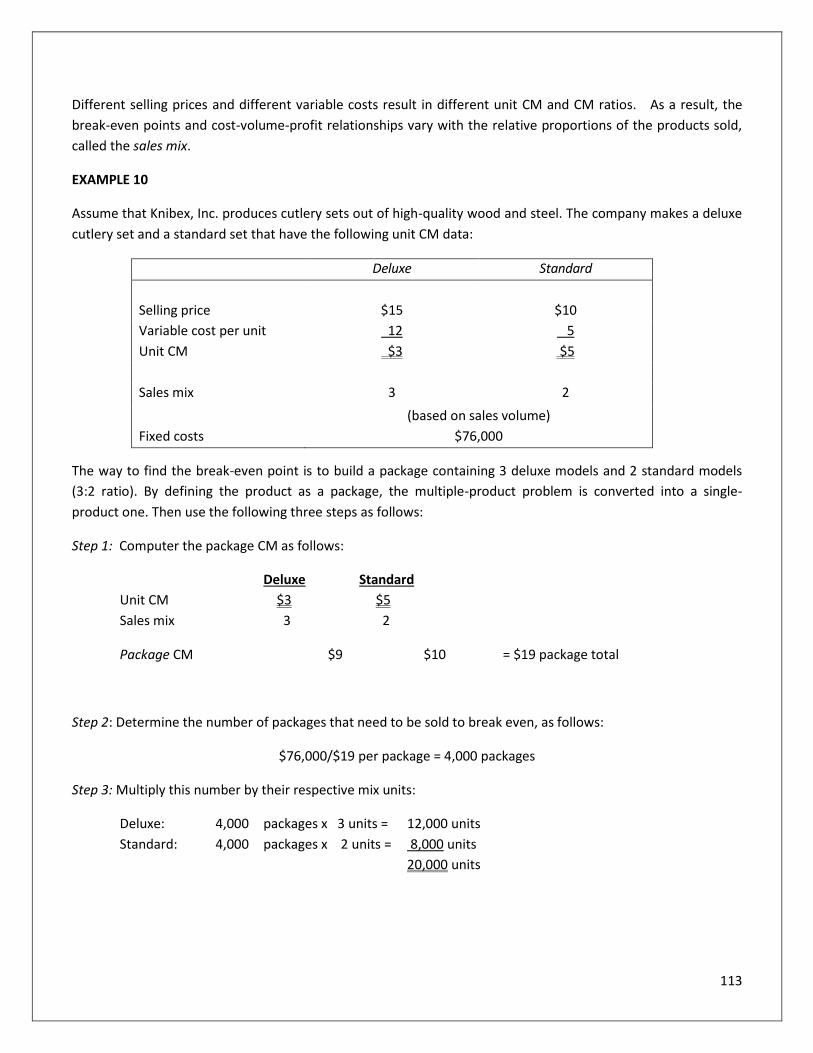
113
Different selling prices and different variable costs result in different unit CM and CM ratios. As a result, the
break-even points and cost-volume-profit relationships vary with the relative proportions of the products sold,
called the sales mix.
EXAMPLE 10
Assume that Knibex, Inc. produces cutlery sets out of high-quality wood and steel. The company makes a deluxe
cutlery set and a standard set that have the following unit CM data:
Deluxe Standard
Selling price $15 $10
Variable cost per unit 12 5
Unit CM $3 $5
Sales mix 3 2
(based on sales volume)
Fixed costs $76,000
The way to find the break-even point is to build a package containing 3 deluxe models and 2 standard models
(3:2 ratio). By defining the product as a package, the multiple-product problem is converted into a single-
product one. Then use the following three steps as follows:
Step 1: Computer the package CM as follows:
Deluxe Standard
Unit CM $3 $5
Sales mix 3 2
Package CM $9 $10 = $19 package total
Step 2: Determine the number of packages that need to be sold to break even, as follows:
$76,000/$19 per package = 4,000 packages
Step 3: Multiply this number by their respective mix units:
Deluxe: 4,000 packages x 3 units = 12,000 units
Standard: 4,000 packages x 2 units = 8,000 units
20,000 units
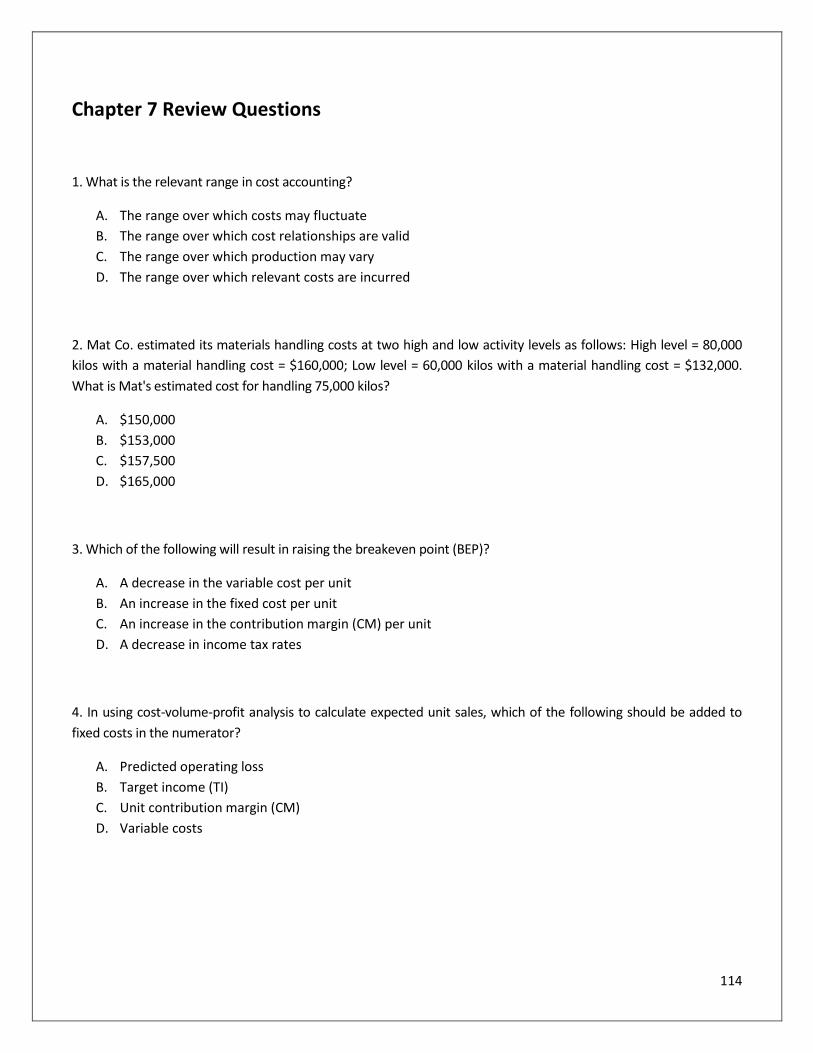
114
Chapter 7 Review Questions
1. What is the relevant range in cost accounting?
A. The range over which costs may fluctuate
B. The range over which cost relationships are valid
C. The range over which production may vary
D. The range over which relevant costs are incurred
2. Mat Co. estimated its materials handling costs at two high and low activity levels as follows: High level = 80,000
kilos with a material handling cost = $160,000; Low level = 60,000 kilos with a material handling cost = $132,000.
What is Mat's estimated cost for handling 75,000 kilos?
A. $150,000
B. $153,000
C. $157,500
D. $165,000
3. Which of the following will result in raising the breakeven point (BEP)?
A. A decrease in the variable cost per unit
B. An increase in the fixed cost per unit
C. An increase in the contribution margin (CM) per unit
D. A decrease in income tax rates
4. In using cost-volume-profit analysis to calculate expected unit sales, which of the following should be added to
fixed costs in the numerator?
A. Predicted operating loss
B. Target income (TI)
C. Unit contribution margin (CM)
D. Variable costs
115
Chapter 8: Budgeting and Standard Cost Systems
Learning Objectives:
After completing this section, you should be able to:
Identify the different budgets used in an organization and their purpose.
Recognize characteristics of a standard costing system and different cost variances.
A comprehensive (master) budget is a formal statement of management's expectation regarding sales,
expenses, volume, and other financial transactions of an organization for the coming period. Simply put, a
budget is a set of pro forma (projected or planned) financial statements. It consists basically of a pro forma
income statement, pro forma balance sheet and cash budget.
A budget is a tool for both planning and control. At the beginning of the period, the budget is a plan or standard;
at the end of the period it serves as a control device to help management measure its performance against the
plan so that future performance may be improved.
One of the most important phases of responsibility accounting (to be discussed in more detail in the following
chapter) is establishing standard costs and evaluating performance by comparing actual costs with the standard
costs. The difference between the actual costs and the standard costs is called the variance and is calculated for
individual cost centers. Variance analysis is a key tool for measuring performance of a cost center.
Types of Budgets
The budget is classified broadly into two categories:
1. Operating budget, reflecting the results of operating decisions.
2. Financial budget, reflecting the financial decisions of the firm.
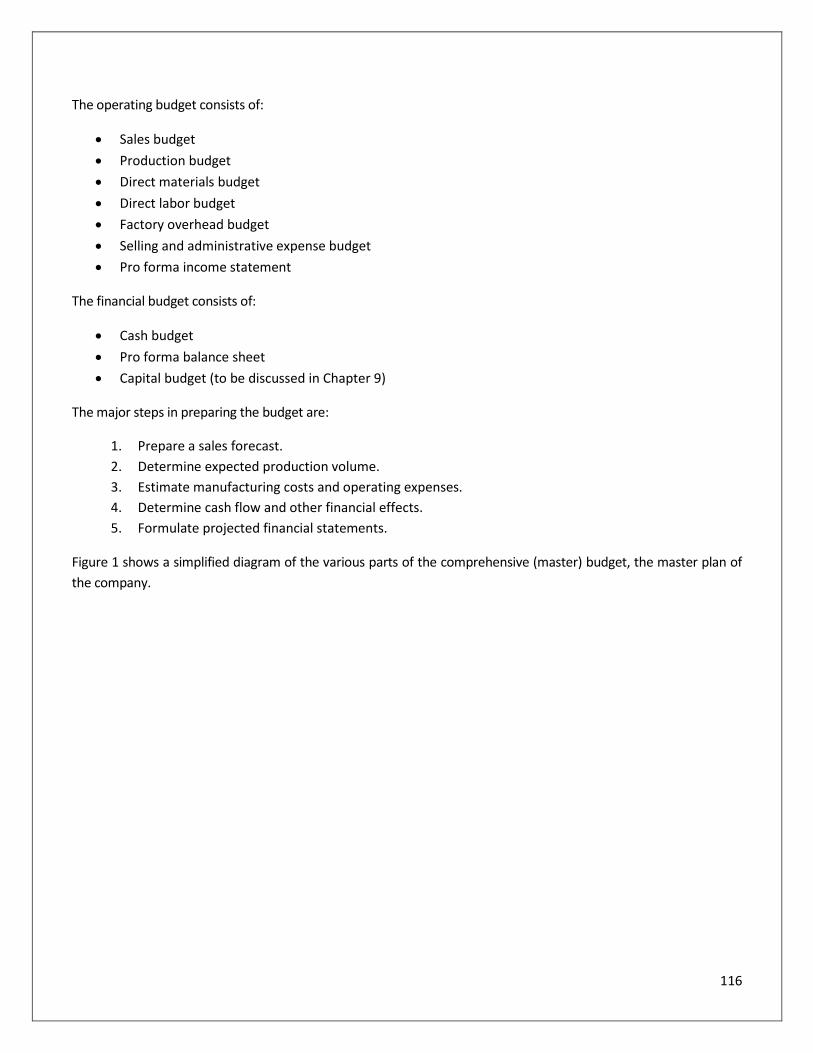
116
The operating budget consists of:
Sales budget
Production budget
Direct materials budget
Direct labor budget
Factory overhead budget
Selling and administrative expense budget
Pro forma income statement
The financial budget consists of:
Cash budget
Pro forma balance sheet
Capital budget (to be discussed in Chapter 9)
The major steps in preparing the budget are:
1. Prepare a sales forecast.
2. Determine expected production volume.
3. Estimate manufacturing costs and operating expenses.
4. Determine cash flow and other financial effects.
5. Formulate projected financial statements.
Figure 1 shows a simplified diagram of the various parts of the comprehensive (master) budget, the master plan of
the company.
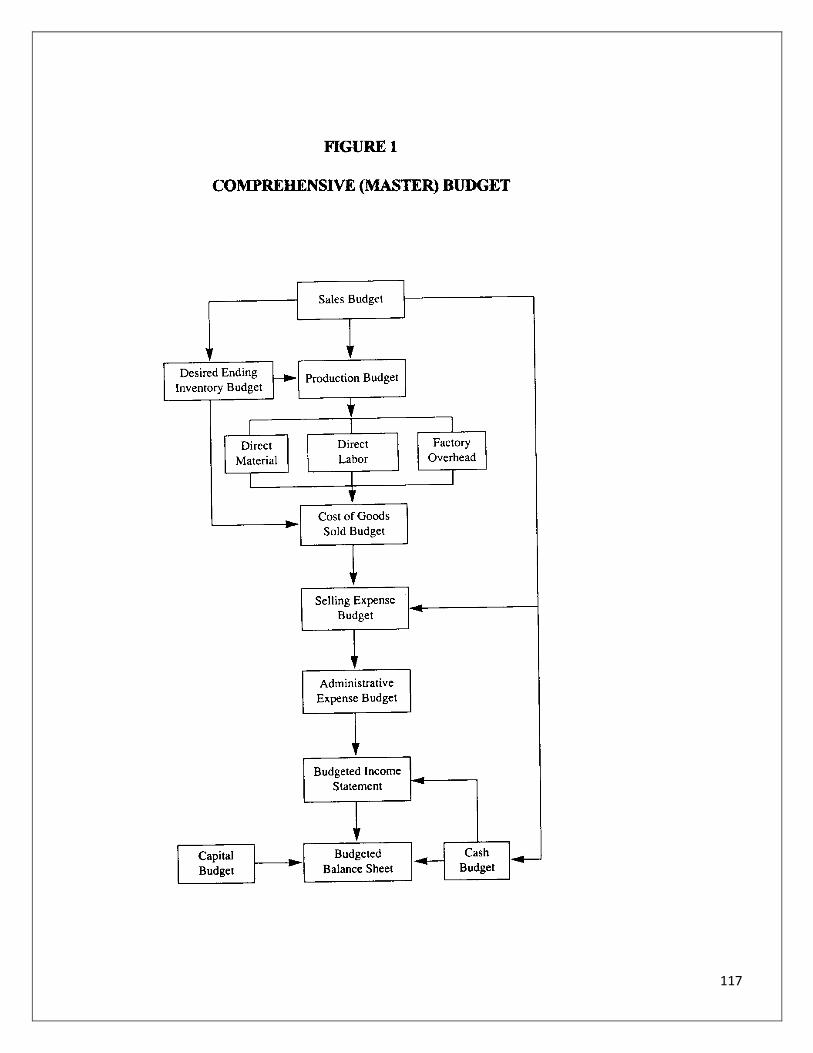
117
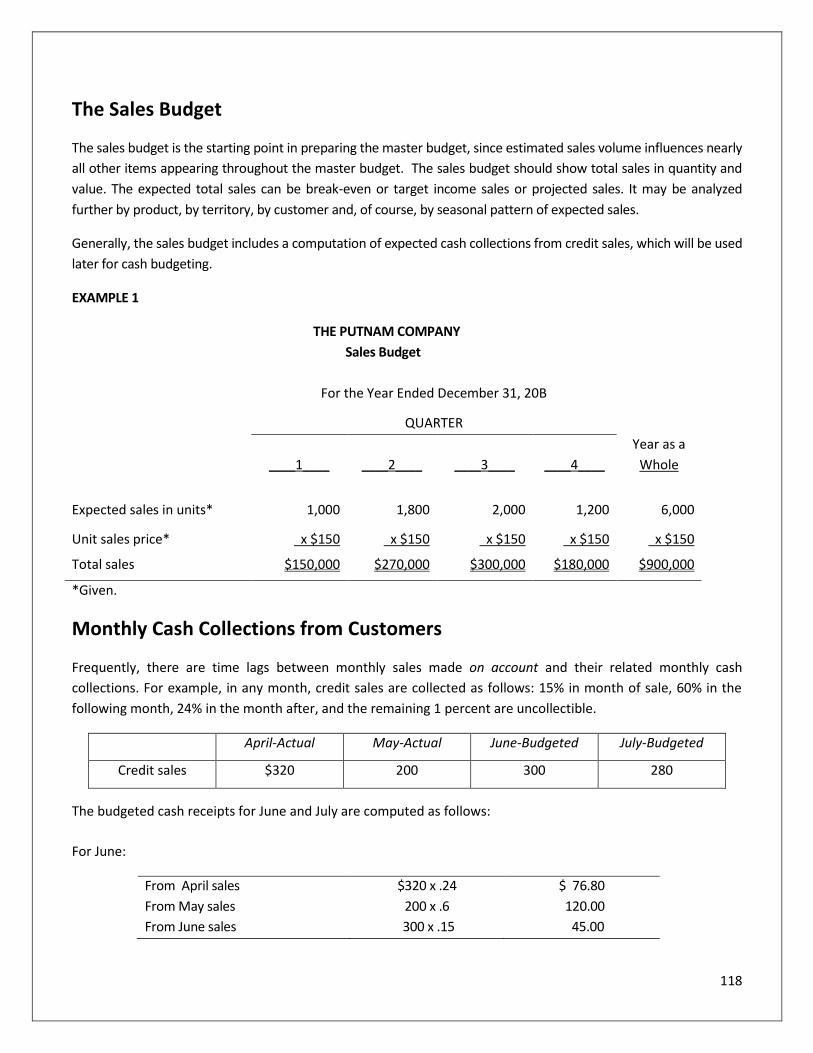
118
The Sales Budget
The sales budget is the starting point in preparing the master budget, since estimated sales volume influences nearly
all other items appearing throughout the master budget. The sales budget should show total sales in quantity and
value. The expected total sales can be break-even or target income sales or projected sales. It may be analyzed
further by product, by territory, by customer and, of course, by seasonal pattern of expected sales.
Generally, the sales budget includes a computation of expected cash collections from credit sales, which will be used
later for cash budgeting.
EXAMPLE 1
THE PUTNAM COMPANY
Sales Budget
For the Year Ended December 31, 20B
QUARTER
____1____ ____2____ ____3____ ____4____
Year as a
Whole
Expected sales in units* 1,000 1,800 2,000 1,200 6,000
Unit sales price* x $150 x $150 x $150 x $150 x $150
Total sales $150,000 $270,000 $300,000 $180,000 $900,000
*Given.
Monthly Cash Collections from Customers
Frequently, there are time lags between monthly sales made on account and their related monthly cash
collections. For example, in any month, credit sales are collected as follows: 15% in month of sale, 60% in the
following month, 24% in the month after, and the remaining 1 percent are uncollectible.
April-Actual May-Actual June-Budgeted July-Budgeted
Credit sales $320 200 300 280
The budgeted cash receipts for June and July are computed as follows:
For June:
From April sales $320 x .24 $ 76.80
From May sales 200 x .6 120.00
From June sales 300 x .15 45.00
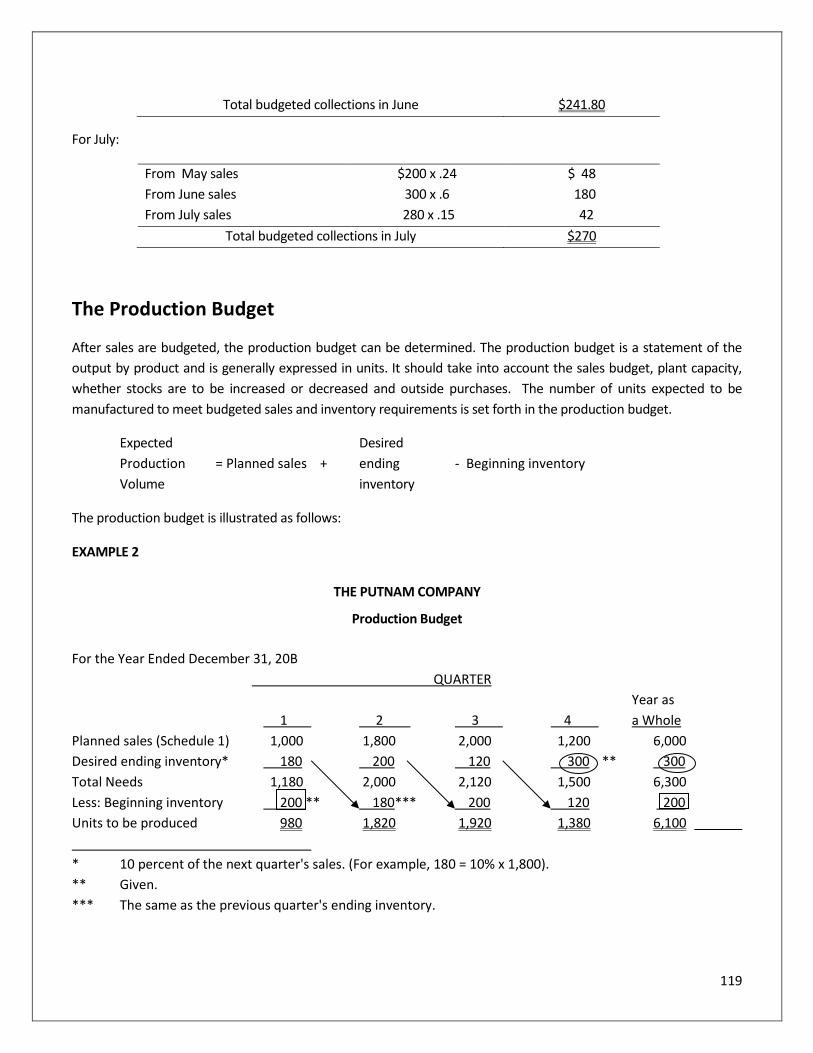
119
Total budgeted collections in June $241.80
For July:
From May sales $200 x .24 $ 48
From June sales 300 x .6 180
From July sales 280 x .15 42
Total budgeted collections in July $270
The Production Budget
After sales are budgeted, the production budget can be determined. The production budget is a statement of the
output by product and is generally expressed in units. It should take into account the sales budget, plant capacity,
whether stocks are to be increased or decreased and outside purchases. The number of units expected to be
manufactured to meet budgeted sales and inventory requirements is set forth in the production budget.
Expected Desired
Production = Planned sales + ending - Beginning inventory
Volume inventory
The production budget is illustrated as follows:
EXAMPLE 2
THE PUTNAM COMPANY
Production Budget
For the Year Ended December 31, 20B
QUARTER
Year as
1 2 3 4 a Whole
Planned sales (Schedule 1) 1,000 1,800 2,000 1,200 6,000
Desired ending inventory* 180 200 120 300 ** 300
Total Needs 1,180 2,000 2,120 1,500 6,300
Less: Beginning inventory 200 ** 180*** 200 120 200
Units to be produced 980 1,820 1,920 1,380 6,100
* 10 percent of the next quarter's sales. (For example, 180 = 10% x 1,800).
** Given.
*** The same as the previous quarter's ending inventory.
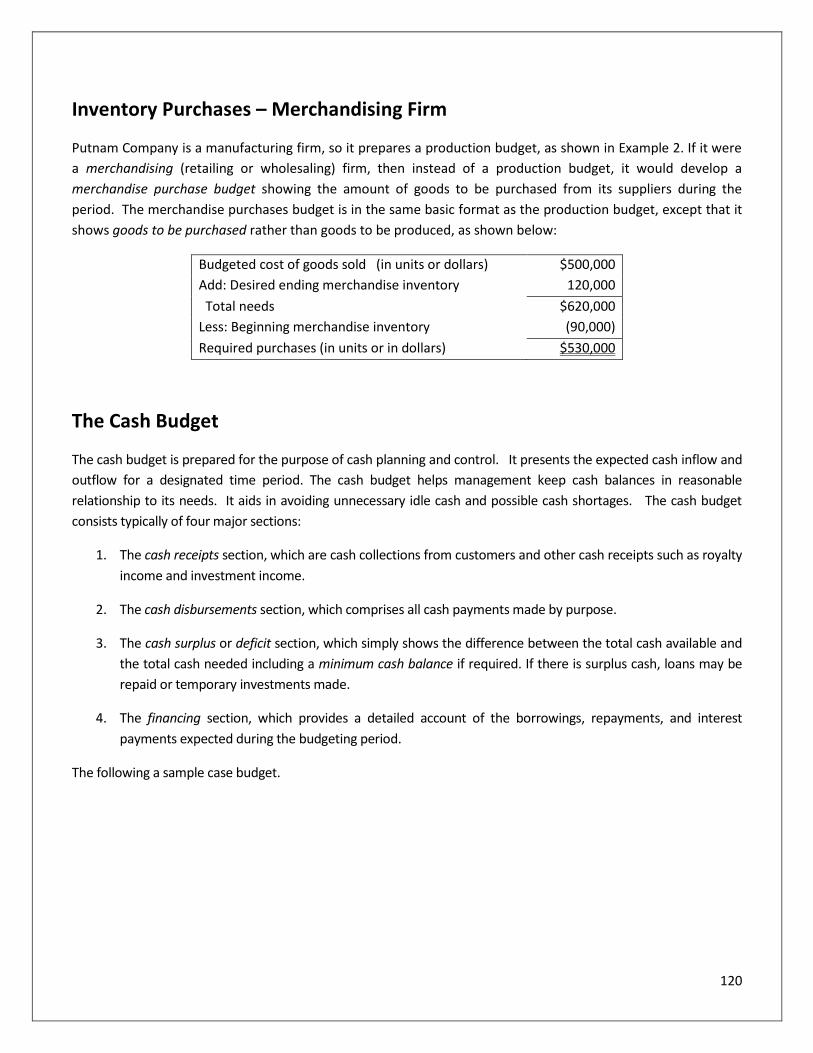
120
Inventory Purchases – Merchandising Firm
Putnam Company is a manufacturing firm, so it prepares a production budget, as shown in Example 2. If it were
a merchandising (retailing or wholesaling) firm, then instead of a production budget, it would develop a
merchandise purchase budget showing the amount of goods to be purchased from its suppliers during the
period. The merchandise purchases budget is in the same basic format as the production budget, except that it
shows goods to be purchased rather than goods to be produced, as shown below:
Budgeted cost of goods sold (in units or dollars) $500,000
Add: Desired ending merchandise inventory 120,000
Total needs $620,000
Less: Beginning merchandise inventory (90,000)
Required purchases (in units or in dollars) $530,000
The Cash Budget
The cash budget is prepared for the purpose of cash planning and control. It presents the expected cash inflow and
outflow for a designated time period. The cash budget helps management keep cash balances in reasonable
relationship to its needs. It aids in avoiding unnecessary idle cash and possible cash shortages. The cash budget
consists typically of four major sections:
1. The cash receipts section, which are cash collections from customers and other cash receipts such as royalty
income and investment income.
2. The cash disbursements section, which comprises all cash payments made by purpose.
3. The cash surplus or deficit section, which simply shows the difference between the total cash available and
the total cash needed including a minimum cash balance if required. If there is surplus cash, loans may be
repaid or temporary investments made.
4. The financing section, which provides a detailed account of the borrowings, repayments, and interest
payments expected during the budgeting period.
The following a sample case budget.
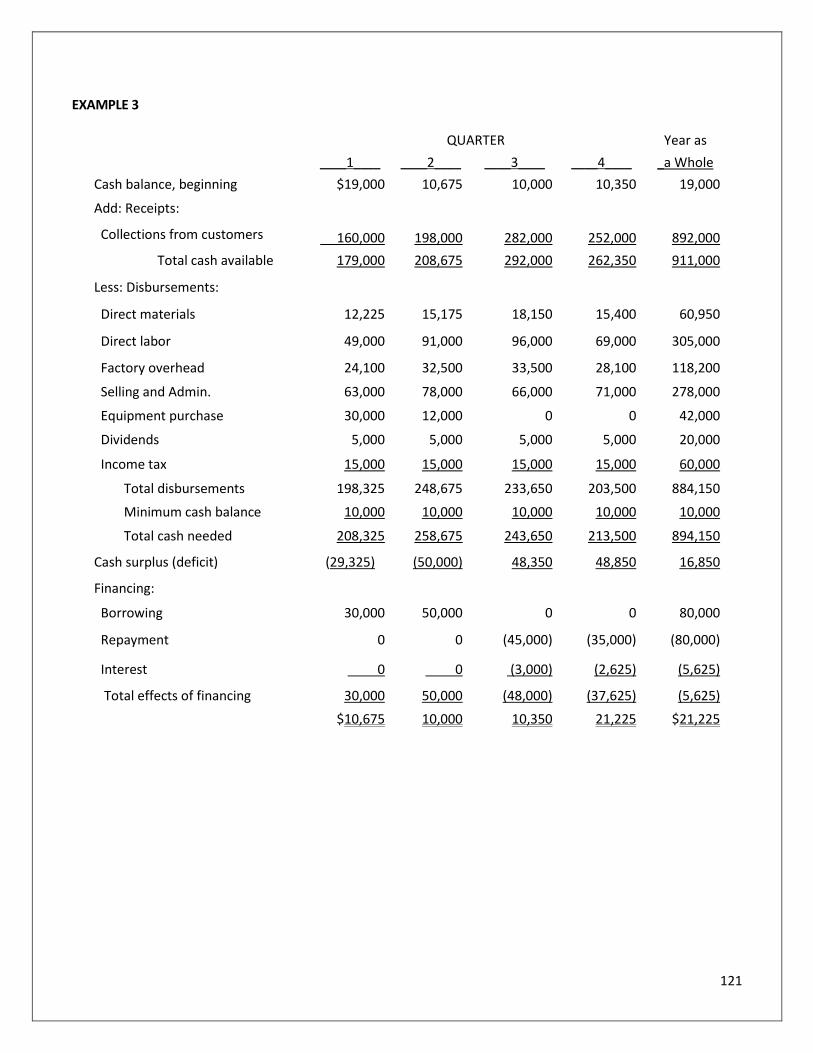
121
EXAMPLE 3
QUARTER Year as
____1____ ____2____ ____3____ ____4____ _a Whole
Cash balance, beginning $19,000 10,675 10,000 10,350 19,000
Add: Receipts:
Collections from customers 160,000 198,000 282,000 252,000 892,000
Total cash available 179,000 208,675 292,000 262,350 911,000
Less: Disbursements:
Direct materials 12,225 15,175 18,150 15,400 60,950
Direct labor 49,000 91,000 96,000 69,000 305,000
Factory overhead 24,100 32,500 33,500 28,100 118,200
Selling and Admin. 63,000 78,000 66,000 71,000 278,000
Equipment purchase 30,000 12,000 0 0 42,000
Dividends 5,000 5,000 5,000 5,000 20,000
Income tax 15,000 15,000 15,000 15,000 60,000
Total disbursements 198,325 248,675 233,650 203,500 884,150
Minimum cash balance 10,000 10,000 10,000 10,000 10,000
Total cash needed 208,325 258,675 243,650 213,500 894,150
Cash surplus (deficit) (29,325) (50,000) 48,350 48,850 16,850
Financing:
Borrowing 30,000 50,000 0 0 80,000
Repayment 0 0 (45,000) (35,000) (80,000)
Interest 0 0 (3,000) (2,625) (5,625)
Total effects of financing 30,000 50,000 (48,000) (37,625) (5,625)
$10,675 10,000 10,350 21,225 $21,225
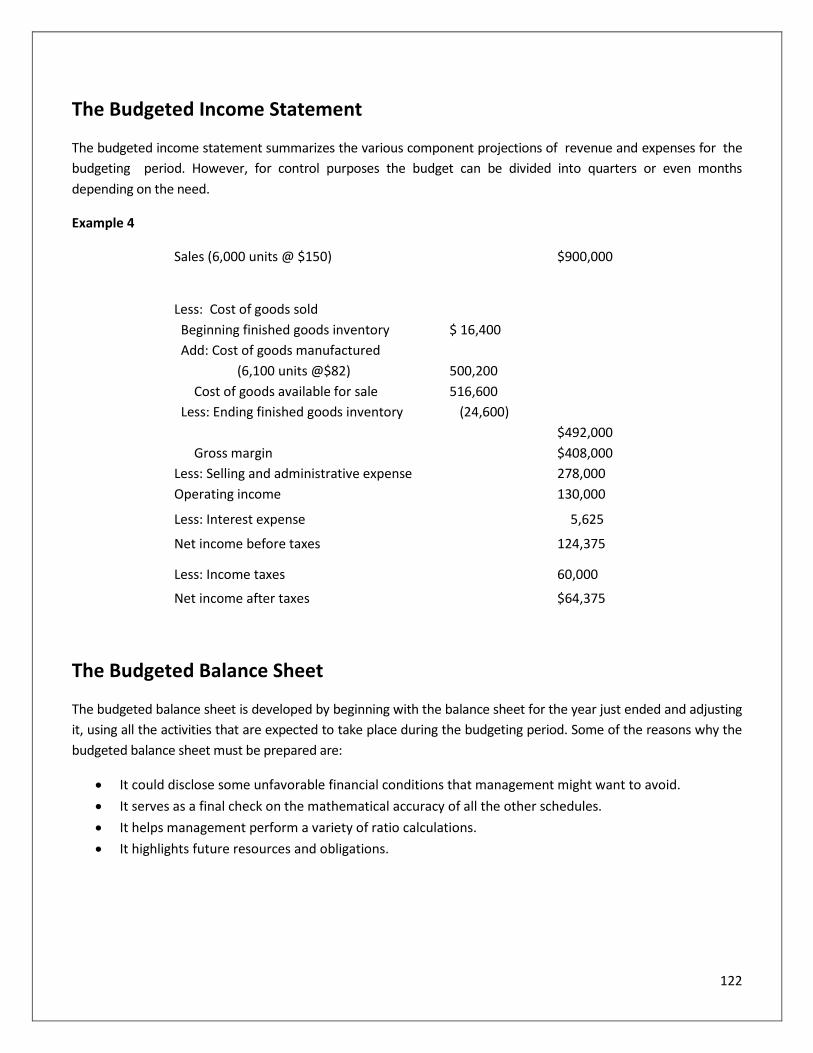
122
The Budgeted Income Statement
The budgeted income statement summarizes the various component projections of revenue and expenses for the
budgeting period. However, for control purposes the budget can be divided into quarters or even months
depending on the need.
Example 4
Sales (6,000 units @ $150) $900,000
Less: Cost of goods sold
Beginning finished goods inventory $ 16,400
Add: Cost of goods manufactured
(6,100 units @$82) 500,200
Cost of goods available for sale 516,600
Less: Ending finished goods inventory (24,600)
$492,000
Gross margin $408,000
Less: Selling and administrative expense 278,000
Operating income 130,000
Less: Interest expense 5,625
Net income before taxes 124,375
Less: Income taxes 60,000
Net income after taxes $64,375
The Budgeted Balance Sheet
The budgeted balance sheet is developed by beginning with the balance sheet for the year just ended and adjusting
it, using all the activities that are expected to take place during the budgeting period. Some of the reasons why the
budgeted balance sheet must be prepared are:
It could disclose some unfavorable financial conditions that management might want to avoid.
It serves as a final check on the mathematical accuracy of all the other schedules.
It helps management perform a variety of ratio calculations.
It highlights future resources and obligations.
123
Financial Modeling:
Computer-Based and Spreadsheet Models for Budgeting
More and more companies are developing computer-based models for financial planning and budgeting, using
powerful, yet easy-to-use, financial modeling languages such as Up Your Cash Flow. The models help not only build a
budget for profit planning but answer a variety of “what-if” scenarios. The resultant calculations provide a basis for
choice among alternatives under conditions of uncertainty. Furthermore, budget modeling can also be
accomplished using spreadsheet programs such as Microsoft’s Excel.
Standard Costs and Variance Analysis
A standard cost system differentiates the expected cost from the actual cost, thus identifying deviations
from expected (attainable) results on a routine basis. One of the purposes of standard costs is to simplify
costing procedures and expedite cost reports. Standard costs are costs that are established in advance to
serve as targets to be met and after the fact, to determine how well those targets were actually met. The
standard cost is based on physical and dollar measures: it is determined by multiplying the standard
quantity of an input by its standard price.
The difference between the actual costs and the standard costs, called the variance, is calculated for
individual cost centers. Variance analysis is a key tool for measuring performance of a cost center.
The performance reports based on the analysis of variances must be prepared for each cost center,
addressing the following questions:
1. Is it favorable (F) or unfavorable (U)?
2. If it is unfavorable, is it significant enough for further investigation? For example, a 5% over the
standard is a redflag. The decision to investigate is based on the company’s policy in terms of the
standard plus or minus an allowable control limit. Current practice sets the control limits subjectively,
based on judgment and past experience rather than any formal identification of limits. About 45 to 47
percent of the firms surveyed used dollar or percentage control limits.
3. If it is significant, is it controllable? For example, it may be due to a strike on the part of the supplier. A
material shortage and the ensuing price hike may not be within the control of the production manager.
4. If it is controllable, then who is responsible for what portion of the total variance?
5. What are the causes for an unfavorable variance?
6. What is the remedial action to take?
The whole purpose of variance analysis is to determine what happened, what the causes are, and make
sure the same thing does not happen again. The report is useful in two ways: (1) in focusing attention on
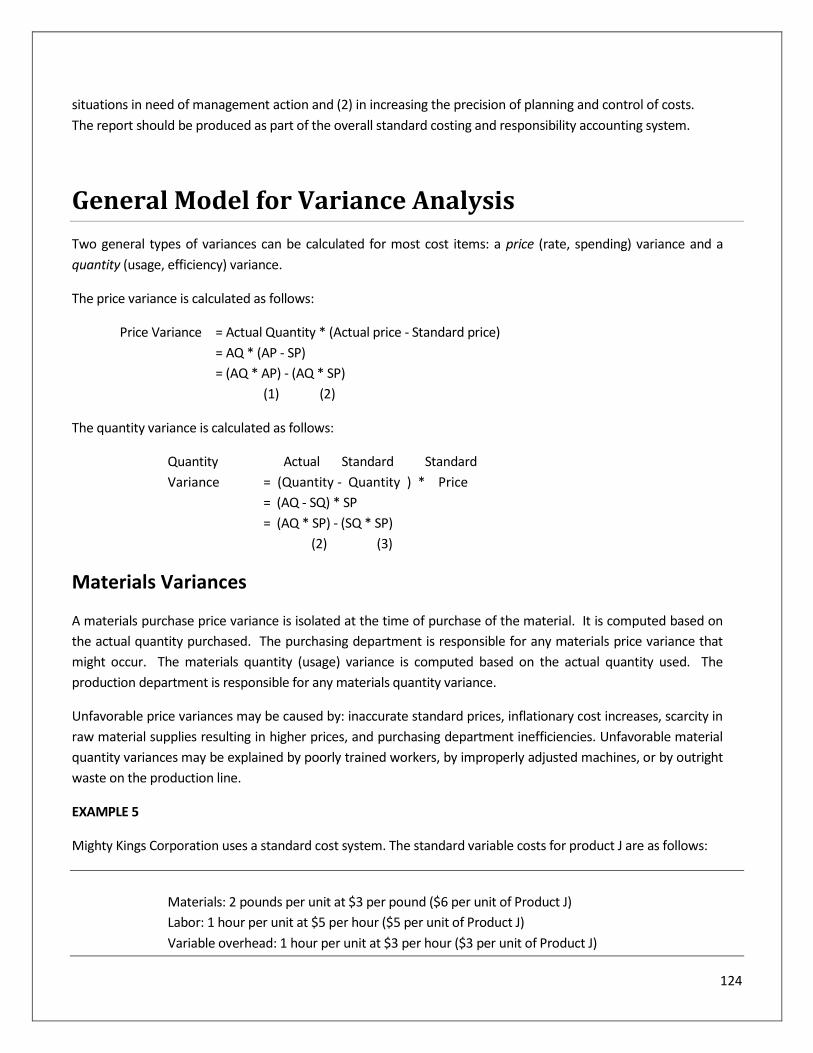
124
situations in need of management action and (2) in increasing the precision of planning and control of costs.
The report should be produced as part of the overall standard costing and responsibility accounting system.
General Model for Variance Analysis
Two general types of variances can be calculated for most cost items: a price (rate, spending) variance and a
quantity (usage, efficiency) variance.
The price variance is calculated as follows:
Price Variance = Actual Quantity * (Actual price - Standard price)
= AQ * (AP - SP)
= (AQ * AP) - (AQ * SP)
(1) (2)
The quantity variance is calculated as follows:
Quantity Actual Standard Standard
Variance = (Quantity - Quantity ) * Price
= (AQ - SQ) * SP
= (AQ * SP) - (SQ * SP)
(2) (3)
Materials Variances
A materials purchase price variance is isolated at the time of purchase of the material. It is computed based on
the actual quantity purchased. The purchasing department is responsible for any materials price variance that
might occur. The materials quantity (usage) variance is computed based on the actual quantity used. The
production department is responsible for any materials quantity variance.
Unfavorable price variances may be caused by: inaccurate standard prices, inflationary cost increases, scarcity in
raw material supplies resulting in higher prices, and purchasing department inefficiencies. Unfavorable material
quantity variances may be explained by poorly trained workers, by improperly adjusted machines, or by outright
waste on the production line.
EXAMPLE 5
Mighty Kings Corporation uses a standard cost system. The standard variable costs for product J are as follows:
Materials: 2 pounds per unit at $3 per pound ($6 per unit of Product J)
Labor: 1 hour per unit at $5 per hour ($5 per unit of Product J)
Variable overhead: 1 hour per unit at $3 per hour ($3 per unit of Product J)
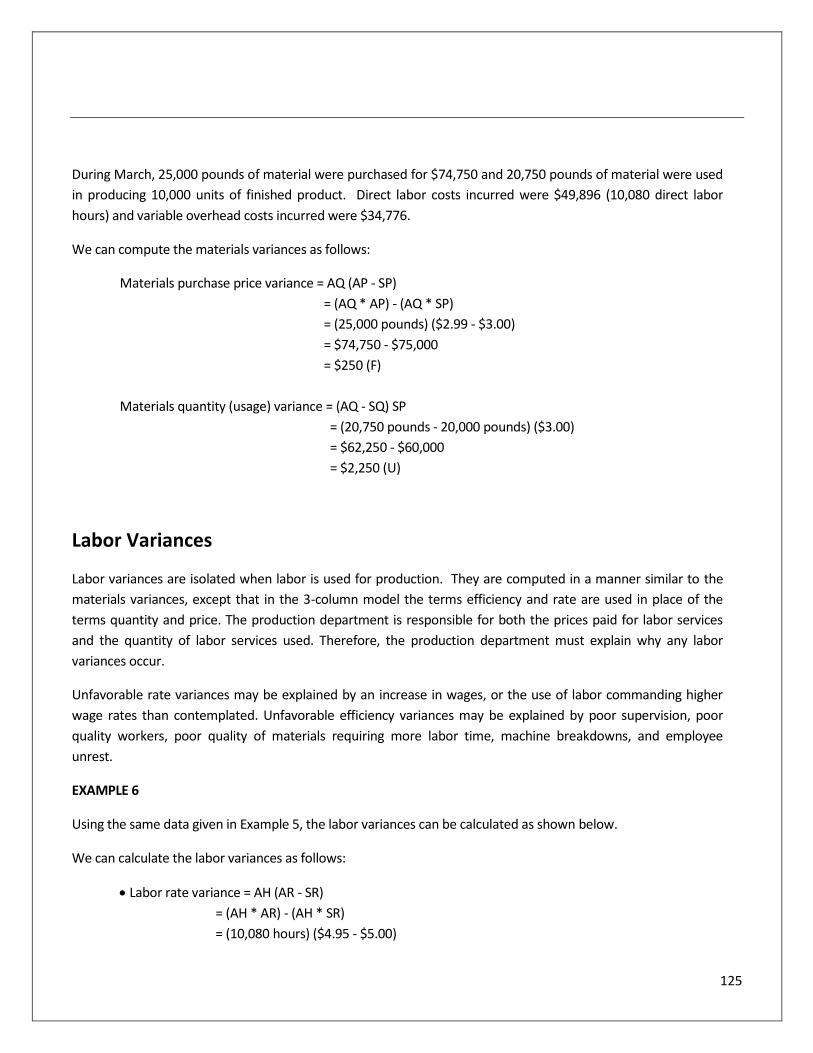
125
During March, 25,000 pounds of material were purchased for $74,750 and 20,750 pounds of material were used
in producing 10,000 units of finished product. Direct labor costs incurred were $49,896 (10,080 direct labor
hours) and variable overhead costs incurred were $34,776.
We can compute the materials variances as follows:
Materials purchase price variance = AQ (AP - SP)
= (AQ * AP) - (AQ * SP)
= (25,000 pounds) ($2.99 - $3.00)
= $74,750 - $75,000
= $250 (F)
Materials quantity (usage) variance = (AQ - SQ) SP
= (20,750 pounds - 20,000 pounds) ($3.00)
= $62,250 - $60,000
= $2,250 (U)
Labor Variances
Labor variances are isolated when labor is used for production. They are computed in a manner similar to the
materials variances, except that in the 3-column model the terms efficiency and rate are used in place of the
terms quantity and price. The production department is responsible for both the prices paid for labor services
and the quantity of labor services used. Therefore, the production department must explain why any labor
variances occur.
Unfavorable rate variances may be explained by an increase in wages, or the use of labor commanding higher
wage rates than contemplated. Unfavorable efficiency variances may be explained by poor supervision, poor
quality workers, poor quality of materials requiring more labor time, machine breakdowns, and employee
unrest.
EXAMPLE 6
Using the same data given in Example 5, the labor variances can be calculated as shown below.
We can calculate the labor variances as follows:
Labor rate variance = AH (AR - SR)
= (AH * AR) - (AH * SR)
= (10,080 hours) ($4.95 - $5.00)
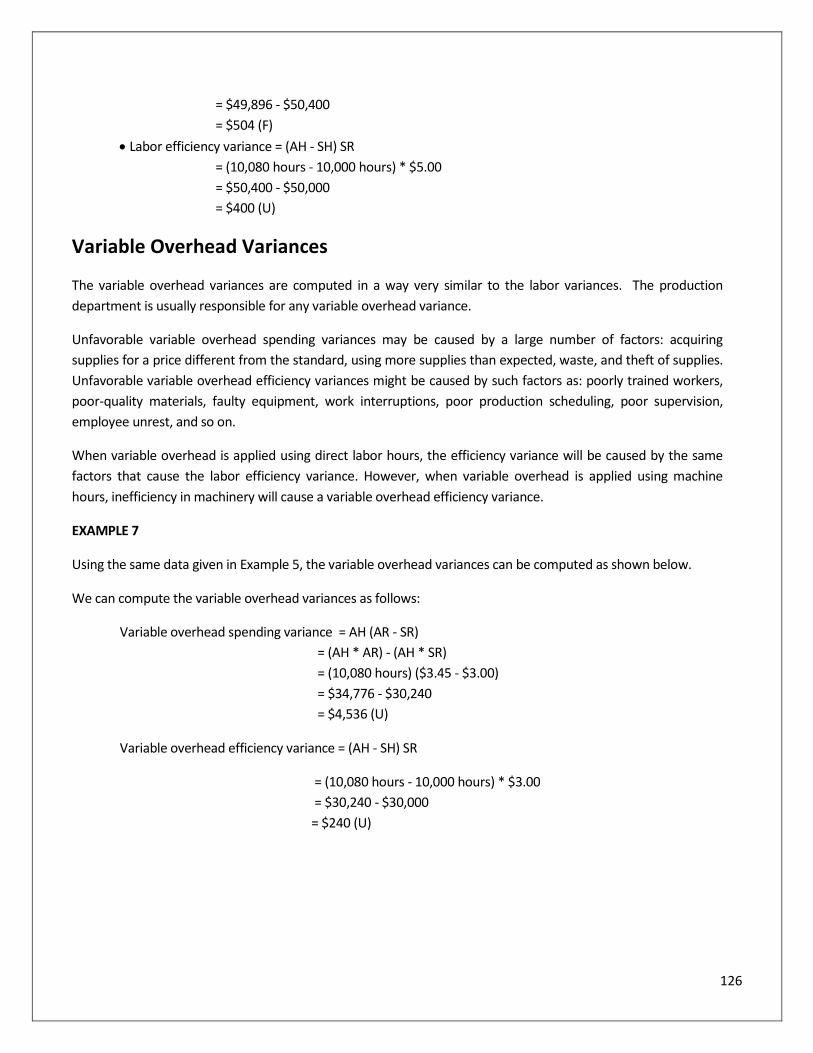
126
= $49,896 - $50,400
= $504 (F)
Labor efficiency variance = (AH - SH) SR
= (10,080 hours - 10,000 hours) * $5.00
= $50,400 - $50,000
= $400 (U)
Variable Overhead Variances
The variable overhead variances are computed in a way very similar to the labor variances. The production
department is usually responsible for any variable overhead variance.
Unfavorable variable overhead spending variances may be caused by a large number of factors: acquiring
supplies for a price different from the standard, using more supplies than expected, waste, and theft of supplies.
Unfavorable variable overhead efficiency variances might be caused by such factors as: poorly trained workers,
poor-quality materials, faulty equipment, work interruptions, poor production scheduling, poor supervision,
employee unrest, and so on.
When variable overhead is applied using direct labor hours, the efficiency variance will be caused by the same
factors that cause the labor efficiency variance. However, when variable overhead is applied using machine
hours, inefficiency in machinery will cause a variable overhead efficiency variance.
EXAMPLE 7
Using the same data given in Example 5, the variable overhead variances can be computed as shown below.
We can compute the variable overhead variances as follows:
Variable overhead spending variance = AH (AR - SR)
= (AH * AR) - (AH * SR)
= (10,080 hours) ($3.45 - $3.00)
= $34,776 - $30,240
= $4,536 (U)
Variable overhead efficiency variance = (AH - SH) SR
= (10,080 hours - 10,000 hours) * $3.00
= $30,240 - $30,000
= $240 (U)
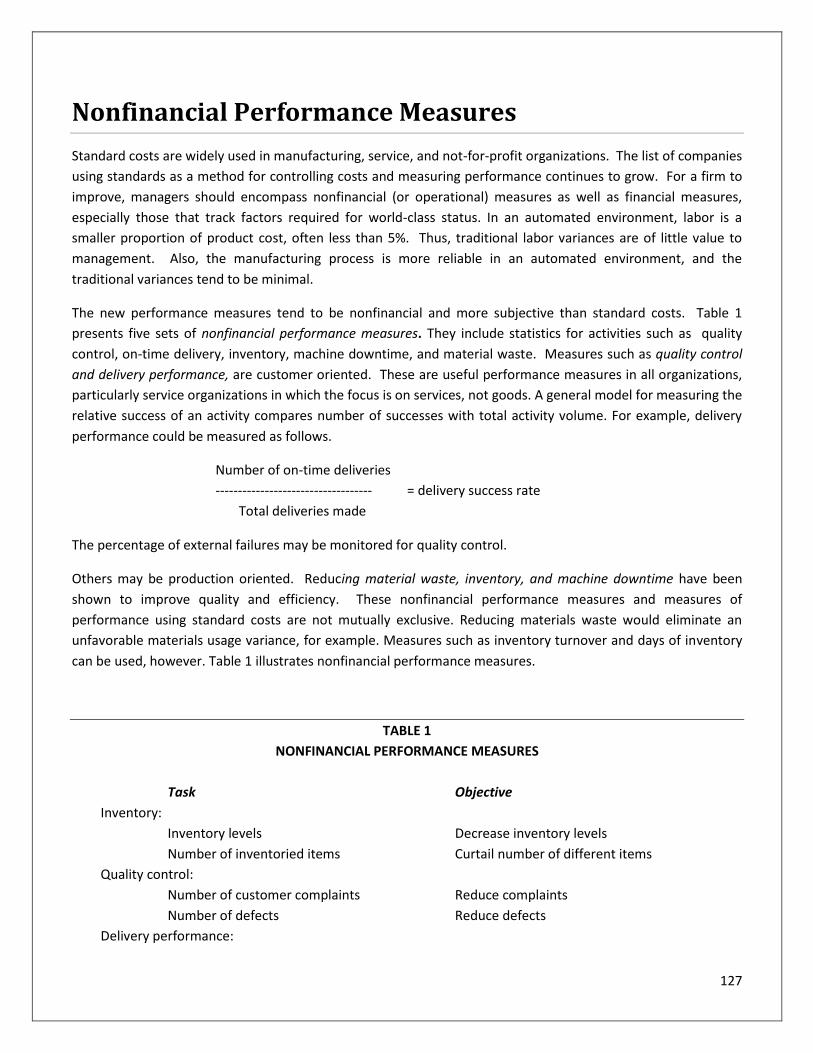
127
Nonfinancial Performance Measures
Standard costs are widely used in manufacturing, service, and not-for-profit organizations. The list of companies
using standards as a method for controlling costs and measuring performance continues to grow. For a firm to
improve, managers should encompass nonfinancial (or operational) measures as well as financial measures,
especially those that track factors required for world-class status. In an automated environment, labor is a
smaller proportion of product cost, often less than 5%. Thus, traditional labor variances are of little value to
management. Also, the manufacturing process is more reliable in an automated environment, and the
traditional variances tend to be minimal.
The new performance measures tend to be nonfinancial and more subjective than standard costs. Table 1
presents five sets of nonfinancial performance measures. They include statistics for activities such as quality
control, on-time delivery, inventory, machine downtime, and material waste. Measures such as quality control
and delivery performance, are customer oriented. These are useful performance measures in all organizations,
particularly service organizations in which the focus is on services, not goods. A general model for measuring the
relative success of an activity compares number of successes with total activity volume. For example, delivery
performance could be measured as follows.
Number of on-time deliveries
----------------------------------- = delivery success rate
Total deliveries made
The percentage of external failures may be monitored for quality control.
Others may be production oriented. Reducing material waste, inventory, and machine downtime have been
shown to improve quality and efficiency. These nonfinancial performance measures and measures of
performance using standard costs are not mutually exclusive. Reducing materials waste would eliminate an
unfavorable materials usage variance, for example. Measures such as inventory turnover and days of inventory
can be used, however. Table 1 illustrates nonfinancial performance measures.
TABLE 1
NONFINANCIAL PERFORMANCE MEASURES
Task Objective
Inventory:
Inventory levels Decrease inventory levels
Number of inventoried items Curtail number of different items
Quality control:
Number of customer complaints Reduce complaints
Number of defects Reduce defects
Delivery performance:
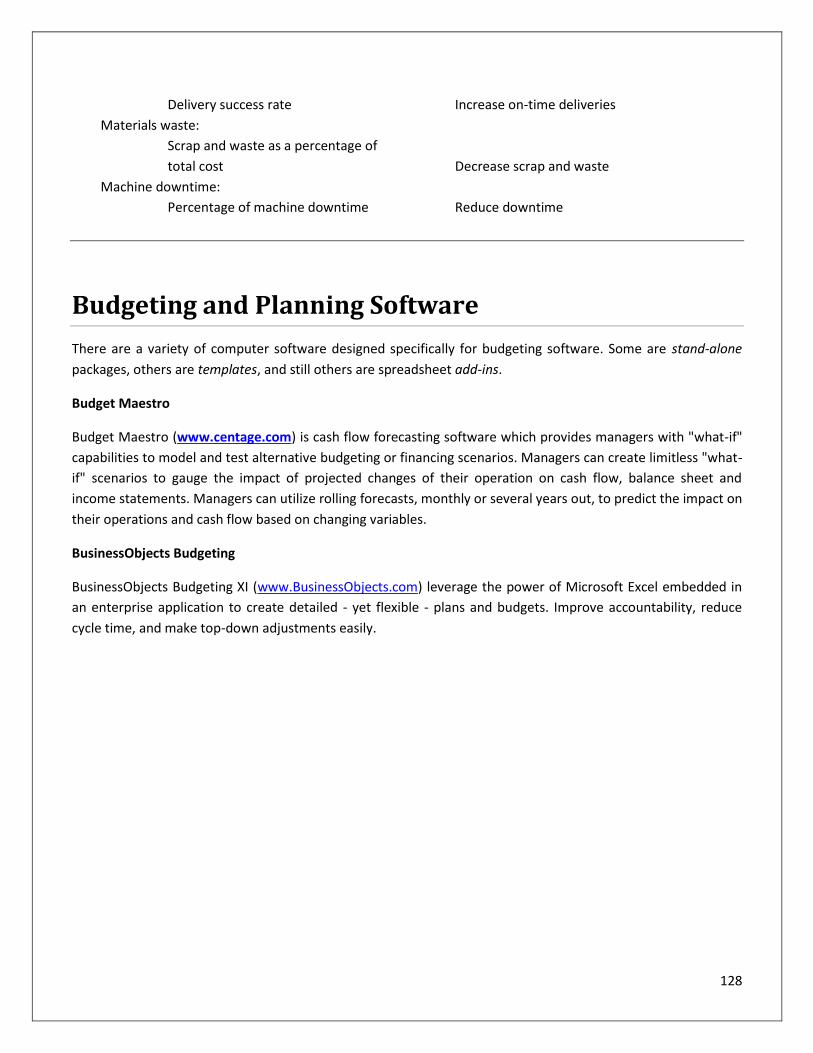
128
Delivery success rate Increase on-time deliveries
Materials waste:
Scrap and waste as a percentage of
total cost Decrease scrap and waste
Machine downtime:
Percentage of machine downtime Reduce downtime
Budgeting and Planning Software
There are a variety of computer software designed specifically for budgeting software. Some are stand-alone
packages, others are templates, and still others are spreadsheet add-ins.
Budget Maestro
Budget Maestro (www.centage.com) is cash flow forecasting software which provides managers with "what-if"
capabilities to model and test alternative budgeting or financing scenarios. Managers can create limitless "what-
if" scenarios to gauge the impact of projected changes of their operation on cash flow, balance sheet and
income statements. Managers can utilize rolling forecasts, monthly or several years out, to predict the impact on
their operations and cash flow based on changing variables.
BusinessObjects Budgeting
BusinessObjects Budgeting XI (www.BusinessObjects.com) leverage the power of Microsoft Excel embedded in
an enterprise application to create detailed - yet flexible - plans and budgets. Improve accountability, reduce
cycle time, and make top-down adjustments easily.
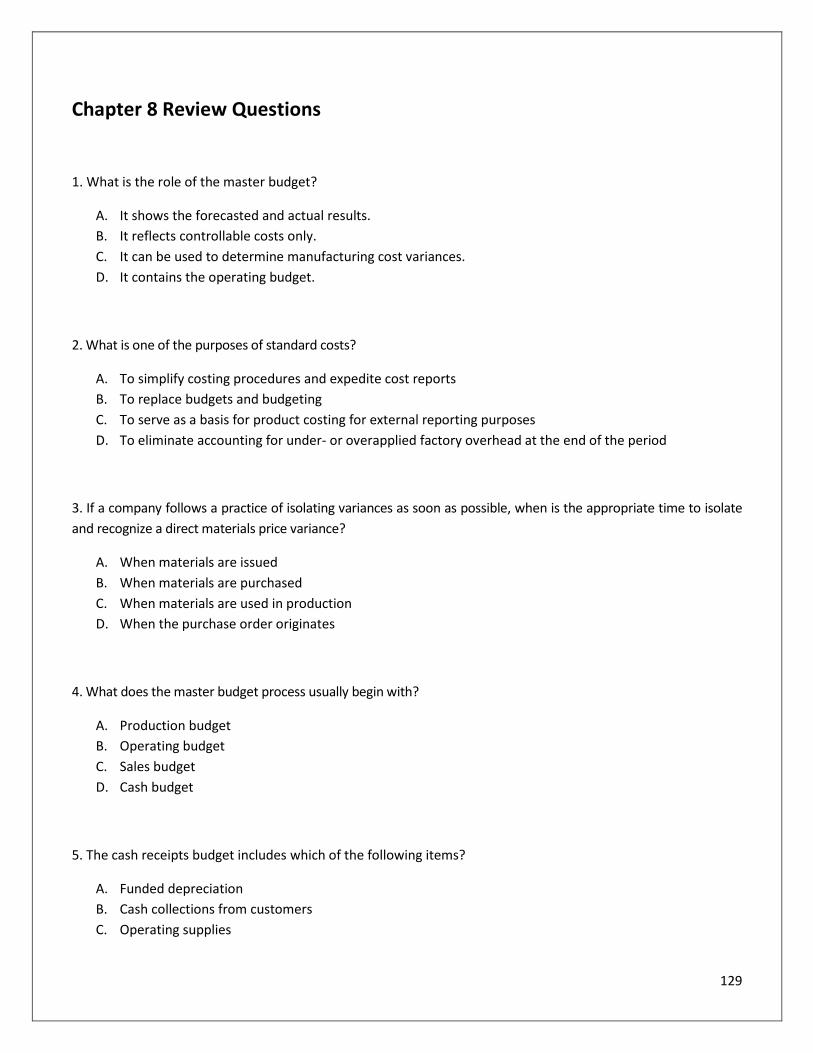
129
Chapter 8 Review Questions
1. What is the role of the master budget?
A. It shows the forecasted and actual results.
B. It reflects controllable costs only.
C. It can be used to determine manufacturing cost variances.
D. It contains the operating budget.
2. What is one of the purposes of standard costs?
A. To simplify costing procedures and expedite cost reports
B. To replace budgets and budgeting
C. To serve as a basis for product costing for external reporting purposes
D. To eliminate accounting for under- or overapplied factory overhead at the end of the period
3. If a company follows a practice of isolating variances as soon as possible, when is the appropriate time to isolate
and recognize a direct materials price variance?
A. When materials are issued
B. When materials are purchased
C. When materials are used in production
D. When the purchase order originates
4. What does the master budget process usually begin with?
A. Production budget
B. Operating budget
C. Sales budget
D. Cash budget
5. The cash receipts budget includes which of the following items?
A. Funded depreciation
B. Cash collections from customers
C. Operating supplies
130
D. Extinguishment of debt
6. The sales budget is normally included in the financial budget of a firm. True or False?
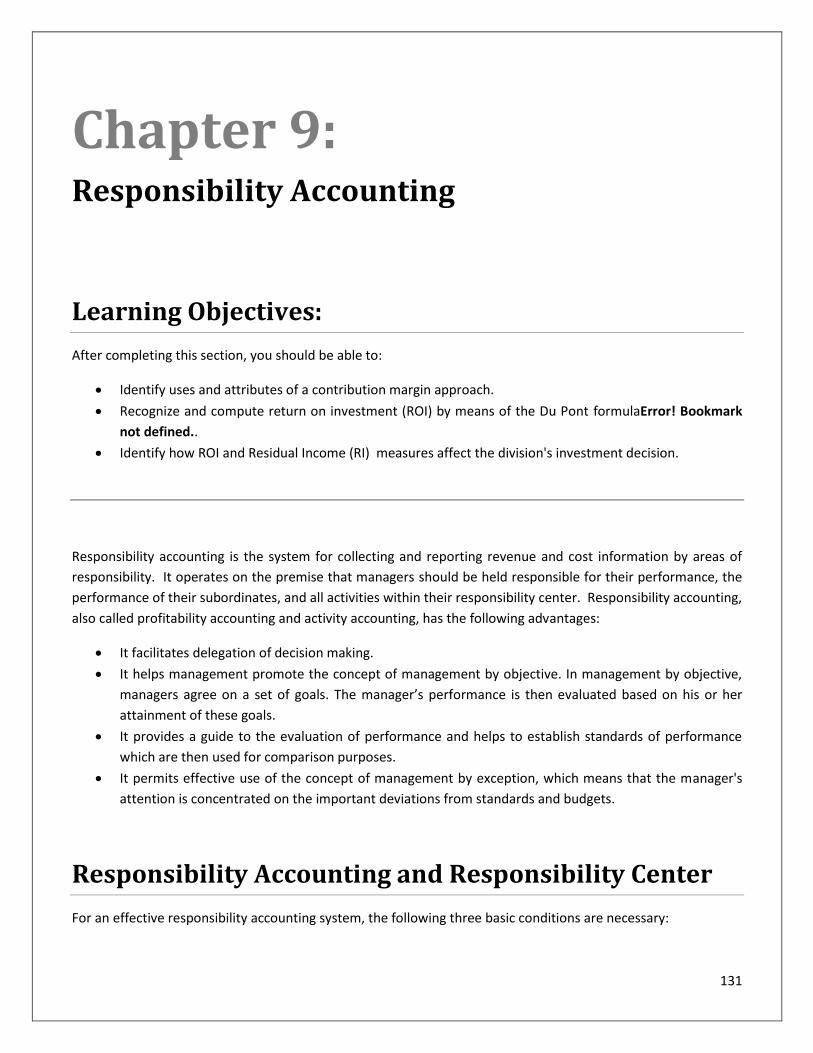
131
Chapter 9: Responsibility Accounting
Learning Objectives:
After completing this section, you should be able to:
Identify uses and attributes of a contribution margin approach.
Recognize and compute return on investment (ROI) by means of the Du Pont formulaError! Bookmark
not defined..
Identify how ROI and Residual Income (RI) measures affect the division's investment decision.
Responsibility accounting is the system for collecting and reporting revenue and cost information by areas of
responsibility. It operates on the premise that managers should be held responsible for their performance, the
performance of their subordinates, and all activities within their responsibility center. Responsibility accounting,
also called profitability accounting and activity accounting, has the following advantages:
It facilitates delegation of decision making.
It helps management promote the concept of management by objective. In management by objective,
managers agree on a set of goals. The manager’s performance is then evaluated based on his or her
attainment of these goals.
It provides a guide to the evaluation of performance and helps to establish standards of performance
which are then used for comparison purposes.
It permits effective use of the concept of management by exception, which means that the manager's
attention is concentrated on the important deviations from standards and budgets.
Responsibility Accounting and Responsibility Center
For an effective responsibility accounting system, the following three basic conditions are necessary:
132
1. The organization structure must be well defined. Management responsibility and authority must go hand in
hand at all levels and must be clearly established and understood.
2. Standards of performance in revenues, costs, and investments must be properly determined and well
defined.
3. The responsibility accounting reports (or performance reports) should include only items that are
controllable by the manager of the responsibility center. Also, they should highlight items calling for
managerial attention.
A well-designed responsibility accounting system establishes responsibility centers within the organization. A
responsibility center is defined as a unit in the organization which has control over costs, revenues, and/or
investment funds. Responsibility centers can be one of the following types:
Cost center. A cost center is the unit within the organization which is responsible only for costs. Examples include
production and maintenance departments of a manufacturing company.
Variance analysis based on standard costs would be a typical performance measure of a cost center. Variance
analysis was discussed in the previous chapter.
Profit center. A profit center is the unit which is held responsible for the revenues earned and costs incurred in that
center. Examples might include a sales office of a publishing company, and appliance department in a retail store,
and an auto repair center in a department store. The contribution approach to cost allocation is widely used to
measure the performance of a profit center.
Investment center. An investment center is the unit within the organization which is held responsible for the costs,
revenues, and related investments made in that center. The corporate headquarters or division in a large
decentralized organization would be an example of an investment center.
Figure 1 illustrates the manners in which responsibility accounting can be used within an organization and highlights
profit and cost centers. This chapter discusses in detail how the performance of both profit and investment
centers are evaluated.
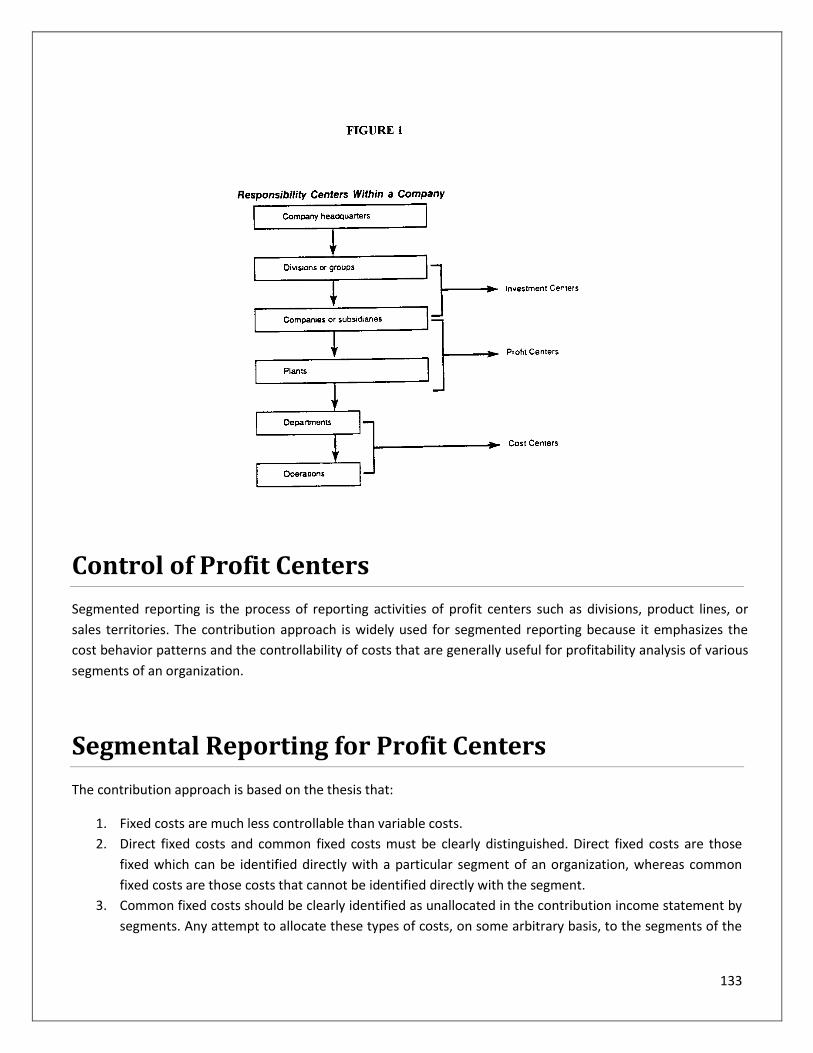
133
Control of Profit Centers
Segmented reporting is the process of reporting activities of profit centers such as divisions, product lines, or
sales territories. The contribution approach is widely used for segmented reporting because it emphasizes the
cost behavior patterns and the controllability of costs that are generally useful for profitability analysis of various
segments of an organization.
Segmental Reporting for Profit Centers
The contribution approach is based on the thesis that:
1. Fixed costs are much less controllable than variable costs.
2. Direct fixed costs and common fixed costs must be clearly distinguished. Direct fixed costs are those
fixed which can be identified directly with a particular segment of an organization, whereas common
fixed costs are those costs that cannot be identified directly with the segment.
3. Common fixed costs should be clearly identified as unallocated in the contribution income statement by
segments. Any attempt to allocate these types of costs, on some arbitrary basis, to the segments of the
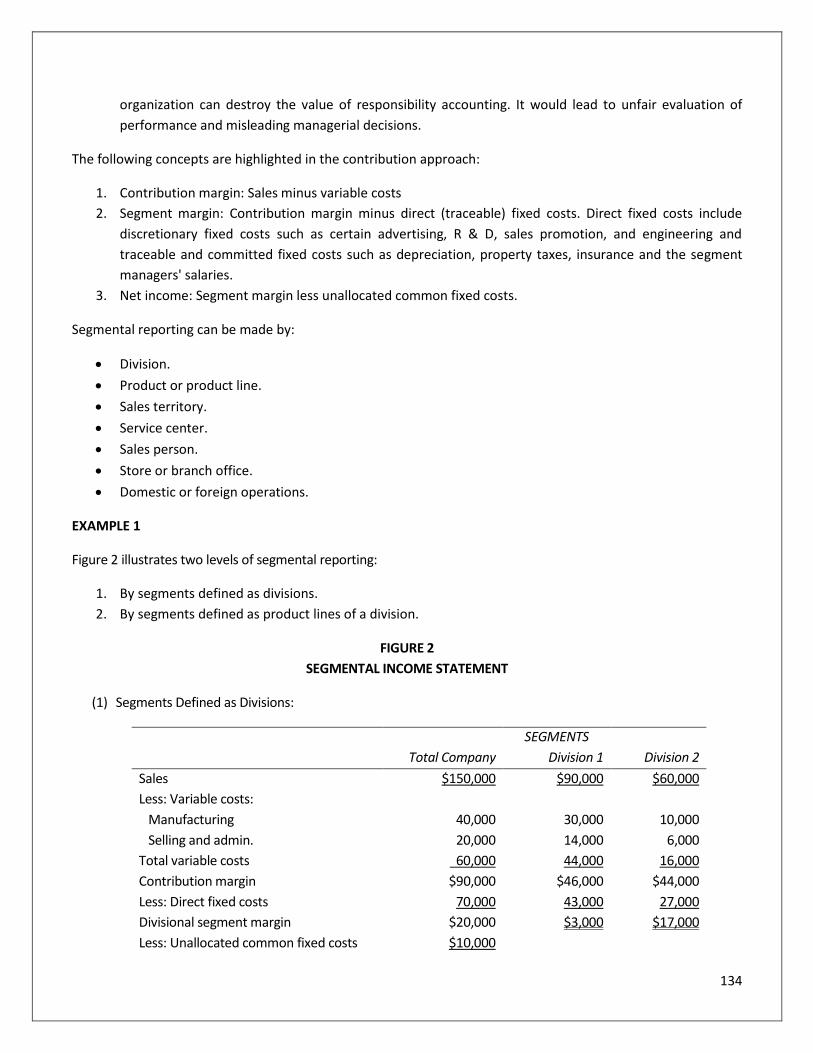
134
organization can destroy the value of responsibility accounting. It would lead to unfair evaluation of
performance and misleading managerial decisions.
The following concepts are highlighted in the contribution approach:
1. Contribution margin: Sales minus variable costs
2. Segment margin: Contribution margin minus direct (traceable) fixed costs. Direct fixed costs include
discretionary fixed costs such as certain advertising, R & D, sales promotion, and engineering and
traceable and committed fixed costs such as depreciation, property taxes, insurance and the segment
managers' salaries.
3. Net income: Segment margin less unallocated common fixed costs.
Segmental reporting can be made by:
Division.
Product or product line.
Sales territory.
Service center.
Sales person.
Store or branch office.
Domestic or foreign operations.
EXAMPLE 1
Figure 2 illustrates two levels of segmental reporting:
1. By segments defined as divisions.
2. By segments defined as product lines of a division.
FIGURE 2
SEGMENTAL INCOME STATEMENT
(1) Segments Defined as Divisions:
SEGMENTS
Total Company Division 1 Division 2
Sales $150,000 $90,000 $60,000
Less: Variable costs:
Manufacturing 40,000 30,000 10,000
Selling and admin. 20,000 14,000 6,000
Total variable costs 60,000 44,000 16,000
Contribution margin $90,000 $46,000 $44,000
Less: Direct fixed costs 70,000 43,000 27,000
Divisional segment margin $20,000 $3,000 $17,000
Less: Unallocated common fixed costs $10,000
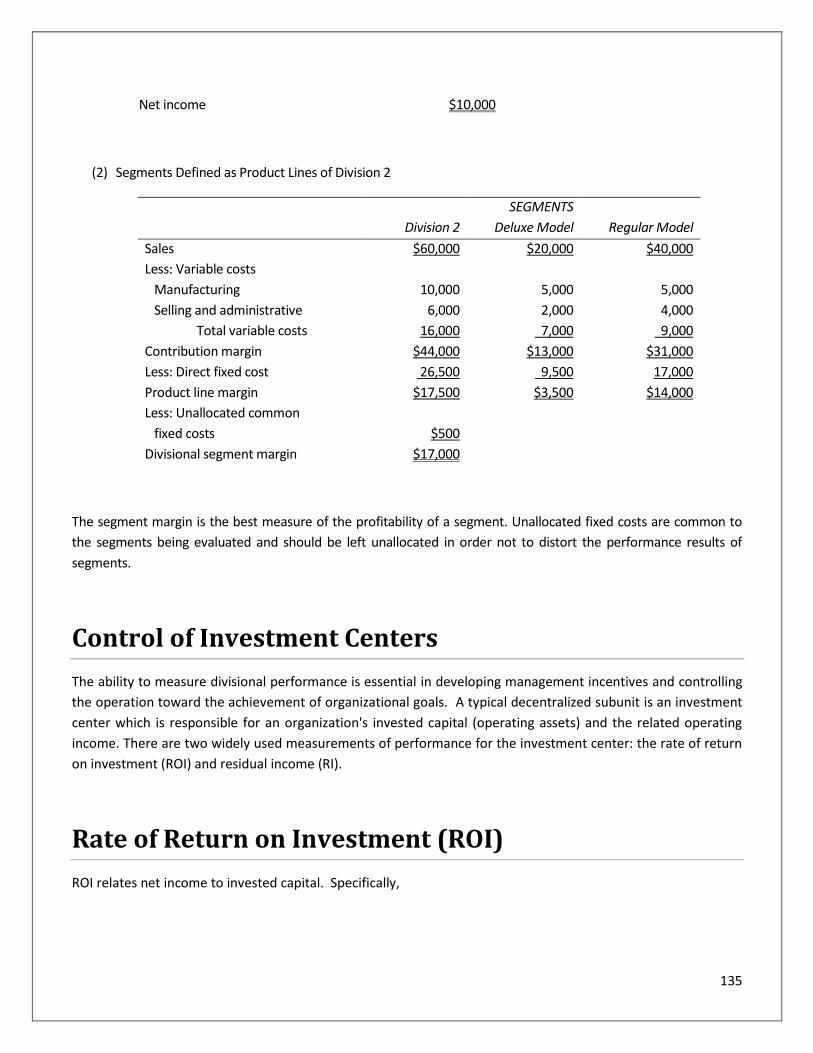
135
Net income $10,000
(2) Segments Defined as Product Lines of Division 2
SEGMENTS
Division 2 Deluxe Model Regular Model
Sales $60,000 $20,000 $40,000
Less: Variable costs
Manufacturing 10,000 5,000 5,000
Selling and administrative 6,000 2,000 4,000
Total variable costs 16,000 7,000 9,000
Contribution margin $44,000 $13,000 $31,000
Less: Direct fixed cost 26,500 9,500 17,000
Product line margin $17,500 $3,500 $14,000
Less: Unallocated common
fixed costs $500
Divisional segment margin $17,000
The segment margin is the best measure of the profitability of a segment. Unallocated fixed costs are common to
the segments being evaluated and should be left unallocated in order not to distort the performance results of
segments.
Control of Investment Centers
The ability to measure divisional performance is essential in developing management incentives and controlling
the operation toward the achievement of organizational goals. A typical decentralized subunit is an investment
center which is responsible for an organization's invested capital (operating assets) and the related operating
income. There are two widely used measurements of performance for the investment center: the rate of return
on investment (ROI) and residual income (RI).
Rate of Return on Investment (ROI)
ROI relates net income to invested capital. Specifically,
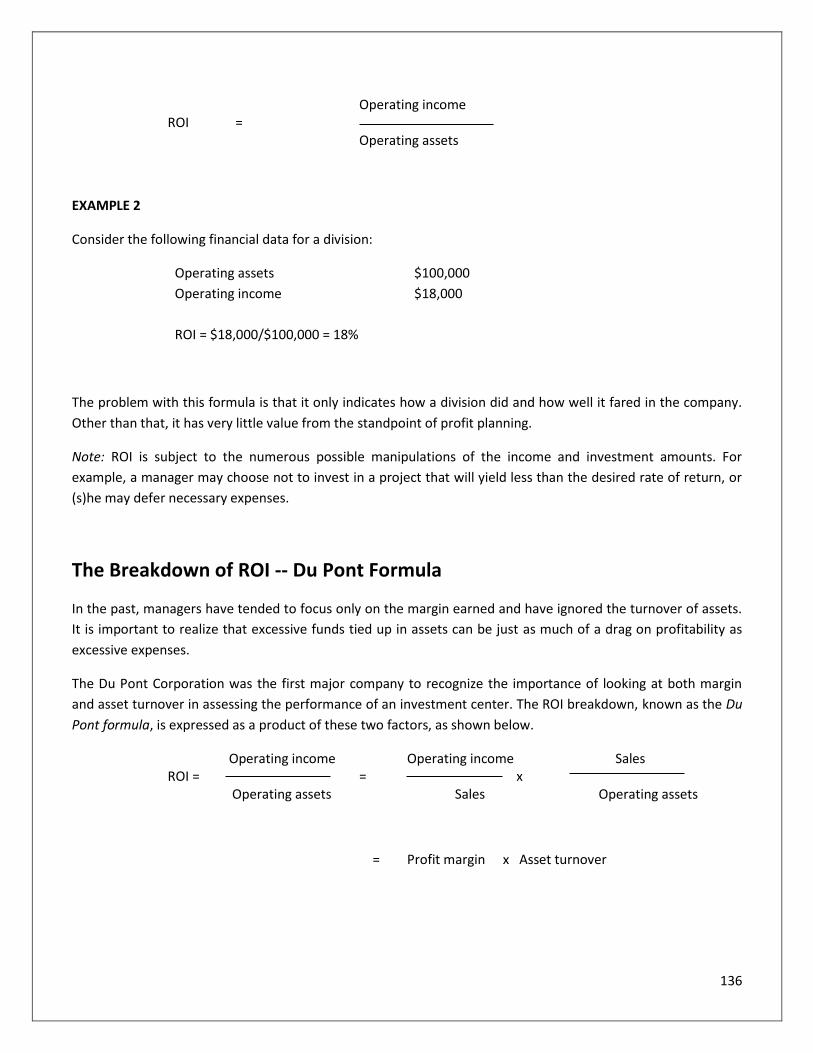
136
Operating income ROI =
Operating assets
EXAMPLE 2
Consider the following financial data for a division:
Operating assets $100,000
Operating income $18,000
ROI = $18,000/$100,000 = 18%
The problem with this formula is that it only indicates how a division did and how well it fared in the company.
Other than that, it has very little value from the standpoint of profit planning.
Note: ROI is subject to the numerous possible manipulations of the income and investment amounts. For
example, a manager may choose not to invest in a project that will yield less than the desired rate of return, or
(s)he may defer necessary expenses.
The Breakdown of ROI -- Du Pont Formula
In the past, managers have tended to focus only on the margin earned and have ignored the turnover of assets.
It is important to realize that excessive funds tied up in assets can be just as much of a drag on profitability as
excessive expenses.
The Du Pont Corporation was the first major company to recognize the importance of looking at both margin
and asset turnover in assessing the performance of an investment center. The ROI breakdown, known as the Du
Pont formula, is expressed as a product of these two factors, as shown below.
Operating income Operating income Sales ROI = = x Operating assets Sales Operating assets
= Profit margin x Asset turnover
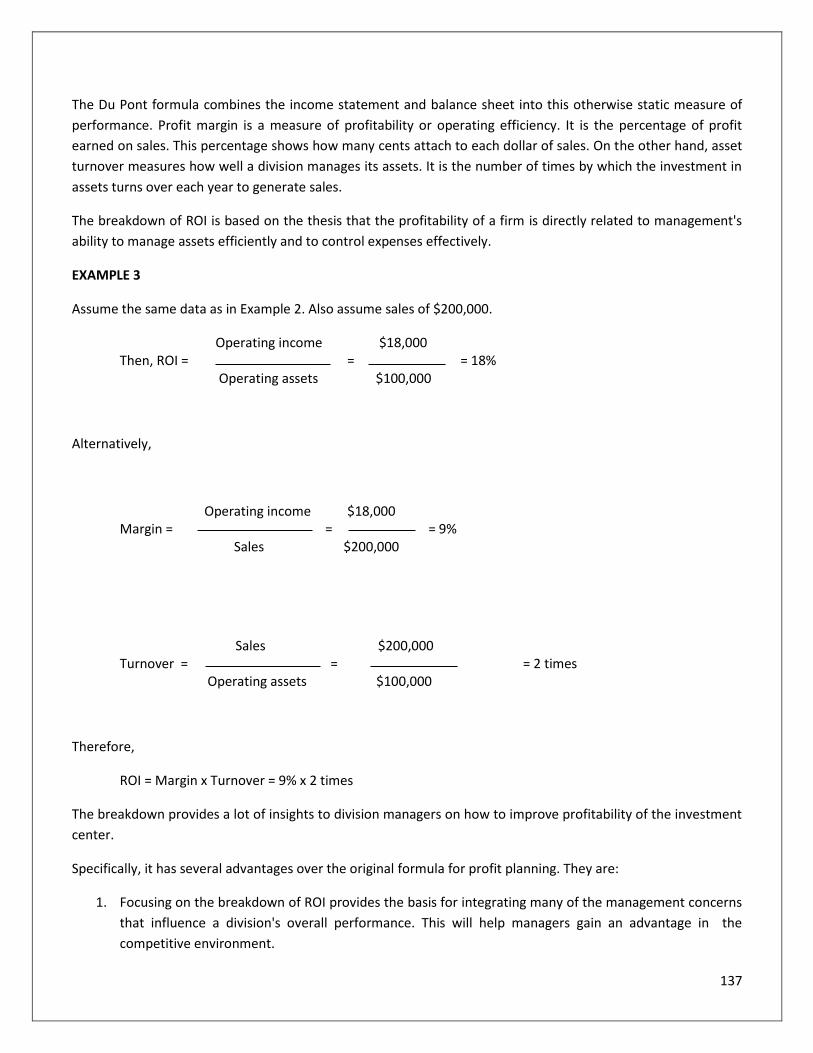
137
The Du Pont formula combines the income statement and balance sheet into this otherwise static measure of
performance. Profit margin is a measure of profitability or operating efficiency. It is the percentage of profit
earned on sales. This percentage shows how many cents attach to each dollar of sales. On the other hand, asset
turnover measures how well a division manages its assets. It is the number of times by which the investment in
assets turns over each year to generate sales.
The breakdown of ROI is based on the thesis that the profitability of a firm is directly related to management's
ability to manage assets efficiently and to control expenses effectively.
EXAMPLE 3
Assume the same data as in Example 2. Also assume sales of $200,000.
Operating income $18,000 Then, ROI = = = 18% Operating assets $100,000
Alternatively,
Operating income $18,000 Margin = = = 9% Sales $200,000
Sales $200,000 Turnover = = = 2 times Operating assets $100,000
Therefore,
ROI = Margin x Turnover = 9% x 2 times
The breakdown provides a lot of insights to division managers on how to improve profitability of the investment
center.
Specifically, it has several advantages over the original formula for profit planning. They are:
1. Focusing on the breakdown of ROI provides the basis for integrating many of the management concerns
that influence a division's overall performance. This will help managers gain an advantage in the
competitive environment.
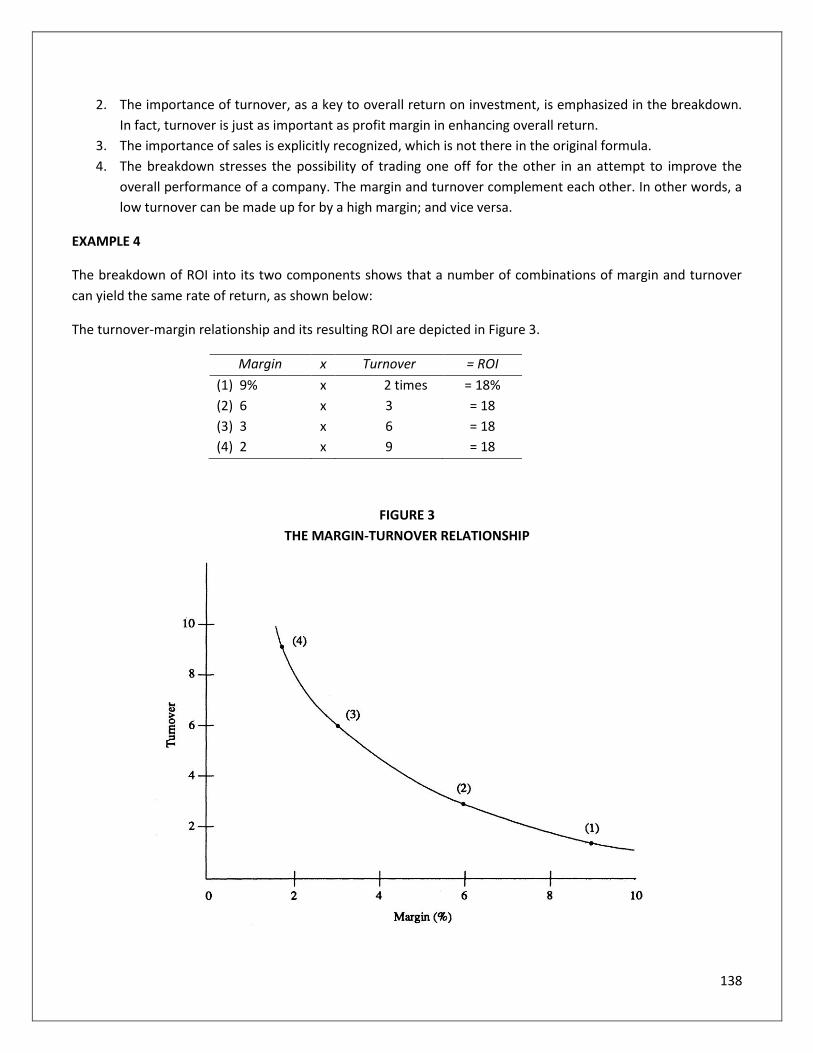
138
2. The importance of turnover, as a key to overall return on investment, is emphasized in the breakdown.
In fact, turnover is just as important as profit margin in enhancing overall return.
3. The importance of sales is explicitly recognized, which is not there in the original formula.
4. The breakdown stresses the possibility of trading one off for the other in an attempt to improve the
overall performance of a company. The margin and turnover complement each other. In other words, a
low turnover can be made up for by a high margin; and vice versa.
EXAMPLE 4
The breakdown of ROI into its two components shows that a number of combinations of margin and turnover
can yield the same rate of return, as shown below:
The turnover-margin relationship and its resulting ROI are depicted in Figure 3.
Margin x Turnover = ROI
(1) 9% x 2 times = 18%
(2) 6 x 3 = 18
(3) 3 x 6 = 18
(4) 2 x 9 = 18
FIGURE 3
THE MARGIN-TURNOVER RELATIONSHIP
139
ROI and Profit Planning
The breakdown of ROI into margin and turnover gives divisional managers insight into planning for profit
improvement by revealing where weaknesses exist: margin or turnover, or both. Various actions can be taken to
enhance ROI. Generally, they can:
1. Improve margin
2. Improve turnover
3. Improve both
Alternative 1 demonstrates a popular way of improving performance. Margins may be increased by reducing
expenses, raising selling prices, or increasing sales faster than expenses. Some of the ways to reduce expenses
are:
Use less costly inputs of materials.
Automate processes as much as possible to increase labor productivity.
Bring the discretionary fixed costs under scrutiny, with various programs either curtailed or eliminated.
Discretionary fixed costs arise from annual budgeting decisions by management. Examples include
advertising, research and development, and management development programs. The cost-benefit
analysis is called for in order to justify the budgeted amount of each discretionary program.
A division with pricing power can raise selling prices and retain profitability without losing business. Pricing
power is the ability to raise prices even in poor economic times when unit sales volume may be flat and capacity
may not be fully utilized. It is also the ability to pass on cost increases to consumers without attracting domestic
and import competition, political opposition, regulation, new entrants, or threats of product substitution. The
division with pricing power must have a unique economic position. Divisions that offer unique, high-quality
goods and services (where the service is more important than the cost) have this economic position.
Alternative 2 may be achieved by increasing sales while holding the investment in assets relatively constant, or
by reducing assets. Some of the strategies to reduce assets are:
Dispose of obsolete and redundant inventory. The computer has been extremely helpful in this regard,
making perpetual inventory methods more feasible for inventory control.
Devise various methods of speeding up the collection of receivables and also evaluate credit terms and
policies.
See if there are unused fixed assets.
Use the converted assets obtained from the use of the previous methods to repay outstanding debts or
repurchase outstanding issues of stock. The division may release them elsewhere to get more profit,
which will improve margin as well as turnover.
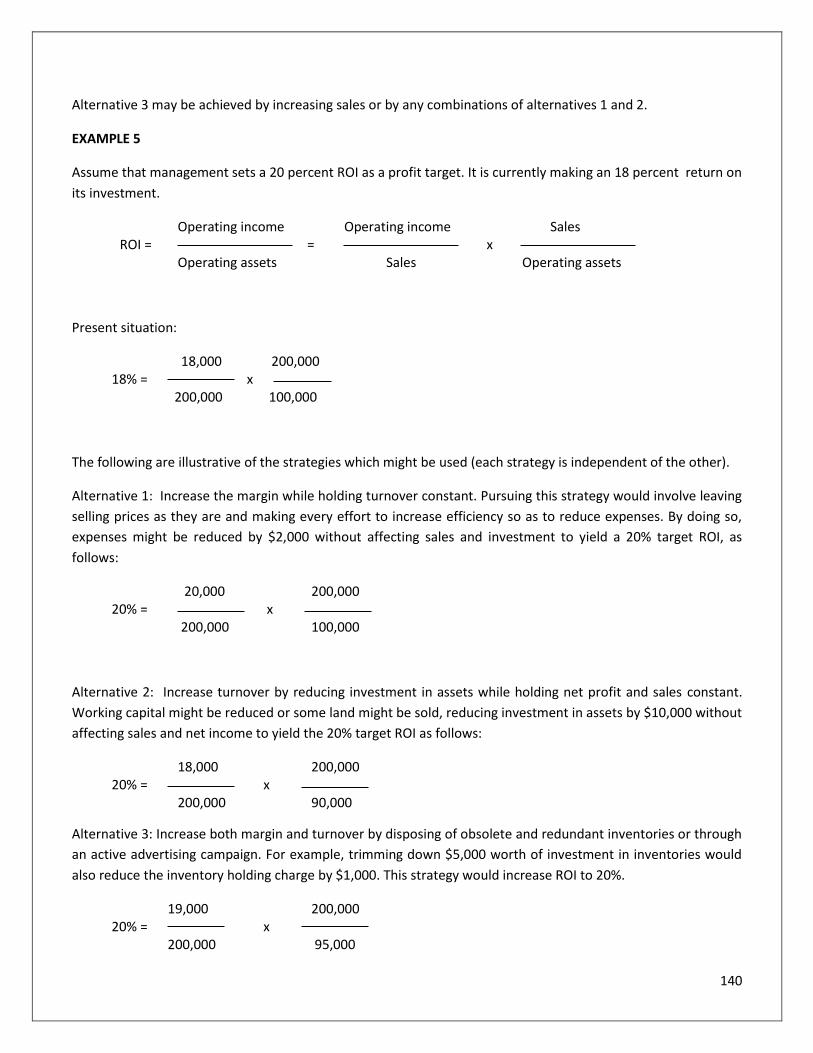
140
Alternative 3 may be achieved by increasing sales or by any combinations of alternatives 1 and 2.
EXAMPLE 5
Assume that management sets a 20 percent ROI as a profit target. It is currently making an 18 percent return on
its investment.
Operating income Operating income Sales ROI = = x Operating assets Sales Operating assets
Present situation:
18,000 200,000 18% = x 200,000 100,000
The following are illustrative of the strategies which might be used (each strategy is independent of the other).
Alternative 1: Increase the margin while holding turnover constant. Pursuing this strategy would involve leaving
selling prices as they are and making every effort to increase efficiency so as to reduce expenses. By doing so,
expenses might be reduced by $2,000 without affecting sales and investment to yield a 20% target ROI, as
follows:
20,000 200,000 20% = x 200,000 100,000
Alternative 2: Increase turnover by reducing investment in assets while holding net profit and sales constant.
Working capital might be reduced or some land might be sold, reducing investment in assets by $10,000 without
affecting sales and net income to yield the 20% target ROI as follows:
18,000 200,000 20% = x 200,000 90,000
Alternative 3: Increase both margin and turnover by disposing of obsolete and redundant inventories or through
an active advertising campaign. For example, trimming down $5,000 worth of investment in inventories would
also reduce the inventory holding charge by $1,000. This strategy would increase ROI to 20%.
19,000 200,000 20% = x 200,000 95,000
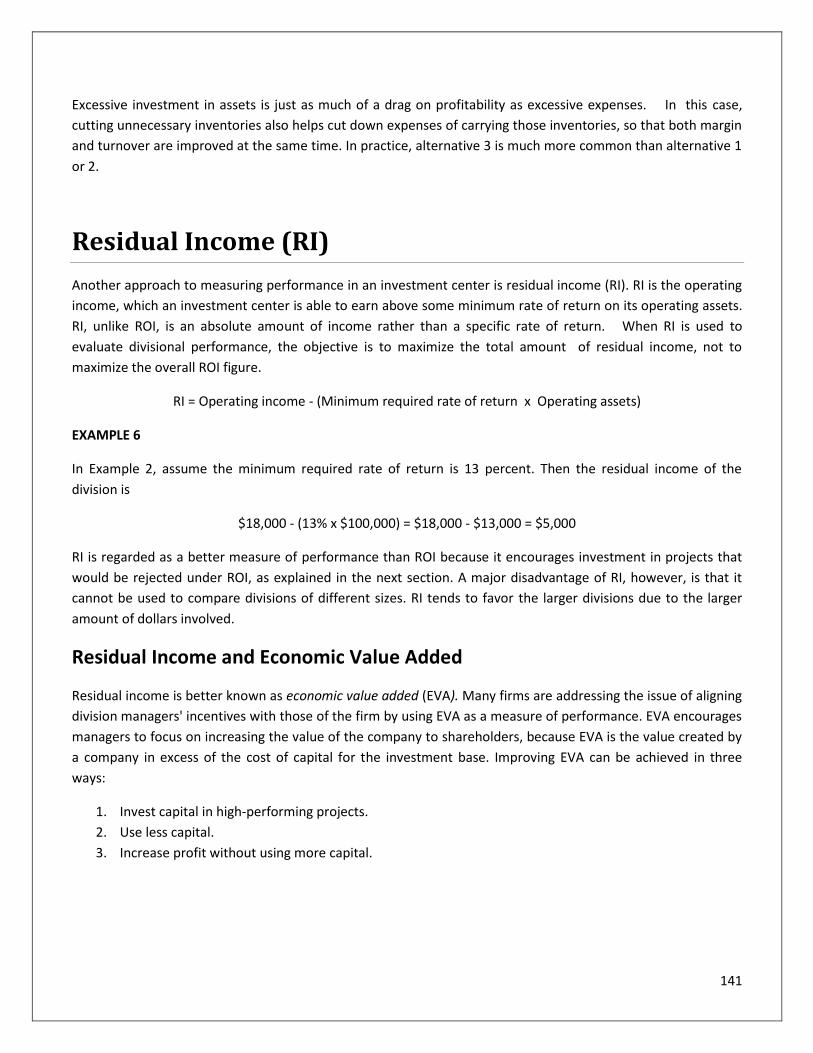
141
Excessive investment in assets is just as much of a drag on profitability as excessive expenses. In this case,
cutting unnecessary inventories also helps cut down expenses of carrying those inventories, so that both margin
and turnover are improved at the same time. In practice, alternative 3 is much more common than alternative 1
or 2.
Residual Income (RI)
Another approach to measuring performance in an investment center is residual income (RI). RI is the operating
income, which an investment center is able to earn above some minimum rate of return on its operating assets.
RI, unlike ROI, is an absolute amount of income rather than a specific rate of return. When RI is used to
evaluate divisional performance, the objective is to maximize the total amount of residual income, not to
maximize the overall ROI figure.
RI = Operating income - (Minimum required rate of return x Operating assets)
EXAMPLE 6
In Example 2, assume the minimum required rate of return is 13 percent. Then the residual income of the
division is
$18,000 - (13% x $100,000) = $18,000 - $13,000 = $5,000
RI is regarded as a better measure of performance than ROI because it encourages investment in projects that
would be rejected under ROI, as explained in the next section. A major disadvantage of RI, however, is that it
cannot be used to compare divisions of different sizes. RI tends to favor the larger divisions due to the larger
amount of dollars involved.
Residual Income and Economic Value Added
Residual income is better known as economic value added (EVA). Many firms are addressing the issue of aligning
division managers' incentives with those of the firm by using EVA as a measure of performance. EVA encourages
managers to focus on increasing the value of the company to shareholders, because EVA is the value created by
a company in excess of the cost of capital for the investment base. Improving EVA can be achieved in three
ways:
1. Invest capital in high-performing projects.
2. Use less capital.
3. Increase profit without using more capital.
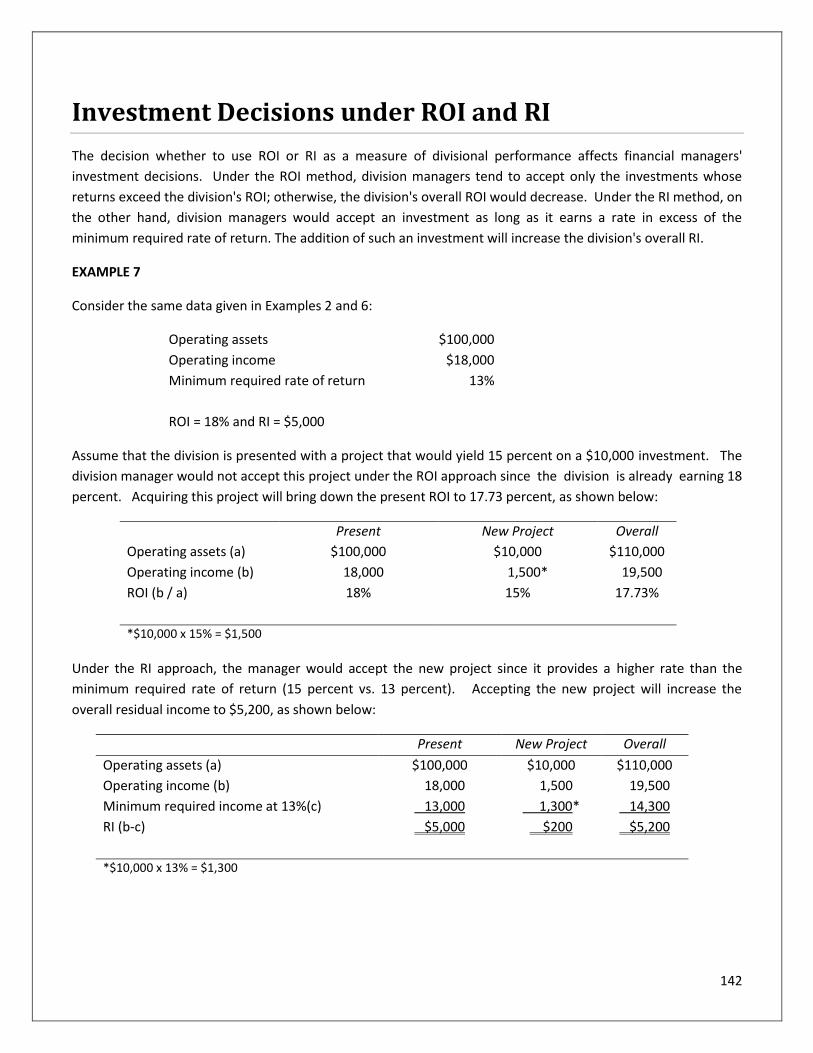
142
Investment Decisions under ROI and RI
The decision whether to use ROI or RI as a measure of divisional performance affects financial managers'
investment decisions. Under the ROI method, division managers tend to accept only the investments whose
returns exceed the division's ROI; otherwise, the division's overall ROI would decrease. Under the RI method, on
the other hand, division managers would accept an investment as long as it earns a rate in excess of the
minimum required rate of return. The addition of such an investment will increase the division's overall RI.
EXAMPLE 7
Consider the same data given in Examples 2 and 6:
Operating assets $100,000
Operating income $18,000
Minimum required rate of return 13%
ROI = 18% and RI = $5,000
Assume that the division is presented with a project that would yield 15 percent on a $10,000 investment. The
division manager would not accept this project under the ROI approach since the division is already earning 18
percent. Acquiring this project will bring down the present ROI to 17.73 percent, as shown below:
Present New Project Overall
Operating assets (a) $100,000 $10,000 $110,000
Operating income (b) 18,000 1,500* 19,500
ROI (b / a) 18% 15% 17.73%
*$10,000 x 15% = $1,500
Under the RI approach, the manager would accept the new project since it provides a higher rate than the
minimum required rate of return (15 percent vs. 13 percent). Accepting the new project will increase the
overall residual income to $5,200, as shown below:
Present New Project Overall
Operating assets (a) $100,000 $10,000 $110,000
Operating income (b) 18,000 1,500 19,500
Minimum required income at 13%(c) 13,000 1,300* 14,300
RI (b-c) $5,000 $200 $5,200
*$10,000 x 13% = $1,300
143
Chapter 9 Review Questions
1. What does responsibility accounting define an operating center that is responsible for revenue and costs as?
A. Profit center
B. Revenue center
C. Division
D. Operating unit
2. Decentralized firms can delegate authority and yet retain control and monitor managers' performance by
structuring the organization into responsibility centers. Which one of the following organizational segments is most
like an independent business?
A. Revenue center
B. Profit center
C. Cost center
D. Investment center
3. Which one of the following statements pertaining to the return on investment (ROI) as a performance
measurement is incorrect?
A. When the average age of assets differs substantially across segments of a business, the use of ROI may
not be appropriate.
B. ROI relies on financial measures that are capable of being independently verified, while other forms of
performance measures are subject to manipulation.
C. The use of ROI may lead managers to reject capital investment projects that can be justified by using
discounted cash flow models.
D. The use of ROI can make it undesirable for a skillful manager to take on trouble-shooting assignments
such as those involving turning around unprofitable divisions.
4. Return on investment (ROI) would be the best for evaluating the management performance of a department
that is operated at a cost center. True or False?
5. Residual income (RI) is a performance evaluation that is used in conjunction with, or instead of, return on
investment (ROI). In many cases, why is RI preferred over ROI?
144
A. Residual income is a measure over time, while ROI represents the results for one period.
B. Residual income concentrates on maximizing absolute dollars of income rather than a percentage return
as with ROI.
C. The imputed interest rate used in calculating residual income is more easily derived than the target rate
that is compared to the calculated ROI.
D. Average investment is employed with residual income while year-end investment is employed with ROI.
145
Chapter 10: Relevant Costs and Short-Term Decisions
Learning Objectives:
After completing this section, you should be able to:
Identify the costs that are relevant for different financial decisions.
Recognize factors used in making a short-term profit maximization decision.
When performing the manufacturing and selling functions, management is constantly faced with the problem of
choosing between alternative courses of action. Typical questions to be answered include: What to make? How
to make it? Where to sell the product? and What price should be charged? In the short run, management is
faced with many short-term, nonroutine decisions. In a short-term situation, fixed costs are generally irrelevant
to the decision at hand. Managerial accountants must recognize as a major decision tool, the two important
concepts: relevant costs and contribution margin.
Relevant Costs Defined
In each of the above situations, the ultimate management decision rests on cost data analysis. Cost data are
important in many decisions, since they are the basis for profit calculations. Cost data are classified by function,
behavior patterns, and other criteria, as discussed previously.
However, not all costs are of equal importance in decision making, and managers must identify the costs that are
relevant to a decision. Such costs are called relevant costs. The relevant costs are the expected future costs (and
also revenues) which differ between the decision alternatives. Therefore, the sunk costs (past and historical costs)
are not considered relevant in the decision at hand. What is relevant are the incremental or differential costs.
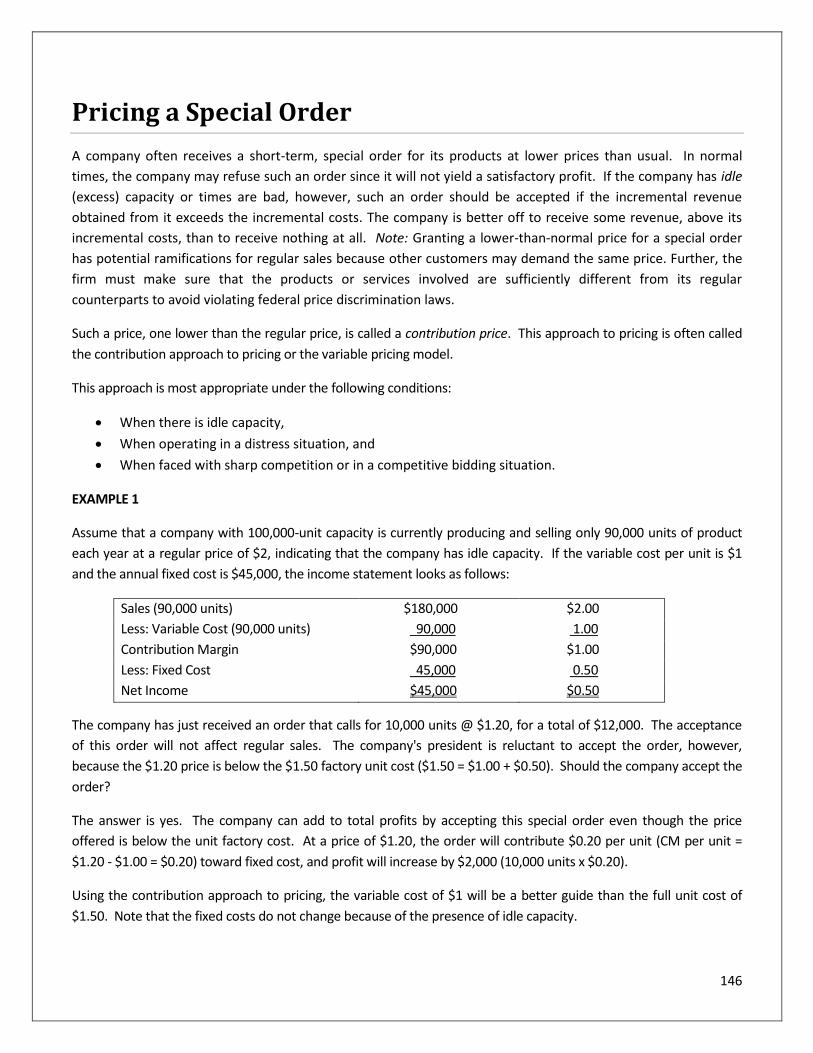
146
Pricing a Special Order
A company often receives a short-term, special order for its products at lower prices than usual. In normal
times, the company may refuse such an order since it will not yield a satisfactory profit. If the company has idle
(excess) capacity or times are bad, however, such an order should be accepted if the incremental revenue
obtained from it exceeds the incremental costs. The company is better off to receive some revenue, above its
incremental costs, than to receive nothing at all. Note: Granting a lower-than-normal price for a special order
has potential ramifications for regular sales because other customers may demand the same price. Further, the
firm must make sure that the products or services involved are sufficiently different from its regular
counterparts to avoid violating federal price discrimination laws.
Such a price, one lower than the regular price, is called a contribution price. This approach to pricing is often called
the contribution approach to pricing or the variable pricing model.
This approach is most appropriate under the following conditions:
When there is idle capacity,
When operating in a distress situation, and
When faced with sharp competition or in a competitive bidding situation.
EXAMPLE 1
Assume that a company with 100,000-unit capacity is currently producing and selling only 90,000 units of product
each year at a regular price of $2, indicating that the company has idle capacity. If the variable cost per unit is $1
and the annual fixed cost is $45,000, the income statement looks as follows:
Sales (90,000 units) $180,000 $2.00
Less: Variable Cost (90,000 units) 90,000 1.00
Contribution Margin $90,000 $1.00
Less: Fixed Cost 45,000 0.50
Net Income $45,000 $0.50
The company has just received an order that calls for 10,000 units @ $1.20, for a total of $12,000. The acceptance
of this order will not affect regular sales. The company's president is reluctant to accept the order, however,
because the $1.20 price is below the $1.50 factory unit cost ($1.50 = $1.00 + $0.50). Should the company accept the
order?
The answer is yes. The company can add to total profits by accepting this special order even though the price
offered is below the unit factory cost. At a price of $1.20, the order will contribute $0.20 per unit (CM per unit =
$1.20 - $1.00 = $0.20) toward fixed cost, and profit will increase by $2,000 (10,000 units x $0.20).
Using the contribution approach to pricing, the variable cost of $1 will be a better guide than the full unit cost of
$1.50. Note that the fixed costs do not change because of the presence of idle capacity.
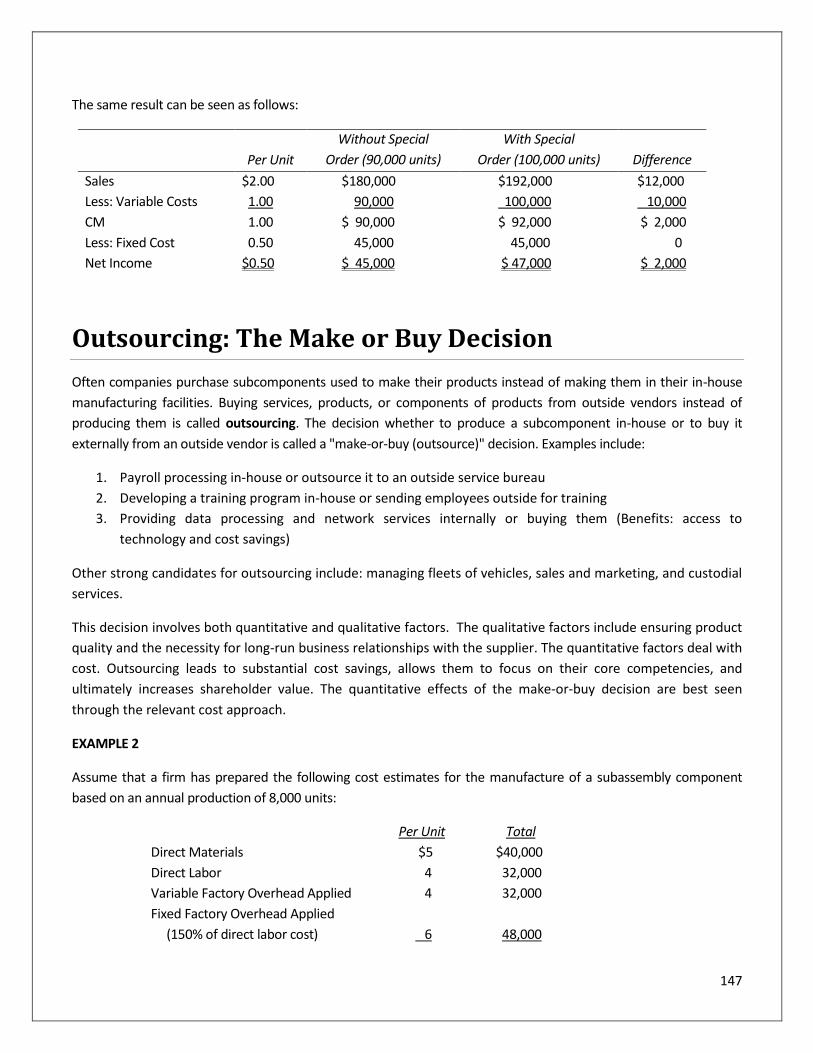
147
The same result can be seen as follows:
Per Unit
Without Special
Order (90,000 units)
With Special
Order (100,000 units)
Difference
Sales $2.00 $180,000 $192,000 $12,000
Less: Variable Costs 1.00 90,000 100,000 10,000
CM 1.00 $ 90,000 $ 92,000 $ 2,000
Less: Fixed Cost 0.50 45,000 45,000 0
Net Income $0.50 $ 45,000 $ 47,000 $ 2,000
Outsourcing: The Make or Buy Decision
Often companies purchase subcomponents used to make their products instead of making them in their in-house
manufacturing facilities. Buying services, products, or components of products from outside vendors instead of
producing them is called outsourcing. The decision whether to produce a subcomponent in-house or to buy it
externally from an outside vendor is called a "make-or-buy (outsource)" decision. Examples include:
1. Payroll processing in-house or outsource it to an outside service bureau
2. Developing a training program in-house or sending employees outside for training
3. Providing data processing and network services internally or buying them (Benefits: access to
technology and cost savings)
Other strong candidates for outsourcing include: managing fleets of vehicles, sales and marketing, and custodial
services.
This decision involves both quantitative and qualitative factors. The qualitative factors include ensuring product
quality and the necessity for long-run business relationships with the supplier. The quantitative factors deal with
cost. Outsourcing leads to substantial cost savings, allows them to focus on their core competencies, and
ultimately increases shareholder value. The quantitative effects of the make-or-buy decision are best seen
through the relevant cost approach.
EXAMPLE 2
Assume that a firm has prepared the following cost estimates for the manufacture of a subassembly component
based on an annual production of 8,000 units:
Per Unit Total
Direct Materials $5 $40,000
Direct Labor 4 32,000
Variable Factory Overhead Applied 4 32,000
Fixed Factory Overhead Applied
(150% of direct labor cost) 6 48,000
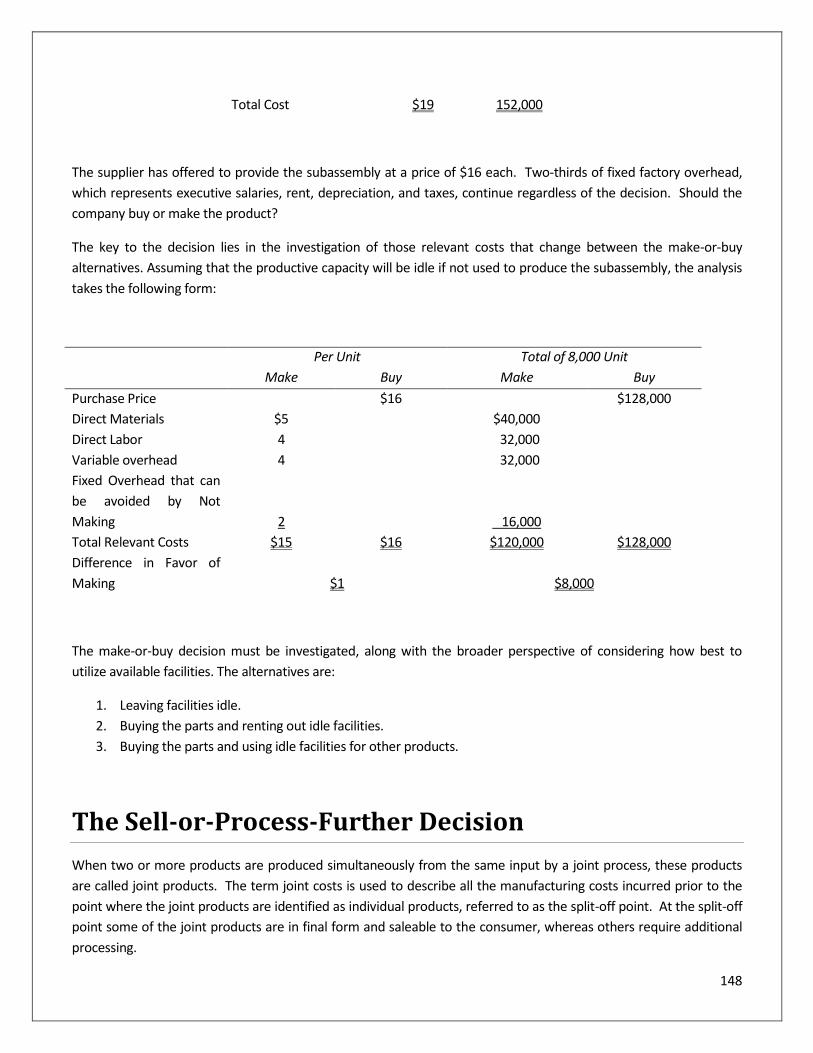
148
Total Cost $19 152,000
The supplier has offered to provide the subassembly at a price of $16 each. Two-thirds of fixed factory overhead,
which represents executive salaries, rent, depreciation, and taxes, continue regardless of the decision. Should the
company buy or make the product?
The key to the decision lies in the investigation of those relevant costs that change between the make-or-buy
alternatives. Assuming that the productive capacity will be idle if not used to produce the subassembly, the analysis
takes the following form:
Per Unit Total of 8,000 Unit
Make Buy Make Buy
Purchase Price $16 $128,000
Direct Materials $5 $40,000
Direct Labor 4 32,000
Variable overhead 4 32,000
Fixed Overhead that can
be avoided by Not
Making
2
16,000
Total Relevant Costs $15 $16 $120,000 $128,000
Difference in Favor of
Making
$1
$8,000
The make-or-buy decision must be investigated, along with the broader perspective of considering how best to
utilize available facilities. The alternatives are:
1. Leaving facilities idle.
2. Buying the parts and renting out idle facilities.
3. Buying the parts and using idle facilities for other products.
The Sell-or-Process-Further Decision
When two or more products are produced simultaneously from the same input by a joint process, these products
are called joint products. The term joint costs is used to describe all the manufacturing costs incurred prior to the
point where the joint products are identified as individual products, referred to as the split-off point. At the split-off
point some of the joint products are in final form and saleable to the consumer, whereas others require additional
processing.
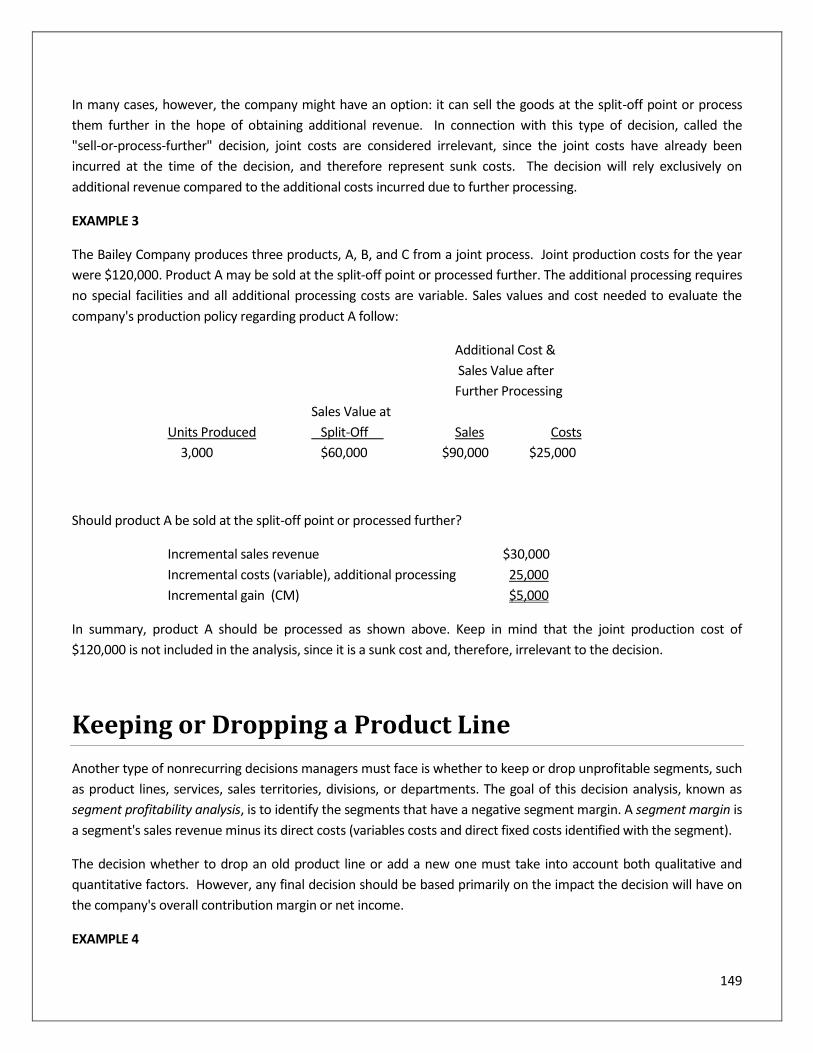
149
In many cases, however, the company might have an option: it can sell the goods at the split-off point or process
them further in the hope of obtaining additional revenue. In connection with this type of decision, called the
"sell-or-process-further" decision, joint costs are considered irrelevant, since the joint costs have already been
incurred at the time of the decision, and therefore represent sunk costs. The decision will rely exclusively on
additional revenue compared to the additional costs incurred due to further processing.
EXAMPLE 3
The Bailey Company produces three products, A, B, and C from a joint process. Joint production costs for the year
were $120,000. Product A may be sold at the split-off point or processed further. The additional processing requires
no special facilities and all additional processing costs are variable. Sales values and cost needed to evaluate the
company's production policy regarding product A follow:
Additional Cost &
Sales Value after
Further Processing
Sales Value at
Units Produced Split-Off Sales Costs
3,000 $60,000 $90,000 $25,000
Should product A be sold at the split-off point or processed further?
Incremental sales revenue $30,000
Incremental costs (variable), additional processing 25,000
Incremental gain (CM) $5,000
In summary, product A should be processed as shown above. Keep in mind that the joint production cost of
$120,000 is not included in the analysis, since it is a sunk cost and, therefore, irrelevant to the decision.
Keeping or Dropping a Product Line
Another type of nonrecurring decisions managers must face is whether to keep or drop unprofitable segments, such
as product lines, services, sales territories, divisions, or departments. The goal of this decision analysis, known as
segment profitability analysis, is to identify the segments that have a negative segment margin. A segment margin is
a segment's sales revenue minus its direct costs (variables costs and direct fixed costs identified with the segment).
The decision whether to drop an old product line or add a new one must take into account both qualitative and
quantitative factors. However, any final decision should be based primarily on the impact the decision will have on
the company's overall contribution margin or net income.
EXAMPLE 4
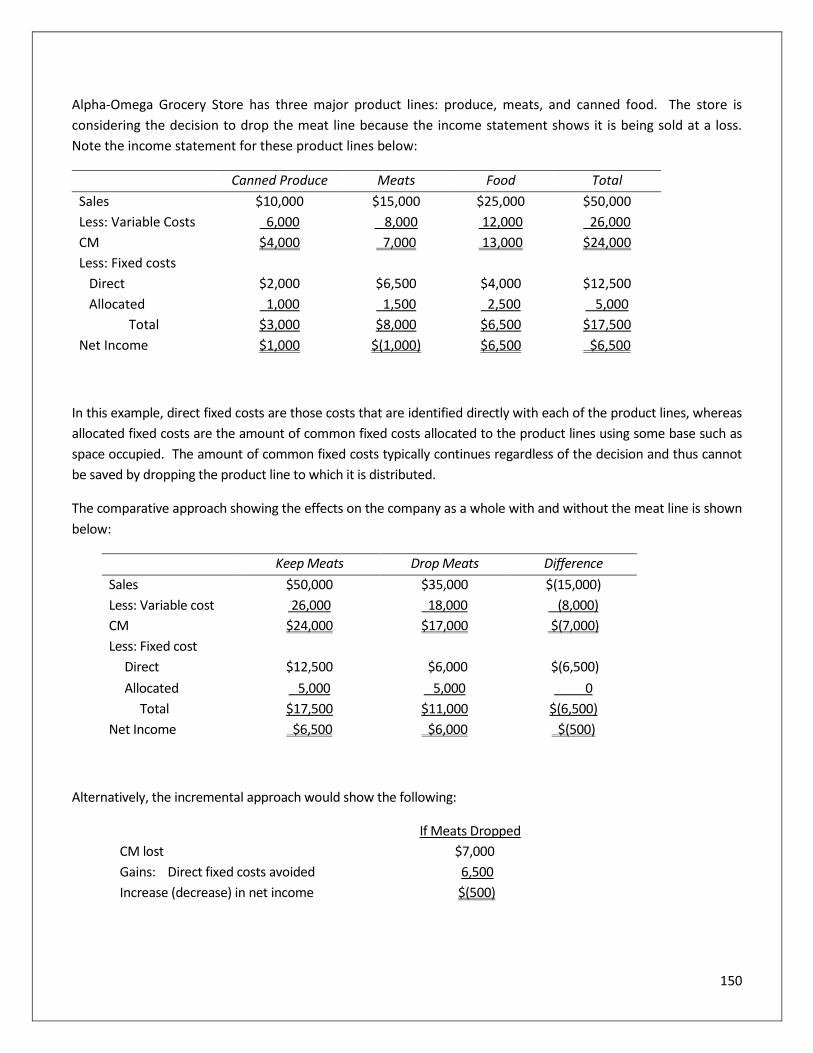
150
Alpha-Omega Grocery Store has three major product lines: produce, meats, and canned food. The store is
considering the decision to drop the meat line because the income statement shows it is being sold at a loss.
Note the income statement for these product lines below:
Canned Produce Meats Food Total
Sales $10,000 $15,000 $25,000 $50,000
Less: Variable Costs 6,000 8,000 12,000 26,000
CM $4,000 7,000 13,000 $24,000
Less: Fixed costs
Direct $2,000 $6,500 $4,000 $12,500
Allocated 1,000 1,500 2,500 5,000
Total $3,000 $8,000 $6,500 $17,500
Net Income $1,000 $(1,000) $6,500 $6,500
In this example, direct fixed costs are those costs that are identified directly with each of the product lines, whereas
allocated fixed costs are the amount of common fixed costs allocated to the product lines using some base such as
space occupied. The amount of common fixed costs typically continues regardless of the decision and thus cannot
be saved by dropping the product line to which it is distributed.
The comparative approach showing the effects on the company as a whole with and without the meat line is shown
below:
Keep Meats Drop Meats Difference
Sales $50,000 $35,000 $(15,000)
Less: Variable cost 26,000 18,000 (8,000)
CM $24,000 $17,000 $(7,000)
Less: Fixed cost
Direct $12,500 $6,000 $(6,500)
Allocated 5,000 5,000 0
Total $17,500 $11,000 $(6,500)
Net Income $6,500 $6,000 $(500)
Alternatively, the incremental approach would show the following:
If Meats Dropped
CM lost $7,000
Gains: Direct fixed costs avoided 6,500
Increase (decrease) in net income $(500)
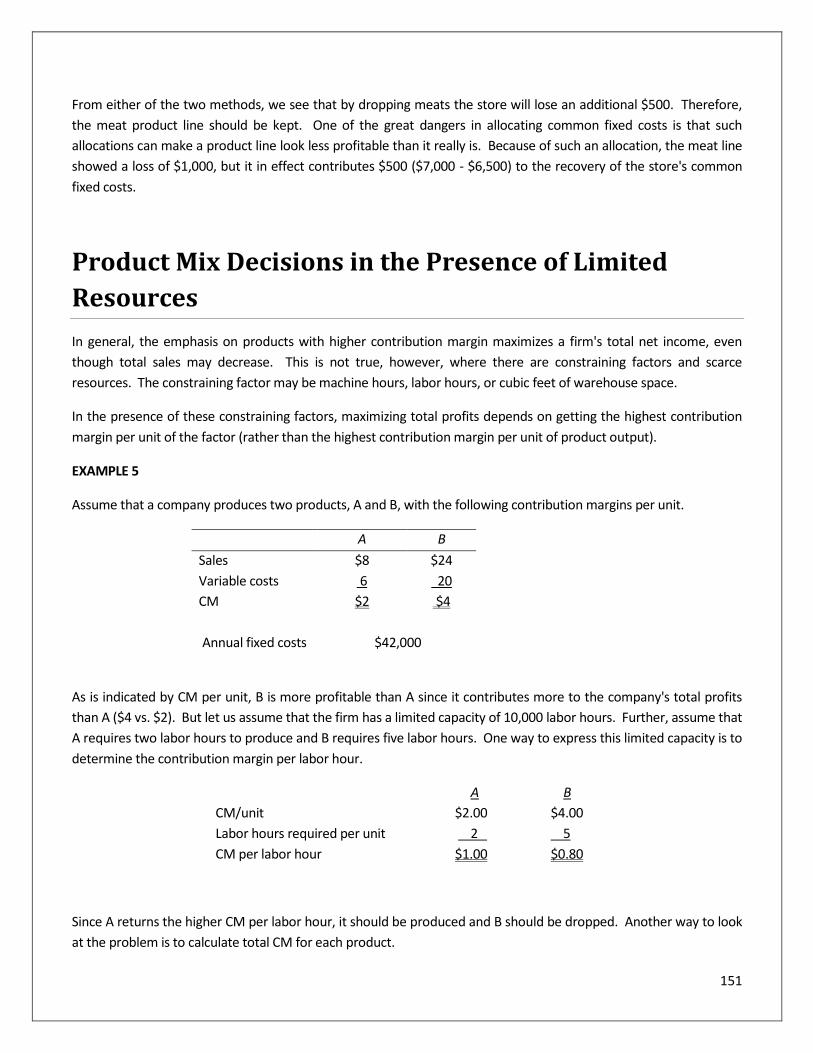
151
From either of the two methods, we see that by dropping meats the store will lose an additional $500. Therefore,
the meat product line should be kept. One of the great dangers in allocating common fixed costs is that such
allocations can make a product line look less profitable than it really is. Because of such an allocation, the meat line
showed a loss of $1,000, but it in effect contributes $500 ($7,000 - $6,500) to the recovery of the store's common
fixed costs.
Product Mix Decisions in the Presence of Limited
Resources
In general, the emphasis on products with higher contribution margin maximizes a firm's total net income, even
though total sales may decrease. This is not true, however, where there are constraining factors and scarce
resources. The constraining factor may be machine hours, labor hours, or cubic feet of warehouse space.
In the presence of these constraining factors, maximizing total profits depends on getting the highest contribution
margin per unit of the factor (rather than the highest contribution margin per unit of product output).
EXAMPLE 5
Assume that a company produces two products, A and B, with the following contribution margins per unit.
A B
Sales $8 $24
Variable costs 6 20
CM $2 $4
Annual fixed costs $42,000
As is indicated by CM per unit, B is more profitable than A since it contributes more to the company's total profits
than A ($4 vs. $2). But let us assume that the firm has a limited capacity of 10,000 labor hours. Further, assume that
A requires two labor hours to produce and B requires five labor hours. One way to express this limited capacity is to
determine the contribution margin per labor hour.
A B
CM/unit $2.00 $4.00
Labor hours required per unit 2 5
CM per labor hour $1.00 $0.80
Since A returns the higher CM per labor hour, it should be produced and B should be dropped. Another way to look
at the problem is to calculate total CM for each product.
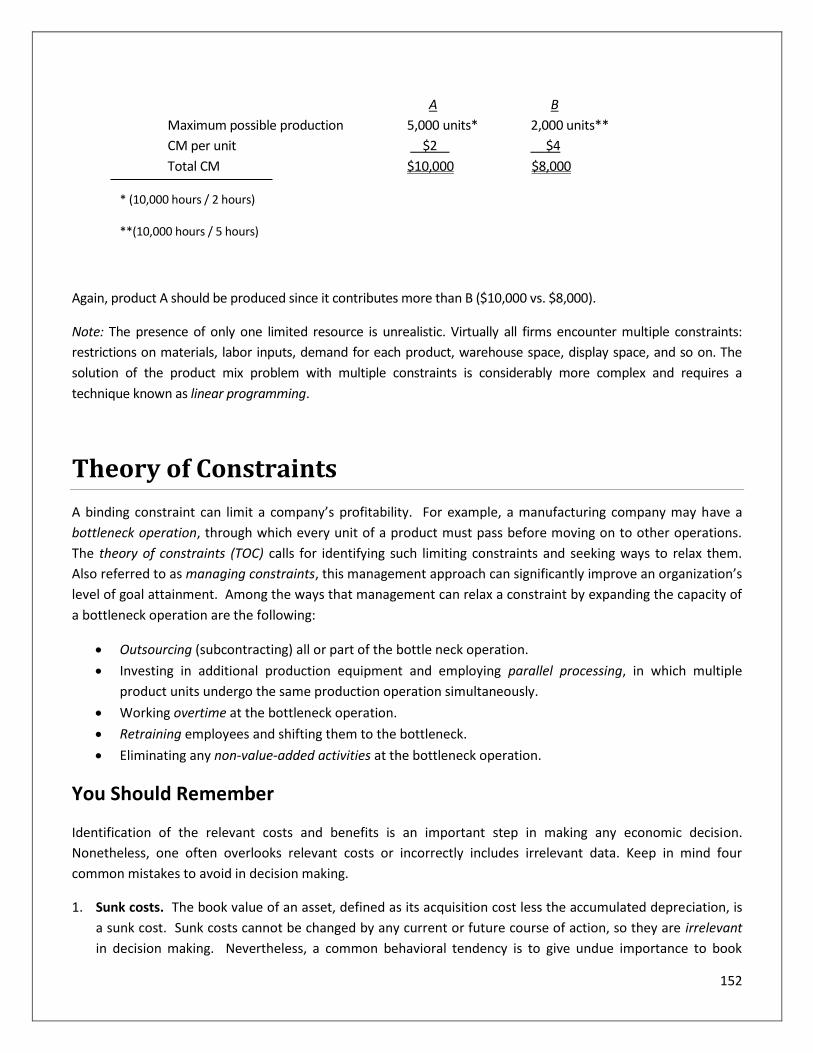
152
A B
Maximum possible production 5,000 units* 2,000 units**
CM per unit $2 $4
Total CM $10,000 $8,000
* (10,000 hours / 2 hours)
**(10,000 hours / 5 hours)
Again, product A should be produced since it contributes more than B ($10,000 vs. $8,000).
Note: The presence of only one limited resource is unrealistic. Virtually all firms encounter multiple constraints:
restrictions on materials, labor inputs, demand for each product, warehouse space, display space, and so on. The
solution of the product mix problem with multiple constraints is considerably more complex and requires a
technique known as linear programming.
Theory of Constraints
A binding constraint can limit a company’s profitability. For example, a manufacturing company may have a
bottleneck operation, through which every unit of a product must pass before moving on to other operations.
The theory of constraints (TOC) calls for identifying such limiting constraints and seeking ways to relax them.
Also referred to as managing constraints, this management approach can significantly improve an organization’s
level of goal attainment. Among the ways that management can relax a constraint by expanding the capacity of
a bottleneck operation are the following:
Outsourcing (subcontracting) all or part of the bottle neck operation.
Investing in additional production equipment and employing parallel processing, in which multiple
product units undergo the same production operation simultaneously.
Working overtime at the bottleneck operation.
Retraining employees and shifting them to the bottleneck.
Eliminating any non-value-added activities at the bottleneck operation.
You Should Remember
Identification of the relevant costs and benefits is an important step in making any economic decision.
Nonetheless, one often overlooks relevant costs or incorrectly includes irrelevant data. Keep in mind four
common mistakes to avoid in decision making.
1. Sunk costs. The book value of an asset, defined as its acquisition cost less the accumulated depreciation, is
a sunk cost. Sunk costs cannot be changed by any current or future course of action, so they are irrelevant
in decision making. Nevertheless, a common behavioral tendency is to give undue importance to book
153
values in decisions that involve replacing an asset or disposing of obsolete inventory. Managers often seek
to justify their past decisions by refusing to dispose of an asset, if a better alternative has been identified.
Ignore sunk costs.
2. Unitized fixed costs. For product-costing purposes, fixed costs are unitized (divided by some activity
measure) and assigned to individual units of product. The result is to make fixed cost appear variable.
While there are legitimate reasons for this practice, from a product-costing perspective, it can create
confusion in decision making. Therefore, in a decision analysis it is usually wise to include a fixed cost in its
total amount, rather than as a per-unit cost. Beware of unitized fixed costs in decision making.
3. Allocated fixed costs. It is also common to allocate fixed costs across divisions, departments, or product
lines. A possible result is that a product or department may appear unprofitable when in reality it does
make a contribution toward covering fixed costs and profit. Before deciding to eliminate a department, be
sure to ask which costs will be avoided if a particular alternative is selected. Beware of allocated fixed costs;
identify the avoidable costs.
4. Opportunity costs. Managers tend to overlook opportunity costs, or to treat such costs as less important
than out-of-pocket costs. Yet opportunity costs are just as real and important to making a correct decision,
as are out-of-pocket costs. Pay special attention to identifying and including opportunity costs in a decision
analysis.
154
Chapter 10 Review Questions
1. What are ‘relevant costs’?
A. All fixed and variable costs
B. Costs that would be incurred within the relevant range of production
C. Past costs that are expected to be different in the future
D. Anticipated future costs that will differ among various alternatives
2. Which one of the following costs would be relevant in short-term decision making?
A. Expected future costs that differ among alternatives
B. All costs of inventory
C. Total variable costs that are the same in the considered alternatives
D. Costs of fixed assets to be used in the alternatives
3. ___________________________ are the costs that cannot be changed by any present or future decision, so they
are irrelevant to a future decision.
A. Net realizable value
B. Relevant costs
C. Sunk costs
D. Incremental cost
4. What is a decision-making concept, described as "the contribution to income that is forgone by not using a limited
resource for its best alternative use," called?
A. Marginal cost
B. Incremental cost
C. Potential cost
D. Opportunity cost
5. Which of the following qualitative factors favors the buy choice in an insourcing vs. outsourcing (make or buy)
decision?
A. Maintaining a long-run relationship with suppliers is desirable
155
B. Quality control is critical
C. Not idle capacity
D. Cost savings is not pressing
6. When only differential manufacturing costs are taken into account for special-order pricing, what is an essential
assumption?
A. Manufacturing fixed and variable costs are linear.
B. Selling and administrative fixed and variable costs are linear.
C. Acceptance of the order will not affect regular sales.
D. Acceptance of the order will not cause unit selling and administrative variable costs to increase.
156
Chapter 11: Capital Budgeting Decisions
Learning Objectives:
After completing this section, you should be able to:
Identify different attributes and ratios used in capital budgeting decisions.
Calculate payback period for capital expenditures.
Capital budgeting is the process of making long-term planning decisions for alternative investment
opportunities. There are many investment decisions that the company may have to make in order to grow.
Examples of capital budgeting applications are product line selection, keep or sell a business segment, lease or
buy, and which asset to invest in.
There are typically two types of long-term investment decisions:
1. Selection decisions in terms of obtaining new facilities or expanding existing ones: Examples include:
Investments in property, plant, and equipment as well as other types of assets.
Resource commitments in the form of new product development, market research, introduction of
information technology (IT), refunding of long-term debt, and so on.
Mergers and acquisitions in the form of buying another company to add a new product line.
2. Replacement decisions in terms of replacing existing facilities with new ones. Examples include replacing an
old machine with a high-tech machine.
What Are the Features of Investment Projects?
Long-term investments have three important features:
157
1. They typically involve a large amount of initial cash outlays which tend to have a long-term impact on the firm's
future profitability. Therefore, this initial cash outlay needs to be justified on a cost-benefit basis.
2. There are expected recurring cash inflows (for example, increased revenues, savings in cash operating expenses,
etc.) over the life of the investment project. This frequently requires considering the time value of money.
3. Income taxes could make a difference in the accept or reject decision. Therefore, income tax factors must be
taken into account in every capital budgeting decision.
Understanding the Concept of Time Value of Money
The time value of money, a measure of financial opportunity costs, is the cost of money that is borrowed or lent. It is
based on the fact that a dollar received today is worth more than a dollar to be received one year from today. This
statement sums up an important principle: money has a time value. The truth of this principle is not that inflation might
make the dollar received at a later time worth less in buying power. The reason is that you could invest the dollar now
and have more than a dollar at the specified later date.
Time value of money is a critical consideration in financial and investment decisions. It has two major components:
future value and present value. Future value, which may be referred to as compounding is future sums of money
resulting from an investment. Present value, which is calculated through a process called discounting, is inversely
related to compounding and used to evaluate the future cash flow associated with capital budgeting projects. There are
numerous applications of the time value of money in accounting and finance.
What Is Present Value - How Much Money Is Worth Now?
Present value is the present worth of future sums of money. The process of calculating present values, or discounting, is
actually the opposite of finding the compounded future value. In connection with present value calculations, the
interest rate “i” is called the discount rate. The discount rate we use is more commonly called the cost of capital, which
is the minimum rate of return required by the investor.
The present value of $1 is given in Table 1.
EXAMPLE 1
You have been given an opportunity to receive $20,000 6 years from now. If you can earn 10 percent on your
investments, what is the most you should pay for this opportunity? To answer this question, you must compute the
present value of $20,000 to be received 6 years from now at a 10 percent rate of discount.
$20,000(0.564) = $11,280
This means that you can earn 10 percent on your investment, and you would be indifferent to receiving $11,280 now
or $20,000 6 years from today since the amounts are time equivalent. In other words, you could invest $11,300
today at 10 percent and have $20,000 in 6 years.
158
Present Value of Mixed Streams of Cash Flows
The present value of a series of mixed payments (or receipts) is the sum of the present value of each individual
payment. We know that the present value of each individual payment is the payment times the appropriate T1
value.
EXAMPLE 2
You are thinking of starting a new product line that initially costs $32,000. Your annual projected cash inflows
are:
1 $10,000
2 $20,000
3 $5,000
If you must earn a minimum of 10 percent on your investment, should you undertake this new product line?
The present value of this series of mixed streams of cash inflows is calculated as follows:
Year Cash inflows x T1(10%, n) Present Value
1 $10,000 0.909 $9,090
2 $20,000 0.826 $16,520
3 $5,000 0.751 $3,755
$29,365
Since the present value of your projected cash inflows is less than the initial investment, you should not undertake
this project.
Present Value of an Annuity
Interest received from bonds, pension funds, and insurance obligations all involve annuities. To compare these
financial instruments, we need to know the present value of each. The present value of an annuity can be found by
using Table 2.
EXAMPLE 3
Assume that the cash inflows in Example 6 form an annuity of $10,000 for 3 years. Then the present value is
$10,000 T2(10%, 3 years) = $10,000 (2.487) = $24,870
159
How Do You Measure Investment Worth?
Several methods of evaluating investment projects are as follows:
1. Payback period
2. Accounting rate of return (ARR)
3. Internal rate of return (IRR)
4. Net present value (NPV)
The NPV method and the IRR method are called discounted cash flow (DCF) methods. Each of these methods is
discussed below.
Payback Period
The payback period measures the length of time required to recover the amount of initial investment. It is computed
by dividing the initial investment by the cash inflows through increased revenues or cost savings.
Initial investment
Payback period =
Annual Cash Inflows
EXAMPLE 4
Assume:
Cost of investment = $18,000
Annual cash savings = $3,000
Then, the payback period is:
Initial investment $18,000 Payback period = = = 6 years Cost savings $3,000
Decision rule: Choose the project with the shorter payback period. The rationale behind this choice is: The shorter the
payback period, the less risky the project, and the greater the liquidity.
The advantages of using the payback period method of evaluating an investment project are that (1) it is simple to
compute and easy to understand, and (2) it handles investment risk effectively.
The shortcomings of this method are that (1) it does not recognize the time value of money, and (2) it ignores the
impact of cash inflows received after the payback period; essentially, cash flows after the payback period determine
profitability of an investment.
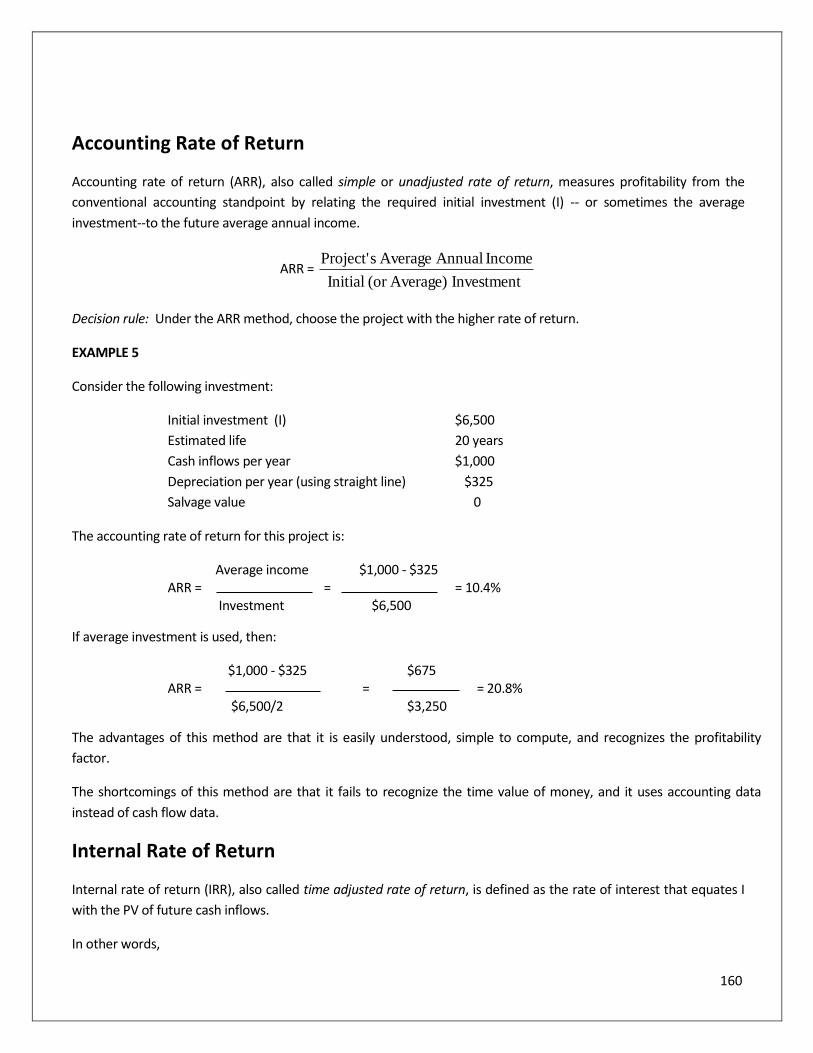
160
Accounting Rate of Return
Accounting rate of return (ARR), also called simple or unadjusted rate of return, measures profitability from the
conventional accounting standpoint by relating the required initial investment (I) -- or sometimes the average
investment--to the future average annual income.
ARR = Investment Average)(or Initial
Income Annual Average sProject'
Decision rule: Under the ARR method, choose the project with the higher rate of return.
EXAMPLE 5
Consider the following investment:
Initial investment (I) $6,500
Estimated life 20 years
Cash inflows per year $1,000
Depreciation per year (using straight line) $325
Salvage value 0
The accounting rate of return for this project is:
Average income $1,000 - $325 ARR = = = 10.4% Investment $6,500
If average investment is used, then:
$1,000 - $325 $675 ARR = = = 20.8% $6,500/2 $3,250
The advantages of this method are that it is easily understood, simple to compute, and recognizes the profitability
factor.
The shortcomings of this method are that it fails to recognize the time value of money, and it uses accounting data
instead of cash flow data.
Internal Rate of Return
Internal rate of return (IRR), also called time adjusted rate of return, is defined as the rate of interest that equates I
with the PV of future cash inflows.
In other words,
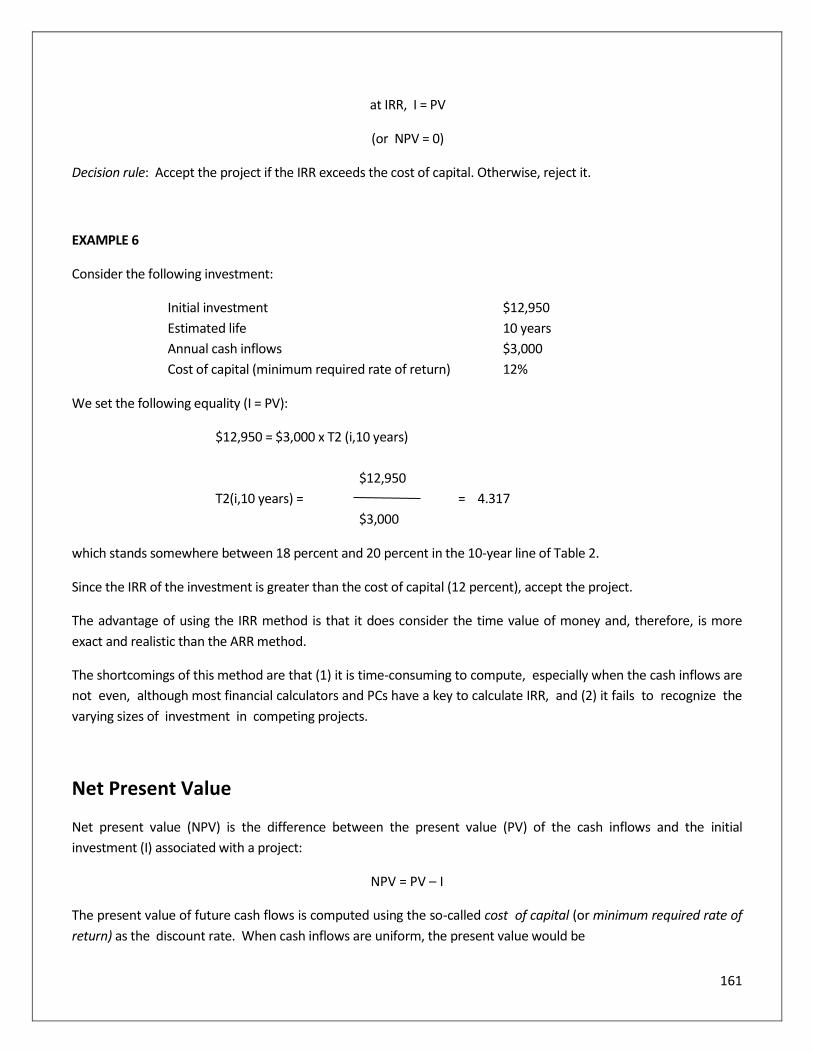
161
at IRR, I = PV
(or NPV = 0)
Decision rule: Accept the project if the IRR exceeds the cost of capital. Otherwise, reject it.
EXAMPLE 6
Consider the following investment:
Initial investment $12,950
Estimated life 10 years
Annual cash inflows $3,000
Cost of capital (minimum required rate of return) 12%
We set the following equality (I = PV):
$12,950 = $3,000 x T2 (i,10 years)
$12,950
T2(i,10 years) = = 4.317
$3,000
which stands somewhere between 18 percent and 20 percent in the 10-year line of Table 2.
Since the IRR of the investment is greater than the cost of capital (12 percent), accept the project.
The advantage of using the IRR method is that it does consider the time value of money and, therefore, is more
exact and realistic than the ARR method.
The shortcomings of this method are that (1) it is time-consuming to compute, especially when the cash inflows are
not even, although most financial calculators and PCs have a key to calculate IRR, and (2) it fails to recognize the
varying sizes of investment in competing projects.
Net Present Value
Net present value (NPV) is the difference between the present value (PV) of the cash inflows and the initial
investment (I) associated with a project:
NPV = PV – I
The present value of future cash flows is computed using the so-called cost of capital (or minimum required rate of
return) as the discount rate. When cash inflows are uniform, the present value would be
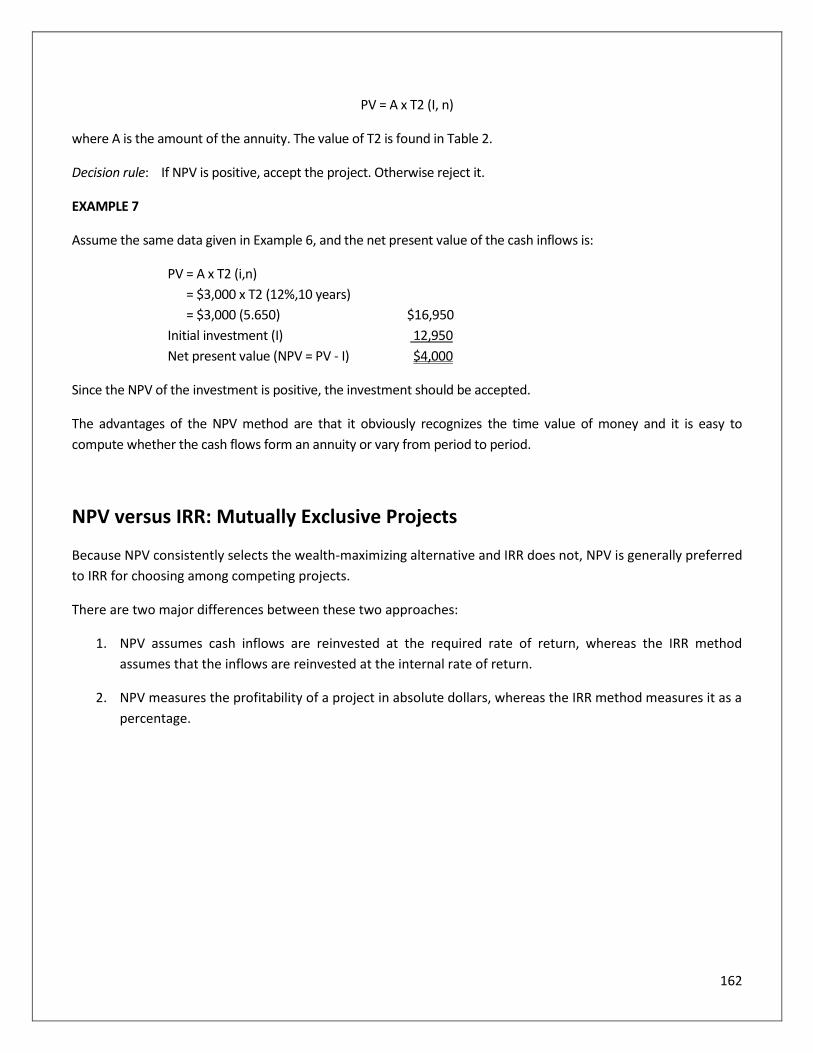
162
PV = A x T2 (I, n)
where A is the amount of the annuity. The value of T2 is found in Table 2.
Decision rule: If NPV is positive, accept the project. Otherwise reject it.
EXAMPLE 7
Assume the same data given in Example 6, and the net present value of the cash inflows is:
PV = A x T2 (i,n)
= $3,000 x T2 (12%,10 years)
= $3,000 (5.650) $16,950
Initial investment (I) 12,950
Net present value (NPV = PV - I) $4,000
Since the NPV of the investment is positive, the investment should be accepted.
The advantages of the NPV method are that it obviously recognizes the time value of money and it is easy to
compute whether the cash flows form an annuity or vary from period to period.
NPV versus IRR: Mutually Exclusive Projects
Because NPV consistently selects the wealth-maximizing alternative and IRR does not, NPV is generally preferred
to IRR for choosing among competing projects.
There are two major differences between these two approaches:
1. NPV assumes cash inflows are reinvested at the required rate of return, whereas the IRR method
assumes that the inflows are reinvested at the internal rate of return.
2. NPV measures the profitability of a project in absolute dollars, whereas the IRR method measures it as a
percentage.
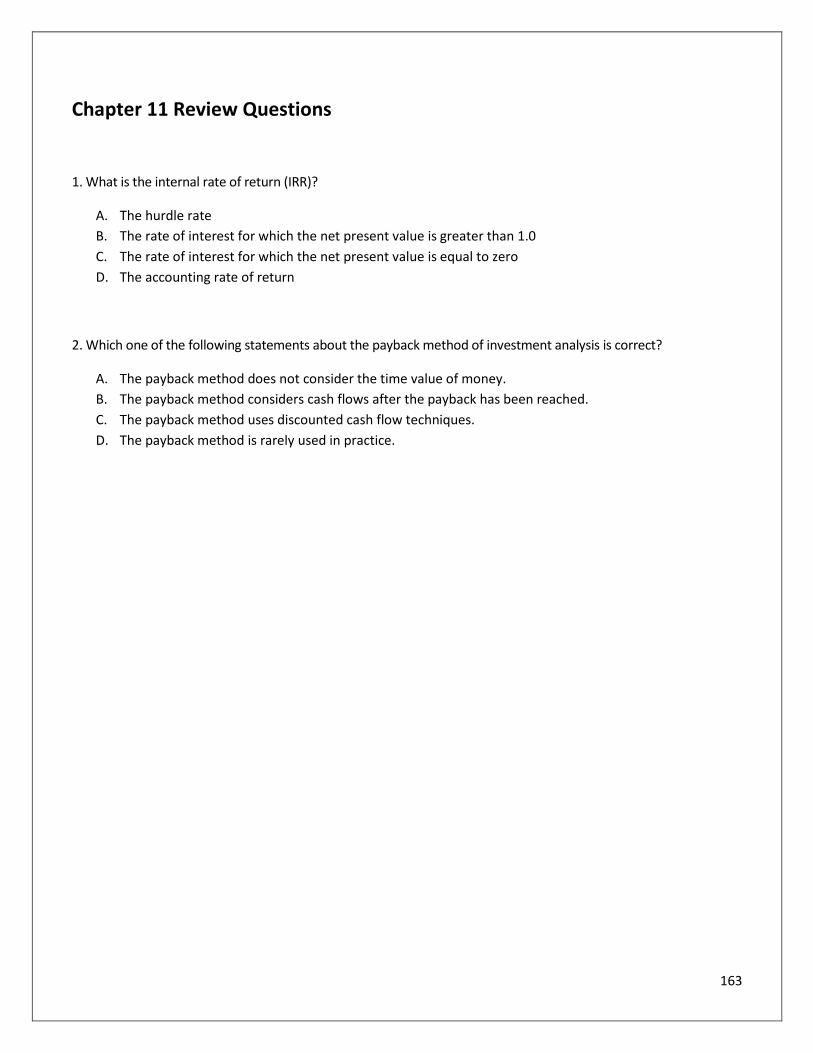
163
Chapter 11 Review Questions
1. What is the internal rate of return (IRR)?
A. The hurdle rate
B. The rate of interest for which the net present value is greater than 1.0
C. The rate of interest for which the net present value is equal to zero
D. The accounting rate of return
2. Which one of the following statements about the payback method of investment analysis is correct?
A. The payback method does not consider the time value of money.
B. The payback method considers cash flows after the payback has been reached.
C. The payback method uses discounted cash flow techniques.
D. The payback method is rarely used in practice.
164
Glossary
Accounting equation: Assets – Liabilities = Owner Equity.
Accounting periods: Time intervals of equal length spanning the life of a business.
Accounting principles: Broadly defined rules adopted by the accounting profession for use as guides in
recording and reporting the affairs and activities of a business.
Accounting system: The business papers, records, reports, and procedures that are utilized in recording and
reporting transactions.
Accounts receivable turnover: A calculation of the speed with which accounts receivable are collected (credit sales divided by the average receivable balance).
Accrual basis of accounting: Revenues are assigned to the period in which they are earned, and expenses are
assigned to the period in which they are incurred.
Acid-test ratio: A calculation of a firm’s liquidity position, that is, the ratio of its “quick” assets (readily convertible to cash) to current liabilities.
Book value per share: A measure of the equity of a share of stock in the assets of the issuing corporation.
Break-even point: The point where total revenue received is exactly equal to the sum of the fixed and variable costs at that particular level of activity.
Budget: A managerial plan of proposed operations to accomplish financial objectives.
165
Capital budgeting: The process of making long-term planning decisions for capital investments.
Cash basis: A method of revenue realization in which revenue is not recognized until cash is actually collected and expenses are recognized as cash is paid.
Cash budget: A budget for cash planning and control that presents anticipated cash inflow and cash outflow for a
specified time period. The cash budget helps the owner keep cash balances in reasonable relationship to needs. It
assists in avoiding idle cash and possible cash shortages. The cash budget shows beginning cash, cash receipts, cash
payments, and ending cash.
Cash flow: Relates to the inflow and outflow of cash only. The receipt and disbursement of cash.
Common-size comparative statements: The total assets, liabilities, and stockholders equity, or net income (for a comparative income statement), are assigned a value of 100 percent; and each individual item is shown as a percentage of 100 percent. Changes in proportions may then be shown and emphasized.
Common stock: Stock issued by a corporation, giving the stockholder specific rights granted by the corporations charter. When only one type of stock is issued it is known as common stock.
Controllable costs: Those costs over which the department’s manager has some influence or control.
Contribution margin per unit: The amount that the sale of one unit contributes toward payment of fixed expenses. The difference between the selling puce and the variable cost per unit of product.
Contribution margin ratio: The contribution margin of a product expressed as a percentage of the sales price.
Cost center: A unit or activity for which costs are collected.
Cost-volume-profit (CVP) analysis: An analysis that deals with how profits and costs change with a change in
volume. It looks at the effects on profits of changes in such factors as variables costs, fixed costs, selling prices,
volume, and mix of products sold.
166
Current ratio: A measure of a firm’s debt-paying ability. Current assets divided by current liabilities.
Direct expenses: Expenses of a department which are incurred for the direct benefit of that specific department.
Direct labor: The cost of labor which is chargeable directly to the product(s) manufactured.
Direct materials: Materials that are chargeable directly to and become a part of the product or products manufactured.
Double entry bookkeeping: A method of accounting that recognizes the duality of a transaction such that any a
change in one account also causes a change in another account.
Earnings per share: A measure of a firm’s ability to earn a return for its stockholders, calculated by dividing net income by the number of shares outstanding.
Factory overhead: All costs related to manufacturing other than for direct materials and direct labor.
Financial Accounting Standards Board (FASB): The seven-member board which currently has the authority to
formulate and issue pronouncements of generally accepted accounting principles.
Fixed budget: A budget in which all plans are based on one “fixed” level of activity.
Flexible budget: A budget that provides cost and expense estimates for each of the several production levels that may be experienced.
Generally Accepted Accounting Principles (GAAP): Rules, regulations, standards, conventions, and
pronouncements used as a basis for financial reporting, and in the preparation of financial statements.
167
Gross income: All income from whatever source derived, unless expressly excluded by law.
Indirect expenses: Expenses that are incurred for the joint benefit of more~ than one department, such as heat, rent, power, etc.
Inventory turnover: The number of times a firm’s average inventory is sold during an accounting period.
Job cost sheets: Comprise the Job Cost Ledger and are used to accumulate costs by jobs.
Job order cost system: A system in which costs are assembled in terms of jobs or job lots of product.
Joint cost: A single cost incurred to secure two or more essentially different products.
Journal: A book in which all business transactions are recorded in chronological order.
Just-In-Time (JIT): A demand-pull system where demand for customer output (not plans for using input resources)
triggers production. Production activities are "pulled", not "pushed," into action.
Market value per share: The price at which a share can be sold.
Out-of-pocket cost: A cost requiring the current or future outlay of funds.
Overapplied overhead: When the Overhead Cost account has a credit balance (actual overhead less than overhead applied).
Payback period: The period required to recover the investment in an asset. A method utilized by management to evaluate the profitability of alternative investment proposals.
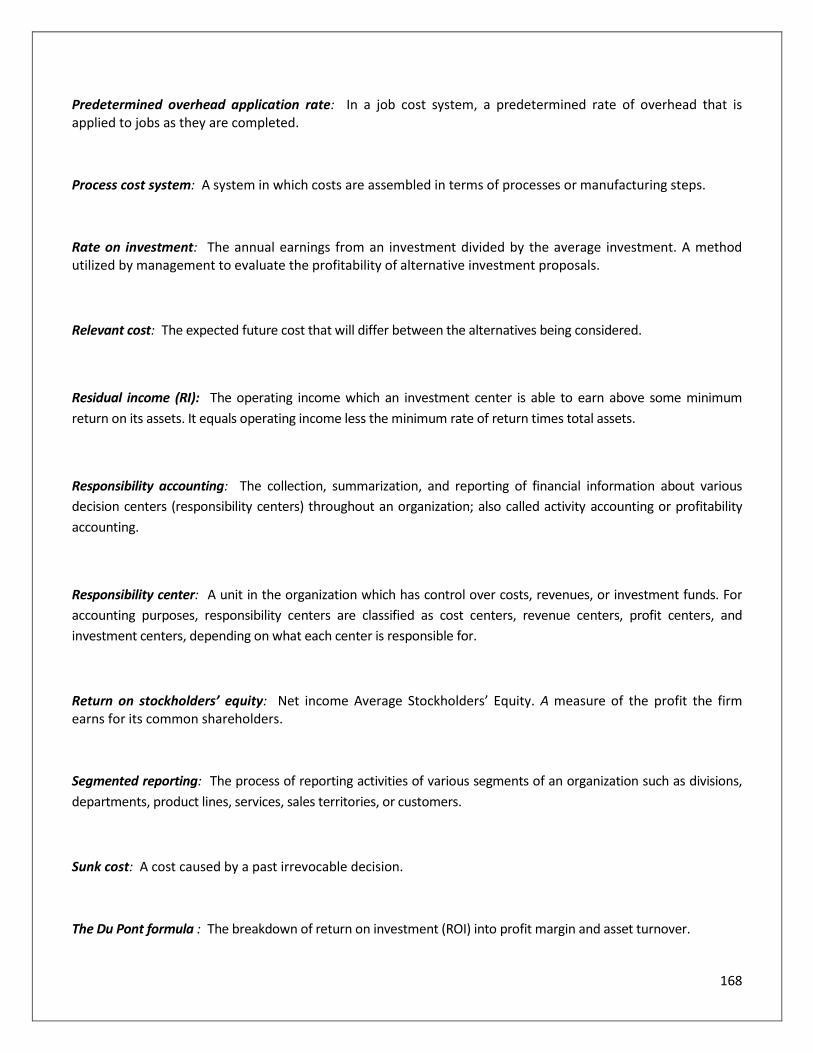
168
Predetermined overhead application rate: In a job cost system, a predetermined rate of overhead that is applied to jobs as they are completed.
Process cost system: A system in which costs are assembled in terms of processes or manufacturing steps.
Rate on investment: The annual earnings from an investment divided by the average investment. A method utilized by management to evaluate the profitability of alternative investment proposals.
Relevant cost: The expected future cost that will differ between the alternatives being considered.
Residual income (RI): The operating income which an investment center is able to earn above some minimum
return on its assets. It equals operating income less the minimum rate of return times total assets.
Responsibility accounting: The collection, summarization, and reporting of financial information about various
decision centers (responsibility centers) throughout an organization; also called activity accounting or profitability
accounting.
Responsibility center: A unit in the organization which has control over costs, revenues, or investment funds. For
accounting purposes, responsibility centers are classified as cost centers, revenue centers, profit centers, and
investment centers, depending on what each center is responsible for.
Return on stockholders’ equity: Net income Average Stockholders’ Equity. A measure of the profit the firm earns for its common shareholders.
Segmented reporting: The process of reporting activities of various segments of an organization such as divisions,
departments, product lines, services, sales territories, or customers.
Sunk cost: A cost caused by a past irrevocable decision.
The Du Pont formula : The breakdown of return on investment (ROI) into profit margin and asset turnover.
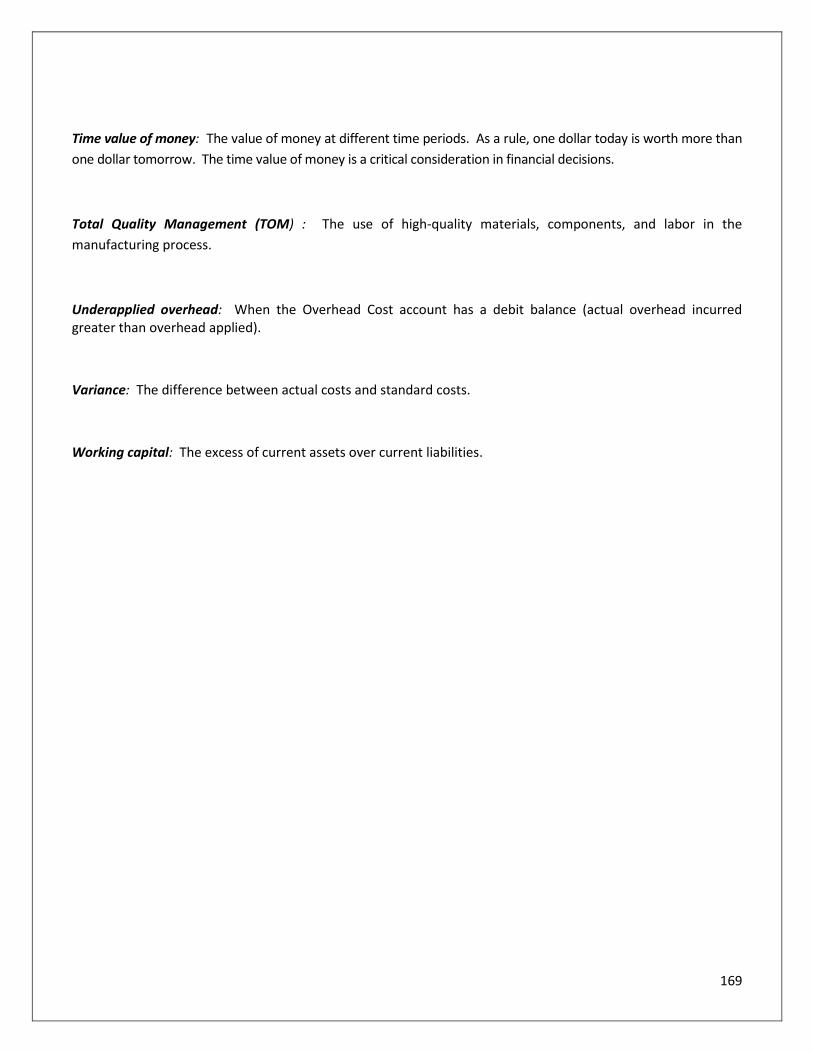
169
Time value of money: The value of money at different time periods. As a rule, one dollar today is worth more than
one dollar tomorrow. The time value of money is a critical consideration in financial decisions.
Total Quality Management (TOM) : The use of high-quality materials, components, and labor in the
manufacturing process.
Underapplied overhead: When the Overhead Cost account has a debit balance (actual overhead incurred greater than overhead applied).
Variance: The difference between actual costs and standard costs.
Working capital: The excess of current assets over current liabilities.
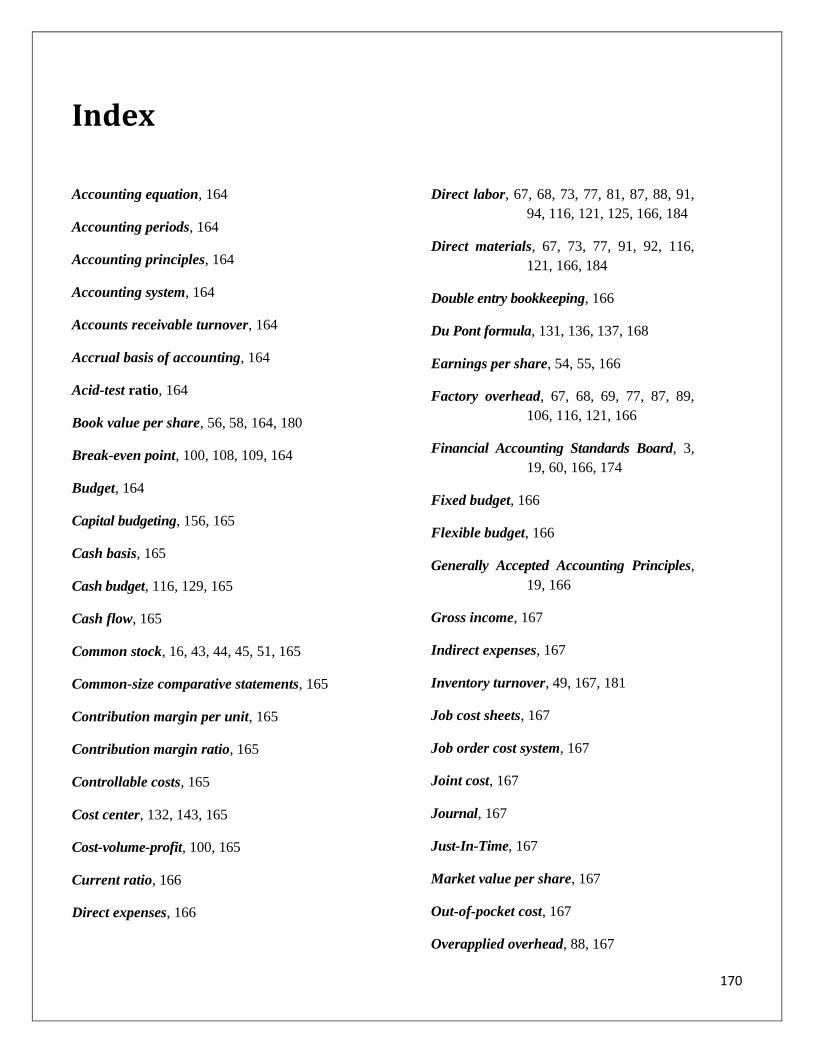
170
Index
Accounting equation, 164
Accounting periods, 164
Accounting principles, 164
Accounting system, 164
Accounts receivable turnover, 164
Accrual basis of accounting, 164
Acid-test ratio, 164
Book value per share, 56, 58, 164, 180
Break-even point, 100, 108, 109, 164
Budget, 164
Capital budgeting, 156, 165
Cash basis, 165
Cash budget, 116, 129, 165
Cash flow, 165
Common stock, 16, 43, 44, 45, 51, 165
Common-size comparative statements, 165
Contribution margin per unit, 165
Contribution margin ratio, 165
Controllable costs, 165
Cost center, 132, 143, 165
Cost-volume-profit, 100, 165
Current ratio, 166
Direct expenses, 166
Direct labor, 67, 68, 73, 77, 81, 87, 88, 91,
94, 116, 121, 125, 166, 184
Direct materials, 67, 73, 77, 91, 92, 116,
121, 166, 184
Double entry bookkeeping, 166
Du Pont formula, 131, 136, 137, 168
Earnings per share, 54, 55, 166
Factory overhead, 67, 68, 69, 77, 87, 89,
106, 116, 121, 166
Financial Accounting Standards Board, 3,
19, 60, 166, 174
Fixed budget, 166
Flexible budget, 166
Generally Accepted Accounting Principles,
19, 166
Gross income, 167
Indirect expenses, 167
Inventory turnover, 49, 167, 181
Job cost sheets, 167
Job order cost system, 167
Joint cost, 167
Journal, 167
Just-In-Time, 167
Market value per share, 167
Out-of-pocket cost, 167
Overapplied overhead, 88, 167
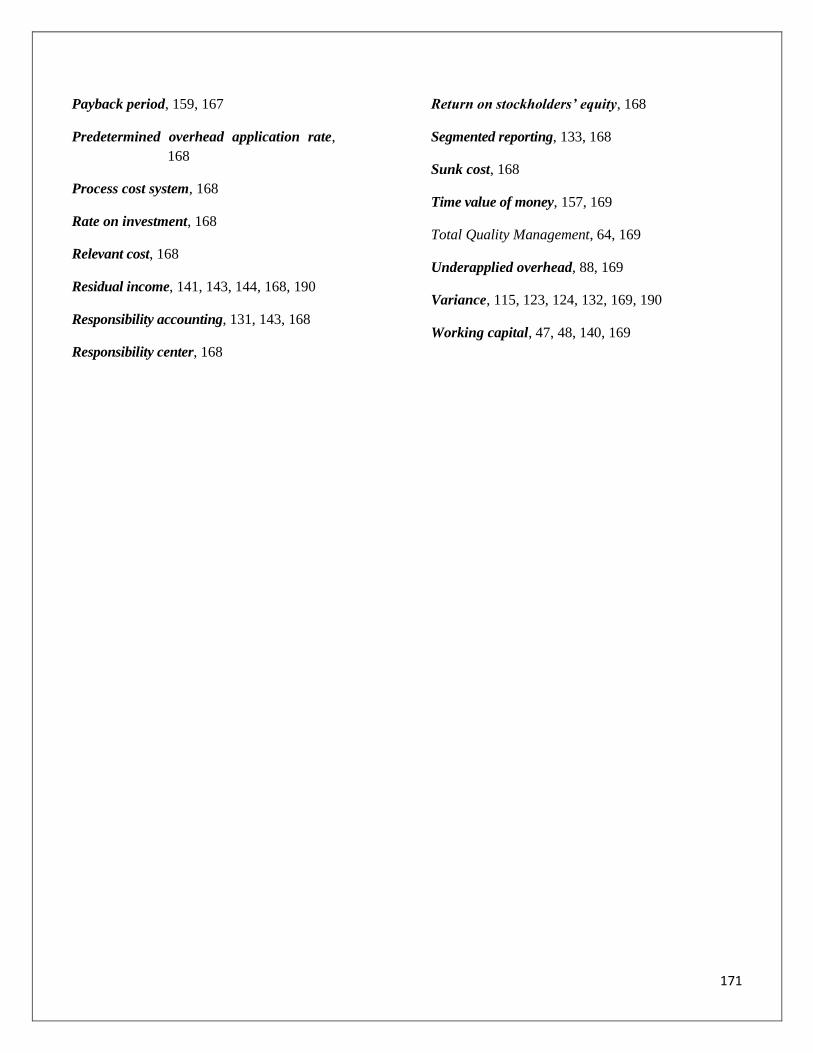
171
Payback period, 159, 167
Predetermined overhead application rate,
168
Process cost system, 168
Rate on investment, 168
Relevant cost, 168
Residual income, 141, 143, 144, 168, 190
Responsibility accounting, 131, 143, 168
Responsibility center, 168
Return on stockholders’ equity, 168
Segmented reporting, 133, 168
Sunk cost, 168
Time value of money, 157, 169
Total Quality Management, 64, 169
Underapplied overhead, 88, 169
Variance, 115, 123, 124, 132, 169, 190
Working capital, 47, 48, 140, 169
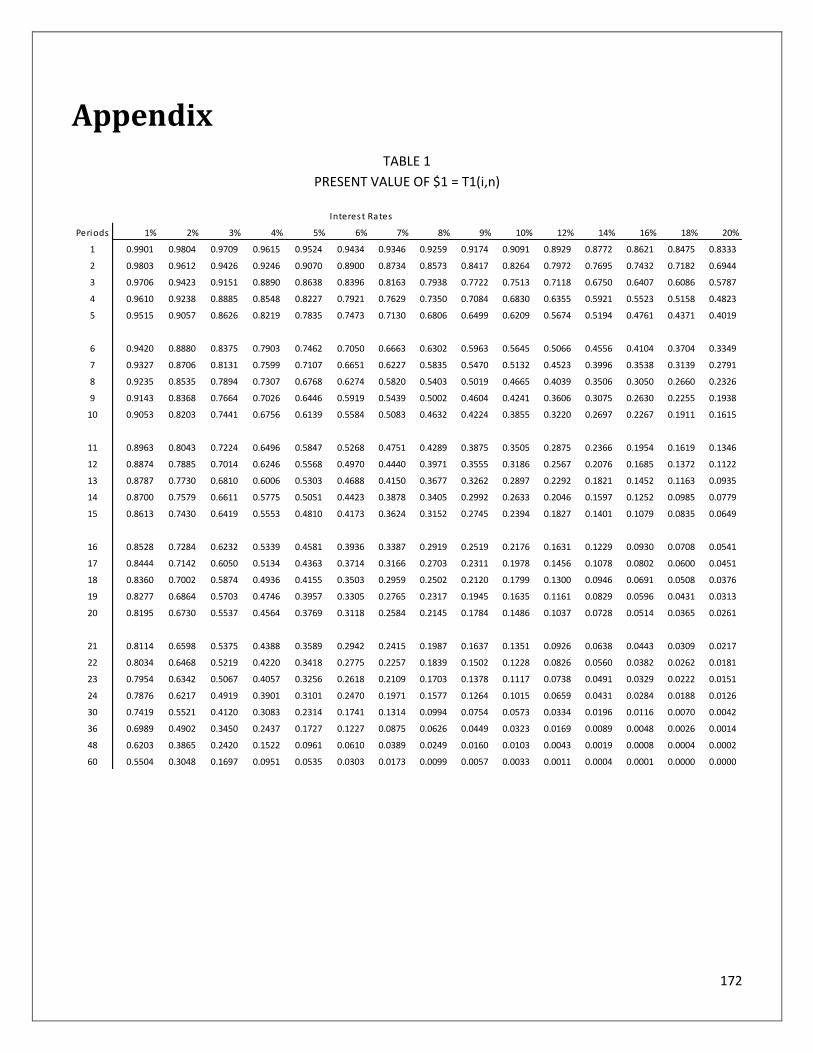
172
Appendix TABLE 1
PRESENT VALUE OF $1 = T1(i,n)
Interest Rates
Periods 1% 2% 3% 4% 5% 6% 7% 8% 9% 10% 12% 14% 16% 18% 20%
1 0.9901 0.9804 0.9709 0.9615 0.9524 0.9434 0.9346 0.9259 0.9174 0.9091 0.8929 0.8772 0.8621 0.8475 0.8333
2 0.9803 0.9612 0.9426 0.9246 0.9070 0.8900 0.8734 0.8573 0.8417 0.8264 0.7972 0.7695 0.7432 0.7182 0.6944
3 0.9706 0.9423 0.9151 0.8890 0.8638 0.8396 0.8163 0.7938 0.7722 0.7513 0.7118 0.6750 0.6407 0.6086 0.5787
4 0.9610 0.9238 0.8885 0.8548 0.8227 0.7921 0.7629 0.7350 0.7084 0.6830 0.6355 0.5921 0.5523 0.5158 0.4823
5 0.9515 0.9057 0.8626 0.8219 0.7835 0.7473 0.7130 0.6806 0.6499 0.6209 0.5674 0.5194 0.4761 0.4371 0.4019
6 0.9420 0.8880 0.8375 0.7903 0.7462 0.7050 0.6663 0.6302 0.5963 0.5645 0.5066 0.4556 0.4104 0.3704 0.3349
7 0.9327 0.8706 0.8131 0.7599 0.7107 0.6651 0.6227 0.5835 0.5470 0.5132 0.4523 0.3996 0.3538 0.3139 0.2791
8 0.9235 0.8535 0.7894 0.7307 0.6768 0.6274 0.5820 0.5403 0.5019 0.4665 0.4039 0.3506 0.3050 0.2660 0.2326
9 0.9143 0.8368 0.7664 0.7026 0.6446 0.5919 0.5439 0.5002 0.4604 0.4241 0.3606 0.3075 0.2630 0.2255 0.1938
10 0.9053 0.8203 0.7441 0.6756 0.6139 0.5584 0.5083 0.4632 0.4224 0.3855 0.3220 0.2697 0.2267 0.1911 0.1615
11 0.8963 0.8043 0.7224 0.6496 0.5847 0.5268 0.4751 0.4289 0.3875 0.3505 0.2875 0.2366 0.1954 0.1619 0.1346
12 0.8874 0.7885 0.7014 0.6246 0.5568 0.4970 0.4440 0.3971 0.3555 0.3186 0.2567 0.2076 0.1685 0.1372 0.1122
13 0.8787 0.7730 0.6810 0.6006 0.5303 0.4688 0.4150 0.3677 0.3262 0.2897 0.2292 0.1821 0.1452 0.1163 0.0935
14 0.8700 0.7579 0.6611 0.5775 0.5051 0.4423 0.3878 0.3405 0.2992 0.2633 0.2046 0.1597 0.1252 0.0985 0.0779
15 0.8613 0.7430 0.6419 0.5553 0.4810 0.4173 0.3624 0.3152 0.2745 0.2394 0.1827 0.1401 0.1079 0.0835 0.0649
16 0.8528 0.7284 0.6232 0.5339 0.4581 0.3936 0.3387 0.2919 0.2519 0.2176 0.1631 0.1229 0.0930 0.0708 0.0541
17 0.8444 0.7142 0.6050 0.5134 0.4363 0.3714 0.3166 0.2703 0.2311 0.1978 0.1456 0.1078 0.0802 0.0600 0.0451
18 0.8360 0.7002 0.5874 0.4936 0.4155 0.3503 0.2959 0.2502 0.2120 0.1799 0.1300 0.0946 0.0691 0.0508 0.0376
19 0.8277 0.6864 0.5703 0.4746 0.3957 0.3305 0.2765 0.2317 0.1945 0.1635 0.1161 0.0829 0.0596 0.0431 0.0313
20 0.8195 0.6730 0.5537 0.4564 0.3769 0.3118 0.2584 0.2145 0.1784 0.1486 0.1037 0.0728 0.0514 0.0365 0.0261
21 0.8114 0.6598 0.5375 0.4388 0.3589 0.2942 0.2415 0.1987 0.1637 0.1351 0.0926 0.0638 0.0443 0.0309 0.0217
22 0.8034 0.6468 0.5219 0.4220 0.3418 0.2775 0.2257 0.1839 0.1502 0.1228 0.0826 0.0560 0.0382 0.0262 0.0181
23 0.7954 0.6342 0.5067 0.4057 0.3256 0.2618 0.2109 0.1703 0.1378 0.1117 0.0738 0.0491 0.0329 0.0222 0.0151
24 0.7876 0.6217 0.4919 0.3901 0.3101 0.2470 0.1971 0.1577 0.1264 0.1015 0.0659 0.0431 0.0284 0.0188 0.0126
30 0.7419 0.5521 0.4120 0.3083 0.2314 0.1741 0.1314 0.0994 0.0754 0.0573 0.0334 0.0196 0.0116 0.0070 0.0042
36 0.6989 0.4902 0.3450 0.2437 0.1727 0.1227 0.0875 0.0626 0.0449 0.0323 0.0169 0.0089 0.0048 0.0026 0.0014
48 0.6203 0.3865 0.2420 0.1522 0.0961 0.0610 0.0389 0.0249 0.0160 0.0103 0.0043 0.0019 0.0008 0.0004 0.0002
60 0.5504 0.3048 0.1697 0.0951 0.0535 0.0303 0.0173 0.0099 0.0057 0.0033 0.0011 0.0004 0.0001 0.0000 0.0000
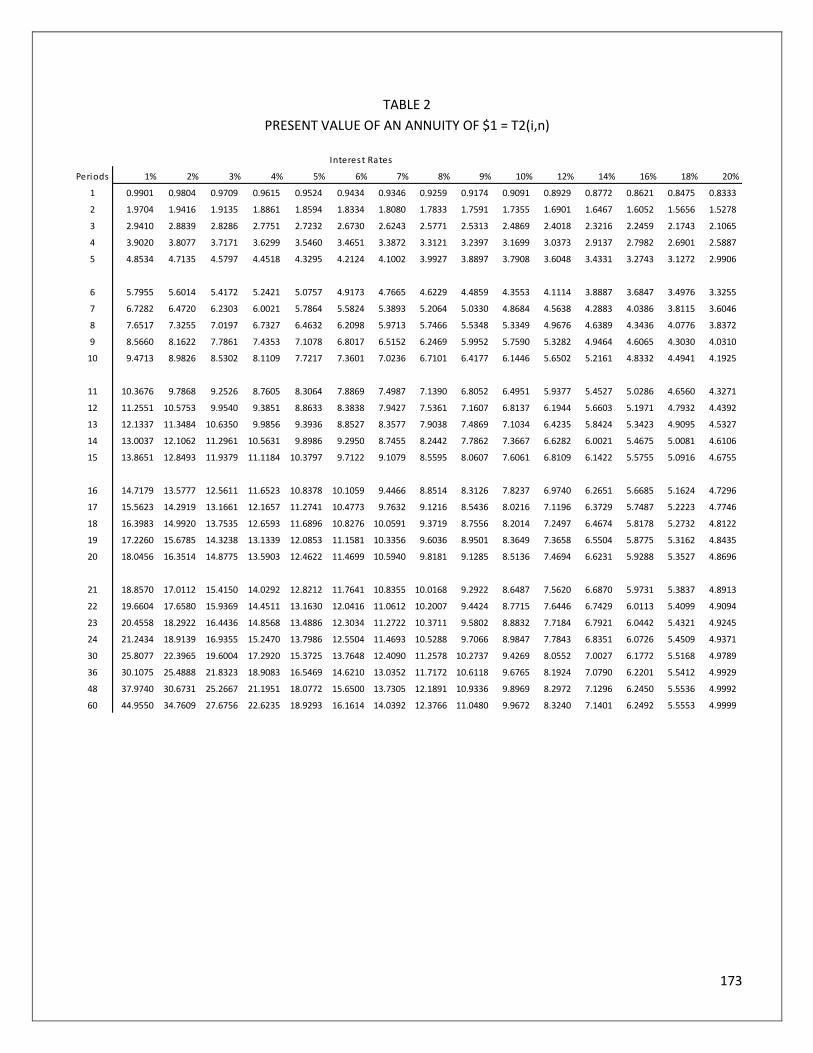
173
TABLE 2
PRESENT VALUE OF AN ANNUITY OF $1 = T2(i,n)
Interest Rates
Periods 1% 2% 3% 4% 5% 6% 7% 8% 9% 10% 12% 14% 16% 18% 20%
1 0.9901 0.9804 0.9709 0.9615 0.9524 0.9434 0.9346 0.9259 0.9174 0.9091 0.8929 0.8772 0.8621 0.8475 0.8333
2 1.9704 1.9416 1.9135 1.8861 1.8594 1.8334 1.8080 1.7833 1.7591 1.7355 1.6901 1.6467 1.6052 1.5656 1.5278
3 2.9410 2.8839 2.8286 2.7751 2.7232 2.6730 2.6243 2.5771 2.5313 2.4869 2.4018 2.3216 2.2459 2.1743 2.1065
4 3.9020 3.8077 3.7171 3.6299 3.5460 3.4651 3.3872 3.3121 3.2397 3.1699 3.0373 2.9137 2.7982 2.6901 2.5887
5 4.8534 4.7135 4.5797 4.4518 4.3295 4.2124 4.1002 3.9927 3.8897 3.7908 3.6048 3.4331 3.2743 3.1272 2.9906
6 5.7955 5.6014 5.4172 5.2421 5.0757 4.9173 4.7665 4.6229 4.4859 4.3553 4.1114 3.8887 3.6847 3.4976 3.3255
7 6.7282 6.4720 6.2303 6.0021 5.7864 5.5824 5.3893 5.2064 5.0330 4.8684 4.5638 4.2883 4.0386 3.8115 3.6046
8 7.6517 7.3255 7.0197 6.7327 6.4632 6.2098 5.9713 5.7466 5.5348 5.3349 4.9676 4.6389 4.3436 4.0776 3.8372
9 8.5660 8.1622 7.7861 7.4353 7.1078 6.8017 6.5152 6.2469 5.9952 5.7590 5.3282 4.9464 4.6065 4.3030 4.0310
10 9.4713 8.9826 8.5302 8.1109 7.7217 7.3601 7.0236 6.7101 6.4177 6.1446 5.6502 5.2161 4.8332 4.4941 4.1925
11 10.3676 9.7868 9.2526 8.7605 8.3064 7.8869 7.4987 7.1390 6.8052 6.4951 5.9377 5.4527 5.0286 4.6560 4.3271
12 11.2551 10.5753 9.9540 9.3851 8.8633 8.3838 7.9427 7.5361 7.1607 6.8137 6.1944 5.6603 5.1971 4.7932 4.4392
13 12.1337 11.3484 10.6350 9.9856 9.3936 8.8527 8.3577 7.9038 7.4869 7.1034 6.4235 5.8424 5.3423 4.9095 4.5327
14 13.0037 12.1062 11.2961 10.5631 9.8986 9.2950 8.7455 8.2442 7.7862 7.3667 6.6282 6.0021 5.4675 5.0081 4.6106
15 13.8651 12.8493 11.9379 11.1184 10.3797 9.7122 9.1079 8.5595 8.0607 7.6061 6.8109 6.1422 5.5755 5.0916 4.6755
16 14.7179 13.5777 12.5611 11.6523 10.8378 10.1059 9.4466 8.8514 8.3126 7.8237 6.9740 6.2651 5.6685 5.1624 4.7296
17 15.5623 14.2919 13.1661 12.1657 11.2741 10.4773 9.7632 9.1216 8.5436 8.0216 7.1196 6.3729 5.7487 5.2223 4.7746
18 16.3983 14.9920 13.7535 12.6593 11.6896 10.8276 10.0591 9.3719 8.7556 8.2014 7.2497 6.4674 5.8178 5.2732 4.8122
19 17.2260 15.6785 14.3238 13.1339 12.0853 11.1581 10.3356 9.6036 8.9501 8.3649 7.3658 6.5504 5.8775 5.3162 4.8435
20 18.0456 16.3514 14.8775 13.5903 12.4622 11.4699 10.5940 9.8181 9.1285 8.5136 7.4694 6.6231 5.9288 5.3527 4.8696
21 18.8570 17.0112 15.4150 14.0292 12.8212 11.7641 10.8355 10.0168 9.2922 8.6487 7.5620 6.6870 5.9731 5.3837 4.8913
22 19.6604 17.6580 15.9369 14.4511 13.1630 12.0416 11.0612 10.2007 9.4424 8.7715 7.6446 6.7429 6.0113 5.4099 4.9094
23 20.4558 18.2922 16.4436 14.8568 13.4886 12.3034 11.2722 10.3711 9.5802 8.8832 7.7184 6.7921 6.0442 5.4321 4.9245
24 21.2434 18.9139 16.9355 15.2470 13.7986 12.5504 11.4693 10.5288 9.7066 8.9847 7.7843 6.8351 6.0726 5.4509 4.9371
30 25.8077 22.3965 19.6004 17.2920 15.3725 13.7648 12.4090 11.2578 10.2737 9.4269 8.0552 7.0027 6.1772 5.5168 4.9789
36 30.1075 25.4888 21.8323 18.9083 16.5469 14.6210 13.0352 11.7172 10.6118 9.6765 8.1924 7.0790 6.2201 5.5412 4.9929
48 37.9740 30.6731 25.2667 21.1951 18.0772 15.6500 13.7305 12.1891 10.9336 9.8969 8.2972 7.1296 6.2450 5.5536 4.9992
60 44.9550 34.7609 27.6756 22.6235 18.9293 16.1614 14.0392 12.3766 11.0480 9.9672 8.3240 7.1401 6.2492 5.5553 4.9999
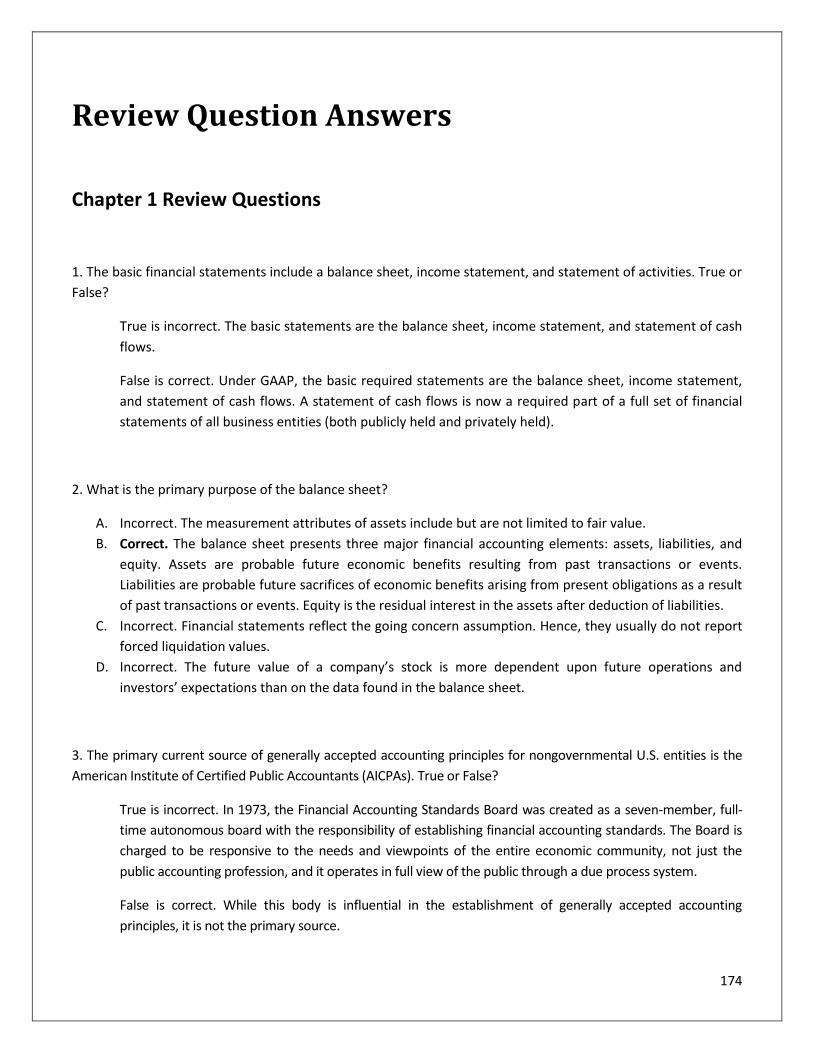
174
Review Question Answers
Chapter 1 Review Questions
1. The basic financial statements include a balance sheet, income statement, and statement of activities. True or
False?
True is incorrect. The basic statements are the balance sheet, income statement, and statement of cash
flows.
False is correct. Under GAAP, the basic required statements are the balance sheet, income statement,
and statement of cash flows. A statement of cash flows is now a required part of a full set of financial
statements of all business entities (both publicly held and privately held).
2. What is the primary purpose of the balance sheet?
A. Incorrect. The measurement attributes of assets include but are not limited to fair value.
B. Correct. The balance sheet presents three major financial accounting elements: assets, liabilities, and
equity. Assets are probable future economic benefits resulting from past transactions or events.
Liabilities are probable future sacrifices of economic benefits arising from present obligations as a result
of past transactions or events. Equity is the residual interest in the assets after deduction of liabilities.
C. Incorrect. Financial statements reflect the going concern assumption. Hence, they usually do not report
forced liquidation values.
D. Incorrect. The future value of a company’s stock is more dependent upon future operations and
investors’ expectations than on the data found in the balance sheet.
3. The primary current source of generally accepted accounting principles for nongovernmental U.S. entities is the
American Institute of Certified Public Accountants (AICPAs). True or False?
True is incorrect. In 1973, the Financial Accounting Standards Board was created as a seven-member, full-
time autonomous board with the responsibility of establishing financial accounting standards. The Board is
charged to be responsive to the needs and viewpoints of the entire economic community, not just the
public accounting profession, and it operates in full view of the public through a due process system.
False is correct. While this body is influential in the establishment of generally accepted accounting
principles, it is not the primary source.
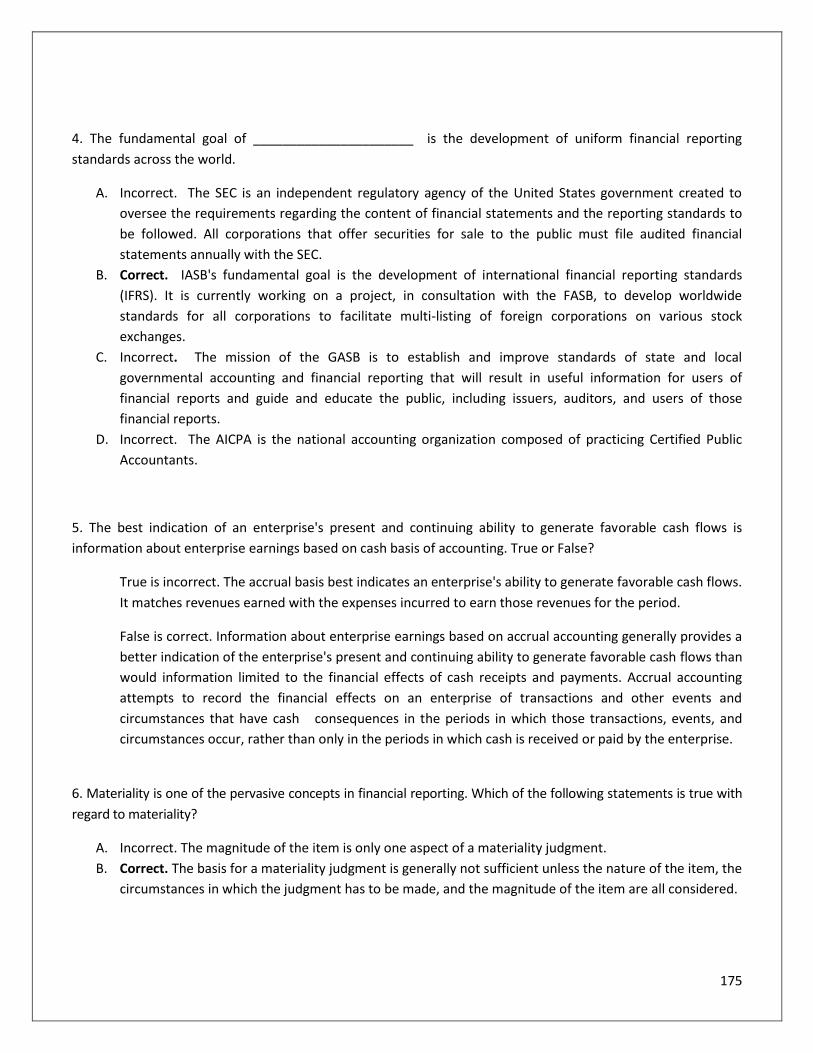
175
4. The fundamental goal of ______________________ is the development of uniform financial reporting
standards across the world.
A. Incorrect. The SEC is an independent regulatory agency of the United States government created to
oversee the requirements regarding the content of financial statements and the reporting standards to
be followed. All corporations that offer securities for sale to the public must file audited financial
statements annually with the SEC.
B. Correct. IASB's fundamental goal is the development of international financial reporting standards
(IFRS). It is currently working on a project, in consultation with the FASB, to develop worldwide
standards for all corporations to facilitate multi-listing of foreign corporations on various stock
exchanges.
C. Incorrect. The mission of the GASB is to establish and improve standards of state and local
governmental accounting and financial reporting that will result in useful information for users of
financial reports and guide and educate the public, including issuers, auditors, and users of those
financial reports.
D. Incorrect. The AICPA is the national accounting organization composed of practicing Certified Public
Accountants.
5. The best indication of an enterprise's present and continuing ability to generate favorable cash flows is
information about enterprise earnings based on cash basis of accounting. True or False?
True is incorrect. The accrual basis best indicates an enterprise's ability to generate favorable cash flows.
It matches revenues earned with the expenses incurred to earn those revenues for the period.
False is correct. Information about enterprise earnings based on accrual accounting generally provides a
better indication of the enterprise's present and continuing ability to generate favorable cash flows than
would information limited to the financial effects of cash receipts and payments. Accrual accounting
attempts to record the financial effects on an enterprise of transactions and other events and
circumstances that have cash consequences in the periods in which those transactions, events, and
circumstances occur, rather than only in the periods in which cash is received or paid by the enterprise.
6. Materiality is one of the pervasive concepts in financial reporting. Which of the following statements is true with
regard to materiality?
A. Incorrect. The magnitude of the item is only one aspect of a materiality judgment.
B. Correct. The basis for a materiality judgment is generally not sufficient unless the nature of the item, the
circumstances in which the judgment has to be made, and the magnitude of the item are all considered.
176
C. Incorrect. Materiality is a pervasive concept that relates to the qualitative characteristic of relevance.
Information may be relevant because it can make a difference in a single investment decision, but it may
be too small (immaterial) to make that difference matter over an accounting period.
D. Incorrect. The magnitude of the item is only one aspect of a materiality judgment. Others include the
nature of the item and the circumstances in which the judgment has to be made.
7. What concept is demonstrated by the continuation of an accounting entity in the absence of evidence to the
contrary?
A. Incorrect. The accounting entity concept refers to the business enterprise, which may or may not be
synonymous with the legal entity. The emphasis is also on the separation of the entity from its
ownership.
B. Incorrect. The consistency principle requires that similar events be accounted for similarly in succeeding
accounting periods to facilitate comparability between periods.
C. Correct. A basic feature of financial accounting is that the business entity is assumed to be a going
concern in the absence of evidence to the contrary. The going concern concept is based on the empirical
observation that many enterprises have an indefinite life.
D. Incorrect. The concept of substance over form requires accounting treatment to be based upon the
economic substance of events rather than upon the legal form.
8. In which legal form of business organization do the owners of the business enjoy limited liability?
A. Incorrect. General partners share profits and losses of the venture.
B. Correct. Shareholders of a corporation own an equity interest in the underlying net assets of the
corporation and is entitled to share in its profits. Unlike a sole proprietor or a general partner, the
shareholder is not subject to liability beyond his/her investment.
C. Incorrect. A sole proprietorship is owned by one person. The sole proprietor is personally liable for all
debts. Debts of a partnership are ultimately the debts of the individual general partners.
D. Incorrect. An oligopoly is not a legal form of business organization.
9. What is an objective of financial reporting?
A. Correct. Financial reporting and analysis is of particular interest to creditors, potential and current
stockholders, management, government agencies, customers, and labor. An objective of financial
reporting is to provide information that (1) is useful to those making investment and credit decisions,
assuming that those individuals have a reasonable understanding of business and economic activities;
(2) is helpful to current and potential investors and creditors and other users such as labor and
government agencies in assessing the amount, timing, and uncertainty of future cash flows; and (3)
discloses economic resources, claims to those resources, and the changes therein.
177
B. Incorrect. Assessing the adequacy of internal control is a function of internal auditing, not financial
reporting.
C. Incorrect. Evaluating management results compared with standards is a function of managerial and cost
accounting.
D. Incorrect. Providing information on compliance with established procedures is a function of internal
auditing, not financial reporting.
10. Which of the following is NOT considered to be an advantage of organizing a business as a sole proprietorship?
A. Incorrect. The easy and inexpensive organization is one of the most appealing characteristics of sole
proprietorships.
B. Incorrect. Sole proprietors make all management decisions and have the rights to all profits as well as
the right to sell the business. Thus, the entrepreneur has freedom of action.
C. Incorrect. As the sole owner and profit sharer, a sole proprietor has a strong incentive to manage the
business efficiently so as to earn more profits.
D. Correct. The sole proprietor does not enjoy the benefits of specialization. (S)he must perform all
management functions, including all decisions relating to buying and selling; the acquisition and
maintenance of personnel; and the technical aspects of production, advertising, and distribution.
Chapter 2 Review Questions
1. A statement of cash flows is to be presented in general purpose external financial statements by all business
enterprises and not-for-profit organizations. True or False?
True is correct. A statement of cash flows is required as part of a full set of financial statements of all
business entities (both publicly held) and not-for-profit organizations.
False is incorrect. Under GAAP, all business organizations—commercial and nonprofit— are required to
present a statement of cash flows.
2. How can a statement of cash flows help users of financial statements?
A. Correct. The statement of cash flows shows the sources and uses of cash, which is a basis for cash flow
analysis for managers. The statement aids you in answering vital questions like "where was money
obtained?" and "where was money put and for what purpose?" If sued with information in the other
financial statements, the statement of cash flows should help users to assess the entity’s ability to
generate positive future net cash flows (liquidity), its ability to meet obligations (solvency) and pay
178
dividends, the need for external financing, the reasons for differences between income and cash receipt
sand payments, and the cash and noncash aspects of the investing and financing activities.
B. Incorrect. The statement of cash flows deals with only one resource-cash.
C. Incorrect. The income statement shows the components of income from operations.
D. Incorrect. The identity of stock buyers and sellers is not shown.
3. A financial statement includes all of the following items: net income, depreciation, operating activities, and
financial activities. What financial statement is this?
A. Incorrect. The balance sheet does not include periodic net income or depreciation expense.
B. Incorrect. The income statement does not have captions for operating and financing activities.
C. Correct. A statement of cash flows is a required financial statement. Its primary purpose is to provide
information about cash receipts and payments by reporting the cash effects of an enterprise’s
operating, investing, and financing activities. Because the statement or a separate schedule reconciles
net income and net operating cash flow, depreciation, a noncash expense, is included in the
presentation.
D. Incorrect. Shareholders’ equity does not include captions for operating and investing activities,
depreciation, and net income.
4. What is the purpose of information presented in notes to the financial statements?
A. Correct. Notes are an integral part of the basic financial statements. Notes provide information
essential to understanding the financial statements, including disclosures required by GAAP.
B. Incorrect. Notes may not be used to rectify an improper presentation.
C. Incorrect. Disclosure in notes is not a substitute for recognition in financial statements for items that
meet recognition criteria.
D. Incorrect. Management's responses to auditor comments are not an appropriate subject of financial
reporting.
Chapter 3 Review Questions
1. What does the term "double-entry system" refer to?
A. Incorrect. The distinction between real and nominal accounts is based on the relative permanence of
accounts rather than the double entry, self-balancing attribute of accounting systems.
179
B. Correct. In the double-entry system, each transaction is composed of two parts, debits and credits. The
debits must equal the credits, and the sum of all debits for all transactions in a double entry system
must equal the sum of all credits.
C. Incorrect. Many journals may be used, e.g., general journal, sales journal, cash receipts journal, and cash
payments journal.
D. Incorrect. Even though journals and ledgers are parts of all double entry systems, they have nothing to
do with the term "double entry."
2. What is a chart of accounts?
A. Incorrect. Actual transactions are not flowcharted. Flowcharts of accounting procedures are developed
by auditors and systems analysts (but are not called charts of accounts).
B. Incorrect. An accounting procedures manual explains how to use the chart of accounts, e.g., whether to
make adjusting entries, reversing entries, etc.
C. Incorrect. A journal contains the initial recording of the transactions that affect the accounts contained
in the chart of accounts.
D. Correct. A chart of accounts is a listing of all account titles used within an accounting system. Business
transactions affecting these accounts are initially recorded by journal entries and then posted to the
individual accounts maintained in the ledger.
3. What function do general ledgers serve in the accounting process?
A. Incorrect. Accounting data are reported in the financial statements.
B. Incorrect. Data are summarized during the adjusting and closing process.
C. Correct. General ledgers serve to classify accounting data. Transactions that have been recorded in the
journals are posted to the general ledger accounts where they are classified as to the accounts that have
been affected.
D. Incorrect. Transactions are recorded in the journals.
4. What is a subsidiary ledger?
A. Correct. A general or controlling ledger contains the balance for each asset, liability, and equity account. A
subsidiary ledger consists of the detail of a general ledger account, e.g., the individual receivables making
up accounts receivable in the aggregate.
B. Incorrect. A subsidiary ledger is not a supplementary accounting system.
C. Incorrect. A listing of account balances just before closing entries are prepared is a trial balance.
D. Incorrect. The term "subsidiary ledger" relates to a specific general ledger account, not the accounting
systems of a subsidiary company.
180
5. What factor must be present to use the units-of-production method of depreciation?
A. Correct. The units-of-production depreciation method allocates asset cost based on the level of
production. As production varies, so will the credit to accumulated depreciation. Each unit is charged with
a constant amount of depreciation equal to the cost of the asset minus salvage value, divided by the total
units expected to be produced.
B. Incorrect. An advantage of the units-of-production method is that depreciation can vary with production.
C. Incorrect. Repairs do not affect depreciation.
D. Incorrect. Obsolescence need not be expected. The units-of-production method treats obsolescence in the
same way as other depreciation methods.
Chapter 4 Review Questions
1. What type of ratio is rate of return on net sales?
A. Correct. The rate of return on net sales is a profitability ratio. This ratio reveals the profit margin of the
business.
B. Incorrect. Activity ratios measure management’s efficiency in using specific resources.
C. Incorrect. Liquidity ratios indicate the ability of a company to meet short-term obligations.
D. Incorrect. Leverage or equity ratios concern the relationship of debt to equity ratios concern the
relationship of debt to equity and measure the impact of the debt on profitability and risk.
2. Book value per share represents the amount of shareholders' equity assigned to each outstanding share of
common stock. Which one of the following statements about book value per common share is correct?
A. Incorrect. Market price may be more or less than book value.
B. Correct. Book value is based on the financial statements, which are stated in terms of historical cost and
nominal dollars. The figure can be misleading because fair market values may differ substantially from
book figures.
C. Incorrect. Fair market value may be more accurate than the carrying values if the historical cost figures
are out of date.
D. Incorrect. The amount another company would pay would be based on fair market values, not book
values.
3. Which one of the following statements about the price-earnings (P-E) ratio is correct?
181
A. Correct. A company with high growth opportunities typically has a high P-E ratio because investors are
willing to pay a price for the stock higher than that justified by current earnings. In effect, they are
trading current earnings for potential future earnings.
B. Incorrect. A P-E ratio cannot be computed when a firm has losses.
C. Incorrect. A firm with abnormally low profits could have an extremely high, and thus meaningless, P-E
ratio.
D. Incorrect. The P-E ratio expresses the relationship between market price and a firm's EPS.
4. Financial ratio analysis has no limitation when it comes to comparing financial fitness among firms. True or False?
True is incorrect. Financial ratios, calculated based on different sources of information, can lead to
misleading interpretations.
False is correct. Ratio analysis provides useful information regarding the efficiency of operations and the
stability of financial condition. Nevertheless, it has several inherent limitations, such as firms using different
accounting and operating policies, multiple lines of businesses, and different sources of information. Each of
these factors impairs the comparability of financial statement amounts and the ratios derived from them.
5. In computing inventory turnover, the preferred base to use is the sales base because it is more likely to reflect a
change in trend. True or False?
True is incorrect. Inventory turnover is measured by dividing the cost of sales by average inventories. Cost of
sales is used rather than sales because the cost of sales base eliminates any changes caused solely by sales
price changes. Furthermore, using sales in the numerator is inconsistent with valuing inventories at cost in
the denominator.
False is correct. Using a sales base would incorrectly compare a retail amount with a cost amount
(inventory).
6. What does the times-interest-earned ratio indicate?
A. Correct. The times-interest-earned ratio equals (Income from operations) / (Interest expense). It
measures the extent to which operating profit can decline before the enterprise is unable to meet its
annual interest cost. Thus, it is a measure of debt-paying capacity (solvency).
B. Incorrect. Liquidity ratios, e.g., the current ratio, indicate the relationship of current assets to current
liabilities.
C. Incorrect. Asset management ratios indicate how effectively the enterprise is using its assets.
D. Incorrect. Profitability ratios measure operating results.
182
7. What is a firm’s receivables collection period equal to?
A. Incorrect. The inventory conversion period (days of inventory) is the average time required to convert
materials into finished goods and then to sell them. This process typically occurs before the receivables
collection period, and the amount of time in one period does not necessarily bear any relationship to
the other.
B. Incorrect. The cash conversion cycle equals the inventory conversion period, plus the receivables
collection period, minus the payables deferral period (average time between resource purchases and
payment of cash for them). It estimates the time between when the enterprise makes payments and
when it receives cash inflows.
C. Correct. The days-sales-in-receivables (day's sales outstanding) may be stated as the accounts receivable
balance divided by average credit sales per day or as days in the year divided by the receivables
turnover. It is the average time required to convert the enterprise's receivables into cash. Thus, it is also
called the receivables collection period.
D. Incorrect. The inventory divided by the sales per day is the inventory conversion period (days of
inventory).
8. A company has 100,000 outstanding common shares with a market value of $20 per share. Dividends of 2 per
share were paid in the current year, and the enterprise has a dividend-payout ratio of 40%. What is the price-to-
earnings ratio of the company?
A. Incorrect. 2.5 equals EPS divided-by dividends per share.
B. Correct. The P-E ratio equals the share price divided by EPS. If the dividends per share equaled 2 and the
dividend-payout ratio was 40%, EPS must have been 5 (2/0.4). Accordingly, the P-E ratio is 4 (20 share
price/5 EPS).
C. Incorrect. 10 equals share price divided by dividends per share.
D. Incorrect. 50 equals price per share divided by the dividend-payout percentage.
Chapter 5 Review Questions
1. What is the primary reason for adopting total quality management (TQM)?
A. Correct. TQM is an integrated system that identifies internal and external customers and establishes
their requirements. The ultimate (external) customer is best served when internal customers are also
well served.
B. Incorrect. Reduced delivery time is one of many potential activities that need improvement. Speed of
delivery is known to be a driver for customer satisfaction.
183
C. Incorrect. Reduced delivery charges is one of many potential activities that need improvement. Free
shipping, for example, has been quite successful for online ecommerce strategy.
D. Incorrect. Increased employee participation is necessary to achieve TQM, but it is not the primary
purpose for establishing the program.
2. What do companies that adopt just-in-time (JIT) purchasing systems often experience?
A. Correct. The objective of JIT is to reduce carrying costs by eliminating inventories and increasing the
deliveries made by suppliers. Ideally, shipments of raw materials are received just in time to be
incorporated into the manufacturing process. The focus of quality control under JIT is the prevention of
quality problems. Quality control is shifted to the supplier. JIT companies typically do not inspect
incoming goods; the assumption is that receipts are of perfect quality. Suppliers are limited to those
who guarantee perfect quality and prompt delivery.
B. Incorrect. More deliveries are needed. Each shipment is smaller.
C. Incorrect. In a JIT system, materials are delivered directly to the production line ready for insertion in
the finished product.
D. Incorrect. The need for communication with the vendor is greater. Orders and deliveries must be made
on short notice, sometimes several times a day.
3. Which of the following is NOT something that controllers are ordinarily concerned with?
A. Incorrect. The preparation of tax returns is a typical responsibility of the controller.
B. Incorrect. External reporting is a function of the controller.
C. Incorrect. The accounting system helps to safeguard assets.
D. Correct. Controllers are usually in charge of budgets, accounting, accounting reports, and related
controls. Treasurers are most often involved with control over cash, receivables, short-term
investments, financing, and insurance. Thus, treasurers rather than controllers are concerned with
investor relations.
4. Treasurers are usually NOT concerned with which of the following activities?
A. Correct. Treasurers are usually concerned with investing cash and near-cash assets, the provision of
capital, investor relations, insurance, etc. Controllers, on the other hand, are responsible for the reporting
and accounting activities of an organization, including financial reporting.
B. Incorrect. Short-term financing lies within the normal range of a treasurer's functions.
C. Incorrect. The treasurer has custody of assets.
D. Incorrect. Credit operations are often within the treasurer's purview.
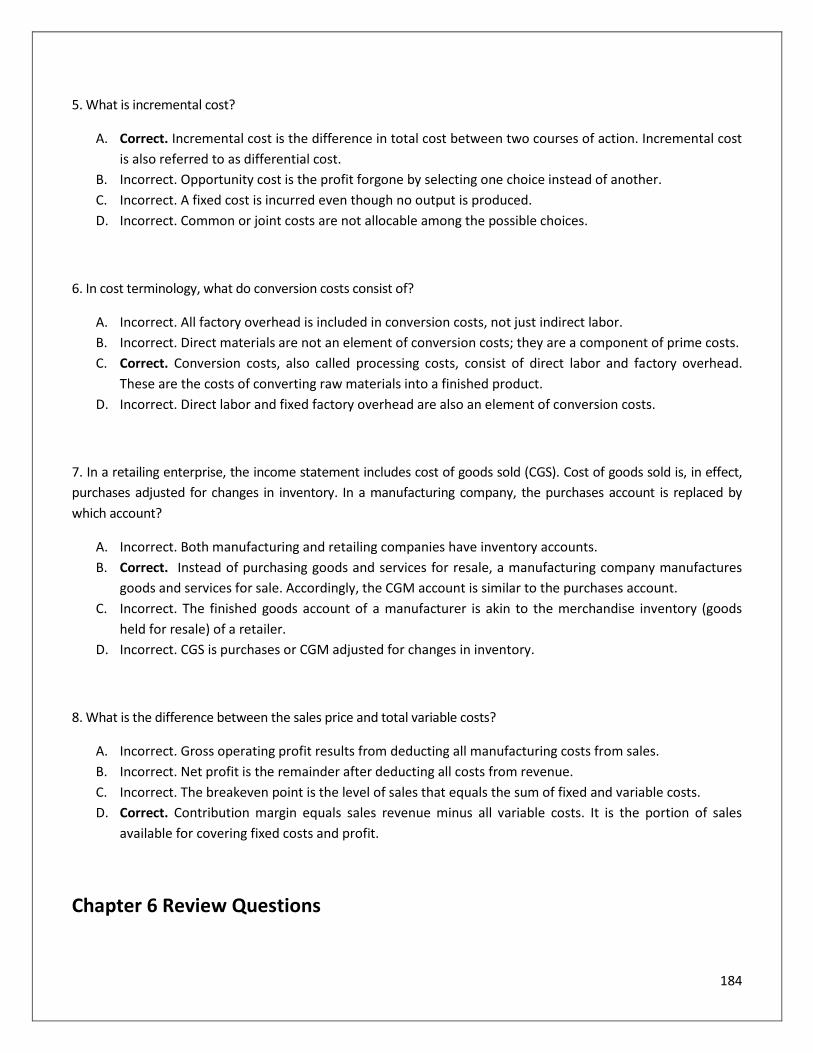
184
5. What is incremental cost?
A. Correct. Incremental cost is the difference in total cost between two courses of action. Incremental cost
is also referred to as differential cost.
B. Incorrect. Opportunity cost is the profit forgone by selecting one choice instead of another.
C. Incorrect. A fixed cost is incurred even though no output is produced.
D. Incorrect. Common or joint costs are not allocable among the possible choices.
6. In cost terminology, what do conversion costs consist of?
A. Incorrect. All factory overhead is included in conversion costs, not just indirect labor.
B. Incorrect. Direct materials are not an element of conversion costs; they are a component of prime costs.
C. Correct. Conversion costs, also called processing costs, consist of direct labor and factory overhead.
These are the costs of converting raw materials into a finished product.
D. Incorrect. Direct labor and fixed factory overhead are also an element of conversion costs.
7. In a retailing enterprise, the income statement includes cost of goods sold (CGS). Cost of goods sold is, in effect,
purchases adjusted for changes in inventory. In a manufacturing company, the purchases account is replaced by
which account?
A. Incorrect. Both manufacturing and retailing companies have inventory accounts.
B. Correct. Instead of purchasing goods and services for resale, a manufacturing company manufactures
goods and services for sale. Accordingly, the CGM account is similar to the purchases account.
C. Incorrect. The finished goods account of a manufacturer is akin to the merchandise inventory (goods
held for resale) of a retailer.
D. Incorrect. CGS is purchases or CGM adjusted for changes in inventory.
8. What is the difference between the sales price and total variable costs?
A. Incorrect. Gross operating profit results from deducting all manufacturing costs from sales.
B. Incorrect. Net profit is the remainder after deducting all costs from revenue.
C. Incorrect. The breakeven point is the level of sales that equals the sum of fixed and variable costs.
D. Correct. Contribution margin equals sales revenue minus all variable costs. It is the portion of sales
available for covering fixed costs and profit.
Chapter 6 Review Questions
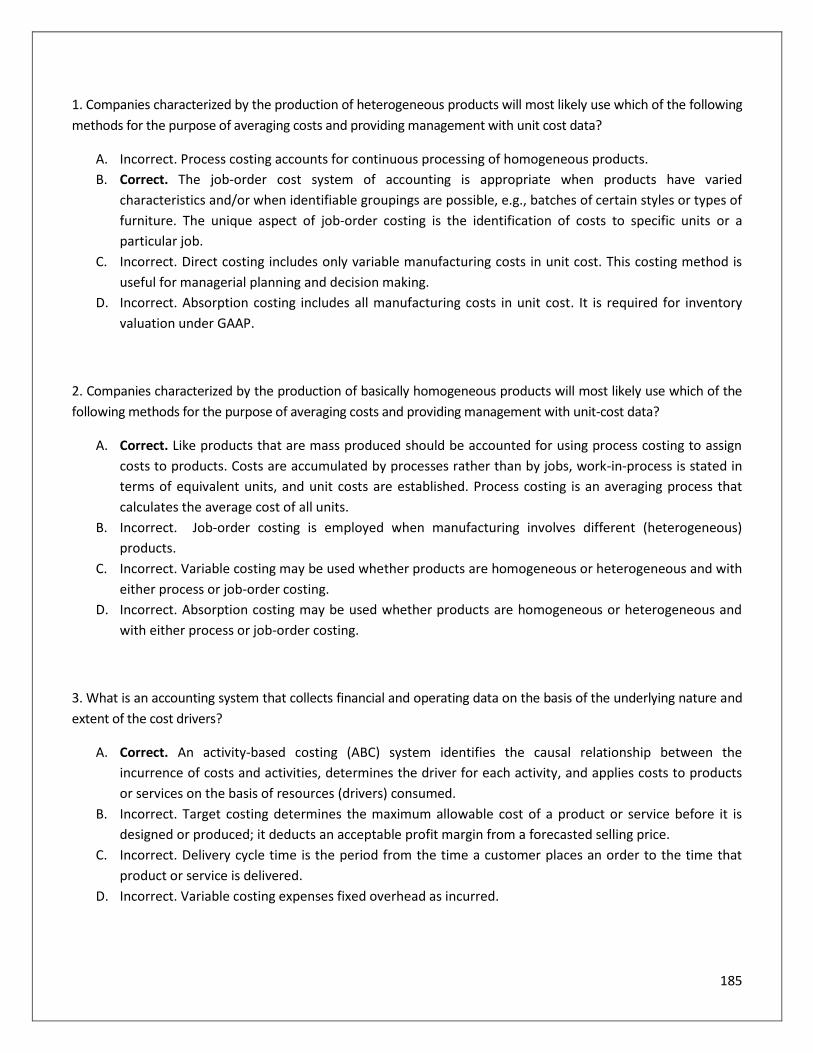
185
1. Companies characterized by the production of heterogeneous products will most likely use which of the following
methods for the purpose of averaging costs and providing management with unit cost data?
A. Incorrect. Process costing accounts for continuous processing of homogeneous products.
B. Correct. The job-order cost system of accounting is appropriate when products have varied
characteristics and/or when identifiable groupings are possible, e.g., batches of certain styles or types of
furniture. The unique aspect of job-order costing is the identification of costs to specific units or a
particular job.
C. Incorrect. Direct costing includes only variable manufacturing costs in unit cost. This costing method is
useful for managerial planning and decision making.
D. Incorrect. Absorption costing includes all manufacturing costs in unit cost. It is required for inventory
valuation under GAAP.
2. Companies characterized by the production of basically homogeneous products will most likely use which of the
following methods for the purpose of averaging costs and providing management with unit-cost data?
A. Correct. Like products that are mass produced should be accounted for using process costing to assign
costs to products. Costs are accumulated by processes rather than by jobs, work-in-process is stated in
terms of equivalent units, and unit costs are established. Process costing is an averaging process that
calculates the average cost of all units.
B. Incorrect. Job-order costing is employed when manufacturing involves different (heterogeneous)
products.
C. Incorrect. Variable costing may be used whether products are homogeneous or heterogeneous and with
either process or job-order costing.
D. Incorrect. Absorption costing may be used whether products are homogeneous or heterogeneous and
with either process or job-order costing.
3. What is an accounting system that collects financial and operating data on the basis of the underlying nature and
extent of the cost drivers?
A. Correct. An activity-based costing (ABC) system identifies the causal relationship between the
incurrence of costs and activities, determines the driver for each activity, and applies costs to products
or services on the basis of resources (drivers) consumed.
B. Incorrect. Target costing determines the maximum allowable cost of a product or service before it is
designed or produced; it deducts an acceptable profit margin from a forecasted selling price.
C. Incorrect. Delivery cycle time is the period from the time a customer places an order to the time that
product or service is delivered.
D. Incorrect. Variable costing expenses fixed overhead as incurred.
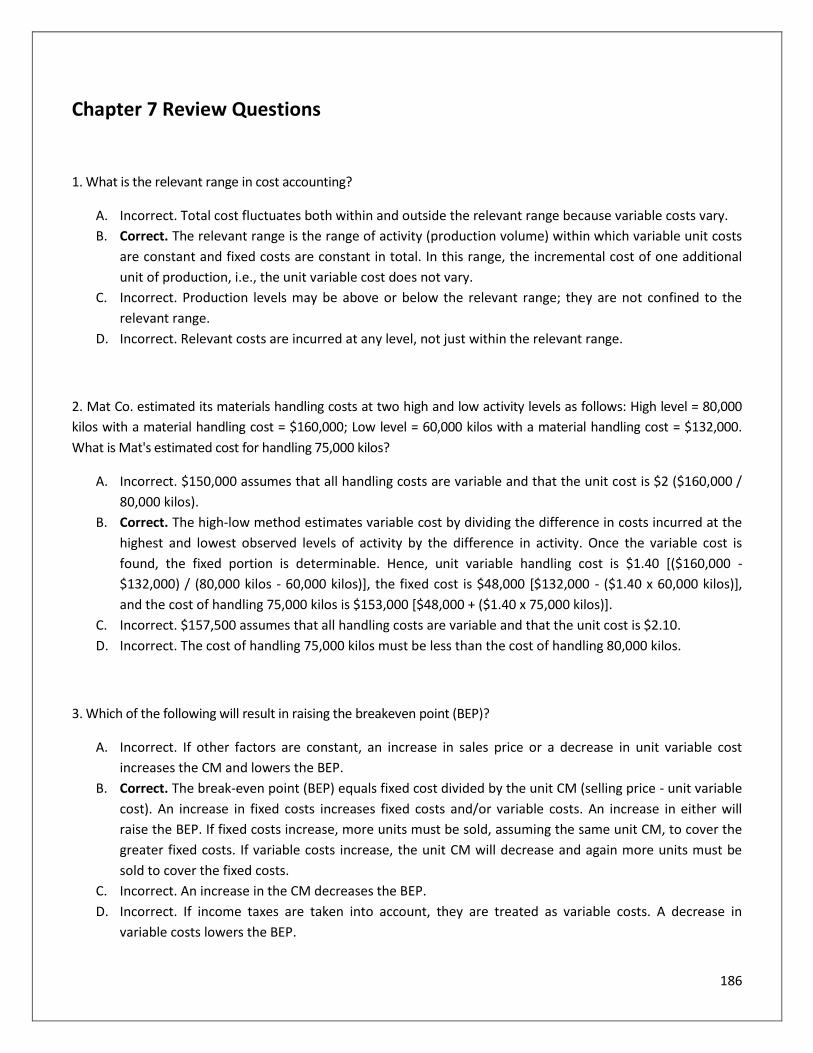
186
Chapter 7 Review Questions
1. What is the relevant range in cost accounting?
A. Incorrect. Total cost fluctuates both within and outside the relevant range because variable costs vary.
B. Correct. The relevant range is the range of activity (production volume) within which variable unit costs
are constant and fixed costs are constant in total. In this range, the incremental cost of one additional
unit of production, i.e., the unit variable cost does not vary.
C. Incorrect. Production levels may be above or below the relevant range; they are not confined to the
relevant range.
D. Incorrect. Relevant costs are incurred at any level, not just within the relevant range.
2. Mat Co. estimated its materials handling costs at two high and low activity levels as follows: High level = 80,000
kilos with a material handling cost = $160,000; Low level = 60,000 kilos with a material handling cost = $132,000.
What is Mat's estimated cost for handling 75,000 kilos?
A. Incorrect. $150,000 assumes that all handling costs are variable and that the unit cost is $2 ($160,000 /
80,000 kilos).
B. Correct. The high-low method estimates variable cost by dividing the difference in costs incurred at the
highest and lowest observed levels of activity by the difference in activity. Once the variable cost is
found, the fixed portion is determinable. Hence, unit variable handling cost is $1.40 [($160,000 -
$132,000) / (80,000 kilos - 60,000 kilos)], the fixed cost is $48,000 [$132,000 - ($1.40 x 60,000 kilos)],
and the cost of handling 75,000 kilos is $153,000 [$48,000 + ($1.40 x 75,000 kilos)].
C. Incorrect. $157,500 assumes that all handling costs are variable and that the unit cost is $2.10.
D. Incorrect. The cost of handling 75,000 kilos must be less than the cost of handling 80,000 kilos.
3. Which of the following will result in raising the breakeven point (BEP)?
A. Incorrect. If other factors are constant, an increase in sales price or a decrease in unit variable cost
increases the CM and lowers the BEP.
B. Correct. The break-even point (BEP) equals fixed cost divided by the unit CM (selling price - unit variable
cost). An increase in fixed costs increases fixed costs and/or variable costs. An increase in either will
raise the BEP. If fixed costs increase, more units must be sold, assuming the same unit CM, to cover the
greater fixed costs. If variable costs increase, the unit CM will decrease and again more units must be
sold to cover the fixed costs.
C. Incorrect. An increase in the CM decreases the BEP.
D. Incorrect. If income taxes are taken into account, they are treated as variable costs. A decrease in
variable costs lowers the BEP.
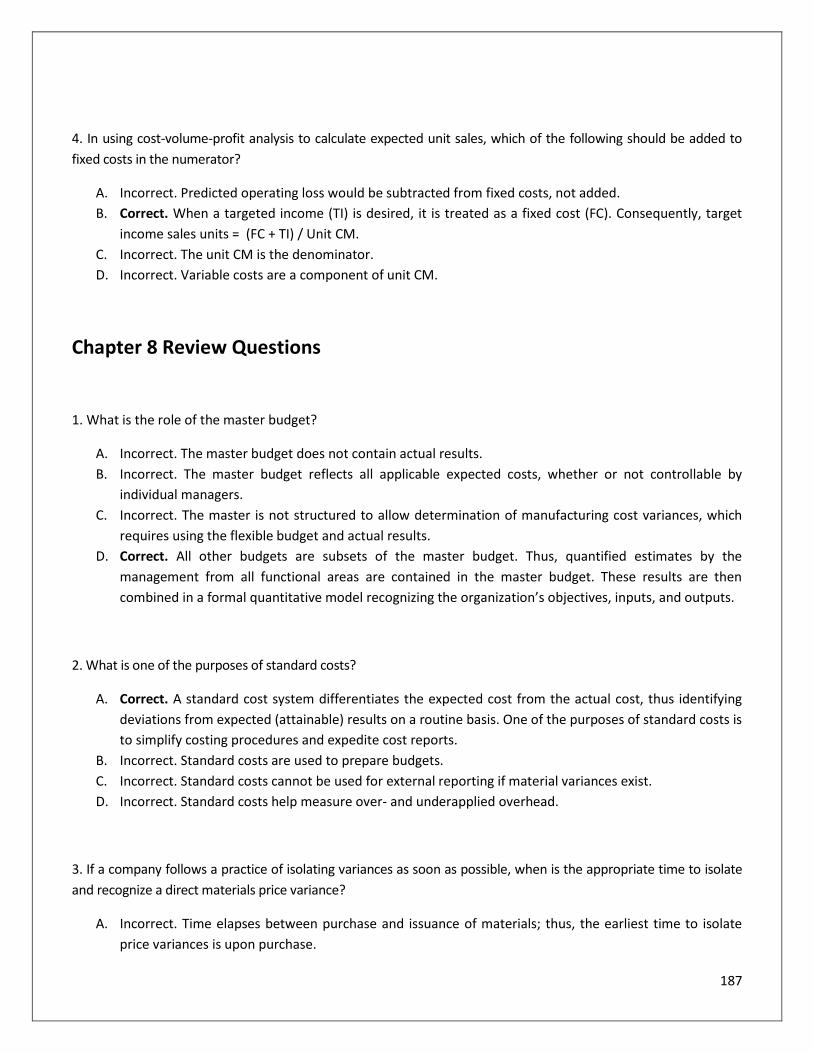
187
4. In using cost-volume-profit analysis to calculate expected unit sales, which of the following should be added to
fixed costs in the numerator?
A. Incorrect. Predicted operating loss would be subtracted from fixed costs, not added.
B. Correct. When a targeted income (TI) is desired, it is treated as a fixed cost (FC). Consequently, target
income sales units = (FC + TI) / Unit CM.
C. Incorrect. The unit CM is the denominator.
D. Incorrect. Variable costs are a component of unit CM.
Chapter 8 Review Questions
1. What is the role of the master budget?
A. Incorrect. The master budget does not contain actual results.
B. Incorrect. The master budget reflects all applicable expected costs, whether or not controllable by
individual managers.
C. Incorrect. The master is not structured to allow determination of manufacturing cost variances, which
requires using the flexible budget and actual results.
D. Correct. All other budgets are subsets of the master budget. Thus, quantified estimates by the
management from all functional areas are contained in the master budget. These results are then
combined in a formal quantitative model recognizing the organization’s objectives, inputs, and outputs.
2. What is one of the purposes of standard costs?
A. Correct. A standard cost system differentiates the expected cost from the actual cost, thus identifying
deviations from expected (attainable) results on a routine basis. One of the purposes of standard costs is
to simplify costing procedures and expedite cost reports.
B. Incorrect. Standard costs are used to prepare budgets.
C. Incorrect. Standard costs cannot be used for external reporting if material variances exist.
D. Incorrect. Standard costs help measure over- and underapplied overhead.
3. If a company follows a practice of isolating variances as soon as possible, when is the appropriate time to isolate
and recognize a direct materials price variance?
A. Incorrect. Time elapses between purchase and issuance of materials; thus, the earliest time to isolate
price variances is upon purchase.
188
B. Correct. The time of purchase is the most appropriate moment to isolate and recognize a price variance.
Analysis at that time permits the earliest possible examination of variances.
C. Incorrect. A materials price variance must be recognized at purchase.
D. Incorrect. The transaction has not yet been consummated when the purchase order originates. The
proper time to isolate and recognize a direct materials price variance is when materials are purchased.
4. What does the master budget process usually begin with?
A. Incorrect. The production budget normally cannot be prepared until the expected sales are known. The
number of units expected to be manufactured to meet budgeted sales and inventory requirements is set
forth in the production budget.
B. Incorrect. The operating budget is the budget reflecting the results of operating decisions. It cannot be
prepared until after the sales budget is prepared.
C. Correct. The sales budget is the starting point in preparing the master budget, since estimated sales
volume influences nearly all other items appearing in the master budget. The sales budget, which
ordinarily indicates the quantity of each product expected to be sold, allows all departments to plan
their needs. Once a firm can estimate sales, the next step is to decide how much to produce or
purchase.
D. Incorrect. Preparation of the cash budget is the last step in the overall budgeting process. The cash
budget is determined after the operating budgets such as the sales and production budgets are
prepared.
5. The cash receipts budget includes which of the following items?
A. Incorrect. Funded depreciation involves cash outlays.
B. Correct. A cash budget may be prepared monthly or even weekly to facilitate cash planning and control.
The purpose is to anticipate cash needs while minimizing the amount of idle cash. The cash receipts
section of the budget includes all sources of cash. One such source is the cash collections from
customers.
C. Incorrect. Purchases of supplies involve cash outlays.
D. Incorrect. The extinguishment of debt involves cash outlays.
6. The sales budget is normally included in the financial budget of a firm. True or False?
True is incorrect. The financial budget normally includes the cash budget and the pro forma balance sheet.
False is correct. The sales budget is included in the operating budget because sales is an operating
activity.
189
Chapter 9 Review Questions
1. What does responsibility accounting define an operating center that is responsible for revenue and costs as?
A. Correct. A profit center is responsible for both revenues and costs, whereas a cost center is responsible
only for costs.
B. Incorrect. A revenue center is responsible only for revenues, not costs.
C. Incorrect. A division can be any type of responsibility center.
D. Incorrect. An operating unit can be organized as any type of center.
2. Decentralized firms can delegate authority and yet retain control and monitor managers' performance by
structuring the organization into responsibility centers. Which one of the following organizational segments is most
like an independent business?
A. Incorrect. A revenue center is responsible only for revenue generation, not for costs or capital
investment.
B. Incorrect. A profit center is responsible for revenues and costs but not for invested capital.
C. Incorrect. A cost center is evaluated only on the basis of costs incurred. It is not responsible for revenues
or invested capital.
D. Correct. An investment center is the organizational type most like an independent business because it is
responsible for its own revenues, costs incurred, and capital invested. The other types of centers do not
incorporate all three elements.
3. Which one of the following statements pertaining to the return on investment (ROI) as a performance
measurement is incorrect?
A. Incorrect. ROI can be misleading when the quality of the investment base differs among segments.
B. Correct. Return on investment (ROI) is the key performance measure in an investment center. ROI is a
rate computed by dividing a segment's income by the invested capital. ROI is therefore subject to the
numerous possible manipulations of the income and investment amounts. For example, a manager may
choose not to invest in a project that will yield less than the desired rate of return, or (s)he may defer
necessary expenses.
C. Incorrect. Managers may reject projects that are profitable (a return greater than the cost of capital) but
would decrease ROI. For example, a segment with a 15% ROI may not want to invest in a new project
with a 10% ROI, even though the cost of capital might be only 8%.
D. Incorrect. The use of ROI does not reflect the relative difficulty of tasks undertaken by managers.
190
4. Return on investment (ROI) would be the best for evaluating the management performance of a department
that is operated at a cost center. True or False?
True is incorrect. A cost center is a responsibility center that is responsible for costs only. Of the
alternative given, variance analysis is the only one that can be used in a cost center. Variance analysis
involves comparing actual costs with predicted or standard costs.
False is correct. Return on investment cannot be computed for a cost center. The manager is not
responsible for revenue (return) or the assets available.
5. Residual income (RI) is a performance evaluation that is used in conjunction with, or instead of, return on
investment (ROI). In many cases, why is RI preferred over ROI?
A. Incorrect. Both measures represent the results for a single period.
B. Correct. Residual income equals earnings in excess of a minimum desired return. Thus, it is measured in
dollars. If performance is evaluated using ROI, a manager may reject a project that exceeds the
minimum return if the project will decrease overall ROI. For example, given a target rate of 20%, a
project with an ROI of 22% might be rejected if the current ROI is 25%.
C. Incorrect. The target rate for ROI is the same as the imputed interest rate used in the residual income
calculation.
D. Incorrect. The same investment base should be employed by both methods.
Chapter 10 Review Questions
1. What are ‘relevant costs’?
A. Incorrect. Both fixed and variable costs can be either relevant or irrelevant depending upon the
circumstances. Fixed costs are usually irrelevant to a future decision.
B. Incorrect. Relevant costs are expected future costs that differ among decision choices.
C. Incorrect. Past costs are sunk costs. Because they cannot be changed by management action, they are
not relevant.
D. Correct. Relevant costs are anticipated costs that will vary among the choices available. In other words,
if two courses of action share some costs, those costs are not relevant because they will be incurred
regardless of the decision made.
2. Which one of the following costs would be relevant in short-term decision making?
191
A. Correct. Not all costs are of equal importance in decision making, and managers must identify the costs
that are relevant to a decision. Such costs are called relevant costs. The relevant costs are the expected
future costs (and also revenues) which differ between the decision alternatives.
B. Incorrect. Inventory costs may not always differ among options. So they may not be relevant.
C. Incorrect. By definition, costs that do not vary are not relevant to the decision process.
D. Incorrect. The costs of fixed assets are usually irrelevant in the short run. It is just a matter of how much-
--in its entirety or the portion that continue regardless the choice.
3. ___________________________ are the costs that cannot be changed by any present or future decision, so they
are irrelevant to a future decision.
A. Incorrect. Net realizable value is the value of an asset net of any disposal costs.
B. Incorrect. Relevant costs are expected future costs that differ among alternatives.
C. Correct. The book value of an asset, defined as its acquisition cost less the accumulated depreciation, is
a sunk cost. Sunk costs cannot be changed by any current or future course of action, so they are
irrelevant in decision making.
D. Incorrect. An incremental cost is the additional cost of selecting one option rather than another. It is
relevant to s future decision.
4. What is a decision-making concept, described as "the contribution to income that is forgone by not using a limited
resource for its best alternative use," called?
A. Incorrect. Marginal cost is the incremental cost of producing one additional unit.
B. Incorrect. Incremental cost is the increase in costs between one option and another.
C. Incorrect. Potential cost is the cost that may be incurred in the future.
D. Correct. Opportunity cost is defined as the profit forgone by selecting one choice instead of another. It is
the benefit provided by the best alternative use of a scarce resource.
5. Which of the following qualitative factors favors the buy choice in an insourcing vs. outsourcing (make or buy)
decision?
A. Correct. The maintenance of long-run relationships with suppliers may become paramount in a make-
or-buy decision. Abandoning long-run supplier relationships may cause difficulty in obtaining needed
parts when terminated suppliers find it advantageous not to supply parts in the future.
B. Incorrect. If quality is important, one can ordinary control it better in one’s own plant.
C. Incorrect. The availability of idle capacity more likely favors the decision to make. With idle capacity, you
can make it cheaper.
D. Incorrect. Companies claim that outsourcing leads to substantial cost savings, allows them to focus on
their core competencies, and ultimately increases shareholder value.
192
6. When only differential manufacturing costs are taken into account for special-order pricing, what is an essential
assumption?
A. Incorrect. The differential analysis of a special order considers total incremental costs. Thus, unit
variable costs and total fixed costs need not be constant, and any changes need not be in direct
proportion to the measure of activity.
B. Incorrect. The assumption is that selling and administrative costs remain the same and hence are not
relevant.
C. Correct. Granting a lower-than-normal price for a special order has potential ramifications for regular
sales because other customers may demand the same price. Thus, the decision to consider differential
manufacturing costs only should be based on a determination that all other costs are not relevant, that
is, that these other costs do not vary with the option chosen.
D. Incorrect. The assumption is that acceptance of the order will not cause total selling and administrative
costs to change. The costs that do not change are irrelevant to a special-order decision.
Chapter 11 Review Questions
1. What is the internal rate of return (IRR)?
A. Incorrect. The hurdle rate is the rate used to calculate the NPV; it is determined by management prior to
the analysis.
B. Incorrect. The IRR is the rate at which the NPV is zero. Internal rate of return (IRR) is defined as the rate
of interest that equates the initial investment (I) with the PV of future cash inflows. In other words, at
IRR, I = PV (or NPV = 0)
C. Correct. The IRR is the interest rate at which the PV of the expected future cash inflows is equal to the
initial investment for a project. Thus, the IRR is the interest rate that will produce the NPV equal to zero.
D. Incorrect. The accounting rate of return does not incorporate the time value of money.
2. Which one of the following statements about the payback method of investment analysis is correct?
A. Correct. The payback method calculates the amount of time required for an investment to recoup the
original investment. Although the payback method is easy to use, it has inherent problems. The time
value of money and returns after the payback period are not considered.
B. Incorrect. The payback method ignores cash flows after payback, which means it does not take into
account returns after the payback period.
C. Incorrect. The payback method does not use discounted cash flow techniques, because it does not
consider the time value of money.
193
D. Incorrect. The payback method is often used, given its simplicity and effectiveness in risk management
and cash conservation.


![Basic Accounting Concepts _ GE Accounting[1]](https://img.pdfslide.net/doc/110x75/577cc8081a28aba711a203c2/basic-accounting-concepts-ge-accounting1.jpg)