Embed Size (px)
Citation preview
97
CHAPTER
Accumulated trade costs and their impact on domestic and international value chainsHUBERT ESCAITH
According to trade analysts, trade costs — together with the relative size of the exporting and import-ing economies — are among the main determinants of bilateral trade patterns. More important from a
trade and development perspective, trade costs influence the competitiveness of domestic firms on the international market and the success of policies to join and move up global value chains (GVCs). Although trade costs have declined over the past decades, their relevance has increased with the surge of frag-mented supply chains and the greater competition in a “small world” in which everybody cooperates and competes with everybody.
The reduction in transportation costs, the progressive decline in tariff duties and other customs barriers, and the progress in information and communication technology connectivity have “flattened the planet” by reducing transaction costs, which has in turn contributed to the rapid expansion of global trade since 1985. After reviewing the domestic value added embodied in the final expenditure of markets of ultimate destination over time, Johnson (2014) and Johnson and Noguera (2016) identified five stylized facts that explain the lessening of trade frictions.1 But as Anderson and van Wincoop (2004) noted, “The death of distance is exaggerated. Trade costs are large, even aside from trade policy barriers and even between apparently highly inte-grated economies.”
The decline in trade frictions stalled after the 2008–09 global financial crisis (Escaith and Miroudot 2015), and the new empha-ses are on reducing transaction costs and facilitating trade. In the geographically fragmented production networks that have emerged since the mid-1990s, trade in intermediate goods accounts for more than half the volume of international transac-tions. More than in traditional bilateral trade in final goods, trans-action costs (border and behind-the-border costs of trade) are crucial elements of the competitiveness of firms and partly deter-mine their ability to participate in global production networks. These trade frictions are mainly an exogenous cost factor for the operators of international supply chains, who may mitigate the negative impacts through leaner production management but cannot alter the underlying causes. Facilitating trade remains largely the domain of public action.
Trade costs such as applied tariffs, transportation and insur-ance costs, and other border taxes and fees are amplified as they pass through the steps associated with modern supply chains. This so-called cascade effect arises because trade costs accumu-late as intermediate goods are imported and then re-exported farther downstream, going through different processing nodes before reaching the final consumer. Thus, trade costs reduce the gains from trade that countries expect from participating in GVCs.
From the exporting firm perspective the financial impact of trade costs is magnified in the “trade in tasks” rationale that
4
This chapter builds on Diakantoni and others (2017), Yu and others (2016), and Hayakawa, Laksanapanyakul, and Yoshimi (2016). The author wishes to rec-
ognize the comments received on preliminary drafts at the two meetings of the Making Global Value Chains Work for Economic Development project in
2016 (Beijing in March and Washington in November) and the suggestions by the revisers on the final draft.
98 • Measuring and Analyzing the Impact of GVCs on Economic Development
governs GVCs. In contrast to a large integrated firm concentrat-ing most production processes under the same roof, specialized processing firms that spread their manufacturing over multi-ple locations need to recoup the associated trade cost, which applies to the full value of the good, from the smaller fraction of value added at each productive stage. This larger relative weight of transaction expenses on the profitability of individual busi-ness operations explains why trade along GVCs is particularly exposed to trade costs.
This chapter measures international trade costs from the value chain perspective and reviews their implications at the industry, national, and global levels. Trade frictions increase the production cost 18% in a single stage of the value chain. Most of the additional expenses result from deficient logistic and trade facilitation conditions, many of which fall under the control of domestic policymakers. Trade costs are not only damaging for domestic firms willing to join GVCs, they also affect all trade partners and generate systemic losses. Using network analysis that goes beyond the traditional bilateral dimension of interna-tional trade, this chapter identifies where investment in trade facilitation would have the highest social returns from a multi-lateral perspective.
Tariffs, cascading transaction costs, and competitiveness
Distance, transportation costs, and tariffs are only some of the fac-tors that affect trade costs; there are many others, some of them not directly measurable, such as uncertainty (see Anderson and van Wincoop 2004 or Ferrantino 2012 for a review of trade costs and border barriers and their measurement). One way of under-standing these factors is to associate them with the set of frictions that tend to reduce trade. Samuelson (1954) depicts trade shrink-ing under the effect of frictions in the same way that an iceberg melts while moving through the sea. International economics has overwhelmingly relied on Samuelson’s hypothesis that frictions are proportional to value (ad valorem “iceberg transport cost”).
An extensive literature has explored the influence of trade costs, especially using the gravity model. Head and Mayer (2013) showed that the magnitude of estimated elasticity of gross trade in goods varies across studies depending on the sample and methodology used but centers around –1. Baldwin and Taglioni (2011) showed that for GVC trade the standard gravity model used by most studies performs poorly when applied to bilateral flows where parts and components trade is important.2 Noguera (2012) applied a gravity model to trade in value added and found that the bilateral trade cost elasticity of value-added exports was about two-thirds that of gross exports and that bilateral value-added exports increased with both bilateral trade agreements (a result also found in trade in final goods) and agreements with other countries.
Nominal tariffs are the most visible cross-border transaction cost. Tariff duties increase the domestic price of tradable goods by adding a tax to their international or free market price. When
duties are specific (particularly for agricultural products), analysts compute ad valorem equivalents. This chapter shows that tariffs are not the biggest trade costs despite being the most visible, as for the iceberg.
For transportation costs the situation is more complex. In prac-tice, transportation costs depend on the nature of the good (per-ishable or not, bulky or not), the mode of transport, and the dis-tance between producers and consumers. Lewis (1994) identified several factors besides freight costs that contribute to logistics costs, including interest charges on goods awaiting shipment, on goods in transit, and on goods held as safety stock, as well as the loss, damage, or decay of goods between manufacture and sale.
Because tariffs have become a less frequent barrier to trade, the contribution of transportation to total trade costs — shipping plus insurance — has become more evident and more important. Hummels (2007) found that median transport expenditures were half as much as tariff duties for U.S. imports in 1958, equal to tariff duties in 1965 and three times higher than aggregate tariff duties in 2004.
Time matters, especially in GVC trade organized along com-plex international supply chains. See, for example, Hayakawa, Laksanapanyakul, and Yoshimi (2016), who concentrated on the time spent in the import process, including cargo handling and customs clearance. Those are the key components of the ad valorem time-related trade costs that are shifted onto the import price of imported inputs. If those costs are passed on to the price of exports, the demand for these exported products becomes smaller as time gaps lengthen.
Trade cost magnification and accumulation through global value chainsWhen manufacturing is geographically segmented and orga-nized as an international production network, trade costs at each step of the production process are incorporated into production costs and passed on to the next step through a higher free-on-board value of the processed good. The trade costs propagate through the supply chain, cascading from upstream to down-stream to the final consumers.
The impact of cascading transaction costs is amplified as intermediate goods are further processed by importing countries and then re-exported. If tariff accumulation is ultimately paid by the final consumer,3 tariff magnification relates to the processing firms’ financial returns (gross profits). GVC suppliers are mainly price takers, and high trade costs translate into reduced value added. For the processing firm at each step of the supply chain, the additional costs have to be compensated for out of the value added generated by the fees the firm receives for processing the imported inputs and re-exporting them to another GVC partici-pant. Unlike a fully integrated firm, which builds a product from stage A to Z and cashes in the full commercial value of the gross output, the processing firm can count on only the smaller share of value added it creates (its processing fees).
It is thus important to measure the impact of trade costs not in proportion to the total value of the output (unlike the “ice-berg” metaphor in conventional trade analysis) but in proportion
Accumulated trade costs and their impact on domestic and international value chains • 99
to the value added generated at each step of the supply chain. The latter value is often much smaller than the full commercial value of the intermediate good to which trade costs apply, so the financial impact of trade costs on the processing firm’s competi-tiveness and profitability in a GVC context is said to be amplified.
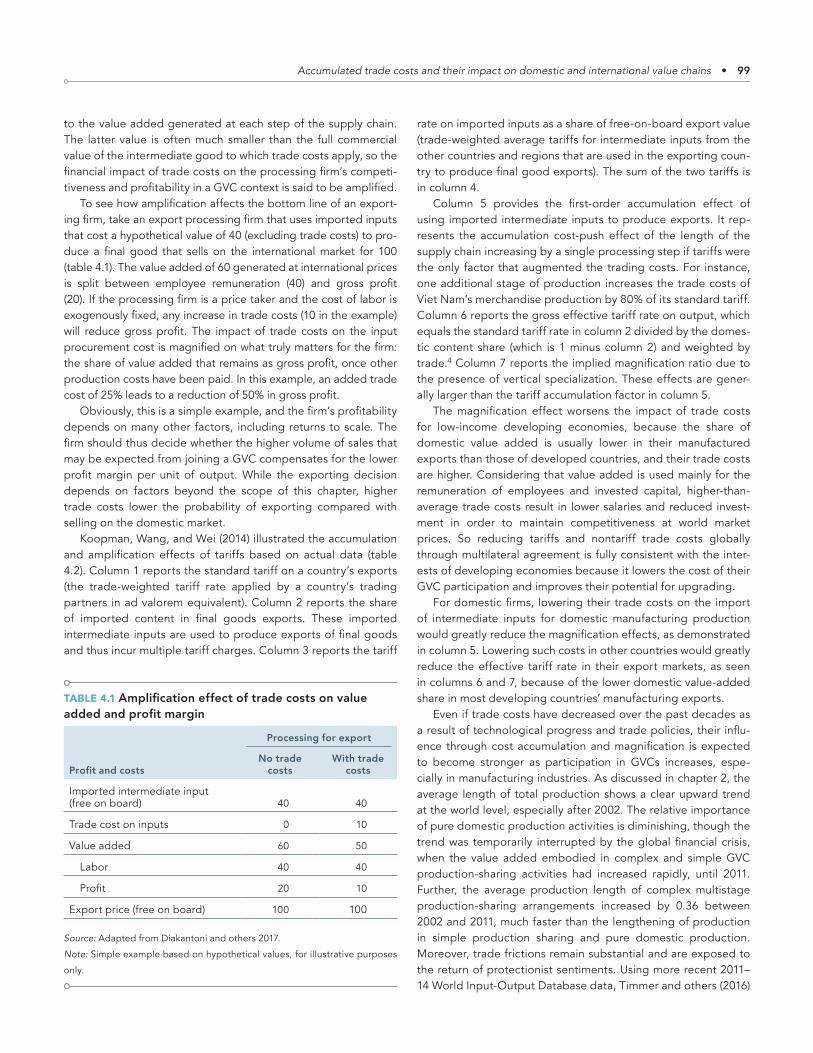
To see how amplification affects the bottom line of an export-ing firm, take an export processing firm that uses imported inputs that cost a hypothetical value of 40 (excluding trade costs) to pro-duce a final good that sells on the international market for 100 (table 4.1). The value added of 60 generated at international prices is split between employee remuneration (40) and gross profit (20). If the processing firm is a price taker and the cost of labor is exogenously fixed, any increase in trade costs (10 in the example) will reduce gross profit. The impact of trade costs on the input procurement cost is magnified on what truly matters for the firm: the share of value added that remains as gross profit, once other production costs have been paid. In this example, an added trade cost of 25% leads to a reduction of 50% in gross profit.
Obviously, this is a simple example, and the firm’s profitability depends on many other factors, including returns to scale. The firm should thus decide whether the higher volume of sales that may be expected from joining a GVC compensates for the lower profit margin per unit of output. While the exporting decision depends on factors beyond the scope of this chapter, higher trade costs lower the probability of exporting compared with selling on the domestic market.
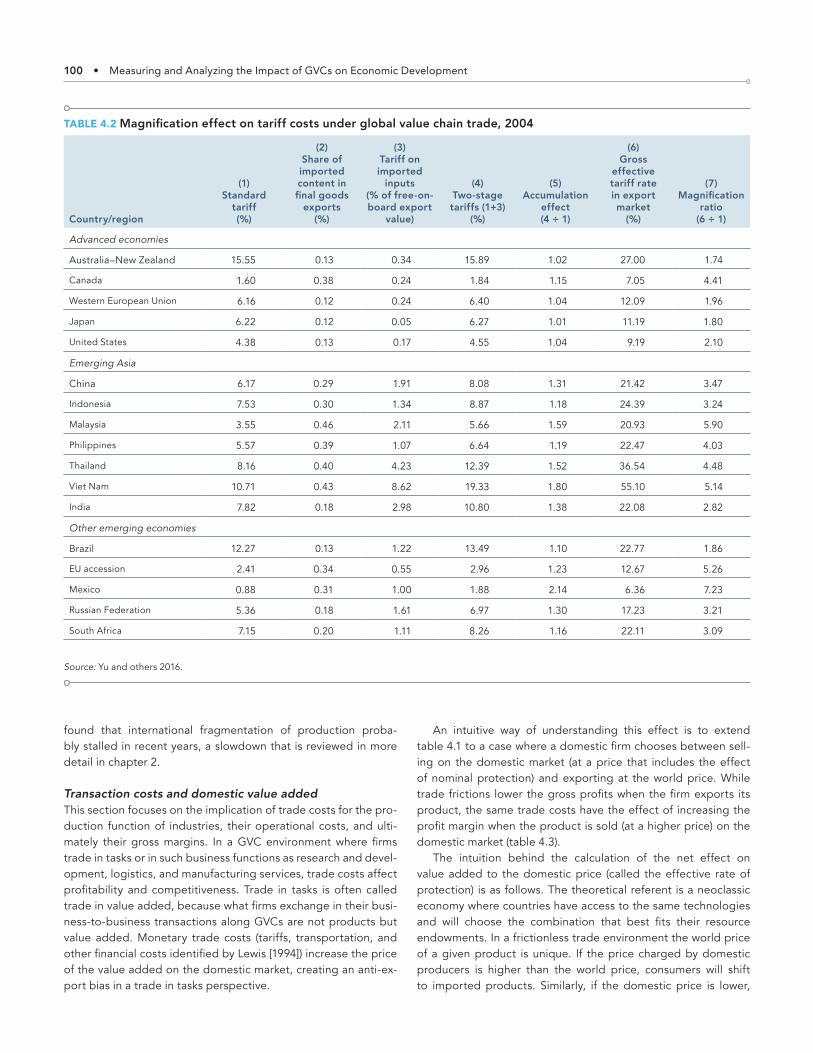
Koopman, Wang, and Wei (2014) illustrated the accumulation and amplification effects of tariffs based on actual data (table 4.2). Column 1 reports the standard tariff on a country’s exports (the trade-weighted tariff rate applied by a country’s trading partners in ad valorem equivalent). Column 2 reports the share of imported content in final goods exports. These imported intermediate inputs are used to produce exports of final goods and thus incur multiple tariff charges. Column 3 reports the tariff
rate on imported inputs as a share of free-on-board export value (trade-weighted average tariffs for intermediate inputs from the other countries and regions that are used in the exporting coun-try to produce final good exports). The sum of the two tariffs is in column 4.
Column 5 provides the first-order accumulation effect of using imported intermediate inputs to produce exports. It rep-resents the accumulation cost-push effect of the length of the supply chain increasing by a single processing step if tariffs were the only factor that augmented the trading costs. For instance, one additional stage of production increases the trade costs of Viet Nam’s merchandise production by 80% of its standard tariff. Column 6 reports the gross effective tariff rate on output, which equals the standard tariff rate in column 2 divided by the domes-tic content share (which is 1 minus column 2) and weighted by trade.4 Column 7 reports the implied magnification ratio due to the presence of vertical specialization. These effects are gener-ally larger than the tariff accumulation factor in column 5.
The magnification effect worsens the impact of trade costs for low-income developing economies, because the share of domestic value added is usually lower in their manufactured exports than those of developed countries, and their trade costs are higher. Considering that value added is used mainly for the remuneration of employees and invested capital, higher-than- average trade costs result in lower salaries and reduced invest-ment in order to maintain competitiveness at world market prices. So reducing tariffs and nontariff trade costs globally through multilateral agreement is fully consistent with the inter-ests of developing economies because it lowers the cost of their GVC participation and improves their potential for upgrading.
For domestic firms, lowering their trade costs on the import of intermediate inputs for domestic manufacturing production would greatly reduce the magnification effects, as demonstrated in column 5. Lowering such costs in other countries would greatly reduce the effective tariff rate in their export markets, as seen in columns 6 and 7, because of the lower domestic value-added share in most developing countries’ manufacturing exports.
Even if trade costs have decreased over the past decades as a result of technological progress and trade policies, their influ-ence through cost accumulation and magnification is expected to become stronger as participation in GVCs increases, espe-cially in manufacturing industries. As discussed in chapter 2, the average length of total production shows a clear upward trend at the world level, especially after 2002. The relative importance of pure domestic production activities is diminishing, though the trend was temporarily interrupted by the global financial crisis, when the value added embodied in complex and simple GVC production-sharing activities had increased rapidly, until 2011. Further, the average production length of complex multistage production-sharing arrangements increased by 0.36 between 2002 and 2011, much faster than the lengthening of production in simple production sharing and pure domestic production. Moreover, trade frictions remain substantial and are exposed to the return of protectionist sentiments. Using more recent 2011–14 World Input- Output Database data, Timmer and others (2016)
TABLE 4.1 Amplification effect of trade costs on value added and profit margin
Profit and costs
Processing for export
No trade costs
With trade costs
Imported intermediate input (free on board) 40 40
Trade cost on inputs 0 10
Value added 60 50
Labor 40 40
Profit 20 10
Export price (free on board) 100 100
Source: Adapted from Diakantoni and others 2017.
Note: Simple example based on hypothetical values, for illustrative purposes
only.
100 • Measuring and Analyzing the Impact of GVCs on Economic Development
found that international fragmentation of production proba-bly stalled in recent years, a slowdown that is reviewed in more detail in chapter 2.
Transaction costs and domestic value addedThis section focuses on the implication of trade costs for the pro-duction function of industries, their operational costs, and ulti-mately their gross margins. In a GVC environment where firms trade in tasks or in such business functions as research and devel-opment, logistics, and manufacturing services, trade costs affect profitability and competitiveness. Trade in tasks is often called trade in value added, because what firms exchange in their busi-ness-to-business transactions along GVCs are not products but value added. Monetary trade costs (tariffs, transportation, and other financial costs identified by Lewis [1994]) increase the price of the value added on the domestic market, creating an anti-ex-port bias in a trade in tasks perspective.
An intuitive way of understanding this effect is to extend table 4.1 to a case where a domestic firm chooses between sell-ing on the domestic market (at a price that includes the effect of nominal protection) and exporting at the world price. While trade frictions lower the gross profits when the firm exports its product, the same trade costs have the effect of increasing the profit margin when the product is sold (at a higher price) on the domestic market (table 4.3).
The intuition behind the calculation of the net effect on value added to the domestic price (called the effective rate of protection) is as follows. The theoretical referent is a neoclassic economy where countries have access to the same technologies and will choose the combination that best fits their resource endowments. In a frictionless trade environment the world price of a given product is unique. If the price charged by domestic producers is higher than the world price, consumers will shift to imported products. Similarly, if the domestic price is lower,
TABLE 4.2 Magnification effect on tariff costs under global value chain trade, 2004
Country/region
(1) Standard
tariff (%)
(2) Share of imported content in final goods
exports (%)
(3) Tariff on imported
inputs (% of free-on-board export
value)
(4) Two-stage tariffs (1+3)
(%)
(5) Accumulation
effect (4 ÷ 1)
(6) Gross
effective tariff rate in export market
(%)
(7) Magnification
ratio(6 ÷ 1)
Advanced economies
Australia–New Zealand 15.55 0.13 0.34 15.89 1.02 27.00 1.74
Canada 1.60 0.38 0.24 1.84 1.15 7.05 4.41
Western European Union 6.16 0.12 0.24 6.40 1.04 12.09 1.96
Japan 6.22 0.12 0.05 6.27 1.01 11.19 1.80
United States 4.38 0.13 0.17 4.55 1.04 9.19 2.10
Emerging Asia
China 6.17 0.29 1.91 8.08 1.31 21.42 3.47
Indonesia 7.53 0.30 1.34 8.87 1.18 24.39 3.24
Malaysia 3.55 0.46 2.11 5.66 1.59 20.93 5.90
Philippines 5.57 0.39 1.07 6.64 1.19 22.47 4.03
Thailand 8.16 0.40 4.23 12.39 1.52 36.54 4.48
Viet Nam 10.71 0.43 8.62 19.33 1.80 55.10 5.14
India 7.82 0.18 2.98 10.80 1.38 22.08 2.82
Other emerging economies
Brazil 12.27 0.13 1.22 13.49 1.10 22.77 1.86
EU accession 2.41 0.34 0.55 2.96 1.23 12.67 5.26
Mexico 0.88 0.31 1.00 1.88 2.14 6.36 7.23
Russian Federation 5.36 0.18 1.61 6.97 1.30 17.23 3.21
South Africa 7.15 0.20 1.11 8.26 1.16 22.11 3.09
Source: Yu and others 2016.

Accumulated trade costs and their impact on domestic and international value chains • 101
domestic producers would rather export their product and sell it at the higher world price.
Because of trade costs, the domestic price of tradable prod-ucts is higher than the world price. Producers gain because they are able to sell at a higher price, with the markup correspond-ing to the ad valorem trade cost. But they have to pay a higher price for the inputs used in production. That will be the case for imported inputs, but also — and this is a key assumption of the underlying model — for the domestically produced goods. If a downstream firm producing a final good for the domestic market is able to increase its prices in proportion to the nominal pro-tection received because of trade costs, this is also the case for upstream firms producing intermediate inputs.
The net effect for a firm gives a higher rate of value added per unit of output than the free-trade benchmark when the addi-tional cost of production is lower than the nominal protection received (or a lower rate of value added per unit of output when the additional cost of production is higher than the nominal pro-tection received). Nominal protection in the domestic market for goods that are a firm’s inputs raises production costs and thus provides negative incentives to export. The service sector is always on the losing side (there is no nominal protection on its output, but it has to pay an additional cost for its tradable inputs). So are consumers. But because services are usually less tradable than goods, it is understood that service providers can pass on the additional costs to their customers.
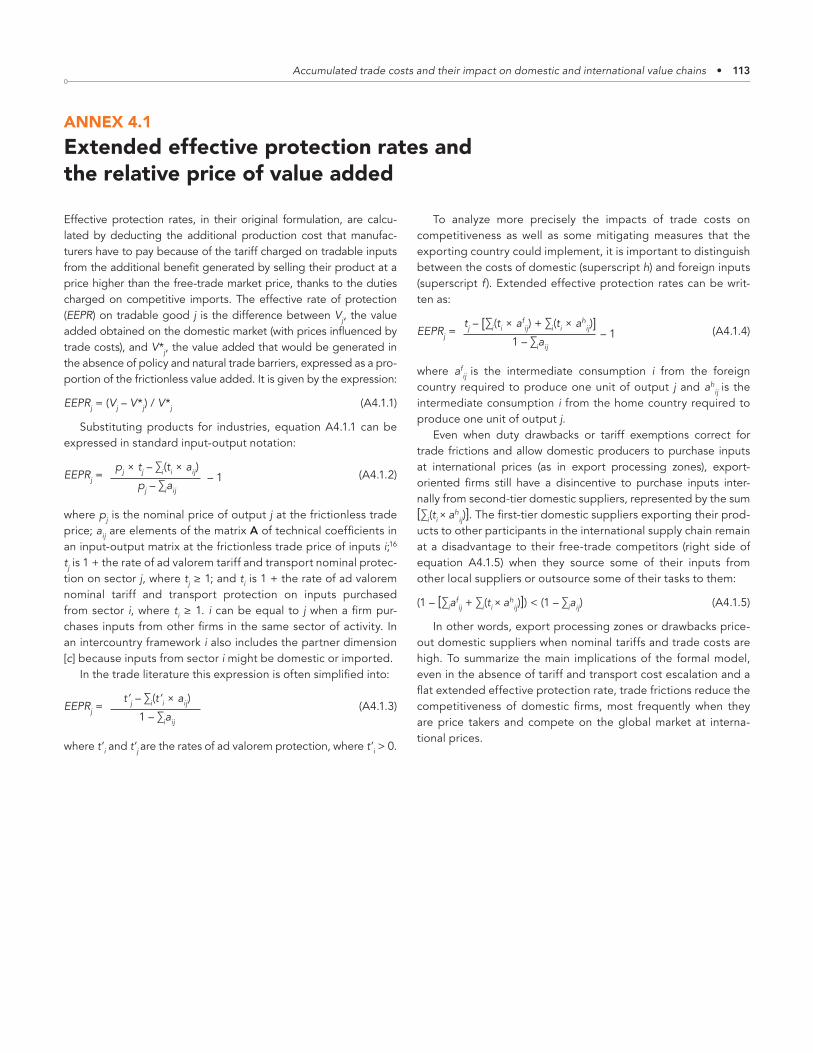
Extended effective protection rates and the relative price of value addedThe method used here to estimate the impact of trade costs across several countries and industries is adapted from the effec-tive protection rate theory introduced by Balassa (1965) and
Corden (1966). Their original formulation calculated effective protection rates by deducting the additional production cost that manufacturers had to pay because of the tariff charged on tradable inputs from the additional benefit generated by selling their product at a price higher than the free-trade market price, thanks to the duties charged on competitive imports. The result is the rate of value added at domestic prices (selling price minus cost of intermediate inputs required for the production) and is compared with the hypothetical value added that would have resulted from the operation if no custom duties had been levied. In table 4.3 the effective rate of protection is 25%, correspond-ing to the additional gains (15) reported to the value added under free trade (60).
Effective rates can be calculated because of the availability of international input- output matrices, which are also used to measure trade in value added, as in the Organisation for Eco-nomic Co-operation and Development (OECD)–World Trade Organization (WTO) Trade in Value-Added database. As men-tioned, the calculation also relies on the simplifying hypothesis of perfect competition and substitutability between imported and domestic products. Domestic industries are expected to raise their price in order to benefit from the additional costs due to tariff and freight costs applied to the imported goods that compete with their products. In that situation international trans-action costs influence the domestic price of all inputs, whether imported or domestically produced. This ad valorem increase in the price of competing goods is the extended tariff and trans-port nominal protection.
When all applied tariffs are most- favored- nation tariffs that do not discriminate between trading partners and when trans-portation costs are proportional to the value of the imported good, the extended tariff and transport effective protection is the difference between the nominal tariff and transport pro-tection enjoyed on the output minus the weighted average of tariff and transport paid directly (imported goods) or indirectly (domestic goods) on the inputs required for production. The weights applied to the additional tariff and transport costs on inputs are derived from the technical coefficients of the input-output matrix.5 The extended tariff and transport effective pro-tection rate is obtained by dividing this result by the value added that the industry would have enjoyed in the absence of tariff and transport costs. A formal presentation of the calculation is in annex 4.1.
Impact on competitiveness and export-led growth strategiesWhen the tariff and trade cost schedules are flat, the extended effective protection rate equals the nominal rate of tariff and transport protection. In table 4.3 that rate equals the rate of nominal protection (25%). But it will differ when there is vari-ance in the tariff and nontariff trade costs, because some sec-tors are more effectively protected than others. With tariff and transport cost escalation (most- favored- nation tariffs rising with the degree of processing or transportation and insurance costs increasing more than proportionally to the unit value of the goods), downstream domestic industries producing final goods
TABLE 4.3 Influence of trade cost on value added and profit margin, domestic versus export prices
Profit and costs
Domestic market
Export market
No trade costs
With trade costs
No trade costs
With trade costs
Imported intermediate input (free on board) 40 40 40 40
Trade cost on inputs 0 10 0 10
Value added 60 75 60 50
Labor 40 40 40 40
Profit 20 35 20 10
Export price (free on board) .. .. 100 100
Domestic market price 100 125 .. ..
Source: Diakantoni and others 2017.
Note: Example is based on hypothetical values, for illustrative purposes only.
The ad valorem trade cost (25%) is the same for input and output products.
102 • Measuring and Analyzing the Impact of GVCs on Economic Development
for the domestic market will benefit from a higher effective pro-tection on their value added. By contrast, upstream industries producing unprocessed inputs and basic parts and components will have a low extended effective protection rate — and possibly a negative one if the sum of tariff and transport margins paid on inputs is higher than the margin of protection received on the output.
Therefore, downstream industries registering a high extended effective protection rate on their production will have little incen-tive to export because the rate of return from exporting is lower than that from selling on the domestic market.6 Even upstream industries supporting a negative effective protection rate will still be better off selling on their domestic market, and the result holds for all domestic firms, but the anti-export bias is stronger for highly protected industries. This hurtful effect of escalation is particularly relevant for developing countries that want to diver-sify their export basket away from basic commodities.
Trade frictions reduce the competitiveness of domestic firms in the most frequent situation where they are price takers and compete on the global market at international prices. When a domestic firm exports, it loses the additional benefit due to the nominal protection it receives on its output while still paying the additional cost on inputs purchased domestically. The only way to compensate for the additional costs and lower profits at export would be to reduce the value-added cost — for example, by paying lower wages or retaining less profit.7
This loss of cost competitiveness is particularly critical in a GVC context, when the customers on the export market are for-eign lead firms that make their “make-or-buy” decisions as well as their choice of offshore localization on the basis of tight cost and profit margins. For this reason, policymakers have devel-oped several strategies, from duty drawbacks (the exporter can redeem the value of the tariff duties and other indirect taxes paid on inputs used for exports) to free export processing zones (industrial parks installed in fiscal enclaves).
Such schemes (duty drawbacks and export processing zones) fall short of providing a first-best policy when the policymakers’ ultimate objective is to use GVCs as a path toward industrializa-tion. Even if the typical arrangement in a supply chain contract is for the lead-firm or supply-chain manager to cover the interna-tional costs of procurement, an exporting firm will still face the higher cost of purchasing its inputs domestically. So the high tariff and transport protection in place outside export process-ing zones will limit the possibility of developing domestic interin-dustry links (second-tier domestic suppliers), even if a domestic firm can join an international supply chain.8
Take the most favorable case of a first-tier supplier operating from an export processing zone in an international supply chain where the foreign lead firm covers the costs of transportation of the intermediate inputs and the re-export of the processed good. In that situation the first-tier supplier does not have to pay any transaction costs. Yet, even when duty drawbacks or tariff exemptions (as in export processing zones) correct for trade fric-tions and allow domestic producers to purchase inputs at inter-national prices, export-oriented firms still have a disincentive to
purchase inputs internally because their second-tier domestic suppliers would not be able to benefit from the duty exemption.
Duty drawbacks and export processing zones compensate the exporting firm for the additional production costs caused by tariffs only when it uses imported inputs. Such a strategy effec-tively prices out domestic suppliers when nominal tariffs and trade costs are high. Second-tier national suppliers of a domes-tic exporting firm are usually not entitled to draw back the trade margins paid on their imports. Even if they were able to do so through some complex and arcane administrative mechanisms, they would still be at a disadvantage when using nonimported inputs (because nominal tariff and transport protection raises the domestic price of all tradable products, regardless of whether they are actually imported). The only possibilities for second-tier domestic suppliers to avoid tariff and transport costs would be to use only imported inputs or to exert downward price pres-sure on their own domestic suppliers to recoup lost competi-tiveness. While the anti-export bias is a well-known result from a traditional trade-in- final-goods perspective, the anti-upgrading corollary is new and relevant only from the vertical specialization perspective typical of GVCs, where a “buy” decision arising from a make-or-buy assessment implies arbitraging between domes-tic and foreign suppliers.
Trade costs per sector and countryDiakantoni and others (2017) applied the extended effective protection rate methodology by crossing OECD-WTO Trade in Value- Added database data on 61 economies and the underlying OECD Inter-Country Input- Output Tables. The detailed tariff data for 2006 and 2011 were sourced from the WTO. Nontariff costs were taken from Duval, Saggu, and Utoktham (2015). These trade costs do not proceed from a direct calculation but are indi-rectly derived from a gravity model applied to Trade in Value- Added database data: the trade frictions may result from a direct monetary cost (such as transportation, insurance, and other fees) as in the extended effective protection rate approach, but they may also arise from more subjective aspects, such as the ease or difficulty of gathering relevant information and other nonmone-tary barriers (regulation, licensing), insecure contracts and weak-ness in trade governance leading to uncertainty, differences in consumer taste, and so on. Nontariff trade measures are partic-ularly relevant for GVCs because they may constrain the produc-tion process itself (box 4.1). The monetary component, according to the experts who build the database, is believed to account for only one-third of these costs; this is the value retained in the extended effective protection rate application.
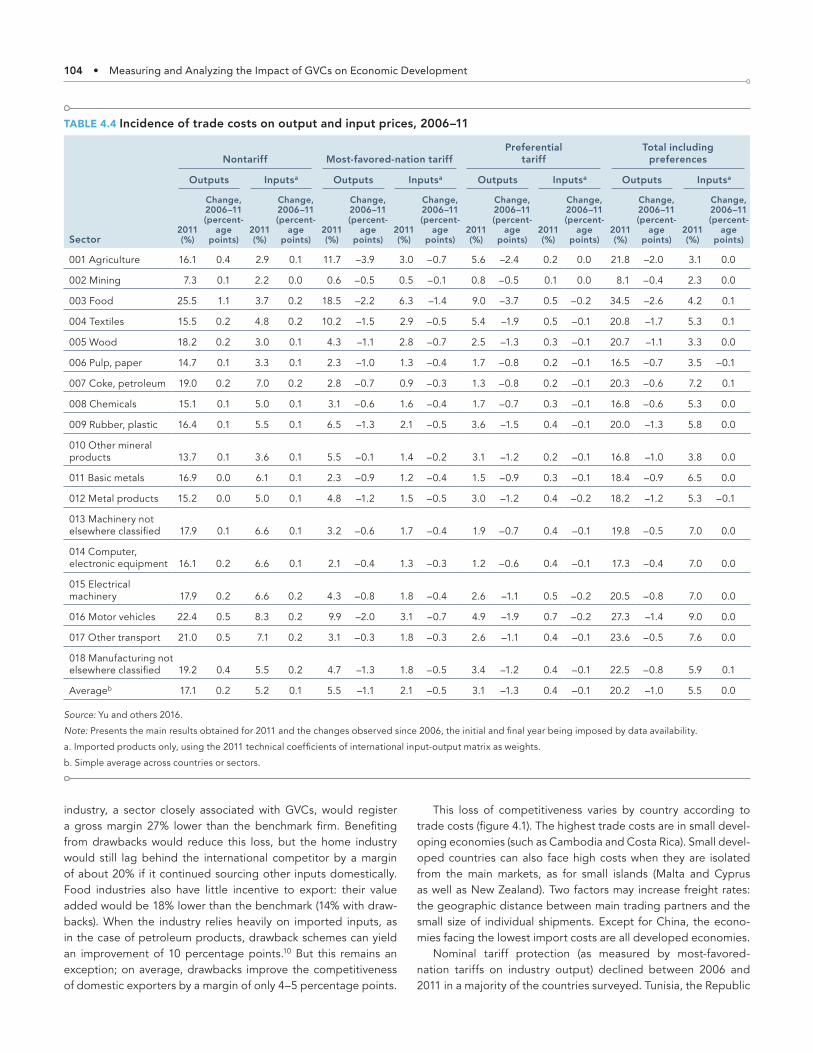
The first effect of tariff and nontariff trade costs is to pro-tect domestic producers from competitive imported products by increasing the import price by a trade margin of 20% to the international price of competing imports (averaged across all sectors in 2011), 17% for nontariff costs and 3% for tariff costs, including 2.5% preference margin (table 4.4).9 Trade costs vary by a factor larger than four between the highest (food prod-ucts) and the lowest (mining). Ranked by trade costs, the top five sectors are food products (35%), motor vehicles (27%), other
Accumulated trade costs and their impact on domestic and international value chains • 103
transport equipment (24%), agriculture (22%), and textiles (21%). The bottom five are computers (17%), other nonmetallic mineral products (17%), chemicals (17%), pulp, paper, and publishing (16%), and mining (8%). Commodities or primary goods such as mining, wood, or paper imported products face the lowest trade costs: tariffs are usually low, and the products are shipped in bulk, using sea freighters. At the other extreme, food products combine the disadvantages of being expensive to transport (as for perishable products) and being heavily protected by tariffs.
Considering that the protection received on output translates into an increase in the production cost for the users of those inter-mediate products, the weight on competitiveness is substantial. Using the technical coefficient of the OECD Inter-Country Input- Output Tables as weights, Diakantoni and others (2017) found that the additional production cost due to tariffs on imported inputs
was about 5.5%, after preferential treatments were included. Even so, the distribution of costs is skewed toward the higher range (7% and above). And this calculation takes into account only the direct cost of trade margins on imported inputs and not the indirect effect of also increasing the domestic market price of all products, regardless of whether they are imported.
Factoring in the impact of trade costs on the imported and domestic cost of inputs requires computing extended effective protection rates relative to a free-trade situation. This free-trade benchmark is not directly observable, but Diakantoni and others (2017) used German industries as the international benchmark because the German economy showed the lowest country/sector trade costs in their sample. Comparisons with this benchmark show that trade costs on inputs can greatly affect the compet-itiveness of industries. The average non-German motor vehicle
BOX 4.1Tariff and nontariff measures
Among trade costs, nontariff measures have a specific role because they interfere with industrial norms, whose regu-lation may also be considered trade enhancing. Nontar-iff measures considered by the World Trade Organization (WTO) concern mostly regulations and standards, which are dealt with under sanitary and phytosanitary measures and the technical barriers to trade. Nontariff measures are not only normative; they also include such quantitative mea-sures as safeguards, countervailing or antidumping mea-sures, and other quantitative restrictions imposed against discriminative policy measures by trading partners.
With the lowering of tariff duties over the past decades, awareness is growing that nontariff measures are imposing new restrictions on trade, especially with the rising impor-tance of global sourcing within global value chains (GVCs). Since the global financial crisis of 2008–09 the WTO primary monitoring and surveillance mechanism has been based on its periodic Trade Policy Reviews. Transparency mechanisms are also present in many regional trade agreements. Ing, Cadot, and Walz (2016) developed an index of nontariff mea-sure transparency, based on WTO notification requirements. They show that transparency varies positively with income (except for non–Organisation for Economic Co-operation and Development high-income countries). The index also varies across regions, high in the Association of Southeast Asian Nations (ASEAN) and low in Africa and the Middle East. It may not be a coincidence that ASEAN is much better inserted in GVCs than the two other regions and that the top five countries are Austria, Denmark, Ireland, Germany, and Sweden, all economies with an important GVC sector.
In theory, tariffs are trade restrictions imposed to pro-tect domestic producers, while nontariff measures are set to protect domestic consumers. Moreover, the use of inter-national standards by either exporters or importers is likely
to promote trade. The compliance of arm’s length suppliers with public and private norms (International Organization for Standardization standards on quality) substitutes for closer and more expensive lead-firm monitoring of the qual-ity of traded intermediate inputs. By contrast, cumbersome and unharmonized nontariff measures increase trade costs, if only because they entail more complex customs proce-dures. When not harmonized, nontariff measures are there-fore expected to be trade-restrictive, especially for smaller firms or firms in less technologically advanced countries.
Discussions of the protectionist nature of nontariff mea-sures are ongoing. Attempts to assess the trade impacts of nontariff measures have led to the development of “tariff equivalent” methods, which seek to estimate the ad valorem tariff that would have a trade-restricting effect equal to the nontariff measure in question (Ferrantino 2012). Adopting a specific GVC perspective, Ghodsi and Stehrer (2016) provided new ad valorem equivalents for nine types of nontariff measures, capturing the effects of these policy measures’ intensity across sectors, importers, and export-ers. Interestingly, some providers (such as Canada) may actually benefit from what would be conceived as restrictive measures, while others (such as Bulgaria) incur larger losses. Less advanced countries may therefore be more affected by stringent nontariff measures. The effect is also differenti-ated by industry and by type of nontariff measure: technical barriers to trade improve the cost efficiency of the inputs for the production of electrical and optical equipment, while sanitary and phytosanitary measures, tariffs, and aver-age bilateral trade-restrictiveness indices increase the costs of inputs for these industries. Ghodsi and Stehrer (2016) concluded that regulated nontariff measures that enhance information symmetries reduce trade costs and increase market efficiencies.
104 • Measuring and Analyzing the Impact of GVCs on Economic Development
industry, a sector closely associated with GVCs, would register a gross margin 27% lower than the benchmark firm. Benefiting from drawbacks would reduce this loss, but the home industry would still lag behind the international competitor by a margin of about 20% if it continued sourcing other inputs domestically. Food industries also have little incentive to export: their value added would be 18% lower than the benchmark (14% with draw-backs). When the industry relies heavily on imported inputs, as in the case of petroleum products, drawback schemes can yield an improvement of 10 percentage points.10 But this remains an exception; on average, drawbacks improve the competitiveness of domestic exporters by a margin of only 4–5 percentage points.
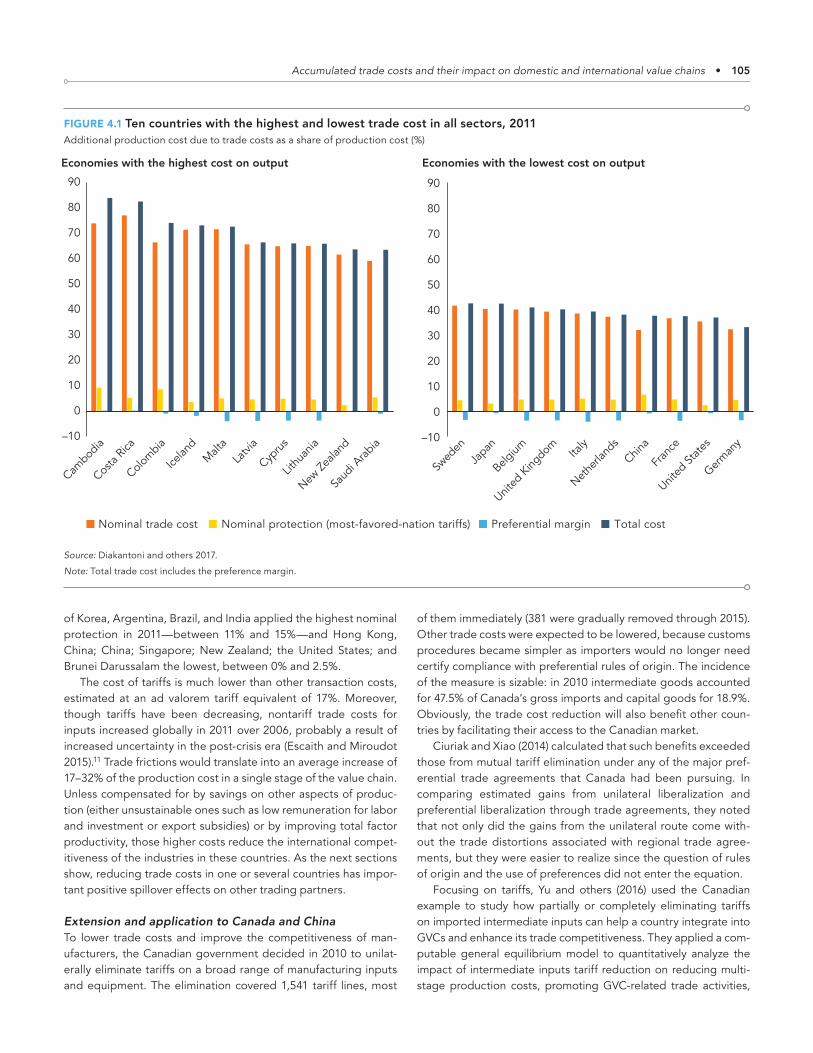
This loss of competitiveness varies by country according to trade costs (figure 4.1). The highest trade costs are in small devel-oping economies (such as Cambodia and Costa Rica). Small devel-oped countries can also face high costs when they are isolated from the main markets, as for small islands (Malta and Cyprus as well as New Zealand). Two factors may increase freight rates: the geographic distance between main trading partners and the small size of individual shipments. Except for China, the econo-mies facing the lowest import costs are all developed economies.
Nominal tariff protection (as measured by most- favored- nation tariffs on industry output) declined between 2006 and 2011 in a majority of the countries surveyed. Tunisia, the Republic
TABLE 4.4 Incidence of trade costs on output and input prices, 2006–11
Sector
Nontariff Most- favored- nation tariffPreferential
tariffTotal including
preferences
Outputs Inputsa Outputs Inputsa Outputs Inputsa Outputs Inputsa
2011 (%)
Change, 2006–11 (percent-
age points)
2011 (%)
Change, 2006–11 (percent-
age points)
2011 (%)
Change, 2006–11 (percent-
age points)
2011 (%)
Change, 2006–11 (percent-
age points)
2011 (%)
Change, 2006–11 (percent-
age points)
2011 (%)
Change, 2006–11 (percent-
age points)
2011 (%)
Change, 2006–11 (percent-
age points)
2011 (%)
Change, 2006–11 (percent-
age points)
001 Agriculture 16.1 0.4 2.9 0.1 11.7 –3.9 3.0 –0.7 5.6 –2.4 0.2 0.0 21.8 –2.0 3.1 0.0
002 Mining 7.3 0.1 2.2 0.0 0.6 –0.5 0.5 –0.1 0.8 –0.5 0.1 0.0 8.1 –0.4 2.3 0.0
003 Food 25.5 1.1 3.7 0.2 18.5 –2.2 6.3 –1.4 9.0 –3.7 0.5 –0.2 34.5 –2.6 4.2 0.1
004 Textiles 15.5 0.2 4.8 0.2 10.2 –1.5 2.9 –0.5 5.4 –1.9 0.5 –0.1 20.8 –1.7 5.3 0.1
005 Wood 18.2 0.2 3.0 0.1 4.3 –1.1 2.8 –0.7 2.5 –1.3 0.3 –0.1 20.7 –1.1 3.3 0.0
006 Pulp, paper 14.7 0.1 3.3 0.1 2.3 –1.0 1.3 –0.4 1.7 –0.8 0.2 –0.1 16.5 –0.7 3.5 –0.1
007 Coke, petroleum 19.0 0.2 7.0 0.2 2.8 –0.7 0.9 –0.3 1.3 –0.8 0.2 –0.1 20.3 –0.6 7.2 0.1
008 Chemicals 15.1 0.1 5.0 0.1 3.1 –0.6 1.6 –0.4 1.7 –0.7 0.3 –0.1 16.8 –0.6 5.3 0.0
009 Rubber, plastic 16.4 0.1 5.5 0.1 6.5 –1.3 2.1 –0.5 3.6 –1.5 0.4 –0.1 20.0 –1.3 5.8 0.0
010 Other mineral products 13.7 0.1 3.6 0.1 5.5 –0.1 1.4 –0.2 3.1 –1.2 0.2 –0.1 16.8 –1.0 3.8 0.0
011 Basic metals 16.9 0.0 6.1 0.1 2.3 –0.9 1.2 –0.4 1.5 –0.9 0.3 –0.1 18.4 –0.9 6.5 0.0
012 Metal products 15.2 0.0 5.0 0.1 4.8 –1.2 1.5 –0.5 3.0 –1.2 0.4 –0.2 18.2 –1.2 5.3 –0.1
013 Machinery not elsewhere classified 17.9 0.1 6.6 0.1 3.2 –0.6 1.7 –0.4 1.9 –0.7 0.4 –0.1 19.8 –0.5 7.0 0.0
014 Computer, electronic equipment 16.1 0.2 6.6 0.1 2.1 –0.4 1.3 –0.3 1.2 –0.6 0.4 –0.1 17.3 –0.4 7.0 0.0
015 Electrical machinery 17.9 0.2 6.6 0.2 4.3 –0.8 1.8 –0.4 2.6 –1.1 0.5 –0.2 20.5 –0.8 7.0 0.0
016 Motor vehicles 22.4 0.5 8.3 0.2 9.9 –2.0 3.1 –0.7 4.9 –1.9 0.7 –0.2 27.3 –1.4 9.0 0.0
017 Other transport 21.0 0.5 7.1 0.2 3.1 –0.3 1.8 –0.3 2.6 –1.1 0.4 –0.1 23.6 –0.5 7.6 0.0
018 Manufacturing not elsewhere classified 19.2 0.4 5.5 0.2 4.7 –1.3 1.8 –0.5 3.4 –1.2 0.4 –0.1 22.5 –0.8 5.9 0.1
Averageb 17.1 0.2 5.2 0.1 5.5 –1.1 2.1 –0.5 3.1 –1.3 0.4 –0.1 20.2 –1.0 5.5 0.0
Source: Yu and others 2016.
Note: Presents the main results obtained for 2011 and the changes observed since 2006, the initial and final year being imposed by data availability.
a. Imported products only, using the 2011 technical coefficients of international input- output matrix as weights.
b. Simple average across countries or sectors.
Accumulated trade costs and their impact on domestic and international value chains • 105
of Korea, Argentina, Brazil, and India applied the highest nominal protection in 2011 — between 11% and 15% — and Hong Kong, China; China; Singapore; New Zealand; the United States; and Brunei Darussalam the lowest, between 0% and 2.5%.
The cost of tariffs is much lower than other transaction costs, estimated at an ad valorem tariff equivalent of 17%. Moreover, though tariffs have been decreasing, nontariff trade costs for inputs increased globally in 2011 over 2006, probably a result of increased uncertainty in the post-crisis era (Escaith and Miroudot 2015).11 Trade frictions would translate into an average increase of 17–32% of the production cost in a single stage of the value chain. Unless compensated for by savings on other aspects of produc-tion (either unsustainable ones such as low remuneration for labor and investment or export subsidies) or by improving total factor productivity, those higher costs reduce the international compet-itiveness of the industries in these countries. As the next sections show, reducing trade costs in one or several countries has impor-tant positive spillover effects on other trading partners.
Extension and application to Canada and ChinaTo lower trade costs and improve the competitiveness of man-ufacturers, the Canadian government decided in 2010 to unilat-erally eliminate tariffs on a broad range of manufacturing inputs and equipment. The elimination covered 1,541 tariff lines, most
of them immediately (381 were gradually removed through 2015). Other trade costs were expected to be lowered, because customs procedures became simpler as importers would no longer need certify compliance with preferential rules of origin. The incidence of the measure is sizable: in 2010 intermediate goods accounted for 47.5% of Canada’s gross imports and capital goods for 18.9%. Obviously, the trade cost reduction will also benefit other coun-tries by facilitating their access to the Canadian market.
Ciuriak and Xiao (2014) calculated that such benefits exceeded those from mutual tariff elimination under any of the major pref-erential trade agreements that Canada had been pursuing. In comparing estimated gains from unilateral liberalization and preferential liberalization through trade agreements, they noted that not only did the gains from the unilateral route come with-out the trade distortions associated with regional trade agree-ments, but they were easier to realize since the question of rules of origin and the use of preferences did not enter the equation.
Focusing on tariffs, Yu and others (2016) used the Canadian example to study how partially or completely eliminating tariffs on imported intermediate inputs can help a country integrate into GVCs and enhance its trade competitiveness. They applied a com-putable general equilibrium model to quantitatively analyze the impact of intermediate inputs tariff reduction on reducing multi-stage production costs, promoting GVC-related trade activities,
FIGURE 4.1 Ten countries with the highest and lowest trade cost in all sectors, 2011Additional production cost due to trade costs as a share of production cost (%)
–10
0
10
20
30
40
50
60
70
80
90
Economies with the highest cost on output Economies with the lowest cost on output
Nominal trade cost Nominal protection (most-favored-nation tariffs) Preferential margin Total cost
Saud
i Arab
ia
New Ze
aland
Lithu
ania
Cypru
sLa
tvia
Malt
a
Icelan
d
Colombia
Costa R
ica
Cambodia
–10
0
10
20
30
40
50
60
70
80
90
German
y
United
State
s
Fran
ceChin
a
Nethe
rland
sIta
ly
United
King
dom
Belgium
Japan
Swed
en
Source: Diakantoni and others 2017.
Note: Total trade cost includes the preference margin.
106 • Measuring and Analyzing the Impact of GVCs on Economic Development
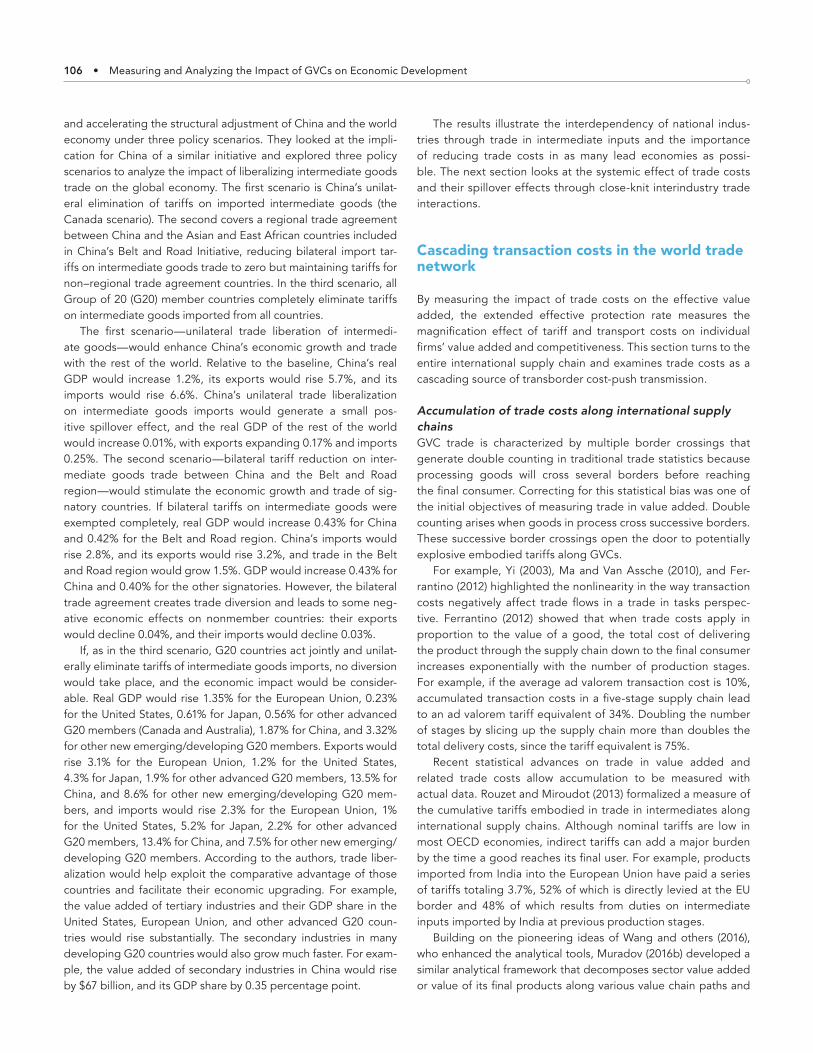
and accelerating the structural adjustment of China and the world economy under three policy scenarios. They looked at the impli-cation for China of a similar initiative and explored three policy scenarios to analyze the impact of liberalizing intermediate goods trade on the global economy. The first scenario is China’s unilat-eral elimination of tariffs on imported intermediate goods (the Canada scenario). The second covers a regional trade agreement between China and the Asian and East African countries included in China’s Belt and Road Initiative, reducing bilateral import tar-iffs on intermediate goods trade to zero but maintaining tariffs for non–regional trade agreement countries. In the third scenario, all Group of 20 (G20) member countries completely eliminate tariffs on intermediate goods imported from all countries.
The first scenario — unilateral trade liberation of intermedi-ate goods — would enhance China’s economic growth and trade with the rest of the world. Relative to the baseline, China’s real GDP would increase 1.2%, its exports would rise 5.7%, and its imports would rise 6.6%. China’s unilateral trade liberalization on intermediate goods imports would generate a small pos-itive spillover effect, and the real GDP of the rest of the world would increase 0.01%, with exports expanding 0.17% and imports 0.25%. The second scenario — bilateral tariff reduction on inter-mediate goods trade between China and the Belt and Road region — would stimulate the economic growth and trade of sig-natory countries. If bilateral tariffs on intermediate goods were exempted completely, real GDP would increase 0.43% for China and 0.42% for the Belt and Road region. China’s imports would rise 2.8%, and its exports would rise 3.2%, and trade in the Belt and Road region would grow 1.5%. GDP would increase 0.43% for China and 0.40% for the other signatories. However, the bilateral trade agreement creates trade diversion and leads to some neg-ative economic effects on nonmember countries: their exports would decline 0.04%, and their imports would decline 0.03%.
If, as in the third scenario, G20 countries act jointly and unilat-erally eliminate tariffs of intermediate goods imports, no diversion would take place, and the economic impact would be consider-able. Real GDP would rise 1.35% for the European Union, 0.23% for the United States, 0.61% for Japan, 0.56% for other advanced G20 members (Canada and Australia), 1.87% for China, and 3.32% for other new emerging/developing G20 members. Exports would rise 3.1% for the European Union, 1.2% for the United States, 4.3% for Japan, 1.9% for other advanced G20 members, 13.5% for China, and 8.6% for other new emerging/developing G20 mem-bers, and imports would rise 2.3% for the European Union, 1% for the United States, 5.2% for Japan, 2.2% for other advanced G20 members, 13.4% for China, and 7.5% for other new emerging/developing G20 members. According to the authors, trade liber-alization would help exploit the comparative advantage of those countries and facilitate their economic upgrading. For example, the value added of tertiary industries and their GDP share in the United States, European Union, and other advanced G20 coun-tries would rise substantially. The secondary industries in many developing G20 countries would also grow much faster. For exam-ple, the value added of secondary industries in China would rise by $67 billion, and its GDP share by 0.35 percentage point.
The results illustrate the interdependency of national indus-tries through trade in intermediate inputs and the importance of reducing trade costs in as many lead economies as possi-ble. The next section looks at the systemic effect of trade costs and their spillover effects through close-knit interindustry trade interactions.
Cascading transaction costs in the world trade network
By measuring the impact of trade costs on the effective value added, the extended effective protection rate measures the magnification effect of tariff and transport costs on individual firms’ value added and competitiveness. This section turns to the entire international supply chain and examines trade costs as a cascading source of transborder cost-push transmission.
Accumulation of trade costs along international supply chainsGVC trade is characterized by multiple border crossings that generate double counting in traditional trade statistics because processing goods will cross several borders before reaching the final consumer. Correcting for this statistical bias was one of the initial objectives of measuring trade in value added. Double counting arises when goods in process cross successive borders. These successive border crossings open the door to potentially explosive embodied tariffs along GVCs.
For example, Yi (2003), Ma and Van Assche (2010), and Fer-rantino (2012) highlighted the nonlinearity in the way transaction costs negatively affect trade flows in a trade in tasks perspec-tive. Ferrantino (2012) showed that when trade costs apply in proportion to the value of a good, the total cost of delivering the product through the supply chain down to the final consumer increases exponentially with the number of production stages. For example, if the average ad valorem transaction cost is 10%, accumulated transaction costs in a five-stage supply chain lead to an ad valorem tariff equivalent of 34%. Doubling the number of stages by slicing up the supply chain more than doubles the total delivery costs, since the tariff equivalent is 75%.
Recent statistical advances on trade in value added and related trade costs allow accumulation to be measured with actual data. Rouzet and Miroudot (2013) formalized a measure of the cumulative tariffs embodied in trade in intermediates along international supply chains. Although nominal tariffs are low in most OECD economies, indirect tariffs can add a major burden by the time a good reaches its final user. For example, products imported from India into the European Union have paid a series of tariffs totaling 3.7%, 52% of which is directly levied at the EU border and 48% of which results from duties on intermediate inputs imported by India at previous production stages.
Building on the pioneering ideas of Wang and others (2016), who enhanced the analytical tools, Muradov (2016b) developed a similar analytical framework that decomposes sector value added or value of its final products along various value chain paths and
Accumulated trade costs and their impact on domestic and international value chains • 107
measures the length of each component.12 The decompositions of GVCs at the sector level reveal substantial variation in the length and importance of the relevant parts of the value chain. Using the international input- output matrices behind the OECD–WTO Trade in Value-Added database, Muradov (2016b) found that, overall, industries are moving downstream along the value chain in two-thirds of the 34 sectors. As in Johnson and Noguera (2016), the results show that GVCs are also gaining importance over domestic value chains in both upstream and downstream directions.
Of special interest for this chapter, the GVC decompositions allow the trade costs accumulated along GVCs to be estimated. Muradov (2016a) found that the direct impact of tariffs (paid on imports) was almost always more significant than the accumu-lated tariffs embodied in the cost of production of the products.
The largest indirect tariffs were for Indonesia (3.76% direct, 1.33% indirect), Australia (2.44%, 1.30%), Chinese Taipei (2.52%, 1.28%), and Japan (1.39%, 1.28%). The indirect cost due to tariffs was higher than the direct one only in countries with low nominal pro-tection: Luxembourg (0.18%, 1.02%), Malta (0.38%, 0.69%), the Russian Federation (0.73%, 1.27%), and Greece (0.72%, 0.92%).
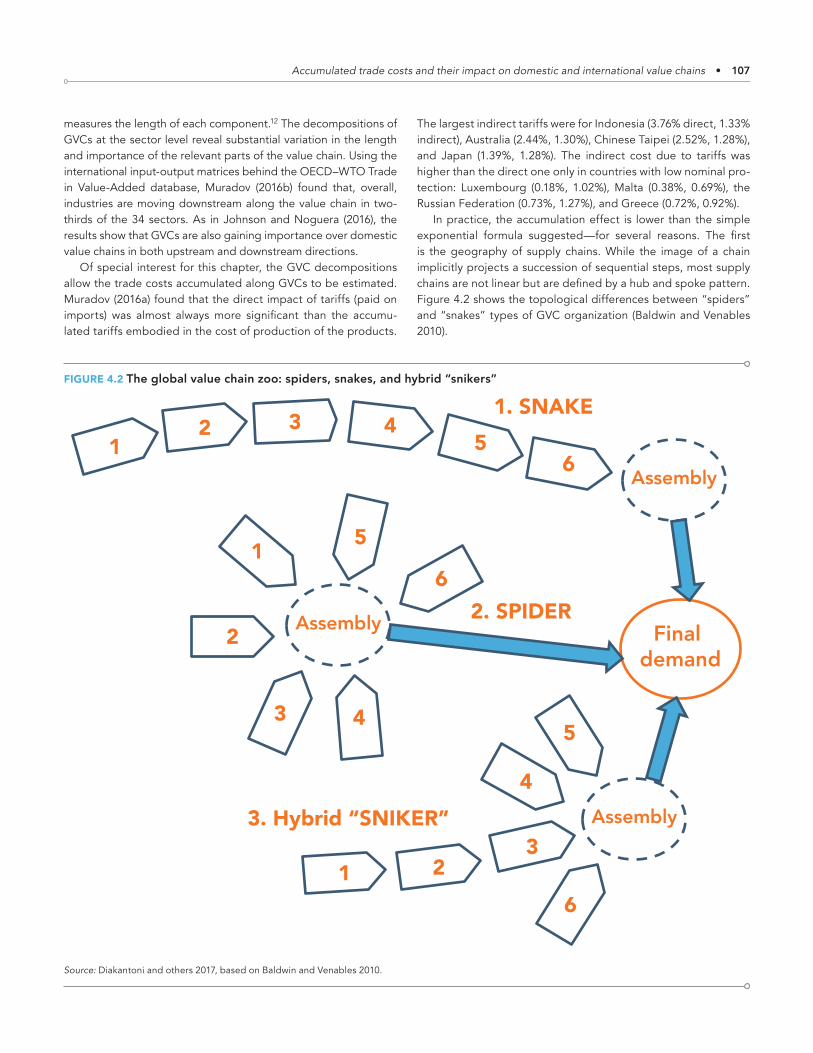
In practice, the accumulation effect is lower than the simple exponential formula suggested — for several reasons. The first is the geography of supply chains. While the image of a chain implicitly projects a succession of sequential steps, most supply chains are not linear but are defined by a hub and spoke pattern. Figure 4.2 shows the topological differences between “spiders” and “snakes” types of GVC organization (Baldwin and Venables 2010).
FIGURE 4.2 The global value chain zoo: spiders, snakes, and hybrid “snikers”
Final demand
Assembly
Assembly
Assembly
2. SPIDER
1. SNAKE
3. Hybrid “SNIKER”
1
1
1
2
2
2 3
3
3
4
4
4
6
6
6
5
5
5
Source: Diakantoni and others 2017, based on Baldwin and Venables 2010.
108 • Measuring and Analyzing the Impact of GVCs on Economic Development
In the spider first-tier suppliers of parts and components are arranged around a central assembly plant that ships the end product to its final destination. Unbundling costs are lower in the hub and spoke configuration: inputs cross a border at most twice, once as a part and once embodied in final output. In a snake each task is embodied in goods during processing, which are shipped again to the next production stage. At each stage the gross commercial value of the good in process increases, lead-ing to cascading transaction costs. Diakantoni and others (2017) showed that the accumulated trade costs are greatly reduced in the spider. In real life, actual supply chains are “snikers” — hybrids of spiders and snakes.
The other important mitigating factor identified by Diakan-toni and others (2017) is endogenous to the development of GVCs: supply chains can prosper and develop only when trade costs are low. And only when trade costs are below a certain threshold will a lead firm find it profitable to internationally out-source part of the production.13 GVCs are Coasian constructs that exist only when the incremental benefit from improved complexity (GVC length) is higher than the increased transaction cost (box 4.2).
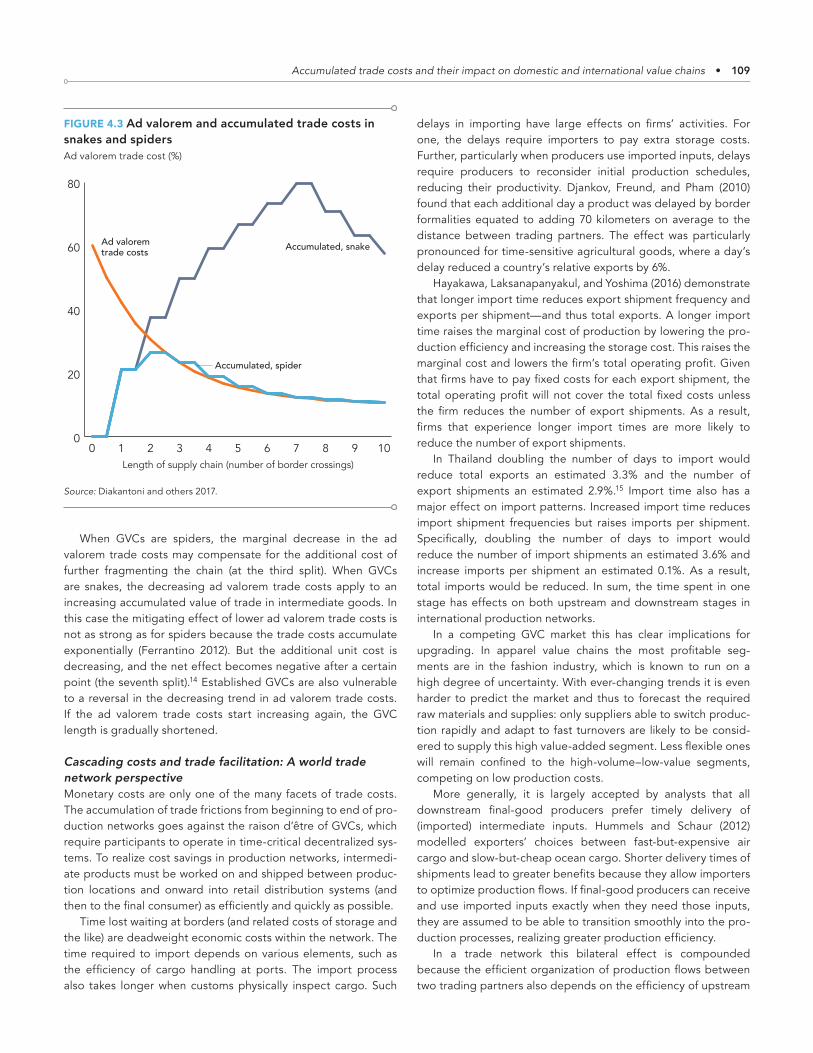
Not only is the total accumulated trade cost bounded by GVC efficiency, but for a given structure of efficiency gains the length of the GVC is negatively correlated with trade costs. As Yi (2003) showed, the relationship is not linear, and trade costs have to be greatly reduced before GVCs start expanding. It is therefore unrealistic to extrapolate accumulating trade costs along longer GVCs where ad valorem trade costs do not decrease. The net result between the decrease in ad valorem trade costs (the exog-enous factor) and the resulting increase in GVC length may lead to relatively small increases in total accumulated costs ex post.
Consider a simple simulation exercise based on the hypoth-esis that, for a given product, GVC expansion is endogenous to trade costs (figure 4.3). When trade costs are above a certain threshold, the length of the GVC measured in border crossings is 0: the places of production and consumption coincide, with-out a border crossing. Only when trade costs fall beyond certain thresholds does it become profitable to shift part of the produc-tion to another country that offers efficiency gains larger than the additional trade cost incurred. When trade costs are further reduced, new outsourcing opportunities may increase produc-tion efficiency by enlarging the supply chain.
BOX 4.2Transaction costs, trade, and foreign direct investment
Ronald Coase posited that corporations exist to economize on the transaction costs of markets. After they reach some size, organizational complexity becomes overwhelming, and the firm faces diseconomies of scale and scope. What Coasian economists call transaction costs include all imped-iments to cooperation and encompass the trade costs dis-cussed here. One aspect of this question, the “make-or-buy” decision (vertical specialization), is central to the rise of GVCs and has been discussed from an international trade perspective by Grossman and Helpman (2002, 2003, 2005), who analyzed the determinants of international outsourcing as a function of trade and transaction costs. As firms adopt increasingly complex organization and sourcing strategies and as global value chains grow in length and layers, lower transaction costs become even more essential, especially when just-in-time management models make transport and communication a critical component of competitiveness.
Indeed, an increasingly important component of trans-action cost, especially in GVCs, is information cost. Infor-mation and communication technologies enable firms to better monitor assets and operation (Head and Ries 2008), communicate with foreign suppliers and customers (Old-enski 2012), and substitute for the transfer of technology embodied in traded intermediates (Keller and Yeaple 2013). An emerging strand of research analyzes the role of com-munication costs in determining the patterns of trade and multinational activity.
Similarly, firms engage in vertical foreign direct invest-ment (when they fragment production or slice up the value chain because vertical foreign direct investment is motivated by comparative advantages, unlike older horizontal foreign direct investment, which is motivated by market access) because of cost considerations arising from countries’ factor cost differences (Alfaro and Chen 2017). Distance has become less an obstacle for foreign direct investment, as it did for trade. Using U.S. foreign direct investment outflow and inflow data for 2001 and 2010, they found that the share of U.S. outward foreign direct investment concentrated within 5,000 kilometers fell from around 30% to around 20%.
This change suggests an expansion of foreign direct investment flow across space in an era when transportation and communication costs have declined. The trend may also reveal that firms are less risk-averse when it comes to invest-ing overseas because they perceive that global economic governance, in particular competition policy, has improved. A growing number of bilateral trade agreements have included chapters on competition policy that allow foreign affiliates to compete on more equal footing with domestic firms. As discussed in chapters 7 and 8 of this book, busi-ness climate and contractual enforcement influence not only make-or-buy decisions, but also the choice between inter-national outsourcing (arm’s length subcontracting) and off-shoring through foreign direct investment when rules lack sufficient binding force for disciplining business practices.
Accumulated trade costs and their impact on domestic and international value chains • 109
When GVCs are spiders, the marginal decrease in the ad valorem trade costs may compensate for the additional cost of further fragmenting the chain (at the third split). When GVCs are snakes, the decreasing ad valorem trade costs apply to an increasing accumulated value of trade in intermediate goods. In this case the mitigating effect of lower ad valorem trade costs is not as strong as for spiders because the trade costs accumulate exponentially (Ferrantino 2012). But the additional unit cost is decreasing, and the net effect becomes negative after a certain point (the seventh split).14 Established GVCs are also vulnerable to a reversal in the decreasing trend in ad valorem trade costs. If the ad valorem trade costs start increasing again, the GVC length is gradually shortened.
Cascading costs and trade facilitation: A world trade network perspectiveMonetary costs are only one of the many facets of trade costs. The accumulation of trade frictions from beginning to end of pro-duction networks goes against the raison d’être of GVCs, which require participants to operate in time-critical decentralized sys-tems. To realize cost savings in production networks, intermedi-ate products must be worked on and shipped between produc-tion locations and onward into retail distribution systems (and then to the final consumer) as efficiently and quickly as possible.
Time lost waiting at borders (and related costs of storage and the like) are deadweight economic costs within the network. The time required to import depends on various elements, such as the efficiency of cargo handling at ports. The import process also takes longer when customs physically inspect cargo. Such
delays in importing have large effects on firms’ activities. For one, the delays require importers to pay extra storage costs. Further, particularly when producers use imported inputs, delays require producers to reconsider initial production schedules, reducing their productivity. Djankov, Freund, and Pham (2010) found that each additional day a product was delayed by border formalities equated to adding 70 kilometers on average to the distance between trading partners. The effect was particularly pronounced for time-sensitive agricultural goods, where a day’s delay reduced a country’s relative exports by 6%.
Hayakawa, Laksanapanyakul, and Yoshima (2016) demonstrate that longer import time reduces export shipment frequency and exports per shipment — and thus total exports. A longer import time raises the marginal cost of production by lowering the pro-duction efficiency and increasing the storage cost. This raises the marginal cost and lowers the firm’s total operating profit. Given that firms have to pay fixed costs for each export shipment, the total operating profit will not cover the total fixed costs unless the firm reduces the number of export shipments. As a result, firms that experience longer import times are more likely to reduce the number of export shipments.
In Thailand doubling the number of days to import would reduce total exports an estimated 3.3% and the number of export shipments an estimated 2.9%.15 Import time also has a major effect on import patterns. Increased import time reduces import shipment frequencies but raises imports per shipment. Specifically, doubling the number of days to import would reduce the number of import shipments an estimated 3.6% and increase imports per shipment an estimated 0.1%. As a result, total imports would be reduced. In sum, the time spent in one stage has effects on both upstream and downstream stages in international production networks.
In a competing GVC market this has clear implications for upgrading. In apparel value chains the most profitable seg-ments are in the fashion industry, which is known to run on a high degree of uncertainty. With ever-changing trends it is even harder to predict the market and thus to forecast the required raw materials and supplies: only suppliers able to switch produc-tion rapidly and adapt to fast turnovers are likely to be consid-ered to supply this high value-added segment. Less flexible ones will remain confined to the high-volume–low-value segments, competing on low production costs.
More generally, it is largely accepted by analysts that all downstream final-good producers prefer timely delivery of (imported) intermediate inputs. Hummels and Schaur (2012) modelled exporters’ choices between fast-but-expensive air cargo and slow-but-cheap ocean cargo. Shorter delivery times of shipments lead to greater benefits because they allow importers to optimize production flows. If final-good producers can receive and use imported inputs exactly when they need those inputs, they are assumed to be able to transition smoothly into the pro-duction processes, realizing greater production efficiency.
In a trade network this bilateral effect is compounded because the efficient organization of production flows between two trading partners also depends on the efficiency of upstream
FIGURE 4.3 Ad valorem and accumulated trade costs in snakes and spidersAd valorem trade cost (%)
0
20
40
60
80
109876543210
Ad valoremtrade costs Accumulated, snake
Length of supply chain (number of border crossings)
Accumulated, spider
Source: Diakantoni and others 2017.
110 • Measuring and Analyzing the Impact of GVCs on Economic Development
and downstream GVC partners: the production chain will be as swift as its slowest link. Bilateral trade frictions should therefore be analyzed from a multiplayer perspective, including not only the other bilateral trading partners, as in conventional gravity models, but also indirect participants that are farther upstream or downstream in the supply chain. Improving the effectiveness in processing trade with a minimum of frictions will not have the same impact on the world trade network as improving logistic and trade facilitation in a country playing the role of a GVC hub.
Network and graph analysis applied to trade in intermediate inputs identifies key players by computing centrality indicators. If a trading partner (a node or a vertex, in network analysis) “influ-ences just one other node, who subsequently influences many other nodes (who themselves influence still more others), then the first node in that chain is highly influential” (Borgatti 2005, p. 61). A player’s centrality is therefore a function of both its own importance in the world trade economy and the centrality of the trading partners it is associated with.
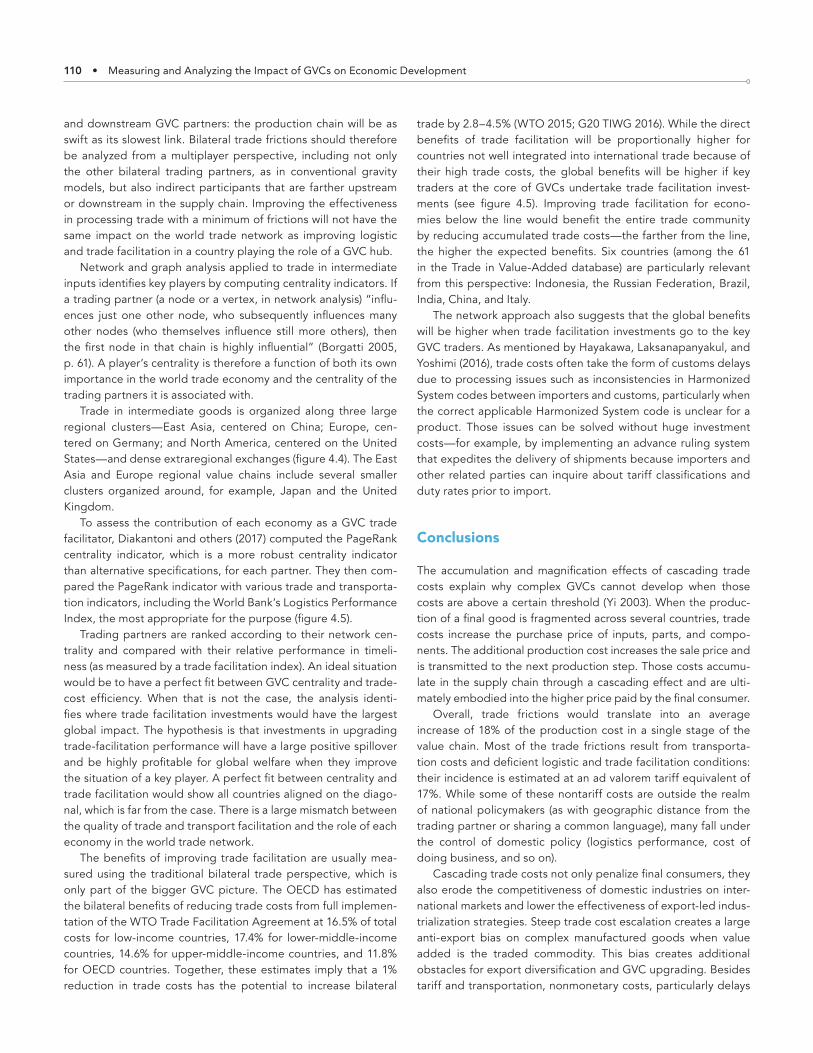
Trade in intermediate goods is organized along three large regional clusters — East Asia, centered on China; Europe, cen-tered on Germany; and North America, centered on the United States — and dense extraregional exchanges (figure 4.4). The East Asia and Europe regional value chains include several smaller clusters organized around, for example, Japan and the United Kingdom.
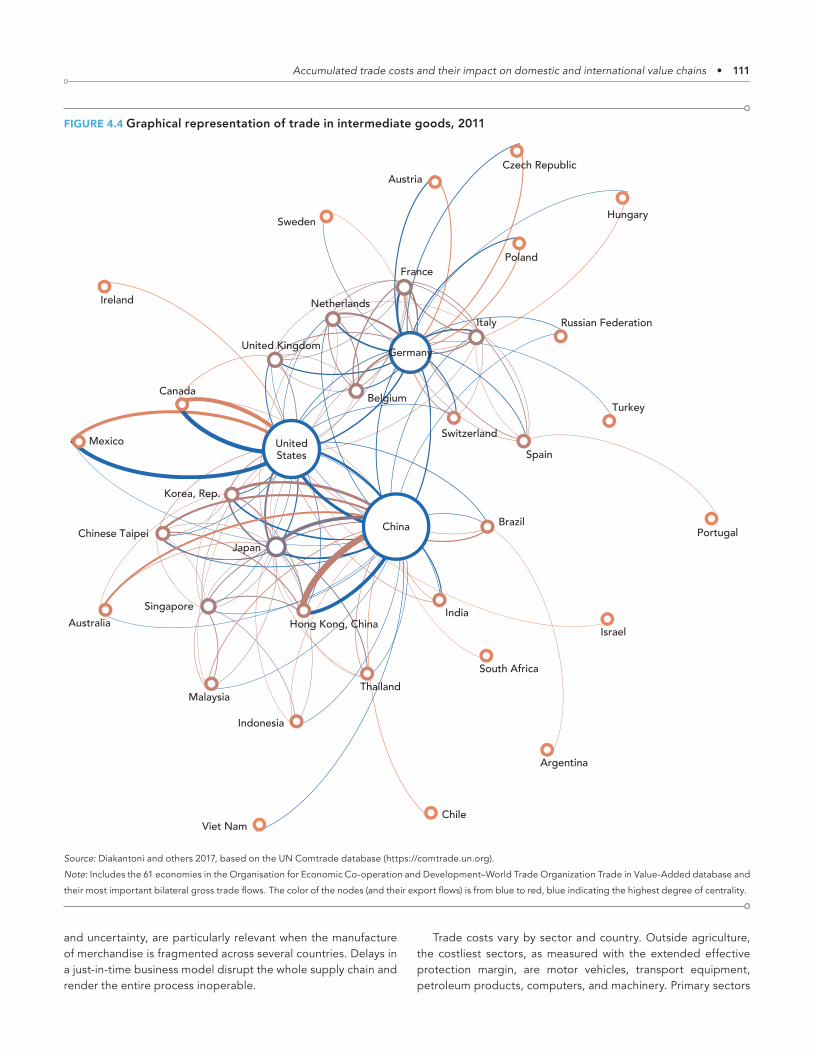
To assess the contribution of each economy as a GVC trade facilitator, Diakantoni and others (2017) computed the PageRank centrality indicator, which is a more robust centrality indicator than alternative specifications, for each partner. They then com-pared the PageRank indicator with various trade and transporta-tion indicators, including the World Bank’s Logistics Performance Index, the most appropriate for the purpose (figure 4.5).
Trading partners are ranked according to their network cen-trality and compared with their relative performance in timeli-ness (as measured by a trade facilitation index). An ideal situation would be to have a perfect fit between GVC centrality and trade-cost efficiency. When that is not the case, the analysis identi-fies where trade facilitation investments would have the largest global impact. The hypothesis is that investments in upgrading trade-facilitation performance will have a large positive spillover and be highly profitable for global welfare when they improve the situation of a key player. A perfect fit between centrality and trade facilitation would show all countries aligned on the diago-nal, which is far from the case. There is a large mismatch between the quality of trade and transport facilitation and the role of each economy in the world trade network.
The benefits of improving trade facilitation are usually mea-sured using the traditional bilateral trade perspective, which is only part of the bigger GVC picture. The OECD has estimated the bilateral benefits of reducing trade costs from full implemen-tation of the WTO Trade Facilitation Agreement at 16.5% of total costs for low-income countries, 17.4% for lower-middle-income countries, 14.6% for upper-middle-income countries, and 11.8% for OECD countries. Together, these estimates imply that a 1% reduction in trade costs has the potential to increase bilateral
trade by 2.8–4.5% (WTO 2015; G20 TIWG 2016). While the direct benefits of trade facilitation will be proportionally higher for countries not well integrated into international trade because of their high trade costs, the global benefits will be higher if key traders at the core of GVCs undertake trade facilitation invest-ments (see figure 4.5). Improving trade facilitation for econo-mies below the line would benefit the entire trade community by reducing accumulated trade costs — the farther from the line, the higher the expected benefits. Six countries (among the 61 in the Trade in Value-Added database) are particularly relevant from this perspective: Indonesia, the Russian Federation, Brazil, India, China, and Italy.
The network approach also suggests that the global benefits will be higher when trade facilitation investments go to the key GVC traders. As mentioned by Hayakawa, Laksanapanyakul, and Yoshimi (2016), trade costs often take the form of customs delays due to processing issues such as inconsistencies in Harmonized System codes between importers and customs, particularly when the correct applicable Harmonized System code is unclear for a product. Those issues can be solved without huge investment costs — for example, by implementing an advance ruling system that expedites the delivery of shipments because importers and other related parties can inquire about tariff classifications and duty rates prior to import.
Conclusions
The accumulation and magnification effects of cascading trade costs explain why complex GVCs cannot develop when those costs are above a certain threshold (Yi 2003). When the produc-tion of a final good is fragmented across several countries, trade costs increase the purchase price of inputs, parts, and compo-nents. The additional production cost increases the sale price and is transmitted to the next production step. Those costs accumu-late in the supply chain through a cascading effect and are ulti-mately embodied into the higher price paid by the final consumer.
Overall, trade frictions would translate into an average increase of 18% of the production cost in a single stage of the value chain. Most of the trade frictions result from transporta-tion costs and deficient logistic and trade facilitation conditions: their incidence is estimated at an ad valorem tariff equivalent of 17%. While some of these nontariff costs are outside the realm of national policymakers (as with geographic distance from the trading partner or sharing a common language), many fall under the control of domestic policy (logistics performance, cost of doing business, and so on).
Cascading trade costs not only penalize final consumers, they also erode the competitiveness of domestic industries on inter-national markets and lower the effectiveness of export-led indus-trialization strategies. Steep trade cost escalation creates a large anti-export bias on complex manufactured goods when value added is the traded commodity. This bias creates additional obstacles for export diversification and GVC upgrading. Besides tariff and transportation, nonmonetary costs, particularly delays
Accumulated trade costs and their impact on domestic and international value chains • 111
and uncertainty, are particularly relevant when the manufacture of merchandise is fragmented across several countries. Delays in a just-in-time business model disrupt the whole supply chain and render the entire process inoperable.
Trade costs vary by sector and country. Outside agriculture, the costliest sectors, as measured with the extended effective protection margin, are motor vehicles, transport equipment, petroleum products, computers, and machinery. Primary sectors
FIGURE 4.4 Graphical representation of trade in intermediate goods, 2011
Argentina
Australia
Austria
Belgium
Brazil
Canada
Switzerland
Chile
China
Czech Republic
Germany
Spain
France
United Kingdom
Hong Kong, China
Hungary
Indonesia
India
Ireland
Israel
Italy
Japan
Korea, Rep.
Mexico
Malaysia
Netherlands
Poland
Portugal
Russian Federation
Singapore
Sweden
Thailand
Turkey
Chinese Taipei
UnitedStates
Viet Nam
South Africa
Source: Diakantoni and others 2017, based on the UN Comtrade database (https://comtrade.un.org).
Note: Includes the 61 economies in the Organisation for Economic Co-operation and Development–World Trade Organization Trade in Value-Added database and
their most important bilateral gross trade flows. The color of the nodes (and their export flows) is from blue to red, blue indicating the highest degree of centrality.
112 • Measuring and Analyzing the Impact of GVCs on Economic Development
carry the lowest trade costs because they require few inputs in the production chain. Small and low-income countries tend to suffer more from trade costs: Cambodia ranks as the most expensive country in additional trade costs.
The smaller domestic value added share in developing econ-omies’ manufactured exports, compared with that in developed countries’ economies, tends to amplify the impact of trade costs through the magnification effect. From a trade and development perspective higher-than-average trade costs marginalize low-in-come countries and prevent them from joining international supply chains. They may still compete by further reducing the wages paid to workers and the gross profit retained by the firm, but such a race to the bottom would severely limit their potential for industrial and social upgrading.
Many developing countries intend to lower their trade costs by setting up duty drawback schemes and export processing zones. But the effect is limited in time and scope, because they compensate exporting firms for the additional production costs only when they use imported inputs. Such strategies tend to
price-out second-tier domestic firms. These mitigating policies are only second-best alternatives to fully fledged trade facilita-tion when it comes to deepening domestic interindustrial links. Reducing tariff and nontariff trade costs globally through mul-tilateral agreements is thus fully consistent with the interests of developing economies because it lowers their cost of GVC participation.
Finally, in a production network, bilateral trade costs tell only part of the story. In a close-knit network, competitiveness also depends on the costs faced by trading partners and by trade competitors. Poor trade facilitation among countries that rank highly in GVC trade (at or close to the heart of regional networks) impose a systemic cost both to themselves and to the rest of the trade community. The welfare benefits of the WTO Trade Facilitation Agreement from gains from trade will be enjoyed by the implementing economy, by its direct trading partners, and by the entire community. This magnified effect of trade facilita-tion is directly attributable to the way trade costs accumulate in GVCs.
FIGURE 4.5 PageRank scores and Logistics Performance Index values, 2011PageRank centrality indicator
0 10 20 30 40 50 600
10
20
30
40
50
60
Logistics Performance Index
Germany ChinaItalyUnited States
Netherlands FranceBelgium United Kingdom
JapanRepublic of Korea IndiaSpain Russian Federation
BrazilSwitzerlandHong Kong, China PolandChinese Taipei
Sweden Turkey IndonesiaThailandAustraliaCanadaSingapore Czech RepublicAustria Malaysia
MexicoChileViet NamHungaryDenmark
FinlandSouth Africa Argentina
RomaniaIsrael
PhilippinesSaudi ArabiaIreland
Slovak RepublicNorway Portugal
Iceland
Lithuania
Luxembourg
Colombia
TunisiaSlovenia
LatviaCosta Rica
Croatia
Bulgaria
EstoniaGreece
CambodiaNew Zealand
Source: Diakantoni and others 2017.
Note: The diagonal line shows equal ranking on the Logistics Performance Index and on PageRank.
Accumulated trade costs and their impact on domestic and international value chains • 113
ANNEX 4.1Extended effective protection rates and the relative price of value added
Effective protection rates, in their original formulation, are calcu-lated by deducting the additional production cost that manufac-turers have to pay because of the tariff charged on tradable inputs from the additional benefit generated by selling their product at a price higher than the free-trade market price, thanks to the duties charged on competitive imports. The effective rate of protection (EEPR) on tradable good j is the difference between Vj, the value added obtained on the domestic market (with prices influenced by trade costs), and V*j, the value added that would be generated in the absence of policy and natural trade barriers, expressed as a pro-portion of the frictionless value added. It is given by the expression:
EEPRj = (Vj – V*j) / V*j (A4.1.1)
Substituting products for industries, equation A4.1.1 can be expressed in standard input- output notation:
EEPRj = pj × tj – ∑i(ti × aij) – 1 (A4.1.2)
pj – ∑iaij
where pj is the nominal price of output j at the frictionless trade price; aij are elements of the matrix A of technical coefficients in an input- output matrix at the frictionless trade price of inputs i;16 tj is 1 + the rate of ad valorem tariff and transport nominal protec-tion on sector j, where tj ≥ 1; and ti is 1 + the rate of ad valorem nominal tariff and transport protection on inputs purchased from sector i, where ti ≥ 1. i can be equal to j when a firm pur-chases inputs from other firms in the same sector of activity. In an intercountry framework i also includes the partner dimension [c] because inputs from sector i might be domestic or imported.
In the trade literature this expression is often simplified into:
EEPRj = t’j – ∑i(t’i × aij) (A4.1.3)
1 – ∑iaij
where t’i and t’j are the rates of ad valorem protection, where t’i > 0.
To analyze more precisely the impacts of trade costs on competitiveness as well as some mitigating measures that the exporting country could implement, it is important to distinguish between the costs of domestic (superscript h) and foreign inputs (superscript f ). Extended effective protection rates can be writ-ten as:
EEPRj = tj – [∑i(ti × af
ij) + ∑i(ti × ahij)] – 1 (A4.1.4)
1 – ∑iaij
where afij is the intermediate consumption i from the foreign
country required to produce one unit of output j and ahij is the
intermediate consumption i from the home country required to produce one unit of output j.
Even when duty drawbacks or tariff exemptions correct for trade frictions and allow domestic producers to purchase inputs at international prices (as in export processing zones), export- oriented firms still have a disincentive to purchase inputs inter-nally from second-tier domestic suppliers, represented by the sum [∑i(ti × ah
ij)]. The first-tier domestic suppliers exporting their prod-ucts to other participants in the international supply chain remain at a disadvantage to their free-trade competitors (right side of equation A4.1.5) when they source some of their inputs from other local suppliers or outsource some of their tasks to them:
(1 – [∑iafij + ∑i(ti × ah
ij)]) < (1 – ∑iaij) (A4.1.5)
In other words, export processing zones or drawbacks price-out domestic suppliers when nominal tariffs and trade costs are high. To summarize the main implications of the formal model, even in the absence of tariff and transport cost escalation and a flat extended effective protection rate, trade frictions reduce the competitiveness of domestic firms, most frequently when they are price takers and compete on the global market at interna-tional prices.
114 • Measuring and Analyzing the Impact of GVCs on Economic Development
ANNEX 4.2Measuring the length of global value chains and the number of border crossings
The analysis of trade costs embodied in multistage international production processes is often carried out using international input- output models. The calculations have been made possible by the availability of the underlying input- output tables: Koopman and others (2010) estimate the cumulative effect of transportation and tariff margins using Global Trade Analysis Project Multi-Country Input- Output tables; Tamamura (2010) uses the Institute of Devel-oping Economies–Japan External Trade Organization international tables to estimate the impact of regional trade agreements.
Length is most often estimated using the concept of average propagation length applied at the international level in Dietzen-bacher and Romero (2007) for major European countries and by Inomata (2008) for Asia. The average propagation length rep-resents the average number of production stages lining up in every branch of all the given supply chains. It is a shorthand rep-resentation for an industry’s level of fragmentation, which relies on weighting the distance index by successive powers k of the technical coefficient matrix A. Aks are regarded as progressive impacts of the initial demand when supply chains are sliced at the kth stage of the production process. The average propaga-tion length is defined as:
APLj–i = 1 × aij + 2 ×
[A2]ij + 3 × [A3]ij + … (A4.2.1)
(lij – δij) (lij – δij) (lij – δij)
where lij is Leontief inverse coefficients [I – A]–1 and δij is a Kro-necker delta product that is δij = 1 if i = j and δij = 0 otherwise.
In other words, the average propagation length is the weighted average of the number of production stages that an impact from industry j goes through until it ultimately reaches industry i, using the strength of an impact at each stage as a weight. By construction, the average propagation length shows a rapidly decaying effect after the second round, because of the low value of the nondiagonal coefficients in the Leontief matrix. As a result, the value of the additional element of the average propagation length suite falls rapidly to zero after the second production stage. That the Aks tend toward zero when k increases is actually a condition for the suite to converge to the Leontief inverse [I – A]–1, a result central to most GVC indicators. The smaller the value of extra-diagonal technical coefficients, the faster is the convergence to zero.
This is particularly true for the international coefficients (those outside the bloc-diagonal matrices representing the domestic interindustrial exchanges) and reflects the fact that most coun-tries are largely self-sufficient in intermediate inputs. Therefore, the foreign component of Ak (coefficients outside the bloc-diag-onal of domestic industries) is rapidly insignificant from an eco-nomic perspective when k increases.17
The length of the GVCs can be factored in by using geo-graphic distance or monetary transportation costs between two inter-related industries instead of counting production stages, as in the average propagation length formulation shown in equa-tion A4.2.2. This calculation was suggested by Los and Temur-shoev (2012). Once the distance between the supplying firm and its clients (dij) is known, a vector of input-weighted distance from customers to suppliers provides a geographical distance (dij is in kilometers) or an economic one (if dij is in monetary terms). The distance covered by the global value chain between its initiation and the final consumer is given by:
D: (I – A’)–1 D* (A4.2.2)
where D* is a diagonal input-weighted matrix of supplier-to- client distance by industry and country.18 Miroudot and Nord-stöm (2015) adapt this methodology to measure the length of the external network of suppliers, sourcing the distance from the GeoDist database maintained by the Centre d’Études Prospec-tives et d’Informations Internationales (Mayer and Zignago 2011).
Another way of looking at GVC length is to estimate the number of border crossings from the first step (most upstream sector/country) to final demand. Such a decomposition also allows an industry to be located in relation to its situation in the supply chain (upstream or downstream). Wang and others (2016) synthesize the various backward and forward measures by defin-ing a GVC position index based on a thorough decomposition of the contribution of each production stage to the total value. Their index measures the distance from any production stage between the final demand and the initial factor inputs in a pro-duction line by a combination of production links based on both forward and backward links. The length of the international part of supply chains (the one subject to cumulative tariff and trans-portation costs) varies from country to country and sector to sector.
Muradov (2016a) proposes a new approach to quantify the accumulation of trade costs and the average number of back-ward and forward border crossings. When the input- output coef-ficients are calculated at basic prices (the most common situa-tion), trade costs can be integrated into the A matrix by adding an additional row of trade margins. His method also relies on the use of an alternative to the Leontief matrix to compute a “global” inverse, disaggregating ex ante (instead of ex post, as in other approaches) the diagonal and off-diagonal blocs corresponding to, respectively, domestic and international transactions in the A matrix. Diakantoni and others (2017) discuss the interpretation of those trade margins when some of the trade costs are embodied in domestic inputs.
Accumulated trade costs and their impact on domestic and international value chains • 115
Notes
1. Measuring the input use and value-added contributions along the
production chain from beginning to end since the mid-1970s, the
five stylized facts are the ratio of world value-added to gross exports
(an indicator of GVC trade) has fallen over time, by roughly 10 per-
centage points; this ratio has fallen for manufacturing but has risen
outside of manufacturing; changes have been heterogeneous across
countries, with fast growing countries seeing larger declines in the
ratio of their value-added to gross exports; declines in value added
to export ratios have been larger for proximate partners that entered
into regional trade agreements; and declines in value added to export
ratios have been larger for country pairs that entered into regional
trade agreements.
2. The author shows that in the presence of trade in intermediates GDP
is not a good proxy for economic mass. As Noguera (2012) explains,
deriving a gravity equation for bilateral value-added trade is com-
plicated by the nonlinear relationship between the value added and
final-good demands. Trade costs affect trade in value added through
their effect both on bilateral gross trade and on production sharing
arrangements, but also through the trade costs corresponding to
other pairs of countries in the supply chain.
3. In competitive markets GVC trade exists only when trade costs are
lower than the efficiency gains of fragmenting the supply chain and
outsourcing the tasks. So by definition accumulating trade costs have
an upper limit. In a competitive market where all efficiency gains are
translated to the price of the final product, any increase in trade costs
will be paid by the consumer. In a semi-monopolistic market the effi-
ciency gains will accrue mainly to the lead firm.
4. The effective tariff rate on output differs from the effective rate of pro-
tection as it is usually understood in trade analysis and is used later in
the chapter. It contemplates only the nominal protection on output
but excludes the additional production cost on inputs.
5. Input coefficients aij are calculated by dividing input values of goods
and services used in each industry by the industry’s corresponding
total output. That is, aij = zij / Xj, where zij is a value of good/service i
purchased for the production in industry j, and Xj is the total output
of industry j. Thus, the coefficients represent the direct requirement of
inputs for producing just one unit of output of industry j.
6. The exporting firm is considered to be a price taker that cannot
impose higher prices and will have to compete on the global market at
international prices. Incidentally, this result explains why small firms do
not export as much as large firms in the more realistic situation where
some of the trade costs are not ad valorem fees but are sunk costs.
7. This tactic may be used to gain a contract, but it is not sustainable
in the long term if the firm wishes to retain skilled staff or invest and
expand its production capacity.
8. The negative impact of high extended effective protection rates on
second-tier domestic suppliers and the perspective of GVC upgrad-
ing in developing countries derives from the fact that tariff and
transportation costs influence the domestic price of all inputs, includ-
ing domestically produced ones (goods, but also services).
9. The last year for which Trade in Value-Added database data were
available is 2011, and 2006 is the first one where preferential tariffs
were available for all trade partners on a comparable basis.
10. Even when the extended effective protection rate is negative, as in
the mining sector, trade frictions still reduce the competitiveness of
domestic firms when they compete on the global market at interna-
tional prices while still paying domestic prices for their inputs.
11. The nontariff trade costs from Duval, Saggu, and Utoktham (2015)
include factors other than freight and insurance costs.
12. The paper is also of interest since it surveys the state of the art and
brings together the results of alternative decompositions. The pre-
sentation of these decomposition techniques, which rely on the inter-
national input- output matrix and its mathematical properties, would
require complex calculus. For example, the decomposition of the
number of transactions along the downstream value chain in Muradov
(2016b) results in as much as twelve indicators (see annex 4.2 for an
introduction).
13. In practice, the lead firm may have strategic objectives in international
outsourcing that go beyond pure cost-efficiency, but this chapter
focuses only on value added and production costs.
14. Intuitively, the existence of an inflection point can be explained as fol-
lows: when trade costs are very high, accumulated cost is 0 because
no trade takes place; when trade is frictionless, accumulated trade
costs are also 0 because there are no trade costs. So, between these
two extreme positions, accumulated trade costs should increase with
the length of the GVC up to a maximum, then decrease afterward.
15. The authors use transaction-level export and import data from 2007
to 2011 that cover all commodity exports and imports in Thailand.
16. Input coefficients aij are calculated by dividing input values of goods
and services used in each industry by the industry’s corresponding
total output. That is, aij = zij / Xj, where zij is a value of good/service i
purchased for the production in industry j, and Xj is the total output
of industry j. Thus, the coefficients represent the direct requirement of
inputs for producing just one unit of output of industry j.
17. This is true for the industry average, represented in an input- output
matrix. This average is prone to aggregation bias, and export-ori-
ented industries may be much more reliant on imported inputs than
the average domestic firm. This can be observed in the Trade in
Value- Added database, which distinguishes several types of firms in
China and Mexico.
18. For each domestic industrial sector, an average distance to interna-
tional supplier is calculated, weighting the distance to the suppli-
er’s country by its share in the total inputs imported by the domes-
tic industry. From a purely international trade perspective, domestic
interindustry commerce should be set to 0 (the distance between two
domestic firms is nil), but this is an oversimplification for some devel-
oping countries, where most people live in coastal areas and inland
transportation is more expensive than international freight.
116 • Measuring and Analyzing the Impact of GVCs on Economic Development
References
Alfaro, L., and M. Chen. 2017. “Transportation Cost and the Geography of
Foreign Investment.” In Handbook of International Trade and Transpor-
tation, edited by B. Blonigen and W. Wilson. Cheltenham, U.K.: Edward
Elgar Publishing.
Anderson, J., and E. van Wincoop. 2004. “Trade Costs.” National Bureau
of Economic Research (NBER) Working Paper No. 10480, NBER, Cam-
bridge, MA.
Balassa, B. 1965. “Tariff Protection in Industrial Countries: An Evaluation.”
Journal of Political Economy 73 (6): 573–94.
Baldwin, R., and A. Venables. 2010. “Spiders and Snakes: Offshoring and
Agglomeration in the Global Economy.” NBER Working Paper No.
16611, NBER, Cambridge, MA.
Baldwin, R., and D. Taglioni. 2011. “Gravity Chains: Estimating Bilateral
Trade Flows When Parts and Components Trade is Important.” NBER
Working Paper No. 16672, NBER, Cambridge, MA.
Borgatti, S. 2005. “Centrality and Network Flow.” Social Networks 27 (1):
55–71.
Ciuriak, D., and J. Xiao. 2014. Should Canada Unilaterally Adopt Global
Free Trade? Ottawa: Canadian Council of Chief Executives.
Corden, W. M. 1966. “The Structure of a Tariff System and the Effective
Protection Rate.” Journal of Political Economy 74 (3): 221–37.
Diakantoni, A., H. Escaith, M. Roberts, and T. Verbeet. 2017. “Accumulat-
ing Trade Costs and Competitiveness in Global Value Chains.” World
Trade Organization (WTO) Working Paper Economic Research and Sta-
tistics Division (ERSD) 2017–2, WTO, Geneva.
Dietzenbacher, E., and I. Romero. 2007. “Production Chains in an Inter-
regional Framework: Identification by Means of Average Propagation
Lengths.” International Regional Science Review 30 (4): 362–83.
Djankov, S., C. Freund, and C-S. Pham. 2010. “Trading on Time.” The
Review of Economics and Statistics 92 (1): 166–73.
Duval, Y., A. Saggu, and C. Utoktham. 2015. “Value Added Trade Costs in
Goods and Services.” United Nations Economic and Social Commission
for Asia and the Pacific (ESCAP) Trade and Investment Working Paper
01, ESCAP, Bangkok.
Escaith, H., and S. Miroudot. 2015. “World Trade and Income Remain
Exposed to Gravity.” In The Global Trade Slowdown: A New Normal?,
edited by B. Hoekman, 127–60. London: Centre for Economic Policy
Research.
Ferrantino, M. 2012. “Using Supply Chain Analysis to Examine the Costs
of Non-Tariff Measures (NTMs) and the Benefits of Trade Facilitation.”
WTO Working Paper ERSD-2012–02, WTO, Geneva.
G20 TIWG (Trade and Investment Working Group). 2016. “Discussion
Paper on Monitoring and Reducing Trade Costs.” Second Meeting of
the Trade and Investment Working Group, Nanjing, China, April 4–5.
Ghodsi, M., and R. Stehrer. 2016. “Non-Tariff Measures Trickling through
Global Value Chains.” Productivity, Non-Tarrif Measures and Openness
(PRONTO) Working Paper, Vienna Institute for International Economic
Studies, Vienna.
Grossman, G., and E. Helpman. 2002. “Integration versus Outsourcing in
Industry Equilibrium.” Quarterly Journal of Economics 117 (1): 85–120.
———. 2003. “Outsourcing versus FDI in Industry Equilibrium.” Journal of
the European Economic Association 1 (2–3): 317–27.
———. 2005. “Outsourcing in a Global Economy.” Review of Economic
Studies 72 (1): 135–59.
Hayakawa, K., N. Laksanapanyakul, and T. Yoshimi. 2016. “Effect of Import
Time on Export Pattern.” Institute of Developing Economies (IDE) Dis-
cussion Paper No. 566, IDE–Japan External Trade Organization, Chiba,
Japan.
Head, K., and J. Ries. 2008. “FDI as an Outcome of the Market for Corpo-
rate Control.” Journal of International Economics 74 (1): 2–20.
Head, K., and T. Mayer. 2013. “What Separates Us? Sources of Resistance
to Globalization.” Canadian Journal of Economics 46 (4): 1196–1231.
Hummels, D. 2007. “Transportation Costs and International Trade in the
Second Era of Globalization.” Journal of Economic Perspectives 21 (3):
131–54.
Hummels, D., and G. Schaur. 2012. “Time as a Trade Barrier.” NBER Work-
ing Paper No. 17758, NBER, Cambridge, MA.
Ing, L.-Y., O. Cadot, and J. Walz. 2016. “Transparency in Non-Tariff Mea-
sures: An International Comparison.” Fondation pour les Études et
Recherches sur le Développement International (FERDI) Working Paper
182, FERDI, Clermont-Ferrand, France.
Inomata, S. 2008. “A New Measurement for International Fragmentation
of the Production Process.” IDE Paper 175, IDE–JETRO, Chiba, Japan.
Johnson, R. 2014. “Five Facts about Value-Added Exports and Implications
for Macroeconomics and Trade Research.” Journal of Economic Per-
spectives 28 (2): 119–42.
Johnson, R., and G. Noguera. 2016. “A Portrait of Trade in Value Added
over Four Decades.” NBER Working Paper No. 22974, NBER, Cam-
bridge, MA.
Keller, W., and S. R. Yeaple. 2013. “The Gravity of Knowledge.” American
Economic Review 103 (4): 1414–44.
Koopman, R., W. Powers, Z. Wang, and S-J. Wei. 2010. “Give Credit Where
Credit Is Due: Tracing Value Added in Global Production Chains.” NBER
Working Paper No. 16426, NBER, Cambridge, MA.
Koopman, R., Z. Wang, and S-J. Wei. 2014. “Tracing Value-Added and
Double Counting in Gross Exports.” American Economic Review 104
(2): 459–94.
Lewis, D. 1994. “Freight Mode Choice: Air Transport Versus Ocean Trans-
port in the 1990’s’ Flight.” Cambridge, MA: Transportation Laboratory,
Massachusetts Institute of Technology.
Los, B., and U. Temurshoev. 2012. “Distance-Based Measures of Global-
ization in a World with Fragmented Production.” Presentation at the
World Input-Output Database (WIOD) Conference on Causes and Con-
sequences of Globalization, Groningen, Netherlands, April 24–26.
Ma, A. C., and Ari Van Assche. 2010. “The Role of Trade Costs in Global
Production Networks Evidence from China’s Processing Trade Regime.”
World Bank Working Paper 5490, World Bank, Washington, DC.
Mayer, T., and S. Zignago. 2011. “Notes on CEPII’s Distances Measures:
The GeoDist Database.” Centre d’Études Prospectives et d’Informa-
tions Internationales (CEPII) Working Paper 2011–25, CEPII, Paris.
Miroudot, S., and H. Nordström. 2015. “Made in the World.” European
University Institute (EUI) Robert Schuman Centre for Advanced Studies
Working Paper 2015/60, EUI, Florence.
Muradov, K. 2016a. “Trade Costs and Borders in the World of Global Value
Chains.” Nineteenth Annual Conference of Global Economic Analysis,
Washington, DC, June 15–16.
Accumulated trade costs and their impact on domestic and international value chains • 117
———. 2016b. “Structure and Length of Value Chains.” Draft paper sub-
mitted to the workshop on Regional/Multi-Regional Input-Output Anal-
ysis, Osnabrück, Germany.
Noguera, G. 2012. “Trade Costs and Gravity for Gross and Value Added
Trade.” Job Market Paper, University of California, Berkeley and Colum-
bia University, Berkeley, CA. and New York, NY.
OECD (Organisation for Economic Co-operation and Development) and
WTO (World Trade Organization). n.d. Trade in Value-Added (TiVA)
database. Paris: OECD. Available at: http://www.oecd.org/sti/ind
/measuringtradeinvalue-addedanoecd-wtojointinitiative.htm.
Oldenski, L. 2012. “Export Versus FDI and the Communication of Complex
Information.” Journal of International Economics 87 (2): 312–22.
Rouzet, D., and S. Miroudot. 2013. “The Cumulative Impact of Trade Bar-
riers Along the Value Chain: An Empirical Assessment Using the OECD
Inter-Country Input-Output Model.” Paper prepared for the 16th Annual
Conference on Global Economic Analysis, Shanghai, June 12–14.
Samuelson, P. 1954. “The Transfer Problem and the Transport Costs.” The
Economic Journal 64 (254): 264–89.
Tamamura, C. 2010. “Cost Reduction Effects of ‘Pseudo FTAs’ in Asia:
Application of a Price Model Based on a Multilateral I/O table.” IDE
Discussion Paper No. 226, IDE–JETRO, Chiba, Japan.
Timmer, M., B. Los, G. de Vries, and R. Stehrer. 2016. An Anatomy of the
Global Trade Slowdown based on the WIOD 2016 Release. Groningen
Growth and Development Centre Research Memorandum 162. Gronin-
gen, Netherlands: University of Groningen.
Wang, Z., S.-J. Wei, X. Yu, and K. Zhu. 2016. “Characterizing Global Value
Chains.” Working Paper 578, Stanford Center for International Devel-
opment, Stanford, CA.
World Bank. 2016. Connecting to Compete 2016: The Logistics Perfor-
mance Index and Its Indicators. Washington, DC: World Bank.
WTO (World Trade Organization). 2015. World Trade Report
2015 — Speeding up trade: benefits and challenges of implementing
the WTO Trade Facilitation Agreement. Geneva: WTO.
Yi, K.-M. 2003. “Can Vertical Specialization Explain the Growth in World
Trade?” Journal of Political Economy 111 (1): 52–102.
Yu, X., R. Wang, J. Yang, and Z. Wang. 2016. “Policy Options on Interme-
diate Goods Trade under the Era of Global Value Chains.” University of
International Business and Economics, Beijing.