Embed Size (px)
Citation preview
This article was downloaded by: [University of Chicago Library]On: 07 October 2014, At: 16:55Publisher: RoutledgeInforma Ltd Registered in England and Wales Registered Number: 1072954Registered office: Mortimer House, 37-41 Mortimer Street, London W1T 3JH,UK
The Journal of GeneralPsychologyPublication details, including instructions forauthors and subscription information:http://www.tandfonline.com/loi/vgen20
Accuracy of Effect SizeEstimates From PublishedPsychological ExperimentsInvolving Multiple TrialsAndrew Brand a , M. T. Bradley b , Lisa A. Best b &George Stoica ba King's College Londonb University of New BrunswickPublished online: 10 Oct 2011.
To cite this article: Andrew Brand , M. T. Bradley , Lisa A. Best & George Stoica(2011) Accuracy of Effect Size Estimates From Published Psychological ExperimentsInvolving Multiple Trials, The Journal of General Psychology, 138:4, 281-291, DOI:10.1080/00221309.2011.604365
To link to this article: http://dx.doi.org/10.1080/00221309.2011.604365
PLEASE SCROLL DOWN FOR ARTICLE
Taylor & Francis makes every effort to ensure the accuracy of all theinformation (the “Content”) contained in the publications on our platform.However, Taylor & Francis, our agents, and our licensors make norepresentations or warranties whatsoever as to the accuracy, completeness,or suitability for any purpose of the Content. Any opinions and viewsexpressed in this publication are the opinions and views of the authors, andare not the views of or endorsed by Taylor & Francis. The accuracy of theContent should not be relied upon and should be independently verified withprimary sources of information. Taylor and Francis shall not be liable for anylosses, actions, claims, proceedings, demands, costs, expenses, damages,
and other liabilities whatsoever or howsoever caused arising directly orindirectly in connection with, in relation to or arising out of the use of theContent.
This article may be used for research, teaching, and private study purposes.Any substantial or systematic reproduction, redistribution, reselling, loan,sub-licensing, systematic supply, or distribution in any form to anyone isexpressly forbidden. Terms & Conditions of access and use can be found athttp://www.tandfonline.com/page/terms-and-conditions
Dow
nloa
ded
by [
Uni
vers
ity o
f C
hica
go L
ibra
ry]
at 1
6:55
07
Oct
ober
201
4
The Journal of General Psychology, 2011, 138(4), 281–291Copyright C© 2011 Taylor & Francis Group, LLC
Accuracy of Effect Size Estimates FromPublished Psychological Experiments
Involving Multiple Trials
ANDREW BRANDKing’s College London
M. T. BRADLEYLISA A. BEST
GEORGE STOICAUniversity of New Brunswick
ABSTRACT. The reporting of exaggerated effect size estimates may occur either throughresearchers accepting statistically significant results when power is inadequate and/or fromrepeated measures approaches aggregating, averaging multiple items, or multiple trials.Monte-Carlo simulations with input of a small, medium, or large effect size were conductedon multiple items or trials that were either averaged or aggregated to create a singledependent measure. Alpha was set at the .05 level, and the trials were assessed over item ortrial correlations ranging from 0 to 1. Simulations showed a large increase in observed effectsize averages and the power to accept these estimates as statistically significant increasedover numbers of trials or items. Overestimation effects were mitigated as correlationsbetween trials increased but still remained substantial in some cases. The implications ofthese findings for meta-analyses and different research scenarios are discussed.
Keywords: Alpha levels, correlation, effect size, Monte Carlo, multiple assessments, power
THE ISSUE OF STATISTICAL POWER IS CENTRAL to the techniques ofinferential statistics but only tangentially relevant to the fundamentals of scientificmeasurement. To explain, publication, in part, depends upon the author makinga binary decision to either accept or reject an observed effect size on the basisof a specified alpha criterion. Typically, if the effect size could be explained aschance variation from the null hypothesis with a probability of greater than 5%,the observed result is often not of interest; but, if chance variation could be anexplanation less than 5% of the time, the result is a contender for publication.
Address correspondence to Andrew Brand, Institute of Psychology, King’s College,London, London 5E5 8AF, UK. [email protected] (e-mail).
281
Dow
nloa
ded
by [
Uni
vers
ity o
f C
hica
go L
ibra
ry]
at 1
6:55
07
Oct
ober
201
4
282 The Journal of General Psychology
The probability of meeting a set alpha criteria (i.e., p < .05) is dependent uponthe true effect size and the number of measures taken (i.e., number of participantssampled). This approach, null hypothesis significance testing (NHST), is a favoredprocedure in judging the value of empirical work in the social sciences.
NHST in psychological research has problems and has been heavily criticized(e.g., Gliner, Leech, & Morgan, 2002; Hubbard & Lindsay, 2008; Trafimow,2003; Trafimow & Rice, 2009). It is possible that some unpublished estimatesare accurate but not statistically significant, and some published estimates arestatistically significant but not accurate. Furthermore, the emphasis on NHST hasresulted in a literature focused on the attainment of significance rather than actualmeasured values. To mitigate this particular problem, Wilkinson and the APA TaskForce on Statistical Inference (1999) attempted to direct more of the focus towardmeasurement by the encouragement of effect size reporting.
Effect sizes are descriptive measures reflecting the degree of associationbetween two measures that show how much the dependant measure changesthrough manipulation of the independent variable. Cohen’s d (Cohen, 1962, 1988),a commonly reported effect size, is standardized and reflects the magnitude ofdifference between two independent group means in deviation units that are metricfree. Reporting of effect sizes allows for standardized comparisons to be madeacross the literature. It does not, however, solve a misestimate problem if an alphacriterion governs acceptance of estimates from underpowered studies. Thus, fortwo reasons, (1) the correction of misestimates, and (2) the potential value ofeffect size estimates as precise and universal, we believe the accuracy of effectsize estimates from studies should become of central concern.
The problems of inaccuracy arose through the predominant and longstandingbias to publish results that were statistically significant even when those studieswere underpowered (Sterling, 1959; Sterling, Rosenbaum, & Weinkam, 1995).The more recent tendency to include effect size estimates is laudatory, but withinadequate sample sizes (Cohen, 1962; Rossi, 1990; Sedlmeier & Gigerenzer,1989), the reported effect sizes or those calculated from published research tendto overestimate the true effect size (see, Brand, Bradley, Best, & Stocia, 2008;Kraemer, Gardner, Brooks, & Yesavage, 1998; Lane & Dunlap, 1978). This isthe case even with reporting confidence intervals. Estimates from underpoweredstudies cannot, by definition, be simultaneously statistically significant and ac-curate, and, therefore, unpublished studies may actually contain more accuratemeasures of effect size. Bradley and Stoica (2004) identified research topics witheither generally adequate or inadequate power. They graphed effect sizes (etas)on the x-axis and sample sizes on the y-axis to show either funnel graphs (Begg,1994) or negative correlations. Funnel graphs resulted if the power across studieswas adequate, and negative correlation scatterplots pertained if the studies hadreported results under conditions of inadequate power.
Even when adherence to NHST is retained, the magnitude of effect size mis-estimates can be reduced through attention to power. In principle, any of a variety
Dow
nloa
ded
by [
Uni
vers
ity o
f C
hica
go L
ibra
ry]
at 1
6:55
07
Oct
ober
201
4
Brand, Bradley, Best, & Stoica 283
of methods that increase the scaled numerical difference between two groups mea-sured in standard error (S.E.) units increases power. One approach is to increasethe number of measures taken, by either increasing the number of participants,or by using multiple measures on each single participant. Multiple measures on aparticipant could involve repeated assessments of the same measure, as is done inEvoked Response Potential (ERP) studies, or through multiple items presented asa test or inventory (Brand, Bradley, Best, & Stoica, 2011). Other approaches focuson the use of a matched group design, employed to reduce variability, or throughcareful attention to theory allowing the selection of a robust independent variablelikely to differentiate between groups. It is also worth mentioning that Bayesianapproaches can avoid issues by reporting exact probabilities even when thoseprobabilities are greater than .05. When all is said and done, however, increasingthe number of measures is very common.
Different methods of analysis do not give an equivalent reflection of thequantity to be measured when multiple assessments are involved; for example,the common practice of analyzing averages or aggregates of data from multipleassessments on the same individual can result in effect size estimates that aresubstantially different. The differences may depend less on the underlying effectsize and more on the number of assessments (Brand, Bradley, Best, & Stocia,2011). These effect size differences between the original single trial effect sizeestimate and estimates from multiple trials do not happen if trial data is analyzedas a within-subjects factor in a Mixed ANOVA (Bradley & Russell, 1998; Overall,1996). Thus, any distortion of published effect sizes with a Mixed ANOVA willbe limited to that which arises from the particular statistical significance criterionimposed (Brand et al., 2008); however, if multiple measures are averaged oraggregated, effect sizes are augmented. This augmentation may or may not beproblematic depending upon the theoretical concept underlying the study. Usinga Monte Carlo simulation, Brand and his colleagues (2011) showed through thecalculation of the difference between the initial effect size and final effect size thatmultiple assessments resulted in augmentations of sizes that reached 455% in 30trials. These magnitudes depend, in part, upon the intercorrelations amongst themeasures and diminish as those correlations increase.
For the average user of statistics the finding of a power increment over trialsmay be, potentially, somewhat surprising. The reason it may take researchers off-guard is that, averaged across participants, any given single trial has a StandardDeviation (SD) approximating the SD of any other trial. This, of course, conformsto the definition of a SD as a descriptive statistic. Averaging across trials for eachparticipant, however, involves averaging probabilistic approximations to the meanof the true distribution, which results in a compressed SD. In the same fashion,aggregation involves the maintenance of the same numerical SD value but now ina distribution of a greater range. As such, the aggregate SD is also proportionatelycompressed.
Dow
nloa
ded
by [
Uni
vers
ity o
f C
hica
go L
ibra
ry]
at 1
6:55
07
Oct
ober
201
4
284 The Journal of General Psychology
Brand and his colleagues conducted separate Monte Carlo simulations toexamine both the distortion effects of alpha criteria (Brand et al., 2008) andof multiple trials (Brand et al., 2011). The studies dealt with distortion effectsseparately, but the imposition of alpha level significance criteria on experimentswith multiple trials or items could interact and modify the reported results ofeffect size distortion. It is, for example, plausible that effect size distortion, dueto analyzing the averages (or aggregates) in a multiple trials experiment, mayovershadow the effect size distortion due to the statistical significant selectionbias. In all likelihood, the relationship is complex. The purpose of this paper is touse a Monte-Carlo approach to describe the interaction between power, multipletrials, inter-trial correlations, and significance levels upon the size and likelihoodof reported effect size measures.
Monte-Carlo Simulations
Simulations were conducted using the statistical package R (R DevelopmentCore Team, 2009). Simulations involved varying three factors: true effect size(e.g., d = 0.20, d = 0.50 and d = 0.80), the average correlation between trialdata (e.g., 0, 0.20, 0.50, 0.80 and 1), and the number of trials in an experiment(e.g., 1, 5, 10, 20 and 30). For each of the 75 different combinations of thefactors, 100,000 experiments were simulated. This resulted in a total of 7,500,000simulated experiments.
The simulations ran as follows. A control distribution with a standard normaldistribution of 1,000,000 values, a mean of 10, and a standard deviation of 2 wasgenerated for each trial in the experiment. The values from the control distributionswere then placed in a matrix in which a row in the matrix represented eachparticipant and a column represented each trial in an experiment. The cells inthe columns (i.e., data for a given trial) were then rearranged so that the averagecorrelation between columns (i.e., trial data) was obtained. To achieve this, allthe values in a column were placed in ascending order and then a given numberof values that were randomly rearranged. To create the experimental data, thisprocedure was repeated using different means to produce the different effect sizes(e.g. M = 10.40 when d = 0.20, M = 11.00 when d = 0.5 and M = 11.60 whend = 0.8).
A simulated experiment involved 76 participants. This number was basedon the results of survey of statistical power of psychological research (Rossi,1990) and is reasonably representative of sample sizes in a typical psychologyexperiment. To simulate an experiment, 38 rows from the control data matrixand 38 rows from the experimental data matrix were randomly selected, andthe aggregates (sum) and averages (mean) for these rows were calculated. Theobserved effect size from a simulated experiment was calculated, and a two-tailedbetween-subjects t-test was computed using both the aggregates and averages todetermine whether a statistically significant effect was obtained (i.e., p <.05).
Dow
nloa
ded
by [
Uni
vers
ity o
f C
hica
go L
ibra
ry]
at 1
6:55
07
Oct
ober
201
4
Brand, Bradley, Best, & Stoica 285
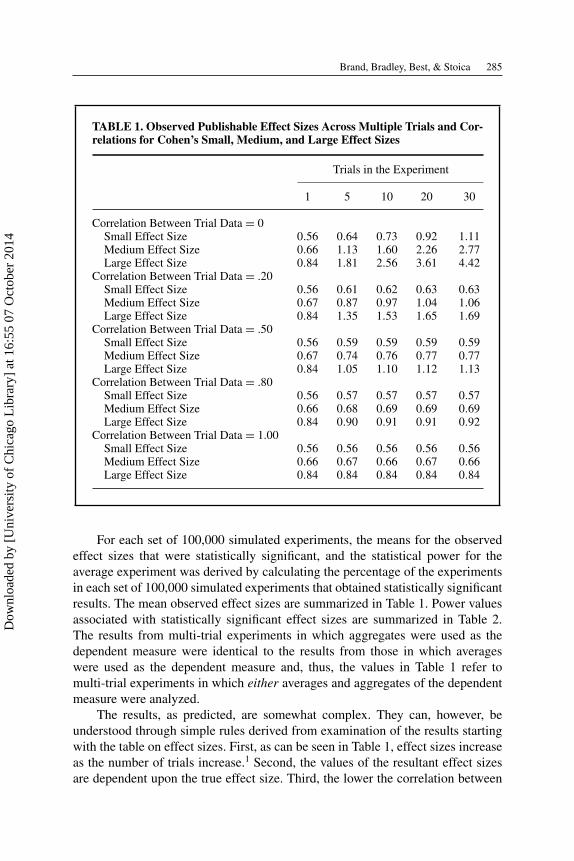
TABLE 1. Observed Publishable Effect Sizes Across Multiple Trials and Cor-relations for Cohen’s Small, Medium, and Large Effect Sizes
Trials in the Experiment
1 5 10 20 30
Correlation Between Trial Data = 0Small Effect Size 0.56 0.64 0.73 0.92 1.11Medium Effect Size 0.66 1.13 1.60 2.26 2.77Large Effect Size 0.84 1.81 2.56 3.61 4.42
Correlation Between Trial Data = .20Small Effect Size 0.56 0.61 0.62 0.63 0.63Medium Effect Size 0.67 0.87 0.97 1.04 1.06Large Effect Size 0.84 1.35 1.53 1.65 1.69
Correlation Between Trial Data = .50Small Effect Size 0.56 0.59 0.59 0.59 0.59Medium Effect Size 0.67 0.74 0.76 0.77 0.77Large Effect Size 0.84 1.05 1.10 1.12 1.13
Correlation Between Trial Data = .80Small Effect Size 0.56 0.57 0.57 0.57 0.57Medium Effect Size 0.66 0.68 0.69 0.69 0.69Large Effect Size 0.84 0.90 0.91 0.91 0.92
Correlation Between Trial Data = 1.00Small Effect Size 0.56 0.56 0.56 0.56 0.56Medium Effect Size 0.66 0.67 0.66 0.67 0.66Large Effect Size 0.84 0.84 0.84 0.84 0.84
For each set of 100,000 simulated experiments, the means for the observedeffect sizes that were statistically significant, and the statistical power for theaverage experiment was derived by calculating the percentage of the experimentsin each set of 100,000 simulated experiments that obtained statistically significantresults. The mean observed effect sizes are summarized in Table 1. Power valuesassociated with statistically significant effect sizes are summarized in Table 2.The results from multi-trial experiments in which aggregates were used as thedependent measure were identical to the results from those in which averageswere used as the dependent measure and, thus, the values in Table 1 refer tomulti-trial experiments in which either averages and aggregates of the dependentmeasure were analyzed.
The results, as predicted, are somewhat complex. They can, however, beunderstood through simple rules derived from examination of the results startingwith the table on effect sizes. First, as can be seen in Table 1, effect sizes increaseas the number of trials increase.1 Second, the values of the resultant effect sizesare dependent upon the true effect size. Third, the lower the correlation between
Dow
nloa
ded
by [
Uni
vers
ity o
f C
hica
go L
ibra
ry]
at 1
6:55
07
Oct
ober
201
4
286 The Journal of General Psychology
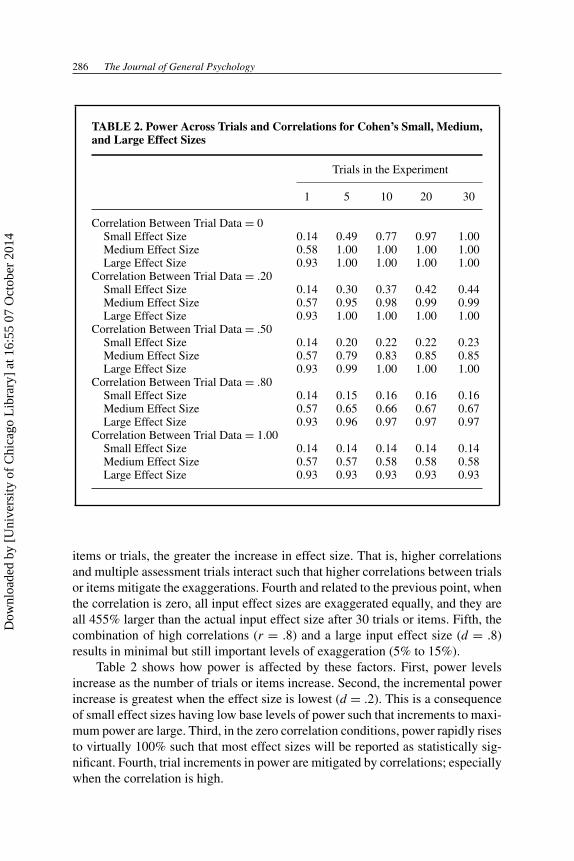
TABLE 2. Power Across Trials and Correlations for Cohen’s Small, Medium,and Large Effect Sizes
Trials in the Experiment
1 5 10 20 30
Correlation Between Trial Data = 0Small Effect Size 0.14 0.49 0.77 0.97 1.00Medium Effect Size 0.58 1.00 1.00 1.00 1.00Large Effect Size 0.93 1.00 1.00 1.00 1.00
Correlation Between Trial Data = .20Small Effect Size 0.14 0.30 0.37 0.42 0.44Medium Effect Size 0.57 0.95 0.98 0.99 0.99Large Effect Size 0.93 1.00 1.00 1.00 1.00
Correlation Between Trial Data = .50Small Effect Size 0.14 0.20 0.22 0.22 0.23Medium Effect Size 0.57 0.79 0.83 0.85 0.85Large Effect Size 0.93 0.99 1.00 1.00 1.00
Correlation Between Trial Data = .80Small Effect Size 0.14 0.15 0.16 0.16 0.16Medium Effect Size 0.57 0.65 0.66 0.67 0.67Large Effect Size 0.93 0.96 0.97 0.97 0.97
Correlation Between Trial Data = 1.00Small Effect Size 0.14 0.14 0.14 0.14 0.14Medium Effect Size 0.57 0.57 0.58 0.58 0.58Large Effect Size 0.93 0.93 0.93 0.93 0.93
items or trials, the greater the increase in effect size. That is, higher correlationsand multiple assessment trials interact such that higher correlations between trialsor items mitigate the exaggerations. Fourth and related to the previous point, whenthe correlation is zero, all input effect sizes are exaggerated equally, and they areall 455% larger than the actual input effect size after 30 trials or items. Fifth, thecombination of high correlations (r = .8) and a large input effect size (d = .8)results in minimal but still important levels of exaggeration (5% to 15%).
Table 2 shows how power is affected by these factors. First, power levelsincrease as the number of trials or items increase. Second, the incremental powerincrease is greatest when the effect size is lowest (d = .2). This is a consequenceof small effect sizes having low base levels of power such that increments to maxi-mum power are large. Third, in the zero correlation conditions, power rapidly risesto virtually 100% such that most effect sizes will be reported as statistically sig-nificant. Fourth, trial increments in power are mitigated by correlations; especiallywhen the correlation is high.
Dow
nloa
ded
by [
Uni
vers
ity o
f C
hica
go L
ibra
ry]
at 1
6:55
07
Oct
ober
201
4
Brand, Bradley, Best, & Stoica 287
Highlighting some examples from the table illustrates how changes in effectsize and power interact. When the correlation between the trials is zero, effectsize exaggerations are at the 455% level, and there is virtually a 100% chancethat the results will pass the significance test and have a chance of being reported.Mitigation effects with correlations are substantial even when the correlation issmall. For example, the combination of a small effect size with r = .2 results inalmost half the exaggeration (215%) and less than half the power (44%) after 30trials. At the other extreme, when the effect size is d = .8, the exaggerations rangefrom 5 to 15% with a change in power from 93 to 97% over 30 trials. Thus, theexaggerations are lower when the true effect size is high, but it may be importantand worth being aware that the exaggeration is still 15%.
The Monte-Carlo simulations replicated effect size findings with single trials(Brand et al., 2008) and multiple trials and items (Brand et al., 2011). Undertypical p < .05 rules for significance reporting, multiple trials generally increasethe probability of reporting exaggerated effect sizes. In the worst but improbablescenario, when the correlation between multiple trials or items is zero, statisticallysignificant outcomes grew from 190% exaggeration in a single trial to 455% with30 trials, regardless of whether the magnitude of the true effect sizes were small,medium, or large. The probability of obtaining statistical significance or powergrew differentially with the magnitude of true effect sizes. With a small trueeffect size, the probability of reporting an exaggeration grew steadily from 14%in a single assessment to 100% after 30 aggregated or averaged trials or items.Furthermore, when 30 trials or items with a small effect size were averaged oraggregated, the exaggeration was at 455%, and the probability of significancewas 100%. Even with as few as five trials or items, the exaggeration increasedto 220% and the probability of obtaining or reporting that exaggeration increasedover threefold with power at the 49% level. When the true effect size was mediumor large, power was at 100% after the averaging or aggregating of five trials oritems. Thus, all levels of trial or item exaggeration from 220% and up would besignificant and potentially published.
One goal of science is accurate measurement. Accurate measurement allowsfor precise description of the quantitative aspects of phenomena under considera-tion. The concept of achieving statistical significance with an a priori expectationof subsequent publication of the results fostered as an a priori goal may be acontradictory practice for the attainment of scientific accuracy. Depending uponpower, some studies cannot produce both statistical significance and accuratemeasurements because one precludes the other. If inaccurate measurements arepublished, the probability is that scientists attempting to understand phenomenawill fail to replicate the results if they also have inadequate power. Such a pro-cess fosters misunderstandings in various literatures. Our findings explain that itis possible for an exaggerated effect to be reported, become controversial, andeventually, as replications fail, be ignored or become controversial once more.
Dow
nloa
ded
by [
Uni
vers
ity o
f C
hica
go L
ibra
ry]
at 1
6:55
07
Oct
ober
201
4
288 The Journal of General Psychology
Inter-item or trial correlations mitigate exaggerations for both effect size andpower. For example, the effect size exaggeration of 220% associated with a smalltrue effect size (d = 0.20) over five uncorrelated (r = 0) trials/items is reducedto 205% when the correlation between the multiple assessments is r = .2 and theprobability of reporting that exaggeration decreases from 49% to 30%. When thecorrelation between items/trials is r = .5, the augmentation effects converge after5 trials to a distortion of 195%. This level of exaggeration is close to that expected,with significance reporting and the probability of reporting the augmented effectsize being 22%. When r = .8 and d = .8, the exaggeration is small, and theincrement of reporting is small. But the word small is only in terms of standardpractice in the social sciences; in the physical sciences or engineering, error inmeasurement in the 6 to 15% range would often be unacceptable.
It is worth noting that the distortions created by the aggregating/averagingdata over multiple trials will also affect the confidence intervals for the effectsize estimate. For instance, for our simulated data, when the correlation betweentrial data is 0, and there are 30 trials in the experiment, the mean effect sizefor the lower 95% confidence interval is 0.64 for a small true effect (d = 0.20).Therefore calculating and reporting confidence intervals for the effect size will notsubstantially lower the distortion created by aggregating data over multiple trials.
Although avoiding the .05 criterion problem, Bayesian inference, using theBayes factor (i.e., Dienes, 2011; Goodman, 1999; Rouder, Speckman, Sun, Morey,& Iverson, 2009) still remains susceptible to distortion through aggregation oraveraging data across multiple trials. When data are aggregated/averaged overmultiple trials and the correlation between trial data is low, the Bayes factor [P(HOgiven Data)/P(HA given Data)], like the p value, will exaggerate the strength ofevidence against the null hypothesis. For instance, for simulated data from Brandand colleagues (2011), the Bayes factor is 0.71, indicating weak initial evidenceagainst the null hypothesis when the experiment consisted of 1 trial and the trueeffect size was medium (d = 0.50). When the correlation between trial data was0.20, and there were 10 trials in the experiment, the Bayes factor was 0.004 fora medium true effect (d = 0.50). Hence, like the statistical inferences derivedfrom p values, the inferences derived from the Bayes factors, vary in relation tothe number of aggregated/averaged trials in the experiment and the correlationbetween trial data.
Exaggerations of effect sizes due to inadequate power associated with signifi-cance criterion are simply a source of inaccuracy. Beyond that, however, enhancedeffect sizes resulting from multiple assessments with correlations amongst thoseassessments may or may not produce results that are inaccurate or misleading. Forexample, Evoked Response Potentials (ERPs) are not visible in a single trial andare defined only after several trials, but once an appropriate number of trials havebeen reached, the phenomenon is well defined. Ideally, if equipment and technicalconcerns become standardized then the number of trials to represent an ERP maybecome part of the definition.
Dow
nloa
ded
by [
Uni
vers
ity o
f C
hica
go L
ibra
ry]
at 1
6:55
07
Oct
ober
201
4
Brand, Bradley, Best, & Stoica 289
An analogous situation exists with exams, personality inventories, attitudemeasures, etc., in which one question is not conceptually adequate to define theconcept of interest. In these areas, the dominant view from general psychologicaltesting books (i.e., Anastasi, 1988) is reasonable and indicates the concept is in themultiplicity of items and not in any single item. For example, given content validity,knowledge of a subject area is reflected in a number of test items successfullyanswered and not inherently in any single item. In fact, the results underline theimportance of current practice emphasizing intercorrelations among items defininga concept. If the concept is tightly defined and the item intercorrelations are highand uniformly so, the resultant effect size has a chance of approaching the trueunderlying effect size, and the result can be replicated. However, even when thecorrelations between test items are high and the concept tightly defined, if a 0.05level criteria is imposed and statistical power to detect the true effect is low forthe average/aggregated measure, misleading high effect size estimates will still bereported.
With the above discussion in mind, it is worth noting that statistical signifi-cance, numbers of trials or items, and the correlations amongst those trials or itemsinteract. For example, with no correlation among trials or items and a small effectsize, the degree of effect size distortion through statistical significance is initiallylarger than the distortion through averaging or aggregating of trials or items. After10 trials or items, however, the distortion through aggregating or averaging isgreater than that found through statistical significance. The same result occursafter five trials with a medium or large effect. When there is a high correlationamong trials or items and when the effect size is small or moderate, significanceis the major source of distortion. In contrast, when both the effect size and thecorrelation are large, the multiple trial and significance effects are within 1% ofeach other. The caution is that typically, correlations are likely to be between r =.2 and r = .8, and, although effect sizes vary, many researchers study phenomenawith small to moderate effect sizes. Thus, if statistical significance remains a cri-terion for publication, even when a concept is defined by multiple trials or items,the published result may be substantially distorted.
NOTE
1. Note that simple effects size measures based solely on the mean difference do notincrease as number of trials increase. Although the reporting of simple effect sizes hasbeen encouraged by Baguley (2009) researchers rarely report them. This is presumablybecause standardized effect sizes such as Cohen’s d are more commonly and widely usefor computing meta-analyses and power analyses.
AUTHOR NOTES
Andrew Brand is a software developer for the Department of Psychology at Kings Collegein London. He is also the creator of iPsychExpts (http://www.ipsychexpts.com), a Web sitethat encourages and promotes the use of web experiments for conducting psychological
Dow
nloa
ded
by [
Uni
vers
ity o
f C
hica
go L
ibra
ry]
at 1
6:55
07
Oct
ober
201
4
290 The Journal of General Psychology
research. Michael T. Bradley is a professor of psychology at the University of NewBrunswick. He has long been interested in statistical issues and has published papersexamining the detection of deception. Lisa A. Best is an associate professor of psychologyat the University of New Brunswick. Her primary research focuses on graphical perceptionand cognition and the history of data analytic techniques. George Stoica is the chair ofMathematical Sciences at the University of New Brunswick in Saint John. His researchcenters on mathematical finance, probability, and statistics.
REFERENCES
Anastasi, A. (1988). Psychological testing (6th ed.). New York, NY: Macmillan.Baguley, T. (2009). Standardized or simple effect size: What should be reported? British
Journal of Psychology, 100, 603–617.Begg, C. B. (1994) Publication bias. In H. Copper & L. V. Hedges (Eds.), The handbook of
research synthesis (pp. 400–409.). New York, NY: Russell Sage Found.Bradley, D. R. & Russell, R. L. (1998). Some cautions regarding statistical power in split-
plot designs. Behavior Research Methods, Instruments, & Computers, 30, 462–477.Bradley, M. T. & Stoica G. (2004) Diagnosing estimate distortion due to significance testing
in literature on detection of deception. Perceptual and Motor Skills, 98, 827–839.Brand, A., Bradley, M. T., Best L. A., & Stoica, G. (2008). Accuracy of effect size estimates
from published psychological research. Perceptual and Motor Skills, 106, 645–649.Brand, A., Bradley, M. T., Best L. A., & Stoica, G. (2011). Multiple trials may yield
exaggerated effect size estimates. Journal of General Psychology, 138, 1–11.Cohen, J. (1962). The statistical power of abnormal-social psychological research: A review.
Journal of Abnormal and Social Psychology, 69, 145–153.Cohen, J. (1988). Statistical Power Analysis for the Behaviors Sciences, 2nd edition.
Hillsdale, NJ: Erlbaum.Dienes, Z. (2011). Bayesian versus orthodox statistics: Which side are you on? Perspectives
on Psychological Science, 6(3), 274–290.Gliner, J. A., Leech, N. L., and Morgan, G. A. (2002). Problems with null hypothesis
significance testing (NHST): What do the textbooks say? The Journal of ExperimentalEducation, 71(1), 83–92.
Goodman, S.N. (1999). Toward evidence-based medical statistics. 2: The Bayes Factor.Annals of Internal Medicine, 130(12):1005.
Hubbard, R., & Lindsay, R. M. (2008). Why P values are not a useful measure of evidencein statistical significance testing. Theory & Psychology, 18, 69–88.
Kraemer, H. C., Gardner, C., Brooks, J. O., & Yesavage, J. A. (1998). Advantages of exclud-ing underpowered studies in meta-analysis: Inclusionist versus exclusionist viewpoints.Psychological Methods, 3, 23–31.
Lane, D. M, & Dunlap, W. P. (1978). Estimating effect size: Bias resulting from the sig-nificance criterion in editorial decisions. British Journal of Mathematical and StatisticalPsychology, 31, 107–112.
Overall, J. E. (1996). How many repeated measurements are useful? Journal of ClinicalPsychology, 52, 243–252.
Rouder, J. N., Speckman, P. L., Sun, D., Morey, R. D., & Iverson, G. (2009). Bayesiant tests for accepting and rejecting the null hypothesis. Psychonomic Bulletin Review,16(2), 225–237.
Rossi, J. S. (1990). Statistical power of psychological research: What have we gained in 20years? Journal of Consulting and Clinical Psychology, 58, 646–656.
Dow
nloa
ded
by [
Uni
vers
ity o
f C
hica
go L
ibra
ry]
at 1
6:55
07
Oct
ober
201
4
Brand, Bradley, Best, & Stoica 291
Sedlmeier, P., & Gigerenzer, G. (1989). Do studies of statistical power have an effect onthe power of studies? Psychological Bulletin, 105, 309–316.
Sterling, T. D. (1959). Publication power of studies? Psychological Bulletin, 105, 309–316.decisions and their possible effects on inferences drawn from tests of significance or viceversa. Journal of the American Statistical Association, 54, 30–34.
Sterling, T. D., Rosenbaum W. L., & Weinkam J. J. (1995). Publication decisions revisited:the effect of the outcome of statistical tests on the decision to publish and vice versa.American Statistician, 49, 108–112.
Trafimow, D. (2003). Hypothesis testing and theory evaluation at the boundaries: Surprisinginsights from Bayes’s theorem. Psychological Review, 110, 526–535.
Trafimow, D., & Rice, S. (2009). A test of the Null Hypothesis Significance TestingProcedure correlation argument. Journal of General Psychology, 136, 261–269.
Wilkinson, L., & APA Task Force on Statistical Inference. (1999). Statistical methods inpsychology journals: Guidelines and explanations. American Psychologist, 54, 594–604.
Original manuscript received May 20, 2011Final version accepted July 5, 2011
Dow
nloa
ded
by [
Uni
vers
ity o
f C
hica
go L
ibra
ry]
at 1
6:55
07
Oct
ober
201
4