Embed Size (px)
Citation preview
ADVANCED COMPOSITION EXPLORER (ACE)
LESSONS LEARNED AND FINAL REPORT
JULY 1998
Explorers Project, Code 410Flight Projects Directorate
NASA/Goddard Space Flight CenterGreenbelt, MD 20771
LESSONS LEARNED AND FINAL REPORT
This document provides lessons learned from the development of the ACE mission andis the final report for the execution phase of the mission. It is hoped that this documentwill serve as a useful reference for future GSFC missions, as well as a repository of keysummary data and information about ACE.
ACE Mission Mahager ACE Project Scientist
i
TABLE OF CONTENTS
Page1.0 INTRODUCTION AND SUMMARY OF FINDINGS.............................................. 1
1.1 Introduction ............................................................................................. 11.2 Summary of Findings .............................................................................. 1
1.2.1 Bottom Line Success................................................................ 11.2.2 Key Reasons for Success ........................................................ 2
2.0 OVERVIEW OF ACE MISSION .......................................................................... 42.1 Summary................................................................................................. 42.2 Project Organization and Responsibilities ............................................... 72.3 Objectives and Requirements ............................................................... 10
2.3.1 Program Characteristics ......................................................... 102.3.2 Programmatic Objectives........................................................ 102.3.3 Mission Objectives.................................................................. 102.3.4 Level 1 Science Requirements ............................................... 102.3.5 Minimum Mission Success Criteria ......................................... 12
2.4 Science Payload ................................................................................... 132.4.1 Mission Instruments................................................................ 132.4.2 Technology Developments ..................................................... 172.4.3 Secondary Payloads............................................................... 18
2.5 Spacecraft............................................................................................. 202.6 Ground System ..................................................................................... 22
3.0 BOTTOM LINE RESULTS ................................................................................ 243.1 On-Orbit Performance........................................................................... 243.2 Cost Performance ................................................................................. 24
3.2.1 Actual Cost vs. Planned ......................................................... 243.2.2 Comparison to Historical Experience...................................... 25
3.3 Schedule Performance.......................................................................... 263.3.1 Actual Schedule vs. Planned.................................................. 263.3.2 Actual Schedule vs. Historical Experience.............................. 27
4.0 UNIQUE AND INNOVATIVE ASPECTS OF ACE ............................................. 28
5.0 RISK AND RISK MITIGATION .......................................................................... 32
6.0 LESSONS LEARNED....................................................................................... 346.1 Key Reasons for Success ..................................................................... 346.2 Other Lessons Learned......................................................................... 34
6.2.1 Project Office Perspective ...................................................... 346.2.2 Payload Perspective............................................................... 356.2.3 Spacecraft Perspective........................................................... 386.2.4 Ground System Perspective ................................................... 39
ii
7.0 DISCUSSION OF MISSION ELEMENTS.......................................................... 427.1 Science Payload ................................................................................... 42
7.1.1 Cosmic Ray Isotope Spectrometer (CRIS).............................. 427.1.1.1 Description ............................................................... 427.1.1.2 Challenges and Solutions ........................................ 447.1.1.3 Complexity Rating .................................................... 44
7.1.2 Solar Isotope Spectrometer (SIS) ........................................... 507.1.2.1 Description ............................................................... 507.1.2.2 Challenges and Solutions ........................................ 507.1.2.3 Complexity Rating .................................................... 52
7.1.3 Ultra Low Energy Isotope Spectrometer (ULEIS) ................... 547.1.3.1 Description ............................................................... 547.1.3.2 Challenges and Solutions ........................................ 557.1.3.3 Complexity Rating .................................................... 56
7.1.4 Solar Energetic Particle Ionic Charge Analyzer (SEPICA)...... 597.1.4.1 Description ............................................................... 597.1.4.2 Challenges and Solutions ........................................ 637.1.4.3 Complexity Rating .................................................... 64
7.1.5 Solar Wind Ion Composition Spectrometer (SWICS) and Solar Wind Ion Mass Spectrometer (SWIMS)......................... 65
7.1.5.1 Description ............................................................... 657.1.5.2 Challenges and Solutions ........................................ 657.1.5.3 Complexity Rating .................................................... 66
7.1.6 Electron, Proton and Alpha Monitor (EPAM)........................... 68 7.1.6.1 Description ............................................................... 68
7.1.6.2 Challenges and Solutions ........................................ 697.1.6.3 Complexity Rating .................................................... 69
7.1.7 Solar Wind Electron, Proton and Alpha Monitor (SWEPAM) .. 737.1.7.1 Description ............................................................... 737.1.7.2 Challenges and Solutions ........................................ 737.1.7.3 Complexity Rating .................................................... 74
7.1.8 Magnetometer (MAG) ............................................................. 767.1.8.1 Description ............................................................... 767.1.8.2 Challenges and Solutions ........................................ 767.1.8.3 Complexity Rating .................................................... 77
7.2 Spacecraft............................................................................................. 797.2.1 Mechanical ............................................................................. 837.2.2 Thermal Control ...................................................................... 847.2.3 Command and Data Handling (C&DH) ................................... 857.2.4 RF Communications ............................................................... 907.2.5 Attitude Determination and Control (AD&C) .......................... 917.2.6 Propulsion............................................................................... 937.2.7 Power ..................................................................................... 967.2.8 Environmental Design Drivers ................................................ 997.2.9 Spacecraft Safing ................................................................. 100
7.3 Integration ........................................................................................... 101
iii
7.4 Ground System ................................................................................... 1047.4.1 Ground Elements.................................................................. 1047.4.2 Ground System Strategy ...................................................... 1047.4.3 Ground System Design and Implementation ........................ 1057.4.4 Benefits ................................................................................ 107
7.4.4.1 Cost Reductions..................................................... 1077.4.4.2 Training .................................................................. 1097.4.4.3 IGSE Interface ....................................................... 109
7.4.5 Common System Challenges and Lessons Learned............ 1097.4.6 Complexity Rating................................................................. 112
8.0 RESOURCES................................................................................................. 1128.1 Costs................................................................................................... 1128.2 Civil Service Work Force..................................................................... 112
Postscript.............................................................................................................. 113
Figures2.1-1 ACE Project Timeline ........................................................................... 52.1-2 ACE Transfer Trajectory and Mission Orbit.......................................... 62.2-1 ACE Project Organization .................................................................... 82.2-2 ACE Project Responsibilities................................................................ 92.5-1 ACE Observatory ............................................................................... 217.1.1-1 CRIS Instrument Cross Section ...................................................... 477.1.1-2 CRIS Instrument.............................................................................. 487.1.1-3 CRIS -- Top View of SOFT.............................................................. 487.1.1-4 CRIS Electronics Block Diagram..................................................... 497.1.2-1 Solar Isotope Spectrometer (SIS) Block Diagram ........................... 517.1.2-2 SIS Stack Detector.......................................................................... 527.1.2-3 SIS Mechanical Design ................................................................... 537.1.2-4 SIS Instrument ................................................................................ 537.1.3-1 ULEIS Interconnection Scheme ...................................................... 567.1.3-2 ULEIS Functional Block Diagram.................................................... 577.1.3-3 ULEIS Three Wedge Prototype Instrument..................................... 587.1.4-1 SEPICA Principles of Operations.................................................... 607.1.4-2 SEPICA Functional and Electrical Block Diagram........................... 617.1.4-3 SEPICA Front View......................................................................... 627.1.4-4 SEPICA Proportional Counter Assembly ........................................ 627.1.4-5 SEPICA Instrument Rear View........................................................ 627.1.5-1 SWICS Instrument .......................................................................... 667.1.5-2 SWIMS Instrument .......................................................................... 677.1.6-1 EPAM Instrument ............................................................................ 707.1.6-2 EPAM Schematic Outline of Detector Telescope
Configurations in the Two Separate Mechanical Mounts................. 717.1.6-3 Block Diagram of EPAM Electronics System .................................. 727.1.7-1 SWEPAM -- Mostly Front View ....................................................... 757.1.7-2 SWEPAM -- Side View.................................................................... 757.1.8-1 MAG Block Diagram........................................................................ 787.1.8-2 MAG -- Schematic of Standard Fluxgate Operation........................ 787.2-1 ACE Spacecraft Exploded View......................................................... 79
iv
7.2-2 ACE System Block Diagram............................................................... 807.2.3-1 C&DH Block Diagram...................................................................... 897.2.6-1 Propulsion Subsystem Schematic................................................... 947.2.6-2 Propulsion -- Location and Function of Thrusters ........................... 957.2.7-1 ACE Electrical Power System Functional Block Diagram................ 987.4-1 ACE Ground Systems Common Functionality.................................. 1057.4-2 ACE MOC and Interfaces With ASC and Other Support Systems... 1087.4-3 ACE ITOCC...................................................................................... 108
Tables2.4-1 ACE Science Objectives .................................................................... 142.4-2 Instrument Requirements for Each Measurement to Meet Minimum Success Criteria.................................................................. 152.5-1 Summary of Weight, Power, Data Rate and Field of View................. 213.2-1 ACE Cost and Civil Service Work Years ............................................ 243.2-2 Cost Comparison to Historical Experience......................................... 257.1-1 Performance Requirements for ACE Science Instruments ................ 437.1.1-1 Summary of CRIS Characteristics................................................... 457.1.1-2 CRIS Design Requirements ............................................................ 467.1.8-1 Summary of MAG Characteristics ................................................... 777.2-1 Technical Parameters of ACE Spacecraft.......................................... 817.2.3-1 Major Requirements of C&DH Subsystem ...................................... 877.2.3-2 C&DH Subsystem User Commands................................................ 877.2.3-3 C&DH Subsystem Telemetry Channels .......................................... 887.2.3-4 C&DH Telemetry Formats ............................................................... 887.2.5-1 Observatory Instantaneous Attitude Error Budget........................... 927.2.7-1 Power -- Weights and Dimensions.................................................. 988-1 ACE Costs, POP 98-1......................................................................... 1128-2 ACE Civil Service Work Years by Directorate ..................................... 112
1
1.0 INTRODUCTION AND SUMMARY OF FINDINGS
1.1 INTRODUCTION
This document is the final report for the Advanced Composition Explorer (ACE), whichwas successfully launched August 25, 1997. The purposes of the report are todocument the history and uniqueness of the ACE project; to objectively demonstratehow successfully ACE has met its objectives and the NASA expectations of faster,better, cheaper; and to document lessons learned from ACE that may aid future NASAprojects.
To assure objectivity, this report has been compiled by an individual not associated withthe ACE project. Questionnaires were used to elicit facts and opinions from severalkey individuals covering all project activities. There were iterations to assure clarity andcompleteness. The author then integrated and summarized the responses and othermaterials to prepare this report.
The following section 1.2 summarizes the key findings from this examination of ACE.Section 2.0 provides an overview of the ACE mission. Section 3.0 demonstrates thebottom line success ACE had in terms of on-orbit performance, cost, and schedule.Section 4.0 discusses unique and innovative aspects of ACE. Section 5.0 reviews therisks and ways they were mitigated. Section 6.0 examines the lessons learned fromthe ACE experience. Section 7.0 provides detailed discussions of the elements of theACE mission. Section 8.0 presents details of the ACE costs and Civil Service workforce.
1.2 SUMMARY OF FINDINGS
1.2.1 Bottom Line Success
The ACE project is a success. ACE is performing very well on orbit, the project wassignificantly underbudget, and launch was on schedule. Also, ACE did well incomparison to historical cost and schedule trends.
1. On-Orbit Performance
Thus far, ACE is performing satisfactorily on orbit and in a manner to achieve itssuccess criteria.
2. Cost Performance
ACE underran its budget by $34.3 million for a 24 percent savings. The project alsounderran its Civil Service work force budget by 25.2 work years for a 25 percentsavings.
ACE costs are less than historical expectations by $30.8 million or 22 percent. CivilService work years are 39 work years or 34 percent less than historical expectation.
3. Schedule Performance
2
ACE beat its not-to-exceed launch date by four months, and met its plannedlaunch date without deviation.
The ACE schedule duration from start to launch is consistent with historicalexperience and was not any faster.
1.2.2 Key Reasons for Success
While a large number of things contributed to the success of ACE, there was generalagreement among the various ACE personnel on the key reasons:
• People--good, dedicated, hardworking• Cooperation among all the groups--team effort• Good up-front planning• Adequate Phase B study effort• Adequate funding when needed• Good management
Elements of good ACE management which are worth emulating in the future include:
• Maintaining full and open communications in all directions• Being open, honest and frank in discussions with contractors or other
supporting groups• Giving appropriate credit to the doers of good work• Defining project/instrument descope options early in the program• Doing what needed to be done and not standing on ceremony• Sticking to design where “good is good enough” and not allow hardware
changes just for the sake of “improvement”• Placing heavy emphasis on maintaining schedule• Providing the ability to reallocate funds as needed• Always remembering who the customer is
Everything mentioned above was key to the success of the ACE project. However,some unique aspects of ACE that were critical are:
• ACE had a long well-funded Phase B. This allowed the resolution of problemareas that normally are worked out during Phase C/D.
• ACE used a Principal Investigator (PI) mode of developing and managing the
science payload. Considerable delegation of responsibility was given to the PIinstitution, and the PI was a full member of project management.
• ACE was the first major NASA mission to adopt a common ground system (i.e.,
the same core hardware and software) for the I&T ground system, missionoperations ground system and science data center ground system. Thisachieved significant savings.
• ACE had a fixed price and fixed launch date approach, similar to the very
successful approach for the X-Ray Timing Explorer (XTE) project. ACE

3
• management took the fixed price mandate very seriously, and the fixed priceconcept was used throughout all elements of the project. Schedule wasmaintained tightly, which provided a control of cost.
Given the success of both XTE and ACE, it appears that the GSFC Explorers ProjectOffice, in conjunction with Headquarters OSS, have constructed a more effective andefficient mode of project management. One that fits well with the NASA concept offaster, better, cheaper.
4
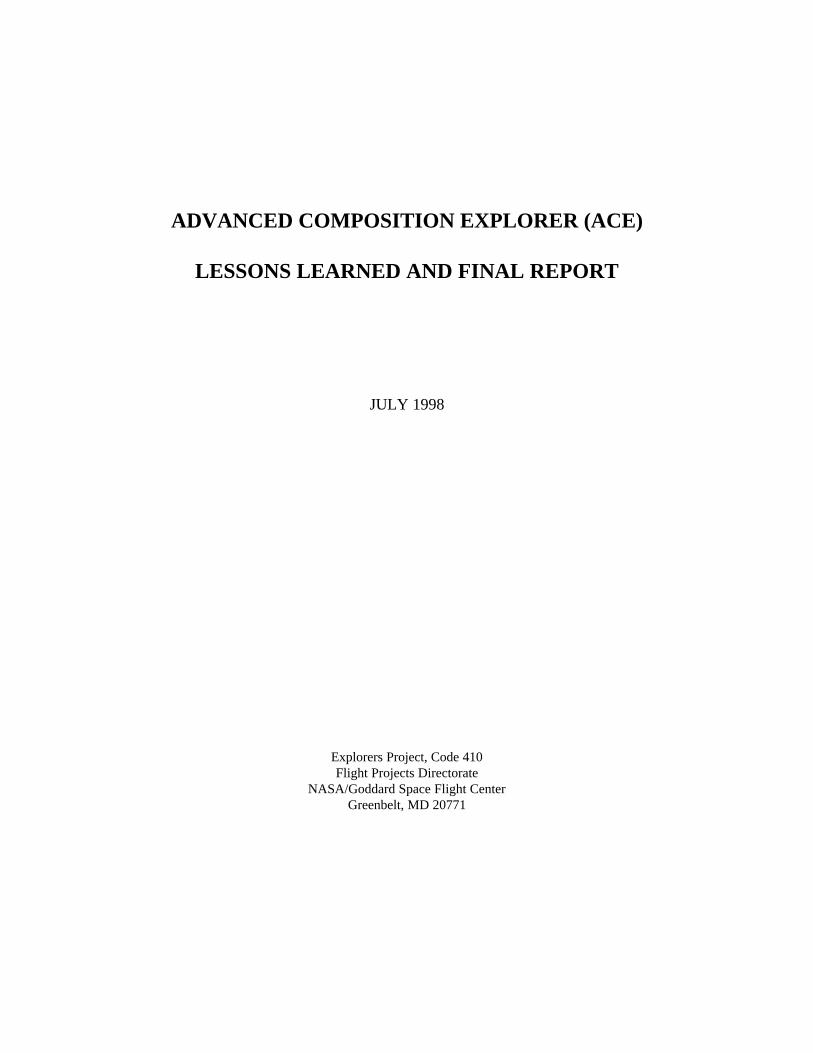
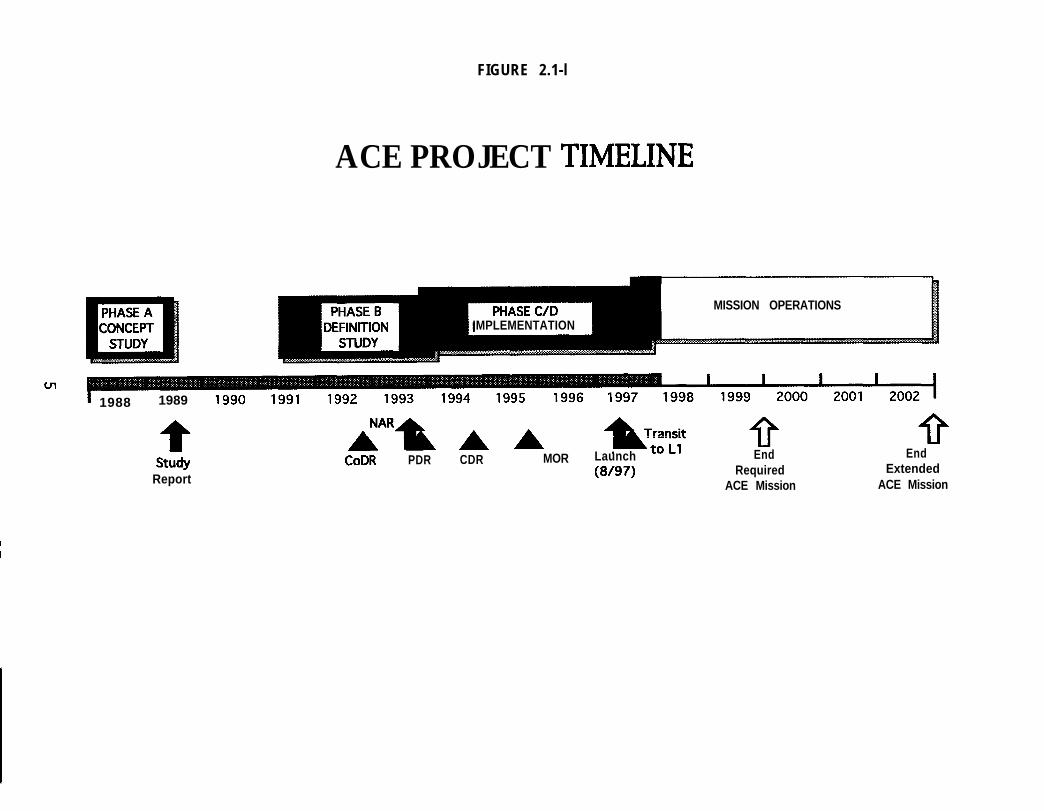
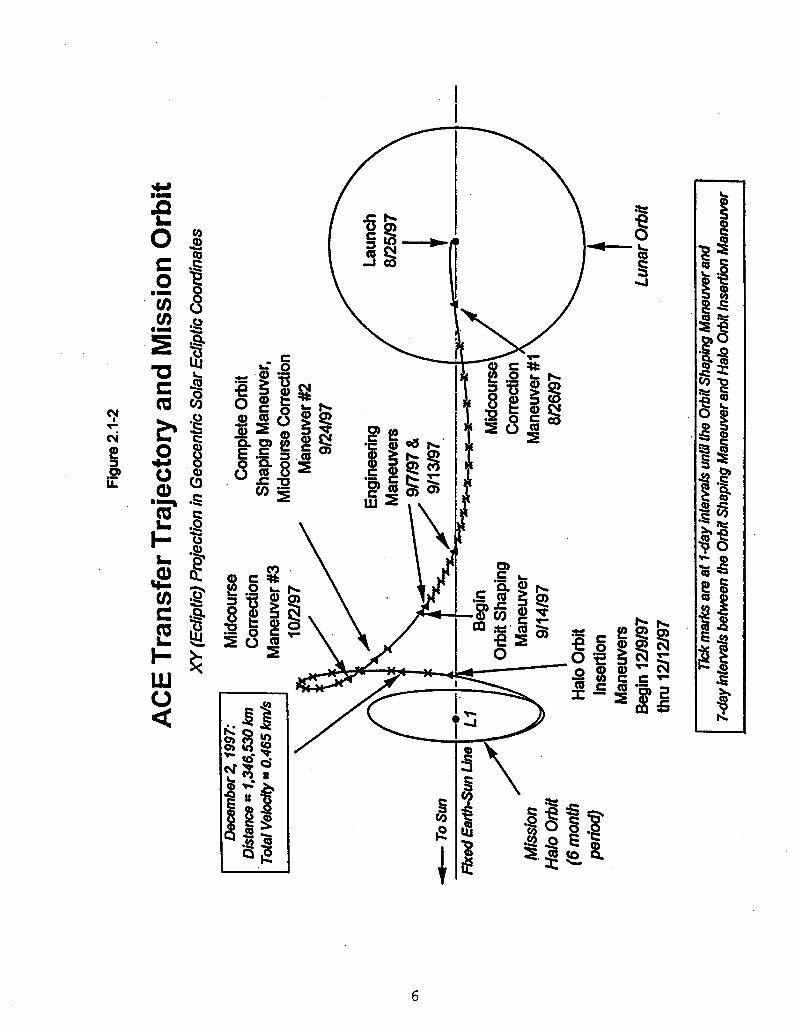
2.0 OVERVIEW OF ACE MISSION 2.1 SUMMARY The ACE is designed to study the origin and subsequent evolution of both solar systemand galactic material in investigations of fundamental questions in space physics. ACEis in orbit at the Earth-Sun L1 libration point to conduct in situ measurements ofparticles originating from the solar corona, the interplanetary medium, the localinterstellar medium and galactic matter. The ACE mission concept was proposed in response to a NASA Headquarters SpaceScience and Applications Notice, dated March 1986, requesting participation in theExplorer Concept Study Program. It was one of four missions selected for a Phase AConcept Study. The ACE Phase A study was conducted from early 1988 to mid-1989,ending with science objectives and a defined payload complement. ACE then entereda Phase B Definition Study in early 1991 for a thorough study of about three years.The Phase B study supported the NASA Non-Advocate Review (NAR) in September1993, which led to approval to proceed into the execution phase (Phase C/D) at thestart of Fiscal Year (FY) 1994 in October 1993. See Figure 2.1-1 for the ACE projecttimeline. The thoroughness of the Phase B effort allowed an overall and spacecraftPreliminary Design Review (PDR) to be held in the first month of the execution phase.Mission development was managed at Goddard Space Flight Center (GSFC) by theExplorers Project. Payload development was managed by the California Institute ofTechnology (CIT). The spacecraft was developed and integrated by the Johns HopkinsUniversity’s Applied Physics Laboratory (APL). The ground system was developed byGSFC and the ACE Science Center (ASC) by CIT. Following the integration of theinstruments and spacecraft, the observatory underwent vibration testing at APL. It wasthen taken to GSFC for the remainder of the environmental test program and then,after eight of the nine instruments were removed for rework or calibration, shipped tothe Kennedy Space Center for final integration, checkout and launch. On August 25, 1997 ACE was successfully launched from Cape Canaveral Air ForceStation on a Delta II 7920 expendable launch vehicle. Then four months of orbitmaneuvers took ACE to its mission halo orbit around the L1 libration point in the latterpart of December 1997. During this period all instruments were outgassed and thenturned on for checkout and calibration during the cruise to L1. It was during this period,on November 4 and 6, 1997, that two large energetic solar particle events occurred.Most of the ACE instruments were able to obtain data from these events and produceoutstanding scientific results. Figure 2.1-2 illustrates the transfer trajectory and missionorbit. ACE was declared operational February 1, 1998. During on-orbit operations thespacecraft propulsion maneuvers ACE to maintain communication with the Deep SpaceNetwork (DSN). In this configuration the nine scientific instruments measure theisotopic and elemental composition of the solar wind and energetic particles in theinterplanetary medium with a mission design lifetime of at least two years and anoperational goal of five years. Spacecraft control originates at the GSFC ACE MissionOperations Center (MOC), with commands and telemetry through the DSN. Dailystored data dumps and real-time data are collected by the DSN, transmitted to GSFC,and then delivered to the ASC at CIT. The ASC processes the data to higher levels,analyses and archives it, and distributes it to the Co-Investigators and the scientificcommunity. The ASC also places the data into the public domain.
I
1I
I
I
FIGURE 2.1-l
ACE PROJECT TIMELINE
MISSION OPERATIONS
IMPLEMENTATION
I 1988 1989
studyReport
L* A A *n$;;t QCoDR PDR CDR MOR Launch End
(W97) RequiredACE Mission
EndExtended
ACE Mission

7
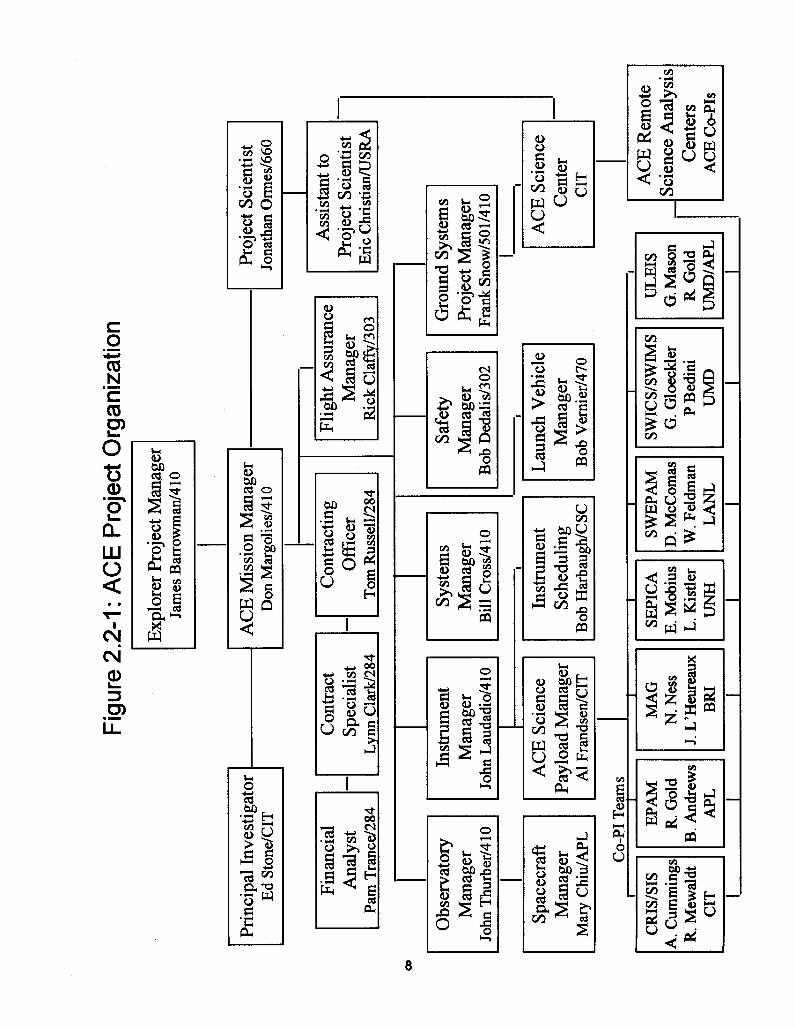
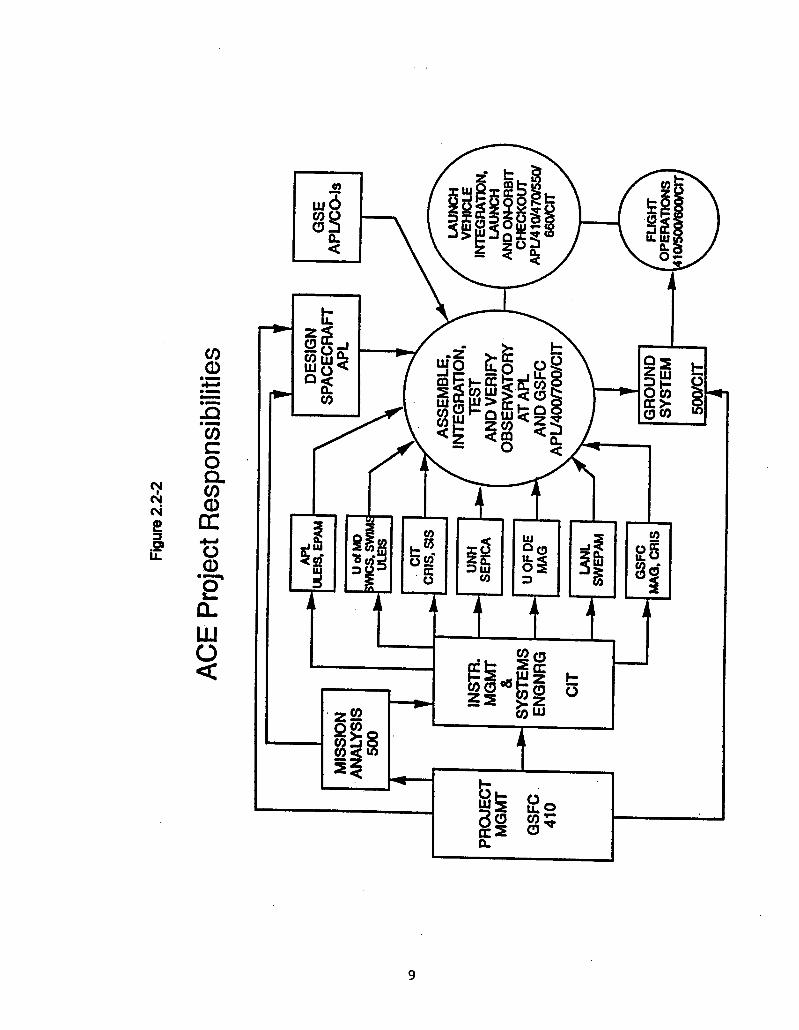
2.2 PROJECT ORGANIZATION AND RESPONSIBILITIES There were a number of organizational interfaces for ACE, although they wererelatively straightforward. Figure 2.2-1 shows the project organization and Figure 2.2-2illustrates the organizational responsibilities. The Project Office had overall responsibility for the mission. APL was responsible foroverall observatory systems engineering. The spacecraft (observatory lessinstruments) was designed and fabricated by APL. APL prepared the overall systemspecifications, integration and test plan, handling plan, and other overall system plans.Interface to the launch vehicle contractor was initially through the Orbiting LaunchServices Project at GSFC. Although this was the official route, direct communicationbetween APL engineers and Boeing engineers was encouraged and implemented.Direct communication between APL engineers and Instrument Development Teamswas also implemented to quickly resolve interface issues. The CIT Payload Management Office (PMO) initiated subcontracts with the Universityof Maryland for the Solar Wind Ion Composition Spectrometer (SWICS), the Solar WindIon Mass Spectrometer (SWIMS) and half of the Ultra Low Energy IsotopeSpectrometer (ULEIS); the University of New Hampshire for Solar Energetic ParticleIonic Charge Analyzer (SEPICA); the University of Delaware for the Magnetic FieldMonitor (MAG); and CIT for the Cosmic Ray Isotope Spectrometer (CRIS) and the SolarIsotope Spectrometer (SIS). GSFC implemented contracts with the Los AlamosNational Laboratory for the Solar Wind Electron, Proton and Alpha Monitor (SWEPAM)and with APL for the Electron, Proton and Alpha Monitor (EPAM) and half of ULEIS.Instrument development support was provided by JPL and by GSFC (testing, partsprocurement) when requested. Most of the observatory test program was conducted atGSFC. With nine science instruments and more than that number of organizations involved,every interface was treated uniquely. Yet all received their technical direction from theCIT Payload Management Office, from which the majority of documents governinginstrument development emanated. These included instrument design and testspecifications, the payload Performance Assurance Requirements (PAR), and manyother controlling documents. Funding was handled by subcontracts from CIT, exceptfor Co-I groups at U.S. government laboratories who, except for JPL, received theirmoney from the Goddard Project Office. JPL support was provided by way of internalCIT Work Orders. The interface between each ACE instrument and the spacecraft was carefully definedin interface control documents (ICDs). These documents represented the formalagreement between the instrument supplier, the ACE Project Office (GSFC) and APL,and permitted design efforts to proceed to the final development stage. Changes tothe documents required formal Change Board approval. In general, this system workedwell and no unusual interface problems were experienced. Ground system development for operations was done by GSFC, and both APL and theASC developed their own systems. The core of each system was the same, but uniquefeatures were added as appropriate. Significant systems interfaces between theseorganizations were required.
10
2.3 OBJECTIVES AND REQUIREMENTS 2.3.1 Program Characteristics The NASA Explorer Program is characterized by relatively low to moderate cost andsmall to medium sized satellites capable of being built, tested and launched in a shorttime compared to the large observatories. The Explorer missions are capable ofsupporting various scientific disciplines. ACE fits this mold very well and is part of theoverall Explorer Program administered by the Astrophysics Division of the Office ofSpace Science (OSS) at NASA Headquarters. 2.3.2 Programmatic Objectives The ACE mission development, covering the execution phase (Phase C/D), wasundertaken by GSFC and OSS on a not-to-exceed cost basis. They agreed that thetotal cost of ACE from start of Phase C/D through launch plus 30 days would notexceed $141.1 million (in real year dollars). In addition, GSFC agreed to launch ACEno later than December, 1997. As will be detailed later, the actual cost wasconsiderably less than the limit and the launch date was earlier than the objective. 2.3.3 Mission Objectives The prime objective of ACE is to determine and compare the elemental and isotopiccomposition of several distinct samples of matter, including the solar corona, theinterplanetary medium, the local interstellar medium, and galactic matter. This objectiveis to be achieved by performing comprehensive and coordinated determinations of theelemental and isotopic composition of energetic nuclei accelerated on the Sun, ininterplanetary space, and from galactic sources. These observations will span fivedecades in energy, from solar wind to galactic cosmic ray energies, and will cover theelement range from hydrogen to zirconium (Z=1 to 40). The comparison of thesesamples of matter will be used to study the origin and subsequent evolution of bothsolar system and galactic material by isolating the effects of fundamental processesthat include nucleosynthesis, charged and neutral-particle separation, bulk plasmaacceleration, and the acceleration of suprathermal and high-energy particles. Theseobservations will allow the investigation of a wide range of fundamental questions in thefollowing four major areas of the ACE Level 1 Science Requirements. 2.3.4 Level 1 Science Requirements 1. The Elemental and Isotopic Composition of Matter A major objective is the accurate and comprehensive determination of the elementaland isotopic composition of the various samples of “source material” from which nucleiare accelerated. ACE measurements will be used to:
• Generate a set of solar isotopic abundances based on direct sampling of solarmaterial.
• Determine the coronal elemental and isotopic composition with greatly improvedaccuracy.
11
• Establish the pattern of isotopic differences between galactic cosmic ray andsolar system matter.
• Measure the elemental and isotopic abundances of interstellar andinterplanetary “pick-up” ions (galactic neutrals ionized by solar ultravioletradiation or the solar wind).
• Determine the isotopic composition of the “anomalous cosmic ray component”,thought to represent a sample of the local interstellar medium.
2. Origin of the Elements and Subsequent Evolutionary Processing Isotopic “anomalies” in meteorites indicate that the solar system was not homogenouswhen formed, while other data suggest that the solar composition continues to evolve.Similarly, the galaxy is neither uniform in space nor constant in time due to continuousstellar nucleosynthesis. ACE measurements will be used to:
• Search for differences between the isotopic composition of solar and meteoriticmaterial.
• Determine the contributions of solar-wind and solar flare nuclei to lunar andmeteoritic material, and to planetary atmospheres and magnetospheres.
• Determine the dominant nucleosynthetic processes that contribute to comic raysource material.
• Determine whether cosmic rays are a sample of freshly synthesized material(e.g., from supernovae) or of the contemporary interstellar medium.
• Search for isotopic patterns in solar and galactic material as a test of galacticevolution models.
3. Formation of the Solar Corona and Acceleration of the Solar Wind Solar energetic particle, solar wind and spectroscopic observations show that theelemental composition of the corona is differentiated from that of the photosphere,although the processes by which this occurs, and by which the solar wind issubsequently accelerated, are poorly understood. The detailed composition andcharge-state data provided by ACE will be used to:
• Isolate the dominant coronal formation processes by comparing a broad rangeof coronal and photospheric abundances.
• Study plasma conditions at the source of solar wind and solar energeticparticles by measuring and comparing the charge states of these twopopulations.
• Study solar wind acceleration processes and any charge or mass-dependentfractionation in various types of solar wind flows.
4. Particle Acceleration and Transport in Nature Particle acceleration is ubiquitous in nature and is one of the fundamental problems ofspace plasma astrophysics. The unique data set obtained by ACE measurements willbe used to:
12
• Make direct measurements of charge and/or mass-dependent fractionationduring solar flare and interplanetary acceleration.
• Constrain solar flare and interplanetary acceleration models with charge, massand spectral data spanning up to five decades in energy.
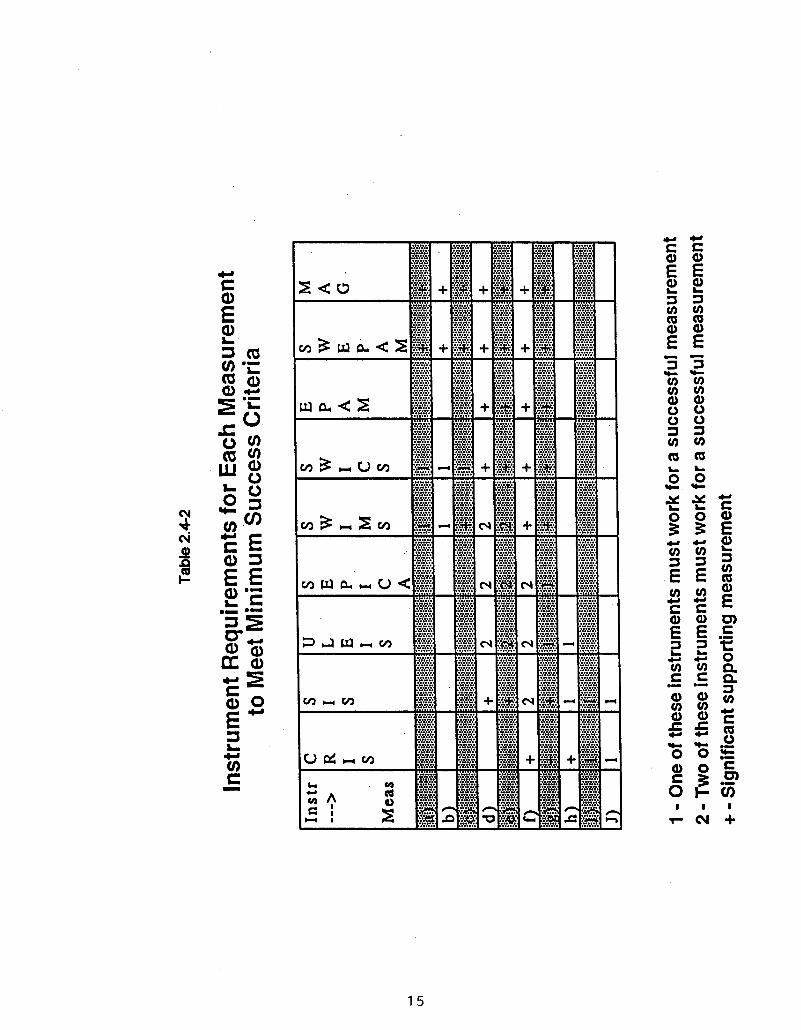
• Test theoretical models for 3He-rich flares and solar gamma ray events. 2.3.5 Minimum Mission Success Criteria There are ten measurements that constitute the ACE mission success criteria forscience. ACE will be declared successful if at least seven of the ten measurements areachieved. Since the mission officially started on February 1, 1998, it is not yet possibleto assess how well ACE will do these measurements. Several require at least a oneyear period of observation and some require two years. The criteria are: a. Composition of heavy nuclei in both the bulk solar wind and in several high
speed streams. b. Composition of coronal mass ejection events over a one year period. c. Solar wind pick-up ions over a one year period. d. Composition of heavy nuclei in co-rotating interaction region events over a
one year period. e. Composition of heavy nuclei in energetic storm particle events over a one
year period. f. Composition of heavy nuclei in ten solar particle events, including three large
events. g. Composition of heavy nuclei in small impulsive solar flares over a one year
period. h. Isotopic composition of anomalous cosmic rays. I. Abundances of radioactive clock isotopes in galactic cosmic rays. j. Isotopic composition of the "primary” galactic cosmic ray elements from carbon
to zinc.
13
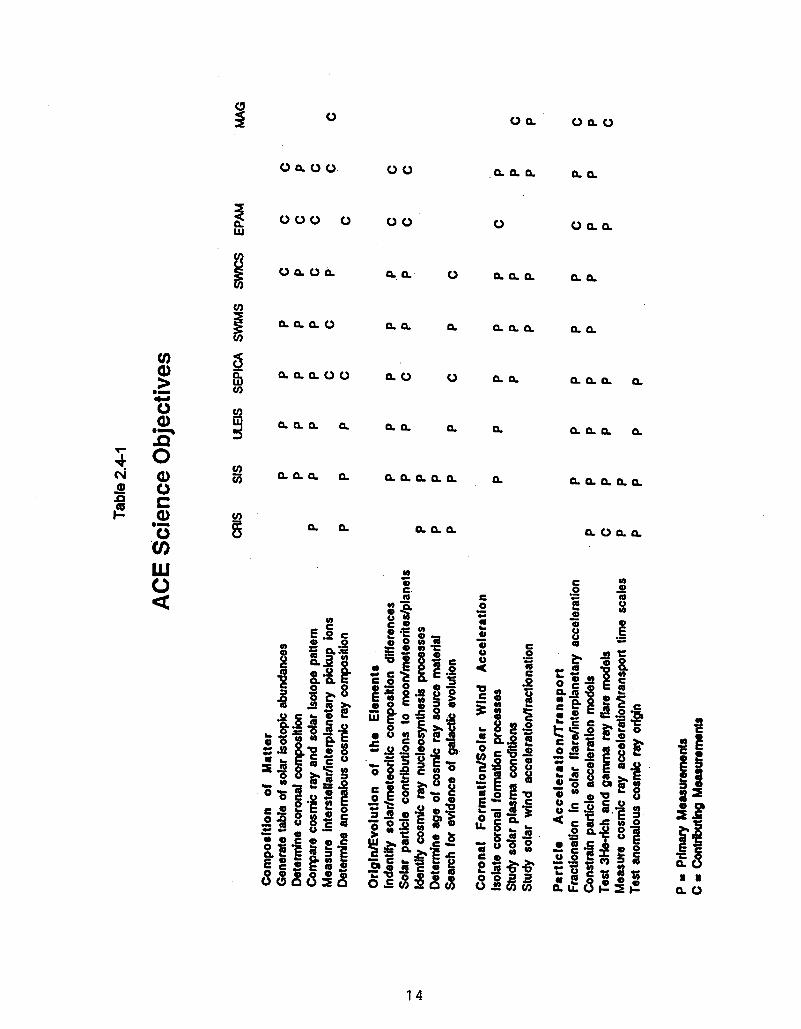
2.4 SCIENCE PAYLOAD There are nine scientific instruments on ACE to make the comprehensive andcoordinated in situ measurements to accomplish the scientific objectives. Theseinstruments are: High Resolution Spectrometers CRIS Cosmic Ray Isotope Spectrometer SIS Solar Isotope Spectrometer ULEIS Ultra Low Energy Isotope Spectrometer SEPICA Solar Energetic Particle Ionic Charge Analyzer SWICS Solar Wind Ion Composition Spectrometer SWIMS Solar Wind Ion Mass Spectrometer Monitoring Instruments EPAM Electron, Proton and Alpha Monitor SWEPAM Solar Wind Electron, Proton and Alpha Monitor MAG Magnetic Field Monitor Table 2.4-1 shows the relationship of the instruments to the scientific objectives(section 2.3.4), and Table 2.4-2 indicates the relationship of the instruments to theminimum success criteria (section 2.3.5). Section 2.4.1 briefly describes theinstruments (a detailed discussion of the ACE science payload is provided in section7.1). Section 2.4.2 discusses the technology developments in the nine missioninstruments. In addition to the nine mission instruments, there are two secondary payloads which areindependent of the ACE mission. They are noted below in section 2.4.3. 2.4.1 Mission Instruments 1. Cosmic Ray Isotope Spectrometer (CRIS) CRIS measures the elemental and isotopic composition of galactic cosmic rays over theenergy range from approximately 100 to 600 MeV/nucleon, with an element range fromhelium to zinc and with a collecting power more than 50 times greater than previousinstruments of its kind. It determines the nuclear charge, mass and kinetic energy ofincident cosmic rays. CRIS is a new instrument developed by CIT, GSFC, JPL andWashington University (St. Louis). 2. Solar Isotope Spectrometer (SIS) SIS measures the elemental and isotropic composition of energetic nuclei from heliumto zinc in the energy range of about 10 to 100 MeV/nucleon. The energy rangeincludes transient fluxes of energetic nuclei accelerated in large solar particle events,as well as anomalous cosmic rays and low-energy galactic cosmic rays. It computesthe nuclear charge, mass and kinetic energy of incident particle. The collecting powerof SIS is about 100 times greater than that of previous solar particle isotopespectrometers. SIS is a new instrument developed by CIT, GSFC and JPL.
16
3. Ultra Low Energy Isotope Spectrometer (ULEIS) ULEIS measures the mass and kinetic energy of nuclei from hydrogen to nickel fromabout 45 keV/nucleon to several MeV/nucleon. Studies of ultra-heavy particles, thoseheavier than iron, are also performed in a more limited energy range near 0.5MeV/nucleon. The energy range covered by ULEIS includes solar energetic particles,particles accelerated by interplanetary shocks and low-energy anomalous cosmic rays.ULEIS has a collecting power for solar flare isotopes more than 10 times greater thanany previous instrument. It provides more than 1,000 times improvement in detectionfor the study of co-rotating interaction region events, and is a significant advance in theresearch of anomalous cosmic ray isotopes. ULEIS is a new instrument developed bythe University of Maryland and JHU/APL. 4. Solar Energetic Particle Ionic Charge Analyzer (SEPICA) SEPICA measures the ionic charge state, elemental composition and energy spectra ofenergetic solar ions. Measurements of solar energetic particle charge states provideinformation on the temperature of the source plasma, as well as possible charge-to-mass dependent acceleration processes. SEPICA also measures anomalous cosmicray charge states. It covers a range from approximately 0.5 to 5 MeV/charge forcharge state composition, and up to 10 MeV/nucleon for element analysis. SEPICAachieves improvements of a factor of 3 in charge resolution and a factor of 20 incollecting power over previous instruments. SEPICA is a new instrument developed bythe University of New Hampshire and the Max Planck Institute for ExtraterrestrialPhysics, Germany. 5. Solar Wind Ion Composition Spectrometer (SWICS) SWICS determines the elemental and ionic charge state composition of all major solarwind ions from hydrogen to iron. It also measures the temperature and speeds ofthese ions, covering solar wind speeds ranging from 145 km/s (protons) to 1,532 km/s(iron). These data tell scientists not only about the nature of the solar wind, but also ofsolar flares, energetic storm particles, co-rotating interaction regions and pick-up ions.EPAM was built by the University of Maryland and the University of Bern, Switzerland,and is the same as an instrument fully developed and tested for the Ulysses mission. Aflight spare from that mission was used for ACE. 6. Solar Wind Ion Mass Spectrometer (SWIMS) SWIMS has excellent mass resolution (M/dM > 100) and measures solar windcomposition for all solar wind conditions. It determines, every few minutes, thequantities of most of the elements and a wide range of isotopes in the solar wind. Theabundances of rare isotopes are determined every few hours, providing informationcrucial to the understanding of pick-up ions and anomalous cosmic rays. SWIMS willextend knowledge of solar wind composition to a wide range of additional elements andisotopes. SWIMS measures speeds, depending on particle mass, ranging from about200 to 1,500 km/s for helium and from 200 to 500 km/s for iron. SWIMS was built bythe University of Maryland and the University of Bern, Switzerland. It is a copy ofportions of the CELIAS experiment from the SOHO mission, modified slightly tooptimize it for ACE.
17
7. Electron, Proton and Alpha Monitor (EPAM) EPAM characterizes the dynamic behavior of electrons and ions with energies about.03 to 5 MeV/nucleon that are accelerated by impulsive solar flares and byinterplanetary shocks associated with coronal mass ejections and co-rotatinginteraction regions. EPAM measures the composition of elements up through iron.EPAM was built by JHU/APL. It is the flight spare of the HI-SCALE instrument from theUlysses mission. 8. Solar Wind Electron, Proton and Alpha Monitor (SWEPAM) SWEPAM measures the solar wind plasma electron and ion fluxes as functions ofdirection and energy. These data provide detailed knowledge of the solar windconditions every minute. Electron and ion measurements are made with separatesensors. The ion sensor measures particle energies between about 0.26 to 35 KeV,and the electron sensor’s energy range is between 1 and 900 eV. SWEPAM was builtby the Los Alamos National Laboratory from the spare solar wind electron and ionanalyzers from the Ulysses mission, with selective modifications and improvements. 9. Magnetic Field Monitor (MAG) Precise examination of the interplanetary and solar magnetic fields and their dynamicsprovides essential supporting information for the other ACE instruments. MAG consistsof two magnetometers that detect and measure the magnetic fields in the vicinity of thespacecraft. MAG measures the strength and direction of the interplanetary magneticfield 30 times per second and can calculate any pattern of variations in it. MAG wasbuilt by the University of Delaware/Bartol Research Institute and GSFC, and is a flightspare from the WIND mission. 10. S3DPU As part of the payload accommodation to the ACE spacecraft, a data processor designwas adapted from the Solar and Heliospheric Observatory (SOHO), which then servedthree of the nine ACE instruments: SEPICA, SWIMS, and SWICS. This unit came tobe known as the S3DPU. The other six instruments had data processors or micro-controllers of their own, and interfaced directly with the spacecraft Command and DataHandling system. 2.4.2 Technology Developments Four large ACE science instruments involved new inventions intended to achieve agiant leap forward in collecting power over previous designs flown on earlier missions.One such invention, the Scintillating Optical Fiber Trajectory (SOFT) hodoscope at thefront end of the CRIS, involved adapting a successful technique heretofore used onstratospheric balloon flights, but never before in a spaceflight instrument. The large-area “stack detectors” at the back-end of CRIS, (which are needed for achieving thesought-after increase in collecting power), necessitated the development of customVLSI chips which were then hybridized to further conserve mass and volume.
18
Another new ACE instrument, SIS, involved the design and use of a different type ofcustom (analog) CMOS VLSI circuit to read out the electronic charge deposited bypenetrating energetic particles, and then preprocess these signals from theunprecedented number of strips in its front-end matrix detectors. At the back end ofSIS, read out of its stack detectors was achieved using the same type of hybridizedVLSI circuits developed for CRIS. The Lithium-drifted stack detectors used in CRIS,and the ion-implant stack detectors used in SIS, both overcame development problemswhich arose in part because of their unusually large collecting area. Another new instrument, ULEIS, needed a carefully engineered system design alongwith yet more custom VLSI in order to achieve the necessary time of flight accuracyallowing it to meet its requirement for unprecedented mass resolution between particlespecies. A fourth new instrument, SEPICA, required front end collimators that involved finemachining to especially tight boresight requirements. The implementation of theserequirements resulted in the development of new technology that is now beingcommercialized. It also necessitated designing an isobutane gas flow control systemoperating at near vacuum pressures, but which could be run and tested at oneatmosphere. Even one of the “design-to-print” instruments, SWIMS, turned out to be more difficultthan anticipated. This occurred when it was learned that its predecessor instrument onthe WIND mission was limited by the Helium background in space. An unplanneddevelopment effort ensued and significant redesign resulted before the modifiedSWIMS instrument was finished. Compared to SWIMS, the other four heritage instruments on ACE underwent relativelyminor internal upgrades, along with the significant interface changes needed to adaptthem to the ACE spacecraft. 2.4.3 Secondary Payloads ACE carries two payloads that are not necessary to accomplishing the project mission.Both were funded outside the ACE budget. 1. Real-Time Solar Wind (RTSW) Geomagnetic storms are a natural hazard that the National Oceanic and AtmosphericAdministration (NOAA) forecasts for the benefit of the public, as it does hurricanes andtornadoes. The location of ACE enables it to provide about one-hour advance warningof impending major geomagnetic activity. A subset of data is sent from SWEPAM, EPAM, MAG and SIS during the time that ACEis not transmitting its full telemetry. For about 21 of 24 hours per day, ACE broadcaststhe real-time solar wind data. The data are received by the ground stations around theworld and sent directly to NOAA. The ground system developed by NOAA receives thedata broadcast by ACE in real time. This system also includes the CommunicationsResearch Laboratory in Japan, the US Air Force Satellite Control Network, and NASAground stations. During the three hours per day that NASA ground stations are
19
receiving full ACE telemetry, NOAA receives a copy of the data. This gives NOAA 24hours per day forecasting capability. NOAA processes the data at its SpaceEnvironment Center in Boulder, Colorado, which issues alerts of any potentialgeomagnetic problems. This is the first real-time solar wind monitor ever flown. 2. Spacecraft Loads and Acoustics Measurement (SLAM) The SLAM instrumentation gathered payload launch environmental data only during thefirst five minutes of powered flight until the Delta fairing separated. SLAM was a GSFCin-house project within the Engineering Directorate. The SLAM system was amicroprocessor-based system designed to determine the structural accelerations andvibroacoustic levels encountered by the ACE spacecraft during those first five minutesof launch. SLAM was turned on approximately 30 seconds prior to launch, remainedactive through all launch events, and was turned off prior to spacecraft-launch vehicleseparation. SLAM read analog signals produced by transducers, digitized the signals,and passed them to an S-band FM transmitter for downlink. The output from thetransmitter was sent by RF coaxial cable to an omni antenna mounted to the launchvehicle fairing.
20
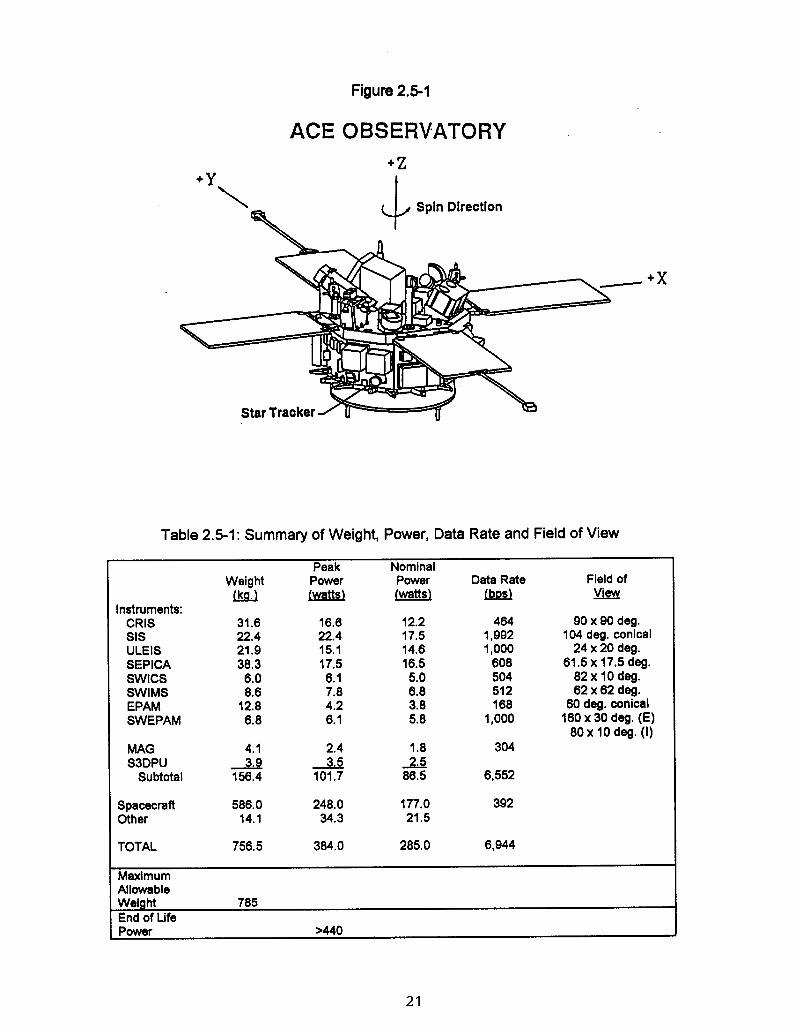
2.5 SPACECRAFT This section presents a summary description of the ACE spacecraft. Detail is providedlater in section 7.2. The ACE spacecraft consists of a two-deck irregular octagon, about 1.6 meters acrossand about 1 meter high. It spins about its axis so that one end always point toward thesun and the other toward the Earth. It has a spin rate of 5 revolutions per minute (rpm).The spacecraft subsystems are: mechanical, thermal control, command and datahandling, radio frequency (RF) communications, attitude determination and control,propulsion, and power. Figure 2.5-1 shows the spacecraft’s deployed configuration. To meet observing requirements and to simplify access to the instruments andspacecraft subsystems, all components except the propulsion system are mounted onthe external surfaces of the spacecraft body. Six of the instruments are mounted onthe top (sunward facing) deck and two are mounted on the sides. The instruments arepositioned to keep their various fields of view clear of each other while maintainingweight balance around the spacecraft. The two magnetometer sensors are on boomsattached to two of the four solar panels. With the solar panels and magnetometerbooms extended, the ACE spacecraft has a wingspan of about 8.3 meters. The fourarrays of solar cells provide sufficient power to allow operations to continue for at leastfive years. The spacecraft contains redundant equipment for collecting and storing data, andtransmitting the data back to Earth. Data are transmitted via a highly directionalparabolic dish antenna mounted on the bottom (Earth facing) deck of the spacecraft.Four other broad-beam antennas, capable of transmitting at lower rates, are alsoavailable if needed. Twenty-four hours of science and housekeeping data, or aboutone gigabit, recorded on one of two solid-state recorders are transmitted to Earth in asingle three to four hour telemetry pass each day. Spacecraft attitude is provided by astar tracker/scanner and digital sun sensors. Table 2.5-1 gives the weight, power anddata rate breakdown for the observatory and the fields of view for the instruments. Thefact that ACE had sufficient weight and power margins enabled these resources to beused to solve problems, in lieu of the use of additional time and money. The ACE spacecraft was developed by APL to meet the mission requirements in thesimplest and least costly way possible. It was a high heritage spacecraft, based on theActive Magnetospheric Particle Tracer Explorer (AMPTE) as well as other spacecraft.Most of the equipment in the subsystems was standard and procured from thespecializing vendors. APL designed and built the command and data handlingprocessors and the power system controllers. There are two advanced technologiesused on ACE: new high capacity solid state recorders and a new star scanner. Therecorders have a capacity of greater than one gigabit. Since the recorders are usedboth by ACE and the Near Earth Asteroid Rendezvous (NEAR) mission, and APL wassimultaneously building the ACE and NEAR spacecraft, the development of therecorders was a shared effort by the two missions. The star scanner is similar to thestar tracker flown on the X-Ray Timing Explorer, but required design modifications tooperate in a star scanning mode.
22
2.6 GROUND SYSTEM To increase ground system efficiency and to help the ACE project stay within its costcap, a common ground system approach was utilized for integration and test, missionoperations, and data processing and distribution. The three major subsystems of theACE ground system are a) the spacecraft I&T ground support system, b) the MissionOperations Center (MOC), and c) the ACE Science Center (ASC). These have manycommon functions, and the ACE common system architecture facilitates sharing ofsoftware, databases and testing procedures. This approach is unique for largermissions. Each of the three ground subsystems utilize the same computational platforms (HP 715and HP 748), and as much as possible use a common set of software modules. To dothis the performance requirements for instrument checkout and data verification had tobe understood far earlier than is usually the case, and procedures had to be developedon a pace that matched the spacecraft development. The ground support equipment for the integration and test of the spacecraft and theinstruments is known as the Integration and Test Operations Control Center (ITOCC).Spacecraft operations and level zero processing of payload data are performed in theMOC at GSFC. The data is then transferred to the ASC at CIT. The ASC isresponsible for initial processing of the data and for making the data accessible to theco-investigators and guest investigators located at their home institutions. Instrumentteams are located at ACE Science Analysis Remote Sites (ASARS) where they canreview and analyze data and evaluate instrument performance, and, as necessary,forward instrument commands to the ACE MOC for transmission to the observatory. Inpractice, three teams (including contractors) at APL, GSFC and CIT had to work closelytogether to make this common ground system approach work. An early Phase B analysis led to the conclusion that the Transportable PayloadOperations Control Center (TPOCC), a Unix based system which has been afoundation system for the past several years for most spacecraft control centers atGSFC, could provide much of the needed functionality in the ITOCC and the ASC, aswell as the MOC. A generic ACE system was adapted from the XTE TPOCC to includeall functionality common to the ACE MOC, ITOCC, and ASC, since many of the XTEunique capabilities were useful for ACE. Separate copies of the generic system werethen augmented individually with unique capabilities needed in the three subsystems.Most of the MOC unique capabilities are to be transferred to the ASC, making itpossible to extend the duration of the ACE mission by operating it at low cost from theASC. A single database was used for spacecraft development and testing, and is being usedfor spacecraft and instrument operations. Using the TPOCC System Test andOperations Language (TSTOL) for all procedures and displays allowed the instrumentteams to use common elements throughout all phases of instrument development, test,checkout and monitoring during integration and testing, and flight operations. Members of the Flight Operations Team (FOT) were included in the design anddevelopment from the early phases of the mission. This enabled a smooth transitionbetween spacecraft design and ground operations and avoided the frequently
23
encountered situation where ground operations are made unnecessarily complicated byspacecraft design decisions. The concept of the integrated team approach acrossspacecraft design, integration and test, and operations has worked successfully onsmaller spacecraft, but ACE is the first time NASA has attempted this approach on alarger program. The approach worked very well and is recommended for futuremissions. The multiple uses of the generic ground system has saved millions of dollars. Althoughthe generic TPOCC task required more lines of code than needed for the MOC alone, itwas substantially less than the lines of code required for the three separate systems. Asimilar savings in maintenance will be realized, since enhancement or correction in onesystem will enhance or correct all three systems. The approach led to the deletion ofthe software training simulator for the FOT. Instead, the FOT received high fidelitytraining with the spacecraft at APL, thus reducing risk to mission operations. The onedatabase utilized for all three systems eliminated time consuming and costlytranslations from one database to another while increasing the reliability of theoperations database.
24
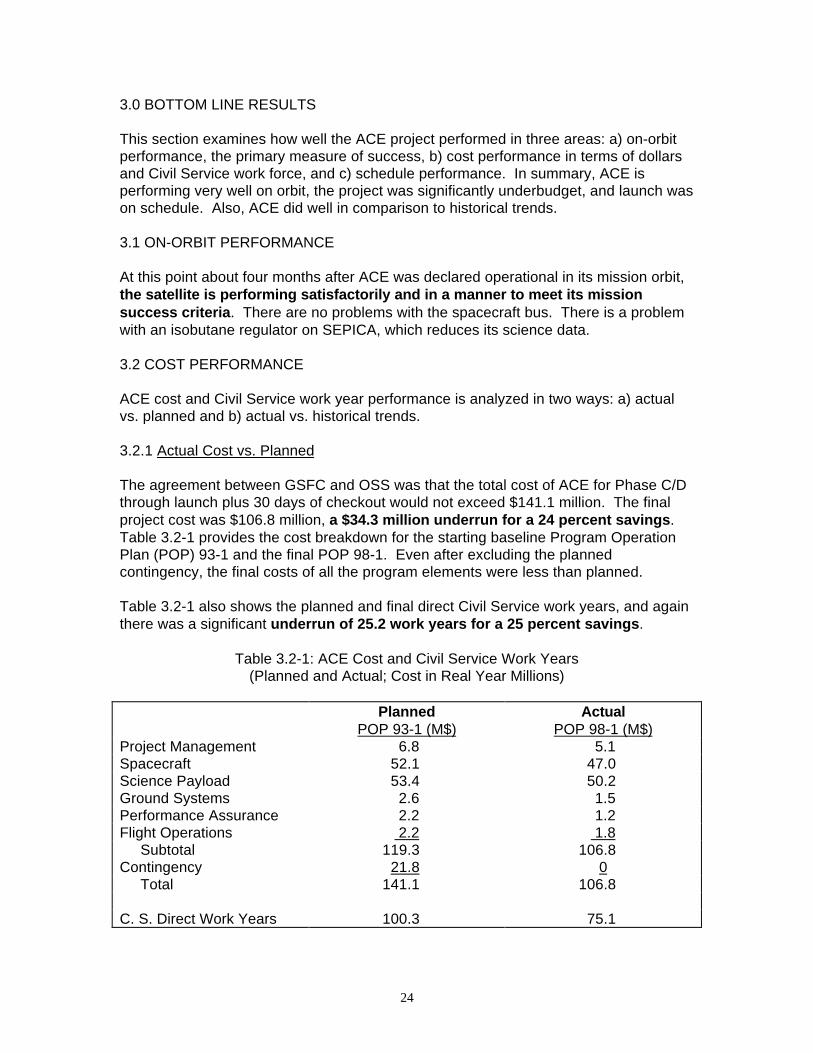
3.0 BOTTOM LINE RESULTS This section examines how well the ACE project performed in three areas: a) on-orbitperformance, the primary measure of success, b) cost performance in terms of dollarsand Civil Service work force, and c) schedule performance. In summary, ACE isperforming very well on orbit, the project was significantly underbudget, and launch wason schedule. Also, ACE did well in comparison to historical trends. 3.1 ON-ORBIT PERFORMANCE At this point about four months after ACE was declared operational in its mission orbit,the satellite is performing satisfactorily and in a manner to meet its missionsuccess criteria. There are no problems with the spacecraft bus. There is a problemwith an isobutane regulator on SEPICA, which reduces its science data. 3.2 COST PERFORMANCE ACE cost and Civil Service work year performance is analyzed in two ways: a) actualvs. planned and b) actual vs. historical trends. 3.2.1 Actual Cost vs. Planned The agreement between GSFC and OSS was that the total cost of ACE for Phase C/Dthrough launch plus 30 days of checkout would not exceed $141.1 million. The finalproject cost was $106.8 million, a $34.3 million underrun for a 24 percent savings. Table 3.2-1 provides the cost breakdown for the starting baseline Program OperationPlan (POP) 93-1 and the final POP 98-1. Even after excluding the plannedcontingency, the final costs of all the program elements were less than planned. Table 3.2-1 also shows the planned and final direct Civil Service work years, and againthere was a significant underrun of 25.2 work years for a 25 percent savings.
Table 3.2-1: ACE Cost and Civil Service Work Years (Planned and Actual; Cost in Real Year Millions)
Planned
POP 93-1 (M$) Actual
POP 98-1 (M$) Project Management 6.8 5.1 Spacecraft 52.1 47.0 Science Payload 53.4 50.2 Ground Systems 2.6 1.5 Performance Assurance 2.2 1.2 Flight Operations 2.2 1.8 Subtotal 119.3 106.8 Contingency 21.8 0 Total 141.1 106.8 C. S. Direct Work Years 100.3 75.1
25
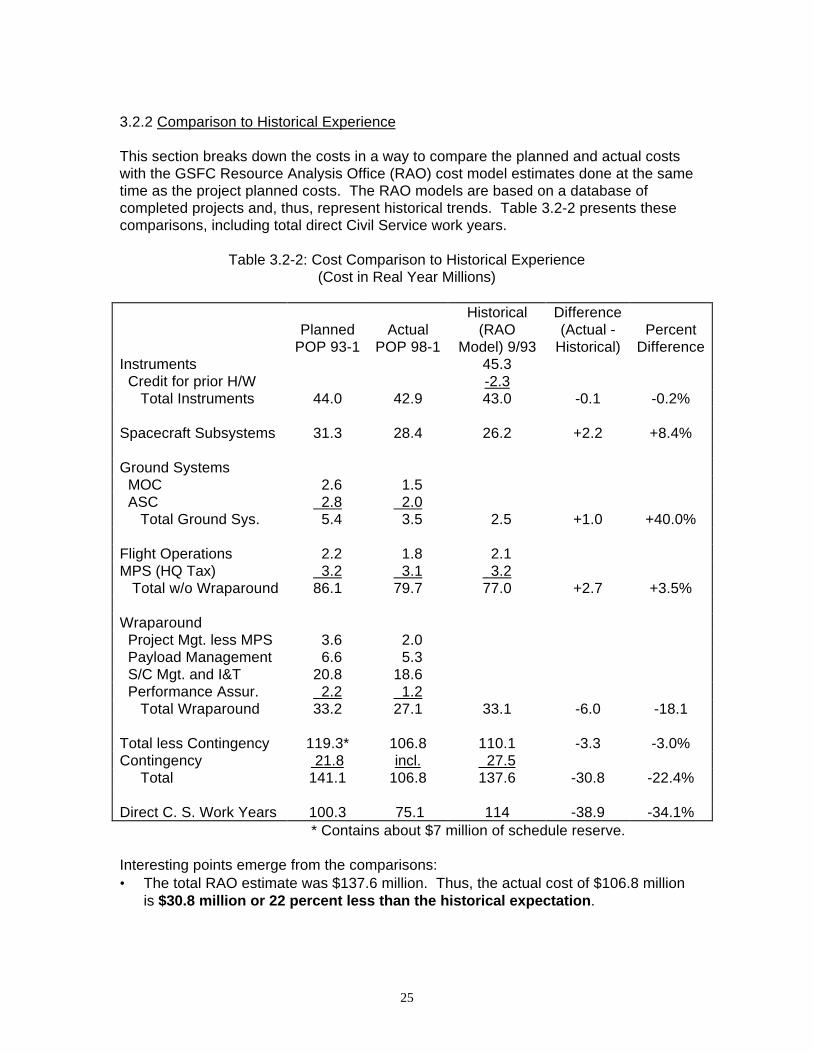
3.2.2 Comparison to Historical Experience This section breaks down the costs in a way to compare the planned and actual costswith the GSFC Resource Analysis Office (RAO) cost model estimates done at the sametime as the project planned costs. The RAO models are based on a database ofcompleted projects and, thus, represent historical trends. Table 3.2-2 presents thesecomparisons, including total direct Civil Service work years.
Table 3.2-2: Cost Comparison to Historical Experience (Cost in Real Year Millions)
Planned POP 93-1
Actual
POP 98-1
Historical(RAO
Model) 9/93
Difference (Actual -
Historical)
Percent
Difference Instruments 45.3 Credit for prior H/W -2.3 Total Instruments 44.0 42.9 43.0 -0.1 -0.2% Spacecraft Subsystems 31.3 28.4 26.2 +2.2 +8.4% Ground Systems MOC 2.6 1.5 ASC 2.8 2.0 Total Ground Sys. 5.4 3.5 2.5 +1.0 +40.0% Flight Operations 2.2 1.8 2.1 MPS (HQ Tax) 3.2 3.1 3.2 Total w/o Wraparound 86.1 79.7 77.0 +2.7 +3.5% Wraparound Project Mgt. less MPS 3.6 2.0 Payload Management 6.6 5.3 S/C Mgt. and I&T 20.8 18.6 Performance Assur. 2.2 1.2 Total Wraparound 33.2 27.1 33.1 -6.0 -18.1 Total less Contingency 119.3* 106.8 110.1 -3.3 -3.0% Contingency 21.8 incl. 27.5 Total 141.1 106.8 137.6 -30.8 -22.4% Direct C. S. Work Years 100.3 75.1 114 -38.9 -34.1% * Contains about $7 million of schedule reserve. Interesting points emerge from the comparisons:• The total RAO estimate was $137.6 million. Thus, the actual cost of $106.8 million
is $30.8 million or 22 percent less than the historical expectation.
26
• Since the RAO estimate and the project planned estimate are within 3 percent ofeach other, this result is similar to the comparison above of actual to planned. Theproject planned estimate reflected historical expectation; ACE results did not.
• Excluding contingency, the basic RAO estimate ($110.1 million) and actual cost are
only 3 percent apart. The RAO estimates for individual mission elements (e.g.,instruments) and the actuals are very close, with the area of wraparound costshaving the largest difference. Wraparound costs cover the functional activities ofmanagement, systems engineering, performance assurance, and integration andtest that bring the people, hardware, software, and other project elements togetherto achieve an integrated operationally ready space mission. The actual workcontent for instruments, spacecraft hardware, ground systems, and preparations forflight operations was very close to historical expectation.
• Again, the project planned estimates (excluding contingency) are quite close to
historical expectations. In fact, the planned total without contingency ($119.3million) contained about $7 million of schedule reserve. Excluding this reservebrings the basic planned estimate to a 5 percent difference from the actual cost anda 2 percent difference from the RAO estimate. As with the RAO estimate, thelargest area of difference is wraparound.
• The major difference between the bottom line actual and historically expected
costs is the expected use of contingency. In the end, the project did not use theanticipated amount of contingency and schedule reserve.
• The actual Civil Service total of 75.1 work years is 39 work years or 34 percent
less than historical expectation. The primary conclusion is that the ACE project performed significantly better thanhistorical expectations. The analysis in this section strongly indicates that the ACEproject was managed differently than most historical projects. The management tookthe fixed price mandate very seriously. First, the contingency and schedule reservewere “banked” early in the project with the desire to manage without them. Second, thefixed price concept was used throughout all elements of the project. Third, schedulewas maintained tightly, which provided a control of cost. Similar results and patternswere seen in the XTE project. It appears that the GSFC Explorers Project Office, inconjunction with Headquarters OSS, have constructed a more efficient mode of projectmanagement. One that fits well with the NASA concept of faster, better, cheaper. 3.3 SCHEDULE PERFORMANCE 3.3.1 Actual Schedule vs. Planned The agreement between Headquarters and GSFC stated that the launch would be nolater than December 1997. At the very beginning of Phase C/D the Project Officeestablished a launch date for the end of August, 1997. The ACE satellite was launchedAugust 25, 1997. There was no deviation between the planned and actual launchdates, and the not-to-exceed launch date was beat by four months.
27
3.3.2 Actual Schedule vs. Historical Experience The Authority to Proceed (ATP) was the beginning of FY1994, or October 1, 1993.Launch was August 25, 1997, which gives a project duration of 46.8 months from ATPto launch. This was 3 months longer than the average project duration for 8 spacecraftprojects in the RAO database with total satellite dry weights from 800 to 1,500 pounds.ACE has a total dry weight of 1,226 pounds. The range for project duration for these 8spacecraft is 34 to 54 months, and the ACE project duration is within 1/2 standarddeviation of the database average. This indicates that while the ACE figure is abovethe historical average, it is close enough to conclude that the ACE schedule isconsistent with historical experience and was not any faster.
28
4.0 UNIQUE AND INNOVATIVE ASPECTS OF ACE This section summarizes key overall characteristics of ACE that are unique andinnovative. More detailed innovative elements, such as in the individual instrumentsand spacecraft subsystems, are discussed in section 7.0 below, and some have beenmentioned above in section 2.0. 1. Extensive Phase B Because of Explorer Program funding priority shifts, the planned execution phase startfor ACE was postponed. This allowed ACE to have an extended Phase B of aroundthree years. Some Phase B activities continued after Phase C/D started. Phase B alsowas well funded. The exceptionally thorough nature of the Phase B effort by an experienced scienceteam and APL spacecraft developer got the mission off to a good start. For example,that effort included demonstration of a new VLSI approach that greatly simplified CRISand SIS. In addition, Phase B helped to refine the scope of all instruments and thespacecraft. Despite the demonstrated success and savings (see section 3.0) of the ACE mission,ACE may be the last of the Explorers to enjoy the advantages of such an extensivePhase B study. Most of the currently planned missions will be limited to Phase Bstudies in the order of a few months. 2. Capped But Adequate Budget ACE was proposed as a straightforward, low-cost mission in the mid-1980s. WhenACE finally was selected to proceed to Phase B, the NASA environment was rapidlychanging (1991 time frame). ACE followed the innovative pattern set by XTE by havinga cost cap agreement between the OSS and the GSFC Project Office. This allowed amuch stronger stand on requirements growth than what was normal in that time period.This played a large role in maintaining the original low-cost nature of ACE. OSS committed up front to provide the Phase C/D funding as planned for each fiscalyear. The establishment up front of adequate resources (including contingency) wascrucial to the success of ACE. That provided the flexibility to make developmenttradeoffs and work-arounds which made it possible to meet a launch date that did notslip. 3. Descope Plan As part of the agreement between OSS and the Project Office to contain the totalproject cost, there also was a scope reduction agreement. Provided that the Level 1Science Requirements were preserved and that full use of contingencies were used,the ACE project, in consultation with the Project Scientist, could pursue scope reductionas a means to control cost. As it turned out, no major descoping was needed.However, having this plan in place provided a useful backup.
29
4. Principal Investigator (PI) Mode ACE was the first full-sized Explorer mission to employ the PI mode, a new way ofdoing business. ACE, despite having nine separate instruments, had only one PI. Theresponsibility for the instruments was delegated to CIT (the PI institution), with minimaloversight from Goddard. For its time, the amount of responsibility turned over to themission PI organization (and, incidentally, to the spacecraft contractor) was innovative. The PI was consulted for all significant decisions that the Project Office had to makeregarding the instruments. In fact, the Mission Manager and the PI communicated on aweekly basis from Phase B through the completion of Phase C/D so that the PI wasalways aware of what was happening and was always in the major decision makingloop. 5. Contracting Arrangements The ACE contracting arrangements were unique. The Project Office had separatecontracts with APL, CIT and the GSFC Mission Operations and Data SystemsDirectorate. APL provided the spacecraft, system integration and test, and launchsupport. The Mission Operations and Data Systems Directorate provided the groundsystem, the Mission Operations Center and Flight Dynamics support. CIT provided thescience payload and the ACE Science Center. The contract with CIT provided for the payload (contract authority for six and one half ofthe instruments), the Payload Management Office (PMO), and the ACE Science Center(ASC). Full authority to subcontract with the investigator institutions and to direct themwas implicit. Instruments built by the Los Alamos National Laboratory and APL (EPAMand one half of ULEIS) were funded directly by GSFC; however CIT was delegatedtotal management responsibility and authority. In monitoring the CIT contract the ACEProject Office had an oversight role. In executing the contract, however, the ProjectOffice, at CIT's request, agreed to become a part of the PMO team and supported theCIT efforts for the East Coast instruments. In addition the Project Office providedscheduler/planner support to CIT for all instruments. This effort resulted in increasedefficiency in resolving problems, faster responses in replanning, and development ofmutual trust between organizations. 6. Common Ground System ACE was the first major NASA mission to adopt the same core hardware and softwaresystem for the I&T ground system, mission operations ground system and science datacenter ground system. This eliminated much of the effort previously required to makethree separate ground systems, made the system far more efficient, saveddevelopment dollars, and provided better trained operations personnel. 7. Instrument Integration With Spacecraft The handling and scheduling of the instrument integration was innovative andsuccessful. The instruments were all integrated prior to thermal vacuum testing and allbut one was removed for calibration and/or repair, and shipped to KSC independent ofthe spacecraft. At the KSC processing facility, the instruments were re-integrated and
30
tested. While this approach was cumbersome, it allowed for late delivery ofinstruments with minimal impact to the overall schedule. 8. NASA Classification Classification was Class C for the spacecraft bus, but was relaxed to Class D for thehighly redundant instrument suite. This allowed CIT/JPL flexibility to handle thedelicate SR&QA tasks in the University environment, while preserving a more normalapproach between GSFC and APL for the spacecraft. This arrangement forced a cleardelegation of responsibility and a concentration on the higher priorities, rather thantrying to tightly control everything from one place. Cooperation resulted, and it workedquite well. 9. Secondary Payloads The near-real-time reporting of space weather using a subset of data from fourscientific instruments is both innovative and unique. ACE carried the first Real TimeSolar Wind monitor, ever, for NOAA/SEC. Also, the incorporation of the SLAMpackage represented an important and unique first step in gathering payload launchenvironmental data. 10. Management Approaches The following unique management approaches were used by the ACE Project Office atGSFC:
• Separate contracts with APL and CIT. Both were effectively managed by therespective institutions.
• Use of contractor operating and R&QA systems wherever possible. Notinsisting that they do it Goddard's way.
• Different Product Assurance requirements for instruments and spacecraft.(Placed primary responsibility for instrument quality in the hands of CIT and Co-Iteams. Provided for less than Class C requirements but preserved overall ClassC mission.)
• The GSFC Instrument Manager played two major roles. The first was providingoversight, from a Project point of view, of the CIT effort. The second wasproviding management support to CIT, as a member of the CIT/PMOmanagement team, in looking after the East Coast instruments. This dual rolewas unique.
• Full and open communications with all parties minimized friction and led toestablishing trust between groups.
• Recognition that people sometimes make mistakes. When they did the problemwas fixed without penalizing the individual. This led to a greater willingness forall team members to provide full and factual information (even if it hurt).
Using CIT to manage the development of the instruments and the ASC was a uniqueand highly successful management approach. What made possible the successfulscience payload management of ACE by a small PI institution such as CIT was easyaccess to the much larger technical and managerial resources of the JPL. Withoutthose, CIT would have been hard pressed to provide the staff necessary to manage the
31
development of an ACE science payload. JPL was in effect used as a cafeteria fromwhich technical and management services were selected on an as-needed basis.
The Project Office management treated ACE completely as a team effort, and trustedthe science team to complete their tasks without direct oversight more than iscommonly done. This helped instill a sense of team spirit. Yet the Project Office wasalso willing to push the science team to accept help in problem areas as early as theseproblems were identified. This was effective in keeping the project on time andunderbudget.
32
5.0 RISK AND RISK MITIGATION
The major risks were those things that were schedule driven. There were adequateweight and power margins and these were used to solve problems rather than initiatelengthy and costly redesigns. In general, the real risks were in the development of keyitems for the four new instruments.
1. Instruments
The major risks were in developing four new instruments of unprecedented collectingpower within the available time and resource constraints. An extended and well fundedPhase B significantly helped reduce, but not eliminate, the instrument developmentrisks. Defining a set of mission objectives in Phase B which required that just sevenout of ten be met in order for the mission to be successful was an important mitigation.Thorough and ongoing reviews of development plans made it possible to avoid overlyambitious undertakings, and to identify descope options, should they becomenecessary. Such reviews were conducted not only by the CIT Payload ManagementOffice and the Goddard Project Office, but also by independent review boardscomposed of technical experts paid for by the CIT PMO. Helpful suggestions oftenarose from members of this independent board whose membership was tailored to theoccasion. A core group of standing members provided continuity across the sciencepayload, as well as an ongoing cross-pollination of lessons learned among the variousinstrument development groups.
In particular, during Phase B, the major instrument risks were identified as being thedetectors for CRIS and SIS; the custom very large scale integrated circuits (VLSI) forthe SIS matrix detector readout; the custom VLSI/hybrids developed for CRIS, SIS andULEIS; the scintillating optical fiber trajectory (SOFT) hodoscope for CRIS; the Time ofFlight System for ULEIS; the collimators, gas controller and power supplies for SEPICA.Adequate funding and planning were provided to mitigate these risks. In most casessuitable alternatives were identified even though their use would have resulted inreduced science or a descoped instrument.
This risk mitigation approach paid off. Each of the instruments was able to complete itsdevelopment properly and all of the high-risk items were flown. For new state-of-the-artinstruments keeping instrument development up front and funded is an important partof a successful mission. In the case of ACE, it was the Phase B that allowed theinstruments time and money to mature to the point where they could be successfullycompleted in Phase C/D, although, even so, it was close.
2. Spacecraft
The spacecraft did not have major risks, although some risks were identified:
The primary risk for the AD&C subsystem was a schedule risk, specifically the deliveryof the star scanner. The reason for the risk was that the ACE star scanner is the first tofly using the Time Delay Integration technique, and the vendor did not have anadequate number of people assigned to the software development effort. The scannerwas delivered nine months behind schedule.
33
To mitigate any risk in communicating with the Observatory, the design incorporated aredundant RF system and a redundant command and data handling system.
In terms of the flight software, the primary risk was that all of the necessary tools werenot available at the start of the program. These tools were developed within APL, andthere was limited staff who could do this. This risk was mitigated by the fact that therewas another program that had several sub-systems that needed the same tools, soresources were shared.
3. Ground System
Schedule risk was the primary risk concern for the ground system. The ground systemteam needed to provide a system to support the I&T of the ACE observatory, and I&Twas in the critical path to launch. If this commitment to the APL I&T team was not met,the launch would have been delayed. At the same time the ground system teamneeded to develop a similar, but not identical system to support flight operation.
Risk was reduced by employing the Flight Operations Team (FOT) as I&T testengineers. In this way the needed training time for the FOT was reduced and carriedmany of the lessons learned from the I&T system to the flight operations system.
34
6.0 LESSONS LEARNED
6.1 KEY REASONS FOR SUCCESS
While a large number of things contributed to the success of ACE, there was generalagreement among the various ACE personnel on the key reasons:
1. People--good, dedicated, hardworking2. Cooperation among all the groups--team effort3. Good up-front planning4. Adequate Phase B study effort5. Adequate funding when needed6. Good management
It was a unanimous opinion that the people on the project and their teamwork made theprimary difference. The success of ACE is due to having proper project managementand a team composed of the right mix of talented, dedicated and experiencedpersonnel who knew how to anticipate and eliminate problem areas before theydeveloped and to quickly react in an appropriate fashion to solve problems thatsurfaced. In addition, having a realistic ACE funding budget and schedule, based ondetailed carefully prepared estimates, contributed greatly to the success. Also, havingreasonable freedom to reallocate funds quickly when needed to solve unexpectedproblems added greatly to the team’s overall performance.
An important reason for the success of the ACE payload development was the use byCIT of a standing review board of technical experts. The particular membership for agiven review was tailored to the occasion. Its members contributed useful suggestionsand sometimes stayed on after a review to participate in work-arounds during the fast-paced days of instrument development. The effectiveness of these outside expertswas made possible by the effort spent beforehand in establishing an environment ofopenness and trust among the Co-Investigator groups, the CIT Payload ManagementOffice, and the Goddard Project Office. After some initial resistance, all groupscontributed to this important spirit of cooperation. For the most part, blame wasavoided as a first reaction to problems.
6.2 OTHER LESSONS LEARNED
6.2.1 Project Office Perspective
ACE was a true team effort. Things done in ACE which are worth emulating in thefuture include:
• Maintaining full and open communications in all directions.• Being open, honest and frank in discussions with contractors or other
supporting groups.• Giving appropriate credit to the doers of good work.• Defining project/instrument descope options early in the program.• Doing what needed to be done and not standing on ceremony.• Always remembering who the customer is.
35
The ACE approach was to stick to design where “good is good enough” and not allowhardware changes just for the sake of “improvement”. A reasonable schedule with keymilestones was established at the start of Phase C/D, and heavy emphasis was placedon maintaining it. Adequate funding was established along with the ability reallocatethese funds as needed. Synergism between ACE and NEAR worked very well. APL utilized many of the sametechnical people on both projects. Consequently many of the solutions to problemswere solved on “the other project” and never became an “ACE problem”. Contractorwork force costs were significantly reduced as they were a shared resource. Although agreements were reached between the GSFC Project Office, APL and CITregarding Safety, Reliability and Quality Assurance (SR&QA) requirements, arriving atthese agreements was not always easy. In fact, the CIT PMO felt that too much timeand effort was spent trying to get to the agreements. The PMO felt that in order toestablish who is responsible for what aspect of SR&QA, the responsible SR&QA teammembers needed to informally talk about the dimensions of needed SR&QA activities.Agreement had to be reached on responsibilities and budget. The agreement wasdocumented and accepted by project management and organizational management.In going through this process everyone knew what corners could be cut during theexecution phase. The PMO also felt that as long as roles were clearly defined, and objectives agreed to,the team, acting efficiently and in collaboration with each other, would be able toreduce documentation time. This was demonstrated. 6.2.2 Payload Perspective Define the job well up front. Decide on its success criteria. Define an achievablescope and schedule. Allocate sufficient resources along with adequate margins. Andprovide key technical and management support to the investigators as needed. ACE worked as well as it did because good people were involved. But as a hand-off ofresponsibility to the PI institution, it went only part way. The management arrangementwas an innovative approach for its time, but resulted in a 3-way nexus of centers,(Goddard, CIT and APL). Each had enough power and independence that when thingswent wrong, a natural temptation arose for two to point a finger at the third.Fortunately, with good people at the helm, appropriate, reasoned solutions were alwaysworked out. In the future however, handing off more overall development responsibilityto the mission PI organization, as is now being done on Small Explorers and MIDEXs,should be even more effective. In the course of managing the instrument payload, the CIT PMO used the followingABC's of project management: a) Anticipate what might occur and take preventative steps to avoid problems, b) Build a good team and endeavor to sustain their interest, and c) Communicate both upwards, downwards and sideways with project peers.
36
Specific observations from the perspective of the CIT PMO related to the way in whichACE was managed are as follows: 1. The effort spent in fostering good relations and team work among all participants iswell worth it. Good relations and team work are essential to any successful effortwhere members must trust and depend upon one another, especially a faster, better,cheaper project. To the extent it can be achieved, co-location in conducive facilitieshelps, as does an adequate travel budget to support frequent fact finding visits andproblem solving trips. 2. Despite the PMO's best intentions, the Instrument Functional RequirementsDocuments (IFRDs) were for the most part not completed until after the hardware wasbuilt and evaluated. Co-Is building new instruments were not sure beforehand whatperformance could be achieved within their operating constraints, and thereforeresisted committing to a set of performance specifications until finished. To their credit,Co-I developments ended when "good-enough" instrument performance was achieved. 3. In order to tell the spacecraft integrator how their instrument should be tested at thesystem level, instrument developers first needed to evaluate how the design turned out,just what performance could be achieved, and how their new invention behaved whenoperated. Meanwhile, in order to develop test procedures, the system integratorwanted to know the answers well before the developers knew themselves. Unless abetter way is found for early scoping of system test procedures, and provisions andresources made available for many last minute changes, this dilemma will onlyexacerbate schedule conflicts late in the program on the upcoming faster, better,cheaper missions. 4. Managers should be given adequate reserves, and use them early and wisely whilethere is still time to do some good. Drawing a tight constraints box around a developerwhile withholding the wherewithal to help him solve his problem will only cause him todissipate excessive resources working against one brick wall (e.g., mass reduction),while sacrificing another (e.g., schedule). In the end, both the developer and theproject lose out. 5. Managers should develop a hierarchical strategy regarding milestones. Decidewhich are the important ones, and put extra effort into meeting those. Use intermediatemilestones to hold people's feet to the fire. But recognize that for understandablereasons some will slip. Such slips necessitate frequent replanning of work flowschedules in order to preserve the important milestones. Throwing project resources ata given problem can often help, provided the developer is persuaded that this help is tohis benefit and will not make his job even more difficult, and that he will not be undulypunished for accepting help. The management team needs to continually work atfostering the idea that they are there to help, and not to punish those do not meet everyexpectation. Openness is needed between participants, not an attitude of pull up thedraw bridges and batten down the hatches so that no manager will ever find out what isreally going on in the development. 6. In some cases, the rework efforts on new instruments became so extensive that awhole new build was initiated. Therefore, a number of partial engineering modelsresulted. These turned out to be very useful in helping to achieve the necessary
37
performance of flight units. The capability to begin a whole new build and continuetesting in parallel on engineering models increased the likelihood of overall success.Having the schedule flexibility and adequate financial reserves to do so, made thisapproach possible and in the end worthwhile. 7. The inevitability of schedule replanning can lead to a non-monotonic "percentcomplete" estimate. This complicates earned value estimates which means that itsabsolute value should not be taken too literally. Nonetheless, an adverse trend in anearned value plot may serve as a good indicator of impending trouble. But such atrend needs to be understood in the context of the recent problems that caused it, aswell as a realistic assessment of efforts and prospects for overcoming those problems.For example, if all the right things are being done to solve a problem, and no new oneshave surfaced, it may be possible to safely discount an adverse trend in earned value. 8. Although a Work Breakdown Structure (WBS) and a companion WBS dictionary wasrequired by the Project Office to establish credible cost estimates, the effort spent oncreating these for the science payload was not useful to the PMO. Other payload lessons learned: Be careful about specifying acoustic and vibration specifications. Even thoughvibration and acoustic levels came from the best data available for the launch vehicleand from past GSFC experience, the vibration specification for SIS was much too large(i.e., by a factor of 10 or more), and that caused six months of difficulties and extracosts. The estimate for the specification was way too conservative, and this was aserious problem for SIS. Development of a database for successful techniques, vendors, guidelines, etc. thatcan be easily disseminated via the web for review by prospective mission contributorswould help avoid unnecessary duplication of effort. Some “wheels” do not need to bere-invented for each mission. Many work hours could have been saved if the NASA Project Office had someoneassigned to help with logistics issues at the beginning of the project. This individualshould be well versed in the Department of Transportation requirements fortransportation of radioactive sources, hazardous materials, such as isobutane. TheSEPICA team had to learn most of the protocols by stumbling over them for months.The efforts put forth for SEPICA were late in the program. Also, many work hours were spent rewriting safety and environmental test proceduresto satisfy GSFC safety and environmental test facility personnel (mostly safetypersonnel). Skeleton procedures should be developed by GSFC to help incoming“customers” using the facilities to insure that at least minimum facility and GSFC safetyrequirements are met. Many iterations were submitted and painfully scrutinized beforeapproval was granted to proceed with testing. Much of this could have been donebeforehand if these skeletal procedures were given at the beginning of the project toinstrumentors planning to perform environmental tests at GSFC.
38
6.2.3 Spacecraft Perspective During the extended Phase B, APL purposefully kept costs low while contributingpositive effort during this phase by careful planning, focusing on top level requirementsand maintaining communications with the instrumentors. ACE provided excellentscience at relatively low cost. This was accomplished by laying out the missionrequirements early and then sticking to them. The ACE team demonstrated success indesigning to cost. There were several organizations involved in ACE, and all had managers/leads, somemore than others. There was a tendency in the beginning of the program for somemanagers/leads to cross organizational lines and cause confusion. The confusionresulted from situations in which a manager/lead from one organization would try todirect individual engineering staff in another organization, without the involvement ofthe manager/lead in the engineer’s organization. This is always counterproductive.This was straightened out with time, but led to significant inefficiencies in the beginning. In ACE there was a unique difference between the spacecraft and the instruments inthe flight “rules” for documentation, review and testing. The spacecraft was Class C,while instruments were Class D. It is appropriate to have the spacecraft come undertighter scrutiny for design and fabrication, because of the fact that it serves the entireinstrument payload. But for ACE, the Class D designation for instruments resulted inproblems when it came time for integration of the instruments with the spacecraft.Documentation and/or records of interfaces and functional, environmental andperformance testing were not always available, and it was difficult to incorporate theseinstruments into a configured spacecraft and still satisfy the requirements levied byGSFC at the Observatory level. There needs to be some documented requirements forthe integration of Class C and D components that reflects the reality of the situation. Some subsystem and I&T specific lessons learned follow: A more standard interface for the star scanner (i.e., a 1553 interface instead of thecustom serial-digital interface) would have greatly simplified the manufacturing of thestar scanner by the vendor. Significant time was lost, resulting in a late delivery,because of difficulties with finding bugs in the timing synchronization of the starscanner’s custom interface. More oversight of the solar cell production might have uncovered earlier a crack in themanufacturer’s calibration standard, which made performance look slightly better thanactual. Testing should have included a hot flash to verify no cracks. Another NASAprogram had solar cell trouble, causing the concern for cracks, but too late to risk thetest on ACE panels. Also in the power area, it was learned that It is possible to fly battery cells which havebeen in dry storage for many years. In the integration area, several features of the ITOCC system helped the ACE programattain its cost and schedule goals. These included using spacecraft redundancy andflexible ground systems to streamline spacecraft testing, using a scaleable ground
39
system architecture that was easy to expand and shrink as needed, the on-linecommand GUI, and providing early access to the spacecraft by the mission operationsteam. The software used for I&T was TSTOL, which the mission operation center is using inpost launch operations. If the software, which had to be modified for ACE, hadpresented itself earlier in the integration scheduled time period, the bugs could havebeen coped with better. The development of I&T software should have been givenprecedence over flight operations software much earlier than was done. 6.2.4 Ground System Perspective The successful implementation of a common ground system for ACE integration andtest, and mission and science operations proves that this is a viable concept for futuremissions. Currently several NASA missions, including the Transition Region andCoronal Explorer (TRACE), the Wide-Field Infrared Explorer (WIRE), the MicrowaveAnisotropy Probe (MAP), and the Earth Orbiter-1 (EO-1) are developing commonground systems for spacecraft integration and test and mission operations. Whilethese missions have chosen different control center architectures, they are followingmany of the same principles as ACE. The FOT has been staffed early as missiondesign decisions are being made. The FOT is actively involved in developing thecommand and telemetry database and in developing and executing spacecraftintegration and test procedures. The common ground system allows the command andtelemetry database, displays and test procedures used in integration and test to bereused with minor modifications for on-orbit operations. The experience the FOT gainswith both the spacecraft and ground system allows a smaller team to handle on-orbitoperations, thereby reducing sustaining mission operations cost. The attempt to reuse functionality from the XTE's TPOCC proved to be a mixedblessing. While the reuse of the XTE software reduced costs, the lack of control overthe XTE software development schedule increased ACE schedule risk. The XTEsystem was less mature than expected and its use became a source of errors in theACE Generic. Moreover, the ACE Generic staffing profile was not adequate to fixthese errors and develop all the new capabilities as scheduled. Therefore, constanttradeoffs were made to prioritize the XTE discrepancy fixes versus the new capabilitiesrequested. Similarly, GTAS, planned for trend analysis in the ITOCC, was droppedbecause of the lack of maturity. It was concluded that to be the first user ofgovernment off the shelf (GOTS) or commercial off the shelf (COTS) systems may notbe worth the additional schedule risk, especially when having hard deadlines thatcannot accommodate extensive system debugging. The assumption that a common ground system could support both integration and testand flight operations spacecraft control requirement proved largely correct. However,adapting a system originally designed for flight operations to service integration andtest requirements presented some unique challenges. A description of each of thesechallenges is provided below, and a more detailed discussion appears in section 7.4. 1. A considerable amount of effort was expended up front trying to document all therequirements for the MOC, ITOCC and ASC for ACE Generic. However all the ITOCC
40
requirements could not be defined in advance because the spacecraft was not yet built.The development team accommodated the growth in requirements by stretching out theACE Generic delivery schedule and delaying the implementation of the less mission-critical ACE MOC specific requirements. 2. The original delivery schedule of providing ACE Generic releases 3 or 4 monthsapart did not meet the ITOCC requirements for delivery of new capabilities or fixinghigh priority system discrepancies. Thus the development team abandoned the systemrelease approach and created a "function drop" delivery mechanism. Function dropswere provided to the ITOCC on a weekly basis. This new delivery approach resulted inbetter responsiveness to ITOCC needs and allowed new requirements to be moreeasily accommodated within the development schedule. 3. Development of a common ground system must take into account the resourcesrequired to support the different objectives and delivery timing of spacecraft I&T andoperations. The ACE development effort ran into significant resource problems startingapproximately two years prior to launch when the I&T effort started to ramp up and theinitial MOC systems were due for initial release to support early FOT testing with thespacecraft. On future common system development efforts the development teamresources must be ramped-up significantly at approximately launch minus two yearsthrough the completion of the I&T effort. This will ensure that the needs of both groupsare met in a timely manner. 4. Another challenge was the different approach for managing schedule reserve. MOCdevelopment at GSFC has tended to vest schedule reserve in the ability toaccommodate a schedule slip or failure of a function by postponing work to futurereleases. However, delays of this scale cannot be accommodated when building anI&T system. Schedule reserve for unforeseen work must be included in the basicschedule for an I&T system just as it is for any spacecraft component or instrument. 5. Spacecraft integration and test stresses the command and control system in adifferent fashion than flight operations. Spacecraft integration and test sends a muchlarger number of real-time commands, interfaces with the spacecraft for longer periodsof time, and has a much greater dependency on real-time telemetry for diagnosingproblems and confirming spacecraft health. The FOT relies on recorded data fortrending and determining spacecraft anomalies. To accommodate these integrationand test requirements, changes had to be made to the size and handling of data files. 6. Similarly, another "cultural" difference pertained to procedures. I&T procedures arebased on complete component and spacecraft functionality, whereas FOT proceduresare based on nominal and contingency operational scenarios. Thus, FOT procedurestend to be more segmented than those used for I&T. This required the FOT to developmany procedures from scratch, using the I&T procedures only as a baseline. Thisprocedure conversion process also led to a greater configuration and control effort thanoriginally planned. 7. During development of a common I&T/operations ground system, the ground systemdeveloper must ensure that maximum commonality is maintained between the systemsto ensure that the only variations between the systems are those that are absolutelynecessary for each group to perform unique functions. On ACE, the development
41
teams working on the I&T system performed a large number of system modificationsthat “improved” I&T operations but were not critical to I&T functional objectives. Sincethese changes were done after the baseline system was delivered to I&T, thesechanges were not reflected back in the MOC system developed for operations. Futurecommon system development efforts should include a development team ControlBoard that reviews and approves all non-common changes submitted by either the I&Tor operations teams. 8. A large number of the high priority discrepancies with the I&T team dealt withinconsistencies with the user interface. While a FOT member will become highlytrained on the intricacies of the MOC user interface, many I&T users (such as systemengineers) have little to no familiarity with the ITOCC. A consistent user interfaceallows such users to quickly come up to speed using the ITOCC with minimal trainingwhile they trouble shoot problems. The development team had to become sensitized tothis issue and give higher priority to fixing user interface problems when they arose. There is a very large overlap between functions performed for spacecraft I&T and thefunctions performed in operating a spacecraft. However, the needs, cultures, andapproaches of the Integration and Test team are different from that of the FlightOperations Team. Coping with these differences presented the greatest challenge tothe ACE Mission Operations Team. These challenges were overcome throughextensive coordination among the various team members. Many meetings wereneeded between the I&T team, FOT, and the software developers to review the statusof, assign priorities to, and establish the schedule for system capabilities anddiscrepancies. Communications was the key to avoiding and resolving problems. A better understanding of the requirements for the APL I&T system would havereduced the schedule risk to the flight operations. Employing some softwaredevelopers more familiar with spacecraft I&T, would have enhanced understanding bythe flight operation team of the needs of the I&T team.
42
7.0 DISCUSSION OF MISSION ELEMENTS This section provides a more detailed discussion of the science payload, spacecraft,integration and ground systems. Where there is a discussion on complexity rating, it isbased on judgments of the relevant ACE team members using the following scale of 1to 5 to rate the level of complexity or difficulty in developing and building the particularmission element: 1 Easy = Low Complexity 2 = Medium-Low Complexity 3 Average = Medium Complexity 4 = Medium-High Complexity 5 Hard = High Complexity 7.1 SCIENCE PAYLOAD Table 7.1-1 provides the performance requirements for the ACE instruments. 7.1.1 Cosmic Ray Isotope Spectrometer (CRIS) 7.1.1.1 Description California Institute of Technology, Pasadena, California was the developing institution.Co-Investigators are: Alan Cummings, Mark Wiedenbeck, Robert Binns, RichardMewaldt, and Tycho von Rosenvinge. The following description of CRIS was extracted from E. C. Stone et al., The CosmicRay Isotope Spectrometer for the Advanced Composition Explorer, accepted forpublication in Space Science Reviews, 1998. A source for obtaining this paper and thefull detail about CRIS is Alan C. Cummings, CIT. CRIS is designed to cover the highest decade of the ACE’s interval, from ~ 50 to ~ 500MeV/nucleon, with isotopic resolution for elements up to Z = 30. The nuclei detected inthis energy interval are predominantly cosmic rays originating in our Galaxy. Thissample of galactic matter can be used to investigate the nucleosynthesis of the parentmaterial, as well as fractionation, acceleration, and transport processes that theseparticles undergo in the Galaxy. Charge and mass identification with CRIS is based on multiple measurements of dE/dxand total energy in stacks of silicon detectors, and trajectory measurements in ascintillating optical fiber trajectory (SOFT) hodoscope. The instrument has ageometrical factor of ~ 250 cm2 ster for isotope measurements, and should accumulate~ 5 x 10⁶ stopping heavy nuclei (Z>2) in two years of data collection under solarminimum conditions. Table 7.1.1-1 provides a summary of CRIS characteristics and Table 7.1.1-2 givesCRIS design requirements. Figure 7.1.1-1 displays the CRIS instrument cross section, top view and side view. Theside view shows the fiber hodoscope which consists of three hodoscope planes (H1,
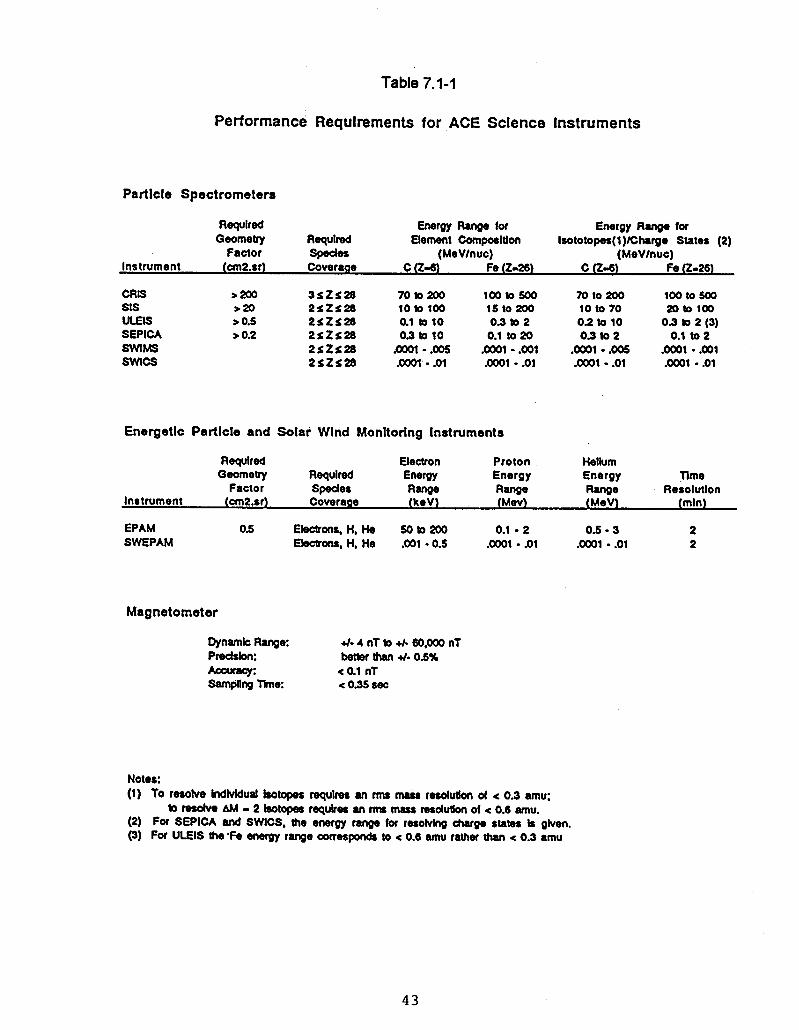
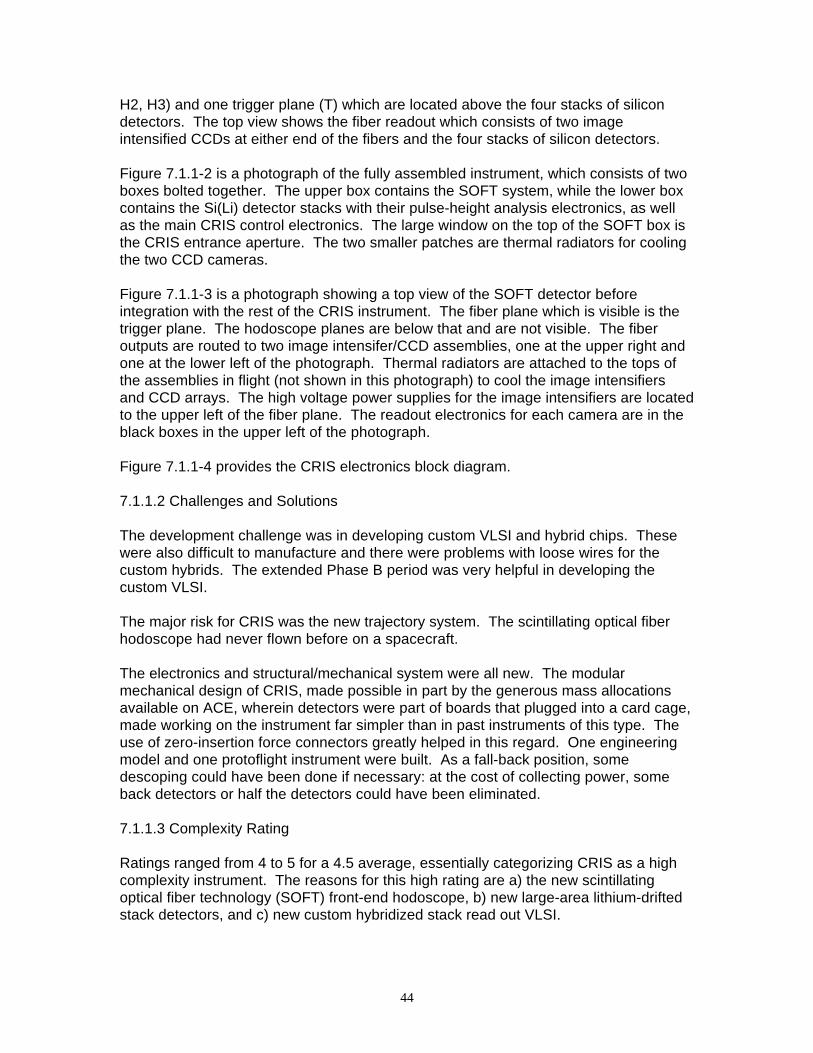
44
H2, H3) and one trigger plane (T) which are located above the four stacks of silicondetectors. The top view shows the fiber readout which consists of two imageintensified CCDs at either end of the fibers and the four stacks of silicon detectors. Figure 7.1.1-2 is a photograph of the fully assembled instrument, which consists of twoboxes bolted together. The upper box contains the SOFT system, while the lower boxcontains the Si(Li) detector stacks with their pulse-height analysis electronics, as wellas the main CRIS control electronics. The large window on the top of the SOFT box isthe CRIS entrance aperture. The two smaller patches are thermal radiators for coolingthe two CCD cameras. Figure 7.1.1-3 is a photograph showing a top view of the SOFT detector beforeintegration with the rest of the CRIS instrument. The fiber plane which is visible is thetrigger plane. The hodoscope planes are below that and are not visible. The fiberoutputs are routed to two image intensifer/CCD assemblies, one at the upper right andone at the lower left of the photograph. Thermal radiators are attached to the tops ofthe assemblies in flight (not shown in this photograph) to cool the image intensifiersand CCD arrays. The high voltage power supplies for the image intensifiers are locatedto the upper left of the fiber plane. The readout electronics for each camera are in theblack boxes in the upper left of the photograph. Figure 7.1.1-4 provides the CRIS electronics block diagram. 7.1.1.2 Challenges and Solutions The development challenge was in developing custom VLSI and hybrid chips. Thesewere also difficult to manufacture and there were problems with loose wires for thecustom hybrids. The extended Phase B period was very helpful in developing thecustom VLSI. The major risk for CRIS was the new trajectory system. The scintillating optical fiberhodoscope had never flown before on a spacecraft. The electronics and structural/mechanical system were all new. The modularmechanical design of CRIS, made possible in part by the generous mass allocationsavailable on ACE, wherein detectors were part of boards that plugged into a card cage,made working on the instrument far simpler than in past instruments of this type. Theuse of zero-insertion force connectors greatly helped in this regard. One engineeringmodel and one protoflight instrument were built. As a fall-back position, somedescoping could have been done if necessary: at the cost of collecting power, someback detectors or half the detectors could have been eliminated. 7.1.1.3 Complexity Rating Ratings ranged from 4 to 5 for a 4.5 average, essentially categorizing CRIS as a highcomplexity instrument. The reasons for this high rating are a) the new scintillatingoptical fiber technology (SOFT) front-end hodoscope, b) new large-area lithium-driftedstack detectors, and c) new custom hybridized stack read out VLSI.
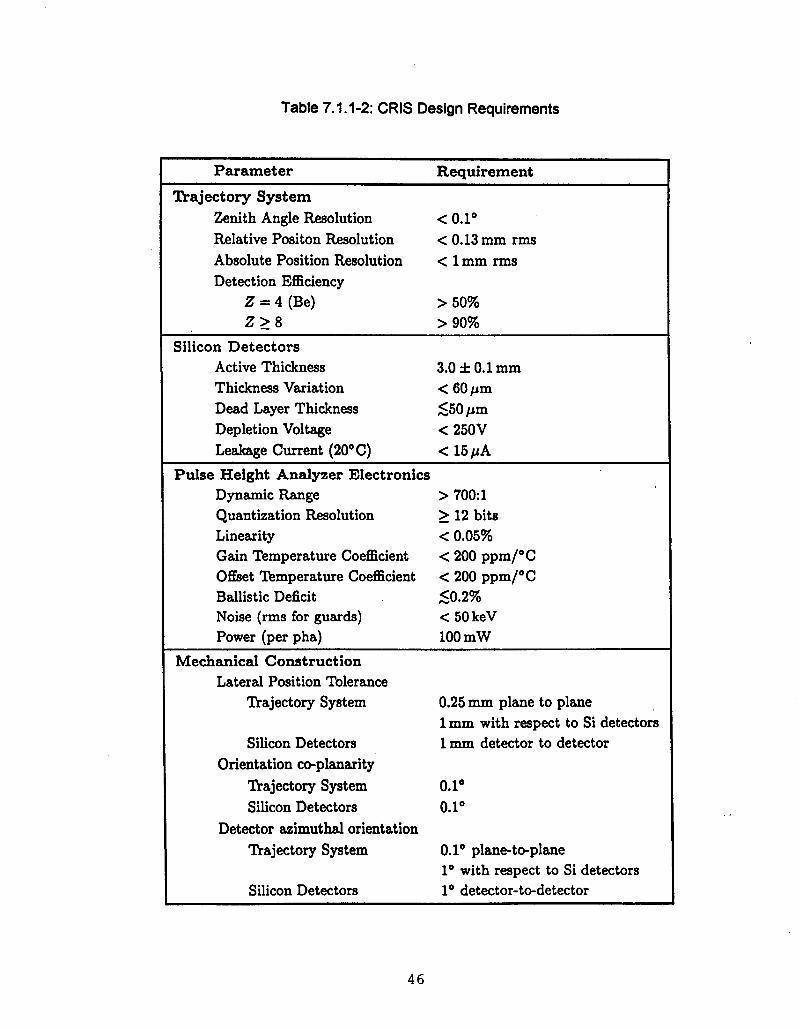
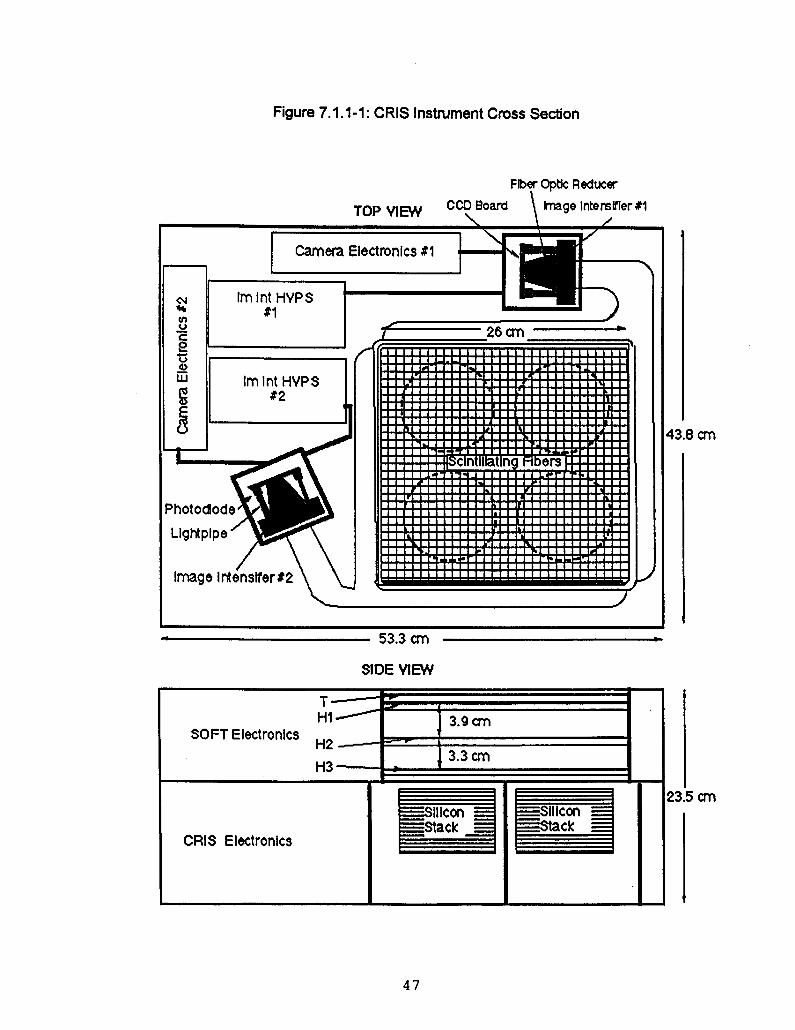
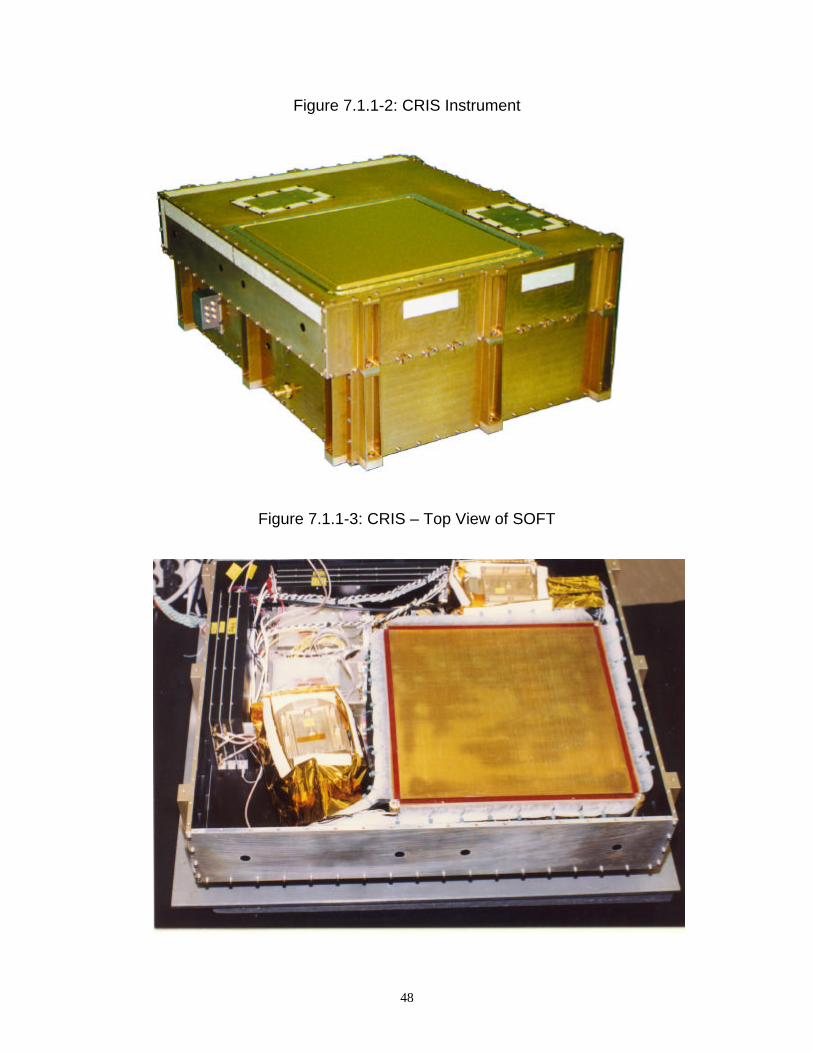
48
Figure 7.1.1-2: CRIS Instrument
Figure 7.1.1-3: CRIS – Top View of SOFT
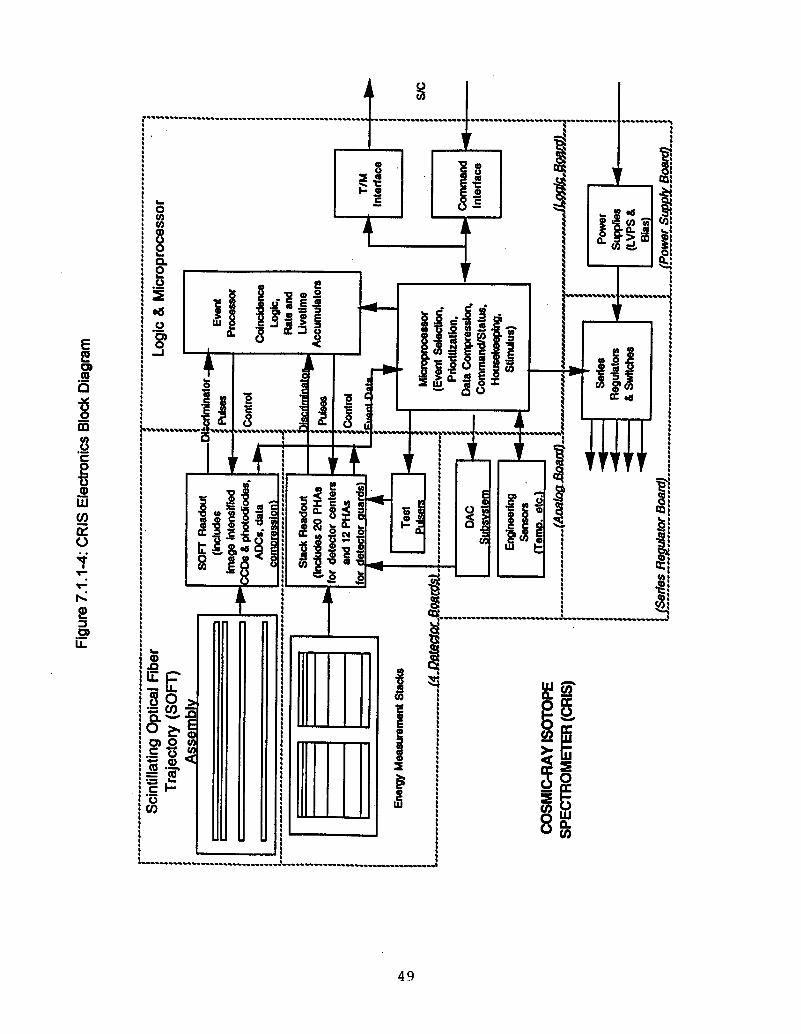
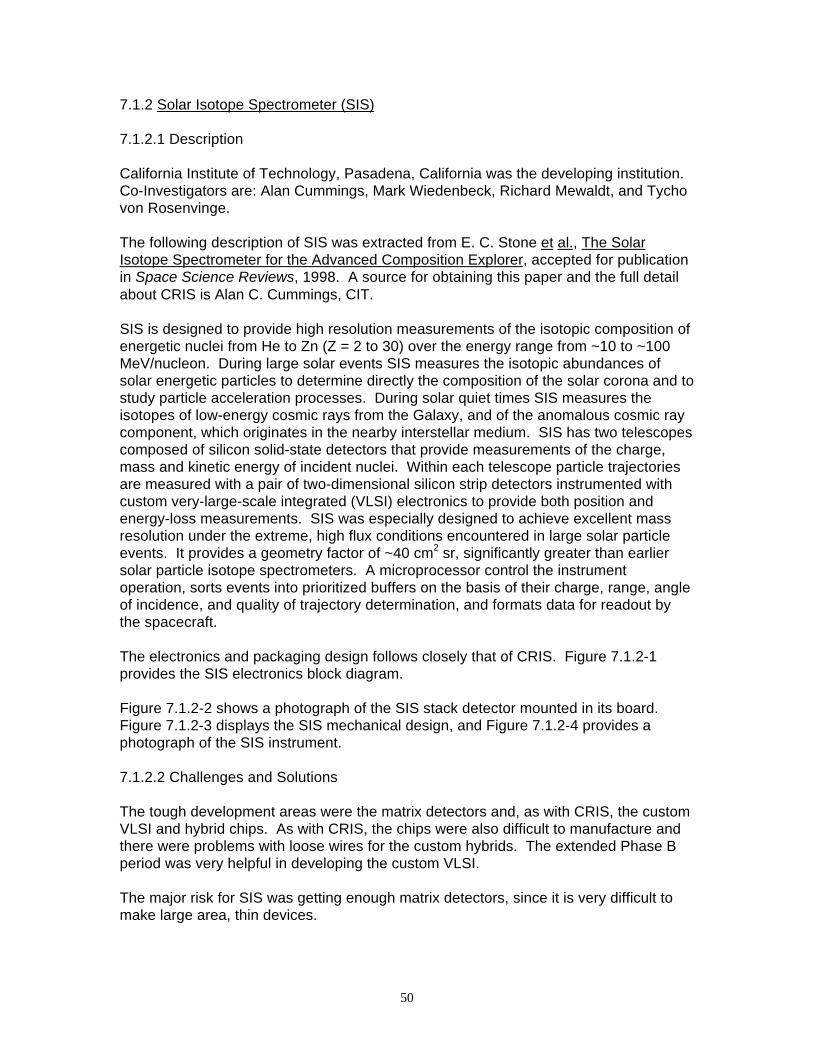
50
7.1.2 Solar Isotope Spectrometer (SIS) 7.1.2.1 Description California Institute of Technology, Pasadena, California was the developing institution.Co-Investigators are: Alan Cummings, Mark Wiedenbeck, Richard Mewaldt, and Tychovon Rosenvinge. The following description of SIS was extracted from E. C. Stone et al., The SolarIsotope Spectrometer for the Advanced Composition Explorer, accepted for publicationin Space Science Reviews, 1998. A source for obtaining this paper and the full detailabout CRIS is Alan C. Cummings, CIT. SIS is designed to provide high resolution measurements of the isotopic composition ofenergetic nuclei from He to Zn (Z = 2 to 30) over the energy range from ~10 to ~100MeV/nucleon. During large solar events SIS measures the isotopic abundances ofsolar energetic particles to determine directly the composition of the solar corona and tostudy particle acceleration processes. During solar quiet times SIS measures theisotopes of low-energy cosmic rays from the Galaxy, and of the anomalous cosmic raycomponent, which originates in the nearby interstellar medium. SIS has two telescopescomposed of silicon solid-state detectors that provide measurements of the charge,mass and kinetic energy of incident nuclei. Within each telescope particle trajectoriesare measured with a pair of two-dimensional silicon strip detectors instrumented withcustom very-large-scale integrated (VLSI) electronics to provide both position andenergy-loss measurements. SIS was especially designed to achieve excellent massresolution under the extreme, high flux conditions encountered in large solar particleevents. It provides a geometry factor of ~40 cm2 sr, significantly greater than earliersolar particle isotope spectrometers. A microprocessor control the instrumentoperation, sorts events into prioritized buffers on the basis of their charge, range, angleof incidence, and quality of trajectory determination, and formats data for readout bythe spacecraft. The electronics and packaging design follows closely that of CRIS. Figure 7.1.2-1provides the SIS electronics block diagram. Figure 7.1.2-2 shows a photograph of the SIS stack detector mounted in its board.Figure 7.1.2-3 displays the SIS mechanical design, and Figure 7.1.2-4 provides aphotograph of the SIS instrument. 7.1.2.2 Challenges and Solutions The tough development areas were the matrix detectors and, as with CRIS, the customVLSI and hybrid chips. As with CRIS, the chips were also difficult to manufacture andthere were problems with loose wires for the custom hybrids. The extended Phase Bperiod was very helpful in developing the custom VLSI. The major risk for SIS was getting enough matrix detectors, since it is very difficult tomake large area, thin devices.
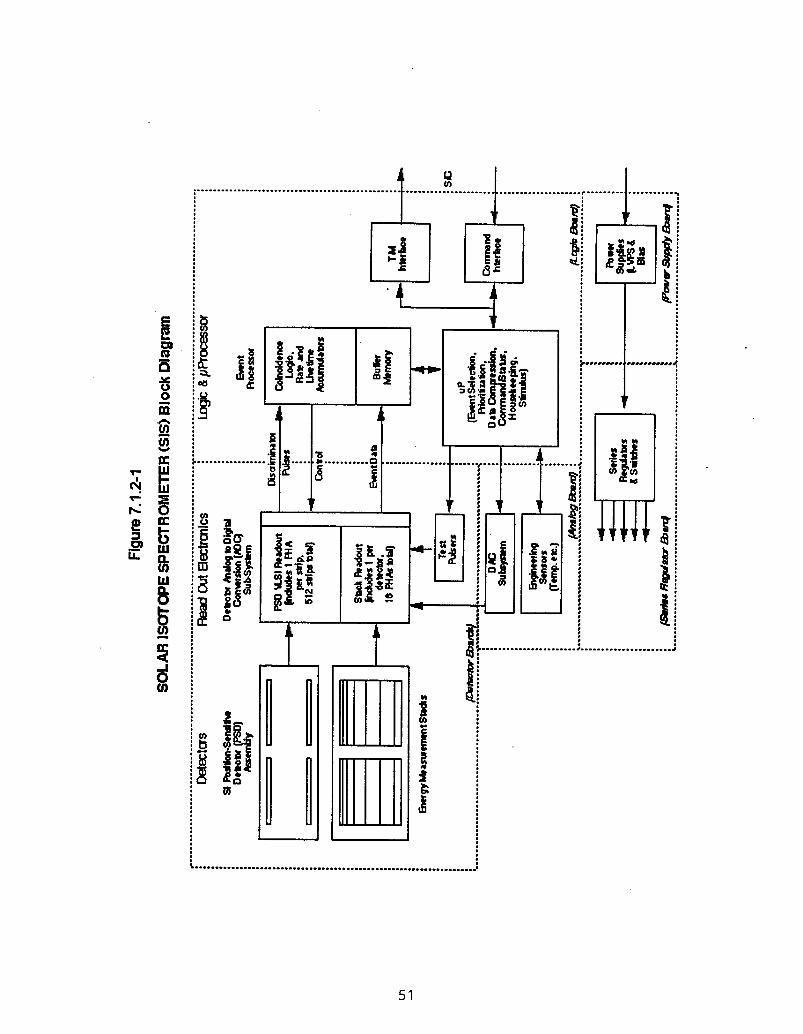
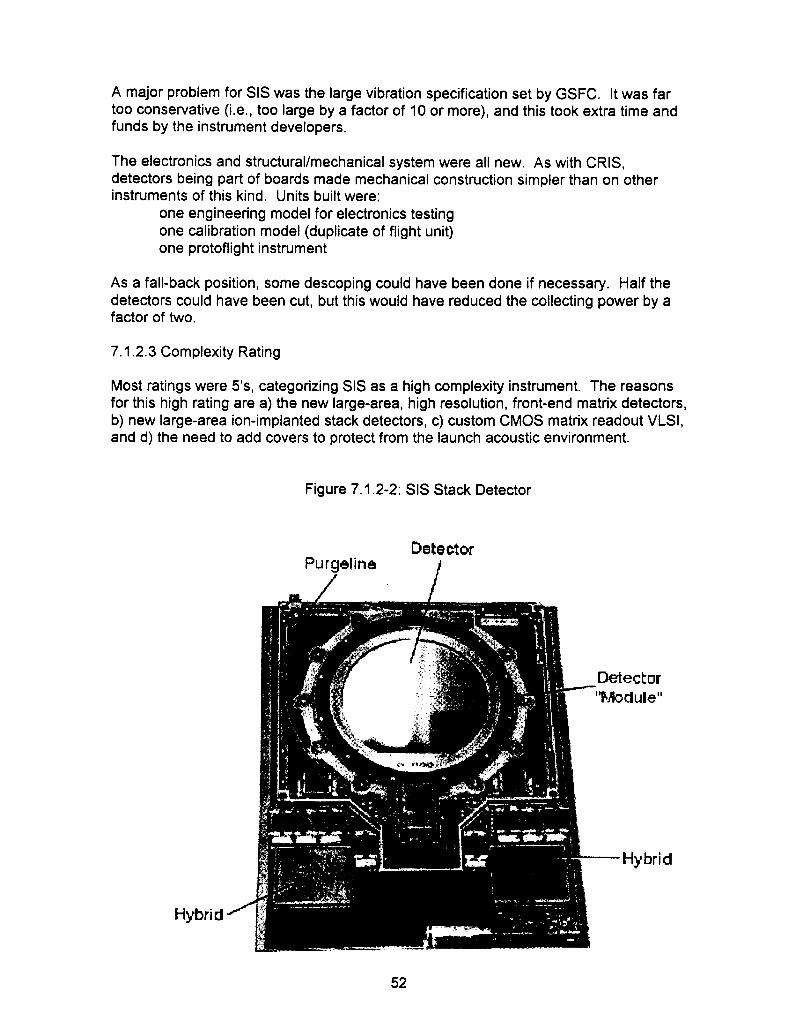
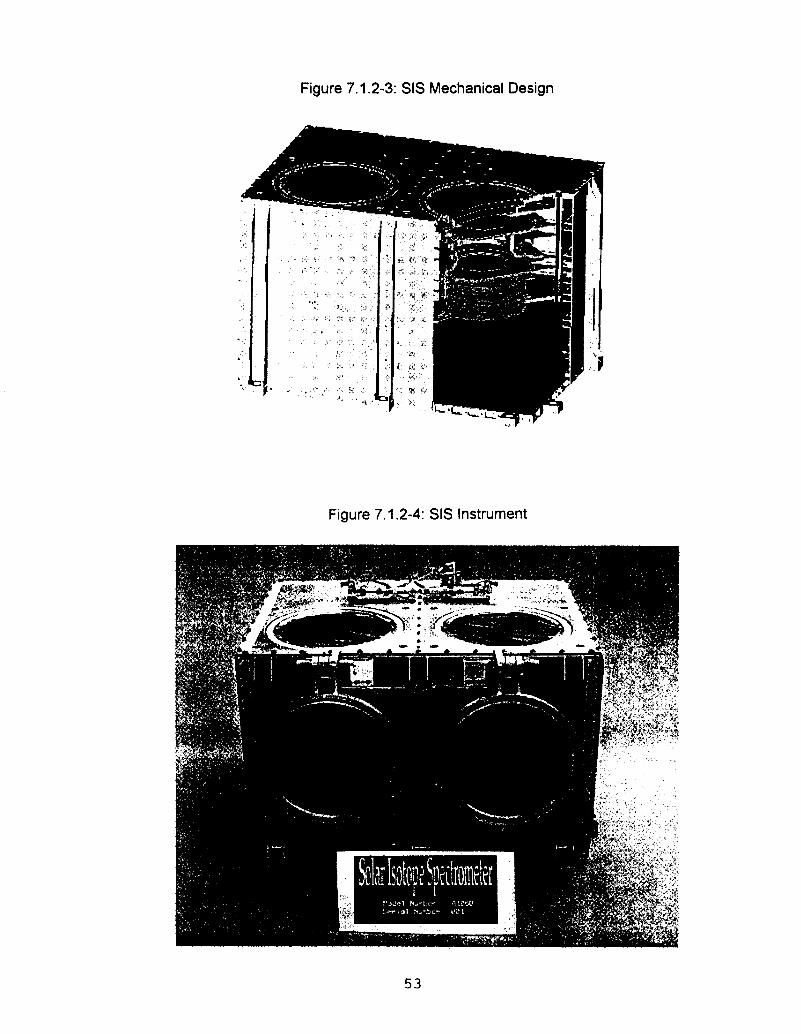
54
7.1.3 Ultra Low Energy Isotope Spectrometer (ULEIS) 7.1.3.1 Description ULEIS was developed by the University of Maryland and the Johns Hopkins University’sApplied Physics Laboratory. Glenn Mason, UMD, is Co-Investigator and Robert Gold,APL, is Lead Investigator. ULEIS measures ion fluxes over the charge range from He through Ni from about 20keV/nucleon to 10 MeV/nucleon. Exploratory measurements of ultra-heavy species(i.e., mass range above Ni) are performed in a more limited energy range near 0.5MeV/nucleon. The ULEIS instrument is composed of three items: the time-of-flight (TOF) telescope,the analog electronics box, and the digital system box (or data processing unit). Thetelescope is mounted on the sunward side of the spacecraft and points at a 30° angleto the spacecraft spin axis. The analog electronics box is located nearby to minimizedetector lead lengths, and the digital electronics box is located within 100 cm of theanalog box. Figure 7.1.3-1 gives the interconnection scheme for the three subsystemsof ULEIS. Figure 7.1.3-2 provides the functional block diagram for the telescope andanalog electronics. Figure 7.1.3-3 shows the prototype instrument. The ULEIS sensor telescope is a time-of-flight mass spectrometer which identifies ionsby measuring the TOF and residual kinetic energy of particles that enter the telescopecone and stop in one of the arrays of silicon solid-state detectors. The TOF isdetermined by START and STOP pulses from microchannel plate (MCP) assembliesthat detect secondary electrons which are emitted from the entrance foil and other foilswithin the telescope when the ion passes through them. Solar UV would cause secondary electron emission from the telescope foil, thusincreasing background. The ULEIS design avoids this by pointing the telescope at 30°to the spin axis, which is approximately the solar direction, and including a sunshadethat prevents sunlight from striking the foil directly. To prevent electronic pile-up during intense flux periods, a mechanical shutter (or iris)slides partially closed under on-board control depending on the START MCP singlescounting rate. This iris can decrease the geometrical factor by a range of about 100:1,thereby making it possible for ULEIS to operate in the most intense events. The irisalso serves as an acoustic cover during launch. All ions triggering the system have their digitized TOF and Si detector energy depositmeasurements processed on-board by a microprocessor. Because of the high eventrates it is not possible to transmit all particle information within available telemetryallocations. Two types of information are thus sent: first, detailed pulse-height-analysis(PHA) data at a rate of about 5 events/second, and second, “species rates”, which aresectored counting rate data derived from the PHA matrices. The species rates coverHe, O, Si, and Fe groups in 15 energy intervals that cover the energy range 20keV/nucleon to 9 MeV/nucleon. These rates are telemetered approximately once perminute.
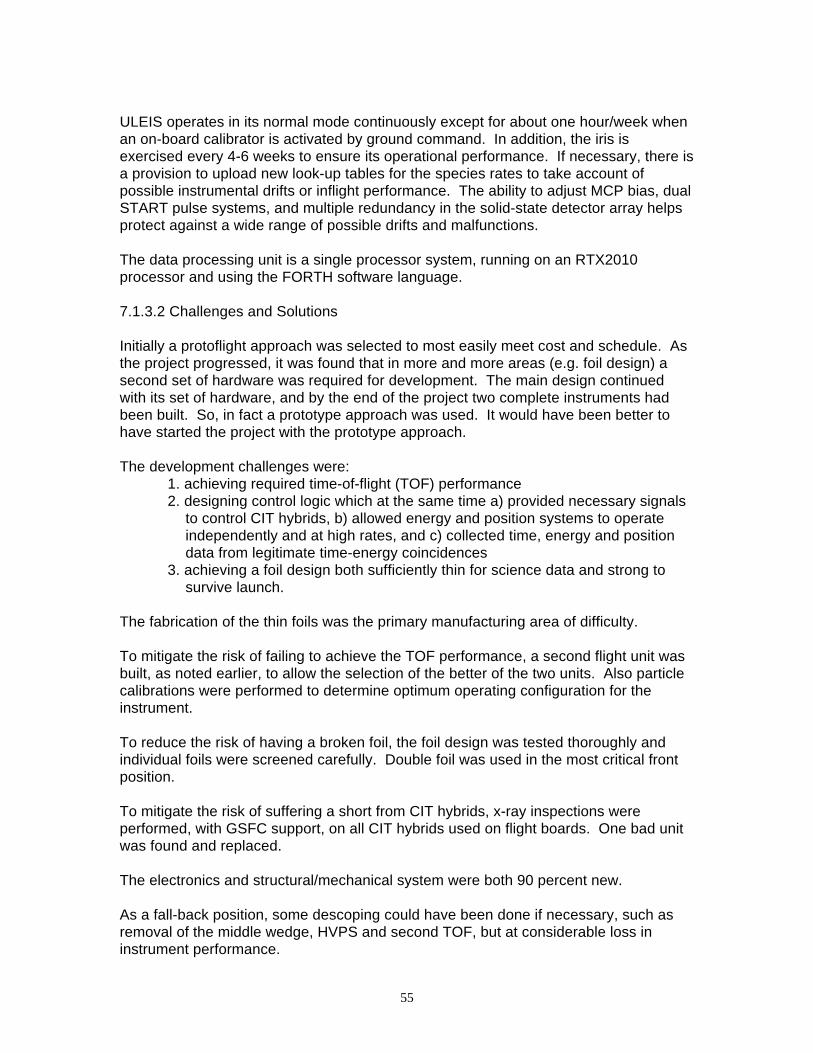
55
ULEIS operates in its normal mode continuously except for about one hour/week whenan on-board calibrator is activated by ground command. In addition, the iris isexercised every 4-6 weeks to ensure its operational performance. If necessary, there isa provision to upload new look-up tables for the species rates to take account ofpossible instrumental drifts or inflight performance. The ability to adjust MCP bias, dualSTART pulse systems, and multiple redundancy in the solid-state detector array helpsprotect against a wide range of possible drifts and malfunctions. The data processing unit is a single processor system, running on an RTX2010processor and using the FORTH software language. 7.1.3.2 Challenges and Solutions Initially a protoflight approach was selected to most easily meet cost and schedule. Asthe project progressed, it was found that in more and more areas (e.g. foil design) asecond set of hardware was required for development. The main design continuedwith its set of hardware, and by the end of the project two complete instruments hadbeen built. So, in fact a prototype approach was used. It would have been better tohave started the project with the prototype approach. The development challenges were: 1. achieving required time-of-flight (TOF) performance 2. designing control logic which at the same time a) provided necessary signals
to control CIT hybrids, b) allowed energy and position systems to operateindependently and at high rates, and c) collected time, energy and positiondata from legitimate time-energy coincidences
3. achieving a foil design both sufficiently thin for science data and strong tosurvive launch.
The fabrication of the thin foils was the primary manufacturing area of difficulty. To mitigate the risk of failing to achieve the TOF performance, a second flight unit wasbuilt, as noted earlier, to allow the selection of the better of the two units. Also particlecalibrations were performed to determine optimum operating configuration for theinstrument. To reduce the risk of having a broken foil, the foil design was tested thoroughly andindividual foils were screened carefully. Double foil was used in the most critical frontposition. To mitigate the risk of suffering a short from CIT hybrids, x-ray inspections wereperformed, with GSFC support, on all CIT hybrids used on flight boards. One bad unitwas found and replaced. The electronics and structural/mechanical system were both 90 percent new. As a fall-back position, some descoping could have been done if necessary, such asremoval of the middle wedge, HVPS and second TOF, but at considerable loss ininstrument performance.
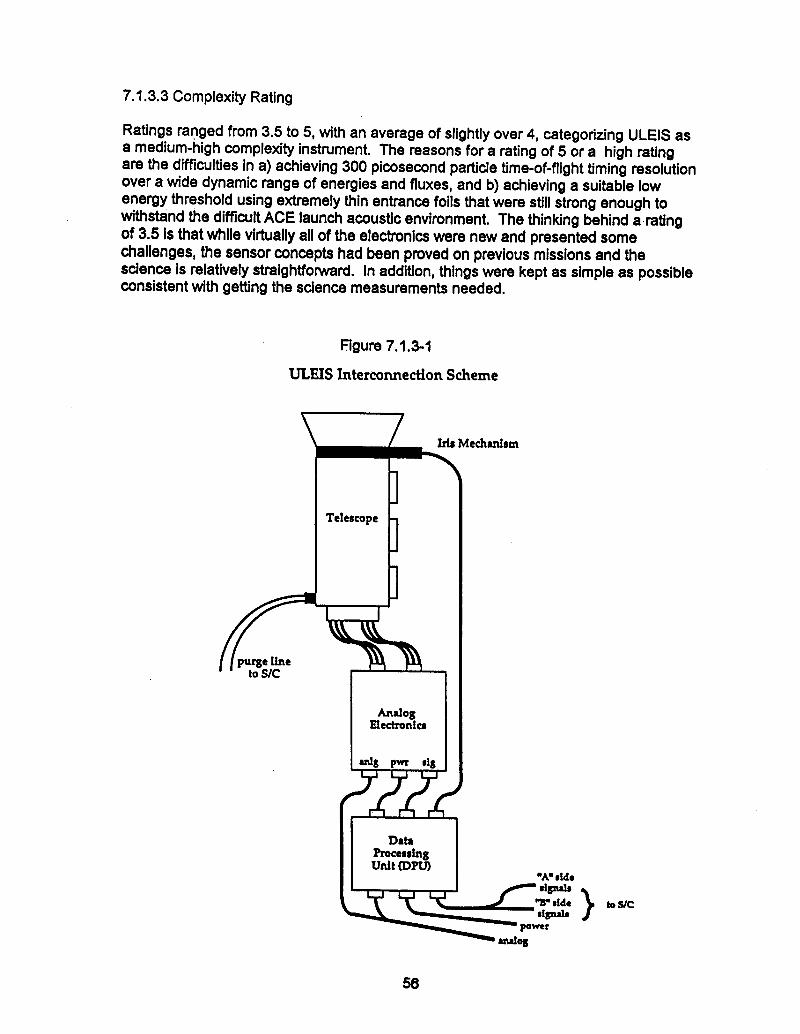
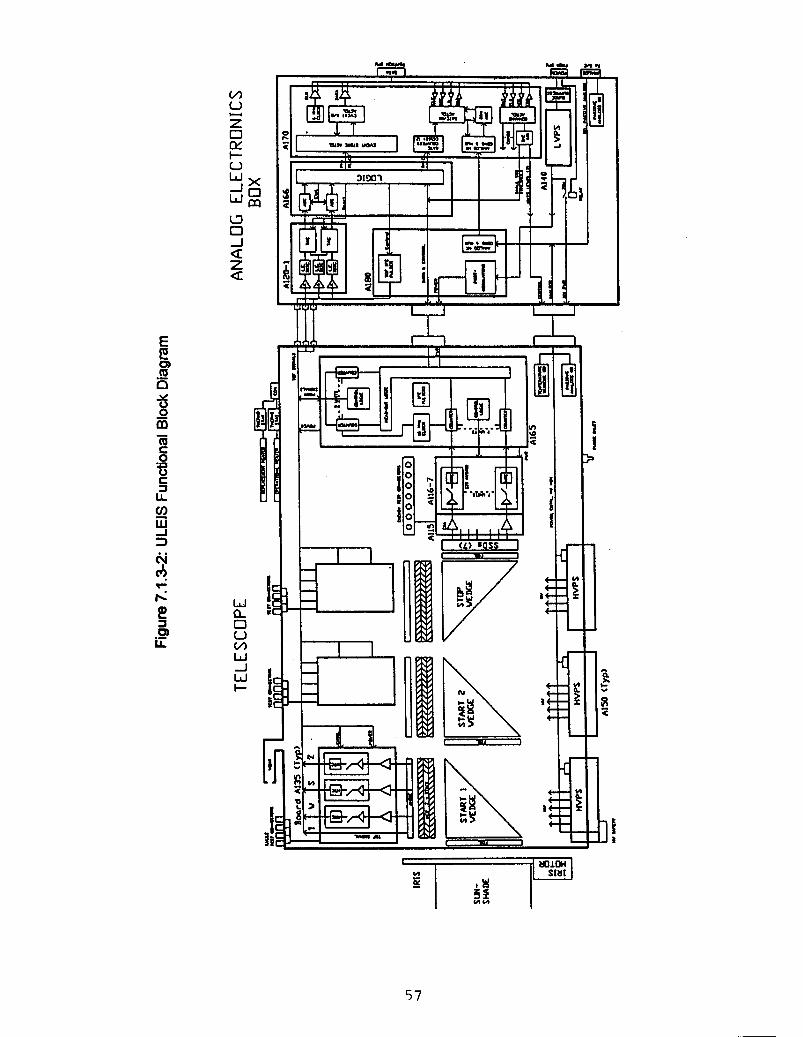
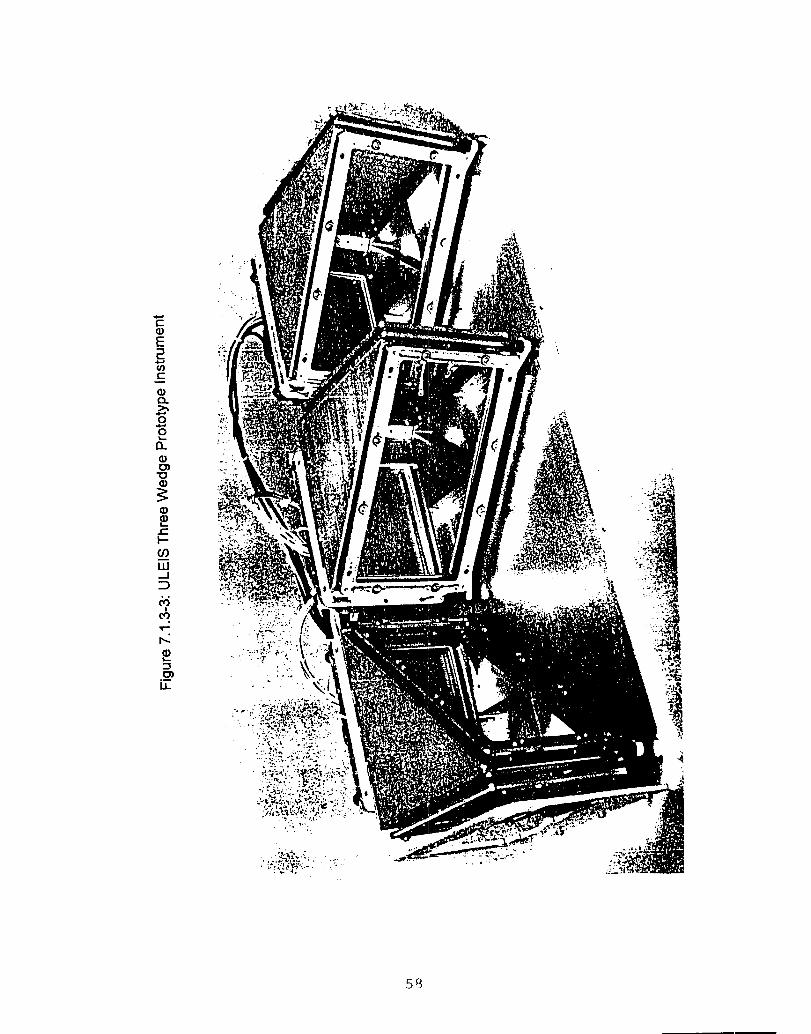
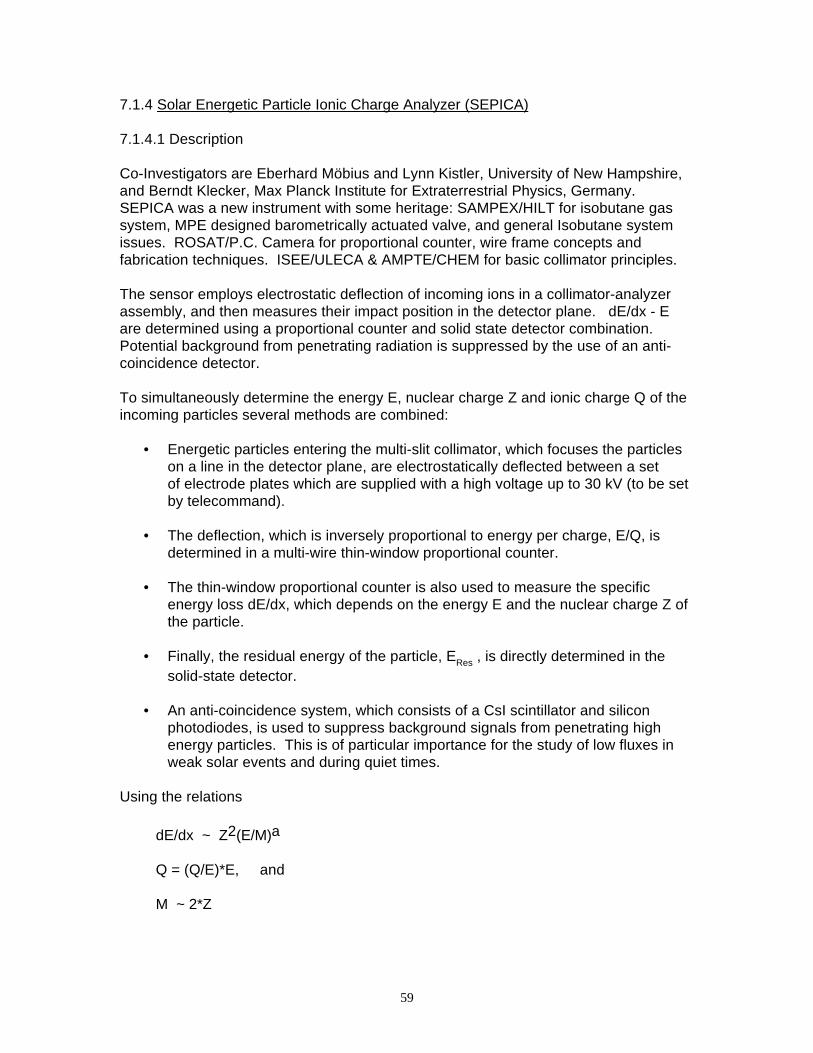
59
7.1.4 Solar Energetic Particle Ionic Charge Analyzer (SEPICA) 7.1.4.1 Description Co-Investigators are Eberhard Möbius and Lynn Kistler, University of New Hampshire,and Berndt Klecker, Max Planck Institute for Extraterrestrial Physics, Germany.SEPICA was a new instrument with some heritage: SAMPEX/HILT for isobutane gassystem, MPE designed barometrically actuated valve, and general Isobutane systemissues. ROSAT/P.C. Camera for proportional counter, wire frame concepts andfabrication techniques. ISEE/ULECA & AMPTE/CHEM for basic collimator principles. The sensor employs electrostatic deflection of incoming ions in a collimator-analyzerassembly, and then measures their impact position in the detector plane. dE/dx - Eare determined using a proportional counter and solid state detector combination.Potential background from penetrating radiation is suppressed by the use of an anti-coincidence detector.
To simultaneously determine the energy E, nuclear charge Z and ionic charge Q of theincoming particles several methods are combined:
• Energetic particles entering the multi-slit collimator, which focuses the particles
on a line in the detector plane, are electrostatically deflected between a set of electrode plates which are supplied with a high voltage up to 30 kV (to be set by telecommand).
• The deflection, which is inversely proportional to energy per charge, E/Q, is
determined in a multi-wire thin-window proportional counter. • The thin-window proportional counter is also used to measure the specific
energy loss dE/dx, which depends on the energy E and the nuclear charge Z of the particle.
• Finally, the residual energy of the particle, ERes , is directly determined in the
solid-state detector. • An anti-coincidence system, which consists of a CsI scintillator and silicon
photodiodes, is used to suppress background signals from penetrating high energy particles. This is of particular importance for the study of low fluxes in weak solar events and during quiet times.
Using the relations
dE/dx ~ Z2(E/M)a
Q = (Q/E)*E, and M ~ 2*Z
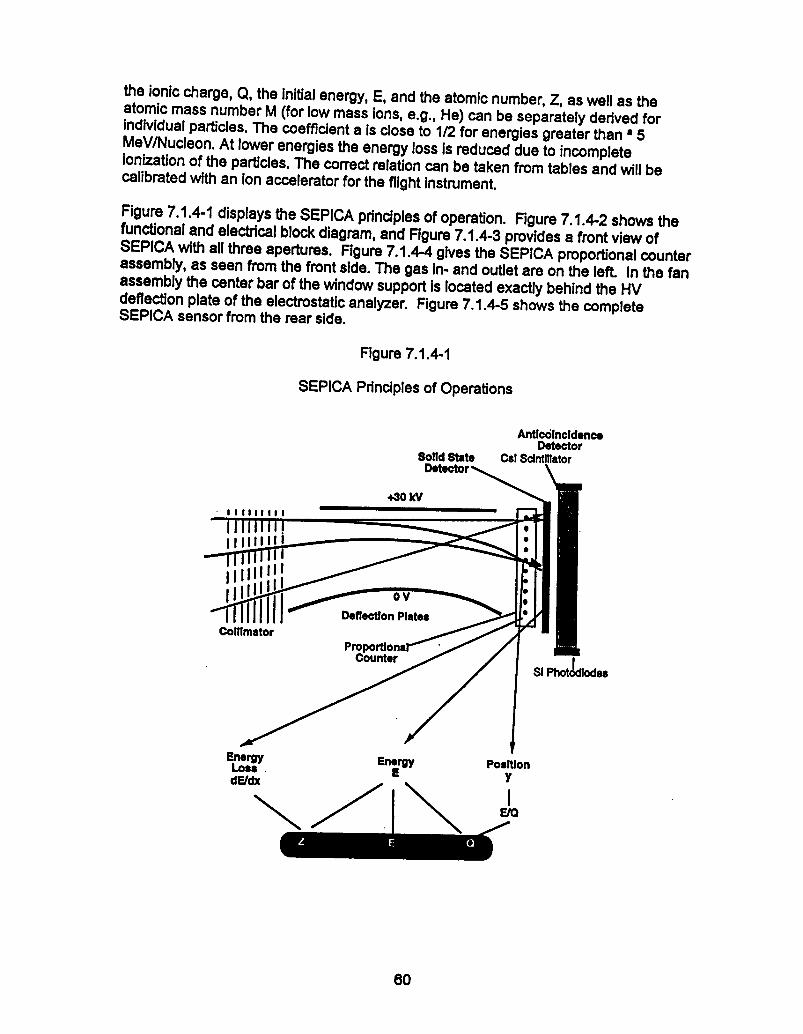

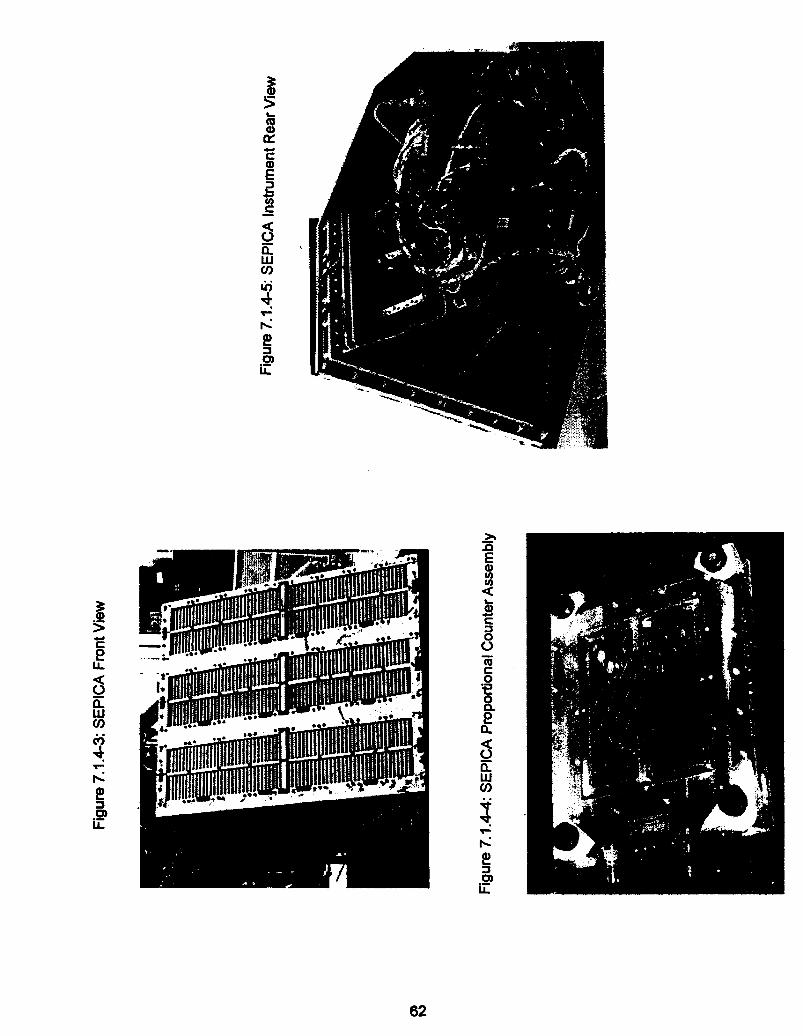
63
7.1.4.2 Challenges and Solutions 1. Development and manufacturing challenges: a) Fabrication of the optical collimator was a true challenge, particularly in the areaprecision wet etching for slit size and location tolerances. The development teamworked closely with Brush-Wellman, Thermal Electron/Tecomet, Northeast EDM,American Electroplating, and the UNH-SSC Machine shop to ensure all aspects of thenear zero alignment collimator assembly would result in adequate plate alignment. Theteam selected a mill hardened, 0.004” thick, Beryllium Copper sheet, alloy XHMS 190,to ensure the plates would hold their shape after etching; developed etch masksdirectly from UNH supplied AutoCad graphics files to avoid interpretation errors; milledand wire EDM’d directly from AutoCad graphics files; worked with the shop to selectand screen the best alignment pins, and developed methods and machining sequenceswhich minimized machine induced tolerance stack-ups. b) Previous gas filled counters put the anode and cathode plates within abulky/structural pressure vessel. With the mass and envelope constraints put onSEPICA, the only way to package the counters was to put the pressure envelope withinthe counter anode and cathode plates and develop a unique “surface trace electricalfeedthru” in the surface of the Macor ceramic plates. O-rings sealed against these flushground traces allowing the integrity of the pressure envelope to be maintained whilepassing the signals to the flight electronics. The inlet and outlet of the pressureenvelope was sealed with 0.5 micron aluminized Mylar film windows, whose supportframes also sealed against the smooth Macor plates with custom o-rings. Critical in thesuccess of this counter design were the following vendors: CMS, Inc., Melrose, MA fortheir contributions to the fabrication of the “surface trace electrical feedthrus,” and LuxelCorp., Friday Harbor, WA for the window assemblies. c) The development of a compact, low power, reliable, autonomous and sensitive gasmetering system, capable of measuring very low absolute pressures and makingconstant corrections to the proportional counter pressures was key to the success ofthis instrument. Previous heritage instruments used systems requiring too much powerand bulk, and with 3 counters present, were not practical for SEPICA. Theidentification, and eventual integration of micro silicon transducers and valvesfabricated by IC Sensors, Milpitas, CA was a tremendous step forward in precision gasmetering. The design of the control electronics by UNH and consulting engineersallowed the feedback loop to work under all flight and test conditions. d) Development of a homespun high voltage supply that could actually work at 30 kVwithout discharging was a painful design and fabrication challenge. Once the supplycascade was found capable of achieving 30 kV, distributing it without dischargedamage was the key to success. The use of high impedance suppression resistors inthe distribution cables became a remarkably successful fix. 2. In terms of Observatory integration, SEPICA was more cumbersome than most dueto it’s relative bulk, high weight of 82.3 pounds, and the presence of the Isobutane gassupply tank. This instrument presented a hazard to personnel, facility and spacecraftsafety, requiring extra-special handling measures and leak check monitoring. The high
64
weight required the use of hoisting equipment, which in turn added to concern aboutthis instrument. 3. There are operating challenges: Gradual increase in the operating voltage, and avoidance of discharges, common to allHV systems, were required with SEPICA. Management of the “autonomous” gasregulation system has proven to be a bit more hands on than expected. Apparently thesilicon micro-valves are either sticking in a slightly open position, or their zero currentstate is closely matching the exchange rate of the counters. Close contact withspacecraft operating personnel was critical to insure setting of pressure alarms toprotect the sensitive P/C windows. The interactive nature of the gas system is anaspect of the instrument that makes it more complicated and unique than others. 4. The primary risk with SEPICA was the presence of the Isobutane gas whichpresented a unique risk to personnel, spacecraft and facility safety. However theimplementation of safety procedures and general high level of awareness ensuredSEPICA was always handled and tested in a safe manner. One incident that almostjeopardized the instrument and facility safety was the handling of the Isobutane withinthe thermal/vacuum chamber testing. Inadvertently, the Teflon GSE lines handling theIsobutane exhaust were left exposed to the chamber LN2 shroud, resulting in cryotrapping (freezing) of the Isobutane during the first such test at GSFC. Gradualwarming of the shroud and bleed off of the gas ensured that no damage was done,however it was very stressful for all involved. In subsequent tests, provisions weremade to ensure the gas lines were safely blanketed from the shroud withthermocouples installed to ensure that constant monitoring of the lines was maintained.The lines were kept above -40c at all times. As an added measure of safety, heatersand thermostats were installed in case an inadvertently cold condition were to exist. 5. SEPICA did not require descoping. If it had been necessary there could have beena reduction in the number of detector fans and respective electronics, but at a seriouscompromising of performance. 7.1.4.3 Complexity Rating SEPICA had a difficulty rating of 5, equating to high complexity. This high complexityresulted from: 1) Achieving the extremely tight machining tolerances needed for fabrication ofentrance collimators. SEPICA pushed the envelope of technology on collimatoraperture tolerances. 2) Achieving the needed tight regulation of low pressure isobutane gas flow.This self-contained Isobutane gas system increased its handling constraints. 3) Achieving satisfactory performance from the newly designed dE/dxproportional counter at the heart of the instrument. 4) SEPICA was a heavy instrument with some intricate assemblies, e.g., SSDs,multiwire frames. A lot of vibration effects analysis was required. Moreover, itcontained two independent high voltage systems.
65
7.1.5 Solar Wind Ion Composition Spectrometer (SWICS) and Solar Wind Ion MassSpectrometer (SWIMS) SWICS and SWIMS are discussed together because they were developedsimultaneously by the same Co-Investigator and development team. The Co-Investigator is George Gloeckler, who is affiliated both with the University of Maryland,College Park, and the University of Michigan, Ann Arbor. 7.1.5.1 Description SWICS uses 4 components to study the mass and isotopic composition of incomingions: a) E/q filtering by electrostatic deflection, b) post-acceleration of the filtered ionsby up to 30 kV, c) TOF measurement, and d) E measurement using ion-implant solid-state detectors (SSDs). Knowing the E/q, E, and TOF, one knows the mass (M) andthe mass per charge (M/q) since E = (M/2)*v 2. SWICS was the flight spare of theUlysses GLG experiment, launched in October 1990. Figure 7.1.5-1 pictures theSWICS instrument. SWIMS uses E/q selection by electrostatic deflection, along with TOF measurement.The nature of the electrostatic field in SWIMS allows mass measurement without theneed for direct E measurement. SWIMS is similar to the MTOF sensor of the CELIASexperiment on the SOHO spacecraft, launched in December of 1995. Figure 7.1.5-2shows the SWIMS instrument. 7.1.5.2 Challenges and Solutions The technology advances for SWICS were accomplished as the Ulysses/GLGexperiment. All that remained for ACE that was the least bit troubling was to develop athermal design that kept the sensitive SSDs below 15C at all times. The SWICS flight spare unit was inherited from the Ulysses project containing asurface coating problem that caused the instrument to produce output data long afteran input test beam was turned off. Significant early work was devoted to solving thisproblem. For reasons of enhancing SWICS’s science return, a high voltagetransformer was redesigned to extend the instrument’s upper operating voltage from 6kilovolts to 10 kilovolts. For SWIMS, by far the biggest challenge was creating a hyperbolic electrode that wouldmaintain a uniform equipotential surface while, at the same time, be as transparent aspossible in order to let the overwhelming number of neutral ions pass through it.Neutrals that do not pass through are liable to reflect onto the Stop microchannel plate(MCP) detector and cause obscuring background counts. A problem with the Helium background encountered early in the SOHO mission led tosignificant redesign of SWIMS’s entrance aperture. Also, the SWIMS redesign addedredundant Start MCPs, and associated power supplies, for co-incidence. The only operational complication was not a surprise at all, and is the fact that the high-voltages of both SWICS and SWIMS must be turned down for spacecraft maneuvers,since the hydrazine fuel used is extremely corrosive to the MCPs used in both sensors.
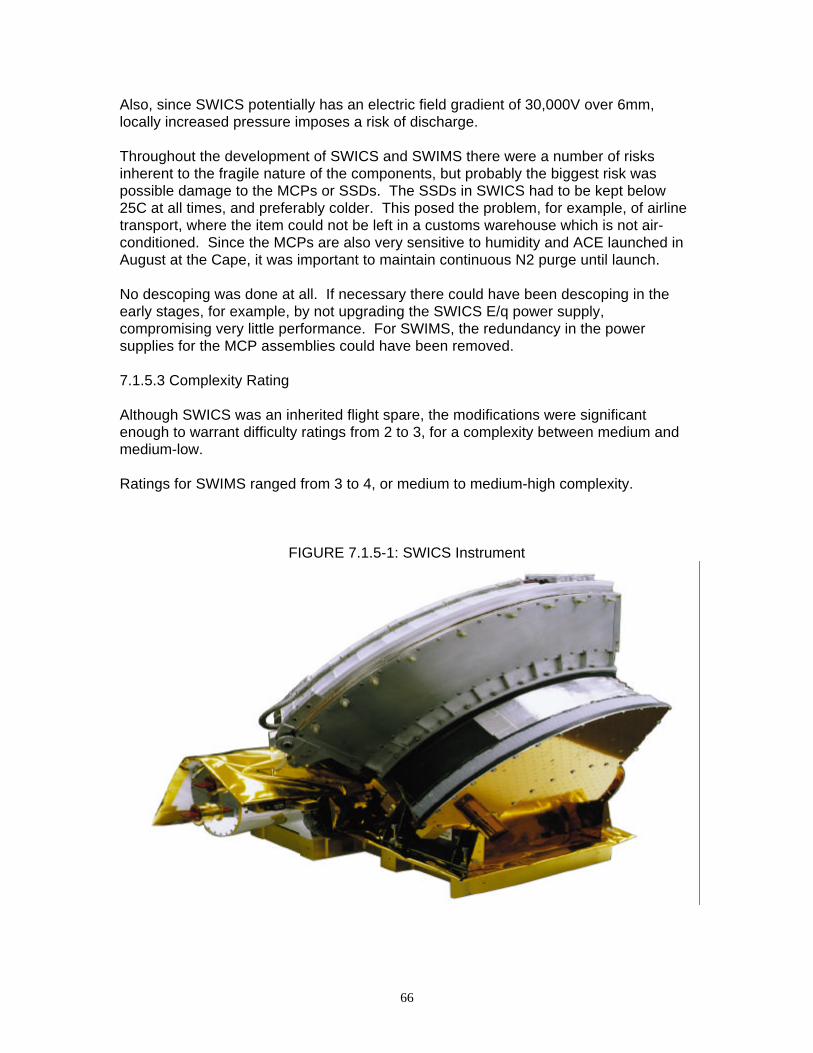
66
Also, since SWICS potentially has an electric field gradient of 30,000V over 6mm,locally increased pressure imposes a risk of discharge. Throughout the development of SWICS and SWIMS there were a number of risksinherent to the fragile nature of the components, but probably the biggest risk waspossible damage to the MCPs or SSDs. The SSDs in SWICS had to be kept below25C at all times, and preferably colder. This posed the problem, for example, of airlinetransport, where the item could not be left in a customs warehouse which is not air-conditioned. Since the MCPs are also very sensitive to humidity and ACE launched inAugust at the Cape, it was important to maintain continuous N2 purge until launch. No descoping was done at all. If necessary there could have been descoping in theearly stages, for example, by not upgrading the SWICS E/q power supply,compromising very little performance. For SWIMS, the redundancy in the powersupplies for the MCP assemblies could have been removed. 7.1.5.3 Complexity Rating Although SWICS was an inherited flight spare, the modifications were significantenough to warrant difficulty ratings from 2 to 3, for a complexity between medium andmedium-low. Ratings for SWIMS ranged from 3 to 4, or medium to medium-high complexity.
FIGURE 7.1.5-1: SWICS Instrument
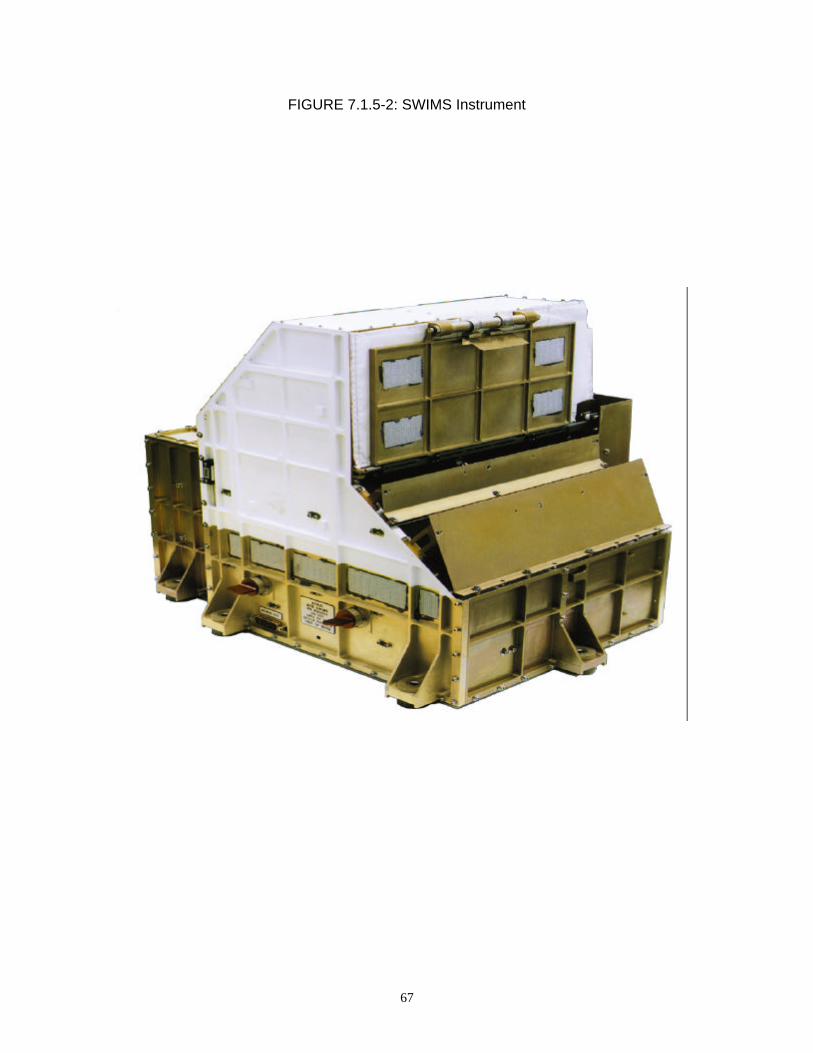
67
FIGURE 7.1.5-2: SWIMS Instrument
68
7.1.6 Electron, Proton and Alpha Monitor (EPAM) 7.1.6.1 Description EPAM was built by the APL. Robert Gold is the Co-Investigator. EPAM is the flightspare of the HI-SCALE instrument (also known as LAN) from the Ulysses spacecraft. EPAM uses low energy solar particle fluxes as probes of the morphological changes ofcoronal and large-scale interplanetary magnetic field structures. EPAM alsoinvestigates solar flare processes using non-relativistic and relativistic electrons. Also,it provides insight into particle energization in interplanetary space. The EPAM development effort consisted of reconstituting EPAM from a fully qualifiedand recently checked flight spare instrument, moving the sensors from the HI-SCALEelectronics box to a separate pedestal, designing a reasonably straightforwardspacecraft command and telemetry interface adapter, and revising the GSE to meetACE interfaces. EPAM consists of five apertures in two telescope assemblies mounted by means of twostub arms and a box containing all of the instrument electronics. The instrument isshown in Figure 7.1.6-1. It measures ions (Ei > 50 keV) and electrons (Ee > 30 keV)with essentially complete pitch angle coverage from the spinning ACE spacecraft. Italso has an ion elemental abundance aperture using the ∆E vs. E technique in a three-element telescope. The detectors form three distinct silicon solid-state detectorsystems. These are Low Energy Magnetic Spectrometers (LEMS), Low Energy FoilSpectrometers (LEFS) and the Composition Aperture (CA). The LEMS/LEFS systemsprovide pulse-height-analyzed single-detector measurements with activeanticoincidence. The CA provides elemental composition in an energy range similar tothose of LEMS/LEFS, and provides 3He/ 4He isotope resolution for identifying 3He-richevents. The five separate detector systems are contained within two mechanical structures, asshown in Figure 7.1.6-2. The individual telescopes are referred to as LEFS 60, LEFS150, LEMS 30, LEMS 120, and CA 60, where the number indicates the inclination ofthe telescope axis with respect to the spacecraft spin axis. The MF, M’F’ and BCdetector pairs are identical for ease of replacement. Each consists of two 200 µmsilicon surface barrier detectors. The D detector is a thin (5 µm) silicon detector of theepitaxial type. An overall schematic block diagram of the EPAM electronics system is shown in Figure7.1.6-3. The detector signals are fed to charge-sensitive preamplifiers, linear shapingamplifiers, and then to discriminators. The analog electronics are largely of hybridconstruction. In addition to the preamplifier, amplifier and discriminator circuits, thesehybrids include logarithmic amplifiers, accumulators, one-shots, peak detectors, powercontrollers, and modules required for the pulse-height-analyzer system. EPAM has a dedicated processor. The instrument is under the overall control of aradiation-hardened microprocessor and its associated peripheral devices. The systemuses 6K ROM and 3K RAM memory. Provision is made for recovery after a partial
69
failure by loading a block of program steps into RAM and then setting this block into thenormal program execution sequence. The science data are collected over a cycle often spacecraft spins (~120 s) and output to the spacecraft, time synchronized with themajor and minor spacecraft frame counters. Since some of the EPAM interface signalswere unique to the Ulysses spacecraft, a small adapter box was added to ensurecompatibility with the ACE command and data handling system formats. 7.1.6.2 Challenges and Solutions Although the development effort consisted of modifications to an existing flight unit,there were some challenges: 1) Relocation of this Ulysses flight spare instrument’s sensors to meet the ACE sciencerequirements, while avoiding the need for new preamplifiers, was a challenge.Eventually it was met by combining the sensor brackets with those used for mountingthe spacecraft digital sun sensors, 2) A special command and data interface box had to be built for accommodation withthe spacecraft, and 3) One of the old Ulysses flight detectors failed during testing and had to be replaced. 7.1.6.3 Complexity Rating The ratings for difficulty ranged from 1 to 3, or from easy to average. This gives anaverage of medium-low complexity.
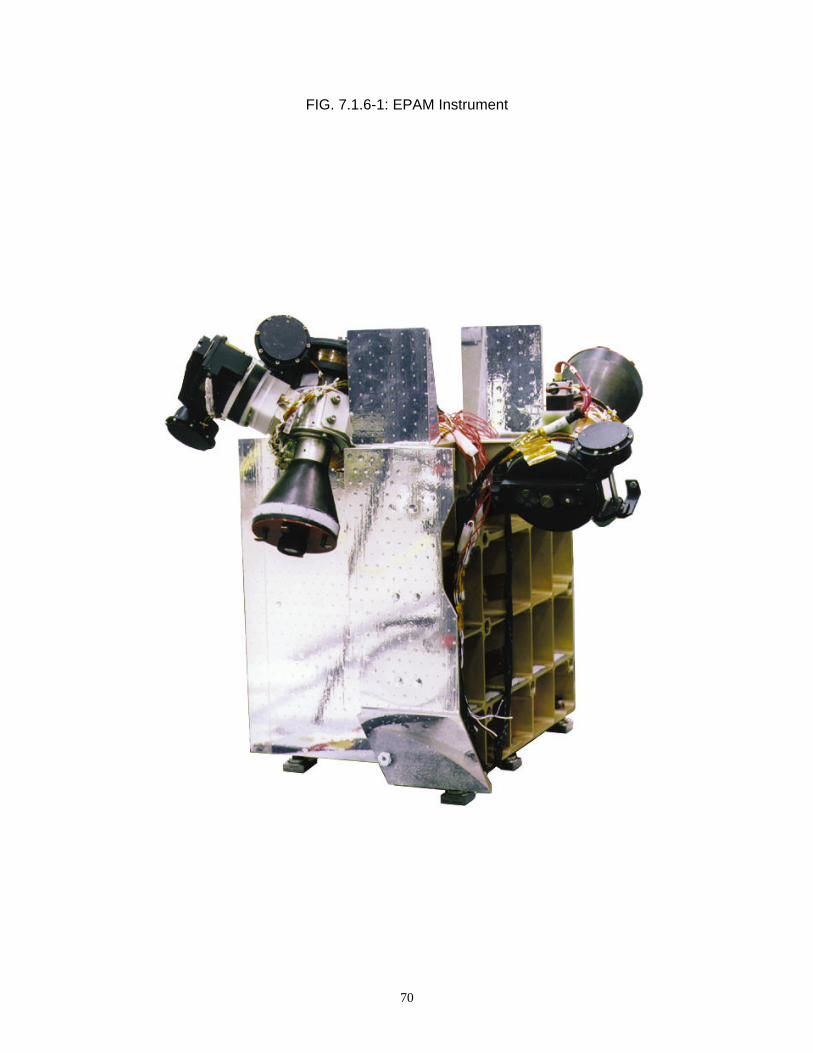
70
FIG. 7.1.6-1: EPAM Instrument
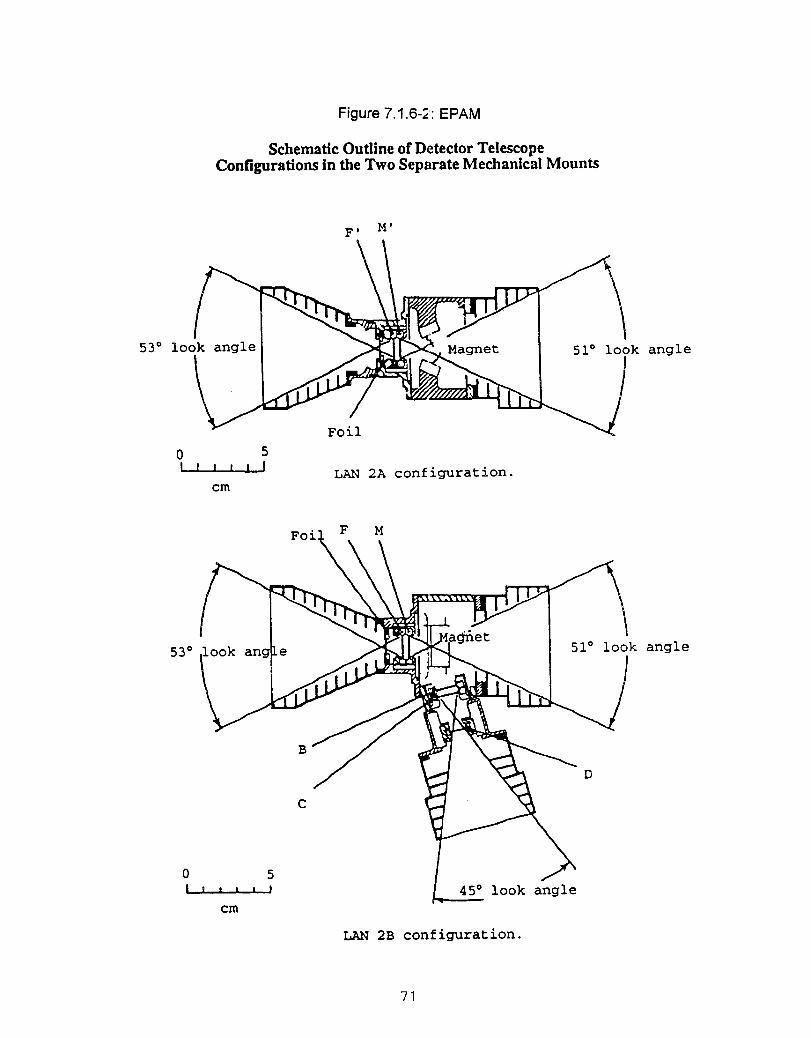
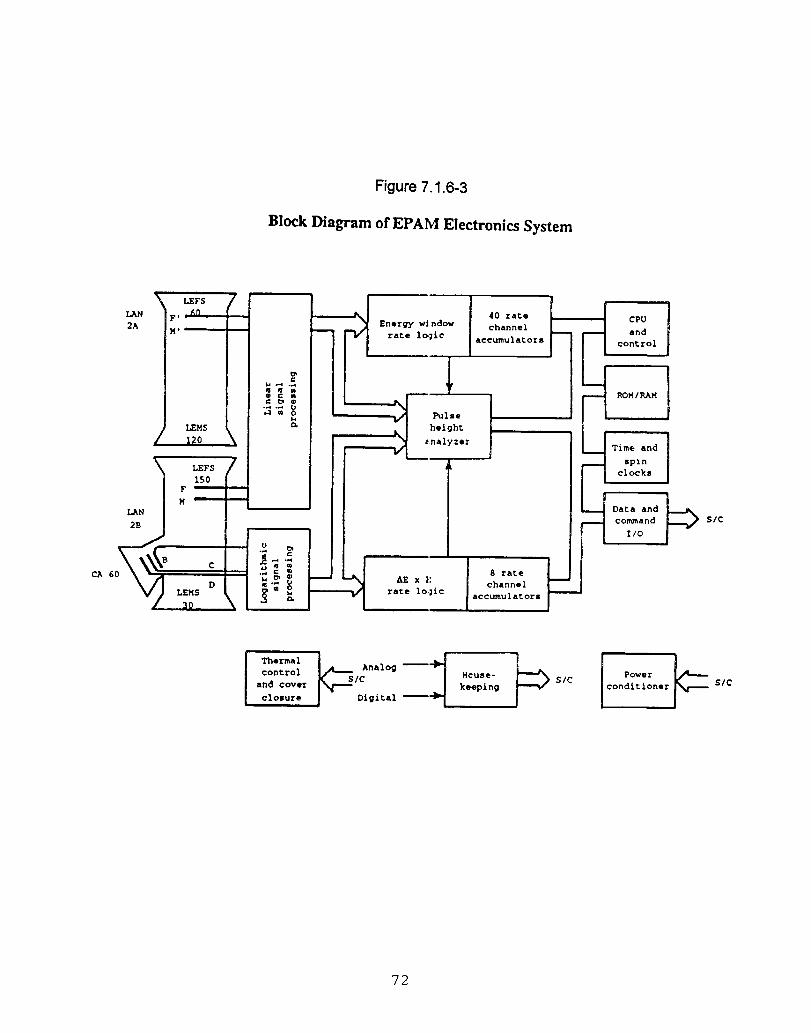
73
7.1.7 Solar Wind Electron, Proton and Alpha Monitor (SWEPAM) 7.1.7.1 Description The SWEPAM Co-Investigators are D. J. McComas and W. C. Feldman of the LosAlamos National Laboratory.
SWEPAM will provide detailed knowledge of solar wind conditions. It provides highquality measurements of electron and ion fluxes in the low-energy solar wind range(electrons: ~1 to ~1450 eV; ions: ~0.26 to 35 kV). SWEPAM is a plasma analyzer andconsists of two instruments, SWEPAM-I for ion measurements and SWEPAM-E forelectron measurements. A curved plate electrostatic analyzer (ESA) is followed bychannel electron multiplier (CEM) detectors. The multiple CEMs provide spatialsampling in elevation while the spacecraft spin provides spatial sampling in azimuth. Amicroprocessor controls ESA high voltage supply, data acquisition, and command anddata handling.
The two SWEPAM instruments are the Ulysses BAM-I and BAM-E flight spareinstruments, adapted for ACE requirements: 1 Astronomical Unit (AU) instead of theUlysses 5 AUs, foregoing the Ulysses data processing unit, separating the two sensorheads into separate autonomous units, and adding smart interfaces to each. Thebreadboards, prototypes and spare parts were transferred along with the flight spareinstruments from the Ulysses project to the ACE project. Figure 7.1.7-1 providesmostly a front view of SWEPAM, and Figure 7.1.7-2 gives a side view. 7.1.7.2 Challenges and Solutions Although the technology developments had been accomplished for Ulysses, there wereareas new to the SWEPAM development team:
1.) Space electronics design implementation in Field Programmable Gate Arrays (FPGAs) using VHDL.
2.) Force limited vibration testing to avoid excessive loads on the heritage SWEPAM hardware.
In terms of manufacturing areas of difficulty, retrofitting the instruments with minimumimpacts to the heritage hardware, having few flight spare parts, and with a tightlyconstrained budget presented challenges.
The ACE project permitted printed wiring board fabrication to the MIL-P-55110Drequirements with product acceptance contingent upon an acceptance inspection byGSFC. The differences between MIL-P-55110D acceptance inspection processes andthe GSFC acceptance inspection processes resulted in conflicts. The instrument teambelieves MIL-P-55110D to be good manufacturing specifications for ACE-like missions,but in the future this potential area of conflict needs to be addressed in a way tominimize impacts to schedules, costs and supplier relations.
In terms of Observatory integration, the most difficult interface task was identifying andprocuring an electrically conductive multi-layer insulation (MLI) blanket which satisfiedthe instrument requirements for spacecraft charging control while at the same timemeeting Observatory thermal, contamination and magnetic control requirements. Theresolution was an Indium Tin Oxide (ITO) coated beta cloth. The final flight blanket was
74
installed late in the integration to preclude degradation in the coating integrity byhandling of the blanket during Observatory I&T.
To minimize impacts to the heritage hardware, work-arounds had to be found for a fewstandard interface control and performance assurance issues in order to control costswhile maintaining acceptable risk exposure. The lack of flight spares for many of theflight critical items was an additional driver. In general, all parties on ACE worked thesekind of issues with good professional attitudes. These issues include:
• EMC waivers for conducted emissions and turn-on transients.
• Reduction of test exposure levels to minimum safe levels.
• High voltage operation and contamination control constraints to precludedamage to both sensors and supplies for which there were no spares.
• Use of a thermally coupled interface for which the heritage hardware hadbeen designed when the ICD preference was for isolated interfaces.
There were problems with the project-provided spacecraft simulators. Nevertheless,the ACE project’s decision to provide each instrument team with a standard spacecraftsimulator was a good one. Part of the problem on ACE was that the use of thestandard was optional, which diluted user review of the simulator design and may havecaused follow-up support to suffer.
In terms of descoping possibilities, if needed, the only descoping that could have takenplace was to forgo the retrofit of the processing electronics. Besides complicating theadaptation of the instrument to the ACE spacecraft interface, this would have severelycompromised the instrument performance. 7.1.7.3 Complexity Rating Although the SWEPAM instruments started as inherited flight spares, the extensivemodifications kept the level of difficulty at the 3 rating, or medium complexity.
76
7.1.8 Magnetic Field Monitor (MAG) 7.1.8.1 Description MAG was developed by Bartol Research Institute, the University of Delaware andGSFC. The Co-Investigator is Norman Ness. MAG is the reconditioned flight spare ofthe WIND/MFI experiment. The instrument consists of a pair of twin, wide-range (+/- 0.001 to +/- 65,536 nT) triaxialfluxgate magnetometers mounted on two deployable titanium booms. Both sensors aredeployed 165 inches (or 4.19 meters) from the center of the spacecraft (along the +/-Yaxes) on opposing solar panels. The electronics and digital processing unit aremounted on the top deck of the spacecraft. The two triaxial sensors provide abalanced, fully redundant vector instrument and permit some enhanced assessment ofthe spacecraft’s magnetic field. The instrument provides data for Browse and high-level products with 3 to 6 vector s-1 resolution for continuous coverage of theinterplanetary magnetic field. Two high-resolution snapshot buffers each hold 297seconds of 24 vector s-1 data while on-board Fast Fourier Transforms extend thecontinuous data to 12 Hz resolution. Real-time observations with one secondresolution are provided continuously to the Space Environmental Center of the NOAAfor near-instantaneous, world-wide dissemination in service to weather studies. Highinstrument reliability is obtained by the use of fully redundant systems and conservativedesigns. Table 7.1.8-1 summarizes the principal characteristics of MAG, and Figure 7.1.8-1provides a block diagram. Each sensor assembly consists of an orthogonal triaxialarrangement of ring-core fluxgate sensors plus additional elements required forautonomous thermal control. The fluxgate sensors are the latest in a series developedfor weak magnetic field measurements. Figure 7.1.8-1 provides a schematic ofstandard fluxgate operation. 7.1.8.2 Challenges and Solutions Through clever modification of interface circuitry internal to the WIND flight sparemagnetometer, it became possible to adapt this unit to the ACE spacecraft withoutusing a separate adapter box at first envisaged. However, cramming more circuitry intothe MAG electronic box led to a vibration-induced problem caused by transformerinsulation wearing through and shorting. An appropriate remedy was identified andimplemented, A misunderstanding of the sensor mechanical mounting interfaces caused the polarityof two axes to be inverted on both sensor assemblies. Changing the polarity of thesetwo axes within the instrument rectified the situation. Since most of the hardware had been previously tested for the WIND instrument,several environmental tests could not be performed at the ACE stated level or had tobe performed at a lower to prevent over-stressing of the hardware. This led to severalwaivers. No failures occurred.
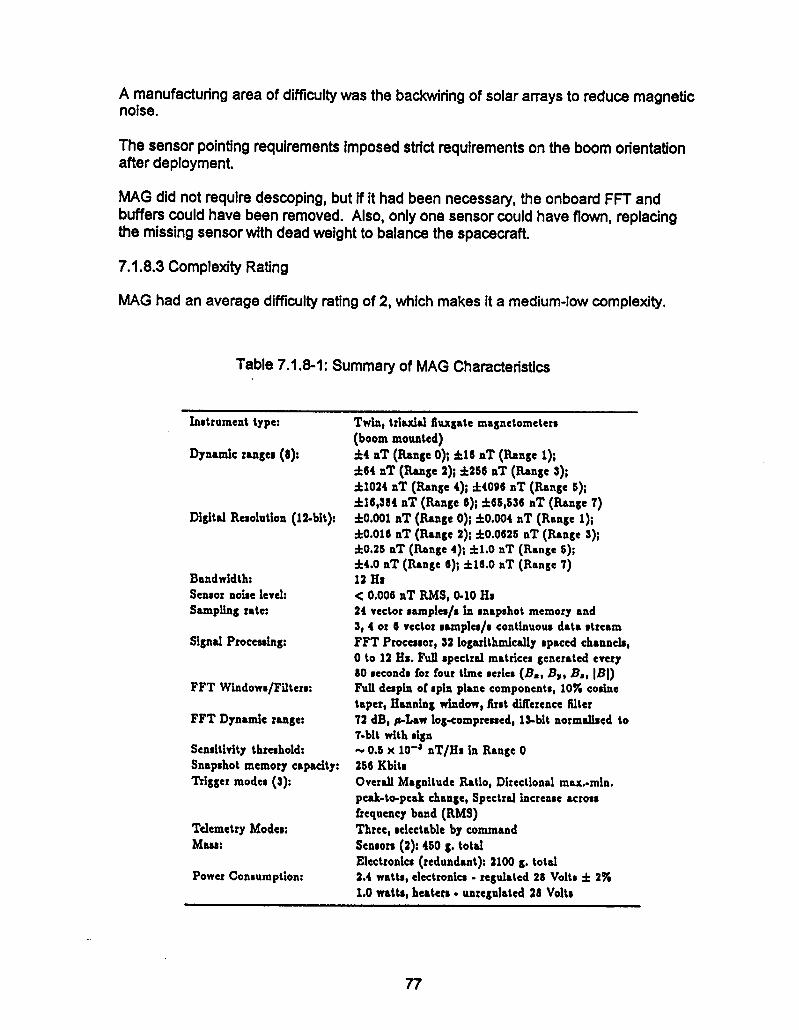
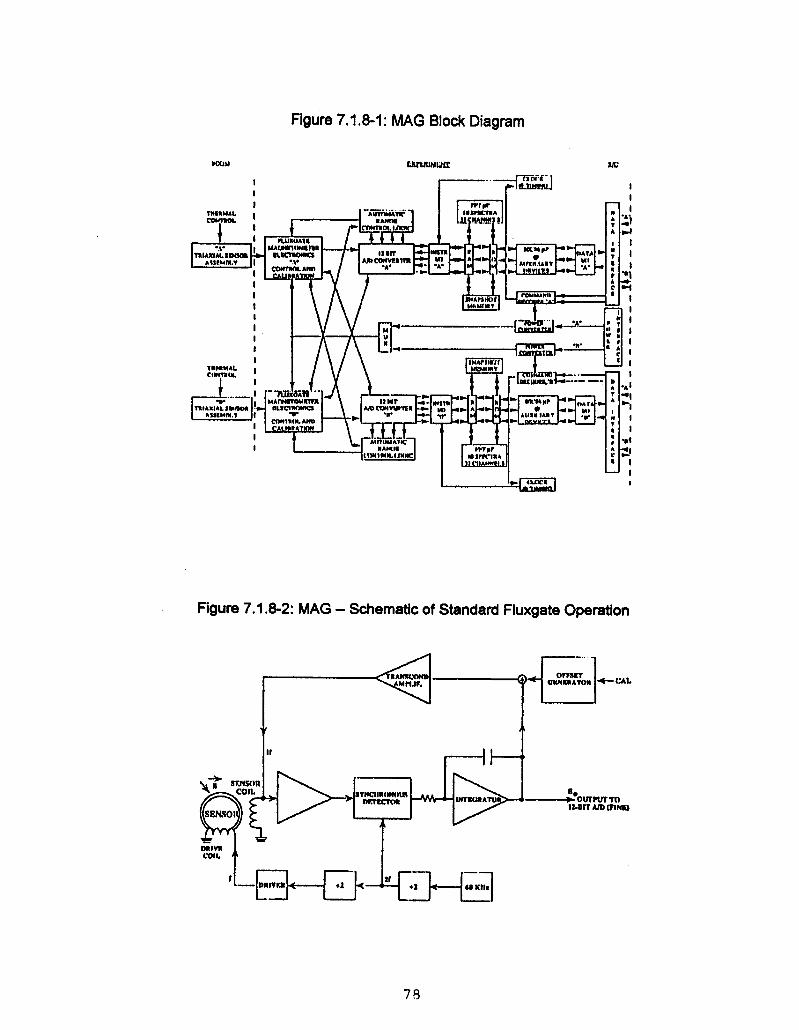
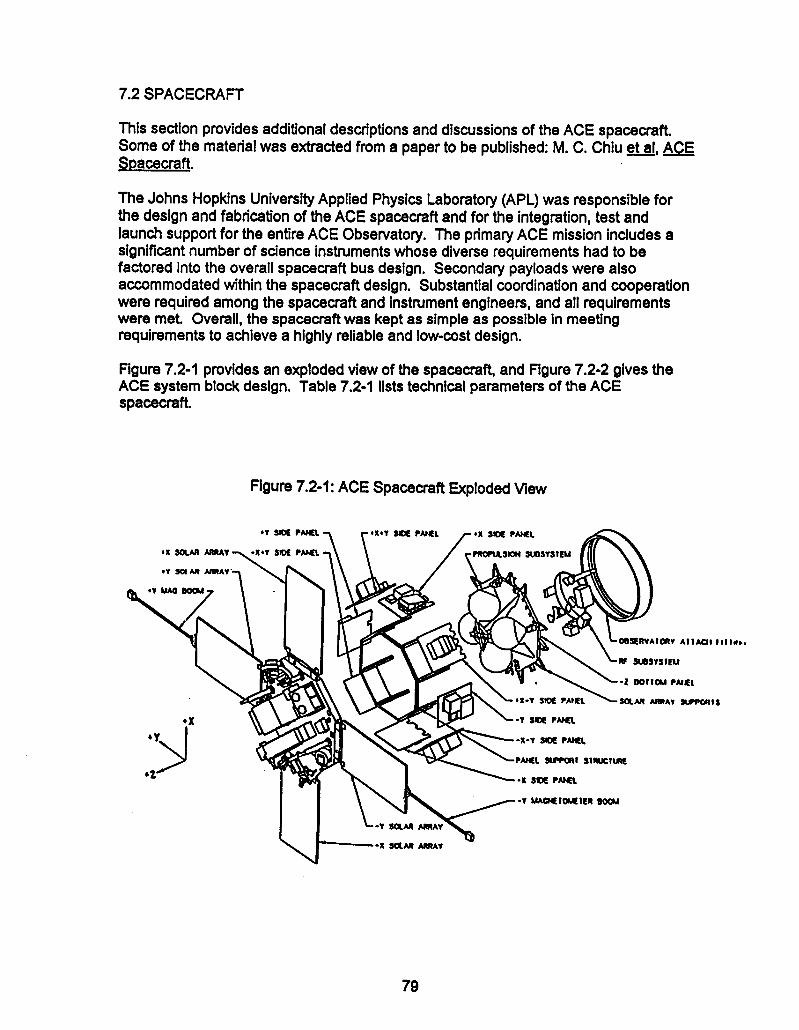
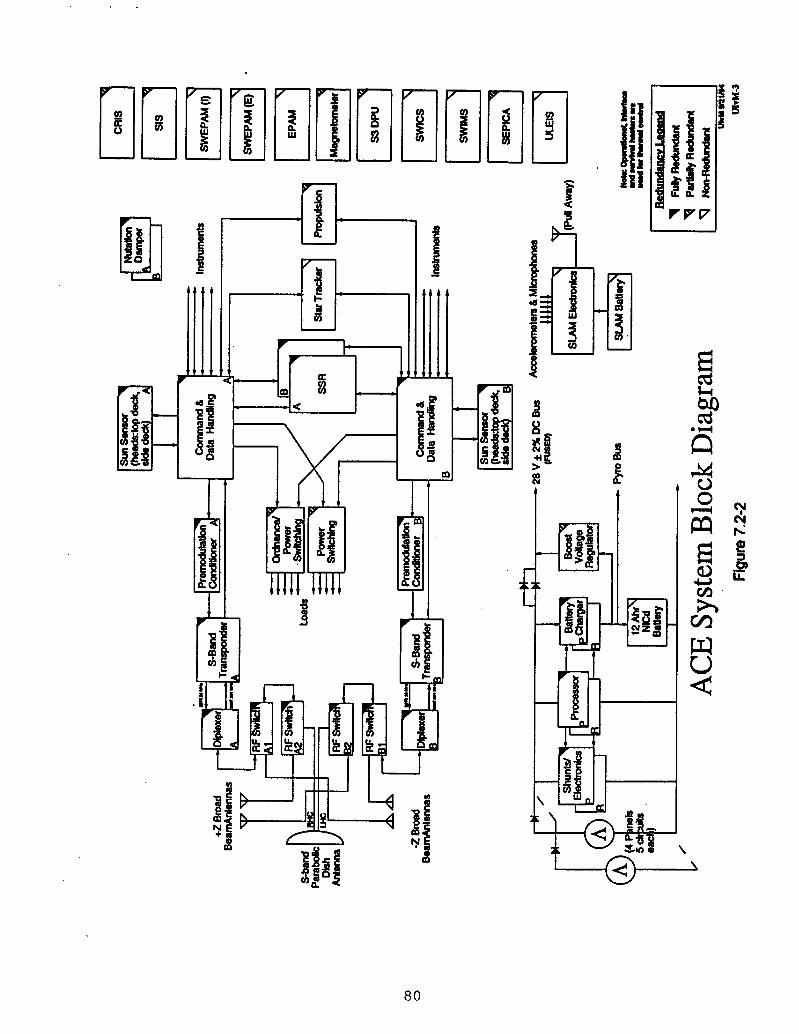
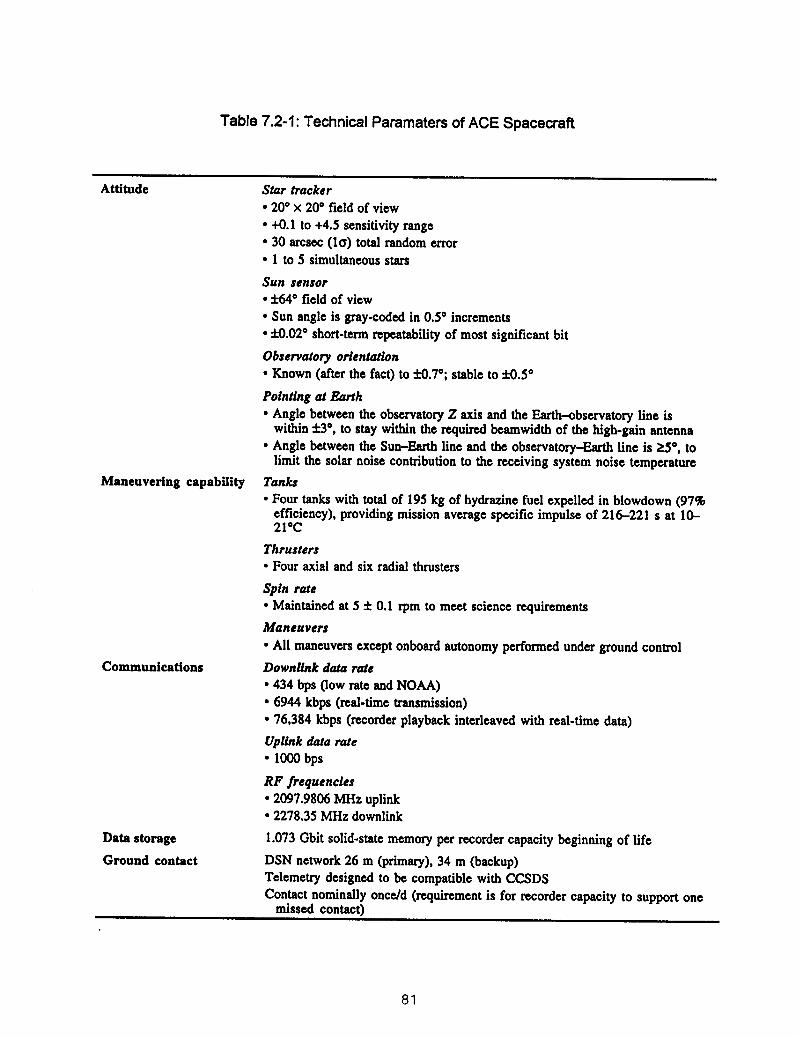
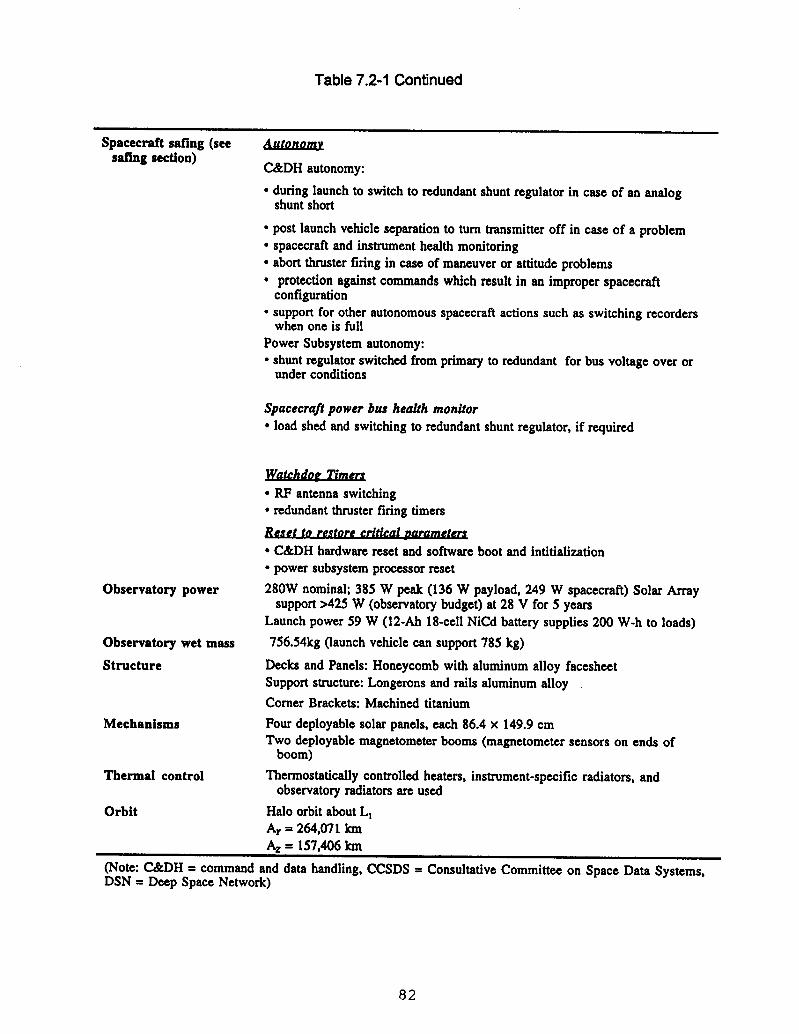
83
7.2.1 Mechanical The ACE structure design was driven primarily by the field-of-view requirements for theinstruments, antennas, and attitude components and by the need for a spinningspacecraft to be mass balanced. Further complications resulted from the need forindividual thermal radiators on the instruments and structure, which required views tospace, and by handling, access, clearance and harness routing issues. The primary structural components consist of ten aluminum honeycomb panels thatform a 142.2 x 76.2 cm closed octagon supported by an internal aluminum and titaniumframe. The Observatory attach fitting is a 22.9 cm high aluminum cylinder that attachesthe primary structure to a 5624 Delta payload fitting with a clampband. Most of theinstruments (SEPICA, SIS, SWICS, SWEPAM, ULEIS, EPAM and S3DPU) aremounted to the top (+Z) deck facing the Sun. The +Z deck is isolated from the rest ofthe structure via buttons (ultem material) and titanium brackets to meet instrumenttemperature requirements. The CRIS and SWIMS instruments and most spacecraftsubsystems are mounted to the side decks. The lower (-Z) deck houses most of the RFsubsystem and the SLAM payload. Propulsion thrusters were mounted and located to minimize plume heating effects onthe solar arrays and nearby instruments. All propulsion components were integratedand welded together on the -Z deck. This eliminated the need for field joints on the fuellines and facilitated the final assembly with the rest of the spacecraft primary structure.The tanks were mounted so the primary structural load path was almost directly into theorbital attach fitting. Once the structure assembly was complete, access to thepropulsion subsystem was limited. Four 86.4 x 149.9 cm deployable aluminum honeycomb solar panels are hinged fromthe +/-X and +/-Y sides of the +Z deck and are restrained to the -Z deck with pin pullermechanisms during launch. A 152.4 cm titanium boom attaches a magnetometer to the+Z end of each of the +/-Y solar panels. For launch, the +Z end of each boom wasrestrained to the +/-Y solar panels with a pin puller mechanism. Pyrotechnic devicesactuate the pin pullers, which release the solar panels and booms. Preloaded torsionsprings deployed and centered the solar panels and booms in their appropriatepositions. To avoid dynamic coupling of the spacecraft with low-frequency Delta II launch vehiclemodes, the primary structure had to be designed with fundamental frequencies above35 Hz in the thrust (Z) direction and 12 Hz in the lateral (X,Y) directions when mountedto the Delta payload attach fitting. The spacecraft primary structural modes weremeasured at about 100 Hz in the thrust direction and 40 Hz in the lateral directions. The Delta II flight events produce loads from steady-state and dynamic environments.A spacecraft random vibration environment is generated by launch vehicle acoustics.The ACE Observatory was designed to withstand the loads from these environments.A protoflight test program was used to verify the observatory strength and stiffness.Vibration (sine and random), acoustic, and shock (clampband separation) testing wereperformed on the fully flight configured observatory, using a flight like payload attachfitting. This was the first time that Boeing allowed its attach fitting hardware to be usedin this manner.
84
In terms of complexity, the structure and mechanisms were rated as 3 and 4, for anaverage of 3.5. This is a shade less than a medium-high complexity. Althoughmechanisms and structure for ACE were based on previous spaceflight designs, therewas significant tailoring. With so many instruments on board, the field of views,radiators, access considerations, and balancing for a spinning spacecraft providedsignificant challenges. 7.2.2 Thermal Control The thermal design of the ACE Observatory was created through the joint efforts of thespacecraft and instrument thermal engineers. Early in the program it was decided thatmost of the instruments should be thermally isolated from the spacecraft. Uncertaintyin the instrument schedules, along with stringent and differing instrument temperaturerequirements, made thermal isolation the best approach. Instruments and instrumentcomponents whose temperature requirements could be managed by the spacecraft(SWEPAM, S3DPU, ULEIS data processing unit, ULEIS analog electronics) wereallowed to thermally conduct their heat to the spacecraft. The observatory uses a combination of multilayer insulation (MLI), thermal radiatorsand thermostatically controlled heater circuits to meet its thermal design requirements,without the need for more active and expensive methods of moving heat, such aslouvers and heat pipes. Aluminum doubler plates from 0.15 to 0.32 cm thick wereadded where necessary to enhance heat conduction away from an area. Whererequired, instruments were thermally isolated at the mounting interface using acombination of bushings made of insulating material (ultem), titanium mountinghardware and MLI blankets. Most of the ACE MLI blankets have an outer layer of white Beta Cloth to providedurability and the desired optical properties while minimizing specular reflections.There also is an embedded graphite weave to provide some protection fromelectrostatic discharge, although a conductive spacecraft was not a requirement forACE. In some areas, special requirements dictated the use of alternative materials instead ofthe MLI outer layer. Possible thruster plume impingement led to the use of MLIblankets with aluminized Kapton layers to provide hardening to increasedtemperatures. Also the SWIMS and SWEPAM(E) instruments had specialrequirements that dictated the use of more electrically conductive MLI outer layermaterials. ITO-coated aluminized Kapton was used. The forward (+Z) deck is covered by thermal insulation to shield it from the Sun asmuch as possible. Heat is rejected from the forward deck via silvered teflon radiatorsattached to each of the eight deck edges. The observatory attach fitting is bolted to the aft deck and is covered with silveredteflon to serve as a thermal radiator for the side panels and aft deck. Except for theRF-radiating surfaces of the two low-gain antenna towers and the high-gain antennadish, the aft deck is protected from a direct view toward space by an MLI blanket.
85
The spacecraft thermal design minimizes heat exchange between the side panels andspace by covering the side panels with MLI blankets. For side panels with instruments,the blankets provide radiative isolation between the instrument and side panel. The spacecraft radiators were oversized during design and fabrication. The effectiveradiator sizes were then tailored using MLI after correlation between the results of theobservatory-level thermal vacuum test and the observatory thermal model. The observatory thermal analysis included worst-case variations in all thermal designparameters. Therefore, the analysis bracketed all possible temperature variations overthe entire mission life. On orbit, the spacecraft thermal environment shows little short-term variation. The sun angle variation occurs on a scale of months, and will becorrected periodically via the propulsion system. The thermal control system is robust and versatile. A primary requirement of thesystem is to minimize peak heater power while providing adequate support ofobservatory temperatures. Survival, operational and interface heaters manage theresources to meet the observatory’s thermal requirements. Survival heater circuitsprovide control when instruments are off and when most spacecraft components areeither off or in low-power states. Operational heater circuits provide control duringnormal observatory power dissipation states. To minimize peak heater power, interfaceheaters are used to replace part of the dissipation of a component placed innonoperational state while the operational heaters are active. Interface heaters areused for all isolated instruments and for some higher-power spacecraft components.Without interface heaters, larger operational heater circuits would have been needed toaccommodate the occasional lower-power modes. This would have resulted in higherpeak operational heater power. In terms of complexity, thermal control was rated as 3 and 4, for an average of 3.5.This is a shade less than a medium-high complexity. Although the spacecraft has asteady environment for operations, with so many instruments on board having differingrequirements, designing for all possible situations provided a challenge for a passivelow-cost implementation. 7.2.3 Command and Data Handling (C&DH) The C&DH subsystem provides capabilities for ground and stored commanding;onboard autonomy and safing; collection, formatting and storage of science andengineering data; switching of spacecraft power and energizing of pyrotechnic devices;thruster firing control; and generation and distribution of Sun pulses and spin clocks.The C&DH subsystem consists of redundant C&DH components, two one-Gbit solidstate recorders, a Power Switching component, and an Ordnance Fire component.These components were designed and fabricated by APL, except for the solid staterecorders (SSRs) which were designed and fabricated by SEAKR Corporation. Specialdesign features are included to avoid any single-point mission failures and to allowcontinuous operation through solar flares. Table 7.2.3-1 provides major requirementsof the C&DH subsystem. Table 7.2.3-2 covers C&DH user commands, Table 7.2.3-3gives telemetry channels and Table 7.2.3-4 has the telemetry formats. Figure 7.2.3-1gives a block diagram showing the major components of the C&DH subsystem and theother systems with which it interfaces.
86
The C&DH components comply with the Consultative Committee for Space DataSystems (CCSDS) uplink and downlink standards. They can execute commands in realtime from the ground, store commands for execution based on time and out-of-limitconditions, and store commands as part of a block of commands. Command outputsinclude serial data commands, logic pulse commands, and relay commands. TheC&DH components collect data using a series of standard interfaces from instrumentsand other subsystems. Special purpose interfaces are used to collect data from sunsensors. Sun pulses and spin clocks are generated and distributed to instruments.The C&DH components also control thruster firings. The C&DH component was a new design that utilizes a Harris RTX2010 processorexecuting the FORTH language. The RTX2010 is fabricated in a CMOS/SOS processthat is exceptionally hardened to single-event upsets, which makes it suitable foroperation through solar flares. To be hardened the C&DH component design includedEDAC on memory, hardened logic and triple voting modules in Actel field-programmable gate arrays (FPGAs). Spot tantalum shielding was used on a few parts. The SSRs are designed to operate with a less than 10-7 bit error rate after 26 hours ofcontinuous solar flare. This radiation level significantly exceeds the worst casescenarios anticipated for the ACE mission. Data is stored using IBM 16-Mbit dynamicrandom access memories (DRAMs) for storage and a Harris 80C85 microprocessor forcontrol. Operationally data are recorded at an average rate of 6,944 bps and playedback at an average rate of 68,640 bps. The SSRs are capable of operating muchfaster than this. The SSR design was loosely based on those for the Clementinespacecraft. The Power Switching and Ordnance Fire components were implemented with amodular design having redundant relay coil driver cards and application-specific relaycards. They operate directly off the spacecraft power bus. The design was previouslyused on the Ballistic Missile Defense Organization’s Midcourse Space Experimentspacecraft and on the Near Earth Asteroid Rendezvous spacecraft. Some additional lessons learned are:
• In terms of development, a difficulty was gaining sufficient confidence to flyDRAMs in plastic packages. It was difficult to find a test house that couldproperly test and screen the parts.
• In terms of fabrication, the chassis design of the C&DH component reduced
costs compared to earlier programs by milling the chassis out of a single blockof metal, instead of individually milling out each side and assembling the sidestogether. This minimized the number of drawings required and minimizedconcerns about tolerances and error buildup in assembly.
• The design of the NEAR spacecraft was concurrent with ACE. The two C&DH
subsytems were designed with as much commonality as possible. This allowedthe design costs of many boards to be split between the two programs.
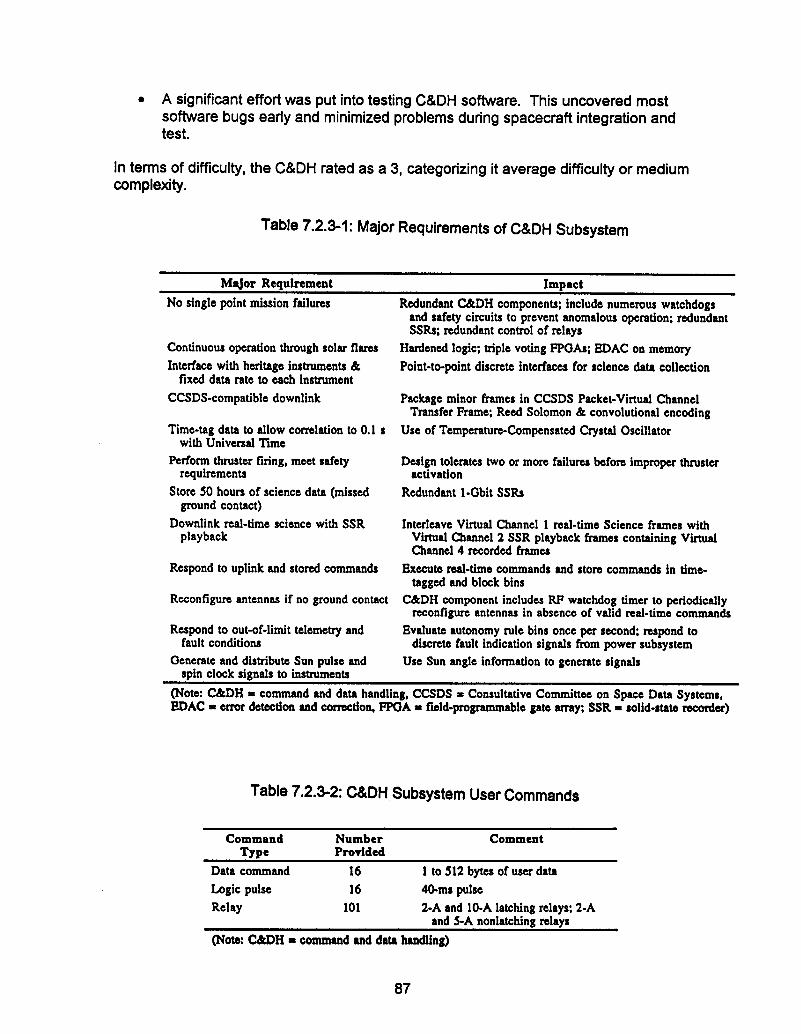
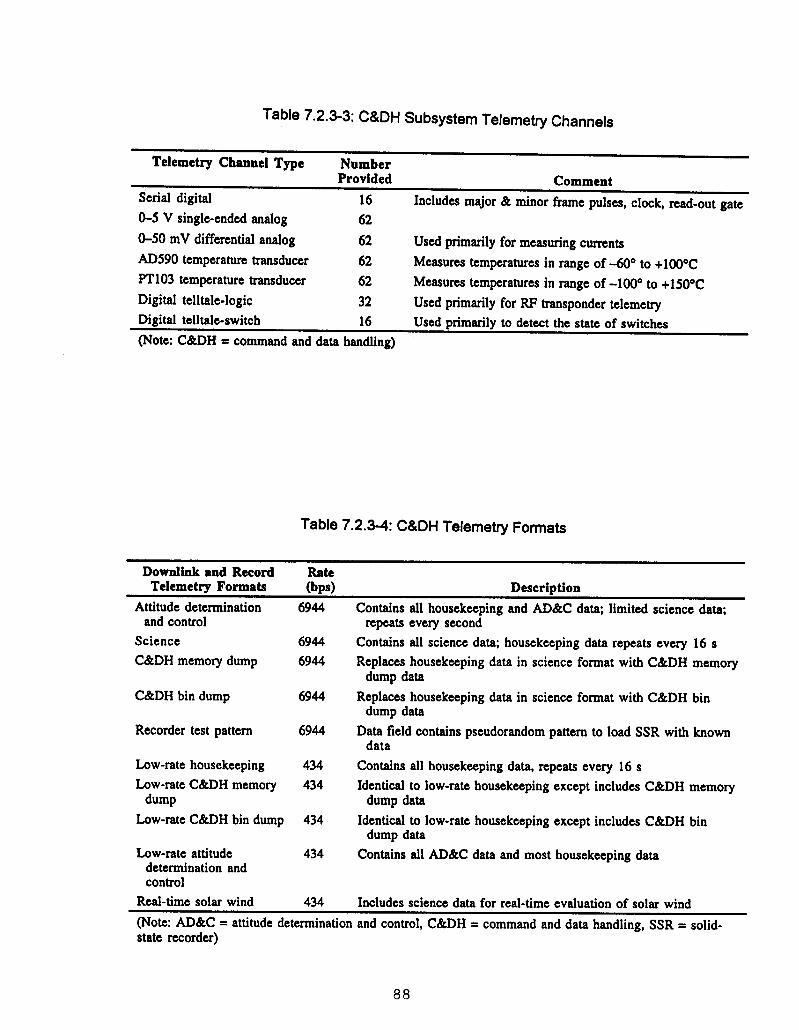
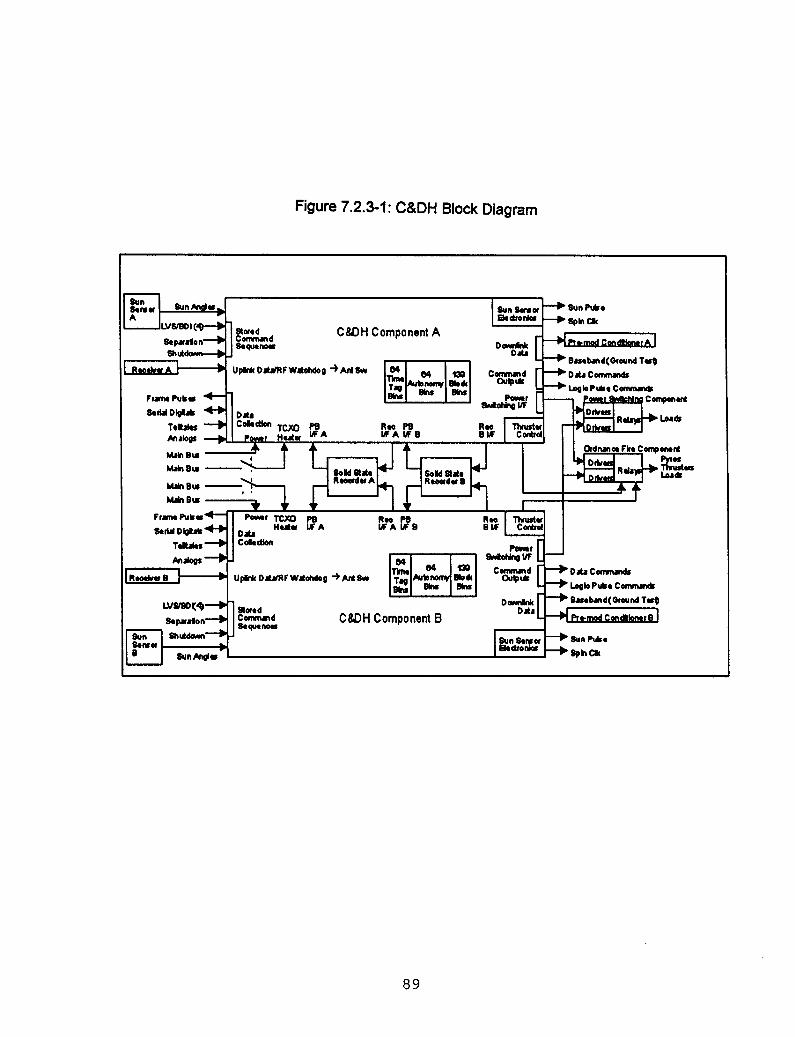
90
7.2.4 RF Communications The primary function of the RF Communications subsystem is to serve as theobservatory terminus for radio communications between the observatory and the NASADeep Space Network of Earth stations. A secondary function is to transmit downlinkdata in real time, at 434 bit/s, to Earth stations supporting the NOAA Real-time SolarWind (RTSW) project. The system is designed to receive uplink commands andtransmit downlink telemetry data concurrently with coherent ranging. The systemoperates at 2097.9806 MHz for the uplink and 2278.35 MHz for the downlink.
The system consists of two identical (redundant) and independent communicationssubsystems and a single high-gain, dual polarized, parabolic reflector antenna. Eachcommunications subsystem consists of a transponder (transmitter and receiver),diplexer, coaxial switching network, and two broadbeam antennas. There is no cross-strapping between RF subsystems. The coaxial switching network is used to connect agiven transponder to an aft (–Z) or forward (+Z) broadbeam antenna or to the aft high-gain parabolic antenna. Watchdog timers, implemented in software within the C&DHsubsystem, are designed to switch the broadbeam antennas if no uplink spacecraftcommands are received within a preset time. The timers provide a means to recoverspacecraft communications in the event of a communications system or attitudeanomaly. Both receivers are operated continuously, but only one transmitter is to bepowered and one antenna energized at any given time. The communications subsystem concept was similar to those in the AMPTE ChargeComposition Explorer (CCE) and the Midcourse Space Experiment (MSX) spacecraft.Similar Loral-Conic S-band transponders have been flown previously on TIROS,Clementine and other missions. However, 75 percent of the electronics design wasnew. There was some descoping. The RF power radiated by the spacecraft was cut 50percent early in the program to eliminate the cost of an RF power amplifier. The sizeand gain of the high gain antenna was increased to partially compensate for the powerloss. Since the beamwidth of the antenna decreases as the size increases, there wasa reduction in the angular coverage of the antenna. The result is that the attitude of thespacecraft must be perturbed more frequently to keep the earth within the antennabeam. These perturbations have some impact on the collection of data by the scienceinstrumentation. In the original concept, the RTSW experiment had an independent X-bandcommunications system that could operate continuously with relatively small earthterminals. The final RTSW system takes advantage of the on board S-bandtelecommunications system to transmit RTSW data about 21 hours per day. Groundstations require large antennas (up to 10 meters depending on sensitivity) to supportthis system. Ground station support is provided by NOAA, the Air Force (AFSCN) andforeign ground stations, but none of this support is continuous. As a result there areperiods when the solar flare activity is not reported. The RF Communications subsystem was designed to be straightforward, whichresulted in an average difficulty rating of 3, or medium complexity.
91
7.2.5 Attitude Determination and Control (AD&C) The AD&C subsystem was designed to minimize spacecraft cost and complexity whilemaximizing reliability and mission success. It utilizes the inherent gyroscopic stability ofa spinning spacecraft for attitude control coupled with telemetered Sun sensor and starscanner data for determining attitude on the ground. The AD&C subsystem consists ofa solid-state star scanner, a redundant Sun sensor system (which acts as an on-orbitbackup to the star scanner), two fluid-filled ring nutation dampers, the ten thrusters ofthe propulsion system, and the command capability of the C&DH subsystem. It is anextremely simple system that has proven itself on a variety of other missions. Each redundant Sun sensor system from the Adcole Corporation consists of two Sunangle sensors and an associated electronics box. Each sensor digitally encodes to an8-bit value, the Sun angle in nominal 0.5° increments over a field of view of ±64° ineach of two orthogonal axes. One Sun angle sensor of a pair is located on the +Z deckof the spacecraft with its normal parallel to the +Z axis; the other is mounted on the sidedeck with its normal canted 125° away from the spacecraft +Z axis. Unless there is anattitude anomaly, the Sun will always shine on the top-deck Sun angle sensor. The Sunsensor electronics forwards to the C&DH subsystem the two encoded 8-bit Sun anglesfrom the illuminated Sun angle sensor and two identification bits indicating which of thetwo sensors is providing the data. The C&DH subsystem records the Sun angle data forinclusion in the downlinked telemetry and both generates a Sun-crossing pulse andinitializes a sector clock based on the transition of the most significant bit of one of thetwo Sun angle values from the illuminated sensor. The observatory attitude is determined on the ground by combining the telemeteredSun angle data with high-accuracy data provided by a Ball Aerospace Systems DivisionCT-632 solid-state star scanner. The CT-632 star scanner is a star tracker modified tooperate at the ACE spin rate of 30°/s, which is two orders of magnitude greater thannominal star tracker angular rates, with no significant impact on the error budget (onesigma error of 30 arcsec). Time delay integration is used to accumulate the star imagesignal on the charge-coupled device (CCD) so that standard star tracker imageprocessing algorithms can be used to determine star centroids and magnitudes. Thedata from the star scanner are collected by the C&DH subsystem for telemetering tothe ground, where they are combined with the Sun angle data to determine the attitudeof the observatory. The requirement for attitude knowledge is ±0.7° after the fact, with a goal of ±0.5° forthe magnetometer. The spacecraft components were assigned budgets for attitudeerrors, which are given in Table 7.2.5-1.
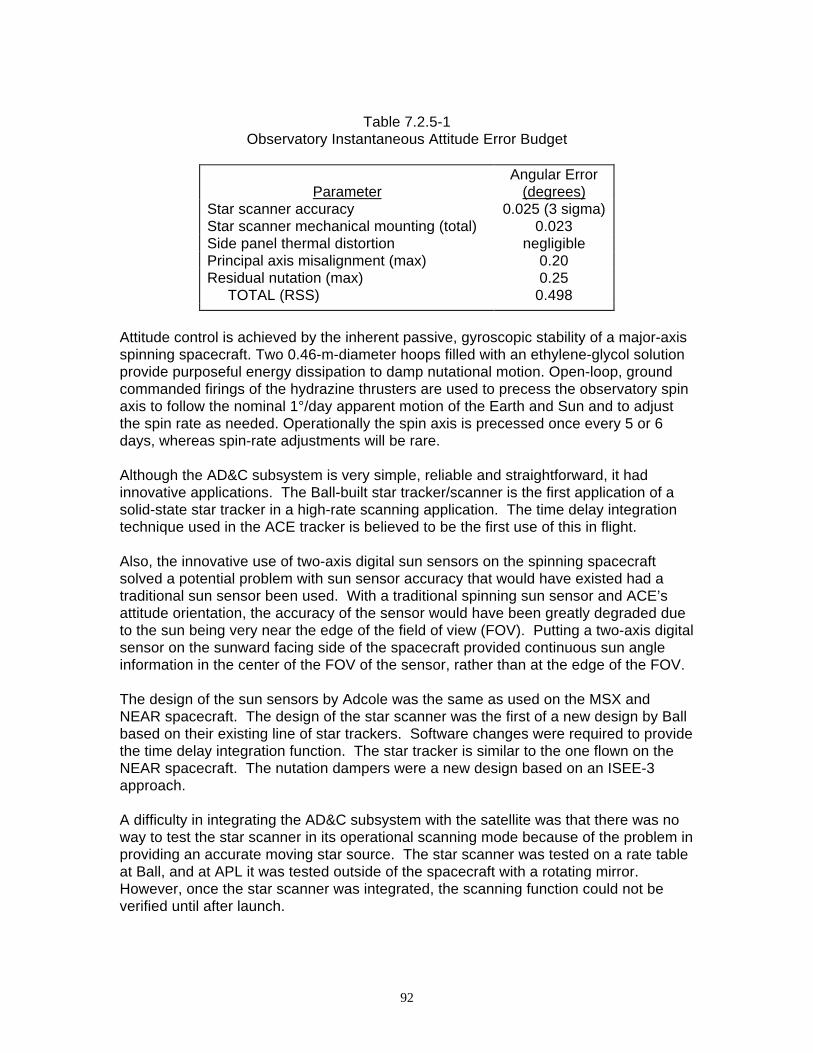
92
Table 7.2.5-1
Observatory Instantaneous Attitude Error Budget
Parameter
Angular Error(degrees)
Star scanner accuracy 0.025 (3 sigma) Star scanner mechanical mounting (total) 0.023 Side panel thermal distortion negligible Principal axis misalignment (max) 0.20 Residual nutation (max) 0.25 TOTAL (RSS) 0.498
Attitude control is achieved by the inherent passive, gyroscopic stability of a major-axisspinning spacecraft. Two 0.46-m-diameter hoops filled with an ethylene-glycol solutionprovide purposeful energy dissipation to damp nutational motion. Open-loop, groundcommanded firings of the hydrazine thrusters are used to precess the observatory spinaxis to follow the nominal 1°/day apparent motion of the Earth and Sun and to adjustthe spin rate as needed. Operationally the spin axis is precessed once every 5 or 6days, whereas spin-rate adjustments will be rare. Although the AD&C subsystem is very simple, reliable and straightforward, it hadinnovative applications. The Ball-built star tracker/scanner is the first application of asolid-state star tracker in a high-rate scanning application. The time delay integrationtechnique used in the ACE tracker is believed to be the first use of this in flight. Also, the innovative use of two-axis digital sun sensors on the spinning spacecraftsolved a potential problem with sun sensor accuracy that would have existed had atraditional sun sensor been used. With a traditional spinning sun sensor and ACE’sattitude orientation, the accuracy of the sensor would have been greatly degraded dueto the sun being very near the edge of the field of view (FOV). Putting a two-axis digitalsensor on the sunward facing side of the spacecraft provided continuous sun angleinformation in the center of the FOV of the sensor, rather than at the edge of the FOV. The design of the sun sensors by Adcole was the same as used on the MSX andNEAR spacecraft. The design of the star scanner was the first of a new design by Ballbased on their existing line of star trackers. Software changes were required to providethe time delay integration function. The star tracker is similar to the one flown on theNEAR spacecraft. The nutation dampers were a new design based on an ISEE-3approach. A difficulty in integrating the AD&C subsystem with the satellite was that there was noway to test the star scanner in its operational scanning mode because of the problem inproviding an accurate moving star source. The star scanner was tested on a rate tableat Ball, and at APL it was tested outside of the spacecraft with a rotating mirror.However, once the star scanner was integrated, the scanning function could not beverified until after launch.
93
Despite the complexity raised by the star scanner, the overall level of difficulty of theAD&C subsystem was rated at a 2, or a medium-low complexity. This is because ACEused a reliable, flight proven design strategy to produce a fairly simple subsystem. Theopen-loop ground-commanded design places the burden on the flight controllers tomaneuver the spacecraft and determine its attitude. 7.2.6 Propulsion The propulsion subsystem corrected launch vehicle dispersion errors, injected thespacecraft into the L1 halo orbit, adjusted the orbit, adjusts spin axis pointing, andmaintains a 5 rpm spin rate. The subsystem is a hydrazine blowndown unit that usesnitrogen gas as the pressurant and comprises four fuel tanks, four axial thrusters forvelocity control along the spin axis, and six radial thrusters for spin plane velocitycontrol and spin rate control, as well as filters, pressure transducers, latch valves,service valves, heaters, plumbing, and structure. Figure 7.2.6-1 presents a schematicof the subsystem and illustrates the cross-strapping between the A and B side tanks,service valves, and thrusters. Figure 7.2.6-2 shows the location and function of the tenthrusters. The four propellant tanks are 65.1-cubic meter titanium cone spheres with a totalcapacity of 195 kg, which provides a mission lifetime of 5 years, with considerablemargin. The tanks were initially pressurized to 305 pounds per square inch absolute(psia) at 21 degrees C, and they blow down to 91 psia when the propellant is fullyexpended. The ten thrusters each provide 4.4 N nominal thrust and, combined with themission duty cycle, provide a mission average specific impulse of 216 s minimum. The pressure transducers have a 0-500 psia range and are individually poweredthrough relays. The latch valves are flown in the open position and are normally usedonly for post-loading shipment at Kennedy Space Center. They could be used toisolate a leaking thruster of propellant tank if such a failure were detected during themission. Tank, line and thruster valve heaters are thermostatically controlled andmaintain the propellant components comfortably over the 0 degree C hydrazinefreezing point. Thruster catalyst bed heaters are relay controlled and preheat the bedprior to thruster firings to prevent cold-start degradation. The subsystem plumbing is allwelded and sized to minimize any differential flow pressure drop that might cause aspin imbalance. Orifices are used in the latch valves and at the entrance to thepressure transducers to minimize pressure surge and water hammer effects. Filtersupstream of each latch valve and at the inlet of each thruster remove any potentialcontaminating particulate before it reaches the component. The propulsion subsystem was designed and fabricated by Primex Corporation(formerly Olin Aerospace) and shipped to APL for integration with the spacecraft afterthermal blanket installation. It was environmentally tested at the protoflight level usingwater to simulate propellant and using mass simulators for the rest of the spacecraftsubsystems.
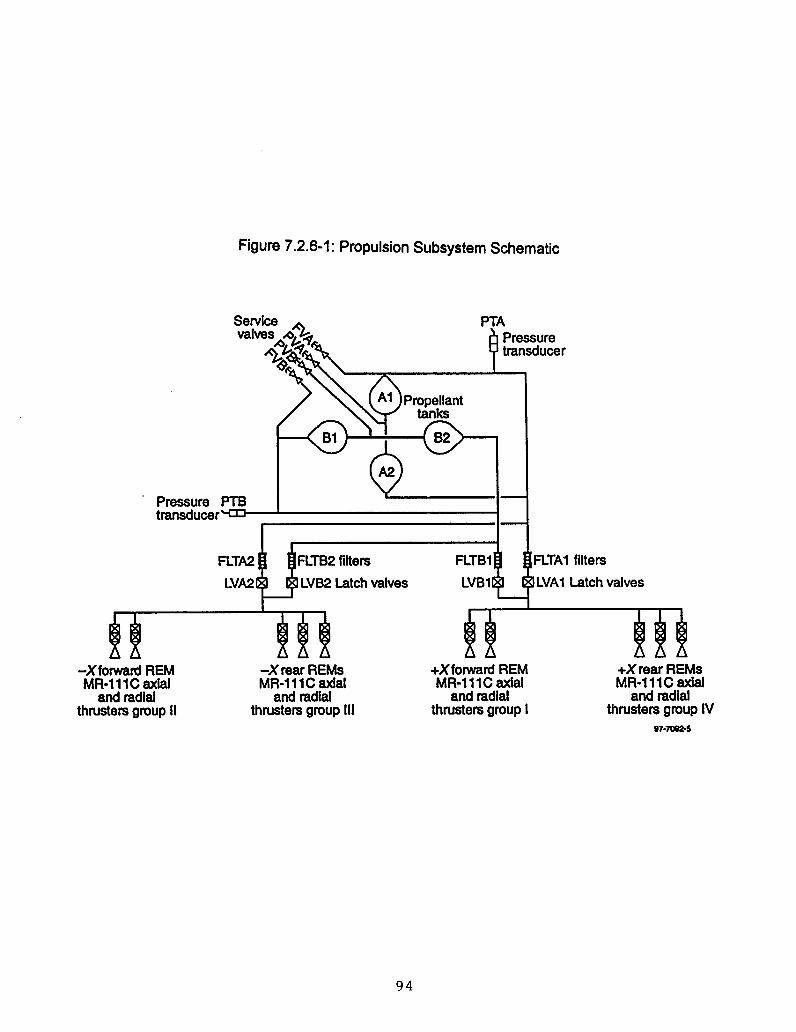
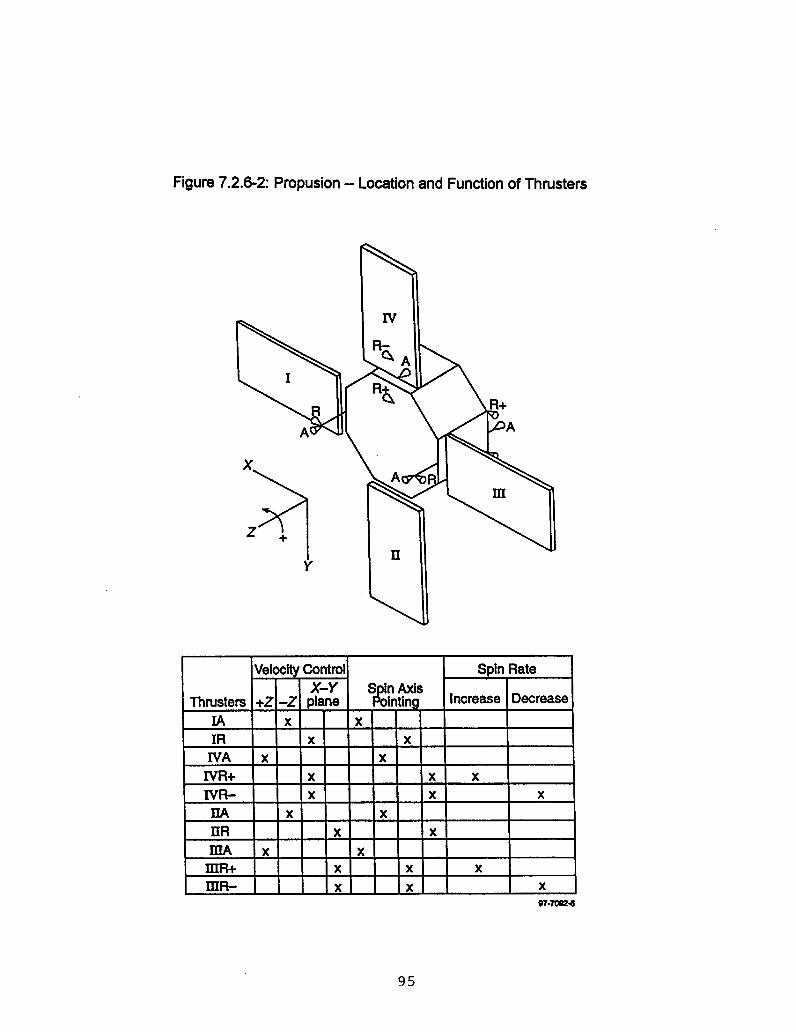
96
7.2.7 Power The ACE electrical power subsystem provides 444 W at spacecraft end of life (EOL),with EOL defined as 5 years. The electrical power load budget is 425 W peak. The low-magnetic-emission, fixed planar silicon solar array is connected directly to the 28 V±2% shunt-regulated bus. The electrical power subsystem also contains an 18 cell 12A-h NiCd battery booster capable of supporting a 165-W launch load. This subsystemis one-fault tolerant with its autonomously controlled redundant shunt regulator andcross-strapped redundant battery chargers. 1. Solar array TECSTAR was contracted to fabricate and lay down five strings, each 89 solar cellslong, on each of four aluminum honeycomb substrates. The 86.4 × 149.9 × 3.2 cmsubstrates, insulated with 3-mil Kapton, were provided by Applied Aerospace StructuresCorporation. The 3.9 × 6.3 cm, 15.1% efficient silicon cells have a diffused boron backsurface field/reflector and are covered with 12-mil, ceria-doped microsheet. The cellsand covers have antireflective coatings, and the covers also have ultraviolet reflectivecoatings. Strings are back-wired for magnetic emissions below 0.1 nT at themagnetometer, which is housed on a boom extending 150 cm from the panel edge.Silver interconnects, which are nonstandard, were used to achieve low magneticemissions. TECSTAR provided a coupon (i.e., a sample) and a qualification panel withaccelerated thermal cycle testing to validate the silver interconnects. The solar arrays were designed for several worst-case operating conditions. Maximumtemperature expected is 58°C while under thruster plume impingement of the ultrapurehydrazine propellant. Conservative degradation estimates project enough EOL powerto tolerate one string failure with no effect on spacecraft performance. A solar cell patchlocated on each panel supports an experiment to measure the degradation overmission life. Strings also have bypass diodes to protect against shadows cast byspacecraft instruments, antennas, and thrusters. Pyrotechnic-actuated, spring-loadedhinges deploy the panels after spacecraft separation from the Delta II.
2. Battery
JHU/APL designed and built the 18-cell stack with redundant thermostatic controlledheaters and current, temperature, and full- and half-stack differential voltage monitors.The thermal design will keep the battery between 0° and 25°C. The cells for the flightbattery are a SAFT Gates Aerospace Batteries (GAB, Gainsville, Florida) 12AB28standard profile design (4.6 × 3.0 × 0.9 cm, 536 g). Although aged for 8 years in drystorage at Gainsville, cells successfully activated in France perform well (typically 15 A-h).
3. Electronics
The electronics consists of six boxes and a shunt resistor dissipater assembly. Eachsolar panel has a digital shunt box nearby containing five metal oxide semiconductorfield-effect transistors (MOSFETs) and blocking diodes for low-dissipation shorting ofeach string. The panel current and the voltage of each string are monitored. Fuses,
97
which help filter the regulated bus, protect the bus from a shorting failure of eitherblocking diodes or capacitors. The power subsystem dissipater electronics contains redundant linear transistors, thebooster, and redundant battery chargers. The 90 percent efficient booster can beconfigured in flight to provide partial battery reconditioning. The battery chargersprovide closed-loop current and voltage limiting. All boxes are constructed with acombination of semirigid flex printed circuit boards and heat sink subassemblies. Thetraces are sized for 70-A fuse blowing capability and 15-A continuous power to the buswith less than a 2-V drop from the solar panel connector to the subsystem dissipaterelectronics output. The power subsystem control electronics contains redundant hybrid power convertersfrom Interpoint, shunt regulation electronics, and a circuit that will switch from theprimary to the redundant side in response to bus under- or overvoltage. It also containsredundant processors and low battery voltage and low bus voltage sensors. The80C85RH-based processors digitize all electrical power subsystem telemetry fortransmission via cross-strapped serial digital links to the redundant spacecraft telemetrysystems. The processors also decode commands cross-strapped from the redundantspacecraft command systems. Digital-to-analog converters allow adjustment of the busvoltage set point (±2%), battery charge limits (0 to 1.5 A), and temperature-compensated battery voltage limits. Figure 7.2.7-1 displays the electrical power system functional block diagram, and Table7.2.7-1 gives weights and dimensions of the power subsystem components. The level of difficulty for the power subsystem was rated as a 3, or a mediumcomplexity level. The subsystem was designed to be straightforward, but did have toprovide a regulated bus voltage and be as magnetically clean as possible without amajor cost impact.
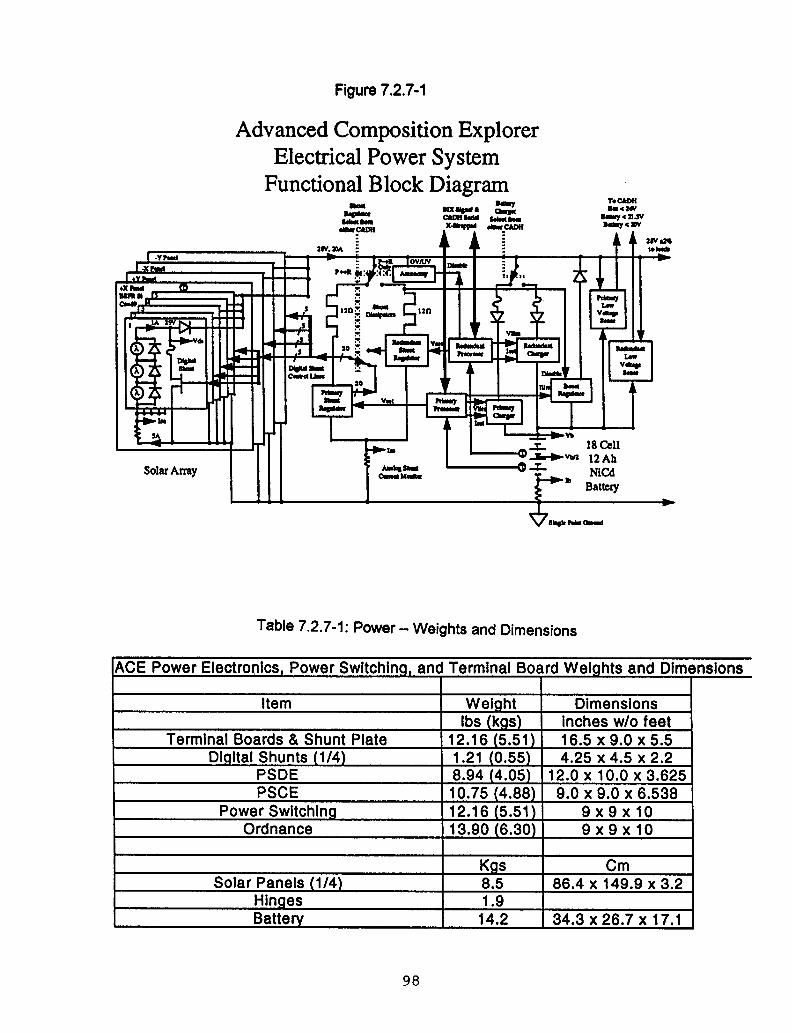
99
7.2.8 Environmental Design Drivers Three environmental factors were given significant attention during the design andfabrication of the ACE Observatory. By addressing these factors from the beginning ofthe design process, goals and requirements were achieved with relatively littleadditional cost. 1. Magnetic Cleanliness The Observatory has two magnetometer sensors, one at each boom. Although ACEhad no magnetic requirement, there were magnetic goals. Magnetic cleanlinessprecautions were undertaken, to the extent that costs would not be significantlyaffected, to limit the magnetic fields from the spacecraft components that could radiateto the sensors. The goal was to achieve a spacecraft static magnetic field at themagnetometer sensors of less than 0.1 nT. The goal for AC interference at the sensorlocations was less than 0.001 nT over a frequency range of 0 to 10 Hz and the specificfrequencies o 15 kHz (+/-200 Hz), 30 kHz (+/-200 Hz), and 60 kHz (+/-200 Hz). Toachieve these goals a number of steps were taken, including the following:
• Battery was wired to reduce magnetic field and magnetic loops• Solar panels were back-wired for compensation• Twisted pair wire was used for power lines; a single-point ground system was
used• Magnetic materials used in spacecraft components were reviewed• Boom material is titanium; hinges and materials near sensors are nonmagnetic• Mapped magnetic emissions of selected suspect spacecraft components and
part Preliminary results of the static test prior to launch indicated a worst-case field of 2.3 nTat each flight sensor, and if the sources had been correctly identified the in-flight fieldcomponents are only 1/10 of this value. Preliminary results of the AC test revealed noAC signals at a level that could significantly affect the magnetic field measurements.The actual field will never be known, but from data for the early phase of the mission, itis estimated to be <1 nT at the sensors. 2. Radiation Environment Spacecraft components had to be designed to meet the following radiationrequirements. Parts were required to survive a total ionizing dose of 15 krad (Si)without part failure (with spot shielding required). The 15 krad (Si) requirement wasbased on a five year mission goal. Since ACE can operate for four years at solarmaximum, the components have to withstand a total proton fluence of about 211
particle/cm2 for protons with energies above 4 MeV. Components had to be immune tolatchup. Parts susceptible to single-event upset (SEU) could not be used in criticalcomponents if these could cause mission-critical failures. In parts of noncriticalcomponents, SEU could not compromise spacecraft health of mission performance.System-level SEU effects were considered, so that upsets did not cause uncorrectableerrors that would affect system performance. SEU susceptible parts used for datastorage memory had to use appropriate error detection and correction techniques so
100
that during exposure to maximum particle flux, the amount of data lost would not causeviolation of the component specification requirements,. 3. Contamination Control ACE instruments are susceptible to hydrocarbons, fluoro-hydrocarbons, particles, andhumidity. To satisfy instrument requirements and permit a comfortable workingenvironment, the instruments were purged and the environment kept at class 100,000clean room level (i.e., this level requires only the use of white coats). Chemicals andcompounds were carefully screened. Nitrogen purge at a temperature of 15 to 25degrees C was supplied to the instruments. Each instrument used a restrictor to obtainits required flow rate. The purge remained connected until launch. The sun sensorand star scanner optical portions were covered unless ground support equipment wasattached. 7.2.9 Spacecraft Safing Spacecraft features are used to “safe” the spacecraft when problems are recognizedonboard or when spacecraft actions are required independent of ground intervention.These features are implemented with a) C&DH autonomy rules, b) built-in powersubsystem autonomy, c) dedicated lines between the power subsystem and the C&DHfor power bus fault indications, d) C&DH RF watchdog timers, and e) C&DH and powersubsystem resets. The C&DH autonomy rules are widely used on the spacecraft to put an instrument, aspacecraft component, or the whole Observatory in a safe configuration when certaincriteria are met. The criteria used to determine the need for action, and the actions arepredefined but can be changed. A component parameter such as a current, whichrequires monitoring, is collected by the C&DH. The value of the parameter is comparedto a preselected threshold, for example, the maximum expected current for thatcomponent. Based on the result, the C&DH autonomy may issue commands such asunpowering the component. Autonomy is used on the ACE spacecraft for all phases ofthe mission: launch, post-launch vehicle separation, and on-station operation.
101
7.3 INTEGRATION The initial integration activities started with the flight harness and the two main terminalboards. These boards housed main bus power, current sensing resistors for all thecomponents, fuses in series for all component power that needed to be switched on oroff, current limiting resistors for all pyro devices, and return ground bus bars toestablish single point ground. All of the wiring that left and returned to these maindistribution points formed the basic flight harness wiring to every component on theACE Observatory. The input and output wiring was distributed and secured on theflight structure, and continuity and isolation measurements were made to verify correctwiring to every component. External power and signal sources were used whereapplicable. The satellite bus components were then integrated to the bus. At this stage ofintegration it is vital to have the power relay components for integration first to achievesuccessful scheduling and progress. The integration team did indeed receive thePower Switching and Ordnance components in a timely fashion for a successfulintegration of the components distributed via the flight harness to all interfaces thatneeded power distribution by switching components. The Command and Data Handling components were delivered, and integration of thesecomponents was accomplished using automated software procedures (PROCS). The RF Communication components were integrated utilizing a ground supportequipment RF power rack to communicate to the antenna receiving and transmittingtransponders. Performance procedures were written in software to accomplish allperformance evaluation testing of the RF components. The Propulsion System was delivered for integration already mounted to the -Z bottomdeck structure. The tanks were partially filled with dry nitrogen for integration andtesting purposes. Testing was accomplished with commands sent manually before aperformance procedure verified all aspects of this system. The Attitude components were integrated with simulators and stimulators attached tothe components. Ground support systems were used to excite these components whileperformance software testing was performed. Power components were integrated utilizing a solar array simulator to produce the solararray power to provide the power to continue Observatory testing with the real powersystem. Prior testing of all components was accomplished via a ground supportequipment power rack with an all purpose test connector and a pull away umbilicalconnector. Each instrument had its own ground support equipment that interfaced with theinstrument during electrical testing, which was done by automated computer softwareprocedures (PROCS). A comprehensive electrical baseline test was run as a flyableObservatory, and the results served as a comparable baseline database for furthertesting. Electrical functional and performance testing of every component wasrepeated at various stages throughout the environmental exposures. The Observatorywas exposed to and tested for vibration, mass properties, acoustics,
102
shock/separation/deployables, electro-magnetic compatibility, static magnetics, wetspin balance, dry spin balance, and thermal vacuum balance and performance. In addition, Deep Space Network testing was accomplished with the GSFC MissionOperation Center (MOC). Several mission tests were run with the mission operatorsstationed at the MOC. These tests gave the mission operators valuable experience forpost launch operations. The ACE Integration and Test Operational Control Center (ITOCC) was the systemused to control the ACE spacecraft during integration, environmental test, and launchsite operations. The ITOCC system has several unique and innovative aspects. Thecore system software was developed for use in both the ITOCC and the MOC. Thisprovided cost efficiencies, cross training synergy, and software debugging that madethe MOC better and more stable at launch than in the typical development process. The integration team used an innovative technique to run tests on multiple spacecraftsystems simultaneously. This saved cost and schedule by shortening the time requiredto complete a full spacecraft test. This scaleable, distributed architecture of the ITOCCsystem and the redundant command systems on the spacecraft allowed thesimultaneous testing to be accomplished. Two instruments were tested simultaneouslyby sending commands through separate command systems, but monitoring a singlestream of spacecraft telemetry. The integration team worked more closely with the mission operations team than onprevious programs of this type. One way this was done was to have a missionoperations team member be a full time integration engineer. In addition, the missionoperations team was provided early access to the spacecraft to test their system andtrain team members. They were also allowed more opportunities to operate the actualspacecraft prior to launch than on a typical spacecraft project. Due to the frequent and early interaction between the integration and test (I&T) andmission operations teams, several spacecraft software functions were added orchanged to improve or ease operations of the spacecraft. A key item in this areainvolved downlinking real time status of the solid state recorder dump process. There were difficulties in the Observatory integration. The instrument deliveries werelate. Given the large number of instruments on board, this made integration on aschedule very difficult. This was coupled with the fact that some of the instruments hadnot been thoroughly checked out (i.e., primarily for interfaces and software, butsometimes for performance) prior to delivery for integration. These instrument problemswere because ACE instrument deliveries were on such a tight schedule that developershad barely begun to learn the behavior of their flight instrument when the spacecraftdeveloper was already asking for its “operating manual” to write system testprocedures, and yet the operational details were not known even to the instrumentbuilders. This situation slowed the integration process, but no relief was given inschedule by the GSFC project management. The solution was many long nights andweekends, not always a reliable fallback. APL software people worked closely with thelead instrument engineers to produce automated procedures for electrical andperformance testing, so that their data could be received and dumped to their groundsupport equipment for their serial instrument data. Each instrumentor had his own work
103
station to retrieve his individual serial data through the C&DH components andtransmitted via selected transponders. This unique setup for each instrument, aftersome involved software difficulties, seemed to work well. These same work stationsare being used on an every day basis at the Mission Operations Center at GSFC.Another unique solution was to allow instrument removal after thermal/vacuum testingfor further work by the instrumentors, and then re-integration at KSC for unit tests andend-to-end tests. Also the software for the ITOCC was late. ACE was the first GSFC project to use acommon ground system for the integration and test function, mission operations, andlater, the data analysis center. The core/generic software was to be expanded toperform each of these functions with the understanding that the I&T function wasneeded first. The function of I&T and what was needed to expand the software wassignificantly under-estimated in the amount of effort needed. This software was beingwritten by a contractor to GSFC, and it was the first time that it was to be used for theI&T function. A primary workaround was to add APL software engineers to modify thesoftware for some needed I&T functions, and then communicate these changes to thecontractor. Then, at a later time when the contractor could incorporate these changesinto the larger common system, they would be sent back to APL via an official softwareupdate. The official update was not always exactly the same as the original APL“patch” which led to some operational and configuration problems. ACE was a learningexperience in this area, and although it was difficult during the program, this should beextremely useful in future programs for reducing costs. The integration of the bus subsystems was rated as a 3, or average difficulty, which is amedium complexity. The integration of the bus and instruments had an average ratingsomewhat greater than 4, or at least a medium-high complexity.
104
7.4 GROUND SYSTEM Much of what is covered in this section was extracted from Frank Snow et al.,Implementation of the ACE Generic System for the Multiple Uses of SpacecraftIntegration and Test and Mission and Science Operations, 1997. Contact Frank Snowat GSFC for more information. 7.4.1 Ground Elements APL was responsible for integration and testing (I&T) of the spacecraft and itsinstruments and providing the I&T Ground Support Equipment (GSE) system whosechief component is the Integration and Test Operations Control Center (ITOCC). Spacecraft Operations are performed at the GSFC in the ACE Mission OperationsCenter (MOC), which was built by the Mission Operations and Data Systems Directorateat GSFC. Level-0 processing of payload data is performed in the ACE MOC. The datais then transmitted to the ACE Science Center (ASC) located at and built by theCalifornia Institute of Technology (CIT). The ASC is responsible for scientificprocessing of the data, making the data products available to the ACE Science AnalysisRemote Sites (ASARS), and transmitting instrument commands to the ACE MOC fortransmission to the on-board ACE Command & Data Handling (C&DH) Data ProcessingUnit (DPU). The commands are then transmitted to the desired instrument’s DPU. The basic component for the ACE MOC is the Transportable Payload OperationsControl Center (TPOCC), a Unix based system, which has been a foundation systemfor most spacecraft control centers at the GSFC for the past several years. Over time,GSFC has found itself increasingly tied to obsolete computers hosting unique systemssupporting aging spacecraft. A primary goal of the TPOCC, which is computerindependent, is to enable a control center to upgrade its computer equipment andrehost the software without having to completely rebuild the software. TPOCC providesthe standard control center functions. Mission unique software components aredeveloped and then interfaced with TPOCC. A secondary goal of TPOCC usage is toenable replacement of TPOCC itself with upgraded versions. 7.4.2 Ground System Strategy Given the NASA mandate to reduce budgets and conform to standards, the ACEGround Project decided to build a common system, based upon TPOCC, to support thethree ground elements, the APL ITOCC, the CIT ASC, and the ACE MOC. Toencourage the ASC and APL participation, the common software was funded throughthe GSFC Mission Operations and Data Analysis (MO&DA) budget. Under the newsingle-project management approach, operation funds from MO&DA (institutionalsupport/MOC) and Code S (mission unique support/ASC, APL) was vested in oneperson, the Ground System Project Manager (GSPM). This allowed the GSPM to basedecisions on the overall NASA ground system costs, which include the ACE MOC, theASC, and the ITOCC. An early Phase B analysis led to the conclusion that the TPOCC could provide much ofthe needed functionality in the ITOCC and the ASC, as well as the ACE MOC. The
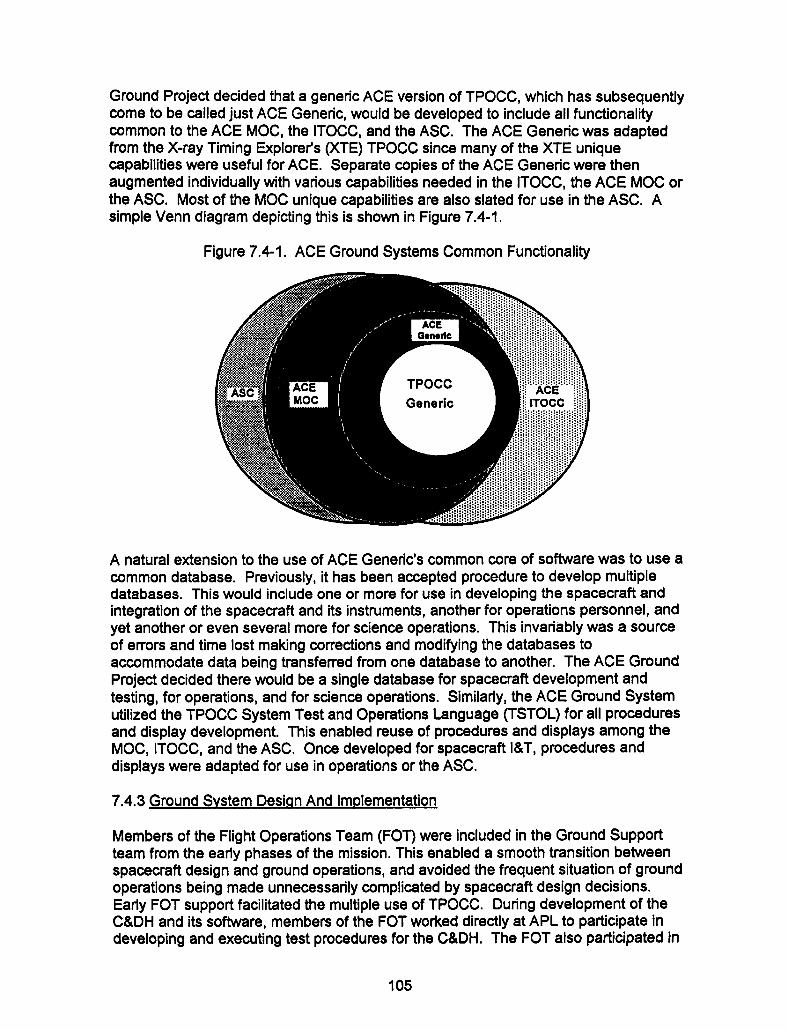
106
the planned usage and design of the ASC. Through these activities, the FOTdeveloped a comprehensive, valuable knowledge of the three areas (ASC, SpacecraftI&T, and Mission Operations) that carried into operations. The concept of theIntegrated Team approach working across spacecraft design, integration and test, andoperations has worked successfully on smaller spacecraft, but this is the first timeNASA has attempted this approach on a program of this magnitude. The ability to bringthis integrated team into being was greatly aided by vesting the MO&DA and Code Sground budgets under a single GSPM. The development of ACE Generic was contracted to Computer Sciences Corporation(CSC) as a task under the MO&DA task order contract. This task also includeddevelopment of the MOC specific enhancements to ACE Generic. APL let a separatecontract to CSC for development of the ITOCC specific enhancements. Manypersonnel at CSC worked on both the ITOCC and MOC contracts, providing a commoncontractor base for both unique developments. CIT detailed a single person to learnabout TPOCC and provide ASC input into the design and development of ACE Generic.This effort required close cooperation between all users and the developers. Questionsand decisions concerning design and development of ACE Generic were made atregular Joint Action Development (JAD) sessions augmented by frequentteleconferences. APL subsequently enlarged their development team to includepersonnel supporting the development of the ACE Generic. For the ACE MOC, some of the ACE Generic enhancements were:
• Level zero processing,• Mission planning and scheduling,• Attitude determination,• Addition of Generalized Systems Analysis Assistant (GENSAA)• Addition of Generalized Trend Analysis System (GTAS)
The ASC uses essentially the same software and hardware systems as the MOC, withthe addition of the science data analysis software. For ITOCC, some of the ACE Generic enhancements were:
• Command Echo - compares an echoed command with what was transmitted,• Raw Telemetry Socket Server - sends a telemetry stream via Ethernet to any
user,• GSE Command-enable - ITOCC control of the GSE and collection of its
telemetry,• Spacecraft Subsystem Run Time Processing - ensures that certain spacecraft
components are run requisite minimum amounts of time and that relays withlifetime limits on the number of state transitions are not over exercised,
• Spacecraft Housekeeping Trending - developed in GTAS, a TPOCC adjunctsystem.
The core computer hosts for the ITOCC, the ACE MOC, and the ASC are HP 748 hostswith multiple processors. These are augmented with UNIX workstations, HP 715s in theMOC and higher-powered HP 735s with more memory in the ITOCC. The MOC HP 748has an Internet Protocol with its workstations connected to an Ethernet-based localarea network. The HP 748 supports mass data storage, as well as additional NASA
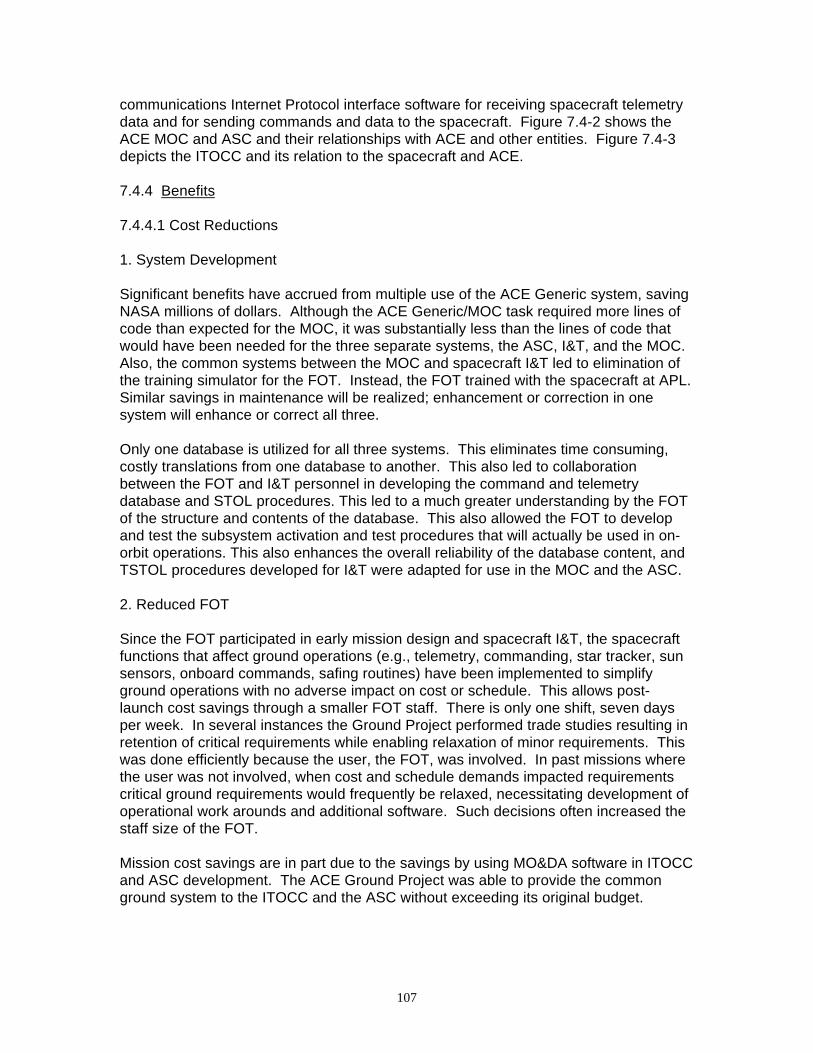
107
communications Internet Protocol interface software for receiving spacecraft telemetrydata and for sending commands and data to the spacecraft. Figure 7.4-2 shows theACE MOC and ASC and their relationships with ACE and other entities. Figure 7.4-3depicts the ITOCC and its relation to the spacecraft and ACE. 7.4.4 Benefits 7.4.4.1 Cost Reductions 1. System Development Significant benefits have accrued from multiple use of the ACE Generic system, savingNASA millions of dollars. Although the ACE Generic/MOC task required more lines ofcode than expected for the MOC, it was substantially less than the lines of code thatwould have been needed for the three separate systems, the ASC, I&T, and the MOC.Also, the common systems between the MOC and spacecraft I&T led to elimination ofthe training simulator for the FOT. Instead, the FOT trained with the spacecraft at APL.Similar savings in maintenance will be realized; enhancement or correction in onesystem will enhance or correct all three. Only one database is utilized for all three systems. This eliminates time consuming,costly translations from one database to another. This also led to collaborationbetween the FOT and I&T personnel in developing the command and telemetrydatabase and STOL procedures. This led to a much greater understanding by the FOTof the structure and contents of the database. This also allowed the FOT to developand test the subsystem activation and test procedures that will actually be used in on-orbit operations. This also enhances the overall reliability of the database content, andTSTOL procedures developed for I&T were adapted for use in the MOC and the ASC. 2. Reduced FOT Since the FOT participated in early mission design and spacecraft I&T, the spacecraftfunctions that affect ground operations (e.g., telemetry, commanding, star tracker, sunsensors, onboard commands, safing routines) have been implemented to simplifyground operations with no adverse impact on cost or schedule. This allows post-launch cost savings through a smaller FOT staff. There is only one shift, seven daysper week. In several instances the Ground Project performed trade studies resulting inretention of critical requirements while enabling relaxation of minor requirements. Thiswas done efficiently because the user, the FOT, was involved. In past missions wherethe user was not involved, when cost and schedule demands impacted requirementscritical ground requirements would frequently be relaxed, necessitating development ofoperational work arounds and additional software. Such decisions often increased thestaff size of the FOT. Mission cost savings are in part due to the savings by using MO&DA software in ITOCCand ASC development. The ACE Ground Project was able to provide the commonground system to the ITOCC and the ASC without exceeding its original budget.
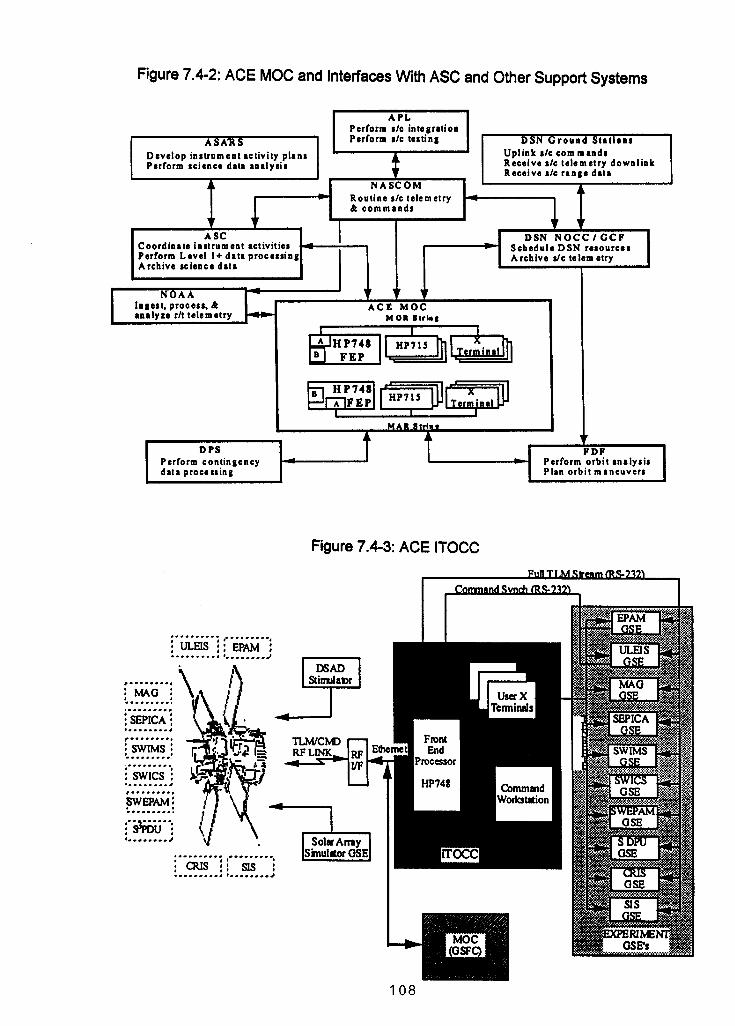
109
7.4.4.2 Training Significant benefits were accrued in training, because the FOT was trained using theITOCC system and the spacecraft. This training was far more comprehensive than aFOT would normally receive. The FOT not only learned how to use procedures, butactually designed, implemented, and tested the procedures. This gave the FOT moreinsight into the procedures and enables the FOT to respond more quickly to spacecraftanomalies during operations. When the spacecraft engineers and scientists came to GSFC for Launch and EarlyOperations little additional training was required since they already had been workingwith the TPOCC system during spacecraft I&T. This reduced the need for multiplesimulations and enabled a smoother transition from spacecraft I&T to operations. The Mission Operations Team came together early in Phase B. Therefore, the MissionOperations Team which includes the spacecraft I&T team, the ASC, and the MOCpersonnel had been involved early in decisions on mission requirements and missiongoals. The team had been collaborating for over two years and developed confidencein each other’s abilities and judgment. With the synergy of the combined team, eventhough key personnel had left the project, the corporate knowledge within the FOT andthe I&T team helped train and support new personnel. 7.4.4.3 IGSE Interface The Instrument Ground Support Equipment (IGSE) uses the same interface to the MOCas to the ITOCC. Pre-flight interface testing between the MOC and the IGSE wasgreatly simplified, only requiring the configuration of the appropriate networkconnections. Moreover, the instruments were able to reuse many of the sameactivation and checkout procedures that were developed during Observatory integrationof their instruments. This helped in the often difficult process of converting instrumentprocedures to the operational system during the last few months prior to launch. 7.4.5 Common System Challenges and Lessons Learned The assumption that a common ground system could support both integration and testand flight operations spacecraft control requirements proved largely correct. However,adapting a system originally designed for flight operations to service integration andtest requirements presented some unique challenges. These and related lessonslearned were discussed briefly in section 6.2.4, and are discussed more fully here.
• A considerable amount of effort was expended up front trying to document allthe requirements for the MOC, ITOCC and ASC for ACE Generic. However, allthe ITOCC requirements could not be defined in advance because thespacecraft was not yet built. Also, as the ITOCC personnel gained experiencewith early deliveries of ACE Generic they discovered that they could not usesome of the designed features as planned. Changes in ITOCC requirementsresulted in an approximately 25% increase in ACE Generic requirements. Thedevelopment team accommodated the growth in requirements by stretching outthe ACE Generic delivery schedule and delaying the implementation of the less
110
mission-critical ACE MOC specific requirements. Any development approach fora common ground system should be able to accommodate this expansion inrequirements and have the capability to change release schedules.
• The original delivery schedule of providing ACE Generic releases 3 or 4 months
apart did not meet the ITOCC requirements for delivery of new capabilities orfixing of high priority system discrepancies. The integration and test teampreferred to get delivered capabilities as soon as they were ready even if alltesting of the new capability was not completed. This resulted in thedevelopment team abandoning the system release approach and creating a"function drop" delivery mechanism. Each function drop comprised a single newcapability or discrepancy fix, system integration instructions and a "function" testplan. Function drops were provided to the ITOCC on a weekly basis. ITOCCpersonnel served as system integrators and testers for each function drop. Thisnew delivery approach resulted in better responsiveness to ITOCC needs andallowed new requirements to be more easily accommodated within thedevelopment schedule.
• Development of a common ground system must take into account the resources
required to support the different objectives and delivery timing of spacecraft I&Tand operations. The ACE development effort ran into significant resourceproblems starting at approximately two years prior to launch when the I&T effortstarted to ramp up and the initial MOC systems were due for initial release tosupport early FOT testing with the spacecraft. At this time the I&T team found avariety of ground system problems that could have potentially delayed the I&Tschedule if they were not fixed in a timely manner. At the same time, the FOTwas ramping up for their initial spacecraft compatibility testing and required aninitial release of the MOC ground system. This caused significant resourceproblems for the spacecraft developers and resulted in resources being movedfrom the MOC development effort to assist the troubleshooting of the I&Tsystem. On future common system development efforts the development teamresources must be ramped-up significantly at approximately launch minus twoyears through the completion of the I&T effort. This will ensure that the needsof both groups are met in a timely manner. It will also ensure that resources willnot be drained away from the MOC development effort to focus on near-term,I&T needs, with the long-term impact of not enough resources being applied tothe MOC development effort prior to launch.
• Another challenge was the different approach for managing schedule reserve.
MOC development at GSFC has tended to vest schedule reserve in the ability toaccommodate a schedule slip or failure of a function by postponing work tofuture releases. However, delays of this scale cannot be accommodated whenbuilding an I&T system. Schedule reserve for unforeseen work must beincluded in the basic schedule for an I&T system just as it is for any spacecraftcomponent or instrument.
• Spacecraft integration and test stresses the command and control system in a
different fashion than flight operations. Spacecraft integration and test sends alarge number of real-time commands, interfaces with the spacecraft for fairly
111
long periods of time (sometimes greater than 24 hours) and has a much greaterdependency on real-time telemetry for diagnosing problems and confirmingspacecraft health. Whereas the flight operations team would rarely send morethan one hundred commands during a real-time contact (a typical ACE pass willlast 3 1/2 hours and never more than 10 hours), the integration and test teammay send thousands. Further, the FOT will rely on recorded data for trendingand determining spacecraft anomalies. To accommodate these integration andtest requirements, the maximum size of the command buffer had to beexpanded significantly. Disk space had to be reallocated to accommodate largehistory files that record all real-time and playback telemetry, which are recordedduring a session with the spacecraft. Also the capability to close history filesand open a new one without losing data had to be added. This allowed theintegration and test team to trend real-time data while continuing with theintegration and test session.
• Similarly, another "cultural" difference pertained to procedures. I&T procedures
are based on complete component and spacecraft functionality whereas FOTprocedures are based on nominal and contingency operational scenarios.Thus, FOT procedures tend to be more segmented than those used for I&T.This required the FOT to develop many procedures from scratch, using the I&Tprocedures only as a baseline. This procedure conversion process also led to agreater configuration and control effort than originally planned.
• During development of a common I&T/operations ground system the ground
system developer must ensure that maximum commonality is maintainedbetween the systems to ensure that the only variations between the systems arethose that are absolutely necessary for each group to perform unique functions.On ACE, the development teams working on the I&T system performed a largenumber of system modifications that “improved” I&T operations but were notcritical to I&T functional objectives. Since these changes were done after thebaseline system was delivered to I&T these changes were not reflected back inthe MOC system developed for operations. Some of these changes affectedhow ground system procedures were run. As a result, the FOT was not able touse many of the procedures developed for I&T on the MOC ground system.These procedures required extensive editing to remove the I&T specific items,replacing each with a MOC equivalent to try to functionally maintain theprocedures integrity. Future common system development efforts shouldinclude a development team Control Board that reviews and approves all non-common changes submitted by either the I&T or operations teams. This boardwould address the implications of each change prior to allowing theimplementation to proceed.
• A large number of the high priority discrepancies with the Integration and Test
team dealt with inconsistencies with the user interface. While a FOT memberwill become highly trained on the intricacies of the MOC user interface, manyI&T users (such as system engineers) have little to no familiarity with theITOCC. A consistent user interface allows these novice users to quickly comeup to speed using the ITOCC with minimal training while they trouble shoot
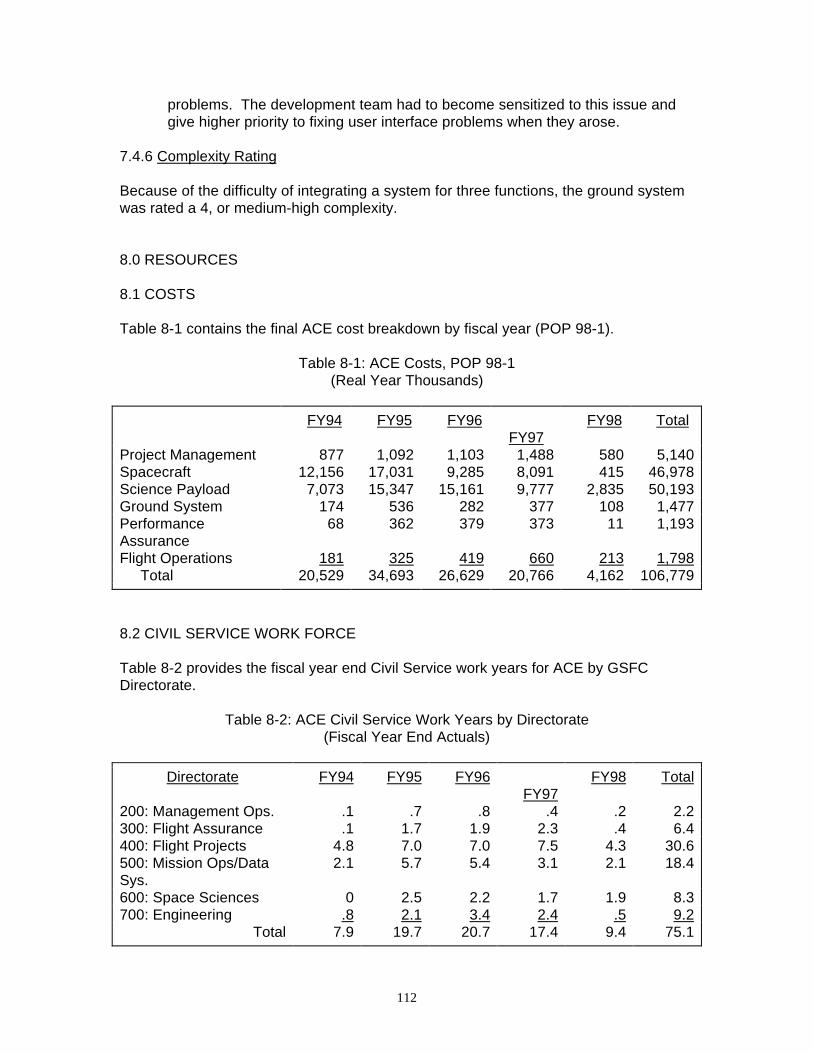
112
problems. The development team had to become sensitized to this issue andgive higher priority to fixing user interface problems when they arose.
7.4.6 Complexity Rating
Because of the difficulty of integrating a system for three functions, the ground systemwas rated a 4, or medium-high complexity.
8.0 RESOURCES
8.1 COSTS
Table 8-1 contains the final ACE cost breakdown by fiscal year (POP 98-1).
Table 8-1: ACE Costs, POP 98-1(Real Year Thousands)
FY94 FY95 FY96FY97
FY98 Total
Project Management 877 1,092 1,103 1,488 580 5,140Spacecraft 12,156 17,031 9,285 8,091 415 46,978Science Payload 7,073 15,347 15,161 9,777 2,835 50,193Ground System 174 536 282 377 108 1,477PerformanceAssurance
68 362 379 373 11 1,193
Flight Operations 181 325 419 660 213 1,798 Total 20,529 34,693 26,629 20,766 4,162 106,779
8.2 CIVIL SERVICE WORK FORCE
Table 8-2 provides the fiscal year end Civil Service work years for ACE by GSFCDirectorate.
Table 8-2: ACE Civil Service Work Years by Directorate(Fiscal Year End Actuals)
Directorate FY94 FY95 FY96FY97
FY98 Total
200: Management Ops. .1 .7 .8 .4 .2 2.2300: Flight Assurance .1 1.7 1.9 2.3 .4 6.4400: Flight Projects 4.8 7.0 7.0 7.5 4.3 30.6500: Mission Ops/DataSys.
2.1 5.7 5.4 3.1 2.1 18.4
600: Space Sciences 0 2.5 2.2 1.7 1.9 8.3700: Engineering .8 2.1 3.4 2.4 .5 9.2
Total 7.9 19.7 20.7 17.4 9.4 75.1

113
POSTSCRIPT
This report was prepared by Donald H. Strope of COST, Inc., Laurel, Maryland underPurchase Order Number S-10557-G.