Embed Size (px)
Citation preview
January 2016Code No. 8572
ACOM CO., LTD.
The Third Quarter Report for the Fiscal Year Ending March, 2016
Notes to DATA BOOK 1
Trend in Actual Results and Estimates (Consolidated)1. Consolidated Subsidiaries 22. Income and Expenses 33. Operating Revenue by Segment 34. Receivables Outstanding by Segment 45. Number of Customer Accounts by Segment 46. Other Indices 4
Trend in Actual Results and Estimates (Non-consolidated)7. Income and Expenses 58. Operating Revenue by Segment 6
8-2. Composition Ratio of Operating Revenue by Segment 69. Operating Expenses 7
9-2. Ratio of Operating Expenses to Operating Revenue 710. Receivables Outstanding 811. Number of Customer Accounts 812. Number of Applicants, New Loan Customers and Lending Ratio 913. Number of Loan Business Outlets 914. Automatic Contract Machines 915. ATMs 916. Employees 917. Average Loan Yield 1018. Accounts Receivable-operating Loans by Interest Rate [Unsecured Loans for Consumers] 10
18-2. Number of Accounts by Interest Rate [Unsecured Loans for Consumers] 1019. Accounts Receivable-operating Loans by Classified Receivable Outstanding [Unsecured Loans for Consumers] 11
19-2. Number of Accounts by Classified Receivable Outstanding [Unsecured Loans for Consumers] 1120. Composition Ratio of Customer Accounts by Annual Income [Unsecured Loans for Consumers] 1221. Composition Ratio of Customer Accounts by Age [Unsecured Loans for Consumers] 1222. Composition Ratio of Customer Accounts by Gender [Unsecured Loans for Consumers] 1223. Bad Debts Expenses 13
23-2. Bad Debts Expenses of Unsecured Loans by Reasons 1324. Non-performing Loans 14
24-2. Loans in Arrears for Less Than 3 Months [excluding balance held by headquarters' collection department] 1425. Allowance for Doubtful Accounts 1426. Provision for Loss on Interest Repayment 1427. Funds Procurement 1528. Credit Card Business 1629. Guarantee Business 1630. Financial Ratios 1731. Per Share Data 1832. Shares Issued 18
Trend in Actual Results and Estimates (Overseas Consolidated Subsidiaries)33. EASY BUY Public Company Limited 1934. PT. Bank Nusantara Parahyangan, Tbk. 19
(Reference) Category criteria concerning situations of non-performing loans 20
Pages
< Contents >
Notes to DATA BOOK
Notes: 1.
: 2.
: 3.
: 4.
: 5.
: 6.
: 7.
: 8.
Forward Looking StatementsThe figures contained in this DATA BOOK with respect to ACOM's plans and strategies and other statements that arenot historical facts are forward-looking statements about the future performance of ACOM which are based onmanagement's assumptions and belief in light of the information currently available to it and involve risks anduncertainties and actual results may differ from those in the forward-looking statements as results of various facts.Potential risks and uncertainties include, without limitation, general economic conditions in ACOM's market andchanges in the size of the overall market for consumer loans, the rate of default by customers, the fluctuations innumber of cases of claims from and the amount paid to customers who claim us to reimburse the portion of interest inexcess of the interest ceiling as specified in the Interest-rate Restriction Law, the level of interest rates paid on theACOM's debt and legal limits on interest rates charged by ACOM.
All amounts less than one million have been truncated. Percentage figures have been as a result of rounding.
The amounts of adjusted per share data have been as a result of rounding.
The total amounts shown in the tables may not necessarily aggregate up with the sums of the individual amounts.
"(E)" indicates estimates.
"yoy p.p." indicates year on year percentage point.
"C.R." indicates composition ratio.
・ "-" is shown in results and "yoy" when these amounts, including those less than one million, are zero.・ "0" is shown in results and "yoy" when these amounts exceed zero, but are less than one million.・ "-" is shown in "yoy%" when percentage changes exceed 1,000%.・ "-" is shown in "yoy%," "yoy," and the results when the figures were not disclosed in the past and/or are not
currently disclosed.・ "-" is shown in "yoy%," and "yoy" when the figures were not disclosed in the past, thus, cannot be
compared.・ Only "yoy" is shown when the results in two terms changed from positive to negative, or from negative to
positive.・ Only "yoy" is shown when both results in two terms are negative.・ Only "yoy" is shown when the results in last term exceeded zero, and the results in current term are zero.
- 1 -
Trend in Actual Results and Estimates (Consolidated)
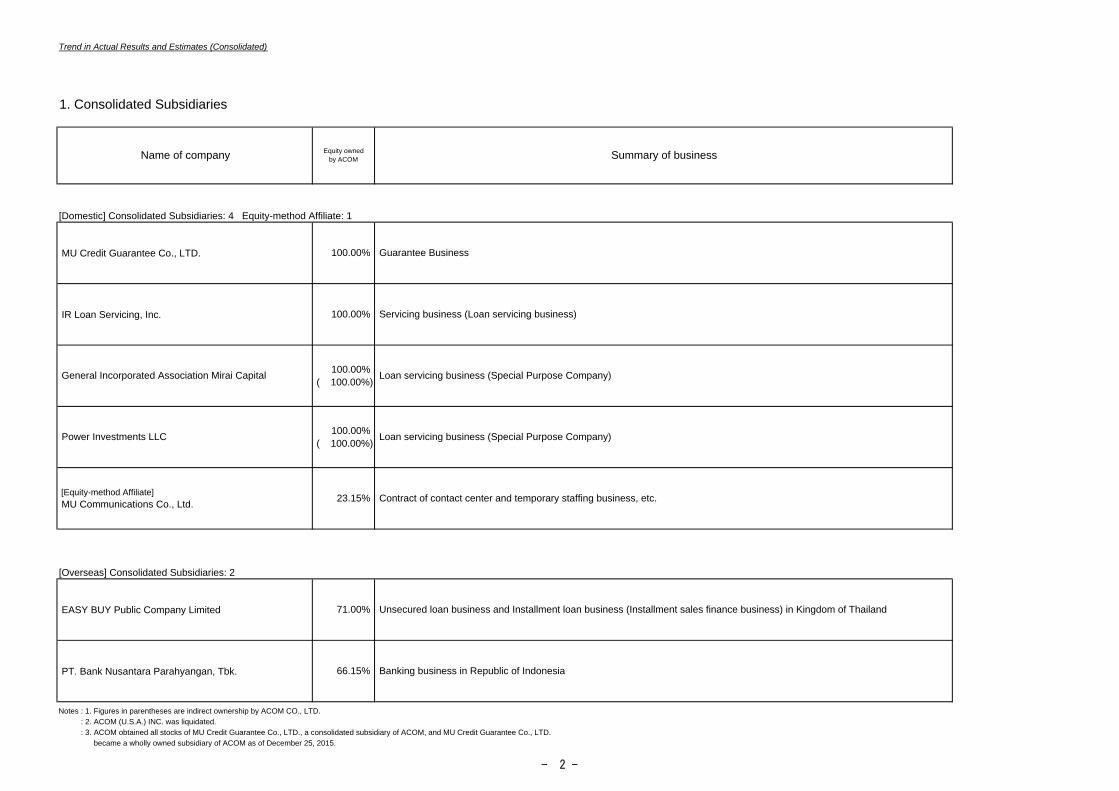
1. Consolidated Subsidiaries
[Domestic] Consolidated Subsidiaries: 4 Equity-method Affiliate: 1
MU Credit Guarantee Co., LTD.
IR Loan Servicing, Inc.
[Overseas] Consolidated Subsidiaries: 2
EASY BUY Public Company Limited
PT. Bank Nusantara Parahyangan, Tbk.
Notes : 1. Figures in parentheses are indirect ownership by ACOM CO., LTD.: 2. ACOM (U.S.A.) INC. was liquidated.: 3. ACOM obtained all stocks of MU Credit Guarantee Co., LTD., a consolidated subsidiary of ACOM, and MU Credit Guarantee Co., LTD. became a wholly owned subsidiary of ACOM as of December 25, 2015.
66.15% Banking business in Republic of Indonesia
[Equity-method Affiliate] MU Communications Co., Ltd. 23.15% Contract of contact center and temporary staffing business, etc.
71.00% Unsecured loan business and Installment loan business (Installment sales finance business) in Kingdom of Thailand
100.00% Servicing business (Loan servicing business)
Power Investments LLC 100.00% Loan servicing business (Special Purpose Company)( 100.00%)
General Incorporated Association Mirai Capital 100.00% Loan servicing business (Special Purpose Company)( 100.00%)
Name of company Equity ownedby ACOM Summary of business
100.00% Guarantee Business
- 2 -
Trend in Actual Results and Estimates (Consolidated)
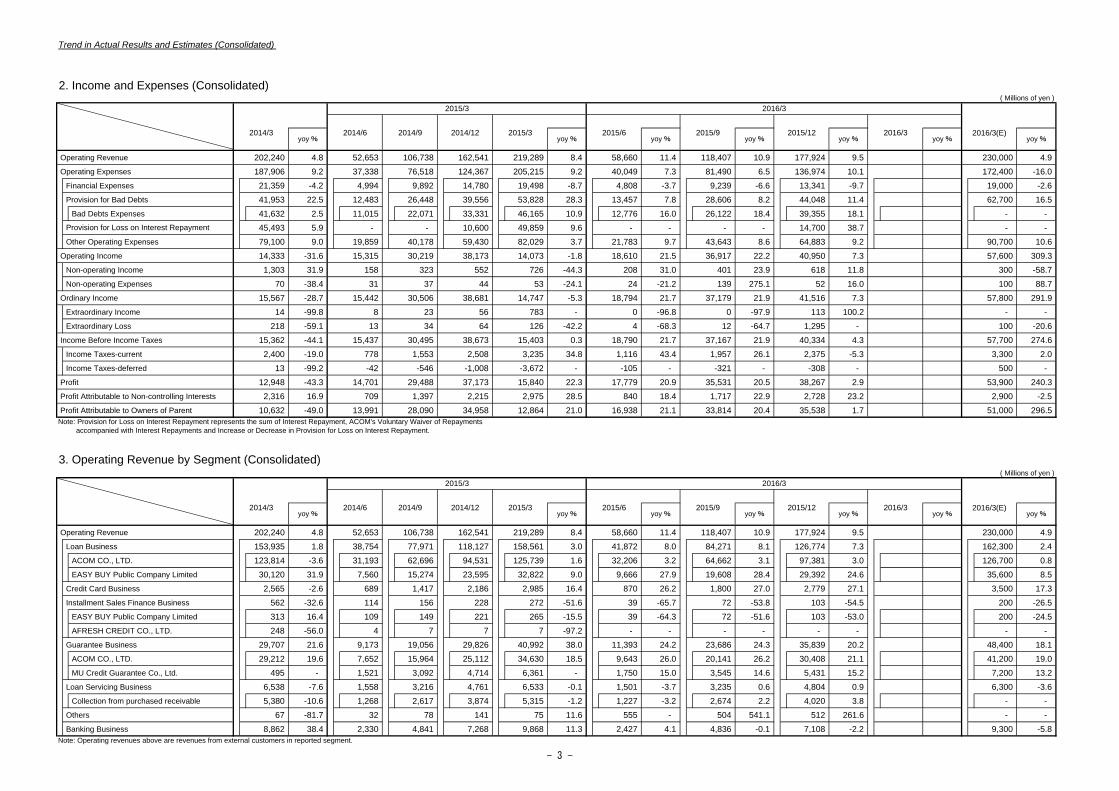
2. Income and Expenses (Consolidated)( Millions of yen )
Operating Revenue 202,240 4.8 52,653 106,738 162,541 219,289 8.4 58,660 11.4 118,407 10.9 177,924 9.5 230,000 4.9 Operating Expenses 187,906 9.2 37,338 76,518 124,367 205,215 9.2 40,049 7.3 81,490 6.5 136,974 10.1 172,400 -16.0
Financial Expenses 21,359 -4.2 4,994 9,892 14,780 19,498 -8.7 4,808 -3.7 9,239 -6.6 13,341 -9.7 19,000 -2.6 Provision for Bad Debts 41,953 22.5 12,483 26,448 39,556 53,828 28.3 13,457 7.8 28,606 8.2 44,048 11.4 62,700 16.5
Bad Debts Expenses 41,632 2.5 11,015 22,071 33,331 46,165 10.9 12,776 16.0 26,122 18.4 39,355 18.1 - - 45,493 5.9 - - 10,600 49,859 9.6 - - - - 14,700 38.7 - -
Other Operating Expenses 79,100 9.0 19,859 40,178 59,430 82,029 3.7 21,783 9.7 43,643 8.6 64,883 9.2 90,700 10.6 Operating Income 14,333 -31.6 15,315 30,219 38,173 14,073 -1.8 18,610 21.5 36,917 22.2 40,950 7.3 57,600 309.3
Non-operating Income 1,303 31.9 158 323 552 726 -44.3 208 31.0 401 23.9 618 11.8 300 -58.7 Non-operating Expenses 70 -38.4 31 37 44 53 -24.1 24 -21.2 139 275.1 52 16.0 100 88.7
Ordinary Income 15,567 -28.7 15,442 30,506 38,681 14,747 -5.3 18,794 21.7 37,179 21.9 41,516 7.3 57,800 291.9 Extraordinary Income 14 -99.8 8 23 56 783 - 0 -96.8 0 -97.9 113 100.2 - - Extraordinary Loss 218 -59.1 13 34 64 126 -42.2 4 -68.3 12 -64.7 1,295 - 100 -20.6
Income Before Income Taxes 15,362 -44.1 15,437 30,495 38,673 15,403 0.3 18,790 21.7 37,167 21.9 40,334 4.3 57,700 274.6 Income Taxes-current 2,400 -19.0 778 1,553 2,508 3,235 34.8 1,116 43.4 1,957 26.1 2,375 -5.3 3,300 2.0 Income Taxes-deferred 13 -99.2 -42 -546 -1,008 -3,672 - -105 - -321 - -308 - 500 -
Profit 12,948 -43.3 14,701 29,488 37,173 15,840 22.3 17,779 20.9 35,531 20.5 38,267 2.9 53,900 240.3 Profit Attributable to Non-controlling Interests 2,316 16.9 709 1,397 2,215 2,975 28.5 840 18.4 1,717 22.9 2,728 23.2 2,900 -2.5 Profit Attributable to Owners of Parent 10,632 -49.0 13,991 28,090 34,958 12,864 21.0 16,938 21.1 33,814 20.4 35,538 1.7 51,000 296.5
3. Operating Revenue by Segment (Consolidated)( Millions of yen )
Operating Revenue 202,240 4.8 52,653 106,738 162,541 219,289 8.4 58,660 11.4 118,407 10.9 177,924 9.5 230,000 4.9 Loan Business 153,935 1.8 38,754 77,971 118,127 158,561 3.0 41,872 8.0 84,271 8.1 126,774 7.3 162,300 2.4
ACOM CO., LTD. 123,814 -3.6 31,193 62,696 94,531 125,739 1.6 32,206 3.2 64,662 3.1 97,381 3.0 126,700 0.8 EASY BUY Public Company Limited 30,120 31.9 7,560 15,274 23,595 32,822 9.0 9,666 27.9 19,608 28.4 29,392 24.6 35,600 8.5
Credit Card Business 2,565 -2.6 689 1,417 2,186 2,985 16.4 870 26.2 1,800 27.0 2,779 27.1 3,500 17.3 Installment Sales Finance Business 562 -32.6 114 156 228 272 -51.6 39 -65.7 72 -53.8 103 -54.5 200 -26.5
EASY BUY Public Company Limited 313 16.4 109 149 221 265 -15.5 39 -64.3 72 -51.6 103 -53.0 200 -24.5 AFRESH CREDIT CO., LTD. 248 -56.0 4 7 7 7 -97.2 - - - - - - - -
Guarantee Business 29,707 21.6 9,173 19,056 29,826 40,992 38.0 11,393 24.2 23,686 24.3 35,839 20.2 48,400 18.1 ACOM CO., LTD. 29,212 19.6 7,652 15,964 25,112 34,630 18.5 9,643 26.0 20,141 26.2 30,408 21.1 41,200 19.0 MU Credit Guarantee Co., Ltd. 495 - 1,521 3,092 4,714 6,361 - 1,750 15.0 3,545 14.6 5,431 15.2 7,200 13.2
Loan Servicing Business 6,538 -7.6 1,558 3,216 4,761 6,533 -0.1 1,501 -3.7 3,235 0.6 4,804 0.9 6,300 -3.6 Collection from purchased receivable 5,380 -10.6 1,268 2,617 3,874 5,315 -1.2 1,227 -3.2 2,674 2.2 4,020 3.8 - -
Others 67 -81.7 32 78 141 75 11.6 555 - 504 541.1 512 261.6 - - Banking Business 8,862 38.4 2,330 4,841 7,268 9,868 11.3 2,427 4.1 4,836 -0.1 7,108 -2.2 9,300 -5.8
2016/3(E)2014/6 2015/3
2015/3
2014/3
Provision for Loss on Interest Repayment
2016/3(E)
2015/3
2014/6 2014/9 2014/12 2015/32014/3
2016/3
2016/3
2015/6 2015/9 2015/12 2016/3
Note: Provision for Loss on Interest Repayment represents the sum of Interest Repayment, ACOM's Voluntary Waiver of Repayments accompanied with Interest Repayments and Increase or Decrease in Provision for Loss on Interest Repayment.
Note: Operating revenues above are revenues from external customers in reported segment.
yoy %yoy %yoy %yoy %yoy %yoy %yoy %2015/6 2015/9 2015/12 2016/3
yoy % yoy %yoy %yoy %yoy %yoy %2014/12
yoy %2014/9
- 3 -
Trend in Actual Results and Estimates (Consolidated)
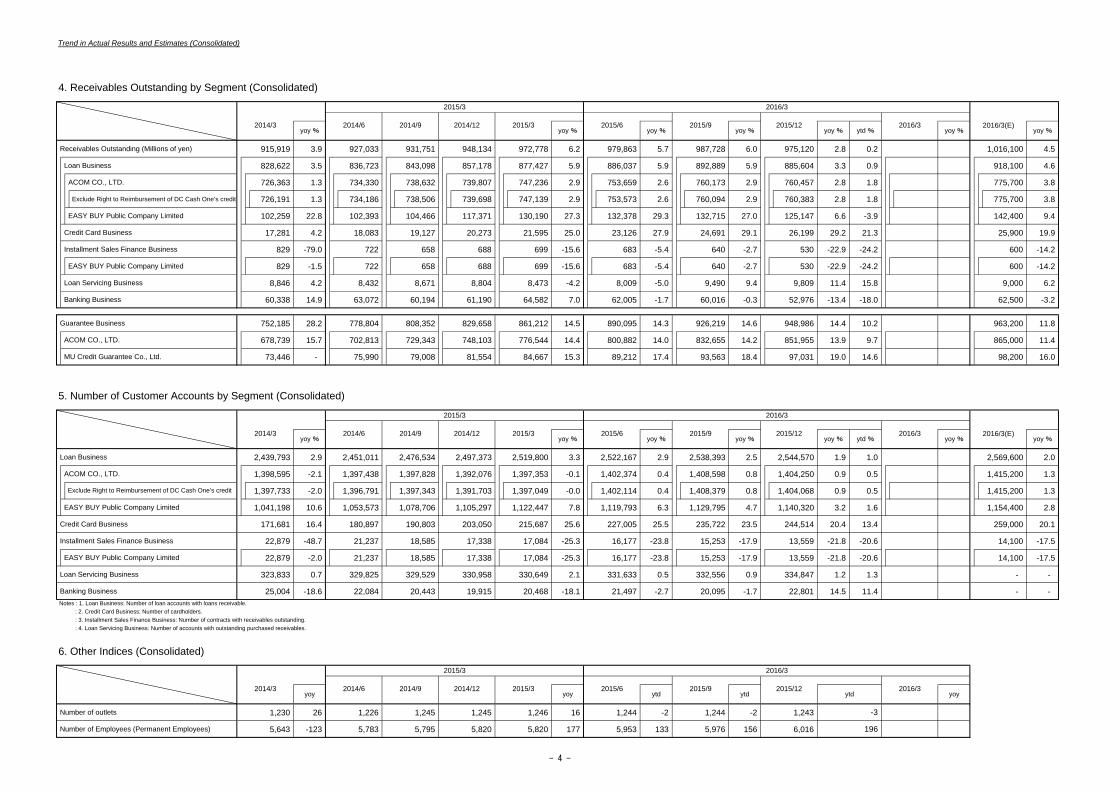
4. Receivables Outstanding by Segment (Consolidated)
Receivables Outstanding (Millions of yen) 915,919 3.9 927,033 931,751 948,134 972,778 6.2 979,863 5.7 987,728 6.0 975,120 2.8 0.2 1,016,100 4.5
Loan Business 828,622 3.5 836,723 843,098 857,178 877,427 5.9 886,037 5.9 892,889 5.9 885,604 3.3 0.9 918,100 4.6
ACOM CO., LTD. 726,363 1.3 734,330 738,632 739,807 747,236 2.9 753,659 2.6 760,173 2.9 760,457 2.8 1.8 775,700 3.8
Exclude Right to Reimbursement of DC Cash One’s credit 726,191 1.3 734,186 738,506 739,698 747,139 2.9 753,573 2.6 760,094 2.9 760,383 2.8 1.8 775,700 3.8
EASY BUY Public Company Limited 102,259 22.8 102,393 104,466 117,371 130,190 27.3 132,378 29.3 132,715 27.0 125,147 6.6 -3.9 142,400 9.4
Credit Card Business 17,281 4.2 18,083 19,127 20,273 21,595 25.0 23,126 27.9 24,691 29.1 26,199 29.2 21.3 25,900 19.9
Installment Sales Finance Business 829 -79.0 722 658 688 699 -15.6 683 -5.4 640 -2.7 530 -22.9 -24.2 600 -14.2
EASY BUY Public Company Limited 829 -1.5 722 658 688 699 -15.6 683 -5.4 640 -2.7 530 -22.9 -24.2 600 -14.2
Loan Servicing Business 8,846 4.2 8,432 8,671 8,804 8,473 -4.2 8,009 -5.0 9,490 9.4 9,809 11.4 15.8 9,000 6.2
Banking Business 60,338 14.9 63,072 60,194 61,190 64,582 7.0 62,005 -1.7 60,016 -0.3 52,976 -13.4 -18.0 62,500 -3.2
Guarantee Business 752,185 28.2 778,804 808,352 829,658 861,212 14.5 890,095 14.3 926,219 14.6 948,986 14.4 10.2 963,200 11.8
ACOM CO., LTD. 678,739 15.7 702,813 729,343 748,103 776,544 14.4 800,882 14.0 832,655 14.2 851,955 13.9 9.7 865,000 11.4
MU Credit Guarantee Co., Ltd. 73,446 - 75,990 79,008 81,554 84,667 15.3 89,212 17.4 93,563 18.4 97,031 19.0 14.6 98,200 16.0
5. Number of Customer Accounts by Segment (Consolidated)
Loan Business 2,439,793 2.9 2,451,011 2,476,534 2,497,373 2,519,800 3.3 2,522,167 2.9 2,538,393 2.5 2,544,570 1.9 1.0 2,569,600 2.0
ACOM CO., LTD. 1,398,595 -2.1 1,397,438 1,397,828 1,392,076 1,397,353 -0.1 1,402,374 0.4 1,408,598 0.8 1,404,250 0.9 0.5 1,415,200 1.3
1,397,733 -2.0 1,396,791 1,397,343 1,391,703 1,397,049 -0.0 1,402,114 0.4 1,408,379 0.8 1,404,068 0.9 0.5 1,415,200 1.3
EASY BUY Public Company Limited 1,041,198 10.6 1,053,573 1,078,706 1,105,297 1,122,447 7.8 1,119,793 6.3 1,129,795 4.7 1,140,320 3.2 1.6 1,154,400 2.8
Credit Card Business 171,681 16.4 180,897 190,803 203,050 215,687 25.6 227,005 25.5 235,722 23.5 244,514 20.4 13.4 259,000 20.1
Installment Sales Finance Business 22,879 -48.7 21,237 18,585 17,338 17,084 -25.3 16,177 -23.8 15,253 -17.9 13,559 -21.8 -20.6 14,100 -17.5
EASY BUY Public Company Limited 22,879 -2.0 21,237 18,585 17,338 17,084 -25.3 16,177 -23.8 15,253 -17.9 13,559 -21.8 -20.6 14,100 -17.5
Loan Servicing Business 323,833 0.7 329,825 329,529 330,958 330,649 2.1 331,633 0.5 332,556 0.9 334,847 1.2 1.3 - -
Banking Business 25,004 -18.6 22,084 20,443 19,915 20,468 -18.1 21,497 -2.7 20,095 -1.7 22,801 14.5 11.4 - - Notes : 1. Loan Business: Number of loan accounts with loans receivable. : 2. Credit Card Business: Number of cardholders. : 3. Installment Sales Finance Business: Number of contracts with receivables outstanding. : 4. Loan Servicing Business: Number of accounts with outstanding purchased receivables.
6. Other Indices (Consolidated)
Number of outlets 1,230 26 1,226 1,245 1,245 1,246 16 1,244 -2 1,244 -2 1,243
Number of Employees (Permanent Employees) 5,643 -123 5,783 5,795 5,820 5,820 177 5,953 133 5,976 156 6,016
2015/3
2014/6 2014/9 2014/12 2015/3yoy %
2014/3
Exclude Right to Reimbursement of DC Cash One’s credit
2014/3 2016/3(E)
2014/3 2016/3(E)2015/3
2015/3
2014/6 2014/9 2014/12
2015/3
2014/6
2016/3
2015/6 2015/9 2015/12 2016/3yoy %
196
-3
2016/3
2015/6 2015/9 2015/12 2016/3
2016/3
2015/6 2015/9 2015/12 2016/3
yoy % ytd %
yoy %yoy %ytd %yoy %yoy %yoy %
yoy % yoy % yoy % yoy % yoy % yoy %
yoy yoy ytd ytd ytd yoy2014/9 2014/12 2015/3
- 4 -
Trend in Actual Results and Estimates (Non-consolidated)
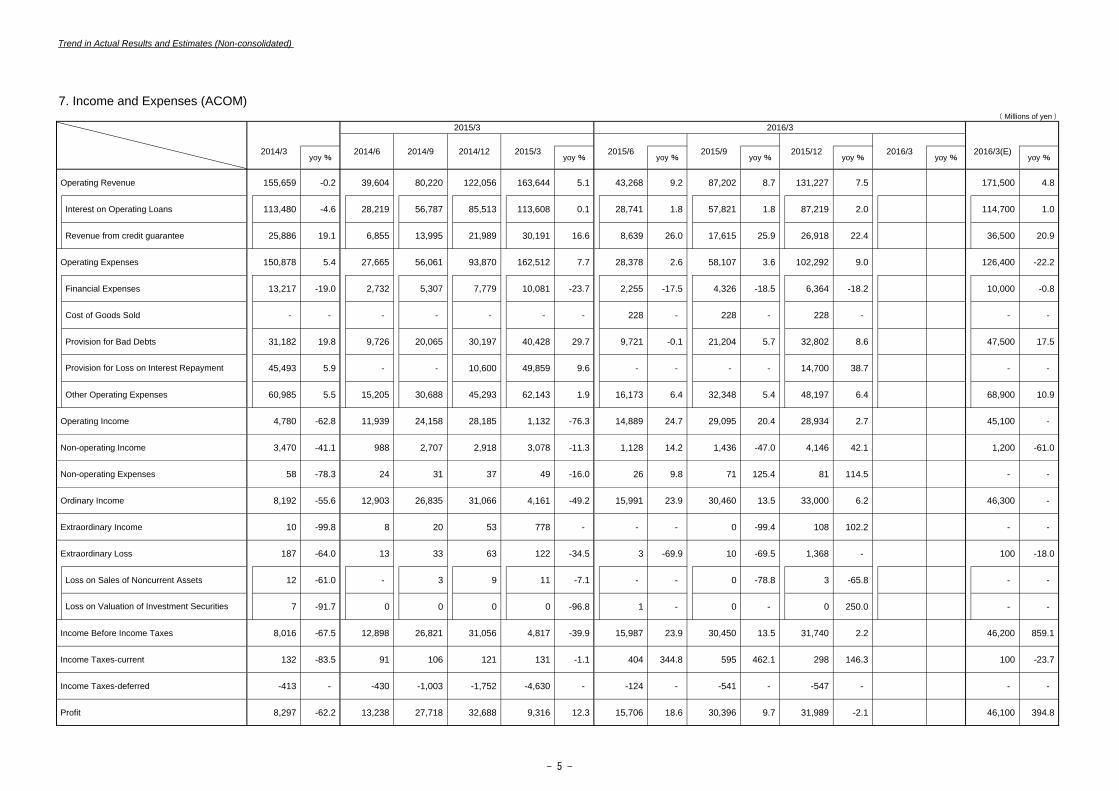
7. Income and Expenses (ACOM)( Millions of yen )
Operating Revenue 155,659 -0.2 39,604 80,220 122,056 163,644 5.1 43,268 9.2 87,202 8.7 131,227 7.5 171,500 4.8
Interest on Operating Loans 113,480 -4.6 28,219 56,787 85,513 113,608 0.1 28,741 1.8 57,821 1.8 87,219 2.0 114,700 1.0
Revenue from credit guarantee 25,886 19.1 6,855 13,995 21,989 30,191 16.6 8,639 26.0 17,615 25.9 26,918 22.4 36,500 20.9
Operating Expenses 150,878 5.4 27,665 56,061 93,870 162,512 7.7 28,378 2.6 58,107 3.6 102,292 9.0 126,400 -22.2
Financial Expenses 13,217 -19.0 2,732 5,307 7,779 10,081 -23.7 2,255 -17.5 4,326 -18.5 6,364 -18.2 10,000 -0.8
Cost of Goods Sold - - - - - - - 228 - 228 - 228 - - -
Provision for Bad Debts 31,182 19.8 9,726 20,065 30,197 40,428 29.7 9,721 -0.1 21,204 5.7 32,802 8.6 47,500 17.5
45,493 5.9 - - 10,600 49,859 9.6 - - - - 14,700 38.7 - -
Other Operating Expenses 60,985 5.5 15,205 30,688 45,293 62,143 1.9 16,173 6.4 32,348 5.4 48,197 6.4 68,900 10.9
Operating Income 4,780 -62.8 11,939 24,158 28,185 1,132 -76.3 14,889 24.7 29,095 20.4 28,934 2.7 45,100 -
Non-operating Income 3,470 -41.1 988 2,707 2,918 3,078 -11.3 1,128 14.2 1,436 -47.0 4,146 42.1 1,200 -61.0
Non-operating Expenses 58 -78.3 24 31 37 49 -16.0 26 9.8 71 125.4 81 114.5 - -
Ordinary Income 8,192 -55.6 12,903 26,835 31,066 4,161 -49.2 15,991 23.9 30,460 13.5 33,000 6.2 46,300 -
Extraordinary Income 10 -99.8 8 20 53 778 - - - 0 -99.4 108 102.2 - -
Extraordinary Loss 187 -64.0 13 33 63 122 -34.5 3 -69.9 10 -69.5 1,368 - 100 -18.0
Loss on Sales of Noncurrent Assets 12 -61.0 - 3 9 11 -7.1 - - 0 -78.8 3 -65.8 - -
7 -91.7 0 0 0 0 -96.8 1 - 0 - 0 250.0 - -
Income Before Income Taxes 8,016 -67.5 12,898 26,821 31,056 4,817 -39.9 15,987 23.9 30,450 13.5 31,740 2.2 46,200 859.1
Income Taxes-current 132 -83.5 91 106 121 131 -1.1 404 344.8 595 462.1 298 146.3 100 -23.7
Income Taxes-deferred -413 - -430 -1,003 -1,752 -4,630 - -124 - -541 - -547 - - -
Profit 8,297 -62.2 13,238 27,718 32,688 9,316 12.3 15,706 18.6 30,396 9.7 31,989 -2.1 46,100 394.8
Loss on Valuation of Investment Securities
Provision for Loss on Interest Repayment
2016/3(E)2014/6 2014/9 2014/12 2015/3 2015/6 2015/12 2016/3
2015/3 2016/3
2015/9yoy %yoy %
2014/3yoy %yoy %yoy %yoy %yoy %
- 5 -
Trend in Actual Results and Estimates (Non-consolidated)
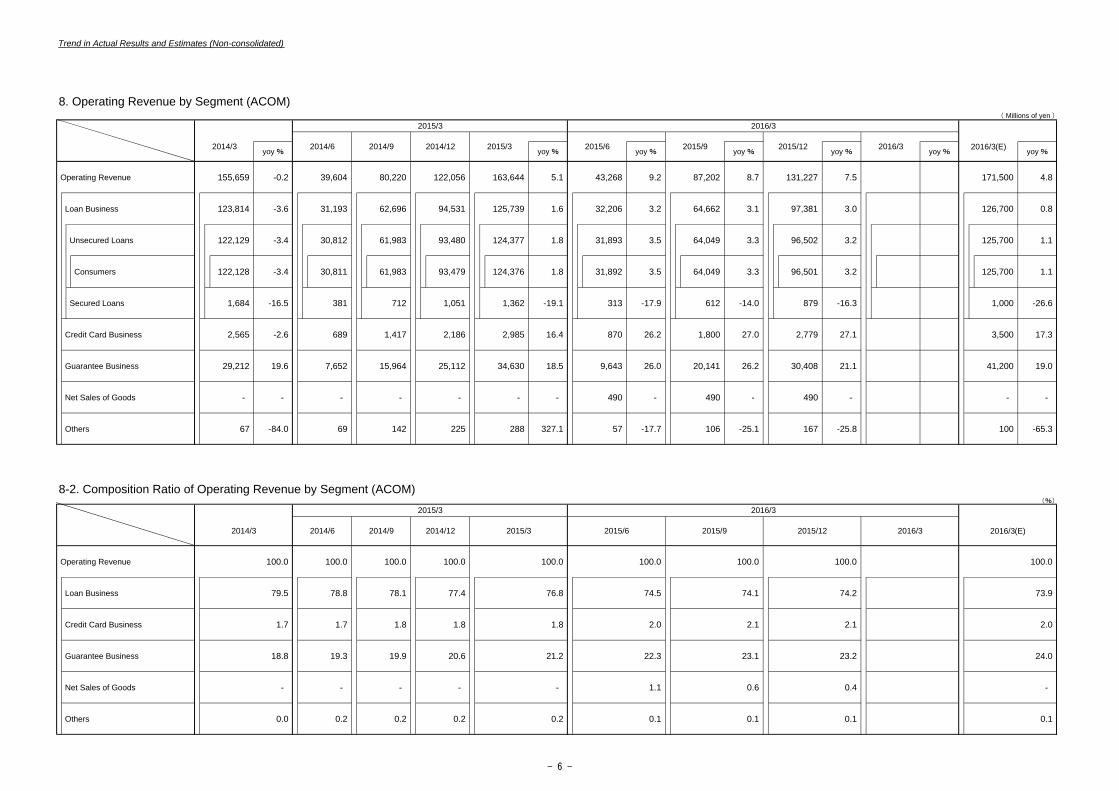
8. Operating Revenue by Segment (ACOM)( Millions of yen )
Operating Revenue 155,659 -0.2 39,604 80,220 122,056 163,644 5.1 43,268 9.2 87,202 8.7 131,227 7.5 171,500 4.8
Loan Business 123,814 -3.6 31,193 62,696 94,531 125,739 1.6 32,206 3.2 64,662 3.1 97,381 3.0 126,700 0.8
Unsecured Loans 122,129 -3.4 30,812 61,983 93,480 124,377 1.8 31,893 3.5 64,049 3.3 96,502 3.2 125,700 1.1
Consumers 122,128 -3.4 30,811 61,983 93,479 124,376 1.8 31,892 3.5 64,049 3.3 96,501 3.2 125,700 1.1
Secured Loans 1,684 -16.5 381 712 1,051 1,362 -19.1 313 -17.9 612 -14.0 879 -16.3 1,000 -26.6
Credit Card Business 2,565 -2.6 689 1,417 2,186 2,985 16.4 870 26.2 1,800 27.0 2,779 27.1 3,500 17.3
Guarantee Business 29,212 19.6 7,652 15,964 25,112 34,630 18.5 9,643 26.0 20,141 26.2 30,408 21.1 41,200 19.0
Net Sales of Goods - - - - - - - 490 - 490 - 490 - - -
Others 67 -84.0 69 142 225 288 327.1 57 -17.7 106 -25.1 167 -25.8 100 -65.3
8-2. Composition Ratio of Operating Revenue by Segment (ACOM)(%)
Operating Revenue 100.0 100.0 100.0 100.0 100.0 100.0 100.0 100.0 100.0
Loan Business 79.5 78.8 78.1 77.4 76.8 74.5 74.1 74.2 73.9
Credit Card Business 1.7 1.7 1.8 1.8 1.8 2.0 2.1 2.1 2.0
Guarantee Business 18.8 19.3 19.9 20.6 21.2 22.3 23.1 23.2 24.0
Net Sales of Goods - - - - - 1.1 0.6 0.4 -
Others 0.0 0.2 0.2 0.2 0.2 0.1 0.1 0.1 0.1
2016/3(E)2014/3 2015/6 2015/9 2015/122014/6 2014/9 2014/12 2015/3
2016/3(E)2016/3
2016/3
2016/3
2015/9 2015/12yoy % yoy % yoy % yoy % yoy %
2015/3
2014/3 2015/62014/6 2014/9 2014/12 2015/3yoy % yoy %
2015/3 2016/3
- 6 -
Trend in Actual Results and Estimates (Non-consolidated)
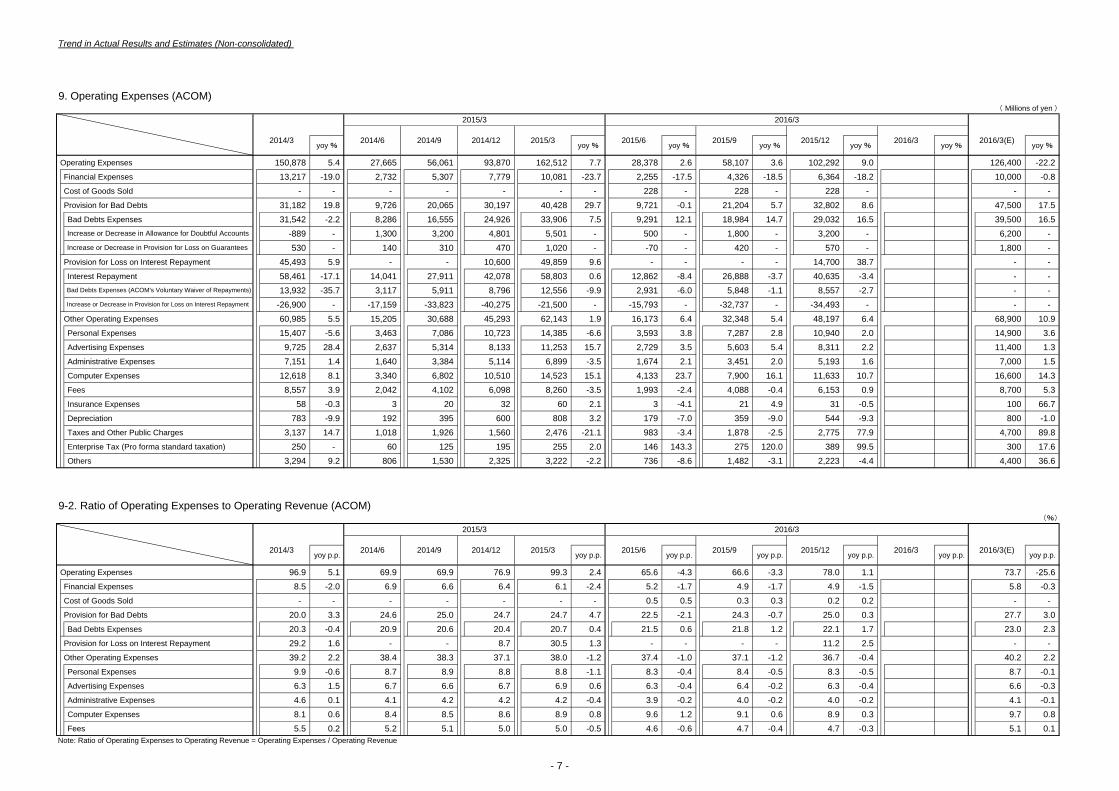
9. Operating Expenses (ACOM)( Millions of yen )
Operating Expenses 150,878 5.4 27,665 56,061 93,870 162,512 7.7 28,378 2.6 58,107 3.6 102,292 9.0 126,400 -22.2 Financial Expenses 13,217 -19.0 2,732 5,307 7,779 10,081 -23.7 2,255 -17.5 4,326 -18.5 6,364 -18.2 10,000 -0.8 Cost of Goods Sold - - - - - - - 228 - 228 - 228 - - - Provision for Bad Debts 31,182 19.8 9,726 20,065 30,197 40,428 29.7 9,721 -0.1 21,204 5.7 32,802 8.6 47,500 17.5 Bad Debts Expenses 31,542 -2.2 8,286 16,555 24,926 33,906 7.5 9,291 12.1 18,984 14.7 29,032 16.5 39,500 16.5
-889 - 1,300 3,200 4,801 5,501 - 500 - 1,800 - 3,200 - 6,200 - 530 - 140 310 470 1,020 - -70 - 420 - 570 - 1,800 -
Provision for Loss on Interest Repayment 45,493 5.9 - - 10,600 49,859 9.6 - - - - 14,700 38.7 - - Interest Repayment 58,461 -17.1 14,041 27,911 42,078 58,803 0.6 12,862 -8.4 26,888 -3.7 40,635 -3.4 - -
13,932 -35.7 3,117 5,911 8,796 12,556 -9.9 2,931 -6.0 5,848 -1.1 8,557 -2.7 - - -26,900 - -17,159 -33,823 -40,275 -21,500 - -15,793 - -32,737 - -34,493 - - -
Other Operating Expenses 60,985 5.5 15,205 30,688 45,293 62,143 1.9 16,173 6.4 32,348 5.4 48,197 6.4 68,900 10.9 Personal Expenses 15,407 -5.6 3,463 7,086 10,723 14,385 -6.6 3,593 3.8 7,287 2.8 10,940 2.0 14,900 3.6 Advertising Expenses 9,725 28.4 2,637 5,314 8,133 11,253 15.7 2,729 3.5 5,603 5.4 8,311 2.2 11,400 1.3 Administrative Expenses 7,151 1.4 1,640 3,384 5,114 6,899 -3.5 1,674 2.1 3,451 2.0 5,193 1.6 7,000 1.5 Computer Expenses 12,618 8.1 3,340 6,802 10,510 14,523 15.1 4,133 23.7 7,900 16.1 11,633 10.7 16,600 14.3 Fees 8,557 3.9 2,042 4,102 6,098 8,260 -3.5 1,993 -2.4 4,088 -0.4 6,153 0.9 8,700 5.3 Insurance Expenses 58 -0.3 3 20 32 60 2.1 3 -4.1 21 4.9 31 -0.5 100 66.7 Depreciation 783 -9.9 192 395 600 808 3.2 179 -7.0 359 -9.0 544 -9.3 800 -1.0 Taxes and Other Public Charges 3,137 14.7 1,018 1,926 1,560 2,476 -21.1 983 -3.4 1,878 -2.5 2,775 77.9 4,700 89.8 Enterprise Tax (Pro forma standard taxation) 250 - 60 125 195 255 2.0 146 143.3 275 120.0 389 99.5 300 17.6 Others 3,294 9.2 806 1,530 2,325 3,222 -2.2 736 -8.6 1,482 -3.1 2,223 -4.4 4,400 36.6
9-2. Ratio of Operating Expenses to Operating Revenue (ACOM)(%)
Operating Expenses 96.9 5.1 69.9 69.9 76.9 99.3 2.4 65.6 -4.3 66.6 -3.3 78.0 1.1 73.7 -25.6 Financial Expenses 8.5 -2.0 6.9 6.6 6.4 6.1 -2.4 5.2 -1.7 4.9 -1.7 4.9 -1.5 5.8 -0.3 Cost of Goods Sold - - - - - - - 0.5 0.5 0.3 0.3 0.2 0.2 - - Provision for Bad Debts 20.0 3.3 24.6 25.0 24.7 24.7 4.7 22.5 -2.1 24.3 -0.7 25.0 0.3 27.7 3.0 Bad Debts Expenses 20.3 -0.4 20.9 20.6 20.4 20.7 0.4 21.5 0.6 21.8 1.2 22.1 1.7 23.0 2.3
Provision for Loss on Interest Repayment 29.2 1.6 - - 8.7 30.5 1.3 - - - - 11.2 2.5 - - Other Operating Expenses 39.2 2.2 38.4 38.3 37.1 38.0 -1.2 37.4 -1.0 37.1 -1.2 36.7 -0.4 40.2 2.2 Personal Expenses 9.9 -0.6 8.7 8.9 8.8 8.8 -1.1 8.3 -0.4 8.4 -0.5 8.3 -0.5 8.7 -0.1 Advertising Expenses 6.3 1.5 6.7 6.6 6.7 6.9 0.6 6.3 -0.4 6.4 -0.2 6.3 -0.4 6.6 -0.3 Administrative Expenses 4.6 0.1 4.1 4.2 4.2 4.2 -0.4 3.9 -0.2 4.0 -0.2 4.0 -0.2 4.1 -0.1 Computer Expenses 8.1 0.6 8.4 8.5 8.6 8.9 0.8 9.6 1.2 9.1 0.6 8.9 0.3 9.7 0.8 Fees 5.5 0.2 5.2 5.1 5.0 5.0 -0.5 4.6 -0.6 4.7 -0.4 4.7 -0.3 5.1 0.1
Note: Ratio of Operating Expenses to Operating Revenue = Operating Expenses / Operating Revenue
2016/3
2015/6 2015/9 2015/12 2016/3
2015/3
2014/6 2014/9 2014/12 2015/3
2015/3
2014/6 2014/9 2014/12 2015/3
Increase or Decrease in Provision for Loss on Interest Repayment
Bad Debts Expenses (ACOM's Voluntary Waiver of Repayments)
Increase or Decrease in Provision for Loss on Guarantees
Increase or Decrease in Allowance for Doubtful Accounts
2016/3(E)2014/3
2016/3(E)2014/3
2016/3
2015/6 2015/9 2015/12 2016/3
yoy %yoy %
yoy p.p.yoy p.p.
yoy %yoy %yoy %yoy %yoy %
yoy p.p.yoy p.p.yoy p.p.yoy p.p.yoy p.p.
- 7 -
Trend in Actual Results and Estimates (Non-consolidated)
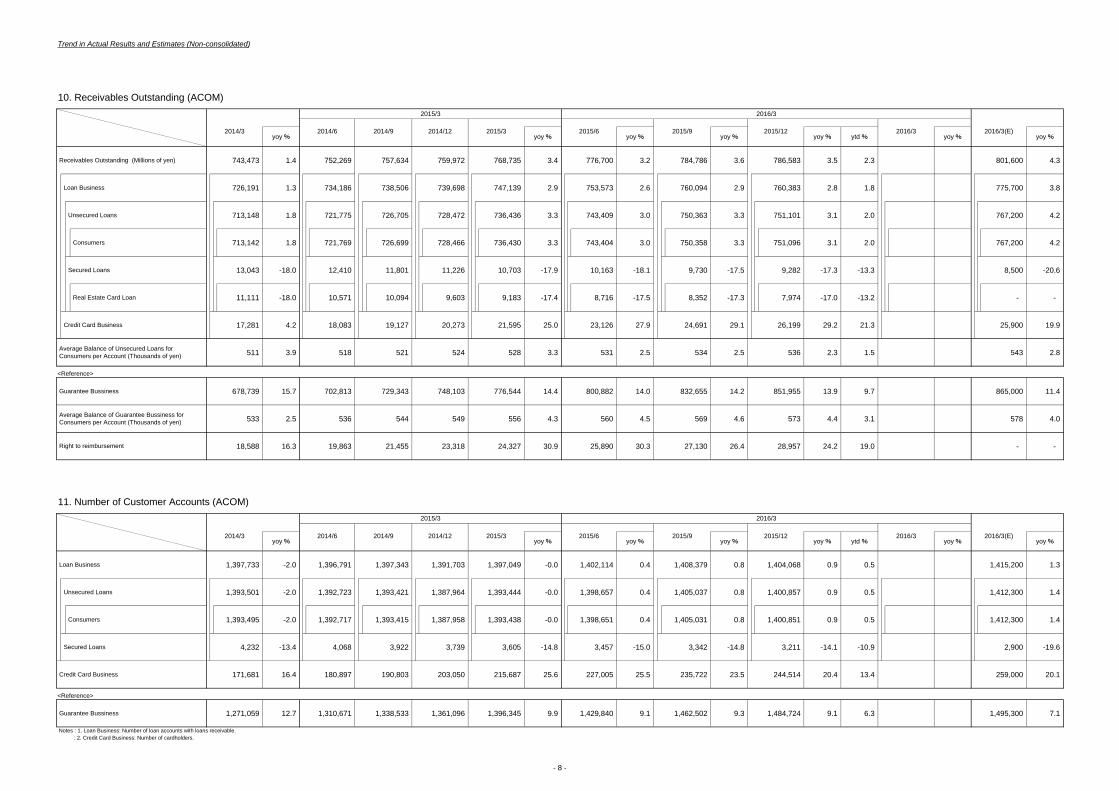
10. Receivables Outstanding (ACOM)
Receivables Outstanding (Millions of yen) 743,473 1.4 752,269 757,634 759,972 768,735 3.4 776,700 3.2 784,786 3.6 786,583 3.5 2.3 801,600 4.3
Loan Business 726,191 1.3 734,186 738,506 739,698 747,139 2.9 753,573 2.6 760,094 2.9 760,383 2.8 1.8 775,700 3.8
Unsecured Loans 713,148 1.8 721,775 726,705 728,472 736,436 3.3 743,409 3.0 750,363 3.3 751,101 3.1 2.0 767,200 4.2
Consumers 713,142 1.8 721,769 726,699 728,466 736,430 3.3 743,404 3.0 750,358 3.3 751,096 3.1 2.0 767,200 4.2
Secured Loans 13,043 -18.0 12,410 11,801 11,226 10,703 -17.9 10,163 -18.1 9,730 -17.5 9,282 -17.3 -13.3 8,500 -20.6
Real Estate Card Loan 11,111 -18.0 10,571 10,094 9,603 9,183 -17.4 8,716 -17.5 8,352 -17.3 7,974 -17.0 -13.2 - -
Credit Card Business 17,281 4.2 18,083 19,127 20,273 21,595 25.0 23,126 27.9 24,691 29.1 26,199 29.2 21.3 25,900 19.9
511 3.9 518 521 524 528 3.3 531 2.5 534 2.5 536 2.3 1.5 543 2.8
<Reference>
Guarantee Bussiness 678,739 15.7 702,813 729,343 748,103 776,544 14.4 800,882 14.0 832,655 14.2 851,955 13.9 9.7 865,000 11.4
533 2.5 536 544 549 556 4.3 560 4.5 569 4.6 573 4.4 3.1 578 4.0
18,588 16.3 19,863 21,455 23,318 24,327 30.9 25,890 30.3 27,130 26.4 28,957 24.2 19.0 - -
11. Number of Customer Accounts (ACOM)
Loan Business 1,397,733 -2.0 1,396,791 1,397,343 1,391,703 1,397,049 -0.0 1,402,114 0.4 1,408,379 0.8 1,404,068 0.9 0.5 1,415,200 1.3
Unsecured Loans 1,393,501 -2.0 1,392,723 1,393,421 1,387,964 1,393,444 -0.0 1,398,657 0.4 1,405,037 0.8 1,400,857 0.9 0.5 1,412,300 1.4
Consumers 1,393,495 -2.0 1,392,717 1,393,415 1,387,958 1,393,438 -0.0 1,398,651 0.4 1,405,031 0.8 1,400,851 0.9 0.5 1,412,300 1.4
Secured Loans 4,232 -13.4 4,068 3,922 3,739 3,605 -14.8 3,457 -15.0 3,342 -14.8 3,211 -14.1 -10.9 2,900 -19.6
Credit Card Business 171,681 16.4 180,897 190,803 203,050 215,687 25.6 227,005 25.5 235,722 23.5 244,514 20.4 13.4 259,000 20.1
<Reference>
Guarantee Bussiness 1,271,059 12.7 1,310,671 1,338,533 1,361,096 1,396,345 9.9 1,429,840 9.1 1,462,502 9.3 1,484,724 9.1 6.3 1,495,300 7.1
Notes : 1. Loan Business: Number of loan accounts with loans receivable. : 2. Credit Card Business: Number of cardholders.
yoy %yoy %yoy %yoy %
yoy %
yoy %yoy %ytd %yoy %
2016/3
2015/6 2015/9 2015/12 2016/3yoy % yoy % yoy % ytd % yoy %
Right to reimbursement
2016/3(E)
2015/3
2014/3 2014/6 2014/9 2014/12 2015/3
2016/3
2015/6 2015/9 2015/12 2016/3
2016/3(E)
Average Balance of Unsecured Loans for Consumers per Account (Thousands of yen)
Average Balance of Guarantee Bussiness for Consumers per Account (Thousands of yen)
yoy % yoy %
2015/3
2014/3 2014/6 2014/9 2014/12 2015/3
- 8 -
Trend in Actual Results and Estimates (Non-consolidated)
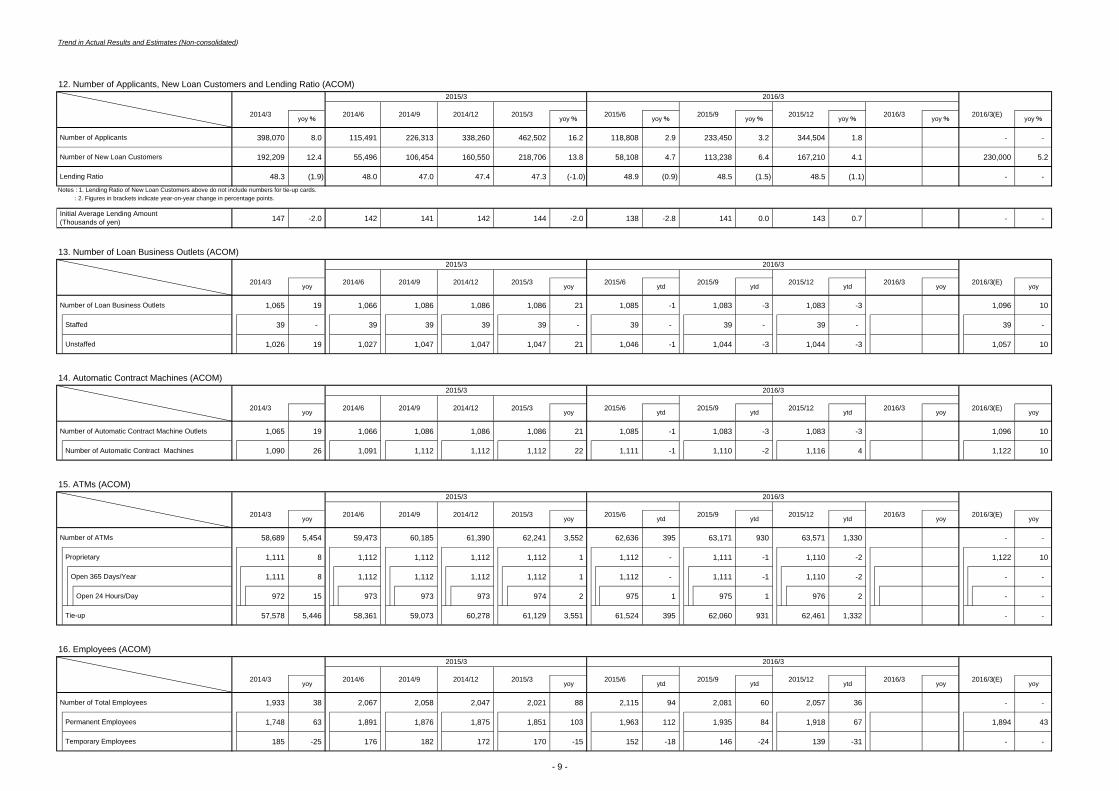
12. Number of Applicants, New Loan Customers and Lending Ratio (ACOM)
Number of Applicants 398,070 8.0 115,491 226,313 338,260 462,502 16.2 118,808 2.9 233,450 3.2 344,504 1.8 - -
Number of New Loan Customers 192,209 12.4 55,496 106,454 160,550 218,706 13.8 58,108 4.7 113,238 6.4 167,210 4.1 230,000 5.2
Lending Ratio 48.3 (1.9) 48.0 47.0 47.4 47.3 (-1.0) 48.9 (0.9) 48.5 (1.5) 48.5 (1.1) - - Notes : 1. Lending Ratio of New Loan Customers above do not include numbers for tie-up cards. : 2. Figures in brackets indicate year-on-year change in percentage points.
147 -2.0 142 141 142 144 -2.0 138 -2.8 141 0.0 143 0.7 - -
13. Number of Loan Business Outlets (ACOM)
Number of Loan Business Outlets 1,065 19 1,066 1,086 1,086 1,086 21 1,085 -1 1,083 -3 1,083 -3 1,096 10
Staffed 39 - 39 39 39 39 - 39 - 39 - 39 - 39 -
Unstaffed 1,026 19 1,027 1,047 1,047 1,047 21 1,046 -1 1,044 -3 1,044 -3 1,057 10
14. Automatic Contract Machines (ACOM)
Number of Automatic Contract Machine Outlets 1,065 19 1,066 1,086 1,086 1,086 21 1,085 -1 1,083 -3 1,083 -3 1,096 10
Number of Automatic Contract Machines 1,090 26 1,091 1,112 1,112 1,112 22 1,111 -1 1,110 -2 1,116 4 1,122 10
15. ATMs (ACOM)
Number of ATMs 58,689 5,454 59,473 60,185 61,390 62,241 3,552 62,636 395 63,171 930 63,571 1,330 - -
Proprietary 1,111 8 1,112 1,112 1,112 1,112 1 1,112 - 1,111 -1 1,110 -2 1,122 10
Open 365 Days/Year 1,111 8 1,112 1,112 1,112 1,112 1 1,112 - 1,111 -1 1,110 -2 - -
Open 24 Hours/Day 972 15 973 973 973 974 2 975 1 975 1 976 2 - -
Tie-up 57,578 5,446 58,361 59,073 60,278 61,129 3,551 61,524 395 62,060 931 62,461 1,332 - -
16. Employees (ACOM)
Number of Total Employees 1,933 38 2,067 2,058 2,047 2,021 88 2,115 94 2,081 60 2,057 36 - -
Permanent Employees 1,748 63 1,891 1,876 1,875 1,851 103 1,963 112 1,935 84 1,918 67 1,894 43
Temporary Employees 185 -25 176 182 172 170 -15 152 -18 146 -24 139 -31 - -
ytdytdyoyyoy
yoyyoyytdytdytdyoyyoy
ytdyoyyoy
yoyyoyytdytdytdyoyyoy
yoy %
yoyyoyytdytd2014/12 2015/3
2015/3
2015/3
2014/6 2014/9 2014/12 2015/3
2015/3
2014/6 2014/9 2014/12 2015/3 yoy %
2016/3(E)
2016/3(E)2014/6 2014/9 2014/12 2015/3
2016/3
2015/6 2015/9 2015/12 2016/3 yoyyoyytd
2016/3(E)2014/3
2015/3
2014/6 2014/9 2014/12 2015/3
2016/3
2015/6 2015/9 2015/12 2016/3
2014/3
2014/3
2016/3(E)
2016/3(E)
2016/3
2015/6 2015/9 2015/12 2016/3
2015/3
2014/6 2014/9
Initial Average Lending Amount (Thousands of yen)
2014/3
2014/3
yoy %
2016/3
2015/6 2015/9 2015/12 2016/3yoy % yoy % yoy % yoy %
2016/3
2015/6 2015/9 2015/12 2016/3
- 9 -
Trend in Actual Results and Estimates (Non-consolidated)
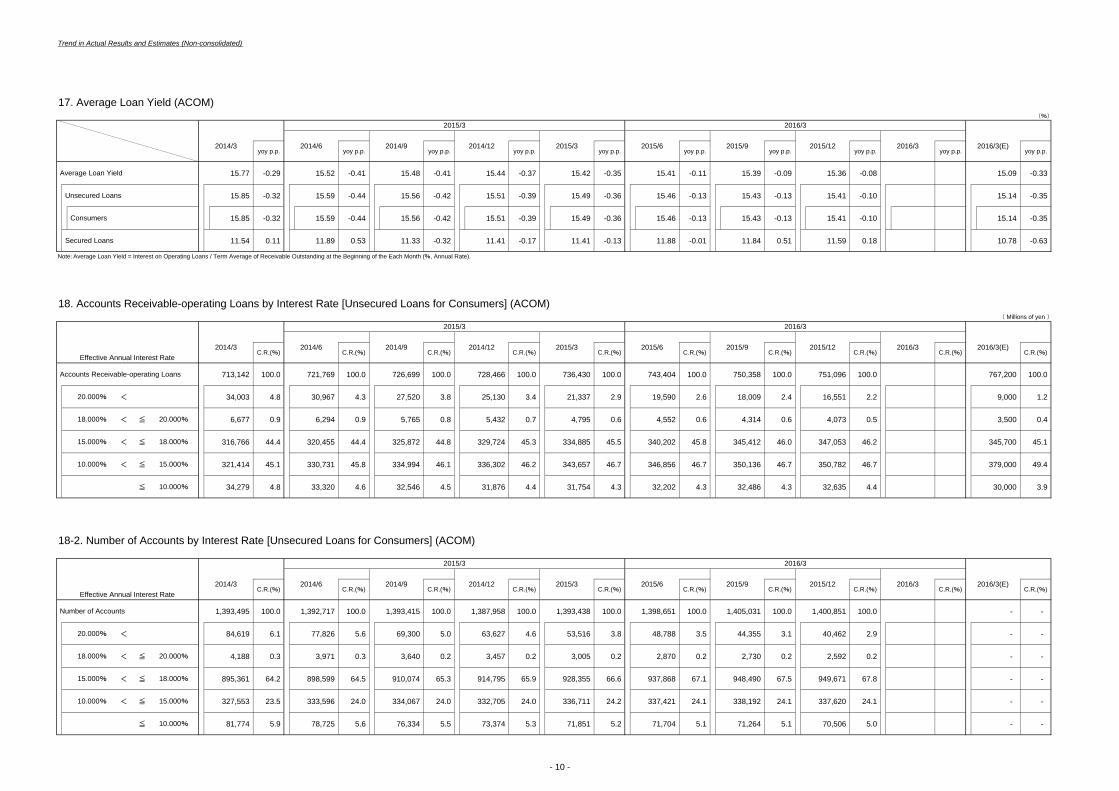
17. Average Loan Yield (ACOM)(%)
Average Loan Yield 15.77 -0.29 15.52 -0.41 15.48 -0.41 15.44 -0.37 15.42 -0.35 15.41 -0.11 15.39 -0.09 15.36 -0.08 15.09 -0.33
Unsecured Loans 15.85 -0.32 15.59 -0.44 15.56 -0.42 15.51 -0.39 15.49 -0.36 15.46 -0.13 15.43 -0.13 15.41 -0.10 15.14 -0.35
Consumers 15.85 -0.32 15.59 -0.44 15.56 -0.42 15.51 -0.39 15.49 -0.36 15.46 -0.13 15.43 -0.13 15.41 -0.10 15.14 -0.35
Secured Loans 11.54 0.11 11.89 0.53 11.33 -0.32 11.41 -0.17 11.41 -0.13 11.88 -0.01 11.84 0.51 11.59 0.18 10.78 -0.63
Note:Average Loan Yield = Interest on Operating Loans / Term Average of Receivable Outstanding at the Beginning of the Each Month (%, Annual Rate).
18. Accounts Receivable-operating Loans by Interest Rate [Unsecured Loans for Consumers] (ACOM)( Millions of yen )
Accounts Receivable-operating Loans 713,142 100.0 721,769 100.0 726,699 100.0 728,466 100.0 736,430 100.0 743,404 100.0 750,358 100.0 751,096 100.0 767,200 100.0
20.000% < 34,003 4.8 30,967 4.3 27,520 3.8 25,130 3.4 21,337 2.9 19,590 2.6 18,009 2.4 16,551 2.2 9,000 1.2
18.000% < ≦ 20.000% 6,677 0.9 6,294 0.9 5,765 0.8 5,432 0.7 4,795 0.6 4,552 0.6 4,314 0.6 4,073 0.5 3,500 0.4
15.000% < ≦ 18.000% 316,766 44.4 320,455 44.4 325,872 44.8 329,724 45.3 334,885 45.5 340,202 45.8 345,412 46.0 347,053 46.2 345,700 45.1
10.000% < ≦ 15.000% 321,414 45.1 330,731 45.8 334,994 46.1 336,302 46.2 343,657 46.7 346,856 46.7 350,136 46.7 350,782 46.7 379,000 49.4
≦ 10.000% 34,279 4.8 33,320 4.6 32,546 4.5 31,876 4.4 31,754 4.3 32,202 4.3 32,486 4.3 32,635 4.4 30,000 3.9
18-2. Number of Accounts by Interest Rate [Unsecured Loans for Consumers] (ACOM)
Number of Accounts 1,393,495 100.0 1,392,717 100.0 1,393,415 100.0 1,387,958 100.0 1,393,438 100.0 1,398,651 100.0 1,405,031 100.0 1,400,851 100.0 - -
20.000% < 84,619 6.1 77,826 5.6 69,300 5.0 63,627 4.6 53,516 3.8 48,788 3.5 44,355 3.1 40,462 2.9 - -
18.000% < ≦ 20.000% 4,188 0.3 3,971 0.3 3,640 0.2 3,457 0.2 3,005 0.2 2,870 0.2 2,730 0.2 2,592 0.2 - -
15.000% < ≦ 18.000% 895,361 64.2 898,599 64.5 910,074 65.3 914,795 65.9 928,355 66.6 937,868 67.1 948,490 67.5 949,671 67.8 - -
10.000% < ≦ 15.000% 327,553 23.5 333,596 24.0 334,067 24.0 332,705 24.0 336,711 24.2 337,421 24.1 338,192 24.1 337,620 24.1 - -
≦ 10.000% 81,774 5.9 78,725 5.6 76,334 5.5 73,374 5.3 71,851 5.2 71,704 5.1 71,264 5.1 70,506 5.0 - -
C.R.(%)C.R.(%)C.R.(%)C.R.(%)C.R.(%)
yoy p.p. yoy p.p. yoy p.p. yoy p.p.
C.R.(%) C.R.(%) C.R.(%) C.R.(%) C.R.(%) C.R.(%) C.R.(%) C.R.(%) C.R.(%) C.R.(%)Effective Annual Interest Rate
2015/3
2015/3
2014/6 2014/9 2014/12 2015/3
2014/9 2014/12yoy p.p. yoy p.p. yoy p.p. yoy p.p. yoy p.p. yoy p.p.
Effective Annual Interest Rate
2015/3
2014/3 2014/9 2014/12 2015/3C.R.(%)C.R.(%)C.R.(%)C.R.(%)C.R.(%)
2015/3
2014/6
2016/3(E)2014/6
2016/3(E)2014/3
2016/3(E)2014/3
2016/3
2015/6 2015/9 2015/12 2016/3
2016/3
2015/6 2015/9 2015/12 2016/3
2015/6 2015/9 2015/12 2016/3
2016/3
- 10 -
Trend in Actual Results and Estimates (Non-consolidated)
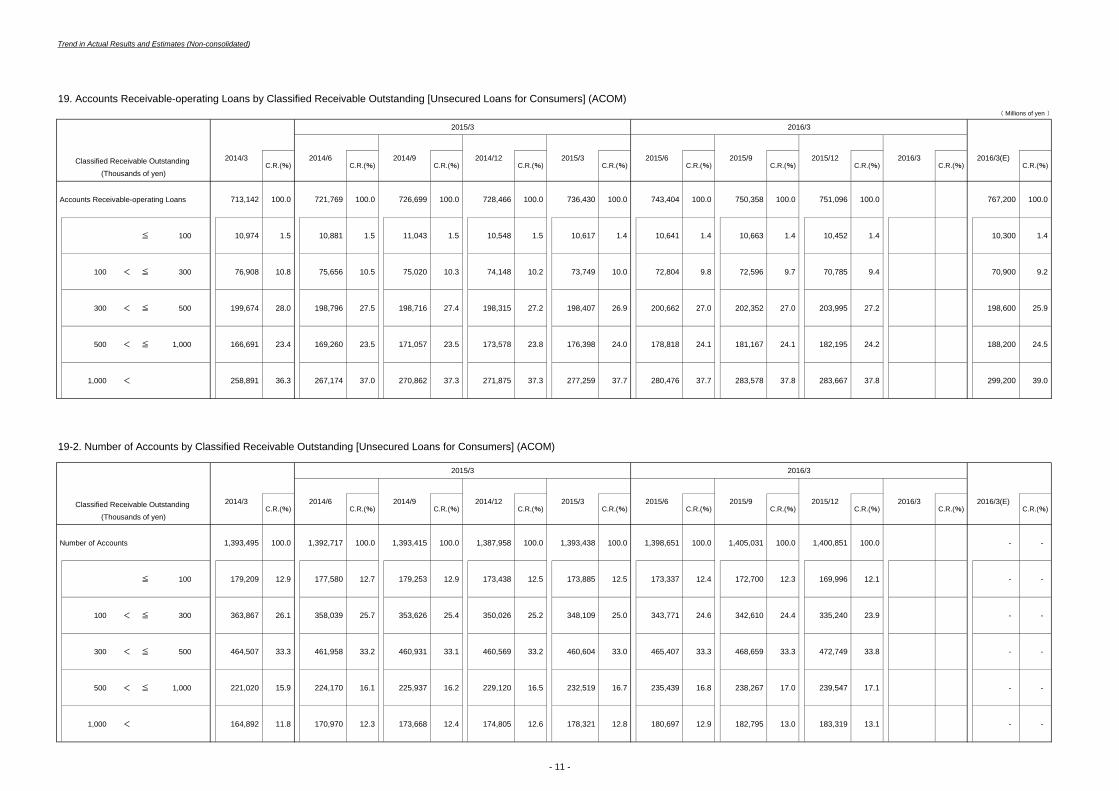
19. Accounts Receivable-operating Loans by Classified Receivable Outstanding [Unsecured Loans for Consumers] (ACOM)( Millions of yen )
Accounts Receivable-operating Loans 713,142 100.0 721,769 100.0 726,699 100.0 728,466 100.0 736,430 100.0 743,404 100.0 750,358 100.0 751,096 100.0 767,200 100.0
≦ 100 10,974 1.5 10,881 1.5 11,043 1.5 10,548 1.5 10,617 1.4 10,641 1.4 10,663 1.4 10,452 1.4 10,300 1.4
100 < ≦ 300 76,908 10.8 75,656 10.5 75,020 10.3 74,148 10.2 73,749 10.0 72,804 9.8 72,596 9.7 70,785 9.4 70,900 9.2
300 < ≦ 500 199,674 28.0 198,796 27.5 198,716 27.4 198,315 27.2 198,407 26.9 200,662 27.0 202,352 27.0 203,995 27.2 198,600 25.9
500 < ≦ 1,000 166,691 23.4 169,260 23.5 171,057 23.5 173,578 23.8 176,398 24.0 178,818 24.1 181,167 24.1 182,195 24.2 188,200 24.5
1,000 < 258,891 36.3 267,174 37.0 270,862 37.3 271,875 37.3 277,259 37.7 280,476 37.7 283,578 37.8 283,667 37.8 299,200 39.0
19-2. Number of Accounts by Classified Receivable Outstanding [Unsecured Loans for Consumers] (ACOM)
Number of Accounts 1,393,495 100.0 1,392,717 100.0 1,393,415 100.0 1,387,958 100.0 1,393,438 100.0 1,398,651 100.0 1,405,031 100.0 1,400,851 100.0 - -
≦ 100 179,209 12.9 177,580 12.7 179,253 12.9 173,438 12.5 173,885 12.5 173,337 12.4 172,700 12.3 169,996 12.1 - -
100 < ≦ 300 363,867 26.1 358,039 25.7 353,626 25.4 350,026 25.2 348,109 25.0 343,771 24.6 342,610 24.4 335,240 23.9 - -
300 < ≦ 500 464,507 33.3 461,958 33.2 460,931 33.1 460,569 33.2 460,604 33.0 465,407 33.3 468,659 33.3 472,749 33.8 - -
500 < ≦ 1,000 221,020 15.9 224,170 16.1 225,937 16.2 229,120 16.5 232,519 16.7 235,439 16.8 238,267 17.0 239,547 17.1 - -
1,000 < 164,892 11.8 170,970 12.3 173,668 12.4 174,805 12.6 178,321 12.8 180,697 12.9 182,795 13.0 183,319 13.1 - -
C.R.(%) C.R.(%) C.R.(%)C.R.(%) C.R.(%) C.R.(%) C.R.(%) C.R.(%)
C.R.(%)C.R.(%)C.R.(%)C.R.(%)C.R.(%)2014/3
2014/3 2016/3(E)2014/6 2014/9
2016/3(E)
2015/3
2015/32014/12
2016/3
2015/6 2015/9 2015/12 2016/3
Classified Receivable Outstanding (Thousands of yen)
(Thousands of yen)Classified Receivable Outstanding
C.R.(%)C.R.(%)
C.R.(%) C.R.(%)
2015/3
2014/6 2014/9 2014/12 2015/3C.R.(%)C.R.(%)C.R.(%)
2016/3
2015/6 2015/9 2015/12 2016/3
- 11 -
Trend in Actual Results and Estimates (Non-consolidated)
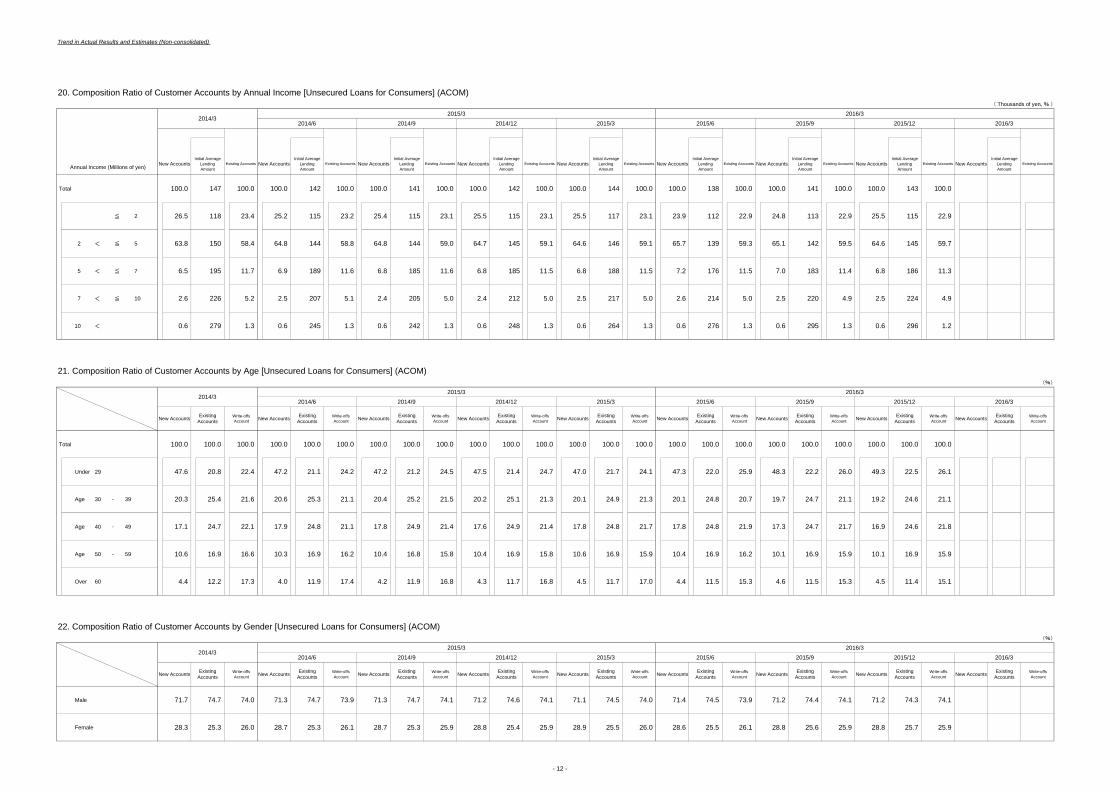
20. Composition Ratio of Customer Accounts by Annual Income [Unsecured Loans for Consumers] (ACOM)( Thousands of yen、% )
Total 100.0 147 100.0 100.0 142 100.0 100.0 141 100.0 100.0 142 100.0 100.0 144 100.0 100.0 138 100.0 100.0 141 100.0 100.0 143 100.0
≦ 2 26.5 118 23.4 25.2 115 23.2 25.4 115 23.1 25.5 115 23.1 25.5 117 23.1 23.9 112 22.9 24.8 113 22.9 25.5 115 22.9
2 < ≦ 5 63.8 150 58.4 64.8 144 58.8 64.8 144 59.0 64.7 145 59.1 64.6 146 59.1 65.7 139 59.3 65.1 142 59.5 64.6 145 59.7
5 < ≦ 7 6.5 195 11.7 6.9 189 11.6 6.8 185 11.6 6.8 185 11.5 6.8 188 11.5 7.2 176 11.5 7.0 183 11.4 6.8 186 11.3
7 < ≦ 10 2.6 226 5.2 2.5 207 5.1 2.4 205 5.0 2.4 212 5.0 2.5 217 5.0 2.6 214 5.0 2.5 220 4.9 2.5 224 4.9
10 < 0.6 279 1.3 0.6 245 1.3 0.6 242 1.3 0.6 248 1.3 0.6 264 1.3 0.6 276 1.3 0.6 295 1.3 0.6 296 1.2
21. Composition Ratio of Customer Accounts by Age [Unsecured Loans for Consumers] (ACOM)(%)
Total 100.0 100.0 100.0 100.0 100.0 100.0 100.0 100.0 100.0 100.0 100.0 100.0 100.0 100.0 100.0 100.0 100.0 100.0 100.0 100.0 100.0 100.0 100.0 100.0
Under 29 47.6 20.8 22.4 47.2 21.1 24.2 47.2 21.2 24.5 47.5 21.4 24.7 47.0 21.7 24.1 47.3 22.0 25.9 48.3 22.2 26.0 49.3 22.5 26.1
Age 30 39 20.3 25.4 21.6 20.6 25.3 21.1 20.4 25.2 21.5 20.2 25.1 21.3 20.1 24.9 21.3 20.1 24.8 20.7 19.7 24.7 21.1 19.2 24.6 21.1
Age 40 49 17.1 24.7 22.1 17.9 24.8 21.1 17.8 24.9 21.4 17.6 24.9 21.4 17.8 24.8 21.7 17.8 24.8 21.9 17.3 24.7 21.7 16.9 24.6 21.8
Age 50 59 10.6 16.9 16.6 10.3 16.9 16.2 10.4 16.8 15.8 10.4 16.9 15.8 10.6 16.9 15.9 10.4 16.9 16.2 10.1 16.9 15.9 10.1 16.9 15.9
Over 60 4.4 12.2 17.3 4.0 11.9 17.4 4.2 11.9 16.8 4.3 11.7 16.8 4.5 11.7 17.0 4.4 11.5 15.3 4.6 11.5 15.3 4.5 11.4 15.1
22. Composition Ratio of Customer Accounts by Gender [Unsecured Loans for Consumers] (ACOM)(%)
Male 71.7 74.7 74.0 71.3 74.7 73.9 71.3 74.7 74.1 71.2 74.6 74.1 71.1 74.5 74.0 71.4 74.5 73.9 71.2 74.4 74.1 71.2 74.3 74.1
Female 28.3 25.3 26.0 28.7 25.3 26.1 28.7 25.3 25.9 28.8 25.4 25.9 28.9 25.5 26.0 28.6 25.5 26.1 28.8 25.6 25.9 28.8 25.7 25.9
Write-offs Account
ExistingAccountsNew Accounts Write-offs
AccountExisting
AccountsNew Accounts Write-offs Account
ExistingAccountsNew Accounts Write-offs
AccountExisting
AccountsNew Accounts Write-offs Account
ExistingAccountsNew Accounts Write-offs
AccountExisting
AccountsNew Accounts
New Accounts ExistingAccounts
Write-offs Account
Write-offs Account
ExistingAccountsNew Accounts Write-offs
AccountExisting
AccountsNew Accounts
New Accounts ExistingAccounts
Write-offs Account New Accounts Existing
Accounts Write-offs Account New Accounts Existing
Accounts Write-offs Account
-
Existing AccountsInitial Average
LendingAmount
2014/3
New Accounts ExistingAccounts
Write-offs Account
Annual Income (Millions of yen) New Accounts
2014/3
New Accounts ExistingAccounts
Write-offs Account New Accounts
-
-
2014/3
New Accounts ExistingAccounts
Write-offs Account
2015/32014/6 2014/9 2014/12 2015/3
New AccountsInitial Average
LendingAmount
Existing Accounts New Accounts Existing Accounts New AccountsInitial Average
LendingAmount
Existing AccountsInitial Average
LendingAmount
Existing Accounts New AccountsInitial Average
LendingAmount
2015/32014/6 2014/9 2014/12 2015/3
ExistingAccounts
Write-offs Account New Accounts Existing
Accounts Write-offs Account New Accounts Existing
Accounts
2015/32014/6 2014/9 2014/12 2015/3
Write-offs Account
2016/32015/6 2015/9 2015/12 2016/3
New AccountsInitial Average
LendingAmount
Existing Accounts New AccountsInitial Average
LendingAmount
Existing Accounts New AccountsInitial Average
LendingAmount
Existing Accounts New AccountsInitial Average
LendingAmount
Existing Accounts
2016/32015/6 2015/9 2015/12 2016/3
2016/32015/6 2015/9 2015/12 2016/3
- 12 -
Trend in Actual Results and Estimates (Non-consolidated)
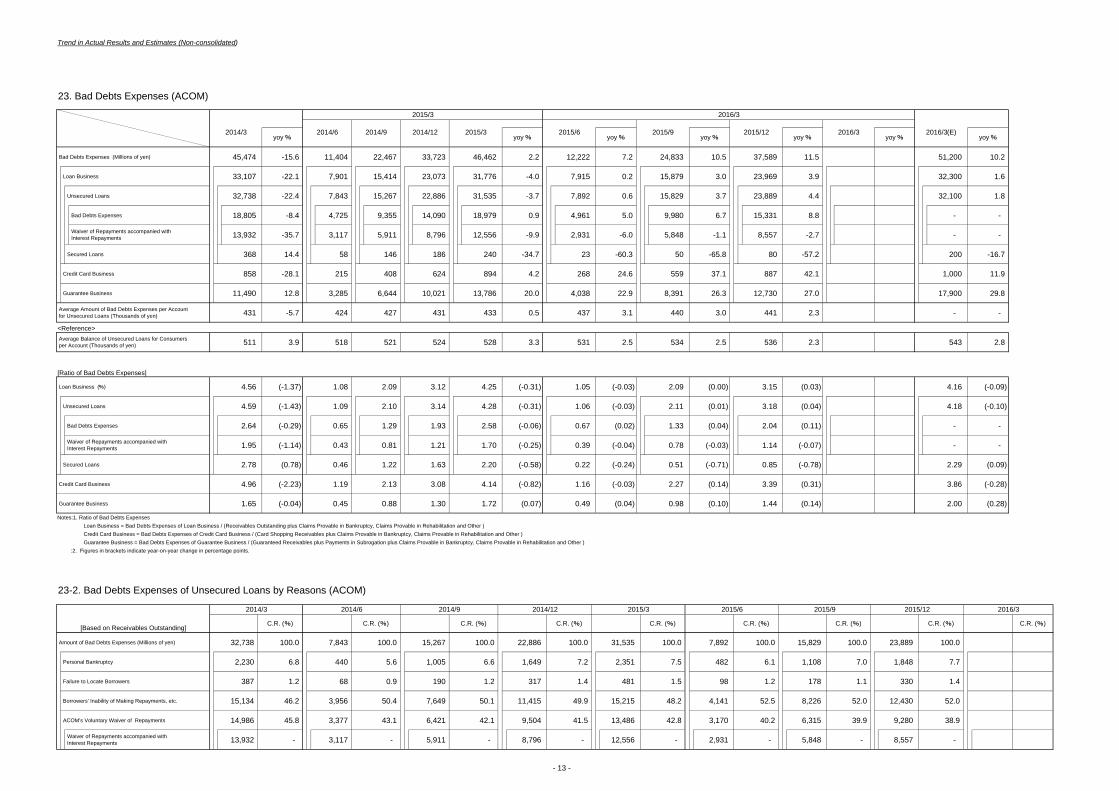
23. Bad Debts Expenses (ACOM)
Bad Debts Expenses (Millions of yen) 45,474 -15.6 11,404 22,467 33,723 46,462 2.2 12,222 7.2 24,833 10.5 37,589 11.5 51,200 10.2
Loan Business 33,107 -22.1 7,901 15,414 23,073 31,776 -4.0 7,915 0.2 15,879 3.0 23,969 3.9 32,300 1.6
Unsecured Loans 32,738 -22.4 7,843 15,267 22,886 31,535 -3.7 7,892 0.6 15,829 3.7 23,889 4.4 32,100 1.8
Bad Debts Expenses 18,805 -8.4 4,725 9,355 14,090 18,979 0.9 4,961 5.0 9,980 6.7 15,331 8.8 - -
13,932 -35.7 3,117 5,911 8,796 12,556 -9.9 2,931 -6.0 5,848 -1.1 8,557 -2.7 - -
Secured Loans 368 14.4 58 146 186 240 -34.7 23 -60.3 50 -65.8 80 -57.2 200 -16.7
Credit Card Business 858 -28.1 215 408 624 894 4.2 268 24.6 559 37.1 887 42.1 1,000 11.9
Guarantee Business 11,490 12.8 3,285 6,644 10,021 13,786 20.0 4,038 22.9 8,391 26.3 12,730 27.0 17,900 29.8
431 -5.7 424 427 431 433 0.5 437 3.1 440 3.0 441 2.3 - -
<Reference>
511 3.9 518 521 524 528 3.3 531 2.5 534 2.5 536 2.3 543 2.8
[Ratio of Bad Debts Expenses]
Loan Business (%) 4.56 (-1.37) 1.08 2.09 3.12 4.25 (-0.31) 1.05 (-0.03) 2.09 (0.00) 3.15 (0.03) 4.16 (-0.09)
Unsecured Loans 4.59 (-1.43) 1.09 2.10 3.14 4.28 (-0.31) 1.06 (-0.03) 2.11 (0.01) 3.18 (0.04) 4.18 (-0.10)
Bad Debts Expenses 2.64 (-0.29) 0.65 1.29 1.93 2.58 (-0.06) 0.67 (0.02) 1.33 (0.04) 2.04 (0.11) - -
1.95 (-1.14) 0.43 0.81 1.21 1.70 (-0.25) 0.39 (-0.04) 0.78 (-0.03) 1.14 (-0.07) - -
Secured Loans 2.78 (0.78) 0.46 1.22 1.63 2.20 (-0.58) 0.22 (-0.24) 0.51 (-0.71) 0.85 (-0.78) 2.29 (0.09)
Credit Card Business 4.96 (-2.23) 1.19 2.13 3.08 4.14 (-0.82) 1.16 (-0.03) 2.27 (0.14) 3.39 (0.31) 3.86 (-0.28)
Guarantee Business 1.65 (-0.04) 0.45 0.88 1.30 1.72 (0.07) 0.49 (0.04) 0.98 (0.10) 1.44 (0.14) 2.00 (0.28)
Notes:1. Ratio of Bad Debts Expenses Loan Business = Bad Debts Expenses of Loan Business / (Receivables Outstanding plus Claims Provable in Bankruptcy, Claims Provable in Rehabilitation and Other ) Credit Card Business = Bad Debts Expenses of Credit Card Business / (Card Shopping Receivables plus Claims Provable in Bankruptcy, Claims Provable in Rehabilitation and Other ) Guarantee Business = Bad Debts Expenses of Guarantee Business / (Guaranteed Receivables plus Payments in Subrogation plus Claims Provable in Bankruptcy, Claims Provable in Rehabilitation and Other )
:2. Figures in brackets indicate year-on-year change in percentage points.
23-2. Bad Debts Expenses of Unsecured Loans by Reasons (ACOM)
Amount of Bad Debts Expenses (Millions of yen) 32,738 100.0 7,843 100.0 15,267 100.0 22,886 100.0 31,535 100.0 7,892 100.0 15,829 100.0 23,889 100.0
Personal Bankruptcy 2,230 6.8 440 5.6 1,005 6.6 1,649 7.2 2,351 7.5 482 6.1 1,108 7.0 1,848 7.7
Failure to Locate Borrowers 387 1.2 68 0.9 190 1.2 317 1.4 481 1.5 98 1.2 178 1.1 330 1.4
Borrowers' Inability of Making Repayments, etc. 15,134 46.2 3,956 50.4 7,649 50.1 11,415 49.9 15,215 48.2 4,141 52.5 8,226 52.0 12,430 52.0
ACOM's Voluntary Waiver of Repayments 14,986 45.8 3,377 43.1 6,421 42.1 9,504 41.5 13,486 42.8 3,170 40.2 6,315 39.9 9,280 38.9
13,932 - 3,117 - 5,911 - 8,796 - 12,556 - 2,931 - 5,848 - 8,557 -
C.R. (%) C.R. (%) C.R. (%)
yoy %yoy %yoy %yoy %yoy %2015/6 2015/9 2016/3 2016/3(E)
yoy %yoy %
Waiver of Repayments accompanied with Interest Repayments
2014/6
2014/6
Waiver of Repayments accompanied with Interest Repayments
2014/9
[Based on Receivables Outstanding]
2014/3
C.R. (%) C.R. (%)
2015/3
2014/12 2015/3
2016/3
2015/12
C.R. (%) C.R. (%) C.R. (%) C.R. (%)
2014/3
Average Amount of Bad Debts Expenses per Account for Unsecured Loans (Thousands of yen)
Average Balance of Unsecured Loans for Consumers per Account (Thousands of yen)
2016/32015/122015/92014/9 2015/3
Waiver of Repayments accompanied with Interest Repayments
2015/62014/12
- 13 -
Trend in Actual Results and Estimates (Non-consolidated)
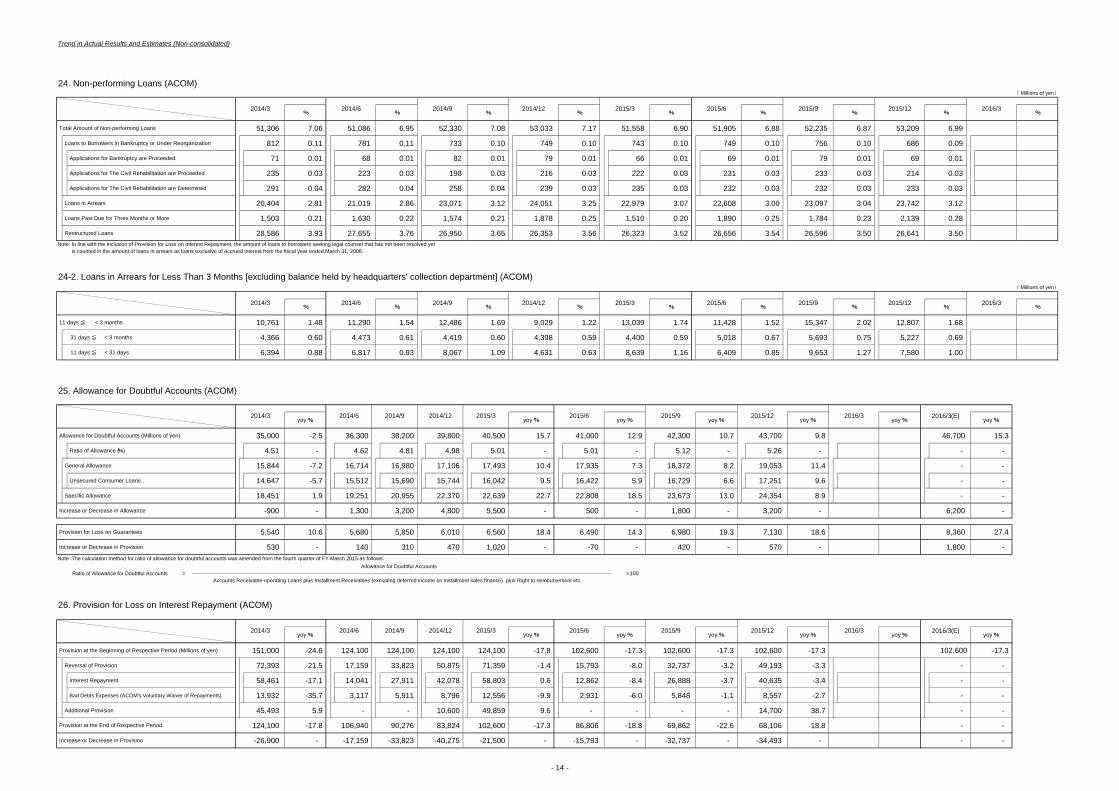
24. Non-performing Loans (ACOM)( Millions of yen )
Total Amount of Non-performing Loans 51,306 7.06 51,086 6.95 52,330 7.08 53,033 7.17 51,558 6.90 51,905 6.88 52,235 6.87 53,209 6.99
Loans to Borrowers in Bankruptcy or Under Reorganization 812 0.11 781 0.11 733 0.10 749 0.10 743 0.10 749 0.10 756 0.10 686 0.09
Applications for Bankruptcy are Proceeded 71 0.01 68 0.01 82 0.01 79 0.01 66 0.01 69 0.01 79 0.01 69 0.01
Applications for The Civil Rehabilitation are Proceeded 235 0.03 223 0.03 198 0.03 216 0.03 222 0.03 231 0.03 233 0.03 214 0.03
Applications for The Civil Rehabilitation are Determined 291 0.04 282 0.04 258 0.04 239 0.03 235 0.03 232 0.03 232 0.03 233 0.03
Loans in Arrears 20,404 2.81 21,019 2.86 23,071 3.12 24,051 3.25 22,979 3.07 22,608 3.00 23,097 3.04 23,742 3.12
Loans Past Due for Three Months or More 1,503 0.21 1,630 0.22 1,574 0.21 1,878 0.25 1,510 0.20 1,890 0.25 1,784 0.23 2,139 0.28
Restructured Loans 28,586 3.93 27,655 3.76 26,950 3.65 26,353 3.56 26,323 3.52 26,656 3.54 26,596 3.50 26,641 3.50 Note: In line with the inclusion of Provision for Loss on Interest Repayment, the amount of loans to borrowers seeking legal counsel that has not been resolved yet is counted in the amount of loans in arrears as loans exclusive of accrued interest from the fiscal year ended March 31, 2006.
24-2. Loans in Arrears for Less Than 3 Months [excluding balance held by headquarters' collection department] (ACOM)( Millions of yen )
11 days ≦ < 3 months 10,761 1.48 11,290 1.54 12,486 1.69 9,029 1.22 13,039 1.74 11,428 1.52 15,347 2.02 12,807 1.68
31 days ≦ < 3 months 4,366 0.60 4,473 0.61 4,419 0.60 4,398 0.59 4,400 0.59 5,018 0.67 5,693 0.75 5,227 0.69
11 days ≦ < 31 days 6,394 0.88 6,817 0.93 8,067 1.09 4,631 0.63 8,639 1.16 6,409 0.85 9,653 1.27 7,580 1.00
25. Allowance for Doubtful Accounts (ACOM)
Allowance for Doubtful Accounts (Millions of yen) 35,000 -2.5 36,300 38,200 39,800 40,500 15.7 41,000 12.9 42,300 10.7 43,700 9.8 46,700 15.3
Ratio of Allowance (%) 4.51 - 4.62 4.81 4.98 5.01 - 5.01 - 5.12 - 5.26 - -
General Allowance 15,844 -7.2 16,714 16,980 17,106 17,493 10.4 17,935 7.3 18,372 8.2 19,053 11.4 -
Unsecured Consumer Loans 14,647 -5.7 15,512 15,690 15,744 16,042 9.5 16,422 5.9 16,729 6.6 17,251 9.6 -
Specific Allowance 18,451 1.9 19,251 20,955 22,370 22,639 22.7 22,808 18.5 23,673 13.0 24,354 8.9 -
Increase or Decrease in Allowance -900 - 1,300 3,200 4,800 5,500 - 500 - 1,800 - 3,200 - 6,200 -
Provision for Loss on Guarantees 5,540 10.6 5,680 5,850 6,010 6,560 18.4 6,490 14.3 6,980 19.3 7,130 18.6 8,360 27.4
Increase or Decrease in Provision 530 - 140 310 470 1,020 - -70 - 420 - 570 - 1,800 - Note :The calculation method for ratio of allowance for doubtful accounts was amended from the fourth quarter of FY March 2015 as follows:
Allowance for Doubtful Accounts Ratio of Allowance for Doubtful Accounts = ×100
Accounts Receivable-operating Loans plus Installment Receivables (excluding deferred income on installment sales finance) plus Right to reimbursement etc.
26. Provision for Loss on Interest Repayment (ACOM)
Provision at the Beginning of Respective Period (Millions of yen) 151,000 -24.6 124,100 124,100 124,100 124,100 -17.8 102,600 -17.3 102,600 -17.3 102,600 -17.3 -17.3
Reversal of Provision 72,393 -21.5 17,159 33,823 50,875 71,359 -1.4 15,793 -8.0 32,737 -3.2 49,193 -3.3 -
Interest Repayment 58,461 -17.1 14,041 27,911 42,078 58,803 0.6 12,862 -8.4 26,888 -3.7 40,635 -3.4 -
Bad Debts Expenses (ACOM's Voluntary Waiver of Repayments) 13,932 -35.7 3,117 5,911 8,796 12,556 -9.9 2,931 -6.0 5,848 -1.1 8,557 -2.7 -
Additional Provision 45,493 5.9 - - 10,600 49,859 9.6 - - - - 14,700 38.7 -
124,100 -17.8 106,940 90,276 83,824 102,600 -17.3 86,806 -18.8 69,862 -22.6 68,106 -18.8 -
Increase or Decrease in Provision -26,900 - -17,159 -33,823 -40,275 -21,500 - -15,793 - -32,737 - -34,493 - -
2014/3 2014/6
2014/6 2014/9
2014/3
% %
%
yoy %
2014/9 2015/9 2015/12 2016/32014/12 2015/3 2015/6 % % % % % %
2014/3 2014/6 2014/9 2015/9 2015/122014/12
2014/6 2014/9 2014/12 2015/3 2016/3yoy %
2015/6 2015/9 2015/12yoy %yoy %yoy %yoy %yoy %
2016/3(E)
2014/12 2015/3
-
Provision at the End of Respective Period -
2016/3 2016/3(E)2015/6 2015/9 2015/122014/3yoy % yoy % yoy % yoy % yoy %
-
102,600
-
-
-
% % % % % 2015/3 2015/6
yoy %
%
% % %
-
-
-
-
yoy %
2016/3
- 14 -
Trend in Actual Results and Estimates (Non-consolidated)
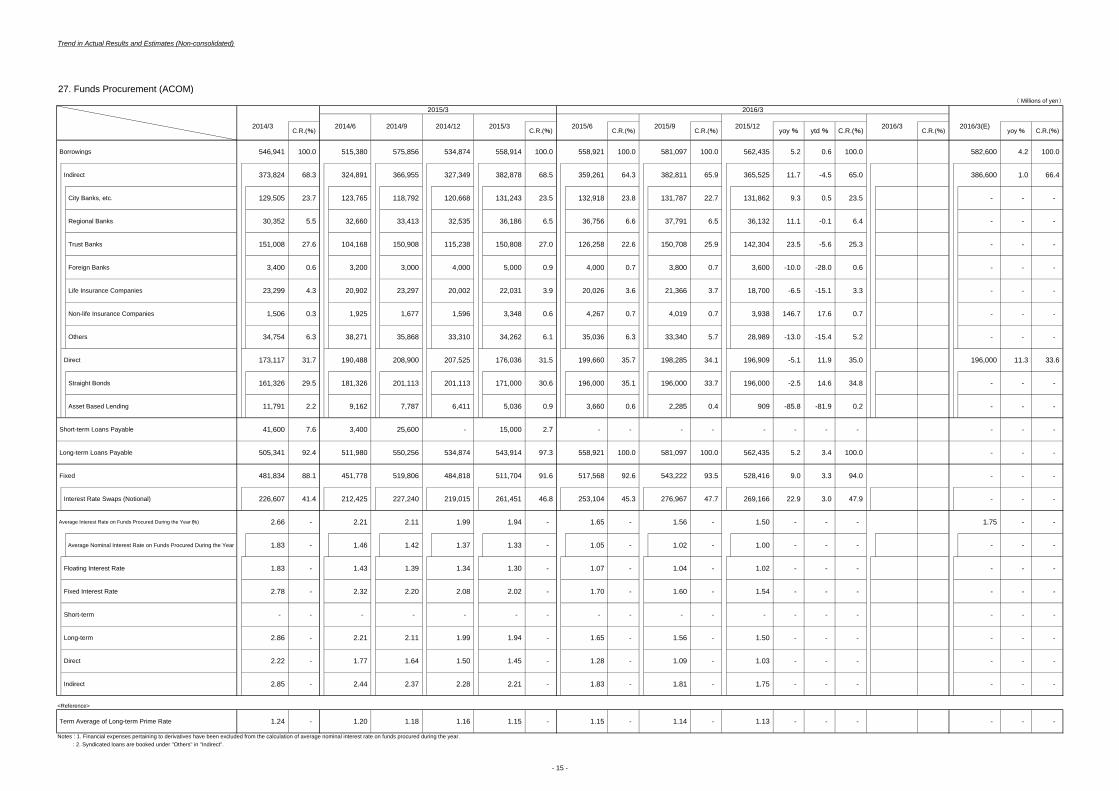
27. Funds Procurement (ACOM)( Millions of yen )
Borrowings 546,941 100.0 515,380 575,856 534,874 558,914 100.0 558,921 100.0 581,097 100.0 562,435 5.2 0.6 100.0 582,600 4.2 100.0
Indirect 373,824 68.3 324,891 366,955 327,349 382,878 68.5 359,261 64.3 382,811 65.9 365,525 11.7 -4.5 65.0 386,600 1.0 66.4
City Banks, etc. 129,505 23.7 123,765 118,792 120,668 131,243 23.5 132,918 23.8 131,787 22.7 131,862 9.3 0.5 23.5 - - -
Regional Banks 30,352 5.5 32,660 33,413 32,535 36,186 6.5 36,756 6.6 37,791 6.5 36,132 11.1 -0.1 6.4 - - -
Trust Banks 151,008 27.6 104,168 150,908 115,238 150,808 27.0 126,258 22.6 150,708 25.9 142,304 23.5 -5.6 25.3 - - -
Foreign Banks 3,400 0.6 3,200 3,000 4,000 5,000 0.9 4,000 0.7 3,800 0.7 3,600 -10.0 -28.0 0.6 - - -
Life Insurance Companies 23,299 4.3 20,902 23,297 20,002 22,031 3.9 20,026 3.6 21,366 3.7 18,700 -6.5 -15.1 3.3 - - -
Non-life Insurance Companies 1,506 0.3 1,925 1,677 1,596 3,348 0.6 4,267 0.7 4,019 0.7 3,938 146.7 17.6 0.7 - - -
Others 34,754 6.3 38,271 35,868 33,310 34,262 6.1 35,036 6.3 33,340 5.7 28,989 -13.0 -15.4 5.2 - - -
Direct 173,117 31.7 190,488 208,900 207,525 176,036 31.5 199,660 35.7 198,285 34.1 196,909 -5.1 11.9 35.0 196,000 11.3 33.6
Straight Bonds 161,326 29.5 181,326 201,113 201,113 171,000 30.6 196,000 35.1 196,000 33.7 196,000 -2.5 14.6 34.8 - - -
Asset Based Lending 11,791 2.2 9,162 7,787 6,411 5,036 0.9 3,660 0.6 2,285 0.4 909 -85.8 -81.9 0.2 - - -
Short-term Loans Payable 41,600 7.6 3,400 25,600 - 15,000 2.7 - - - - - - - - - - -
Long-term Loans Payable 505,341 92.4 511,980 550,256 534,874 543,914 97.3 558,921 100.0 581,097 100.0 562,435 5.2 3.4 100.0 - - -
Fixed 481,834 88.1 451,778 519,806 484,818 511,704 91.6 517,568 92.6 543,222 93.5 528,416 9.0 3.3 94.0 - - -
Interest Rate Swaps (Notional) 226,607 41.4 212,425 227,240 219,015 261,451 46.8 253,104 45.3 276,967 47.7 269,166 22.9 3.0 47.9 - - -
2.66 - 2.21 2.11 1.99 1.94 - 1.65 - 1.56 - 1.50 - - - 1.75 - -
Average Nominal Interest Rate on Funds Procured During the Year 1.83 - 1.46 1.42 1.37 1.33 - 1.05 - 1.02 - 1.00 - - - - - -
Floating Interest Rate 1.83 - 1.43 1.39 1.34 1.30 - 1.07 - 1.04 - 1.02 - - - - - -
Fixed Interest Rate 2.78 - 2.32 2.20 2.08 2.02 - 1.70 - 1.60 - 1.54 - - - - - -
Short-term - - - - - - - - - - - - - - - - - -
Long-term 2.86 - 2.21 2.11 1.99 1.94 - 1.65 - 1.56 - 1.50 - - - - - -
Direct 2.22 - 1.77 1.64 1.50 1.45 - 1.28 - 1.09 - 1.03 - - - - - -
Indirect 2.85 - 2.44 2.37 2.28 2.21 - 1.83 - 1.81 - 1.75 - - - - - -
<Reference>
Term Average of Long-term Prime Rate 1.24 - 1.20 1.18 1.16 1.15 - 1.15 - 1.14 - 1.13 - - - - - -
Notes : 1. Financial expenses pertaining to derivatives have been excluded from the calculation of average nominal interest rate on funds procured during the year. : 2. Syndicated loans are booked under "Others" in "Indirect".
2016/3
2015/6 2015/9 2015/12 2016/3
Average Interest Rate on Funds Procured During the Year (%)
2014/3
2015/3
2014/6 2014/9 2014/12 2015/3C.R.(%) C.R.(%) C.R.(%) C.R.(%) yoy % ytd % C.R.(%) C.R.(%) yoy % C.R.(%)
2016/3(E)
- 15 -
Trend in Actual Results and Estimates (Non-consolidated)
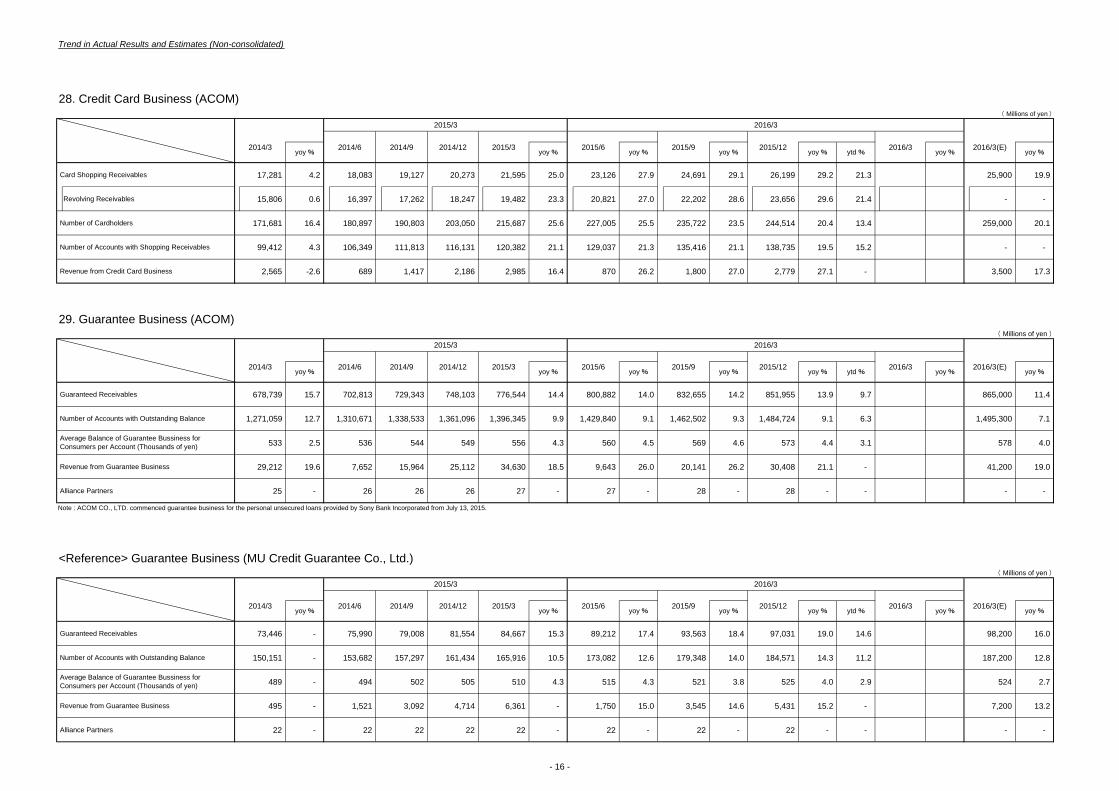
28. Credit Card Business (ACOM)( Millions of yen )
Card Shopping Receivables 17,281 4.2 18,083 19,127 20,273 21,595 25.0 23,126 27.9 24,691 29.1 26,199 29.2 21.3 25,900 19.9
Revolving Receivables 15,806 0.6 16,397 17,262 18,247 19,482 23.3 20,821 27.0 22,202 28.6 23,656 29.6 21.4 - -
Number of Cardholders 171,681 16.4 180,897 190,803 203,050 215,687 25.6 227,005 25.5 235,722 23.5 244,514 20.4 13.4 259,000 20.1
Number of Accounts with Shopping Receivables 99,412 4.3 106,349 111,813 116,131 120,382 21.1 129,037 21.3 135,416 21.1 138,735 19.5 15.2 - -
Revenue from Credit Card Business 2,565 -2.6 689 1,417 2,186 2,985 16.4 870 26.2 1,800 27.0 2,779 27.1 - 3,500 17.3
29. Guarantee Business (ACOM)( Millions of yen )
Guaranteed Receivables 678,739 15.7 702,813 729,343 748,103 776,544 14.4 800,882 14.0 832,655 14.2 851,955 13.9 9.7 865,000 11.4
Number of Accounts with Outstanding Balance 1,271,059 12.7 1,310,671 1,338,533 1,361,096 1,396,345 9.9 1,429,840 9.1 1,462,502 9.3 1,484,724 9.1 6.3 1,495,300 7.1
533 2.5 536 544 549 556 4.3 560 4.5 569 4.6 573 4.4 3.1 578 4.0
Revenue from Guarantee Business 29,212 19.6 7,652 15,964 25,112 34,630 18.5 9,643 26.0 20,141 26.2 30,408 21.1 - 41,200 19.0
Alliance Partners 25 - 26 26 26 27 - 27 - 28 - 28 - - - -
Note : ACOM CO., LTD. commenced guarantee business for the personal unsecured loans provided by Sony Bank Incorporated from July 13, 2015.
<Reference> Guarantee Business (MU Credit Guarantee Co., Ltd.)( Millions of yen )
Guaranteed Receivables 73,446 - 75,990 79,008 81,554 84,667 15.3 89,212 17.4 93,563 18.4 97,031 19.0 14.6 98,200 16.0
Number of Accounts with Outstanding Balance 150,151 - 153,682 157,297 161,434 165,916 10.5 173,082 12.6 179,348 14.0 184,571 14.3 11.2 187,200 12.8
489 - 494 502 505 510 4.3 515 4.3 521 3.8 525 4.0 2.9 524 2.7
Revenue from Guarantee Business 495 - 1,521 3,092 4,714 6,361 - 1,750 15.0 3,545 14.6 5,431 15.2 - 7,200 13.2
Alliance Partners 22 - 22 22 22 22 - 22 - 22 - 22 - - - -
2015/6 2015/9 2015/12 2016/3yoy % yoy % yoy % ytd %
Average Balance of Guarantee Bussiness for Consumers per Account (Thousands of yen)
2014/6 2014/9 2014/12 2015/32014/3
2015/3
2016/3(E)
2016/3
2016/3
yoy % yoy %
2015/3
2015/6 2015/9
2014/3 2014/12 2015/32014/6 2014/9 2015/6 2015/9 2015/12 2016/3yoy % yoy % yoy % yoy %
Average Balance of Guarantee Bussiness for Consumers per Account (Thousands of yen)
2016/3(E)2014/3 2014/6 2014/9 2014/12 2015/3 2015/12 2016/3
2016/32015/3
yoy % yoy % yoy % yoy % yoy %
yoy %
yoy % ytd % yoy % yoy %
ytd % yoy % yoy %
2016/3(E)
yoy %
- 16 -
Trend in Actual Results and Estimates (Non-consolidated)
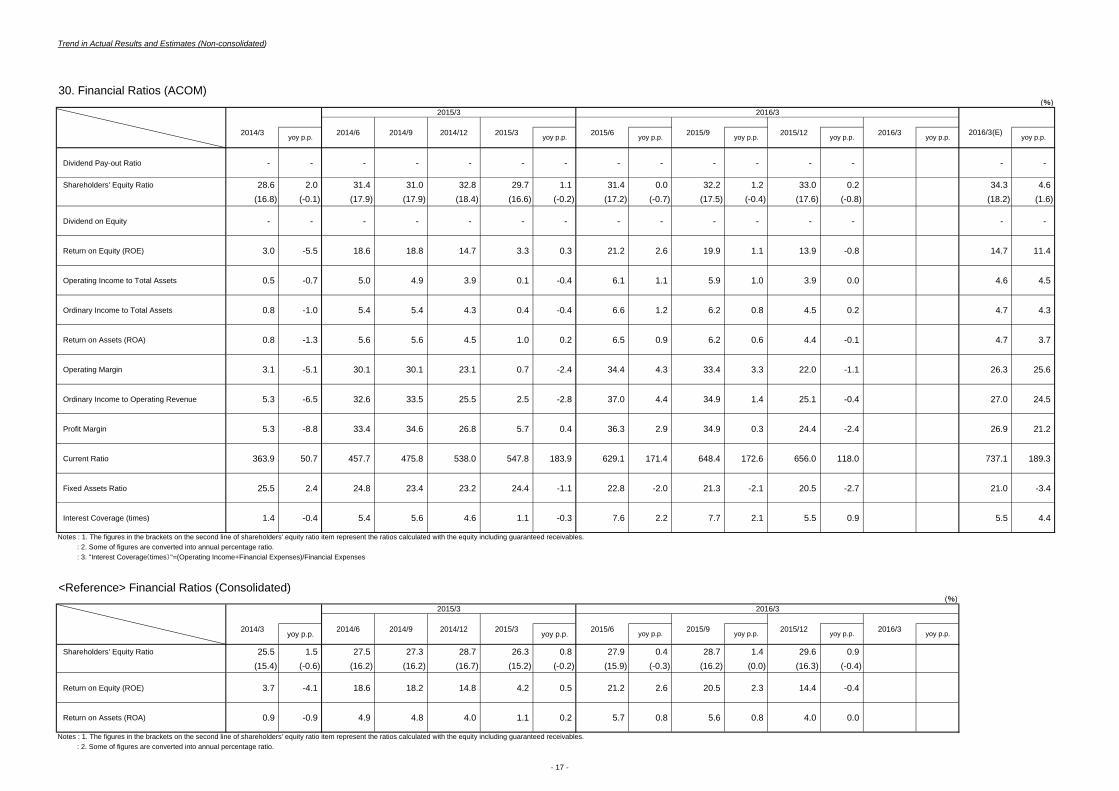
30. Financial Ratios (ACOM)(%)
2014/3 2014/6 2014/9 2014/12 2015/3 2015/6 2015/9 2015/12 2016/3 2016/3(E)
Dividend Pay-out Ratio - - - - - - - - - - - - - - -
Shareholders' Equity Ratio 28.6 2.0 31.4 31.0 32.8 29.7 1.1 31.4 0.0 32.2 1.2 33.0 0.2 34.3 4.6 (16.8) (-0.1) (17.9) (17.9) (18.4) (16.6) (-0.2) (17.2) (-0.7) (17.5) (-0.4) (17.6) (-0.8) (18.2) (1.6)
Dividend on Equity - - - - - - - - - - - - - - -
Return on Equity (ROE) 3.0 -5.5 18.6 18.8 14.7 3.3 0.3 21.2 2.6 19.9 1.1 13.9 -0.8 14.7 11.4
Operating Income to Total Assets 0.5 -0.7 5.0 4.9 3.9 0.1 -0.4 6.1 1.1 5.9 1.0 3.9 0.0 4.6 4.5
Ordinary Income to Total Assets 0.8 -1.0 5.4 5.4 4.3 0.4 -0.4 6.6 1.2 6.2 0.8 4.5 0.2 4.7 4.3
Return on Assets (ROA) 0.8 -1.3 5.6 5.6 4.5 1.0 0.2 6.5 0.9 6.2 0.6 4.4 -0.1 4.7 3.7
Operating Margin 3.1 -5.1 30.1 30.1 23.1 0.7 -2.4 34.4 4.3 33.4 3.3 22.0 -1.1 26.3 25.6
Ordinary Income to Operating Revenue 5.3 -6.5 32.6 33.5 25.5 2.5 -2.8 37.0 4.4 34.9 1.4 25.1 -0.4 27.0 24.5
Profit Margin 5.3 -8.8 33.4 34.6 26.8 5.7 0.4 36.3 2.9 34.9 0.3 24.4 -2.4 26.9 21.2
Current Ratio 363.9 50.7 457.7 475.8 538.0 547.8 183.9 629.1 171.4 648.4 172.6 656.0 118.0 737.1 189.3
Fixed Assets Ratio 25.5 2.4 24.8 23.4 23.2 24.4 -1.1 22.8 -2.0 21.3 -2.1 20.5 -2.7 21.0 -3.4
Interest Coverage (times) 1.4 -0.4 5.4 5.6 4.6 1.1 -0.3 7.6 2.2 7.7 2.1 5.5 0.9 5.5 4.4
Notes : 1. The figures in the brackets on the second line of shareholders' equity ratio item represent the ratios calculated with the equity including guaranteed receivables. : 2. Some of figures are converted into annual percentage ratio. : 3. "Interest Coverage(times)"=(Operating Income+Financial Expenses)/Financial Expenses
<Reference> Financial Ratios (Consolidated)(%)
2014/3 2014/6 2014/9 2014/12 2015/3 2015/6 2015/9 2015/12 2016/3
Shareholders' Equity Ratio 25.5 1.5 27.5 27.3 28.7 26.3 0.8 27.9 0.4 28.7 1.4 29.6 0.9 (15.4) (-0.6) (16.2) (16.2) (16.7) (15.2) (-0.2) (15.9) (-0.3) (16.2) (0.0) (16.3) (-0.4)
Return on Equity (ROE) 3.7 -4.1 18.6 18.2 14.8 4.2 0.5 21.2 2.6 20.5 2.3 14.4 -0.4
Return on Assets (ROA) 0.9 -0.9 4.9 4.8 4.0 1.1 0.2 5.7 0.8 5.6 0.8 4.0 0.0
Notes : 1. The figures in the brackets on the second line of shareholders' equity ratio item represent the ratios calculated with the equity including guaranteed receivables. : 2. Some of figures are converted into annual percentage ratio.
2015/3
2015/3
2016/3
2016/3
yoy p.p. yoy p.p. yoy p.p. yoy p.p. yoy p.p. yoy p.p. yoy p.p.
yoy p.p. yoy p.p. yoy p.p. yoy p.p. yoy p.p. yoy p.p.
- 17 -
Trend in Actual Results and Estimates (Non-consolidated)
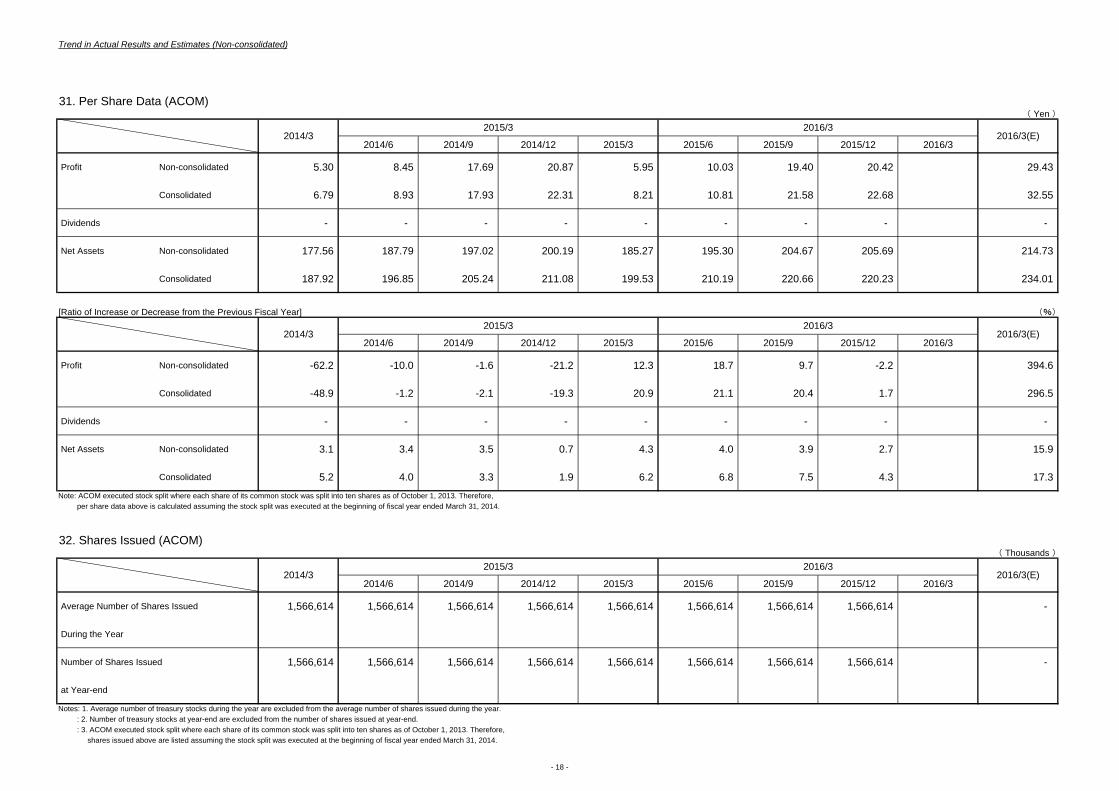
31. Per Share Data (ACOM)( Yen )
2014/6 2014/9 2014/12 2015/3 2015/6 2015/9 2015/12 2016/3
Profit Non-consolidated 5.30 8.45 17.69 20.87 5.95 10.03 19.40 20.42 29.43
Consolidated 6.79 8.93 17.93 22.31 8.21 10.81 21.58 22.68 32.55
Dividends - - - - - - - - -
Net Assets Non-consolidated 177.56 187.79 197.02 200.19 185.27 195.30 204.67 205.69 214.73
Consolidated 187.92 196.85 205.24 211.08 199.53 210.19 220.66 220.23 234.01
[Ratio of Increase or Decrease from the Previous Fiscal Year] (%)
2014/6 2014/9 2014/12 2015/3 2015/6 2015/9 2015/12 2016/3
Profit Non-consolidated -62.2 -10.0 -1.6 -21.2 12.3 18.7 9.7 -2.2 394.6
Consolidated -48.9 -1.2 -2.1 -19.3 20.9 21.1 20.4 1.7 296.5
Dividends - - - - - - - - -
Net Assets Non-consolidated 3.1 3.4 3.5 0.7 4.3 4.0 3.9 2.7 15.9
Consolidated 5.2 4.0 3.3 1.9 6.2 6.8 7.5 4.3 17.3
Note: ACOM executed stock split where each share of its common stock was split into ten shares as of October 1, 2013. Therefore, per share data above is calculated assuming the stock split was executed at the beginning of fiscal year ended March 31, 2014.
32. Shares Issued (ACOM)( Thousands )
2014/6 2014/9 2014/12 2015/3 2015/6 2015/9 2015/12 2016/3
Average Number of Shares Issued 1,566,614 1,566,614 1,566,614 1,566,614 1,566,614 1,566,614 1,566,614 1,566,614 -
During the Year
Number of Shares Issued 1,566,614 1,566,614 1,566,614 1,566,614 1,566,614 1,566,614 1,566,614 1,566,614 -
at Year-end
Notes: 1. Average number of treasury stocks during the year are excluded from the average number of shares issued during the year. : 2. Number of treasury stocks at year-end are excluded from the number of shares issued at year-end. : 3. ACOM executed stock split where each share of its common stock was split into ten shares as of October 1, 2013. Therefore, shares issued above are listed assuming the stock split was executed at the beginning of fiscal year ended March 31, 2014.
2014/3
2014/3
2014/3 2016/3(E)
2016/3(E)
2016/3(E)
2015/3
2015/3
2015/3
2016/3
2016/3
2016/3
- 18 -
Trend in Actual Results and Estimates (Overseas Consolidated Subsidiaries)
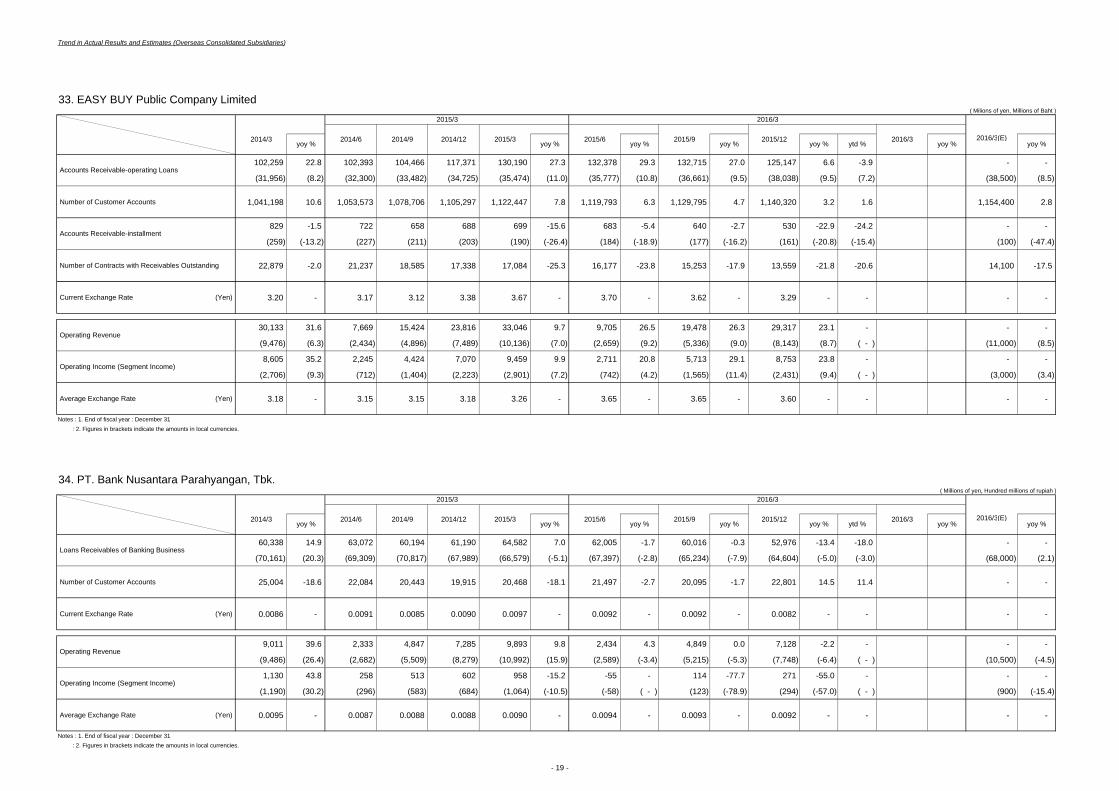
33. EASY BUY Public Company Limited( Milions of yen, Millions of Baht )
2016/3(E)
102,259 22.8 102,393 104,466 117,371 130,190 27.3 132,378 29.3 132,715 27.0 125,147 6.6 -3.9 - -
(31,956) (8.2) (32,300) (33,482) (34,725) (35,474) (11.0) (35,777) (10.8) (36,661) (9.5) (38,038) (9.5) (7.2) (38,500) (8.5)
Number of Customer Accounts 1,041,198 10.6 1,053,573 1,078,706 1,105,297 1,122,447 7.8 1,119,793 6.3 1,129,795 4.7 1,140,320 3.2 1.6 1,154,400 2.8
829 -1.5 722 658 688 699 -15.6 683 -5.4 640 -2.7 530 -22.9 -24.2 - -
(259) (-13.2) (227) (211) (203) (190) (-26.4) (184) (-18.9) (177) (-16.2) (161) (-20.8) (-15.4) (100) (-47.4)
Number of Contracts with Receivables Outstanding 22,879 -2.0 21,237 18,585 17,338 17,084 -25.3 16,177 -23.8 15,253 -17.9 13,559 -21.8 -20.6 14,100 -17.5
Current Exchange Rate (Yen) 3.20 - 3.17 3.12 3.38 3.67 - 3.70 - 3.62 - 3.29 - - - -
30,133 31.6 7,669 15,424 23,816 33,046 9.7 9,705 26.5 19,478 26.3 29,317 23.1 - - -
(9,476) (6.3) (2,434) (4,896) (7,489) (10,136) (7.0) (2,659) (9.2) (5,336) (9.0) (8,143) (8.7) ( - ) (11,000) (8.5)
8,605 35.2 2,245 4,424 7,070 9,459 9.9 2,711 20.8 5,713 29.1 8,753 23.8 - - -
(2,706) (9.3) (712) (1,404) (2,223) (2,901) (7.2) (742) (4.2) (1,565) (11.4) (2,431) (9.4) ( - ) (3,000) (3.4)
Average Exchange Rate (Yen) 3.18 - 3.15 3.15 3.18 3.26 - 3.65 - 3.65 - 3.60 - - - -
Notes : 1. End of fiscal year : December 31 : 2. Figures in brackets indicate the amounts in local currencies.
34. PT. Bank Nusantara Parahyangan, Tbk.( Millions of yen, Hundred millions of rupiah )
2016/3(E)
60,338 14.9 63,072 60,194 61,190 64,582 7.0 62,005 -1.7 60,016 -0.3 52,976 -13.4 -18.0 - -
(70,161) (20.3) (69,309) (70,817) (67,989) (66,579) (-5.1) (67,397) (-2.8) (65,234) (-7.9) (64,604) (-5.0) (-3.0) (68,000) (2.1)
Number of Customer Accounts 25,004 -18.6 22,084 20,443 19,915 20,468 -18.1 21,497 -2.7 20,095 -1.7 22,801 14.5 11.4 - -
Current Exchange Rate (Yen) 0.0086 - 0.0091 0.0085 0.0090 0.0097 - 0.0092 - 0.0092 - 0.0082 - - - -
9,011 39.6 2,333 4,847 7,285 9,893 9.8 2,434 4.3 4,849 0.0 7,128 -2.2 - - -
(9,486) (26.4) (2,682) (5,509) (8,279) (10,992) (15.9) (2,589) (-3.4) (5,215) (-5.3) (7,748) (-6.4) ( - ) (10,500) (-4.5)
1,130 43.8 258 513 602 958 -15.2 -55 - 114 -77.7 271 -55.0 - - -
(1,190) (30.2) (296) (583) (684) (1,064) (-10.5) (-58) ( - ) (123) (-78.9) (294) (-57.0) ( - ) (900) (-15.4)
Average Exchange Rate (Yen) 0.0095 - 0.0087 0.0088 0.0088 0.0090 - 0.0094 - 0.0093 - 0.0092 - - - -
Notes : 1. End of fiscal year : December 31 : 2. Figures in brackets indicate the amounts in local currencies.
Operating Income (Segment Income)
Operating Revenue
Loans Receivables of Banking Business
2014/9 2014/12 2015/3
2014/3
2014/3
Operating Income (Segment Income)
Operating Revenue
Accounts Receivable-operating Loans
Accounts Receivable-installment
yoy %
2015/3
2014/6 2014/9 2014/12 2015/3yoy %
2016/3
2015/6 2015/9 2015/12 2016/3yoy % yoy % yoy % ytd % yoy % yoy %
yoy % yoy % yoy % yoy % yoy % ytd % yoy % yoy %
2016/3
2015/6 2015/9 2015/12 2016/3
2015/3
2014/6
- 19 -
(Reference) Category criteria concerning situations of Non-performingLoans are as follows ;
Loans to borrowers in bankruptcy or under reorganizationLoans to borrowers declared bankrupt, to borrowers under rehabilitation, to borrowers under reorganization, or other similar circumstances, which are part of loans exclusive of accrued interest that are past due for over 121 days and held by headquarters' collection department.
Loans in arrearsOther delinquent loans exclusive of accrued interest.This category excludes loans on which interest is being waived in support of business restructuring.
Loans past due for three months or moreLoans past due for three months or more that do not fall into the above two categories.
Restructured loansLoans, other than those in the above three categories, in which favorable terms, such as the reduction of interest, have been granted with a view to promoting recovery of the loans.
- 20 -