Embed Size (px)
Citation preview
Acoustic and photoacousticcharacterization of micron-sizedperfluorocarbon emulsions
Eric M. StrohmIvan GorelikovNaomi MatsuuraMichael C. Kolios
Downloaded From: https://www.spiedigitallibrary.org/journals/Journal-of-Biomedical-Optics on 24 Feb 2020Terms of Use: https://www.spiedigitallibrary.org/terms-of-use
Acoustic and photoacoustic characterization ofmicron-sized perfluorocarbon emulsions
Eric M. Strohm,a Ivan Gorelikov,b Naomi Matsuura,b and Michael C. KoliosaaRyerson University, Department of Physics, Toronto, CanadabSunnybrook Health Sciences Centre, Imaging Research Department, Toronto, Canada
Abstract. Perfluorocarbon droplets containing nanoparticles (NPs) have recently been investigated as theranosticand dual-mode contrast agents. These droplets can be vaporized via laser irradiation or used as photoacousticcontrast agents below the vaporization threshold. This study investigates the photoacoustic mechanism of NP-loaded droplets using photoacoustic frequencies between 100 and 1000 MHz, where distinct spectral featuresare observed that are related to the droplet composition. The measured photoacoustic spectrum from NP-loadedperfluorocarbon droplets was compared to a theoretical model that assumes a homogenous liquid. Good agree-ment in the location of the spectral features was observed, which suggests the NPs act primarily as optical absorbersto induce thermal expansion of the droplet as a single homogenous object. The NP size and composition do notaffect the photoacoustic spectrum; therefore, the photoacoustic signal can be maximized by optimizing the NPoptical absorbing properties. To confirm the theoretical parameters in the model, photoacoustic, ultrasonic,and optical methods were used to estimate the droplet diameter. Photoacoustic and ultrasonic methods agreedto within 1.4%, while the optical measurement was 8.5% higher; this difference decreased with increasing dropletsize. The small discrepancy may be attributed to the difficulty in observing the small droplets through the partiallytranslucent phantom. © 2012 Society of Photo-Optical Instrumentation Engineers (SPIE). [DOI: 10.1117/1.JBO.17.9.096016]
Keywords: perfluorocarbon droplets; contrast agent; nanoparticles; acoustic microscopy; photoacoustic imaging; dispersion.
Paper 12243P received Apr. 19, 2012; revised manuscript received Jul. 30, 2012; accepted for publication Aug. 21, 2012; publishedonline Sep. 19, 2012.
1 IntroductionFor several decades, perfluorocarbon (PFC) liquids have beenused in various biomedical applications. PFCs are biologicallyand chemically inert, which makes them appealing for use inmedicine,1 and they can be emulsified into nano- or micron-sized droplets2 to overcome their insolubility in water forin vivo infusion. In 2000, it was reported that a liquid-to-gasphase change could be induced in PFC emulsions via ultrasoundirradiation using a method called acoustic droplet vaporization(ADV).3,4 The resulting bubbles could be used as ultrasoundcontrast agents,4–7 for cancer therapy via vessel occlusion,8
and enhance thermal ablation with high-intensity focused ultra-sound (HIFU).9 Furthermore, upon vaporization, chemothera-peutic agents loaded within the emulsions can be released todeliver drugs to a target region.10,11 Recently, PFC emulsionshave been developed as photoacoustic agents through the incor-poration of optically absorbing nanoparticles (NPs)12–15 ordyes16 into the droplets. NP-loaded PFC droplets can be vapor-ized via light using a method called optical droplet vaporization(ODV)13,14 with similar applications as in ADV. Alternatively,the droplets could be irradiated below their vaporization thresh-old where they remain as liquid particles and used as photoa-coustic contrast agents.14,15
NPs in the 10 to 200 nm range have been used as photoa-coustic contrast agents in vivo,17–19 where they circulate withinthe bloodstream and extravasate into tumors via the enhancedpermeability and retention effect (EPR).20 Using PFC droplets
containing NPs as photoacoustic contrast agents may provideadvantages over using NPs alone. The NPs within a droplet areconcentrated into a small volume, so fewer NPs may be requiredto create a measurable photoacoustic signal compared to freeNPs. The photoacoustic signal from NPs is dependent on theenvironment surrounding the NP.21 Enclosing the NPs withina droplet of known liquid allows for direct optimization ofthe NPs within the liquid to maximize the photoacoustic signaloutput, whereas the signal from free NPs may differ dependingon their location (such as blood, interstitial tissue, or within sin-gle cells). It is also possible to functionalize the PFC dropletsurface with targeting ligands or imaging agents.22 These dro-plets can be loaded with therapeutic agents to deliver a targetedpayload to a region of interest.10,11 Finally, the droplet size canbe tailored for specific applications, ranging from nm-sized (forpenetration into interstitial tissue) to micron-sized (restricted tothe bloodstream). The droplets could be used as photoacousticcontrast agents to determine their location and then vaporized torelease a payload and/or the NPs into surrounding tissue. Therehave been very few studies examining the photoacousticmechanism from NP-loaded droplets.
NPs are increasingly being used as photoacoustic contrastagents. This paper demonstrates that micron-sized PFH dropletsloaded with optical absorbing, silica-coated gold NPs act as asingle photoacoustic emitter when irradiated with the appropri-ate wavelengths and can be used as photoacoustic contrastagents. The droplet photoacoustic spectral features, from dro-plets of various sizes, are investigated to show that the dropletphotoacoustic spectrum features depend on the size and physicalproperties of the liquid within the droplet only. The NPs are only
Address all correspondence to: Michael C. Kolios, Ryerson University, Depart-ment of Physics, Toronto, Canada. Tel: +416-979-5000 x7065; E-mail:[email protected] 0091-3286/2012/$25.00 © 2012 SPIE
Journal of Biomedical Optics 096016-1 September 2012 • Vol. 17(9)
Journal of Biomedical Optics 17(9), 096016 (September 2012)
Downloaded From: https://www.spiedigitallibrary.org/journals/Journal-of-Biomedical-Optics on 24 Feb 2020Terms of Use: https://www.spiedigitallibrary.org/terms-of-use
used to initiate the thermal expansion within the droplet. Thesefindings indicate the NP-loaded droplets provide advantagesover using NPs alone.
2 TheoryWhen irradiated by a laser with an appropriate wavelength, opti-cally absorbing structures will absorb energy and undergo arapid thermoelastic expansion, resulting in emission of a pres-sure wave that can be detected with conventional ultrasonictransducers. In this study, silica-coated gold NPs were selectedas the optical absorbers, due to their strong absorption peak atthe laser frequency used, and their ability to be loaded within thePFC droplets.14 A well-established theoretical model was usedto calculate the photoacoustic pressure waves generated fromhomogeneous optical absorbing liquid spheres.23 Assumingthe droplet undergoes a uniform thermal expansion due tothe heated NPs, the frequency domain pressure wave generateda distance r from a droplet with radius a when irradiated with alaser intensity I0 is
PðfÞ ¼ i
�μaI0cdβ
4πCpðr∕aÞ�
×ðsin q − q cos qÞ∕q2�
1 − ρdρf
�ðsin q∕qÞ − cos qþ i cdcf
ρdρfsin q
; (1)
where f is the ultrasound frequency, β is the droplet thermalexpansion coefficient, Cp is the droplet heat capacity, μa isthe optical absorption coefficient of the NPs within the droplet,ρ is the density, c is the sound speed, the subscripts d and frefer to the droplet and surrounding fluid, respectively, andq ¼ 2πfa∕cd.23 In this equation, the variables in the first bracketcontribute only to the amplitude of the signal and can be repre-sented by a constant A. The only variables that contribute sig-nificantly to spectral variations [the component to the right ofthe bracket in Eq. (1)] are the droplet radius, density, andsound speed. This equation also assumes that the physicalparameters such as sound speed do not change with frequency.Although this assumption is valid for liquids where sound dis-persion is absent over small frequency ranges, in this study afrequency range of 100 to 1000 MHz was used, where PFCliquids have a small but measureable increase in sound speedwith frequency.24 To account for this dispersion, Eq. (1)was modified by setting the droplet sound speed as a functionof frequency, and setting the variables that contribute to theamplitude to a constant A, so that the pressure P as a functionof frequency is
PðfÞ ¼ iAðsin q − q cos qÞ∕q2�
1 − ρdρf
�ðsin q∕qÞ − cos qþ i cdðfÞcf
ρdρfsin q
;
where q ¼ 2πfacdðfÞ
: (2)
The droplet radius, density, and sound speed all contribute to thefrequency content of the generated photoacoustic signal. If thePFC liquid type [e.g., perfluorohexane (PFH)] is kept constant,then the droplet radius is the only parameter that affects thephotoacoustic spectral features. The droplet diameter can be cal-culated by adjusting the radius in the model until a best fitbetween the model and measured photoacoustic spectrum isfound. To confirm the accuracy of the diameter parameter in
the model, the diameter can also be determined using photoa-coustic and ultrasonic pulse echo methods based on the time offlight of the photoacoustic signals or reflected echoes from thedroplet surfaces. A characteristic “N-shape” wave in the timedomain is generated composed of a positive pressure followedby a negative pressure.25 If the sound speed cd in the droplet isknown, the droplet diameter can be found from the arrival timeof the pressures wave using
d ¼ cdðt2 − t1Þ; (3)
where t1 is time of flight of the positive pressure peak and t2 isthe time of flight of negative pressure peak. Similarly, when adroplet is probed with pulsed ultrasound, echoes will occur fromthe top and bottom of the droplet due to the acoustic impedancemismatch between the droplet and surrounding fluid. The dia-meter of the droplet can be found using
d ¼ cd2ðt2 − t1Þ; (4)
where t1 is the echo from the top of the droplet and t2 is the echofrom the bottom of the droplet.26 In total, four independentmethods were used to determine the PFC droplet diametersin this study.
In Eq. (2), it is essential to know how the sound speed variesas a function of frequency (known as sound dispersion). Pre-vious work measuring the sound speed and attenuation of PFCliquids determined that the sound speed and ultrasound attenua-tion of PFH increases with frequency.24 The increase in attenua-tion αðfÞ with frequency is generally described using a powerlaw fit, such as αðfÞ ¼ α0fn, where the attenuation coefficientα0 and the power law exponent n describe how the attenuationchanges with frequency.27 A direct relationship between sounddispersion and ultrasonic attenuation can be accuratelydescribed using the Kramers-Kronig relation28
cðfÞ ¼�1
cdþ α0 tan
�nπ2
�ðj2πfjn−1 − j2πf0jn−1Þ
�−1; (5)
where α0 ¼ αðfÞ∕fn is the attenuation coefficient (with unitsNepers, converted to dB by multiplying by 8.686), and f0 is thefrequency where cd was measured.29 The change in sound speedwith frequency can be determined using equation 5 if α0 and nare known for a specific liquid.
3 Method
3.1 PFC Emulsions
Gold NPs were synthesized using a previously publishedmethod based on the reduction of sodium citrate.30 Specifically,gold NPs were made by loading 100 mg of sodium citrate and150 mL of deionized water into a 250-mL round-bottom flask,heating the mixture to boiling, followed by the injection of 1 mLof 25 mM HAuCl4. The temperature of the mixture was slowlydecreased to 90°C over a 15 min time period, and 1 mL of 60-mM sodium citrate was then injected, followed by the injectionof 0.9 mL of 25-mM HAuCl4. After 15 min, the injections ofsodium citrate and HAuCl4 were repeated, resulting in the for-mation of gold NPs. To miscibilize gold NPs into PFHs (FC-72,Synquest Labs, FL, USA), the NPs were coated with silica,31
followed by surface fluorination.32,33 Specifically, to coat theNPs with silica, a freshly prepared aqueous solution of 3-aminopropyl trimethoxy silane (APTES, 1.6 mL, 1 mM) was
Journal of Biomedical Optics 096016-2 September 2012 • Vol. 17(9)
Strohm et al.: Acoustic and photoacoustic characterization of micron-sized perfluorocarbon emulsions
Downloaded From: https://www.spiedigitallibrary.org/journals/Journal-of-Biomedical-Optics on 24 Feb 2020Terms of Use: https://www.spiedigitallibrary.org/terms-of-use
added to 150 mL of the gold NPs solution under vigorous mag-netic stirring. The APS and gold dispersion were reacted for15 min to ensure complete complexation of the amine groupswith the gold surface. A solution of active silica was preparedby lowering the pH of a 0.54 wt% sodium silicate solution to 11by progressive additions of 1.0 M HCl. Active silica (9 mL) wasthen added to 150 mL of the surface modified gold NPs, againunder vigorous magnetic stirring. The resulting dispersion(pH ¼ 8.5) was then allowed to stand for a minimum of24 h, to permit the active silica to polymerize onto the surfaceof the gold NPs. For miscibilization of gold NPs into PFH, thesilica-coated gold NPs were redispersed in 10 mL of methanol,34
and the mixture was reacted with 150 μL of 1H,1H,2H,2H-per-fluorodecyltriethoxysilane (5 min), and mixed with 50 μL of30% ammonia/water and reacted for 24 h. After evaporationof methanol, the NPs were solubilized into 2 mL of PFH.All chemicals for silica-coated gold NP synthesis and their mis-cibilization into PFCs (HAuCl4, sodium citrate, APS, sodiumsilicate and 1H,1H,2H,2H-perfluorodecyltriehthoxysilane) werepurchased from Sigma-Aldrich, ON, Canada. The thickness ofthe silica coating and the size of the gold NPs were determinedby transmission electron microscopy using a Hitachi S-5200scanning electron microscope (Hitachi Canada Ltd., ON,Canada). For NP characterization in the ultraviolet, visible,and near-IR ranges, a Cary-5000 UV-Vis-NIR spectrophot-ometer (Agilent Technologies, CA, USA) was used. GoldNP-incorporated PFH droplets were prepared using 5 mL ofdeionized water (Millipore Milli-Q grade, 18.2 MΩ),0.175 mL of gold NP-FC-72 solution, and 0.025 mL of anionicphosphate fluorosurfactant (Zonyl-FSP, Sigma Aldrich, ON,Canada). Droplets were prepared by coarse emulsification byvortexing, followed by membrane emulsification using 10-μmpore size polycarbonate membranes (Nuclepore Track-EtchMembrane, Whatman, NJ, USA).14
PFH (56°C boiling point) was used instead of the more com-monly used perfluoropentane (PFP, 29°C boiling point) asmicron-scale PFH droplets are more stable and are less likely tospontaneously vaporize at the temperatures used in these experi-ments compared to PFP droplets.35,36 Moreover, the sound speedof bulk PFP could not be measured at 36°C as it is over the boil-ing point of 29°C, and it would be difficult to use the theoreticalphotoacoustic equations. The sound speed of bulk PFH has beenpreviously measured at the frequencies and temperatures used.24
3.2 Photoacoustic Microscope
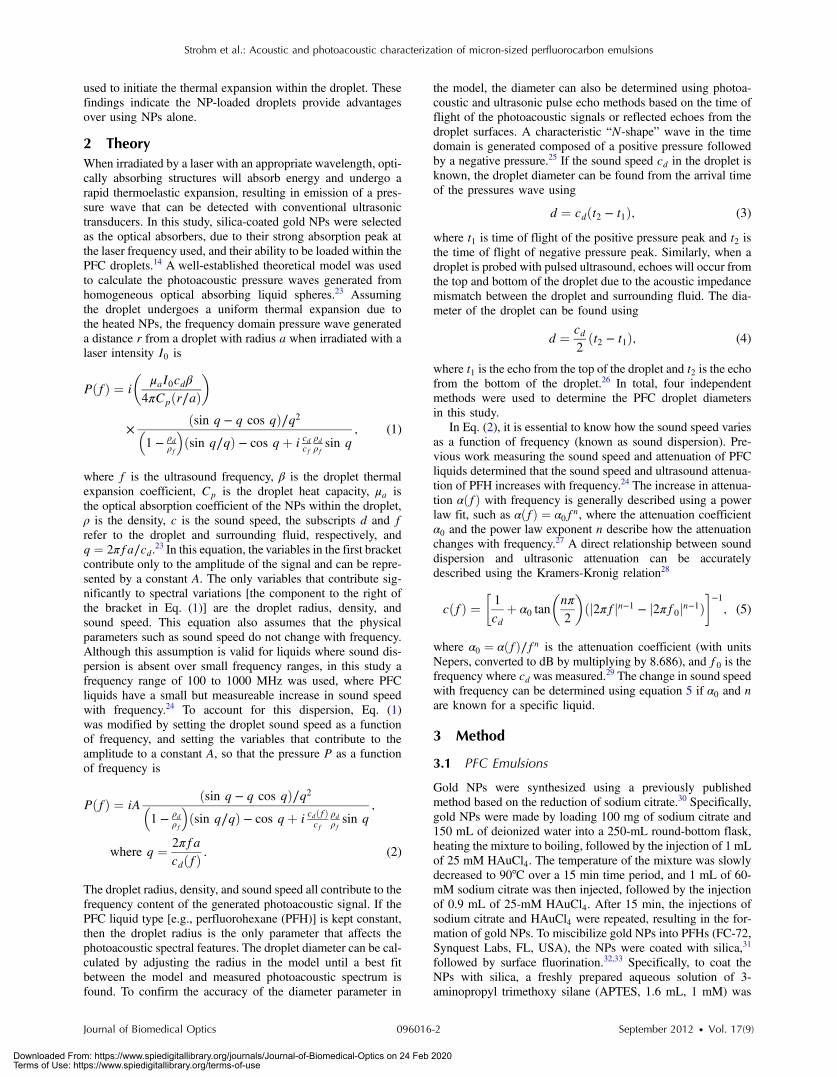
All acoustic and photoacoustic measurements were made usingthe SASAM acoustic microscope (Kibero GmbH, Germany).An IX81 inverted optical microscope (Olympus, Japan) wasmodified where a transducer was positioned above the opticalobjective. The sample is positioned between the optical objec-tive and transducer, allowing for optical observation during mea-surements. Ultrasonic pulse echo measurements were made byscanning the sample under the transducer. For photoacousticmeasurements, a 532-nm laser was collimated through theback port of the inverted microscope and focused onto the sam-ple with the same objective used to view the sample. A dichoricmirror (Chroma Technology Corp, USA) was used to reflectoptical wavelengths between 450 and 620 nm, but pass allother wavelengths to allow for optical viewing and targetingwhen using the laser [Fig. 1(a)]. The transducer was focusedabove the laser spot under optical guidance, and the sample
was scanned under the transducer with both the optical objectiveand transducer remaining stationary [Fig. 1(b)].
Transducers with center frequencies of 375 MHz (60-degaperture, 42% bandwidth) and 750 MHz (100-deg aperture,37% bandwidth) were used for all acoustic and photoacousticmeasurements. For acoustic measurements, a 10 Vpp monocyclesignal was generated at 300 MHz (for the 375 MHz transducer)and at 1000 MHz (for the 750 MHz transducer) at a pulse repeti-tion frequency (PRF) of up to 500 kHz. One hundred signalswere averaged at 375 MHz, while 1000 signals were averagedat 750 MHz. For photoacoustic measurements, the laser wasfocused onto the sample using a 10× optical objective (0.3numerical aperture). The laser triggered the data acquisitionof the signals the transducer recorded. The laser had a pulsewidth of 330 ps and PRF of 4 kHz. All signals were amplifiedby a 40-dB amplifier (Miteq, USA) and digitized at 8 GHz. Allmeasurements were made at 36°C to simulate human physiolo-gical conditions. Further details on the system can be foundelsewhere.14,37
3.3 Acoustic and Photoacoustic Measurements
Droplets were embedded into gelatin phantoms to ensure theywere immobilized during the measurements. Droplets wereadded to liquid gelatin at a temperature of 37°C, and then for-maldehyde was added to increase phantom stiffness. Dropletsclose to the phantom surface were measured to minimize theattenuation losses through gelatin. All acoustic and photoacous-tic measurements at 375 MHz were made with the dropletsembedded within the gelatin. No signal from embedded dropletswas detected at 750 MHz due to attenuation through the gelatin,therefore droplets were deposited onto the phantom surface forthe 750-MHz photoacoustic measurements. Subsequent mea-surements using the 375-MHz transducer were not possible,as the droplets would move from the field of view while switch-ing transducers. The acoustic properties of gelatin and water arevery similar,38 and the spectral features only depend on thesound speed and density of the droplet and coupling fluid inEq. (2). Therefore it is unlikely the change in medium betweensimilar liquids would significantly affect the spectral shape.
Fig. 1 (a) The acoustic microscope is an inverted optical microscopewhere the laser has been focused through the pack port onto the sam-ple. The mirror reflects 500 to 650 nm (the laser wavelengths) towardthe sample, but allows other wavelengths to pass for optical viewing.The transducer measures the signals from above the sample. (b) A close-up view of a measurement of a single droplet. The laser is focused ontothe sample using the optical objective with the transducer positioneddirectly above the droplet.
Journal of Biomedical Optics 096016-3 September 2012 • Vol. 17(9)
Strohm et al.: Acoustic and photoacoustic characterization of micron-sized perfluorocarbon emulsions
Downloaded From: https://www.spiedigitallibrary.org/journals/Journal-of-Biomedical-Optics on 24 Feb 2020Terms of Use: https://www.spiedigitallibrary.org/terms-of-use
To record the acoustic and photoacoustic signals, a dropletwas positioned over the laser spot and then the transducer wasfocused above the droplet. The sample stage was scanned over a10 × 10-μm area using a 0.5-μm step size, and the signal fromthe center of the droplet was used for analysis. The opticalobjective and transducer remained stationary and co-alignedduring all scans. The transducer response was removed by nor-malizing the signal as described elsewhere.39 Briefly, the nor-malized signal was calculated by dividing the measuredspectrum of the droplet by the reference spectrum of the trans-ducer. The bandwidth of a transducer is typically found by mea-suring the reflected echoes from a glass or quartz substrate thatreflects the ultrasound back to the transducer. We have foundthat this is not an accurate representation of the transducer band-width used in photoacoustics since the transducer is used in pas-sive mode. The transducers appear to have better sensitivitywhen receiving (photoacoustic) than during transmit and receive(ultrasound). A 200-nm gold layer theoretically has a flat photo-acoustic spectrum to within 3 dB from 1 to 1000 MHz,40 andwill give an accurate representation of the transducer spectralresponse in passive mode; therefore, we used the photoacousticsignal from a gold film as a reference. A Hamming window wasapplied to all signals, along with a bandpass filter of 100 to500 MHz for the 375-MHz transducer and 300 to 1000 MHzfor the 750-MHz transducer.
3.4 Droplet Diameter Measurements
The droplet diameter was calculated using three independentmethods: 1) the photoacoustic time domain signal; 2) the timedomain ultrasound signal; and 3) fitting the measured photoa-coustic spectrum to the model. Only the signals measured usingthe 375-MHz transducer were used in the diameter calculations.These calculations were compared to images recorded from aCCD camera using an optical microscope with a 10× objective(100 × total magnification).
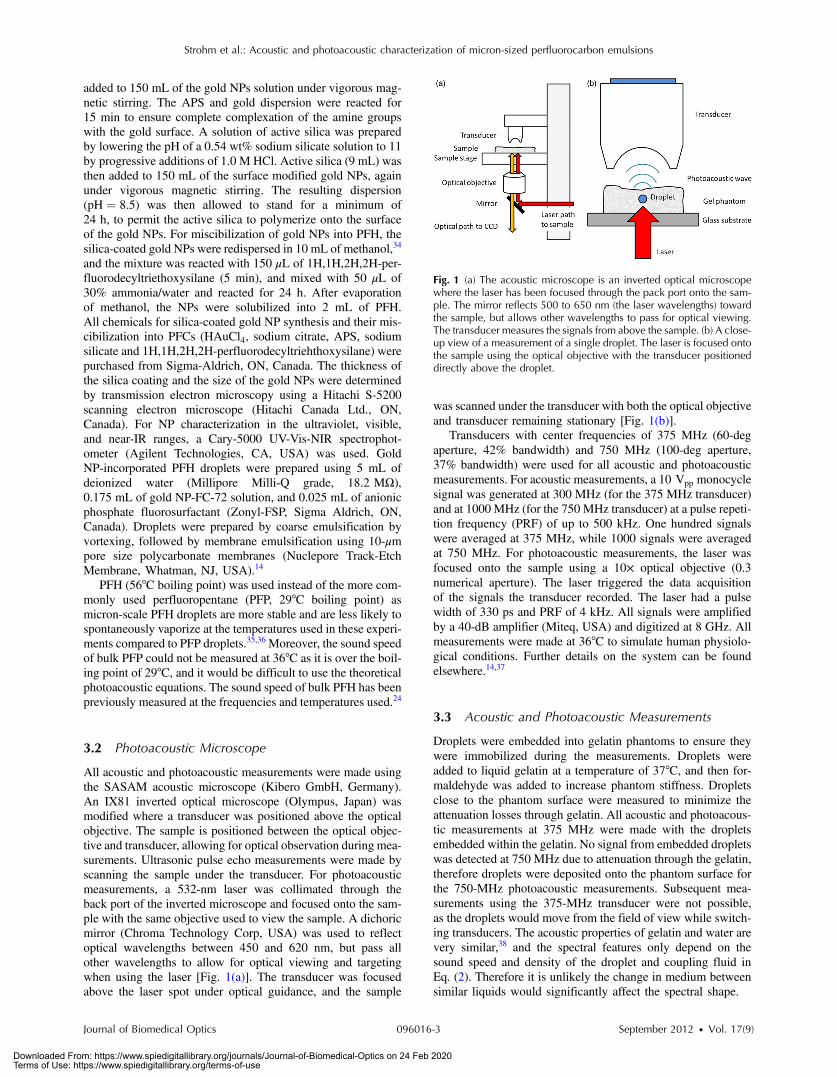
The photoacoustic method used the time of flight of the posi-tive and negative pressure waves from the droplet and Eq. (3) todetermine the droplet diameter. The pressure wave emitted froma droplet during optical irradiation has two significant features:an initial positive sharp pressure peak that gradually decreases toa negative pressure peak. This waveform has a characteristic“N-shape” in the time domain, analogous to pressure waves gen-erated from a bursting balloon.41,42 The theoretical time domain
signal for a 5-μm PFH droplet is shown in Fig. 2(a) (black dottedline), where the N-shape waveform is clearly visible. However,the finite bandwidth of a transducer can alter the signal. Forexample, the same signal subjected to a Hamming windowand a 100- to 500-MHz bandpass filter (to emulate the limitedtransducer bandwidth) is shown in Fig. 2(a) (red solid line).Instead of an N-shape, two peaks are visible, which alignwith the positive and negative peaks of the N-shape waveform.These two peaks can be used to determine the droplet diameterusing Eq. (3), where t1 is the positive peak on the first signal andt2 is the negative peak on the second signal.
The ultrasound pulse echo method used the time of flight ofthe echoes from the top and bottom of the droplet [t1 and t2 inFig. 2(b)] in Eq. (4) to determine the droplet diameter. Thisapproach required that the droplet was sufficiently large so thatthe two echoes were separated in time and could be resolved.This method could not be used for droplets smaller than approxi-mately 5 μm, as the signals would overlap.
The photoacoustic spectral method was used to calculate thediameter by comparing the spectrum from the measured photo-acoustic signal to the model [Eq. (2)]. The model was calculatedusing a constant density of 1650 kg∕m3, and the sound speedwas varied from 480 to 486 m∕swith increasing frequency from100 to 1000 MHz [Eq. (5)]. The diameter was adjusted until theminima and maxima between experiment and model matched.The diameter found from these signal processing methodswere then compared to a direct optical measurement from themicroscope.
4 Results and Discussion
4.1 Droplet Configuration
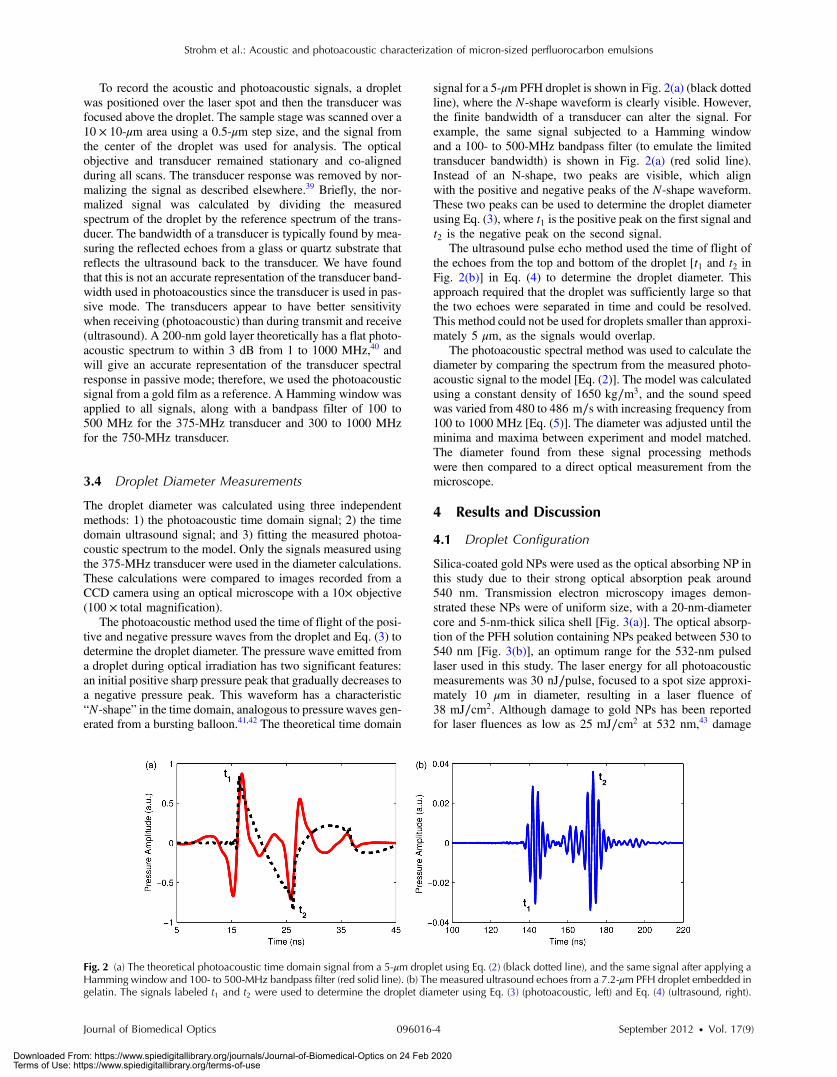
Silica-coated gold NPs were used as the optical absorbing NP inthis study due to their strong optical absorption peak around540 nm. Transmission electron microscopy images demon-strated these NPs were of uniform size, with a 20-nm-diametercore and 5-nm-thick silica shell [Fig. 3(a)]. The optical absorp-tion of the PFH solution containing NPs peaked between 530 to540 nm [Fig. 3(b)], an optimum range for the 532-nm pulsedlaser used in this study. The laser energy for all photoacousticmeasurements was 30 nJ∕pulse, focused to a spot size approxi-mately 10 μm in diameter, resulting in a laser fluence of38 mJ∕cm2. Although damage to gold NPs has been reportedfor laser fluences as low as 25 mJ∕cm2 at 532 nm,43 damage
Fig. 2 (a) The theoretical photoacoustic time domain signal from a 5-μm droplet using Eq. (2) (black dotted line), and the same signal after applying aHamming window and 100- to 500-MHz bandpass filter (red solid line). (b) The measured ultrasound echoes from a 7.2-μm PFH droplet embedded ingelatin. The signals labeled t1 and t2 were used to determine the droplet diameter using Eq. (3) (photoacoustic, left) and Eq. (4) (ultrasound, right).
Journal of Biomedical Optics 096016-4 September 2012 • Vol. 17(9)
Strohm et al.: Acoustic and photoacoustic characterization of micron-sized perfluorocarbon emulsions
Downloaded From: https://www.spiedigitallibrary.org/journals/Journal-of-Biomedical-Optics on 24 Feb 2020Terms of Use: https://www.spiedigitallibrary.org/terms-of-use
thresholds can depend on the gold NP surface and coating, andother laser parameters such as pulse length. In this study, thephotoacoustic signals from the NP-loaded droplets (rangingin size from 2 to 15 μm) were stable over repeated measurementsusing laser fluences of 38 mJ∕cm2, indicating damage to NPswas negligible. At higher fluence levels (over 50 mJ∕cm2), themeasured photoacoustic signal decreased rapidly over repeatedpulses, which could be attributed to NP damage. The vaporiza-tion threshold for these droplets was between 50 and120 mJ∕cm2, considerably less than 1.5 to 3 J∕cm2 requiredto vaporize PFH droplets containing lead sulphide NPsreported previously using a 1064-nm laser.14 This is likelydue to the much higher absorption coefficient of the goldNPs (110 cm−1 at 532 nm) compared with lead sulphide NPs(4.3 cm−1 at 1064 nm).
The number of NPs inside the droplets was estimated basedon the initial concentration of NPs in the PFC liquid(∼1014 NPs∕mL of PFC). Assuming the NPs are distributeduniformly within the droplets, there are approximately6550 NPs in 5-μm droplets (6.7 × 10⁻¹¹ cc) and 52300 NPsin 10-μm droplets (5.7 × 10⁻¹⁰ cc). The approximate distancefrom one NP to its neighbor can be calculated by estimatingthe volume fraction of spheres that can fill a single dropletusing a random close-packing model.44 Based on this model, theaverage distance between NPs is ∼230 nm. Although some non-uniform distribution of NPs within the droplets is possible, as an
order of magnitude calculation, the calculated values for the NPquantity and NP-spacing seem reasonable.
4.2 Sound Dispersion Effects
Other studies have demonstrated excellent agreement betweenthe photoacoustic model [Eq. (1)] and experiments of opticalabsorbing mm-sized spherical droplets at photoacoustic fre-quencies less than 20 MHz, where sound dispersion has beenneglected.23,25,45 While PFC liquids have negligible dispersionat 22 MHz,46 a small but measureable increase of sound disper-sion was found for three PFC liquids up to 1000 MHz.24 ForPFH, the liquid used in this study, the sound speed increasedfrom 480 to 486 m∕s, and the ultrasound attenuation increasedfrom 1368 to 16840 dB∕cm from 200 to 1000 MHz at 36°C.24
Using a power law fit, the attenuation as a function of frequencywas found to be αðfÞ ¼ 0.352 f1.56, as described in Ref. 24.Attenuation is linked to changes in sound speed via theKramers-Kronig relations. To obtain a smooth change insound speed with frequency, the sound speed over the range of100 to 1000MHz was calculated from the attenuation power lawfit of 0.352 f1.56 using the Kramers-Kronig relations [Eq. (5)].
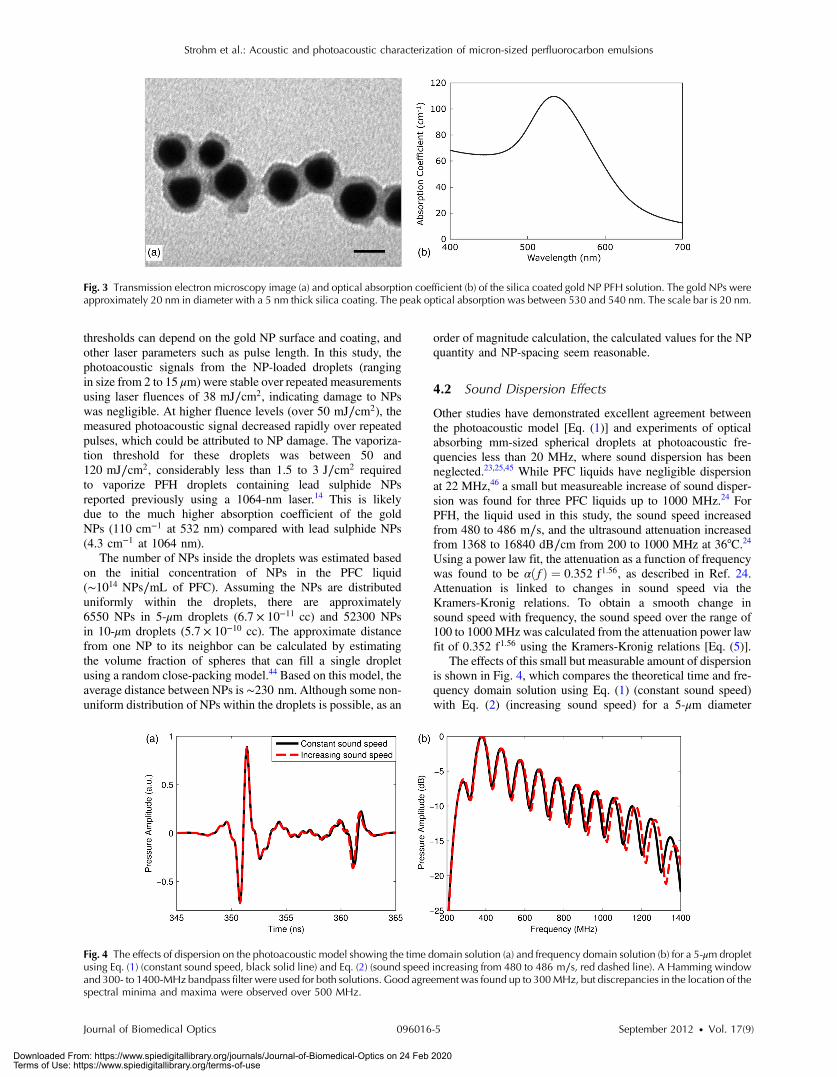
The effects of this small but measurable amount of dispersionis shown in Fig. 4, which compares the theoretical time and fre-quency domain solution using Eq. (1) (constant sound speed)with Eq. (2) (increasing sound speed) for a 5-μm diameter
Fig. 3 Transmission electron microscopy image (a) and optical absorption coefficient (b) of the silica coated gold NP PFH solution. The gold NPs wereapproximately 20 nm in diameter with a 5 nm thick silica coating. The peak optical absorption was between 530 and 540 nm. The scale bar is 20 nm.
Fig. 4 The effects of dispersion on the photoacoustic model showing the time domain solution (a) and frequency domain solution (b) for a 5-μm dropletusing Eq. (1) (constant sound speed, black solid line) and Eq. (2) (sound speed increasing from 480 to 486 m∕s, red dashed line). A Hamming windowand 300- to 1400-MHz bandpass filter were used for both solutions. Good agreement was found up to 300MHz, but discrepancies in the location of thespectral minima and maxima were observed over 500 MHz.
Journal of Biomedical Optics 096016-5 September 2012 • Vol. 17(9)
Strohm et al.: Acoustic and photoacoustic characterization of micron-sized perfluorocarbon emulsions
Downloaded From: https://www.spiedigitallibrary.org/journals/Journal-of-Biomedical-Optics on 24 Feb 2020Terms of Use: https://www.spiedigitallibrary.org/terms-of-use
PFH droplet. A Hamming window and 300- to 1400-MHz band-pass filter were used to simulate a wide bandwidth transducer.Good agreement in the location of the spectral minima and max-ima between both equations were observed up to 300 MHz,while discrepancies were observed over 500 MHz. Onlyminor differences were observed in the time domain waveform,where the second peak at 362 ns was shifted slightly. Since thisstudy compares the measured photoacoustic spectra from dro-plets up to 1000 MHz, it is important to account for sound dis-persion when comparing measured results to the model.
4.3 Droplet Diameter Measurements
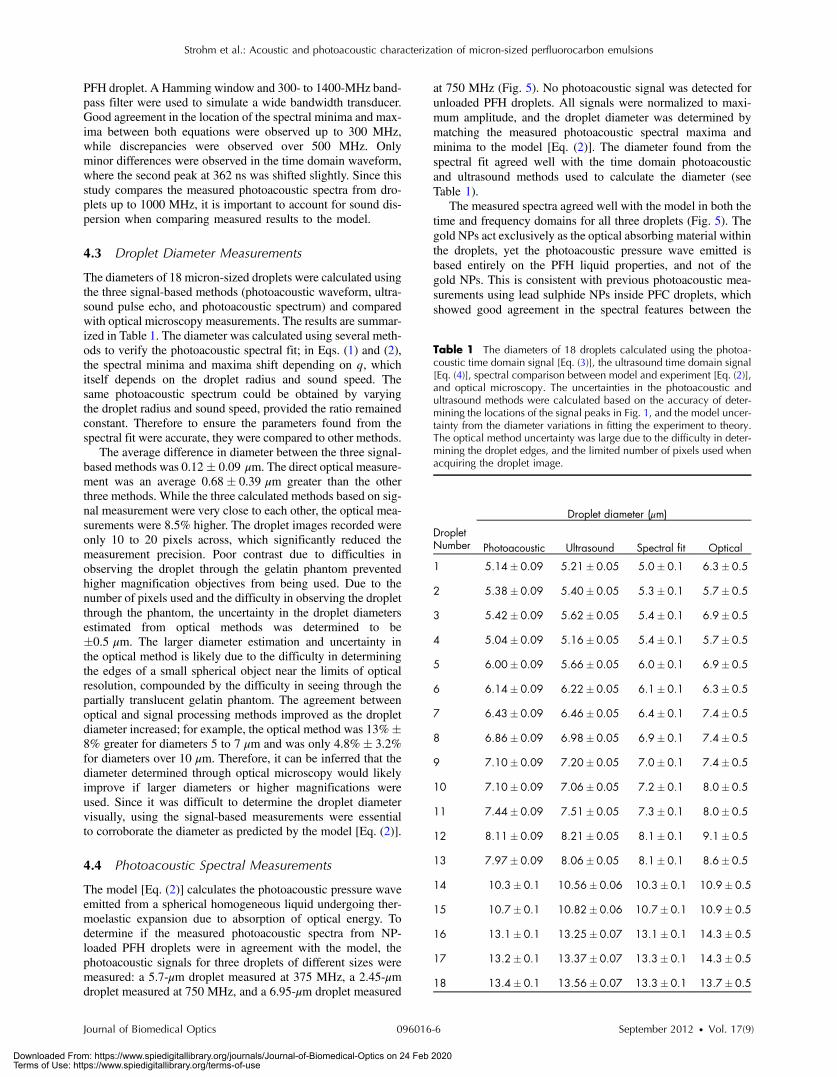
The diameters of 18 micron-sized droplets were calculated usingthe three signal-based methods (photoacoustic waveform, ultra-sound pulse echo, and photoacoustic spectrum) and comparedwith optical microscopy measurements. The results are summar-ized in Table 1. The diameter was calculated using several meth-ods to verify the photoacoustic spectral fit; in Eqs. (1) and (2),the spectral minima and maxima shift depending on q, whichitself depends on the droplet radius and sound speed. Thesame photoacoustic spectrum could be obtained by varyingthe droplet radius and sound speed, provided the ratio remainedconstant. Therefore to ensure the parameters found from thespectral fit were accurate, they were compared to other methods.
The average difference in diameter between the three signal-based methods was 0.12� 0.09 μm. The direct optical measure-ment was an average 0.68� 0.39 μm greater than the otherthree methods. While the three calculated methods based on sig-nal measurement were very close to each other, the optical mea-surements were 8.5% higher. The droplet images recorded wereonly 10 to 20 pixels across, which significantly reduced themeasurement precision. Poor contrast due to difficulties inobserving the droplet through the gelatin phantom preventedhigher magnification objectives from being used. Due to thenumber of pixels used and the difficulty in observing the dropletthrough the phantom, the uncertainty in the droplet diametersestimated from optical methods was determined to be�0.5 μm. The larger diameter estimation and uncertainty inthe optical method is likely due to the difficulty in determiningthe edges of a small spherical object near the limits of opticalresolution, compounded by the difficulty in seeing through thepartially translucent gelatin phantom. The agreement betweenoptical and signal processing methods improved as the dropletdiameter increased; for example, the optical method was 13%�8% greater for diameters 5 to 7 μm and was only 4.8%� 3.2%for diameters over 10 μm. Therefore, it can be inferred that thediameter determined through optical microscopy would likelyimprove if larger diameters or higher magnifications wereused. Since it was difficult to determine the droplet diametervisually, using the signal-based measurements were essentialto corroborate the diameter as predicted by the model [Eq. (2)].
4.4 Photoacoustic Spectral Measurements
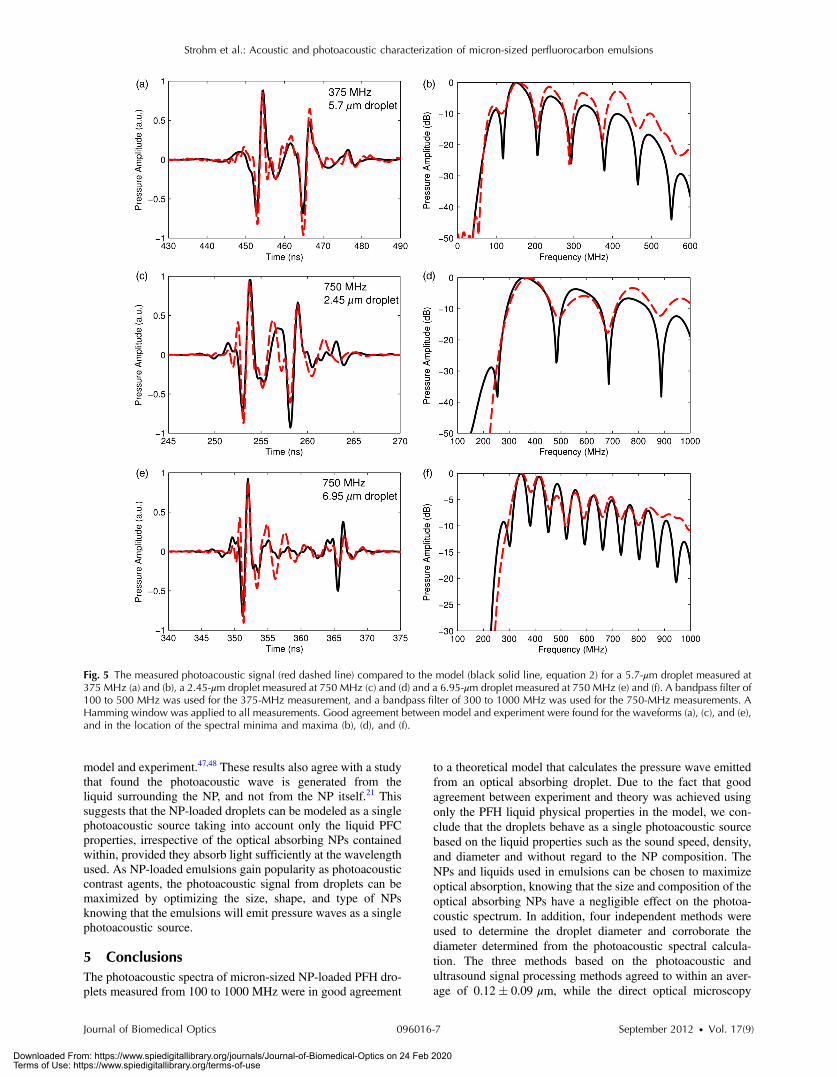
The model [Eq. (2)] calculates the photoacoustic pressure waveemitted from a spherical homogeneous liquid undergoing ther-moelastic expansion due to absorption of optical energy. Todetermine if the measured photoacoustic spectra from NP-loaded PFH droplets were in agreement with the model, thephotoacoustic signals for three droplets of different sizes weremeasured: a 5.7-μm droplet measured at 375 MHz, a 2.45-μmdroplet measured at 750 MHz, and a 6.95-μm droplet measured
at 750 MHz (Fig. 5). No photoacoustic signal was detected forunloaded PFH droplets. All signals were normalized to maxi-mum amplitude, and the droplet diameter was determined bymatching the measured photoacoustic spectral maxima andminima to the model [Eq. (2)]. The diameter found from thespectral fit agreed well with the time domain photoacousticand ultrasound methods used to calculate the diameter (seeTable 1).
The measured spectra agreed well with the model in both thetime and frequency domains for all three droplets (Fig. 5). Thegold NPs act exclusively as the optical absorbing material withinthe droplets, yet the photoacoustic pressure wave emitted isbased entirely on the PFH liquid properties, and not of thegold NPs. This is consistent with previous photoacoustic mea-surements using lead sulphide NPs inside PFC droplets, whichshowed good agreement in the spectral features between the
Table 1 The diameters of 18 droplets calculated using the photoa-coustic time domain signal [Eq. (3)], the ultrasound time domain signal[Eq. (4)], spectral comparison between model and experiment [Eq. (2)],and optical microscopy. The uncertainties in the photoacoustic andultrasound methods were calculated based on the accuracy of deter-mining the locations of the signal peaks in Fig. 1, and the model uncer-tainty from the diameter variations in fitting the experiment to theory.The optical method uncertainty was large due to the difficulty in deter-mining the droplet edges, and the limited number of pixels used whenacquiring the droplet image.
Droplet diameter (μm)
DropletNumber Photoacoustic Ultrasound Spectral fit Optical
1 5.14� 0.09 5.21� 0.05 5.0� 0.1 6.3� 0.5
2 5.38� 0.09 5.40� 0.05 5.3� 0.1 5.7� 0.5
3 5.42� 0.09 5.62� 0.05 5.4� 0.1 6.9� 0.5
4 5.04� 0.09 5.16� 0.05 5.4� 0.1 5.7� 0.5
5 6.00� 0.09 5.66� 0.05 6.0� 0.1 6.9� 0.5
6 6.14� 0.09 6.22� 0.05 6.1� 0.1 6.3� 0.5
7 6.43� 0.09 6.46� 0.05 6.4� 0.1 7.4� 0.5
8 6.86� 0.09 6.98� 0.05 6.9� 0.1 7.4� 0.5
9 7.10� 0.09 7.20� 0.05 7.0� 0.1 7.4� 0.5
10 7.10� 0.09 7.06� 0.05 7.2� 0.1 8.0� 0.5
11 7.44� 0.09 7.51� 0.05 7.3� 0.1 8.0� 0.5
12 8.11� 0.09 8.21� 0.05 8.1� 0.1 9.1� 0.5
13 7.97� 0.09 8.06� 0.05 8.1� 0.1 8.6� 0.5
14 10.3� 0.1 10.56� 0.06 10.3� 0.1 10.9� 0.5
15 10.7� 0.1 10.82� 0.06 10.7� 0.1 10.9� 0.5
16 13.1� 0.1 13.25� 0.07 13.1� 0.1 14.3� 0.5
17 13.2� 0.1 13.37� 0.07 13.3� 0.1 14.3� 0.5
18 13.4� 0.1 13.56� 0.07 13.3� 0.1 13.7� 0.5
Journal of Biomedical Optics 096016-6 September 2012 • Vol. 17(9)
Strohm et al.: Acoustic and photoacoustic characterization of micron-sized perfluorocarbon emulsions
Downloaded From: https://www.spiedigitallibrary.org/journals/Journal-of-Biomedical-Optics on 24 Feb 2020Terms of Use: https://www.spiedigitallibrary.org/terms-of-use
model and experiment.47,48 These results also agree with a studythat found the photoacoustic wave is generated from theliquid surrounding the NP, and not from the NP itself.21 Thissuggests that the NP-loaded droplets can be modeled as a singlephotoacoustic source taking into account only the liquid PFCproperties, irrespective of the optical absorbing NPs containedwithin, provided they absorb light sufficiently at the wavelengthused. As NP-loaded emulsions gain popularity as photoacousticcontrast agents, the photoacoustic signal from droplets can bemaximized by optimizing the size, shape, and type of NPsknowing that the emulsions will emit pressure waves as a singlephotoacoustic source.
5 ConclusionsThe photoacoustic spectra of micron-sized NP-loaded PFH dro-plets measured from 100 to 1000 MHz were in good agreement
to a theoretical model that calculates the pressure wave emittedfrom an optical absorbing droplet. Due to the fact that goodagreement between experiment and theory was achieved usingonly the PFH liquid physical properties in the model, we con-clude that the droplets behave as a single photoacoustic sourcebased on the liquid properties such as the sound speed, density,and diameter and without regard to the NP composition. TheNPs and liquids used in emulsions can be chosen to maximizeoptical absorption, knowing that the size and composition of theoptical absorbing NPs have a negligible effect on the photoa-coustic spectrum. In addition, four independent methods wereused to determine the droplet diameter and corroborate thediameter determined from the photoacoustic spectral calcula-tion. The three methods based on the photoacoustic andultrasound signal processing methods agreed to within an aver-age of 0.12� 0.09 μm, while the direct optical microscopy
Fig. 5 The measured photoacoustic signal (red dashed line) compared to the model (black solid line, equation 2) for a 5.7-μm droplet measured at375 MHz (a) and (b), a 2.45-μm droplet measured at 750 MHz (c) and (d) and a 6.95-μm droplet measured at 750 MHz (e) and (f). A bandpass filter of100 to 500 MHz was used for the 375-MHz measurement, and a bandpass filter of 300 to 1000 MHz was used for the 750-MHz measurements. AHamming window was applied to all measurements. Good agreement between model and experiment were found for the waveforms (a), (c), and (e),and in the location of the spectral minima and maxima (b), (d), and (f).
Journal of Biomedical Optics 096016-7 September 2012 • Vol. 17(9)
Strohm et al.: Acoustic and photoacoustic characterization of micron-sized perfluorocarbon emulsions
Downloaded From: https://www.spiedigitallibrary.org/journals/Journal-of-Biomedical-Optics on 24 Feb 2020Terms of Use: https://www.spiedigitallibrary.org/terms-of-use
measurement was 0.68� 0.39 μm higher. The large errors asso-ciated with the optical measurement may be due to limited vis-ibility, poor contrast, and the difficulty in delineating the bordersof micron-sized objects when embedded in a translucent gelatinmedium.
AcknowledgmentsE. Strohm is supported through a NSERC doctoral scholarship.This research was undertaken, in part, thanks to funding fromNSERC and the Canada Research Chairs Program awarded toM. Kolios. Funding to purchase the equipment was provided bythe Canada Foundation for Innovation, the Ontario Ministry ofResearch and Innovation, and Ryerson University. This studywas supported, in part, by the Ontario Institute for CancerResearch Network through funding provided by the Provinceof Ontario, the FY07 Department of Defense Breast CancerResearch Program Concept Award (BC075873), a program pro-ject grant entitled “Imaging for Cancer” and “Ultrasound forCancer Therapy” from the Terry Fox Foundation, and theOntario Research Fund-Research for Excellence Program.
References1. C. S. Cohn and M. M. Cushing, “Oxygen therapeutics: perfluorocar-
bons and blood substitute safety,” Crit. Care Clin. 25(2), 399–414(2009).
2. J. P. Fast and S. Mecozzi, “Nanoemulsions for Intravenous Drug Deliv-ery,” in Nanotechnology in Drug Delivery, M. M. Villiers, P. Aramwit,and G. S. Kwon, Eds., 461–489, Springer New York, New York, NY(2009).
3. R. E. Apfel, “Activatable infusable dispersions containing drops of asuperheated liquid,” U. S. Patent No. 5840276 (1998).
4. O. D. Kripfgans et al., “Acoustic droplet vaporization for therapeuticand diagnostic applications,” Ultrasound Med. Biol. 26(7), 1177–1189(2000).
5. T. Giesecke and K. Hynynen, “Ultrasound-mediated cavitation thresh-olds of liquid perfluorocarbon droplets in vitro,” Ultrasound Med. Biol.29(9), 1359–1365 (2003).
6. P. S. Sheeran et al., “Decafluorobutane as a phase-change contrast agentfor low-energy extravascular ultrasonic imaging,” Ultrasound Med.Biol. 37(9), 1518–1530 (2011).
7. N. Reznik, R. Williams, and P. N. Burns, “Investigation of vaporizedsubmicron perfluorocarbon droplets as an ultrasound contrast agent,”Ultrasound Med. Biol. 37(8), 1271–1279 (2011).
8. O. D. Kripfgans et al., “In vivo droplet vaporization for occlusion ther-apy and phase aberration correction,” IEEE Trans. Ultrason. Ferroe-lectr. Freq. Control 49(6), 726–738 (2002).
9. M. Zhang et al., “Acoustic droplet vaporization for enhancement of ther-mal ablation by high intensity focused ultrasound,” Acad. Radiol. 18(9),1123–1132 (2011).
10. M. L. Fabiilli et al., “Delivery of chlorambucil using an acousticallytriggered perfluoropentane emulsion,” Ultrasound Med. Biol. 36(8),1364–75 (2010).
11. N. Rapoport et al., “Ultrasound-mediated tumor imaging and nanother-apy using drug loaded, block copolymer stabilized perfluorocarbonnanoemulsions,” J. Control. Release 153(1), 4–15 (2011).
12. K. Wilson, K. Homan, and S. Emelianov, “Photoacoustic and ultra-sound imaging contrast enhancement using a dual contrast agent,” inProc. SPIE 7564, 75642P (2010).
13. E. M. Strohm et al., “Optical droplet vaporization (ODV): photoacousticcharacterization of perfluorocarbon droplets,” in IEEE InternationalUltrasonics Symposium, pp. 495–498, Institute of Electrical and Elec-tronics Engineers (IEEE), USA (2010).
14. E. M. Strohm et al., “Vaporization of perfluorocarbon droplets usingoptical irradiation,” Bio. Opt. Express 2(6), 1432–1442 (2011).
15. K. Wilson, K. Homan, and S. Emelianov, “Biomedical photoacousticsbeyond thermal expansion using triggered nanodroplet vaporization forcontrast-enhanced imaging,” Nat. Commun. 3, 618 (Jan 2012).
16. W. J. Akers et al., “Noninvasive photoacoustic and fluorescence sentinellymph node identification using dye-loaded perfluorocarbon nanoparti-cles,” ACS Nano 5(1), 173–182 (2011).
17. P. K. Jain, I. H. El-Sayed, and M. A. El-Sayed, “Au nanoparticles targetcancer,” Nano Today 2(1), 18–29 (2007).
18. A.D. L. Zerda et al., “Carbon nanotubes as photoacousticmolecular ima-ging agents in living mice,” Nat. Nanotechnol. 3(9), 557–562 (2008).
19. J.-W. Kim et al., “Golden carbon nanotubes as multimodal photoacous-tic and photothermal high-contrast molecular agents,” Nat. Nanotech-nol. 4(10), 688–694 (2009).
20. H. Maeda et al., “Tumor vascular permeability and the EPR effect inmacromolecular therapeutics: a review,” J. Control. Release65(1–2), 271–284 (2000).
21. Y. Chen et al., “Environment-dependent generation of photoacousticwaves from plasmonic nanoparticles,” Small 8(1), 47–52 (2012).
22. M. M. Kaneda et al., “Perfluorocarbon nanoemulsions for quantitativemolecular imaging and targeted therapeutics,” Ann. Biomed. Engin. 37(10), 1922–1933 (2009).
23. G. J. Diebold, T. Sun, and M. I. Khan, “Photoacoustic monopole radia-tion in one, two, and three dimensions,” Phys. Rev. Lett. 67(24),3384–3387 (1991).
24. E. M. Strohm and M. C. Kolios, “Sound velocity and attenuation mea-surements of perfluorocarbon liquids using photoacoustic methods,” inIEEE International Ultrasonics Symposium, pp. 2368–2371, Institute ofElectrical and Electronics Engineers (IEEE), USA (2011).
25. G. J. Diebold, M. I. Khan, and S. M. Park, “Photoacoustic ‘signatures’of particulate matter: optical production of acoustic monopole radia-tion,” Science 250(4977), 101–104 (1990).
26. A. Briggs and O. Kolosov, Acoustic Microscopy, Oxford UniversityPress, USA (2009).
27. R. S. C. Cobbold, N. V. Sushilov, and A. C. Weathermon, “Transientpropagation in media with classical or power-law loss,” J. AcousticalSoc. Am. 116(6), 3294–3303 (2004).
28. M. O’Donnell, “Kramers–Kronig relationship between ultrasonicattenuation and phase velocity,” J. Acoustical Soc. Am. 69(3), 696–701 (1981).
29. T. L. Szabo, “Causal theories and data for acoustic attenuation obeying afrequency power law,” J. Acoustical Soc. Am. 97(1), 14–24 (1995).
30. N. G. Bastús, J. Comenge, and V. Puntes, “Kinetically controlled seededgrowth synthesis of citrate-stabilized gold nanoparticles of up to200 nm: size focusing versus Ostwald ripening,” Langmuir 27(17),11098–11105 (2011).
31. L. M. Liz-Marzán, M. Giersig, and P. Mulvaney, “Synthesis of nano-sized gold–silica core–shell particles,” Langmuir 12(18), 4329–4335(1996).
32. I. Gorelikov et al., “Silica-coated quantum dots for optical evaluation ofperfluorocarbon droplet interactions with cells,” Langmuir 27(24),15024–15033 (2011).
33. N. Matsuura et al., “Nanoparticle-tagged perfluorocarbon droplets formedical imaging,” in Mater. Res. Soc. Symp. Proc. p. 1140, CambridgeUniversity Press, Cambridge, United Kingdom (2009).
34. I. Gorelikov and N. Matsuura, “Single-step coating of mesoporous silicaon cetyltrimethyl ammonium bromide-capped nanoparticles,” NanoLett. 8(1), 369–373 (2008).
35. A. Martin et al., “Intracellular growth of nanoscale perfluorocarbondroplets for enhanced ultrasound-induced phase-change conversion,”Ultrasound Med. Biol. 38(10), 1799–1810 (2012).
36. M. G. Freire et al., “Aging mechanisms of perfluorocarbon emulsionsusing image analysis,” J. Colloid Interface Sci. 286(1), 224–232 (2005).
37. E. M. Strohm, G. J. Czarnota, and M. C. Kolios, “Quantitative measure-ments of apoptotic cell properties using acoustic microscopy,” IEEETrans. Ultrason. Ferroelectr. Freq. Control 57(10), 2293–2304 (2010).
38. K. Zell et al., “Acoustical properties of selected tissue phantom materi-als for ultrasound imaging,” Phys. Med. Biol. 52(20), N475–N484(2007).
39. R. E. Baddour et al., “High-frequency ultrasound scattering from micro-spheres and single cells,” J. Acoust. Soc. Am. 117(2), 934–943 (2005).
40. M. Khan, T. Sun, and G. Diebold, “Photoacoustic waves generated byabsorption of laser radiation in optically thin layers,” J. Acoustical Soc.Am. 93(3), 1417–1425 (1993).
41. B. G. Watters, “The (sound of a bursting) red balloon,” Sound: Its UsesControl 2(2), 8–14 (1963).
Journal of Biomedical Optics 096016-8 September 2012 • Vol. 17(9)
Strohm et al.: Acoustic and photoacoustic characterization of micron-sized perfluorocarbon emulsions
Downloaded From: https://www.spiedigitallibrary.org/journals/Journal-of-Biomedical-Optics on 24 Feb 2020Terms of Use: https://www.spiedigitallibrary.org/terms-of-use
42. D. T. Deihl, “‘N Waves’ from bursting balloons,” Am. J. Phys. 36(5),441–444 (1968).
43. R. R. Letfullin et al., “Laser-induced explosion of gold nanoparticles:potential role for nanophotothermolysis of cancer,” Nanomedicine 1(4),473–480 (2006).
44. G. D. Scott and D. M. Kilgour, “The density of random close packing ofspheres,” J. Phys. D Appl. Phys. 2(6), 863–866 (1969).
45. G. Diebold and P. Westervelt, “The photoacoustic effect generated by aspherical droplet in a fluid,” J. Acoustical Soc. Am. 84, 2245–2251(1988).
46. C. S. Hall et al., “Experimental determination of phase velocityof perfluorocarbons: applications to targeted contrast agents,”IEEE Trans. Ultrasonics Ferroelectr. Frequ. Control. 47(1), 75–84(2000).
47. E. M. Strohm et al., “Optical droplet vaporization of micron-sized per-fluorocarbon droplets and their photoacoustic detection,” Proc. SPIE7899, 78993H (2011).
48. E. Strohm et al., “Photoacoustic spectral characterization of perfluoro-carbon droplets,” Proc. SPIE 8223, 82232F (2012).
Journal of Biomedical Optics 096016-9 September 2012 • Vol. 17(9)
Strohm et al.: Acoustic and photoacoustic characterization of micron-sized perfluorocarbon emulsions
Downloaded From: https://www.spiedigitallibrary.org/journals/Journal-of-Biomedical-Optics on 24 Feb 2020Terms of Use: https://www.spiedigitallibrary.org/terms-of-use