Embed Size (px)
Citation preview
Waterborne seismic noise is abroad category encompassing well-known noises like marine multiples,seismic interference noise, noise ema-nating from offshore structures andpropagating into the marine envi-ronment, and even borehole-trappednoise. For several years, we havebeen studying the potential of bub-ble curtains for suppressing thesetypes of noises.
The work began in the area ofmultiple suppression. Processingapproaches to multiple suppressionhave a long history in the seismicindustry, dating back at least toBackus’ classic 1959 GEOPHYSICSpaper on removal of “singing” fromseismic records by deconvolution.Each successive generation of pro-cessing methods has improved mul-tiple suppression by relying on moreaccurate models of the noise-gener-ation mechanisms. However, overthe course of more than 30 years ofimproving processing-only methods,suppressing such noises is still a keyissue in seismic data processing, and still a key risk factor inseismic interpretation and attribute analysis. One reason is thatgeophysical data are applied in contexts that are more demand-ing from the noise-suppression perspective: The current geo-logic areas where we are operating are more structurallycomplex and involve stronger multiple generators (e.g., saltand volcanics) than in earlier years. Another reason for thecontinued difficulty with multiple suppression is that moreis required of data today than in the past. A structural inter-pretation is only the beginning—now we also require goodamplitudes for AVO, attribute analysis, and inversions.
One approach toward improving multiple suppression intoday’s difficult data areas is to continue to improve our phys-ical description of multiple-generation mechanisms, includ-ing extending algorithms into 3D and improving the accuracyof estimating multiple characteristics from the data. A num-ber of new methods have resulted from this approach in recentyears, including the surface-related multiple eliminationmethod and several model-based methods. Improving ourmodels will continue to be an important part of the develop-ment of multiple-suppression techniques.
However, a processing-only approach has its limits. Thelevel of improvement that each successive generation of meth-ods achieves is smaller and smaller. This methodology mayhave reached diminishing returns. Multiple suppression by afactor of 3-5 is readily achievable by processing. However, mul-tiples generated from strong subsurface reflectors may be anorder of magnitude larger than the primaries of interest(though obviously not larger than the primaries that gener-ated them).
An alternative, the one underlying the methods proposedin this paper, is to attempt multiple suppression in data acqui-sition. Methods such as OBC and over-under sources/stream-ers adopt this philosophy by modifying acquisition to improvemultiple suppression. Another example is multiazimuth acqui-sition, in which acquisition is tailored to the requirements ofcomplex multiple generation. The method proposed hereattempts to mitigate multiples by blocking their generation atthe air-water interface. The air-water interface is the mostimportant horizon in the generation of surface multiples andhas been the focus of surface-related processing for severalyears. We extend this approach to the acquisition realm. Werefer to the method of blocking or absorbing acoustic energyfrom downward reflection at the air-water interface as an“acoustic blanket” (Figure 1).
Early in our work, we studied many potential materialsand configurations that could provide absorption or diminu-tion of the downgoing reflection from the air-water interface.Laboratory studies demonstrated more success with methodsof deflection than methods of absorption. Even highly atten-uative materials represented a large impedance contrast to theacoustic wave, and as such reflected the acoustic wave ratherthan attenuating it. These results highlighted the value of cre-ating a surface that would be highly reflecting and have anadvantageous shape, rather than attempting to absorb theacoustic wave.
Scaling laboratory results to actual field acquisition dimen-sions highlighted the enormous volumes that would berequired for objects to deflect low-frequency acoustic waves.Objects need to be on the order of a Fresnel zone at the air-
MARCH 2005 THE LEADING EDGE 303
Mitigating seismic noise with an acoustic blanket—the promise and the challengeW.S. ROSS, P.J. LEE, S.E. HEINEY, and J.V. YOUNG, ExxonMobil Upstream Research Company, Houston, USAE.N. DRAKE, ExxonMobil Research and Engineering Company, Clinton, New Jersey, USAR. TENGHAMN and A. STENZEL, Petroleum Geo-Services, Houston, USA
Figure 1. Acoustic blanket concept. The acoustic blanket blocks downgoing waves at any portion of theair-water interface it covers. The white ray path would have been recorded as a multiple on the nearoffsets, but is intercepted by the acoustic blanket. The red ray path will be recorded on the far offsets,where there is moveout between multiple and primary and, hence, processing methods are effective. Theblanket should cover the portion of a CMP gather shown in the green circle, where primary-to-multipledifferential moveout is small.
water interface to have an appreciable effect on the reflectionprocess at that interface. It was natural to consider the use ofair-bubble curtains in order to create such large objects. Morethan a decade before our work, Domenico (1982) and Clark(1986) had proposed bubble curtains for this use. More recently,Berhens (1999) also employed bubbles for noise suppression.However, our application, though similar in some respects,had significant differences.
Clark had proposed a curtain designed not for high reflec-tion but for refraction of the acoustic wave. Clark’s inventionintended the acoustic wave to travel through the curtain, andmodify its propagation path by the consequent refraction. Inour approach (Lee et al., 2003), with the insights developedfrom laboratory work, the curtain would deflect substantiallyall the incoming acoustic wave, presenting a barrier of veryhigh reflectivity, ideally as high as 0.9.
Domenico proposed interfaces of very high reflectivity.However, his proposed device was much smaller than ours(and Clark’s), with the intended deployment local to thesource. The Fresnel zone of the upgoing source wave near thesource is much smaller than that of an upcoming wave fromdeeper horizons like the water bottom and, hence, it was moreeasily deployed and had a significantly lower air requirementthan ours.
Berhens tailored bubble sizes to absorb the acoustic wave.This is a tricky process, which works in certain specializedapplications where the noise is sufficiently narrow band toallow the tuning of bubble sizes to noise frequencies of inter-est. However, this approach is difficult to extend to all appli-cations discussed below.
What resulted from this work, however, is not a singleapplication but an entire range of applications in the sup-pression of marine noises. Moving to the highly reflectiveconcept made it possible to consider several areas of imple-mentation that benefit our industry.
Overview of applications. In this section, we will brieflyreview several possible applications. The following section willdiscuss the multiple suppression application in more detail.
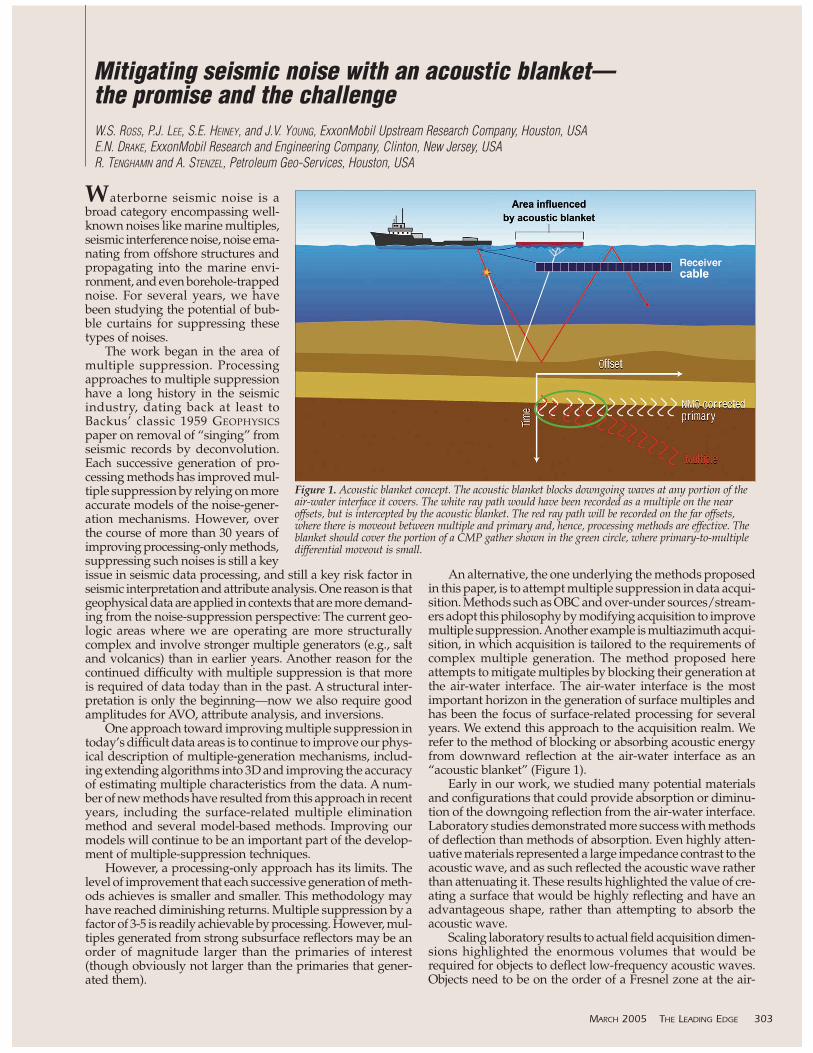
Multiple suppression. In this application, a bubble curtainis deployed at the air-water interface in such a way as todeflect upcoming primary signal. The bubbles are emitted froma plane behind the seismic vessel (or source vessel in OBCacquisition). Figure 2 shows two concepts for the shape of thebubble curtain in that plane. The first (Figure 2a) is an inverted“V,” sometimes referred to as a “wedge baffle.” Being a highlyreflective surface, the lower edge of the V deflects the multi-ple off to the side in the crossline direction, away from thestreamers (or bottom cables in OBC acquisition). The secondconcept (Figure 2b) is a surface of heights arranged in a pseudo-random pattern. This pattern, based on the concept of “prim-
itive roots” in number theory (Schroeder, 1995), is optimallydesigned to minimize the backscattered energy (downgoingmultiple) after reflection.
The bubble curtain created at the above-described planeremains in the water for some time after it is emitted. Thislatency in rising out of the water allows the curtain to take ona three-dimensional shape by extension in the inline direction(Figure 2c). The length of time the curtain remains in the wateris, hence, a critical parameter in determining the size of thebubble curtain object as a multiple deflector. We discuss bub-ble-curtain latency and research into methods of controllingit in detail below.
Mitigating noise emanating from construction and facilities. Theidea of protecting structures from waterborne noise by bub-
304 THE LEADING EDGE MARCH 2005
Figure 2. Two concepts for the shape of the bubble curtain in the vertical plane behind the vessel. (a) inverted V; (b) a surface of heights arranged in apseudorandom pattern; (c) extension of the curtain in the inline direction resulting from the latency of bubbles rising slowly out of the water.
Figure 3. (a) Concept of tube-wave suppression via bubble curtains, and(b) tube-wave signal level as a function of air volume flow rate.
ble curtains is not new. La Prairie patented the idea in 1955 asa means of protecting a dam from the damaging effects ofexplosions across a forebay, and saving the cost of drainingthe forebay. This idea has been implemented recently at theHong Kong airport where a pile driver was surrounded by abubble curtain to protect the nearby shoreline. Another cur-rent application is the ringing of piles with “bubble trees” atthe San Francisco-Oakland Bay Bridge extension.
Potential applications are numerous in the petroleumindustry. When noise from machinery on platforms, or fromtankers, needs to be mitigated, solutions can be expensive (e.g.,building permanent concrete berms or even changing thelocation of the noise-creating structure). Bubble curtains afforda relatively inexpensive solution and one that is portable inprinciple. Furthermore, offshore structures often have suffi-cient power and/or compressor capacity to easily accommo-date the operation of bubble curtains.
Tube-wave suppression. Tube waves are an important noisein VSPs. In particular, for land VSPs, ground roll reaching thehead of the well converts very effectively into tube waves andreverberates up and down the well. Over the years, severaldevices have achieved partial success in mitigating thesenoises.
A small amount of air injected in the top of the wellachieves very high tube-wave suppression. One recent patent(Naville et al.) proposes creating mini-explosions in the wellto supply such air. However, a small amount of compressedair directly injected in the top 50-100 m of the well may achievea similar effect. By using this method, we have observed sup-pression ratios of a factor of six. Figure 3 shows the conceptand a plot of tube-wave amplitude as a function of air vol-ume flow.
Seismic interference. There are several types of noise labeled
seismic interference; some are amenable to a bubble curtainsolution and others are not. What is commonly known as seis-mic interference noise occurs when two nearby vessels areshooting seismic data at the same time. If they do not agreeto time share (which is very expensive), acoustic energy fromshots emitted by one vessel can be recorded on the streamers(or bottom cables) of the other. This is very difficult to blockbecause the noise source is moving in an unpredictable rela-tionship to the recording array. It could be easier to avoidrecording this noise if each shooting vessel could deploy a bub-ble curtain to block emanations from its own source. However,even in such a case, the receiving array of the other vessel maybe in an unpredictable position and therefore the direction toblock emanations would still be unknown.
The kind of interference noise that is most amenable to abubble curtain solution occurs when the noise source is sta-tionary or quasi-stationary—i.e., platforms or other facilitiesin the neighborhood of the seismic survey, noise created byvessels participating in the survey, or noise created by local-izable marine life (e.g., shrimp). In one case we are aware of,noise created by the engines of a cable-laying vessel could eas-ily be observed on the bottom cables of the active part of anOBC survey. Such noises are very noticeable on horizontal bot-tom phones. Because the cable-laying vessel is moving veryslowly, the noise it creates could be blocked by a small bub-ble curtain deployed over the side of the vessel. This wouldbe similar to the “masker” configuration used by the U.S.Navy to avoid detectable noises emanating from machineryaboard its vessels.
Multiple suppression. The acoustic blanket concept, for mul-tiple suppression, is to create a highly reflective surface thatwill deflect an upcoming seismic wave before it reflects directly
MARCH 2005 THE LEADING EDGE 305
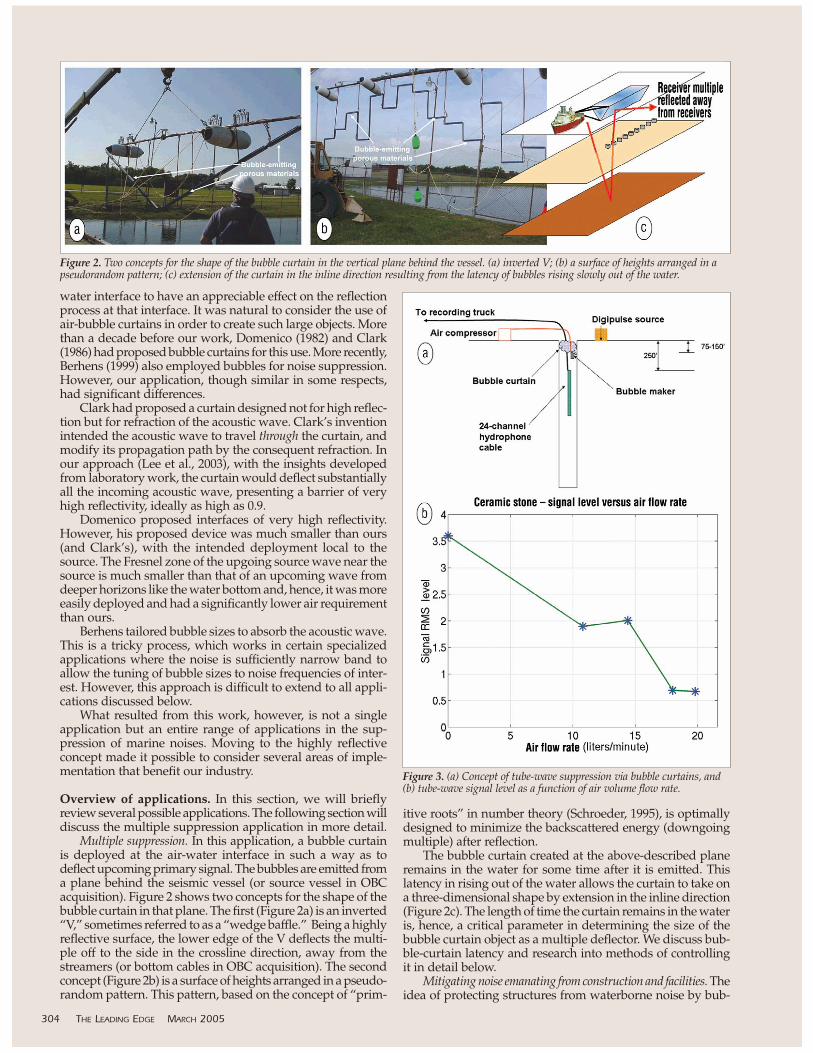
Figure 4. Snapshots of the wavefield as it propagates upward towards the air-water interface and interacts with the blanket.
downward from the air-water interface. The shapes shown inFigure 2 are only two of a large class of such po-tential shapes. The primary characteristic of this class of shapesis that advantageous phase delays are introduced into the seis-mic wave that minimize downward reflection.
Whichever shape is chosen, one can obtain the far-fieldresponse of the array by computing its discrete Fourier trans-
form, and one can model the exact response of the array byacoustic simulation or other wave-equation modeling meth-ods. Figure 4 shows snapshots from an acoustic simulation ofthe interaction of an upcoming wave with the V-shapedacoustic blanket. The blanket clearly puts a hole in the seis-mic wavefield, and redirects the highest concentration ofenergy at an angle to the vertical. The amplitude of the wave-field in the central portion has been reduced to 16-41% of itsoriginal value by the blanket.
Small-scale field tests. Small-scale field tests of the acousticblanket concept were conducted at ExxonMobil’s seismic testfacility in Friendswood, Texas, U.S. in 2000. The Friends-wood seismic pond is a 60 � 60 m body of fresh water witha maximum depth of 7 m. Both the V-shaped and primitiveroots phase gratings were tested, although only the former ispresented here. A miniaturized marine experiment was sim-ulated by towing the bubble-making shapes, the source, anda four-channel hydrophone array along a single line with anelectric winch. The seismic source was a 15 in3 water gun thatgenerated frequencies from 200 to 5000 Hz (filters applied inprocessing cut the upper end to 1100 Hz). The dimensions ofthe blankets were 8-12 m in the crossline direction and 2-4 mvertically. The blankets consisted of ceramic bubble-makingstones affixed to a metal frame. Seismic data were collectedand processed with this configuration, and multiple sup-pression measured by comparing the strength of the multi-ples with and without the blanket.
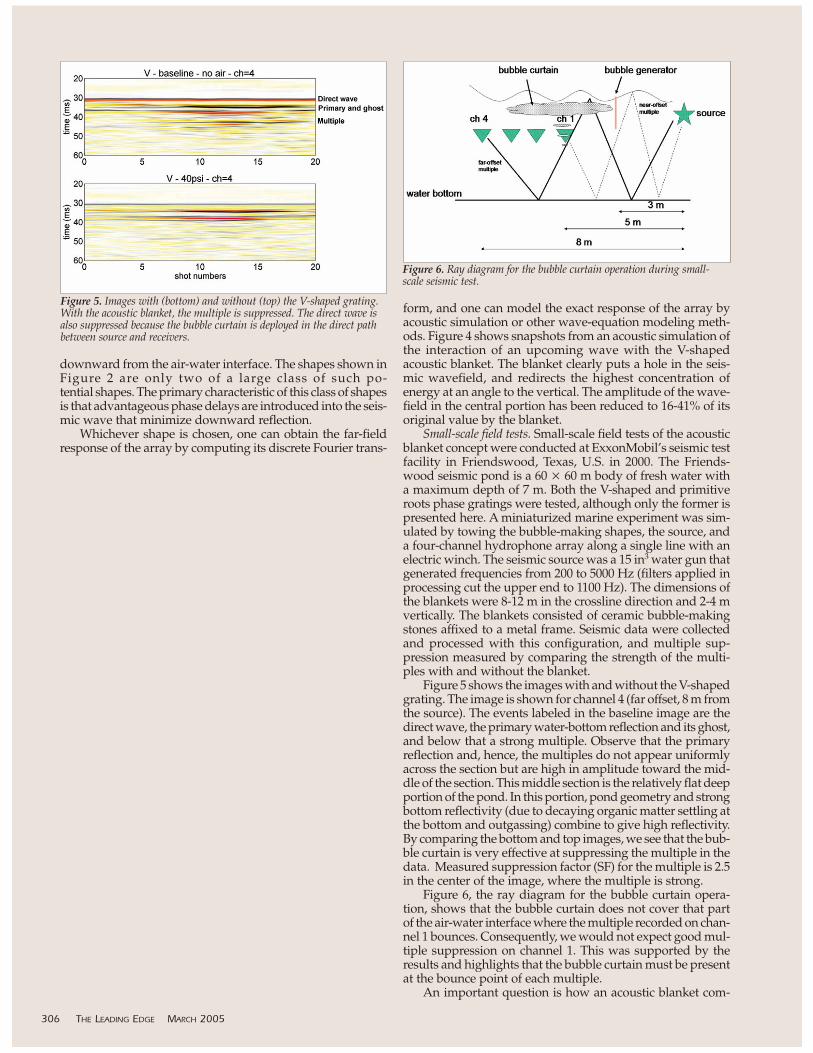
Figure 5 shows the images with and without the V-shapedgrating. The image is shown for channel 4 (far offset, 8 m fromthe source). The events labeled in the baseline image are thedirect wave, the primary water-bottom reflection and its ghost,and below that a strong multiple. Observe that the primaryreflection and, hence, the multiples do not appear uniformlyacross the section but are high in amplitude toward the mid-dle of the section. This middle section is the relatively flat deepportion of the pond. In this portion, pond geometry and strongbottom reflectivity (due to decaying organic matter settling atthe bottom and outgassing) combine to give high reflectivity.By comparing the bottom and top images, we see that the bub-ble curtain is very effective at suppressing the multiple in thedata. Measured suppression factor (SF) for the multiple is 2.5in the center of the image, where the multiple is strong.
Figure 6, the ray diagram for the bubble curtain opera-tion, shows that the bubble curtain does not cover that partof the air-water interface where the multiple recorded on chan-nel 1 bounces. Consequently, we would not expect good mul-tiple suppression on channel 1. This was supported by theresults and highlights that the bubble curtain must be presentat the bounce point of each multiple.
An important question is how an acoustic blanket com-
306 THE LEADING EDGE MARCH 2005
Figure 5. Images with (bottom) and without (top) the V-shaped grating.With the acoustic blanket, the multiple is suppressed. The direct wave isalso suppressed because the bubble curtain is deployed in the direct pathbetween source and receivers.
Figure 6. Ray diagram for the bubble curtain operation during small-scale seismic test.
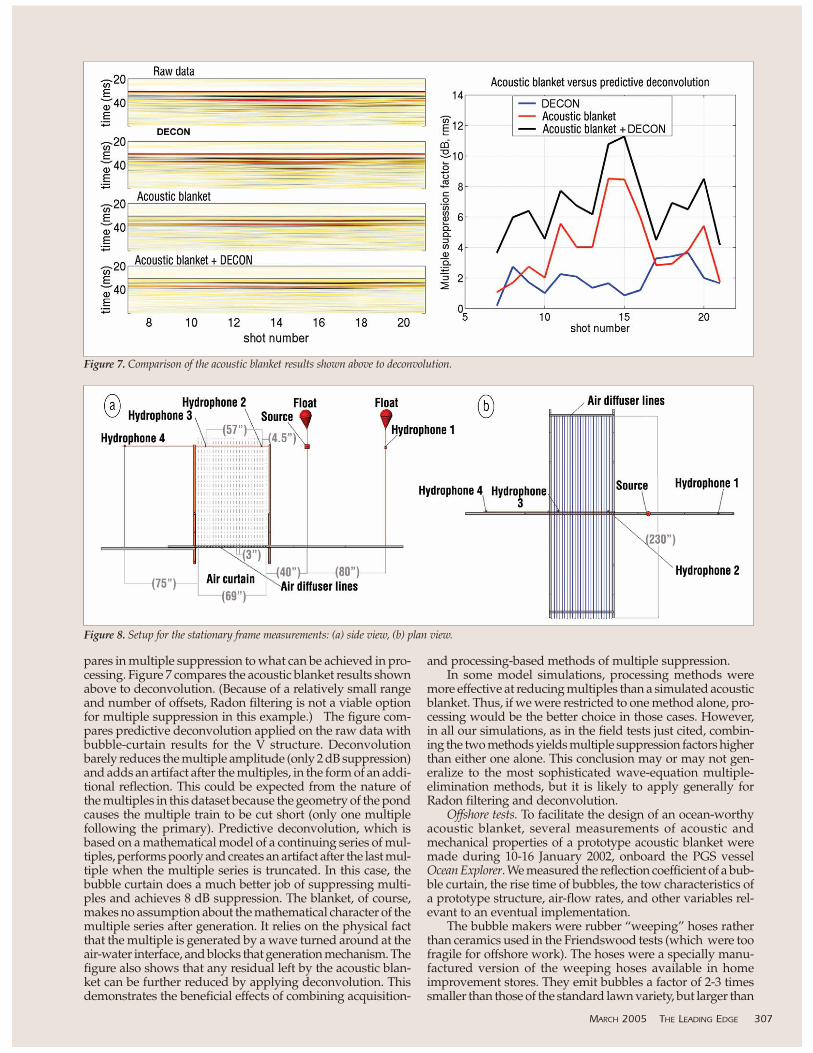
pares in multiple suppression to what can be achieved in pro-cessing. Figure 7 compares the acoustic blanket results shownabove to deconvolution. (Because of a relatively small rangeand number of offsets, Radon filtering is not a viable optionfor multiple suppression in this example.) The figure com-pares predictive deconvolution applied on the raw data withbubble-curtain results for the V structure. Deconvolutionbarely reduces the multiple amplitude (only 2 dB suppression)and adds an artifact after the multiples, in the form of an addi-tional reflection. This could be expected from the nature ofthe multiples in this dataset because the geometry of the pondcauses the multiple train to be cut short (only one multiplefollowing the primary). Predictive deconvolution, which isbased on a mathematical model of a continuing series of mul-tiples, performs poorly and creates an artifact after the last mul-tiple when the multiple series is truncated. In this case, thebubble curtain does a much better job of suppressing multi-ples and achieves 8 dB suppression. The blanket, of course,makes no assumption about the mathematical character of themultiple series after generation. It relies on the physical factthat the multiple is generated by a wave turned around at theair-water interface, and blocks that generation mechanism. Thefigure also shows that any residual left by the acoustic blan-ket can be further reduced by applying deconvolution. Thisdemonstrates the beneficial effects of combining acquisition-
and processing-based methods of multiple suppression.In some model simulations, processing methods were
more effective at reducing multiples than a simulated acousticblanket. Thus, if we were restricted to one method alone, pro-cessing would be the better choice in those cases. However,in all our simulations, as in the field tests just cited, combin-ing the two methods yields multiple suppression factors higherthan either one alone. This conclusion may or may not gen-eralize to the most sophisticated wave-equation multiple-elimination methods, but it is likely to apply generally forRadon filtering and deconvolution.
Offshore tests. To facilitate the design of an ocean-worthyacoustic blanket, several measurements of acoustic andmechanical properties of a prototype acoustic blanket weremade during 10-16 January 2002, onboard the PGS vesselOcean Explorer. We measured the reflection coefficient of a bub-ble curtain, the rise time of bubbles, the tow characteristics ofa prototype structure, air-flow rates, and other variables rel-evant to an eventual implementation.
The bubble makers were rubber “weeping” hoses ratherthan ceramics used in the Friendswood tests (which were toofragile for offshore work). The hoses were a specially manu-factured version of the weeping hoses available in homeimprovement stores. They emit bubbles a factor of 2-3 timessmaller than those of the standard lawn variety, but larger than
MARCH 2005 THE LEADING EDGE 307
Figure 7. Comparison of the acoustic blanket results shown above to deconvolution.
Figure 8. Setup for the stationary frame measurements: (a) side view, (b) plan view.
the bubbles produced by the ceramic stones.The test was conducted offshore Gulf of Mexico in a water
depth of 100 m. The test goals were divided into two parts—those that must be performed under tow and those requiringa stationary condition. All acoustic measurements were madeusing a stationary frame lowered to 25 m. As described below,bubble hoses were attached to an aluminum frame andacoustic measurements of both bubble rise time and bubble-curtain reflectivity were made approximately 3 m above thebubble-hose bed. In addition to the stationary test, a 10-m pro-totype of an acoustic blanket was towed at speeds up to 4.5knots. Drag and stability characteristics of this prototype wereobserved, using pressure measurements and in-water video.Only the acoustic tests are presented here.
• Experimental setup. Figure 8 shows the setup for the sta-tionary frame measurements. An aluminum frame, about 2 � 6 m, was threaded with 24 bubble hoses. The framehad vertical members 3 m above the hoses that support acrossbar from which hydrophones are deployed. The framealso had outrigger extensions that allow a source andother hydrophones to be deployed outside the bubble cur-tain. Four hydrophones were used, one 2 m behind thesource, two inside the curtain, and one on the outside ofthe curtain attached to a far-side outrigger beam. Thehydrophones were numbered 1-4 starting with thehydrophone behind the source.
Two sources were used for the experiment. A high-fre-quency piezoelectric crystal, driven at 10 kHz, was usedfor the rise-time measurements, where precision pin-
308 THE LEADING EDGE MARCH 2005
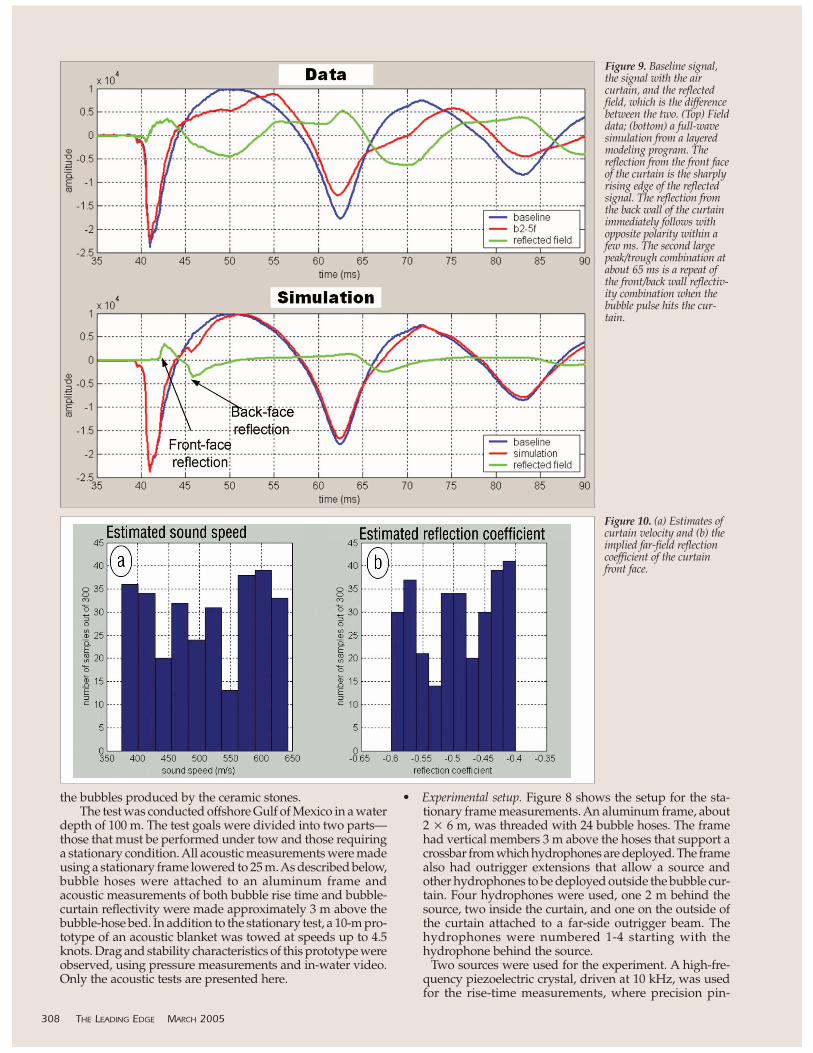
Figure 10. (a) Estimates ofcurtain velocity and (b) theimplied far-field reflectioncoefficient of the curtainfront face.
Figure 9. Baseline signal,the signal with the aircurtain, and the reflectedfield, which is the differencebetween the two. (Top) Fielddata; (bottom) a full-wavesimulation from a layeredmodeling program. Thereflection from the front faceof the curtain is the sharplyrising edge of the reflectedsignal. The reflection fromthe back wall of the curtainimmediately follows withopposite polarity within afew ms. The second largepeak/trough combination atabout 65 ms is a repeat ofthe front/back wall reflectiv-ity combination when thebubble pulse hits the cur-tain.
pointing of the curtain is necessary. An air gun with a 40in3 chamber, pressured at 800 psi, was used for reflectiv-ity measurements. Each source was placed at the locationmarked “source” in Figure 8, during the experiment.
The key instrumentation on the frame was a set of pres-sure transducers—several for the hoses, and two mea-suring the ambient pressure on each end of the stationaryframe. The hose measurements allowed us to pressure thebubble hoses to the right level to obtain the needed flowrate. The ambient pressure measurements were usedtogether as a level to confirm that the ends of the framewere close to the same depth in the water (within 2 ft) dur-ing the measurements. All pressure measurements wererecorded continuously during data acquisition, as were theflow meter and acoustic data.
The frame was deployed over the side of the OceanExplorer using two cranes to curtail rotation. Bubble cur-tain stationarity was critical in making the acoustic mea-surements successfully. Ship thrusters were used to obtainzero relative speed between the frame and ocean currents.
• Bubble-curtain reflectivity.An air gun was the source. Seismicdata were collected at all hydrophones but data from the“back” hydrophone (1) is discussed here. Baseline mea-surements were made with no air-bubble curtain. Then,with air curtains of varying thickness, data were collectedand compared with baseline measurements to determinereflectivity.
The dominant wavelength in the air-gun signature is 30m. To minimize the diffraction around the air curtain, thesource and hydrophones were placed very close to the cur-tain, approximately 1 and 3 m away, respectively, for thesource and back hydrophone. This reduced diffractionsignificantly. However, it was still necessary to computeand compensate for the frequency-dependent diffractionaround the curtain. Full-wave modeling matched to thedata allowed estimation of the far-field acoustic reflectioncoefficient.
Figure 9 shows the baseline signal, thesignal with the air curtain, and thereflected field (the difference betweenthem). The top panel shows the fielddata and the bottom panel shows a full-wave simulation from a layered model-ing program. The first part of thereflected field, arriving within 2 ms ofthe peak input signal, is the reflectionfrom the front face of the curtain. Afterthat, the reflection from the back wall ofthe curtain is visible as an oppositepolarity peak. Observe that the modelsimulation shows this back wall reflec-tion to be a sharp, well-defined peak,whereas in the measured data it isbroader and less well defined. We alsonoted that this back-wall part of the sig-nal is more variable from shot-to-shotthan the first peak energy. This can beattributed to the fact that the signal isinteracting with the interior of the bub-ble curtain, which is a fluctuating, inho-mogeneous medium. Despite thesedifferences between model and mea-sured results, the general character issimilar, and in particular the reflectionamplitude of the first peak matches well.We confirmed with modeling that theamplitude of this first peak is unaffected
by the presence of the back wall of the curtain.Figure 10 shows the estimates of curtain velocity and the
implied far-field reflection coefficient of the curtain frontface, based on comparing the amplitude of recorded datato a library of modeled responses with varying reflectioncoefficients. Three sets of measurements were used forthese analyses—corresponding to curtain thicknesses of.84, 1.14, and 1.45 m. Taking all combinations of 10 base-line measurements with 30 reflected field measurementsyields 300 independent estimates of the curtain velocity.The estimates range from 350 m/s to 640 m/s, and yieldfar-field reflection coefficients between -0.4 and -0.6.Velocity inside the curtain is estimated to be 512 ± 82 m/s.Curtain reflectivity is -0.49 ± 0.06. Data transmitted throughthe bubble curtain to the far hydrophone (4, data notshown) confirm the curtain velocities estimated from thereflected data.
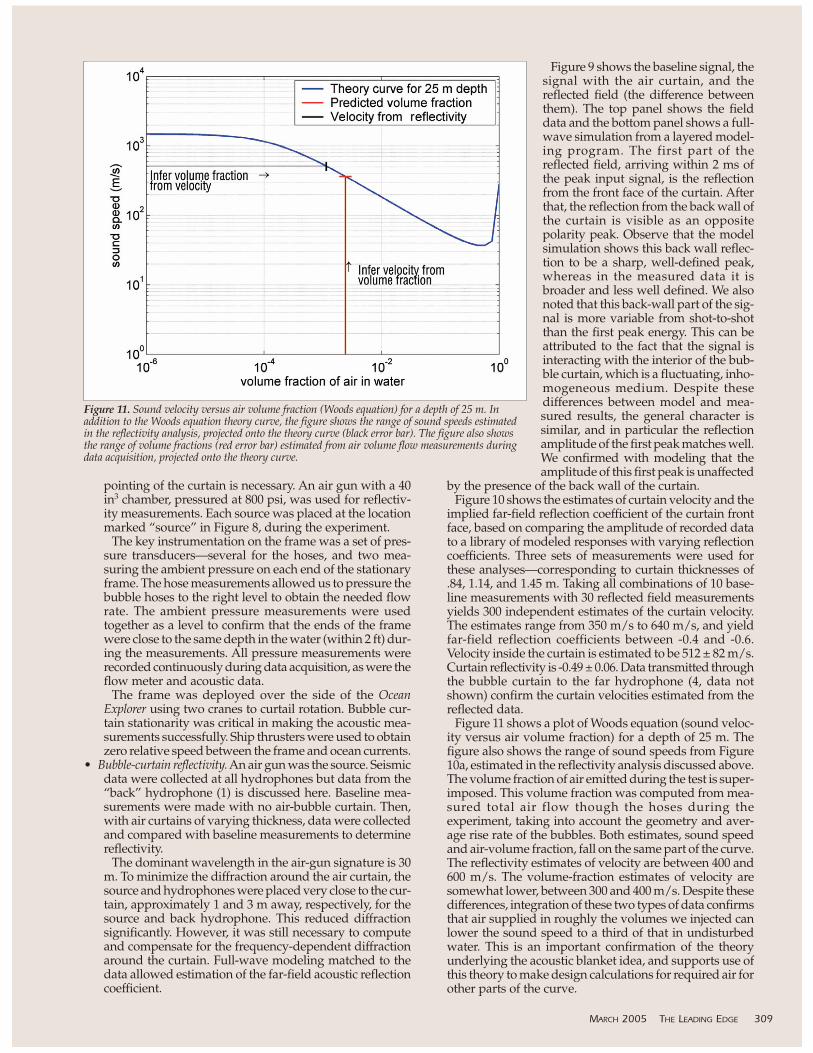
Figure 11 shows a plot of Woods equation (sound veloc-ity versus air volume fraction) for a depth of 25 m. Thefigure also shows the range of sound speeds from Figure10a, estimated in the reflectivity analysis discussed above.The volume fraction of air emitted during the test is super-imposed. This volume fraction was computed from mea-sured total air flow though the hoses during theexperiment, taking into account the geometry and aver-age rise rate of the bubbles. Both estimates, sound speedand air-volume fraction, fall on the same part of the curve.The reflectivity estimates of velocity are between 400 and600 m/s. The volume-fraction estimates of velocity aresomewhat lower, between 300 and 400 m/s. Despite thesedifferences, integration of these two types of data confirmsthat air supplied in roughly the volumes we injected canlower the sound speed to a third of that in undisturbedwater. This is an important confirmation of the theoryunderlying the acoustic blanket idea, and supports use ofthis theory to make design calculations for required air forother parts of the curve.
MARCH 2005 THE LEADING EDGE 309
Figure 11. Sound velocity versus air volume fraction (Woods equation) for a depth of 25 m. Inaddition to the Woods equation theory curve, the figure shows the range of sound speeds estimatedin the reflectivity analysis, projected onto the theory curve (black error bar). The figure also showsthe range of volume fractions (red error bar) estimated from air volume flow measurements duringdata acquisition, projected onto the theory curve.
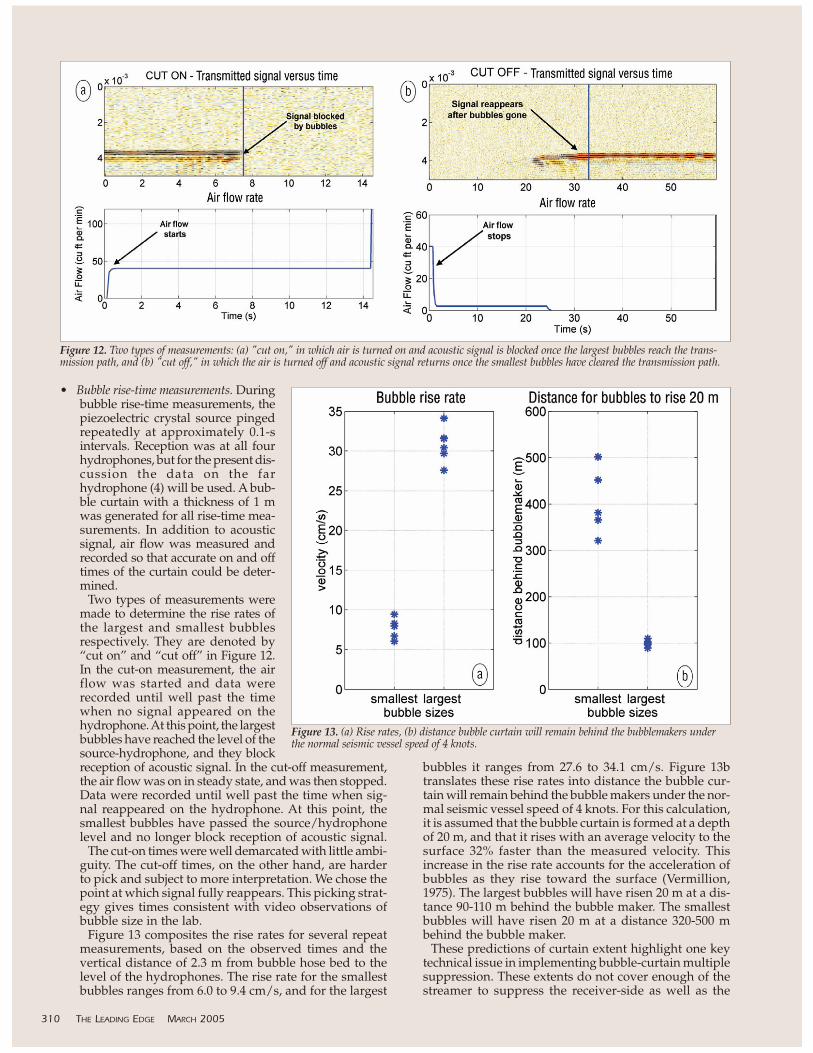
• Bubble rise-time measurements. Duringbubble rise-time measurements, thepiezoelectric crystal source pingedrepeatedly at approximately 0.1-sintervals. Reception was at all fourhydrophones, but for the present dis-cussion the data on the farhydrophone (4) will be used. A bub-ble curtain with a thickness of 1 mwas generated for all rise-time mea-surements. In addition to acousticsignal, air flow was measured andrecorded so that accurate on and offtimes of the curtain could be deter-mined.
Two types of measurements weremade to determine the rise rates ofthe largest and smallest bubblesrespectively. They are denoted by“cut on” and “cut off” in Figure 12.In the cut-on measurement, the airflow was started and data wererecorded until well past the timewhen no signal appeared on thehydrophone. At this point, the largestbubbles have reached the level of thesource-hydrophone, and they blockreception of acoustic signal. In the cut-off measurement,the air flow was on in steady state, and was then stopped.Data were recorded until well past the time when sig-nal reappeared on the hydrophone. At this point, thesmallest bubbles have passed the source/hydrophonelevel and no longer block reception of acoustic signal.
The cut-on times were well demarcated with little ambi-guity. The cut-off times, on the other hand, are harderto pick and subject to more interpretation. We chose thepoint at which signal fully reappears. This picking strat-egy gives times consistent with video observations ofbubble size in the lab.
Figure 13 composites the rise rates for several repeatmeasurements, based on the observed times and thevertical distance of 2.3 m from bubble hose bed to thelevel of the hydrophones. The rise rate for the smallestbubbles ranges from 6.0 to 9.4 cm/s, and for the largest
bubbles it ranges from 27.6 to 34.1 cm/s. Figure 13btranslates these rise rates into distance the bubble cur-tain will remain behind the bubble makers under the nor-mal seismic vessel speed of 4 knots. For this calculation,it is assumed that the bubble curtain is formed at a depthof 20 m, and that it rises with an average velocity to thesurface 32% faster than the measured velocity. Thisincrease in the rise rate accounts for the acceleration ofbubbles as they rise toward the surface (Vermillion,1975). The largest bubbles will have risen 20 m at a dis-tance 90-110 m behind the bubble maker. The smallestbubbles will have risen 20 m at a distance 320-500 mbehind the bubble maker.
These predictions of curtain extent highlight one keytechnical issue in implementing bubble-curtain multiplesuppression. These extents do not cover enough of thestreamer to suppress the receiver-side as well as the
310 THE LEADING EDGE MARCH 2005
Figure 12. Two types of measurements: (a) "cut on," in which air is turned on and acoustic signal is blocked once the largest bubbles reach the trans-mission path, and (b) "cut off," in which the air is turned off and acoustic signal returns once the smallest bubbles have cleared the transmission path.
Figure 13. (a) Rise rates, (b) distance bubble curtain will remain behind the bubblemakers underthe normal seismic vessel speed of 4 knots.
source-side multiples. To fully reach their potential, bub-ble curtains must cover 3000-5000 m of the streamer.
Practical implementation issues. Extending the length of thecurtain is discussed in detail in the next section. Several otherimplementation issues not addressed in this paper must alsobe considered in order to make the acoustic blanket practical.Among them are the effect of ocean currents, integration of abubble curtain into streamer operations, required air volume,and cost. Ocean currents move the bubble curtain, since bub-bles move when the water moves. This is a major problemwhen the bubble curtain remains a long time in the waterbecause currents can move the curtain a long way. As anexample, a 1 knot current will move a bubble stream 60 m intwo minutes. Bubble curtain size and deployment must takesuch movement into account. High currents, and especiallycrosscurrents that vary with depth, might deteriorate the effec-tiveness of a bubble curtain to the point that it would be unus-able.
To block the downward reflection from the air-water inter-face without interfering with the primary reflection, the bub-ble curtain must be deployed above the seismic streamer. Thus,the streamer must be lowered to more than 30 m. The bubblecurtain must be deployed near the source, close enough thatthe bubble curtain sufficiently surrounds the bounce point ofthe near-offset multiples. Otherwise, it will not suppress themeffectively. The towing and careful positioning of a frame thatrequires large air volumes and hoses, supplied from onboardcompressors or additional air-supply vessels outboard of theseismic spread, add complexity and safety issues to the imple-mentation.
Note that a 30-m streamer depth does not imply a low-frequency first ghost notch, as might first be assumed, becausethe curtain reflecting interface is only a few meters above towdepth. There may be receiver ghost issues, however, as thecurtain changes its depth with distance along the streamer,ultimately disappearing from the water. Processing solutions
(such as dip filtering or ghost deconvolu-tion) must be developed or tailored to han-dle an offset-dependent ghost variation.
Required air volume flow rate is a func-tion of the blanket dimensions, volume frac-tion of air in water, vessel speed andpercentage of “useful” bubbles (bubbles thatdo not rise out of the system too quickly). A350-m blanket injecting a 2-m thick curtainwith a volume fraction of 0.002 into seawa-ter, towed at a speed of 2 m/s (4 knots),requires 18 000 standard ft3 per minute (scfm)if all the bubbles are useful (a perfectly effi-cient system). If only 25% of the bubbles meetthat standard, 72 000 scfm are required. Theseair volumes are very high by seismic stan-dards: Aseismic vessel might have two 1500scfm compressors onboard. However, itshould be noted that the air pressuresrequired for an acoustic blanket are onlyincrementally above ambient pressure atdepth (enough to pressure bubble makersabove head pressure). For a given air-han-dling capacity, cost and complexity of low-pressure compressors are significantly lowerthan for the high-pressure compressors usedwith air-gun arrays.
Nonetheless, air compressors and the fuelto run them dominate the cost of an acousticblanket system, and system efficiency is a
critical cost determinant. Cost of a system that would cover amultistreamer 3D survey represents a 37% premium overdaily 3D survey costs. Of this, 80% is attributable to com-pressors. To be sure, these are research costs and would besubject to lowering with economies of scale and improve-ments in the technology. Furthermore, multiples are so severea problem in some areas that significant acquisition cost incre-ments have been incurred to address them.
Preliminary bubble-size reduction experiments. As is clearfrom the above predictions of curtain length, longevity ofbubbles in the water is an important unsolved challenge. Inthe offshore test, rise rates for the smallest bubbles were mea-sured to be about 6.0-9.4 cm/s, which yields a bubble curtainthat covers approximately the first 400 m of the streamer.Modeling shows that the bubble curtain must have an extentin the inline direction of at least a kilometer to meet minimalmultiple-suppression requirements, even for the source-sidemultiples. Preferably, the bubble curtain would extend overa substantial portion of a seismic streamer, in order to sup-press receiver-side multiples as well.
Meeting this technology hurdle requires the improvementof bubble-making hoses to emit bubbles with mean radii of50-75 microns, a factor 2-3 smaller than currently available. Inaddition to extending the coverage of the bubble curtain, thisreduction of the bubble size has important efficiency impli-cations: One bubble with a radius of 150 microns contains ninetimes the air volume of a bubble with a radius of 50 microns.This air volume is wasted, as large bubbles rise out of the watertoo rapidly to be of practical use.
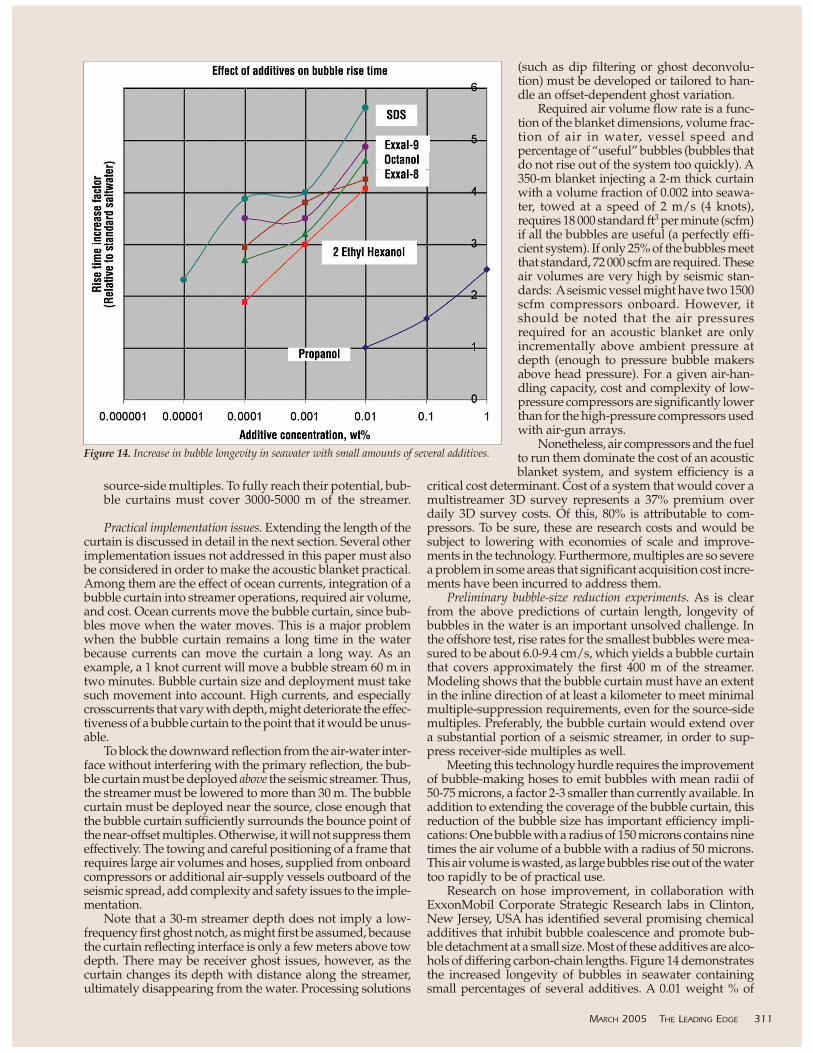
Research on hose improvement, in collaboration withExxonMobil Corporate Strategic Research labs in Clinton,New Jersey, USA has identified several promising chemicaladditives that inhibit bubble coalescence and promote bub-ble detachment at a small size. Most of these additives are alco-hols of differing carbon-chain lengths. Figure 14 demonstratesthe increased longevity of bubbles in seawater containingsmall percentages of several additives. A 0.01 weight % of
MARCH 2005 THE LEADING EDGE 311
Figure 14. Increase in bubble longevity in seawater with small amounts of several additives.
octanol, for example, increases the timerequired for bubbles to reach the surface bya factor of 4.5. Other alcohols of differentchain lengths are also effective, and effec-tiveness increases with chain length.Surfactants such as sodium dodecyl sulfate(SDS in Figure 14) are also very effective.The key to using these additives is deliv-ery. Several methods of application havebeen tested, including surface coating ofthe bubble-making hoses and suspensionof the additives in the air mixture, diffus-ing them with the air through the hosepores. Results of the coating method to dateonly show short-term improvement beforethe additives wear off or are dispersed. Thesuspension approach has also been inef-fective thus far, due to inability to supplylarge enough volumes of the additive with-out condensation and clogging. Methodsneed to be developed to more permanentlyaffix these additives to the hoses, incorpo-rate them in the hoses, or force themthrough the pores without condensation.
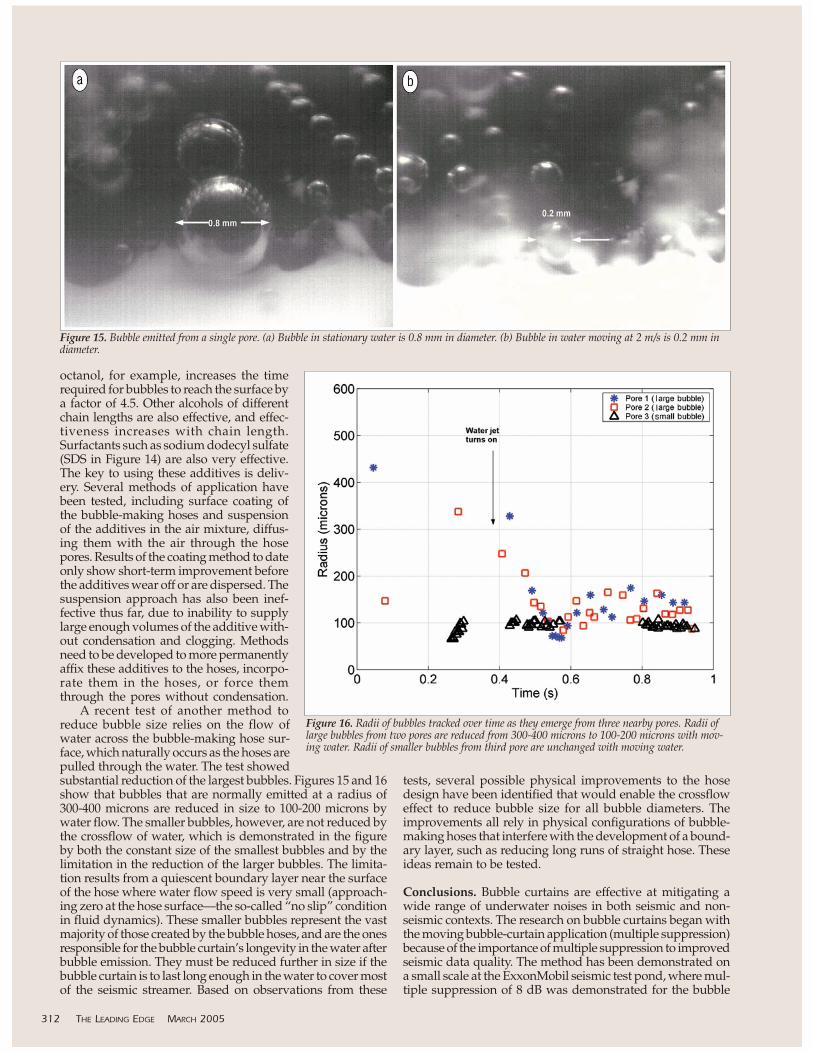
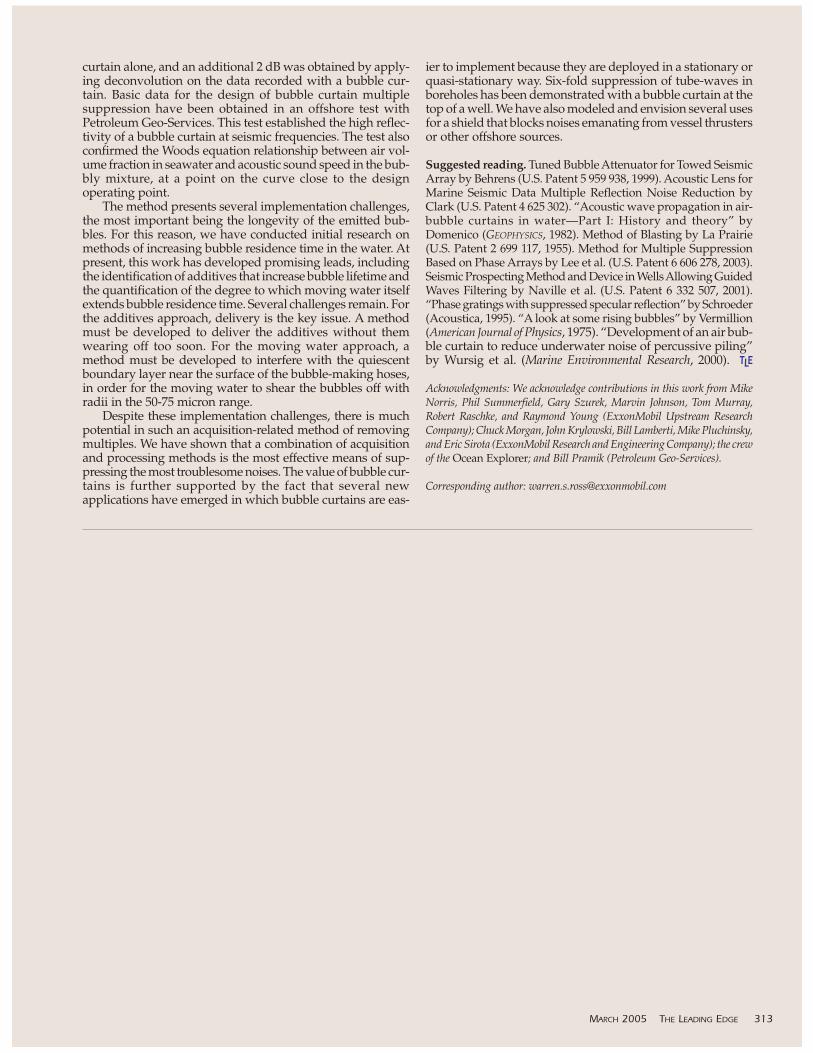
A recent test of another method toreduce bubble size relies on the flow ofwater across the bubble-making hose sur-face, which naturally occurs as the hoses arepulled through the water. The test showedsubstantial reduction of the largest bubbles. Figures 15 and 16show that bubbles that are normally emitted at a radius of300-400 microns are reduced in size to 100-200 microns bywater flow. The smaller bubbles, however, are not reduced bythe crossflow of water, which is demonstrated in the figureby both the constant size of the smallest bubbles and by thelimitation in the reduction of the larger bubbles. The limita-tion results from a quiescent boundary layer near the surfaceof the hose where water flow speed is very small (approach-ing zero at the hose surface—the so-called “no slip” conditionin fluid dynamics). These smaller bubbles represent the vastmajority of those created by the bubble hoses, and are the onesresponsible for the bubble curtain’s longevity in the water afterbubble emission. They must be reduced further in size if thebubble curtain is to last long enough in the water to cover mostof the seismic streamer. Based on observations from these
tests, several possible physical improvements to the hosedesign have been identified that would enable the crossfloweffect to reduce bubble size for all bubble diameters. Theimprovements all rely in physical configurations of bubble-making hoses that interfere with the development of a bound-ary layer, such as reducing long runs of straight hose. Theseideas remain to be tested.
Conclusions. Bubble curtains are effective at mitigating awide range of underwater noises in both seismic and non-seismic contexts. The research on bubble curtains began withthe moving bubble-curtain application (multiple suppression)because of the importance of multiple suppression to improvedseismic data quality. The method has been demonstrated ona small scale at the ExxonMobil seismic test pond, where mul-tiple suppression of 8 dB was demonstrated for the bubble
312 THE LEADING EDGE MARCH 2005
Figure 15. Bubble emitted from a single pore. (a) Bubble in stationary water is 0.8 mm in diameter. (b) Bubble in water moving at 2 m/s is 0.2 mm indiameter.
Figure 16. Radii of bubbles tracked over time as they emerge from three nearby pores. Radii oflarge bubbles from two pores are reduced from 300-400 microns to 100-200 microns with mov-ing water. Radii of smaller bubbles from third pore are unchanged with moving water.
curtain alone, and an additional 2 dB was obtained by apply-ing deconvolution on the data recorded with a bubble cur-tain. Basic data for the design of bubble curtain multiplesuppression have been obtained in an offshore test withPetroleum Geo-Services. This test established the high reflec-tivity of a bubble curtain at seismic frequencies. The test alsoconfirmed the Woods equation relationship between air vol-ume fraction in seawater and acoustic sound speed in the bub-bly mixture, at a point on the curve close to the designoperating point.
The method presents several implementation challenges,the most important being the longevity of the emitted bub-bles. For this reason, we have conducted initial research onmethods of increasing bubble residence time in the water. Atpresent, this work has developed promising leads, includingthe identification of additives that increase bubble lifetime andthe quantification of the degree to which moving water itselfextends bubble residence time. Several challenges remain. Forthe additives approach, delivery is the key issue. A methodmust be developed to deliver the additives without themwearing off too soon. For the moving water approach, amethod must be developed to interfere with the quiescentboundary layer near the surface of the bubble-making hoses,in order for the moving water to shear the bubbles off withradii in the 50-75 micron range.
Despite these implementation challenges, there is muchpotential in such an acquisition-related method of removingmultiples. We have shown that a combination of acquisitionand processing methods is the most effective means of sup-pressing the most troublesome noises. The value of bubble cur-tains is further supported by the fact that several newapplications have emerged in which bubble curtains are eas-
ier to implement because they are deployed in a stationary orquasi-stationary way. Six-fold suppression of tube-waves inboreholes has been demonstrated with a bubble curtain at thetop of a well. We have also modeled and envision several usesfor a shield that blocks noises emanating from vessel thrustersor other offshore sources.
Suggested reading. Tuned Bubble Attenuator for Towed SeismicArray by Behrens (U.S. Patent 5 959 938, 1999). Acoustic Lens forMarine Seismic Data Multiple Reflection Noise Reduction byClark (U.S. Patent 4 625 302). “Acoustic wave propagation in air-bubble curtains in water—Part I: History and theory” byDomenico (GEOPHYSICS, 1982). Method of Blasting by La Prairie(U.S. Patent 2 699 117, 1955). Method for Multiple SuppressionBased on Phase Arrays by Lee et al. (U.S. Patent 6 606 278, 2003).Seismic Prospecting Method and Device in Wells Allowing GuidedWaves Filtering by Naville et al. (U.S. Patent 6 332 507, 2001).“Phase gratings with suppressed specular reflection” by Schroeder(Acoustica, 1995). “A look at some rising bubbles” by Vermillion(American Journal of Physics, 1975). “Development of an air bub-ble curtain to reduce underwater noise of percussive piling”by Wursig et al. (Marine Environmental Research, 2000). TLE
Acknowledgments: We acknowledge contributions in this work from MikeNorris, Phil Summerfield, Gary Szurek, Marvin Johnson, Tom Murray,Robert Raschke, and Raymond Young (ExxonMobil Upstream ResearchCompany); Chuck Morgan, John Krylowski, Bill Lamberti, Mike Pluchinsky,and Eric Sirota (ExxonMobil Research and Engineering Company); the crewof the Ocean Explorer; and Bill Pramik (Petroleum Geo-Services).
Corresponding author: [email protected]
MARCH 2005 THE LEADING EDGE 313