Embed Size (px)
Citation preview
Acquisizioni in Europa Acquisizioni in Europa per un traguardo a 1.000 miliardiper un traguardo a 1.000 miliardi
Milano, 10 Maggio 2000Milano, 10 Maggio 2000
Acquisizioni in Europa per un traguardo a 1.000 miliardiAcquisizioni in Europa per un traguardo a 1.000 miliardi
Relatori:Relatori:• Giovanni RecordatiGiovanni Recordati Chairman and Chief Executive OfficerChairman and Chief Executive Officer
• Fritz SquindoFritz Squindo Chief Financial OfficerChief Financial Officer
• Walter BevilacquaWalter Bevilacqua Vice President and Director Corporate DevelopmentVice President and Director Corporate Development
11

Fritz SquindoFritz SquindoChief Financial OfficerChief Financial Officer
22
Where we come from: 1997-1999 HIGHLIGHTSWhere we come from: 1997-1999 HIGHLIGHTS
33
55
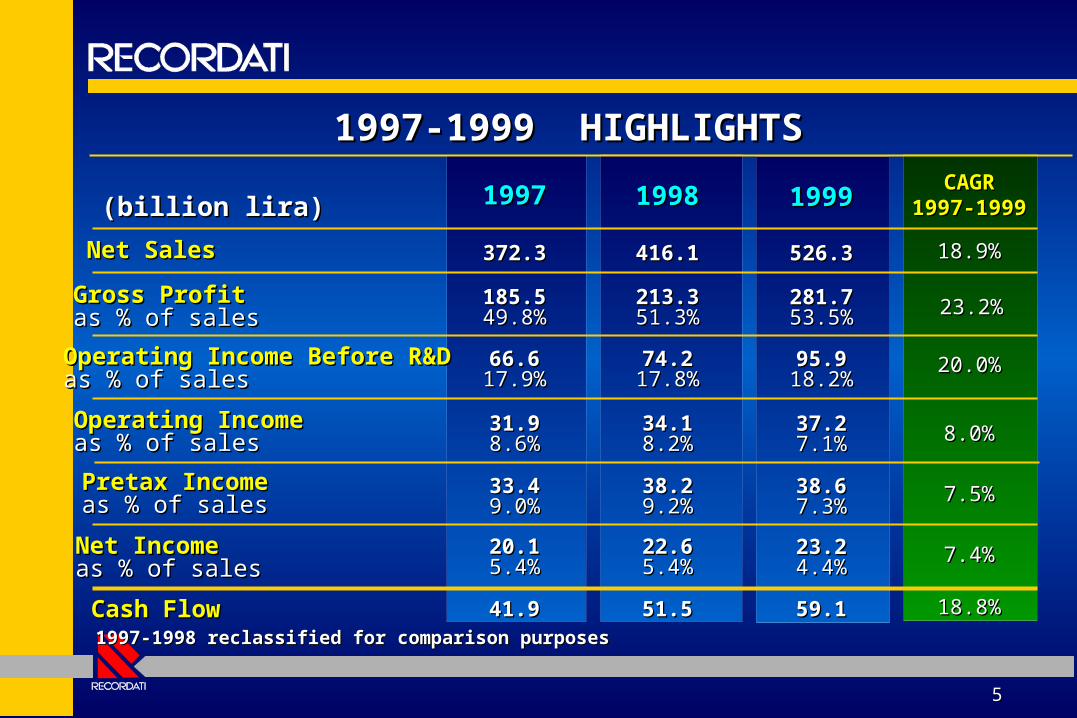
CAGRCAGR1997-19991997-1999
18.9%18.9%
23.2%23.2%
20.0%20.0%
8.0%8.0%
7.5%7.5%
7.4%7.4%
18.8%18.8%
19981998
416.1416.1
213.3213.351.3%51.3%
74.274.217.8%17.8%
34.134.18.2%8.2%
38.238.29.2%9.2%
22.622.65.4%5.4%
51.551.5
19971997
372.3372.3
185.5185.549.8%49.8%
66.666.617.9%17.9%
31.931.98.6%8.6%
33.433.49.0%9.0%
20.120.15.4%5.4%
41.941.9
19991999
526.3526.3
281.7281.753.5%53.5%
95.995.918.2%18.2%
37.237.27.1%7.1%
38.638.67.3%7.3%
23.223.24.4%4.4%
59.159.1
1997-1999 HIGHLIGHTS1997-1999 HIGHLIGHTS
Net SalesNet Sales
Gross ProfitGross Profitas % of salesas % of sales
1997-1998 reclassified for comparison purposes1997-1998 reclassified for comparison purposes
Operating Income Before R&DOperating Income Before R&Das % of salesas % of sales
Operating Income Operating Income as % of salesas % of sales
Pretax IncomePretax Incomeas % of salesas % of sales
Net IncomeNet Incomeas % of salesas % of sales
Cash FlowCash Flow
(billion lira)(billion lira)

Where we are:Where we are: RESULTS Q1 2000RESULTS Q1 2000P&L TRENDSP&L TRENDSSALES & MARGINS BY BUSINESS SALES & MARGINS BY BUSINESS
AREAAREACAPITAL EMPLOYEDCAPITAL EMPLOYED
66
77
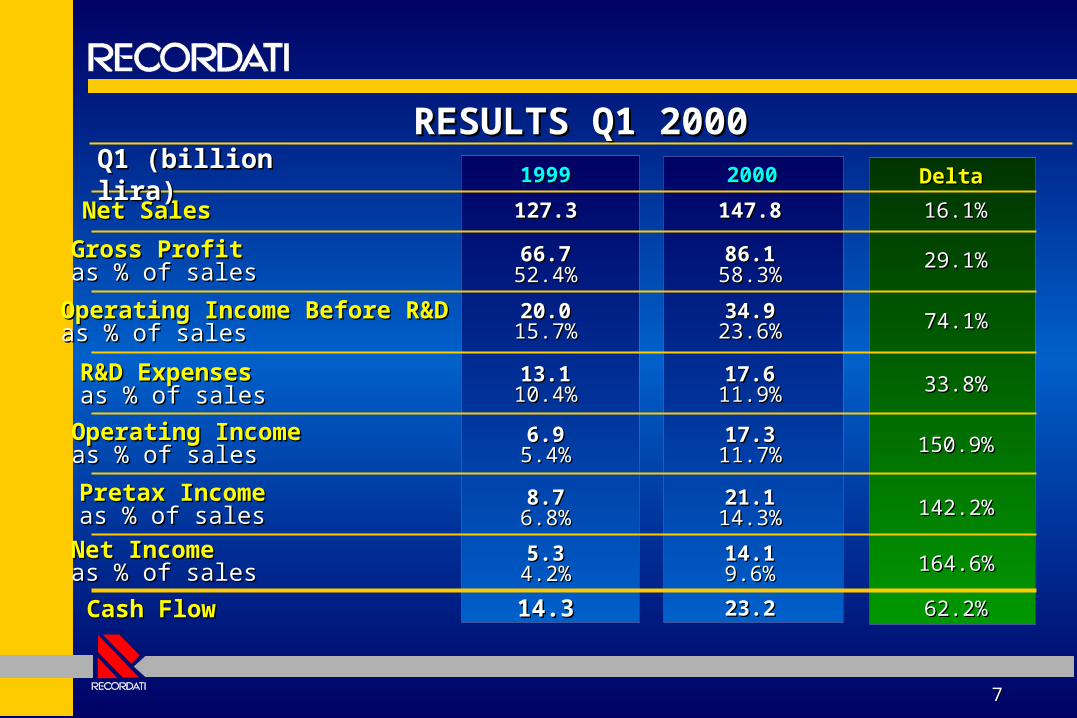
127.3127.3
66.766.752.4%52.4%
20.020.015.7%15.7%
6.96.95.4%5.4%
8.78.76.8%6.8%
5.35.34.2%4.2%
14.314.3
19991999
13.113.110.4%10.4%
147.8147.8
86.186.158.3%58.3%
34.934.923.6%23.6%
17.317.311.7%11.7%
21.121.114.3%14.3%
14.114.19.6%9.6%
23.223.2
20002000
17.617.611.9%11.9%
16.1%16.1%
29.1%29.1%
74.1%74.1%
150.9150.9%%
142.2%142.2%
164.6%164.6%
62.2%62.2%
DeltaDelta
33.8%33.8%
RESULTS Q1 2000RESULTS Q1 2000
Net SalesNet Sales
Gross ProfitGross Profitas % of salesas % of sales
Operating Income Before R&DOperating Income Before R&Das % of salesas % of sales
Operating Income Operating Income as % of salesas % of sales
Pretax IncomePretax Incomeas % of salesas % of sales
Net IncomeNet Incomeas % of salesas % of sales
Cash FlowCash Flow
Q1 (billion lira)Q1 (billion lira)
R&D ExpensesR&D Expensesas % of salesas % of sales
88
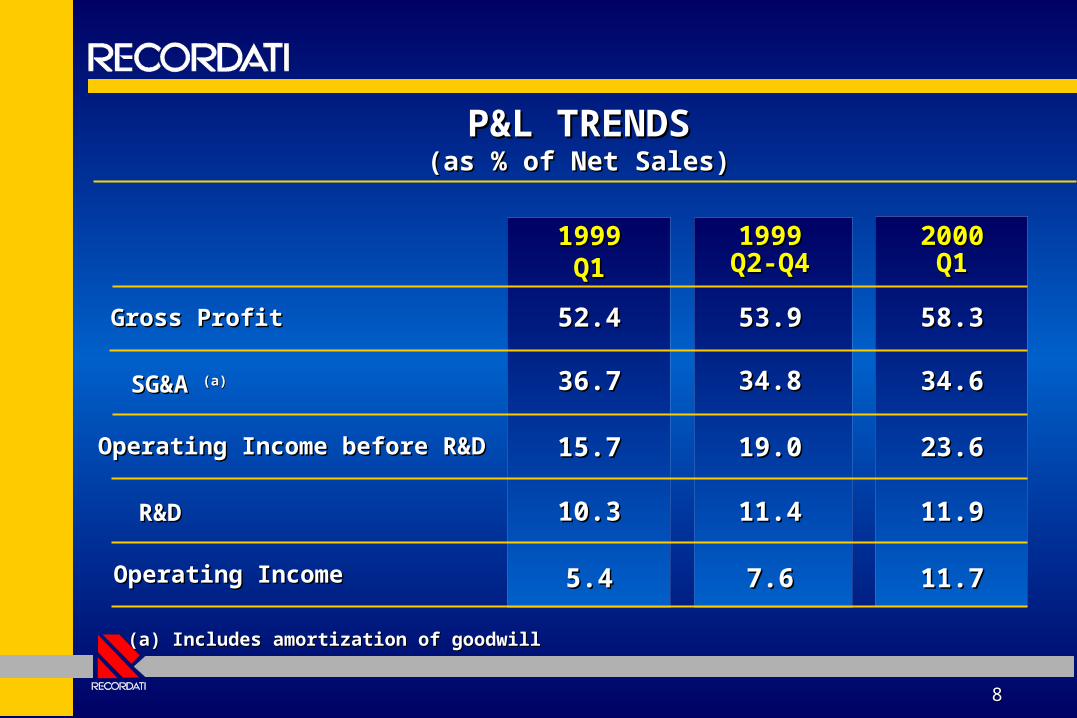
20002000Q1Q1
58.358.3
34.634.6
23.623.6
11.911.9
11.711.7
19991999Q2-Q4Q2-Q4
53.953.9
34.834.8
19.019.0
11.411.4
7.67.6
P&L TRENDSP&L TRENDS(as % of Net Sales)(as % of Net Sales)
Gross ProfitGross Profit
SG&A SG&A (a)(a)
Operating IncomeOperating Income
R&DR&D
Operating Income before R&DOperating Income before R&D
19991999Q1Q1
52.452.4
36.736.7
10.310.3
5.45.4
15.715.7
(a) Includes amortization of goodwill(a) Includes amortization of goodwill

99
127.3127.3
66.766.752.4%52.4%
20.020.015.7%15.7%
6.96.95.4%5.4%
8.78.76.8%6.8%
5.35.34.2%4.2%
14.314.3
19991999
13.113.110.4%10.4%
147.8147.8
86.186.158.3%58.3%
34.934.923.6%23.6%
17.317.311.7%11.7%
21.121.114.3%14.3%
14.114.19.6%9.6%
23.223.2
20002000
17.617.611.9%11.9%
16.1%16.1%
29.1%29.1%
74.1%74.1%
150.9150.9%%
142.2%142.2%
164.6%164.6%
62.2%62.2%
DeltaDelta
33.8%33.8%
RESULTS Q1 2000RESULTS Q1 2000
Net SalesNet Sales
Gross ProfitGross Profitas % of salesas % of sales
Operating Income Before R&DOperating Income Before R&Das % of salesas % of sales
Operating Income Operating Income as % of salesas % of sales
Pretax IncomePretax Incomeas % of salesas % of sales
Net IncomeNet Incomeas % of salesas % of sales
Cash FlowCash Flow
Q1 (billion lira)Q1 (billion lira)
R&D ExpensesR&D Expensesas % of salesas % of sales

Where we are:Where we are: RESULTS Q1 2000RESULTS Q1 2000P&L TRENDSP&L TRENDSSALES & MARGINS BY BUSINESS SALES & MARGINS BY BUSINESS
AREAAREACAPITAL EMPLOYEDCAPITAL EMPLOYED
1010
1111
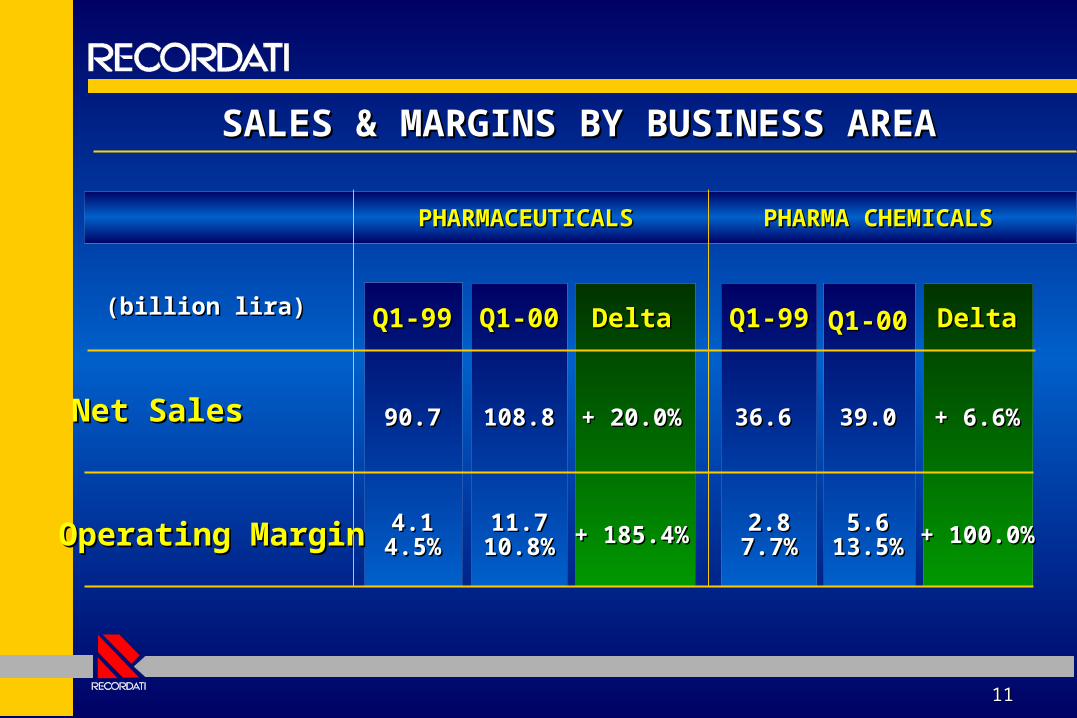
Q1-99Q1-99
90.790.7
4.14.14.5%4.5%
SALES & MARGINS BY BUSINESS AREASALES & MARGINS BY BUSINESS AREA
Q1-00Q1-00Q1-00Q1-00
Net SalesNet Sales
Operating MarginOperating Margin
39.039.0108.8108.8
5.65.613.5%13.5%
11.711.710.8%10.8%
Q1-99Q1-99
36.636.6
2.82.87.7%7.7%
PHARMACEUTICALSPHARMACEUTICALS PHARMA CHEMICALSPHARMA CHEMICALS
DeltaDelta DeltaDelta
+ 20.0%+ 20.0%
+ 185.4%+ 185.4% + 100.0%+ 100.0%
+ 6.6%+ 6.6%
(billion lira)(billion lira)
1212
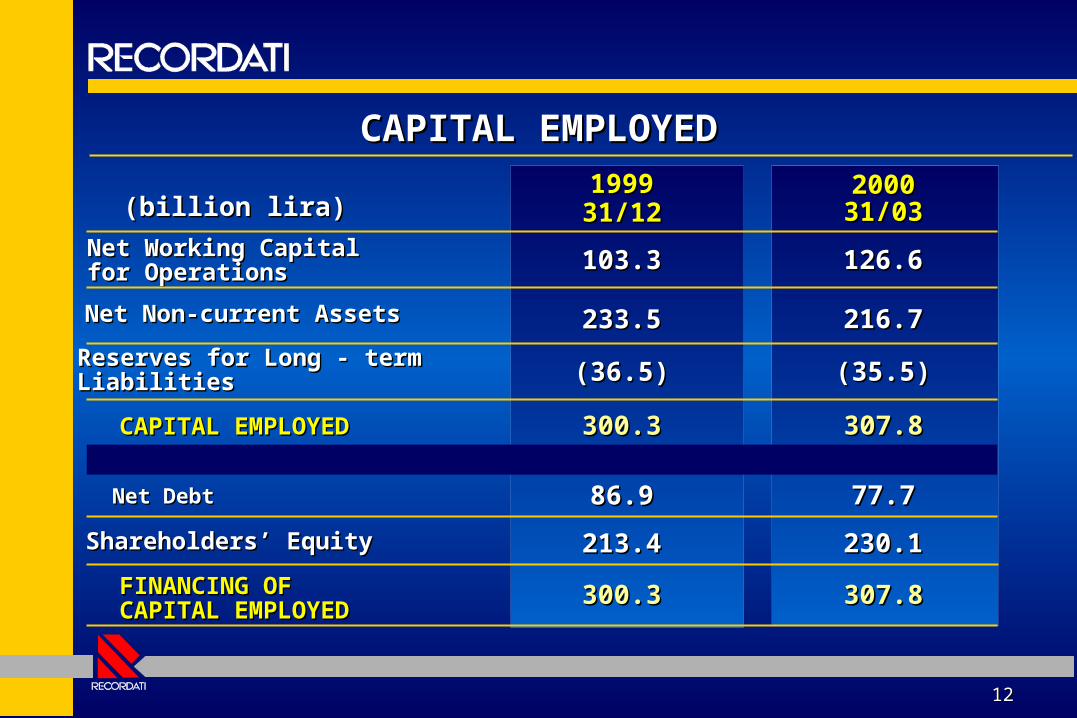
1999199931/1231/12
103.3103.3
233.5233.5
(36.5)(36.5)
300.3300.3
86.986.9
213.4213.4
300.3300.3
126.6126.6
216.7216.7
(35.5)(35.5)
307.8307.8
77.777.7
230.1230.1
CAPITAL EMPLOYEDCAPITAL EMPLOYED
Net Working Capital Net Working Capital for Operationsfor Operations
Net Non-current AssetsNet Non-current Assets
Reserves for Long - termReserves for Long - termLiabilitiesLiabilities
FINANCING OF FINANCING OF CAPITAL EMPLOYEDCAPITAL EMPLOYED
Net DebtNet Debt
Shareholders’ EquityShareholders’ Equity
CAPITAL EMPLOYEDCAPITAL EMPLOYED
307.8307.8
2000200031/0331/03(billion lira)(billion lira)

Where we are going: Where we are going: 2000-2003 TARGETS2000-2003 TARGETS
1313
NET SALES & OPERATING MARGINNET SALES & OPERATING MARGIN
CAPITAL EMPLOYEDCAPITAL EMPLOYED
1414
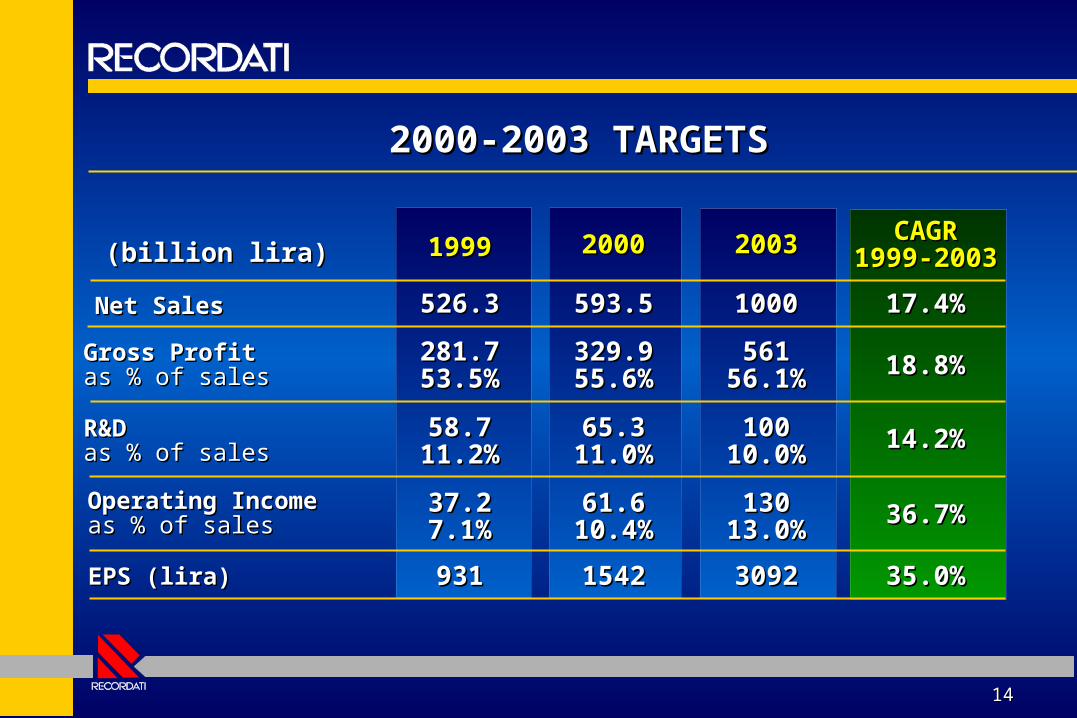
2000-2003 TARGETS2000-2003 TARGETS
2000200019991999
Net SalesNet Sales
Gross ProfitGross Profitas % of salesas % of sales
EPS (lira)EPS (lira)
Operating IncomeOperating Incomeas % of salesas % of sales
526.3526.3
281.7281.753.5%53.5%
37.237.27.1%7.1%
593.5593.5
329.9329.955.6%55.6%
931931
R&DR&Das % of salesas % of sales
58.758.711.2%11.2%
65.365.311.0%11.0%
61.661.610.4%10.4%
15421542
20032003
10001000
56156156.1%56.1%
10010010.0%10.0%
13013013.0%13.0%
30923092
CAGRCAGR1999-20031999-2003
17.4%17.4%
18.8%18.8%
14.2%14.2%
36.7%36.7%
35.0%35.0%
(billion lira)(billion lira)
1515
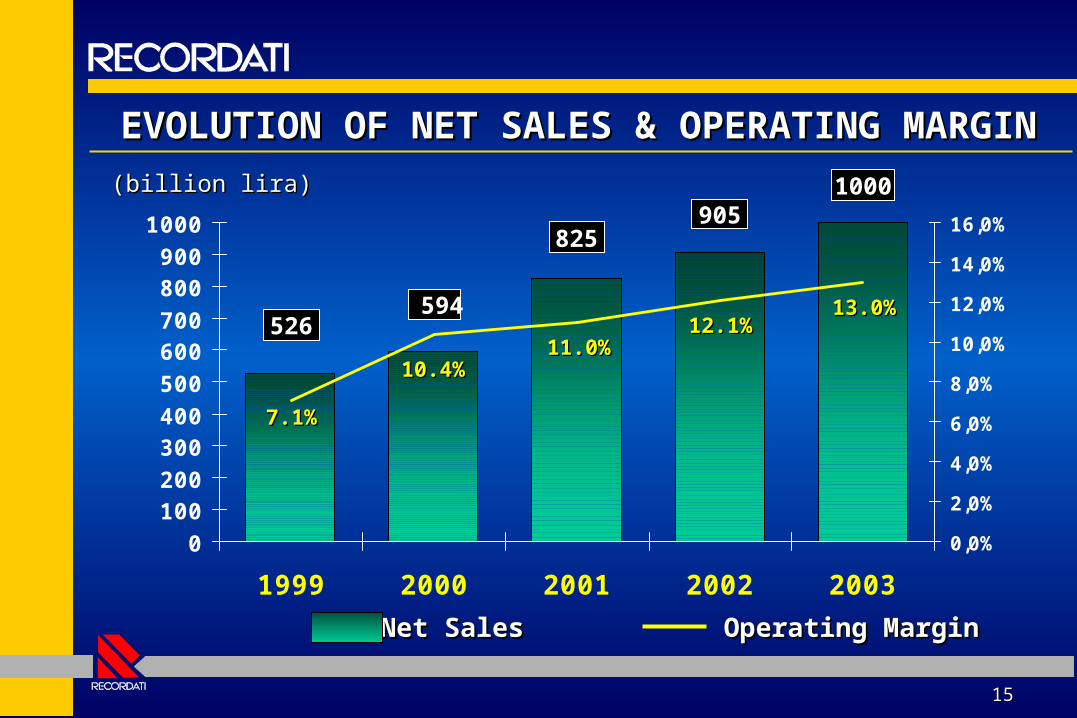
EVOLUTION OF NET SALES & OPERATING EVOLUTION OF NET SALES & OPERATING MARGINMARGIN
0100200300400500600700800900
1000
1999 2000 2001 2002 2003
0,0%
2,0%
4,0%
6,0%
8,0%
10,0%
12,0%
14,0%
16,0%
(billion lira)(billion lira)
526 594
825905
1000
Net SalesNet SalesNet SalesNet Sales Operating MarginOperating MarginOperating MarginOperating Margin
7.1%7.1%
10.4%10.4%11.0%11.0%
12.1%12.1%13.0%13.0%
1616
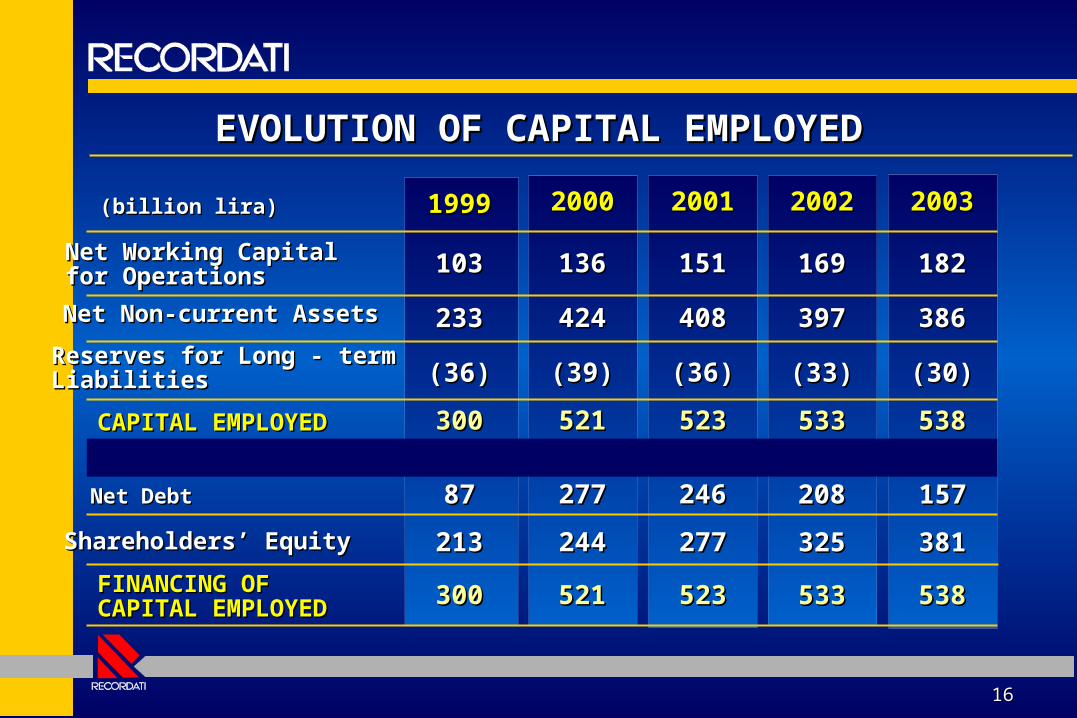
182182
386386
(30)(30)
538538
157157
381381
538538
2003200319991999
103103
233233
(36)(36)
300300
8787
213213
300300
136136
424424
(39)(39)
521521
277277
244244
521521
20002000
169169
397397
(33)(33)
533533
208208
325325
533533
20022002
151151
408408
(36)(36)
523523
246246
277277
523523
20012001
EVOLUTION OF CAPITAL EMPLOYEDEVOLUTION OF CAPITAL EMPLOYED
Net Working Capital Net Working Capital for Operationsfor Operations
Net Non-current AssetsNet Non-current Assets
Reserves for Long - termReserves for Long - termLiabilitiesLiabilities
FINANCING OF FINANCING OF CAPITAL EMPLOYEDCAPITAL EMPLOYED
Net DebtNet Debt
Shareholders’ EquityShareholders’ Equity
CAPITAL EMPLOYEDCAPITAL EMPLOYED
(billion lira)(billion lira)

Walter BevilacquaWalter BevilacquaVice President and Director Corporate Vice President and Director Corporate
DevelopmentDevelopment
1414

How we are going to get How we are going to get there:there:
1818
THE STARTING POINTTHE STARTING POINTDRIVERS OF GROWTHDRIVERS OF GROWTHRECORDATI IN 2003RECORDATI IN 2003BEYOND 2003BEYOND 2003
1919
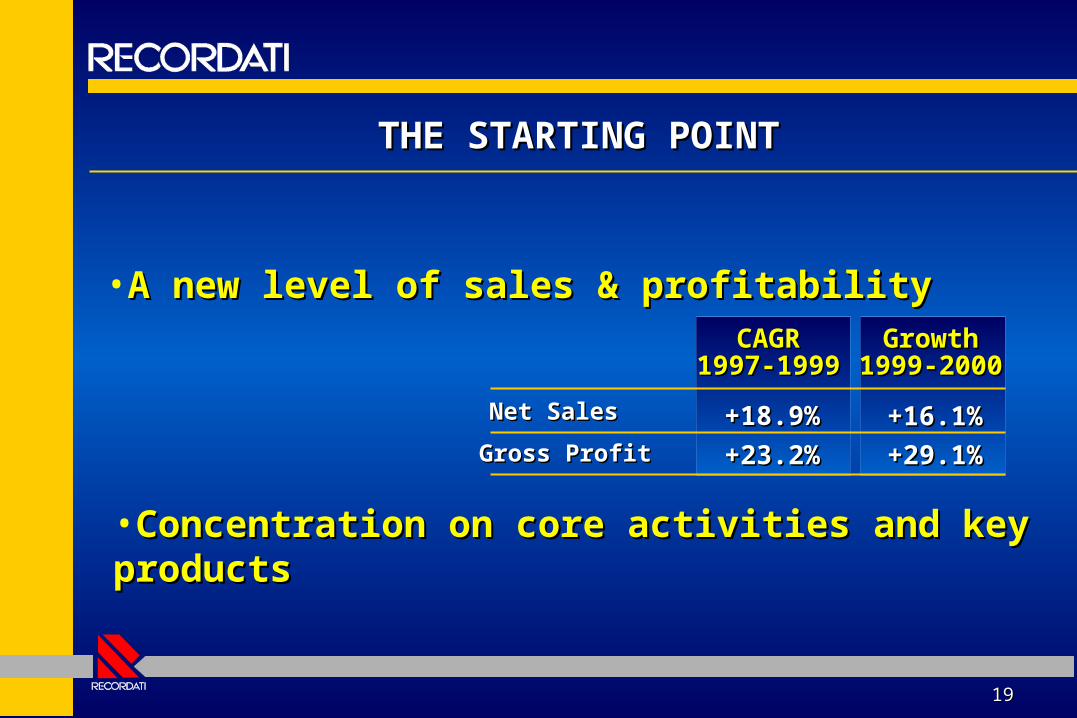
THE STARTING POINTTHE STARTING POINT
CAGRCAGR1997-19991997-1999
Net SalesNet Sales
Gross ProfitGross Profit
+18.9%+18.9%
+23.2%+23.2%
GrowthGrowth1999-20001999-2000
+16.1%+16.1%
+29.1%+29.1%
•A new level of sales & profitabilityA new level of sales & profitability
•Concentration on core activities and key Concentration on core activities and key productsproducts

2020
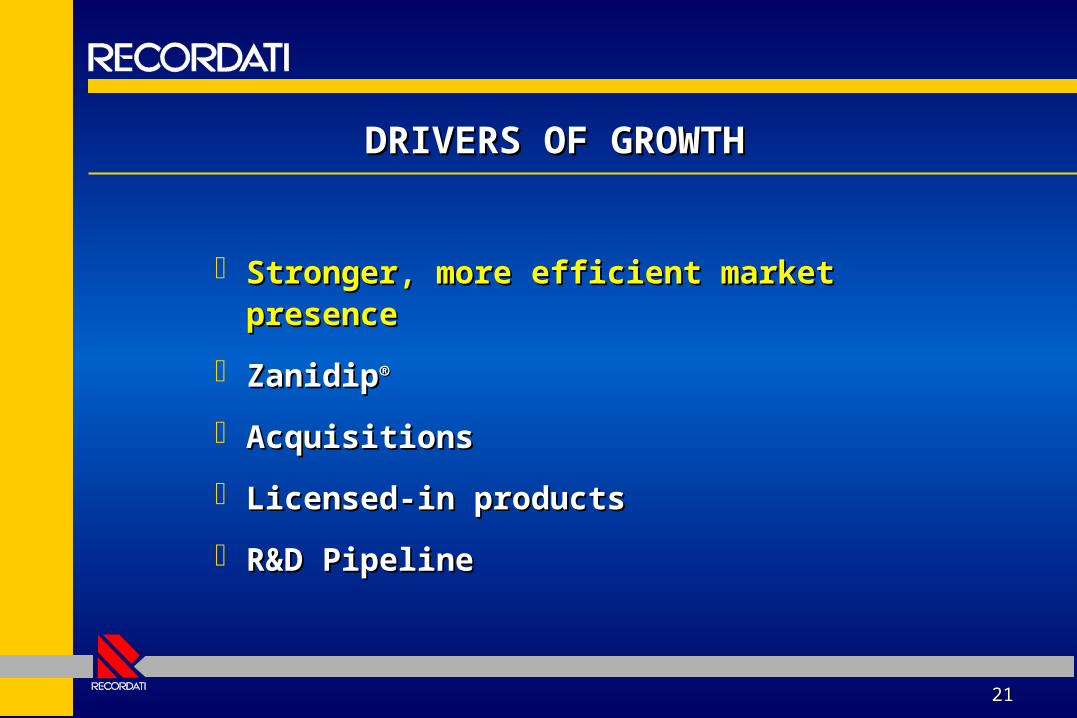
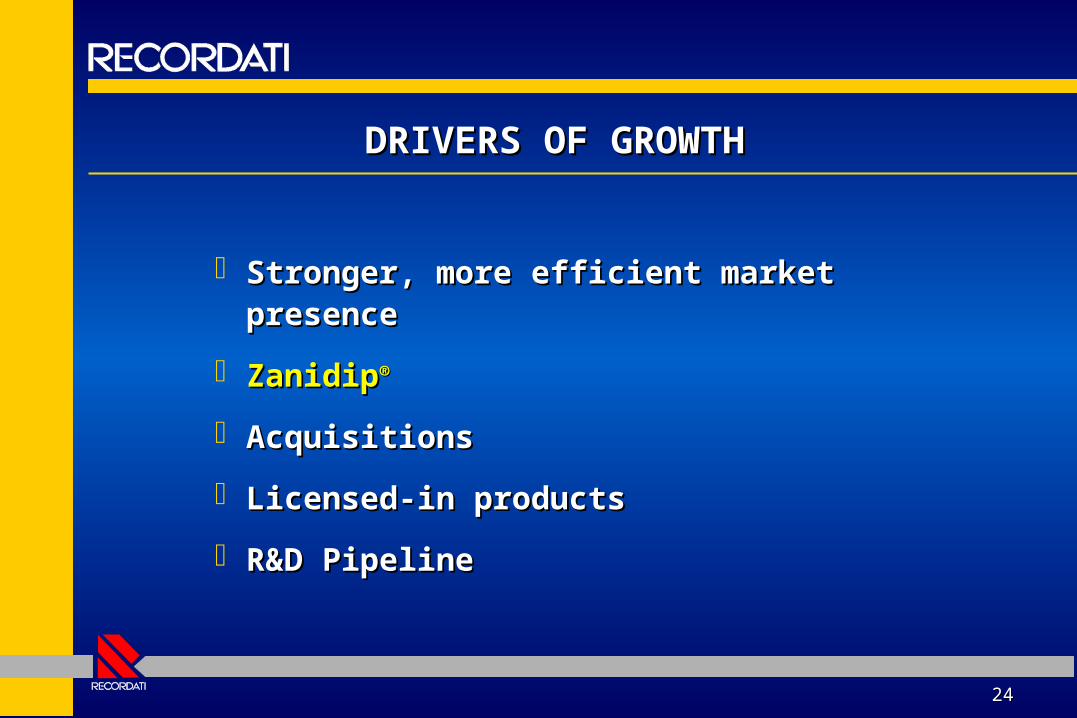
DRIVERS OF GROWTHDRIVERS OF GROWTH
Stronger, more efficient market Stronger, more efficient market presencepresence
ZanidipZanidip®®
AcquisitionsAcquisitions
Licensed-in productsLicensed-in products
R&D PipelineR&D Pipeline
2121
DRIVERS OF GROWTHDRIVERS OF GROWTH
Stronger, more efficient market Stronger, more efficient market presencepresence
ZanidipZanidip®®
AcquisitionsAcquisitions
Licensed-in productsLicensed-in products
R&D PipelineR&D Pipeline
2222
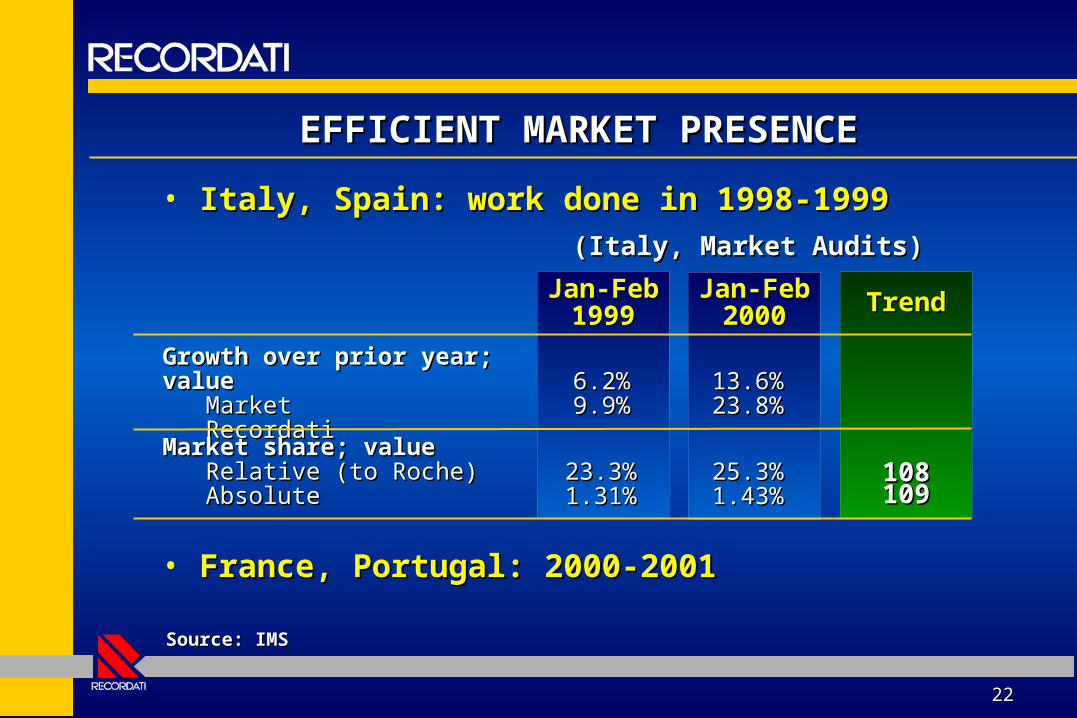
EFFICIENT MARKET PRESENCEEFFICIENT MARKET PRESENCE
• Italy, Spain: work done in 1998-1999Italy, Spain: work done in 1998-1999
• France, Portugal: 2000-2001France, Portugal: 2000-2001
Jan-FebJan-Feb19991999
Growth over prior year; Growth over prior year; valuevalue MarketMarket RecordatiRecordati
Jan-FebJan-Feb20002000 TrendTrend
108108109109
Market share; valueMarket share; value Relative (to Roche)Relative (to Roche) AbsoluteAbsolute
6.2%6.2%9.9%9.9%
13.6%13.6%23.8%23.8%
23.3%23.3%1.31%1.31%
25.3%25.3%1.43%1.43%
(Italy, Market Audits)(Italy, Market Audits)
Source: IMSSource: IMS
2323
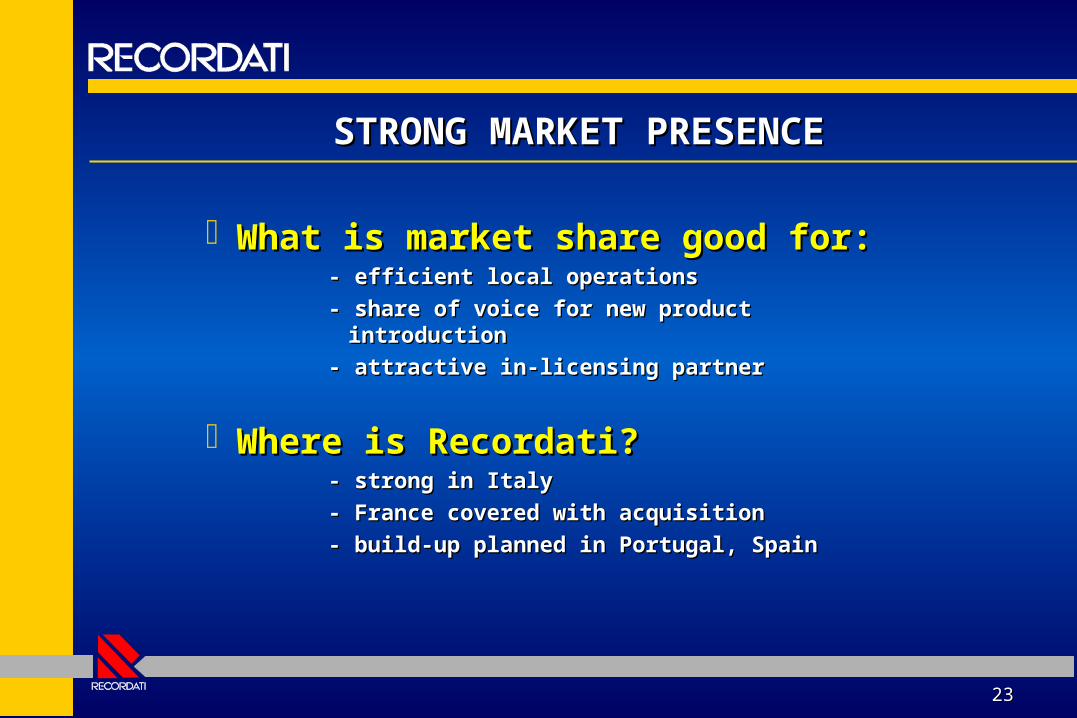
STRONG MARKET PRESENCESTRONG MARKET PRESENCE
What is market share good for:What is market share good for:- efficient local operations- efficient local operations
- share of voice for new product - share of voice for new product introductionintroduction
- attractive in-licensing partner- attractive in-licensing partner
Where is Recordati?Where is Recordati?- strong in Italy- strong in Italy
- France covered with acquisition- France covered with acquisition
- build-up planned in Portugal, Spain- build-up planned in Portugal, Spain
2424
DRIVERS OF GROWTHDRIVERS OF GROWTH
Stronger, more efficient market Stronger, more efficient market presencepresence
ZanidipZanidip®®
AcquisitionsAcquisitions
Licensed-in productsLicensed-in products
R&D PipelineR&D Pipeline
2525
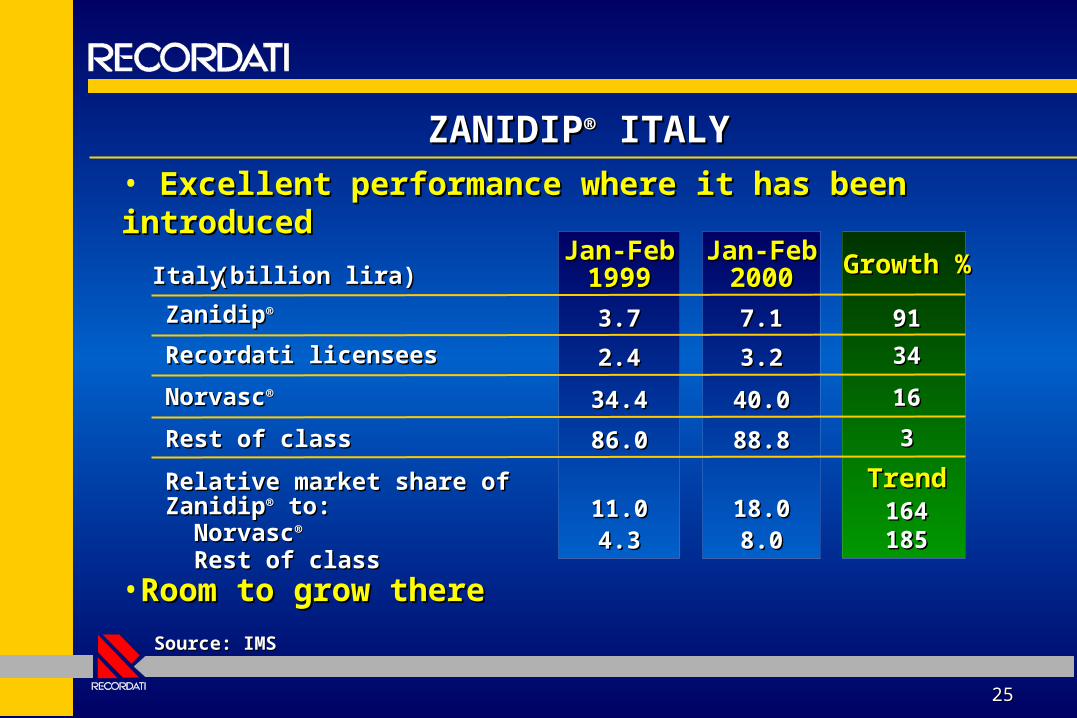
ZANIDIPZANIDIP®® ITALY ITALY• Excellent performance where it has been Excellent performance where it has been introducedintroduced
Jan-FebJan-Feb19991999
ZanidipZanidip®® 3.73.7
Jan-FebJan-Feb20002000
7.17.1
Growth %Growth %
9191
NorvascNorvasc®®
Recordati licenseesRecordati licensees
Relative market share of Relative market share of ZanidipZanidip®® to: to: NorvascNorvasc®®
Rest of classRest of class•Room to grow thereRoom to grow there
2.42.4 3.23.2
34.434.4 40.040.0
3434
1616
18.018.08.08.0
Rest of classRest of class 86.086.0 88.888.8 33
11.011.04.34.3
164164185185
TrendTrend
(billion lira)(billion lira)ItalyItaly
Source: IMSSource: IMS
2626
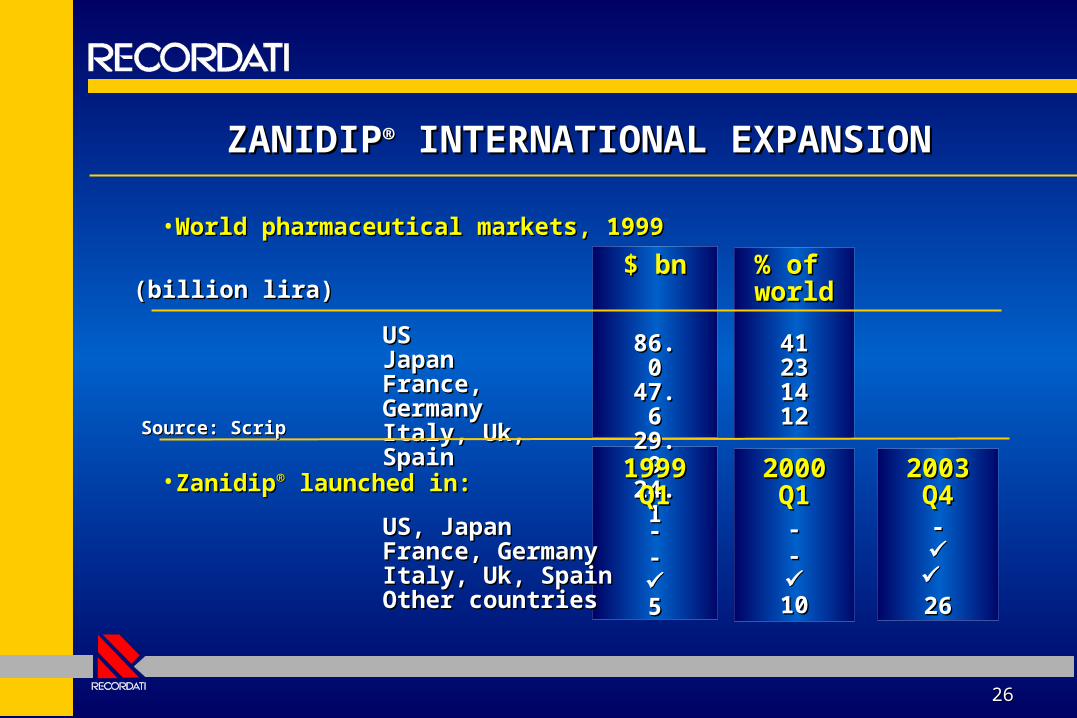
ZANIDIPZANIDIP®® INTERNATIONAL EXPANSION INTERNATIONAL EXPANSION
•World pharmaceutical markets, 1999World pharmaceutical markets, 1999
$ bn$ bn
USUSJapanJapanFrance, France, GermanyGermanyItaly, Uk, SpainItaly, Uk, Spain
% of % of worldworld(billion lira)(billion lira)
•ZanidipZanidip®® launched in: launched in:
4141232314141212
86.86.00
47.47.66
29.29.99
24.24.11
19991999Q1Q1
20002000Q1Q1
20032003Q4Q4
US, JapanUS, JapanFrance, GermanyFrance, GermanyItaly, Uk, SpainItaly, Uk, SpainOther countriesOther countries
Source: ScripSource: Scrip
----55
----1010
-- 2626

2727
DRIVERS OF GROWTHDRIVERS OF GROWTH
Stronger, more efficient market Stronger, more efficient market presencepresence
ZanidipZanidip®®
AcquisitionsAcquisitions
Licensed-in productsLicensed-in products
R&D PipelineR&D Pipeline
2828
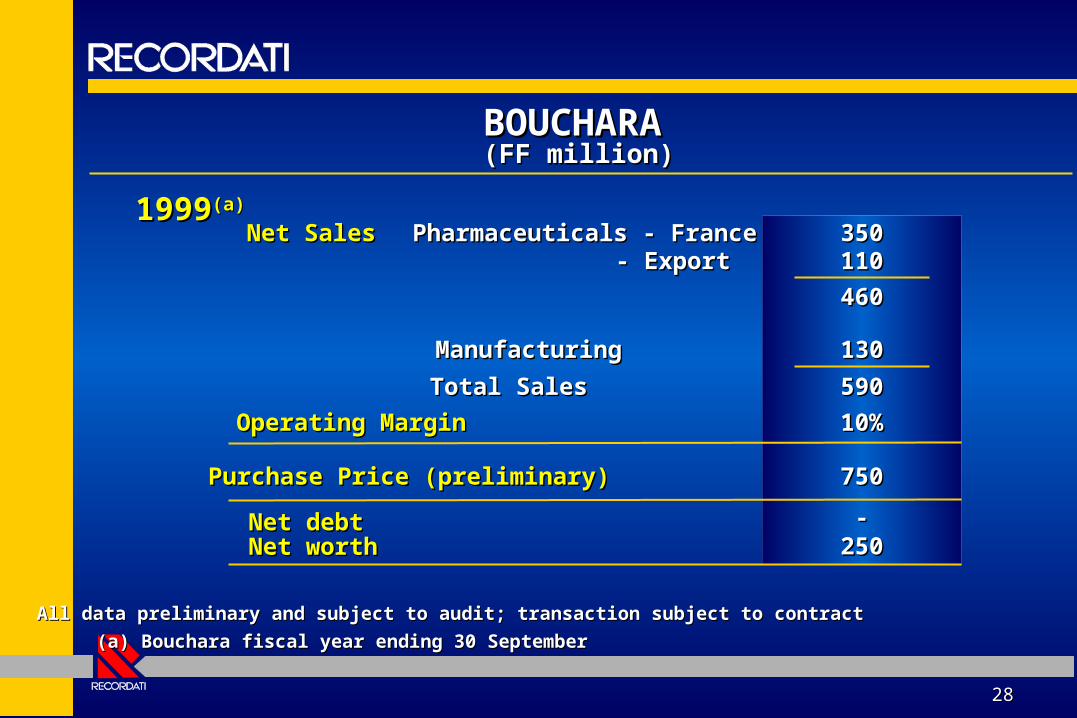
BOUCHARABOUCHARA
(FF million)(FF million)
All data preliminary and subject to audit; transaction subject to contractAll data preliminary and subject to audit; transaction subject to contract
(a) Bouchara fiscal year ending 30 September (a) Bouchara fiscal year ending 30 September
19991999(a)(a)
10%10%
- Export- Export
Net debtNet debtNet worthNet worth 250250
750750Purchase Price (preliminary)Purchase Price (preliminary)
Operating MarginOperating Margin
Net SalesNet Sales
ManufacturingManufacturing
Total SalesTotal Sales
350350110110
590590
Pharmaceuticals - FrancePharmaceuticals - France
131300
460460
--
2929
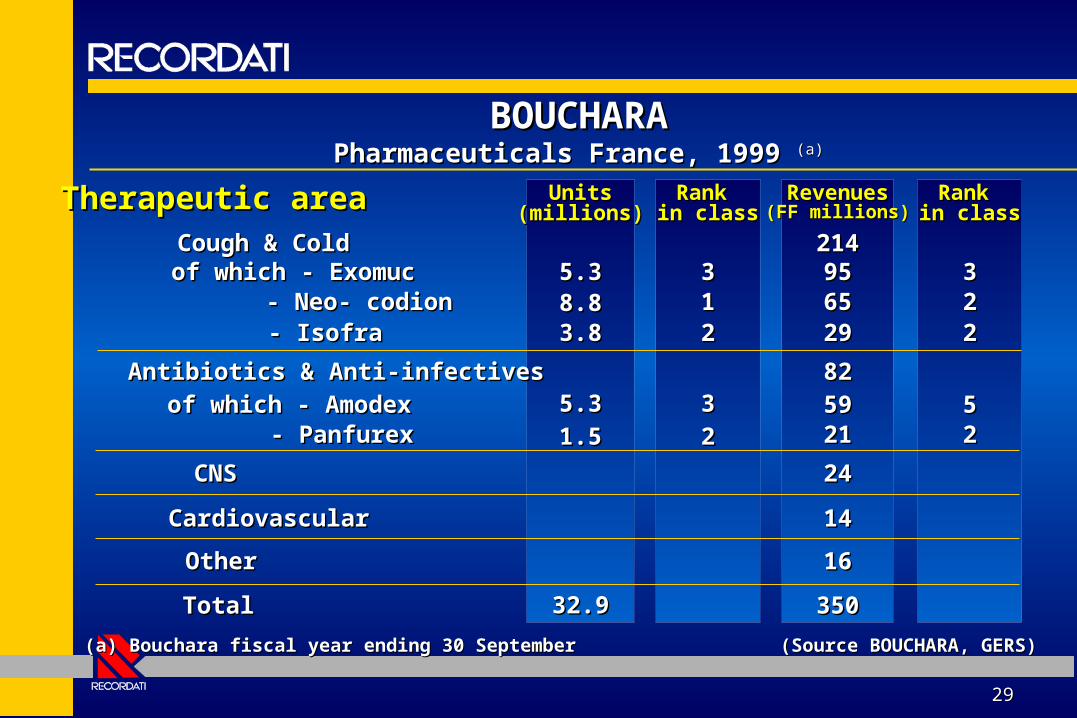
BOUCHARABOUCHARAPharmaceuticals France, 1999 Pharmaceuticals France, 1999 (a)(a)
(a) Bouchara fiscal year ending 30 September (a) Bouchara fiscal year ending 30 September
UnitsUnits(millions)(millions)
Rank Rank in classin class
RevenuesRevenues(FF millions)(FF millions)
Rank Rank in classin class
(Source BOUCHARA, (Source BOUCHARA, GERS)GERS)
Therapeutic areaTherapeutic areaCough & ColdCough & Coldof which - Exomucof which - Exomuc
- Neo- codion- Neo- codion- Isofra- Isofra
Antibiotics & Anti-infectivesAntibiotics & Anti-infectivesof which - Amodexof which - Amodex
- Panfurex- Panfurex
CNSCNS
CardiovascularCardiovascular
OtherOther
TotalTotal
5.35.38.88.83.83.8
5.35.31.51.5
32.932.9
331122
3322
21421495956565
8822
2929
5959
350350
2121
1616
1414
2424
332222
5522
3030
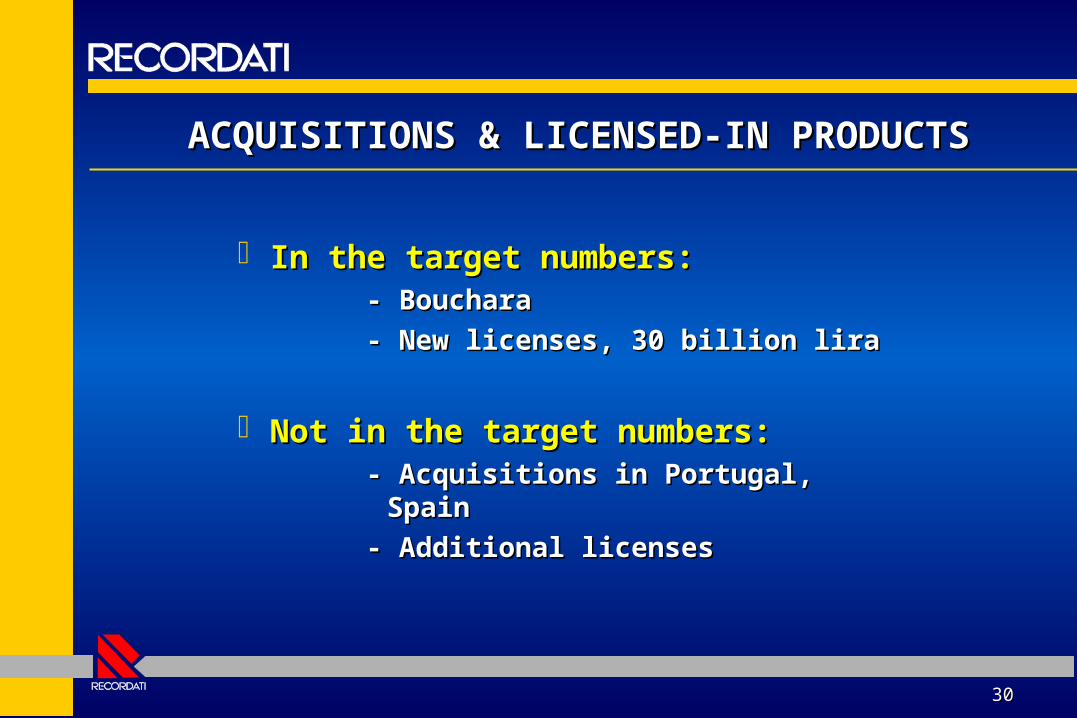
ACQUISITIONS & LICENSED-IN PRODUCTSACQUISITIONS & LICENSED-IN PRODUCTS
In the target numbers:In the target numbers:- Bouchara- Bouchara
- New licenses, 30 billion lira- New licenses, 30 billion lira
Not in the target numbers:Not in the target numbers:- Acquisitions in Portugal, - Acquisitions in Portugal,
SpainSpain
- Additional licenses- Additional licenses
3131
UPSIDE, otherUPSIDE, other
Not in the target numbers:Not in the target numbers:
- Zanidip- Zanidip®® in US, Japan in US, Japan
3232
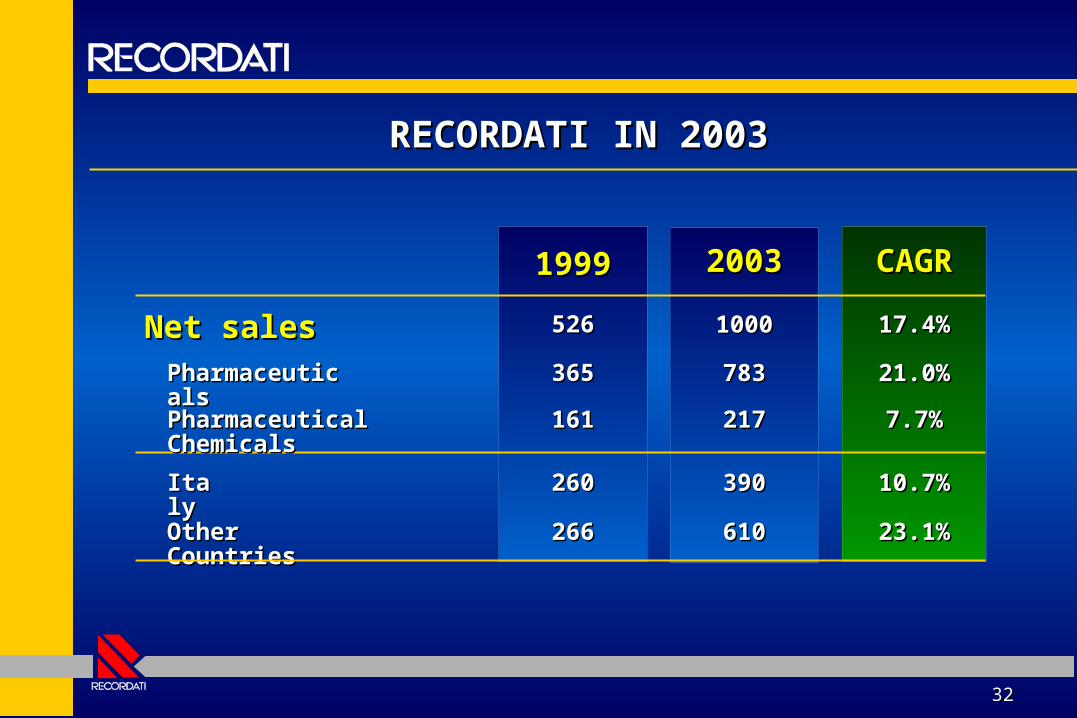
RECORDATI IN 2003RECORDATI IN 2003
Net salesNet salesPharmaceutiPharmaceuticalscals
ItalItalyy
Pharmaceutical Pharmaceutical ChemicalsChemicals
Other Other CountriesCountries
2003200319991999 CAGRCAGR
365365
161161
10001000
783783
526526
217217
260260
266266
390390
610610
17.4%17.4%
21.0%21.0%
7.7%7.7%
10.7%10.7%
23.1%23.1%
3333
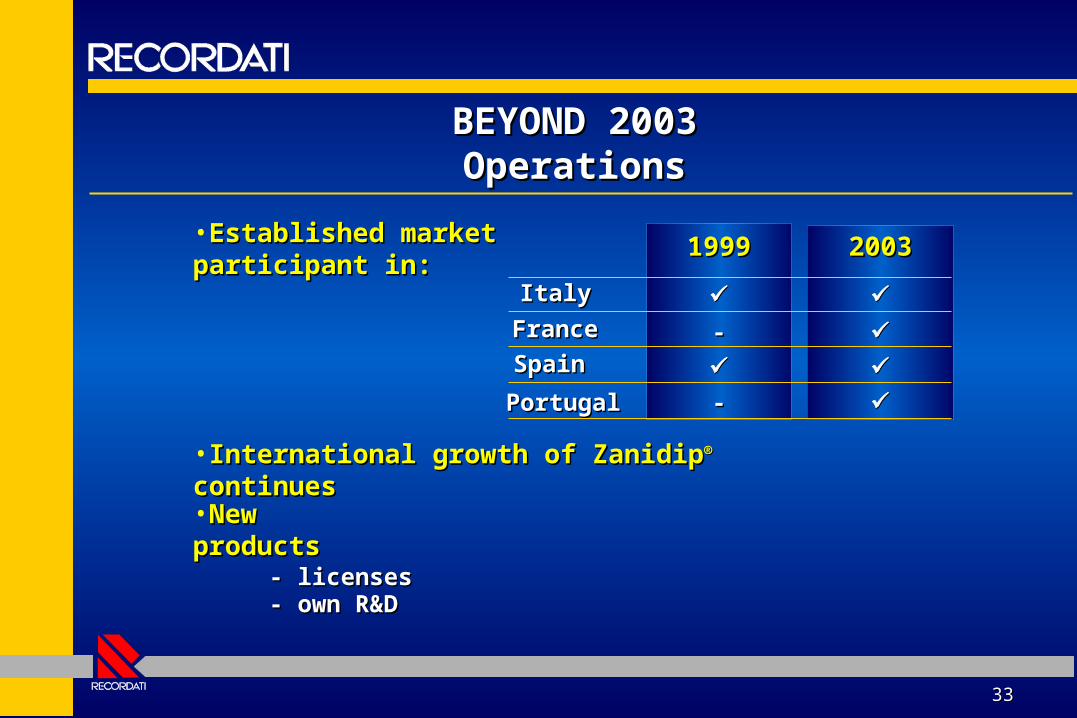
BEYOND 2003BEYOND 2003OperationsOperations
•Established market Established market participant in:participant in:
19991999
ItalyItaly
20032003
•International growth of ZanidipInternational growth of Zanidip®® continuescontinues•New New productsproducts
- licenses- licenses- own R&D- own R&D
--
--
FranceFrance
SpainSpain
PortugalPortugal
3434
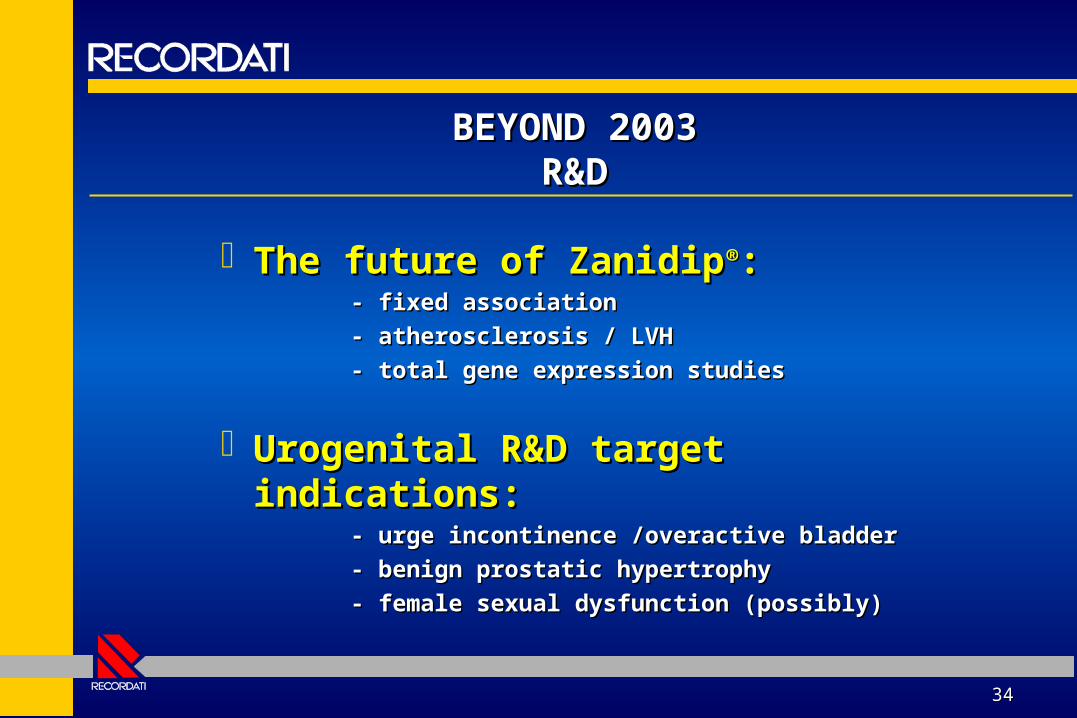
BEYOND 2003BEYOND 2003R&DR&D
The future of ZanidipThe future of Zanidip®®::- fixed association- fixed association
- atherosclerosis / LVH- atherosclerosis / LVH
- total gene expression studies- total gene expression studies
Urogenital R&D target Urogenital R&D target indications:indications:
- urge incontinence /overactive bladder- urge incontinence /overactive bladder
- benign prostatic hypertrophy- benign prostatic hypertrophy
- female sexual dysfunction (possibly)- female sexual dysfunction (possibly)

Acquisizioni in Europa Acquisizioni in Europa per un traguardo a 1.000 miliardiper un traguardo a 1.000 miliardi
Milano, 10 Maggio 2000Milano, 10 Maggio 2000