Embed Size (px)
Citation preview
[45]
ADAPTATION OF THE FIVE NONVERBAL SUBTESTS OF STANFORD–BINET INTELLIGENCE SCALE FIFTH EDITION FOR USE IN URBAN BANGLADESH
Dr. Nigar Sultana
Assistant Professor & Chairman, Department of Special Education,
Institute of Education And Research (IER),University of Dhaka.
Email: [email protected]
Dr. Sharmin Huq
Professor, Department Of Special Education,
Institute Of Education And Research (IER), University Of Dhaka.
Email: [email protected]
Mohammad Nasir Uddin Khan,
Senior Research Associate,Research And Evaluation Division,
BRAC, Dhaka
Email: [email protected]
ABSTRACT
Following the total raw scores of SB5 testing, scores were divided into two groups and then item difficulty and the discrimination index were calculated within 165 children from the total sample. Besides, the study also sought to perform an age specific (6-16) item analysis from those total students. The adaptation and modification of the items were done based on the difficulty, discriminating index and internal consistency of item. Based on the findings, total 16 from 152 items were modified. While rearranging and modifying, themes were intended to keep unchanged and hence, items were changed with native content/symbol or object, made the item culture friendly, and often retranslated the question for better understanding of the students in Bangladesh.
KEYWORDS: Adaptation, Item analysis, Nonverbal, IQ, Standardization, SB5
[46]
BACKGROUND
The greatest adaptive resource of human being is his intellectual abilities – his superior capacity for learning, reasoning and imagining. It is largely by virtue of these resources that he has been able, as a species, to master so many facets of his environment and establish his supremacy over other members of the animal kingdom. Thus, Psychological testing is one of the methods available for evaluating individuals’ abilities. Basically the function of psychological test is to measure differences in ability between individuals or between the reactions of the same individual on different occasions (Huq, 1992). It is important to detect the strength of one’s ability through a test where the first criteria of measuring abilities to analyze the item of the test.
The implications for future intelligence testing and for education are numerous. There is much basis for expecting that various intellectual abilities can be improved in individuals and the procedures needed for doing this should be clear (Guilford, J.P, 1968). Originally, intelligence tests measured verbal and nonverbal functioning and offered an overall estimate of cognitive functioning based primarily on these two constructs (Alfonso, Flanagan & Radwan, 2005). Non-verbal domain measures skills in solving abstract, visually oriented problems, recalling facts and figures, solving quantitative problems shown in picture form, assembling designs and recalling visual sequences. The non-verbal Intelligence Quotient (IQ) measures the ability to reason, solve problems and recall information presented in pictorial and symbolic form (Schreiner & Luis, 2006). It can be used to assess deaf or hard of hearing as well as
individuals with communication disorders, autism, specific learning disabilities, limited English language back ground, traumatic brain injury and other condition, such as aphasia or stroke, that may constrain linguistic ability.
At present parallel to many other developing countries, in Bangladesh there are more than a million primary school-age children with assorted disabilities and disadvantages but without access to basic education. One of the major causes of failure in schools and of low standard of achievement is due to the lack of proper assessment, counseling and guidance offered to students before and during the tenure of their education. The possibilities of education of any individual were limited by his/her attitudes and interests. The use of psychometric tests (Psychometrics is the quantitative and technical aspect of intellectual measurement) in developed countries which facilitate teachers in educational planning by providing approach to determine possible teaching learning strategies, need to be regarded as a major initiative in order to ensure the goals for achieving education for all. In consequence with the viewpoint of ‘Education for All’; a global movement led by UNESCO, aiming to meet the learning needs of all children, youth and adults by 2015 (UNESCO, 2010), many significant changes have taken place in the policy and system of education in Bangladesh. At present in Bangladesh, a handful of researchers have taken the front role in developing and standardizing psychometric tests for assessing children's ability.
Consequently, the existing measures of assessment techniques need to be up-to-date and sophisticated. In this context, the Stanford-Binet Intelligence Scale Fifth Edition
[47]
(2003) by Gale H.Roid, which is widely used worldwide as a measure for detecting any academic problem was translated, adapted and standardized for Bangladesh culture? The Stanford-Binet Intelligence Scale, Fifth Edition (SB5) is a contemporary assessment with a rich tradition, which began in 1916 when Lewis Terman completed his American revision of the Binet-Simon Scales (1908).Through various editions in 1937, 1960, and 1986, the Stanford-Binet has become widely known as a standard measure of intellectual abilities. Many of the familiar subtests of previous editions remain in the SB5. Examples include Picture Absurdities, Matrices, Vocabulary, and Memory for Sentences, Quantitative Reasoning, and Verbal Absurdities (shown in figure 1 in methodology section). Stanford-Binet maintained a hybrid structure, combining point-scale and age-scale formats for both verbal and non verbal domain. The SB5 includes many high-end items designed to measure individuals at the highest level of gifted performance. It also corporate improved low-end items to better measure young children, low functioning older children and adults with mental retardation. Toys and manipulations are included in the test kit. The ‘Item Books’ include colorful artwork to make the materials more children friendly (Roid, 2003).
Item analysis is the first criteria of standardization (a research process of testing a normative group) for any psychological test (Anastasi & Urbina, 1997). Whereas the other three criteria are norm development, reliability and validity respectively. Every widely used psychological assessment instrument is under scrutiny in terms of cultural fairness (Roid, 2003). Item analysis is a process, which examines student responses
to individual test items (questions) in order to assess the quality of those items and of the test as a whole. Item analysis is especially valuable in improving items, which will be used again in later tests, but it can also be used to eliminate ambiguous or misleading items in a single test administration. The study aims to scrutinize the strengths and weaknesses of each non-verbal test item.
On the other hand, a psychometric test would be effectively standardized for using in other language and culture when the items of the test are being well adapted. With this view, standardization and adaptation of psychological tests for cross-cultural assessment is becoming prominent worldwide at an increasing pace. A safe rule of thumb to translate or adapt an item is to ensure whether the proposed target item reflects the spirit of the original item (Allalouf & Chang, 1999; Sireci, 1998 in Matthews, 2003). Moreover, adapting an existing instrument instead of developing a new one has remarkable benefit. By adapting a test, the researcher is able to compare the cross-cultural studies at both the national and international perspective.
OBJECTIVES
The main purpose of the present study was to adapt the five nonverbal subtests of SB5 in Bangla. Whereas, to accomplish this purpose the author stated the following specific objectives.
1. To translate the five nonverbal subtests of SB5 in Bangla.
[48]
2. To examine the strengths and weaknesses of each non verbal test item of SB5 (2003) on Bangladesh perspective.
3. To find out internal consistency of five nonverbal test items of SB5.
METHODOLOGY
PARTICIPANTS
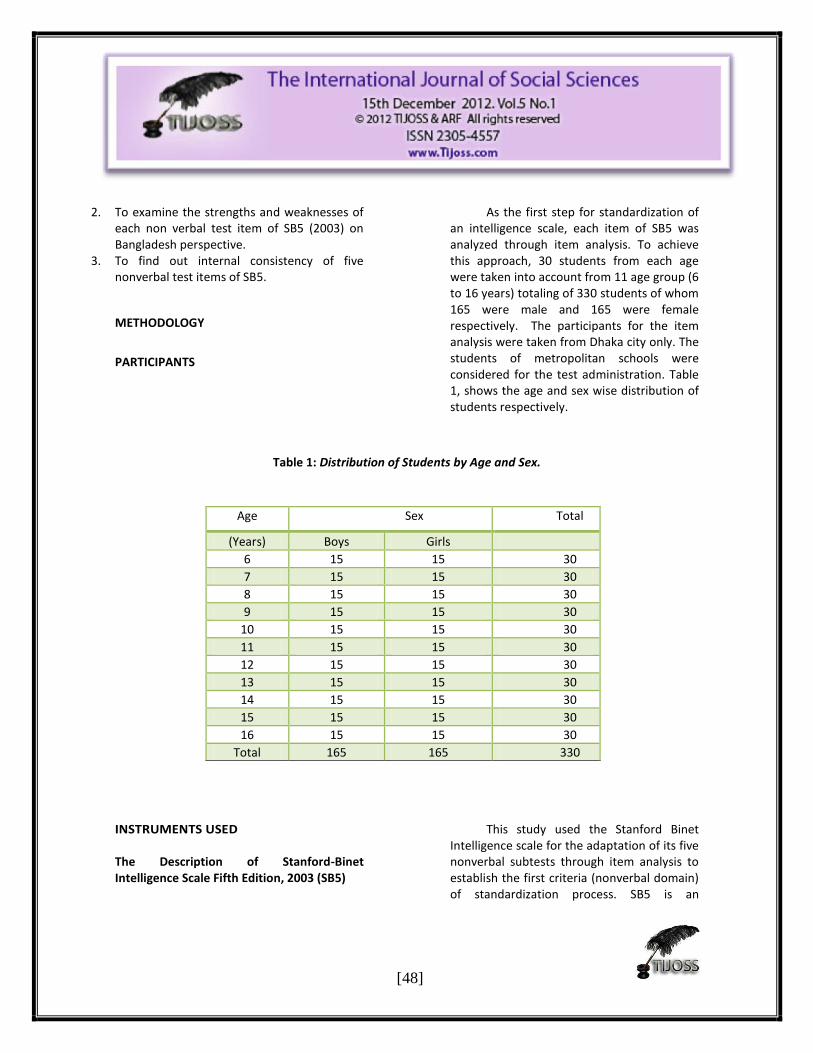
As the first step for standardization of an intelligence scale, each item of SB5 was analyzed through item analysis. To achieve this approach, 30 students from each age were taken into account from 11 age group (6 to 16 years) totaling of 330 students of whom 165 were male and 165 were female respectively. The participants for the item analysis were taken from Dhaka city only. The students of metropolitan schools were considered for the test administration. Table 1, shows the age and sex wise distribution of students respectively.
Table 1: Distribution of Students by Age and Sex.
INSTRUMENTS USED The Description of Stanford-Binet Intelligence Scale Fifth Edition, 2003 (SB5)
This study used the Stanford Binet Intelligence scale for the adaptation of its five nonverbal subtests through item analysis to establish the first criteria (nonverbal domain) of standardization process. SB5 is an
Age Sex Total
(Years) Boys Girls
6 15 15 30
7 15 15 30
8 15 15 30
9 15 15 30
10 15 15 30
11 15 15 30
12 15 15 30
13 15 15 30
14 15 15 30
15 15 15 30
16 15 15 30
Total 165 165 330
[49]
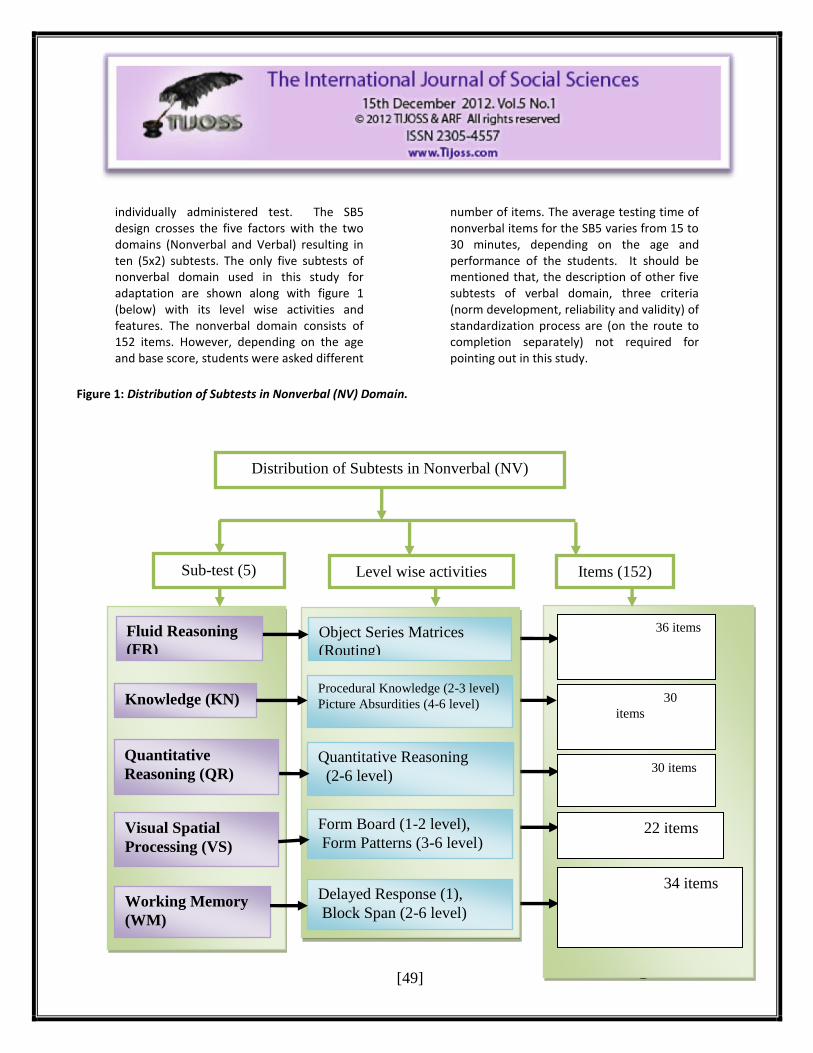
individually administered test. The SB5 design crosses the five factors with the two domains (Nonverbal and Verbal) resulting in ten (5x2) subtests. The only five subtests of nonverbal domain used in this study for adaptation are shown along with figure 1 (below) with its level wise activities and features. The nonverbal domain consists of 152 items. However, depending on the age and base score, students were asked different
number of items. The average testing time of nonverbal items for the SB5 varies from 15 to 30 minutes, depending on the age and performance of the students. It should be mentioned that, the description of other five subtests of verbal domain, three criteria (norm development, reliability and validity) of standardization process are (on the route to completion separately) not required for pointing out in this study.
Figure 1: Distribution of Subtests in Nonverbal (NV) Domain.
Fluid Reasoning
(FR)
Knowledge (KN)
Visual Spatial
Processing (VS)
Quantitative
Reasoning (QR)
Working Memory
(WM)
Delayed Response (1),
Block Span (2-6 level)
Procedural Knowledge (2-3 level)
Picture Absurdities (4-6 level)
Object Series Matrices
(Routing)
Quantitative Reasoning
(2-6 level)
Form Board (1-2 level),
Form Patterns (3-6 level)
Distribution of Subtests in Nonverbal (NV)
Domain
Sub-test (5) Level wise activities
Items (152)
36 items
30
items
30 items
22 items
34 items
[50]
Figure 1: Organization of Five Subtests of Non verbal domain of SB 5.
Source: Stanford Binet Intelligence Scales Fifth Edition-Technical Manual by Roid, G.H (2003), p.8. Copyright 2003 by the Riverside Publishing.
PROCEDURE It should be noted that the SB5 intelligence scale has already been bought and used by the researchers with the copy right permission from the Riverside publisher. For item analysis the following procedure is described. TRANSLATION The students may have difficulty in understanding English language. Each item of the subtests was first translated into Bangla. The translation was done under the supervision of the supervisor and translated version was given to experts (special educators & psychologists) to have an opinion of the translation. Finally, the translated version was again retranslated into English in order to verify the reliability of translation.
STANDARDIZED TESTING PROCEDURES SB5 are designed to assess an examinee’s functional abilities under controlled conditions. To be scientifically accurate, the examiner must use only the standard instructions that were shown in the Item Books and must present materials such as toys, blocks and other manipulative in the order and arrangement specified in the directions printed in the Item Books The examiner would follow the directions for administering and scoring each portion of the test carefully (Roid, 2003).
SCORING
The scoring of the test was done by using the conventional hand scoring procedures. To use the hand scoring procedure, the researcher completed the scoring summary on first page of the record form.
ANALYSIS TECHNIQUE
Examination of each item was done in terms of (i) Difficulty Index (ii) Discriminating Index. Item analysis was computed on the scores obtained by 330 students as participants for the ten subtests of SB5. The item analysis considers total of 330 students of 30 students from each age group (6 to 16). These analyses were done into two sections. In the first section, in calculating the discrimination index and difficulty index participants from all age groups (6 to 16) were considered. In the second stage, age specific difficulty index and discrimination were calculated. In calculating difficulty index and discrimination index 165 students from all ages were considered. And there, 82 were from lower score group (lowest quartile) and 82 were from upper score group (highest quartile). For age specific difficulty index, score and items of 30 students of each age were considered. In this calculation, 15 students were from lower score group and 15 were from upper score group of the 30 students.
DIFFICULTY INDEX
The item difficulty (P) was computed by calculating the total number of individuals who passed each item in the two different groups divided by the total number of individuals who attempted the item from both groups for each item (Ahmann and Glock, 1981). The
[51]
level of difficulty of an item focuses on the proportion of students who correctly answer an item. The higher the correct response from both groups, the easier the item. On the other hand, as the item gradually becomes more difficult the proportion of answering an item correctly becomes lower (Ahmann and Glock, 1981).
DISCRIMINATION INDEX
Item discrimination (D) refers to the degree to which an item differentiates correctly among test takers in the behavior that the test is designed to measure. The purpose of this index is to provide a measure that would separate an item considering their correct or incorrect responses depending on the answers from upper and lower groups which explores discrimination of group differences. (Anastasi & Urbina, 1997). The item discrimination index (D) can vary from -1.00 to +1.00. A negative discrimination index (between -1.00 and zero) results when more students in the lower group answered correctly than students in the higher group. A discrimination index of zero means equal numbers from higher and lower students answered correctly, so the items did not discriminate between groups. A positive index occurs when more students in the higher group answer correctly than the lower group (Oosterhof, 1990). Besides, another method, Cronbach Alpha, for measuring internal consistency of test items was also considered in this study.
ADAPTATION
Test adaptation is exclusively necessary for language and cultural differences (Reckase 1989). The most significant recognition for any test adaptation in any country is the provision of guidelines
from the International Test Commission (ITC). The International Test Commission (ITC) has provided guidelines for translating and adapting tests in 1992. It further highlights administration and interpretation of tests to improve the accuracy and compile evidence on the equivalence between the different language versions (Guideline D1., ITC, 2001; Hambleton, 2005). This guideline can act as a benchmark for translation and adaptation of the SB5 test which has been taken into consideration for adaptation and further standardization in our country, Bangladesh.
RESULTS
The item difficulty of a test item that is scored right or wrong is indicated by the percentage of children who got the item right. It meant that the item, which has the higher value of ‘P’, is the easier item. In this connection, the item gradually becomes more difficult the value of ‘P’ for this item becomes lower (Linn & Gronlund, 2005).
[52]
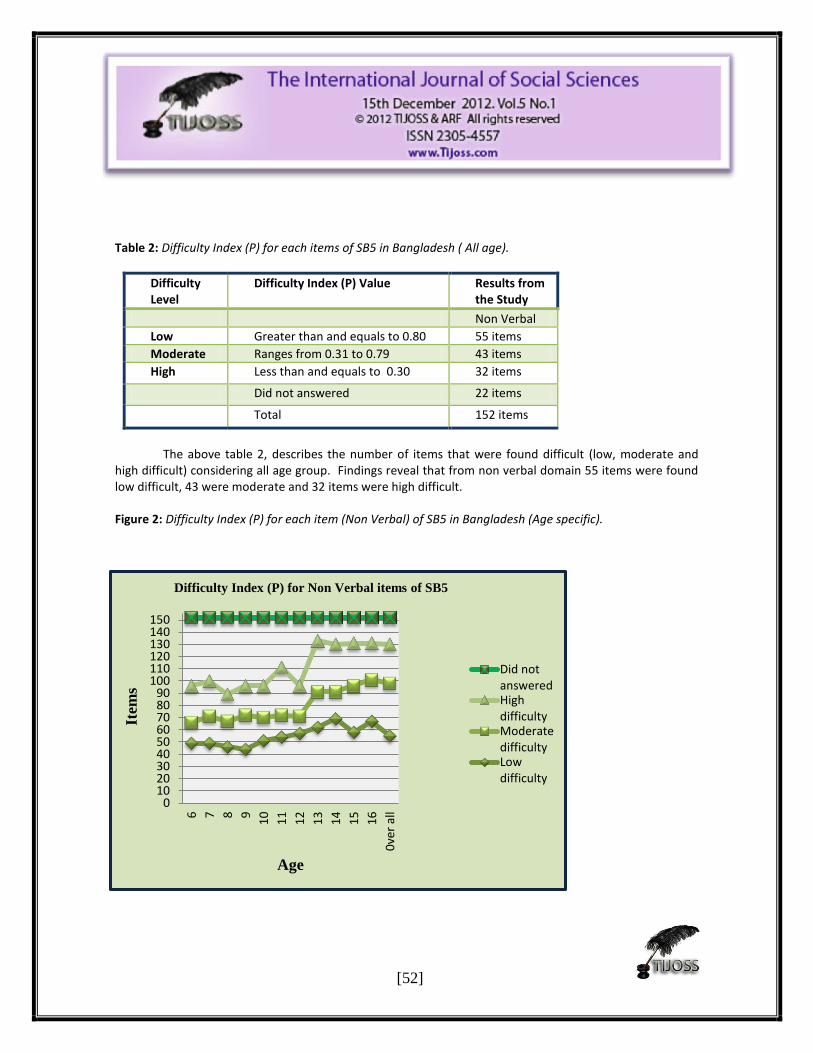
Table 2: Difficulty Index (P) for each items of SB5 in Bangladesh ( All age).
Difficulty Level
Difficulty Index (P) Value Results from the Study
Non Verbal
Low Greater than and equals to 0.80 55 items
Moderate Ranges from 0.31 to 0.79 43 items
High Less than and equals to 0.30 32 items
Did not answered 22 items
Total 152 items
The above table 2, describes the number of items that were found difficult (low, moderate and high difficult) considering all age group. Findings reveal that from non verbal domain 55 items were found low difficult, 43 were moderate and 32 items were high difficult.
Figure 2: Difficulty Index (P) for each item (Non Verbal) of SB5 in Bangladesh (Age specific).
0102030405060708090
100110120130140150
6 7 8 9
10
11
12
13
14
15
16
0ve
r al
l
Item
s
Age
Difficulty Index (P) for Non Verbal items of SB5
Did notansweredHighdifficultyModeratedifficultyLowdifficulty
[53]
The above figure (2) shows that in non verbal domain as age increases, it reduces the number of unanswered items. Again, as age increases the proportion of low difficulty index increases except for age 15 years in non verbal domain. The method of extreme groups can be applied to compute a very simple measure of the discriminating power of a test item. The following table 3 depicts the items which have discriminating power and which don't have. As like as the difficulty index, the discrimination index were analyzed into two sections namely over all ages and age specific sections.
Table 3: Decision from Discrimination Index (D) for each item of SB5 in Bangladesh (All age).
Discrimination Level Discrimination Index (D)Value
Findings from the Study
Non Verbal
Very good Greater than or equals to 0.6
51 items
Good When D ranges from 0.31 to 0.60
15 items
Acceptable When D ranges from 0.01 to 0.30
14 items
Bad Less than or equals to 0.20
50 items
Did not answered
22 items
Total 152 items
The above table (3) describes the number of items by their discrimination level (very good, good, acceptable and bad) considering all age group. Findings reveal that from non verbal domain 51, 15, 14, 50 items were found very good, good and acceptable respectively at the decimation level. Item-wise discrimination index values are presented in table 3.
[54]
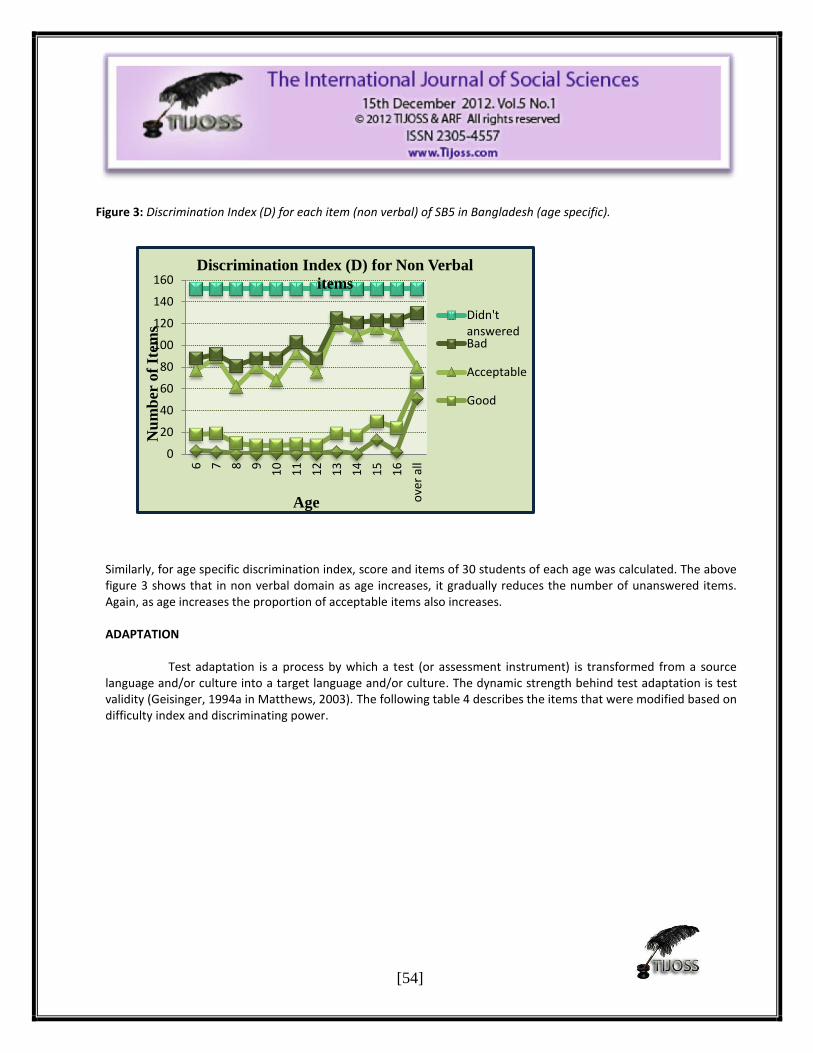
Figure 3: Discrimination Index (D) for each item (non verbal) of SB5 in Bangladesh (age specific).
Similarly, for age specific discrimination index, score and items of 30 students of each age was calculated. The above figure 3 shows that in non verbal domain as age increases, it gradually reduces the number of unanswered items. Again, as age increases the proportion of acceptable items also increases. ADAPTATION
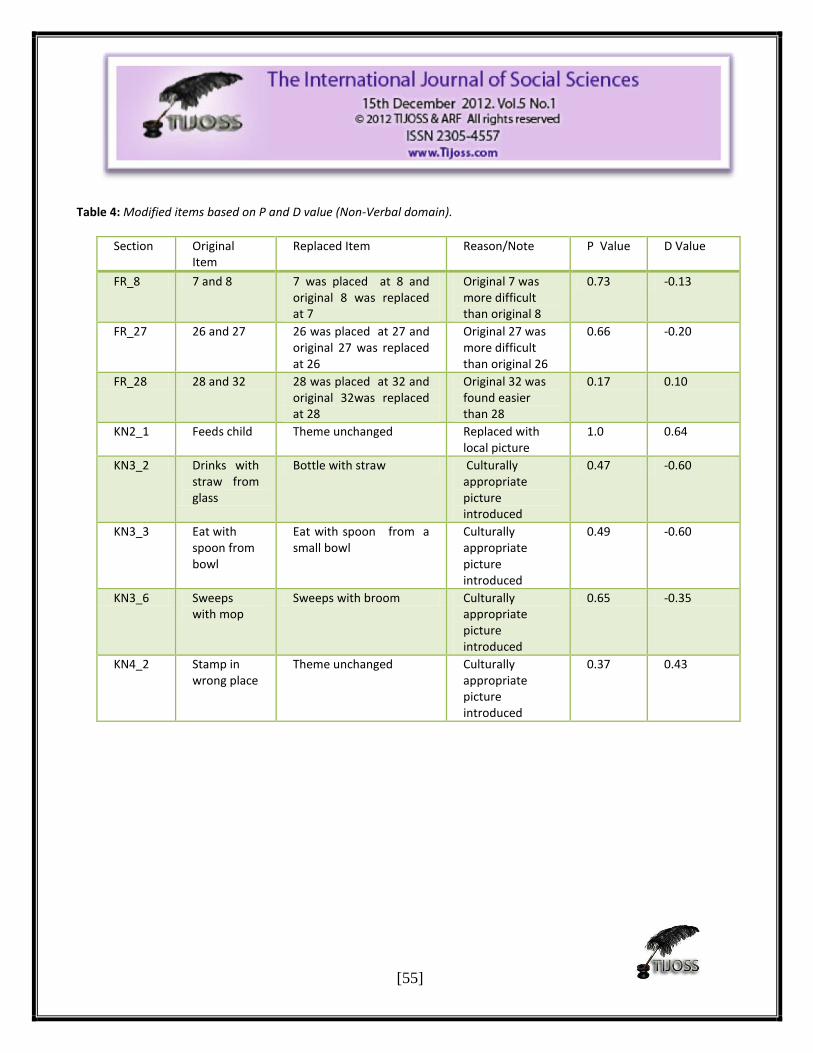
Test adaptation is a process by which a test (or assessment instrument) is transformed from a source language and/or culture into a target language and/or culture. The dynamic strength behind test adaptation is test validity (Geisinger, 1994a in Matthews, 2003). The following table 4 describes the items that were modified based on difficulty index and discriminating power.
0
20
40
60
80
100
120
140
160
6 7 8 9
10
11
12
13
14
15
16
ove
r al
l
Nu
mb
er o
f It
ems
Age
Discrimination Index (D) for Non Verbal
items
Didn'tansweredBad
Acceptable
Good
[55]
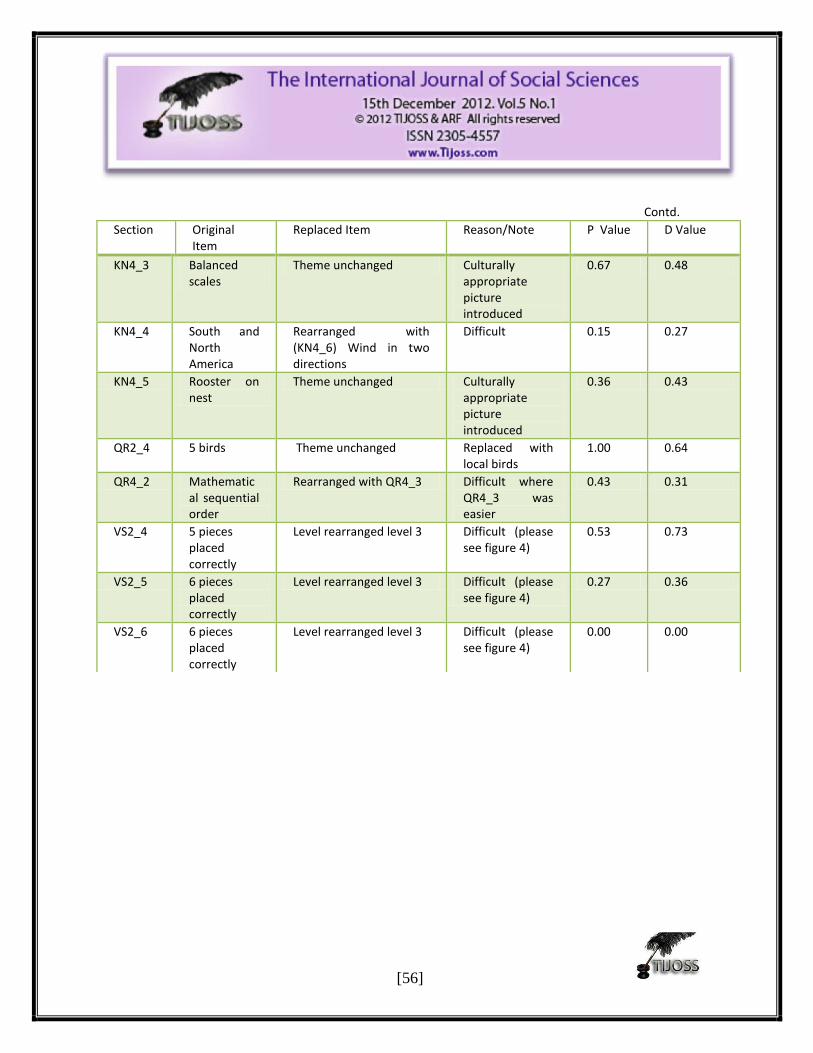
Table 4: Modified items based on P and D value (Non-Verbal domain).
Section Original Item
Replaced Item Reason/Note P Value D Value
FR_8 7 and 8 7 was placed at 8 and original 8 was replaced at 7
Original 7 was more difficult than original 8
0.73 -0.13
FR_27 26 and 27 26 was placed at 27 and original 27 was replaced at 26
Original 27 was more difficult than original 26
0.66 -0.20
FR_28 28 and 32 28 was placed at 32 and original 32was replaced at 28
Original 32 was found easier than 28
0.17 0.10
KN2_1 Feeds child Theme unchanged Replaced with local picture
1.0 0.64
KN3_2 Drinks with straw from glass
Bottle with straw Culturally appropriate picture introduced
0.47 -0.60
KN3_3 Eat with spoon from bowl
Eat with spoon from a small bowl
Culturally appropriate picture introduced
0.49 -0.60
KN3_6 Sweeps with mop
Sweeps with broom Culturally appropriate picture introduced
0.65 -0.35
KN4_2 Stamp in wrong place
Theme unchanged Culturally appropriate picture introduced
0.37 0.43
[56]
Contd.
Section Original Item
Replaced Item Reason/Note P Value D Value
KN4_3 Balanced scales
Theme unchanged Culturally appropriate picture introduced
0.67 0.48
KN4_4 South and North America
Rearranged with (KN4_6) Wind in two directions
Difficult 0.15 0.27
KN4_5 Rooster on nest
Theme unchanged Culturally appropriate picture introduced
0.36 0.43
QR2_4 5 birds Theme unchanged Replaced with local birds
1.00 0.64
QR4_2 Mathematical sequential order
Rearranged with QR4_3 Difficult where QR4_3 was easier
0.43 0.31
VS2_4 5 pieces placed correctly
Level rearranged level 3 Difficult (please see figure 4)
0.53 0.73
VS2_5 6 pieces placed correctly
Level rearranged level 3 Difficult (please see figure 4)
0.27 0.36
VS2_6 6 pieces placed correctly
Level rearranged level 3 Difficult (please see figure 4)
0.00 0.00
[57]
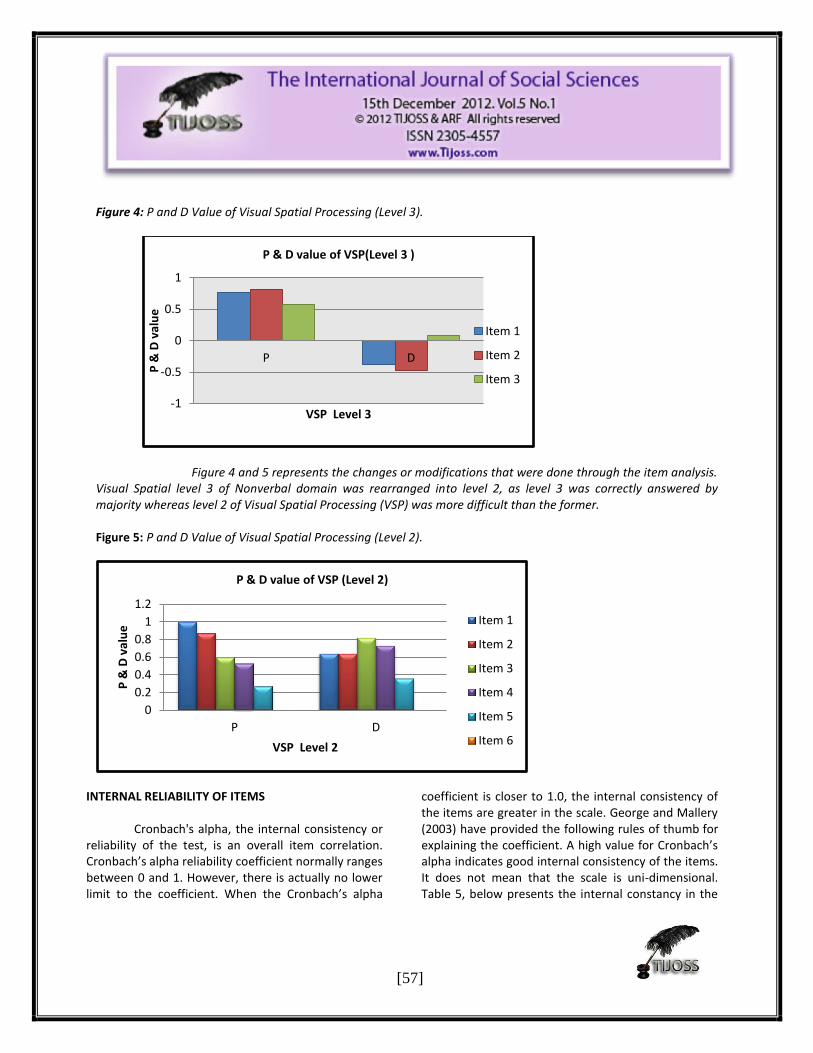
Figure 4: P and D Value of Visual Spatial Processing (Level 3).
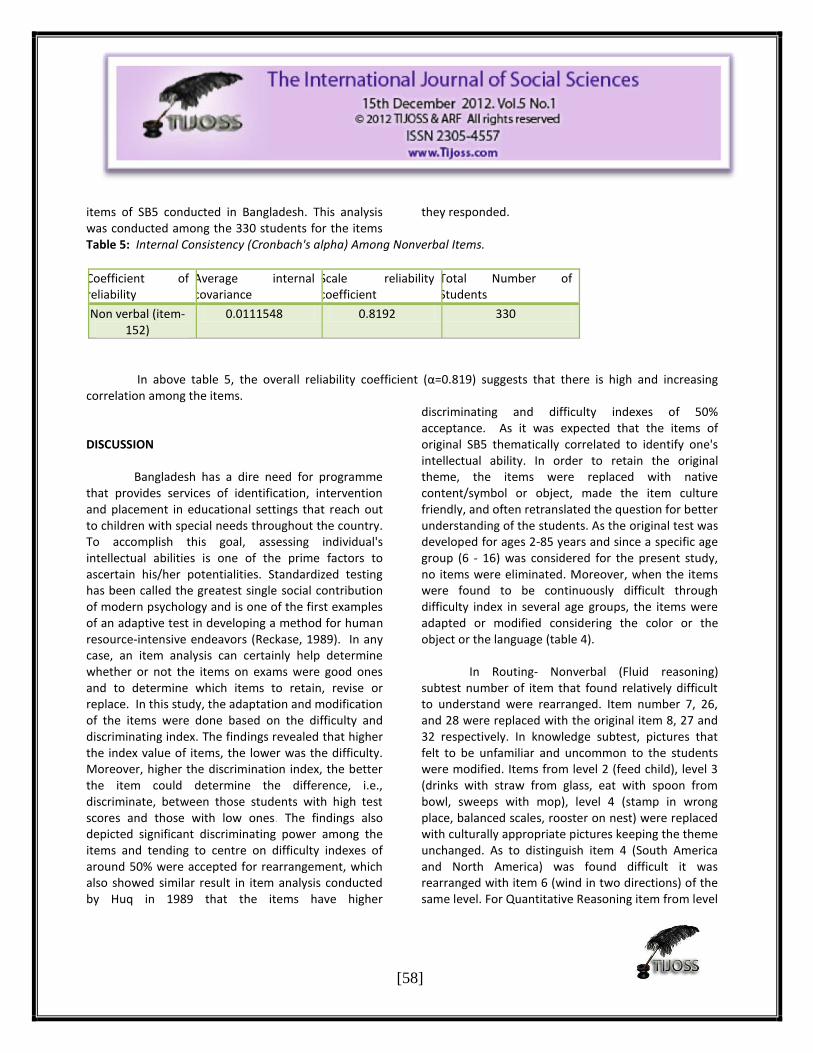
Figure 4 and 5 represents the changes or modifications that were done through the item analysis. Visual Spatial level 3 of Nonverbal domain was rearranged into level 2, as level 3 was correctly answered by majority whereas level 2 of Visual Spatial Processing (VSP) was more difficult than the former.
Figure 5: P and D Value of Visual Spatial Processing (Level 2).
INTERNAL RELIABILITY OF ITEMS
Cronbach's alpha, the internal consistency or reliability of the test, is an overall item correlation. Cronbach’s alpha reliability coefficient normally ranges between 0 and 1. However, there is actually no lower limit to the coefficient. When the Cronbach’s alpha
coefficient is closer to 1.0, the internal consistency of the items are greater in the scale. George and Mallery (2003) have provided the following rules of thumb
for
explaining the coefficient. A high value for Cronbach’s alpha indicates good internal consistency of the items. It does not mean that the scale is uni-dimensional. Table 5, below presents the internal constancy in the
-1
-0.5
0
0.5
1
P D
P &
D v
alu
e
VSP Level 3
P & D value of VSP(Level 3 )
Item 1
Item 2
Item 3
0
0.2
0.4
0.6
0.8
1
1.2
P D
P &
D v
alu
e
VSP Level 2
P & D value of VSP (Level 2)
Item 1
Item 2
Item 3
Item 4
Item 5
Item 6
[58]
items of SB5 conducted in Bangladesh. This analysis was conducted among the 330 students for the items
they responded.
Table 5: Internal Consistency (Cronbach's alpha) Among Nonverbal Items.
Coefficient of reliability
Average internal covariance
Scale reliability coefficient
Total Number of Students
Non verbal (item-152)
0.0111548 0.8192 330
In above table 5, the overall reliability coefficient (α=0.819) suggests that there is high and increasing correlation among the items.
DISCUSSION
Bangladesh has a dire need for programme that provides services of identification, intervention and placement in educational settings that reach out to children with special needs throughout the country. To accomplish this goal, assessing individual's intellectual abilities is one of the prime factors to ascertain his/her potentialities. Standardized testing has been called the greatest single social contribution of modern psychology and is one of the first examples of an adaptive test in developing a method for human resource-intensive endeavors (Reckase, 1989). In any case, an item analysis can certainly help determine whether or not the items on exams were good ones and to determine which items to retain, revise or replace. In this study, the adaptation and modification of the items were done based on the difficulty and discriminating index. The findings revealed that higher the index value of items, the lower was the difficulty. Moreover, higher the discrimination index, the better the item could determine the difference, i.e., discriminate, between those students with high test scores and those with low ones. The findings also depicted significant discriminating power among the items and tending to centre on difficulty indexes of around 50% were accepted for rearrangement, which also showed similar result in item analysis conducted by Huq in 1989 that the items have higher
discriminating and difficulty indexes of 50% acceptance. As it was expected that the items of original SB5 thematically correlated to identify one's intellectual ability. In order to retain the original theme, the items were replaced with native content/symbol or object, made the item culture friendly, and often retranslated the question for better understanding of the students. As the original test was developed for ages 2-85 years and since a specific age group (6 - 16) was considered for the present study, no items were eliminated. Moreover, when the items were found to be continuously difficult through difficulty index in several age groups, the items were adapted or modified considering the color or the object or the language (table 4).
In Routing- Nonverbal (Fluid reasoning)
subtest number of item that found relatively difficult to understand were rearranged. Item number 7, 26, and 28 were replaced with the original item 8, 27 and 32 respectively. In knowledge subtest, pictures that felt to be unfamiliar and uncommon to the students were modified. Items from level 2 (feed child), level 3 (drinks with straw from glass, eat with spoon from bowl, sweeps with mop), level 4 (stamp in wrong place, balanced scales, rooster on nest) were replaced with culturally appropriate pictures keeping the theme unchanged. As to distinguish item 4 (South America and North America) was found difficult it was rearranged with item 6 (wind in two directions) of the same level. For Quantitative Reasoning item from level
[59]
2 (5 birds) was replaced with picture of native birds (Table 4). Item 1 from level 4 (mathematical sequential order) was rearranged with the item 3 from the same level where item 3 was found easier compare to mathematical sequential order. In Visual Spatial level 2 was reshuffled with level 3. Level 3 of Visual Spatial Processing in Nonverbal domain was rearranged into level 2, as level 3 was correctly answered by majority whereas level 2 of Visual Spatial
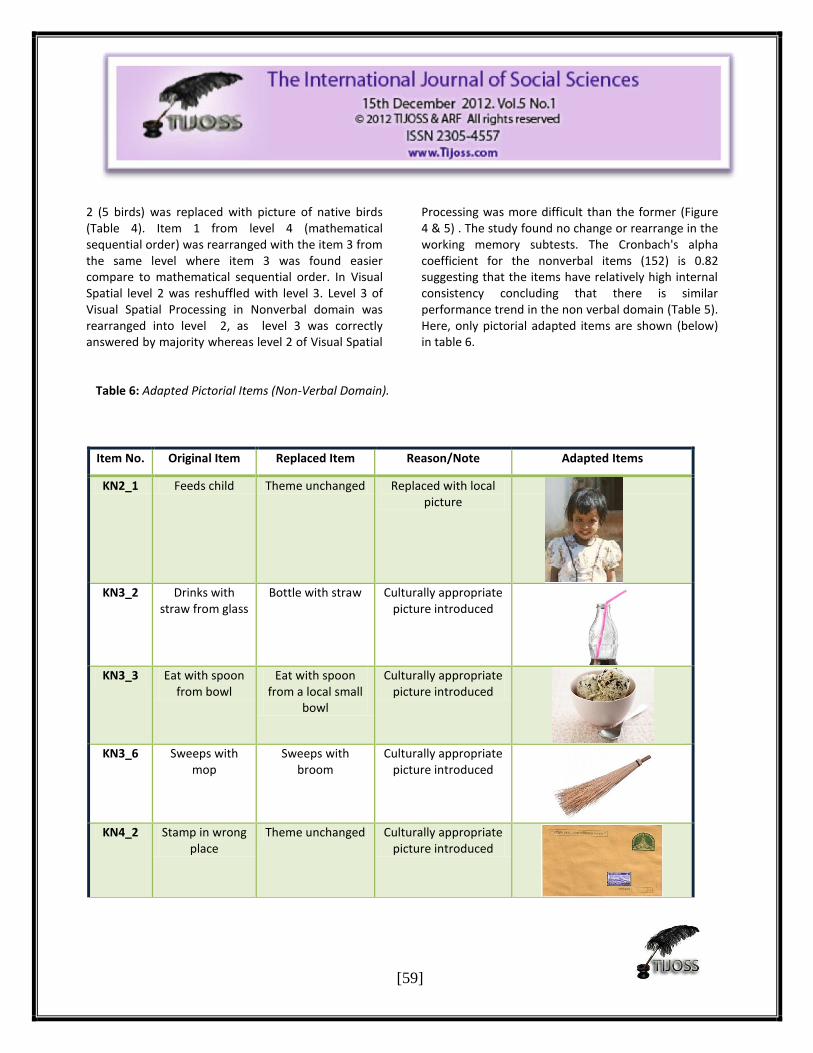
Processing was more difficult than the former (Figure 4 & 5) . The study found no change or rearrange in the working memory subtests. The Cronbach's alpha coefficient for the nonverbal items (152) is 0.82 suggesting that the items have relatively high internal consistency concluding that there is similar performance trend in the non verbal domain (Table 5). Here, only pictorial adapted items are shown (below) in table 6.
Table 6: Adapted Pictorial Items (Non-Verbal Domain).
Item No. Original Item Replaced Item Reason/Note Adapted Items
KN2_1 Feeds child Theme unchanged Replaced with local picture
KN3_2 Drinks with straw from glass
Bottle with straw Culturally appropriate picture introduced
KN3_3 Eat with spoon
from bowl Eat with spoon
from a local small bowl
Culturally appropriate picture introduced
KN3_6 Sweeps with
mop Sweeps with
broom Culturally appropriate
picture introduced
KN4_2 Stamp in wrong
place Theme unchanged Culturally appropriate
picture introduced
[60]
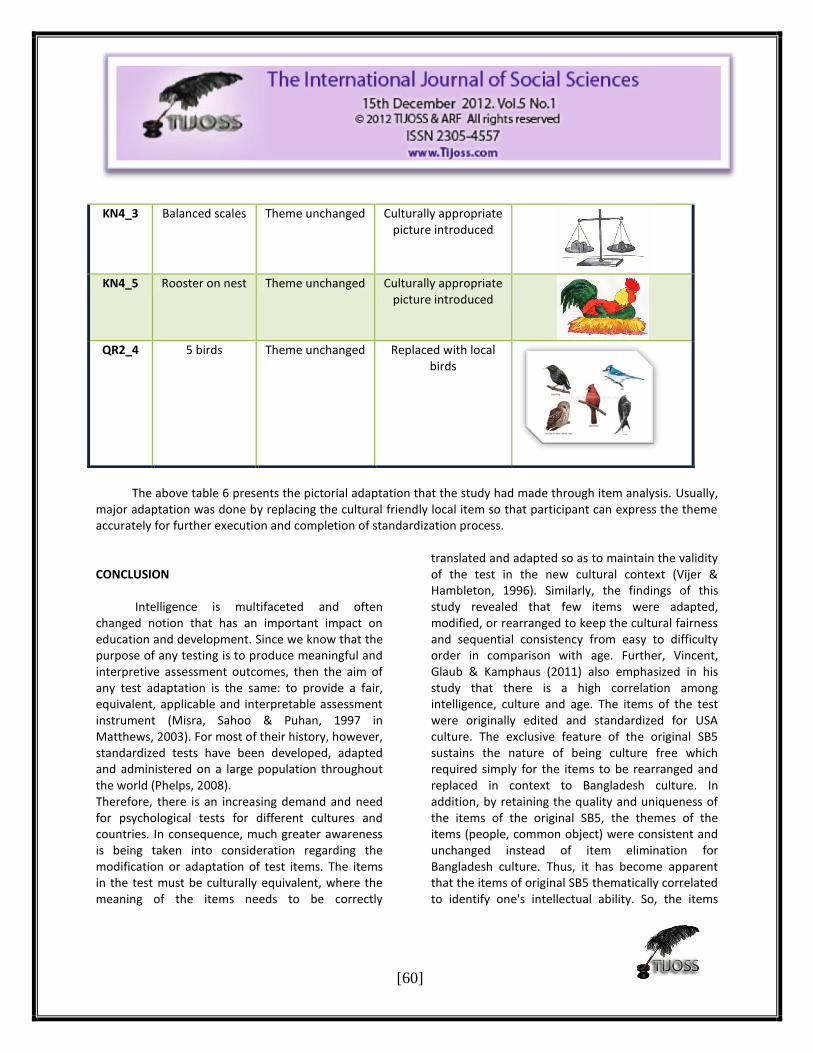
The above table 6 presents the pictorial adaptation that the study had made through item analysis. Usually, major adaptation was done by replacing the cultural friendly local item so that participant can express the theme accurately for further execution and completion of standardization process. CONCLUSION Intelligence is multifaceted and often changed notion that has an important impact on education and development. Since we know that the purpose of any testing is to produce meaningful and interpretive assessment outcomes, then the aim of any test adaptation is the same: to provide a fair, equivalent, applicable and interpretable assessment instrument (Misra, Sahoo & Puhan, 1997 in Matthews, 2003). For most of their history, however, standardized tests have been developed, adapted and administered on a large population throughout the world (Phelps, 2008). Therefore, there is an increasing demand and need for psychological tests for different cultures and countries. In consequence, much greater awareness is being taken into consideration regarding the modification or adaptation of test items. The items in the test must be culturally equivalent, where the meaning of the items needs to be correctly
translated and adapted so as to maintain the validity of the test in the new cultural context (Vijer & Hambleton, 1996). Similarly, the findings of this study revealed that few items were adapted, modified, or rearranged to keep the cultural fairness and sequential consistency from easy to difficulty order in comparison with age. Further, Vincent, Glaub & Kamphaus (2011) also emphasized in his study that there is a high correlation among intelligence, culture and age. The items of the test were originally edited and standardized for USA culture. The exclusive feature of the original SB5 sustains the nature of being culture free which required simply for the items to be rearranged and replaced in context to Bangladesh culture. In addition, by retaining the quality and uniqueness of the items of the original SB5, the themes of the items (people, common object) were consistent and unchanged instead of item elimination for Bangladesh culture. Thus, it has become apparent that the items of original SB5 thematically correlated to identify one's intellectual ability. So, the items
KN4_3 Balanced scales Theme unchanged Culturally appropriate picture introduced
KN4_5 Rooster on nest Theme unchanged Culturally appropriate
picture introduced
QR2_4 5 birds Theme unchanged Replaced with local
birds
[61]
were replaced with native content/symbol or object, made the item culture friendly, and often retranslated the question for better understanding of the students.
Keep pace with the theme of original SB5; the study concluded that the items were adapted for Bangladesh that are culture friendly, changing the order, language through using the tools of item analysis. Since the present study was the part of standardization of SB5 for use in Bangladesh, this criterion of standardization (adaptation through item analysis) establish a path for further execution and completion of norm development that will assist the professionals like school psychologists, educators to be concerned while selecting an effective assessment scale to measure a student’s intellectual ability. REFERENCES
Ahmann, J. S., and Glock, M.D. (1981). Evaluating pupil growth. (6
th Ed.) Boston: Ally and
Bacons Alfonso, V. S., Flanagan D. P., & Radwan, S.
(2005). The impact of the Cattell-Horn Carroll theory on test development and interpretation of cognitive and academic abilities. Contemporary Intellectual Assessment, (2nd ed.). Theories, Tests, and Issues. New York, NY: Guilford Publications.
Anastasi, A. & Urbina, S. (1997).
Psychological testing. N.D.: Pearson Education George, D., & Mallery, P. (2003). SPSS for
Windows step by step: A simple guide and reference. 11.0 update (4th Ed.). Boston: Allyn & Bacon.
Guilford, J. P. (1968). The three faces of
intellect. In R. G. Kuhlen (Ed.) Studies in educational psychology (pp. 59-70). Waltham, MA: Blaisdell Publishing Co.
Hambleton, R.K (2005). The Next Generation of the ITC Test Translation and Adaptation Guidelines. European Journal of Psychological Assessment, 17(3), 164-172.
Huq, S (1989). Item analysis of the five subtests of Stanford Binet intelligence Scale (translated version in Bengali) for use in Bangladesh. AFMR: Proceedings of 9th Asian conference on mental retardation. Thailand Bangkok.
Huq, S. (1992) Determination of Reliability
and Validity of Stanford Binet intelligence Scale and the Construction of Norm for use in Bangladesh
Linn, R. L., & Gronlund, N. E. (2005).
Measurement and assessment in teaching (8th ed.). India: Pearson Education.
Matthews L, (2003). Best Practices and
Technical Issues in Cross-Lingual, Cross-Cultural Assessments: An Evaluation of a Test Adaptation, Ohio University, 232 p.
Oosterhof, A. (1990). Classroom
Applications of Educational Measurements. Merrill, Columbus, OH.
Phelps, R.P. (2008). Educational
achievement testing fallacies, Chapter 3 in R.P. Phelps (Ed.), Correcting fallacies about educational and psychological testing. Washington, DC, USA: American Psychological Association.
Reckase, M. D. (1989). Adaptive testing: The
evolution of a good idea. Educational Measurement: Issues & Practice, 8, 11–15. Roid, G. H. (2003). Stanford-Binet Intelligence Scales. IL: Riverside Publishing.
[62]
Roid, G. H. (2003a). Stanford-Binet Intelligence Scales, Fifth Edition. Itasca, IL: Riverside Publishing.
Schreiner, L. A., & Louis, M. (2006).
Measuring engaged learning in college students: Beyond the borders of NSSE. Paper presented at the annual meeting of the Association for the Study of Higher Education, Anaheim, CA.
Vijer, F.V., & Hambleton, R. K. (1996). Translating tests: some practical guidelines. European Psychologist, 1, 89-99. Vincent, E., Glaub, R., & Kamphaus, W. (2011). Construction of a Nonverbal Adaptation of the Stanford-Binet Fourth Edition. Educational and Psychological Measurement 51(1), 231-241.