Embed Size (px)
Citation preview
ARTICLE IN PRESS
Journal of Network and
Computer Applications 30 (2007) 60–80
1084-8045/$ -
doi:10.1016/j
�CorrespoE-mail ad
davis.edu (A.
www.elsevier.com/locate/jnca
Adaptive anomaly detection withevolving connectionist systems
Yihua Liaoa,�, V. Rao Vemuria,b, Alejandro Pasosb
aDepartment of Computer Science, University of California at Davis, One Shields Avenue,
Davis, CA 95616, USAbDepartment of Applied Science, University of California at Davis, One Shields Avenue,
Davis, CA 95616, USA
Received 28 June 2005; accepted 28 June 2005
Abstract
Anomaly detection holds great potential for detecting previously unknown attacks. In order
to be effective in a practical environment, anomaly detection systems have to be capable of
online learning and handling concept drift. In this paper, a new adaptive anomaly detection
framework, based on the use of unsupervised evolving connectionist systems, is proposed to
address these issues. It is designed to adapt to normal behavior changes while still recognizing
anomalies. The evolving connectionist systems learn a subject’s behavior in an online, adaptive
fashion through efficient local element tuning. Experiments with the KDD Cup 1999 network
data and the Windows NT user profiling data show that our adaptive anomaly detection
systems, based on Fuzzy Adaptive Resonance Theory (ART) and Evolving Fuzzy Neural
Networks (EFuNN), can significantly reduce the false alarm rate while the attack detection
rate remains high.
r 2005 Elsevier Ltd. All rights reserved.
Keywords: Adaptive anomaly detection; Online learning; Concept drift; Evolving connectionist systems;
Fuzzy ART; EFuNN
see front matter r 2005 Elsevier Ltd. All rights reserved.
.jnca.2005.08.005
nding author.
dresses: [email protected] (Y. Liao), [email protected] (V.R. Vemuri), apasos@uc-
Pasos).
ARTICLE IN PRESS
Y. Liao et al. / Journal of Network and Computer Applications 30 (2007) 60–80 61
1. Introduction
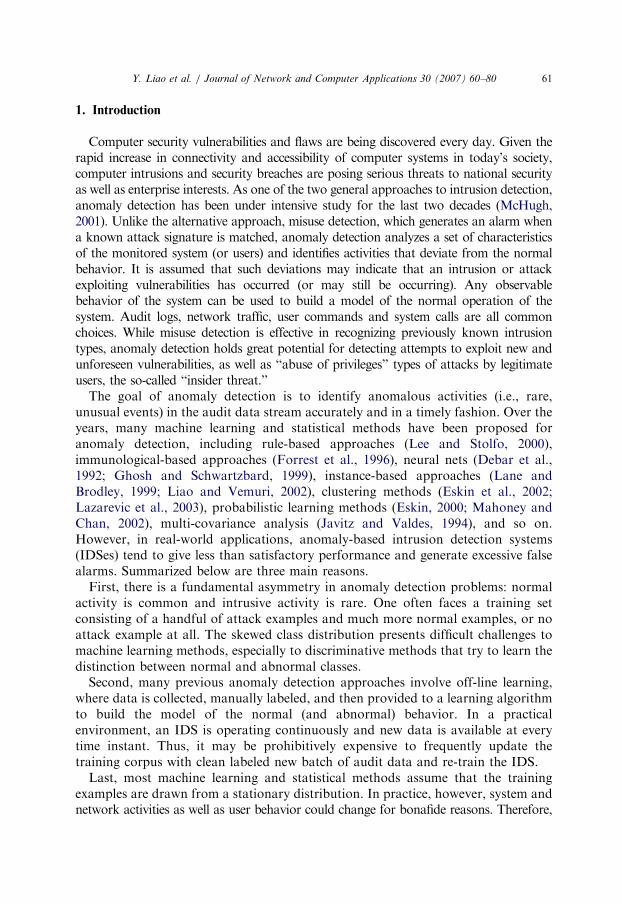
Computer security vulnerabilities and flaws are being discovered every day. Given therapid increase in connectivity and accessibility of computer systems in today’s society,computer intrusions and security breaches are posing serious threats to national securityas well as enterprise interests. As one of the two general approaches to intrusion detection,anomaly detection has been under intensive study for the last two decades (McHugh,2001). Unlike the alternative approach, misuse detection, which generates an alarm whena known attack signature is matched, anomaly detection analyzes a set of characteristicsof the monitored system (or users) and identifies activities that deviate from the normalbehavior. It is assumed that such deviations may indicate that an intrusion or attackexploiting vulnerabilities has occurred (or may still be occurring). Any observablebehavior of the system can be used to build a model of the normal operation of thesystem. Audit logs, network traffic, user commands and system calls are all commonchoices. While misuse detection is effective in recognizing previously known intrusiontypes, anomaly detection holds great potential for detecting attempts to exploit new andunforeseen vulnerabilities, as well as ‘‘abuse of privileges’’ types of attacks by legitimateusers, the so-called ‘‘insider threat.’’
The goal of anomaly detection is to identify anomalous activities (i.e., rare,unusual events) in the audit data stream accurately and in a timely fashion. Over theyears, many machine learning and statistical methods have been proposed foranomaly detection, including rule-based approaches (Lee and Stolfo, 2000),immunological-based approaches (Forrest et al., 1996), neural nets (Debar et al.,1992; Ghosh and Schwartzbard, 1999), instance-based approaches (Lane andBrodley, 1999; Liao and Vemuri, 2002), clustering methods (Eskin et al., 2002;Lazarevic et al., 2003), probabilistic learning methods (Eskin, 2000; Mahoney andChan, 2002), multi-covariance analysis (Javitz and Valdes, 1994), and so on.However, in real-world applications, anomaly-based intrusion detection systems(IDSes) tend to give less than satisfactory performance and generate excessive falsealarms. Summarized below are three main reasons.
First, there is a fundamental asymmetry in anomaly detection problems: normalactivity is common and intrusive activity is rare. One often faces a training setconsisting of a handful of attack examples and much more normal examples, or noattack example at all. The skewed class distribution presents difficult challenges tomachine learning methods, especially to discriminative methods that try to learn thedistinction between normal and abnormal classes.
Second, many previous anomaly detection approaches involve off-line learning,where data is collected, manually labeled, and then provided to a learning algorithmto build the model of the normal (and abnormal) behavior. In a practicalenvironment, an IDS is operating continuously and new data is available at everytime instant. Thus, it may be prohibitively expensive to frequently update thetraining corpus with clean labeled new batch of audit data and re-train the IDS.
Last, most machine learning and statistical methods assume that the trainingexamples are drawn from a stationary distribution. In practice, however, system andnetwork activities as well as user behavior could change for bonafide reasons. Therefore,
ARTICLE IN PRESS
Y. Liao et al. / Journal of Network and Computer Applications 30 (2007) 60–8062
the normal behavior may not be strictly predictable in the long term. This problem,known as concept drift in machine learning literature, presents a significant challenge foranomaly detection. An effective anomaly detection system should be capable of adaptingto normal behavior changes while still recognizing anomalous activities. Otherwise, largeamount of false alarms would be generated if the normal behavior model of the IDS failedto change accordingly to accommodate the new patterns.
In this paper, we present an adaptive anomaly detection framework that are suitable fordynamic, changing environments. Our framework employs unsupervised evolvingconnectionist systems to learn system, network or user behavior in an online, adaptivefashion without a priori knowledge of the underlying non-stationary data distributions.Normal behavior changes are efficiently accommodated while anomalous activities canstill be identified.
Adaptive learning and evolving connectionist systems are an active area of artificialintelligence research. Evolving connectionist systems are artificial neural networks thatresemble the human cognitive information processing models. They are stable enough toretain patterns learned from previously observed data while being flexible enough to learnnew patterns from new incoming data. Due to their self-organizing and adaptive nature,they provide powerful tools for modeling evolving processes and knowledge discovery(Kasabov, 2002).
Our adaptive anomaly detection framework performs one-pass clustering of the inputdata stream that represents a monitored subject’s behavior patterns. Each new incominginstance is assigned to one of the three states: normal, uncertain and anomalous. Twodifferent alarm levels are defined to reduce the risk of false alarming. We evaluated ouradaptive anomaly detection systems, based on the Fuzzy Adaptive Resonance Theory(Fuzzy ART) (Carpenter et al., 1991) and Evolving Fuzzy Neural Networks (EFuNN)(Kasabov, 2001), over two types of data sets, the KDDCup 1999 network data (The thirdinternational knowledge discovery and data mining tools competition (KDD cup 1999)data, 1999) and Windows NT user profiling data. Our experiments show that bothevolving connectionist systems are able to adapt to user or network normal behaviorchanges and at the same time detect anomalous activities. Compared to support vectormachines (SVM)-based static learning, our adaptive anomaly detection systemssignificantly reduced the false alarm rate.
The rest of this paper is organized as follows: in Section 2, we review some related workon adaptive anomaly detection. Section 3 presents our adaptive framework and a briefintroduction to Fuzzy ART and EFuNN. Section 4 details our experiments with theKDD Cup 1999 network data and the Windows NT user profiling data. Section 5contains further discussions. Finally, we summarize our conclusions and future work inSection 6.
2. Related work
To handle concept drift and non-stationary data distributions, a common practice is toforget out-of-data statistics of the data and favor recent events using a decay or agingfactor. For example, NIDES (Javitz and Valdes, 1994) compares a user’s short-term
ARTICLE IN PRESS
Y. Liao et al. / Journal of Network and Computer Applications 30 (2007) 60–80 63
behavior to the user’s long-term behavior. The user profiles keep statistics such asfrequency table, means and covariance, which are constantly aged by multiplying them byan exponential decay factors. This method of aging creates a moving time window for theprofile data, so that the new behavior is only compared to the most recently observedbehaviors that fall into the time window. Similarly, SmartSifter (Yamanishi et al., 2004)employs discounting algorithms to gradually fade the effect of past examples. Mahoneyand Chan (2002) took training decay to the extreme by discarding all events before themost recent occurrence. There is one theoretical and one practical problem with this agingor time window approach. Theoretically, no justification has been provided for theassumption that a user’s behavior changes gradually. Notwithstanding this theoreticalgap, the decay factor is usually chosen in an ad hoc manner. By contrast, our evolvingconnectionist systems are able to adapt to normal behavior changes without losing earlierinformation.
There were a few other previous efforts on adaptive intrusion detection. Teng et al.(1990) proposed a time-based inductive learning approach to perform adaptive real-timeanomaly detection. Sequential rules were generated dynamically to adapt to changes in auser’s behavior. Lane and Brodley (1998) proposed a nearest-neighbor classifiers-basedonline learning scheme and examined the issues of incremental updating of systemparameters and instance selection. Finite mixture models were employed in Eskin et al.(2000) to generate adaptive probabilistic models and detect anomalies within a data set.Fan (2001) used ensembles of classification models to adapt existing models in order todetect newly established patterns. Hossain and Bridges (2001) proposed a fuzzyassociation rule mining architecture for adaptive anomaly detection.
Compared to previous statistical and rule-learning-based adaptive anomalydetection systems, our framework does not require a priori knowledge of theunderlying data distributions. Through the use of evolving connectionist systems, itprovides efficient adaptation to new patterns in a dynamic environment. Unlikeother neural networks that have been applied to intrusion detection (e.g., Debar etal. (1992); Ghosh and Schwartzbard (1999)) as ‘‘black boxes,’’ our evolvingconnectionist systems can provide knowledge (i.e., the weight vectors) to ‘‘explain’’the learned normal behavior patterns.
Our approach also falls into the category of unsupervised anomaly detection (Eskin etal., 2002; Lazarevic et al., 2003) as it does not require the knowledge of data labels.However, our algorithms assign each instance into a cluster in an online, adaptive mode.No distinction between training and testing has to be made. Therefore, the period ofsystem initialization during which all behaviors are assumed normal is not necessary.
Another research project closely related to ours is ADMIT (Sequeira and Zaki,2002), which uses semi-incremental clustering techniques to create user profiles.Different types of alarms are also introduced.
3. Adaptive anomaly detection framework
In addressing the problem of adaptive anomaly detection two fundamentalquestions arise: (a) How to generate a model or profile that can concisely describe a
ARTICLE IN PRESS
Y. Liao et al. / Journal of Network and Computer Applications 30 (2007) 60–8064
subject’s normal behavior, and more importantly, can it be updated efficiently toaccommodate new behavior patterns? (b) How to select instances to update themodel without introducing noise and incorporating abnormal patterns as normal?Our adaptive anomaly detection framework addresses these issues through the use ofonline unsupervised learning methods, under the assumption that normal instancescluster together in the input space, whereas the anomalous activities correspond tooutliers that lie in sparse regions of the input space. Our framework is general in thatthe underlying clustering method can be any online unsupervised evolvingconnectionist system and it can be used for different types of audit data. Withoutloss of generality, we assume the audit data that is continuously fed into the adaptiveanomaly detection system has been transformed into a stream of input vectors afterpre-processing, where the input features describe the monitored subject’s behavior.
The evolving connectionist systems are designed for modeling evolving processes.They operate continuously in time and adapt their structure and functionalitythrough a continuous interaction with the environment (Kasabov, 2002). They canlearn in unsupervised, supervised or reinforcement learning modes. The onlineunsupervised evolving connectionist systems provide one-pass clustering of an inputdata stream, where there is no predefined number of different clusters that the databelong to.
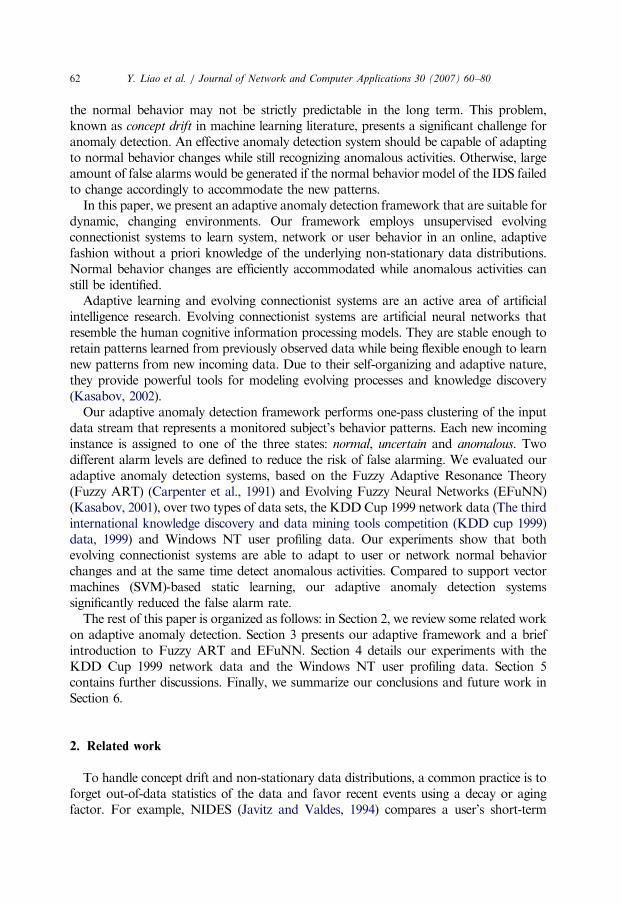
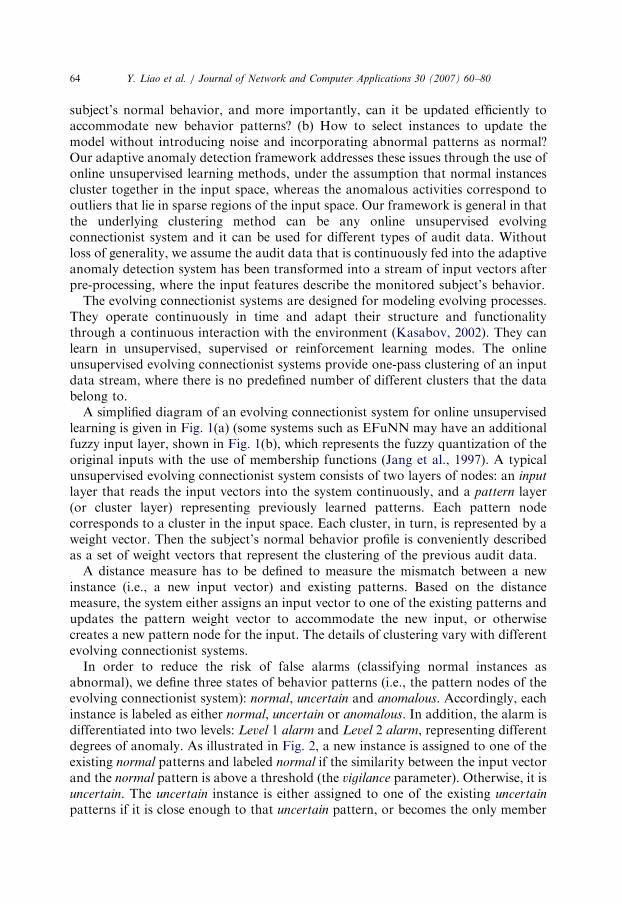
A simplified diagram of an evolving connectionist system for online unsupervisedlearning is given in Fig. 1(a) (some systems such as EFuNN may have an additionalfuzzy input layer, shown in Fig. 1(b), which represents the fuzzy quantization of theoriginal inputs with the use of membership functions (Jang et al., 1997). A typicalunsupervised evolving connectionist system consists of two layers of nodes: an input
layer that reads the input vectors into the system continuously, and a pattern layer(or cluster layer) representing previously learned patterns. Each pattern nodecorresponds to a cluster in the input space. Each cluster, in turn, is represented by aweight vector. Then the subject’s normal behavior profile is conveniently describedas a set of weight vectors that represent the clustering of the previous audit data.
A distance measure has to be defined to measure the mismatch between a newinstance (i.e., a new input vector) and existing patterns. Based on the distancemeasure, the system either assigns an input vector to one of the existing patterns andupdates the pattern weight vector to accommodate the new input, or otherwisecreates a new pattern node for the input. The details of clustering vary with differentevolving connectionist systems.
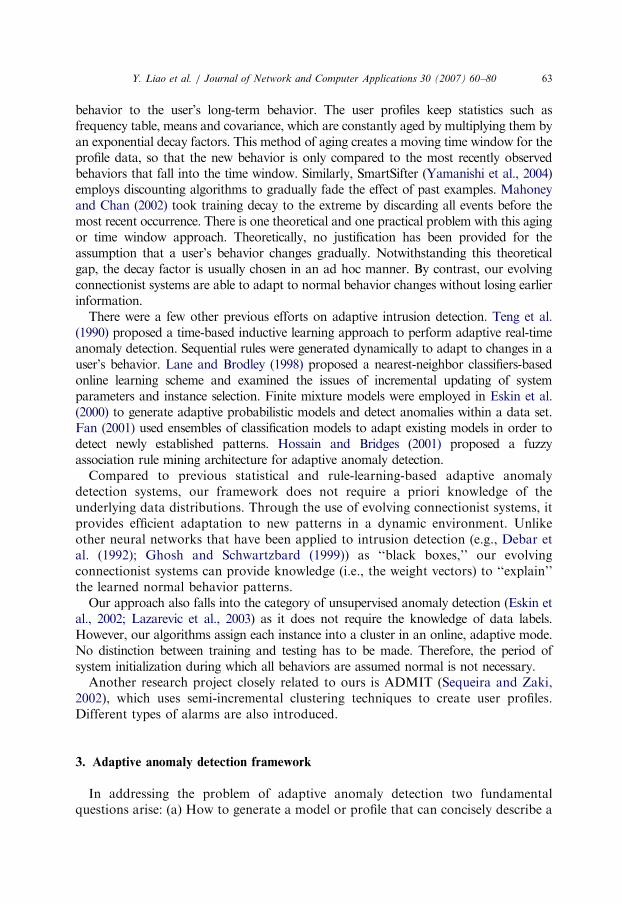
In order to reduce the risk of false alarms (classifying normal instances asabnormal), we define three states of behavior patterns (i.e., the pattern nodes of theevolving connectionist system): normal, uncertain and anomalous. Accordingly, eachinstance is labeled as either normal, uncertain or anomalous. In addition, the alarm isdifferentiated into two levels: Level 1 alarm and Level 2 alarm, representing differentdegrees of anomaly. As illustrated in Fig. 2, a new instance is assigned to one of theexisting normal patterns and labeled normal if the similarity between the input vectorand the normal pattern is above a threshold (the vigilance parameter). Otherwise, it isuncertain. The uncertain instance is either assigned to one of the existing uncertain
patterns if it is close enough to that uncertain pattern, or becomes the only member
ARTICLE IN PRESS
W1 W2
Input Stream
X1 X2 X3 X4 Xn
Input Layer
Pattern LayerWm
W1 W2
X1 X2 Xn
Input Layer
Pattern LayerWm
Fuzzy Input
(a)
(b)
Fig. 1. (a) A simplified diagram of an evolving connectionist system for unsupervised learning. The system
has n input nodes and m pattern nodes. There is a connection from each input node to every pattern node.
Some connections are not shown in the figure. (b) An evolving connectionist system that has an additional
fuzzy input layer. The task of the fuzzy input nodes is to transfer the input values into membership
degrees.
Y. Liao et al. / Journal of Network and Computer Applications 30 (2007) 60–80 65
of a new uncertain pattern. A Level 1 alarm is triggered whenever a new uncertain
pattern is created as the new instance is different from all the learned patterns andthus deserves special attention. At this point, some preliminary security measuresneed to be taken. However, one cannot draw a final conclusion yet. The new instancecan be truly anomalous or merely the beginning of a new normal behavior pattern,which will be determined by the subsequent instances. After the processing of acertain number (the Nwatch parameter) of the subsequent instances in the samemanner, if the number of members of an uncertain pattern reaches a threshold value(the Mincount parameter), the uncertain pattern becomes a normal pattern and thelabels of all its members are changed from uncertain to normal. This indicates that anew behavior pattern has been developed and incorporated into the subject’s normalbehavior profile as enough instances have shown the same pattern. On the otherhand, after Nwatch subsequent instances, any uncertain pattern with less than Mincount
members will be destroyed and all its members are labeled anomalous. This will make

ARTICLE IN PRESS
Fig. 2. Pseudo-code for adaptive anomaly detection.
Y. Liao et al. / Journal of Network and Computer Applications 30 (2007) 60–8066
sure that anomalous patterns, corresponding to the sparse regions in the input space,will not be included into the normal profile. A Level 2 alarm is issued when aninstance is labeled anomalous and further response actions are expected.
The main tunable parameters of an adaptive anomaly detection system aresummarized as follows:
�
Vigilance r: This threshold controls the degree of mismatch between newinstances and existing patterns that the system can tolerate. � Learning rate b: It determines how fast the system should adapt to a new instancewhen it is assigned to a pattern. � Nwatch: It is the period that the system will wait before making a decision on anewly created uncertain pattern. � Mincount: The minimum number of members that an uncertain pattern should havein order to be recognized as a normal pattern.Our framework does not require a priori knowledge of the number of inputfeatures. When a new input feature is presented, the system simply adds a new inputnode to the input layer and connections from this newly created input node to theexisting pattern nodes. This can be very important when the features that describe asubject’s behavior grow over time and cannot be foreseen in a dynamic environment.Similarly, accommodation of a new pattern is efficiently realized by creating a newpattern node and adding connections from input nodes to this new pattern node. Therest of the structure remains the same.
With the framework, the learned normal profile is expressed as a set of weightvectors representing the coordinates of the cluster centers in the input space. These

ARTICLE IN PRESS
Y. Liao et al. / Journal of Network and Computer Applications 30 (2007) 60–80 67
weight vectors can be interpreted as a knowledge presentation that can be used todescribe the subject’s behavior patterns, and thus they can facilitate understanding ofthe subject’s behavior. The weight vectors are stored in the long-term memory of theconnectionist systems. Since new instances are compared to all previously learnedpatterns, recurring activities would be recognized easily.
While the underlying clustering method of the adaptive anomaly detectionframework can be any unsupervised evolving connectionist system, Fuzzy ART andthe unsupervised learning version of EFuNN are adapted for anomaly detection inthis paper. Both of them are conceptually simple and computationally fast.Furthermore, they cope well with fuzzy data, and the fuzzy distance measures helpto smooth the abrupt separation of normality and abnormality of a subject’sbehavior. Below is a brief introduction to Fuzzy ART and EFuNN.
3.1. Fuzzy ART
Fuzzy ART (Carpenter et al., 1991) is a member of the ART neural networkfamily (Carpenter and Grossberg, 1991). It incorporates computations from fuzzyset theory (Jang et al., 1997) into the ART 1 neural network. It is capable of faststable unsupervised category learning and pattern recognition in response toarbitrary input sequences.
Fuzzy ART clusters input vectors into patterns based on two separate distancecriteria, match and choice. For input vector X and pattern j, the match function isdefined by
SjðX Þ ¼jX ^W jj
jX j, (1)
where W j is the weight vector associated with pattern j. Here, the fuzzy ANDoperator ^ is defined by
ðX ^ Y Þi � minðxi; yiÞ (2)
and the norm j � j is defined by
jX j �X
i
jxij. (3)
The choice function is defined by
TjðX Þ ¼jX ^W jj
aþ jW jj, (4)
where a is a small constant.For each input vector X , Fuzzy ART assigns it to the pattern j that maximizes
TjðX Þ while satisfying SjðX ÞXr, where r is the vigilance parameter, 0prp1. Theweight vector W j is then updated according to
WðnewÞj ¼ bðX ^W
ðoldÞj Þ þ ð1� bÞW ðoldÞ
j , (5)
ARTICLE IN PRESS
Initialize weights: Wji = 1.0
Read Input vector: X = (X1, X2, ƒ, Xn)
Calculate choice function Tj(X)
max (Tj)
Sj(X) > = ρ
Update weight Wj
Reset allTJ
Reset Tj = 0
Create new pattern
Yes Yes
No
No
Fig. 3. Flow graph representation of the Fuzzy ART algorithm.
Y. Liao et al. / Journal of Network and Computer Applications 30 (2007) 60–8068
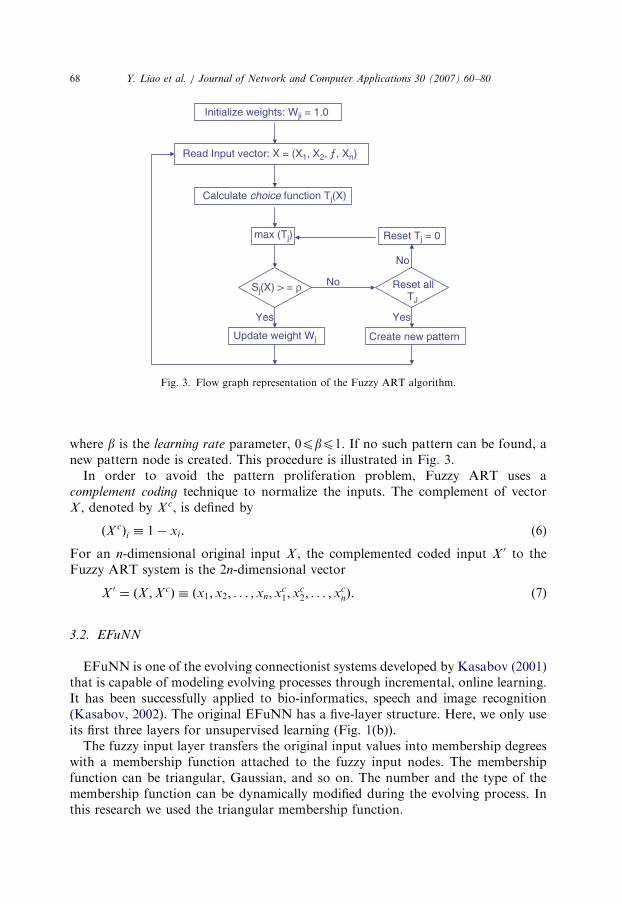
where b is the learning rate parameter, 0pbp1. If no such pattern can be found, anew pattern node is created. This procedure is illustrated in Fig. 3.
In order to avoid the pattern proliferation problem, Fuzzy ART uses acomplement coding technique to normalize the inputs. The complement of vectorX , denoted by X c, is defined by
ðX cÞi � 1� xi. (6)
For an n-dimensional original input X , the complemented coded input X 0 to theFuzzy ART system is the 2n-dimensional vector
X 0 ¼ ðX ;X cÞ � ðx1;x2; . . . ; xn; xc1;x
c2; . . . ; x
cnÞ. (7)
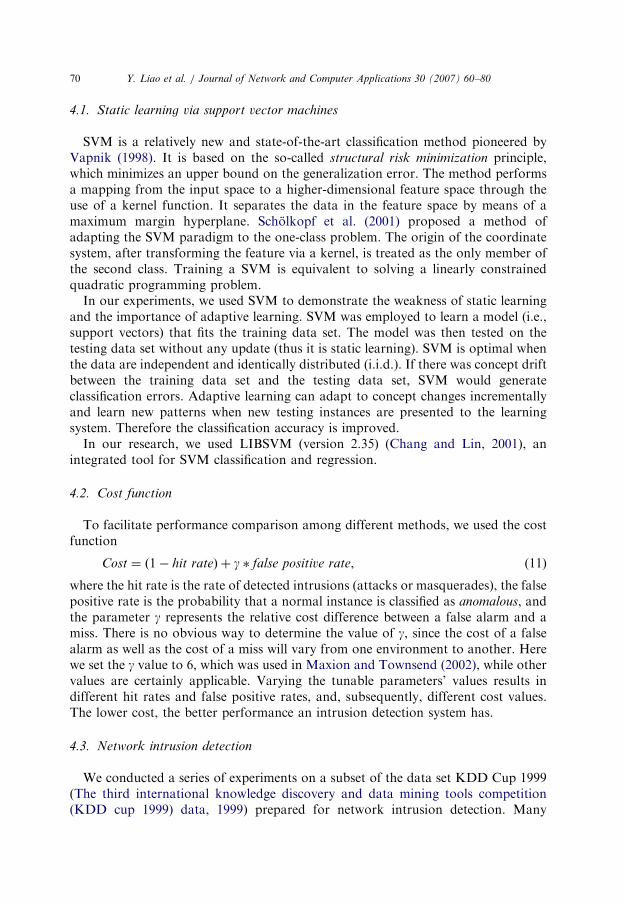
3.2. EFuNN
EFuNN is one of the evolving connectionist systems developed by Kasabov (2001)that is capable of modeling evolving processes through incremental, online learning.It has been successfully applied to bio-informatics, speech and image recognition(Kasabov, 2002). The original EFuNN has a five-layer structure. Here, we only useits first three layers for unsupervised learning (Fig. 1(b)).
The fuzzy input layer transfers the original input values into membership degreeswith a membership function attached to the fuzzy input nodes. The membershipfunction can be triangular, Gaussian, and so on. The number and the type of themembership function can be dynamically modified during the evolving process. Inthis research we used the triangular membership function.

ARTICLE IN PRESS
Y. Liao et al. / Journal of Network and Computer Applications 30 (2007) 60–80 69
Unlike Fuzzy ART, EFuNN groups input vectors into patterns based on onedistance measure only, the local normalized fuzzy distance between a fuzzy inputvector X f and a weight vector W j associated with pattern j, which is defined by
DðX f ;W jÞ ¼jX f �W jj
jX f þW jj, (8)
where j � j denotes the same vector norm defined in Fuzzy ART. The localnormalized fuzzy distance between any two fuzzy membership vectors is within therange of ½0; 1�.
The rest of the clustering algorithm of EFuNN is very similar to that of FuzzyART. When a new input vector X is presented, EFuNN calculates the correspondingfuzzy input vector X f and evaluates the normalized fuzzy distance between X f andthe existing pattern weight vectors. The activation of the pattern node layer A is thencalculated. The activation of a single pattern node j is defined by
AðjÞ ¼ f ðDðX f ;W jÞÞ, (9)
where f can be a simple linear function, for example, AðjÞ ¼ 1�DðX f ;W jÞ. EFuNNfinds the closest pattern node j to the fuzzy input vector that has the highestactivation value AðjÞ. If AðjÞXr, where r is the vigilance parameter (the originalEFuNN paper named it sensitivity threshold (Kasabov, 2001)), the new input isassigned to the jth pattern and the weight vector W j is updated according to thefollowing vector operation:
WðnewÞj ¼W
ðoldÞj þ bðX f �W
ðoldÞj Þ, (10)
where b is the learning rate. Otherwise, a new pattern node is created toaccommodate the current instance X .
The parameters r and b can be static, or they can be self-adjustable while thestructure of EFuNN evolves. They can hold the same values for all the patterns, orthey can be pattern-specific so that the pattern node that has more instance memberswill change less when it accommodates a new instance. In our early implementation,all the pattern nodes share the same static r and b values.
4. Experiments
In this section we describe some experiments. The emphasis of the experiments ison the understanding of how Fuzzy ART and EFuNN-based adaptive anomalydetection systems work in practice. One objective of our experiments is to observethe influence of variability of the tunable parameters on the performance of ananomaly detection system. Another objective of the experiments is to compare SVM-based static learning and evolving connectionist system-based adaptive learning.
ARTICLE IN PRESS
Y. Liao et al. / Journal of Network and Computer Applications 30 (2007) 60–8070
4.1. Static learning via support vector machines
SVM is a relatively new and state-of-the-art classification method pioneered byVapnik (1998). It is based on the so-called structural risk minimization principle,which minimizes an upper bound on the generalization error. The method performsa mapping from the input space to a higher-dimensional feature space through theuse of a kernel function. It separates the data in the feature space by means of amaximum margin hyperplane. Scholkopf et al. (2001) proposed a method ofadapting the SVM paradigm to the one-class problem. The origin of the coordinatesystem, after transforming the feature via a kernel, is treated as the only member ofthe second class. Training a SVM is equivalent to solving a linearly constrainedquadratic programming problem.
In our experiments, we used SVM to demonstrate the weakness of static learningand the importance of adaptive learning. SVM was employed to learn a model (i.e.,support vectors) that fits the training data set. The model was then tested on thetesting data set without any update (thus it is static learning). SVM is optimal whenthe data are independent and identically distributed (i.i.d.). If there was concept driftbetween the training data set and the testing data set, SVM would generateclassification errors. Adaptive learning can adapt to concept changes incrementallyand learn new patterns when new testing instances are presented to the learningsystem. Therefore the classification accuracy is improved.
In our research, we used LIBSVM (version 2.35) (Chang and Lin, 2001), anintegrated tool for SVM classification and regression.
4.2. Cost function
To facilitate performance comparison among different methods, we used the costfunction
Cost ¼ ð1� hit rateÞ þ g � false positive rate, (11)
where the hit rate is the rate of detected intrusions (attacks or masquerades), the falsepositive rate is the probability that a normal instance is classified as anomalous, andthe parameter g represents the relative cost difference between a false alarm and amiss. There is no obvious way to determine the value of g, since the cost of a falsealarm as well as the cost of a miss will vary from one environment to another. Herewe set the g value to 6, which was used in Maxion and Townsend (2002), while othervalues are certainly applicable. Varying the tunable parameters’ values results indifferent hit rates and false positive rates, and, subsequently, different cost values.The lower cost, the better performance an intrusion detection system has.
4.3. Network intrusion detection
We conducted a series of experiments on a subset of the data set KDD Cup 1999(The third international knowledge discovery and data mining tools competition(KDD cup 1999) data, 1999) prepared for network intrusion detection. Many

ARTICLE IN PRESS
Y. Liao et al. / Journal of Network and Computer Applications 30 (2007) 60–80 71
methods have been tested with this popular data set for supervised intrusiondetection. The data labels were usually used for training the learning systems. Ourevolving connectionist systems, however, do not rely on the data labels. They buildnetwork connection patterns incrementally in an online unsupervised learning mode.Therefore, they are not directly comparable to previously proposed supervisedlearning methods.
The 1999 KDD Cup network traffic data are connection-based. Each data record,described by 7 symbolic attributes and 34 continuous attributes, corresponds to aTCP/IP connection between two IP addresses. In addition, a label is providedindicating whether the record is normal or it belongs one of the four attack types(Probe, DoS, U2R and R2L). The symbolic attributes that have two possible values(e.g., logged_in) were represented by a binary entry with the value of 0 or 1. Forsymbolic attributes that have more than two possible categorical values, we usedmultiple entries to encode them in the vector representation, one entry for eachpossible value. The entry corresponding to the category value has a value of 1 whilethe other entries are set to 0. The attribute service has 41 types, and we furtherclassified them into {http, smtp, ftp, ftp_data, others} to reduce the vectordimensions. The resulting feature vectors have a total of 57 dimensions.
Since different continuous attributes were measured on very different scales,the effect of some attributes might be completely dwarfed by others that havelarger scales. Therefore, we scaled the attributes to the range of ½0; 1� bycalculating
X i ¼vi �minðviÞ
maxðviÞ �minðviÞ, (12)
where vi is the actual value of attribute i, and the maximum and minimum are takenover the whole data set. However, we are aware that this scaling technique would notwork if the maximum and minimum values are not known a priori.
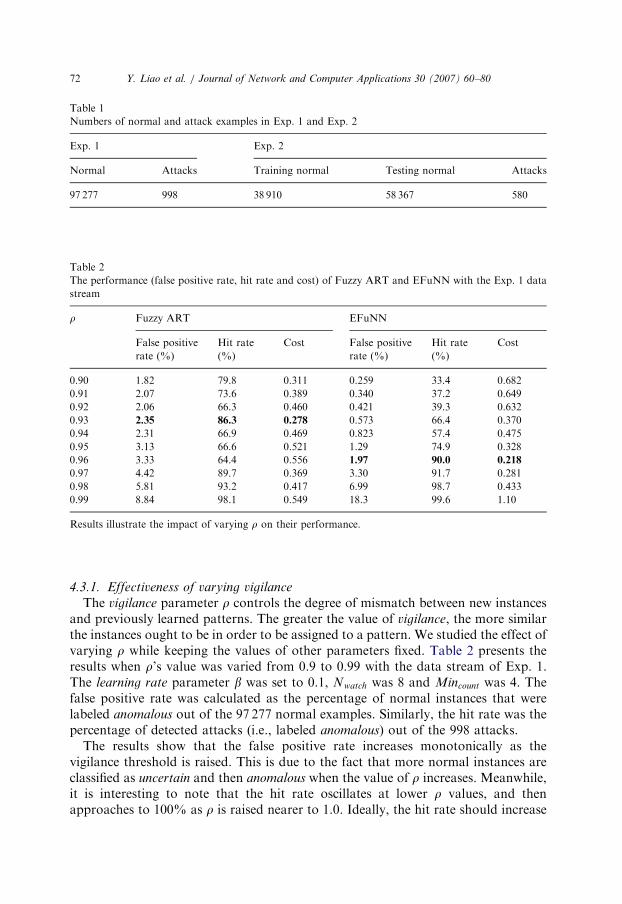
We formed a subset of the original data set consisting of 97 277normal connections and 9199 attacks by randomly sampling. We then conductedtwo experiments with this subset. The first experiment (Exp. 1) was designedto test our evolving connectionist systems. In the data stream of Exp. 1, the attackexamples randomly drawn from the 9199 attacks were inserted into the97 277 normal examples with a 1% probability. Fuzzy ART and EFuNNwere employed to model the network connections on the fly from an empty set ofnormal patterns and detect the intrusions in the data stream. For thesecond experiment (Exp. 2), the training data set and testing data set wereformed to compare the performance between static learning and adaptive learning.The first 40% of the 97 277 normal examples were used for training, and the rest fortesting. The testing data set also included attacks interspersed into the normalexamples with the probability of 1%. The model learned from the training exampleswas applied to the testing data set. The model remained unchanged during thetesting process for static learning, while it was updated continuously for adaptivelearning methods. Table 1 lists the numbers of normal and attack examples in Exp. 1and Exp. 2.
ARTICLE IN PRESS
Table 1
Numbers of normal and attack examples in Exp. 1 and Exp. 2
Exp. 1 Exp. 2
Normal Attacks Training normal Testing normal Attacks
97 277 998 38 910 58 367 580
Table 2
The performance (false positive rate, hit rate and cost) of Fuzzy ART and EFuNN with the Exp. 1 data
stream
r Fuzzy ART EFuNN
False positive
rate (%)
Hit rate
(%)
Cost False positive
rate (%)
Hit rate
(%)
Cost
0.90 1.82 79.8 0.311 0.259 33.4 0.682
0.91 2.07 73.6 0.389 0.340 37.2 0.649
0.92 2.06 66.3 0.460 0.421 39.3 0.632
0.93 2.35 86.3 0.278 0.573 66.4 0.370
0.94 2.31 66.9 0.469 0.823 57.4 0.475
0.95 3.13 66.6 0.521 1.29 74.9 0.328
0.96 3.33 64.4 0.556 1.97 90.0 0.218
0.97 4.42 89.7 0.369 3.30 91.7 0.281
0.98 5.81 93.2 0.417 6.99 98.7 0.433
0.99 8.84 98.1 0.549 18.3 99.6 1.10
Results illustrate the impact of varying r on their performance.
Y. Liao et al. / Journal of Network and Computer Applications 30 (2007) 60–8072
4.3.1. Effectiveness of varying vigilance
The vigilance parameter r controls the degree of mismatch between new instancesand previously learned patterns. The greater the value of vigilance, the more similarthe instances ought to be in order to be assigned to a pattern. We studied the effect ofvarying r while keeping the values of other parameters fixed. Table 2 presents theresults when r’s value was varied from 0.9 to 0.99 with the data stream of Exp. 1.The learning rate parameter b was set to 0.1, Nwatch was 8 and Mincount was 4. Thefalse positive rate was calculated as the percentage of normal instances that werelabeled anomalous out of the 97 277 normal examples. Similarly, the hit rate was thepercentage of detected attacks (i.e., labeled anomalous) out of the 998 attacks.
The results show that the false positive rate increases monotonically as thevigilance threshold is raised. This is due to the fact that more normal instances areclassified as uncertain and then anomalous when the value of r increases. Meanwhile,it is interesting to note that the hit rate oscillates at lower r values, and thenapproaches to 100% as r is raised nearer to 1.0. Ideally, the hit rate should increase
ARTICLE IN PRESS
Y. Liao et al. / Journal of Network and Computer Applications 30 (2007) 60–80 73
monotonically as well. Its oscillation may suggest the abnormality of the data. Thecost of Fuzzy ART reaches the lowest value at r ¼ 0:93 with a false positive rate of2.35% and hit rate of 86.3%. For EFuNN, the lowest cost is obtained at r ¼ 0:96while the hit rate is 90% and the false positive rate is as low as 1.97% (values inbold).
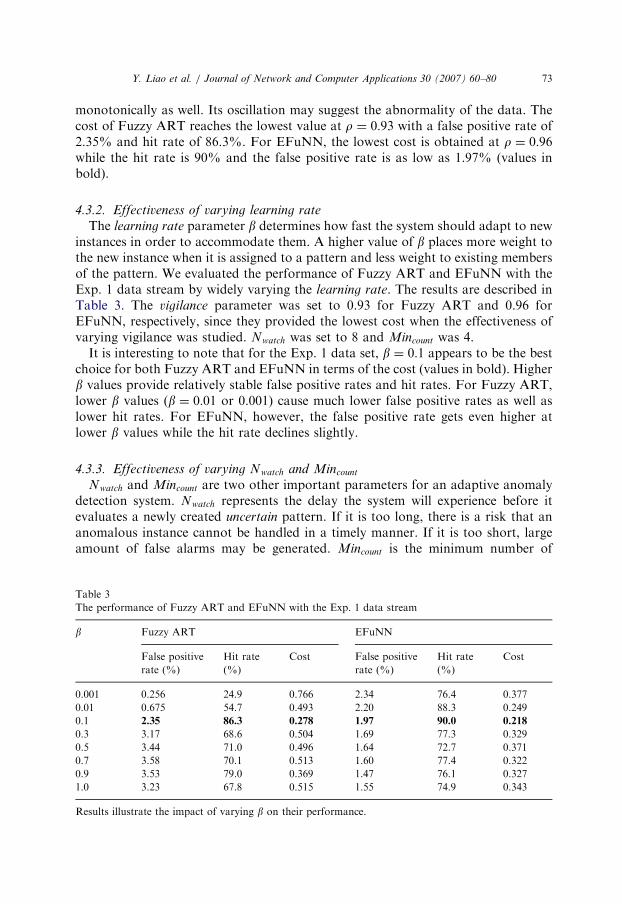
4.3.2. Effectiveness of varying learning rate
The learning rate parameter b determines how fast the system should adapt to newinstances in order to accommodate them. A higher value of b places more weight tothe new instance when it is assigned to a pattern and less weight to existing membersof the pattern. We evaluated the performance of Fuzzy ART and EFuNN with theExp. 1 data stream by widely varying the learning rate. The results are described inTable 3. The vigilance parameter was set to 0.93 for Fuzzy ART and 0.96 forEFuNN, respectively, since they provided the lowest cost when the effectiveness ofvarying vigilance was studied. Nwatch was set to 8 and Mincount was 4.
It is interesting to note that for the Exp. 1 data set, b ¼ 0:1 appears to be the bestchoice for both Fuzzy ART and EFuNN in terms of the cost (values in bold). Higherb values provide relatively stable false positive rates and hit rates. For Fuzzy ART,lower b values (b ¼ 0:01 or 0.001) cause much lower false positive rates as well aslower hit rates. For EFuNN, however, the false positive rate gets even higher atlower b values while the hit rate declines slightly.
4.3.3. Effectiveness of varying Nwatch and Mincount
Nwatch and Mincount are two other important parameters for an adaptive anomalydetection system. Nwatch represents the delay the system will experience before itevaluates a newly created uncertain pattern. If it is too long, there is a risk that ananomalous instance cannot be handled in a timely manner. If it is too short, largeamount of false alarms may be generated. Mincount is the minimum number of
Table 3
The performance of Fuzzy ART and EFuNN with the Exp. 1 data stream
b Fuzzy ART EFuNN
False positive
rate (%)
Hit rate
(%)
Cost False positive
rate (%)
Hit rate
(%)
Cost
0.001 0.256 24.9 0.766 2.34 76.4 0.377
0.01 0.675 54.7 0.493 2.20 88.3 0.249
0.1 2.35 86.3 0.278 1.97 90.0 0.218
0.3 3.17 68.6 0.504 1.69 77.3 0.329
0.5 3.44 71.0 0.496 1.64 72.7 0.371
0.7 3.58 70.1 0.513 1.60 77.4 0.322
0.9 3.53 79.0 0.369 1.47 76.1 0.327
1.0 3.23 67.8 0.515 1.55 74.9 0.343
Results illustrate the impact of varying b on their performance.
ARTICLE IN PRESS
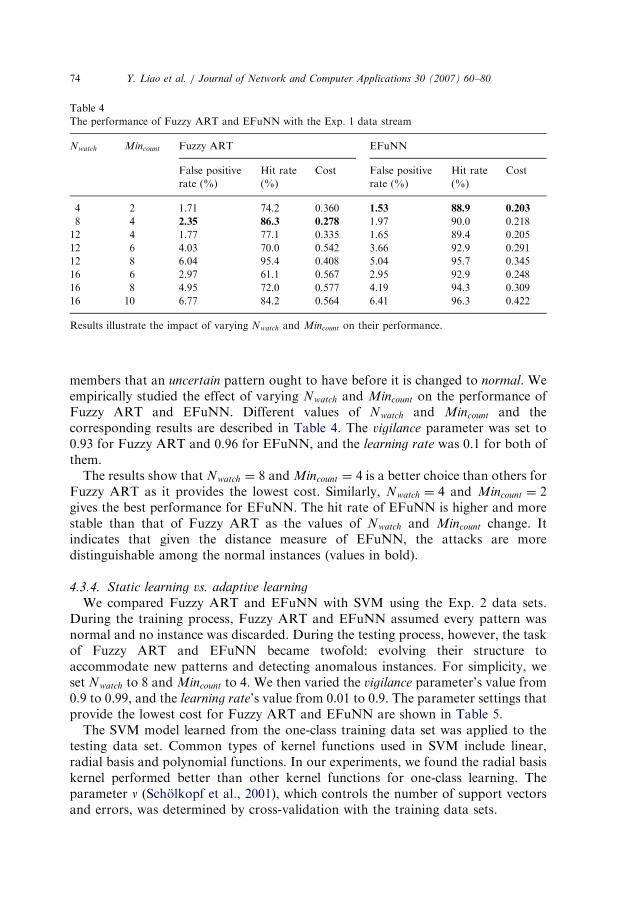
Table 4
The performance of Fuzzy ART and EFuNN with the Exp. 1 data stream
Nwatch Mincount Fuzzy ART EFuNN
False positive
rate (%)
Hit rate
(%)
Cost False positive
rate (%)
Hit rate
(%)
Cost
4 2 1.71 74.2 0.360 1.53 88.9 0.203
8 4 2.35 86.3 0.278 1.97 90.0 0.218
12 4 1.77 77.1 0.335 1.65 89.4 0.205
12 6 4.03 70.0 0.542 3.66 92.9 0.291
12 8 6.04 95.4 0.408 5.04 95.7 0.345
16 6 2.97 61.1 0.567 2.95 92.9 0.248
16 8 4.95 72.0 0.577 4.19 94.3 0.309
16 10 6.77 84.2 0.564 6.41 96.3 0.422
Results illustrate the impact of varying Nwatch and Mincount on their performance.
Y. Liao et al. / Journal of Network and Computer Applications 30 (2007) 60–8074
members that an uncertain pattern ought to have before it is changed to normal. Weempirically studied the effect of varying Nwatch and Mincount on the performance ofFuzzy ART and EFuNN. Different values of Nwatch and Mincount and thecorresponding results are described in Table 4. The vigilance parameter was set to0.93 for Fuzzy ART and 0.96 for EFuNN, and the learning rate was 0.1 for both ofthem.
The results show that Nwatch ¼ 8 and Mincount ¼ 4 is a better choice than others forFuzzy ART as it provides the lowest cost. Similarly, Nwatch ¼ 4 and Mincount ¼ 2gives the best performance for EFuNN. The hit rate of EFuNN is higher and morestable than that of Fuzzy ART as the values of Nwatch and Mincount change. Itindicates that given the distance measure of EFuNN, the attacks are moredistinguishable among the normal instances (values in bold).
4.3.4. Static learning vs. adaptive learning
We compared Fuzzy ART and EFuNN with SVM using the Exp. 2 data sets.During the training process, Fuzzy ART and EFuNN assumed every pattern wasnormal and no instance was discarded. During the testing process, however, the taskof Fuzzy ART and EFuNN became twofold: evolving their structure toaccommodate new patterns and detecting anomalous instances. For simplicity, weset Nwatch to 8 and Mincount to 4. We then varied the vigilance parameter’s value from0.9 to 0.99, and the learning rate’s value from 0.01 to 0.9. The parameter settings thatprovide the lowest cost for Fuzzy ART and EFuNN are shown in Table 5.
The SVM model learned from the one-class training data set was applied to thetesting data set. Common types of kernel functions used in SVM include linear,radial basis and polynomial functions. In our experiments, we found the radial basiskernel performed better than other kernel functions for one-class learning. Theparameter n (Scholkopf et al., 2001), which controls the number of support vectorsand errors, was determined by cross-validation with the training data sets.
ARTICLE IN PRESS
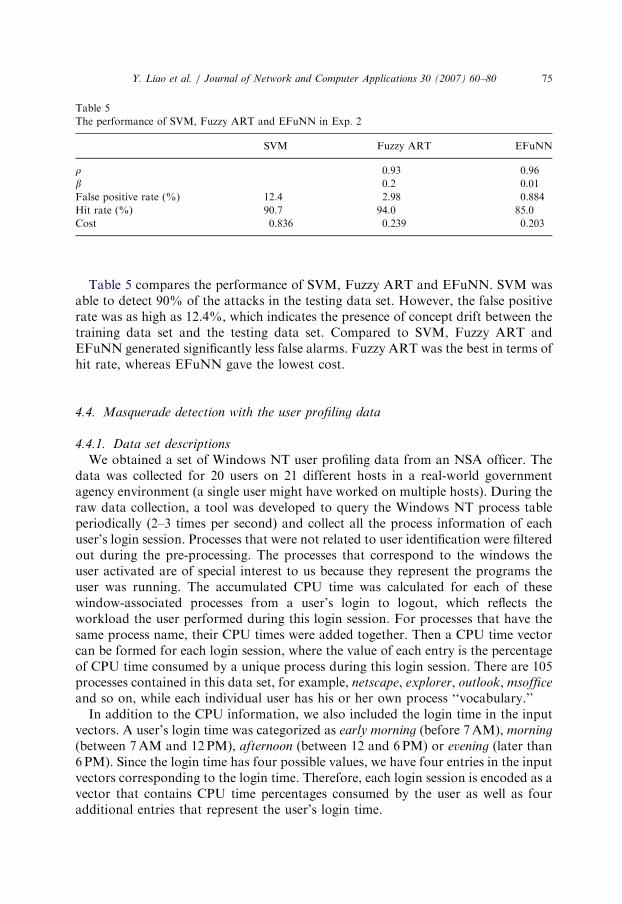
Table 5
The performance of SVM, Fuzzy ART and EFuNN in Exp. 2
SVM Fuzzy ART EFuNN
r 0.93 0.96
b 0.2 0.01
False positive rate (%) 12.4 2.98 0.884
Hit rate (%) 90.7 94.0 85.0
Cost 0.836 0.239 0.203
Y. Liao et al. / Journal of Network and Computer Applications 30 (2007) 60–80 75
Table 5 compares the performance of SVM, Fuzzy ART and EFuNN. SVM wasable to detect 90% of the attacks in the testing data set. However, the false positiverate was as high as 12.4%, which indicates the presence of concept drift between thetraining data set and the testing data set. Compared to SVM, Fuzzy ART andEFuNN generated significantly less false alarms. Fuzzy ART was the best in terms ofhit rate, whereas EFuNN gave the lowest cost.
4.4. Masquerade detection with the user profiling data
4.4.1. Data set descriptions
We obtained a set of Windows NT user profiling data from an NSA officer. Thedata was collected for 20 users on 21 different hosts in a real-world governmentagency environment (a single user might have worked on multiple hosts). During theraw data collection, a tool was developed to query the Windows NT process tableperiodically (2–3 times per second) and collect all the process information of eachuser’s login session. Processes that were not related to user identification were filteredout during the pre-processing. The processes that correspond to the windows theuser activated are of special interest to us because they represent the programs theuser was running. The accumulated CPU time was calculated for each of thesewindow-associated processes from a user’s login to logout, which reflects theworkload the user performed during this login session. For processes that have thesame process name, their CPU times were added together. Then a CPU time vectorcan be formed for each login session, where the value of each entry is the percentageof CPU time consumed by a unique process during this login session. There are 105processes contained in this data set, for example, netscape, explorer, outlook, msoffice
and so on, while each individual user has his or her own process ‘‘vocabulary.’’In addition to the CPU information, we also included the login time in the input
vectors. A user’s login time was categorized as early morning (before 7AM), morning
(between 7AM and 12 PM), afternoon (between 12 and 6PM) or evening (later than6PM). Since the login time has four possible values, we have four entries in the inputvectors corresponding to the login time. Therefore, each login session is encoded as avector that contains CPU time percentages consumed by the user as well as fouradditional entries that represent the user’s login time.
ARTICLE IN PRESS
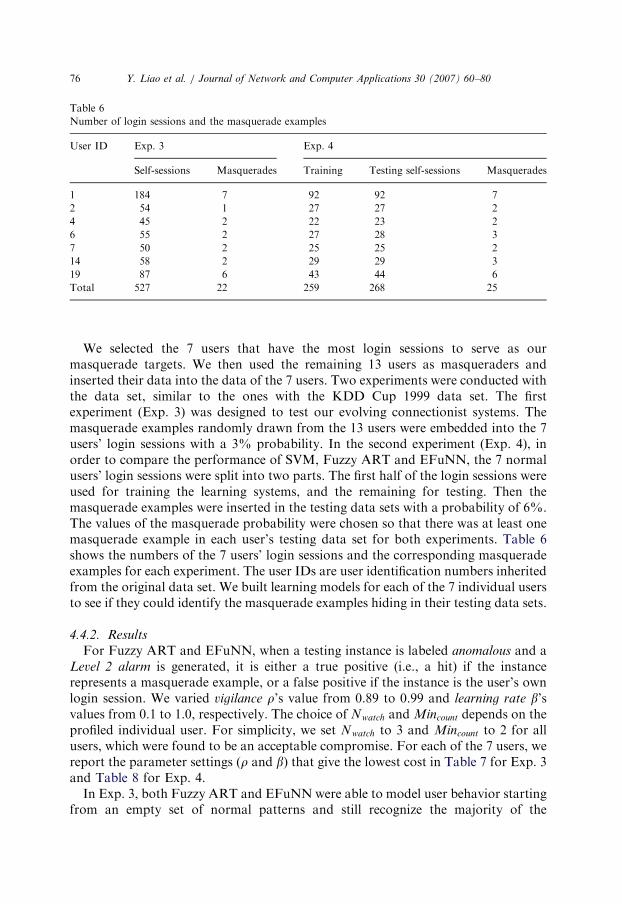
Table 6
Number of login sessions and the masquerade examples
User ID Exp. 3 Exp. 4
Self-sessions Masquerades Training Testing self-sessions Masquerades
1 184 7 92 92 7
2 54 1 27 27 2
4 45 2 22 23 2
6 55 2 27 28 3
7 50 2 25 25 2
14 58 2 29 29 3
19 87 6 43 44 6
Total 527 22 259 268 25
Y. Liao et al. / Journal of Network and Computer Applications 30 (2007) 60–8076
We selected the 7 users that have the most login sessions to serve as ourmasquerade targets. We then used the remaining 13 users as masqueraders andinserted their data into the data of the 7 users. Two experiments were conducted withthe data set, similar to the ones with the KDD Cup 1999 data set. The firstexperiment (Exp. 3) was designed to test our evolving connectionist systems. Themasquerade examples randomly drawn from the 13 users were embedded into the 7users’ login sessions with a 3% probability. In the second experiment (Exp. 4), inorder to compare the performance of SVM, Fuzzy ART and EFuNN, the 7 normalusers’ login sessions were split into two parts. The first half of the login sessions wereused for training the learning systems, and the remaining for testing. Then themasquerade examples were inserted in the testing data sets with a probability of 6%.The values of the masquerade probability were chosen so that there was at least onemasquerade example in each user’s testing data set for both experiments. Table 6shows the numbers of the 7 users’ login sessions and the corresponding masqueradeexamples for each experiment. The user IDs are user identification numbers inheritedfrom the original data set. We built learning models for each of the 7 individual usersto see if they could identify the masquerade examples hiding in their testing data sets.
4.4.2. Results
For Fuzzy ART and EFuNN, when a testing instance is labeled anomalous and aLevel 2 alarm is generated, it is either a true positive (i.e., a hit) if the instancerepresents a masquerade example, or a false positive if the instance is the user’s ownlogin session. We varied vigilance r’s value from 0.89 to 0.99 and learning rate b’svalues from 0.1 to 1.0, respectively. The choice of Nwatch and Mincount depends on theprofiled individual user. For simplicity, we set Nwatch to 3 and Mincount to 2 for allusers, which were found to be an acceptable compromise. For each of the 7 users, wereport the parameter settings (r and b) that give the lowest cost in Table 7 for Exp. 3and Table 8 for Exp. 4.
In Exp. 3, both Fuzzy ART and EFuNN were able to model user behavior startingfrom an empty set of normal patterns and still recognize the majority of the
ARTICLE IN PRESS
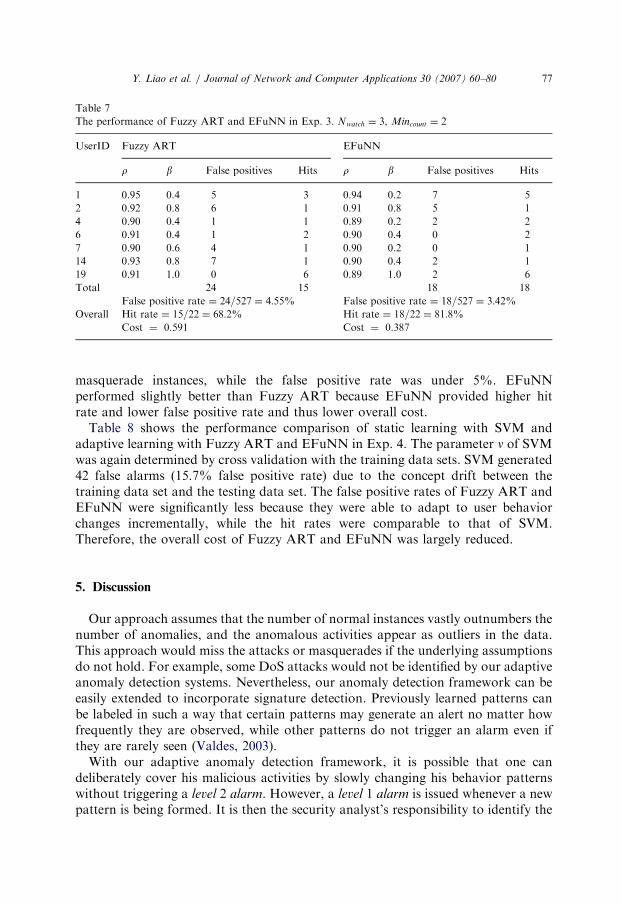
Table 7
The performance of Fuzzy ART and EFuNN in Exp. 3. Nwatch ¼ 3, Mincount ¼ 2
UserID Fuzzy ART EFuNN
r b False positives Hits r b False positives Hits
1 0.95 0.4 5 3 0.94 0.2 7 5
2 0.92 0.8 6 1 0.91 0.8 5 1
4 0.90 0.4 1 1 0.89 0.2 2 2
6 0.91 0.4 1 2 0.90 0.4 0 2
7 0.90 0.6 4 1 0.90 0.2 0 1
14 0.93 0.8 7 1 0.90 0.4 2 1
19 0.91 1.0 0 6 0.89 1.0 2 6
Total 24 15 18 18
False positive rate ¼ 24=527 ¼ 4:55% False positive rate ¼ 18=527 ¼ 3:42%Overall Hit rate ¼ 15=22 ¼ 68:2% Hit rate ¼ 18=22 ¼ 81:8%
Cost ¼ 0.591 Cost ¼ 0.387
Y. Liao et al. / Journal of Network and Computer Applications 30 (2007) 60–80 77
masquerade instances, while the false positive rate was under 5%. EFuNNperformed slightly better than Fuzzy ART because EFuNN provided higher hitrate and lower false positive rate and thus lower overall cost.
Table 8 shows the performance comparison of static learning with SVM andadaptive learning with Fuzzy ART and EFuNN in Exp. 4. The parameter n of SVMwas again determined by cross validation with the training data sets. SVM generated42 false alarms (15.7% false positive rate) due to the concept drift between thetraining data set and the testing data set. The false positive rates of Fuzzy ART andEFuNN were significantly less because they were able to adapt to user behaviorchanges incrementally, while the hit rates were comparable to that of SVM.Therefore, the overall cost of Fuzzy ART and EFuNN was largely reduced.
5. Discussion
Our approach assumes that the number of normal instances vastly outnumbers thenumber of anomalies, and the anomalous activities appear as outliers in the data.This approach would miss the attacks or masquerades if the underlying assumptionsdo not hold. For example, some DoS attacks would not be identified by our adaptiveanomaly detection systems. Nevertheless, our anomaly detection framework can beeasily extended to incorporate signature detection. Previously learned patterns canbe labeled in such a way that certain patterns may generate an alert no matter howfrequently they are observed, while other patterns do not trigger an alarm even ifthey are rarely seen (Valdes, 2003).
With our adaptive anomaly detection framework, it is possible that one candeliberately cover his malicious activities by slowly changing his behavior patternswithout triggering a level 2 alarm. However, a level 1 alarm is issued whenever a newpattern is being formed. It is then the security analyst’s responsibility to identify the

ARTICLE IN PRESS
Table
8
Theperform
ance
ofSVM,FuzzyARTandEFuNN
inExp.4
UserID
SVM
FuzzyART
EFuNN
Falsepositives
Hits
rb
Falsepositives
Hits
rb
Falsepositives
Hits
111
60.92
1.0
67
0.96
0.1
26
27
10.91
1.0
01
0.90
1.0
01
43
20.91
0.6
02
0.91
0.8
01
63
20.89
0.8
12
0.94
0.6
13
78
20.89
0.6
11
0.90
0.6
11
14
61
0.91
1.0
21
0.91
0.4
31
19
46
0.91
0.4
06
0.92
0.2
06
Total
42
20
10
20
719
Falsepositiverate¼
42=268¼
15:7%
Falsepositiverate¼
10=268¼
3:73%
Falsepositiverate¼
7=268¼
2:61%
Overall
Hitrate¼
20=2
5¼
80:0%
Hitrate¼
20=25¼
80:0%
Hitrate¼
19=2
5¼
76:0%
Cost¼
1.14
Cost¼
0.424
Cost¼
0.397
Y. Liao et al. / Journal of Network and Computer Applications 30 (2007) 60–8078
ARTICLE IN PRESS
Y. Liao et al. / Journal of Network and Computer Applications 30 (2007) 60–80 79
user’s intent in order to distinguish malicious from non-malicious anomalies, whichis beyond the scope of this paper. We also note that in case a continuing abnormalactivity occurs, large amount of level 1 alarms may be raised and the security analystcan still get overwhelmed.
6. Conclusion
This paper has presented a new adaptive anomaly detection framework throughthe use of evolving connectionist systems. A subject’s normal behavior is learned inthe online unsupervised mode. The performance of two adaptive anomaly detectionsystems, based on Fuzzy ART and EFuNN, was empirically tested with the KDDCup 1999 network data and the user profiling data. The experiments have shownthat our adaptive anomaly detection systems are able to adapt to user or networkbehavior changes while still recognizing anomalous activities. Compared to theSVM-based static learning, the adaptive anomaly detection methods can signifi-cantly reduce the false alarms.
In order to make an adaptive anomaly detection system scalable, it might benecessary to prune or aggregate pattern nodes as the system evolves, which is asignificant issue for our future work. Other issues of our future work includeexploring automated determination of the parameters and comparing more evolvingconnectionist systems, such as evolving self-organizing maps.
Acknowledgments
The authors wish to thank Dr. Tom Goldring of NSA for providing us the WindowsNT user profiling data set. This work is supported in part by the AFOSR Grant F49620-01-1-0327 to the Center for Digital Security of the University of California, Davis.
References
Carpenter GA, Grossberg S., editors. Pattern recognition by self-organizing neural networks. Cambridge,
MA: MIT Press; 1991.
Carpenter GA, Grossberg S, Rosen DB. Fuzzy art: fast stable learning and categorization of analog
patterns by an adaptive resonance system. Neural Networks 1991;4:759–71.
Chang C-C, Lin C-J. LIBSVM: a library for support vector machines, 2001. URL http://
www.csie.ntu.edu.tw/cjlin/libsvm
Debar H, Becker M, Siboni D. A neural network component for an intrusion detection system. In:
Proceedings of the 1992 IEEE symposium on security and privacy. Silver Spring, MD: IEEE Computer
Society; 1992. p. 240.
Eskin E. Anomaly detection over noisy data using learned probability distributions. In: Proceedings 17th
international conference on machine learning. San Francisco, CA: Morgan Kaufmann; 2000. p. 255–62.
Eskin E, Arnold A, Prerau M, Portnoy L, Stolfo S. A geometric framework for unsupervised anomaly
detection: detecting intrusions in unlabeled data. In: Barbara D, Jajodia S., editors. Applications of
data mining in computer security. Dordrecht: Kluwer; 2002.
ARTICLE IN PRESS
Y. Liao et al. / Journal of Network and Computer Applications 30 (2007) 60–8080
Eskin E, Miller M, Zhong Z-D, Yi G, Lee W-A, Stolfo S. Adaptive model generation for intrusion
detection systems. In: Proceedings of the ACMCCS workshop on intrusion detection and prevention.
Athens, Greece, 2000.
Fan W. Cost-sensitive, scalable and adaptive learning using ensemble-based methods. PhD thesis,
Columbia University, February 2001.
Forrest S, Hofmeyr SA, Somayaji A, Longstaff TA. A sense of self for unix processes. In: Proceedings of
the 1996 IEEE symposium on security and privacy. Silver Spring, MD: IEEE Computer Society; 1996.
p. 120.
Ghosh AK, Schwartzbard A. A study in using neural networks for anomaly and misuse detection. In:
Proceedings of the eighth USENIX security symposium, 1999.
Hossain M, Bridges SM. A framework for an adaptive intrusion detection system with data mining. In:
Proceedings of the 13th annual Canadian information technology security symposium. Ottawa,
Canada, 2001.
Jang J-SR, Sun C-T, Mizutani E. Neuro-fuzzy and soft computing: a computational approach to learning
and machine intelligence. Englewood Cliffs, NJ: Prentice-Hall; 1997.
Javitz HS, Valdes A. The nides statistical component description and justification, Technical Report,
Computer Science Laboratory, SRI International, Menlo Park, CA, March 1994.
Kasabov N. Evolving fuzzy neural networks for supervised/unsupervised on-line knowledge-based
learning. IEEE Trans Man Mach Cybernet—Part B: Cybernet 2001;31(6):902–18.
Kasabov N. Evolving connectionist systems: methods and applications in bioinformatics, brain study and
intelligence machines. Berlin: Springer; 2002.
Lane T, Brodley CE. Approaches to online learning and concept drift for user identification in computer
security. In: Proceedings of the fourth international conference on knowledge discovery and data
mining, 1998. p. 259–63.
Lane T, Brodley CE. Temporal sequence learning and data reduction for anomaly detection. ACM Trans
Inf Systems Security 1999;2(3):295–331.
Lazarevic A, Ertoz L, Kumar V, Ozgur A, Srivastava J. A comparative study of anomaly detection
schemes in network intrusion detection. In: Proceedings of the third SIAM international conference on
data mining. San Francisco, CA: 2003. p. 25–36.
Lee W, Stolfo SJ. A framework for constructing features and models for intrusion detection systems.
ACM Trans Inf Systems Security 2000;3(4):227–61.
Liao Y, Vemuri VR. Use of k-nearest neighbor classifier for intrusion detection. Comput Security
2002;21(5):439–48.
Mahoney MV, Chan PK. Learning nonstationary models of normal network traffic for detecting novel
attacks. In: Proceedings of the eighth ACM SIGKDD international conference on knowledge
discovery and data mining. New York: ACM Press; 2002. p. 376–85.
Maxion RA, Townsend TN. Masquerade detection using truncated command lines. In: Proceedings of
international conference on dependable systems & networks. Washington DC: 2002. p. 219–28.
McHugh J. Intrusion and intrusion detection. Int J Inf Security 2001;1(1):14–35.
Scholkopf B, Platt JC, Schawe-Taylor J, Smola AJ, Williamson RC. Estimating the support of a high-
dimensional distribution. Neural Comput 2001;13(7):1443–71.
Sequeira K, Zaki MJ. Admit: anomaly-based data mining for intrusions. In: Proceedings of SIGKDD,
2002. p. 386–95.
Teng HS, Chen K, Lu SC. Adaptive real-time anomaly detection using inductively generated sequential
patterns. In: Proceedings of IEEE symposium on security and privacy. Oakland, CA: 1990. p. 278–84.
The third international knowledge discovery and data mining tools competition (kdd cup 1999) data, 1999.
URL http://kdd.ics.uci.edu/databases/kddcup99/kddcup99.html
Valdes A. Detecting novel scans through pattern anomaly detection. In: Proceedings of DARPA
information survivability conference and exposition. Washington, DC: 2003. p. 140–51.
Vapnik V. Statistical learning theory. New York: Wiley; 1998.
Yamanishi K, Takeuchi J, Williams G. On-line unsupervised outlier detection using finite mixtures with
discounting learning algorithms. Data Mining and Knowledge Discovery 2004;8:275–300.