Embed Size (px)
Citation preview
Addressing Diversity in Rural Education
Lynne Vernon-Feagans, UNC-CHJill V. Hamm, UNC-CH
Thomas W. Farmer, Penn State Univ.
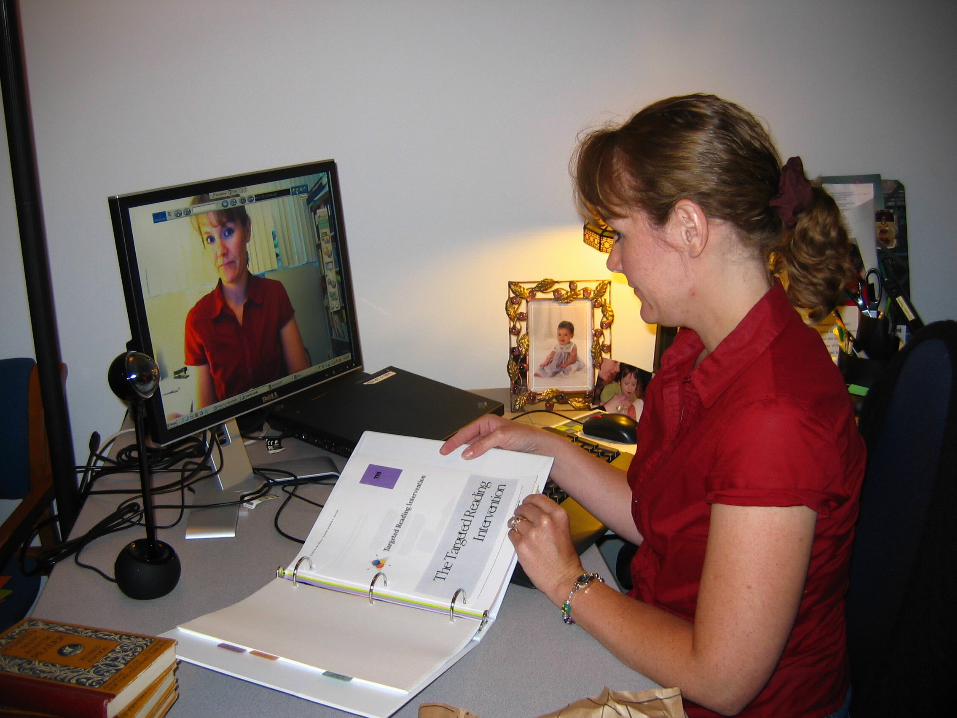
The Targeted Reading Intervention: How Rural Diversity makes a difference for implementation
Targeting instructional match in every interaction…
Lynne Vernon-FeagansMarnie GinsbergSteve Amendum
NRCRES: TRI staff
Lynne Vernon-Feagans, PISteve AmendumPeg BurchinalKate Gallagher
Marnie GinsbergKirsten Kainz Steve Knotek
Nathan VandergriftPam Winton
Pledger FedoraIris Padgett
Megan Livengood Kelley MayerJason Rose
Andrea SauerHeather Ward
Tim Wood
What is ‘Rural’
US Census Bureau: Census Tracts http://www.census.gov/geo/www/ua/ua_2k.html
Population density Population size
NCES: Locale Codeshttp://nces.ed.gov/surveys/RuralEd/definitions.asp
Population size Distance to an urbanized area
What makes Rural different from urban? Promotive Factors
More two parent families Less population density Much less violent crime More homes owned by families Proportionately more children
attending Head Start Fewer behavior problems in school Smaller schools More experienced teachers
What makes Rural different from urban?
Risk Factors Higher percentage of children living
in poverty, especially minority children
Outmigration of talented young people because of job losses
Fewer college graduates More maternal depression and
prescription drug abuse Lower child achievement levels Less educated teachers with lower
salaries Longer bus rides to school
The consensus intangibles in rural education
In a place at a distance from large cities
Historical roots to agrarian culture Access to fewer resources Smaller communities and schools Ready to meet community needs Grounded in a “sense of place” and
rooted in the lives of families
The TRI Study
Cluster Randomized Clinical Trial to assess the effectiveness of the TRI in Low Wealth Rural Schools.
Part of the National Research Center on Rural Education Support
www.nrcres.org/TRI.htm www.nrcres.org/TRI.htm
Funded by the Institute of Education Sciences (IES)
Purpose
The TRI is designed to improve the literacy teaching strategies of rural kindergarten and first grade teachers, using an individualized diagnostic teaching model, with a specific focus on strategies that are effective with struggling readers who do not make reading gains using traditional reading instruction.
Why focus on teacher training? Research has shown that the first few years of
school are critical for children’s later school success, especially in the area of reading (Alexander& Entwisle, 1992; Juel, 1988).
Teachers in rural areas have more experience in teaching and knowledge about the background of their students but teachers have less access to professional development opportunities (GAO report, 2004; Lee & Burkham, 2003)
Teachers and parents are more satisfied with their schools in rural areas but children come to school with less formal and high quality preschool experiences (Israel, 2004; Vernon-Feagans et al., in press).
The TRI Strategies for Success
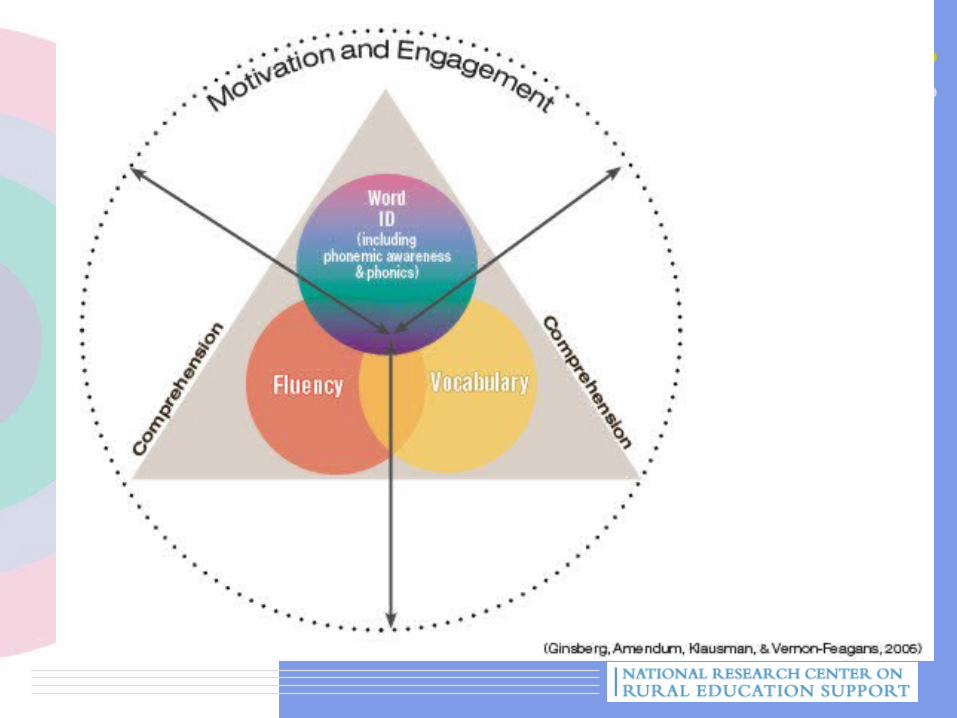
The TRI Model of Reading
Examples of TRI Strategies:
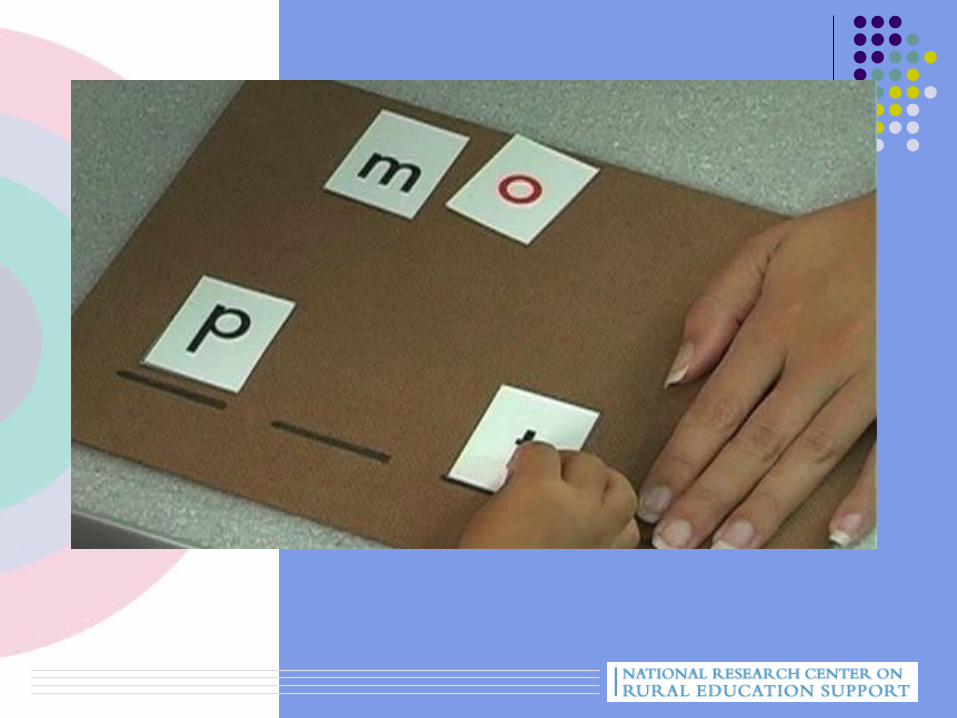
Teaching in the context of the word and text from the beginning
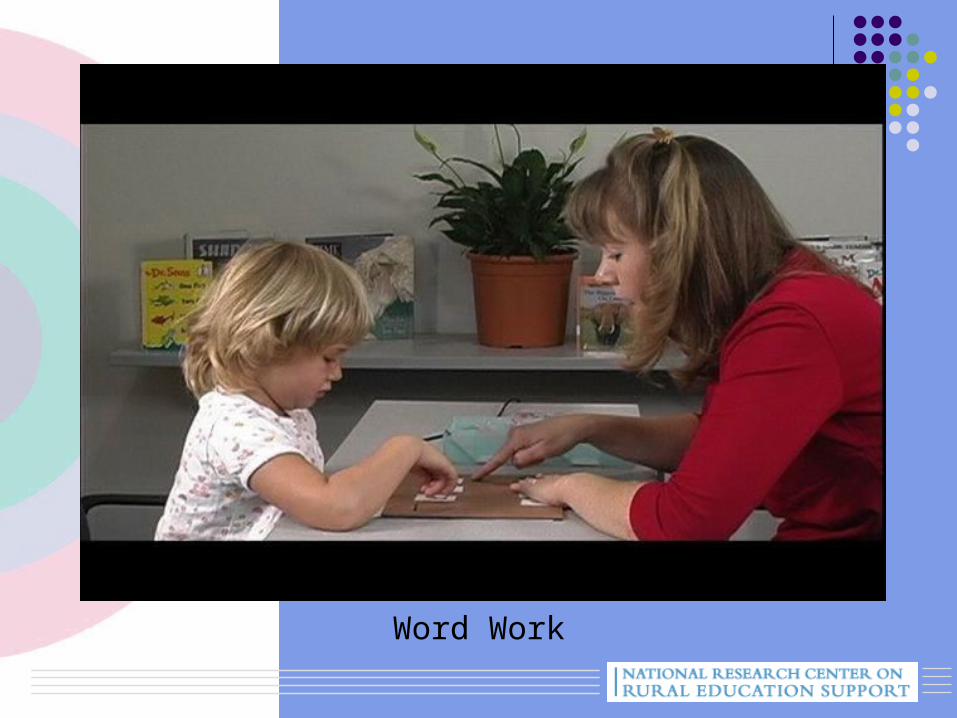
Word Work
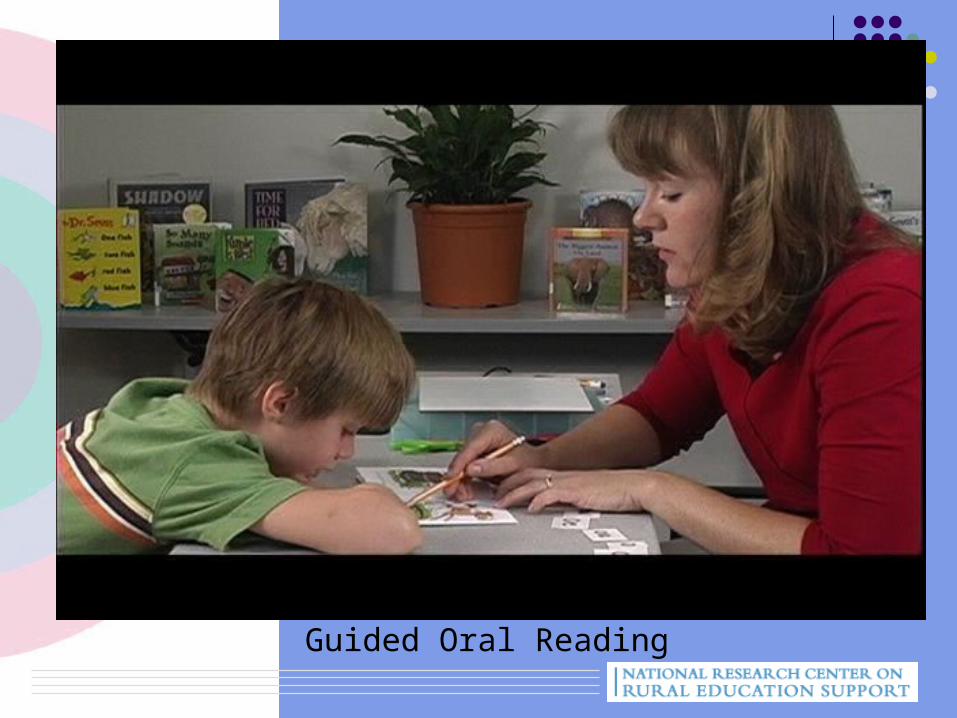
Guided Oral Reading
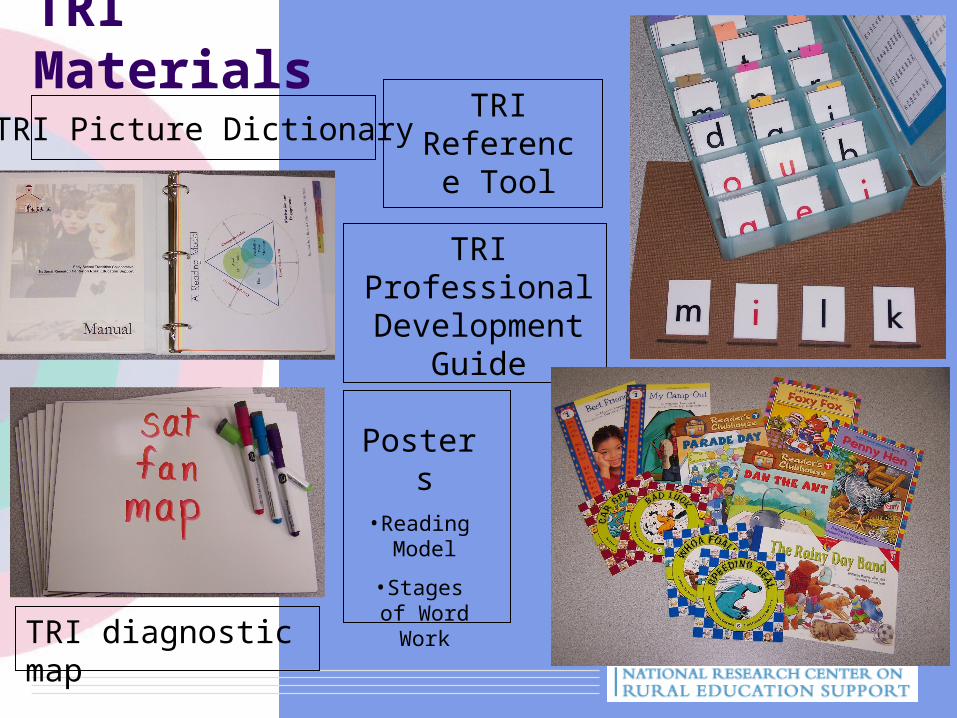
TRI Materials
Posters
•Reading Model
•Stages of Word Work
TRI Referenc
e Tool
TRI diagnostic map
TRI Picture Dictionary
TRI Professional Development
Guide
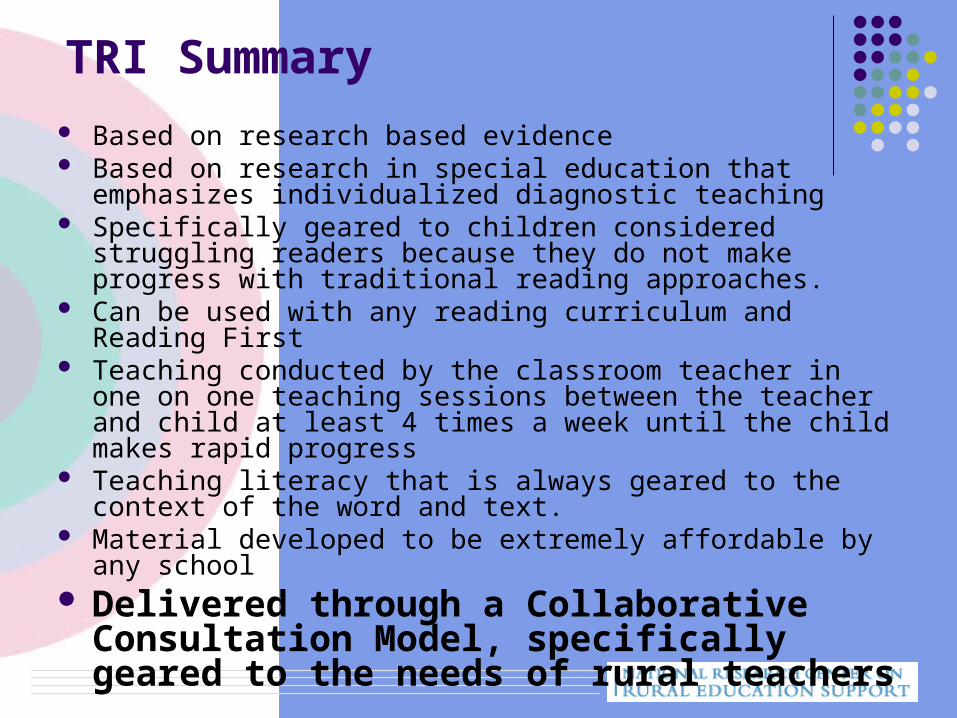
TRI Summary
Based on research based evidence Based on research in special education that emphasizes
individualized diagnostic teaching Specifically geared to children considered struggling readers
because they do not make progress with traditional reading approaches.
Can be used with any reading curriculum and Reading First Teaching conducted by the classroom teacher in one on one
teaching sessions between the teacher and child at least 4 times a week until the child makes rapid progress
Teaching literacy that is always geared to the context of the word and text.
Material developed to be extremely affordable by any school Delivered through a Collaborative
Consultation Model, specifically geared to the needs of rural teachers
Implementation : Diversity Issues in Rural
Education
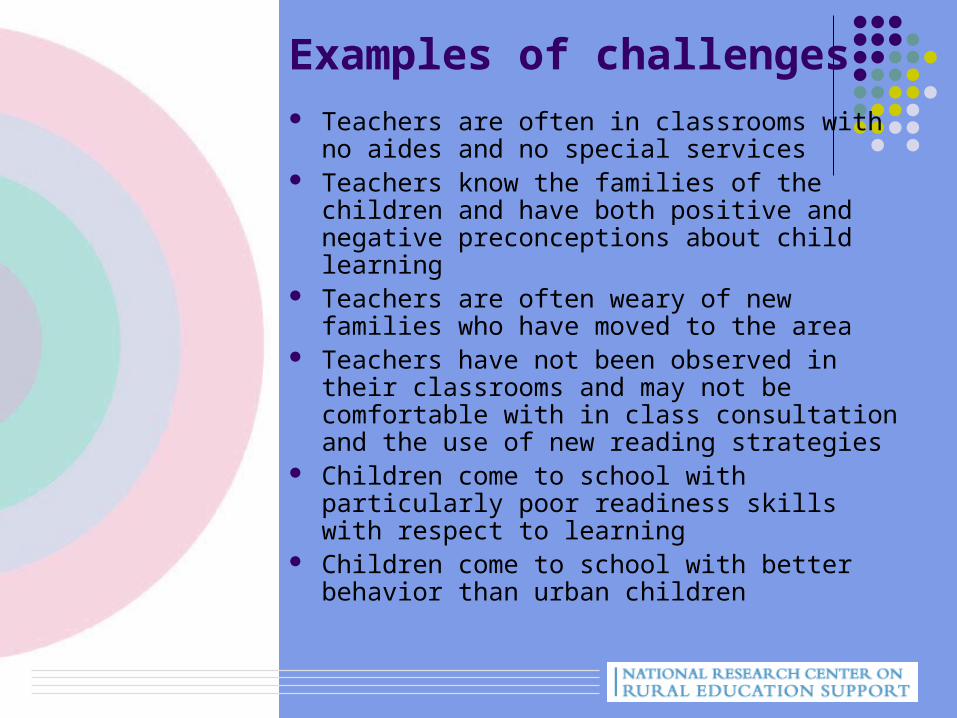
Examples of challenges Teachers are often in classrooms with no
aides and no special services Teachers know the families of the children and
have both positive and negative preconceptions about child learning
Teachers are often weary of new families who have moved to the area
Teachers have not been observed in their classrooms and may not be comfortable with in class consultation and the use of new reading strategies
Children come to school with particularly poor readiness skills with respect to learning
Children come to school with better behavior than urban children
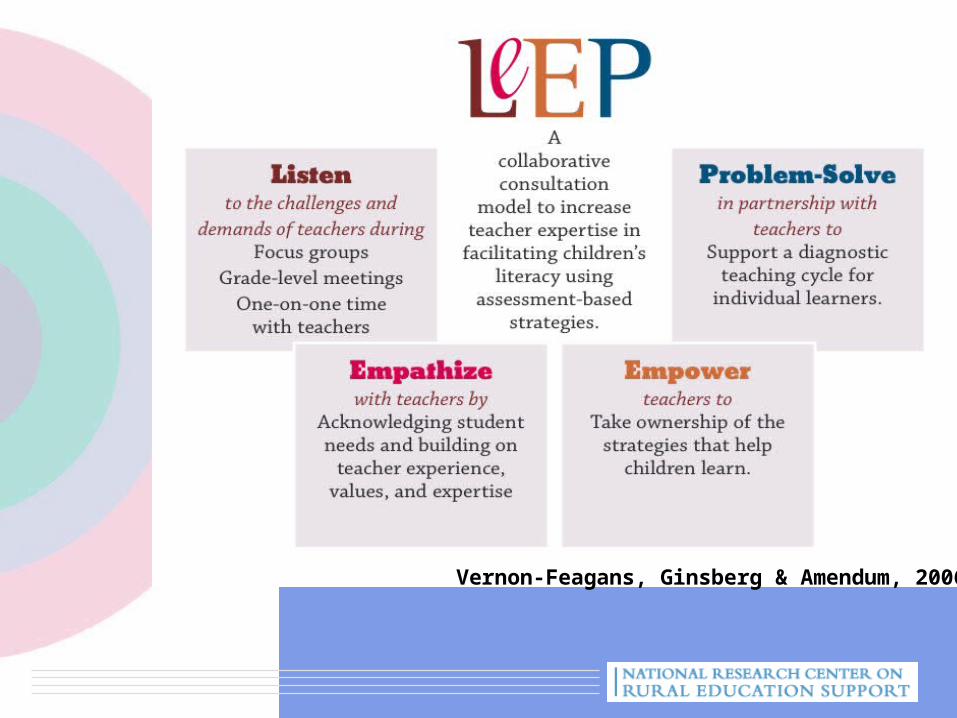
Vernon-Feagans, Ginsberg & Amendum, 2006
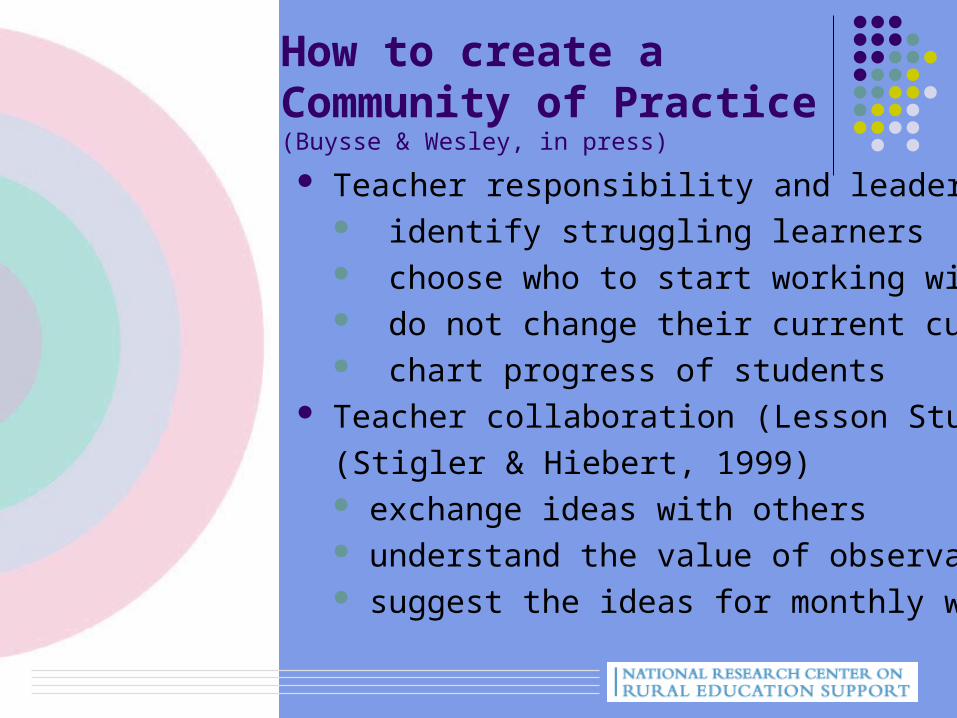
How to create a Community of Practice (Buysse & Wesley, in press)
Teacher responsibility and leadership identify struggling learners choose who to start working with do not change their current curriculum chart progress of students
Teacher collaboration (Lesson Study)
(Stigler & Hiebert, 1999) exchange ideas with others understand the value of observation suggest the ideas for monthly workshops
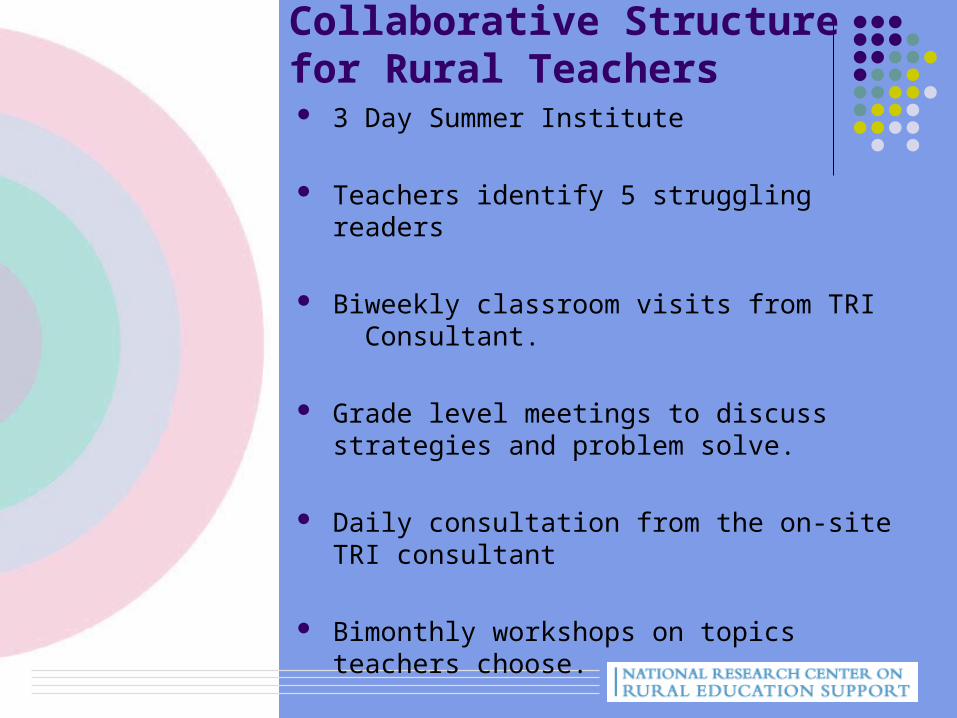
Collaborative Structure for Rural Teachers 3 Day Summer Institute
Teachers identify 5 struggling readers
Biweekly classroom visits from TRI Consultant.
Grade level meetings to discuss strategies and problem solve.
Daily consultation from the on-site TRI consultant
Bimonthly workshops on topics teachers choose.
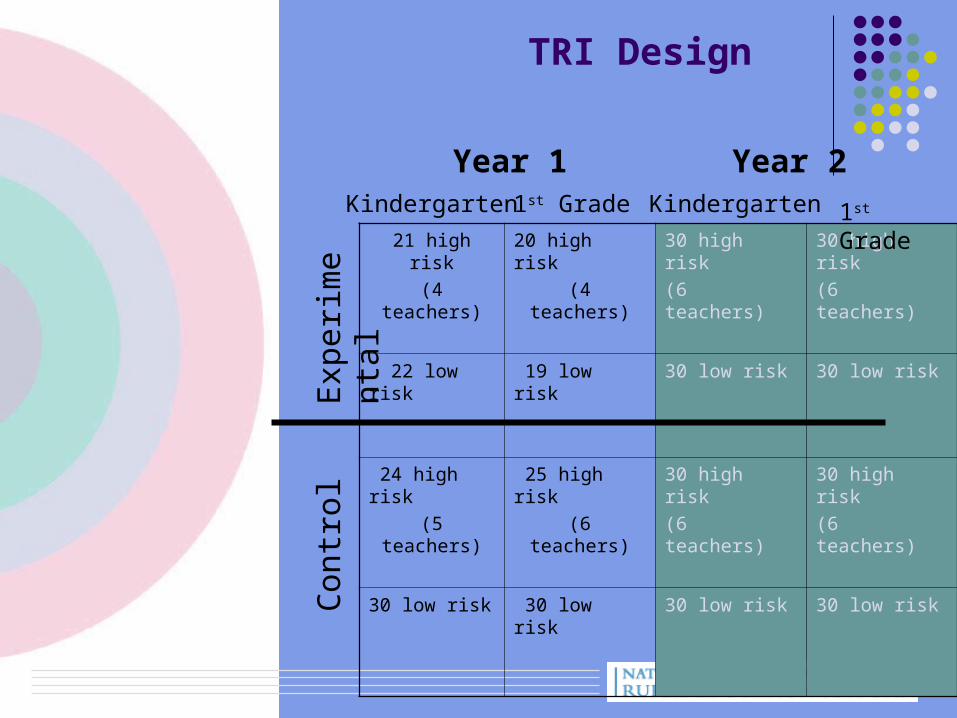
21 high risk
(4 teachers)
20 high risk
(4 teachers)
30 high risk
(6 teachers)
30 high risk
(6 teachers)
22 low risk 19 low risk 30 low risk 30 low risk
24 high risk
(5 teachers)
25 high risk
(6 teachers)
30 high risk
(6 teachers)
30 high risk
(6 teachers)
30 low risk 30 low risk 30 low risk 30 low risk
Year 1 Year 2Kindergarten 1st Grade Kindergarten 1st Grade
Exp
erim
enta
lC
ontr
ol
TRI Design
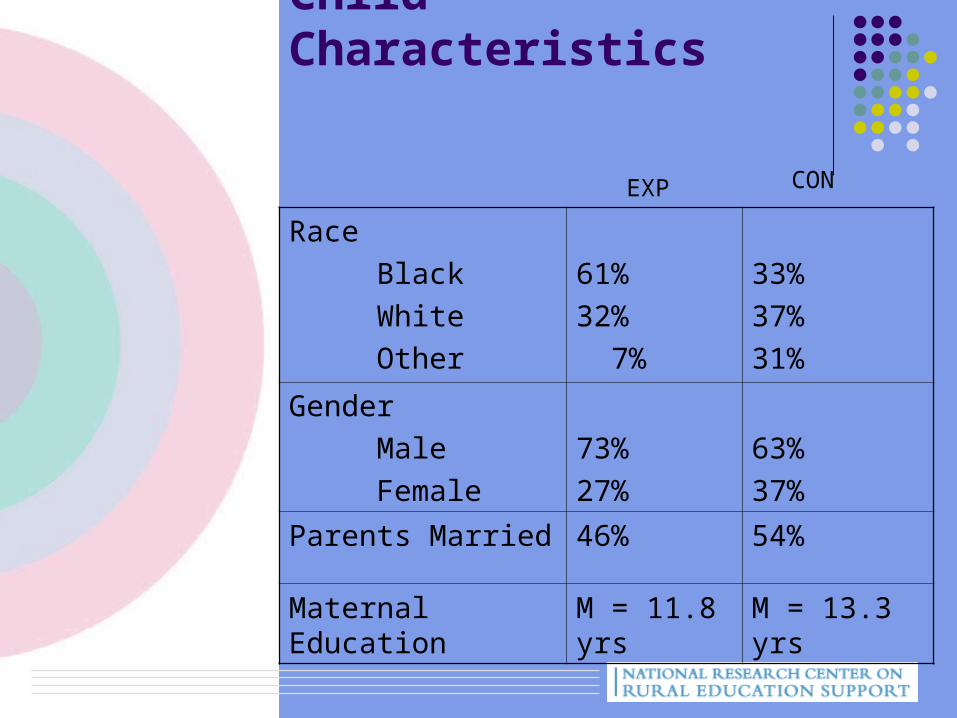
Child Characteristics
Race
Black
White
Other
61%
32%
7%
33%
37%
31%
Gender
Male
Female
73%
27%
63%
37%
Parents Married 46% 54%
Maternal Education M = 11.8 yrs
M = 13.3 yrs
EXP CON
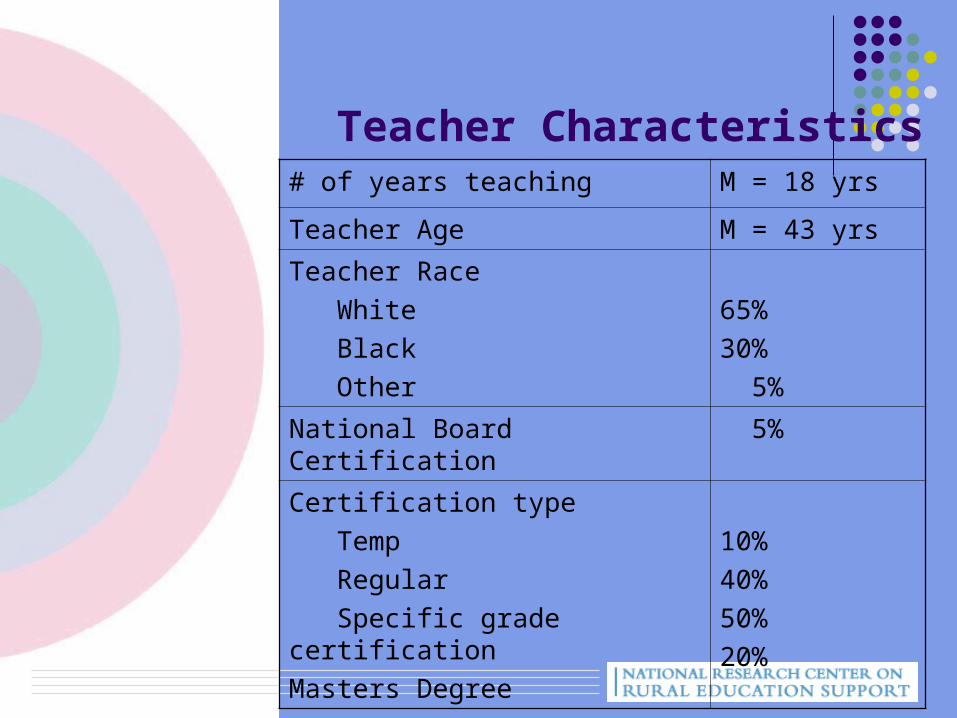
Teacher Characteristics# of years teaching M = 18 yrs
Teacher Age M = 43 yrs
Teacher Race
White
Black
Other
65%
30%
5%
National Board Certification 5%
Certification type
Temp
Regular
Specific grade certification
Masters Degree
10%
40%
50%
20%
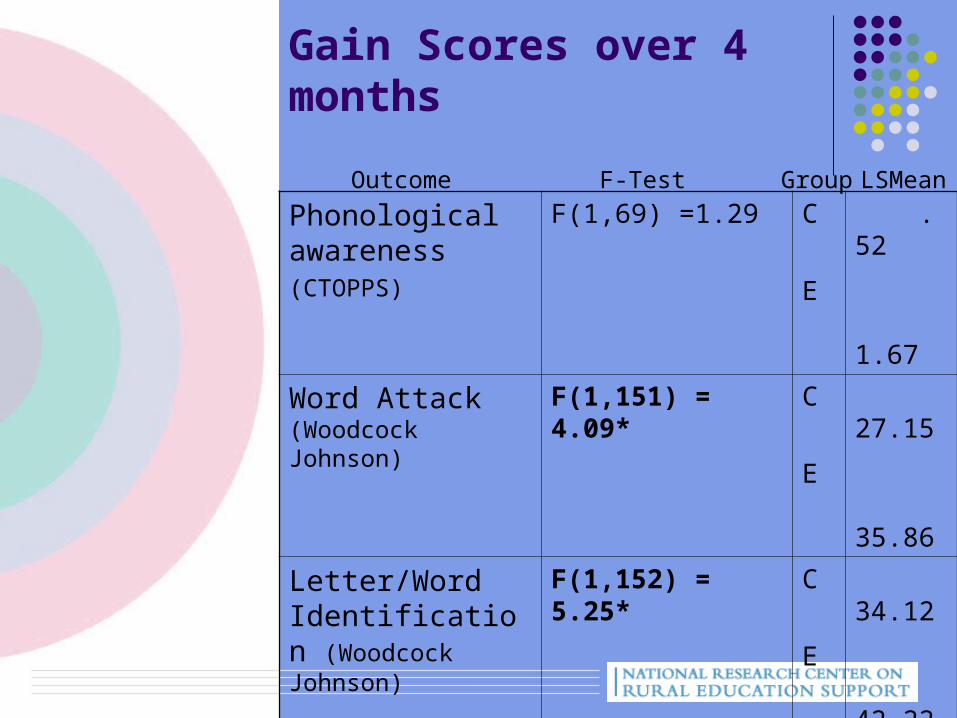
Gain Scores over 4 months
Phonological awareness (CTOPPS)
F(1,69) =1.29 C
E
.52
1.67
Word Attack (Woodcock Johnson)
F(1,151) = 4.09* C
E
27.15
35.86
Letter/Word Identification (Woodcock Johnson)
F(1,152) = 5.25* C
E
34.12
42.22
Vocabulary(PPVT)
F(1,120) = 0.38 C
E
1.20
2.32
Outcome F-Test Group LSMean
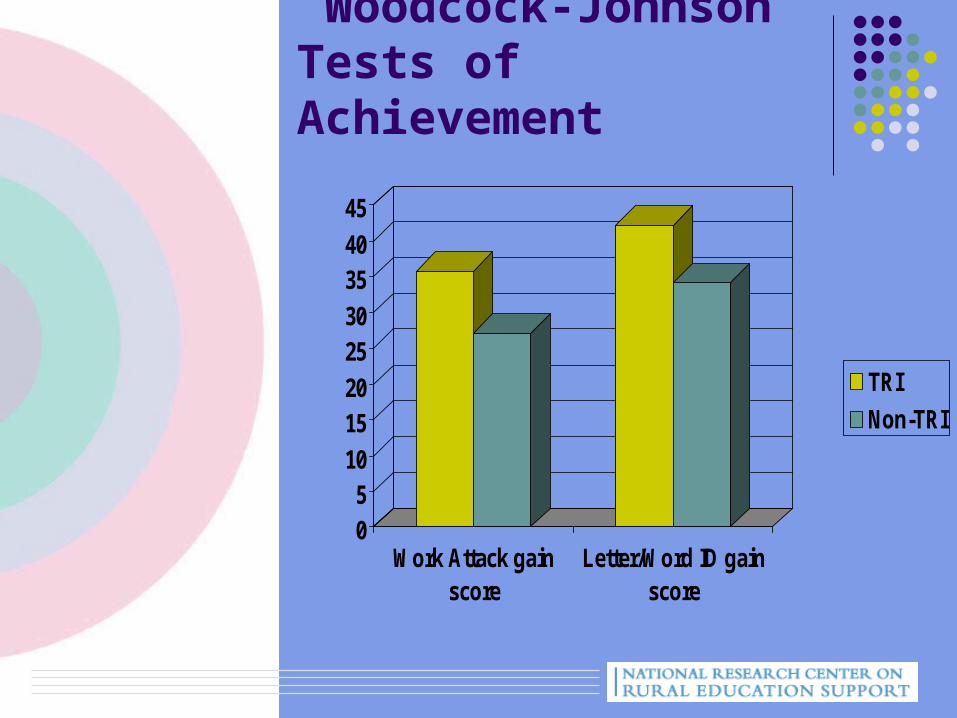
Woodcock-Johnson Tests of Achievement
05
10
1520
2530
3540
45
Work Attack gainscore
Letter/Word ID gainscore
TRI
Non-TRI
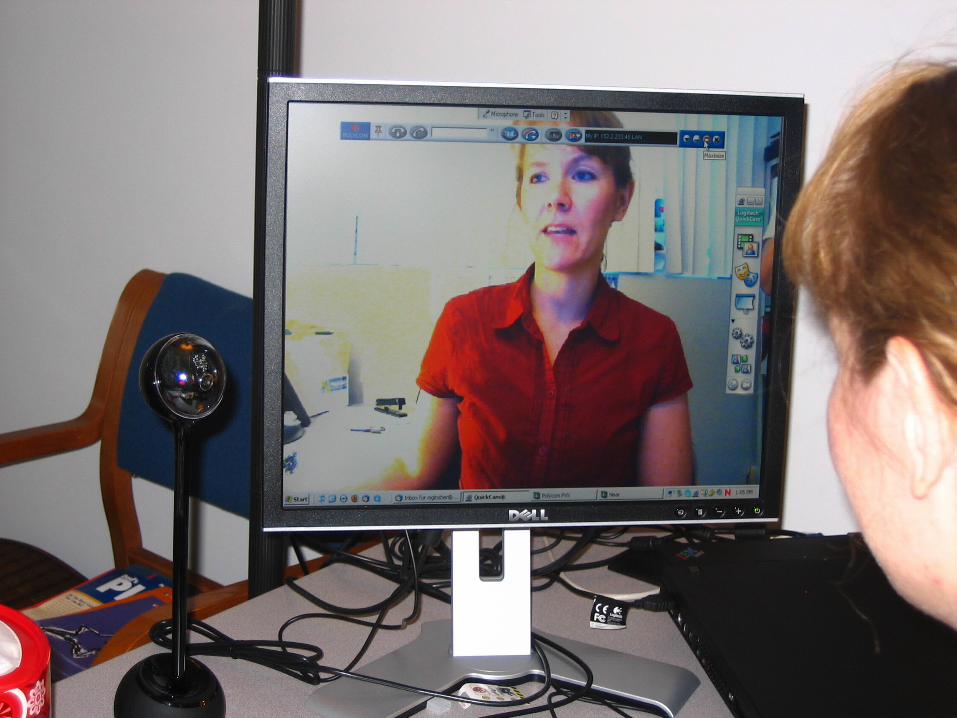
Future DirectionsWebcam technology TRI consultation in remote rural classrooms in real time TRI grade level meetings across sites through web cam technology Problem solving across sites to create a community of practice
Summary
Rural Schools are different contexts for learning Need sensitivity to rural structure and beliefs in
schools Need to break the barrier of access Need to break the barrier of isolation Individual consultation in real time using the TRI
provides a major solution to these barriers while providing research based literacy strategies for struggling learners
Implementation and Evaluation of the Rural Early Adolescent Learning Project (REAL):
Commonalities in Diverse Educational Settings
Jill V. Hamm, Dylan Robertson, Kimberly Dadisman, Matthew Irvin, Allen Murray, Jana Thompson, Kelli O’Brien, & Jenny Westrick
University of North Carolina at Chapel Hill
General Aims of Project REAL
• Professional development for rural teachers who serve middle level youth (5th – 6th grades)
• Responsive to local resources, needs, and school configurations
• Promote strategies that provide universal support for all students during early adolescence
• Promote strategies that help teachers advance the learning of low-achieving students
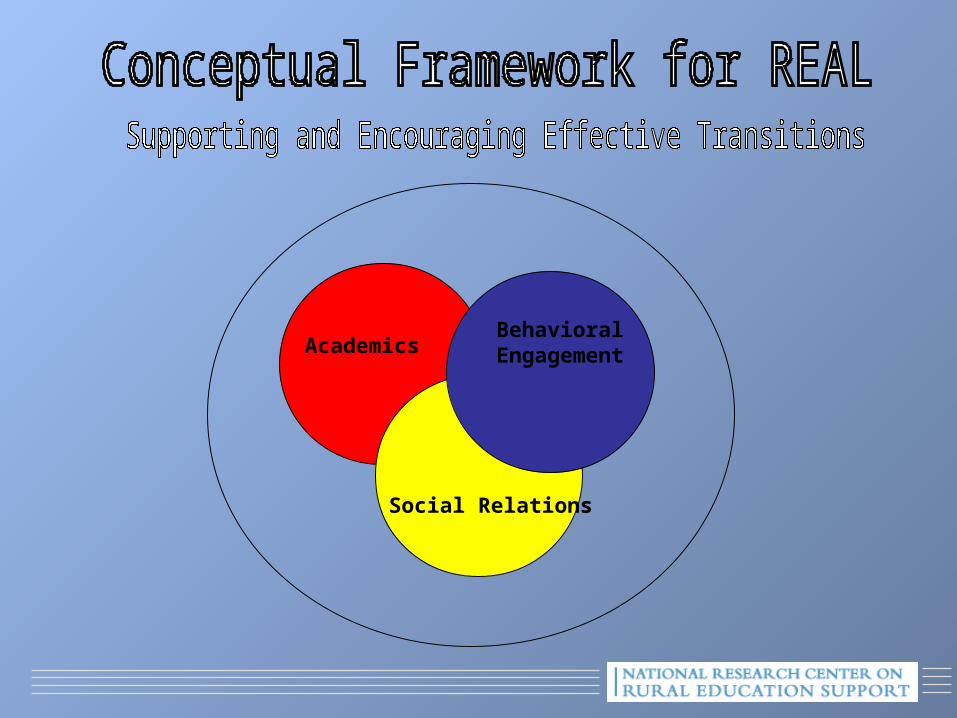
Academics
Behavioral Engagement
Social Relations
Support for Conceptual Framework in Rural Areas
Pilot Sites Research Participants
• Recruited from all 5th grade classrooms of eight public elementary schools in two states of the rural Appalachia region– 61% agreed to participate
• 315 participating students (170 girls and 145 boys)
• Over 95% White
• Schools were eligible for U.S. Department of Education’s Rural and Low-Income School Program (RLISP) – locale code 6, 7, or 8 and at least 20% of students are from families
living below the federal poverty level
Support for Conceptual Framework in Rural Areas
Measures: Adjustment in Multiple Domains• Teacher-ratings on 18-item questionnaire (ICS-T; Cairns, Leung, Gest, &
Cairns, 1995) – Sub-scales/factors:
• Aggression (α = .84), Popularity (α = .83), Academic competence (α = .80), Affiliative (α = .74), Internalizing (α = .52), Olympian (α = .78)
Measures: Achievement• End-of-Year Grade Average
– School records data for end of 5th grade for: • math, English/reading, social studies/history and science
– Mean across four subjects (in the form of a percentage) was obtained and used in analyses
• State-level Standardized Achievement Test Scores – School records data for end of 5th grade for similar subjects:
• math, science, social studies and English– Mean across these four subjects was obtained and used in analyses
• scaled scores were on different metrics by state; average standardized achievement score were standardized within state.
Support for Conceptual Framework in Rural AreasData Reduction Techniques
4 unique patterns of variables emerged in girls (i.e.,clusters, behavioral configurations)
– Troubled: above average aggression and internalizing; below average academic competence, affiliative, popularity, and Olympian
– Tough: well above average aggression; average popularity, academic competence, affiliative, and Olympian; below average internalizing
– Sensitive: above average internalizing; below average affiliative; average aggression, academic competence, popularity, and Olympian
– Model: above average academic competence, affiliative, and popularity; below average aggression and internalizing.
Support for Conceptual Framework in Rural Areas
Data Reduction Techniques
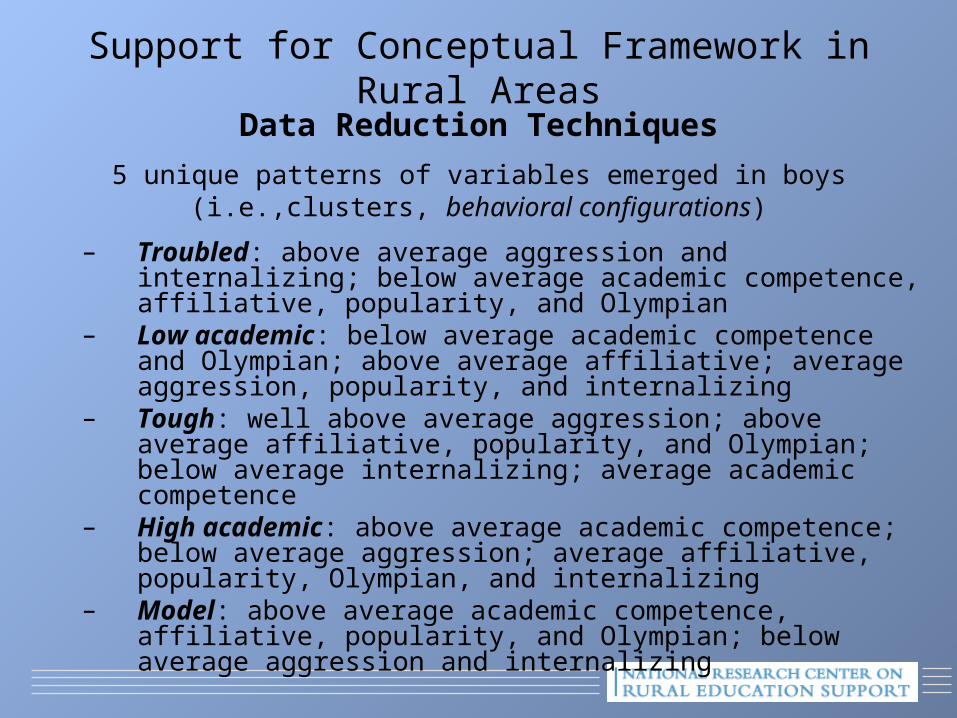
5 unique patterns of variables emerged in boys(i.e.,clusters, behavioral configurations)
– Troubled: above average aggression and internalizing; below average academic competence, affiliative, popularity, and Olympian
– Low academic: below average academic competence and Olympian; above average affiliative; average aggression, popularity, and internalizing
– Tough: well above average aggression; above average affiliative, popularity, and Olympian; below average internalizing; average academic competence
– High academic: above average academic competence; below average aggression; average affiliative, popularity, Olympian, and internalizing
– Model: above average academic competence, affiliative, popularity, and Olympian; below average aggression and internalizing
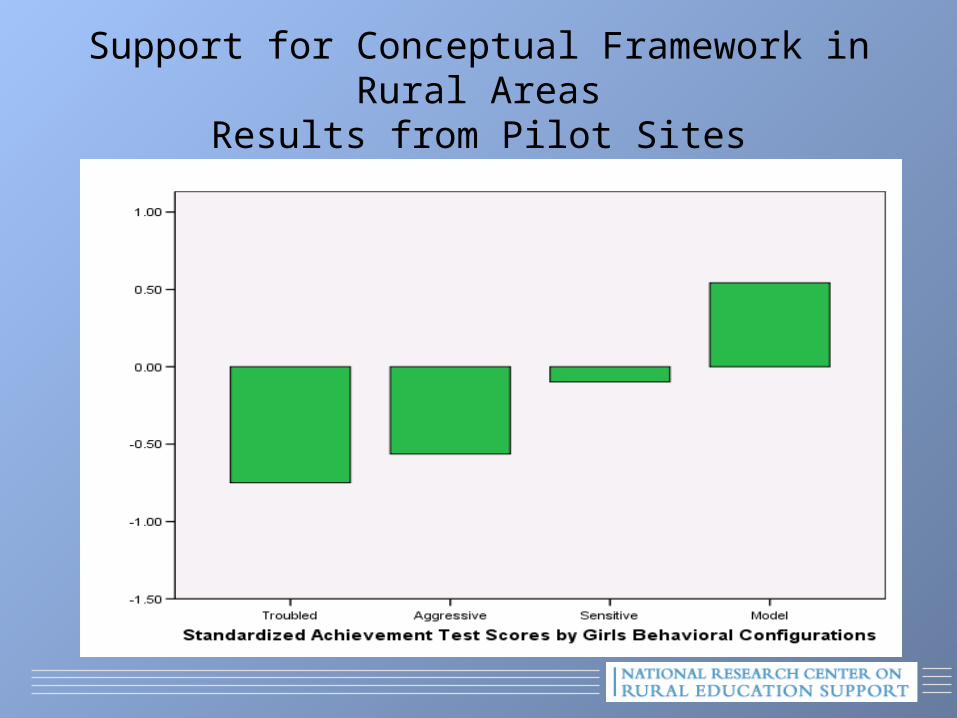
Support for Conceptual Framework in Rural AreasResults from Pilot Sites
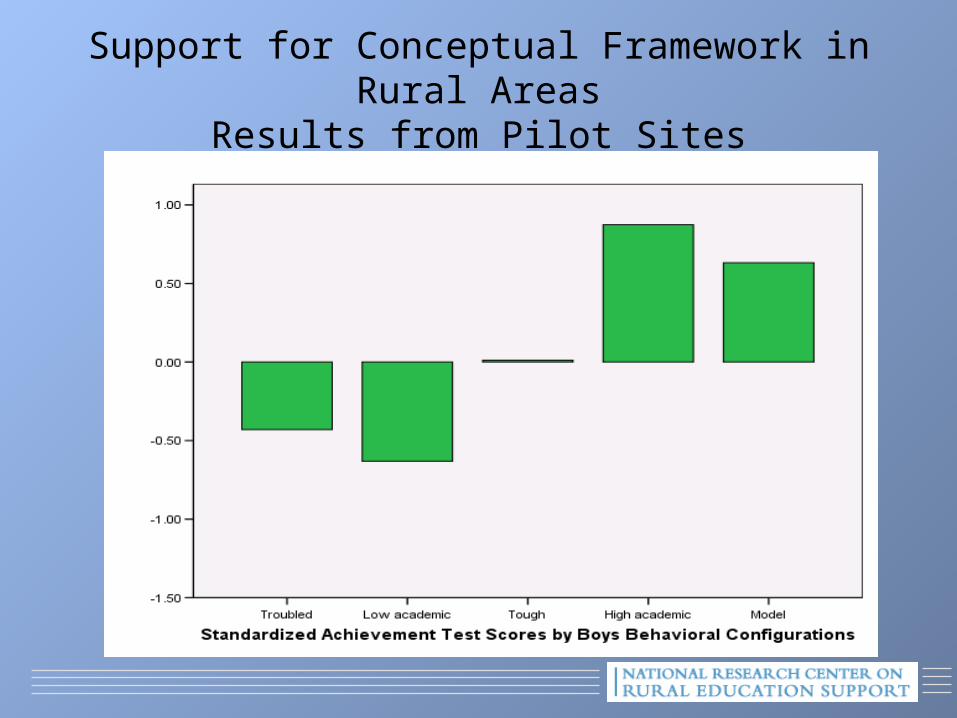
Support for Conceptual Framework in Rural AreasResults from Pilot Sites
Moving from Pilot Sites to Efficacy Sites:Research Design for Project REAL
8 intervention and 8 control schools– 8 with middle school transition configuration– 8 alternative configuration (e.g., k-8, k-12)
• Baseline data collected in spring of 5th grade; Process/transition data collected in fall and spring of 6th grade
• Outcome data on school adjustment and academic achievement collected in spring of 6th grade
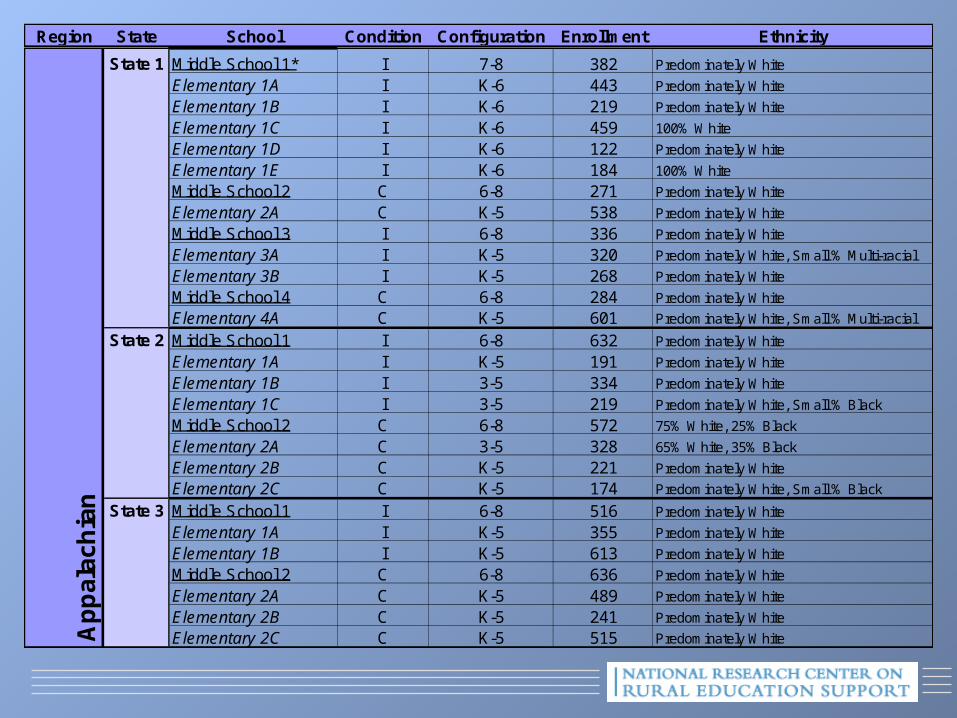
Region State School Condition Configuration Enrollment Ethnicity
State 1 Middle School 1* I 7-8 382 Predominately White
Elementary 1A I K-6 443 Predominately White
Elementary 1B I K-6 219 Predominately White
Elementary 1C I K-6 459 100% White
Elementary 1D I K-6 122 Predominately White
Elementary 1E I K-6 184 100% White
Middle School 2 C 6-8 271 Predominately White
Elementary 2A C K-5 538 Predominately White
Middle School 3 I 6-8 336 Predominately White
Elementary 3A I K-5 320 Predominately White, Small % Multi-racial
Elementary 3B I K-5 268 Predominately White
Middle School 4 C 6-8 284 Predominately White
Elementary 4A C K-5 601 Predominately White, Small % Multi-racial
State 2 Middle School 1 I 6-8 632 Predominately White
Elementary 1A I K-5 191 Predominately White
Elementary 1B I 3-5 334 Predominately White
Elementary 1C I 3-5 219 Predominately White, Small % Black
Middle School 2 C 6-8 572 75% White, 25% Black
Elementary 2A C 3-5 328 65% White, 35% Black
Elementary 2B C K-5 221 Predominately White
Elementary 2C C K-5 174 Predominately White, Small % Black
State 3 Middle School 1 I 6-8 516 Predominately White
Elementary 1A I K-5 355 Predominately White
Elementary 1B I K-5 613 Predominately White
Middle School 2 C 6-8 636 Predominately White
Elementary 2A C K-5 489 Predominately White
Elementary 2B C K-5 241 Predominately White
Elementary 2C C K-5 515 Predominately WhiteAp
pa
lac
hia
n
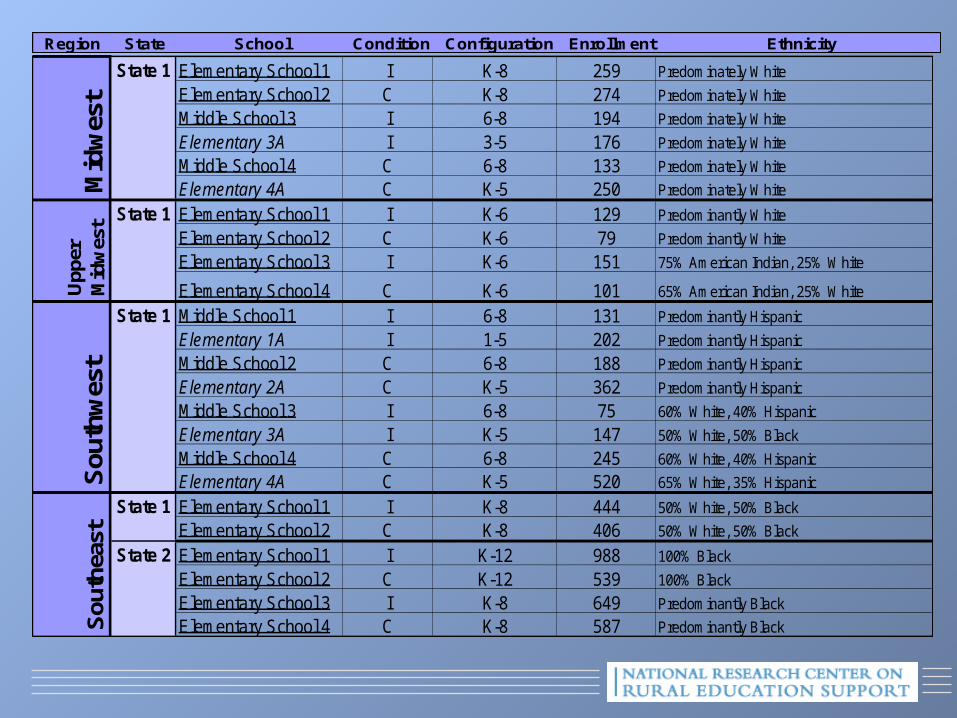
Region State School Condition Configuration Enrollment Ethnicity
State 1 Elementary School 1 I K-8 259 Predominately White
Elementary School 2 C K-8 274 Predominately White
Middle School 3 I 6-8 194 Predominately White
Elementary 3A I 3-5 176 Predominately White
Middle School 4 C 6-8 133 Predominately White
Elementary 4A C K-5 250 Predominately White
State 1 Elementary School 1 I K-6 129 Predominantly White
Elementary School 2 C K-6 79 Predominantly White
Elementary School 3 I K-6 151 75% American Indian, 25% White
Elementary School 4 C K-6 101 65% American Indian, 25% White
State 1 Middle School 1 I 6-8 131 Predominantly Hispanic
Elementary 1A I 1-5 202 Predominantly Hispanic
Middle School 2 C 6-8 188 Predominantly Hispanic
Elementary 2A C K-5 362 Predominantly Hispanic
Middle School 3 I 6-8 75 60% White, 40% Hispanic
Elementary 3A I K-5 147 50% White, 50% Black
Middle School 4 C 6-8 245 60% White, 40% Hispanic
Elementary 4A C K-5 520 65% White, 35% Hispanic
State 1 Elementary School 1 I K-8 444 50% White, 50% Black
Elementary School 2 C K-8 406 50% White, 50% Black
State 2 Elementary School 1 I K-12 988 100% Black
Elementary School 2 C K-12 539 100% Black
Elementary School 3 I K-8 649 Predominantly Black
Elementary School 4 C K-8 587 Predominantly BlackSou
thea
stM
idw
est
Upp
er
Mid
wes
tS
outh
wes
t
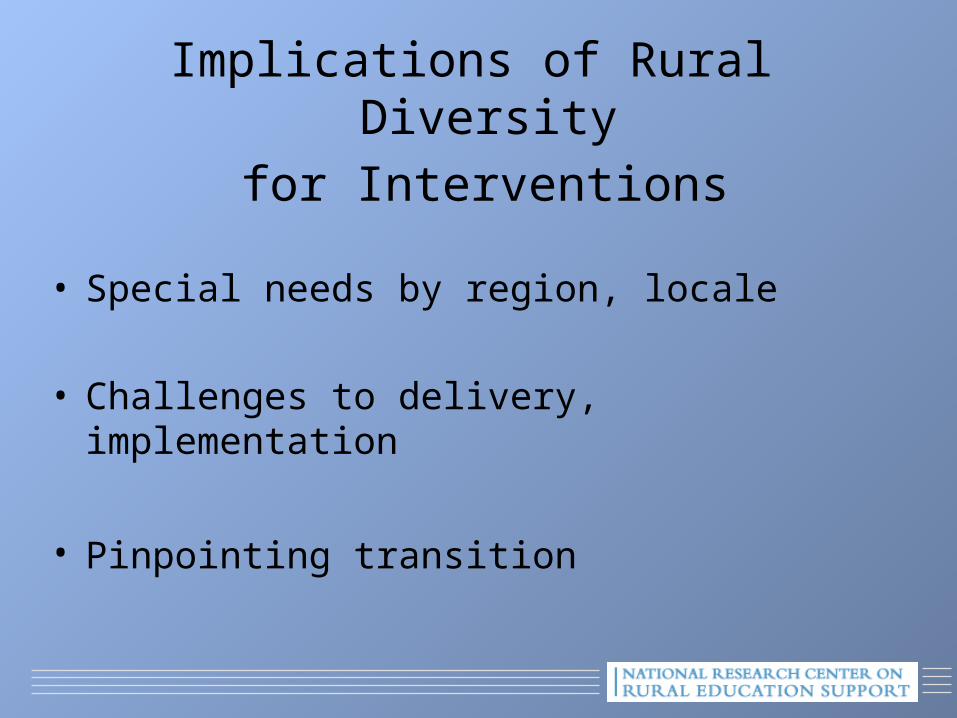
Implications of Rural Diversity for Interventions
• Special needs by region, locale
• Challenges to delivery, implementation
• Pinpointing transition
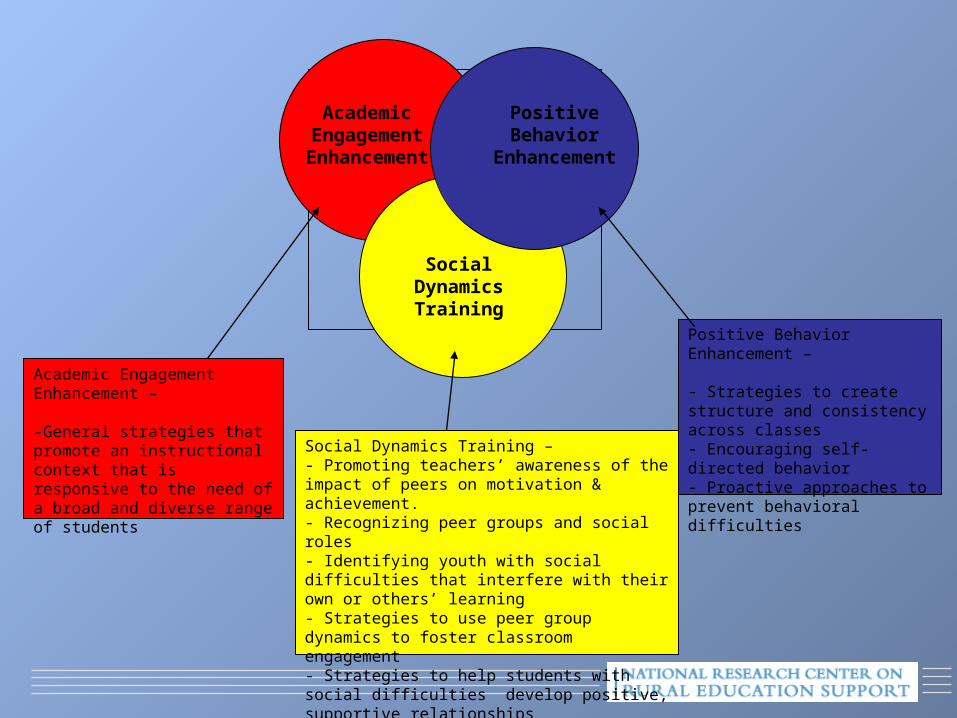
Positive Behavior
Enhancement
Academic Engagement
Enhancement
Social Dynamics Training
Academic Engagement Enhancement –
-General strategies that promote an instructional context that is responsive to the need of a broad and diverse range of students
Positive Behavior Enhancement –
- Strategies to create structure and consistency across classes- Encouraging self-directed behavior- Proactive approaches to prevent behavioral difficulties
Social Dynamics Training – - Promoting teachers’ awareness of the impact of peers on motivation & achievement.- Recognizing peer groups and social roles- Identifying youth with social difficulties that interfere with their own or others’ learning- Strategies to use peer group dynamics to foster classroom engagement- Strategies to help students with social difficulties develop positive, supportive relationships
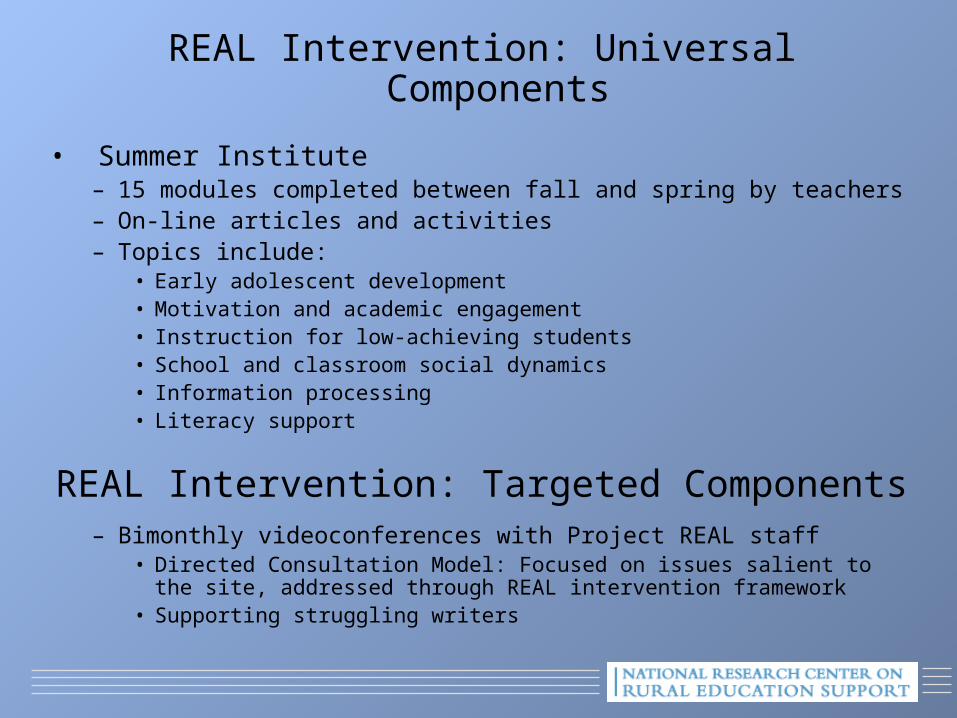
REAL Intervention: Universal Components
• Summer Institute– 15 modules completed between fall and spring by teachers– On-line articles and activities– Topics include:
• Early adolescent development• Motivation and academic engagement• Instruction for low-achieving students• School and classroom social dynamics• Information processing• Literacy support
REAL Intervention: Targeted Components– Bimonthly videoconferences with Project REAL staff
• Directed Consultation Model: Focused on issues salient to the site, addressed through REAL intervention framework
• Supporting struggling writers
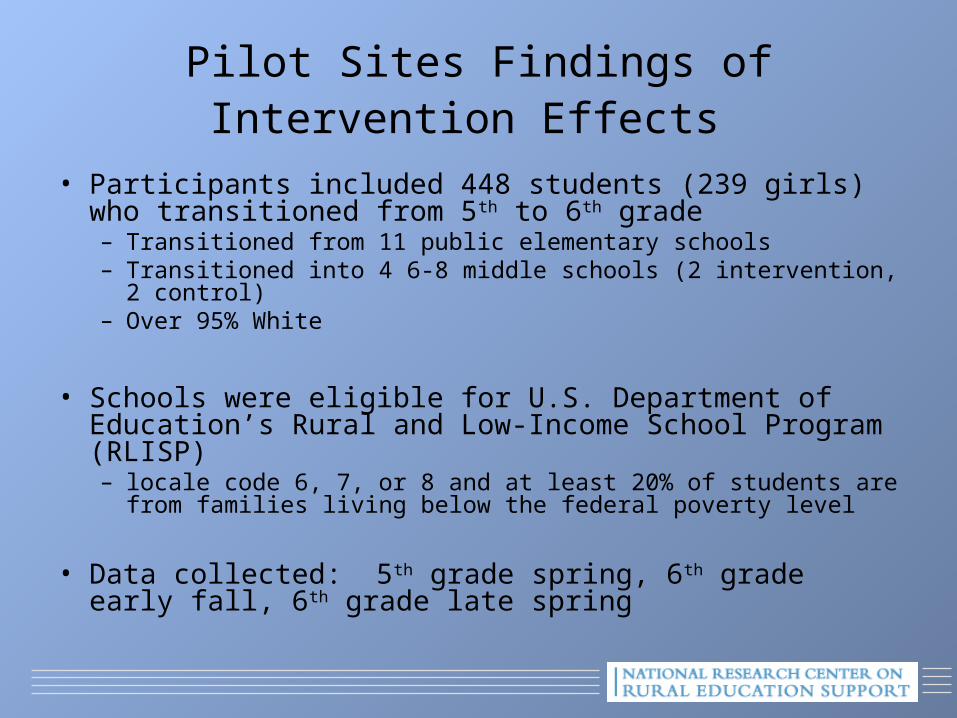
Pilot Sites Findings of Intervention Effects
• Participants included 448 students (239 girls) who transitioned from 5th to 6th grade– Transitioned from 11 public elementary schools– Transitioned into 4 6-8 middle schools (2 intervention, 2 control)– Over 95% White
• Schools were eligible for U.S. Department of Education’s Rural and Low-Income School Program (RLISP) – locale code 6, 7, or 8 and at least 20% of students are from
families living below the federal poverty level
• Data collected: 5th grade spring, 6th grade early fall, 6th grade late spring
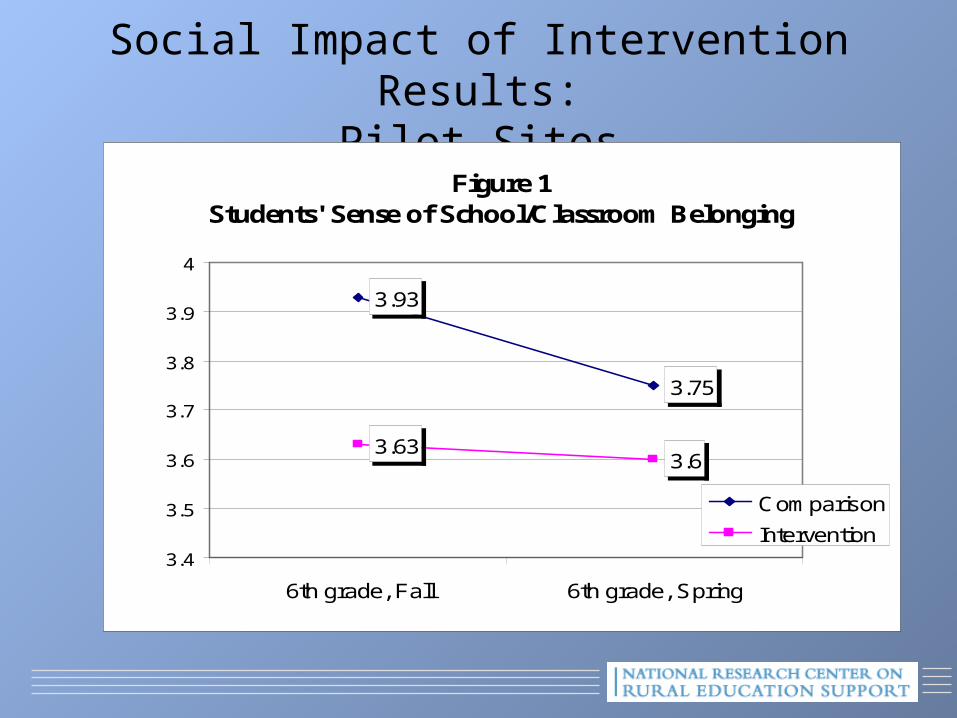
Social Impact of Intervention Results:Pilot Sites
Figure 1Students' Sense of School/Classroom Belonging
3.93
3.75
3.633.6
3.4
3.5
3.6
3.7
3.8
3.9
4
6th grade, Fall 6th grade, Spring
Comparison
Intervention
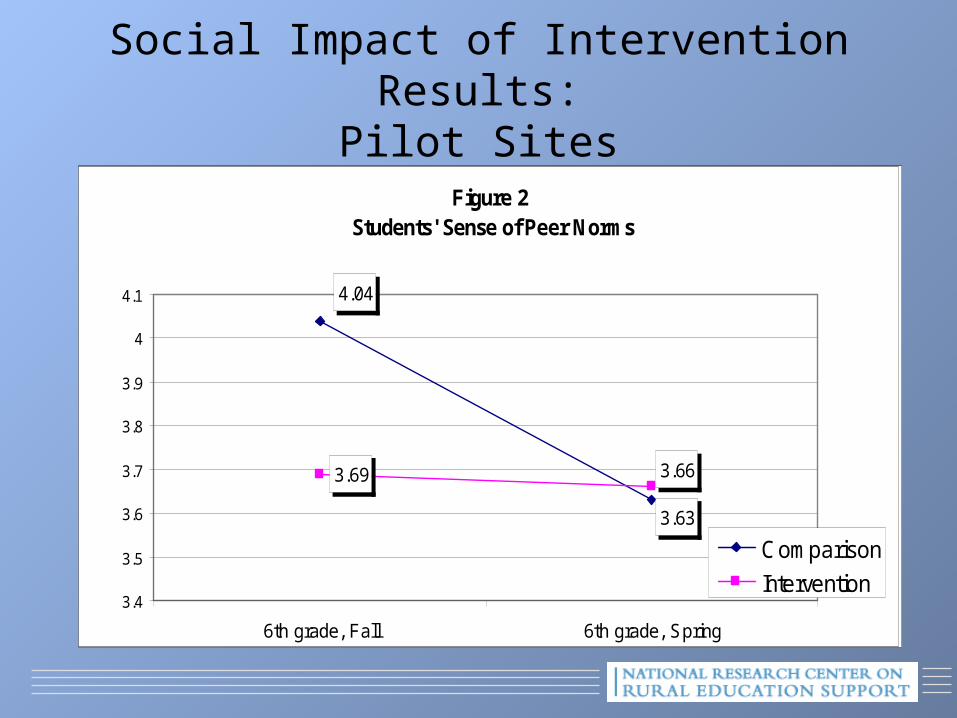
Social Impact of Intervention Results:Pilot Sites
Figure 2 Students' Sense of Peer Norms
4.043.98
3.63
3.93
3.69
3.66
3.4
3.5
3.6
3.7
3.8
3.9
4
4.1
5th grade, Spring 6th grade, Fall 6th grade, Spring
Comparison
Intervention
Figure 2 Students' Sense of Peer Norms
3.63
4.04
3.69 3.66
3.4
3.5
3.6
3.7
3.8
3.9
4
4.1
6th grade, Fall 6th grade, Spring
Comparison
Intervention
Summary of Pilot Site Findings
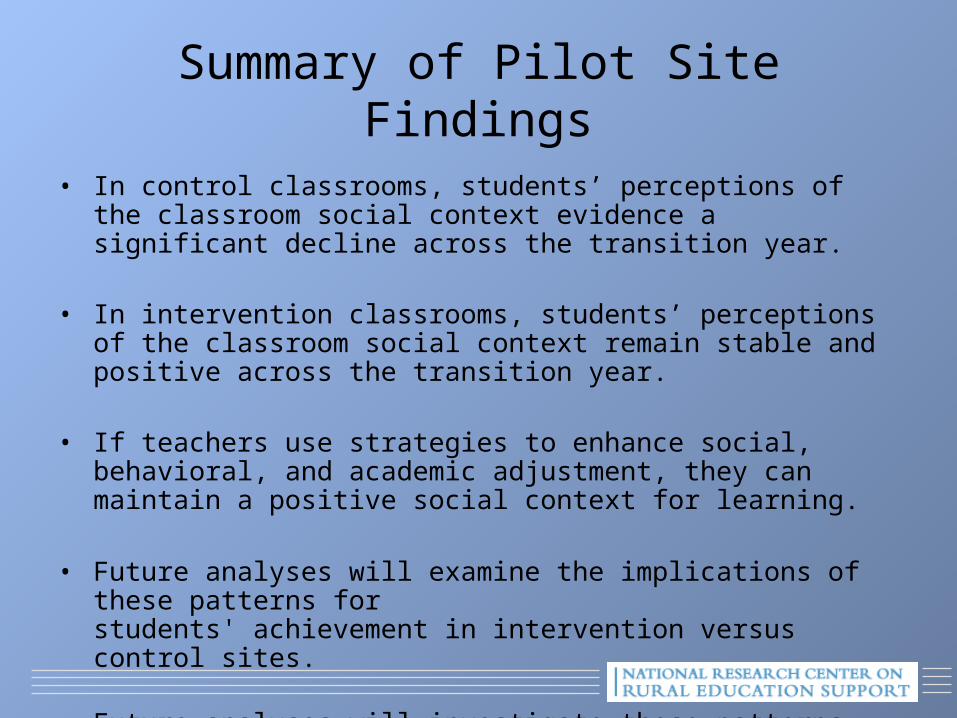
• In control classrooms, students’ perceptions of the classroom social context evidence a significant decline across the transition year.
• In intervention classrooms, students’ perceptions of the classroom social context remain stable and positive across the transition year.
• If teachers use strategies to enhance social, behavioral, and academic adjustment, they can maintain a positive social context for learning.
• Future analyses will examine the implications of these patterns forstudents' achievement in intervention versus control sites.
• Future analyses will investigate these patterns across a larger and diverse sampling of sites, and in relation to differences in student risk pre-transition and school characteristics, and using HLM.
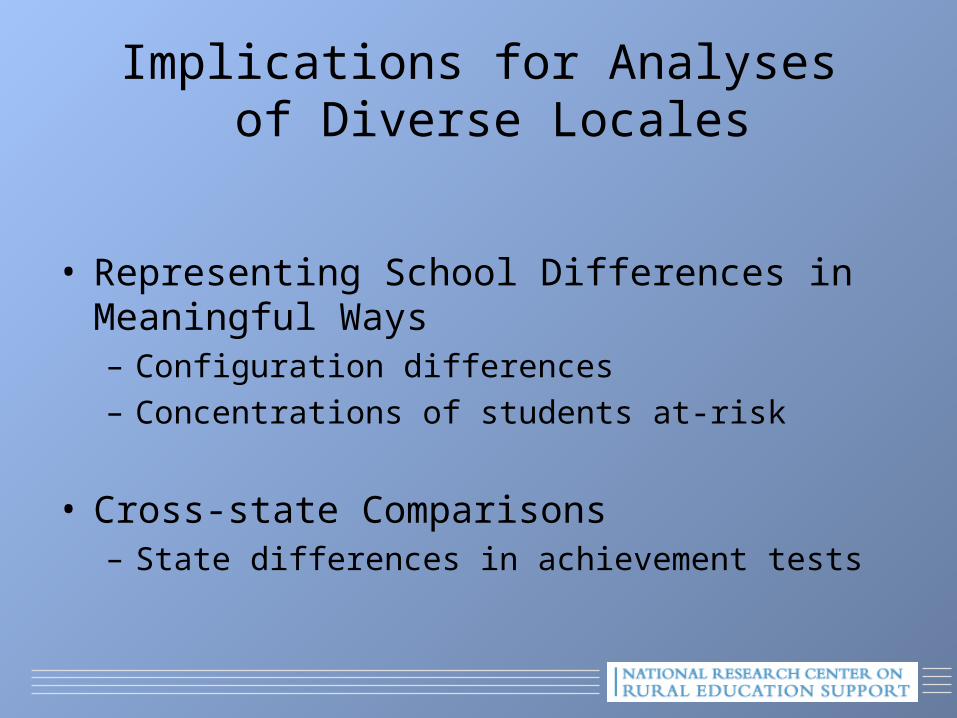
• Representing School Differences in Meaningful Ways– Configuration differences– Concentrations of students at-risk
• Cross-state Comparisons– State differences in achievement tests
Implications for Analyses of Diverse Locales
Conducting Educational Interventions in Diverse Rural Contexts: Issues,
Challenges, and Lessons Learned
Thomas W. Farmer Pennsylvania State University
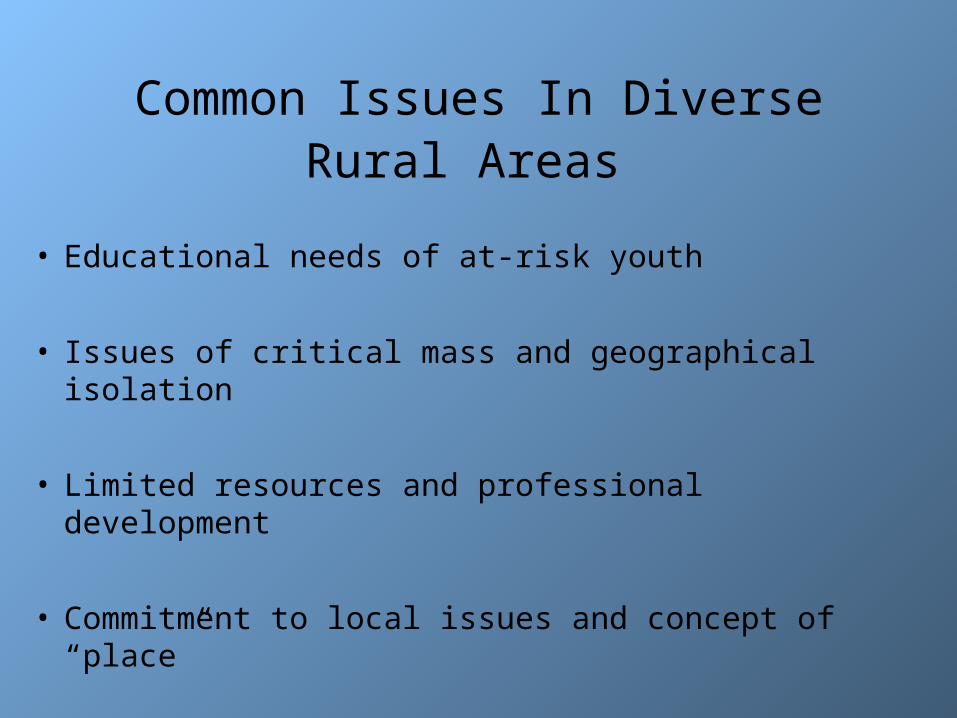
Common Issues In Diverse Rural Areas
• Educational needs of at-risk youth
• Issues of critical mass and geographical isolation
• Limited resources and professional development
• Commitment to local issues and concept of “place”
Diversity in Issues Faced by Rural Areas
• Different types of at-risk youth
• Different school structures and approaches for addressing isolation and issues of critical mass
• Different levels and configurations of providing supports and professional development
• Local values, expectations, and support for education differ from community to community
Challenges for Developing and Evaluating Standardized Interventions
• Must include universal and targeted interventions that can be adapted to both the general and unique populations of each district while maintaining standardization
• Must accommodate different configurations of grouping students and supporting teachers while guarding against biases that may be introduced by these differences
• Intervention must complement existing curricula
• Must be responsive to the fact that each community views themselves as unique and not fitting a standard curriculum or model of support
Lessons Learned: Rural Intervention Research
• There is more than one “rural” – Intervention design must be responsive to different contexts – Research design can be challenging and identifying comparable
sites for randomization is very difficult
• Increased research costs – Variability in district and school configurations, critical mass – Isolation increases both staffing and travel costs
• “Place” matters– Pride, loyalty, and identity linked to the land or the community – Expectation that curriculum and instruction is linked to place – School is viewed as a primary anchor of the community
General Lessons Learned: Developing Interventions that can be “Scaled-Up”
• Anticipate highly varied contexts in the intervention
development phase
• Assess the degree to which the intervention is “instruction dependent” and “context dependent” – Instruction (e.g., reading, writing) – Context (e.g., social, behavioral)
• Create a delivery format that promotes flexibility and “local tailoring” in preparing teachers for implementation – Directed consultation (standard content and aims) – Embedded in the local curricula and instructional philosophies