Embed Size (px)
Citation preview
ADMINISTRATIVELY-MEDIATED VARIABLES AND OUTCOMES
OF HOSPITALIZED INJURED OLDER ADULTS
By
Cathy A. Maxwell
Dissertation
Submitted to the Faculty of the
Graduate School of Vanderbilt University
in partial fulfillment of the requirements
for the degree of
DOCTOR OF PHILOSOPHY
in
Nursing Science
May 2012
Nashville, Tennessee
Approved:
Professor Lorraine C. Mion
Professor Ann Minnick
Professor Mary S. Dietrich
Professor William F. Fallon

Copyright © 2012 by Cathy A. Maxwell All Rights Reserved
iii
D ED IC A TI ON
This dissertation is dedicated with love to my family, friends, and colleagues who have encouraged and supported me on this journey. Special attention is given to the following individuals: My Dissertation Chair, Dr. Lorraine Mion, a wonderful mentor. Without her guidance in so many areas of scholarship and role development, I would not be at this point. My mother, children, and friends, who supported me when hours of study remo ved me from activities and family time My husband and best friend, Kelly Maxwell, who provided continuous encouragement and reassurance as I progressed towards my dream. His love and support truly made this journey possible.
iv
A C K N O WL ED G EM EN TS
I would like to take this opportunity to express my gratitude to the following
individuals and groups who have contributed to the completion of my dissertation study.
First, I am truly grateful for having had the opportunity to study under an
outstanding cadre of senior researchers at Vanderbilt University School of Nursing. Each
and every faculty member with whom I interacted made a unique contribution to my
growth as a nurse scientist.
Second, I extend appreciation to other members of my dissertation committee, Dr.
Ann Minnick, Dr. Mary Dietrich, and Dr. William Fallon for their support and
uncompromising commitment to excellence.
Third, I would like to acknowledge the support of colleagues at Vanderbilt
University and Troy University who have walked alongside me during the past four
years. I extend a special thanks to my peers, Carrie and Shelley, for their camaraderie and
friendship.
Finally, I want to extend my appreciation to the Vanderbilt University School of
Nursing PhD Faculty Support Fund for providing funding for my dissertation research.
The assistance lifted a burden at a time when my energies needed to be focused on the
goal of completion.
v
TAB LE O F C ON TEN T
Page
DEDICATION ................................................................................................................... iii ACKNOWLEDGEMENTS ................................................................................................iv LIST OF TABLES ............................................................................................................ vii LIST OF FIGURES .............................................................................................................x Chapter I. INTRODUCTION ............................................................................................................1 Statement of the Problem ...........................................................................................1 Purpose of the Study ..................................................................................................3 Background and Significance ....................................................................................4 Research Aims .........................................................................................................10 Summary ..................................................................................................................11 II. LITERATURE REVIEW AND THEORETICAL FRAMEWORK ............................13 Theoretical Framework ............................................................................................13 Analysis of Relevant Literature ...............................................................................18 Summary ..................................................................................................................30 III. METHODOLOGY.......................................................................................................32 Overview ..................................................................................................................32 Data Sources ............................................................................................................33 Patient/Discharge Level Data..............................................................................33 Complementary Data Trauma Mortality Prediction Model (TMPM)...............................................34 Elixhauser Comorbidity Software..................................................................36 AHRQ Patient Safety Indicators ....................................................................40 American Hospital Association Survey ..............................................................43 Prior Study ..........................................................................................................43 Population/Sample/Setting.......................................................................................44 Data Collection Procedures (by Aims) ....................................................................45 Dataset Construction ................................................................................................52 Data Management & Quality Control ......................................................................52 Data Analysis Strategy (by Aims) ...........................................................................53
vi
Summary ..................................................................................................................56 IV. RESULTS ....................................................................................................................57 Participant Profile ....................................................................................................57 Aim One ...................................................................................................................63 Aim Two ..................................................................................................................87 Aim Three ..............................................................................................................101 V. DISCUSSION .............................................................................................................109 Sample Characteristics ...........................................................................................109 Aim One .................................................................................................................110 Aim Two ................................................................................................................115 Aim Three ..............................................................................................................118 Strengths and Limitations ......................................................................................121 Implications............................................................................................................125 Recommendations for Future Research .................................................................127 Conclusion .............................................................................................................129 Appendix A. INVENTORY OF ADMINISTRATIVELY-MEDIATED VARIABLES .................131 B. DISSERTATION STUDY VARIABLES ..................................................................146 C. SUMMARY OF STUDY AHRQ PATIENT SAFETY INDICATORS ....................155 D. STUDY SURVEY ......................................................................................................158 E. SUMMARY OF SURVEY CONTENT VALIDATION ............................................165 F. PRELIMINARY POSTCARD FOR SURVEY ..........................................................168 G. SURVEY COVER LETTER ......................................................................................169 H. FOLLOW-UP COVER LETTERS .............................................................................170 I. DIAGRAM OF DATASET CONSTRUCTION ..........................................................172 J. PERMISSIONS ............................................................................................................173 REFERENCES ................................................................................................................175
vii
LIST O F T AB L ES
Table Page
1.1. Summary from Five Systematic Reviews on Predictors and Practices Associated with Outcomes in Hospitalized Older Adults.............................................6
2.1. Overview of Selected Administratively-Mediated Variables .....................................20 2.2. Patient Safety Indicator Rates by Groups ...................................................................30 3.1. Overview of Data Categories and Data Sources .........................................................32 3.2. Elixhauser Comorbidities (within HCUP NIS)...........................................................37 3.3. Example of Elixhauser Method ..................................................................................37 3.4. Elixhauser Comorbidity Groups and Their Associated Point Values Based on Walraven et al. (2009) .................................................................................38 3.5. Summary of Comorbidities and Total Comorbidity Points within Total Patient Sample ...........................................................................................................40 3.6. Profile of Hospital-Level Patient Characteristics .....................................................49 3.7. Patient Safety Indicators: Cases and Rates within Patient-Level Sample ..................51 4.1. Descriptive Statistics of Sample Hospitals and their Patients of Injured Older Adults Age 65 and Older ................................................................................60 4.2. Profile of HIOA Patients in the HCUP NIS with HIOA Patients in Sample Hospitals .......................................................................................................62 4.3. Summary of Adoption of Nine Targeted Quality Indicators ....................................65 4.4. ACOVE Indicator 1: Adoption of Multi-dimensional Assessment of Cognition by Hospital Characteristics ......................................................................68 4.5. ACOVE Indicator 2: Adoption of Assessment for Functional Status by Hospital Characteristics ............................................................................................70 4.6. ACOVE Indicator 3: Adoption of Documented Assessment for Etiology of Delirium by Hospital Characteristic ......................................................................72
viii
4.7. ACOVE Indicator 4: Adoption of Documented Plan to Increase Mobility within 48 Hours of Admission by Hospital Characteristics ......................................74 4.8. ACOVE Indicator 5: Adoption of Documented Screening of Surgical Patients for Risk Factors for Delirium Prior to Surgery by Hospital Characteristic ............................................................................................................76 4.9. ACOVE Indicator 6: Adoption of Patients Ambulatory Prior to Surgery are Ambulated by Postoperative Day #2 by Hospital Characteristics .............................78 4.10. ACOVE Indicator 7: Adoption of Surgical Patients Screened for Delirium for 3 Days Postop by Hospital Characteristics .........................................................80 4.11. ACOVE Indicator 8: Adoption of Surgical Patients Assessed at Discharge for Cognitive and Functional Status with Comparison to Preoperative Levels by Hospital Characteristics............................................................................82 4.12. ACOVE Indicator 9: Adoption of Discharge Assessment for Level of Independence and Need for Home Health by Hospital Characteristics....................84 4.13. Summary of Study Hospitals with Partial to Complete Implementation of Nine Targeted ACOVE Indicators ............................................................................86 4.14. Descriptive Summary of Capital Input Administratively-Mediated Variables Variables by Sub-Category, Number of Hospitals with Submitted Data, Missing Cases, and Frequencies ...............................................................................88 4.15. Descriptive Summary of Organizational Facet Administratively-Mediated Variables by Sub-Category, Number of Hospitals with Submitted Data, Missing Cases and Frequencies ................................................................................90 4.16. Descriptive Summary of Labor Input Administratively-Mediated Variables by Sub-Category, Number of Hospitals with Submitted Data, Missing Cases, Frequencies, and Measures of Central Tendency ..........................................91 4.17. Correlations among Hospital-Level Patient Characteristics and Capital Inputs.........................................................................................................................93 4.18 Correlations among Hospital-Level Patient Characteristics and Organizational Facets................................................................................................95 4.19. Correlations among Hospital-Level Patient Characteristics and Labor Inputs.........................................................................................................................97
ix
4.20. Correlations of Patient Characteristics with ACOVE Indicator Index .....................98 4.21. Correlations of Administratively-Mediated Variables with ACOVE Indicator Indicator Index ..........................................................................................................99 4.22. Descriptive Summary of PSI #12: Postoperative Deep Vein Thrombosis or Pulmonary Embolus ................................................................................................102 4.23. Unadjusted Associations of Patient Characteristics and Rate of PSI #12 ..............103 4.24. Unadjusted Associations of Administratively-Mediated Variables with PSI #12 ....................................................................................................................104 4.25. Summary of Results from Hierarchical Multiple Linear Regression of PSI #12: Rates on Four Levels of Influence (Patient Characteristics, General Hospital Characteristics, Trauma Centers, Geriatric-Specific Characteristics)........................................................................................................107
x
LIST O F F IG UR ES
Figure Page
1.1 Development of Frailty with Advancing Age...............................................................8
2.1. Conceptual Framework: Minnick and Roberts Outcomes Production Framework ..................................................................................................................14 2.2. Adapted Conceptual Framework and Study Aims......................................................15 4.1. Process of Hospital and Patient (Discharges) Selection for Dissertation Study .........58
1
C H APT ER I
IN TR OD UC TI ON
Over the next 20 years, the U.S. will experience a dramatic increase in its older
population as a result of increased life expectancy and aging of the baby boom
generation. The effects will be felt throughout society, and particularly so in health care.
Caring for older adults poses many challenges. Older adults in healthcare settings present
complex clinical scenarios of chronic conditions, physiologic changes associated with
aging, and geriatric syndromes (e.g., cognitive impairment, falls, and malnutrition). The
rising demand for health services by an older population calls for innovative research
aimed at optimization of quality and cost effectiveness.
State me nt of the Proble m
Hospitalized injured older adults (HIOAs) are a vulnerable and understudied
complex picture, where care and management demand attention to both injury-related
and geriatric-specific issues. More than 47% of patients discharged from hospitals with a
primary injury diagnosis are age 65 or older (Agency for Healthcare Research and
Quality (AHRQ), 2008, 2009). Falls are the leading cause of injury, comprising more
than 60% of hospital admissions for injured patients over age 64 and over 80% of
hospital admissions after age 84 (Agency for Healthcare Research and Quality (AHRQ),
2
2008). By 2030, the number of injured older adults will exceed 7 million annually
(Centers for Disease Control and Prevention (CDC), 2009).
In spite of these striking statistics, much work is needed in the study of HIOAs.
Although patient characteristics as predictors of outcomes have been studied extensively,
organizational factors and processes of care associated with outcomes for HIOAs are
much less studied and may play a role in outcomes. Best practices specific to age-related
needs have barely begun to be addressed in trauma publications. Mortality is the most
studied outcome for HIOAs, yet the usefulness of mortality as an outcome measure may
not be optimal in light of expected decline in survival rates associated with aging. Other
outcomes such as readmission rates and development of adverse events may be more
pertinent to this population in understanding quality of care.
adverse events caused by the health care system (Institute of Medicine (IOM), Kohn,
Corrigan, & Donaldson, 2000). The report set forth a national agenda for improving
patient safety through design of safer systems. Since 1999, awareness of the importance
of patient safety has heightened; however, much scientific work is still needed to
determine organizational strategies for improving patient safety (Agency for Healthcare
Research and Quality (AHRQ), 2010; Clancy, 2009). This is particularly true in regards
to HIOAs. A national study examining the occurrence of potential patient safety events
among all injured adults revealed that adverse events related to hospitalization are
significantly higher among older trauma patients (Chang et al., 2008). The odds of
experiencing at least one adverse event during hospitalization increased from 1.48 to 1.83
3
(35%) between ages 65 and 90, compared with 1.06 to 1.38 (32%) in patients between
ages18 to 64 (Chang, et al., 2008). These findings demonstrate increasing susceptibility
to adverse events and likely reflect changes in baseline vulnerability associated with
aging. This highlights the importance and relevance of patient safety indicators as
outcome measures in research on HIOAs.
Purpose of the Study
The proposed study addresses the problem described above through a health
services approach with a focus on organizational factors and patient safety indicators.
Health services research (HSR) is aimed at optimizing health care outcomes within the
real world. HSR examines the delivery of health care within organizations, with an
ultimate goal of improving the health and well-being of individuals, families,
organizations, communities, and populations (AcademyHealth, 2008). This approach to
research reflects a belief that an array of factors contribute to patient outcomes, and that
the delivery of healthcare should be based on best available evidence from multiple sites
and large samples and populations.
A systematic review of predictors and outcomes for HIOAs revealed a dearth of
research on the contribution of organizational factors on outcomes for HIOAs, and an
absence of studies examining patient safety indicators (avoidable adverse events) as an
outcome measure (Maxwell & Mion, 2010, Unpublished Study-b). The purpose of this
study was to examine administratively-mediated variables (AMVs), or alterable
organizational factors within U.S. hospitals that might be associated with the occurrence
of adverse events for HIOAs in acute care settings.
4
Background and Signif icance
As previously stated, HIOAs represent a subpopulation that differs from the
broader adult population in both scope and complexity. A research agenda for HIOAs
should entail study of the effects of hospitalization and injury on aging persons since
each area is pertinent to outcomes. Care of the injured at trauma centers and care of
hospitalized older adults have been studied as separate entities, and over 70 studies have
specifically examined outcomes for HIOAs. However, few studies have incorporated
variables from all three areas (hospitalization, injury,aging) into study design. A synthesis
of literature (by the PI) within these domains (hospitalization, injury, and aging) provided
the foundation for development and design of the proposed study, reflecting an
overarching desire to understand the relative importance of both injury-specific and
geriatric-specific needs of HIOAs during hospitalization.
Hospita liza tion.
Hospitalization poses more risks for older patients as compared to younger
patients in three areas: 1) potential for iatrogenic issues (e.g., nosocomial infections,
medication errors); 2) baseline susceptibility to stressors (i.e., delirium, illness severity);
and 3) risk of geriatric syndromes (e.g., falls, skin breakdown) (Podrazik & Whelan,
2008)
outlined the interaction of aging and hospitalization in eight areas: muscle strength and
aerobic capacity, vasomotor stability, respiratory function, demineralization, urinary
incontinence, sensory deprivation, skin integrity, and nutritional status. These interactions
5
contribute to deconditioning, dizziness and falls, reduced oxygenation, pressure sores,
functional incontinence, and increased fracture risk (Podrazik & Whelan, 2008). Many
studies related to risks of hospitalization have been conducted on older hospitalized
patients. Findings from these studies are applicable to HIOAs as interactions of aging and
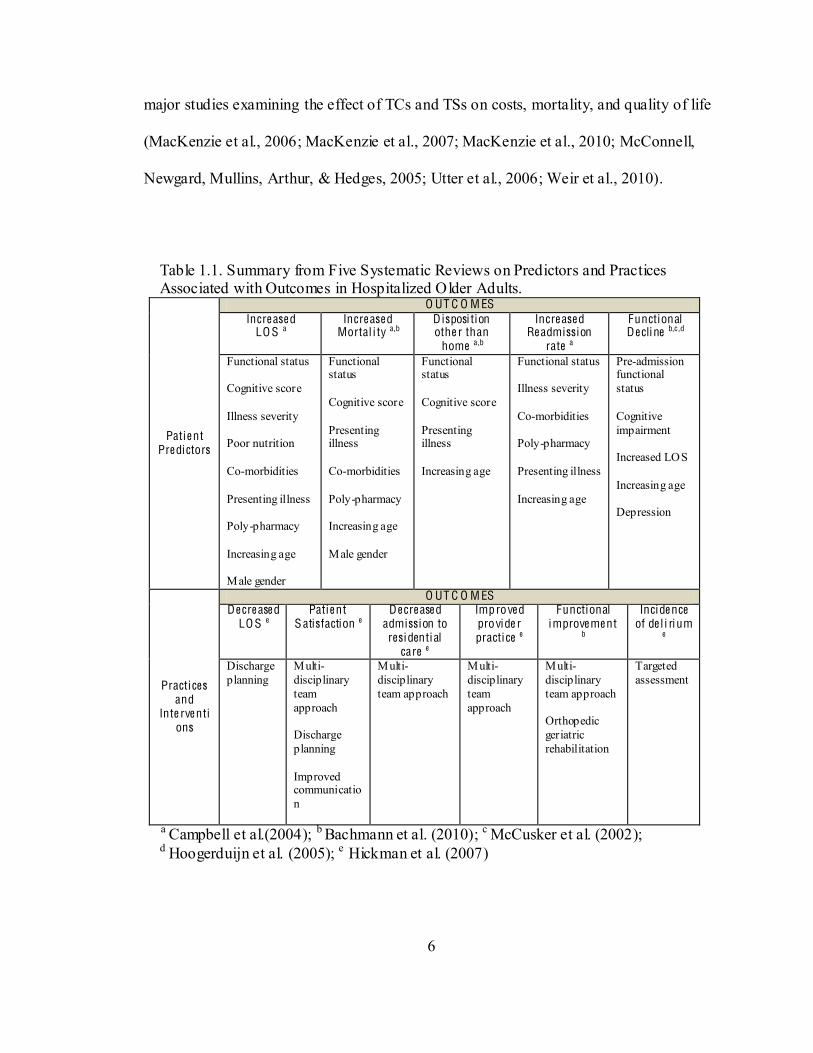
hospitalization are germane to all hospitalized older adults. Table 1.1 summarizes the
findings from five systematic reviews related to patient predictors and outcomes (e.g.,
functional improvement) for hospitalized older adults (Bachmann et al., 2010; Campbell,
Seymour, Primrose, & ACME plus project, 2004; Hickman, Newton, Halcomb, Chang, &
Davidson, 2007; Hoogerduijn, Schuurmans, Duijnstee, De Rooij, & Grypdonck, 2007;
McCusker, Kakuma, & Abrahamowicz, 2002). Of note, patient predictors of multiple
outcomes include functional status, cognitive impairment, presenting illness, and
increasing age. Practices associated with improvements in outcomes include discharge
planning and multidisciplinary teams.
Injury.
Within the US, trauma centers are considered the preferred/optimal acute care
facilities for management of injured patients. Interest in the efficacy of trauma centers
(TCs) and trauma systems (TSs) on patient outcomes has grown with the rise in health
services research and concern for quality and cost-effectiveness. Celso and colleagues
(2006) conducted a systematic review and meta-analysis of literature between 1966 and
August 2004 and assessed patient outcomes in states (or regions) with implemented
trauma systems. Investigators found a 15% reduction in mortality in favor of the presence
of an inclusive trauma system. In the past five years, R01 or R49 grants have resulted in
6
major studies examining the effect of TCs and TSs on costs, mortality, and quality of life
(MacKenzie et al., 2006; MacKenzie et al., 2007; MacKenzie et al., 2010; McConnell,
Newgard, Mullins, Arthur, & Hedges, 2005; Utter et al., 2006; Weir et al., 2010).
Table 1.1. Summary from Five Systematic Reviews on Predictors and Practices Associated with Outcomes in Hospitalized Older Adults.
Patie nt Pre dictors
O UT C O M ES Incre ase d
LO S a Incre ase d
Mortal i ty a,b D isposi tion othe r than
home a,b
Incre ase d Re admission
rate a
Functional De cli ne b,c ,d
Functional status Cognitive score Illness severity Poor nutrition Co-morbidities Presenting illness Poly-pharmacy Increasing age Male gender
Functional status Cognitive score Presenting illness Co-morbidities Poly-pharmacy Increasing age Male gender
Functional status Cognitive score Presenting illness Increasing age
Functional status Illness severity Co-morbidities Poly-pharmacy Presenting illness Increasing age
Pre-admission functional status Cognitive impairment Increased LOS Increasing age Depression
Practices and
Inte rve ntions
O UT C O M ES De cre ase d
LO S e Patie nt
S atisfaction e De cre ase d
admission to resi dential
care e
Improve d provide r practice e
Functional improve me nt
b
Inci de nce of de l i rium
e
Discharge planning
Multi-disciplinary team approach Discharge planning Improved communication
Multi-disciplinary team approach
Multi-disciplinary team approach
Multi-disciplinary team approach Orthopedic geriatric rehabilitation
Targeted assessment
a Campbell et al.(2004); b Bachmann et al. (2010); c McCusker et al. (2002); d Hoogerduijn et al. (2005); e Hickman et al. (2007)
7
Since 2004, over 20 studies have examined a variety of predictor variables
associated with outcomes among all adult injured populations, however, only three
examined outcomes in older injured patients (MacKenzie, et al., 2010; Marcin &
Romano, 2004; Rotondo et al., 2009). Each of these studies failed to demonstrate a
statistically significant difference in outcomes for HIOAs as compared to younger
patients. In a more recent study (Hsia et al., 2011) of California hospitals between 1999
and 2008, investigators examined the likelihood of an elderly patient receiving care in a
trauma center versus a non-trauma center. Although the study did not examine patient
outcomes, it revealed that increasing age was strongly associated with lower likelihood of
trauma center care and that the pattern was unchanged even with risk adjustment for
injury type and severity. Considering the complexities of injury severity, concomitant
with geriatric-specific issues, the role of trauma centers for HIOAs needs further study.
Aging.
The development of frailty with advancing age is an important factor in the study
of hospitalized older adults. Knowledge of the concept of vulnerabil ity, and its
relationship to the aging process, is necessary for an understanding of the importance of
the concept to research on HIOAs. Omission of this concept in health services research
on older adults may be responsible for many unanswered questions and conflicting
findings. F ra ilty is a widely used term describing vulnerable elders and is becoming a
recognized distinct clinical syndrome with a biological basis (Lang, Michel, & Zekry,
2009). Lang et al. discussed the indistinct borders between aging and frailty that can be a
confounding factor in studies if not understood. While normal aging results in
8
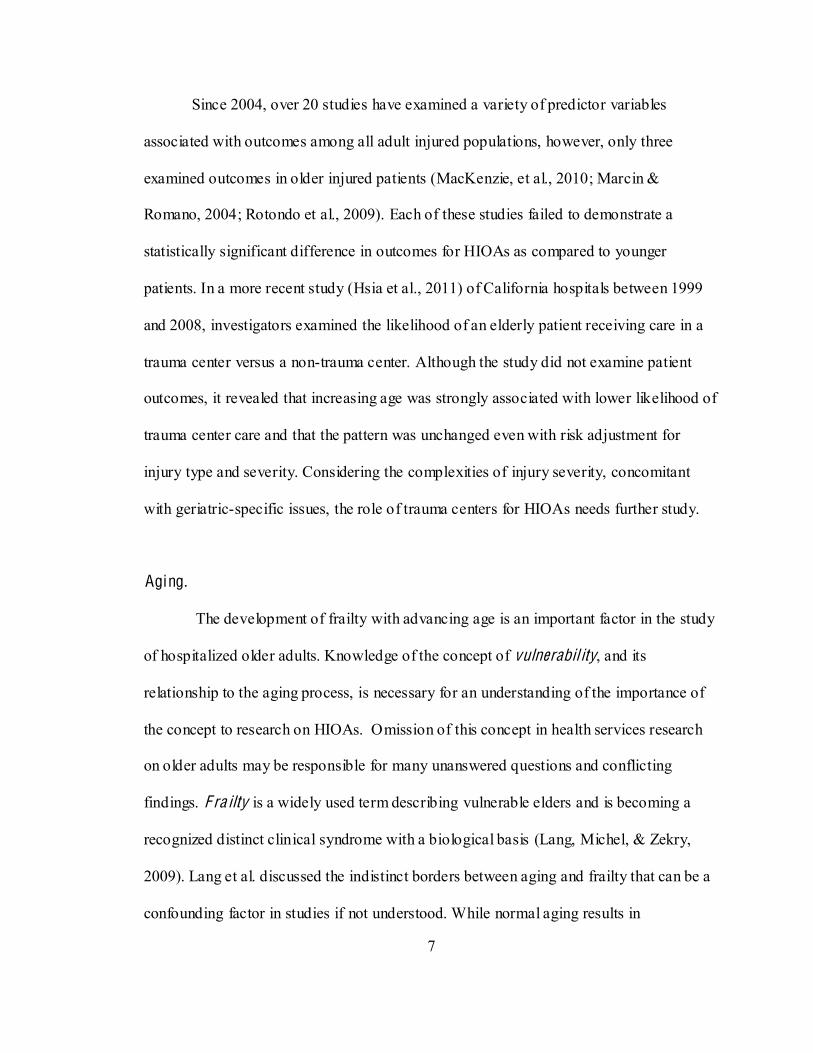
physiologic changes, frailty represents an extended process of increasing vulnerability
during which physiological reserve diminishes, resulting in impairments in mobility,
balance, muscle strength, motor processing, cognition, nutrition, endurance and physical
activity (Lang, et al., 2009). Figure 1.1 provides a visual aid for understanding the
concept of frailty. Of note, the pre-
occurring and physiologic reserves are sufficient for persons to respond adequately to
insults of disease, injury, or stress. The frailty cycle develops from an accumulation of
the effects of lack of physical exercise, poor nutrition, unhealthy environments, injuries,
disease, and drug use (all types) (Lang, et al., 2009). As such, it is noted that frailty can
affect more than the aging population, and that older persons can avoid frailty well into
advanced age. An awareness of this concept within the proposed study is necessary since
a greater percentage of older adults are affected by frailty in contrast to younger adults.
Figure 1.1. Development of Frailty with Advancing Age
PERFOR
MAN
CE
HOMEO
STATIC M
ECHA
NISM
COMPLICATION STATE Negative outcomes
PRE-‐FRAIL
FRAILTY
Response to external stressor(s)
Response to external stressor(s)
Normal aging
Clinically silent
Clinical deterioration
AGE
Frailty phenotype
(Lang, Michel, & Zekry, 2009)
DEVELOPMENT OF FRAILTY WITH ADVANCING AGE
9
The Assessing Care of Vulnerable Elders (ACOVE) project is among the most
(Wenger, Shekelle, & ACOVE
Investigators, 2001). The Vulnerable Elder Survey (VES-13) was developed to identify
frail older adults. Subsequent research deemed functional status to be the most important
predictor of death and functional decline (Wenger, et al., 2001). From a nationally
representative sample of community-dwelling adults age 65 and older, 32% were
vulnerable (had crossed a pre-frail to frail threshold), indicating a four-fold increase in
the risk of death or functional decline over a 2-year period (Min et al., 2009). The
percentage of older adults in a pre-frail stage has not been measured; however, an
awareness that a significant percentage of older adults may reside in both frail and pre-
frail stages underscores the importance of this concept for research in older populations.
Hospita lize d injure d olde r adults .
A systematic review of research published between 1980 and September 2010
was conducted to examine outcomes related to HIOAs (Maxwell & Mion, 2010,
Unpublished Study-b). Among 71 studies, over 60 examined patient characteristics, and
only 10 examined organizational factors associated with outcomes, including trauma
center care and trauma center volume. Findings indicated decreased mortality among all
injured patients at level I trauma centers. Only one study examined a geriatric-specific
intervention (geriatric trauma team) (Fallon et al., 2006).The association of patient
characteristics with outcomes demonstrated consistent findings with increasing age, male
10
gender, injury severity, pre-existing conditions, and physiologic demise as predictors of
worse outcomes.
Rese arch Aims
Further study on the relationship of organizational structures and processes with
outcomes is needed to begin to understand the role that hospital structures, resources, and
processes play in maintaining patient safety for HIOAs. The aims for the proposed study
were:
1. To determine the extent of adoption of targeted ACOVE (Assessing Care of
Vulnerable Elders) indicators for hospitalized injured older adults in acute care
settings;
2. To determine associations among administratively-mediated variables (AMVs),
patient characteristics, and the extent of adoption of ACOVE indicators for
HIOAs;
3. To determine the extent to which AMVs, including adoption of ACOVE
indicators, explain variations in patient safety indictors for HIOAs.
The study was accomplished through a descriptive design using: 1) a survey of
hospitals in 24 states, 2) 2009 American Hospital Association (AHA) Survey data, 3)
2009 Healthcare Cost and Utilization Project Nationwide In-patient Sample (HCUP NIS),
and variables from a previous study (Maxwell & Mion, 2010, Unpublished Study-a).
Datasets were constructed from these sources to describe the study sample and to conduct
analyses that addressed each of the study aims.
11
Aim One was addressed by a mailed survey to chief nursing officers (CNOs) in
U.S. hospitals in 24 states with a mail or web-based respondent-selected return
mechanism. Aim Two and Aim Three were addressed through utilization of the four data
sources listed above. Independent variables (AMVs) were obtained from the survey of
hospitals, AHA data, and the previous study. Aim Two
an intermediate outcome variable to determine
associations between AMVs, patient characteristics, and adoption of ACOVE indicators.
Aim Three was addressed by utilizing selected patient safety indicators (PSIs) derived
from the 2009 HCUP NIS, as outcome variables. Variations in hospital rates of four PSIs
were examined, and the extent to which AMVs explained variations was studied.
Aim One was proposed because ACOVE quality indicators that address cognitive
and functional impairment (leading predictors of mortality and increased length of stay)
have been shown to improve outcomes for hospitalized older adults. Aim Two was
proposed because characteristics of hospitals and characteristics of HIOAs associated
with adoption of ACOVE indicators were unknown. Aim Three was proposed because
relationships between AMVs and the rate of adverse events in HIOAs were unknown,
leaving little direction as to how to decrease HIOA adverse events.
Summa ry
This chapter provides the background and rationale for this dissertation study.
The study incorporated categories of AMVs from three domains (hospitalization, injury,
and aging) to study the relative importance of individual variables and clusters of
variables. The study also highlighted geriatric-specific ACOVE indicators related to
12
cognitive and functional impairment, prominent predictors of negative outcomes in older
adults. The following chapters discuss the study in detail. The theoretical framework and
review of relevant literature are covered in Chapter II. Chapter III presents the
methodology used to accomplish the study. Chapter IV presents the results, and Chapter
V discusses implications and recommendations for future research.
13
C H APT ER I I
LI TER A T UR E R E VI E W AN D TH E OR ET IC A L FR A M E W OR K
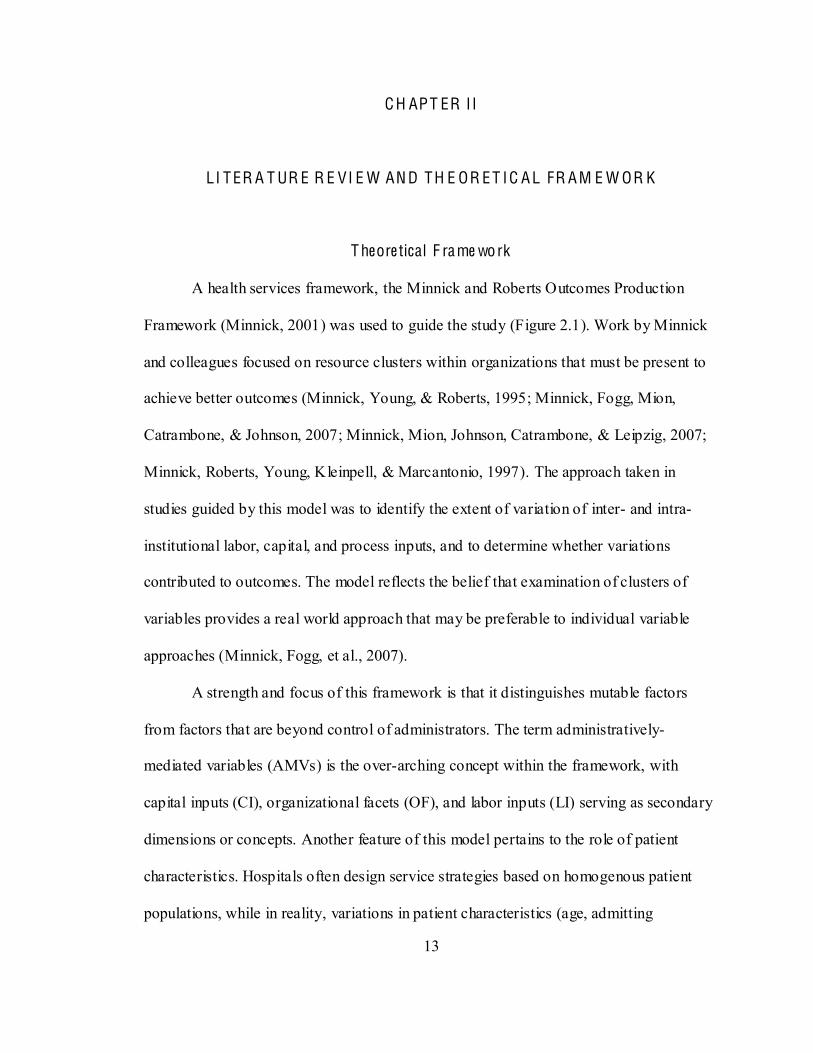
T heore tical F rame work
A health services framework, the Minnick and Roberts Outcomes Production
Framework (Minnick, 2001) was used to guide the study (Figure 2.1). Work by Minnick
and colleagues focused on resource clusters within organizations that must be present to
achieve better outcomes (Minnick, Young, & Roberts, 1995; Minnick, Fogg, Mion,
Catrambone, & Johnson, 2007; Minnick, Mion, Johnson, Catrambone, & Leipzig, 2007;
Minnick, Roberts, Young, Kleinpell, & Marcantonio, 1997). The approach taken in
studies guided by this model was to identify the extent of variation of inter- and intra-
institutional labor, capital, and process inputs, and to determine whether variations
contributed to outcomes. The model reflects the belief that examination of clusters of
variables provides a real world approach that may be preferable to individual variable
approaches (Minnick, Fogg, et al., 2007).
A strength and focus of this framework is that it distinguishes mutable factors
from factors that are beyond control of administrators. The term administratively-
mediated variables (AMVs) is the over-arching concept within the framework, with
capital inputs (CI), organizational facets (OF), and labor inputs (LI) serving as secondary
dimensions or concepts. Another feature of this model pertains to the role of patient
characteristics. Hospitals often design service strategies based on homogenous patient
populations, while in reality, variations in patient characteristics (age, admitting
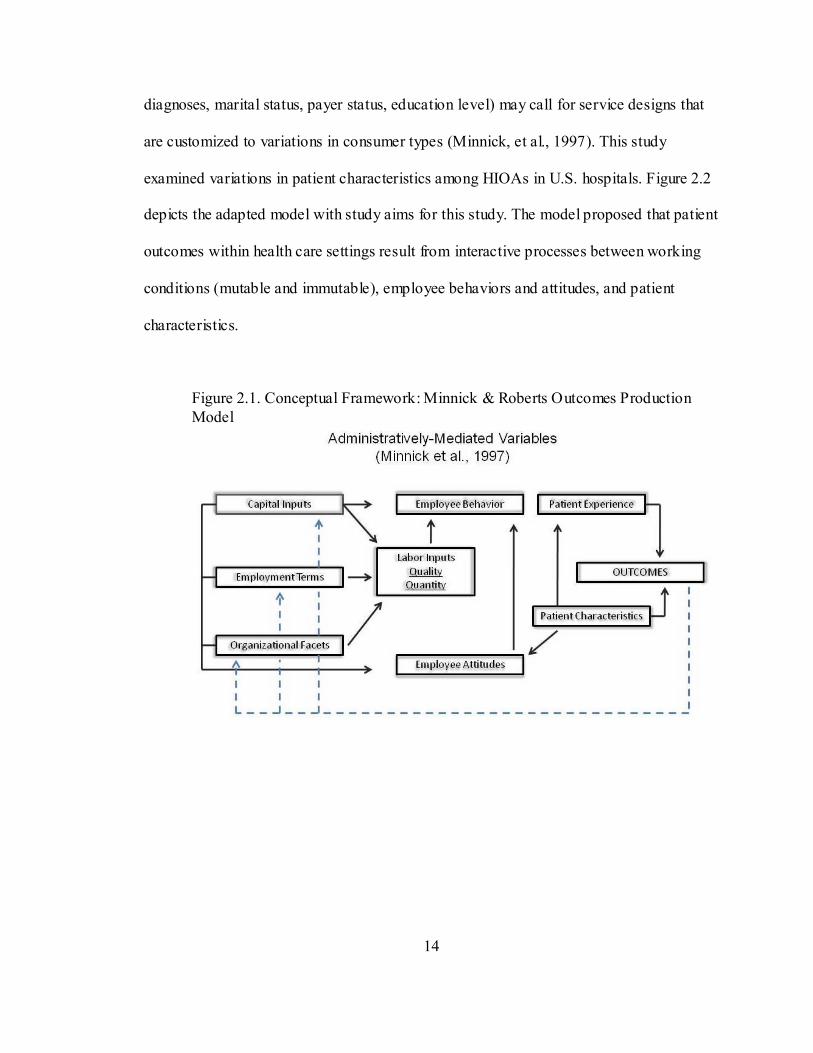
14
diagnoses, marital status, payer status, education level) may call for service designs that
are customized to variations in consumer types (Minnick, et al., 1997). This study
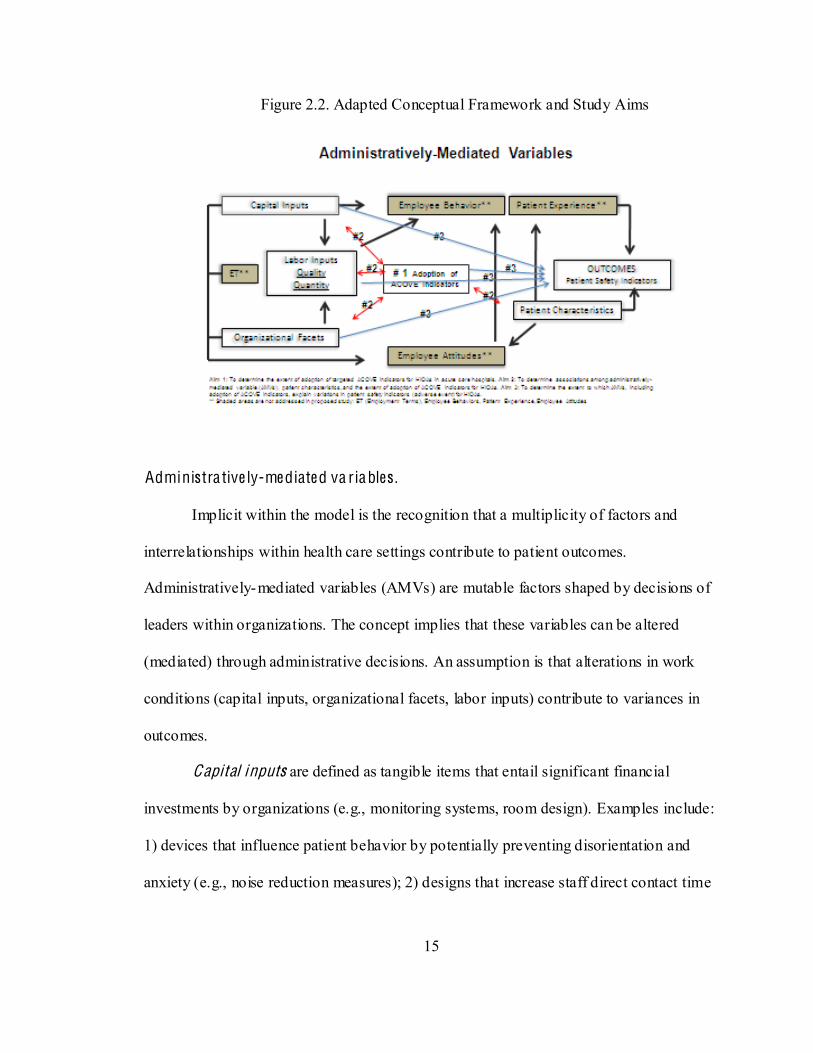
examined variations in patient characteristics among HIOAs in U.S. hospitals. Figure 2.2
depicts the adapted model with study aims for this study. The model proposed that patient
outcomes within health care settings result from interactive processes between working
conditions (mutable and immutable), employee behaviors and attitudes, and patient
characteristics.
Figure 2.1. Conceptual Framework: Minnick & Roberts Outcomes Production Model
15
Figure 2.2. Adapted Conceptual Framework and Study Aims
Administra tive ly-me diate d va riables .
Implicit within the model is the recognition that a multiplicity of factors and
interrelationships within health care settings contribute to patient outcomes.
Administratively-mediated variables (AMVs) are mutable factors shaped by decisions of
leaders within organizations. The concept implies that these variables can be altered
(mediated) through administrative decisions. An assumption is that alterations in work
conditions (capital inputs, organizational facets, labor inputs) contribute to variances in
outcomes.
Capi tal inputs are defined as tangible items that entail significant financial
investments by organizations (e.g., monitoring systems, room design). Examples include:
1) devices that influence patient behavior by potentially preventing disorientation and
anxiety (e.g., noise reduction measures); 2) designs that increase staff direct contact time
16
with patients (e.g., unit configurations, room-based supplies); and 3) measures that
provide for indirect patient assessment (e.g., monitoring, surveillance capabilities).
Employment terms are temporal (time-related) and workload requirements of
caregivers. This AMV category was not examined in this study.
Organizational facets are defined as work environment, work traits, and work
guides or organizational structures and procedures. Structures include traits within an
organizations that affect worker autonomy (e.g., Magnet facility, ACE unit); and
procedures include guidelines that influence the work environment (e.g., policies,
ability to exercise their expertise and direct standardization of work (Minnick, Fogg, et
al., 2007).
Labor inputs are defined as measures that reflect the quant ity of providers or the
quality (characteristics) of providers within settings. Quantity includes factors such as
number of RN FTEs or number of hospitalists; and quality includes factors such as nurse
certification and level of experience. Within the framework, a second assumption is that
labor inputs mediate the effects of capital inputs, employment terms, and organizational
factors, and influence employee behavior (actions taken by employees for patients).
Pat ient characterist ics represent baseline status at the outset of treatment and/or
the status before onset of the problem that requires treatment. Within any study,
investigators must consider patient-related elements considered to be most relevant to the
outcome(s). Consideration of the expected influence of each characteristic is an essential
step in study design. Within this study, patient characteristics were examined at the
organizational level (Aim Two) to determine if variations were associated with adoption
17
of ACOVE indicators, based on the premise that variations in patient characteristics and
expectations may call for system designs that are customized to different types of
consumers (Minnick, et al., 1997; Young, Minnick, & Marcantonio, 1996). A third
assumption within the framework is that patient characteristics influence employee
attitudes, patient experience, and patient outcomes.
Employee atti tudes reflect the internal disposition of employees. The pat ient
experience describes the objective and subjective experience of patients. (These concepts
were not examined in this study.)
A C O VE Qual ity Indicators (Q Is) (o rganiza tiona l face ts), a primary focus in this
study, were designated as an intermediate outcome for Aim Two (Figure 2.2). The
ACOVE Indicators, developed by RAND Health, include 392 quality indicators covering
26 conditions specific to vulnerable elders. ACOVE QIs follow an IF--THEN
BECAUSE format, with IF describing clinical characteristics of the patient; THEN
describing the care process that should or should not be performed; and BECAUSE
describing the expected health effect if the process is followed (Wenger, Roth, Shekelle,
& the A.I., 2007). Quality indicators for measuring quality of hospital care for older
adults were derived from 485 studies, resulting in 30 QIs in five areas: 1) general hospital
care, 2) pneumonia, 3) preoperative care, 4) peri-operative care, and 5) postoperative care
(Wenger, et al., 2007). Each indicator is derived from rigorous research (RCTs,
systematic reviews).
Nine of the ACOVE indicators for hospitalized older adults address measures
aimed at recognition of cognitive and functional impairment, and prevention of cognitive
and functional decline during hospitalization. These nine indicators are of particular
18
importance in light of research on the predictors of outcomes among hospitalized older
adults. Three systematic reviews of studies over several decades show that impaired
cognition and function are strong predictors of worse outcomes, including increased
length of stay, mortality, readmission rates, disposition other than home, and functional
decline (Campbell, et al., 2004; Hoogerduijn, et al., 2007; McCusker, et al., 2002).
Pat ient safety indicators (PSIs) were the outcome measures for this study. Patient
safety indicators are a set of measures developed by Agency for Healthcare Research and
Quality (AHRQ) that can be used with hospital inpatient discharge data to provide
perspective on patient safety by screening for problems that patients experience as a
result of exposure to the healthcare system (Agency for Healthcare Research and Quality
(AHRQ), 2007a). Indicators are likely amenable to prevention by changes at the system
or provider level. Twenty PSIs are provider- level indicators; however, only 10 of these
are applicable to trauma patients. Among the applicable PSIs, four were most applicable
to older trauma patients, including: 1) decubitus ulcers, 2) infections due to medical care,
3) postoperative hemorrhage or hematoma, and 4) postoperative pulmonary embolus or
deep vein thrombosis.
Ana lys is of Re le vant L ite ra ture
Administra tive ly-me diate d va riables .
An inventory approach was used to select AMVs for this study. This approach has
been used in prior studies (Longo, Hewett, Ge, & Schubert, 2005; Minnick, et al., 1997)
and is based on the premise that many system factors, human factors, and interactions
19
(clusters) contribute to optimal hospital care. Using this health services approach,
potential contributors (AMVs) to outcomes for HIOAs were sought within the literature
and an attempt was made to identify an inclusive list of the most salient variables.
Appendix A provides an inventory list that summarizes identified variables with
descriptions, rationale, and references for each variable. Criteria for variable selection
included: 1) recommendations by geriatric organization(s), 2) evidence from systematic
reviews of literature, 3) evidence from other research studies, and/or 4) published expert
opinion. Variables were subsequently examined for relevance to the basic concepts and
aims, as well as feasibility to measure with grading of these factors noted in Appendix A.
From the list, variables that could be obtained from the
study were identified. Variables to be measured by a survey of hospitals were selected
from the inventory and a survey instrument (discussed in detail in chapter 3) was
developed by the PI.
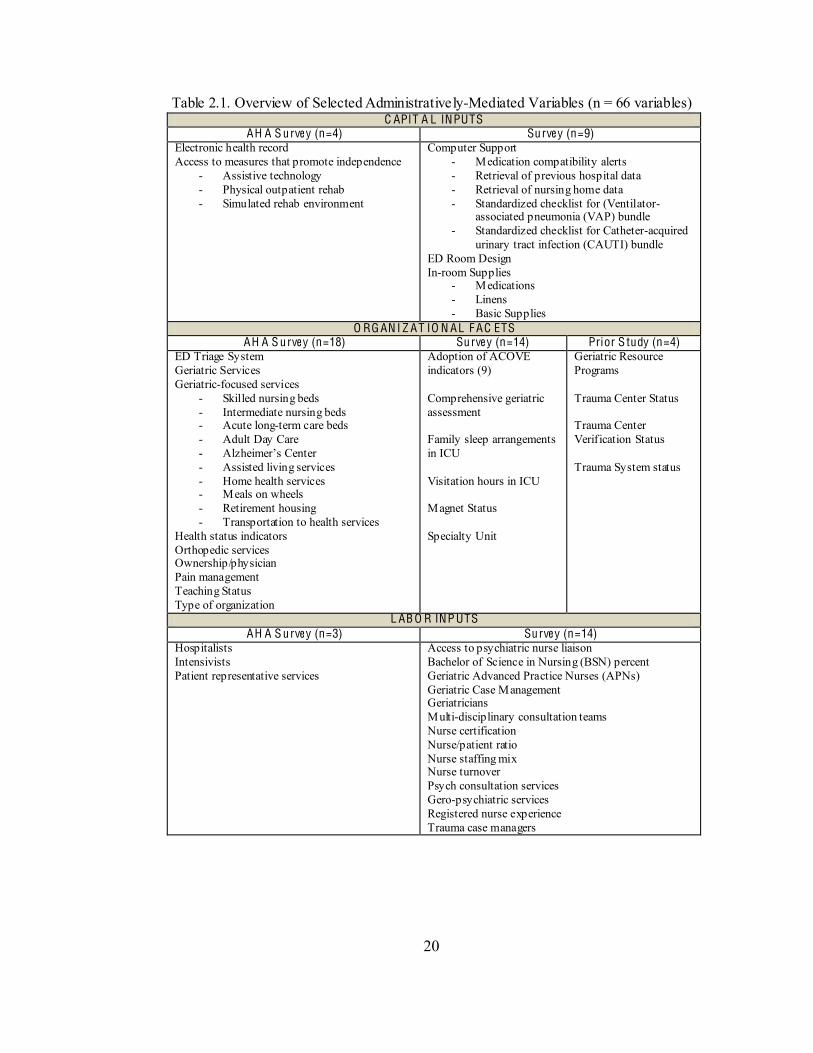
The AMV inventory list contained over 75 variables (Appendix A). Sixty-six
AMVs were selected for the study and conceptually categorized according to each AMV
category (CI, OF, LI), relevance to the research aims, and the source from which each
variable would be obtained (AHA, prior study, survey). Appendix B provides a detailed
summary of selected study variables, including conceptual and operational definitions,
variable types, instrument of measure, scale of measure, and aim(s) addressed. Table 2.1
provides an overview of selected AMVs categorized according to source.
20
Table 2.1. Overview of Selected Administratively-Mediated Variables (n = 66 variables) C APIT A L INPUTS
AH A S urve y (n=4) Surve y (n=9) Electronic health record Access to measures that promote independence
- Assistive technology - Physical outpatient rehab - Simulated rehab environment
Computer Support - Medication compatibility alerts - Retrieval of previous hospital data - Retrieval of nursing home data - Standardized checklist for (Ventilator-
associated pneumonia (VAP) bundle - Standardized checklist for Catheter-acquired
urinary tract infection (CAUTI) bundle ED Room Design In-room Supplies
- Medications - Linens - Basic Supplies
O RG AN I Z AT IO N AL F AC ETS AH A S urve y (n=18) Surve y (n=14) Prior S tudy (n=4)
ED Triage System Geriatric Services Geriatric-focused services
- Skilled nursing beds - Intermediate nursing beds - Acute long-term care beds - Adult Day Care - - Assisted living services - Home health services - Meals on wheels - Retirement housing - Transportation to health services
Health status indicators Orthopedic services Ownership/physician Pain management Teaching Status Type of organization
Adoption of ACOVE indicators (9) Comprehensive geriatric assessment Family sleep arrangements in ICU Visitation hours in ICU Magnet Status Specialty Unit
Geriatric Resource Programs Trauma Center Status Trauma Center Verification Status Trauma System status
L AB O R INP UTS AH A S urve y (n=3) Surve y (n=14)
Hospitalists Intensivists Patient representative services
Access to psychiatric nurse liaison Bachelor of Science in Nursing (BSN) percent Geriatric Advanced Practice Nurses (APNs) Geriatric Case Management Geriatricians Multi-disciplinary consultation teams Nurse certification Nurse/patient ratio Nurse staffing mix Nurse turnover Psych consultation services Gero-psychiatric services Registered nurse experience Trauma case managers
21
A C O V E indicato rs .
As noted earlier, the aims of this study emphasize ACOVE indicators targeted to
cognitive and functional status. The rationale for this emphasis was based on empirical
evidence that cognition and functional ability were significant predictors of worse
outcomes among hospitalized older adults and that indicators targeted to cognition and
function improved multiple outcomes. Hence, it followed that measures aimed at
recognition of these conditions and prevention of further impairment might also be
associated with variations in PSI rates. This section provides a review of each ACOVE
indicator within the study, followed by a brief summary of supportive evidence.
M ultidime ns ional assessme nt of cognition upon admiss ion.
An indirect line of evidence supports this indicator. Cognitive assessment can: 1)
identify the presence of dementia, depression, or delirium; 2) determine patient readiness
to learn; and 3) predict subsequent outcomes related to hospitalization. Identification of
cognitive impairment on admission can alter the workup and management of patients,
leading to vigilance aimed at preventing further decline (McCusker, Cole, Dendukuri,
Belzile, & Primeau, 2001). Concerning patient safety, one study revealed associations
between reported adverse events (i.e., falls and nursing errors) and patients with mild to
moderate cognitive impairment (Watkin, Blanchard, Tookman, & Sampson, 2012). A
meta-analysis of predictors for nursing home admission revealed that cognitive
impairment is one of three primary predictors for nursing home admission (Gaugler,
Duval, Anderson, & Kane, 2007). Dementia guidelines promote documentation of
cognitive ability on admission to the hospital (Costa Jr et al., 1996; Eccles, Clarke,
22
Livingston, Freemantle, & Mason, 1998; Small et al., 1997). Detection of unrecognized
cognitive impairment can also lead to enhanced family involvement and participation in
targeted interventions.
Assessme nt of funct ional status on admiss ion.
Functional impairment on admission to hospitals is a leading predictor of further
functional decline, increased length of stay, geriatric syndromes, and readmissions (de
Saint-Hubert et al., 2010; de Saint-Hubert, Schoevaerdts, Poulain, Cornette, & Swine,
2009; Hoogerduijn, et al., 2007). Screening patients upon admission enables better care
planning and incorporation of targeted interventions to prevent further decline.
Establishing baseline function through simple screening on admission can identify
patients at increased risk for in-hospital ADL decline and failure to recover
(Lindenberger et al., 2003).
Docume nte d assessme nt fo r e tio logy of de li r ium.
Studies show that cognition is often impaired during hospitalization in older
adults and that there is potential for improvement, both during and after hospitalization
(Fields, MacKenzie, Charlson, & Perry, 1986; Hickey, Clinch, & Groarke, 1997;
Lindquist, Go, Fleisher, Jain, & Baker, 2011). Potential etiologies for delirium include
acute illness, infection, impaired hemodynamics, medications, and environmental change.
Other studies suggest that linking the occurrence of delirium to a potential etiology may
improve cognitive and functional recovery (Lundström et al., 2005; McCusker, Cole,
Dendukuri, Han, & Belzile, 2003). Educational interventions for health care providers
23
focused on assessment, prevention, and treatment of delirium resulted in lower rates o f
delirium, quicker recovery, and better post-discharge outcomes (Lundström, et al., 2005;
McCusker, et al., 2003; Mudge, Giebel, & Cutler, 2008).
Docume nte d plan to inc re ase mobili ty within 48 hours of admiss ion.
Immobility is a risk factor for deconditioning, aspiration, pressure ulcers, deep
vein thrombosis, and falls. Focused measures that address early ambulation can minimize
or negate these adverse events. Studies show that early ambulation can reduce length of
stay by one to two days (Fisher, Kuo, Graham, Ottenbacher, & Ostir, 2010; Mundy, Leet,
Darst, Schnitzler, & Dunagan, 2003). Others advocate for proactive measures and
ambulation protocols aimed at improving quality and safety in older adults (Murphy,
2011).
Pre-op sc re e ning of ris k facto rs fo r de li rium.
Several studies have identified risk factors for delirium that can be detected
preoperatively. In a systematic review, dementia and severe medical illness were strongly
associated with postoperative delirium (Elie, Cole, Primeau, & Bellavance, 1998). Other
predisposing factors include vision impairment, cognitive impairment, alcohol abuse,
poor functional status, abnormal electrolytes, and blood urea nitrogen to creatinine ratio
of 18 or greater (Inouye, Viscoli, Horwitz, Hurst, & Tinetti, 1993; Marcantonio et al.,
1994). Early identification of these risk factors may promote prevention or earlier
detection and treatment of postoperative delirium, as well as adverse events associated
with delirium.
24
Ea rly ambulat ion afte r s urge ry.
Several RCTs revealed that early ambulation resulted in shorter length of stay and
more rapid attainment of functional goals between Days 6 and 10 (Delaney et al., 2003;
Larsen, Hansen, Thomsen, Christiansen, & Søballe, 2009; Munin, Rudy, Glynn, Crossett,
& Rubash, 1998). One of these studies (Larsen, et al., 2009) also showed that accelerated
perioperative rehabilitation protocols following hip and knee surgeries were more cost
effective than traditional care. Smith, Parvizi, and Purtill (2011) found that immobility
and delays in surgical intervention in patients with hip and femur fractures resulted in
increased incidence of deep vein thrombosis and pulmonary embolus. These findings,
along with previously discussed studies on early ambulation, suggest that recovery time
can be reduced, thus averting potential complications related to prolonged hospitalization.
De lirium sc re e ning fo r thre e days postop.
Delirium is commonly associated with poor outcomes in older adults. The
literature suggests that daily screening of elderly patients undergoing major surgery leads
to early detection of postoperative delirium (Ely et al., 2001; Hattori et al., 2009; Inouye
et al., 1999; Inouye, Foreman, Mion, Katz, & Cooney, 2001; Marcantonio, Ta, Duthie, &
Resnick, 2002). Another prospective study (de Jonghe et al., 2007) revealed that early
acute admission to the hospital, difficulty repeating and remembering words,
disorientation, pressured speech, and flight of ideas (de Jonghe, et al., 2007). Injured
25
older adults are often admitted acutely to hospitals and many undergo surgery,
highlighting the importance of delirium screening.
Cognit ive and funct ional assessme nt at disc ha rge and assessme nt fo r le ve l of
inde pe nde nce and ne e d fo r home he alth.
Pre-discharge screening for cognition and functional status may identify patients
with unmet needs. Studies have identified factors associated with the need for post acute
referral, including lack of informal caregiver support, major walking restrictions, low
self-rated health, higher depression scores, and number of comorbidities (Bowles et al.,
2009; Mamon et al., 1992). Addressing unmet needs may allay the need for readmission
and/or development of complications.
Of note, a recent study (Neuman, Speck, Karlawish, Schwartz, & Shea, 2010)
assessed the prevalence of protocols for 11 ACOVE indicators in Pennsylvania hospitals
(n=103). Five of the indicators examined in the study coincide with indicators examined
in this study. The percentage of hospitals that indicated the presence of written protocols
were as follows: 1) assessment of risk factors for delirium (21%); 2) screening for
delirium after surgery (17%); 3) timing of mobilization after surgery (34%); 4)
assessment of physical function at discharge (81%); and 5) assessment of cognition at
discharge (40%). The study also found that inpatient geriatric consultation was available
in 39% of hospitals and that teaching hospitals, as compared to non-teaching hospitals,
reported significantly higher rates of protocols for postoperative delirium screening
(Neuman, et al., 2010). These findings served as benchmarks for Aim One of this study.
Comparisons are discussed in Chapter V.
26
Pat ie nt safe ty indicato rs .
The outcome measures chosen for this study included four patient safety
indicators (PSIs) that were relevant to HIOAs. Mortality has been the most studied
outcome in this population. PSIs may be a preferable outcome to examine variations in
quality care among acute care settings, as PSI data elements provide an indirect measure
for assessing quality of inpatient care. Development of the AHRQ PSIs arose from the
of the health care system to improve quality (Institute of Medicine (IOM), et al., 2000).
The PSIs are measures designed for use with inpatient discharge data to provide
perspective on patient safety by screening for problems that patients experience as a
result of being within the healthcare system (Agency for Healthcare Research and Quality
(AHRQ), 2007a). The PSIs are also known as adverse events or complications arising
from medical care, thus, were pertinent as outcome measures since they are directly
related to provision of care within hospitals. While PSIs cannot define quality of care,
they can be used to identify specific issues/problems for further investigation.
Development of the AHRQ PSIs involved a detailed approach for identification,
development, and evaluation of PSIs that included review of literature, clinician panels,
expert coders, and empirical analysis (Agency for Healthcare Research and Quality
(AHRQ), 2007a). Detailed evidence for each PSI is available through AHRQ, including
definitions of the indicators, numerators and denominators for each and strength of
published evidence (Agency for Healthcare Research and Quality (AHRQ), 2007a).
Appendix C provides a summary of the four PSIs examined in this study. The following
27
sections provide an overview of each PSI and supportive evidence (if any) related to
HIOAs or hospitalized adults in general.
De cubitus ulce r.
This PSI is intended to detect cases of in-hospital decubitus ulcers in patients with
a length of stay greater than 4 days. Needleman and Buerhaus (2001) identified this
outcome as potentially sensitive to nursing. The ANA, state associations, and the
California Nursing Outcomes Coalition identi -sensitive
(Savitz, Jones, & Bernard, 1999). Studies have
reported pressure ulcer incidence rates in acute-care settings between 7% and 9%, and
prevalence rates between 14% and 17% (Comfort, 2008; Whittington & Briones, 2004).
No studies were found that examined incidence of decubitus ulcers in HIOAs. Of note,
one study in a single hospital compared AHRQ methodology for identification of
pressure ulcer PSIs with a medical record review and found that failure to accurately code
denominators for the PSI resulted in higher rates of pressure ulcers (Polancich, Restrepo,
& Prosser, 2006).
Infe ctions due to me dical ca re .
This PSI detects cases of infection related to intravenous (IV) lines and catheters.
The AHRQ project team found no published evidence to support the PSI constructs,
however, the ANA and state associations identified the number of bacteremic episodes
g-sensitive quality
(Savitz, et al., 1999). Three studies validated increased
28
incidence in nosocomial infections in older versus younger injured patients, however
associations with processes of care were not examined in these studies (Bochicchio,
Joshi, Knorr, & Scalea, 2001; Grossman et al., 2003; Tornetta et al., 1999).
Postope ra tive he morrhage or he matoma.
This PSI detects cases of bleeding (hemorrhage or hematoma) following a
surgical procedure. The AHRQ project team stratified this indicator for patients with
clotting differences (coagulopathies, on anticoagulants). The team also noted that patients
admitted for trauma may have a higher risk for developing this indicator. No studies were
found that examined this indicator in HIOAs, however, one study that compared hip
fracture patients in two management groups (usual care (n=121) vs. co-management with
orthopedist and geriatrician (n=193)) revealed a lower incidence of bleeding in the co-
managed group (unadjusted mean 3.3 versus 0, p = .02) (Friedman, Mendelson,
Bingham, & Kates, 2009). The adjusted p-value in this study was reported to be
one site not experiencing the outcome. A systematic review of
prehospital factors associated with severe injury in older adults (Scheetz, 2005), revealed
that anticoagulant and antiplatelet agents were associated with increased mortality and
increased length of stay. These studies highlight the importance of optimal management
of coagulopathies in HIOAs.
29
Postope ra tive PE o r D V T.
This PSI detects cases of postoperative venous thrombosis and embolism. The
AHRQ project team considered the usefulness of this indicator as high in relationship to
other PSIs since preventive techniques should decrease the rate of DVTs and PEs
(Agency for Healthcare Research and Quality (AHRQ), 2007a). Needleman and
Buerhaus (2001) did not find a relationship between nurse staffing and the occurrence of
DVT/PE; however, Kovner and Gergen (1998) found an association between more
registered nurse hours (and non-RN hours) and lower rates of DVT/PE after major
surgery. Friedman, Meldelson, Bingham et al. (2009) found lower rates of
thromboembolism in a group of hip fracture patients co-managed by a orthopedist-
geriatrician team vs. usual care (mean 0.5 vs. 5.0), (p < .05) (adjusted R2 = .07).
A final study that supported the use of PSIs as outcome measures for HIOAs
examined the occurrence of PSI events among trauma patients age 18 and older (Chang,
et al., 2008). The study used the HCUP NIS from 2000-2004 and enriched the data with
AHRQ PSIs, injury severity measures, and comorbidity measures. Ten applicable PSIs
were examined to determine the rate of occurrence of 1 or more PSIs in groups stratified
by age, gender, race, length of stay, hospital type, U.S. region, and calendar year. In the
overall trauma population, 1.43% of all patients experienced one or more PSIs. The
adjusted odds of experiencing a PSI began to rise after age 35 and increased markedly
after age 65 (p < .05) (ORs by age: 60-64, 1.38; 65-69, 1.48; 70-74, 1.62; 75-79, 1.61;
80-84, 1.61; 85-89, 1.64; 90+, 1.83). The adjusted odds of at least one adverse event
increased eight- fold for patients hospitalized for four or more days as compared to those
hospitalized for less than four days (p < .05, OR: 8.08) (Chang et al.). Statistically
30
significant associations were also found between higher injury severity and increased
occurrence of PSIs, as well as urban teaching hospitals and increased occurrence of PSIs
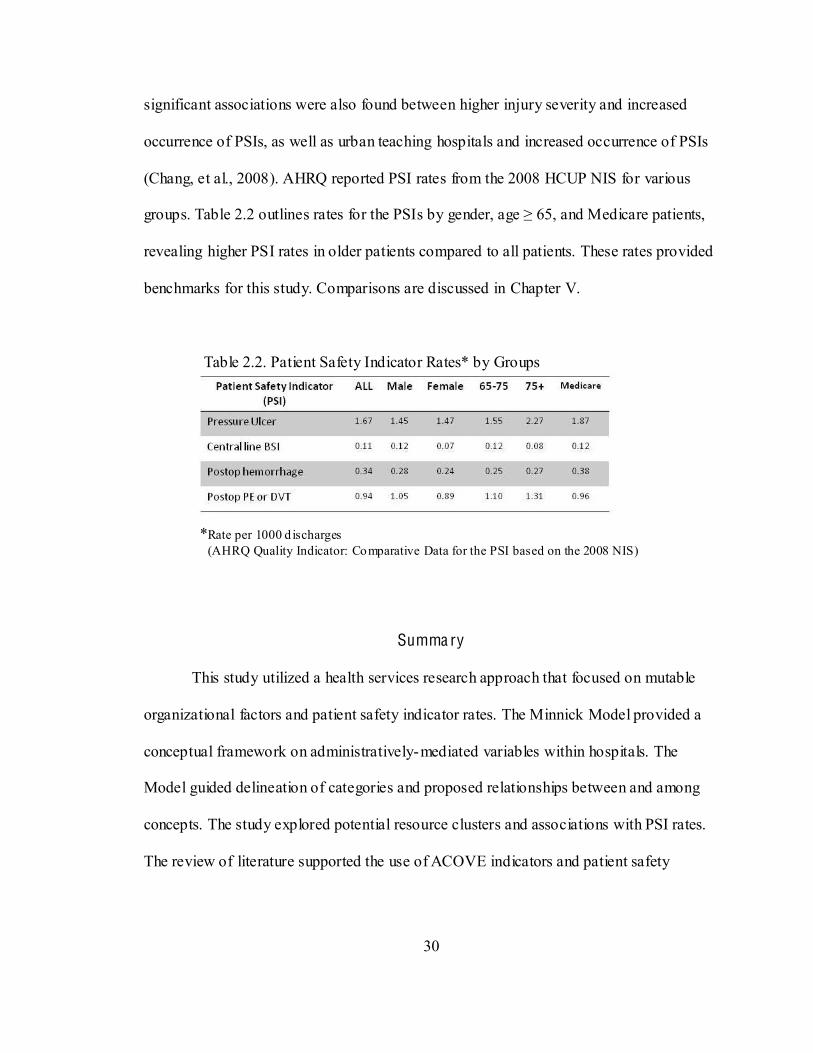
(Chang, et al., 2008). AHRQ reported PSI rates from the 2008 HCUP NIS for various
revealing higher PSI rates in older patients compared to all patients. These rates provided
benchmarks for this study. Comparisons are discussed in Chapter V.
Table 2.2. Patient Safety Indicator Rates* by Groups
*Rate per 1000 d ischarges (AHRQ Quality Indicator: Comparative Data for the PSI based on the 2008 NIS)
Summa ry
This study utilized a health services research approach that focused on mutable
organizational factors and patient safety indicator rates. The Minnick Model provided a
conceptual framework on administratively-mediated variables within hospitals. The
Model guided delineation of categories and proposed relationships between and among
concepts. The study explored potential resource clusters and associations with PSI rates.
The review of literature supported the use of ACOVE indicators and patient safety

31
indicators as pertinent variables for the study. The following chapter describes the
methodologies employed to meet the aims of the study.
32
C H APT ER I I I
M ETH OD O L O G Y
Ove rvie w
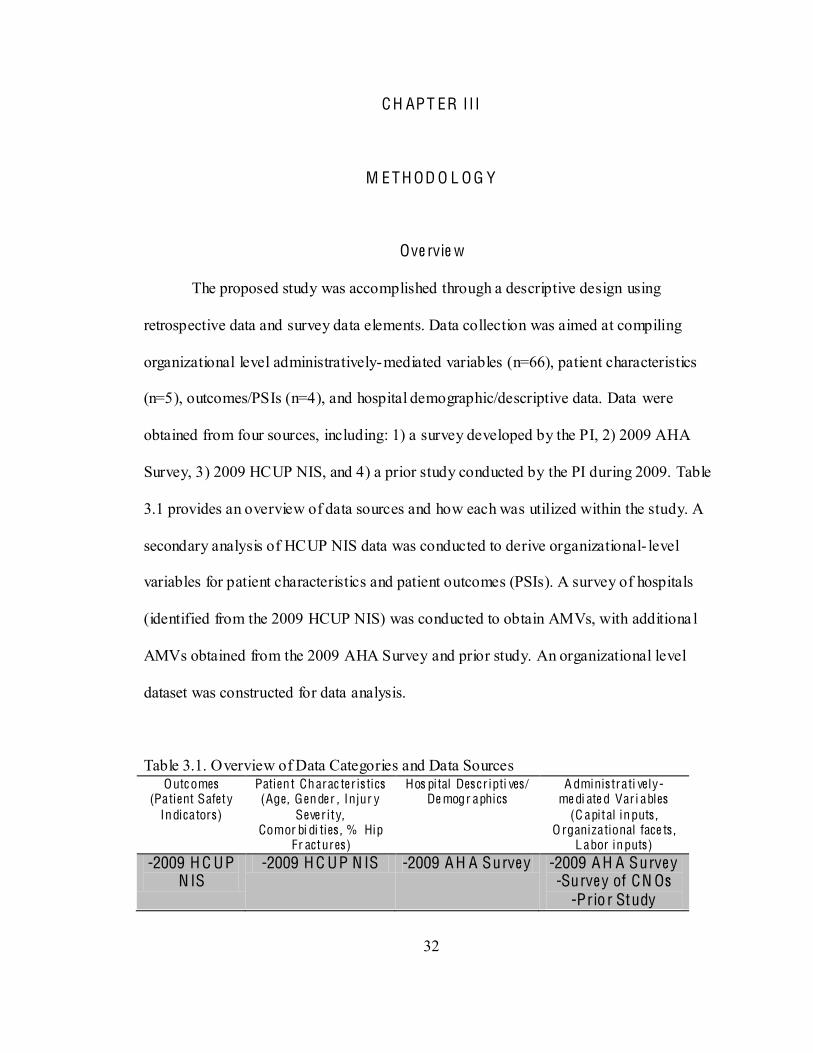
The proposed study was accomplished through a descriptive design using
retrospective data and survey data elements. Data collection was aimed at compiling
organizational level administratively-mediated variables (n=66), patient characteristics
(n=5), outcomes/PSIs (n=4), and hospital demographic/descriptive data. Data were
obtained from four sources, including: 1) a survey developed by the PI, 2) 2009 AHA
Survey, 3) 2009 HCUP NIS, and 4) a prior study conducted by the PI during 2009. Table
3.1 provides an overview of data sources and how each was utilized within the study. A
secondary analysis of HCUP NIS data was conducted to derive organizational- level
variables for patient characteristics and patient outcomes (PSIs). A survey of hospitals
(identified from the 2009 HCUP NIS) was conducted to obtain AMVs, with additiona l
AMVs obtained from the 2009 AHA Survey and prior study. An organizational level
dataset was constructed for data analysis.
Table 3.1. Overview of Data Categories and Data Sources Outc omes
(Patient Safety Indicators)
Patient Charac ter is tics (Age, Gender , Injur y
Sever i ty, Comor bi di ties , % Hip
Fr actures)
Hos pital Des cr ipti ves/ De mogr aphics
A dminis trati ve ly-me di ate d Var i ables
(C apital inputs , O rganizational face ts ,
L abor inputs) -2009 H C UP
N IS -2009 H C UP N IS -2009 A H A Surve y -2009 A H A Surve y
-Surve y of CN Os -Prio r Study
33
The purpose of this study was to examine administratively-mediated variables (AMVs),
or alterable organizational factors within U.S. hospitals that might be associated with the
occurrence of adverse events for HIOAs in acute care settings.
Study Aims
1) To determine the extent of adoption of targeted ACOVE indicators for
hospitalized injured older adults (HIOAs) in acute care settings;
2) To determine associations among administratively-mediated variables
(AMVs), patient characteristics, and the extent of adoption of ACOVE
indicators for HIOAs;
3) To determine the extent to which AMVs, including adoption of ACOVE
indicators, explain variations in patient safety indicators (adverse events) for
HIOAs.
Data Sources
Discharge (pat ient) level data. The HC UP NIS for 2009 was purchased from the
Agency for Healthcare Research and Quality (AHRQ). The HCUP NIS is a database of
inpatient stays built from hospitals that participate in the HCUP. The NIS is designed to
approximate a 20 percent sample of U.S. hospitals within 44 states that comprise 96
percent of the U.S. population (Healthcare Cost and Utilization Project [HCUP], 2009).
The NIS contains all-payer data on hospital inpatient stays from a sample of community
-Federal, short-term, general, and other specialty hospitals,
34
by five strata: 1) ownership/control, 2) bedsize, 3) teaching status, 4) urban/rural location,
and 5) U.S. geographic region. Sampling probabilities are proportional to the number of
community hospitals in each stratum (Healthcare Cost and Utilization Project (HCUP),
2009). The NIS can be linked to hospital- level data from the AHA Annual Survey
database. Of note, some states impose restrictions on the release of certain data elements.
Eighteen states in the 2009 NIS restrict identification of hospitals (AR, GA, HI, IN, KS,
LA, ME, MI, MO, NE, NM, OH, OK, SC, SD, TN, TX, WY). This restriction limited
this study to data from hospitals in 26 states rather than 44. Implications are discussed in
Chapter IV.
The NIS is distributed on a single DVD as fixed-width ASCII formatted data files
compressed with WinZip®. It includes the following files: 1) inpatient core files (unit of
observation is an inpatient stay record); 2) hospital weight files (weights and variance
estimation data elements for calculating national estimates); 3) disease severity measures
files (four sets of disease severity measures and 29 comorbidities); and 4) diagnosis and
procedure groups files (facilitates use of ICD-9-CM diagnostic and procedure
information). In order to load and analyze NIS data, a hard drive with 15 gigabytes of
space was needed, as well as analysis software (i.e., SPSS). The PI insta lled all software
components on a home computer.
Complementary data. Additional data and software were obtained to facilitate
risk adjustment and to create patient safety indicator measures from a patient/discharge
dataset.
Trauma Mortal i ty Prediction Model . The TMPM-ICD9 is a statistical model that
uses injury ICD-9 codes to create regression-based estimates of injury severity (Glance et
35
al., 2009)
with risk adjustment for age, gender, mechanism of injury, and hospital fixed effects
(Glance, et al., 2009). Within this model, ICD-9-CM codes are mapped to a severity
measure to create MARC (Model Averaged Regression coefficient) values. A predicted
probability of death is created from the five worst injuries, as well as a variable that
indicates whether the first and second worst injuries were in the same body region.
Among other available injury severity measures (Abbreviated Injury Scale [AIS];
International Classification of diseases ninth Edition Injury Severity Score [ICISS]), the
TMPM-ICD9 demonstrated superior model performance (Glance, Osler, Mukamel,
Meredith, & Dick, 2011; Glance, et al., 2009). The PI obtained the TMPM-ICD9
calculator and permission for use from the developers of the TMPM-ICD9 (Appendix J).
The TMPM-ICD9 calculator (software) was used to create a probability of mortality for
each patient in the patient/discharge- level dataset from model-averaged regression
coefficients (MARC values) for the five worst injuries using the following statistical
model (Glance, et al., 2009):
P(de ath) = Probit[C0 + C1*I1 + C2*I2 + C3*I3 + C4*I4 + C5*I5 + C6*S +
C7*I1*I2]
I1 through I5: MARC (Model Averaged Regression Coefficient) values
ordered from greatest to fifth worst injury.
S: indicator variable set equal to 0 if the worst two injuries occurred in
different body regions and set to 1 if they occurred in the same body region.
C0 through C7: TMPM coefficients (C0 = -(2.217565); C1 = 1.406958; C2 =
1.409992; C3 = 0.5205343; C4 = 0.4150946; C5 = 0.8883929; C6 = -
36
0.0890527; C7 = -0.7782696) (TMPM based on National Trauma Data Bank,
2002-2004, 2006).
The TMPM calculator is a set of electronic instructions that runs inside Microsoft
Excel. Data (patient identifier numbers [1-25,544] and injury ICD9 codes (800-859.9)
were exported to Excel and formatted according to TMPM program specifications with
each ICD9 code on a separate row. Once formatted, the TMPM program loaded ICD-9
data and displayed each patient number on a separate line followed by five fields with the
based on the injuries) (0 to 1). TMPM scores for each patient (n=25,544) were exported
back to SPSS for subsequent conversion to hospital- level TMPM measures.
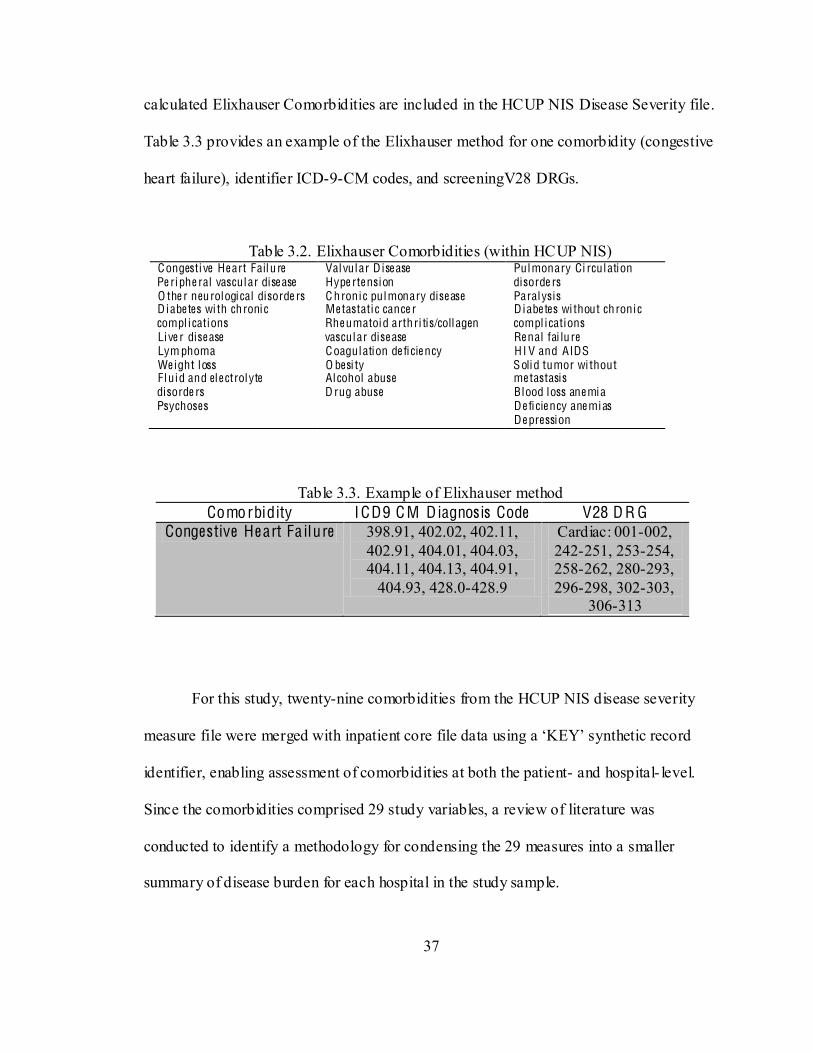
E l ixhauser Comorbidi ty C lassi ficat ion System. Elixhauser Comorbidity software
(Elixhauser, Steiner, Harris, & Coffey, 1998) assigns a dichotomous score (0/1) to 29
comorbidities from ICD-9-CM codes. Using DRG screening, this method excludes: 1)
the primary reason for hospitalization as reflected by the principal diagnosis; 2) the
severity of the principal diagnosis; 3) complications that result from the process of care;
and 4) unimportant comorbidities or conditions present on admission that have a trivial
impact on outcome (Elixhauser, et al., 1998). The 29 comorbidities included in the
HCUP software are listed in Table 3.2. Developers chose to retain separate (29)
comorbidities, rather than a summary measure, because individual comorbidities are
irrelevant for some diseases and are likely to influence outcomes of different diseases and
treatments differently (Elixhauser, et al., 1998). This method also allows investigators to
examine the impact of specific comorbidities on different outcome measures. The
37
calculated Elixhauser Comorbidities are included in the HCUP NIS Disease Severity file.
Table 3.3 provides an example of the Elixhauser method for one comorbidity (congestive
heart failure), identifier ICD-9-CM codes, and screeningV28 DRGs.
Table 3.2. Elixhauser Comorbidities (within HCUP NIS) Congesti ve He art Failu re Pe riphe ral vascular dise ase O the r neurological disorde rs D iabe tes wi th chronic compl ications Live r dise ase Lym phoma We ight loss Fluid and ele ctrolyte disorde rs Psychoses
Valvular D ise ase Hype rte nsion C hronic pulmonary dise ase Me tastatic cance r Rhe umatoid arthri tis/collagen vascular dise ase Coagulation de ficie ncy O besi ty Alcohol abuse D rug abuse
Pulmonary Ci rculation disorde rs Paralysis D iabe tes wi thout chronic compl ications Re nal fai lu re H I V and AIDS Solid tumor wi thout me tastasis Blood loss ane mia De ficie ncy ane mias De pression
Table 3.3. Example of Elixhauser method Comorbidity ICD9 C M Diagnos is Code V28 D R G
Congestive He art Fa ilure 398.91, 402.02, 402.11, 402.91, 404.01, 404.03, 404.11, 404.13, 404.91,
404.93, 428.0-428.9
Cardiac: 001-002, 242-251, 253-254, 258-262, 280-293, 296-298, 302-303,
306-313
For this study, twenty-nine comorbidities from the HCUP NIS disease severity
identifier, enabling assessment of comorbidities at both the patient- and hospital- level.
Since the comorbidities comprised 29 study variables, a review of literature was
conducted to identify a methodology for condensing the 29 measures into a smaller
summary of disease burden for each hospital in the study sample.
38
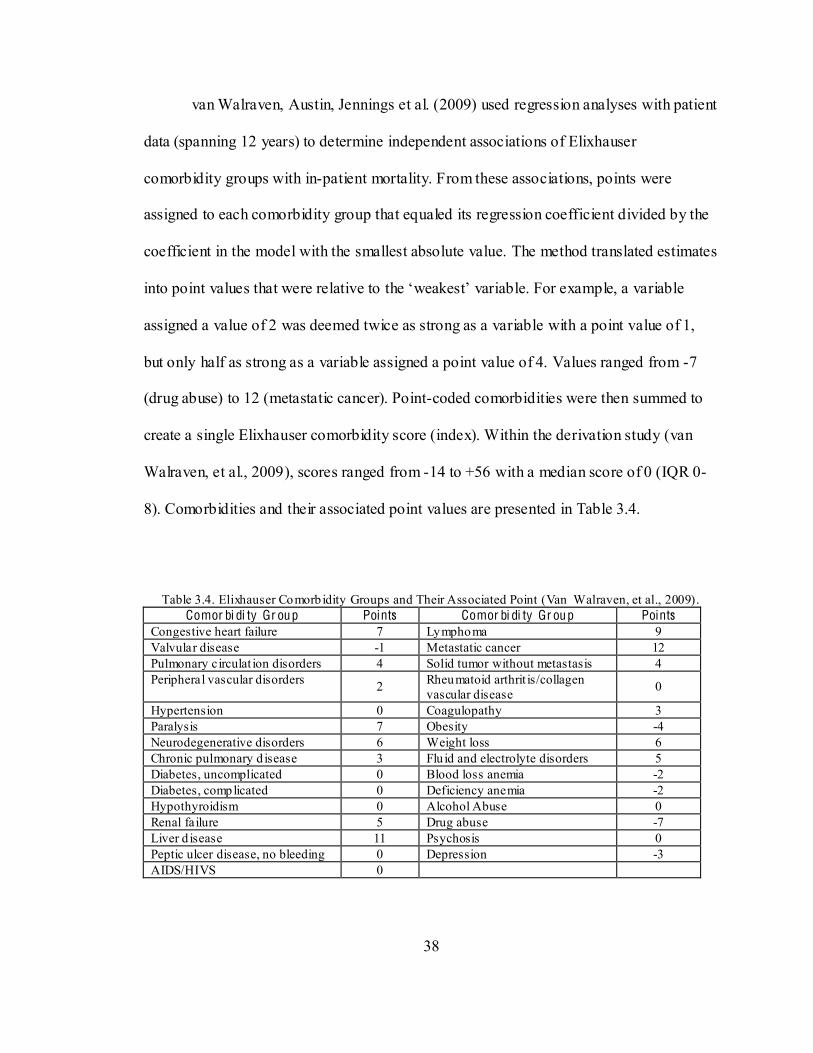
van Walraven, Austin, Jennings et al. (2009) used regression analyses with patient
data (spanning 12 years) to determine independent associations of Elixhauser
comorbidity groups with in-patient mortality. From these associations, points were
assigned to each comorbidity group that equaled its regression coefficient divided by the
coefficient in the model with the smallest absolute value. The method translated estimates
assigned a value of 2 was deemed twice as strong as a variable with a point value of 1,
but only half as strong as a variable assigned a point value of 4. Values ranged from -7
(drug abuse) to 12 (metastatic cancer). Point-coded comorbidities were then summed to
create a single Elixhauser comorbidity score (index). Within the derivation study (van
Walraven, et al., 2009), scores ranged from -14 to +56 with a median score of 0 (IQR 0-
8). Comorbidities and their associated point values are presented in Table 3.4.
Table 3.4. Elixhauser Comorb idity Groups and Their Associated Point (Van Walraven, et al., 2009).
Comor bi di ty Gr oup Points Comor bi di ty Gr oup Points Congestive heart failure 7 Lymphoma 9 Valvular disease -1 Metastatic cancer 12 Pulmonary circulat ion disorders 4 Solid tumor without metastasis 4 Peripheral vascular disorders 2 Rheumatoid arthrit is/collagen
vascular disease 0
Hypertension 0 Coagulopathy 3 Paralysis 7 Obesity -4 Neurodegenerative disorders 6 Weight loss 6 Chronic pulmonary d isease 3 Flu id and electrolyte disorders 5 Diabetes, uncomplicated 0 Blood loss anemia -2 Diabetes, complicated 0 Deficiency anemia -2 Hypothyroidism 0 Alcohol Abuse 0 Renal failure 5 Drug abuse -7 Liver d isease 11 Psychosis 0 Peptic ulcer disease, no bleeding 0 Depression -3 AIDS/HIVS 0
39
Of note, van Walraven et al. compared the Elixhauser comorbidity index to the
Charlson comorbidity score for discriminating between patients who died and did not die
in the hospital. The Elixhauser comorbidity index (methodology) exceeded the Charlson
score in discrimination and was thus chosen for use with this study.
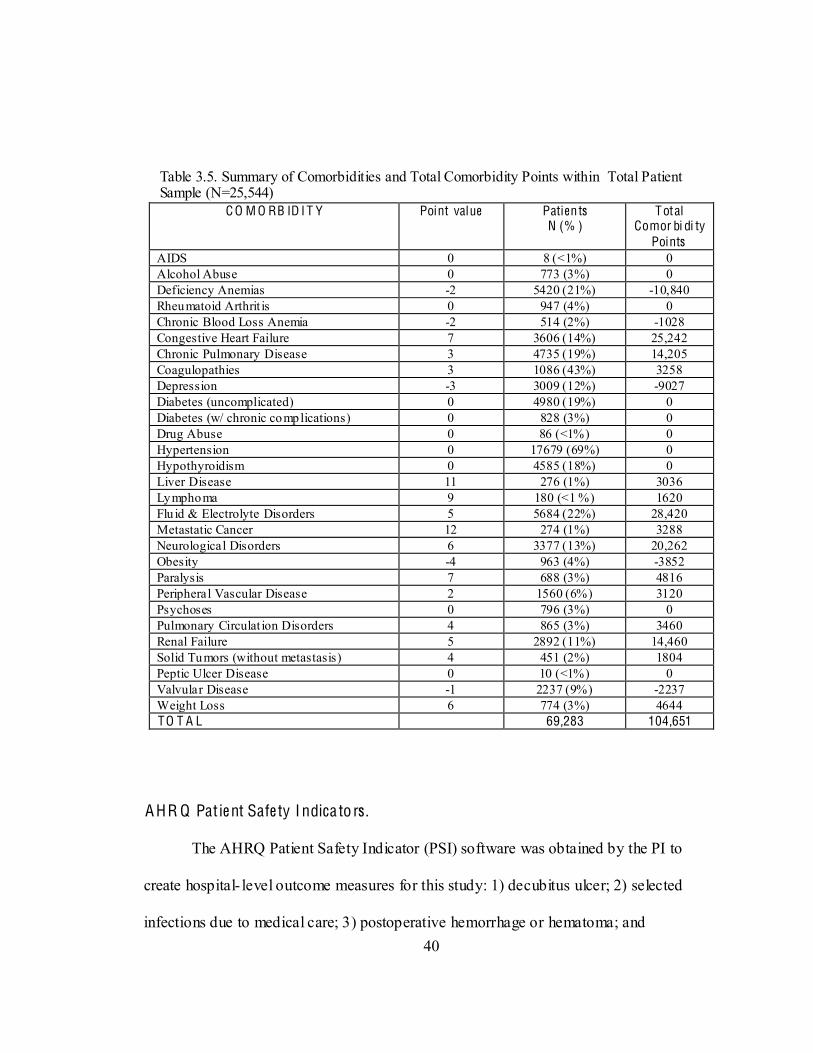
Table 3.5 provides a summary of comorbidities among the patient sample (n =
25,544) in this study with over 69,000 comorbidities representing 104,651 comorbidity
points. To create an Elixhauser comorbidity score within the sample at the hospital level,
the point values for each individual cormorbidity were summed and divided by the total
number of patients present in the patient sample for each hospital. For example, patients
at hospital # 32 represented 50 comorbidity points among 31 patients, producing a
comorbidity index of 1.61; while patients at hospital # 87 represented 2364 comorbidity
points among 513 patients, for a comorbidity index of 4.61. The hospital- level
comorbidity index provided a continuous variable for risk adjustment that reflected the
non- injury-related disease burden for each hospital. Permission was obtained from the
developer of the Elixhauser comorbidity index for use in this study (Appendix J).
40
Table 3.5. Summary of Comorbidities and Total Comorbidity Points within Total Patient Sample (N=25,544)
C O M O RB ID I T Y Point value Patients N (% )
Total Comor bi di ty
Points AIDS 0 8 (<1%) 0 Alcohol Abuse 0 773 (3%) 0 Deficiency Anemias -2 5420 (21%) -10,840 Rheumatoid Arthrit is 0 947 (4%) 0 Chronic Blood Loss Anemia -2 514 (2%) -1028 Congestive Heart Failure 7 3606 (14%) 25,242 Chronic Pulmonary Disease 3 4735 (19%) 14,205 Coagulopathies 3 1086 (43%) 3258 Depression -3 3009 (12%) -9027 Diabetes (uncomplicated) 0 4980 (19%) 0 Diabetes (w/ chronic complications) 0 828 (3%) 0 Drug Abuse 0 86 (<1%) 0 Hypertension 0 17679 (69%) 0 Hypothyroidism 0 4585 (18%) 0 Liver Disease 11 276 (1%) 3036 Lymphoma 9 180 (<1 %) 1620 Flu id & Electrolyte Disorders 5 5684 (22%) 28,420 Metastatic Cancer 12 274 (1%) 3288 Neurological Disorders 6 3377 (13%) 20,262 Obesity -4 963 (4%) -3852 Paralysis 7 688 (3%) 4816 Peripheral Vascular Disease 2 1560 (6%) 3120 Psychoses 0 796 (3%) 0 Pulmonary Circulat ion Disorders 4 865 (3%) 3460 Renal Failure 5 2892 (11%) 14,460 Solid Tumors (without metastasis) 4 451 (2%) 1804 Peptic Ulcer Disease 0 10 (<1%) 0 Valvular Disease -1 2237 (9%) -2237 Weight Loss 6 774 (3%) 4644 TO T A L 69,283 104,651
A HR Q Pat ie nt Safe ty I ndica to rs .
The AHRQ Patient Safety Indicator (PSI) software was obtained by the PI to
create hospital- level outcome measures for this study: 1) decubitus ulcer; 2) selected
infections due to medical care; 3) postoperative hemorrhage or hematoma; and
41
4) postoperative deep vein thrombosis or pulmonary embolus. The PSI software screens
inpatient discharge data for problems that patients experience from exposure to the
healthcare system (Agency for Healthcare Research and Quality (AHRQ), 2007a).
Appendix C provides a summary of four indicators, including the definition, numerator,
denominator, strength of evidence as an outcome measure, and risk adjustment variables
from which the PSIs are derived (Agency for Healthcare Research and Quality (AHRQ),
2007a).
The AHRQ PSI development team evaluated the soundness of the PSIs through a
systematic process that assessed six areas of evidence, including face validity, precision,
minimum bias, construct validity, application, and opportunity for quality improvement
(Agency for Healthcare Research and Quality (AHRQ), 2007a). Empirical examination
included statistical testing from which three different estimates of hospital performance
were calculated for each indicator:
1) Raw indicator rate- the number of adverse events in the numerator divided by the
number of discharges in the population at risk by hospital;
2) Adjusted raw indicator rate- risk adjustment with age, gender, modified DRG, and
comorbidities;
Adjacent DRG categories that were separated by the presence or absence of
comorbidities or complications were collapsed to avoid adjusting for the
complication being measured.
APR-DRG risk adjustment was not implemented.
The ICD-9-CM codes used to define comorbidity categories were modified to
exclude conditions likely to represent potentially preventable complications.
42
comorbidities would not be mislabeled as not having conditions of interest.
3) Multivariate signal extraction- hods were applied to
performance or reliability) for each indicator.
The PSI Software was downloaded free of charge from AHRQ as a WinQI
version for a Microsoft Operating system. The software was designed to run as a single-
use application. Instructions were provided on the AHRQ website for loading data and
verifying formatting. AHRQ technical support was also utilized to obtain results from the
patient level dataset for this study. Utilization of the PSI software produced results of
individual cases of adverse events within hospitals, as well as provider- level PSI rates for
the sample hospitals as a whole. A report on the four PSIs within 128 hospitals was
produced from the PSI software in Microsoft Excel. For each hospital, the report
included: 1) the number of PSI cases within the numerator, 2) the number of applicable
cases in the denominator, 3) the observed PSI rate, 4) the expected rate (based on
population estimates from the 2008 HCUP NIS), and 5) an observed/expected (O/E)
ratio. Following use of the PSI software to identify cases of PSI #12 and to calculate PSI
rates for the hospitals in this study, the PSI data were exported to SPSS. The number of
cases for PSI #12 (postoperative deep vein thrombosis or pulmonary embolus) divided by
the total number of discharges for each hospital in the study was used to create a PSI rate
for each hospital. This measure was used as the dependent variable for Aim Three.
43
A me rican Hospital Association (A H A) Surve y (2009).
The 2009 AHA Survey Database was purchased by Vanderbilt University School
of Nursing for use by students and faculty. The AHA Survey is completed online by most
US hospitals and profiles a universe of over 5000 hospitals. The database contains over
1000 fields covering hospital structure, service line, staffing, expenses, physician
organization structures, beds and utilization (American Hosptial Association (AHA),
2010). A smaller AHA dataset comprised of only the 128 study hospitals and 27 AHA
study variables was created in SPSS and subsequently merged by a hospital identifier
with HCUP NIS data.
Prio r Study.
States and hospitals (including trauma centers) in which five prominent geriatric
resource programs (GRPs) were located in December 2009 were identified by the PI from
data obtained directly from each program or from GRP websites. The five GRPs included
two acute care models: Nurses Improving Care to Health System Elders (NICHE),
Hospitalized Elder Life Program (HELP); and three other prominent programs: Geriatric
Education Centers (GEC), Association of Directors of Geriatric Academic Programs
(ADGAP) and Donald W. Reynolds Foundation Centers. Trauma centers and trauma
center levels were obtained from the American Trauma Society Trauma Information
Exchange Program (ATS-TIEP). The prior study identified the presence and availability
of GRPs within specific U.S. hospitals, as well as trauma center status, trauma center
level, and verification mechanism (state or American College of Surgeons Committee on
Trauma verification). The presence of an inclusive trauma system within states was also
44
identified. These data were manually incorporated into the proposed study database with
subsequent checks for accuracy.
Populat ion/Sample/Se tting
Populat ion.
-
federal, short term, acute care hospitals with facilities and services available to the
(American Hosptial Association (AHA), 2010) that admitted patients age 65 and
older with primary injury diagnoses. This included community hospitals, as well as
academic medical centers. Federal and military hospitals were excluded.
Sample: Hospi tal level . The 2009 HCUP NIS is a nationally representative
sample containing data from 1050 hospitals in 44 states. Variables from which
stratification was conducted include geographic region (N, MW, W, S), control (public,
voluntary, proprietary), location (urban, rural), teaching status (teaching, non-teaching),
and bed size (small, medium, and large). Eighteen states were excluded from the study
since identification of individual hospitals was not possible. One hundred and six
hospitals that did not have patients meeting inclusion criteria were excluded. These
factors limited the population of hospitals for this study. Among identifiable hospitals
with at least 10 applicable patients, 128 hospitals from 24 states returned study surveys
and comprised the hospital sample.
Sample: Pat ient (discharge) level . Eligible criteria for patients were: patients age
65 and older with a primary injury diagnosis (excluding 905-909 [late effects of injury],
45
930-939 [foreign body], and 958 [early complications of trauma]) were extracted from
the 2009 HCUP NIS.
Data Colle ction Proce dures
The overall purpose of this study was to examine administratively-mediated
variables (AMVs), or alterable organizational factors within U.S. hospitals that might be
associated with the occurrence of adverse events for HIOAs in acute care settings. Data
collection procedures are presented by study aims.
Aim One. To determine the extent of adoption of targeted ACOVE indicators for
hospitalized injured older adults (HIOAs) in acute care settings.
Surve y of hospita ls- surve y de ve lopme nt.
Data collection was achieved using a 17- item survey instrument (Appendix D)
developed by the PI to collect pertinent variables (AMVs) that were not available in the
2009 AHA survey, including: 1) capital inputs (i.e., computer support features, and in-
room supply features); 2) organizational facets (i.e., adoption of ACOVE indicators,
geriatric assessment, family visitation features, Magnet recognition, and specialty units);
and 3) labor inputs (i.e., access to select providers and services, RN quality measures
[BSN, certification, experience], and staffing measures) (American Hosptial Association
(AHA), 2010). The process for selection of variables was discussed in a previous section
(pp. 18-19). Survey item development was based on consultation with other investigators
(A. Minnick, L. Mion) who measured similar concepts/variables in prior studies, as well
46
as recommended methodologies (Dillman, Smyth, & Christian, 2008; Fink, 2009;
Fowler, 2009; Lynn, 1986).
Following initial survey development, content validation was conducted, based on
the content validity index (CVI) (Lynn, 1986; Polit & Beck, 2008). Eight chief nursing
officers (CNOs) from community hospitals were selected to review the survey instrument
as expert reviewers. A content validation tool was provided for CNOs to rate survey
items for relevance and appropriateness. A 4-point relevance rating scale (1 = not
relevant, 2 = somewhat relevant, 3 = quite relevant, 4 = highly relevant) was used to
evaluate each item. Since ACOVE indicators were an emphasized variable in the study,
each indicator was evaluated separately for relevance. The PI met with each of the CNOs
to explain the survey instrument and relevance rating tool. Six completed expert reviews
were collected. Based on recommendations (Lynn, 1986), a CVI was computed for each
survey item by summing the number of 3 or 4 ratings and dividing by the number of
experts (6). Results ranges from .5 to 1.0 (.5 [2 items]; .83 [4 items]; 1.0 (21 items]).
Items scored with a CVI of .5 were based on feelings that the item was misplaced under
the wrong AMV sub-category (CI, OF, LI). The six reviewers rated all AMVs as relevant
to the over-arching concept (administratively-mediated variables). Based on results from
the expert review, no revisions to the survey instrument were made (see Appendix E).
Surve y of hospita ls-data colle ction.
The survey of hospitals was distributed to CNOs at 465 identifiable hospitals from
26 states in the 2009 HCUP NIS. Distribution was conducted by postal mailing. A
postcard announcing the survey (Appendix F) was mailed first, followed by an initial
47
mailing of the survey and two subsequent mailings of the survey to non-respondents,
each spaced 10 days apart. A cover letter (Appendix G) explained the purpose of the
survey and provided directions for completion and return. Cover letters for follow-up
survey mailings (Appendix H) to non-respondents reiterated the purpose of the survey
and emphasized the potential advancement in knowledge for understanding outcomes in
HIOAs. Protection of institutions and human subjects, as well as Institutional Review
Board (IRB) approval was addressed in the letter. Postcards were mailed on August 29,
2011 and the final survey mailing occurred on September 29, 2011. One month (October
2011) was allowed for return of completed surveys. Data analysis began on November 1,
2011. Among the 128 returned surveys, 110 (86%) were received via postal mailing and
18 were completed via web-based REDCap (2011). Returned surveys reflected a
response rate of 27.8% and was consistent with previously conducted similar studies
(Edwards et al., 2009). As a follow-up note, four additional surveys were submitted after
data analysis was begun, increasing the response rate to 28.8%. To convert survey results
into study data, as completed surveys (via mail) were returned, the PI entered survey
results into REDCap, noting the survey number assigned by REDCap. REDCap survey
numbers were subsequently used to link survey data with other data sources in
development of the completed study dataset.
Aim Two: To determine associations among administratively-mediated variables
(AMVs), patient characteristics, and the extent of adoption of ACOVE indicators for
HIOAs.
48
Se le ction of A M Vs fo r analys is .
Seventy-five AMVs from returned surveys (n=42), AHA data (n=27), and the
prior study (n=4) were categorized according to AMV sub-categories. For each sub-
category, items were examined for percent of missing variables. A strategy was defined
for exclusion of variables: 1) variables with low variability (> 90% or < 10%, no
hospitals). Using these criteria, 23 variables were excluded. Among the remaining 52
variables, missing data values were examined and reported in Tables 4.14 4.16. Among
dichotomous variables (present or not present), missing data were
an assumption
that if a hospital failed to answer the AHA survey question, it did so because it did not
provide the service. Missing data among continuous variables were treated as missing
data because no assumptions could be made and the data values were no t available.
Multiple imputation was not conducted. A detailed descriptive summary of each AMV is
presented in Chapter IV, including excluded variables and missing data.
De ve lopme nt of o rganizationa l-le ve l patie nt c ha ra cte ristics .
Distributions of patient characteristics (age, TMPM scores, gender, and
comorbidities, hip fractures, HIOAs among total discharges) within the patient-level data
were examined. Based on the distributions, the following measures were chosen for use
as hospital- level patient characteristic variables: 1) mean age, 2) percent female patients,
3) median TMPM-ICD9 scores, 4) mean comorbidity index, 5) percent hip fractures
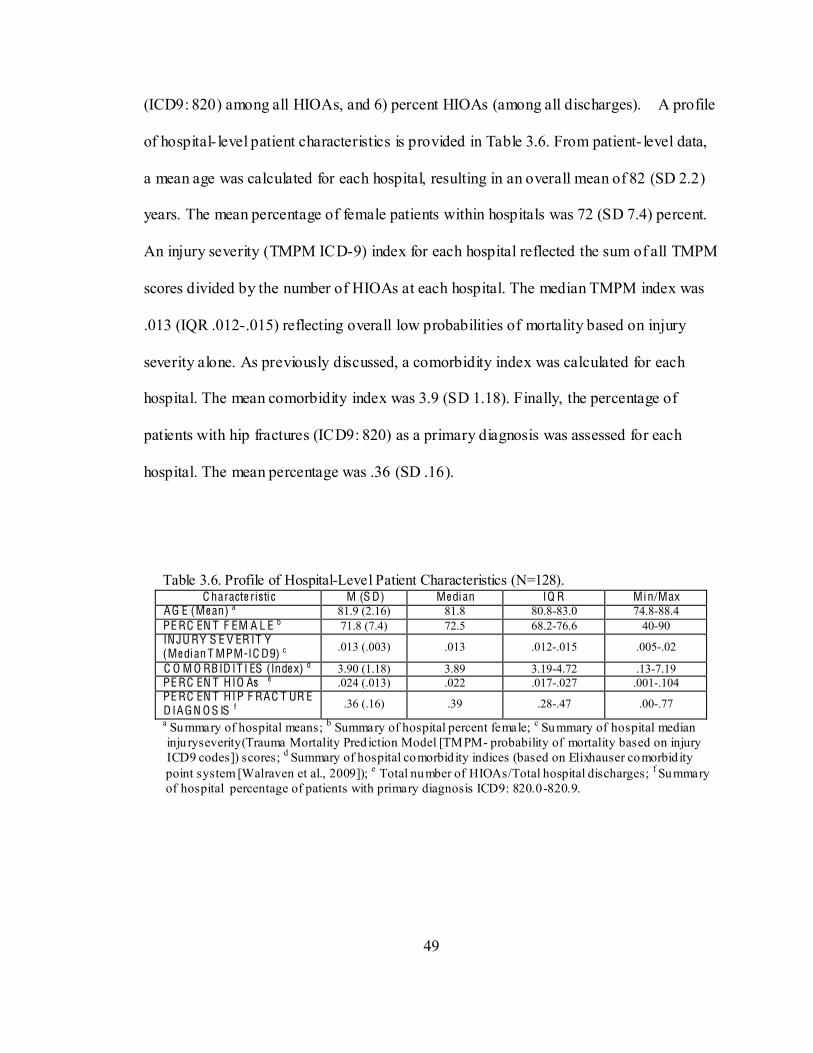
49
(ICD9: 820) among all HIOAs, and 6) percent HIOAs (among all discharges). A profile
of hospital- level patient characteristics is provided in Table 3.6. From patient- level data,
a mean age was calculated for each hospital, resulting in an overall mean of 82 (SD 2.2)
years. The mean percentage of female patients within hospitals was 72 (SD 7.4) percent.
An injury severity (TMPM ICD-9) index for each hospital reflected the sum of all TMPM
scores divided by the number of HIOAs at each hospital. The median TMPM index was
.013 (IQR .012-.015) reflecting overall low probabilities of mortality based on injury
severity alone. As previously discussed, a comorbidity index was calculated for each
hospital. The mean comorbidity index was 3.9 (SD 1.18). Finally, the percentage of
patients with hip fractures (ICD9: 820) as a primary diagnosis was assessed for each
hospital. The mean percentage was .36 (SD .16).
Table 3.6. Profile of Hospital-Level Patient Characteristics (N=128). C haracte ristic M (S D) Me dian IQ R Min/Max
AG E (Me an) a 81.9 (2.16) 81.8 80.8-83.0 74.8-88.4 PE RC EN T F EM A L E b 71.8 (7.4) 72.5 68.2-76.6 40-90 INJU RY S E V ER IT Y (Me dian T MPM-IC D9) c .013 (.003) .013 .012-.015 .005-.02
C O M O RBID IT I ES (Inde x) d 3.90 (1.18) 3.89 3.19-4.72 .13-7.19 PE RC EN T HIO As e .024 (.013) .022 .017-.027 .001-.104 PE RC EN T HIP F RAC T UR E D IAGN O S IS f .36 (.16) .39 .28-.47 .00-.77
a Summary of hospital means; b Summary of hospital percent female; c Summary of hospital median inju ryseverity(Trauma Mortality Pred iction Model [TMPM- probability of mortality based on injury ICD9 codes]) scores; d Summary of hospital comorbid ity indices (based on Elixhauser comorbid ity point system [Walraven et al., 2009]); e Total number of HIOAs/Total hospital discharges; f Summary of hospital percentage of patients with primary diagnosis ICD9: 820.0-820.9.
50
De ve lopme nt of an A C O V E I ndica to r I nde x.
To summarize and condense the nine individual ACOVE indicator adoption
variables into one variable, ACOVE indicator variables were extracted from the returned
CNO surveys (N=128) and a new variable (ACOVE Index) was created. Levels of
adoption for each ACOVE indicator ranged from 0 (no activity) to 5 (full implementation
throughout hospital). A sum of the extent of implementation (0-5) for each indicator (n =
9) was totaled to create a new continuous- level variable for use as an outcome variable
for Aim Two and as an independent variable for Aim Three. Each indicator ranged from
0 to 5, thus the ACOVE index reflected nine indicators and a theoretical range of 0 to 45.
Aim Three: To determine the extent to which AMVs, including adoption of
ACOVE indicators, explain variations in patient safety indicators (adverse events) for
HIOAs.
Pat ie nt Safe ty I ndica to rs
Utilizing AHRQ PSI software applied to HCUP data for the patient- level sample,
PSI rates from the patient-level data were calculated. Among patient discharges that met
inclusion criteria for PSI calculations (n=25,513), three PSI reports (PSI #3-pressure
ulcers, PSI #7-central line infections, PSI #9- post-operative hemorrhage/hematoma)
identified less than 10 cases from the patient level data. One PSI report (PSI #12-
postoperative deep vein thrombosis or pulmonary embolus) revealed 134 cases among
the patient- level sample for an overall provider rate of .01which was greater than the
reference population-estimated rate (0.005). The difference in the sample rate (.01) and
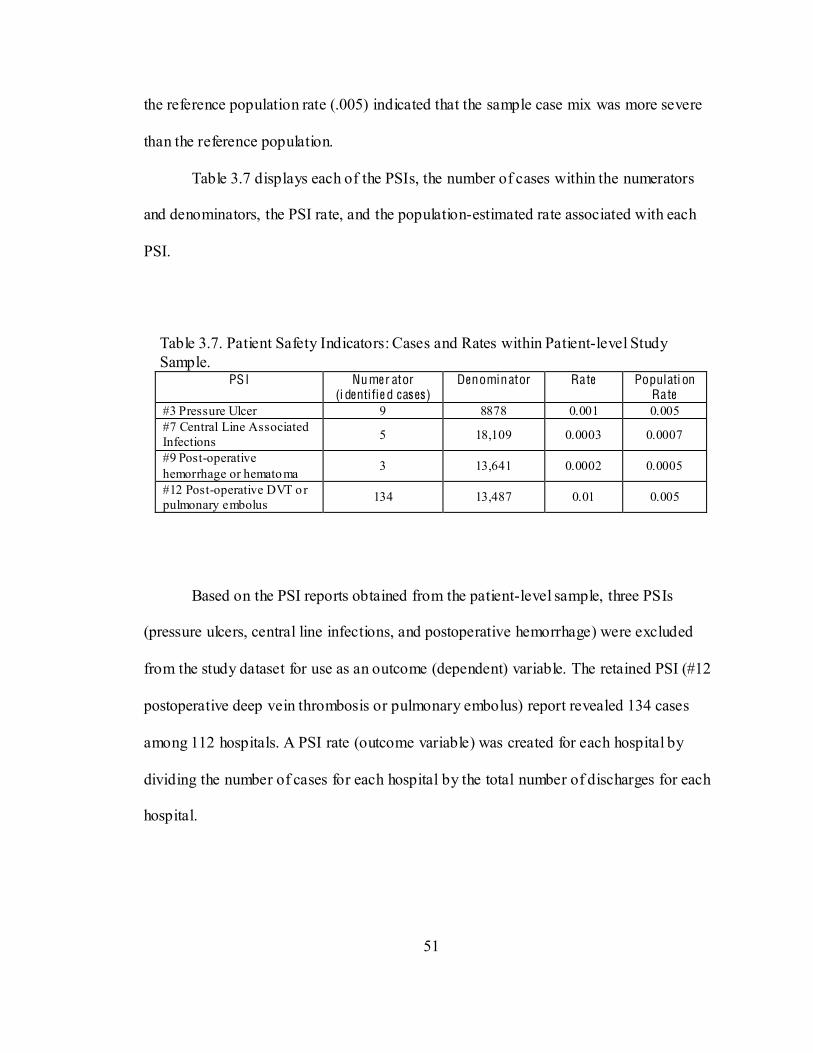
51
the reference population rate (.005) indicated that the sample case mix was more severe
than the reference population.
Table 3.7 displays each of the PSIs, the number of cases within the numerators
and denominators, the PSI rate, and the population-estimated rate associated with each
PSI.
Table 3.7. Patient Safety Indicators: Cases and Rates within Patient-level Study Sample.
PSI Numer ator (i dentifie d cas es)
Denominator Rate Populati on Rate
#3 Pressure Ulcer 9 8878 0.001 0.005 #7 Central Line Associated Infections 5 18,109 0.0003 0.0007
#9 Post-operative hemorrhage or hematoma 3 13,641 0.0002 0.0005
#12 Post-operative DVT or pulmonary embolus 134 13,487 0.01 0.005
Based on the PSI reports obtained from the patient-level sample, three PSIs
(pressure ulcers, central line infections, and postoperative hemorrhage) were excluded
from the study dataset for use as an outcome (dependent) variable. The retained PSI (#12
postoperative deep vein thrombosis or pulmonary embolus) report revealed 134 cases
among 112 hospitals. A PSI rate (outcome variable) was created for each hospital by
dividing the number of cases for each hospital by the total number of discharges for each
hospital.
52
Datase t Const ruction
A hospital- level study dataset comprised of demographic and descriptive
variables, AMVs, patient characteristic summary variables, and outcome variables
(ACOVE Index, hospital rates for PSI #12) was constructed for the data analysis phase of
the study. Appendix I provides an overview of the dataset construction as it was built in
SPSS. Variable categories, variables, and level of measurement are included.
Data M anage me nt and Q ual ity Cont rol
Missing values within the study dataset were examined. For patient- level data,
missing values resulted in exclusion of 31 cases from the PSI software analysis. For
hospital- level data, 23 variables were excluded from analysis secondary to low variability
and missing data. All 128 hospitals were included in the data analysis.
REDCap. As the PI received completed surveys, each was entered into REDCap and
stored in a lock file cabinet in the PIs home office. REDCap is an encrypted web-based
application designed exclusively to support research studies with data management
reports, data integrity reports for data cleaning and evaluation, and tracking reports for
longitudinal studies (Harris, et al., 2009). The study dataset for data analysis was built in
SPSS 19.0. De-identified aggregate hospital data were (and continue to be) maintained
53
Data Ana lys is Strategy
Data Cle aning Proce dures .
After the study dataset was constructed, and prior to data analysis, each variable
in the dataset was examined separately. Frequencies were checked to identify invalid
numerical values and missing data. Few invalid numerical values were found. If the
intended response could be determined from the invalid value, the value was changed to
an appropriate value. For example, from the CNO survey data (item #12) that asked the
number of hours per week that visitors were allowed in the ICU, one response was
intended response for invalid values could not be determined, the value was deleted and
treated as a missing value. Dichotomous variables with missing data were assumed to not
be present . Missing data among continuous variables were treated
as missing data.
Descriptive Statistics .
Descriptive statistics (frequencies, measures of central sample was compared with
the larger nationally-representative sample (2009 HCUP tendency and variability) were
generated for all hospital and patient- level variables. The study sample was compared
with the larger nationally-representative sample (2009 HCUP NIS) for
representativeness.
Aim One: Descriptive statistics (frequencies, percentages) were generated for
nine ACOVE indicators. Descriptive statistics were then generated for each individual
54
indicator by hospital characteristics (U. S. region, bed size, location, ownership, teaching
status, trauma center status, and presence of a geriatric acute care model).
To examine possible differences in individual indicators among key hospital
Subsequently, chi-square tests of independence were conducted to test differences in
ACOVE indicator adoption between and among hospital characteristics.
Aim Two: Descriptive statistics (frequencies, percentages, measures of central
tendency and variability) were generated for AMVs, patient characteristics, and an
ACOVE Indicator Index. Spearman correlations between patient characteristics and
AMVs were conducted to assess patient level associations with AMVs.
Prior to conducting correlational statistics, distributions of variables were
examined. Thirteen variables from the survey of CNOs were ordinal level (not available
[0], available to select adult nursing units [1], available to all adult nursing units [2]).
Among the thirteen variables, nine variables (medication compatibility alerts, retrieval of
nursing home data, checklist for VAP, decision support for pressure ulcer risk
assessment, psychiatric nurse liaison, psychiatric consultation, gero-psychiatric
consultation, geriatricians, geriatric advanced practice nurses) had less than 10 cases in
reponderance of cases in the
dichotomous variables (not available [0], available to adult nursing units [1]). Upon
examination of continuous level variables, six of eight (percent nurse certification,
55
percent other ICU, percent LPNs med/surg, percent other med/surg, percent RN turnover,
percent RN workforce 5 years experience) were skewed. The values for these six
variables were rank transformed, thus achieving normal distribution for use in Pearson
(Aims 2 and) and linear regression analyses (Aim Three).
Three sets of correlational statistics were generated between: 1) patient
characteristics and AMVs, 2) patient characteristics with an ACOVE Index, and 3)
AMVs with an ACOVE Index. The three correlational sets address relationships in the
Minnick & Roberts Outcomes Model. Examination of associations of patient
characteristics (consumer types) with AMVs can identify hospitals having or lacking
specific resources deemed important (in the literature) for hospitalized older adults.
Those associations, as well as associations of patient characteristics with an ACOVE
Index, address the premise that variations in patient characteristics may call for system
designs that are customized to different types of consumers (Minnick, et al., 1997;
Young, et al., 1996). Associations between AMVs and an ACOVE Index place particular
emphasis on the key concept of the model, administrat ively-mediated variables, which
recognizes that AMVs can be altered or shaped by the decisions of leaders within
organizations, and that resource clusters (e.g., groups of AMVs, groups of quality
indicators) must be present to achieve better outcomes.
Due to the limited sample size, bivariate correlational statistics were used for
addressing the questions of Aim Two. Considering the high number of AMVs (n=52) in
the study, to reduce the likelihood of Type I errors, a critical alpha level of .01 was used
for determination of statistically significant associations.
56
Aim Three: Descriptive analyses were generated for the dependent variable (PSI
#12: Rate of postoperative deep vein thrombosis or pulmonary embolus). The dependent
variable was extremely (positive) skewed, thus those data values were rank transformed
resulting in a normal distribution. Pearson correlations between independent variables
(patient characteristics, AMVs) and the dependent variable (rate of PSI #12) were
conducted to determine associations. A critical alpha level of .01 was established for
determination of statistically significant associations. In the final analysis for Aim Three,
a multivariate hierarchical regression model was used to test the contributions of
variables within four hypothesized levels of influence (patient characteristics, general
hospital factors, trauma centers, and geriatric-specific factors).
Summa ry
The preceding sections have provided a detailed description of the data sources,
study sample, data collections procedures, data management, dataset construction, and
analytic strategies used for this study. Chapter IV presents results from the data analysis
and Chapter V concludes with a discussion about the study finding, implications,
strengths and limitations, and recommendations for future research.
57
C H APT ER IV
R ESUL TS
This chapter provides the results of a study examining administratively-mediated
variables, including targeted ACOVE indicators, at 128 hospitals. The chapter begins
with a profile of sample participants at the hospital and discharge level. Each study aim is
addressed separately with a discussion of the statistical analysis and results obtained. The
chapter concludes with an overall summary of the research findings.
Pa rt icipant Profile
Hospital and patient selection followed a defined process (Figure 4.1). First, from
the 2009 HCUP NIS Inpatient Core Files and Hospital Weight Files, hospitals with an
AHA identifier were isolated (n=575) and those without an identifier were excluded from
excluded (n=10). From the remaining 565 hospitals, the patient/discharge- level data were
examined for the presence and number of patients 65 and older with a primary injury
diagnosis (ICD9 800.0 959.9 [excluding 905-909 [late effect of injuries]; 930-939
[foreign bodies]; 958-959 [complications]). Hospitals with 10 or more applicable patients
were included in the study (n=459) and those with less than 10 applicable patients were
excluded (n=106). Finally, among hospitals with 10 or more patients, those that returned
a study survey were included in the final study sample (n=128). Discharge-level data
from the 128 sample hospitals included 25,544 patient discharges that met inclusion
criteria.
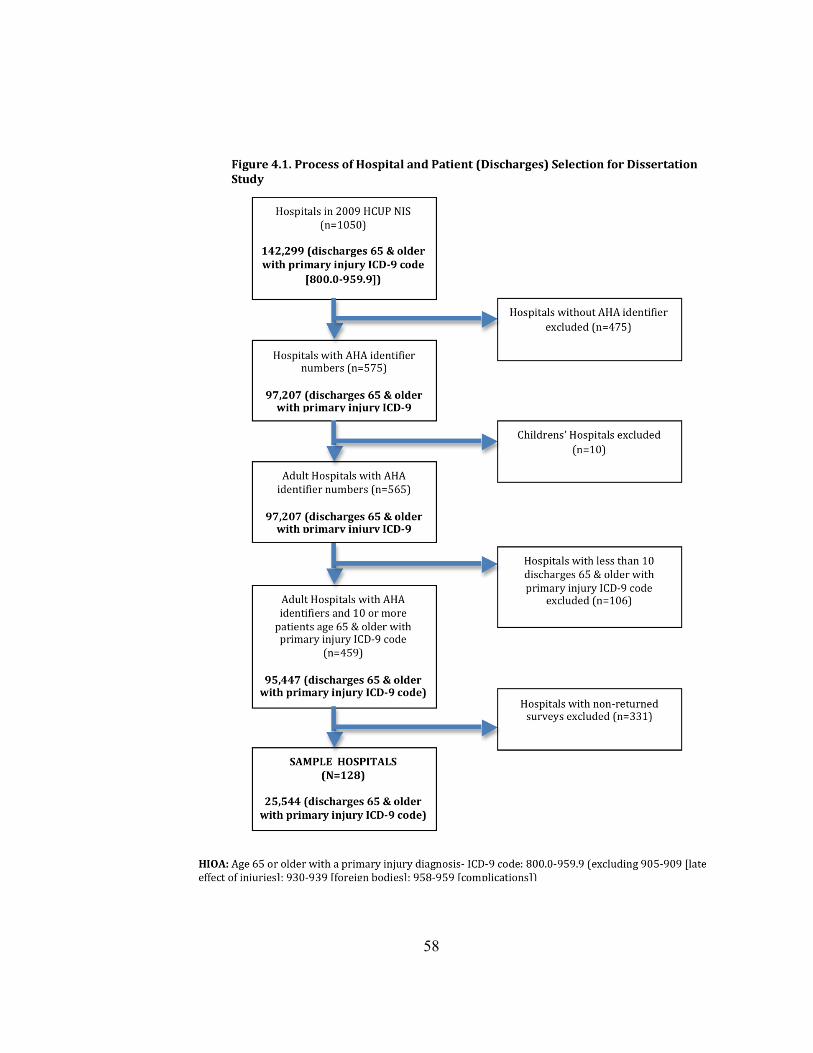
58
D
59
Descriptive statistics were generated for hospital- and patient/discharge- level
variables to summarize hospital and patient characteristics of the samples (Tables 4.1 &
4.2) and to compare the study sample with a nationally-representative sample (2009
HCUP NIS).
Sample Hospita ls and Pa tie nts by Hospital C ha racte ristics
Table 4.1 provides a description of hospitals and discharges by hospital
characteristics. Among the four geographic regions, hospitals were over-represented in
the Northeast (30%) and under-represented in the South (18%). Within patient level data,
the Northeast was over-represented (37%), with under-representation in the Midwest
(18%). The sample of hospitals was examined by hospital bed size with modifications
based on the AHA bed size classification system. The AHA bed sizes 1 through 3 (1= 6
to 24 beds; 2=25 to 49 beds; 3=50 to 99 beds) were collapsed with a single digit 1 (1 to
99 beds) for this study to represent small hospitals. The remaining codes (2 through 6)
matched AHA codes (2= 100-199; 3=200-299; 4= 300-399; 5= 400-499; 6= 500+).
Among sample hospitals (n=128), 50 (39%) had a bed capacity of less than 100. Forty-
nine hospitals (38%) had bed capacities of 100 to 299, and twenty-nine hospitals (23%)
had bed capacities greater than 300, including 10 hospitals (8%) with 500 or more beds.
Patient characteristics for bed sizes and ownership status by AHA categories could not be
determined within the HCUP categorizations. Eighty-seven hospitals (68%) were located
in urban settings with 92% of the patients in an urban setting. The majority of hospitals
had a private, not- for-profit ownership status.
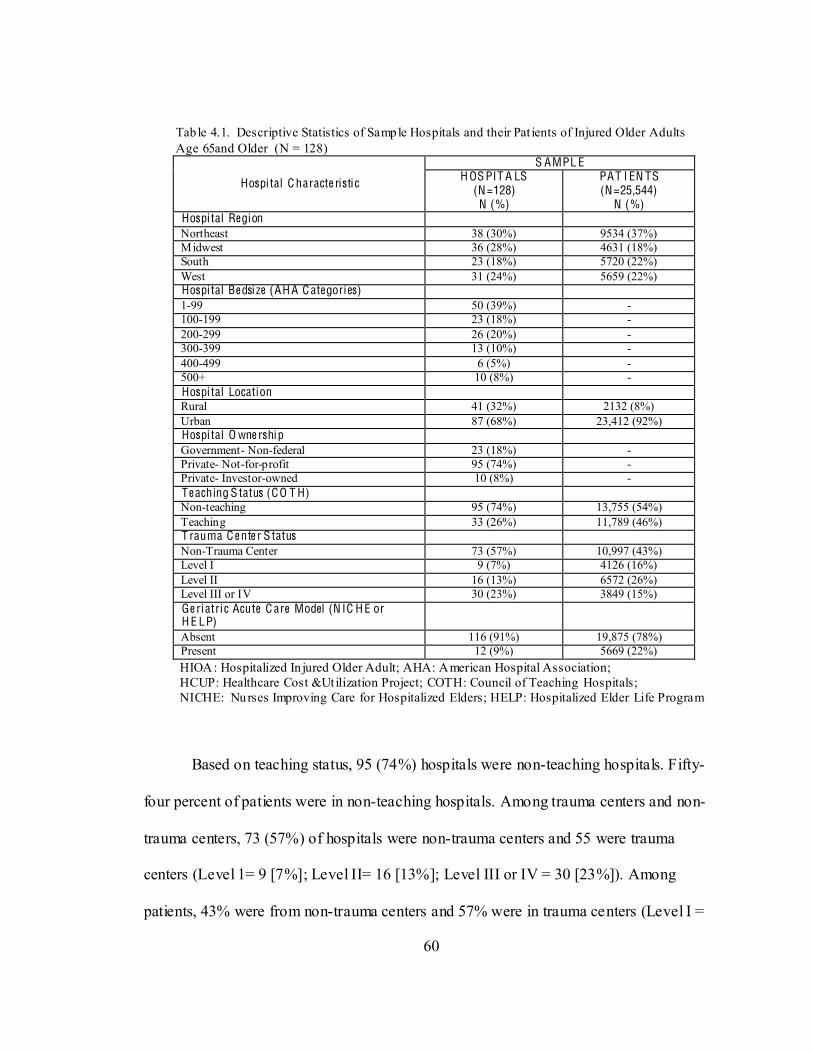
60
Tab le 4.1. Descriptive Statistics of Sample Hospitals and their Pat ients of Injured Older Adults Age 65and Older (N = 128)
Hospi tal C haracte ristic
S AMPL E H OS PIT A LS
(N=128) N (%)
PAT I EN TS (N=25,544)
N (%) Hospi tal Region Northeast 38 (30%) 9534 (37%) Midwest 36 (28%) 4631 (18%) South 23 (18%) 5720 (22%) West 31 (24%) 5659 (22%) Hospi tal Be dsi ze (AH A C ategories) 1-99 50 (39%) - 100-199 23 (18%) - 200-299 26 (20%) - 300-399 13 (10%) - 400-499 6 (5%) - 500+ 10 (8%) - Hospi tal Location Rural 41 (32%) 2132 (8%) Urban 87 (68%) 23,412 (92%) Hospi tal O wne rship Government- Non-federal 23 (18%) - Private- Not-for-profit 95 (74%) - Private- Investor-owned 10 (8%) - T e aching S tatus (CO T H) Non-teaching 95 (74%) 13,755 (54%) Teaching 33 (26%) 11,789 (46%) T rauma C e nte r S tatus Non-Trauma Center 73 (57%) 10,997 (43%) Level I 9 (7%) 4126 (16%) Level II 16 (13%) 6572 (26%) Level III or IV 30 (23%) 3849 (15%) Ge ri atric Acute C are Model (N IC H E or H E LP)
Absent 116 (91%) 19,875 (78%) Present 12 (9%) 5669 (22%)
HIOA: Hospitalized In jured Older Adult; AHA: American Hospital Association; HCUP: Healthcare Cost &Utilization Project; COTH: Council of Teaching Hospitals; NICHE: Nurses Improving Care for Hospitalized Elders; HELP: Hospitalized Elder Life Program
Based on teaching status, 95 (74%) hospitals were non-teaching hospitals. Fifty-
four percent of patients were in non-teaching hospitals. Among trauma centers and non-
trauma centers, 73 (57%) of hospitals were non-trauma centers and 55 were trauma
centers (Level 1= 9 [7%]; Level II= 16 [13%]; Level III or IV = 30 [23%]). Among
patients, 43% were from non-trauma centers and 57% were in trauma centers (Level I =
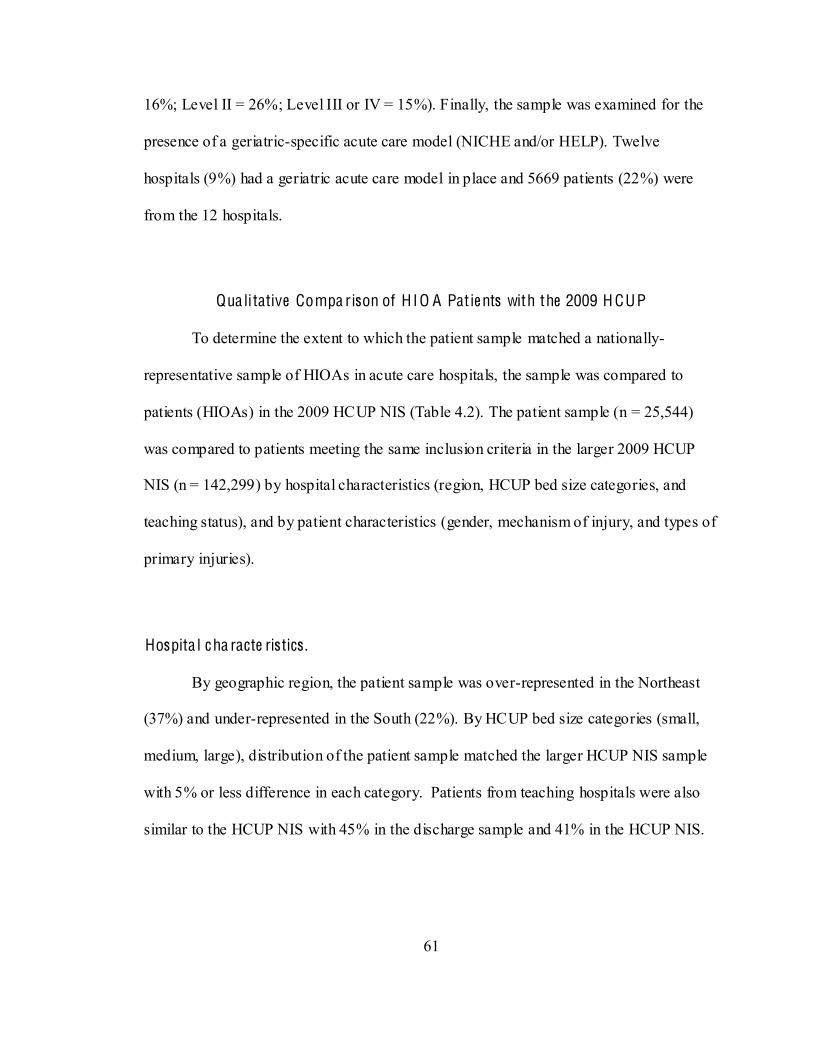
61
16%; Level II = 26%; Level III or IV = 15%). Finally, the sample was examined for the
presence of a geriatric-specific acute care model (NICHE and/or HELP). Twelve
hospitals (9%) had a geriatric acute care model in place and 5669 patients (22%) were
from the 12 hospitals.
Qua li tative Compa rison of H IO A Pat ie nts with the 2009 H CUP
To determine the extent to which the patient sample matched a nationally-
representative sample of HIOAs in acute care hospitals, the sample was compared to
patients (HIOAs) in the 2009 HCUP NIS (Table 4.2). The patient sample (n = 25,544)
was compared to patients meeting the same inclusion criteria in the larger 2009 HCUP
NIS (n = 142,299) by hospital characteristics (region, HCUP bed size categories, and
teaching status), and by patient characteristics (gender, mechanism of injury, and types of
primary injuries).
Hospita l c ha racte ristics .
By geographic region, the patient sample was over-represented in the Northeast
(37%) and under-represented in the South (22%). By HCUP bed size categories (small,
medium, large), distribution of the patient sample matched the larger HCUP NIS sample
with 5% or less difference in each category. Patients from teaching hospitals were also
similar to the HCUP NIS with 45% in the discharge sample and 41% in the HCUP NIS.
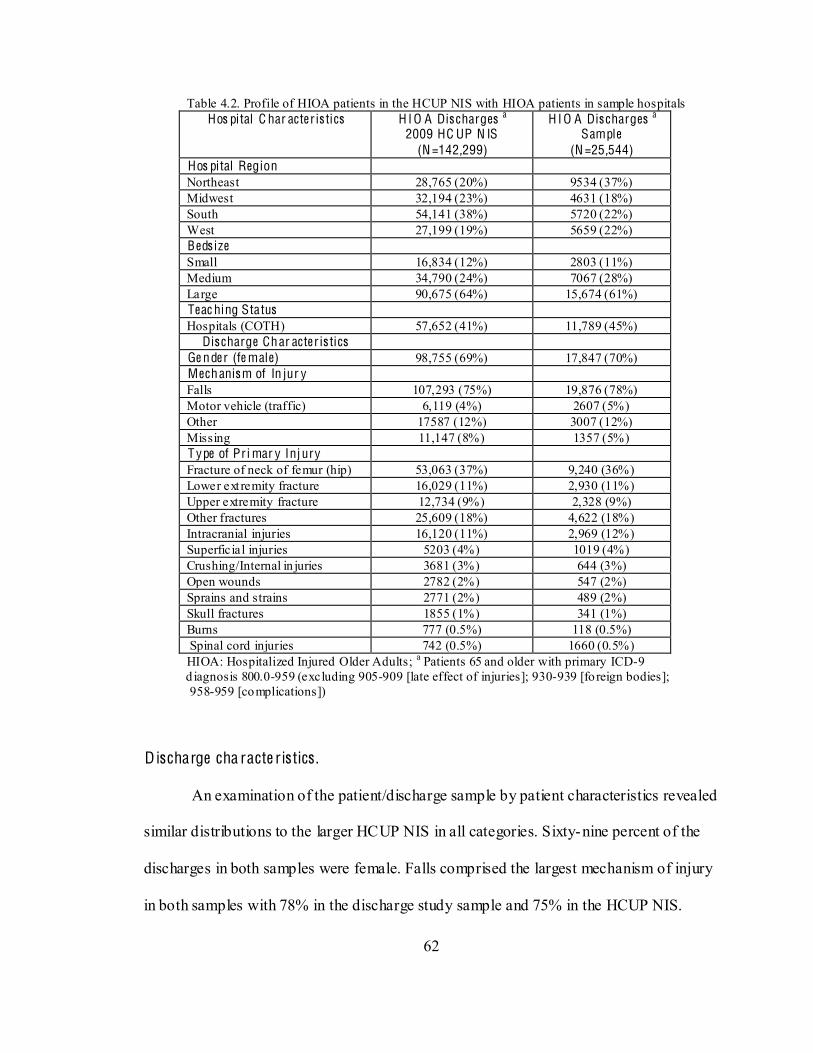
62
Table 4.2. Profile of HIOA patients in the HCUP NIS with HIOA patients in sample hospitals Hos pital C har acter is tics H I O A Dis charges a
2009 HC UP N IS (N =142,299)
H I O A Dis charges a Sample
(N =25,544) Hos pital Region Northeast 28,765 (20%) 9534 (37%) Midwest 32,194 (23%) 4631 (18%) South 54,141 (38%) 5720 (22%) West 27,199 (19%) 5659 (22%) Beds ize Small 16,834 (12%) 2803 (11%) Medium 34,790 (24%) 7067 (28%) Large 90,675 (64%) 15,674 (61%) Teac hing Status Hospitals (COTH) 57,652 (41%) 11,789 (45%)
Dis charge Char acter is tics Ge nder (fe male) 98,755 (69%) 17,847 (70%) Mechanism of In jur y Falls 107,293 (75%) 19,876 (78%) Motor vehicle (traffic) 6,119 (4%) 2607 (5%) Other 17587 (12%) 3007 (12%) Missing 11,147 (8%) 1357 (5%) T ype of Pr i mar y Inj ury Fracture of neck of femur (hip) 53,063 (37%) 9,240 (36%) Lower ext remity fracture 16,029 (11%) 2,930 (11%) Upper extremity fracture 12,734 (9%) 2,328 (9%) Other fractures 25,609 (18%) 4,622 (18%) Intracranial injuries 16,120 (11%) 2,969 (12%) Superficial injuries 5203 (4%) 1019 (4%) Crushing/Internal in juries 3681 (3%) 644 (3%) Open wounds 2782 (2%) 547 (2%) Sprains and strains 2771 (2%) 489 (2%) Skull fractures 1855 (1%) 341 (1%) Burns 777 (0.5%) 118 (0.5%) Spinal cord injuries 742 (0.5%) 1660 (0.5%)
HIOA: Hospitalized Injured Older Adults; a Patients 65 and older with primary ICD-9 d iagnosis 800.0-959 (excluding 905-909 [late effect of injuries]; 930-939 [fo reign bodies]; 958-959 [complications])
Discharge cha racte ristics .
An examination of the patient/discharge sample by patient characteristics revealed
similar distributions to the larger HCUP NIS in all categories. Sixty-nine percent of the
discharges in both samples were female. Falls comprised the largest mechanism of injury
in both samples with 78% in the discharge study sample and 75% in the HCUP NIS.
63
Types of injuries were also similar with femur neck fractures (ICD-9: 820.0) comprising
36% of the study sample and 37% of the HCUP NIS, and other lower extremity fractures
(ICD-9: 821-829) comprising 11% in both samples. Upper extremity fractures (ICD-9:
810-819) comprised 9% of bo -9: 805-809)
accounted for 18% of both samples. Intracranial injuries (ICD-9: 850-854) comprised
11% of both samples. Less frequent injuries listed as a primary diagnosis also matched in
both sets, including superficial injuries (4%), crushing/internal injuries (3%), open
wounds (2%), sprains and strains (2%), skull fractures (1%), burns (0.5%), and spinal
cord injuries (0.5%).
Aim O ne
Aim One: To determine the extent of adoption of targeted ACOVE indicators for
hospitalized injured older adults in acute care settings. The variables collected to meet
this aim were obtained from a survey of hospitals sent to chief nursing officers.
Respondents c
of all indicators followed by extent of adoption by hospital characteristics for each
individual indicator.
64
Descriptive Summa ry of Ove ral l I ndica to r A doption.
Table 4.3 provides a summary of adoption of the nine indicators among the
sample hospitals (n=128). Indicators that had no activity in hospitals ranged from a low
of 7% (assessment for level of independence and need for home health on discharge) to
63% (surgical patients screened for delirium for 3 days postop). The degree of full
implementation of an indicator throughout the hospital ranged from 11%
(multidimensional assessment of cognition) to 72% of the hospitals (assessment for level
of independence and need for home health on discharge).
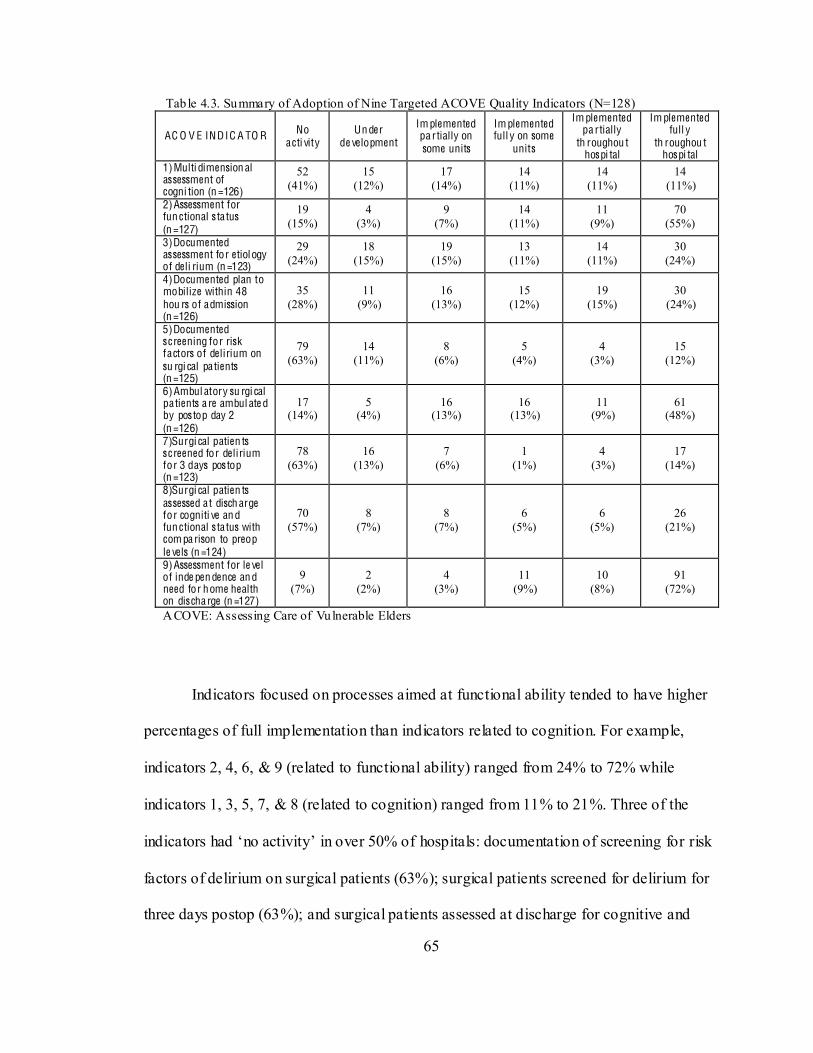
65
Tab le 4.3. Summary of Adoption of Nine Targeted ACOVE Quality Indicators (N=128)
AC O V E INDIC A TO R No acti vity
Un der de velopment
Im plemented pa rtially on some units
Im plemented full y on some
units
Im plemented pa rtially
th roughou t hospi tal
Im plemented full y
th roughou t hospi tal
1)Multi dimension al assessment of cogni tion (n =126)
52 (41%)
15 (12%)
17 (14%)
14 (11%)
14 (11%)
14 (11%)
2)Assessment for fun ctional s ta tus (n =127)
19 (15%)
4 (3%)
9 (7%)
14 (11%)
11 (9%)
70 (55%)
3)Documented assessment for etiology of deli rium (n =123)
29 (24%)
18 (15%)
19 (15%)
13 (11%)
14 (11%)
30 (24%)
4)Documented plan to mobilize within 48 hou rs of admission (n =126)
35 (28%)
11 (9%)
16 (13%)
15 (12%)
19 (15%)
30 (24%)
5)Documented s creening for risk factors of delirium on su rgi cal patients (n =125)
79 (63%)
14 (11%)
8 (6%)
5 (4%)
4 (3%)
15 (12%)
6)Ambul atory su rgi cal patients a re ambul ate d by pos top day 2 (n =126)
17 (14%)
5 (4%)
16 (13%)
16 (13%)
11 (9%)
61 (48%)
7)Surgi cal patien ts s creened for delirium for 3 days pos top (n =123)
78 (63%)
16 (13%)
7 (6%)
1 (1%)
4 (3%)
17 (14%)
8)Surgi cal patien ts assessed at disch arge for cogniti ve an d fun ctional s ta tus with com pa rison to preop le vels (n =124)
70 (57%)
8 (7%)
8 (7%)
6 (5%)
6 (5%)
26 (21%)
9)Assessment for le vel of inde pen dence an d need for home health on dis cha rge (n =127)
9 (7%)
2 (2%)
4 (3%)
11 (9%)
10 (8%)
91 (72%)
ACOVE: Assessing Care of Vulnerable Elders
Indicators focused on processes aimed at functional ability tended to have higher
percentages of full implementation than indicators related to cognition. For example,
indicators 2, 4, 6, & 9 (related to functional ability) ranged from 24% to 72% while
indicators 1, 3, 5, 7, & 8 (related to cognition) ranged from 11% to 21%. Three of the
r risk
factors of delirium on surgical patients (63%); surgical patients screened for delirium for
three days postop (63%); and surgical patients assessed at discharge for cognitive and
66
functional status with comparisons to preoperative levels (57%). The indicator most
d need for home
Post-Hoc A nalyses of Hospital C ha ra cte ristics with Degre e of Imple me ntat ion by
A C O V E I ndica to rs
A C O V E I ndica to r 1: M ultidime ns ional assessme nt of cognition.
Table 4.4 presents a summary of this indicator by hospital characteristics,
including geographic region, bed size, teaching status, trauma center status, and presence
of a geriatric acute care model. The table divides (bolded lines) the level of adoption by
varying level
hospitals in any degree of implementation.
One hundred and twenty-six of 128 hospital respondents answered this survey
question. Partial to complete implementation of this indicator by hospital characteristics
ranged from 33% (hospitals in the Midwest, level III or IV trauma centers; and hospitals
with geriatric acute care models) to 71% (i.e., level I trauma centers). Statistically
significant differences were observed for trauma center status with level I trauma centers
having the highest percentage of implementation (71%, Pearson Chi-Square: 11.51 (df 3,

67
125), p=.009) compared to the lowest (19% for level II trauma centers). No statistically
significant differences in rates were found among the other characteristics.
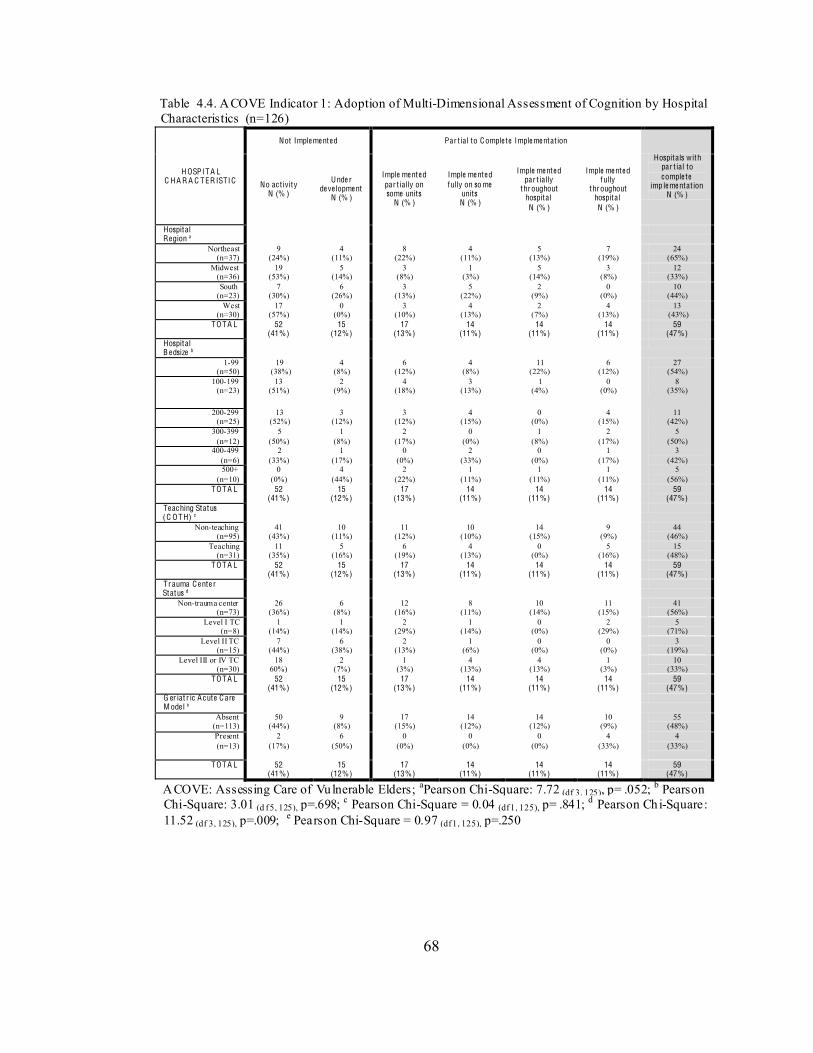
68
Table 4.4. ACOVE Indicator 1: Adoption of Multi-Dimensional Assessment of Cognition by Hospital Characteristics (n=126)
H OSPIT A L C H A R A C TER ISTIC
Not Imple me nte d Par t ial to Comple te Imple me ntat ion
Hospitals with par t ial to comple te
imp le me ntat ion N (% )
No ac t ivity N (% )
Unde r de ve lopme nt
N (% )
Imple me nte d par t ially on some units
N (% )
Imple me nte d fully on so me
units N (% )
Imple me nte d par t ially
throughout hospital N (% )
Imple me nte d fully
throughout hospital N (% )
Hospital Region a
Northeast (n=37)
9 (24%)
4 (11%)
8 (22%)
4 (11%)
5 (13%)
7 (19%)
24 (65%)
Midwest (n=36)
19 (53%)
5 (14%)
3 (8%)
1 (3%)
5 (14%)
3 (8%)
12 (33%)
South (n=23)
7 (30%)
6 (26%)
3 (13%)
5 (22%)
2 (9%)
0 (0%)
10 (44%)
West (n=30)
17 (57%)
0 (0%)
3 (10%)
4 (13%)
2 (7%)
4 (13%)
13 (43%)
TO TA L 52 (41%)
15 (12%)
17 (13%)
14 (11%)
14 (11%)
14 (11%)
59 (47%)
Hospital B e dsize b
1-99 (n=50)
19 (38%)
4 (8%)
6 (12%)
4 (8%)
11 (22%)
6 (12%)
27 (54%)
100-199 (n=23)
13 (51%)
2 (9%)
4 (18%)
3 (13%)
1 (4%)
0 (0%)
8 (35%)
200-299 (n=25)
13 (52%)
3 (12%)
3 (12%)
4 (15%)
0 (0%)
4 (15%)
11 (42%)
300-399 (n=12)
5 (50%)
1 (8%)
2 (17%)
0 (0%)
1 (8%)
2 (17%)
5 (50%)
400-499 (n=6)
2 (33%)
1 (17%)
0 (0%)
2 (33%)
0 (0%)
1 (17%)
3 (42%)
500+ (n=10)
0 (0%)
4 (44%)
2 (22%)
1 (11%)
1 (11%)
1 (11%)
5 (56%)
TO TA L 52 (41%)
15 (12%)
17 (13%)
14 (11%)
14 (11%)
14 (11%)
59 (47%)
Te ac hing Status (C O TH) c
Non-teaching (n=95)
41 (43%)
10 (11%)
11 (12%)
10 (10%)
14 (15%)
9 (9%)
44 (46%)
Teaching (n=31)
11 (35%)
5 (16%)
6 (19%)
4 (13%)
0 (0%)
5 (16%)
15 (48%)
TO TA L 52 (41%)
15 (12%)
17 (13%)
14 (11%)
14 (11%)
14 (11%)
59 (47%)
Tr auma C e nte r Status d
Non-trauma center (n=73)
26 (36%)
6 (8%)
12 (16%)
8 (11%)
10 (14%)
11 (15%)
41 (56%)
Level I TC (n=8)
1 (14%)
1 (14%)
2 (29%)
1 (14%)
0 (0%)
2 (29%)
5 (71%)
Level II TC (n=15)
7 (44%)
6 (38%)
2 (13%)
1 (6%)
0 (0%)
0 (0%)
3 (19%)
Level III or IV TC (n=30)
18 60%)
2 (7%)
1 (3%)
4 (13%)
4 (13%)
1 (3%)
10 (33%)
TO TA L 52 (41%)
15 (12%)
17 (13%)
14 (11%)
14 (11%)
14 (11%)
59 (47%)
G er iat r ic A c ute C are M ode l e
Absent (n=113)
50 (44%)
9 (8%)
17 (15%)
14 (12%)
14 (12%)
10 (9%)
55 (48%)
Present (n=13)
2 (17%)
6 (50%)
0 (0%)
0 (0%)
0 (0%)
4 (33%)
4 (33%)
TO TA L 52
(41%) 15
(12%) 17
(13%) 14
(11%) 14
(11%) 14
(11%) 59
(47%)
ACOVE: Assessing Care of Vulnerable Elders; aPearson Chi-Square: 7.72 (df 3, 125), p= .052; b Pearson Chi-Square: 3.01 (d f 5, 125), p=.698; c Pearson Chi-Square = 0.04 (df 1, 125), p= .841; d Pearson Chi-Square: 11.52 (df 3, 125), p=.009; e Pearson Chi-Square = 0.97 (df 1, 125), p=.250
69
A C O V E I ndica to r 2: Assessme nt fo r funct ional status .
Table 4.5 presents the summary of this indicator by hospital characteristics. One
hundred and twenty-seven of 128 hospital respondents answered this survey question.
Partial to complete implementation of this indicator ranged from 67% (Midwest region;
400-499 bed size) to 97% (Northeast region). A statistically significant difference among
geographic regions was observed with the northeast region having the highest percentage
of partial to complete implementation (97%; Pearson Chi-Square: 13.213 (df 3, 126),
p=.004) compared to the lowest (67%) in the Midwest. No statistically significant
differences were found for other hospital characteristics. Of note, hospitals most likely to
have ful l implementation throughout the hospital (column 6) of the indicator throughout
the hospital were those in the Northeast (71%), hospitals with a geriatric acute care model
(75%), and level I trauma centers (75%).
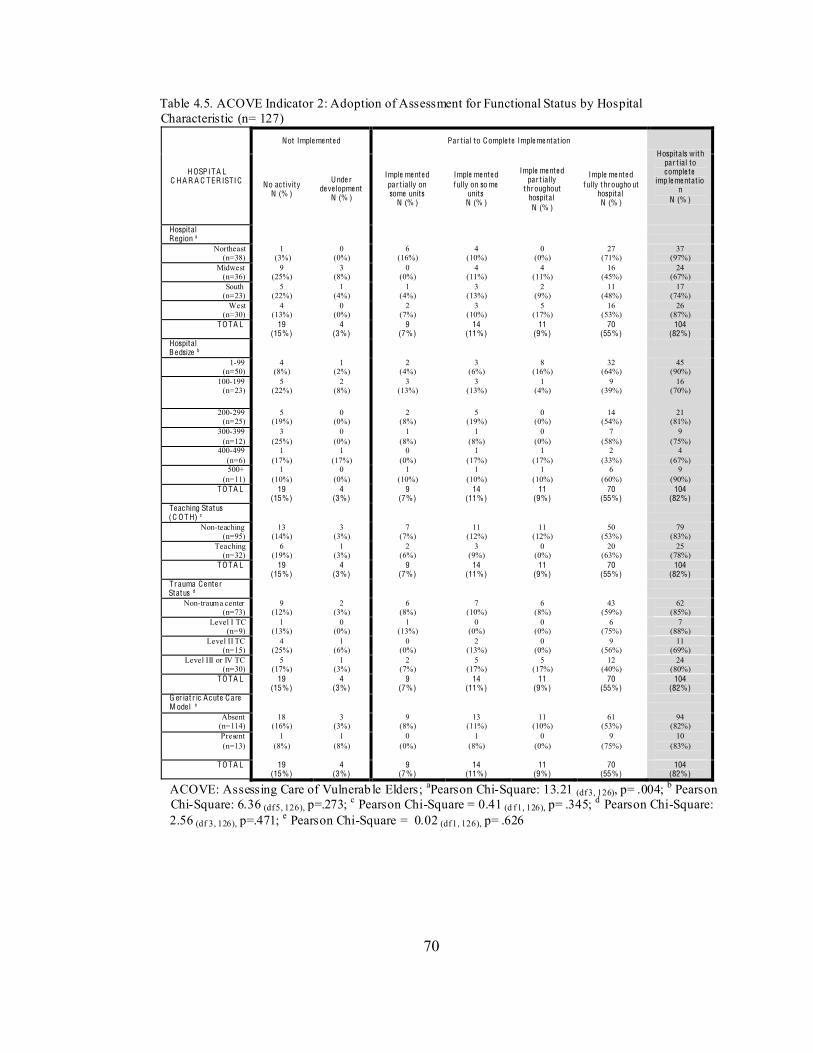
70
Table 4.5. ACOVE Indicator 2: Adoption of Assessment for Functional Status by Hospital Characteristic (n= 127)
H OSPITA L C H A R A C TER ISTIC
Not Imple me nte d Par t ial to Comple te Imple me ntat ion
Hospitals with par t ial to comple te
imp le me ntat ion
N (% )
No ac t ivity N (% )
Unde r de ve lopme nt
N (% )
Imple me nte d par t ially on some units
N (% )
Imple me nte d fully on so me
units N (% )
Imple me nte d par t ially
throughout hospital N (% )
Imple me nte d fully througho ut
hospital N (% )
Hospital Region a
Northeast (n=38)
1 (3%)
0 (0%)
6 (16%)
4 (10%)
0 (0%)
27 (71%)
37 (97%)
Midwest (n=36)
9 (25%)
3 (8%)
0 (0%)
4 (11%)
4 (11%)
16 (45%)
24 (67%)
South (n=23)
5 (22%)
1 (4%)
1 (4%)
3 (13%)
2 (9%)
11 (48%)
17 (74%)
West (n=30)
4 (13%)
0 (0%)
2 (7%)
3 (10%)
5 (17%)
16 (53%)
26 (87%)
TO TA L 19 (15%)
4 (3%)
9 (7%)
14 (11%)
11 (9%)
70 (55%)
104 (82%)
Hospital B e dsize b
1-99 (n=50)
4 (8%)
1 (2%)
2 (4%)
3 (6%)
8 (16%)
32 (64%)
45 (90%)
100-199 (n=23)
5 (22%)
2 (8%)
3 (13%)
3 (13%)
1 (4%)
9 (39%)
16 (70%)
200-299 (n=25)
5 (19%)
0 (0%)
2 (8%)
5 (19%)
0 (0%)
14 (54%)
21 (81%)
300-399 (n=12)
3 (25%)
0 (0%)
1 (8%)
1 (8%)
0 (0%)
7 (58%)
9 (75%)
400-499 (n=6)
1 (17%)
1 (17%)
0 (0%)
1 (17%)
1 (17%)
2 (33%)
4 (67%)
500+ (n=11)
1 (10%)
0 (0%)
1 (10%)
1 (10%)
1 (10%)
6 (60%)
9 (90%)
TO TA L 19 (15%)
4 (3%)
9 (7%)
14 (11%)
11 (9%)
70 (55%)
104 (82%)
Te ac hing Status (C O TH) c
Non-teaching (n=95)
13 (14%)
3 (3%)
7 (7%)
11 (12%)
11 (12%)
50 (53%)
79 (83%)
Teaching (n=32)
6 (19%)
1 (3%)
2 (6%)
3 (9%)
0 (0%)
20 (63%)
25 (78%)
TO TA L 19 (15%)
4 (3%)
9 (7%)
14 (11%)
11 (9%)
70 (55%)
104 (82%)
Tr auma C e nte r Status d
Non-trauma center (n=73)
9 (12%)
2 (3%)
6 (8%)
7 (10%)
6 (8%)
43 (59%)
62 (85%)
Level I TC (n=9)
1 (13%)
0 (0%)
1 (13%)
0 (0%)
0 (0%)
6 (75%)
7 (88%)
Level II TC (n=15)
4 (25%)
1 (6%)
0 (0%)
2 (13%)
0 (0%)
9 (56%)
11 (69%)
Level III or IV TC (n=30)
5 (17%)
1 (3%)
2 (7%)
5 (17%)
5 (17%)
12 (40%)
24 (80%)
TO TA L 19 (15%)
4 (3%)
9 (7%)
14 (11%)
11 (9%)
70 (55%)
104 (82%)
G er iat r ic A c ute C are M ode l e
Absent (n=114)
18 (16%)
3 (3%)
9 (8%)
13 (11%)
11 (10%)
61 (53%)
94 (82%)
Present (n=13)
1 (8%)
1 (8%)
0 (0%)
1 (8%)
0 (0%)
9 (75%)
10 (83%)
TO TA L 19
(15%) 4
(3%) 9
(7%) 14
(11%) 11
(9%) 70
(55%) 104
(82%)
ACOVE: Assessing Care of Vulnerab le Elders; aPearson Chi-Square: 13.21 (df 3, 126), p= .004; b Pearson Chi-Square: 6.36 (df 5, 126), p=.273; c Pearson Chi-Square = 0.41 (d f 1, 126), p= .345; d Pearson Chi-Square: 2.56 (df 3, 126), p=.471; e Pearson Chi-Square = 0.02 (df 1, 126), p= .626
71
A C O V E I ndica to r 3: Doc ume nte d assessme nt fo r e tiology of de li r ium.
Table 4.6 summarizes this indicator by hospital characteristics. One hundred and
twenty-three of 128 hospital respondents answered this survey question. No statistically
significant differences between implementation groups were found for any hospital
characteristic. Partial to complete implementation was present in over 50% of the hospital
characteristics with one exception (level II trauma centers [36%]).
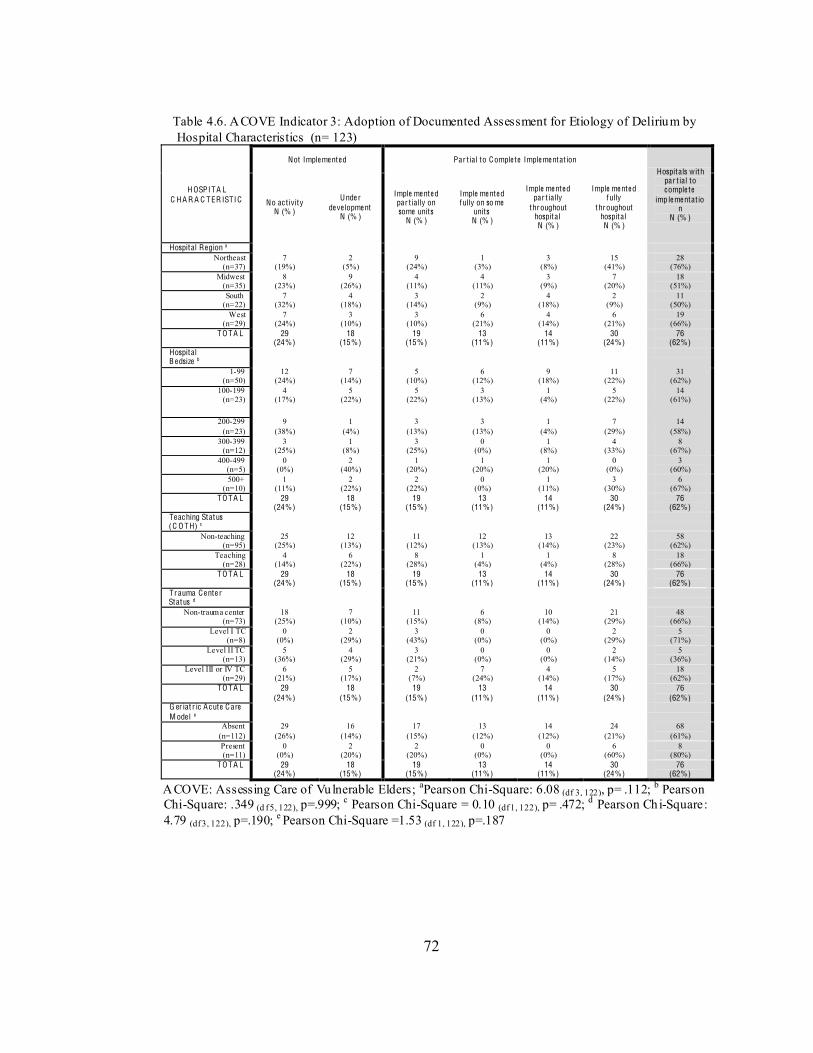
72
Table 4.6. ACOVE Indicator 3: Adoption of Documented Assessment for Etiology of Delirium by Hospital Characteristics (n= 123)
H OSPITA L C H A R A C TER ISTIC
Not Imple me nte d Par t ial to Comple te Imple me ntat ion Hospitals with
par t ial to comple te
imp le me ntat ion
N (% )
No ac t ivity N (% )
Unde r de ve lopme nt
N (% )
Imple me nte d par t ially on some units
N (% )
Imple me nte d fully on so me
units N (% )
Imple me nte d par t ially
throughout hospital N (% )
Imple me nte d fully
throughout hospital N (% )
Hospital Region a Northeast
(n=37) 7
(19%) 2
(5%) 9
(24%) 1
(3%) 3
(8%) 15
(41%) 28
(76%) Midwest
(n=35) 8
(23%) 9
(26%) 4
(11%) 4
(11%) 3
(9%) 7
(20%) 18
(51%) South
(n=22) 7
(32%) 4
(18%) 3
(14%) 2
(9%) 4
(18%) 2
(9%) 11
(50%) West
(n=29) 7
(24%) 3
(10%) 3
(10%) 6
(21%) 4
(14%) 6
(21%) 19
(66%) TO TA L 29
(24%) 18
(15%) 19
(15%) 13
(11%) 14
(11%) 30
(24%) 76
(62%) Hospital B e dsize b
1-99 (n=50)
12 (24%)
7 (14%)
5 (10%)
6 (12%)
9 (18%)
11 (22%)
31 (62%)
100-199 (n=23)
4 (17%)
5 (22%)
5 (22%)
3 (13%)
1 (4%)
5 (22%)
14 (61%)
200-299 (n=23)
9 (38%)
1 (4%)
3 (13%)
3 (13%)
1 (4%)
7 (29%)
14 (58%)
300-399 (n=12)
3 (25%)
1 (8%)
3 (25%)
0 (0%)
1 (8%)
4 (33%)
8 (67%)
400-499 (n=5)
0 (0%)
2 (40%)
1 (20%)
1 (20%)
1 (20%)
0 (0%)
3 (60%)
500+ (n=10)
1 (11%)
2 (22%)
2 (22%)
0 (0%)
1 (11%)
3 (30%)
6 (67%)
TO TA L 29 (24%)
18 (15%)
19 (15%)
13 (11%)
14 (11%)
30 (24%)
76 (62%)
Te ac hing Status (C O TH) c
Non-teaching (n=95)
25 (25%)
12 (13%)
11 (12%)
12 (13%)
13 (14%)
22 (23%)
58 (62%)
Teaching (n=28)
4 (14%)
6 (22%)
8 (28%)
1 (4%)
1 (4%)
8 (28%)
18 (66%)
TO TA L 29 (24%)
18 (15%)
19 (15%)
13 (11%)
14 (11%)
30 (24%)
76 (62%)
Tr auma C e nte r Status d
Non-trauma center (n=73)
18 (25%)
7 (10%)
11 (15%)
6 (8%)
10 (14%)
21 (29%)
48 (66%)
Level I TC (n=8)
0 (0%)
2 (29%)
3 (43%)
0 (0%)
0 (0%)
2 (29%)
5 (71%)
Level II TC (n=13)
5 (36%)
4 (29%)
3 (21%)
0 (0%)
0 (0%)
2 (14%)
5 (36%)
Level III or IV TC (n=29)
6 (21%)
5 (17%)
2 (7%)
7 (24%)
4 (14%)
5 (17%)
18 (62%)
TO TA L 29 (24%)
18 (15%)
19 (15%)
13 (11%)
14 (11%)
30 (24%)
76 (62%)
G er iat r ic A c ute C are M ode l e
Absent (n=112)
29 (26%)
16 (14%)
17 (15%)
13 (12%)
14 (12%)
24 (21%)
68 (61%)
Present (n=11)
0 (0%)
2 (20%)
2 (20%)
0 (0%)
0 (0%)
6 (60%)
8 (80%)
TO TA L 29 (24%)
18 (15%)
19 (15%)
13 (11%)
14 (11%)
30 (24%)
76 (62%)
ACOVE: Assessing Care of Vulnerable Elders; aPearson Chi-Square: 6.08 (df 3, 122), p= .112; b Pearson Chi-Square: .349 (d f 5, 122), p=.999; c Pearson Chi-Square = 0.10 (df 1, 122), p= .472; d Pearson Chi-Square: 4.79 (df 3, 122), p=.190; e Pearson Chi-Square =1.53 (df 1, 122), p=.187
73
A C O V E I ndica to r 4: Doc ume nte d plan to inc re ase mobil ity within 48 hours of
admiss ion.
Table 4.7 provides a summary of this indicator by hospital characteristics. One
hundred and twenty-six of 128 hospital respondents answered this survey question.
Partial to complete implementation of this indicator by hospital characteristic ranged
from 38% (level II trauma centers) to 87% (level I trauma centers). There were no
statistically significant differences between groups for any of the hospital characteristics.
Partial to complete implementation occurred in 50% or more for each characteristic with
the exception of level II trauma centers.
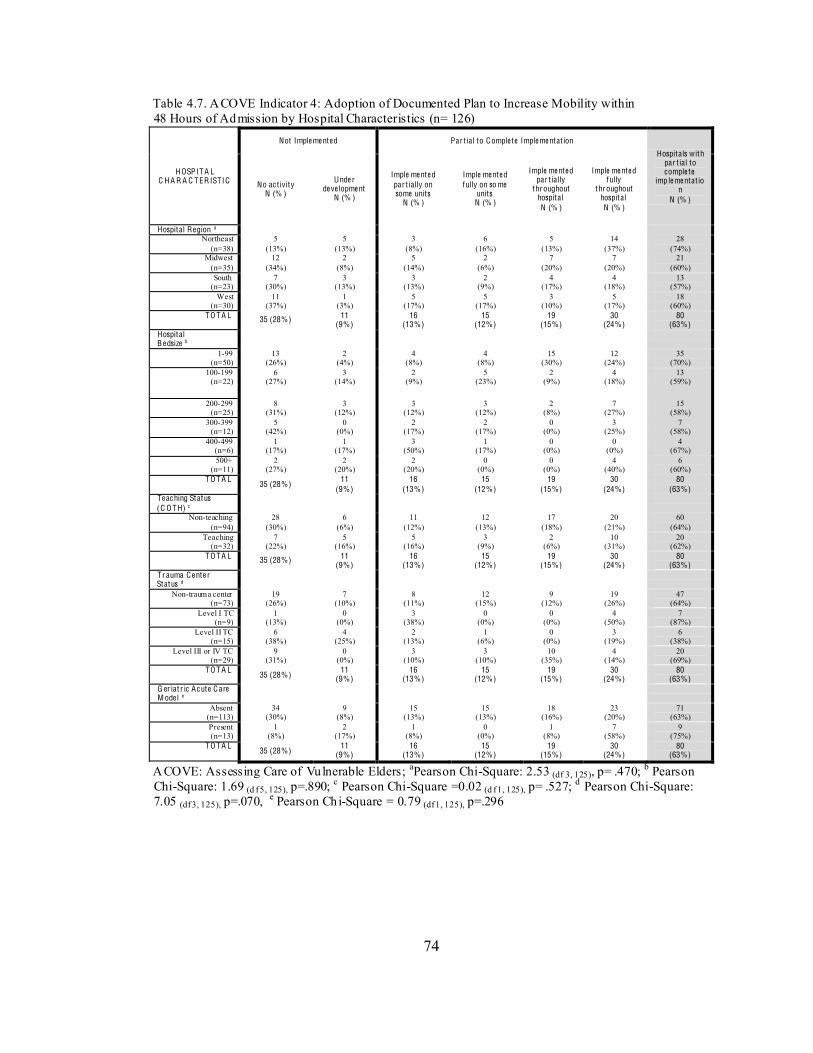
74
Table 4.7. ACOVE Indicator 4: Adoption of Documented Plan to Increase Mobility within 48 Hours of Admission by Hospital Characteristics (n= 126)
H OSPITA L C H A R A C TER ISTIC
Not Imple me nte d Par t ial to Comple te Imple me ntat ion
Hospitals with par t ial to comple te
imp le me ntat ion
N (% )
No ac t ivity N (% )
Unde r de ve lopme nt
N (% )
Imple me nte d par t ially on some units
N (% )
Imple me nte d fully on so me
units N (% )
Imple me nte d par t ially
throughout hospital N (% )
Imple me nte d fully
throughout hospital N (% )
Hospital Region a Northeast
(n=38) 5
(13%) 5
(13%) 3
(8%) 6
(16%) 5
(13%) 14
(37%) 28
(74%) Midwest
(n=35) 12
(34%) 2
(8%) 5
(14%) 2
(6%) 7
(20%) 7
(20%) 21
(60%) South
(n=23) 7
(30%) 3
(13%) 3
(13%) 2
(9%) 4
(17%) 4
(18%) 13
(57%) West
(n=30) 11
(37%) 1
(3%) 5
(17%) 5
(17%) 3
(10%) 5
(17%) 18
(60%) TO TA L 35 (28%) 11
(9%) 16
(13%) 15
(12%) 19
(15%) 30
(24%) 80
(63%) Hospital B e dsize b
1-99 (n=50)
13 (26%)
2 (4%)
4 (8%)
4 (8%)
15 (30%)
12 (24%)
35 (70%)
100-199 (n=22)
6 (27%)
3 (14%)
2 (9%)
5 (23%)
2 (9%)
4 (18%)
13 (59%)
200-299 (n=25)
8 (31%)
3 (12%)
3 (12%)
3 (12%)
2 (8%)
7 (27%)
15 (58%)
300-399 (n=12)
5 (42%)
0 (0%)
2 (17%)
2 (17%)
0 (0%)
3 (25%)
7 (58%)
400-499 (n=6)
1 (17%)
1 (17%)
3 (50%)
1 (17%)
0 (0%)
0 (0%)
4 (67%)
500+ (n=11)
2 (27%)
2 (20%)
2 (20%)
0 (0%)
0 (0%)
4 (40%)
6 (60%)
TO TA L 35 (28%)
11 (9%)
16 (13%)
15 (12%)
19 (15%)
30 (24%)
80 (63%)
Te ac hing Status (C O TH) c
Non-teaching (n=94)
28 (30%)
6 (6%)
11 (12%)
12 (13%)
17 (18%)
20 (21%)
60 (64%)
Teaching (n=32)
7 (22%)
5 (16%)
5 (16%)
3 (9%)
2 (6%)
10 (31%)
20 (62%)
TO TA L 35 (28%) 11 (9%)
16 (13%)
15 (12%)
19 (15%)
30 (24%)
80 (63%)
Tr auma C e nte r Status d
Non-trauma center (n=73)
19 (26%)
7 (10%)
8 (11%)
12 (15%)
9 (12%)
19 (26%)
47 (64%)
Level I TC (n=9)
1 (13%)
0 (0%)
3 (38%)
0 (0%)
0 (0%)
4 (50%)
7 (87%)
Level II TC (n=15)
6 (38%)
4 (25%)
2 (13%)
1 (6%)
0 (0%)
3 (19%)
6 (38%)
Level III or IV TC (n=29)
9 (31%)
0 (0%)
3 (10%)
3 (10%)
10 (35%)
4 (14%)
20 (69%)
TO TA L 35 (28%)
11 (9%)
16 (13%)
15 (12%)
19 (15%)
30 (24%)
80 (63%)
G er iat r ic A c ute C are M ode l e
Absent (n=113)
34 (30%)
9 (8%)
15 (13%)
15 (13%)
18 (16%)
23 (20%)
71 (63%)
Present (n=13)
1 (8%)
2 (17%)
1 (8%)
0 (0%)
1 (8%)
7 (58%)
9 (75%)
TO TA L 35 (28%)
11 (9%)
16 (13%)
15 (12%)
19 (15%)
30 (24%)
80 (63%)
ACOVE: Assessing Care of Vulnerable Elders; aPearson Chi-Square: 2.53 (df 3, 125), p= .470; b Pearson Chi-Square: 1.69 (d f 5, 125), p=.890; c Pearson Chi-Square =0.02 (d f 1, 125), p= .527; d Pearson Chi-Square: 7.05 (df 3, 125), p=.070, e Pearson Chi-Square = 0.79 (df 1, 125), p=.296
75
A C O V E I ndica to r 5: Doc ume nte d sc re e ning of surgica l pat ie nts fo r ris k facto rs fo r
de li rium.
Table 4.8 provides a summary of the implementation of this indicator by hospital
characteristic. One hundred and twenty-five of 128 hospital respondents answered this
survey question. Partial to complete implementation of this indicator ranged from 11%
(Midwest region) to 50% (bed size 400 to 499). There were no statistically significant
differences between groups for any hospital characteristic.

76
Tab le 4.8. ACOVE Indicator 5: Adoption of Documented Screen ing of Surg ical Patients for Risk Factors for Delirium Prior to Surgery BY Hospital Characteristics (n= 125)
H OSPITA L C H A R A C TER ISTIC
Not Imple me nte d Par t ial to Comple te Imple me ntat ion
Hospitals with par t ial to comple te
imp le me ntat ion N (% )
No ac t ivity N (% )
Unde r de ve lopme nt
N (% )
Imple me nte d par t ially on some units
N (% )
Imple me nte d fully on so me
units N (% )
Imple me nte d par t ially
throughout hospital N (% )
Imple me nte d fully
throughout hospital N (% )
Hospital Region a Northeast
(n=37) 19
(16%) 6
16%) 3
(8%) 1
(3%) 2
(5%) 6
(16%) 12
(32%) Midwest
(n=35) 28
(80%) 3
(9%) 1
(3%) 1
(3%) 0
(0%) 2
(6%) 4
(11%) South
(n=22) 16
(73%) 1
(5%) 1
(5%) 1
(5%) 1
(5%) 2
(9%) 5
(22%) West
(n=31) 16
(51%) 4
(13%) 3
(10%) 2
(7%) 1
(3%) 5
(16%) 11
(36%) TO TA L 79
(63%) 14
(11%) 8
(6%) 5
(4%) 4
(3%) 15
(12%) 32
(26%) Hospital B e dsize b
1-99 (n=50)
36 (72%)
4 (8%)
1 (2%)
0 (0%)
2 (4%)
7 (14%)
10 (20%)
100-199 (n=22)
14 (64%)
4 (18%)
2 (9%)
1 (5%)
0 (0%)
1 (5%)
4 (18%)
200-299 (n=24)
13 (56%)
4 (16%)
1 (4%)
4 (16%)
0 (0%)
3 (12%)
8 (32%)
300-399 (n=13)
6 (46%)
1 (8%)
2 (15%)
0 (0%)
2 (15%)
2 (15%)
6 (46%)
400-499 (n=6)
3 (50%)
0 (0%)
2 (33%)
0 (0%)
0 (0%)
1 (17%)
3 (50%)
500+ (n=10)
7 (78%)
1 (11%)
0 (0%)
0 (0%)
0 (0%)
1 (11%)
1 (11%)
TO TA L 79 (63%)
14 (11%)
8 (6%)
5 (4%)
4 (3%)
15 (12%)
32 (26%)
Te ac hing Status (C O TH) c
Non-teaching (n=94)
60 (64%)
9 (10%)
5 (5%)
4 (4%)
3 (3%)
13 (14%)
25 (26%)
Teaching (n=31)
10 (62%)
5 (16%)
3 10%)
1 (3%)
1 (3%)
2 (6%)
7 (22%)
TO TA L 79 (63%)
14 (11%)
8 (6%)
5 (4%)
4 (3%)
15 (12%)
32 (26%)
Tr auma C e nte r Status d
Non-trauma center (n=74)
42 (59%)
9 (12%)
4 (6%)
3 (4%)
3 (4%)
11 (15%)
21 (29%)
Level I TC (n=8)
6 (75%)
0 (0%)
2 (25%)
0 (0%)
0 (0%)
0 (0%)
2 (25%)
Level II TC (n=14)
11 (73%)
2 (13%)
1 (7%)
0 (0%)
0 (0%)
1 (7%)
2 13%)
Level III or IV TC (n=29)
19 (66%)
3 (10%)
1 (3%)
2 (7%)
1 (3%)
3 (10%)
7 (24%)
TO TA L 79 (63%)
14 (11%)
8 (6%)
5 (4%)
4 (3%)
15 (12%)
32 (26%)
G er iat r ic A c ute C are M ode l e
Absent (n=113)
75 (66%)
10 (9%)
8 (7%)
5 (4%)
3 (3%)
13 (11%)
29 (25%)
Present (n=12)
4 (30%)
4 (42%)
0 (0%)
0 (0%)
1 (9%)
2 (18%)
3 (27%)
TO TA L 79 (63%)
14 (11%)
8 (6%)
5 (4%)
4 (3%)
15 (12%)
32 (26%)
ACOVE: Assessing Care of Vulnerab le Elders; aPearson Chi-Square: 6.29 (df 3, 124), p= .099; b Pearson Chi-Square:7.47 (df 5, 124), p=.171; c Pearson Chi-Square = 0.20 (df 1, 124), p= .426; d Pearson Chi-Square: 1.60 (df 3, 124), p=..661; e Pearson Chi-Square = 0.02 (df 1, 124), p=.570
77
A C O V E I ndica to r 6: Pat ie nts ambulato ry prio r to surge ry a re ambulate d by postop
day 2.
Table 4.9 summarizes the implementation of this indicator by hospital
characteristic. One hundred and twenty-six of 128 hospital respondents answered this
survey question. Partial to complete implementation ranged from 60% (500+ bed size) to
93% (level III or IV trauma centers). No statistically significant differences between
groups were found for any hospital characteristic.
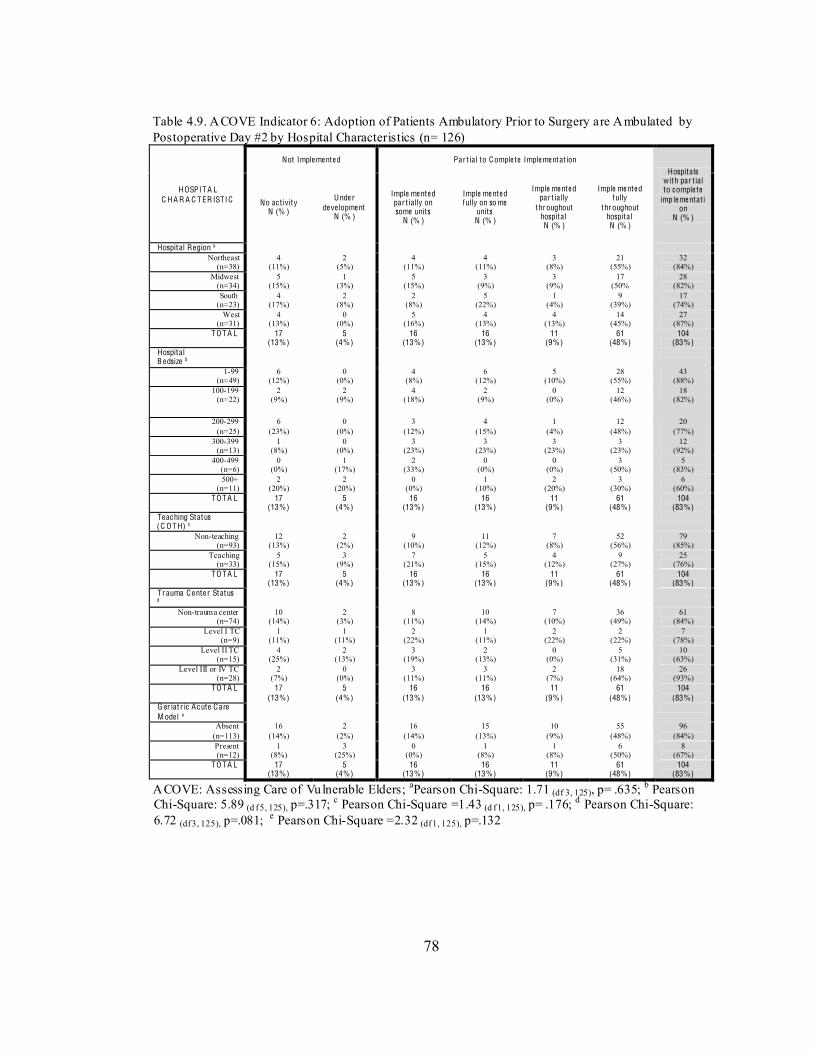
78
Table 4.9. ACOVE Indicator 6: Adoption of Patients Ambulatory Prior to Surgery are Ambulated by Postoperative Day #2 by Hospital Characteristics (n= 126)
H OSPITA L C H A R A C TER ISTIC
Not Imple me nte d Par t ial to Comple te Imple me ntat ion Hospitals
with par t ial to comple te
imp le me ntat ion
N (% )
No ac t ivity N (% )
Unde r de ve lopme nt
N (% )
Imple me nte d par t ially on some units
N (% )
Imple me nte d fully on so me
units N (% )
Imple me nte d par t ially
throughout hospital N (% )
Imple me nte d fully
throughout hospital N (% )
Hospital Region a Northeast
(n=38) 4
(11%) 2
(5%) 4
(11%) 4
(11%) 3
(8%) 21
(55%) 32
(84%) Midwest
(n=34) 5
(15%) 1
(3%) 5
(15%) 3
(9%) 3
(9%) 17
(50% 28
(82%) South
(n=23) 4
(17%) 2
(8%) 2
(8%) 5
(22%) 1
(4%) 9
(39%) 17
(74%) West
(n=31) 4
(13%) 0
(0%) 5
(16%) 4
(13%) 4
(13%) 14
(45%) 27
(87%) TO TA L 17
(13%) 5
(4%) 16
(13%) 16
(13%) 11
(9%) 61
(48%) 104
(83%) Hospital B e dsize b
1-99 (n=49)
6 (12%)
0 (0%)
4 (8%)
6 (12%)
5 (10%)
28 (55%)
43 (88%)
100-199 (n=22)
2 (9%)
2 (9%)
4 (18%)
2 (9%)
0 (0%)
12 (46%)
18 (82%)
200-299 (n=25)
6 (23%)
0 (0%)
3 (12%)
4 (15%)
1 (4%)
12 (48%)
20 (77%)
300-399 (n=13)
1 (8%)
0 (0%)
3 (23%)
3 (23%)
3 (23%)
3 (23%)
12 (92%)
400-499 (n=6)
0 (0%)
1 (17%)
2 (33%)
0 (0%)
0 (0%)
3 (50%)
5 (83%)
500+ (n=11)
2 (20%)
2 (20%)
0 (0%)
1 (10%)
2 (20%)
3 (30%)
6 (60%)
TO TA L 17 (13%)
5 (4%)
16 (13%)
16 (13%)
11 (9%)
61 (48%)
104 (83%)
Te ac hing Status (C O TH) c
Non-teaching (n=93)
12 (13%)
2 (2%)
9 (10%)
11 (12%)
7 (8%)
52 (56%)
79 (85%)
Teaching (n=33)
5 (15%)
3 (9%)
7 (21%)
5 (15%)
4 (12%)
9 (27%)
25 (76%)
TO TA L 17 (13%)
5 (4%)
16 (13%)
16 (13%)
11 (9%)
61 (48%)
104 (83%)
Tr auma C e nte r Status
d
Non-trauma center (n=74)
10 (14%)
2 (3%)
8 (11%)
10 (14%)
7 (10%)
36 (49%)
61 (84%)
Level I TC (n=9)
1 (11%)
1 (11%)
2 (22%)
1 (11%)
2 (22%)
2 (22%)
7 (78%)
Level II TC (n=15)
4 (25%)
2 (13%)
3 (19%)
2 (13%)
0 (0%)
5 (31%)
10 (63%)
Level III or IV TC (n=28)
2 (7%)
0 (0%)
3 (11%)
3 (11%)
2 (7%)
18 (64%)
26 (93%)
TO TA L 17 (13%)
5 (4%)
16 (13%)
16 (13%)
11 (9%)
61 (48%)
104 (83%)
G er iat r ic A c ute C are M ode l e
Absent (n=113)
16 (14%)
2 (2%)
16 (14%)
15 (13%)
10 (9%)
55 (48%)
96 (84%)
Present (n=12)
1 (8%)
3 (25%)
0 (0%)
1 (8%)
1 (8%)
6 (50%)
8 (67%)
TO TA L 17 (13%)
5 (4%)
16 (13%)
16 (13%)
11 (9%)
61 (48%)
104 (83%)
ACOVE: Assessing Care of Vulnerable Elders; aPearson Chi-Square: 1.71 (df 3, 125), p= .635; b Pearson Chi-Square: 5.89 (d f 5, 125), p=.317; c Pearson Chi-Square =1.43 (d f 1, 125), p= .176; d Pearson Chi-Square: 6.72 (df 3, 125), p=.081; e Pearson Chi-Square =2.32 (df 1, 125), p=.132
79
A C O V E I ndica to r 7: Surgical pat ie nts scre e ne d for de li r ium fo r 3 days postop.
Table 4.10 provides a summary of the implementation of this indicator by hospital
characteristic. One hundred and twenty-three of 128 hospital respondents answered this
survey question. Partial to complete implementation ranged from 6% (level II trauma
centers) to 83% (400 to 499 bed size). Statistically significant differences between groups
were found for hospital bed size with hospitals of bed size 400 to 499 having 83% partial
to complete implementation (Pearson Chi-square: 17.83 (df 5, 122), p=.003), compared to
only 5% for hospitals of bed size 100 to 199.
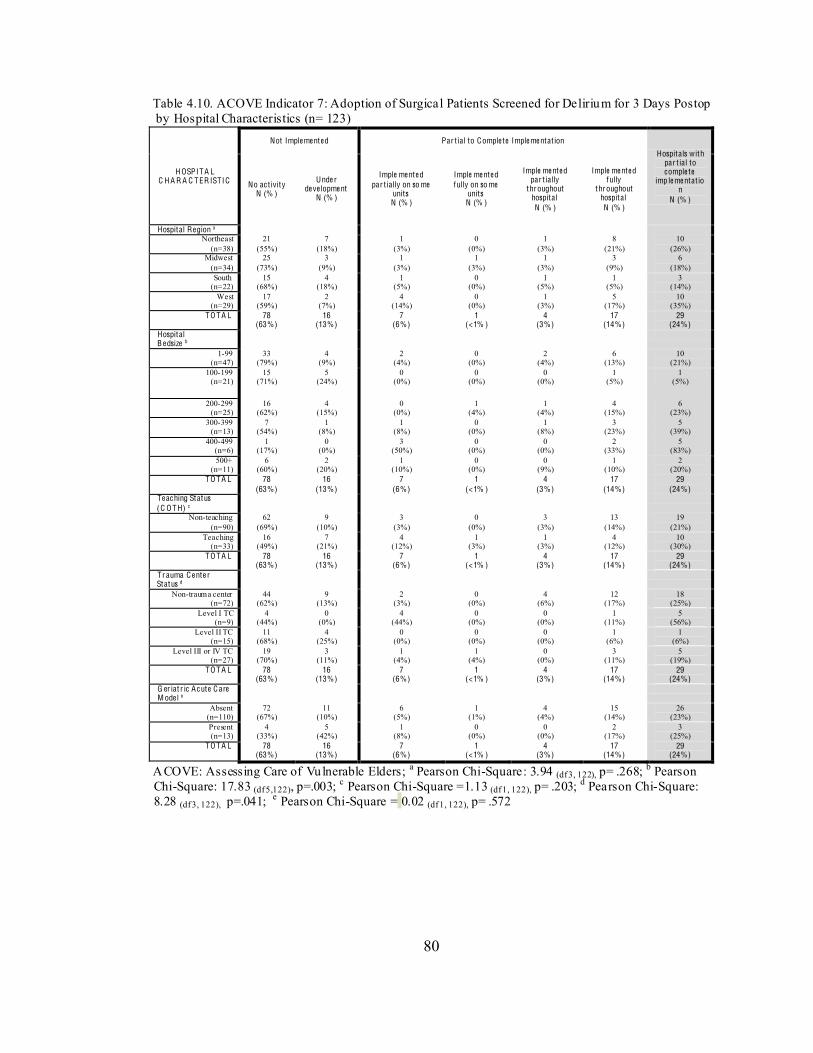
80
Table 4.10. ACOVE Indicator 7: Adoption of Surgical Patients Screened for Delirium for 3 Days Postop by Hospital Characteristics (n= 123)
H OSPITA L C H A R A C TER ISTIC
Not Imple me nte d Par t ial to Comple te Imple me ntat ion
Hospitals with par t ial to comple te
imp le me ntat ion
N (% )
No ac t ivity N (% )
Unde r de ve lopme nt
N (% )
Imple me nte d par t ially on so me
units N (% )
Imple me nte d fully on so me
units N (% )
Imple me nte d par t ially
throughout hospital N (% )
Imple me nte d fully
throughout hospital N (% )
Hospital Region a Northeast
(n=38) 21
(55%) 7
(18%) 1
(3%) 0
(0%) 1
(3%) 8
(21%) 10
(26%) Midwest
(n=34) 25
(73%) 3
(9%) 1
(3%) 1
(3%) 1
(3%) 3
(9%) 6
(18%) South
(n=22) 15
(68%) 4
(18%) 1
(5%) 0
(0%) 1
(5%) 1
(5%) 3
(14%) West
(n=29) 17
(59%) 2
(7%) 4
(14%) 0
(0%) 1
(3%) 5
(17%) 10
(35%) TO TA L 78
(63%) 16
(13%) 7
(6%) 1
(<1% ) 4
(3%) 17
(14%) 29
(24%) Hospital B e dsize b
1-99 (n=47)
33 (79%)
4 (9%)
2 (4%)
0 (0%)
2 (4%)
6 (13%)
10 (21%)
100-199 (n=21)
15 (71%)
5 (24%)
0 (0%)
0 (0%)
0 (0%)
1 (5%)
1 (5%)
200-299 (n=25)
16 (62%)
4 (15%)
0 (0%)
1 (4%)
1 (4%)
4 (15%)
6 (23%)
300-399 (n=13)
7 (54%)
1 (8%)
1 (8%)
0 (0%)
1 (8%)
3 (23%)
5 (39%)
400-499 (n=6)
1 (17%)
0 (0%)
3 (50%)
0 (0%)
0 (0%)
2 (33%)
5 (83%)
500+ (n=11)
6 (60%)
2 (20%)
1 (10%)
0 (0%)
0 (9%)
1 (10%)
2 (20%)
TO TA L 78 (63%)
16 (13%)
7 (6%)
1 (<1% )
4 (3%)
17 (14%)
29 (24%)
Te ac hing Status (C O TH) c
Non-teaching (n=90)
62 (69%)
9 (10%)
3 (3%)
0 (0%)
3 (3%)
13 (14%)
19 (21%)
Teaching (n=33)
16 (49%)
7 (21%)
4 (12%)
1 (3%)
1 (3%)
4 (12%)
10 (30%)
TO TA L 78 (63%)
16 (13%)
7 (6%)
1 (<1% )
4 (3%)
17 (14%)
29 (24%)
Tr auma C e nte r Status d
Non-trauma center (n=72)
44 (62%)
9 (13%)
2 (3%)
0 (0%)
4 (6%)
12 (17%)
18 (25%)
Level I TC (n=9)
4 (44%)
0 (0%)
4 (44%)
0 (0%)
0 (0%)
1 (11%)
5 (56%)
Level II TC (n=15)
11 (68%)
4 (25%)
0 (0%)
0 (0%)
0 (0%)
1 (6%)
1 (6%)
Level III or IV TC (n=27)
19 (70%)
3 (11%)
1 (4%)
1 (4%)
0 (0%)
3 (11%)
5 (19%)
TO TA L 78 (63%)
16 (13%)
7 (6%)
1 (<1% )
4 (3%)
17 (14%)
29 (24%)
G er iat r ic A c ute C are M ode l e
Absent (n=110)
72 (67%)
11 (10%)
6 (5%)
1 (1%)
4 (4%)
15 (14%)
26 (23%)
Present (n=13)
4 (33%)
5 (42%)
1 (8%)
0 (0%)
0 (0%)
2 (17%)
3 (25%)
TO TA L 78 (63%)
16 (13%)
7 (6%)
1 (<1% )
4 (3%)
17 (14%)
29 (24%)
ACOVE: Assessing Care of Vulnerable Elders; a Pearson Chi-Square: 3.94 (df 3, 122), p= .268; b Pearson Chi-Square: 17.83 (df 5,122), p=.003; c Pearson Chi-Square =1.13 (df 1, 122), p= .203; d Pearson Chi-Square: 8.28 (df 3, 122), p=.041; e Pearson Chi-Square = 0.02 (df 1, 122), p= .572
81
A C O V E I ndica to r 8: Surgical pat ie nts assesse d at discha rge fo r cognitive and
func tional status with compa rison to preope ra tive le ve ls .
Table 4.11 summarizes the implementation of this indicator by hospital
characteristic. One hundred and twenty-four of 128 hospital respondents answered this
survey. Partial to complete implementation ranged from 14% (100 to 199 bed size) to
54% (200 to 299 bed size). There were no statistically significant differences between
groups for any hospital characteristic. While not statistically significant, hospitals in the
Northeast region had a higher percentage of implementation (47%) compared to 29% in
the Midwest. Hospitals with geriatric acute care models had a higher percentage of
implementation (50%) compared to 36% in hospitals without a geriatric acute care
model.
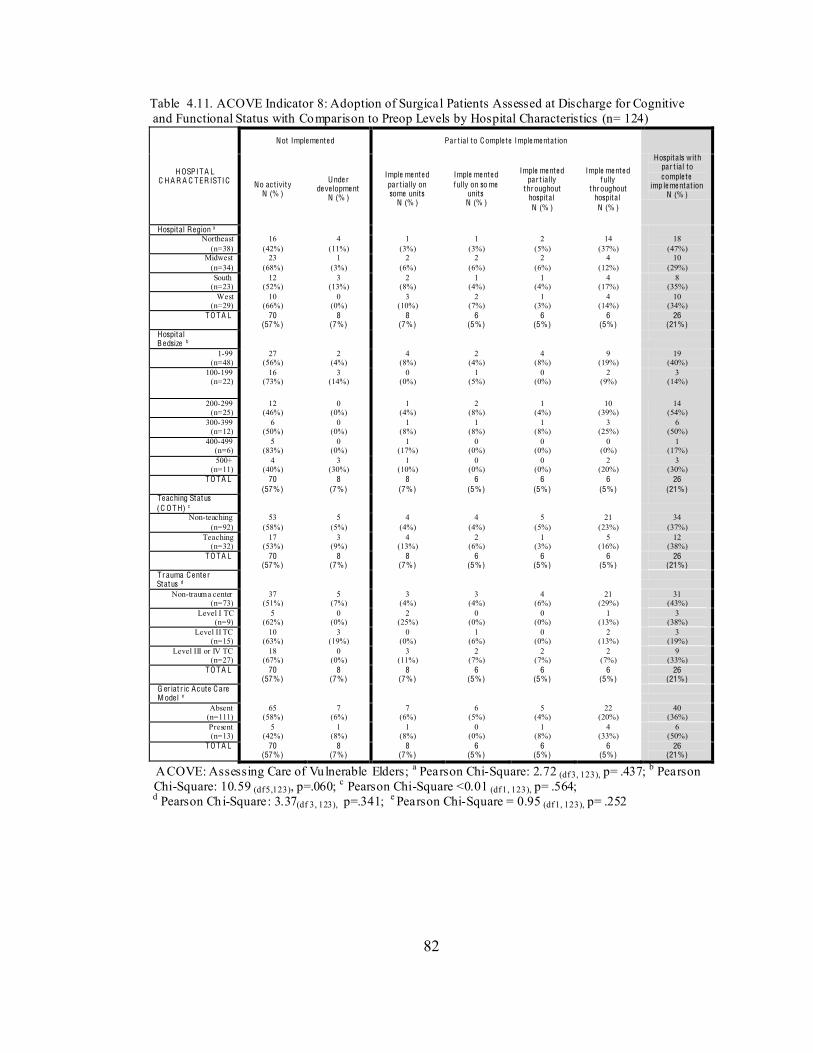
82
Table 4.11. ACOVE Indicator 8: Adoption of Surgical Patients Assessed at Discharge for Cognitive and Functional Status with Comparison to Preop Levels by Hospital Characteristics (n= 124)
H OSPITA L C H A R A C TER ISTIC
Not Imple me nte d Par t ial to Comple te Imple me ntat ion
Hospitals with par t ial to comple te
imp le me ntat ion N (% )
No ac t ivity N (% )
Unde r de ve lopme nt
N (% )
Imple me nte d par t ially on some units
N (% )
Imple me nte d fully on so me
units N (% )
Imple me nte d par t ially
throughout hospital N (% )
Imple me nte d fully
throughout hospital N (% )
Hospital Region a Northeast
(n=38) 16
(42%) 4
(11%) 1
(3%) 1
(3%) 2
(5%) 14
(37%) 18
(47%) Midwest
(n=34) 23
(68%) 1
(3%) 2
(6%) 2
(6%) 2
(6%) 4
(12%) 10
(29%) South
(n=23) 12
(52%) 3
(13%) 2
(8%) 1
(4%) 1
(4%) 4
(17%) 8
(35%) West
(n=29) 10
(66%) 0
(0%) 3
(10%) 2
(7%) 1
(3%) 4
(14%) 10
(34%) TO TA L 70
(57%) 8
(7%) 8
(7%) 6
(5%) 6
(5%) 6
(5%) 26
(21%) Hospital B e dsize b
1-99 (n=48)
27 (56%)
2 (4%)
4 (8%)
2 (4%)
4 (8%)
9 (19%)
19 (40%)
100-199 (n=22)
16 (73%)
3 (14%)
0 (0%)
1 (5%)
0 (0%)
2 (9%)
3 (14%)
200-299 (n=25)
12 (46%)
0 (0%)
1 (4%)
2 (8%)
1 (4%)
10 (39%)
14 (54%)
300-399 (n=12)
6 (50%)
0 (0%)
1 (8%)
1 (8%)
1 (8%)
3 (25%)
6 (50%)
400-499 (n=6)
5 (83%)
0 (0%)
1 (17%)
0 (0%)
0 (0%)
0 (0%)
1 (17%)
500+ (n=11)
4 (40%)
3 (30%)
1 (10%)
0 (0%)
0 (0%)
2 (20%)
3 (30%)
TO TA L 70 (57%)
8 (7%)
8 (7%)
6 (5%)
6 (5%)
6 (5%)
26 (21%)
Te ac hing Status (C O TH) c
Non-teaching (n=92)
53 (58%)
5 (5%)
4 (4%)
4 (4%)
5 (5%)
21 (23%)
34 (37%)
Teaching (n=32)
17 (53%)
3 (9%)
4 (13%)
2 (6%)
1 (3%)
5 (16%)
12 (38%)
TO TA L 70 (57%)
8 (7%)
8 (7%)
6 (5%)
6 (5%)
6 (5%)
26 (21%)
Tr auma C e nte r Status d
Non-trauma center (n=73)
37 (51%)
5 (7%)
3 (4%)
3 (4%)
4 (6%)
21 (29%)
31 (43%)
Level I TC (n=9)
5 (62%)
0 (0%)
2 (25%)
0 (0%)
0 (0%)
1 (13%)
3 (38%)
Level II TC (n=15)
10 (63%)
3 (19%)
0 (0%)
1 (6%)
0 (0%)
2 (13%)
3 (19%)
Level III or IV TC (n=27)
18 (67%)
0 (0%)
3 (11%)
2 (7%)
2 (7%)
2 (7%)
9 (33%)
TO TA L 70 (57%)
8 (7%)
8 (7%)
6 (5%)
6 (5%)
6 (5%)
26 (21%)
G er iat r ic A c ute C are M ode l e
Absent (n=111)
65 (58%)
7 (6%)
7 (6%)
6 (5%)
5 (4%)
22 (20%)
40 (36%)
Present (n=13)
5 (42%)
1 (8%)
1 (8%)
0 (0%)
1 (8%)
4 (33%)
6 (50%)
TO TA L 70 (57%)
8 (7%)
8 (7%)
6 (5%)
6 (5%)
6 (5%)
26 (21%)
ACOVE: Assessing Care of Vulnerable Elders; a Pearson Chi-Square: 2.72 (df 3, 123), p= .437; b Pearson Chi-Square: 10.59 (df 5,123), p=.060; c Pearson Chi-Square <0.01 (df 1, 123), p= .564; d Pearson Chi-Square: 3.37(df 3, 123), p=.341; e Pearson Chi-Square = 0.95 (df 1, 123), p= .252
83
A C O V E I ndica to r 9: D ischa rge assessme nt fo r le ve l of inde pe nde nce and ne e d fo r
home he alth.
Table 4.12 provides a summary of the implementation of this indicator by hospital
characteristic. One hundred and twenty-seven of 128 hospital respondents answered this
survey question. This indicator had the highest degree of implementation among all of the
ACOVE indicators in this study. Partial to complete implementation ranged from 75%
(level II trauma centers) to 100% (level 1 trauma centers). There were no statistically
significant differences between groups for any hospital characteristic.

84
Table 4.12. ACOVE Indicator 9: Adoption of Discharge Assessment for Level of Independence and Need for Home Health by Hospital Characteristic (n= 127)
H OSPITA L C H A R A C TER ISTIC
Not Imple me nte d Par t ial to Comple te Imple me ntat ion
Hospitals with par t ial to comple te
imp le me ntat ion
N (% )
No ac t ivity N (% )
Unde r de ve lopme nt
N (% )
Imple me nte d par t ially on some units
N (% )
Imple me nte d fully on so me
units N (% )
Imple me nte d par t ially
throughout hospital N (% )
Imple me nte d fully
throughout hospital N (% )
Hospital Region a Northeast
(n=38) 1
(3%) 0
(0%) 1
(3%) 3
(8%) 2
(5%) 31
(82%) 37
(97%) Midwest
(n=35) 4
(11%) 1
(3%) 1
(3%) 3
(9%) 2
(6%) 24
(69%) 30
(86%) South
(n=23) 2
(8%) 1
(4%) 1
(4%) 1
(4%) 1
(4%) 17
(74%) 20
(86%) West
(n=31) 2
(7%) 0
(0%) 1
(3%) 4
(13%) 5
(16%) 19
(61%) 29
(94%) TO TA L 9
(7%) 2
(2%) 4
(3%) 11
(9%) 10
(8%) 91
(72%) 116
(91%) Hospital B e dsize b
1-99 (n=50)
2 (4%)
0 (0%)
1 (2%)
5 (10%)
2 (4%)
39 (80%)
48 (96%)
100-199 (n=22)
2 (9%)
1 (5%)
2 (9%)
1 (5%)
2 (9%)
14 (64%)
19 (86%)
200-299 (n=25)
4 (15%)
0 (0%)
0 (0%)
3 (12%)
1 (4%)
18 (69%)
22 (85%)
300-399 (n=13)
0 (0%)
0 (0%)
0 (0%)
1 (8%)
3 (23%)
9 (69%)
13 (100%)
400-499 (n=6)
1 (17%)
0 (0%)
1 (17%)
0 (0%)
1 (17%)
3 (50%)
5 (83%)
500+ (n=11)
0 (0%)
1 (10%)
0 (0%)
1 (10%)
1 (10%)
7 (70%)
9 (90%)
TO TA L 9 (7%)
2 (2%)
4 (3%)
11 (9%)
10 (8%)
91 (72%)
116 (91%)
Te ac hing Status (C O TH) c
Non-teaching (n=94)
5 (5%)
2 (2%)
4 (4%)
7 (7%)
5 (5%)
71 (76%)
87 (93%)
Teaching (n=33)
4 (12%)
0 (0%)
0 (0%)
4 (12%)
5 (15%)
20 (61%)
29 (88%)
TO TA L 9 (7%)
2 (2%)
4 (3%)
11 (9%)
10 (8%)
91 (72%)
116 (91%)
Tr auma C e nte r Status d
Non-trauma center (n=74)
5 (7%)
1 (1%)
3 (4%)
4 (6%)
5 (7%)
55 (75%)
67 (92%)
Level I TC (n=9)
0 (0%)
0 (0%)
0 (0%)
1 (11%)
3 (33%)
5 (56%)
9 (100%)
Level II TC (n=15)
3 (19%)
1 (6%)
0 (0%)
2 (13%)
0 (0%)
10 (63%)
12 (75%)
Level III or IV TC (n=29)
1 (3%)
0 (0%)
1` (3%)
4 (14%)
2 (7%)
21 (72%)
28 (97%)
TO TA L 9 (7%)
2 (2%)
4 (3%)
11 (9%)
10 (8%)
91 (72%)
116 (91%)
G er iat r ic A c ute C are M ode l e
Absent (n=114)
7 (6%)
2 (2%)
4 (4%)
11 (10%)
9 (8%)
82 (71%)
106 (93%)
Present (n=13)
2 (17%)
0 (0%)
0 (0%)
0 (0%)
1 (8%)
9 (75%)
10 (83%)
TO TA L 9 (7%)
2 (2%)
4 (3%)
11 (9%)
10 (8%)
91 (72%)
116 (91%)
ACOVE: Assessing Care of Vulnerab le Elders; a Pearson Chi-Square: 3.90 (df 3, 126), p= .271; b Pearson Chi-Square: 5.29 (df 5,126), p=.382; c Pearson Chi-Square = 0.68 (d f 1, 126), p= .309; d Pearson Chi-Square: 7.27 (df 3, 126), p=.064; e Pearson Chi-Square =1.07 (d f 1, 126), p= .278
85
Summa ry of Results for Aim O ne
The preceding paragraphs and tables presented the extent of adoption of targeted
ACOVE indicators for hospitalized injured older adults in acute care settings fro m an
overall perspective and from a detailed presentation of individual indicators by hospital
characteristics. Table 4.13 presents a summary of each indicator and its partial to
complete adoption among all hospitals. Overall, partial to complete implementation of
the ACOVE indicators ranged from 24% (surgical patients screened for delirium for 3
days postop) to 91% (discharge assessment for level of independence and need for home
health). Although indicator adoption varied by individual indicators and among hospital
characteristics, several trends emerged. First, indicators related to functional ability had
higher degrees of implementation than those related to cognition. Partial to complete
implementation of indicators related to functional ability ranged from 64% to 91% and
those related to cognition ranged from 26% to 62%. Second, the Northeast region had
overall higher degrees of indicator implementation compared to the South and Midwest
regions, and the highest percentages for six of nine indicators; one indicator difference
(assessment of functional status) was statistically significant. Third, level I trauma centers
had higher percentages of indicator implementation than all other level trauma centers
and non-trauma centers for seven of nine indicators; and one indicator differences were
statistically significant. Level II trauma centers had the lowest percentages of indicator
implementation for all nine indicators. Statistically significant difference trends were not
noted for hospital bed size, teaching status or presence of geriatric acute care models.
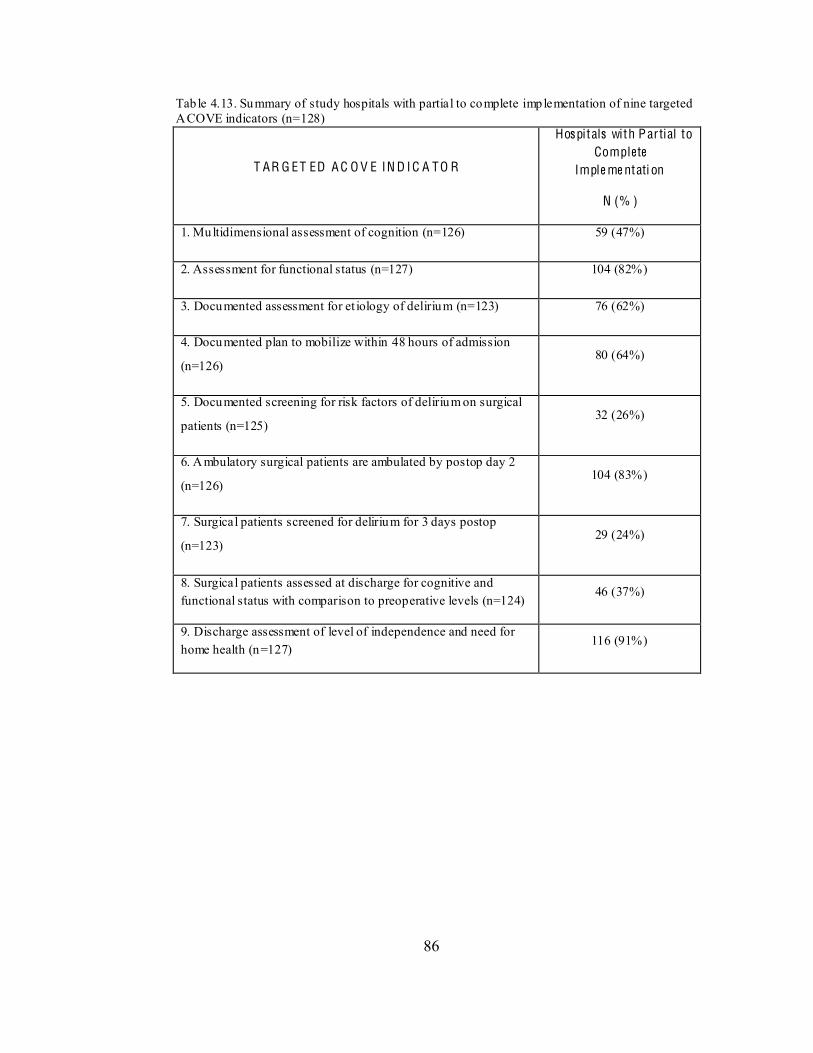
86
Tab le 4.13. Summary of study hospitals with partial to complete implementation of nine targeted ACOVE indicators (n=128)
T AR G ET ED A C O V E IN D I C A TO R
Hospitals with P ar tial to Complete
Imple me ntati on
N (% )
1. Multidimensional assessment of cognition (n=126) 59 (47%)
2. Assessment for functional status (n=127) 104 (82%)
3. Documented assessment for et iology of delirium (n=123) 76 (62%)
4. Documented plan to mobilize within 48 hours of admission
(n=126) 80 (64%)
5. Documented screening for risk factors of delirium on surgical
patients (n=125) 32 (26%)
6. Ambulatory surgical patients are ambulated by postop day 2
(n=126) 104 (83%)
7. Surgical patients screened for delirium for 3 days postop
(n=123) 29 (24%)
8. Surgical patients assessed at discharge for cognitive and functional status with comparison to preoperative levels (n=124)
46 (37%)
9. Discharge assessment of level of independence and need for home health (n=127)
116 (91%)
87
Aim T wo
Aim Two: To determine associations among administratively-mediated variables
(AMVs), patient characteristics, and the extent of adoption of ACOVE indicators for
HIOAs. The variables used to meet this aim were obtained from the four data sources
described in Chapter 3 (see pg. 31). A sequential approach was employed to conduct data
analyses. First, descriptive statistics (frequencies, percentages, and measures of central
tendency and variability) were conducted for AMVs, patient characteristics, and the
composite ACOVE Indicator Index. Second, univariate associations between hospital-
level patient characteristics and AMVs were examined to assess patient level associations
with AMVs. Third, univariate associations of independent variables (AMVs, patient
characteristics) with the dependent variable (ACOVE Indicator Index) were examined to
determine associations with ACOVE Indicator adoption.
Descriptive Statistics- Administra tive ly-M e diate d Va riables
Tables 4.14 through 4.16 provide descriptive summaries of AMVs (capital inputs,
organizational facets, and labor inputs). Each is described below by: 1) report of missing
items, 2) items with low variability, 3) items with less than 10 cases, 4) and variables
subsequently dropped based on the exclusion criteria described in Chapter 3 (see pg. 41).
Capi tal Inputs. Table 4.14 summarizes this sub-category. Missing data for
individual variables ranged from missing in one hospital (< 1%) to missing in 23
hospitals (18%) (electronic health record). Six variables (43%) had no missing data. One
variable (electronic health record) had > 15% missing cases (23 hospitals non-reporting),
and one variable was present in over 90% of hospitals (computer support for retrieval of
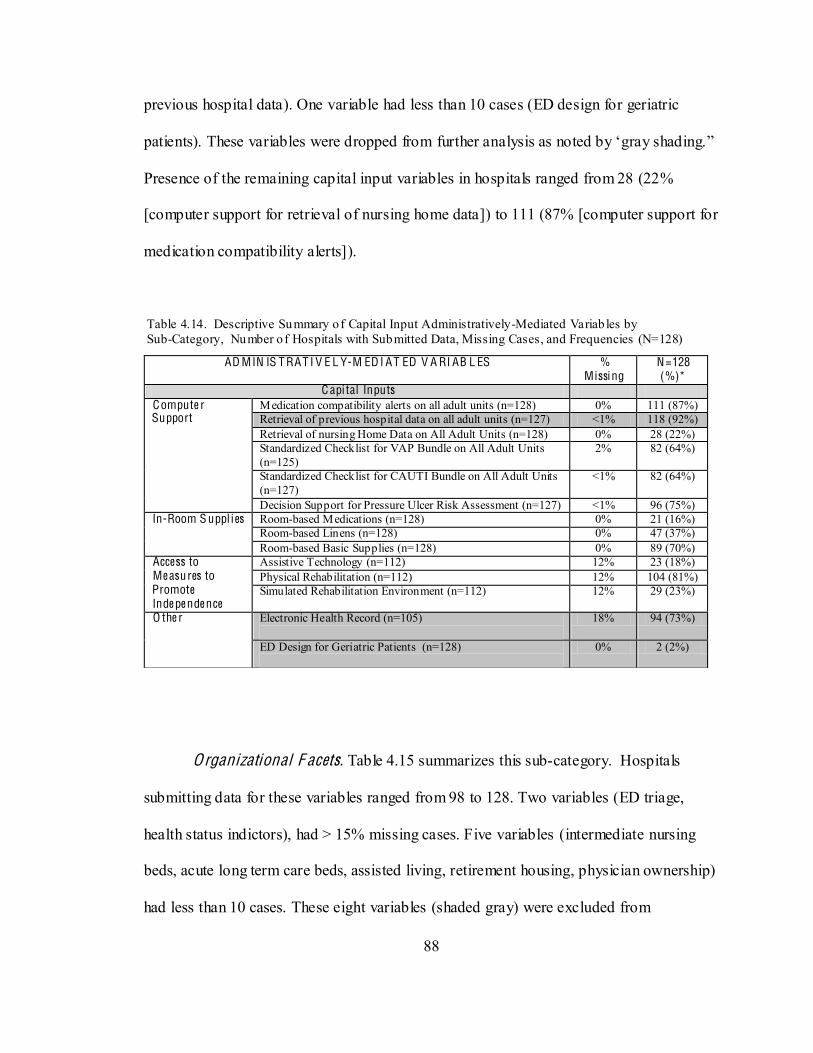
88
previous hospital data). One variable had less than 10 cases (ED design for geriatric
Presence of the remaining capital input variables in hospitals ranged from 28 (22%
[computer support for retrieval of nursing home data]) to 111 (87% [computer support for
medication compatibility alerts]).
Table 4.14. Descriptive Summary of Capital Input Administratively-Mediated Variab les by Sub-Category, Number o f Hospitals with Submitted Data, Missing Cases, and Frequencies (N=128)
Organizational F acets. Table 4.15 summarizes this sub-category. Hospitals
submitting data for these variables ranged from 98 to 128. Two variables (ED triage,
health status indictors), had > 15% missing cases. Five variables (intermediate nursing
beds, acute long term care beds, assisted living, retirement housing, physician ownership)
had less than 10 cases. These eight variables (shaded gray) were excluded from
AD MIN IS T RAT I V E L Y-M ED I AT ED V A RI AB L ES % Missi ng
N=128 (%)*
C api tal Inputs Compute r Support
Medication compatibility alerts on all adult units (n=128) 0% 111 (87%) Retrieval of previous hospital data on all adult units (n=127) <1% 118 (92%) Retrieval of nursing Home Data on All Adult Units (n=128) 0% 28 (22%) Standardized Checklist for VAP Bundle on All Adult Units (n=125)
2% 82 (64%)
Standardized Checklist for CAUTI Bundle on All Adult Units (n=127)
<1% 82 (64%)
Decision Support for Pressure Ulcer Risk Assessment (n=127) <1% 96 (75%) In-Room S uppl ies Room-based Medications (n=128) 0% 21 (16%)
Room-based Linens (n=128) 0% 47 (37%) Room-based Basic Supplies (n=128) 0% 89 (70%)
Access to Me asures to Promote Inde pe nde nce
Assistive Technology (n=112) 12% 23 (18%) Physical Rehabilitation (n=112) 12% 104 (81%) Simulated Rehabilitation Environment (n=112) 12% 29 (23%)
O the r Electronic Health Record (n=105)
18% 94 (73%)
ED Design for Geriatric Patients (n=128)
0% 2 (2%)
89
subsequent analyses. Presence of the remaining organizational facets ranged from 8%
(adult day care) to 77% (orthopedic services). Two organizational facets not shown in
Table 4.15 (ICU visitation hours per week, ACOVE Indicator Index) were continuous
variables. ICU visitation hours (median: 154, IQR: 44-168) had > 15% missing cases,
thus was excluded. The ACOVE indicator Index (median: 22, IQR: 13-29), a composite
measure of nine ACOVE indicators, had a theoretical range of 0-45.
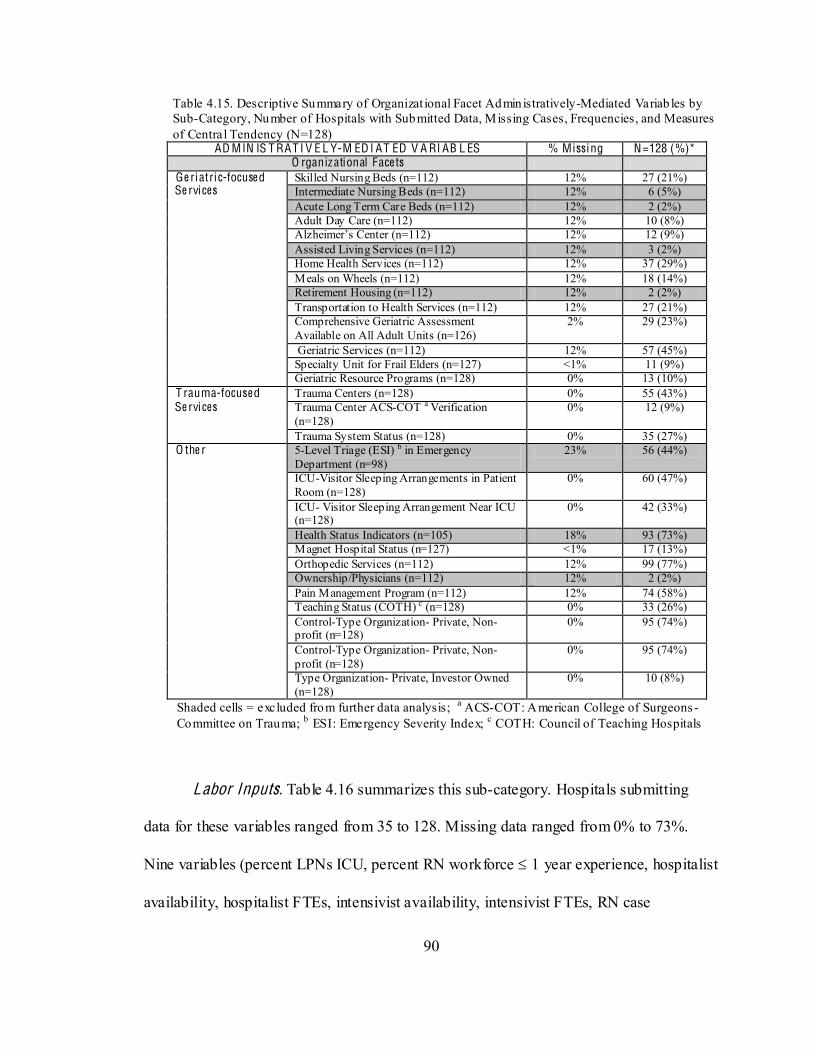
90
Table 4.15. Descriptive Summary of Organizat ional Facet Admin istratively-Mediated Variab les by Sub-Category, Number of Hospitals with Submitted Data, Missing Cases, Frequencies, and Measures of Central Tendency (N=128)
AD MIN IS T RAT I V E L Y-M ED I AT ED V A RI AB L ES % Missi ng N=128 (%)* O rganizational Face ts
Ge ri atric-focuse d Se rvices
Skilled Nursing Beds (n=112) 12% 27 (21%) Intermediate Nursing Beds (n=112) 12% 6 (5%) Acute Long Term Care Beds (n=112) 12% 2 (2%) Adult Day Care (n=112) 12% 10 (8%)
(n=112) 12% 12 (9%) Assisted Living Services (n=112) 12% 3 (2%) Home Health Services (n=112) 12% 37 (29%) Meals on Wheels (n=112) 12% 18 (14%) Retirement Housing (n=112) 12% 2 (2%) Transportation to Health Services (n=112) 12% 27 (21%) Comprehensive Geriatric Assessment Available on All Adult Units (n=126)
2% 29 (23%)
Geriatric Services (n=112) 12% 57 (45%) Specialty Unit for Frail Elders (n=127) <1% 11 (9%) Geriatric Resource Programs (n=128) 0% 13 (10%)
T rauma-focuse d Se rvices
Trauma Centers (n=128) 0% 55 (43%) Trauma Center ACS-COT a Verification (n=128)
0% 12 (9%)
Trauma System Status (n=128) 0% 35 (27%) O the r 5-Level Triage (ESI) b in Emergency
Department (n=98) 23% 56 (44%)
ICU-Visitor Sleeping Arrangements in Patient Room (n=128)
0% 60 (47%)
ICU- Visitor Sleeping Arrangement Near ICU (n=128)
0% 42 (33%)
Health Status Indicators (n=105) 18% 93 (73%) Magnet Hospital Status (n=127) <1% 17 (13%) Orthopedic Services (n=112) 12% 99 (77%) Ownership/Physicians (n=112) 12% 2 (2%) Pain Management Program (n=112) 12% 74 (58%) Teaching Status (COTH) c (n=128) 0% 33 (26%) Control-Type Organization- Private, Non-profit (n=128)
0% 95 (74%)
Control-Type Organization- Private, Non-profit (n=128)
0% 95 (74%)
Type Organization- Private, Investor Owned (n=128)
0% 10 (8%)
Shaded cells = excluded from further data analysis; a ACS-COT: American College of Surgeons- Committee on Trauma; b ESI: Emergency Severity Index; c COTH: Council of Teaching Hospitals
Labor Inputs. Table 4.16 summarizes this sub-category. Hospitals submitting
data for these variables ranged from 35 to 128. Missing data ranged from 0% to 73%.
Nine variables (percent LPNs ICU, percent RN workforce 1 year experience, hospitalist
availability, hospitalist FTEs, intensivist availability, intensivist FTEs, RN case
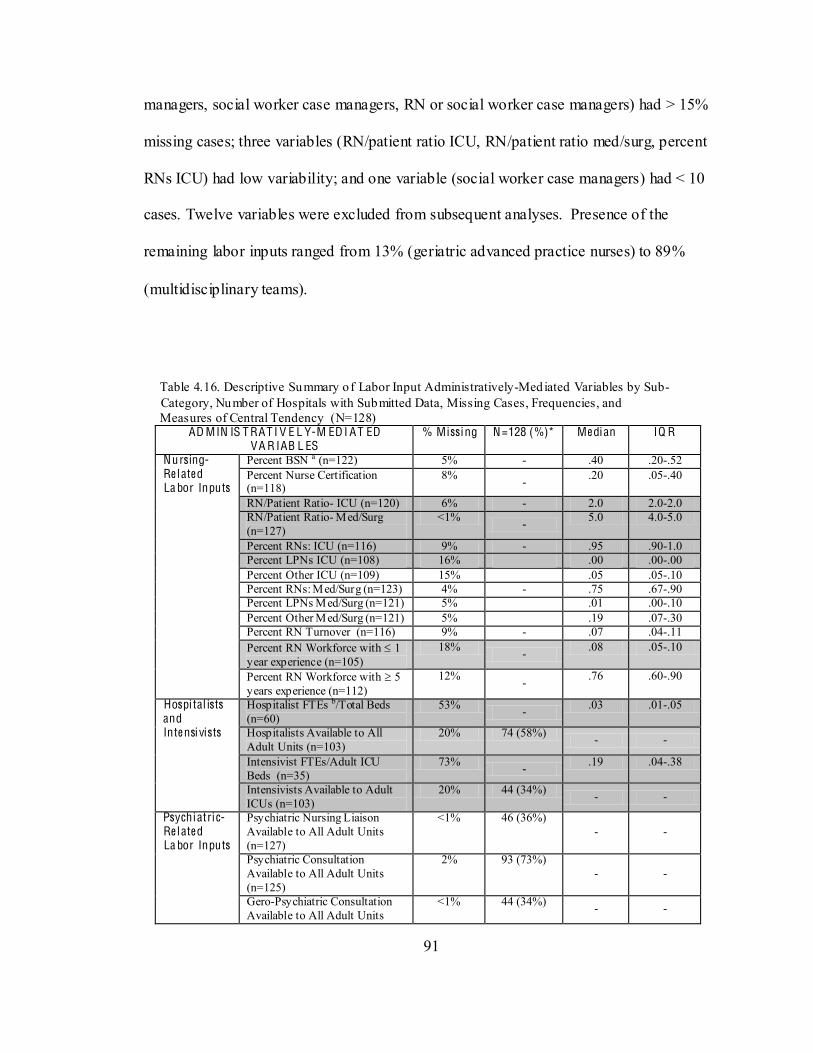
91
managers, social worker case managers, RN or social worker case managers) had > 15%
missing cases; three variables (RN/patient ratio ICU, RN/patient ratio med/surg, percent
RNs ICU) had low variability; and one variable (social worker case managers) had < 10
cases. Twelve variables were excluded from subsequent analyses. Presence of the
remaining labor inputs ranged from 13% (geriatric advanced practice nurses) to 89%
(multidisciplinary teams).
Table 4.16. Descriptive Summary of Labor Input Administratively-Mediated Variables by Sub- Category, Number of Hospitals with Submitted Data, Missing Cases, Frequencies, and Measures of Central Tendency (N=128)
AD MIN IS T RAT I V E L Y-M ED I AT ED VA R IAB L ES
% Missi ng N=128 (%)* Me dian IQ R
Nursing- Re l ate d La bor Inputs
Percent BSN a (n=122) 5% - .40 .20-.52 Percent Nurse Certification (n=118)
8% - .20 .05-.40
RN/Patient Ratio- ICU (n=120) 6% - 2.0 2.0-2.0 RN/Patient Ratio- Med/Surg (n=127)
<1% - 5.0 4.0-5.0
Percent RNs: ICU (n=116) 9% - .95 .90-1.0 Percent LPNs ICU (n=108) 16% .00 .00-.00 Percent Other ICU (n=109) 15% .05 .05-.10 Percent RNs: Med/Surg (n=123) 4% - .75 .67-.90 Percent LPNs Med/Surg (n=121) 5% .01 .00-.10 Percent Other Med/Surg (n=121) 5% .19 .07-.30 Percent RN Turnover (n=116) 9% - .07 .04-.11 Percent RN Workforce with 1 year experience (n=105)
18% - .08 .05-.10
Percent RN Workforce with 5 years experience (n=112)
12% - .76 .60-.90
Hospi tal ists and Inte nsi vists
Hospitalist FTEs b/Total Beds (n=60)
53% - .03 .01-.05
Hospitalists Available to All Adult Units (n=103)
20% 74 (58%) - -
Intensivist FTEs/Adult ICU Beds (n=35)
73% - .19 .04-.38
Intensivists Available to Adult ICUs (n=103)
20% 44 (34%) - -
Psychiatric- Re l ate d La bor Inputs
Psychiatric Nursing Liaison Available to All Adult Units (n=127)
<1% 46 (36%) - -
Psychiatric Consultation Available to All Adult Units (n=125)
2% 93 (73%) - -
Gero-Psychiatric Consultation Available to All Adult Units
<1% 44 (34%) - -
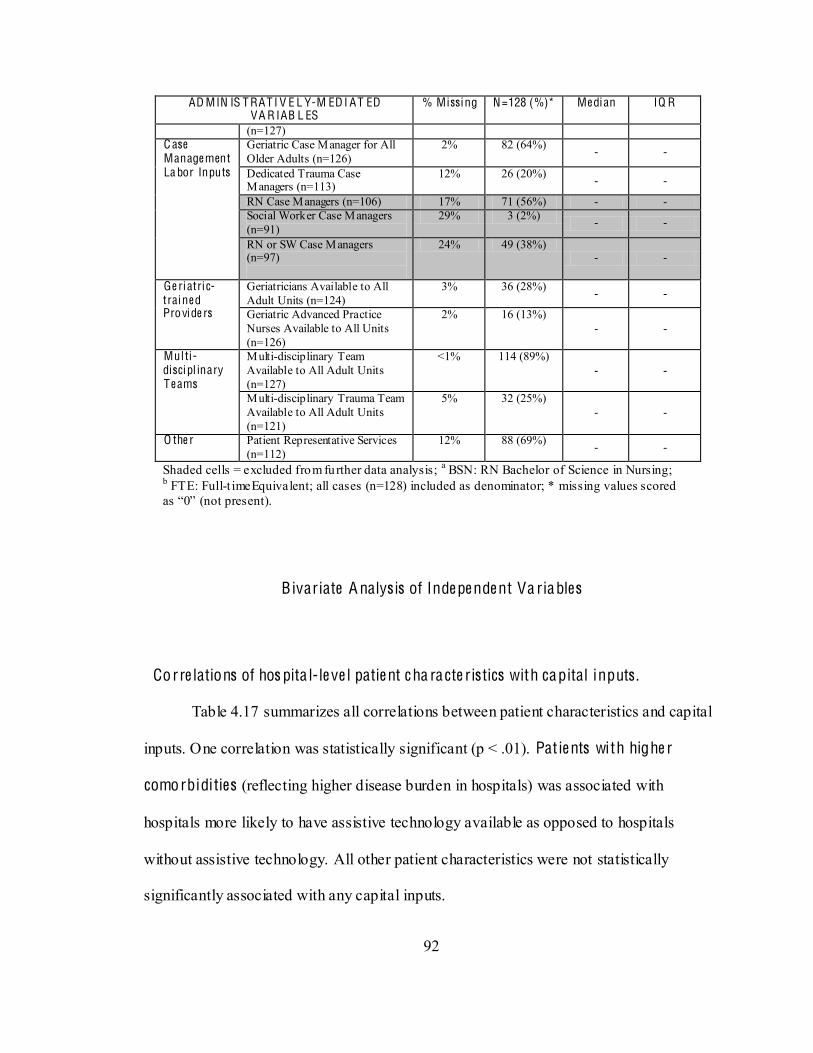
92
AD MIN IS T RAT I V E L Y-M ED I AT ED VA R IAB L ES
% Missi ng N=128 (%)* Me dian IQ R
(n=127) C ase Manage ment La bor Inputs
Geriatric Case Manager for All Older Adults (n=126)
2% 82 (64%) - -
Dedicated Trauma Case Managers (n=113)
12% 26 (20%) - -
RN Case Managers (n=106) 17% 71 (56%) - - Social Worker Case Managers (n=91)
29% 3 (2%) - -
RN or SW Case Managers (n=97)
24% 49 (38%) - -
Ge ri atric- traine d Provide rs
Geriatricians Available to All Adult Units (n=124)
3% 36 (28%) - -
Geriatric Advanced Practice Nurses Available to All Units (n=126)
2% 16 (13%) - -
Mul ti-disci pl inary T e ams
Multi-disciplinary Team Available to All Adult Units (n=127)
<1% 114 (89%) - -
Multi-disciplinary Trauma Team Available to All Adult Units (n=121)
5% 32 (25%) - -
O the r Patient Representative Services (n=112)
12% 88 (69%) - -
Shaded cells = excluded from further data analysis; a BSN: RN Bachelor of Science in Nursing; b FTE: Full-t imeEquivalent; all cases (n=128) included as denominator; * missing values scored (not present).
B ivariate A nalys is of Inde pe nde nt Va riables
Corre lations of hos pita l-le ve l patie nt c ha ra cte ristics with capital inputs .
Table 4.17 summarizes all correlations between patient characteristics and capital
inputs. One correlation was statistically significant (p < .01). Pat ie nts with highe r
comorbidities (reflecting higher disease burden in hospitals) was associated with
hospitals more likely to have assistive technology available as opposed to hospitals
without assistive technology. All other patient characteristics were not statistically
significantly associated with any capital inputs.
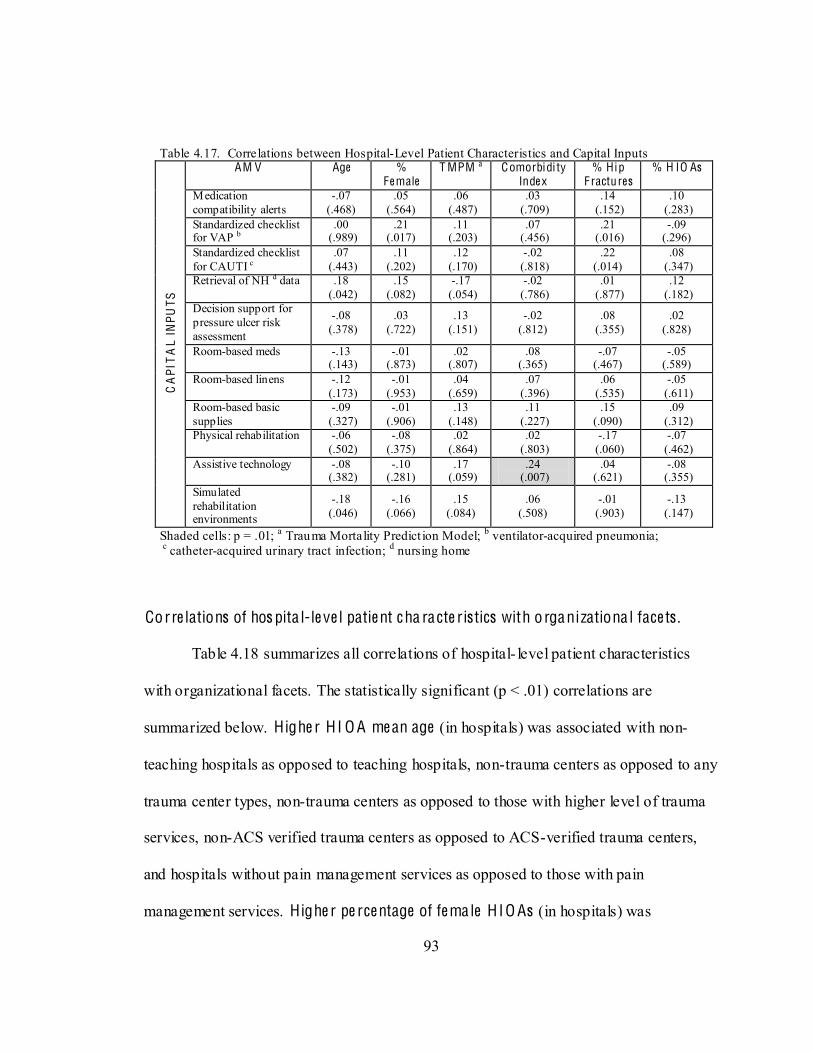
93
Table 4.17. Correlations between Hospital-Level Patient Characteristics and Capital Inputs C
API
TA
L IN
PUTS
AM V Age %
Fe male T MPM a Comorbidi ty
Inde x % Hip
F ractu res % H IO As
Medication compatibility alerts
-.07 (.468)
.05 (.564)
.06 (.487)
.03 (.709)
.14 (.152)
.10 (.283)
Standardized checklist for VAP b
.00 (.989)
.21 (.017)
.11 (.203)
.07 (.456)
.21 (.016)
-.09 (.296)
Standardized checklist for CAUTI c
.07 (.443)
.11 (.202)
.12 (.170)
-.02 (.818)
.22 (.014)
.08 (.347)
Retrieval of NH d data .18 (.042)
.15 (.082)
-.17 (.054)
-.02 (.786)
.01 (.877)
.12 (.182)
Decision support for pressure ulcer risk assessment
-.08 (.378)
.03 (.722)
.13 (.151)
-.02 (.812)
.08 (.355)
.02 (.828)
Room-based meds -.13 (.143)
-.01 (.873)
.02 (.807)
.08 (.365)
-.07 (.467)
-.05 (.589)
Room-based linens -.12 (.173)
-.01 (.953)
.04 (.659)
.07 (.396)
.06 (.535)
-.05 (.611)
Room-based basic supplies
-.09 (.327)
-.01 (.906)
.13 (.148)
.11 (.227)
.15 (.090)
.09 (.312)
Physical rehabilitation -.06 (.502)
-.08 (.375)
.02 (.864)
.02 (.803)
-.17 (.060)
-.07 (.462)
Assistive technology
-.08 (.382)
-.10 (.281)
.17 (.059)
.24 (.007)
.04 (.621)
-.08 (.355)
Simulated rehabilitation environments
-.18 (.046)
-.16 (.066)
.15 (.084)
.06 (.508)
-.01 (.903)
-.13 (.147)
Shaded cells: p = .01; a Trauma Mortality Predict ion Model; b ventilator-acquired pneumonia; c catheter-acquired urinary tract infection; d nursing home
Corre lations of hos pita l-le ve l patie nt c ha ra cte ristics with o rganizationa l face ts .
Table 4.18 summarizes all correlations of hospital- level patient characteristics
with organizational facets. The statistically significant (p < .01) correlations are
summarized below. Highe r H I O A me an age (in hospitals) was associated with non-
teaching hospitals as opposed to teaching hospitals, non-trauma centers as opposed to any
trauma center types, non-trauma centers as opposed to those with higher level of trauma
services, non-ACS verified trauma centers as opposed to ACS-verified trauma centers,
and hospitals without pain management services as opposed to those with pain
management services. Highe r pe rce ntage of fe male H IO As (in hospitals) was
94
associated with private, investor-owned hospitals as opposed to government, not- for-
profit hospitals, non-teaching hospitals as opposed to teaching hospitals, non-trauma
centers as opposed to any trauma center type, non-trauma centers as opposed to those
with higher level of trauma services, non-ACS-verified trauma centers as opposed to
ACS-verified TCs, and non-Magnet hospitals as opposed to Magnet hospitals. Highe r
H IO A injury se ve rity (in hospitals) (median TMPM scores) was associated with
teaching hospitals as opposed to non-teaching hospitals, higher level trauma centers as
opposed to non-trauma centers, ACS-verified trauma centers as opposed to non-ACS-
verified trauma centers, hospitals with geriatric resource programs and acute care models
as opposed to those without, hospitals with a specialty unit for frail elders as opposed to
those without, Magnet hospitals as opposed to non-Magnet hospitals, and hospitals with
an Alzheimer Center as opposed to those without. Highe r H IO A pe rce ntage of hip
fra ctures (in hospitals) was associated with private, for-profit hospitals as opposed to
government, not- for-profit hospitals, non-teaching hospitals as opposed to teaching
hospitals, non-trauma centers as opposed to all trauma centers, and non-trauma centers as
opposed to higher level trauma centers. Highe r pe rce ntage of H I O As among tota l
disc ha rges (in hospitals) was associated with non-teaching hospitals as opposed to
teaching hospitals. Highe r H IO A comorbidit ies (in hospitals) was not associated with
any organizational facets.
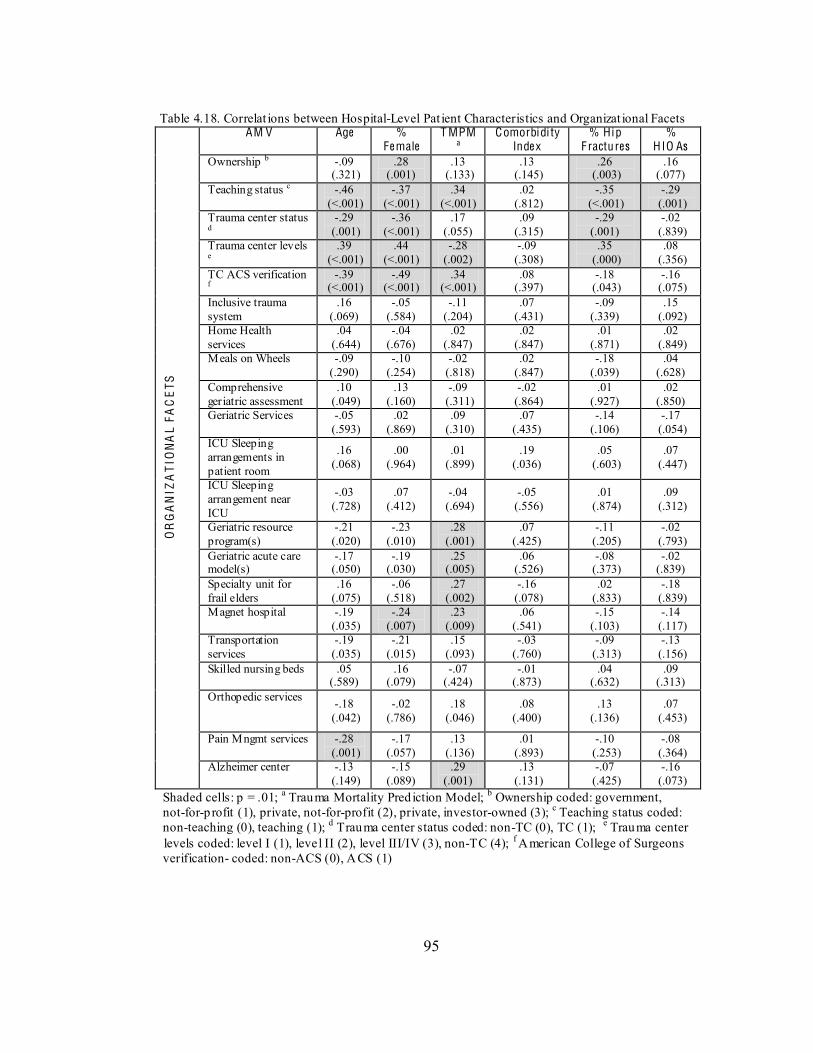
95
Table 4.18. Correlat ions between Hospital-Level Pat ient Characteristics and Organizat ional Facets
OR
GA
NIZ
AT
ION
AL
FAC
ETS
AM V Age % Fe male
T MPM a
Comorbidi ty Inde x
% Hip F ractu res
% HIO As
Ownership b -.09 (.321)
.28 (.001)
.13 (.133)
.13 (.145)
.26 (.003)
.16 (.077)
Teaching status c -.46 (<.001)
-.37 (<.001)
.34 (<.001)
.02 (.812)
-.35 (<.001)
-.29 (.001)
Trauma center status d
-.29 (.001)
-.36 (<.001)
.17 (.055)
.09 (.315)
-.29 (.001)
-.02 (.839)
Trauma center levels e
.39 (<.001)
.44 (<.001)
-.28 (.002)
-.09 (.308)
.35 (.000)
.08 (.356)
TC ACS verification f
-.39 (<.001)
-.49 (<.001)
.34 (<.001)
.08 (.397)
-.18 (.043)
-.16 (.075)
Inclusive trauma system
.16 (.069)
-.05 (.584)
-.11 (.204)
.07 (.431)
-.09 (.339)
.15 (.092)
Home Health services
.04 (.644)
-.04 (.676)
.02 (.847)
.02 (.847)
.01 (.871)
.02 (.849)
Meals on Wheels -.09 (.290)
-.10 (.254)
-.02 (.818)
.02 (.847)
-.18 (.039)
.04 (.628)
Comprehensive geriatric assessment
.10 (.049)
.13 (.160)
-.09 (.311)
-.02 (.864)
.01 (.927)
.02 (.850)
Geriatric Services -.05 (.593)
.02 (.869)
.09 (.310)
.07 (.435)
-.14 (.106)
-.17 (.054)
ICU Sleeping arrangements in patient room
.16 (.068)
.00 (.964)
.01 (.899)
.19 (.036)
.05 (.603)
.07 (.447)
ICU Sleeping arrangement near ICU
-.03 (.728)
.07 (.412)
-.04 (.694)
-.05 (.556)
.01 (.874)
.09 (.312)
Geriatric resource program(s)
-.21 (.020)
-.23 (.010)
.28 (.001)
.07 (.425)
-.11 (.205)
-.02 (.793)
Geriatric acute care model(s)
-.17 (.050)
-.19 (.030)
.25 (.005)
.06 (.526)
-.08 (.373)
-.02 (.839)
Specialty unit for frail elders
.16 (.075)
-.06 (.518)
.27 (.002)
-.16 (.078)
.02 (.833)
-.18 (.839)
Magnet hospital -.19 (.035)
-.24 (.007)
.23 (.009)
.06 (.541)
-.15 (.103)
-.14 (.117)
Transportation services
-.19 (.035)
-.21 (.015)
.15 (.093)
-.03 (.760)
-.09 (.313)
-.13 (.156)
Skilled nursing beds .05 (.589)
.16 (.079)
-.07 (.424)
-.01 (.873)
.04 (.632)
.09 (.313)
Orthopedic services
-.18 (.042)
-.02 (.786)
.18 (.046)
.08 (.400)
.13 (.136)
.07 (.453)
Pain Mngmt services -.28 (.001)
-.17 (.057)
.13 (.136)
.01 (.893)
-.10 (.253)
-.08 (.364)
Alzheimer center -.13 (.149)
-.15 (.089)
.29 (.001)
.13 (.131)
-.07 (.425)
-.16 (.073)
Shaded cells: p = .01; a Trauma Mortality Pred iction Model; b Ownership coded: government, not-for-profit (1), private, not-for-profit (2), private, investor-owned (3); c Teaching status coded: non-teaching (0), teaching (1); d Trauma center status coded: non-TC (0), TC (1); e Trauma center levels coded: level I (1), level II (2), level III/IV (3), non-TC (4); f American College of Surgeons verification- coded: non-ACS (0), ACS (1)
96
Corre lations of hos pita l-le ve l patie nt c ha ra cte ristics with labor inputs .
Table 4.19 summarizes all correlations of patient characteristics with labor inputs.
Statistically significant (p < .01) correlations are summarized below. Highe r H IO A
me an age (in hospitals) was associated with lower percentages of BSN nurses as opposed
to higher percentages of BSN nurses and no dedicated trauma case managers as opposed
to presence of dedicated trauma case managers. Highe r pe rce ntage of fe male H IO As
(in hospitals) was associated with lower percentages of BSN nurses as opposed to higher
percentages, higher percentages of LPNs on med/surg units as opposed to lower
percentages of LPNs on med/surg units, no dedicated trauma case managers as opposed
to presence of dedicated trauma case managers, and no multidisciplinary trauma team as
opposed to presence of multidisciplinary trauma teams. Highe r H IO A injury se ve rity
(in hospitals) (median TMPM scores) was associated with higher percentages of BSN
nurses as opposed to lower percentages of BSN nurses, lower percentages of LPNs on
med/surg units as opposed to higher percentages of LPNs on med/surg units, availability
of geriatric advanced practice nurses as opposed to no geriatric APN nurses and presence
of multidisciplinary trauma teams as opposed to no multidisciplinary trauma teams.
Highe r pe rce ntage of H IO As with a prima ry hip f racture diagnos is (in hospitals) was
associated with no dedicated trauma case managers as opposed to presence of dedicated
trauma case managers. Finally, highe r pe rce ntage of H IO As among total discha rges
was associated with lower percentages of RN certification as opposed to higher
percentages of RN certification, no geriatricians as opposed to presence of geriatricians,
and no psychiatric consultation as opposed to availability of psychiatric consultation.
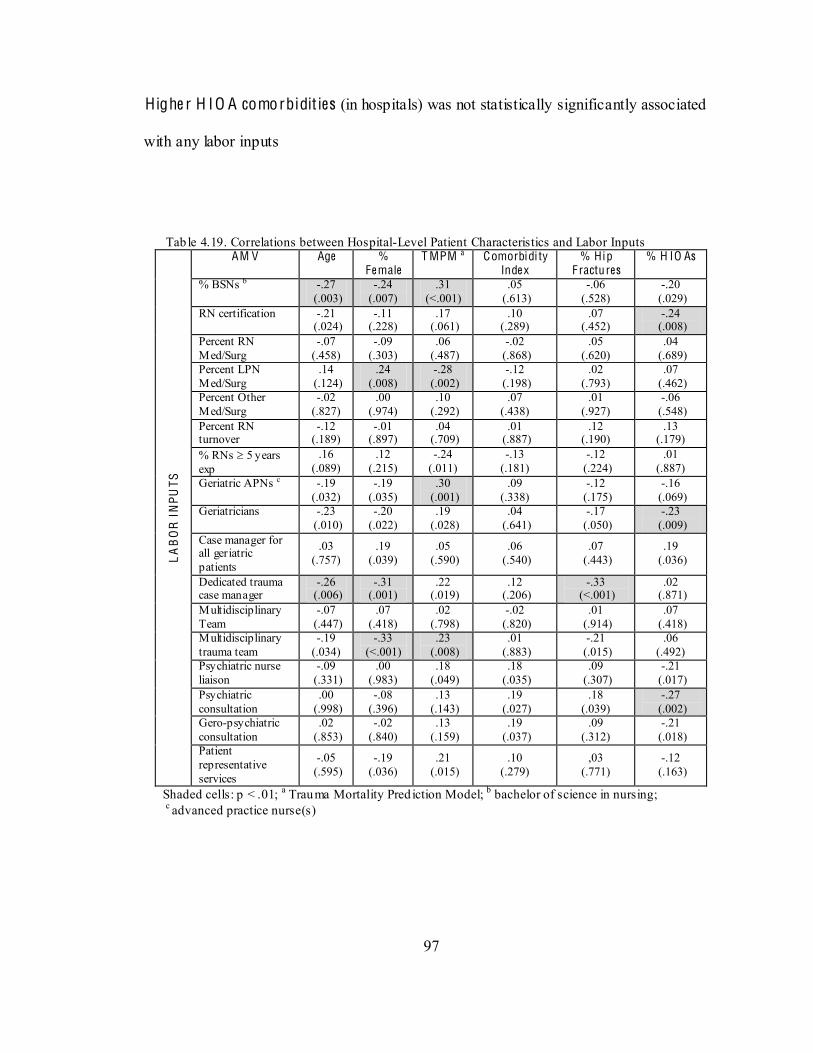
97
Highe r H IO A comorbidit ies (in hospitals) was not statistically significantly associated
with any labor inputs
Tab le 4.19. Correlations between Hospital-Level Patient Characteristics and Labor Inputs
LA
BO
R I
NPU
TS
AM V Age % Fe male
T MPM a Comorbidi ty Inde x
% Hip F ractu res
% H IO As
% BSNs b -.27 (.003)
-.24 (.007)
.31 (<.001)
.05 (.613)
-.06 (.528)
-.20 (.029)
RN certification -.21 (.024)
-.11 (.228)
.17 (.061)
.10 (.289)
.07 (.452)
-.24 (.008)
Percent RN Med/Surg
-.07 (.458)
-.09 (.303)
.06 (.487)
-.02 (.868)
.05 (.620)
.04 (.689)
Percent LPN Med/Surg
.14 (.124)
.24 (.008)
-.28 (.002)
-.12 (.198)
.02 (.793)
.07 (.462)
Percent Other Med/Surg
-.02 (.827)
.00 (.974)
.10 (.292)
.07 (.438)
.01 (.927)
-.06 (.548)
Percent RN turnover
-.12 (.189)
-.01 (.897)
.04 (.709)
.01 (.887)
.12 (.190)
.13 (.179)
% RNs 5 years exp
.16 (.089)
.12 (.215)
-.24 (.011)
-.13 (.181)
-.12 (.224)
.01 (.887)
Geriatric APNs c -.19 (.032)
-.19 (.035)
.30 (.001)
.09 (.338)
-.12 (.175)
-.16 (.069)
Geriatricians -.23 (.010)
-.20 (.022)
.19 (.028)
.04 (.641)
-.17 (.050)
-.23 (.009)
Case manager for all geriatric patients
.03 (.757)
.19 (.039)
.05 (.590)
.06 (.540)
.07 (.443)
.19 (.036)
Dedicated trauma case manager
-.26 (.006)
-.31 (.001)
.22 (.019)
.12 (.206)
-.33 (<.001)
.02 (.871)
Multidisciplinary Team
-.07 (.447)
.07 (.418)
.02 (.798)
-.02 (.820)
.01 (.914)
.07 (.418)
Multidisciplinary trauma team
-.19 (.034)
-.33 (<.001)
.23 (.008)
.01 (.883)
-.21 (.015)
.06 (.492)
Psychiatric nurse liaison
-.09 (.331)
.00 (.983)
.18 (.049)
.18 (.035)
.09 (.307)
-.21 (.017)
Psychiatric consultation
.00 (.998)
-.08 (.396)
.13 (.143)
.19 (.027)
.18 (.039)
-.27 (.002)
Gero-psychiatric consultation
.02 (.853)
-.02 (.840)
.13 (.159)
.19 (.037)
.09 (.312)
-.21 (.018)
Patient representative services
-.05 (.595)
-.19 (.036)
.21 (.015)
.10 (.279)
,03 (.771)
-.12 (.163)
Shaded cells: p < .01; a Trauma Mortality Pred iction Model; b bachelor of science in nursing; c advanced practice nurse(s)
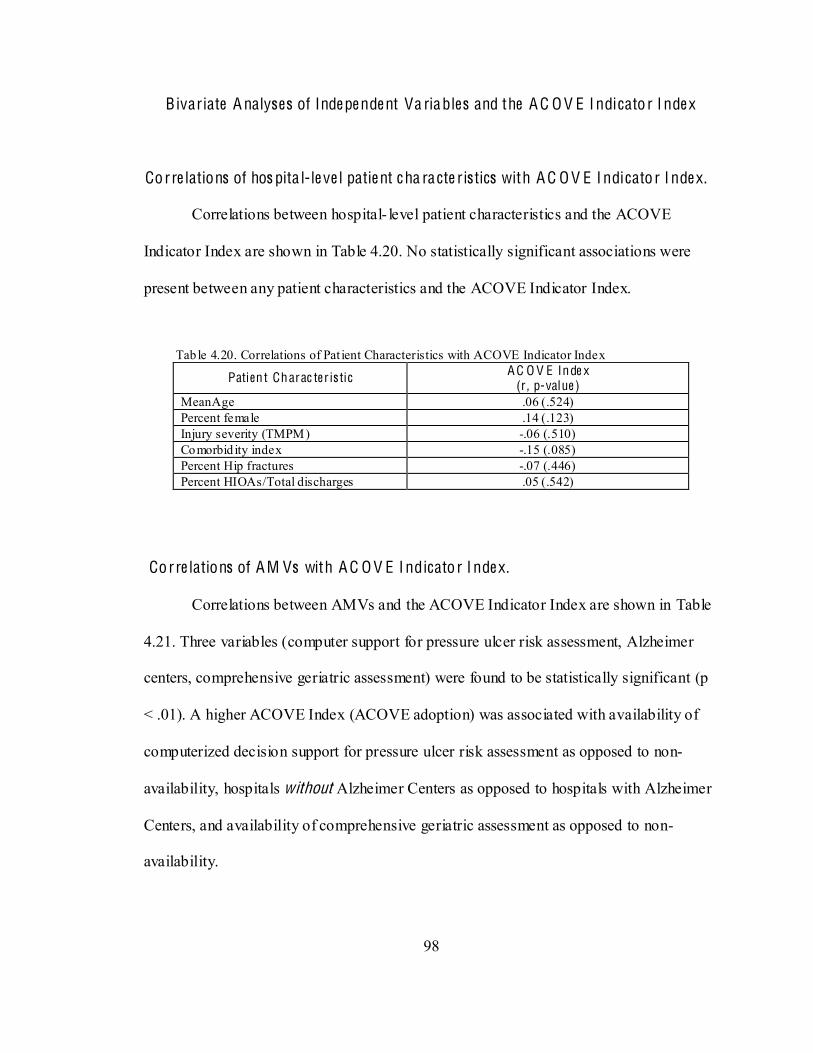
98
Bivariate A nalyses of Inde pe nde nt Va riables and the A C O V E I ndicato r I nde x
Corre lations of hos pita l-le ve l patie nt c ha ra cte ristics with A C O V E I ndicato r I nde x.
Correlations between hospital- level patient characteristics and the ACOVE
Indicator Index are shown in Table 4.20. No statistically significant associations were
present between any patient characteristics and the ACOVE Indicator Index.
Tab le 4.20. Correlations of Pat ient Characteristics with ACOVE Indicator Index
Patient Charac ter is tic A C O V E Inde x (r , p-value )
MeanAge .06 (.524) Percent female .14 (.123) Injury severity (TMPM) -.06 (.510) Comorbid ity index -.15 (.085) Percent Hip fractures -.07 (.446) Percent HIOAs/Total discharges .05 (.542)
Corre lations of A M Vs with A C O V E I ndicato r I nde x.
Correlations between AMVs and the ACOVE Indicator Index are shown in Table
4.21. Three variables (computer support for pressure ulcer risk assessment, Alzheimer
centers, comprehensive geriatric assessment) were found to be statistically significant (p
< .01). A higher ACOVE Index (ACOVE adoption) was associated with availability of
computerized decision support for pressure ulcer risk assessment as opposed to non-
availability, hospitals without Alzheimer Centers as opposed to hospitals with Alzheimer
Centers, and availability of comprehensive geriatric assessment as opposed to non-
availability.
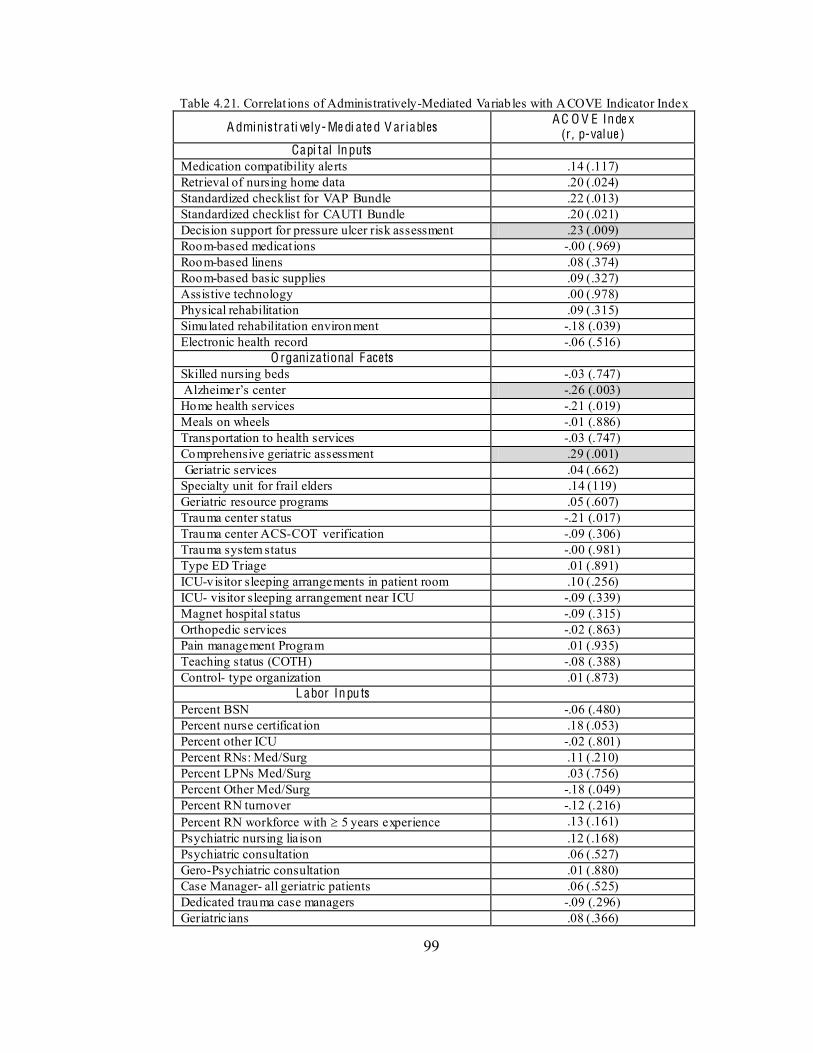
99
Table 4.21. Correlat ions of Administratively-Mediated Variab les with ACOVE Indicator Index
A dminis trati ve ly- Me di ate d V ar iables A C O V E Inde x (r , p-value )
Capi tal Inputs Medication compatibility alerts .14 (.117) Retrieval of nursing home data .20 (.024) Standardized checklist for VAP Bundle .22 (.013) Standardized checklist for CAUTI Bundle .20 (.021) Decision support for pressure ulcer risk assessment .23 (.009) Room-based medicat ions -.00 (.969) Room-based linens .08 (.374) Room-based basic supplies .09 (.327) Assistive technology .00 (.978) Physical rehabilitation .09 (.315) Simulated rehabilitation environment -.18 (.039) Electronic health record -.06 (.516)
O rganizational Facets Skilled nursing beds -.03 (.747) -.26 (.003) Home health services -.21 (.019) Meals on wheels -.01 (.886) Transportation to health services -.03 (.747) Comprehensive geriatric assessment .29 (.001) Geriatric services .04 (.662) Specialty unit for frail elders .14 (119) Geriatric resource programs .05 (.607) Trauma center status -.21 (.017) Trauma center ACS-COT verification -.09 (.306) Trauma system status -.00 (.981) Type ED Triage .01 (.891) ICU-visitor sleeping arrangements in patient room .10 (.256) ICU- visitor sleeping arrangement near ICU -.09 (.339) Magnet hospital status -.09 (.315) Orthopedic services -.02 (.863) Pain management Program .01 (.935) Teaching status (COTH) -.08 (.388) Control- type organization .01 (.873)
L abor Inpu ts Percent BSN -.06 (.480) Percent nurse certificat ion .18 (.053) Percent other ICU -.02 (.801) Percent RNs: Med/Surg .11 (.210) Percent LPNs Med/Surg .03 (.756) Percent Other Med/Surg -.18 (.049) Percent RN turnover -.12 (.216) Percent RN workforce with 5 years experience .13 (.161) Psychiatric nursing liaison .12 (.168) Psychiatric consultation .06 (.527) Gero-Psychiatric consultation .01 (.880) Case Manager- all geriatric patients .06 (.525) Dedicated trauma case managers -.09 (.296) Geriatricians .08 (.366)
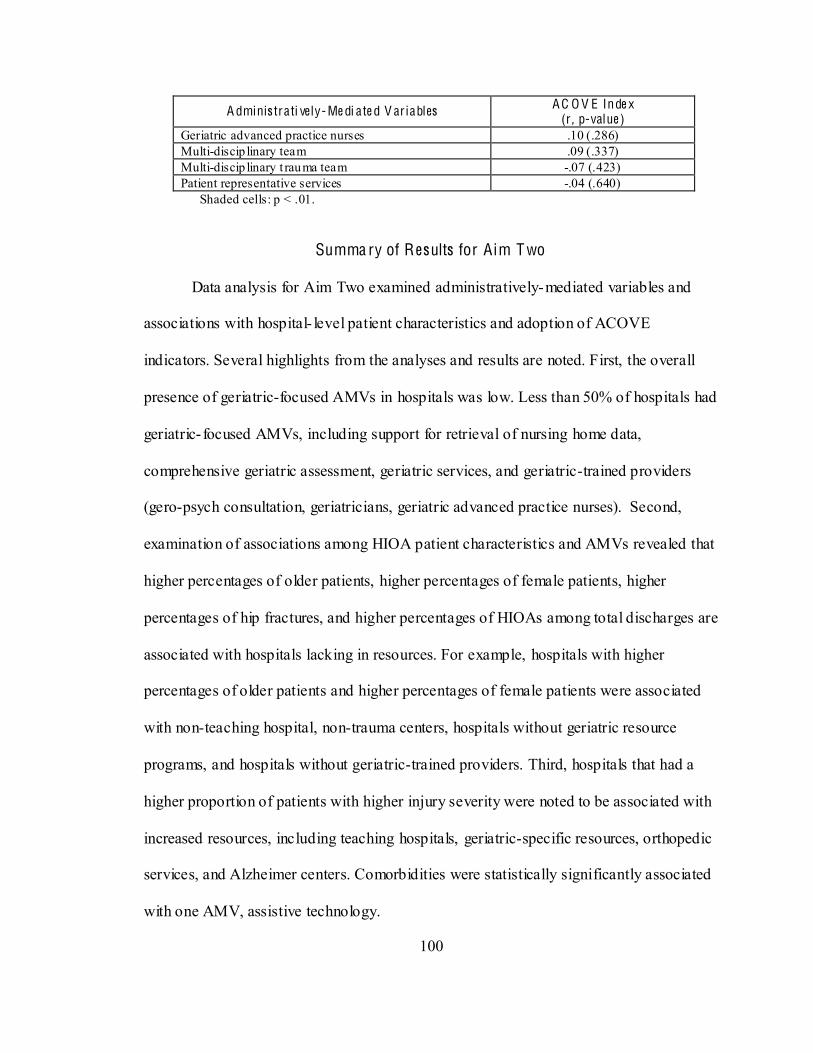
100
A dminis trati ve ly- Me di ate d V ar iables A C O V E Inde x (r , p-value )
Geriatric advanced practice nurses .10 (.286) Multi-discip linary team .09 (.337) Multi-discip linary t rauma team -.07 (.423) Patient representative services -.04 (.640)
Shaded cells: p < .01.
Summa ry of Results for Aim T wo
Data analysis for Aim Two examined administratively-mediated variables and
associations with hospital- level patient characteristics and adoption of ACOVE
indicators. Several highlights from the analyses and results are noted. First, the overall
presence of geriatric-focused AMVs in hospitals was low. Less than 50% of hospitals had
geriatric- focused AMVs, including support for retrieval of nursing home data,
comprehensive geriatric assessment, geriatric services, and geriatric-trained providers
(gero-psych consultation, geriatricians, geriatric advanced practice nurses). Second,
examination of associations among HIOA patient characteristics and AMVs revealed that
higher percentages of older patients, higher percentages of female patients, higher
percentages of hip fractures, and higher percentages of HIOAs among total discharges are
associated with hospitals lacking in resources. For example, hospitals with higher
percentages of older patients and higher percentages of female patients were associated
with non-teaching hospital, non-trauma centers, hospitals without geriatric resource
programs, and hospitals without geriatric-trained providers. Third, hospitals that had a
higher proportion of patients with higher injury severity were noted to be associated with
increased resources, including teaching hospitals, geriatric-specific resources, orthopedic
services, and Alzheimer centers. Comorbidities were statistically significantly associated
with one AMV, assistive technology.
101
Examination of patient characteristics as consumer types revealed that patient
characteristics were not associated with adoption of ACOVE indicators, however several
associations were found between AMVs and adoption of ACOVE indicators. One AMV
related to computerized support (decision support for pressure ulcer risk assessment) was
statistically significantly associated with ACOVE indicator adoption, and it is also noted
that three other AMVs related to computerized support (retrieval of nursing home data,
standardized checklists for VAP and CAUTI bundles) were associated with a higher
ACOVE Indicator Index. Comprehensive geriatric assessment was also associated with
ACOVE indicator adoption while hospitals without Alzheimer Centers had higher
ACOVE indicator adoption.
Aim T hre e
Aim Three: To determine the extent to which AMVs, including adoption of
ACOVE indicators, explain variations in patient safety indicators for HIOAs.
The four data sources for this study were used to meet this aim and a sequential approach
was employed. First, descriptive statistics were generated for hospital rates of
postoperative deep vein thrombosis or pulmonary embolus (PSI #12). Second,
correlations between independent variables (patient characteristics and AMVs [including
the ACOVE Indicator Index]) and the dependent variable (PSI #12) were conducted to
determine associations. Finally, a hierarchical regression model was used to determine
whether variables (patient characteristics and AMVs) representing four levels of
influence (patient-specific, hospital- specific, injury specific, and geriatric-specific)
explained variations in PSI rates among hospitals.
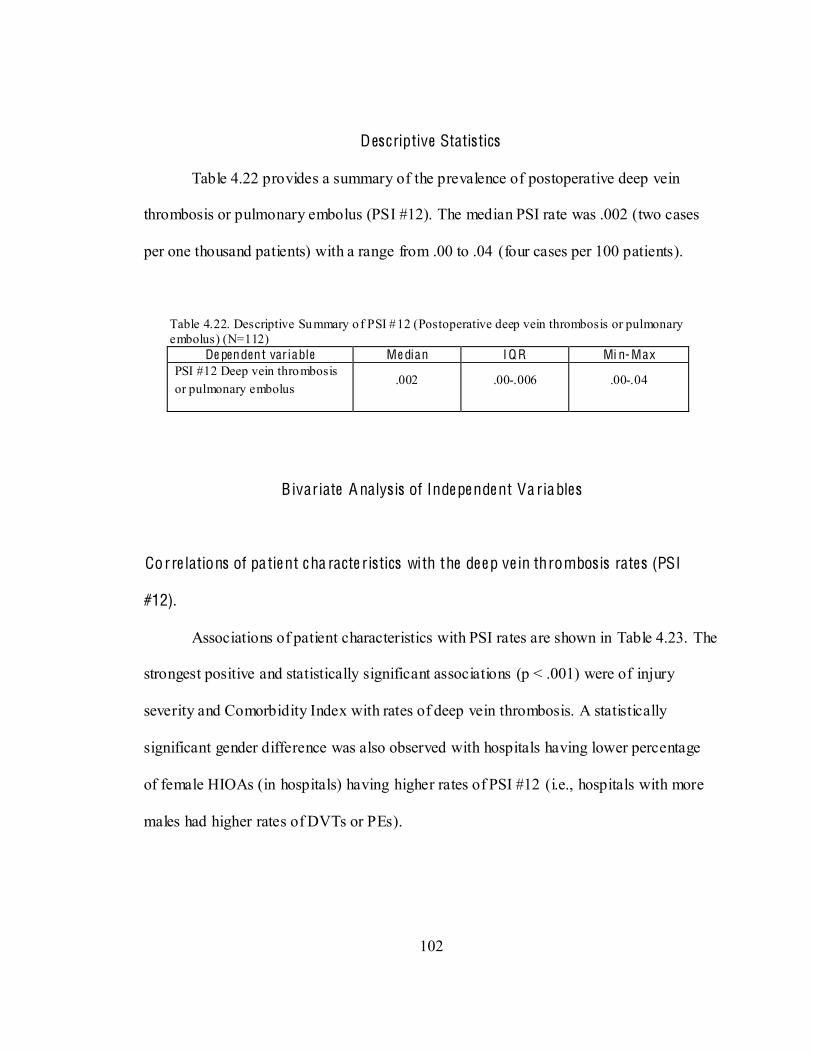
102
Descriptive Statistics
Table 4.22 provides a summary of the prevalence of postoperative deep vein
thrombosis or pulmonary embolus (PSI #12). The median PSI rate was .002 (two cases
per one thousand patients) with a range from .00 to .04 (four cases per 100 patients).
Table 4.22. Descriptive Summary of PSI #12 (Postoperative deep vein thrombosis or pulmonary embolus) (N=112)
De pendent var iable Me dian I Q R Mi n- Max PSI #12 Deep vein thrombosis or pulmonary embolus
.002 .00-.006 .00-.04
Bivariate A nalys is of Inde pe nde nt Va riables
Corre lations of pa tie nt c ha racte ristics with the de e p ve in thrombos is rates (PSI
#12).
Associations of patient characteristics with PSI rates are shown in Table 4.23. The
strongest positive and statistically significant associations (p < .001) were of injury
severity and Comorbidity Index with rates of deep vein thrombosis. A statistically
significant gender difference was also observed with hospitals having lower percentage
of female HIOAs (in hospitals) having higher rates of PSI #12 (i.e., hospitals with more
males had higher rates of DVTs or PEs).
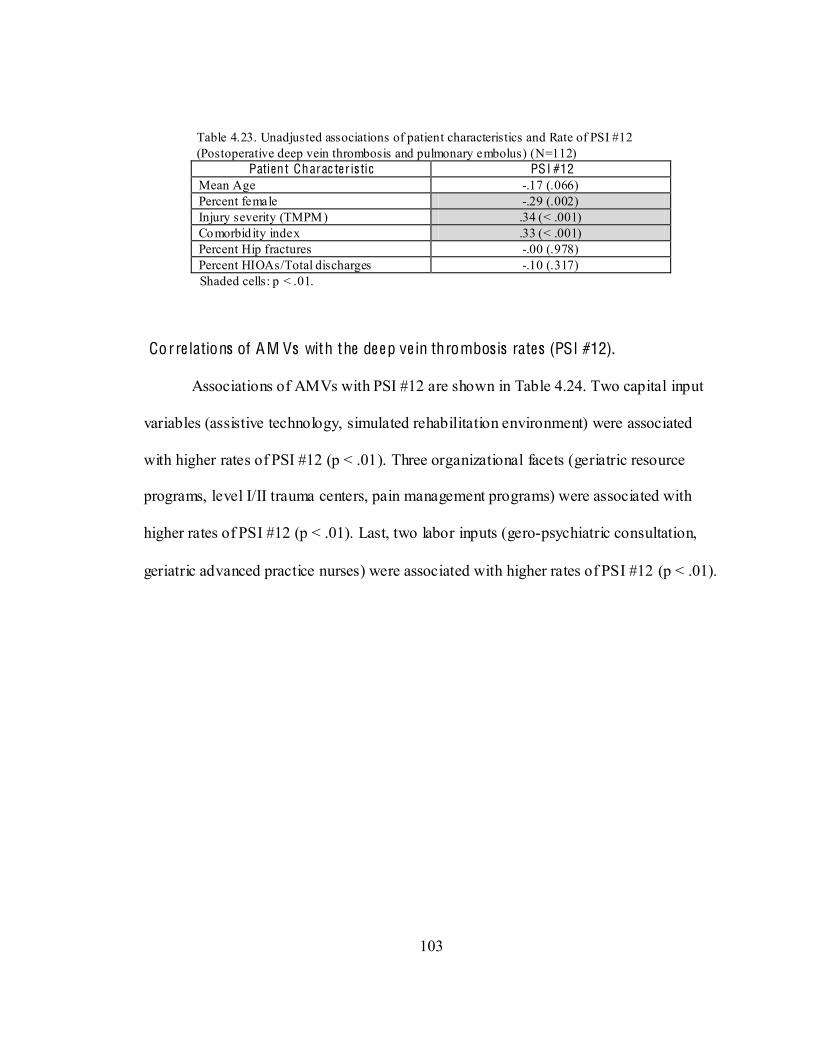
103
Table 4.23. Unadjusted associations of patient characteristics and Rate of PSI #12 (Postoperative deep vein thrombosis and pulmonary embolus) (N=112)
Patient Charac ter is tic PSI #12 Mean Age -.17 (.066) Percent female -.29 (.002) Injury severity (TMPM) .34 (< .001) Comorbid ity index .33 (< .001) Percent Hip fractures -.00 (.978) Percent HIOAs/Total discharges -.10 (.317)
Shaded cells: p < .01. Corre lations of A M Vs with the de e p ve in thrombos is rates (PSI #12).
Associations of AMVs with PSI #12 are shown in Table 4.24. Two capital input
variables (assistive technology, simulated rehabilitation environment) were associated
with higher rates of PSI #12 (p < .01). Three organizational facets (geriatric resource
programs, level I/II trauma centers, pain management programs) were associated with
higher rates of PSI #12 (p < .01). Last, two labor inputs (gero-psychiatric consultation,
geriatric advanced practice nurses) were associated with higher rates of PSI #12 (p < .01).
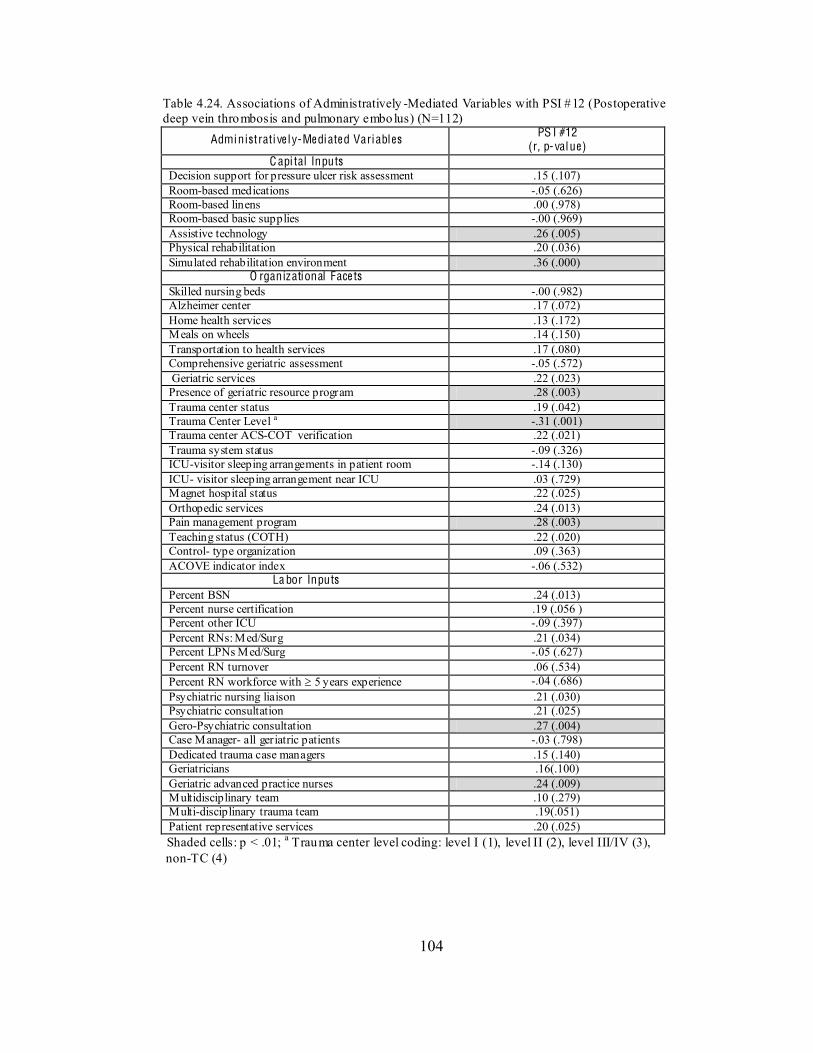
104
Table 4.24. Associations of Administratively -Mediated Variables with PSI #12 (Postoperative deep vein thrombosis and pulmonary embolus) (N=112)
Administrati ve l y-Me diate d Variables PS I #12 (r, p-value)
C api tal Inputs Decision support for pressure ulcer risk assessment .15 (.107) Room-based medications -.05 (.626) Room-based linens .00 (.978) Room-based basic supplies -.00 (.969) Assistive technology .26 (.005) Physical rehabilitation .20 (.036) Simulated rehabilitation environment .36 (.000)
O rganizational Face ts Skilled nursing beds -.00 (.982) Alzheimer center .17 (.072) Home health services .13 (.172) Meals on wheels .14 (.150) Transportation to health services .17 (.080) Comprehensive geriatric assessment -.05 (.572) Geriatric services .22 (.023) Presence of geriatric resource program .28 (.003) Trauma center status .19 (.042) Trauma Center Level a -.31 (.001) Trauma center ACS-COT verification .22 (.021) Trauma system status -.09 (.326) ICU-visitor sleeping arrangements in patient room -.14 (.130) ICU- visitor sleeping arrangement near ICU .03 (.729) Magnet hospital status .22 (.025) Orthopedic services .24 (.013) Pain management program .28 (.003) Teaching status (COTH) .22 (.020) Control- type organization .09 (.363) ACOVE indicator index -.06 (.532)
La bor Inputs Percent BSN .24 (.013) Percent nurse certification .19 (.056 ) Percent other ICU -.09 (.397) Percent RNs: Med/Surg .21 (.034) Percent LPNs Med/Surg -.05 (.627) Percent RN turnover .06 (.534) Percent RN workforce with 5 years experience -.04 (.686) Psychiatric nursing liaison .21 (.030) Psychiatric consultation .21 (.025) Gero-Psychiatric consultation .27 (.004) Case Manager- all geriatric patients -.03 (.798) Dedicated trauma case managers .15 (.140) Geriatricians .16(.100) Geriatric advanced practice nurses .24 (.009) Multidisciplinary team .10 (.279) Multi-disciplinary trauma team .19(.051) Patient representative services .20 (.025)
Shaded cells: p < .01; a Trauma center level coding: level I (1), level II (2), level III/IV (3), non-TC (4)
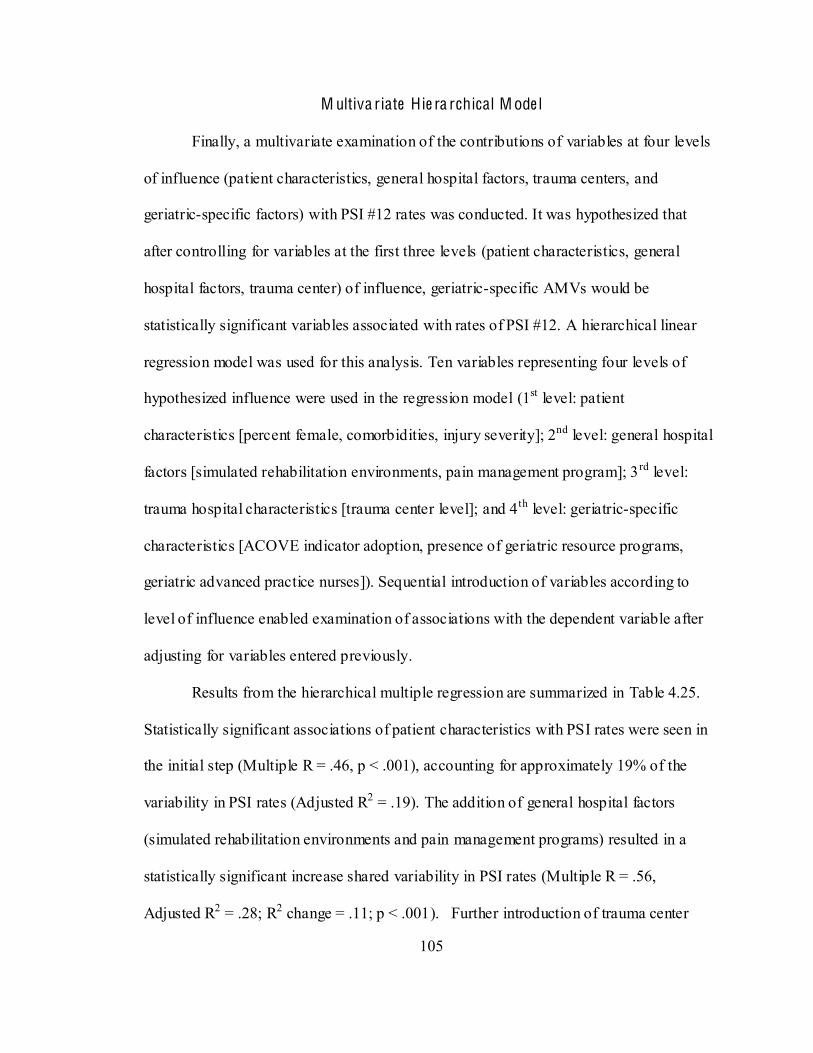
105
M ultiva riate Hie ra rchical M ode l
Finally, a multivariate examination of the contributions of variables at four levels
of influence (patient characteristics, general hospital factors, trauma centers, and
geriatric-specific factors) with PSI #12 rates was conducted. It was hypothesized that
after controlling for variables at the first three levels (patient characteristics, general
hospital factors, trauma center) of influence, geriatric-specific AMVs would be
statistically significant variables associated with rates of PSI #12. A hierarchical linear
regression model was used for this analysis. Ten variables representing four levels of
hypothesized influence were used in the regression model (1st level: patient
characteristics [percent female, comorbidities, injury severity]; 2nd level: general hospital
factors [simulated rehabilitation environments, pain management program]; 3rd level:
trauma hospital characteristics [trauma center level]; and 4th level: geriatric-specific
characteristics [ACOVE indicator adoption, presence of geriatric resource programs,
geriatric advanced practice nurses]). Sequential introduction of variables according to
level of influence enabled examination of associations with the dependent variable after
adjusting for variables entered previously.
Results from the hierarchical multiple regression are summarized in Table 4.25.
Statistically significant associations of patient characteristics with PSI rates were seen in
the initial step (Multiple R = .46, p < .001), accounting for approximately 19% of the
variability in PSI rates (Adjusted R2 = .19). The addition of general hospital factors
(simulated rehabilitation environments and pain management programs) resulted in a
statistically significant increase shared variability in PSI rates (Multiple R = .56,
Adjusted R2 = .28; R2 change = .11; p < .001). Further introduction of trauma center
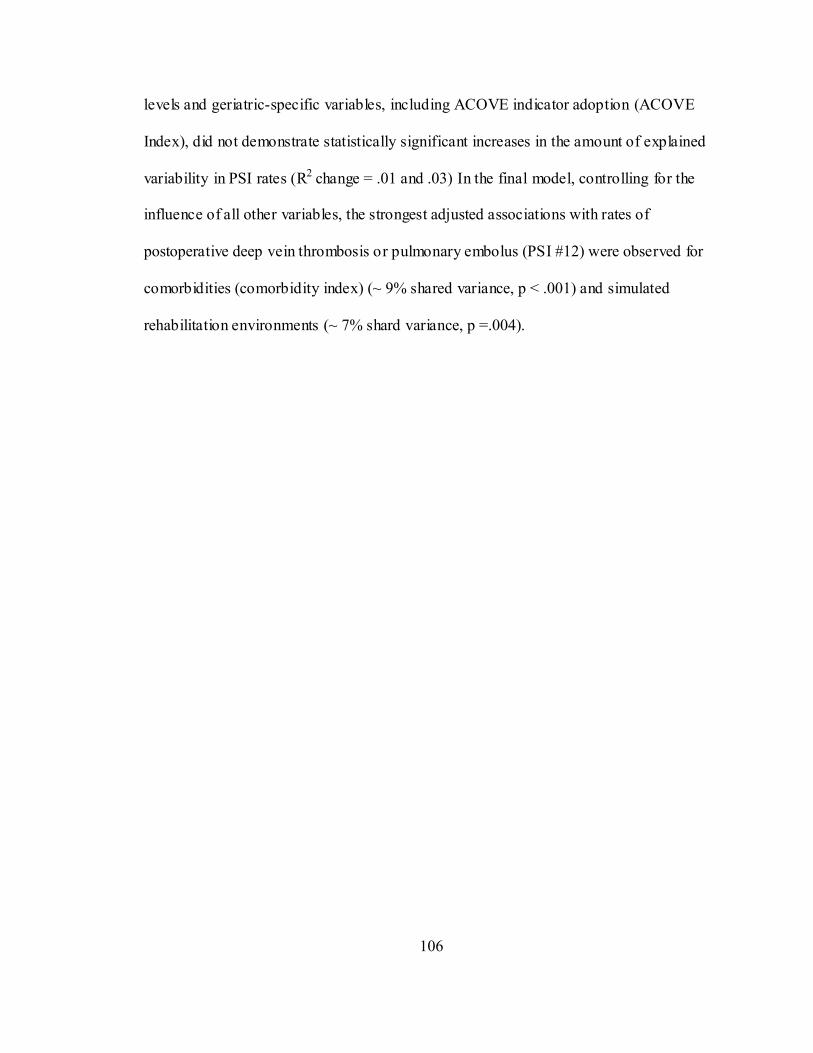
106
levels and geriatric-specific variables, including ACOVE indicator adoption (ACOVE
Index), did not demonstrate statistically significant increases in the amount of explained
variability in PSI rates (R2 change = .01 and .03) In the final model, controlling for the
influence of all other variables, the strongest adjusted associations with rates of
postoperative deep vein thrombosis or pulmonary embolus (PSI #12) were observed for
comorbidities (comorbidity index) (~ 9% shared variance, p < .001) and simulated
rehabilitation environments (~ 7% shard variance, p =.004).
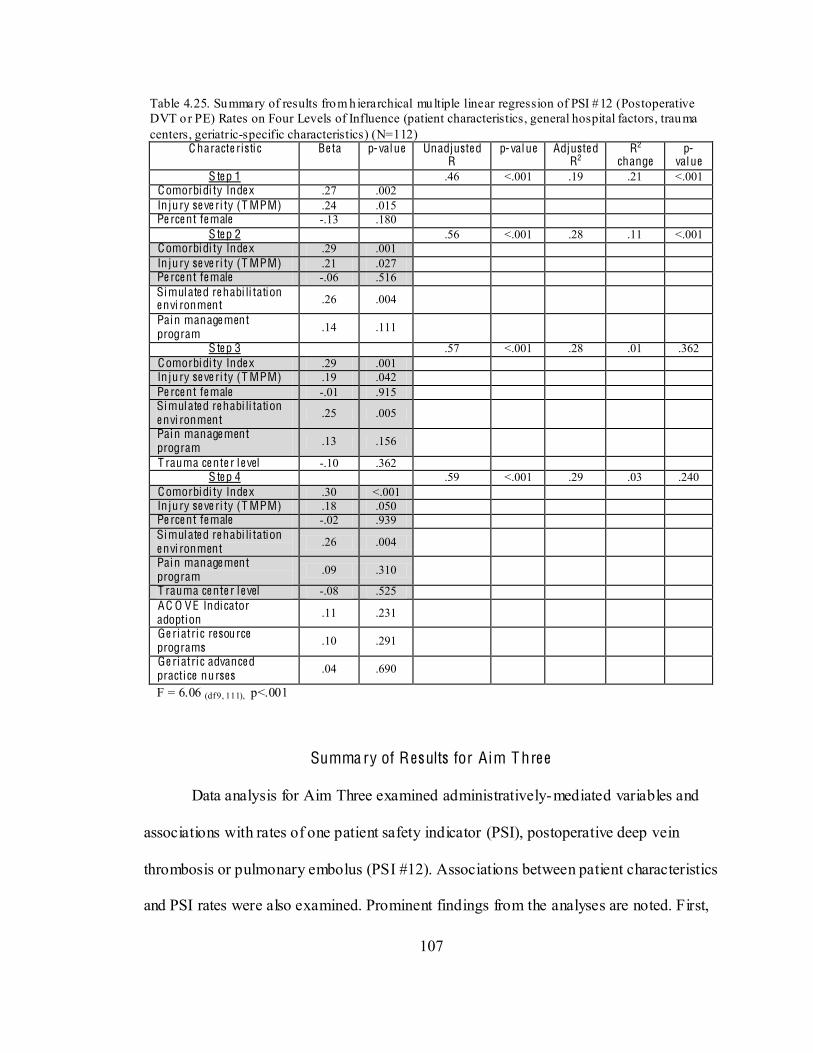
107
Table 4.25. Summary of results from h ierarchical multiple linear regression of PSI #12 (Postoperative DVT or PE) Rates on Four Levels of Influence (patient characteristics, general hospital factors, trauma centers, geriatric-specific characteristics) (N=112)
C haracte ristic Be ta p-value Unadjuste d R
p-value Adjuste d R2
R2
change p-
value S te p 1 .46 <.001 .19 .21 <.001
Comorbidi ty Inde x .27 .002 In ju ry se ve ri ty (T MPM) .24 .015 Pe rce nt fe male -.13 .180
S te p 2 .56 <.001 .28 .11 <.001 Comorbidi ty Inde x .29 .001 In ju ry se ve ri ty (T MPM) .21 .027 Pe rce nt fe male -.06 .516 Simulate d re habi li tation e nvi ronment .26 .004
Pain manage ment program .14 .111
S te p 3 .57 <.001 .28 .01 .362 Comorbidi ty Inde x .29 .001 In ju ry se ve ri ty (T MPM) .19 .042 Pe rce nt fe male -.01 .915 Simulate d re habi li tation e nvi ronment .25 .005
Pain manage ment program .13 .156
T rauma ce nte r le vel -.10 .362 S te p 4 .59 <.001 .29 .03 .240
Comorbidi ty Inde x .30 <.001 In ju ry se ve ri ty (T MPM) .18 .050 Pe rce nt fe male -.02 .939 Simulate d re habi li tation e nvi ronment .26 .004
Pain manage ment program .09 .310
T rauma ce nte r le vel -.08 .525 AC O VE Indicator adoption .11 .231
Ge ri atric resource programs .10 .291
Ge ri atric advance d practice nurses .04 .690
F = 6.06 (df 9, 111), p<.001
Summa ry of Results for Aim T hre e
Data analysis for Aim Three examined administratively-mediated variables and
associations with rates of one patient safety indicator (PSI), postoperative deep vein
thrombosis or pulmonary embolus (PSI #12). Associations between patient characteristics
and PSI rates were also examined. Prominent findings from the analyses are noted. First,
108
variables from all three AMV categories were associated with variance in PSI rates.
Among capital inputs, hospitals with more rehabilitative resources had higher rates of PSI
#12. Hospitals with select organizational facet resources (geriatric resource programs,
level I trauma centers, Magnet hospitals, teaching hospitals, and orthopedic services)
were also associated with higher rates of PSI #12. Among labor inputs, hospitals with
more resources (BSN nurses, psychiatric services, geriatric advanced practice nurses) had
higher rates of PSI #12.
A hierarchical regression model was used to understand associations of variables
at four levels. Several highlights were noted. First, although trauma centers and geriatric-
specific variables (including adoption of ACOVE indicators) were associated with higher
rates of PSIs, they did not have statistically significant associations in a multivariate
hierarchical model after adjusting for patient and general hospital characteristics. Among
AMVs related to rehabilitation resources, hospitals with simulated rehabilitation
environments explained a small percentage (7%) of variance in PSI rates. However,
patient characteristics (particularly comorbidities) primarily contributed to variances in
PSI rates. The null hypothesis that geriatric-specific AMVs would not explain variations
of PSI rate after controlling for other patient and hospital characteristics was accepted.
109
C H APT ER V
D ISCUSSION
This chapter provides a synopsis and discussion of study findings for this
dissertation study. The following five sections are addressed: 1) sample characteristics,
2) aims, 3) strengths and limitations, 4) implications, and 5) recommendations for future
research.
Sample Cha rac te ristics
Study samples were based on returned surveys (N=128) of chief nursing officers
from identifiable hospitals in the 2009 HCUP NIS that provided care to at least 10
patients age 65 or older with a primary injury diagnosis. Among 128 identifiable
hospitals, 25,544 patients/discharges formed a patient-level dataset. The ability to merge
four data sources enabled creation of a hospital- level dataset enriched with hospital
demographics, organizational factors (administratively-mediated variables), patient
characteristics, and patient outcomes.
Comparisons of the current study sample characteristics at both hospital and
patient levels with those from a national data source (Agency for Healthcare Research
and Quality (AHRQ), 2009) and prior studies (Clark & Chu, 2002; Clark, DeLorenzo,
Lucas, & Wennberg, 2005; Gorra, Clark, Mullins, & DeLorenzo, 2008; Maxwell &
Mion, 2010, Unpublished Study-a) reveal similar findings. Given similar comparisons
and the small sample size, external validity for this study is moderate. Thus, findings for
110
each of the study aims can be generalized with caution to the population of hospitalized
injured older adults recognizing that teaching status and the Northeast regions were over-
represented.
Aims
Aim One: To determine the extent of adoption of targeted ACOVE indicators for
hospitalized injured older adults in acute care settings. Data to meet this aim were
obtained from a survey of chief nursing officers (CNOs) because adoption of quality
indicators is primarily a nursing function. The conduct of prior content validation by
CNOs strengthened the survey validity.
Ove ral l adoption of nine A C O V E indica to rs
Within the literature, two studies (Arora et al., 2009; Neuman, et al., 2010) have
examined presence of and adherence to quality indicators in hospitals. Neuman et al.
(2010) assessed the prevalence of written protocols for inpatient care of older adults
through a survey of CNOs in Pennsylvania hospitals (n=103) for 2009. Comparisons of
the current study with the previous study revealed some similarities: 1) assessment of risk
factors for delirium (Neuman et al.: 21.1%; current study: 26% ); 2) screening for
delirium after surgery (Neuman et al.: 17.0%; current study: 24% ); 3) timing of
mobilization after surgery (Neuman et al.: 34.0%; current study: 83%); 4) assessment of
physical function at discharge (Neuman et al.: 80.7%; current study: 91%); and 5)
assessment of cognition at discharge (Neuman et al.: 40.2%; current study: 37%)
(Neuman, et al., 2010). The difference in target populations of the two studies may
111
explain the findings. The current study focused on injured older adults and the other
focused on all adults.
Arora et al. (2009) examined adherence to select ACOVE indicators at one
University medical center. Two of the indicators (surgical patients assessed for cognitive
status, documentation of multidimensional assessment of cognitive ability and assessment
of functional status) examined in that work were also used in the current study.
Adherence to assessment of cognition in surgical patients was 4.3% in the prior study,
compared to 24% in the current study. Adherence to multidimensional assessment of
cognition and functional status in the prior study was 41.9%, compared to 47% in the
current study. Of note, the prior study examined adherence by conducting medical record
reviews, while the measure (partial to complete adoption) for this study was obtained
through a survey. This may account for the difference for assessment of cognition in
surgical patients.
Compared with prior studies, the findings for the current study suggest that some
improvements may have occurred in the adoption of ACOVE indicators. For example,
compared with Neuman et al. (2010), protocol adherence/indicator adoption was higher
for 4 of 5 indicators. The greatest difference was for timing of mobilization after surgery
(34% vs. 83%). Differences in data collection methods (CNO self-report versus medical
record review) could account for this difference. Many studies over the past 10 years, as
well as the most recent studies and practice guidelines (Chong, Savige, & Lim, 2010;
Gregory, Kostakopoulou, Cool, & Ford, 2010; Hildreth et al., 2010; Morris, Benetti,
Marro, & Rosenthal, 2010) support early mobilization for elderly surgical patients. The
findings of this study may reflect greater progress for this indicator. An alternate
112
explanation may be selection bias among CNOs. For example, the 128 CNOs who
completed the survey may have had a greater interest in geriatric care and/or desire to
provide positive answers. Given no reward or recognition was offered for survey
completion, this does not seem like a likely explanation.
A C O V E indicato r adopt ion by hos pita l c ha racte ristics .
Geographic region. Among the nine ACOVE indicators, the Northeast region had
the highest percentage of adoption for six of nine indicators with one indicator
(assessment of functional status) having a statistically significant difference compared to
other geographic groups. For the remainder, the West region had the highest percentage
for three of the indicators, and the Midwest and South were similar in adoption behind
the Northeast and West. No studies have examined quality indicator adoption by
geographic regions, however, one study (Marshall, Harbin, Hooker, Oswald, &
Cummings, 2012) did examine whether safety-net hospitals published quality
performance data and which were top performers in the Centers for Medicare and
Medicaid Services (CMS) core quality and patient satisfaction (HCAHPS) measures.
They reported hospitals in the Northeast were highest performers on core measures and
were most likely to post core measures online. Another study (Jha, Li, Orav, & Epstein,
2005) examined hospital performance from CMS data on 10 quality indicators and found
significant regional differences with the Midwest and Northeast outperforming the West
and South.
One explanation may account for the findings in the current study. The Northeast
region is home to both of the most prominent geriatric acute care models for hospitalized
elders (NICHE and HELP). Based out of university medical centers (New York
113
University, Yale University) in the Northeast, other hospitals in the region may be more
familiar with NICHE and HELP. In fact, a prior study (Maxwell & Mion, 2010,
Unpublished Study-a)found that hospitals in two states (New York, New Jersey) had the
highest number of NICHE programs within the U.S. This finding is consistent with
findings in the studies described above (Jha, et al., 2005; Marshall, et al., 2012) that
found better performance in the Northeast.
Bedsize and Teaching Status. Variability of ACOVE indicator adoption by
bedsize and teaching status revealed no patterns of adoption or statistically significant
differences. Indicator adoption varied widely among hospitals by bedsize. Among six
indicators, percentages of adoption were equivalent for both teaching and non-teaching
hospitals. These findings could be interpreted as encouraging because hospitals of
variable bedsize and teaching status were able to achieve equivalent levels of ACOVE
adoption. Other studies within the literature (Jha, et al., 2005) found no relationship
between bedsize and quality of care. Adoption of quality indicators by teaching status has
not been examined; however, patient outcomes have been examined between teaching
and non-teaching hospitals. A systematic review (Papanikolaou, Christidi, & Ioannidis,
2006) of patient outcomes in teaching and non-teaching facilities revealed that teaching
facilities did not experience better outcomes than non-teaching facilities. Another study
(Vartak, Ward, & Vaughn, 2008) found that teaching hospitals treat sicker patients and
perform more complicated procedures, but that after adjusting for patient characteristics,
there were no differences in outcomes. The findings from the current study suggest that
while many teaching hospitals may be located in academic settings and have more
114
resources than non-teaching hospitals this does not necessarily translate into written
protocols and practice change.
Trauma center status. Adoption of ACOVE indicators by trauma center status
revealed consistent findings across all nine indicators. Level I trauma centers had the
highest percentage of adoption for six of nine indicators, and second highest for two
others. Behind Level I trauma centers, non-trauma centers had the next highest
percentages of ACOVE adoption. Level II trauma centers had the lowest percentage of
ACOVE adoption for all nine indicators. One reason for these findings could be that the
small sample of Level I trauma centers (n = 9) were not reflective of all Level I trauma
centers. Considering that trauma centers are often teaching hospitals, the findings for the
Level II trauma centers might be a more accurate portrayal of ACOVE adoption among
trauma centers, and more consistent with adoption patterns of teaching hospitals.
Geriatric Acute Care Models. Adoption of ACOVE indicators among hospitals
with/without geriatric acute care model (NICHE or HELP) was evenly distributed across
all nine indicators. For three indicators (multidimensional assessment of cognition,
discharge assessment for level of independence and home health, ambulation by
postoperative day two), hospitals without an acute care model had higher percentages of
adoption. For three indicators (assessment for etiology of delirium, plan to increase
mobilization within 48 hours, discharge assessment for cognitive and functional status),
hospitals with an acute care model had higher percentages, and for the remaining three
indicators adoption percentages were equivalent within 5%.
These findings were unexpected because adoption of geriatric-specific indicators
seems an expectation for hospitals with geriatric acute care models. Several explanations
115
for this are possible. First, closer inspection of the degrees of adoption among hospitals
with an acute care model shows a gap
two extremes (partial implementation), contain only one or two hospitals for all nine
indicators. This suggests that the NICHE or HELP hospitals in this study are either in
beginning stages (no activity or under development) of adoption or have matured to the
point of full adoption. Given the small sample size and survey method used for
measurement, the statistical analysis might not detect this finding. Another explanation
reflects the possibility that hospitals without a geriatric acute care model are using
evidence-based guidelines (including ACOVE indicators) to develop protocols and that
these hospitals may be similar in adoption to NICHE hospitals. Finally, an expectation of
higher adoption rates among NICHE hospitals may not be appropriate. One study (Mezey
et al., 2004) examined the use of geriatric nursing protocols and found that 51% of
NICHE hospitals were using geriatric protocols. In the current study, the overall
percentage of full adoption of all nine ACOVE indicators was 58%, or 7% above the
prior study. Perhaps the current study reflects an increase in indicator adoption among
NICHE hospitals.
Aim Two: To determine associations among administratively-mediated variables
(AMVs), patient characteristics, and the extent of adoption of ACOVE indicators for
-mediated variables
efined by Minnick and colleagues to describe factors within hospitals
that are shaped by decisions of key personnel (administrators) (Minnick, et al., 1997).
The concept implies that variables can be altered (mediated) through administrative
116
actions. The Minnick and Roberts Outcome Model focuses on variables for which system
modifications can be made, as opposed to patient or provider modifications. Sub-
categories within the concept include capital inputs, organizational facets, and labor
inputs. The current study examined an array of AMVs within the three categories that
could potentially influence the adoption of quality indicators within hospitals. Variables
were obtained from the survey of CNOs, the 2009 American Hospital Association (AHA)
survey of hospitals, and a prior study. After descriptive statistics were conducted for over
70 AMVs, correlations between AMVs and patient characteristics, and correlations
between AMVs and adoption of the nine ACOVE indicators were conducted and
examined. The following paragraphs discuss the findings along with possible
explanations for the results.
Associat ion among A MVs and HIO A pat ient characterist ics. A number of
AMVs were associated with hospital- level patient characteristics at a .01 significance
level. From a broad perspective, the study findings revealed that older female HIOAs
with lower injury severity and less comorbidities are treated at hospitals with less
resources. A correlation between increased patient age and hospitals with lower
percentages of BSN nurses was a noted finding. Higher percentage of female HIOAs was
associated with non-Magnet hospitals, higher percentage of LPNs on med/surg units and
absence of trauma case managers and multidisciplinary trauma teams. Higher injury
severity was associated with presence of geriatric resources, Magnet hospitals, Alzheimer
centers, geriatric advanced practice nurses, higher percentages of BSN nurses, and lower
percentages of LPNs on med/surg units. Given that teaching hospitals (i.e., trauma
centers) are associated with higher percentages of BSN nurses (Goode et al., 2001), these
117
findings are not surprising. However, future research is needed to further understand
reasons for these interrelationships.
Associat ions among A MVs, pat ient characteristics, and adoption of A CO V E
indicators. Correlations among patient characteristics and an ACOVE indicator index
showed no statistically significant clinical correlations. While it might be expected for
hospitals with higher percentages of older patients or higher percentages of primary hip
fractures to adopt geriatric-specific quality indicators, the findings suggest that is not the
case. Perhaps, despite the fact that ACOVE indicators were developed over 10 years ago
(Wenger, et al., 2001), many hospitals with older patients remain unaware of these
indicators. Another possibility may be that while hospital patient safety standards have
focused on risk assessment for falls and need for home health, few initiatives have
addressed geriatric syndromes. Hospitals may be more responsive to indicators that are
driven by third party payers.
Correlations among AMVs and the ACOVE indicator index did reveal
statistically significant correlations (p < .01). Three AMVs were associated with ACOVE
adoption, including, computerized decision support for pressure ulcer assessment, and
comprehensive geriatric assessment. Of note, three other capital inputs related to
computer support were associated at a .05 level of significance. These findings are
supported by prior studies. Menachemi, Chukmaitov, Saunders et al. (2008) found that
hospitals with greater adoption of information technologies were more likely to utilize
quality indicator measures and to have desirable outcomes. Longo, Hewett, Ge et al.
(2007) examined organizational factors associated with patient safety systems and found
that computerization support such as safety alert systems and availability of data to
118
support patient care systems were associated with better performance in implementing
patient safety.
Comprehensive geriatric assessment (CGA) was associated with adoption of
ACOVE indicators. This finding was anticipated as implementation of geriatric-specific
quality indicators is a part of CGA. Comprehensive geriatric assessment is defined as a
coordinated and integrated plan for treatment and long term follow up (Rubenstein,
Stuck, Siu, & Wieland, 1991) -analysis (
Langhorne, & Robinson, 2011) of randomized controlled trials found that older patients
are more likely to survive admission to the hospital if they undergo CGA.
An unanticipated association was between hospitals without Alzheimer Centers
and higher adoption of ACOVE indicators. Seemingly, hospitals with Alzheimer Centers
would have higher ACOVE adoption. The limited sample size of hospitals with
Alzheimer centers (n = 12) may account for this finding.
Aim Three: To determine the extent to which AMVs, including adoption of
ACOVE indicators, explain variations in patient safety indicators for HIOAs. Results for
this aim provided new knowledge regarding the occurrence of four adverse events among
HIOAs. Three of the patient safety indicators to be used as dependent/outcome variables
(pressure ulcers, central line infections, and postoperative hemorrhage or hematoma) had
very low rates among the patient sample, rendering data analysis impossible. This
suggests that among the population of HIOAs, these three adverse events are either (1)
not large problems, or (2) go unreported. Given national programs, the second
119
explanation is unlikely. Perhaps lower injury severity, shorter lengths of stay, and more
time for preoperative assessment contribute to this finding. National programs to prevent
these problems may be having a salutary effect.
Although three PSIs occurred at very low rates among HIOAs, one PSI rate
(postoperative deep vein thrombosis [DVT] or pulmonary embolus [PE]- PSI #12) was
much higher and occurred ten times as often as in the reference population (2008 HCUP
NIS). Deep vein thrombosis is a common complication after traumatic injury (Chiasson,
Manns, & Stelfox, 2009; Geerts, Code, Jay, Chen, & Szalai, 1994). Risk factors include
pelvic and lower extremity fractures and prolonged immobilization. Increasing age is
considered the single most important predictor of venous thrombosis in trauma patients
(Toker, Hak, & Morgan, 2011). In light of these facts, it is not surprising that the rate of
PSI #12 was high within the patient sample, since all patients were 65 and older, and 48%
of the sample of patients had lower extremity fractures. Compared with the other three
indicators, even the best prevention efforts for PSI #12 have a low success rate.
Studies within the last three years have been critical of the use of this PSI as an
outcome measure to assess quality in hospitals (and trauma centers). Two studies (Haut et
al., 2009; Pierce et al., 2008) used the National Trauma Data Bank to identify DVT rates
in trauma centers and found significant surveillance bias and inequities in coding
practices. Another study (Kaafarani et al., 2011), applied AHRQ PSI software to identify
patients and 21% were found to have inaccurate coding, while another 36% of cases were
present on admission. In light of these other studies, the findings from the current study
should be regarded with caution.
120
Associat ion of pat ient characterist ics wi th PSI #12. Three patient characteristics
had associations with PSI #12 at a .01 level of significance, including higher injury
severity (TMPM score) (r = .34), increased comorbidities (comorbidity index) (r = .33),
and lower percents of female patients (r = -.29). These findings are consistent with the
literature (Andreou et al., 2008; Haut, et al., 2009).
Associat ions of A MVs wi th PSI #12. Seven AMVs had associations with PSI #12
at a .01 level of significance or less. Two AMVs related to physical rehabilitation
(assistive technology, simulated rehabilitation environments) were associated with higher
rates of PSI #12. Three geriatric-specific AMVs (geriatric resource programs, geriatric
advanced practice nurses, gero-psychiatric consultation), and two injury-related AMVs
(trauma centers with higher levels of service, pain management programs) were
associated with higher rates of PSI #12. These findings suggest that occurrences of PSI
#12 occur more often in resource- intensive hospitals where HIOAs have higher injury
severity and more comorbidities.
Mul t ivariate analysis of A MVs wi th PSI #12. A hierarchical regression model
was used to examine patient characteristics and AMVs that might explain variances in
PSI rates. This approach enabled examination of the relative importance of four levels of
variables (patient characteristics, general hospital characteristics, trauma centers, and
geriatric-specific variables [including the ACOVE indicator index]). The analysis showed
that after controlling for the influence of all variables in the model, comorbidities, injury
severity, and simulated home and community rehabilitation environments in hospitals
remained as the only explanatory variables. There are several explanations for these
results. First, hospitals with simulated home and community rehabilitation environments
121
may serve as referral centers for patients with greater injury severity and greater need for
more intensive rehabilitation, thus explaining higher rates of DVTs. Another explanation
is that immobility related to injury contributed to the occurrence of DVT and its
discovery during the rehabilitation phase. Finally, although several AMVs (including
adoption of ACOVE indicators) did not emerge as explanatory variables, it is important
to note that in the final analysis, comorbidities and injury severity provided the strongest
explanation for occurrence of DVTs.
Prior studies have shown higher rates of DVTs and PEs in trauma centers (Ang et
al., 2009). Other studies (MacKenzie, et al., 2006; Rotondo, et al., 2009) have
highlighted poorer outcomes in trauma centers for older patients and have raised
questions about quality of care. After risk adjustment, trauma centers were not a factor
that explained occurrence of DVTs or PEs in this study. Perhaps efforts made in this
study to accurately reflect injury severity and disease burden (comorbidity) through the
use of additional software (TMPM scoring) and creation of a hospital- level comorbidity
index from 29 identified comorbidities support continued use of these methods in studies
that examine outcomes at the hospital level.
Stre ngths and L imitat ions
This study was first to utilize administrative data to examine organizational
factors that are associated with outcomes specific to HIOAs. It was also an initial study to
examine patient safety indicators as an outcome measure for HIOAs. In consideration of
these firsts, this section discusses strengths and limitations of the study for the following
areas: 1) use of administrative data, 2) multi- level analysis, and 3) study design.
122
Administra tive data.
Studies using administrative data have inherent strengths and weaknesses.
Advantages for this study included less ethical concerns, data availability and lower cost.
Since administrative data had already been collected, ethical issues were minimized. The
2009 HCUP NIS was purchased for $50 from AHRQ. Additional software (TMPM, PSI
software) was free of charge, yet provided significant assistance in risk adjustment. The
2009 AHA Survey data was available free of charge from Vanderbilt University School
of Nursing.
Despite strengths, use of administrative data also had limitations. One threat to
data validity is un-blinded data collection methods. Data within the HCUP NIS was
collected for non-research purposes. Coding of diagnoses and procedures are primarily
(Powell, Davies, &
Thomson, 2003; Riley, 2009).
Validity of d
discharge and transfer practices or by changes in reporting practices over time (Powell, et
al., 2003).
Another limitation was that of time frame. The HCUP NIS and AHA Survey data
contained information from two years prior to current events and may not have accurately
represented current practice. It is also noted that data used for this study were limited to
those variables available in the datasets and were thus lacking in clinical detail. A final
limitation was that of coping with chance variability. Large quantities of data are prone to
identifying false outliers that can lead to false conclusions for type I errors (Powell, et al.,
123
2003). Pre-specification of outcomes of interest (ACOVE Indicator Index, PSI #12) in
this study and reporting statistical significance of .01 was employed to minimize false
conclusions.
M ulti-le ve l analys is .
The use of more than one level of data (i.e., patient-level and hospital- level)
provided opportunities that strengthened the study but also held the potential for bias.
Studies involving multiple levels of influence must address hypothesized relationships
that operate across different levels (Luke, 2004). Use of the 2009 HCUP NIS provided
the opportunity to utilize patient- level data from a nationally-representative sample, thus
enabling the current study to be an inclusive, multi- site study, representative of all
hospitalized injured older adults. In order to represent patient-level variables in context at
the hospital level, it was necessary to apply statistical methods to create hospital- level
patient characteristics, and hospital- level outcome measures. Methods used to accomplish
this were a strength of the study. As noted in a previous section (pp. 33-38), the use of the
Trauma Mortality Prediction Model (TMPM) and the comorbidity index were superior to
traditional methods for risk adjustment. Once injury severity, comorbidity measures, and
outcome events (DVTs and PEs) were determined at the patient level, methods were
employed for all patient- level characteristics to create variables that were accurate
representations of hospital- level characteristics.
124
Study des ign.
The use of four data sources was a strength of this study and provided the
opportunity to enrich a hospital- level dataset with variables heretofore unexamined in
studies of HIOAs and trauma centers. The HCUP NIS provided patient characteristics
and outcomes. AHA Survey data and the prior study provided hospital characteristics
(administratively-mediated variables), and the survey of CNOs provided detailed hospital
information on other variables not available in administrative data. The choice of specific
administratively-mediated variables enabled a study design that incorporated variables at
multiple levels of influence (patient, hospital, trauma center, and geriatric-specific).
Dissemination of the study survey to CNOs in only 26 of 50 states was a
limitation. Since eighteen states did not provide identifiers for individual hospitals, it
was not possible to include data from all states in the HCUP NIS. Despite this limitation,
the distribution of returned surveys closely represented a na tionally-representative sample
(HCUP NIS) for multiple hospital and patient characteristics.
The small sample size (N=128) of hospitals was also a limitation of the study. For
variables with small sub-categories (i.e. geriatric acute care models), it was difficult to
establish clinically and statistically significant associations. The sample size also limited
the number of variables that could be used in multivariate data analysis. Despite the small
sample size, the survey mailing approach actually resulted in a favorable response rate
compared to similarly conducted health services research studies (Edwards, et al., 2009;
VanGeest, Johnson, & Welch, 2007). The methods designed to increase the number of
returned surveys (pre-survey postcard, 3 survey mailings, paper & web-based completion
options) were a strength of the study. While the response rate was relatively low,
125
considering the recipients were senior-level administrators, the response rate approaching
30% was expected and resulted in a representative distribution of hospitals.
A final limitation of the study was the absence of patient characteristics of
cognitive and functional impairment. Cognitive impairment and functional impairment
are strong predictors of worse outcomes in hospitalized older adults as a whole
(Bachmann, et al., 2010; Campbell, et al., 2004), yet these data are not available in
administrative data. The extent to which HIOAs are admitted to hospitals with cognitive
and functional impairment is unknown, yet may be significant factors in understanding
patient outcomes.
I mplica tions
Three primary implications can be drawn from this study. First, overall adoption
of ACOVE quality indicators targeted to cognition and functional status is low among
acute care hospitals, despite over a decade of work to promote adoption. Reasons for this
remain unclear, and ultimately, the relationship of indicator adoption and patient
outcomes must be established. Second, the study identified select areas of potent ial
salutary effects of national programs aimed at improving quality and safety. The
occurrence of three of the patient safety indicators (pressure ulcers, central line infections
postoperative hemorrhage) to be examined as outcome variables were found to be very
low in the study sample, suggesting that these are not a problem. Quality indicators
related to functional status had higher degrees of adoption, with one (discharge
assessment of level of independence and need for home health) having > 90% partial to
complete adoption among hospitals. Finally, this study provided more evidence
126
validating the occurrence of postoperative thromboembolism in older patients, yet failing
to identify mutable factors associated with lower occurrence. Perhaps this highlights the
need to reexamine the usefulness of this indicator as an outcome measure.
Secondary implications can also be drawn from this study. First, the study adds to
the literature that demonstrates the importance of information technology (IT) in the
adoption of quality indicators. Computer support for standardized checklists and decision
support of risk assessment were associated with adoption of the ACOVE indicators. The
availability of IT applications provides immediate access to information or decision
support and enables nurses to spend more time with patients and to focus on quality
(Menachemi, et al., 2008). This study strengthens understanding of how health IT can be
linked to improved care processes aimed at improving outcomes.
Although the AMVs included in this study were not associated with improved
outcomes, future studies using different AMVs might reveal associations. The current
study did contribute to the body of knowledge regarding the role that patient
characteristics play in patient outcomes. The study validates the contributions of injury
severity and comorbidities to worse outcomes, and it points to the need to better
understand the extent to which other patient characteristics (e.g., cognition and functional
status) contribute to patient outcomes. The findings from this study challenge
investigators to design studies that can detect the influence of organizational structures
and processes on patient outcomes in light of strong patient-specific influences.
A final implication concerns the role that trauma centers play in the care of
HIOAs. The extent to which trauma centers are utilizing indicators with their older
injured adults is unknown and was a limitation in this study. The unanticipated finding
127
that Level II trauma centers were lowest among all hospitals in adoption of all nine
ACOVE indicators raises unanswered questions. Further investigation is needed to
understand this phenomenon.
Re comme nda tions fo r Future Rese arch
Hospitalized injured older adults are a vulnerable and understudied population.
Research is needed that is directed at both understanding patient outcomes and improving
patient outcomes. Much work is needed from which a program of research can be built.
This dissertation research contributes to the body of knowledge and provides a
foundation for future work. This section presents recommendations for future research in
order of importance.
A first step for future research is to establish the extent to which variations in
cognitive impairment and functional impairment exist among hospitals providing care to
HIOAs. This is crucial for adequate risk adjustment in determining whether ACOVE
adoption improves outcomes. A pilot study to determine the feasibility of administering
functional and cognitive screening instruments to HIOAs after admission to the hospital
is currently in progress at two types of hospitals (non-trauma center & Level II trauma
center) in the PIs local community. The goal of the study is to identify and resolve
potential problems related to instrument administration in preparation for a subsequent
larger study.
The feasibility study described above will support the design of a prospective
multi-site study aimed at determining the extent of baseline pre-existing cognitive
impairment and functional impairment in HIOAs prior to the injury event at different
128
types of hospitals (level I TC, level II TC, non-TC). Although associations among
medical patients are documented in the literature, associations among the sub-population
of HIOAs have not been studied. As noted in Chapter I (Table 1.1, pg. 6), cognitive and
functional impairment are associated with worse outcomes in the broader population of
all hospitalized older adults. It is hypothesized that the extent of pre-existing impairment
is even greater in the sub-population of HIOAs. These two studies are essential to
subsequent work since outcomes research is dependent upon adequate risk adjustment for
analyzing outcomes. Failure to consider all potential risk factors such as pre-existing
cognitive and functional impairment can introduce bias and render erroneous results.
Concomitant with this work, the dissertation dataset provides additional
opportunities for secondary data analyses. Using the sample hospitals (N=128),
associations between AMVs and other patient outcomes (inpatient mortality, length of
stay, discharge disposition) can be examined to begin to understand whether AMVs
contribute to other outcomes. Using a larger sample of hospitals from the 2009 HCUP
NIS with hospital identifiers (N=465), the presence of AMVs from AHA Survey data and
the prior study can be examined. The larger sample can also be used to examine
associations between specific AMVs (e.g. geriatric resources and services, hospitalists,
intensivists) and outcomes (inpatient mortality, length of stay, discharge disposition).
Once a foundation is laid with the studies described above, the next step would be
to design a prospective study that examines the effects of an intervention on patient
outcomes. After a deeper understanding of patient characteristics is established, the
intervention study could be designed to examine effects within stratified groups based on
varying patient characteristics. For example, an intervention aimed at preventing delirium
129
could be used and patient outcomes (e.g., development of delirium, length of stay, cost)
could be examined by injury severity, cognitive impairment, and functional impairment.
An approach such as this would begin to establish the relat ive importance of specific
interventions in light of varying injury severity and preadmission factors such as
cognitive and functional status. It may also identify sub-populations of HIOAs that are
more apt to respond to ACOVE indicators.
Conclus ion
Aim One: Overall partial to complete adoption of nine ACOVE quality indicators
was 57% with a range of 24% to 91% for individual indicators. Examination of ACOVE
adoption by hospital characteristics revealed that the Northeast region and Level I trauma
centers had higher degrees of ACOVE adoption, and that Level II trauma centers had the
lowest degrees of ACOVE adoption. Adoption has remained poor despite efforts to raise
awareness. Aim Two: Examination of patient characteristics and AMVs revealed that
hospitals with a greater percentage of older HIOAs and females are associated with a lack
of resources. Patient characteristics were not associated with adoption of ACOVE
indicators. Associations between AMVs and adoption of ACOVE indicators revealed
statistically significant positive associations with computerized support and
comprehensive geriatric assessment. The presence of Alzheimer center services were
associated negatively with ACOVE adoption. Aim Three : After risk adjustment, the
strongest association with rates of deep vein thrombosis or pulmonary embolus in HIOAs
was with comorbidities.
130
These findings suggest that despite 10 years of efforts to adopt ACOVE indicators
in hospitals, much progress remains to be made. Before launching studies to further
increase adoption, the lack of associations of ACOVE adoption and patient outcomes
must be explained. Careful inclusion of risk adjustment for cognitive and functional
status may help to elucidate if there is, in fact, a relationship between ACOVE adoption
and outcomes. On a final note, this study validates other studies regarding the occurrence
of DVTs in older hospitalized patients. Postoperative thromboembolism must be
carefully reconsidered as a quality indicator.
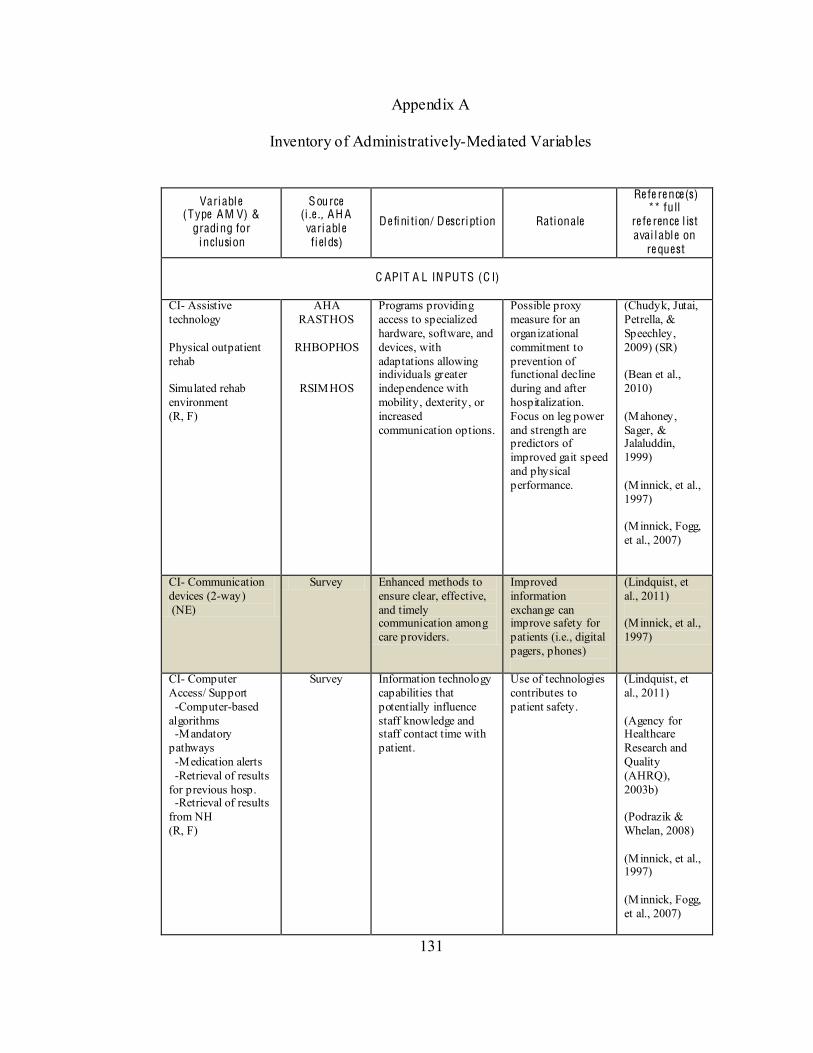
131
Appendix A
Inventory of Administratively-Mediated Variables
Variable (Type AM V) &
grading for inclusion
Source (i .e ., AH A variable fiel ds)
De fini tion/ Description Rationale
Re fe re nce(s) ** full
re fe rence l ist avai l able on
re quest
C APIT A L INPUTS (C I)
CI- Assistive technology Physical outpatient rehab Simulated rehab environment (R, F)
AHA RASTHOS
RHBOPHOS
RSIMHOS
Programs providing access to specialized hardware, software, and devices, with adaptations allowing individuals greater independence with mobility, dexterity, or increased communication options.
Possible proxy measure for an organizational commitment to prevention of functional decline during and after hospitalization. Focus on leg power and strength are predictors of improved gait speed and physical performance.
(Chudyk, Jutai, Petrella, & Speechley, 2009) (SR) (Bean et al., 2010) (Mahoney, Sager, & Jalaluddin, 1999) (Minnick, et al., 1997) (Minnick, Fogg, et al., 2007)
CI- Communication devices (2-way) (NE)
Survey Enhanced methods to ensure clear, effective, and timely communication among care providers.
Improved information exchange can improve safety for patients (i.e., digital pagers, phones)
(Lindquist, et al., 2011) (Minnick, et al., 1997)
CI- Computer Access/ Support -Computer-based algorithms -Mandatory pathways -Medication alerts -Retrieval of results for previous hosp. -Retrieval of results from NH (R, F)
Survey Information technology capabilities that potentially influence staff knowledge and staff contact time with patient.
Use of technologies contributes to patient safety.
(Lindquist, et al., 2011) (Agency for Healthcare Research and Quality (AHRQ), 2003b) (Podrazik & Whelan, 2008) (Minnick, et al., 1997) (Minnick, Fogg, et al., 2007)
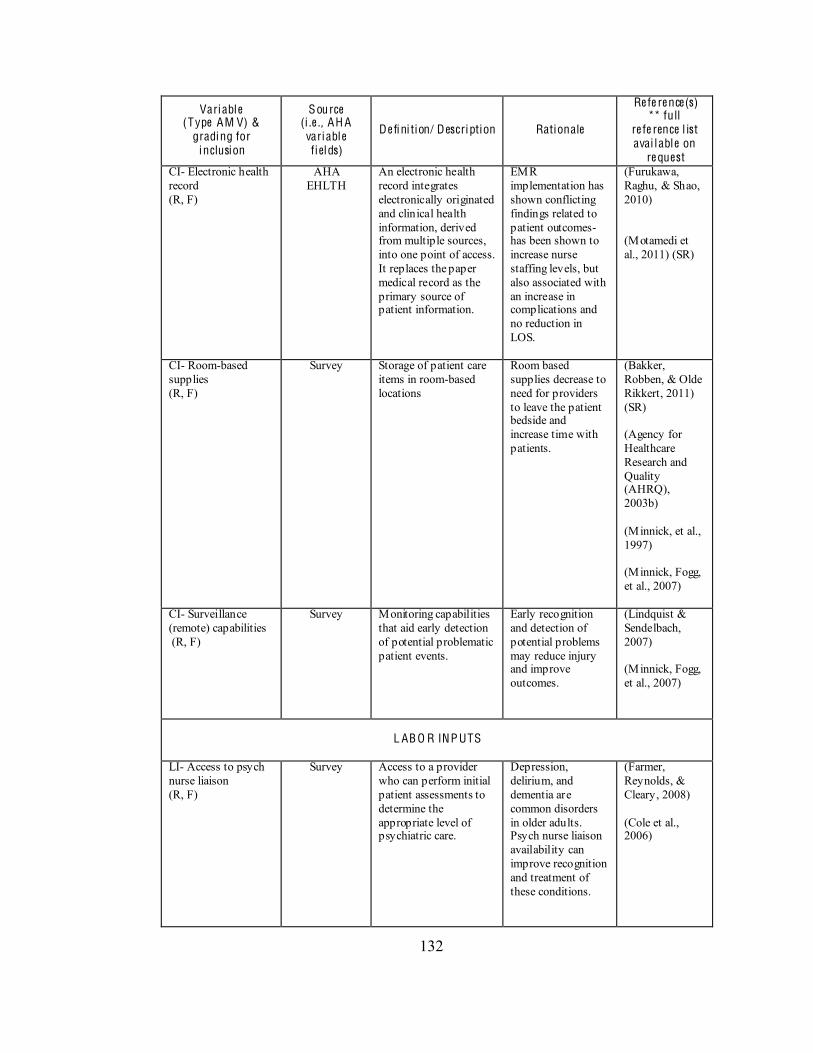
132
Variable (Type AM V) &
grading for inclusion
Source (i .e ., AH A variable fiel ds)
De fini tion/ Description Rationale
Re fe re nce(s) ** full
re fe rence l ist avai l able on
re quest CI- Electronic health record (R, F)
AHA EHLTH
An electronic health record integrates electronically originated and clinical health information, derived from multiple sources, into one point of access. It replaces the paper medical record as the primary source of patient information.
EMR implementation has shown conflicting findings related to patient outcomes- has been shown to increase nurse staffing levels, but also associated with an increase in complications and no reduction in LOS.
(Furukawa, Raghu, & Shao, 2010) (Motamedi et al., 2011) (SR)
CI- Room-based supplies (R, F)
Survey Storage of patient care items in room-based locations
Room based supplies decrease to need for providers to leave the patient bedside and increase time with patients.
(Bakker, Robben, & Olde Rikkert, 2011) (SR) (Agency for Healthcare Research and Quality (AHRQ), 2003b) (Minnick, et al., 1997) (Minnick, Fogg, et al., 2007)
CI- Surveillance (remote) capabilities (R, F)
Survey Monitoring capabilities that aid early detection of potential problematic patient events.
Early recognition and detection of potential problems may reduce injury and improve outcomes.
(Lindquist & Sendelbach, 2007) (Minnick, Fogg, et al., 2007)
L AB O R INP UTS
LI- Access to psych nurse liaison (R, F)
Survey Access to a provider who can perform initial patient assessments to determine the appropriate level of psychiatric care.
Depression, delirium, and dementia are common disorders in older adults. Psych nurse liaison availability can improve recognition and treatment of these conditions.
(Farmer, Reynolds, & Cleary, 2008) (Cole et al., 2006)
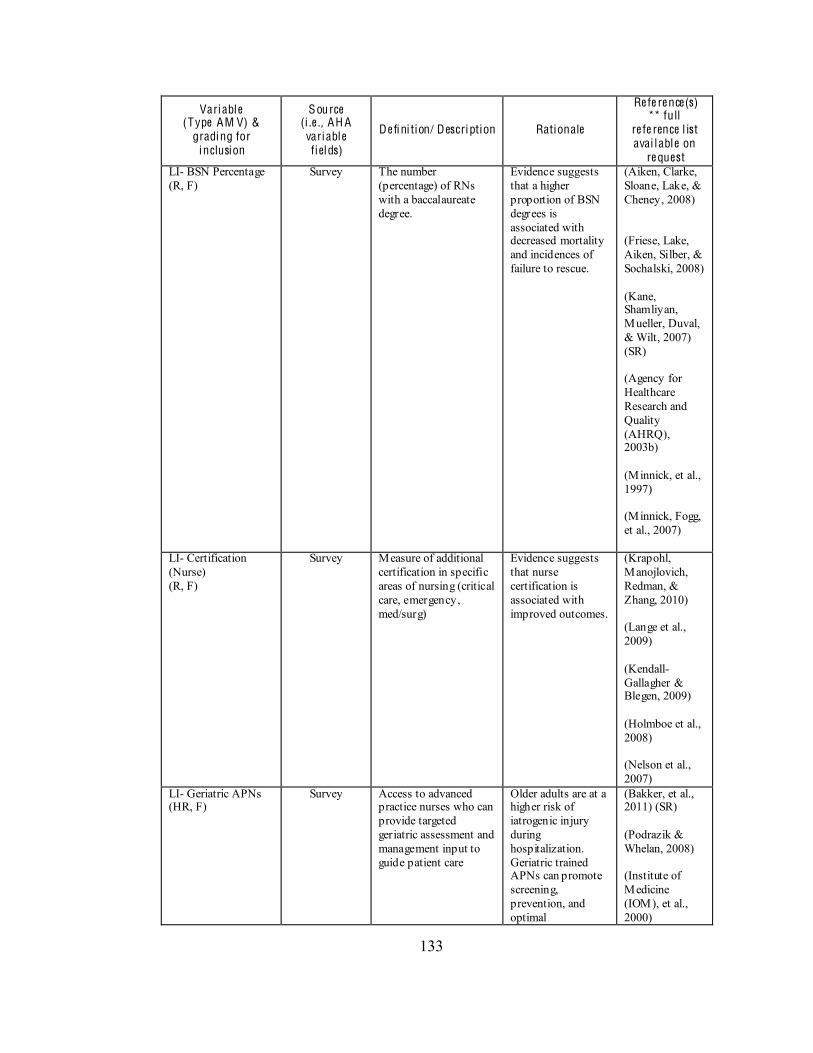
133
Variable (Type AM V) &
grading for inclusion
Source (i .e ., AH A variable fiel ds)
De fini tion/ Description Rationale
Re fe re nce(s) ** full
re fe rence l ist avai l able on
re quest LI- BSN Percentage (R, F)
Survey The number (percentage) of RNs with a baccalaureate degree.
Evidence suggests that a higher proportion of BSN degrees is associated with decreased mortality and incidences of failure to rescue.
(Aiken, Clarke, Sloane, Lake, & Cheney, 2008) (Friese, Lake, Aiken, Silber, & Sochalski, 2008) (Kane, Shamliyan, Mueller, Duval, & Wilt, 2007) (SR) (Agency for Healthcare Research and Quality (AHRQ), 2003b) (Minnick, et al., 1997) (Minnick, Fogg, et al., 2007)
LI- Certification (Nurse) (R, F)
Survey Measure of additional certification in specific areas of nursing (critical care, emergency, med/surg)
Evidence suggests that nurse certification is associated with improved outcomes.
(Krapohl, Manojlovich, Redman, & Zhang, 2010) (Lange et al., 2009) (Kendall-Gallagher & Blegen, 2009) (Holmboe et al., 2008) (Nelson et al., 2007)
LI- Geriatric APNs (HR, F)
Survey Access to advanced practice nurses who can provide targeted geriatric assessment and management input to guide patient care
Older adults are at a higher risk of iatrogenic injury during hospitalization. Geriatric trained APNs can promote screening, prevention, and optimal
(Bakker, et al., 2011) (SR) (Podrazik & Whelan, 2008) (Institute of Medicine (IOM), et al., 2000)
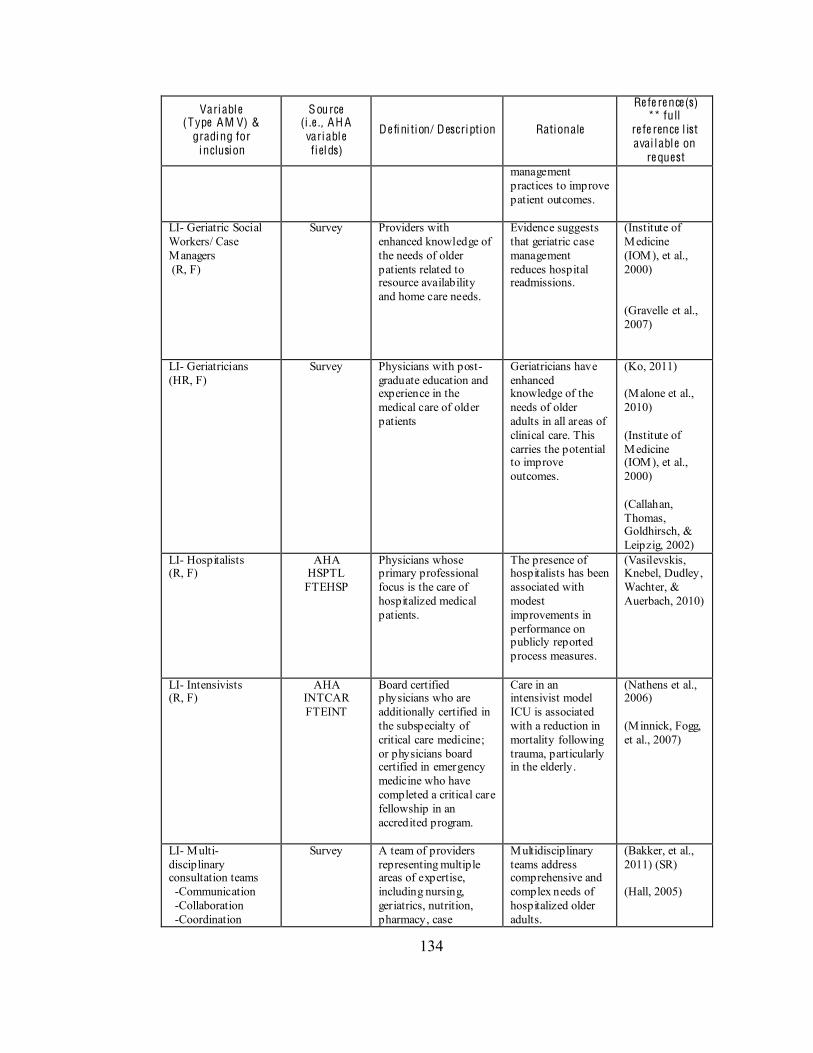
134
Variable (Type AM V) &
grading for inclusion
Source (i .e ., AH A variable fiel ds)
De fini tion/ Description Rationale
Re fe re nce(s) ** full
re fe rence l ist avai l able on
re quest management practices to improve patient outcomes.
LI- Geriatric Social Workers/ Case Managers (R, F)
Survey Providers with enhanced knowledge of the needs of older patients related to resource availability and home care needs.
Evidence suggests that geriatric case management reduces hospital readmissions.
(Institute of Medicine (IOM), et al., 2000) (Gravelle et al., 2007)
LI- Geriatricians (HR, F)
Survey Physicians with post-graduate education and experience in the medical care of older patients
Geriatricians have enhanced knowledge of the needs of older adults in all areas of clinical care. This carries the potential to improve outcomes.
(Ko, 2011) (Malone et al., 2010) (Institute of Medicine (IOM), et al., 2000) (Callahan, Thomas, Goldhirsch, & Leipzig, 2002)
LI- Hospitalists (R, F)
AHA HSPTL FTEHSP
Physicians whose primary professional focus is the care of hospitalized medical patients.
The presence of hospitalists has been associated with modest improvements in performance on publicly reported process measures.
(Vasilevskis, Knebel, Dudley, Wachter, & Auerbach, 2010)
LI- Intensivists (R, F)
AHA INTCAR FTEINT
Board certified physicians who are additionally certified in the subspecialty of critical care medicine; or physicians board certified in emergency medicine who have completed a critical care fellowship in an accredited program.
Care in an intensivist model ICU is associated with a reduction in mortality following trauma, particularly in the elderly.
(Nathens et al., 2006) (Minnick, Fogg, et al., 2007)
LI- Multi-disciplinary consultation teams -Communication -Collaboration -Coordination
Survey A team of providers representing multiple areas of expertise, including nursing, geriatrics, nutrition, pharmacy, case
Multidisciplinary teams address comprehensive and complex needs of hospitalized older adults.
(Bakker, et al., 2011) (SR) (Hall, 2005)
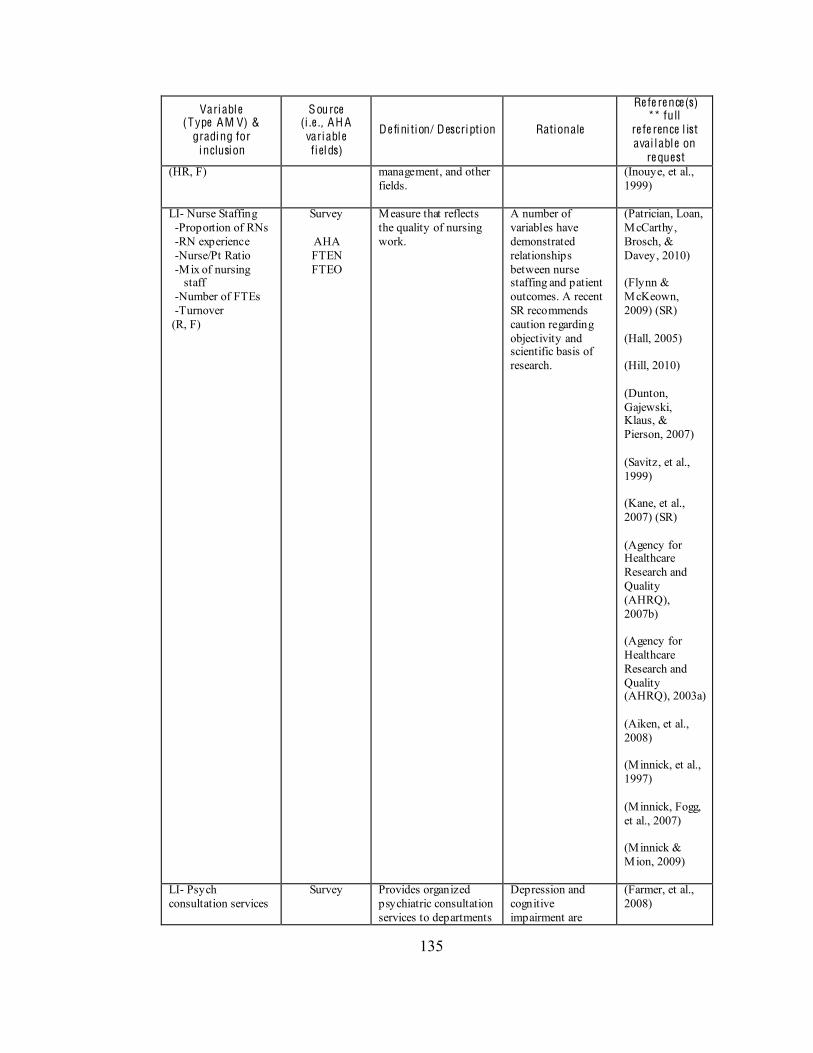
135
Variable (Type AM V) &
grading for inclusion
Source (i .e ., AH A variable fiel ds)
De fini tion/ Description Rationale
Re fe re nce(s) ** full
re fe rence l ist avai l able on
re quest (HR, F) management, and other
fields.
(Inouye, et al., 1999)
LI- Nurse Staffing -Proportion of RNs -RN experience -Nurse/Pt Ratio -Mix of nursing staff -Number of FTEs -Turnover (R, F)
Survey
AHA FTEN FTEO
Measure that reflects the quality of nursing work.
A number of variables have demonstrated relationships between nurse staffing and patient outcomes. A recent SR recommends caution regarding objectivity and scientific basis of research.
(Patrician, Loan, McCarthy, Brosch, & Davey, 2010) (Flynn & McKeown, 2009) (SR) (Hall, 2005) (Hill, 2010) (Dunton, Gajewski, Klaus, & Pierson, 2007) (Savitz, et al., 1999) (Kane, et al., 2007) (SR) (Agency for Healthcare Research and Quality (AHRQ), 2007b) (Agency for Healthcare Research and Quality (AHRQ), 2003a) (Aiken, et al., 2008) (Minnick, et al., 1997) (Minnick, Fogg, et al., 2007) (Minnick & Mion, 2009)
LI- Psych consultation services
Survey Provides organized psychiatric consultation services to departments
Depression and cognitive impairment are
(Farmer, et al., 2008)
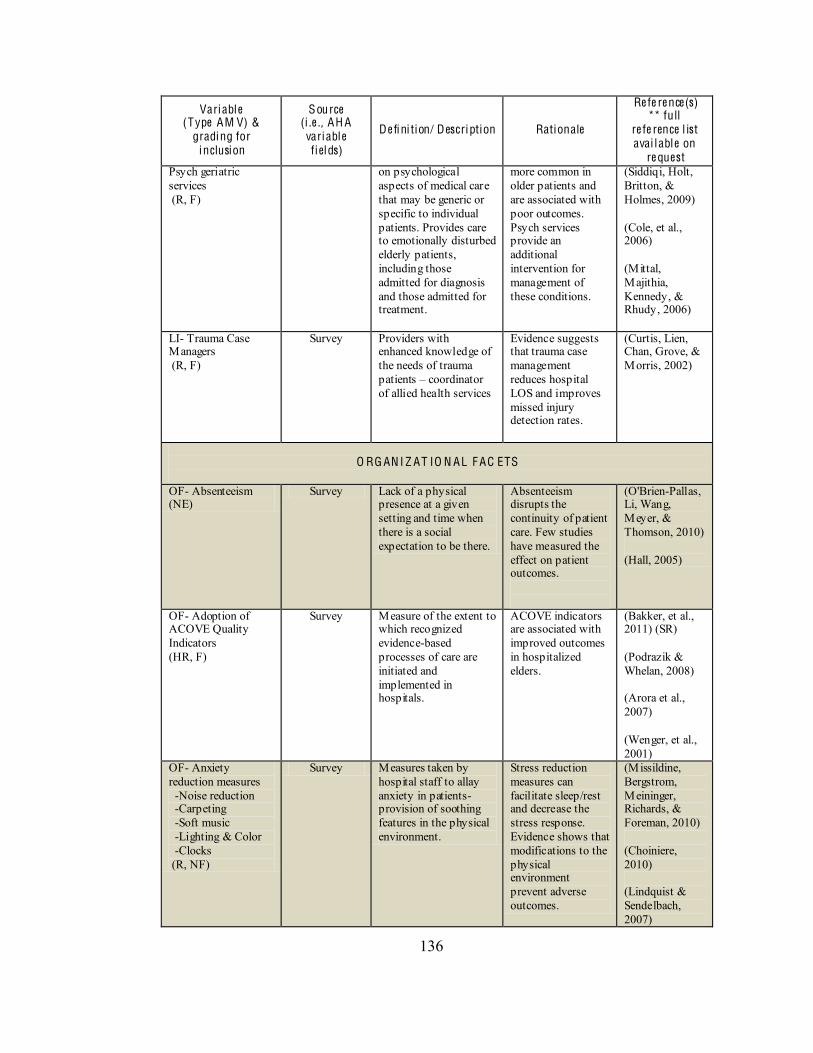
136
Variable (Type AM V) &
grading for inclusion
Source (i .e ., AH A variable fiel ds)
De fini tion/ Description Rationale
Re fe re nce(s) ** full
re fe rence l ist avai l able on
re quest Psych geriatric services (R, F)
on psychological aspects of medical care that may be generic or specific to individual patients. Provides care to emotionally disturbed elderly patients, including those admitted for diagnosis and those admitted for treatment.
more common in older patients and are associated with poor outcomes. Psych services provide an additional intervention for management of these conditions.
(Siddiqi, Holt, Britton, & Holmes, 2009) (Cole, et al., 2006) (Mittal, Majithia, Kennedy, & Rhudy, 2006)
LI- Trauma Case Managers (R, F)
Survey Providers with enhanced knowledge of the needs of trauma patients coordinator of allied health services
Evidence suggests that trauma case management reduces hospital LOS and improves missed injury detection rates.
(Curtis, Lien, Chan, Grove, & Morris, 2002)
O RG AN I Z AT IO N AL F AC ETS
OF- Absenteeism (NE)
Survey Lack of a physical presence at a given setting and time when there is a social expectation to be there.
Absenteeism disrupts the continuity of patient care. Few studies have measured the effect on patient outcomes.
(O'Brien-Pallas, Li, Wang, Meyer, & Thomson, 2010) (Hall, 2005)
OF- Adoption of ACOVE Quality Indicators (HR, F)
Survey Measure of the extent to which recognized evidence-based processes of care are initiated and implemented in hospitals.
ACOVE indicators are associated with improved outcomes in hospitalized elders.
(Bakker, et al., 2011) (SR) (Podrazik & Whelan, 2008) (Arora et al., 2007) (Wenger, et al., 2001)
OF- Anxiety reduction measures -Noise reduction -Carpeting -Soft music -Lighting & Color -Clocks (R, NF)
Survey Measures taken by hospital staff to allay anxiety in patients- provision of soothing features in the physical environment.
Stress reduction measures can facilitate sleep/rest and decrease the stress response. Evidence shows that modifications to the physical environment prevent adverse outcomes.
(Missildine, Bergstrom, Meininger, Richards, & Foreman, 2010) (Choiniere, 2010) (Lindquist & Sendelbach, 2007)
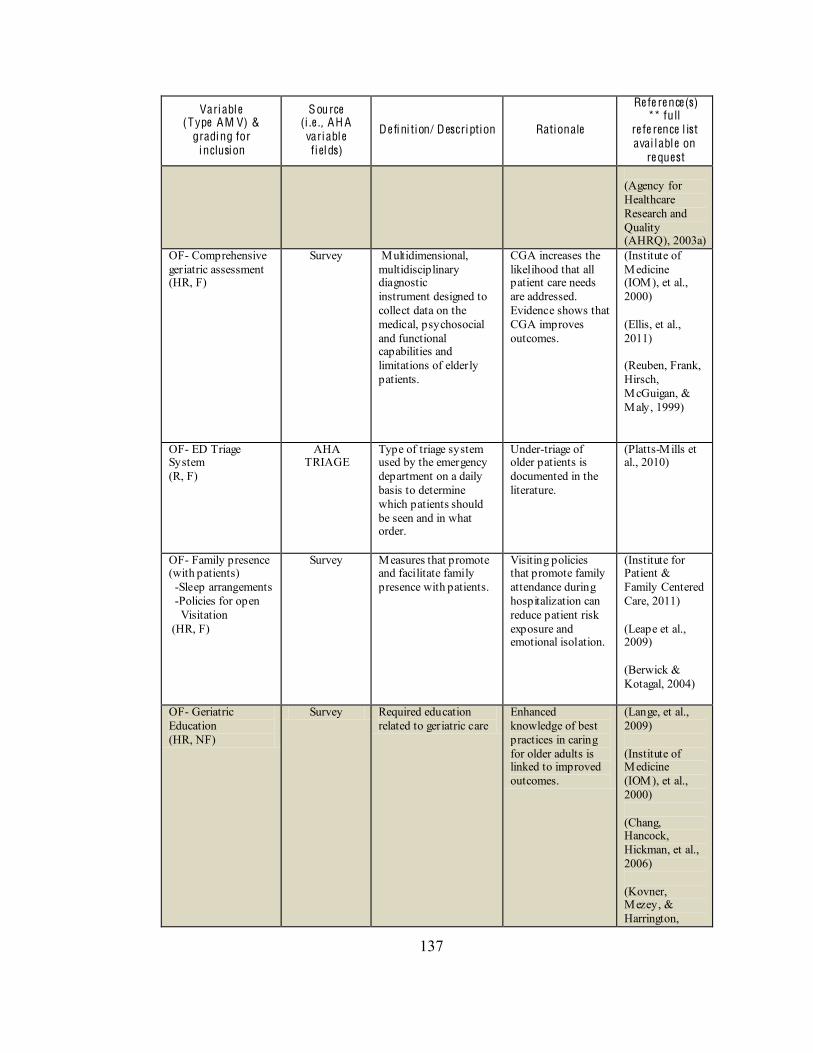
137
Variable (Type AM V) &
grading for inclusion
Source (i .e ., AH A variable fiel ds)
De fini tion/ Description Rationale
Re fe re nce(s) ** full
re fe rence l ist avai l able on
re quest (Agency for Healthcare Research and Quality (AHRQ), 2003a)
OF- Comprehensive geriatric assessment (HR, F)
Survey Multidimensional, multidisciplinary diagnostic instrument designed to collect data on the medical, psychosocial and functional capabilities and limitations of elderly patients.
CGA increases the likelihood that all patient care needs are addressed. Evidence shows that CGA improves outcomes.
(Institute of Medicine (IOM), et al., 2000) (Ellis, et al., 2011) (Reuben, Frank, Hirsch, McGuigan, & Maly, 1999)
OF- ED Triage System (R, F)
AHA TRIAGE
Type of triage system used by the emergency department on a daily basis to determine which patients should be seen and in what order.
Under-triage of older patients is documented in the literature.
(Platts-Mills et al., 2010)
OF- Family presence (with patients) -Sleep arrangements -Policies for open Visitation (HR, F)
Survey Measures that promote and facilitate family presence with patients.
Visiting policies that promote family attendance during hospitalization can reduce patient risk exposure and emotional isolation.
(Institute for Patient & Family Centered Care, 2011) (Leape et al., 2009) (Berwick & Kotagal, 2004)
OF- Geriatric Education (HR, NF)
Survey Required education related to geriatric care
Enhanced knowledge of best practices in caring for older adults is linked to improved outcomes.
(Lange, et al., 2009) (Institute of Medicine (IOM), et al., 2000) (Chang, Hancock, Hickman, et al., 2006) (Kovner, Mezey, & Harrington,
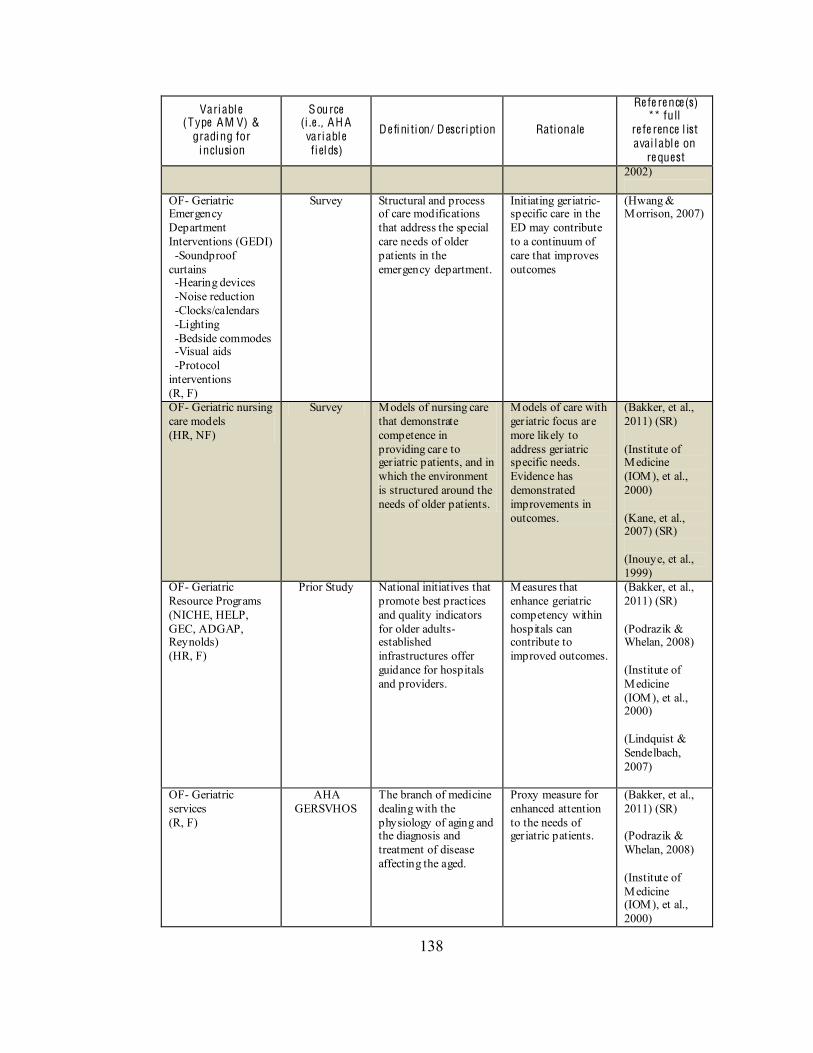
138
Variable (Type AM V) &
grading for inclusion
Source (i .e ., AH A variable fiel ds)
De fini tion/ Description Rationale
Re fe re nce(s) ** full
re fe rence l ist avai l able on
re quest 2002)
OF- Geriatric Emergency Department Interventions (GEDI) -Soundproof curtains -Hearing devices -Noise reduction -Clocks/calendars -Lighting -Bedside commodes -Visual aids -Protocol interventions (R, F)
Survey Structural and process of care modifications that address the special care needs of older patients in the emergency department.
Initiating geriatric-specific care in the ED may contribute to a continuum of care that improves outcomes
(Hwang & Morrison, 2007)
OF- Geriatric nursing care models (HR, NF)
Survey Models of nursing care that demonstrate competence in providing care to geriatric patients, and in which the environment is structured around the needs of older patients.
Models of care with geriatric focus are more likely to address geriatric specific needs. Evidence has demonstrated improvements in outcomes.
(Bakker, et al., 2011) (SR) (Institute of Medicine (IOM), et al., 2000) (Kane, et al., 2007) (SR) (Inouye, et al., 1999)
OF- Geriatric Resource Programs (NICHE, HELP, GEC, ADGAP, Reynolds) (HR, F)
Prior Study National initiatives that promote best practices and quality indicators for older adults- established infrastructures offer guidance for hospitals and providers.
Measures that enhance geriatric competency within hospitals can contribute to improved outcomes.
(Bakker, et al., 2011) (SR) (Podrazik & Whelan, 2008) (Institute of Medicine (IOM), et al., 2000) (Lindquist & Sendelbach, 2007)
OF- Geriatric services (R, F)
AHA GERSVHOS
The branch of medicine dealing with the physiology of aging and the diagnosis and treatment of disease affecting the aged.
Proxy measure for enhanced attention to the needs of geriatric patients.
(Bakker, et al., 2011) (SR) (Podrazik & Whelan, 2008) (Institute of Medicine (IOM), et al., 2000)
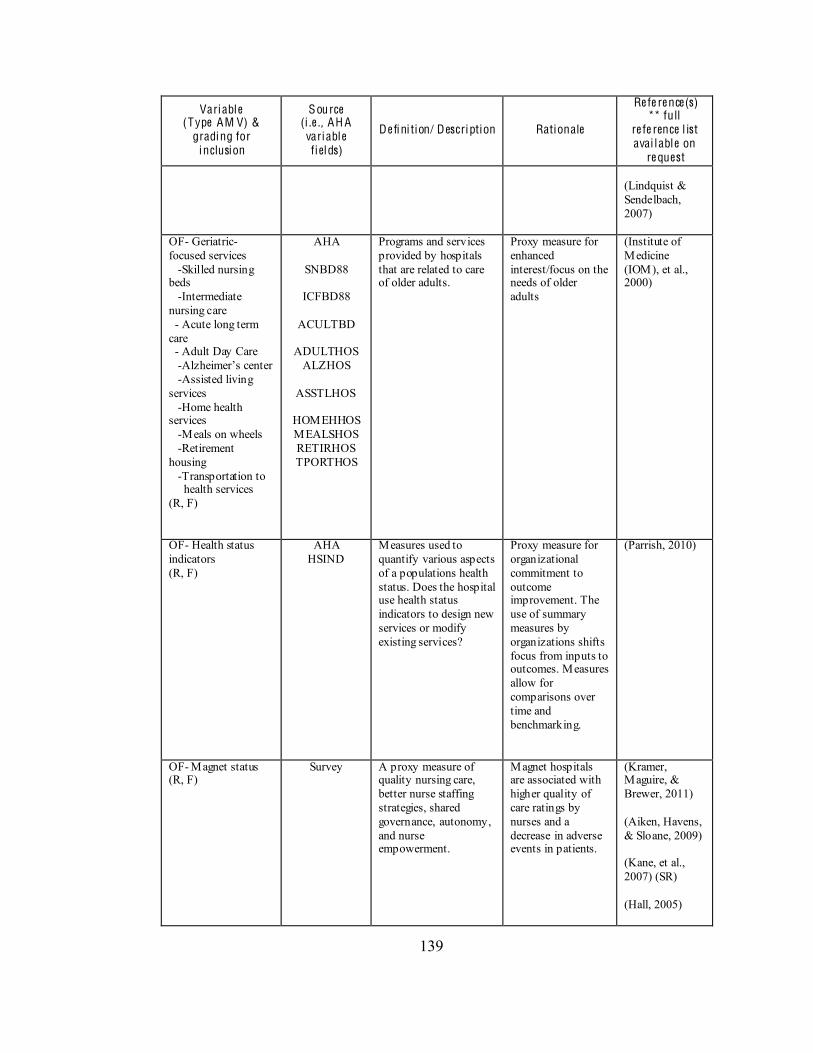
139
Variable (Type AM V) &
grading for inclusion
Source (i .e ., AH A variable fiel ds)
De fini tion/ Description Rationale
Re fe re nce(s) ** full
re fe rence l ist avai l able on
re quest (Lindquist & Sendelbach, 2007)
OF- Geriatric-focused services -Skilled nursing beds -Intermediate nursing care - Acute long term care - Adult Day Care - -Assisted living services -Home health services -Meals on wheels -Retirement housing -Transportation to health services (R, F)
AHA
SNBD88
ICFBD88
ACULTBD
ADULTHOS ALZHOS
ASSTLHOS
HOMEHHOS MEALSHOS RETIRHOS TPORTHOS
Programs and services provided by hospitals that are related to care of older adults.
Proxy measure for enhanced interest/focus on the needs of older adults
(Institute of Medicine (IOM), et al., 2000)
OF- Health status indicators (R, F)
AHA HSIND
Measures used to quantify various aspects of a populations health status. Does the hospital use health status indicators to design new services or modify existing services?
Proxy measure for organizational commitment to outcome improvement. The use of summary measures by organizations shifts focus from inputs to outcomes. Measures allow for comparisons over time and benchmarking.
(Parrish, 2010)
OF- Magnet status (R, F)
Survey A proxy measure of quality nursing care, better nurse staffing strategies, shared governance, autonomy, and nurse empowerment.
Magnet hospitals are associated with higher quality of care ratings by nurses and a decrease in adverse events in patients.
(Kramer, Maguire, & Brewer, 2011) (Aiken, Havens, & Sloane, 2009) (Kane, et al., 2007) (SR) (Hall, 2005)
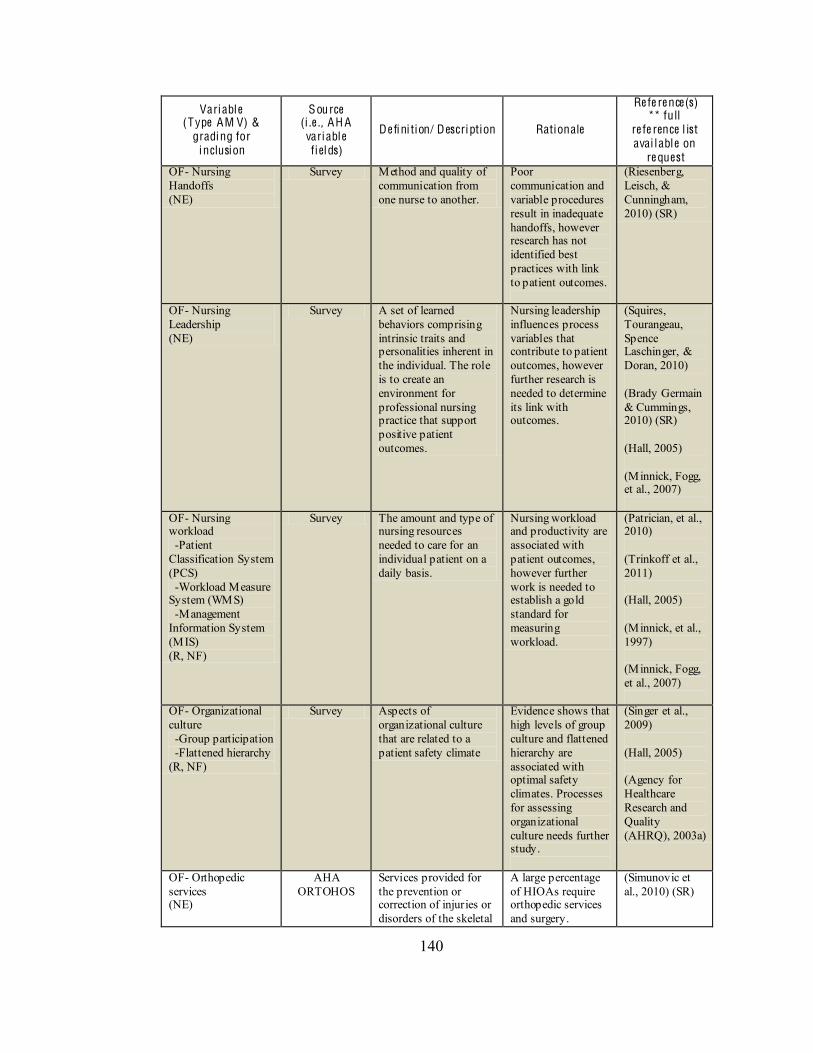
140
Variable (Type AM V) &
grading for inclusion
Source (i .e ., AH A variable fiel ds)
De fini tion/ Description Rationale
Re fe re nce(s) ** full
re fe rence l ist avai l able on
re quest OF- Nursing Handoffs (NE)
Survey Method and quality of communication from one nurse to another.
Poor communication and variable procedures result in inadequate handoffs, however research has not identified best practices with link to patient outcomes.
(Riesenberg, Leisch, & Cunningham, 2010) (SR)
OF- Nursing Leadership (NE)
Survey A set of learned behaviors comprising intrinsic traits and personalities inherent in the individual. The role is to create an environment for professional nursing practice that support positive patient outcomes.
Nursing leadership influences process variables that contribute to patient outcomes, however further research is needed to determine its link with outcomes.
(Squires, Tourangeau, Spence Laschinger, & Doran, 2010) (Brady Germain & Cummings, 2010) (SR) (Hall, 2005) (Minnick, Fogg, et al., 2007)
OF- Nursing workload -Patient Classification System (PCS) -Workload Measure System (WMS) -Management Information System (MIS) (R, NF)
Survey The amount and type of nursing resources needed to care for an individual patient on a daily basis.
Nursing workload and productivity are associated with patient outcomes, however further work is needed to establish a gold standard for measuring workload.
(Patrician, et al., 2010) (Trinkoff et al., 2011) (Hall, 2005) (Minnick, et al., 1997) (Minnick, Fogg, et al., 2007)
OF- Organizational culture -Group participation -Flattened hierarchy (R, NF)
Survey Aspects of organizational culture that are related to a patient safety climate
Evidence shows that high levels of group culture and flattened hierarchy are associated with optimal safety climates. Processes for assessing organizational culture needs further study.
(Singer et al., 2009) (Hall, 2005) (Agency for Healthcare Research and Quality (AHRQ), 2003a)
OF- Orthopedic services (NE)
AHA ORTOHOS
Services provided for the prevention or correction of injuries or disorders of the skeletal
A large percentage of HIOAs require orthopedic services and surgery.
(Simunovic et al., 2010) (SR)
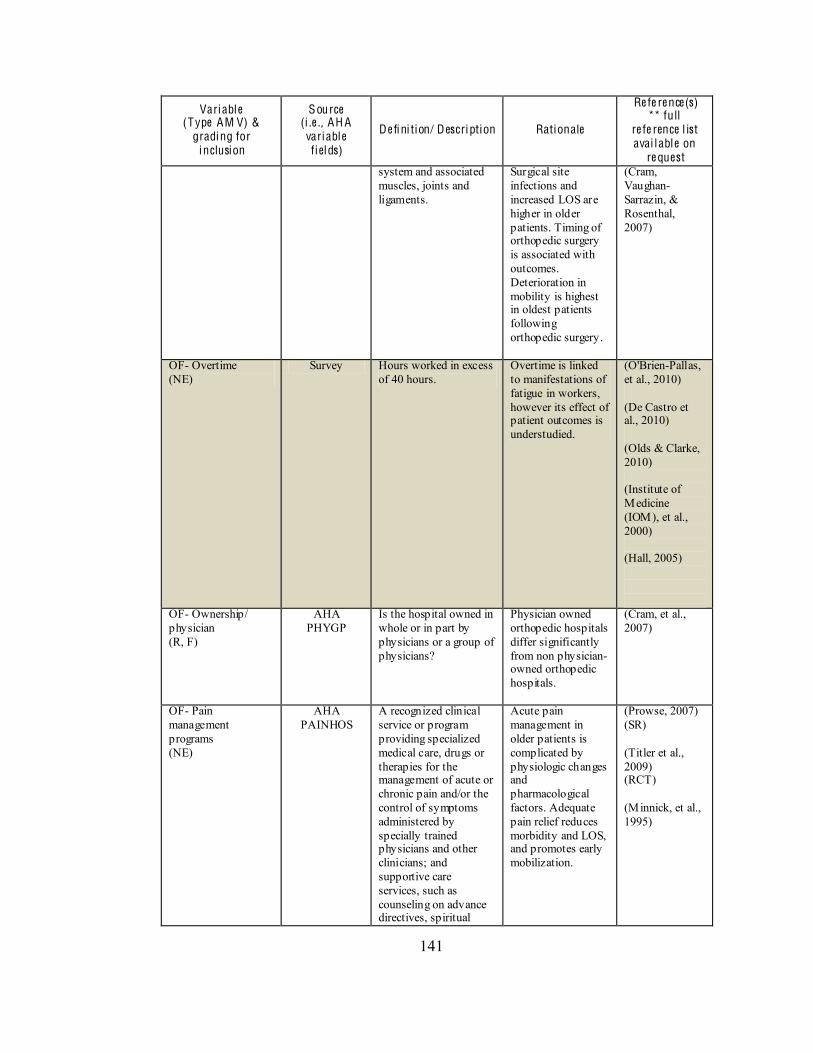
141
Variable (Type AM V) &
grading for inclusion
Source (i .e ., AH A variable fiel ds)
De fini tion/ Description Rationale
Re fe re nce(s) ** full
re fe rence l ist avai l able on
re quest system and associated muscles, joints and ligaments.
Surgical site infections and increased LOS are higher in older patients. Timing of orthopedic surgery is associated with outcomes. Deterioration in mobility is highest in oldest patients following orthopedic surgery.
(Cram, Vaughan-Sarrazin, & Rosenthal, 2007)
OF- Overtime (NE)
Survey Hours worked in excess of 40 hours.
Overtime is linked to manifestations of fatigue in workers, however its effect of patient outcomes is understudied.
(O'Brien-Pallas, et al., 2010) (De Castro et al., 2010) (Olds & Clarke, 2010) (Institute of Medicine (IOM), et al., 2000) (Hall, 2005)
OF- Ownership/ physician (R, F)
AHA PHYGP
Is the hospital owned in whole or in part by physicians or a group of physicians?
Physician owned orthopedic hospitals differ significantly from non physician-owned orthopedic hospitals.
(Cram, et al., 2007)
OF- Pain management programs (NE)
AHA PAINHOS
A recognized clinical service or program providing specialized medical care, drugs or therapies for the management of acute or chronic pain and/or the control of symptoms administered by specially trained physicians and other clinicians; and supportive care services, such as counseling on advance directives, spiritual
Acute pain management in older patients is complicated by physiologic changes and pharmacological factors. Adequate pain relief reduces morbidity and LOS, and promotes early mobilization.
(Prowse, 2007) (SR) (Titler et al., 2009) (RCT) (Minnick, et al., 1995)
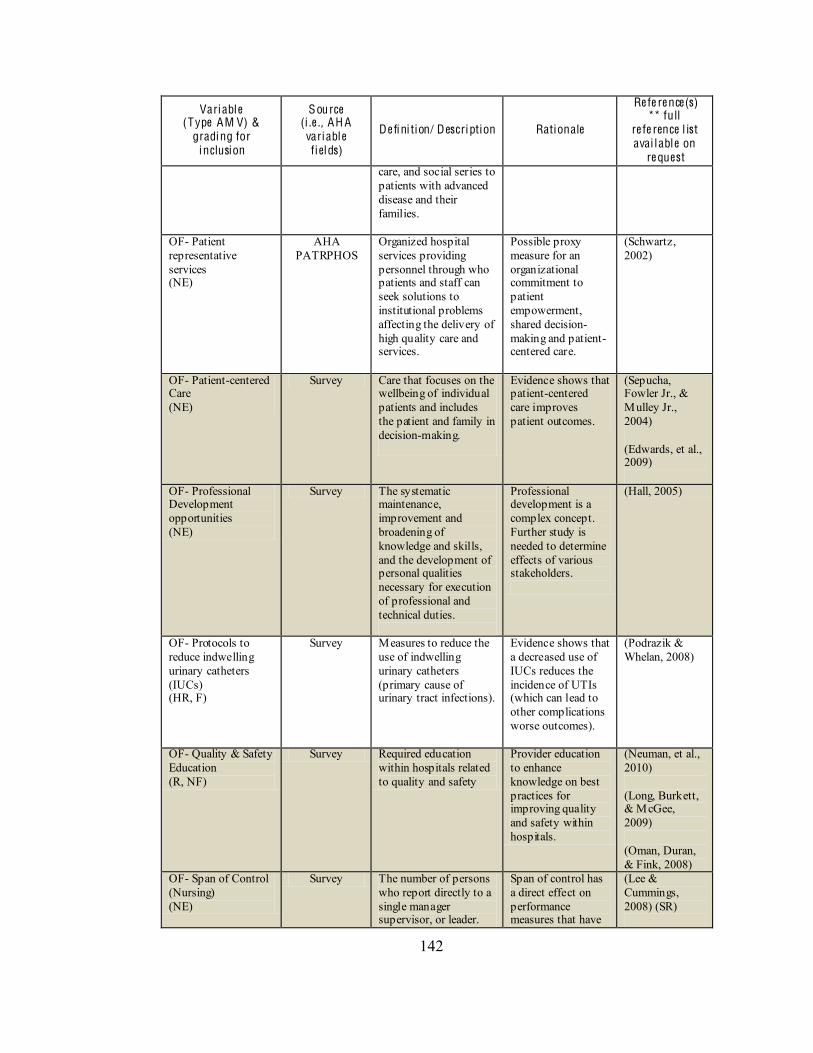
142
Variable (Type AM V) &
grading for inclusion
Source (i .e ., AH A variable fiel ds)
De fini tion/ Description Rationale
Re fe re nce(s) ** full
re fe rence l ist avai l able on
re quest care, and social series to patients with advanced disease and their families.
OF- Patient representative services (NE)
AHA PATRPHOS
Organized hospital services providing personnel through who patients and staff can seek solutions to institutional problems affecting the delivery of high quality care and services.
Possible proxy measure for an organizational commitment to patient empowerment, shared decision-making and patient-centered care.
(Schwartz, 2002)
OF- Patient-centered Care (NE)
Survey Care that focuses on the wellbeing of individual patients and includes the patient and family in decision-making.
Evidence shows that patient-centered care improves patient outcomes.
(Sepucha, Fowler Jr., & Mulley Jr., 2004) (Edwards, et al., 2009)
OF- Professional Development opportunities (NE)
Survey The systematic maintenance, improvement and broadening of knowledge and skills, and the development of personal qualities necessary for execution of professional and technical duties.
Professional development is a complex concept. Further study is needed to determine effects of various stakeholders.
(Hall, 2005)
OF- Protocols to reduce indwelling urinary catheters (IUCs) (HR, F)
Survey Measures to reduce the use of indwelling urinary catheters (primary cause of urinary tract infections).
Evidence shows that a decreased use of IUCs reduces the incidence of UTIs (which can lead to other complications worse outcomes).
(Podrazik & Whelan, 2008)
OF- Quality & Safety Education (R, NF)
Survey Required education within hospitals related to quality and safety
Provider education to enhance knowledge on best practices for improving quality and safety within hospitals.
(Neuman, et al., 2010) (Long, Burkett, & McGee, 2009) (Oman, Duran, & Fink, 2008)
OF- Span of Control (Nursing) (NE)
Survey The number of persons who report directly to a single manager supervisor, or leader.
Span of control has a direct effect on performance measures that have
(Lee & Cummings, 2008) (SR)
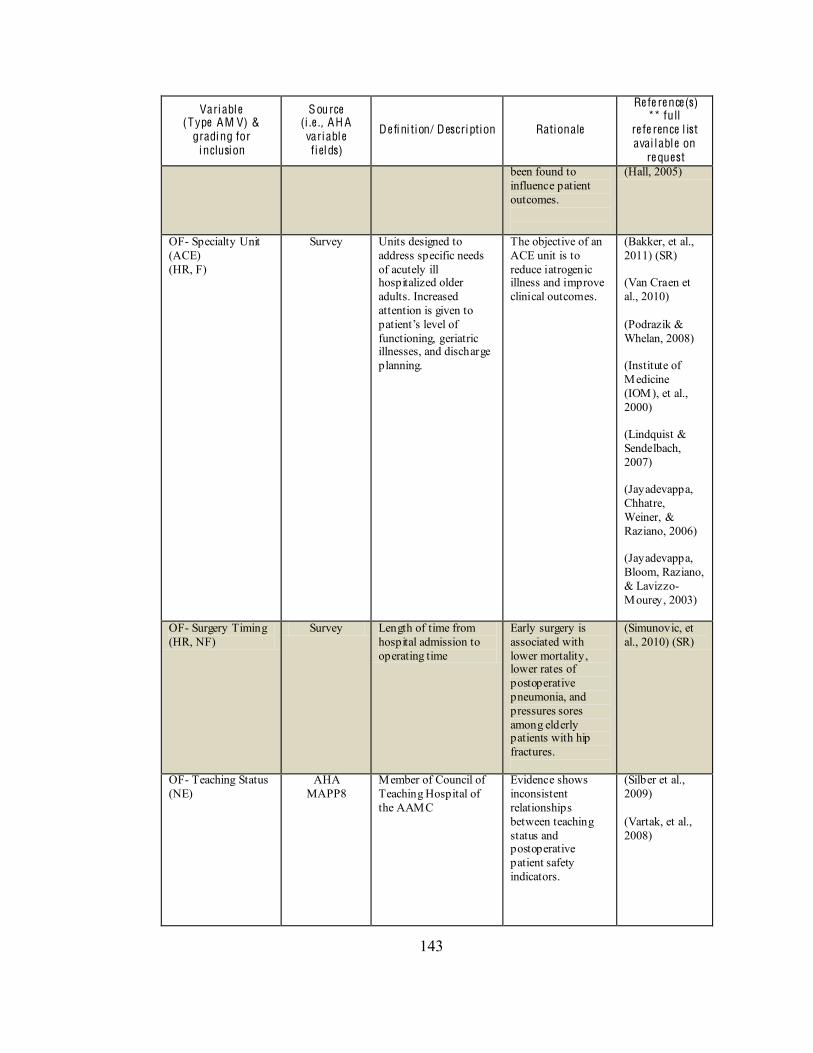
143
Variable (Type AM V) &
grading for inclusion
Source (i .e ., AH A variable fiel ds)
De fini tion/ Description Rationale
Re fe re nce(s) ** full
re fe rence l ist avai l able on
re quest been found to influence patient outcomes.
(Hall, 2005)
OF- Specialty Unit (ACE) (HR, F)
Survey Units designed to address specific needs of acutely ill hospitalized older adults. Increased attention is given to
functioning, geriatric illnesses, and discharge planning.
The objective of an ACE unit is to reduce iatrogenic illness and improve clinical outcomes.
(Bakker, et al., 2011) (SR) (Van Craen et al., 2010) (Podrazik & Whelan, 2008) (Institute of Medicine (IOM), et al., 2000) (Lindquist & Sendelbach, 2007) (Jayadevappa, Chhatre, Weiner, & Raziano, 2006) (Jayadevappa, Bloom, Raziano, & Lavizzo-Mourey, 2003)
OF- Surgery Timing (HR, NF)
Survey Length of time from hospital admission to operating time
Early surgery is associated with lower mortality, lower rates of postoperative pneumonia, and pressures sores among elderly patients with hip fractures.
(Simunovic, et al., 2010) (SR)
OF- Teaching Status (NE)
AHA MAPP8
Member of Council of Teaching Hospital of the AAMC
Evidence shows inconsistent relationships between teaching status and postoperative patient safety indicators.
(Silber et al., 2009) (Vartak, et al., 2008)
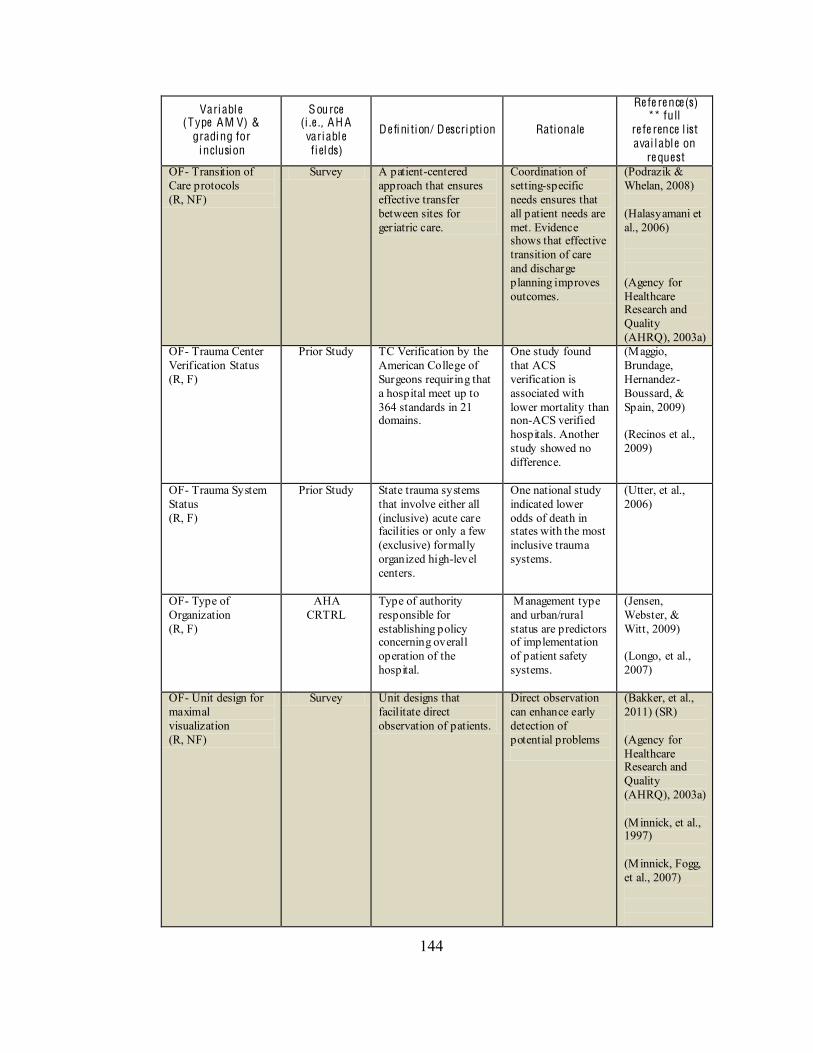
144
Variable (Type AM V) &
grading for inclusion
Source (i .e ., AH A variable fiel ds)
De fini tion/ Description Rationale
Re fe re nce(s) ** full
re fe rence l ist avai l able on
re quest OF- Transition of Care protocols (R, NF)
Survey A patient-centered approach that ensures effective transfer between sites for geriatric care.
Coordination of setting-specific needs ensures that all patient needs are met. Evidence shows that effective transition of care and discharge planning improves outcomes.
(Podrazik & Whelan, 2008) (Halasyamani et al., 2006) (Agency for Healthcare Research and Quality (AHRQ), 2003a)
OF- Trauma Center Verification Status (R, F)
Prior Study TC Verification by the American College of Surgeons requiring that a hospital meet up to 364 standards in 21 domains.
One study found that ACS verification is associated with lower mortality than non-ACS verified hospitals. Another study showed no difference.
(Maggio, Brundage, Hernandez-Boussard, & Spain, 2009) (Recinos et al., 2009)
OF- Trauma System Status (R, F)
Prior Study State trauma systems that involve either all (inclusive) acute care facilities or only a few (exclusive) formally organized high-level centers.
One national study indicated lower odds of death in states with the most inclusive trauma systems.
(Utter, et al., 2006)
OF- Type of Organization (R, F)
AHA CRTRL
Type of authority responsible for establishing policy concerning overall operation of the hospital.
Management type and urban/rural status are predictors of implementation of patient safety systems.
(Jensen, Webster, & Witt, 2009) (Longo, et al., 2007)
OF- Unit design for maximal visualization (R, NF)
Survey Unit designs that facilitate direct observation of patients.
Direct observation can enhance early detection of potential problems
(Bakker, et al., 2011) (SR) (Agency for Healthcare Research and Quality (AHRQ), 2003a) (Minnick, et al., 1997) (Minnick, Fogg, et al., 2007)
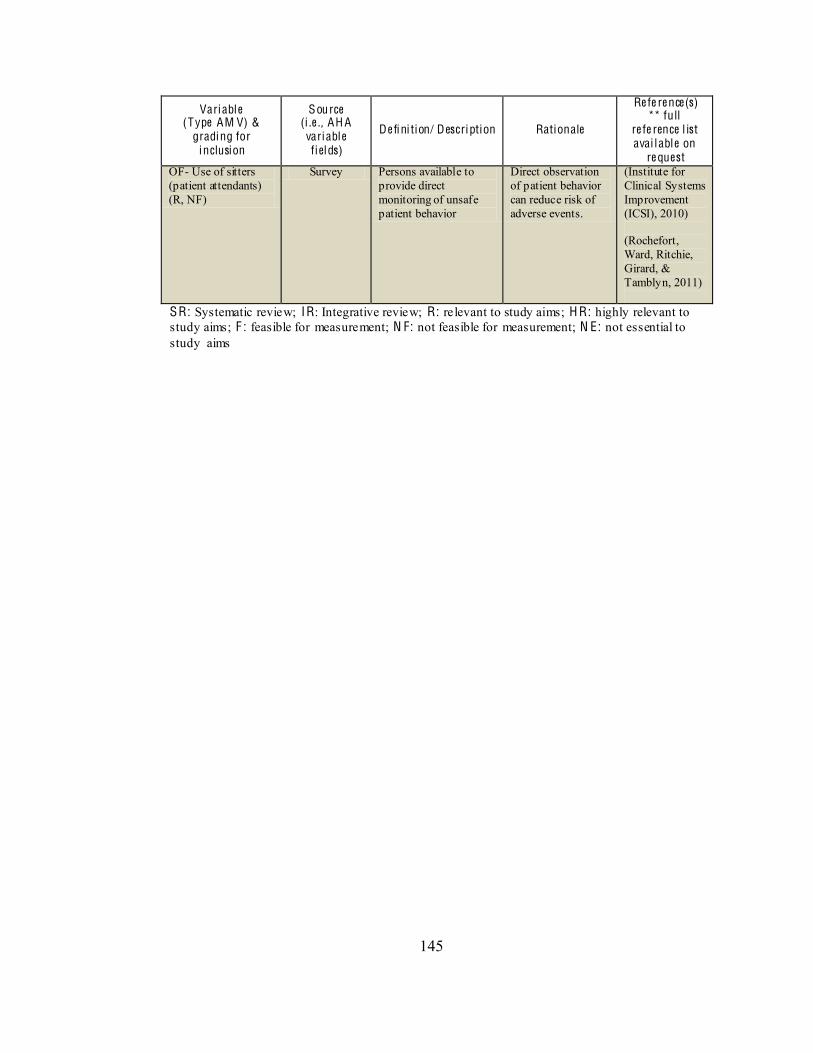
145
Variable (Type AM V) &
grading for inclusion
Source (i .e ., AH A variable fiel ds)
De fini tion/ Description Rationale
Re fe re nce(s) ** full
re fe rence l ist avai l able on
re quest OF- Use of sitters (patient attendants) (R, NF)
Survey Persons available to provide direct monitoring of unsafe patient behavior
Direct observation of patient behavior can reduce risk of adverse events.
(Institute for Clinical Systems Improvement (ICSI), 2010) (Rochefort, Ward, Ritchie, Girard, & Tamblyn, 2011)
SR: Systematic review; IR: Integrative review; R: relevant to study aims; H R: highly relevant to study aims; F : feasible for measurement; N F: not feasible for measurement; N E: not essential to study aims
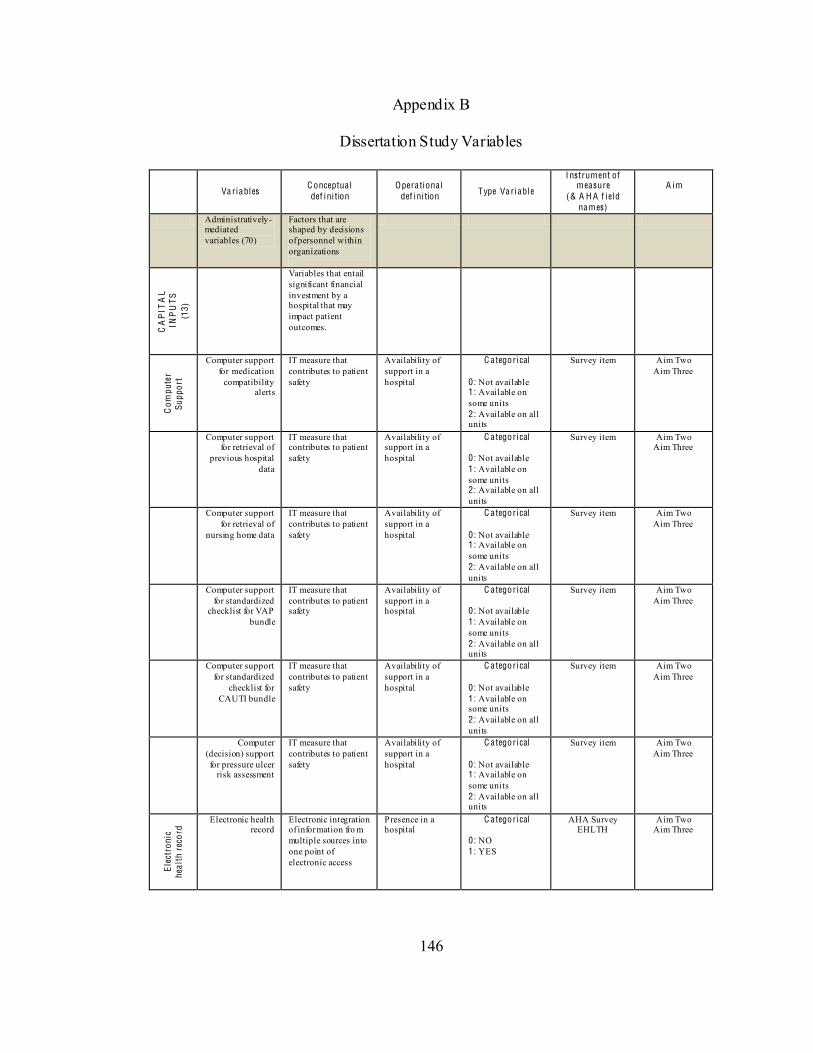
146
Appendix B
Dissertation Study Variables
Va riables C onceptua l def ini tion
Opera tiona l def ini tion Type Va riable
I nstrument of measure
(& A H A f iel d names)
A im
Administratively-mediated variables (70)
Factors that are shaped by decisions of personnel within organizations
CA
PIT
AL
INP
UTS
(1
3)
Variables that entail significant financial investment by a hospital that may impact patient outcomes.
Com
pute
r Su
ppor
t
Computer support for medication
compatibility alerts
IT measure that contributes to patient safety
Availability of support in a hospital
C ategorical
0: Not available 1: Available on some units 2: Available on all units
Survey item Aim Two Aim Three
Computer support for retrieval of
previous hospital data
IT measure that contributes to patient safety
Availability of support in a hospital
C ategorical
0: Not available 1: Available on some units 2: Available on all units
Survey item Aim Two Aim Three
Computer support for retrieval of
nursing home data
IT measure that contributes to patient safety
Availability of support in a hospital
C ategorical
0: Not available 1: Available on some units 2: Available on all units
Survey item Aim Two Aim Three
Computer support for standardized
checklist for VAP bundle
IT measure that contributes to patient safety
Availability of support in a hospital
C ategorical
0: Not available 1: Available on some units 2: Available on all units
Survey item Aim Two Aim Three
Computer support for standardized
checklist for CAUTI bundle
IT measure that contributes to patient safety
Availability of support in a hospital
C ategorical
0: Not available 1: Available on some units 2: Available on all units
Survey item Aim Two Aim Three
Computer (decision) support for pressure ulcer
risk assessment
IT measure that contributes to patient safety
Availability of support in a hospital
C ategorical
0: Not available 1: Available on some units 2: Available on all units
Survey item Aim Two Aim Three
Elec
tron
ic
heal
th r
ecor
d Electronic health
record Electronic integration of information fro m multiple sources into one point of electronic access
Presence in a hospital
C ategorical
0: NO 1: YES
AHA Survey EHLTH
Aim Two Aim Three
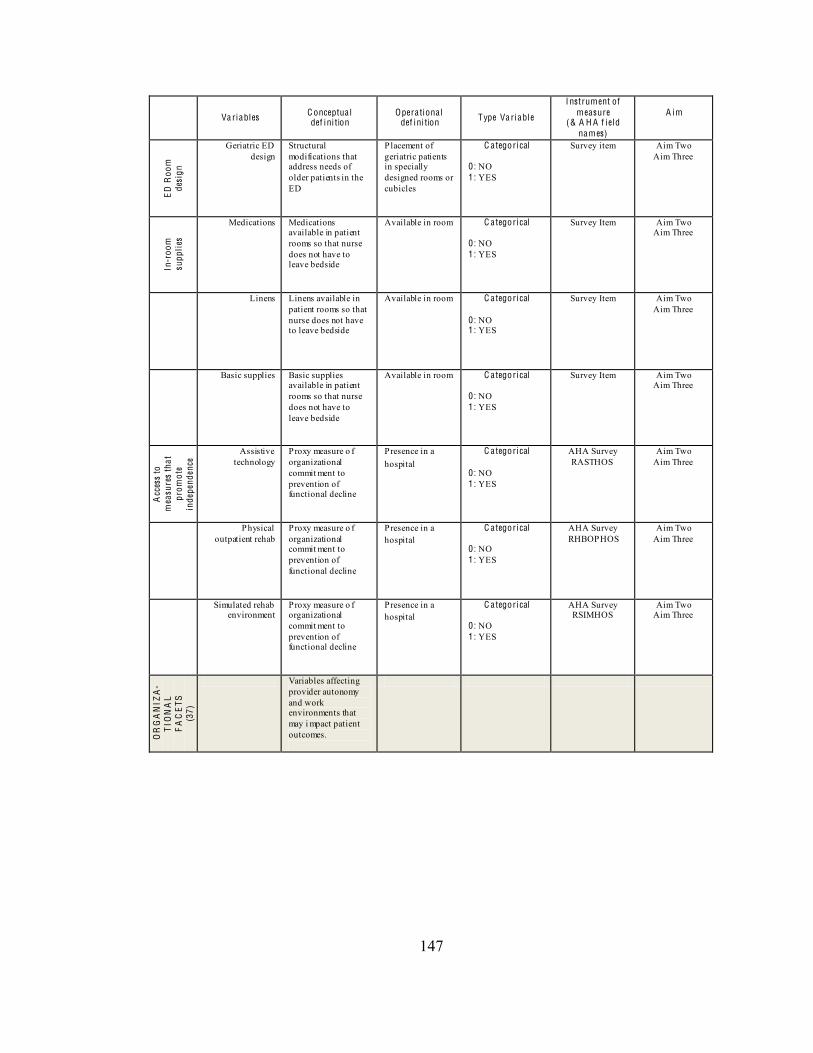
147
Va riables C onceptua l def ini tion
Opera tiona l def ini tion Type Va riable
I nstrument of measure
(& A H A f iel d names)
A im
ED
Roo
m
desi
gn
Geriatric ED design
Structural modifications that address needs of older patients in the ED
Placement of geriatric patients in specially designed rooms or cubicles
C ategorical 0: NO 1: YES
Survey item Aim Two Aim Three
In
-roo
m
supp
lies
Medications Medications available in patient rooms so that nurse does not have to leave bedside
Available in room C ategorical
0: NO 1: YES
Survey Item Aim Two Aim Three
Linens Linens available in patient rooms so that nurse does not have to leave bedside
Available in room C ategorical
0: NO 1: YES
Survey Item Aim Two Aim Three
Basic supplies Basic supplies available in patient rooms so that nurse does not have to leave bedside
Available in room C ategorical
0: NO 1: YES
Survey Item Aim Two Aim Three
Acc
ess
to
mea
sure
s th
at
prom
ote
inde
pend
ence
Assistive technology
Proxy measure o f organizational commit ment to prevention of functional decline
Presence in a hospital
C ategorical
0: NO 1: YES
AHA Survey RASTHOS
Aim Two Aim Three
Physical outpatient rehab
Proxy measure o f organizational commit ment to prevention of functional decline
Presence in a hospital
C ategorical
0: NO 1: YES
AHA Survey RHBOPHOS
Aim Two Aim Three
Simulated rehab environment
Proxy measure o f organizational commit ment to prevention of functional decline
Presence in a hospital
C ategorical
0: NO 1: YES
AHA Survey RSIMHOS
Aim Two Aim Three
OR
GA
NIZ
A-
TIO
NA
L F
AC
ETS
(3
7)
Variables affecting provider autonomy and work environments that may i mpact patient outcomes.
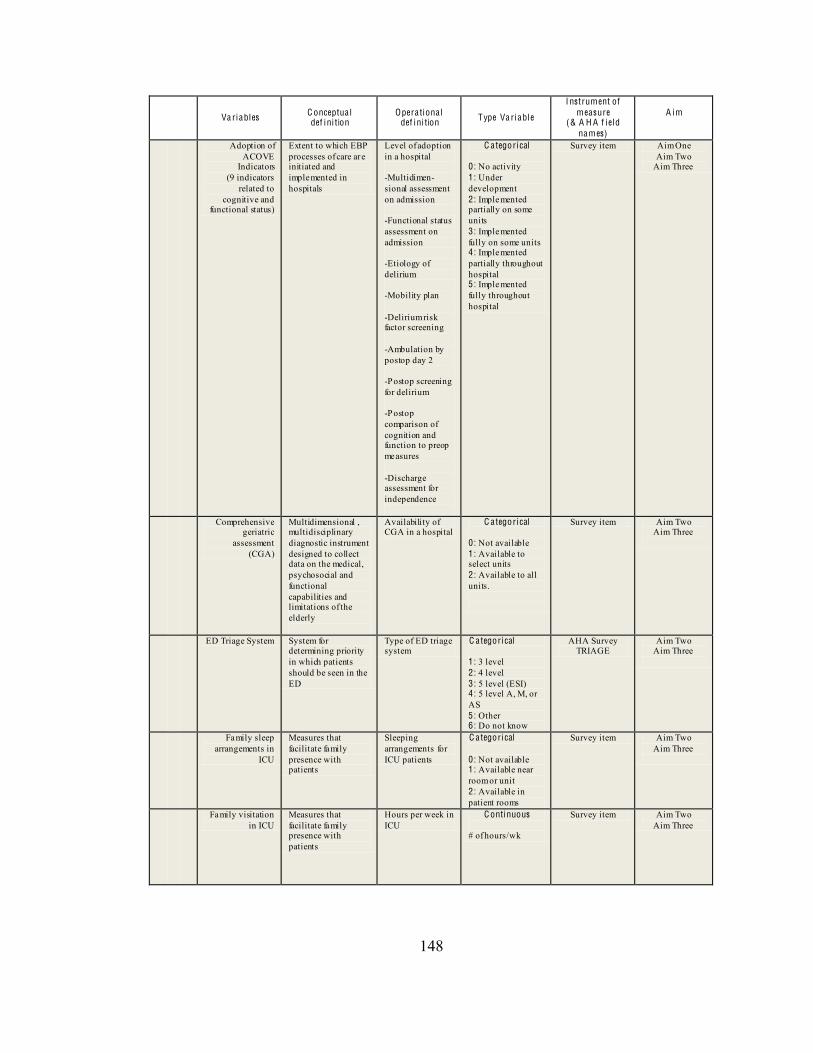
148
Va riables C onceptua l def ini tion
Opera tiona l def ini tion Type Va riable
I nstrument of measure
(& A H A f iel d names)
A im
Adoption of ACOVE
Indicators (9 indicators
related to cognitive and
functional status)
Extent to which EBP processes of care are initiated and implemented in hospitals
Level of adoption in a hospital -Multidimen-sional assessment on admission -Functional status assessment on admission -Etiology of delirium -Mobility plan -Delirium risk factor screening -Ambulation by postop day 2 -Postop screening for delirium -Postop comparison of cognition and function to preop measures -Discharge assessment for independence
C ategorical
0: No activity 1: Under development 2: Implemented partially on some units 3: Implemented fully on some units 4: Implemented partially throughout hospital 5: Implemented fully throughout hospital
Survey item Aim One Aim Two
Aim Three
Comprehensive geriatric
assessment (CGA)
Multidimensional , multidisciplinary diagnostic instrument designed to collect data on the medical, psychosocial and functional capabilities and limitations of the elderly
Availability of CGA in a hospital
C ategorical 0: Not available 1: Available to select units 2: Available to all units.
Survey item Aim Two Aim Three
ED Triage System System for determining priority in which patients should be seen in the ED
Type of ED triage system
C ategorical 1 : 3 level 2: 4 level 3: 5 level (ESI) 4: 5 level A, M, or AS 5: Other 6: Do not know
AHA Survey TRIAGE
Aim Two Aim Three
Family sleep arrangements in
ICU
Measures that facilitate family presence with patients
Sleeping arrangements for ICU patients
C ategorical 0 : Not available 1: Available near room or unit 2: Available in patient rooms
Survey item Aim Two Aim Three
Family visitation in ICU
Measures that facilitate family presence with patients
Hours per week in ICU
C ontinuous # of hours/wk
Survey item Aim Two Aim Three
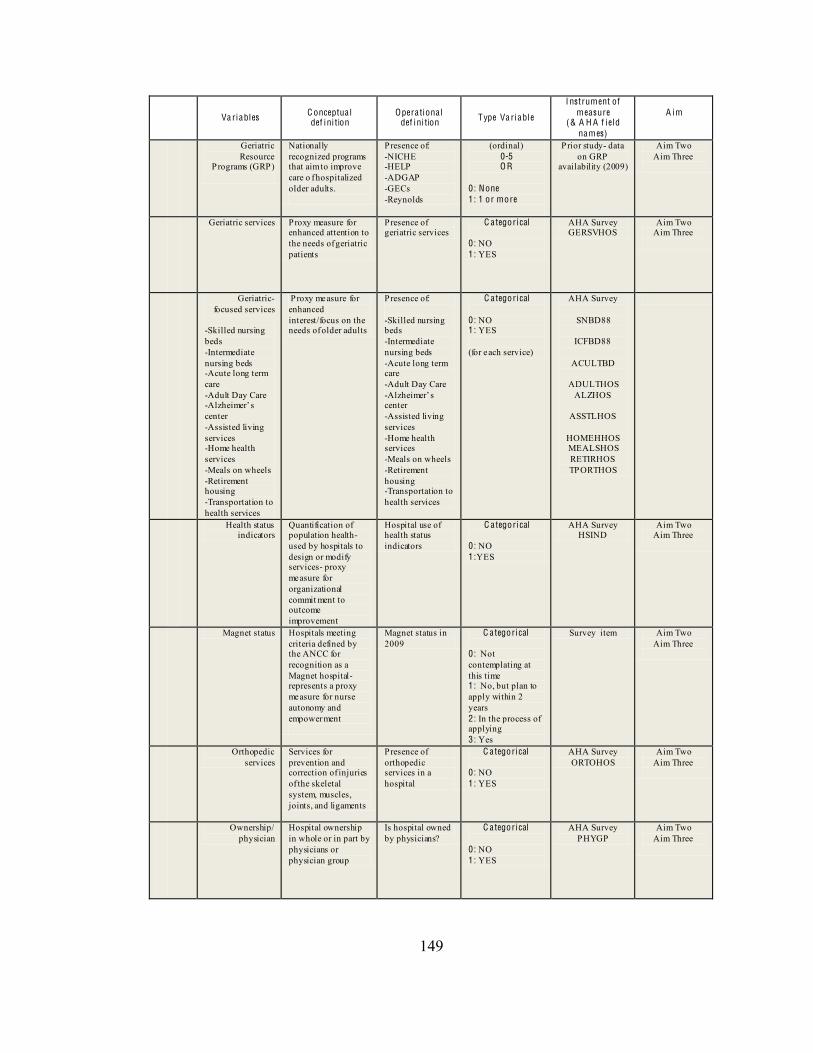
149
Va riables C onceptua l def ini tion
Opera tiona l def ini tion Type Va riable
I nstrument of measure
(& A H A f iel d names)
A im
Geriatric Resource
Programs (GRP)
Nationally recognized programs that aim to improve care o f hospitalized older adults.
Presence of: -NICHE -HELP -ADGAP -GECs -Reynolds
(ordinal) 0-5 O R
0: None 1 : 1 or more
Prior study- data on GRP
availability (2009)
Aim Two Aim Three
Geriatric services Proxy measure for enhanced attention to the needs of geriatric patients
Presence of geriatric services
C ategorical
0: NO 1: YES
AHA Survey GERSVHOS
Aim Two Aim Three
Geriatric-focused services
-Skilled nursing beds -Intermediate nursing beds -Acute long term care -Adult Day Care -center -Assisted living services -Home health services -Meals on wheels -Retirement housing -Transportation to health services
Proxy measure for enhanced interest/focus on the needs of older adults
Presence of: -Skilled nursing beds -Intermediate nursing beds -Acute long term care -Adult Day Care -center -Assisted living services -Home health services -Meals on wheels -Retirement housing -Transportation to health services
C ategorical
0: NO 1: YES (for each service)
AHA Survey
SNBD88
ICFBD88
ACULTBD
ADULTHOS ALZHOS
ASSTLHOS
HOMEHHOS MEALSHOS RETIRHOS TPORTHOS
Health status indicators
Quantification of population health- used by hospitals to design or modify services- proxy measure for organizational commit ment to outcome improvement
Hospital use of health status indicators
C ategorical
0: NO 1:YES
AHA Survey HSIND
Aim Two Aim Three
Magnet status Hospitals meeting criteria defined by the ANCC for recognition as a Magnet hospital- represents a proxy measure for nurse autonomy and empowerment
Magnet status in 2009
C ategorical
0: Not contemplating at this time 1: No, but plan to apply within 2 years 2: In the process of applying 3: Yes
Survey item Aim Two Aim Three
Orthopedic services
Services for prevention and correction of injuries of the skeletal system, muscles, joints, and ligaments
Presence of orthopedic services in a hospital
C ategorical
0: NO 1: YES
AHA Survey ORTOHOS
Aim Two Aim Three
Ownership/ physician
Hospital ownership in whole or in part by physicians or physician group
Is hospital owned by physicians?
C ategorical
0: NO 1: YES
AHA Survey PHYGP
Aim Two Aim Three
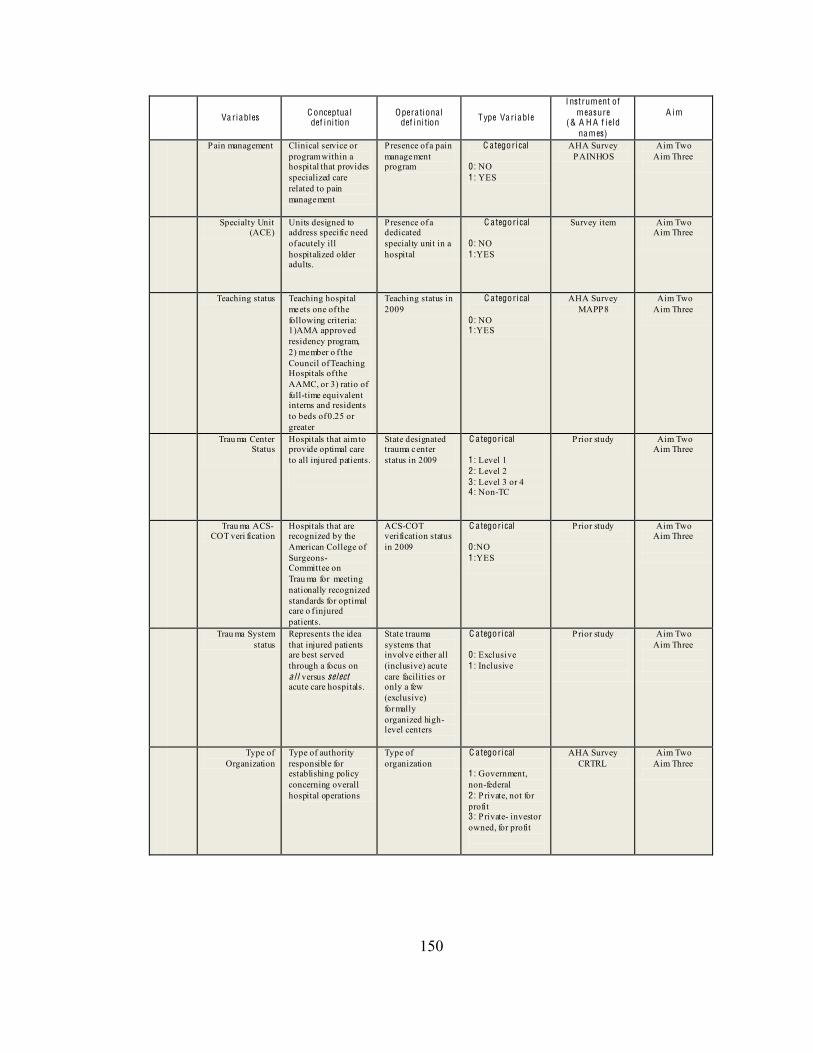
150
Va riables C onceptua l def ini tion
Opera tiona l def ini tion Type Va riable
I nstrument of measure
(& A H A f iel d names)
A im
P ain management Clinical service or program within a hospital that provides specialized care related to pain management
Presence of a pain management program
C ategorical
0: NO 1: YES
AHA Survey PAINHOS
Aim Two Aim Three
Specialty Unit (ACE)
Units designed to address specific need of acutely ill hospitalized older adults.
Presence of a dedicated specialty unit in a hospital
C ategorical
0: NO 1:YES
Survey item Aim Two Aim Three
Teaching status Teaching hospital meets one of the following criteria: 1)AMA approved residency program, 2) member o f the Council of Teaching Hospitals of the AAMC, or 3) ratio of full-time equivalent interns and residents to beds of 0.25 or greater
Teaching status in 2009
C ategorical
0: NO 1:YES
AHA Survey MAPP8
Aim Two Aim Three
Trau ma Center Status
Hospitals that aim to provide optimal care to all injured patients.
State designated trauma center status in 2009
C ategorical 1: Level 1 2 : Level 2 3: Level 3 or 4 4: Non-TC
Prior study
Aim Two Aim Three
Trau ma ACS-COT veri fication
Hospitals that are recognized by the American College of Surgeons- Committee on Trau ma for meeting nationally recognized standards for optimal care o f injured patients.
ACS-COT verification status in 2009
C ategorical 0 :NO 1:YES
Prior study
Aim Two Aim Three
Trau ma System status
Represents the idea that injured patients are best served through a focus on a l l versus select acute care hospitals.
State trauma systems that involve either all (inclusive) acute care facilities or only a few (exclusive) formally organized high-level centers
C ategorical 0 : Exclusive 1: Inclusive
Prior study
Aim Two Aim Three
Type of Organization
Type of authority responsible for establishing policy concerning overall hospital operations
Type of organization
C ategorical 1: Government, non-federal 2: Private, not for profit 3: Private- investor owned, for profit
AHA Survey CRTRL
Aim Two Aim Three
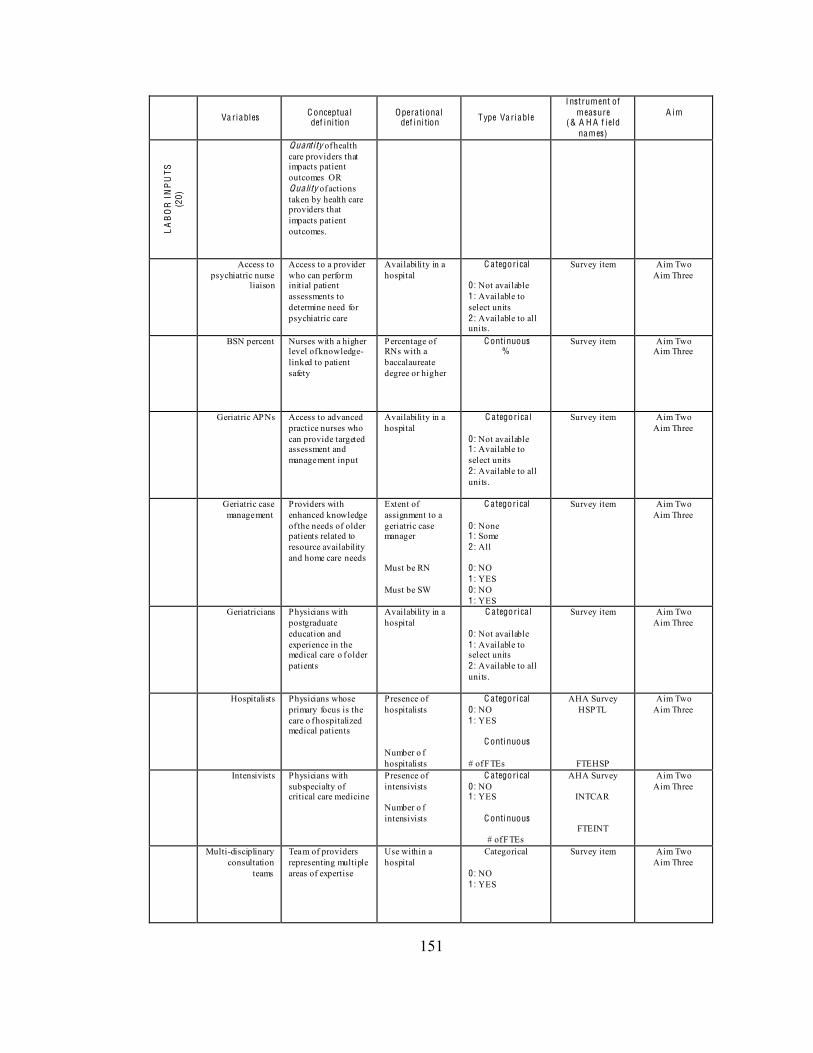
151
Va riables C onceptua l def ini tion
Opera tiona l def ini tion Type Va riable
I nstrument of measure
(& A H A f iel d names)
A im
LA
BO
R I
NP
UTS
(2
0)
Quant i ty of health care providers that impacts patient outcomes OR Qua li ty of actions taken by health care providers that impacts patient outcomes.
Access to psychiatric nurse
liaison
Access to a provider who can perform initial patient assessments to determine need for psychiatric care
Availability in a hospital
C ategorical
0: Not available 1: Available to select units 2: Available to all units.
Survey item Aim Two Aim Three
BSN percent Nurses with a higher level of knowledge- linked to patient safety
Percentage of RNs with a baccalaureate degree or higher
C ontinuous %
Survey item Aim Two Aim Three
Geriatric APNs Access to advanced practice nurses who can provide targeted assessment and management input
Availability in a hospital
C a tegorica l 0: Not available 1: Available to select units 2: Available to all units.
Survey item Aim Two Aim Three
Geriatric case management
Providers with enhanced knowledge of the needs of older patients related to resource availability and home care needs
Extent of assignment to a geriatric case manager Must be RN Must be SW
C ategorical
0: None 1: Some 2: All 0: NO 1: YES 0: NO 1: YES
Survey item Aim Two Aim Three
Geriatricians Physicians with postgraduate education and experience in the medical care o f older patients
Availability in a hospital
C a tegorica l 0: Not available 1: Available to select units 2: Available to all units.
Survey item Aim Two Aim Three
Hospitalists Physicians whose primary focus is the care o f hospitalized medical patients
Presence of hospitalists Number o f hospitalists
C ategorical 0 : NO 1: YES
C ontinuous # of FTEs
AHA Survey HSPTL
FTEHSP
Aim Two Aim Three
Intensivists Physicians with subspecialty of critical care medicine
Presence of intensivists Number o f intensivists
C ategorical 0 : NO 1: YES
C ontinuous
# of FTEs
AHA Survey
INTCAR
FTEINT
Aim Two Aim Three
Multi-disciplinary consultation
teams
Team of providers representing multiple areas of expertise
Use within a hospital
Categorical
0: NO 1: YES
Survey item Aim Two Aim Three
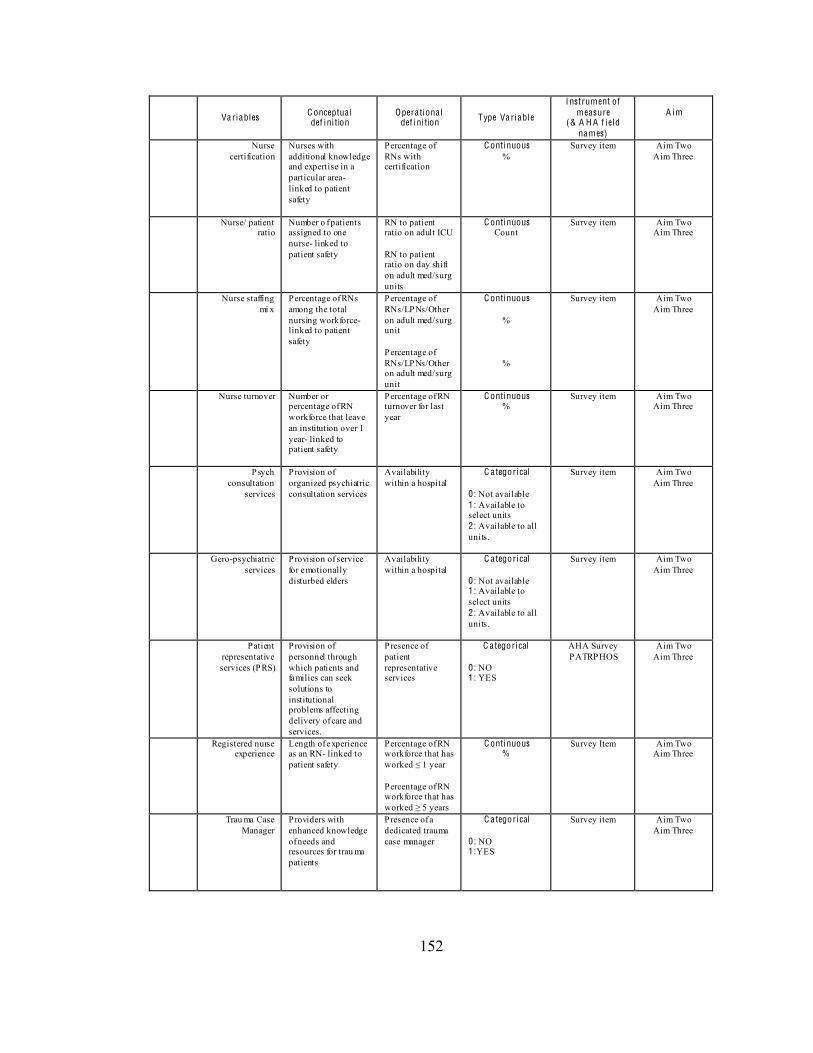
152
Va riables C onceptua l def ini tion
Opera tiona l def ini tion Type Va riable
I nstrument of measure
(& A H A f iel d names)
A im
Nurse certification
Nurses with additional knowledge and expertise in a particular area- linked to patient safety
Percentage of RNs with certification
C ontinuous %
Survey item Aim Two Aim Three
Nurse/ patient ratio
Number o f patients assigned to one nurse- linked to patient safety
RN to patient ratio on adult ICU RN to patient ratio on day shift on adult med/surg units
C ontinuous Count
Survey item Aim Two Aim Three
Nurse staffing mi x
Percentage of RNs among the total nursing workforce- linked to patient safety
Percentage of RNs/LPNs/Other on adult med/surg unit Percentage of RNs/LPNs/Other on adult med/surg unit
C ontinuous
%
%
Survey item Aim Two Aim Three
Nurse turnover Number or percentage of RN workforce that leave an institution over 1 year- linked to patient safety
Percentage of RN turnover for last year
C ontinuous %
Survey item Aim Two Aim Three
Psych consultation
services
Provision of organized psychiatric consultation services
Availability within a hospital
C ategorical 0: Not available 1: Available to select units 2: Available to all units.
Survey item Aim Two Aim Three
Gero-psychiatric services
Provision of service for emotionally disturbed elders
Availability within a hospital
C ategorical 0: Not available 1: Available to select units 2: Available to all units.
Survey item Aim Two Aim Three
Patient representative services (PRS)
Provision of personnel through which patients and families can seek solutions to institutional problems affecting delivery of care and services.
Presence of patient representative services
C ategorical
0: NO 1: YES
AHA Survey PATRPHOS
Aim Two Aim Three
Registered nurse experience
Length of experience as an RN- linked to patient safety
Percentage of RN workforce that has
Percentage of RN workforce that has
C ontinuous %
Survey Item Aim Two Aim Three
Trau ma Case Manager
Providers with enhanced knowledge of needs and resources for trau ma patients
Presence of a dedicated trauma case manager
C ategorical
0: NO 1:YES
Survey item Aim Two Aim Three
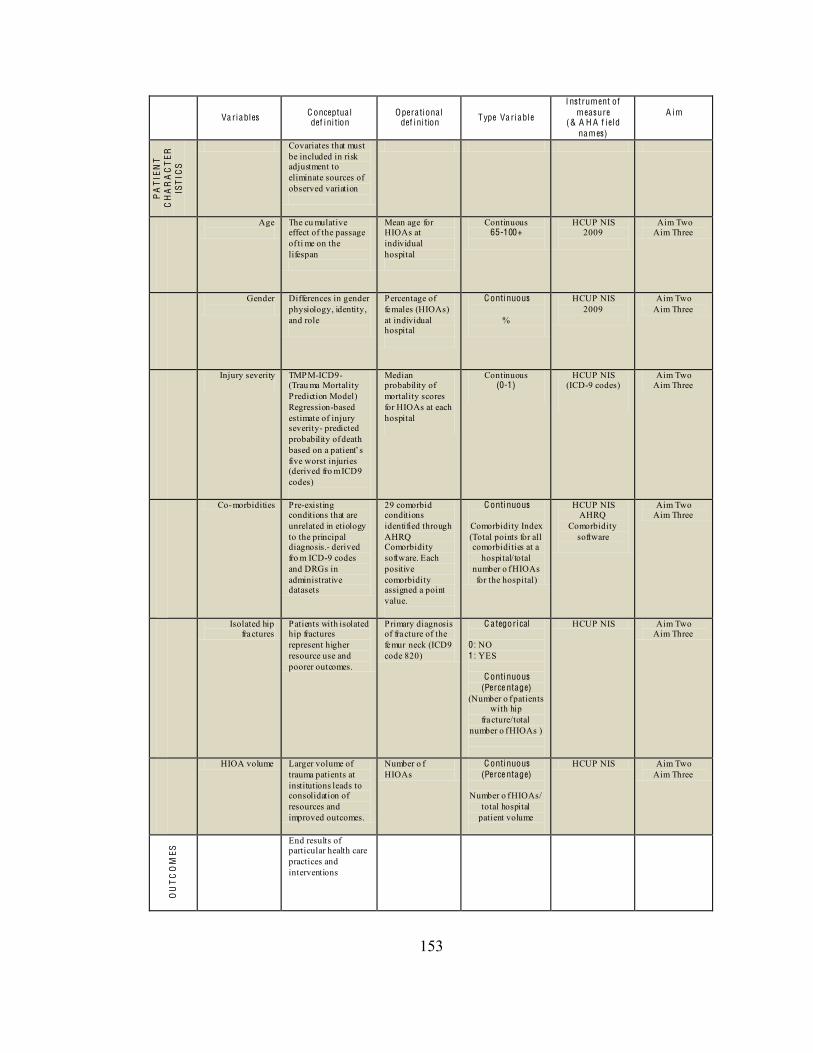
153
Va riables C onceptua l def ini tion
Opera tiona l def ini tion Type Va riable
I nstrument of measure
(& A H A f iel d names)
A im
PA
TIE
NT
CH
AR
AC
TE
RIS
TIC
S
Covariates that must be included in risk adjustment to eliminate sources of observed variation
Age
The cu mulative effect of the passage of ti me on the lifespan
Mean age for HIOAs at individual hospital
Continuous 65-100+
HCUP NIS 2009
Aim Two Aim Three
Gender
Differences in gender physiology, identity, and role
Percentage of females (HIOAs) at individual hospital
C ontinuous
%
HCUP NIS 2009
Aim Two Aim Three
Injury severity
TMPM-ICD9- (Trau ma Mortality Prediction Model) Regression-based estimate of injury severity- predicted probability of death
five worst injuries (derived fro m ICD9 codes)
Median probability of mortality scores for HIOAs at each hospital
Continuous (0-1)
HCUP NIS (ICD-9 codes)
Aim Two Aim Three
Co-morbidities Pre-existing conditions that are unrelated in etiology to the principal diagnosis.- derived fro m ICD-9 codes and DRGs in administrative datasets
29 comorbid conditions identified through AHRQ Comorbidity software. Each positive comorbidity assigned a point value.
C ontinuous
Comorbidity Index (Total points for all comorbidities at a
hospital/total number o f HIOAs for the hospital)
HCUP NIS AHRQ
Comorbidity software
Aim Two Aim Three
Isolated hip fractures
Patients with isolated hip fractures represent higher resource use and poorer outcomes.
Primary diagnosis of fracture of the femur neck (ICD9 code 820)
C ategorical 0 : NO 1: YES
C ontinuous (Perce ntage)
(Number o f patients with hip
fracture/total number o f HIOAs )
HCUP NIS Aim Two Aim Three
HIOA volume Larger volume of trauma patients at institutions leads to consolidation of resources and improved outcomes.
Number o f HIOAs
C ontinuous (Perce ntage)
Number o f HIOAs/
total hospital patient volume
HCUP NIS Aim Two Aim Three
OU
TC
OM
ES End results of
particular health care practices and interventions
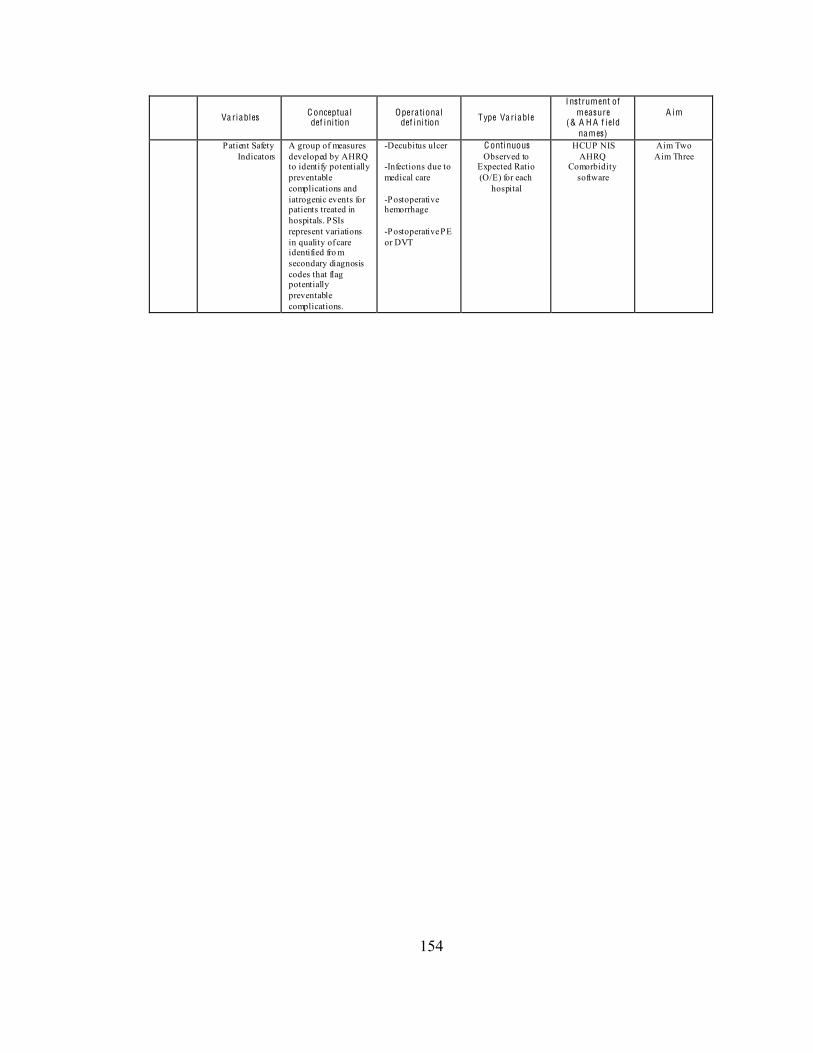
154
Va riables C onceptua l def ini tion
Opera tiona l def ini tion Type Va riable
I nstrument of measure
(& A H A f iel d names)
A im
P atient Safety Indicators
A group of measures developed by AHRQ to identify potentially preventable complications and iatrogenic events for patients treated in hospitals. PSIs represent variations in quality of care identified fro m secondary diagnosis codes that flag potentially preventable complications.
-Decubitus ulcer -Infections due to medical care -Postoperative hemorrhage -Postoperative PE or DVT
C ontinuous Observed to
Expected Ratio (O/E) for each
hospital
HCUP NIS AHRQ
Comorbidity software
Aim Two Aim Three
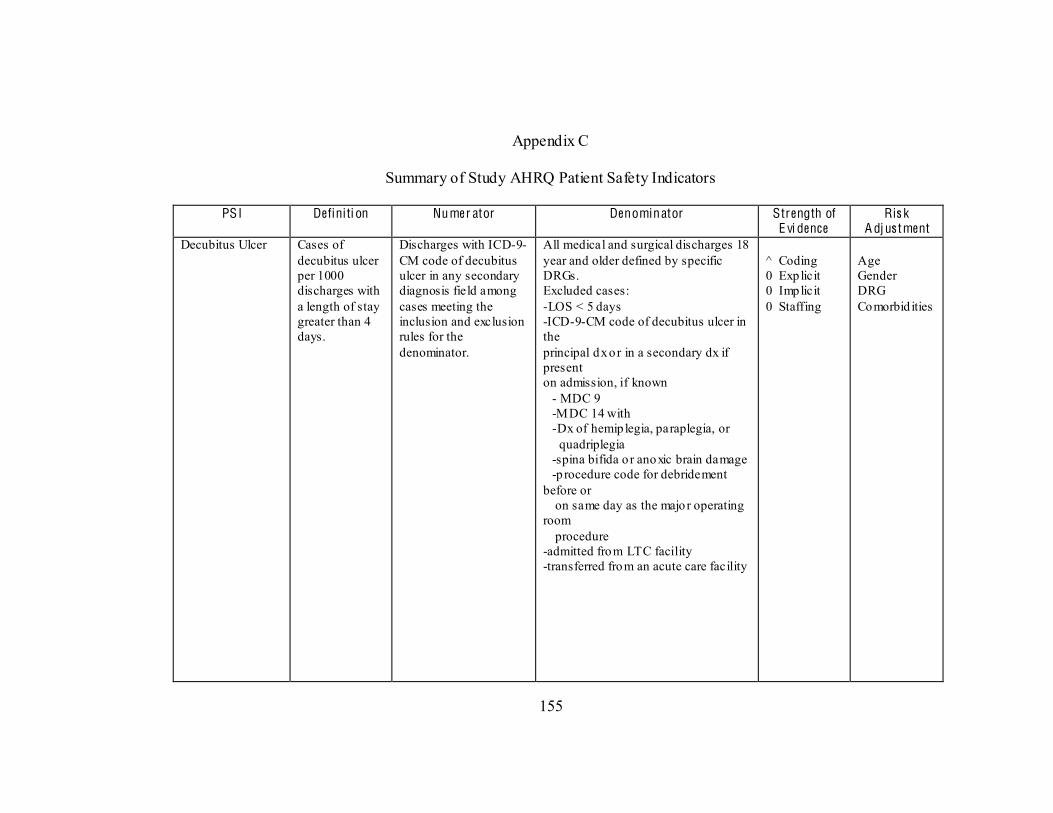
155
Appendix C
Summary of Study AHRQ Patient Safety Indicators
PSI Definiti on Numer ator Denominator Strength of E vi dence
Ris k A dj us tment
Decubitus Ulcer Cases of decubitus ulcer per 1000 discharges with a length of stay greater than 4 days.
Discharges with ICD-9-CM code of decubitus ulcer in any secondary diagnosis field among cases meeting the inclusion and exclusion rules for the denominator.
All medical and surgical discharges 18 year and older defined by specific DRGs. Excluded cases: -LOS < 5 days -ICD-9-CM code of decubitus ulcer in the principal dx o r in a secondary dx if present on admission, if known - MDC 9 -MDC 14 with -Dx of hemip legia, paraplegia, or quadriplegia -spina bifida o r anoxic brain damage -p rocedure code for debridement before or on same day as the major operating room procedure -admitted from LTC facility -transferred from an acute care facility
^ Coding 0 Explicit 0 Implicit 0 Staffing
Age Gender DRG Comorbid ities
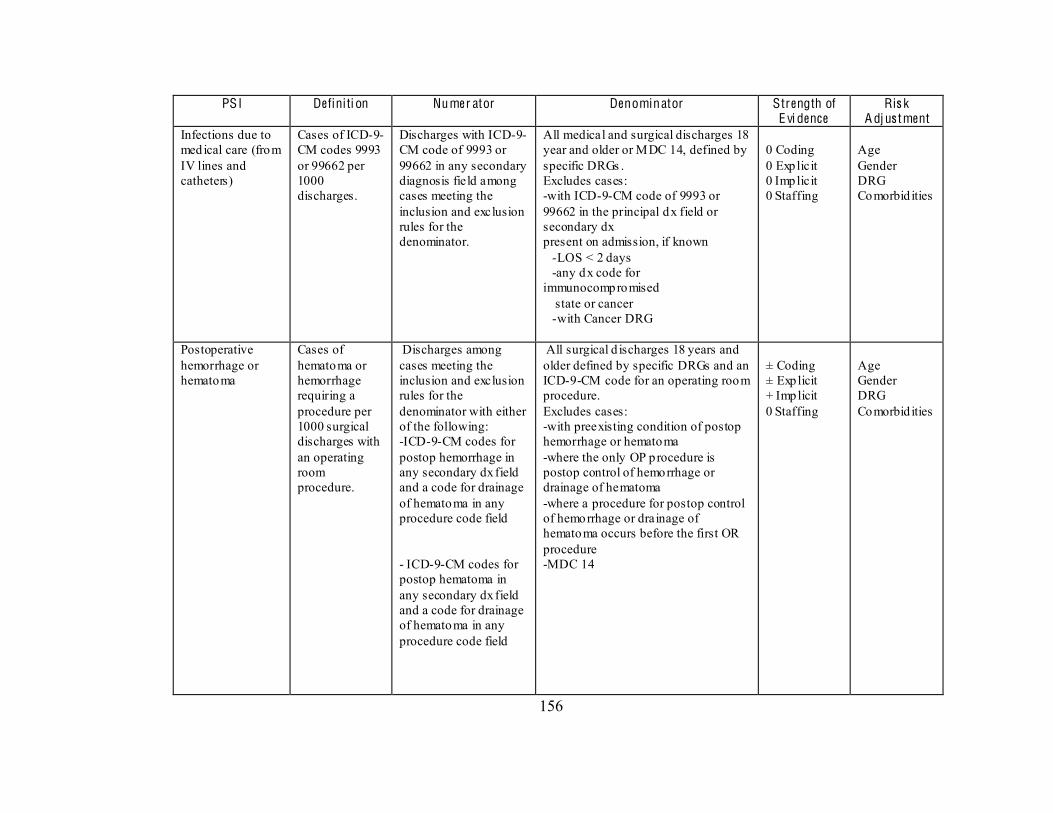
156
PSI Definiti on Numer ator Denominator Strength of E vi dence
Ris k A dj us tment
Infections due to medical care (from IV lines and catheters)
Cases of ICD-9-CM codes 9993 or 99662 per 1000 discharges.
Discharges with ICD-9-CM code of 9993 or 99662 in any secondary diagnosis field among cases meeting the inclusion and exclusion rules for the denominator.
All medical and surgical discharges 18 year and older or MDC 14, defined by specific DRGs . Excludes cases: -with ICD-9-CM code of 9993 or 99662 in the principal dx field or secondary dx present on admission, if known -LOS < 2 days -any dx code for immunocompromised state or cancer -with Cancer DRG
0 Coding 0 Explicit 0 Implicit 0 Staffing
Age Gender DRG Comorbid ities
Postoperative hemorrhage or hematoma
Cases of hematoma or hemorrhage requiring a procedure per 1000 surgical discharges with an operating room procedure.
Discharges among cases meeting the inclusion and exclusion rules for the denominator with either of the following: -ICD-9-CM codes for postop hemorrhage in any secondary dx field and a code for drainage of hematoma in any procedure code field - ICD-9-CM codes for postop hematoma in any secondary dx field and a code for drainage of hematoma in any procedure code field
All surgical d ischarges 18 years and older defined by specific DRGs and an ICD-9-CM code for an operating room procedure. Excludes cases: -with preexisting condition of postop hemorrhage or hematoma -where the only OP procedure is postop control of hemorrhage or drainage of hematoma -where a procedure for postop control of hemorrhage or drainage of hematoma occurs before the first OR procedure -MDC 14
± Coding ± Explicit + Implicit 0 Staffing
Age Gender DRG Comorbid ities
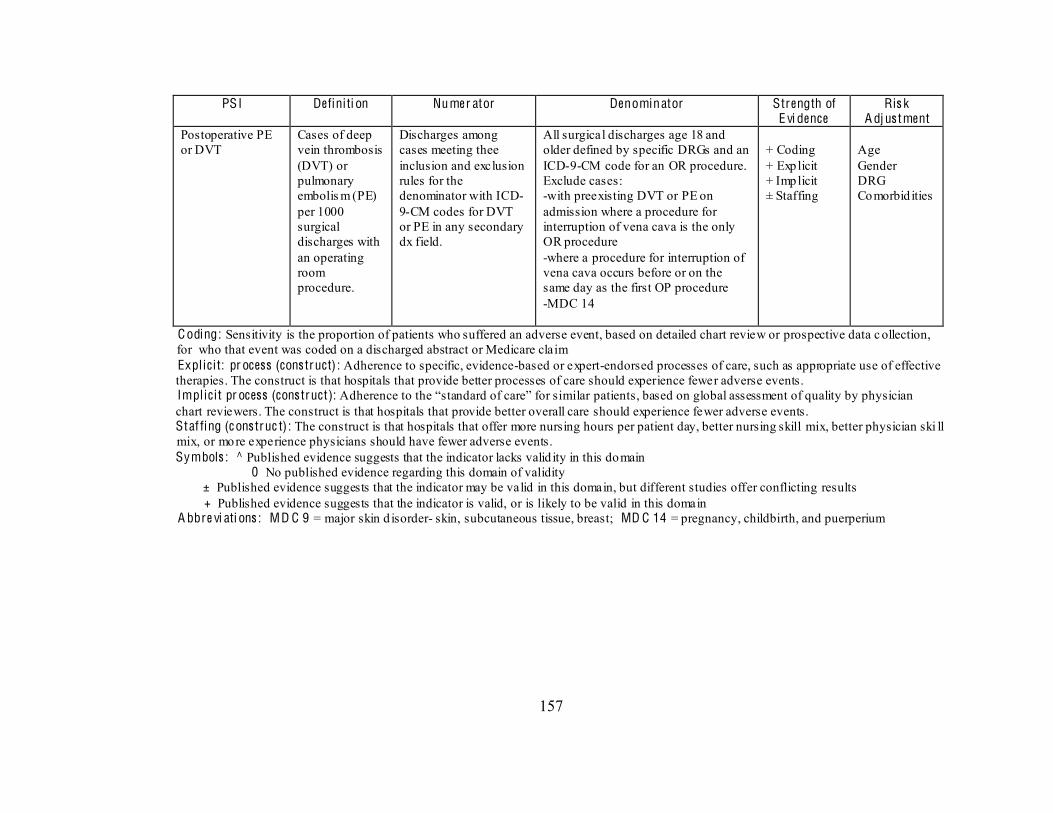
157
PSI Definiti on Numer ator Denominator Strength of E vi dence
Ris k A dj us tment
Postoperative PE or DVT
Cases of deep vein thrombosis (DVT) or pulmonary embolis m (PE) per 1000 surgical discharges with an operating room procedure.
Discharges among cases meeting thee inclusion and exclusion rules for the denominator with ICD-9-CM codes for DVT or PE in any secondary dx field.
All surgical discharges age 18 and older defined by specific DRGs and an ICD-9-CM code for an OR procedure. Exclude cases: -with preexisting DVT or PE on admission where a procedure for interruption of vena cava is the only OR procedure -where a procedure for interruption of vena cava occurs before or on the same day as the first OP procedure -MDC 14
+ Coding + Explicit + Implicit ± Staffing
Age Gender DRG Comorbid ities
C oding: Sensitivity is the proportion of patients who suffered an adverse event, based on detailed chart review or prospective data c ollection, for who that event was coded on a discharged abstract or Medicare claim Expl ic i t: pr ocess (cons truct) : Adherence to specific, evidence-based or expert-endorsed processes of care, such as appropriate use of effective therapies. The construct is that hospitals that provide better processes of care should experience fewer adverse events. Implic i t pr ocess (cons truct): chart reviewers. The construct is that hospitals that provide better overall care should experience fewer adverse events. Staf fing (c ons truc t) : The construct is that hospitals that offer more nursing hours per patient day, better nursing skill mix, better physician ski ll mix, or more experience physicians should have fewer adverse events. Symbols : ^ Published evidence suggests that the indicator lacks valid ity in this domain 0 No published evidence regarding this domain of validity ± Published evidence suggests that the indicator may be valid in this domain, but different studies offer conflicting results + Published evidence suggests that the indicator is valid, or is likely to be valid in this domain A bbre vi ati ons : MD C 9 = major skin d isorder- skin, subcutaneous tissue, breast; MD C 14 = pregnancy, childbirth, and puerperium
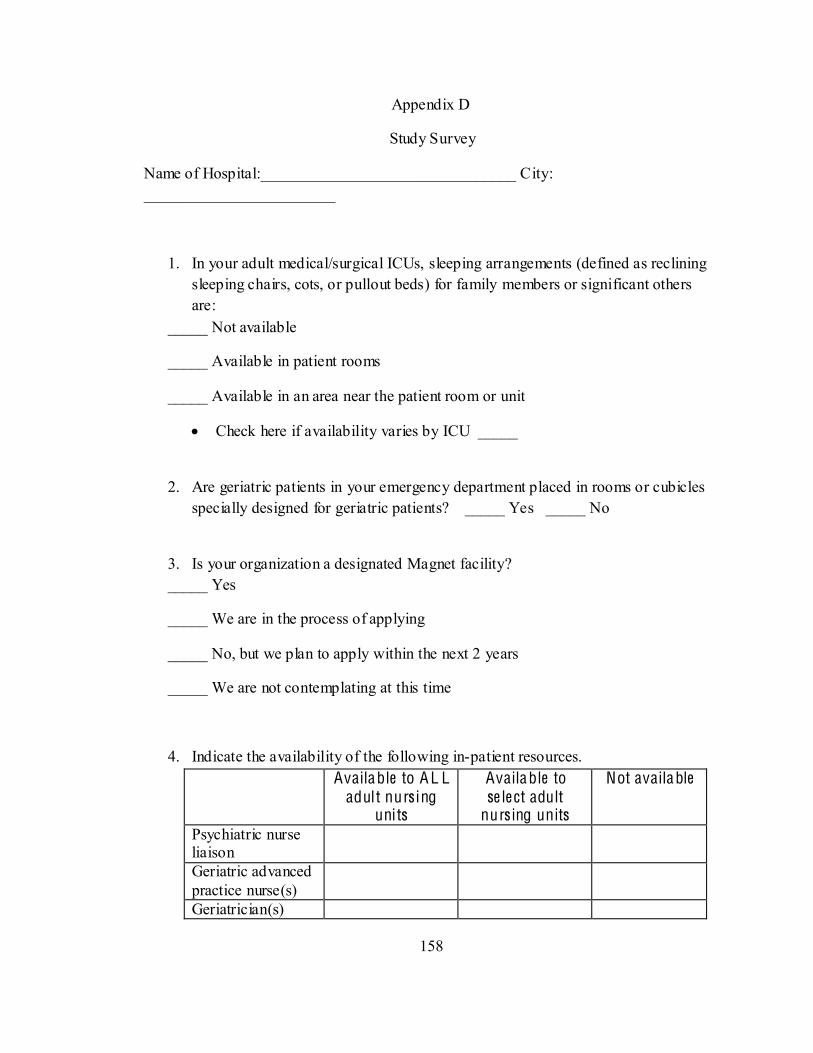
158
Appendix D
Study Survey
Name of Hospital:________________________________ City: ________________________
1. In your adult medical/surgical ICUs, sleeping arrangements (defined as reclining sleeping chairs, cots, or pullout beds) for family members or significant others are:
_____ Not available
_____ Available in patient rooms
_____ Available in an area near the patient room or unit
Check here if availability varies by ICU _____
2. Are geriatric patients in your emergency department placed in rooms or cubicles specially designed for geriatric patients? _____ Yes _____ No
3. Is your organization a designated Magnet facility? _____ Yes
_____ We are in the process of applying
_____ No, but we plan to apply within the next 2 years
_____ We are not contemplating at this time
4. Indicate the availability of the following in-patient resources. Available to A L L
adult nurs ing units
Available to se le ct adult
nurs ing units
Not available
Psychiatric nurse liaison
Geriatric advanced practice nurse(s)
Geriatrician(s)
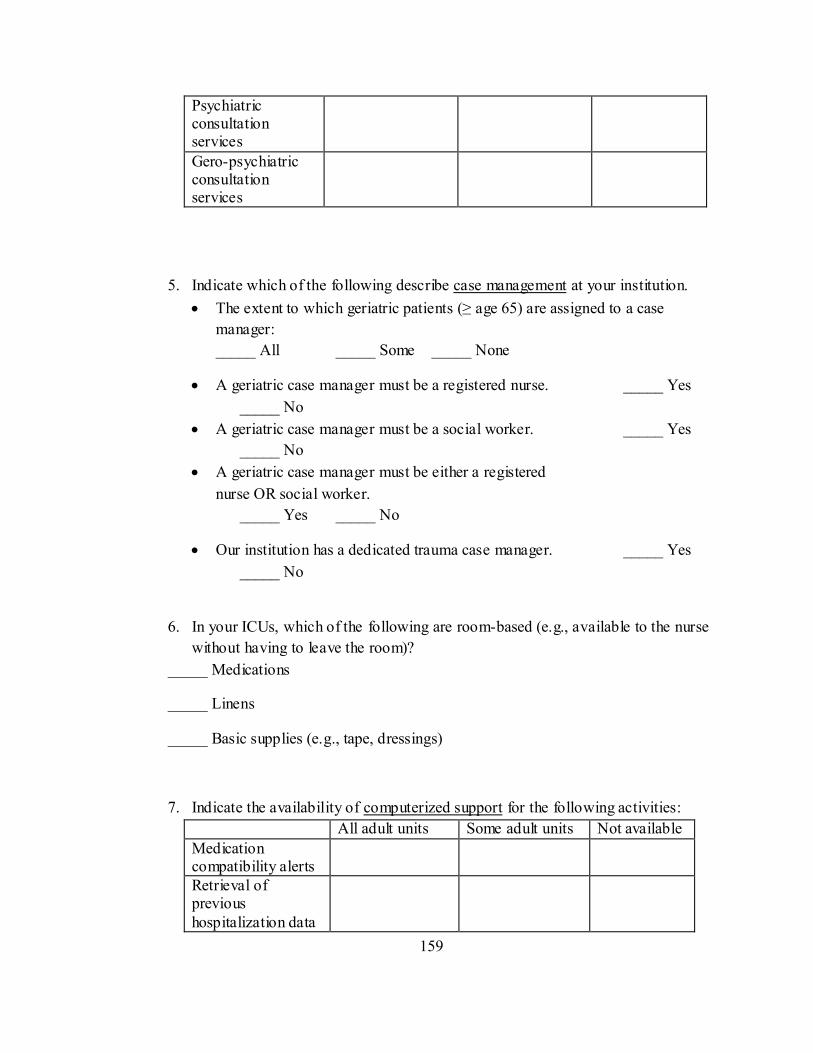
159
Psychiatric consultation services
Gero-psychiatric consultation services
5. Indicate which of the following describe case management at your institution. The extent to which geriatric patients ( age 65) are assigned to a case
manager: _____ All _____ Some _____ None
A geriatric case manager must be a registered nurse. _____ Yes _____ No
A geriatric case manager must be a social worker. _____ Yes _____ No
A geriatric case manager must be either a registered nurse OR social worker. _____ Yes _____ No
Our institution has a dedicated trauma case manager. _____ Yes _____ No
6. In your ICUs, which of the following are room-based (e.g., available to the nurse without having to leave the room)?
_____ Medications
_____ Linens
_____ Basic supplies (e.g., tape, dressings)
7. Indicate the availability of computerized support for the following activities: All adult units Some adult units Not available Medication compatibility alerts
Retrieval of previous hospitalization data
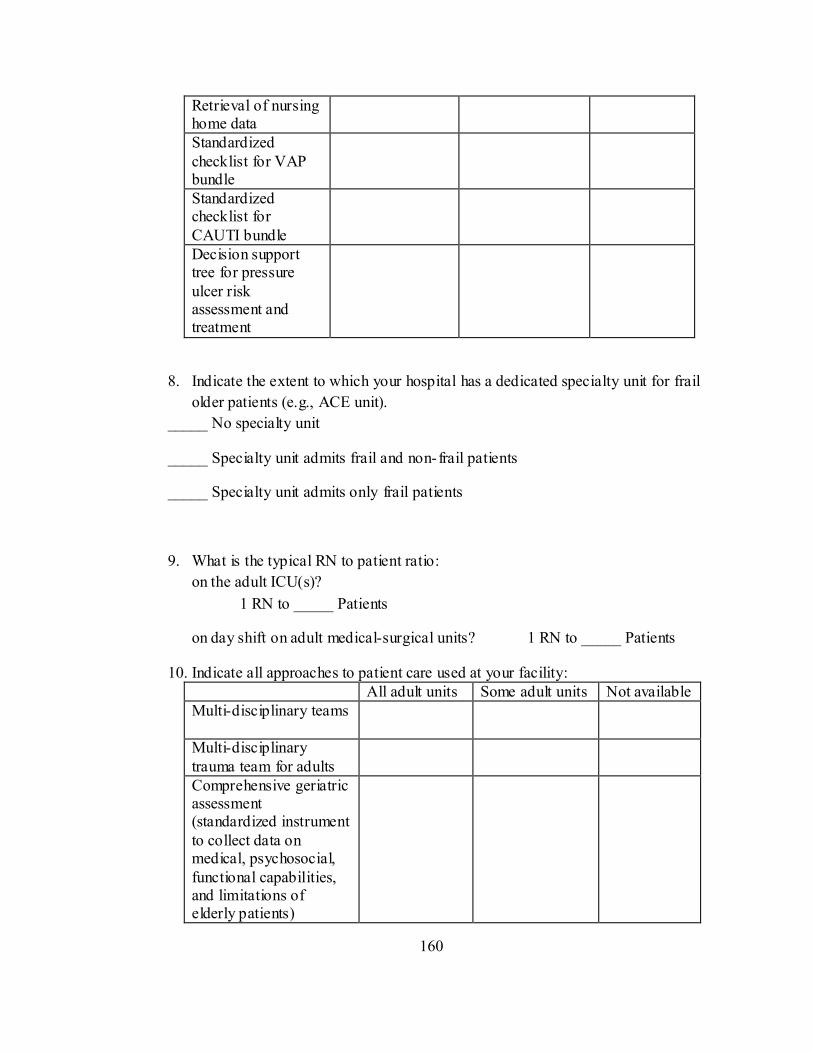
160
Retrieval of nursing home data
Standardized checklist for VAP bundle
Standardized checklist for CAUTI bundle
Decision support tree for pressure ulcer risk assessment and treatment
8. Indicate the extent to which your hospital has a dedicated specialty unit for frail older patients (e.g., ACE unit).
_____ No specialty unit
_____ Specialty unit admits frail and non-frail patients
_____ Specialty unit admits only frail patients
9. What is the typical RN to patient ratio: on the adult ICU(s)?
1 RN to _____ Patients
on day shift on adult medical-surgical units? 1 RN to _____ Patients
10. Indicate all approaches to patient care used at your facility: All adult units Some adult units Not available Multi-disciplinary teams
Multi-disciplinary trauma team for adults
Comprehensive geriatric assessment (standardized instrument to collect data on medical, psychosocial, functional capabilities, and limitations of elderly patients)
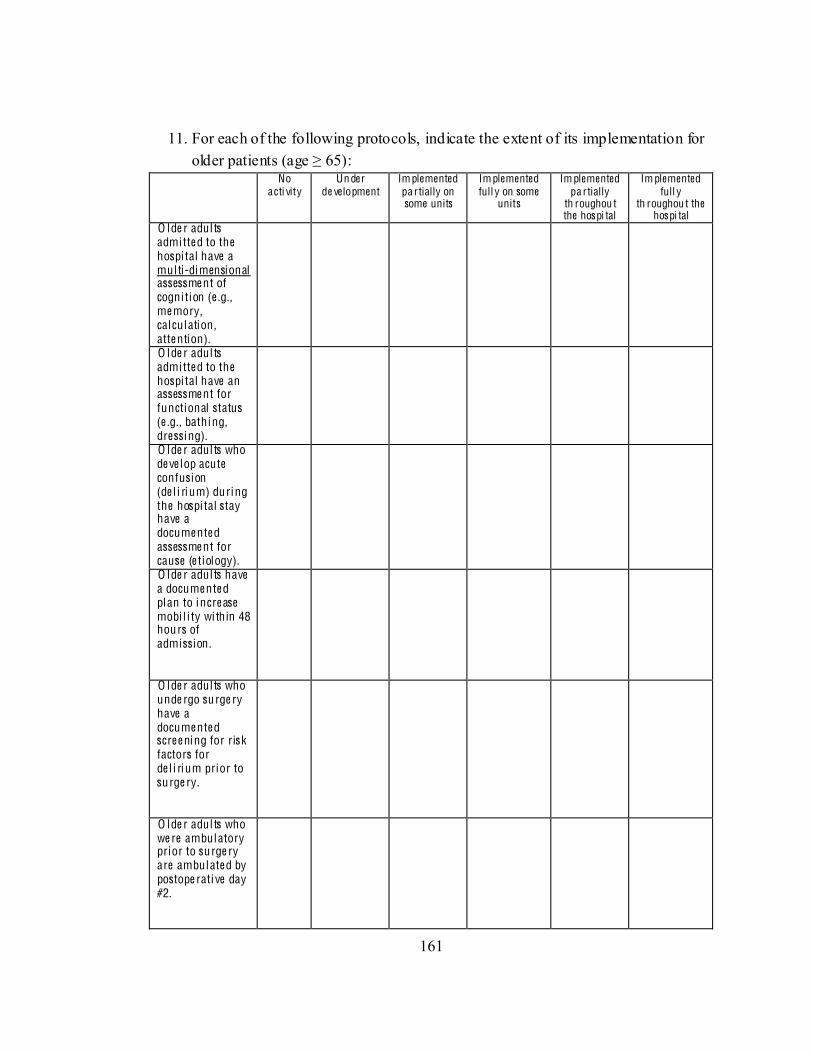
161
11. For each of the following protocols, indicate the extent of its implementation for older patients (
No acti vity
Un der de velopment
Im plemented pa rtially on some units
Im plemented full y on some
units
Im plemented pa rtially
th roughou t the hospi tal
Im plemented full y
th roughou t the hospi tal
O lde r adul ts admi tte d to the hospi tal have a mul ti-dimensional assessme nt of cogni tion (e .g., me mory, calculation , atte ntion).
O lde r adul ts admi tte d to the hospi tal have an assessme nt for functional status (e .g., bathing, dressi ng).
O lde r adul ts who de ve lop acute confusion (de l i rium) during the hospi tal stay have a docume nte d assessme nt for cause (e tiology).
O lde r adul ts have a docume nte d plan to incre ase mobi l i ty wi thin 48 hours of admission .
O lde r adul ts who unde rgo surge ry have a docume nte d scre e ning for risk factors for de l i rium prior to surge ry.
O lde r adul ts who we re ambulatory prior to surge ry are ambulate d by postope rati ve day #2.
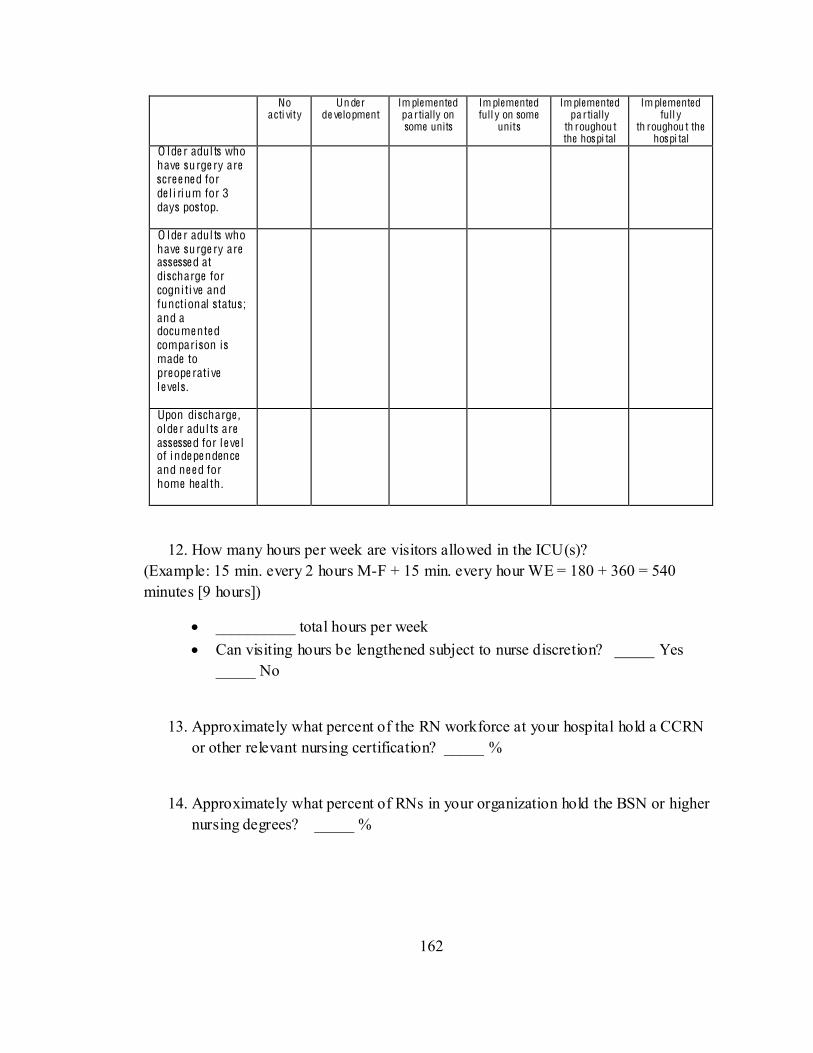
162
No acti vity
Un der de velopment
Im plemented pa rtially on some units
Im plemented full y on some
units
Im plemented pa rtially
th roughou t the hospi tal
Im plemented full y
th roughou t the hospi tal
O lde r adul ts who have surge ry are scre e ne d for de l i rium for 3 days postop.
O lde r adul ts who have surge ry are assesse d at discharge for cogni ti ve and functional status; and a docume nte d comparison is made to preope rati ve le vels.
Upon discharge , olde r adul ts are assesse d for le ve l of inde pe ndence and ne e d for home he al th .
12. How many hours per week are visitors allowed in the ICU(s)? (Example: 15 min. every 2 hours M-F + 15 min. every hour WE = 180 + 360 = 540 minutes [9 hours])
__________ total hours per week Can visiting hours be lengthened subject to nurse discretion? _____ Yes
_____ No
13. Approximately what percent of the RN workforce at your hospital hold a CCRN or other relevant nursing certification? _____ %
14. Approximately what percent of RNs in your organization hold the BSN or higher nursing degrees? _____ %
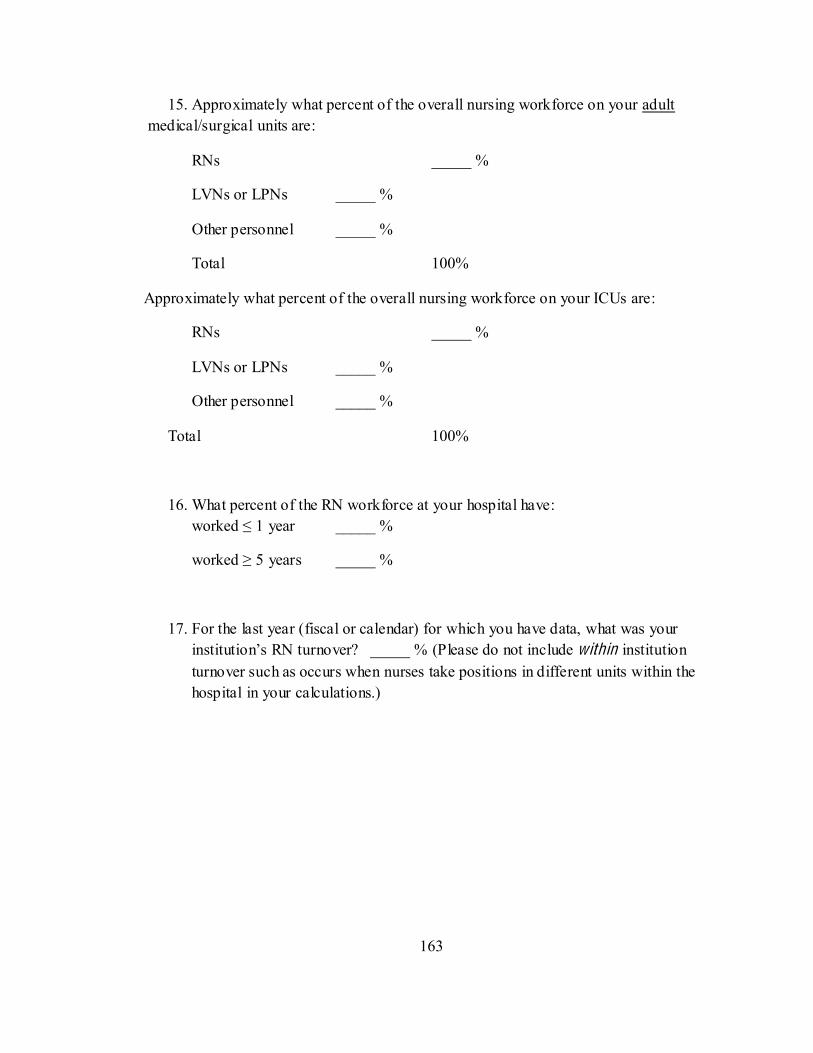
163
15. Approximately what percent of the overall nursing workforce on your adult medical/surgical units are:
RNs _____ %
LVNs or LPNs _____ %
Other personnel _____ %
Total 100%
Approximately what percent of the overall nursing workforce on your ICUs are:
RNs _____ %
LVNs or LPNs _____ %
Other personnel _____ %
Total 100%
16. What percent of the RN workforce at your hospital have: _____ %
5 years _____ %
17. For the last year (fiscal or calendar) for which you have data, what was your (Please do not include within institution
turnover such as occurs when nurses take positions in different units within the hospital in your calculations.)
164
TH AN K Y OU F OR PAR TIC IPA TIN G IN T HIS SUR V E Y
Title of person completing the survey (optional): _____________________________________
Please indicate if you may be contacted for additional clarification:
Name: ________________________________________________
Email: ________________________________________________
Telephone number: ( ) ________________________________
If you are interested in receiving a short summary of results, please indicate name of person to receive the report, and email:
Name: ________________________________________________
Hospital name: _________________________________________
Email address: __________________________________________
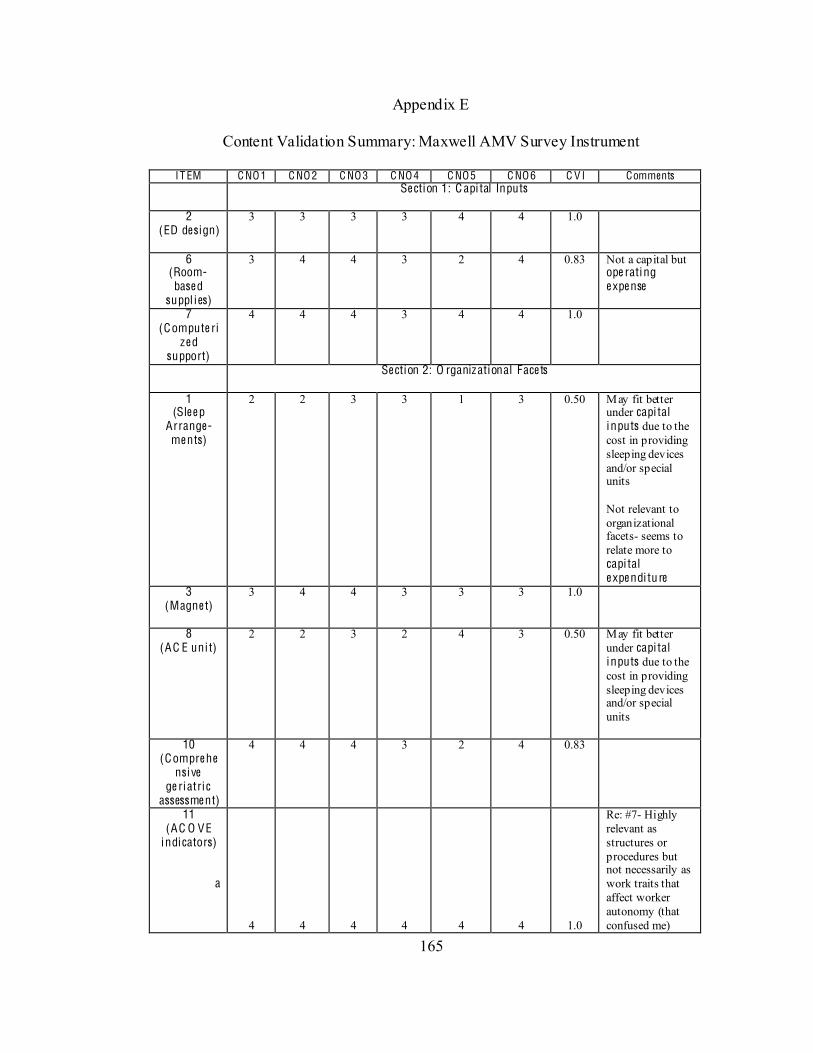
165
Appendix E
Content Validation Summary: Maxwell AMV Survey Instrument
IT EM C NO1 C NO2 C NO3 C NO4 C NO5 C NO6 C V I Comments Se ction 1: C api tal Inputs
2
(ED design)
3 3 3 3 4 4 1.0
6 (Room-base d
suppl ies)
3 4 4 3 2 4 0.83 Not a capital but ope rating e xpe nse
7 (Compute ri
ze d support)
4 4 4 3 4 4 1.0
Se ction 2: O rganizational Face ts
1 (Sle e p
Arrange-me nts)
2 2 3 3 1 3 0.50 May fit better under capi tal inputs due to the cost in providing sleeping devices and/or special units Not relevant to organizational facets- seems to relate more to capi tal e xpe ndi ture
3 (Magne t)
3 4 4 3 3 3 1.0
8 (AC E uni t)
2 2 3 2 4 3 0.50 May fit better under capi tal inputs due to the cost in providing sleeping devices and/or special units
10 (Compre he
nsi ve ge ri atric
assessme nt)
4 4 4 3 2 4 0.83
11 (AC O VE
indicators)
a
4 4 4 4 4 4 1.0
Re: #7- Highly relevant as structures or procedures but not necessarily as work traits that affect worker autonomy (that confused me)
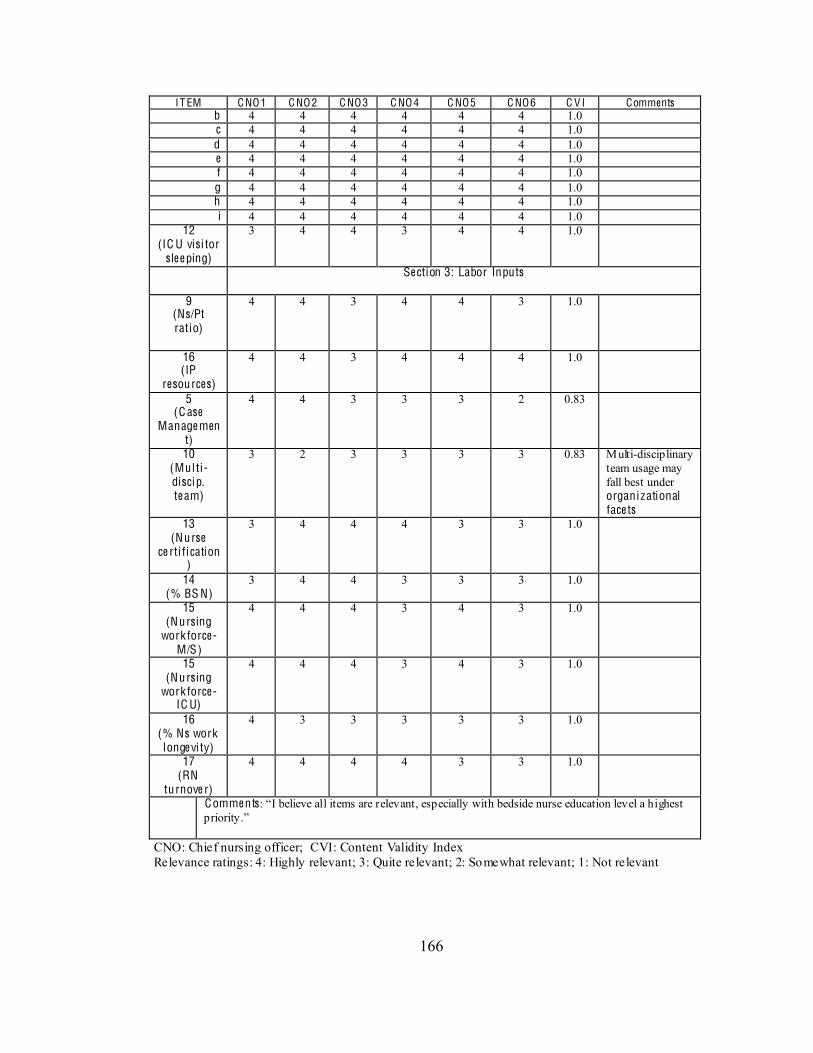
166
IT EM C NO1 C NO2 C NO3 C NO4 C NO5 C NO6 C V I Comments b 4 4 4 4 4 4 1.0 c 4 4 4 4 4 4 1.0 d 4 4 4 4 4 4 1.0 e 4 4 4 4 4 4 1.0 f 4 4 4 4 4 4 1.0 g 4 4 4 4 4 4 1.0 h 4 4 4 4 4 4 1.0 i 4 4 4 4 4 4 1.0
12 (IC U visi tor
sle e ping)
3 4 4 3 4 4 1.0
Se ction 3: Labor Inputs
9 (Ns/Pt ratio)
4 4 3 4 4 3 1.0
16 (IP
resources)
4 4 3 4 4 4 1.0
5 (C ase
Manage ment)
4 4 3 3 3 2 0.83
10 (Mul ti -disci p. te am)
3 2 3 3 3 3 0.83 Multi-disciplinary team usage may fall best under organizational face ts
13 (Nurse
ce rti fication)
3 4 4 4 3 3 1.0
14 (% BS N)
3 4 4 3 3 3 1.0
15 (Nursing
work force- M/S)
4 4 4 3 4 3 1.0
15 (Nursing
work force- IC U)
4 4 4 3 4 3 1.0
16 (% Ns work longe vi ty)
4 3 3 3 3 3 1.0
17 (RN
turnove r)
4 4 4 4 3 3 1.0
Comme nts
CNO: Chief nursing officer; CVI: Content Validity Index Relevance ratings: 4: Highly relevant; 3: Quite relevant; 2: Somewhat relevant; 1: Not relevant
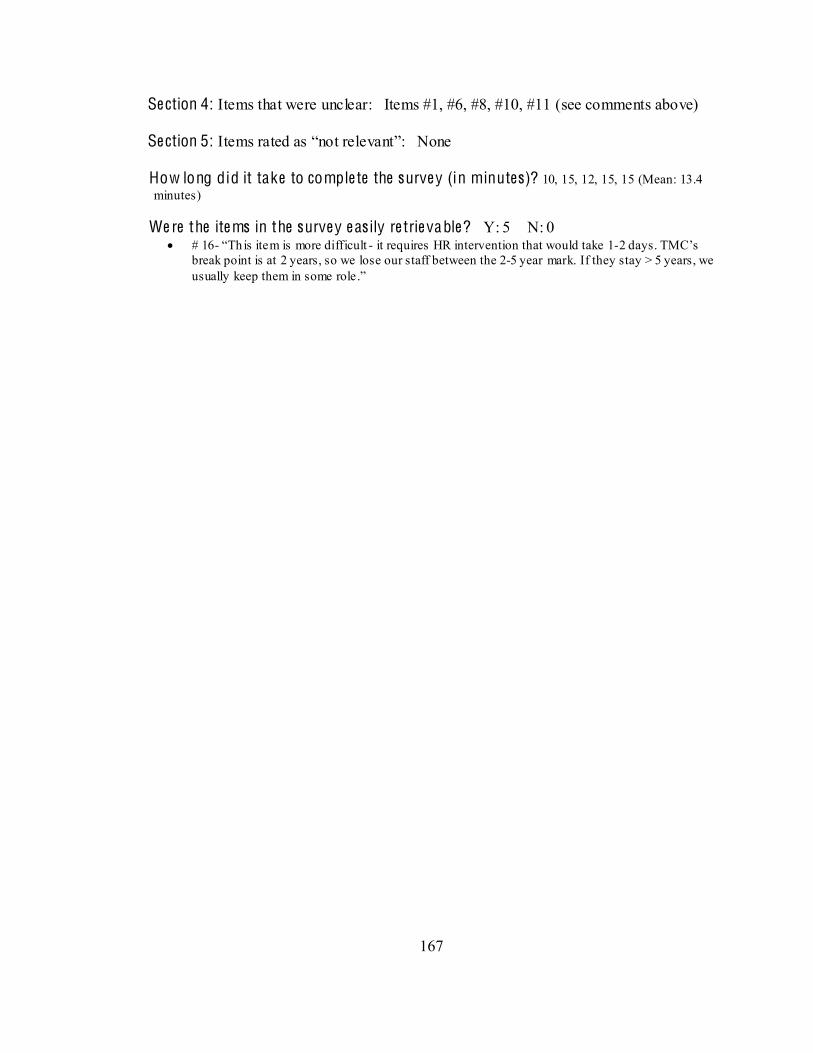
167
Se ction 4: Items that were unclear: Items #1, #6, #8, #10, #11 (see comments above) Se ction 5: How long did it take to comple te the surve y (in minutes)? 10, 15, 12, 15, 15 (Mean: 13.4 minutes) We re the ite ms in the surve y e as ily re trie vable? Y: 5 N: 0
# 16- - it requires HR intervention that would take 1-break point is at 2 years, so we lose our staff between the 2-5 year mark. If they stay > 5 years, we
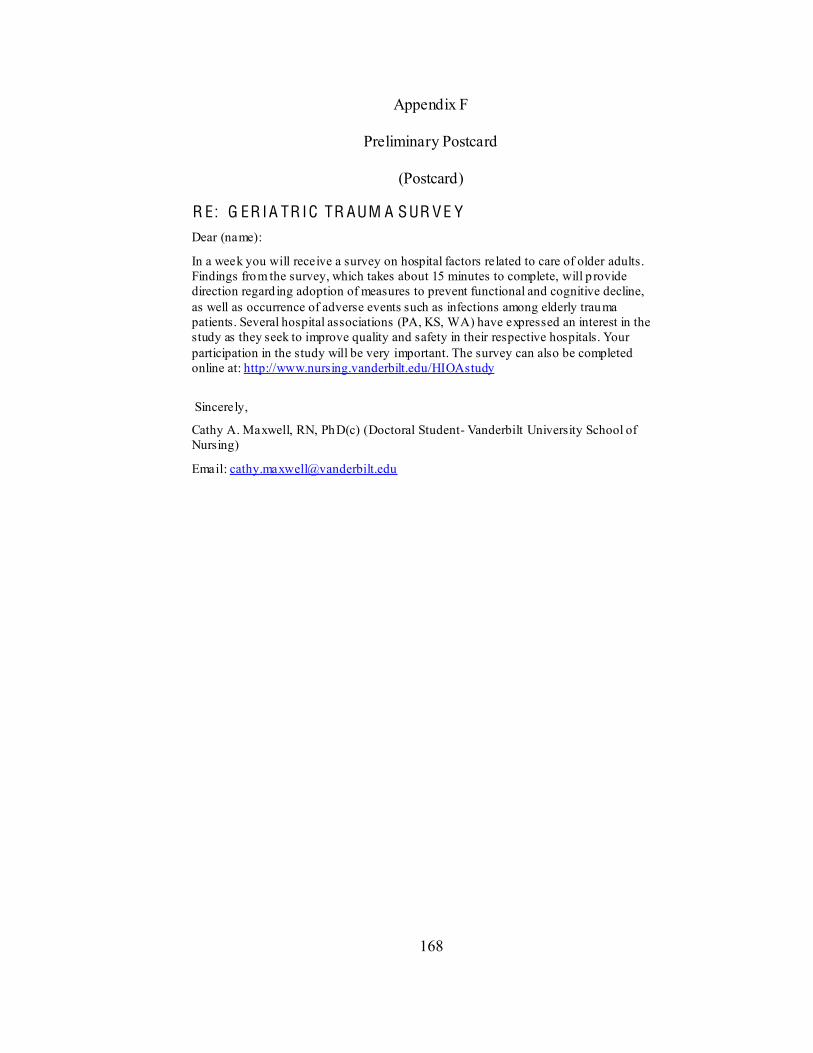
168
Appendix F
Preliminary Postcard
(Postcard)
R E: G ER IA TR IC TR AUM A SUR V E Y Dear (name):
In a week you will receive a survey on hospital factors related to care of older adults. Findings from the survey, which takes about 15 minutes to complete, will p rovide direction regard ing adoption of measures to prevent functional and cognitive decline, as well as occurrence of adverse events such as infections among elderly trauma patients. Several hospital associations (PA, KS, WA) have expressed an interest in the study as they seek to improve quality and safety in their respective hospitals. Your participation in the study will be very important. The survey can also be completed online at: http://www.nursing.vanderbilt.edu/HIOAstudy
Sincerely,
Cathy A. Maxwell, RN, PhD(c) (Doctoral Student- Vanderbilt University School of Nursing)
Email: [email protected]
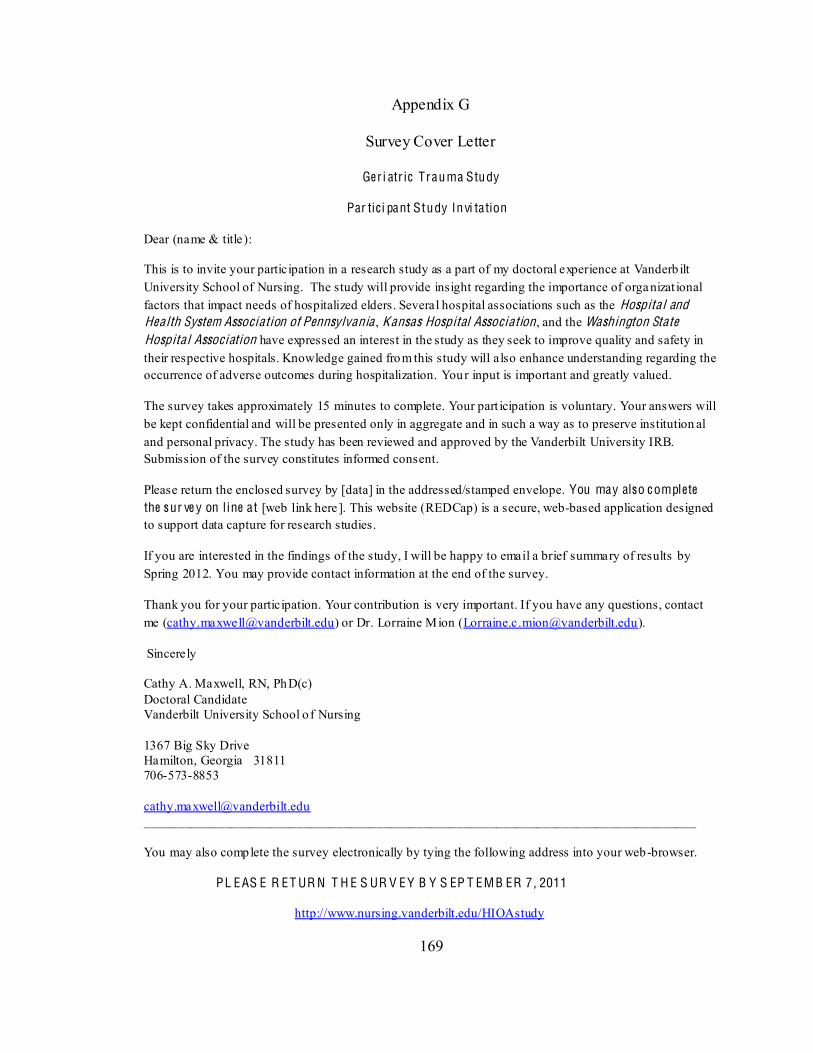
169
Appendix G
Survey Cover Letter
Ger i atr ic Trauma Study
Par tic i pant Study Invi tation
Dear (name & title):
This is to invite your participation in a research study as a part of my doctoral experience at Vanderb ilt University School of Nursing. The study will provide insight regarding the importance of organizat ional factors that impact needs of hospitalized elders. Several hospital associations such as the Hospi tal and Heal th System Assoc ia t ion of Pennsylvania , Kansas Hospi tal Assoc ia t ion, and the Washington Sta te Hospi tal Assoc iat ion have expressed an interest in the study as they seek to improve quality and safety in their respective hospitals. Knowledge gained from this study will also enhance understanding regarding the occurrence of adverse outcomes during hospitalization. Your input is important and greatly valued.
The survey takes approximately 15 minutes to complete. Your part icipation is voluntary. Your answers will be kept confidential and will be presented only in aggregate and in such a way as to preserve institution al and personal privacy. The study has been reviewed and approved by the Vanderbilt University IRB. Submission of the survey constitutes informed consent.
Please return the enclosed survey by [data] in the addressed/stamped envelope. You may also c omplete the sur ve y on l ine at [web link here]. This website (REDCap) is a secure, web-based application designed to support data capture for research studies.
If you are interested in the findings of the study, I will be happy to email a brief summary of results by Spring 2012. You may provide contact information at the end of the survey.
Thank you for your participation. Your contribution is very important. If you have any questions, contact me ([email protected]) or Dr. Lorraine Mion ([email protected]).
Sincerely
Cathy A. Maxwell, RN, PhD(c) Doctoral Candidate Vanderbilt University School o f Nursing 1367 Big Sky Drive Hamilton, Georgia 31811 706-573-8853 [email protected] ___________________________________________________________________________________ You may also complete the survey electronically by tying the following address into your web-browser.
PL EAS E R ET UR N T H E S UR V EY B Y S EP T EMB ER 7 , 2011
http://www.nursing.vanderbilt.edu/HIOAstudy
170
Appendix H
Follow up Cover Letter (2nd mailing)
Ger i atr ic Trauma Study
Par tic i pant Study Invi tation
Dear (name & title):
A survey was mailed to you over the past two weeks that may provide insight on the importance of particular o rganizat ional factors, including nursing-specific elements that impact needs of hospitalized elders. If you have already completed the survey, please disregard this letter. Knowledge gained from the study will enhance understanding regarding the occurrence of adverse events during hospitalization. Your participation as chief nursing officer is important and valued.
The survey takes approximately 15 minutes to complete. Your part icipation is voluntary. Your answers will be kept confidential and will be presented only in aggregate and in such a way as to preserve institutional and personal privacy. The study has been reviewed and approved by the Vanderbilt University IRB. Submission of the survey constitutes informed consent.
Please return the enclosed survey by [data] in the addressed/stamped envelope. You may also c omplete the sur ve y on l ine at [web link here].
If you are interested in the findings of the study, I will be happy to email a brief summary of results by Spring 2012. You may provide contact information at the end of the survey.
Thank you for your participation. Your contribution is very important. If you have any questions, contact me ([email protected]) or Dr. Lorraine Mion ([email protected]).
Sincerely,
Cathy A. Maxwell, RN, PhD(c) Doctoral Candidate Vanderbilt University School o f Nursing 1367 Big Sky Drive Hamilton, Georgia 31811 706-573-8853 [email protected] ___________________________________________________________________________________ You may also complete the survey electronically by tying the following address into your web -browser.
PL EAS E R ET UR N T H E S UR V EY B Y S EP T EMB ER 17 , 2011
http://www.nursing.vanderbilt.edu/HIOAstudy
171
Follow up Cover Letter (3rd mailing)
Ger i atr ic Trauma Study
Par tic i pant Study Invi tation
Dear (name & title):
An important survey related to care of hospitalized elders was mailed to you over the past few weeks. This is a final appeal for your part icipation to contribute to nursing research that may advance understanding of the needs of older patients, as well as factors related to occurrence of adverse events. Your input is important and greatly valued. If you have already completed this survey, I am tru ly appreciative.
The survey takes approximately 15 minutes to complete. Your part icipation is voluntary. Your answers will be kept confidential and will be presented only in aggregate and in such a way as to preserve institutional and personal privacy. The study has been reviewed and approved by the Vanderbilt University IRB. Submission of the survey constitutes informed consent.
Please return the enclosed survey by [data] in the addressed/stamped envelope. You may also c omplete the sur ve y on l ine at [web link here].
If you are interested in the findings of the study, I will be happy to email a brief summary of resu lts by Spring 2012. You may provide contact information at the end of the survey.
Thank you for your participation. Your contribution is very important. If you have any questions, contact me ([email protected]) or Dr. Lorraine Mion ([email protected]).
Sincerely,
Cathy A. Maxwell, RN, PhD(c) Doctoral Candidate Vanderbilt University School o f Nursing 1367 Big Sky Drive Hamilton, Georgia 31811 706-573-8853 [email protected] ___________________________________________________________________________________ You may also complete the survey electronically by tying the following address into your web-browser.
PL EAS E R ET UR N T H E S UR V EY B Y S EP T EMB ER 27, 2011
http://www.nursing.vanderbilt.edu/HIOAstudy
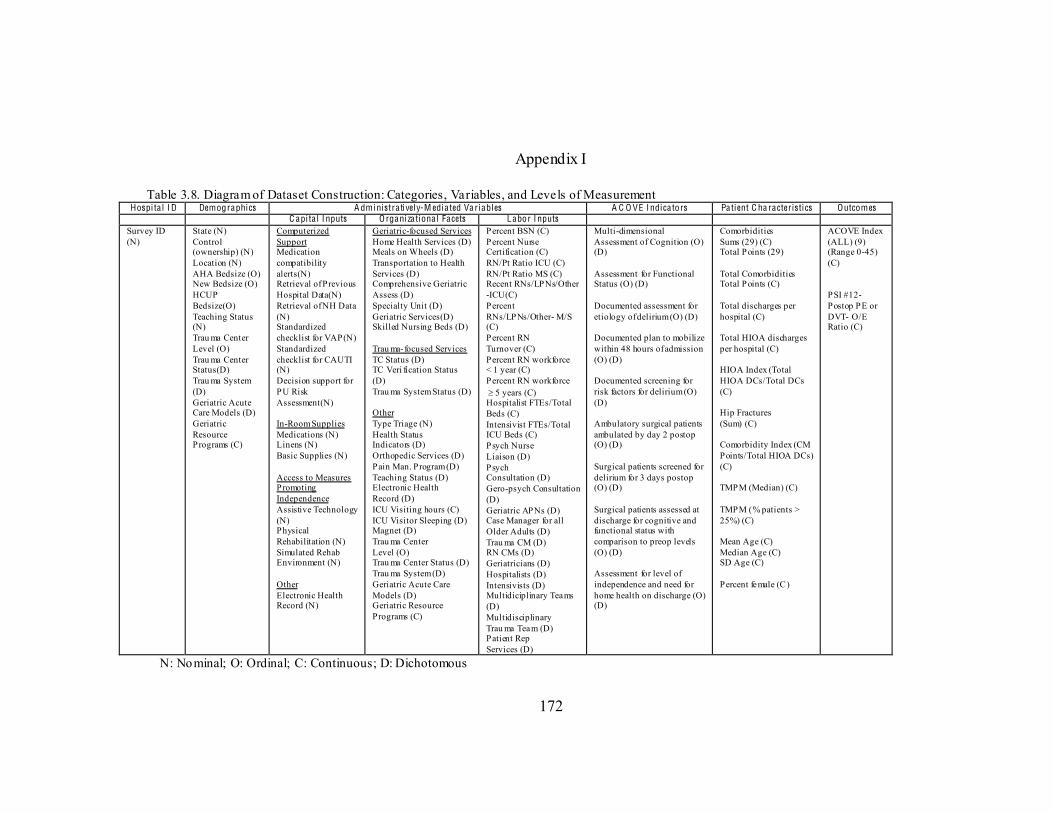
172
Appendix I
Table 3.8. Diagram of Dataset Construction: Categories, Variables, and Levels of Measurement Hospi ta l I D Demographics A dministra ti vel y-M edia ted Va riables A C O VE I ndica tors Pa tient C ha racter istics Outcomes
C api ta l I nputs O rganiza tiona l Facets Labor I nputs Survey ID (N)
State (N) Control (ownership) (N) Location (N) AHA Bedsize (O) New Bedsize (O) HCUP Bedsize(O) Teaching Status (N) Trau ma Center Level (O) Trau ma Center Status(D) Trau ma System (D) Geriatric Acute Care Models (D) Geriatric Resource Programs (C)
Computerized Support Medication compatibility alerts(N) Retrieval of Previous Hospital Data(N) Retrieval of NH Data (N) Standardized checklist for VAP(N) Standardized checklist for CAUTI (N) Decision support for PU Risk Assessment(N) In-Room Supplies Medications (N) Linens (N) Basic Supplies (N) Access to Measures Promoting Independence Assistive Technology (N) Physical Rehabilitation (N) Simulated Rehab Environment (N) Other Electronic Health Record (N)
Geriatric-focused Services Home Health Services (D) Meals on Wheels (D) Transportation to Health Services (D) Comprehensive Geriatric Assess (D) Specialty Unit (D) Geriatric Services(D) Skilled Nursing Beds (D) Trau ma- focused Services TC Status (D) TC Veri fication Status (D) Trau ma System Status (D) Other Type Triage (N) Health Status Indicators (D) Orthopedic Services (D) Pain Man. Program (D) Teaching Status (D) Electronic Health Record (D) ICU Visiting hours (C) ICU Visitor Sleeping (D) Magnet (D) Trau ma Center Level (O) Trau ma Center Status (D) Trau ma System (D) Geriatric Acute Care Models (D) Geriatric Resource Programs (C)
Percent BSN (C) Percent Nurse Certification (C) RN/Pt Ratio ICU (C) RN/Pt Ratio MS (C) Recent RNs/LPNs/Other -ICU(C) Percent RNs/LPNs/Other- M/S (C) Percent RN Turnover (C) Percent RN workforce < 1 year (C) Percent RN workforce 5 years (C) Hospitalist FTEs/Total Beds (C) Intensivist FTEs/Total ICU Beds (C) Psych Nurse Liaison (D) Psych Consultation (D) Gero-psych Consultation (D) Geriatric APNs (D) Case Manager for all Older Adults (D) Trau ma CM (D) RN CMs (D) Geriatricians (D) Hospitalists (D) Intensivists (D) Multidiciplinary Teams (D) Multidisciplinary Trau ma Team (D) Patient Rep Services (D)
Multi-dimensional Assessment of Cognition (O) (D) Assessment for Functional Status (O) (D) Documented assessment for etiology of delirium (O) (D) Documented plan to mobilize within 48 hours of admission (O) (D) Documented screening for risk factors for delirium (O) (D) Ambulatory surgical patients ambulated by day 2 postop (O) (D) Surgical patients screened for delirium for 3 days postop (O) (D) Surgical patients assessed at discharge for cognitive and functional status with comparison to preop levels (O) (D) Assessment for level of independence and need for home health on discharge (O) (D)
Comorbidities Sums (29) (C) Total Points (29) Total Comorbidities Total Points (C) Total discharges per hospital (C) Total HIOA discharges per hospital (C) HIOA Index (Total HIOA DCs/Total DCs (C) Hip Fractures (Sum) (C) Comorbidity Index (CM Points/Total HIOA DCs) (C) TMPM (Median) (C) TMPM (% patients > 25%) (C) Mean Age (C) Median Age (C) SD Age (C) Percent female (C)
ACOVE Index (ALL) (9) (Range 0-45) (C) PSI #12- Postop PE or DVT- O/E Ratio (C)
N: Nominal; O: Ordinal; C: Continuous; D: Dichotomous
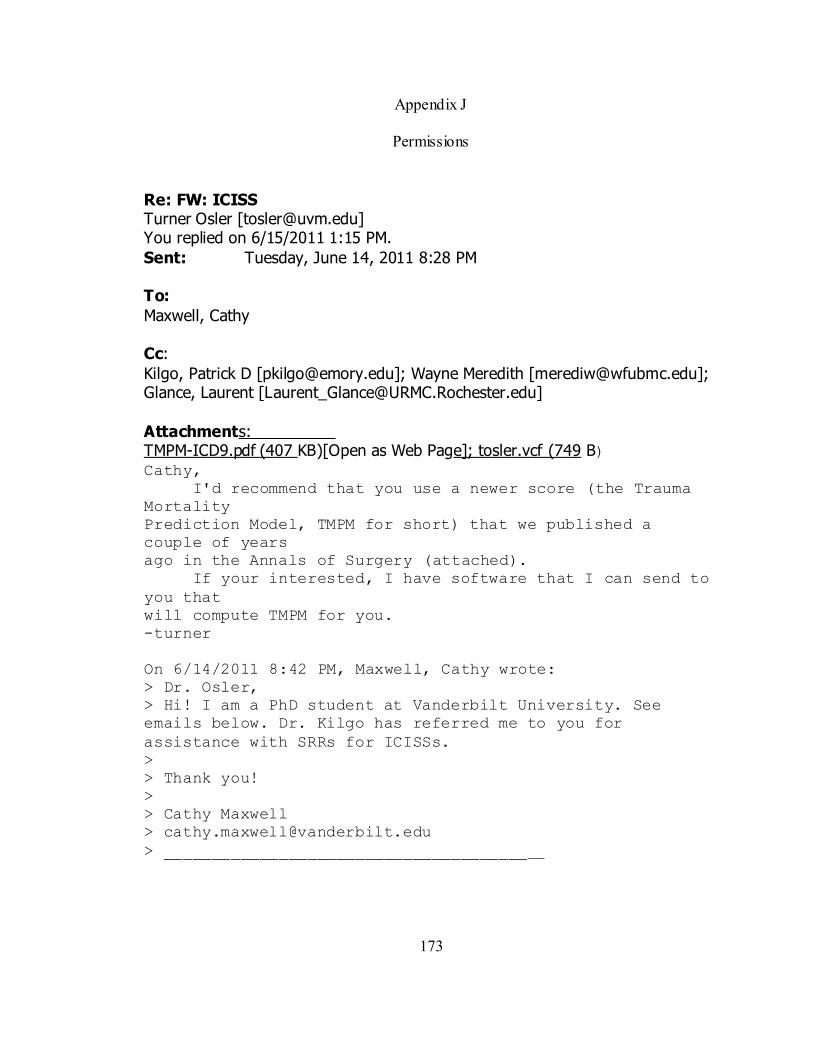
173
Appendix J
Permissions Re: FW: ICISS Turner Osler [[email protected]] You replied on 6/15/2011 1:15 PM. Sent: Tuesday, June 14, 2011 8:28 PM To: Maxwell, Cathy Cc: Kilgo, Patrick D [[email protected]];; Wayne Meredith [[email protected]];; Glance, Laurent [[email protected]] Attachments: TMPM-ICD9.pdf (407 KB)[Open as Web Page];; tosler.vcf (749 B) Cathy, I'd recommend that you use a newer score (the Trauma Mortality Prediction Model, TMPM for short) that we published a couple of years ago in the Annals of Surgery (attached). If your interested, I have software that I can send to you that will compute TMPM for you. -turner On 6/14/2011 8:42 PM, Maxwell, Cathy wrote: > Dr. Osler, > Hi! I am a PhD student at Vanderbilt University. See emails below. Dr. Kilgo has referred me to you for assistance with SRRs for ICISSs. > > Thank you! > > Cathy Maxwell > [email protected] > ________________________________________
174
RE: request Van Walraven, Carl [[email protected]] Sent: Sunday, January 29, 2012 7:42 AM To: Maxwell, Cathy Dear Dr. Maxwell: Thanks for the letter. I'm glad to hear that the index worked out well. The index is open to all;; you can use it in any publication. Best of luck with your dissertation. Carl
175
References
AcademyHealth. (2008). What is HSR? Retrieved 06/05/2011, from
http://www.academyhealth.org/About/content.cfm?ItemNumber=831&navItemNumber=514
Agency for Healthcare Research and Quality (AHRQ). (2003a). AHRQ's patient safety initiative: Building foundations, reducing risk: Interim report to the senate committee on appropriations Retrieved 06/05/2011, from http://www.ahrq.gov/qual/pscongrpt/
Agency for Healthcare Research and Quality (AHRQ). (2003b). Patient safety and quality: An evidence-based handbook for nurses Retrieved 06/05/2011, from http://www.ahrq.gov/qual/nurseshdbk/
Agency for Healthcare Research and Quality (AHRQ). (2007a). Guide to patient safety indicators (Version 3.0). Retrieved 09/05/2011, from http://www.qualityindicators.ahrq.gov/downloads/software/sas/v30a/psi_guide_v30a.pdf
Agency for Healthcare Research and Quality (AHRQ). (2007b). Nurse staffing and quality of patient care Retrieved 06/05/2011, from http://www.ahrq.gov/clinic/tp/nursesttp.htm
Agency for Healthcare Research and Quality (AHRQ). (2008). Hcup net nationwide in-patient sample. National statistics. Retrieved 06/05/2011, from http://hcupnet.ahrq.gov
Agency for Healthcare Research and Quality (AHRQ). (2009). Hcup net nationwide in-patient sample, national statistics. Retrieved 06/05/2011, from http://hcupnet.ahrq.gov
Agency for Healthcare Research and Quality (AHRQ). (2010). 2010 national healthcare quality & disparities report. Retrieved 06/05/2011, from http://www.ahrq.gov/qual/qrdr10.htm
Aiken, L. H., Clarke, S. P., Sloane, D. M., Lake, E. T., & Cheney, T. (2008). Effects of hospital care environment on patient mortality and nurse outcomes. The Journal of nursing administrat ion, 38(5), 223-229. doi: 10.1097/01.NNA.0000312773.42352.d7
Aiken, L. H., Havens, D. S., & Sloane, D. M. (2009). The magnet nursing services recognition program: A comparison of two groups of magnet hospitals. Journa l of Nursing Administrat ion, 39(7/8), S5-S14. doi: 10.1097/NNA.0b013e3181aeb469
176
American Hosptial Association (AHA). (2010). AHA data, insights, resources: Health care statistics & market research: AHA data. Retrieved 06/05/2011, from http://www.ahadata.com/ahadata/html/ahahf.html
Andreou, R. E., Koru-Sengul, T., Linkins, L., Bates, S. M., Ginsberg, J. S., & Kearon, C. (2008). Differences in clinical presentation of deep vein thrombosis in men and women. Journa l of Thrombosis and Haemostasis, 6(10), 1713-1719. doi: 10.1111/j.1538-7836.2008.03110.x
Ang, D. N., Rivara, F. P., Nathens, A., Jurkovich, G. J., Maier, R. V., Wang, J., & MacKenzie, E. J. (2009). Complication rates among trauma centers. Journal of the American College of Surgeons, 209(5), 595-602. doi: 10.1016/j.jamcollsurg.2009.08.003
Arora, V. M., Johnson, M., Olson, J., Podrazik, P. M., Levine, S., DuBeau, C. E., . . . Meltzer, D. O. (2007). Using assessing care of vulnerable elders quality indicators to measure quality of hospital care for vulnerable elders. Journal of the American Geriatrics Society, 55(11), 1705-1711. doi: 10.1111/j.1532-5415.2007.01444.x
Arora, V. M., Plein, C., Chen, S., Siddique, J., Sachs, G. A., & Meltzer, D. O. (2009). Relationship between quality of care and functional decline in hospitalized vulnerable elders. Medical Care, 47(8), 895-901. doi: 10.1097/MLR.0b013e3181a7e3ec
Bachmann, S., Finger, C., Huss, A., Egger, M., Stuck, A. E., & Clough-Gorr, K. M. (2010). Inpatient rehabilitation specifically designed for geriatric patients: Systematic review and meta-analysis of randomised controlled trials. Brit ish Medical Journal, 340, c1718. doi: 10.1136/bmj.c1718
Bakker, F. C., Robben, S. H. M., & Olde Rikkert, M. G. M. (2011). Effects of hospital-wide interventions to improve care for frail older inpatients: A systematic review. BMJ Qual ity & Safety, 20(8), 680-691. doi: 10.1136/bmjqs.2010.047183
Bean, J. F., Kiely, D. K., LaRose, S., Goldstein, R., Frontera, W. R., & Leveille, S. G. (2010). Are changes in leg power responsible for clinically meaningful improvements in mobility in older adults? Journa l of the American Geriatrics Society, 58(12), 2363-2368. doi: 10.1111/j.1532-5415.2010.03155.x
Berwick, D. M., & Kotagal, M. (2004). Restricted visiting hours in ICUs. JAMA: The Journal of the American Medical Associat ion, 292(6), 736-737. doi: 10.1001/jama.292.6.736
Bochicchio, G. V., Joshi, M., Knorr, K. M., & Scalea, T. M. (2001). Impact of nosocomial infections in trauma: Does age make a difference? The Journal of Trauma and Acute Care Surgery, 50(4), 612-619. doi: 10.1097/00005373-200104000-00004
177
Bowles, K. H., Holmes, J. H., Ratcliffe, S. J., Liberatore, M., Nydick, R., & Naylor, M. D. (2009). Factors identified by experts to support decision making for post acute referral. Nurs ing Research, 58(2), 115-122. doi: 10.1097/NNR.0b013e318199b52a
Brady Germain, P., & Cummings, G. G. (2010). The influence of nursing leadership on nurse performance: A systematic literature review. Journal of Nursing Management , 18(4), 425-439. doi: 10.1111/j.1365-2834.2010.01100.x
Callahan, E., Thomas, D., Goldhirsch, S., & Leipzig, R. (2002). Geriatric hospital medicine. The Medical c lin ics of North America, 86(4), 707-729.
Campbell, S. E., Seymour, D. G., Primrose, W. R., & ACME plus project. (2004). A systematic literature review of factors affecting outcome in older medical patients admitted to hospital. Age and Ageing, 33(2), 110-115. doi: 10.1093/ageing/afh036
Celso, B., Tepas, J., Langland-Orban, B., Pracht, E., Papa, L., Lottenberg, L., & Flint, L. (2006). A systematic review and meta-analysis comparing outcome of severely injured patients treated in trauma centers following the establishment of trauma systems. The Journa l of Trauma and Acute Care Surgery, 60(2), 371-378. doi: 10.1097/01.ta.0000197916.99629.eb
Centers for Disease Control and Prevention (CDC). (2009). Web-based injury statistics query and reporting system (WISQARSTM). Retrieved 09/05/2011, from http://www.cdc.gov/injury/wisqars/index.html
Chang, D. C., Handly, N., Abdullah, F., Efron, D. T., Haut, E. R., Haider, A. H., . . . Cornwell, E. E. (2008). The occurrence of potential patient safety events among trauma patients: Are they random? Annals of Surgery, 247(2), 327-334. doi: 10.1097/SLA.0b013e31815aab0d
Chang, E., Hancock, K., Hickman, L., Glasson, J., & Davidson, P. (2006). Outcomes of acutely ill older hospitalized patients following implementation of tailored models of care: A repeated measures (pre- and post-intervention) design. Internat ional Journal of Nursing Studies, 44(7), 1079-1092. doi: 10.1016/j.ijnurstu.2006.04.017
Chiasson, T. C., Manns, B. J., & Stelfox, H. T. (2009). An economic evaluation of venous thromboembolism prophylaxis strategies in critically ill trauma patients at risk of bleeding. PLoS Medic ine, 6(6), e1000098. doi: 10.1371/journal.pmed.1000098
Choiniere, D. B. (2010). The effects of hospital noise. Nursing Administrat ion Quarterly, 34(4), 327-333. doi: 10.1097/NAQ.0b013e3181f563db
Chong, C., Savige, J., & Lim, W. (2010). Medical problems in hip fracture patients. Archives of Orthopaedic and Trauma Surgery, 130(11), 1355-1361. doi: 10.1007/s00402-009-1038-y
178
Chudyk, A. M., Jutai, J. W., Petrella, R. J., & Speechley, M. (2009). Systematic review of hip fracture rehabilitation practices in the elderly. Archives of Physical Medic ine and Rehabi litat ion, 90(2), 246-262. doi: 10.1016/j.apmr.2008.06.036
Clancy, C. M. (2009). Ten years after to err is human. Amer ican Journal of Medical Quality, 24(6), 525-528. doi: 10.1177/1062860609349728
Clark, D. E., & Chu, M. K. (2002). Increasing importance of the elderly in a trauma system. The Amer ican journal of emergency medicine, 20(2), 108-111. doi: 10.1053/ajem.2002.31576
Clark, D. E., DeLorenzo, M. A., Lucas, F. L., & Wennberg, D. E. (2005). Injuries among older americans with and without Medicare. American Journa l of Public Health, 95(2), 273-278. doi: 10.2105/ajph.2003.036871
Cole, M. G., McCusker, J., Elie, M., Dendukuri, N., Latimer, E., & Belzile, E. (2006). Systematic detection and multidisciplinary care of depression in older medical inpatients: A randomized trial. Canadian Medical Associat ion Journa l, 174(1), 38-44. doi: 10.1503/cmaj.050519
Comfort, E. H. (2008). Reducing pressure ulcer incidence through braden scale risk assessment and support surface use. Advances in Sk in & Wound Care, 21(7), 330-334. doi: 10.1097/01.ASW.0000323519.08306.ea
Costa Jr, P., Williams, T., Somerfield, M., Albert, M., Folstein, M., Gilman, S., . . . Kaszniak, A. (1996). Recognition and initial assessment of Alzheimer's disease and related dementias. Clinical practice guideline no. 19. Rockville, MD: US Department of Health and Human Services, Public Health Service, Agency for Health Care Policy and Research.
Cram, P., Vaughan-Sarrazin, M., & Rosenthal, G. (2007). Hospital characteristics and patient populations served by physician owned and non physician owned orthopedic specialty hospitals. BMC Health Services Research, 7(1), 155. doi: 10.1186/1472-6963-7-155
Creditor, M. C. (1993). Hazards of hospitalization of the elderly. Anna ls of Internal Medicine, 118(3), 219-223. doi: 10.1059/0003-4819-118-3-199302010-00011
Curtis, K., Lien, D., Chan, A., Grove, P., & Morris, R. (2002). The impact of trauma case management on patient outcomes. The Journa l of Trauma and Acute Care Surgery, 53(3), 477-482. doi: 10.1097/00005373-200209000-00014
De Castro, A. B., Fujishiro, K., Rue, T., Tagalog, E. A., Samaco-Paquiz, L. P. G., & Gee, G. C. (2010). Associations between work schedule characteristics and occupational injury and illness. Internat iona l Nursing Review, 57(2), 188-194. doi: 10.1111/j.1466-7657.2009.00793.x
179
de Jonghe, J. F. M., Kalisvaart, K. J., Dijkstra, M., van Dis, H., Vreeswijk, R., Kat, M. G., . . . van Gool, W. A. (2007). Early symptoms in the prodromal phase of delirium: A prospective cohort study in elderly patients undergoing hip surgery. American Journal of Geriatric Psychiatry, 15(2), 112-121. doi: 10.1097/01.JGP.0000241002.86410.c2
de Saint-C. (2010). Predicting functional adverse outcomes in hospitalized older patients: A systematic review of screening tools. The Journal of Nutrit ion, Hea lth & Aging, 14(5), 394-399. doi: 10.1007/s12603-010-0086-x
de Saint-Hubert, M., Schoevaerdts, D., Poulain, G., Cornette, P., & Swine, C. (2009). Risk factors predicting later functional decline in older hospitalized patients. Acta C linica Belg ica, 64(3), 187-194.
Delaney, C., Zutshi, M., Senagore, A., Remzi, F., Hammel, J., & Fazio, V. (2003). Prospective, randomized, controlled trial between a pathway of controlled rehabilitation with early ambulation and diet and traditional postoperative care after laparotomy and intestinal resection. Diseases of the Colon and Rectum, 46(7), 851-859. doi: 10.1007/s10350-004-6672-4
Dillman, D. A., Smyth, J. D., & Christian, L. M. (2008). Internet , mail, and mixed-mode surveys: The tailored des ign method. Hoboken, NJ: Wiley Publishing.
Dunton, N., Gajewski, B., Klaus, S., & Pierson, B. (2007). The relationship of nursing workforce characteristics to patient outcomes. Online J Issues Nurs, 12(3), 1-15. Retrieved from http://www.medscape.com/viewarticle/569394
Eccles, M., Clarke, J., Livingston, M., Freemantle, N., & Mason, J. (1998). North of England evidence based guidelines development project: Guideline for the primary care management of dementia. Br it ish Medical Journal, 317(7161), 802-808. doi: 10.1136/bmj.317.7161.802
Edwards, P., Roberts, I., Clarke, M., DiGuiseppi, C., Pratap, S., Wentz, R., . . . Cooper, R. (2009). Methods to increase response rates to postal questionnaires. Cochrane Database System Review, 3, 1465. doi: 10.1002/14651858.MR000008.pub4
Elie, M., Cole, M. G., Primeau, F. J., & Bellavance, F. (1998). Delirium risk factors in elderly hospitalized patients. Journal of General Internal Medicine, 13(3), 204-212. doi: 10.1046/j.1525-1497.1998.00047.x
Elixhauser, A., Steiner, C., Harris, D. R., & Coffey, R. M. (1998). Comorbidity measures for use with administrative data. Medical Care, 36(1), 8-27.
Comprehensive geriatric assessment for older adults admitted to hospital. Cochrane Database System Review, 7. Retrieved from
180
http://onlinelibrary.wiley.com/doi/10.1002/14651858.CD006211.pub2/abstract doi:10.1002/14651858.CD006211.pub2
Ely, E. W., Inouye, S. K., Bernard, G. R., Gordon, S., Francis, J., May, L., . . . Dittus, R. (2001). Delirium in mechanically ventilated patients. JAMA : The Journal of the American Medica l Associat ion, 286(21), 2703-2710. doi: 10.1001/jama.286.21.2703
Fallon, W. F. J., Rader, E., Zyzanski, S., Mancuso, C., Martin, B., Breedlove, L., . . . Campbell, J. (2006). Geriatric outcomes are improved by a geriatric trauma consultation service. The Journal of Trauma and Acute Care Surgery, 61(5), 1040-1046. doi: 10.1097/01.ta.0000238652.48008.59
Farmer, T. C., Reynolds, C. F., & Cleary, P. D. (2008). Quality of depression care for people with coincident chronic medical conditions. Genera l Hospital Psychiatry, 30(6), 528-535. doi: 10.1016/j.genhosppsych.2008.07.002
Fields, S. D., MacKenzie, C. R., Charlson, M. E., & Perry, S. W. (1986). Reversibility of cognitive impairment in medical inpatients. Archives of Internal Medicine, 146(8), 1593-1596. doi: 10.1001/archinte.1986.00360200165027
Fink, A. (2009). How to conduct surveys: A step-by-step guide. Thousand Oaks, CA: Sage Publications, Inc.
Fisher, S. R., Kuo, Y.-f., Graham, J. E., Ottenbacher, K. J., & Ostir, G. V. (2010). Early ambulation and length of stay in older adults hospitalized for acute illness. Archives of Internal Medicine, 170(21), 1942-1943. doi: 10.1001/archinternmed.2010.422
Flynn, M., & McKeown, M. (2009). Nurse staffing levels revisited: A consideration of key issues in nurse staffing levels and skill mix research. Journal of Nursing Management , 17(6), 759-766. doi: 10.1111/j.1365-2834.2009.01023.x
Fowler, F. J. (2009). Survey resea rch methods. Thousand Oaks, CA: Sage Publications, Inc.
Friedman, S. M., Mendelson, D. A., Bingham, K. W., & Kates, S. L. (2009). Impact of a comanaged geriatric fracture center on short-term hip fracture outcomes. Archives of Internal Medicine, 169(18), 1712-1717. doi: 10.1001/archinternmed.2009.321
Friese, C. R., Lake, E. T., Aiken, L. H., Silber, J. H., & Sochalski, J. (2008). Hospital nurse practice environments and outcomes for surgical oncology patients. Hea lth Services Research, 43(4), 1145-1163. doi: 10.1111/j.1475-6773.2007.00825.x
Furukawa, M. F., Raghu, T. S., & Shao, B. B. M. (2010). Electronic medical records, nurse staffing, and nurse-sensitive patient outcomes: Evidence from California
181
hospitals, 1998 2007. Health Services Research, 45(4), 941-962. doi: 10.1111/j.1475-6773.2010.01110.x
Gaugler, J., Duval, S., Anderson, K., & Kane, R. (2007). Predicting nursing home admission in the U.S.: A meta-analysis. BMC Geriatrics, 7(13), 1-14. doi: 10.1186/1471-2318-7-13
Geerts, W. H., Code, K. I., Jay, R. M., Chen, E., & Szalai, J. P. (1994). A prospective study of venous thromboembolism after major trauma. New England Journal of Medicine, 331(24), 1601-1606. doi: 10.1056/NEJM199412153312401
Glance, L. G., Osler, T. M., Mukamel, D. B., Meredith, W., & Dick, A. W. (2011). Expert consensus vs empirical estimation of injury severity: Effect on quality measurement in trauma. Archives of Surgery, 144(4), 326-332. doi: 10.1001/archsurg.2009.8
Glance, L. G., Osler, T. M., Mukamel, D. B., Meredith, W., Wagner, J., & Dick, A. W. (2009). TMPM-ICD9: A trauma mortality prediction model based on ICD-9-cm codes. Annals of Surgery, 249(6), 1032-1039. doi: 10.1097/SLA.0b013e3181a38f28
Goode, C. J., Pinkerton, S., McCausland, M. P., Southard, P., Graham, R., & Krsek, C. (2001). Documenting chief nursing officers' preference for BSN-prepared nurses. Journal of Nursing Administrat ion, 31(2), 55-59.
Gorra, A., Clark, D., Mullins, R., & DeLorenzo, M. (2008). Regional variation in hospital mortality and 30-day mortality for injured Medicare patients. World Journal of Surgery, 32(6), 954-959. doi: 10.1007/s00268-007-9410-y
Gravelle, H., Dusheiko, M., Sheaff, R., Sargent, P., Boaden, R., Pickard, S., . . . Roland, M. (2007). Impact of case management (Evercare) on frail elderly patients: Controlled before and after analysis of quantitative outcome data. BMJ, 334(7583), 31. doi: 10.1136/bmj.39020.413310.55
Gregory, J. J., Kostakopoulou, K., Cool, W. P., & Ford, D. J. (2010). One-year outcome for elderly patients with displaced intracapsular fractures of the femoral neck managed non-operatively. Injury, 41(12), 1273-1276. doi: 10.1016/j.injury.2010.06.009
Grossman, M., Scaff, D. W., Miller, D., III, J. R., Hoey, B., & Anderson, H. L. I. (2003). Functional outcomes in octogenarian trauma. The Journal of Trauma and Acute Care Surgery, 55(1), 26-32. doi: 10.1097/01.TA.0000072109.52351.0D
Halasyamani, L., Kripalani, S., Coleman, E., Schnipper, J., van Walraven, C., Nagamine, J., . . . Manning, D. (2006). Transition of care for hospitalized elderly patientsdevelopment of a discharge checklist for hospitalists. Journa l of Hospital Medicine, 1(6), 354-360. doi: 10.1002/jhm.129
182
Hall, L. M. G. (2005). Qua lity work environments for nurse and pat ient safety. Sudbury, MA: Jones & Bartlett Learning.
Harris, P. A., Taylor, R., Thielke, R., Payne, J., Gonzalez, N., & Conde, J. G. (2009). Research electronic data capture (REDCap) a metadata-driven methodology and workflow process for providing translational research informatics support. Journal of Biomedical Informat ics, 42(2), 377-381. doi: 10.1016/j.jbi.2008.08.010
Hattori, H., Kamiya, J., Shimada, H., Akiyama, H., Yasui, A., Kuroiwa, K., . . . Fukata, S. (2009). Assessment of the risk of postoperative delirium in elderly patients using E-PASS and the NEECHAM confusion scale. Internat iona l Journal of Geriatric Psychiatry, 24(11), 1304-1310. doi: 10.1002/gps.2262
Haut, E. R., Chang, D. C., Pierce, C. A., Colantuoni, E., Efron, D. T., Haider, A. H., . . . Pronovost, P. J. (2009). Predictors of posttraumatic deep vein thrombosis (DVT): Hospital practice versus patient factors-an analysis of the national trauma data bank (NTDB). The Journal of Trauma and Acute Care Surgery, 66(4), 994-1001. doi: 10.1097/TA.0b013e3181991adc
Healthcare Cost and Utilization Project (HCUP). (2009). Overview of the nationwide inpatient sample (NIS). Retrieved 09/05/2011, from http://www.hcup-us.ahrq.gov/nisoverview.jsp
Hickey, A. N. N., Clinch, D., & Groarke, E. P. (1997). Prevalence of cognitive impairment in the hospitalized elderly. Internat ional Journa l of Geriatric Psychiatry, 12(1), 27-33. doi: 10.1002/(sici)1099-1166(199701)12:1<27::aid-gps446>3.0.co;2-f
Hickman, L., Newton, P., Halcomb, E. J., Chang, E., & Davidson, P. (2007). Best practice interventions to improve the management of older people in acute care settings: A literature review. Journal of Advanced Nursing, 60(2), 113-126. doi: 10.1111/j.1365-2648.2007.04417.x
Hildreth, A. N., Enniss, T., Martin, R. S., Miller, P. R., Mitten-Long, D., Gasaway, J., . . . Meredith, J. W. (2010). Surgical intensive care unit mobility is increased after institution of a computerized mobility order set and intensive care unit mobility protocol: A prospective cohort analysis. The American Surgeon, 76(8), 818-822.
Hill, K. S. (2010). Improving quality and patient safety by retaining nursing expertise. OJIN: The Online Journal of Issues in Nursing Retrieved 09/05/2011, from http://www.medscape.com/viewarticle/729397
Holmboe, E. S., Wang, Y., Meehan, T. P., Tate, J. P., Ho, S.-Y., Starkey, K. S., & Lipner, R. S. (2008). Association between maintenance of certification examination scores and quality of care for Medicare beneficiaries. Archives of Internal Medicine, 168(13), 1396-1403. doi: 10.1001/archinte.168.13.1396
183
Hoogerduijn, J. G., Schuurmans, M. J., Duijnstee, M. S. H., De Rooij, S. E., & Grypdonck, M. F. H. (2007). A systematic review of predictors and screening instruments to identify older hospitalized patients at risk for functional decline. Journal of C linica l Nursing, 16(1), 46-57. doi: 10.1111/j.1365-2702.2006.01579.x
Hsia, R. Y., Wang, E., Saynina, O., Wise, P., Perez-Stable, E. J., & Auerbach, A. (2011). Factors associated with trauma center use for elderly patients with trauma: A statewide analysis, 1999-2008. Archives of Surgery, 146(5), 585-592. doi: 10.1001/archsurg.2010.311
Hwang, U., & Morrison, R. S. (2007). The geriatric emergency department. Journal of the American Geriatrics Society, 55(11), 1873-1876. doi: 10.1111/j.1532-5415.2007.01400.x
Inouye, S. K., Bogardus, S. T., Charpentier, P. A., Leo-Summers, L., Acampora, D., Holford, T. R., & Cooney, L. M. (1999). A multicomponent intervention to prevent delirium in hospitalized older patients. New England Journal of Medicine, 340(9), 669-676. doi: 10.1056/NEJM199903043400901
Inouye, S. K., Foreman, M. D., Mion, L. C., Katz, K. H., & Cooney, L. M., Jr. (2001). Nurses' recognition of delirium and its symptoms: Comparison of nurse and researcher ratings. Archives of Internal Medic ine, 161(20), 2467-2473. doi: 10.1001/archinte.161.20.2467
Inouye, S. K., Viscoli, C. M., Horwitz, R. I., Hurst, L. D., & Tinetti, M. E. (1993). A predictive model for delirium in hospitalized elderly medical patients based on admission characteristics. Anna ls of Internal Medicine, 119(6), 474-481. doi: 10.1059/0003-4819-119-6-199309150-00005
Institute for Clinical Systems Improvement (ICSI). (2010). Falls (acute care), prevention of (protocol) Retrieved 09/05/2011, from http://www.icsi.org/guidelines_and_more/protocols_/patient_safety___reliability_protocols/falls__acute_care___prevention_of__protocol_/falls__acute_care___prevention_of__protocol__24254.html
policies and practices: Supporting family presence and participation Retrieved 09/05/2011, from http://www.ipfcc.org/visiting.pdf
Institute of Medicine (IOM), Kohn, L. T., Corrigan, J., & Donaldson, M. S. (2000). To err is human: Bui lding a safer health system (Vol. 6). Washington, D. C.: National Academy Press.
Jayadevappa, R., Bloom, B. S., Raziano, D. B., & Lavizzo-Mourey, R. (2003). Dissemination and characteristics of acute care for elders (ACE) units in the
184
United States. Internat ional Journal of Technology Assessment in Hea lth Care, 19(01), 220-227. doi: 10.1017/S0266462303000205
Jayadevappa, R., Chhatre, S., Weiner, M., & Raziano, D. B. (2006). Health resource utilization and medical care cost of acute care elderly unit patients. Value in Health, 9(3), 186-192. doi: 10.1111/j.1524-4733.2006.00099.x
Jensen, P. H., Webster, E., & Witt, J. (2009). Hospital type and patient outcomes: An empirical examination using AMI readmission and mortality records. Hea lth Economics, 18(12), 1440-1460. doi: 10.1002/hec.1435
Jha, A. K., Li, Z., Orav, E. J., & Epstein, A. M. (2005). Care in U.S. Hospitals the hospital quality alliance program. New England Journa l of Medic ine, 353(3), 265-274. doi: 10.1056/NEJMsa051249
Kaafarani, H. M. A., Borzecki, A. M., Itani, K. M. F., Loveland, S., Mull, H. J., Hickson, K., . . . Rosen, A. K. (2011). Validity of selected patient safety indicators: Opportunities and concerns. Journa l of the American College of Surgeons, 212(6), 924-934. doi: 10.1016/j.jamcollsurg.2010.07.007
Kane, R. L., Shamliyan, T. A., Mueller, C., Duval, S., & Wilt, T. J. (2007). The association of registered nurse staffing levels and patient outcomes: Systematic review and meta-analysis. Medical Care, 45(12), 1195-1204. doi: 10.1097/MLR.0b013e3181468ca3
Kendall-Gallagher, D., & Blegen, M. A. (2009). Competence and certification of registered nurses and safety of patients in intensive care units. American Journa l of Crit ical Care, 18(2), 106-113. doi: 10.4037/ajcc2009487
Ko, F. C.-Y. (2011). The clinical care of frail, older adults. Clinics in Ger iatric Medicine, 27(1), 89-100.
Kovner, C., & Gergen, P. J. (1998). Nurse staffing levels and adverse events following surgery in U.S. Hospitals. Journal of Nursing Scholarship, 30(4), 315-321. doi: 10.1111/j.1547-5069.1998.tb01326.x
Kovner, C. T., Mezey, M., & Harrington, C. (2002). Who cares for older adults? Workforce implications of an aging society. Hea lth Affairs, 21(5), 78-89. doi: 10.1377/hlthaff.21.5.78
Kramer, M., Maguire, P. A. T., & Brewer, B. B. (2011). Clinical nurses in magnet hospitals confirm productive, healthy unit work environments. Journa l of Nursing Management , 19(1), 5-17. doi: 10.1111/j.1365-2834.2010.01211.x
Krapohl, G., Manojlovich, M., Redman, R., & Zhang, L. (2010). Nursing specialty certification and nursing-sensitive patient outcomes in the intensive care unit. American Journal of Crit ical Care, 19(6), 490-498. doi: 10.4037/ajcc2010406
185
Lang, P., Michel, J., & Zekry, D. (2009). Frailty syndrome: A transitional state in a dynamic process. Gerontology, 55(5), 539-549. doi: 10.1159/000211949
Lange, J., Wallace, M., Gerard, S., Lovanio, K., Fausty, N., & Rychlewicz, S. (2009). Effect of an acute care geriatric educational program on fall rates and nurse work satisfaction. The Journa l of Cont inuing Educat ion in Nursing, 40(8), 371-379. doi: 10.3928/00220124-20090723-03
Larsen, K., Hansen, T. B., Thomsen, B., Christiansen, T., & Søballe, K. (2009). Cost-effectiveness of accelerated perioperative care and rehabilitation after total hip and knee arthroplasty. The Journa l of Bone and Joint Surgery (American), 91(4), 761-772. doi: 10.2106/JBJS.G.01472
Leape, L., Berwick, D., Clancy, C., Conway, J., Gluck, P., Guest, J., . . . Isaac, T. (2009). Transforming healthcare: A safety imperative. Qual ity and Safety in Health Care, 18(6), 424-428. doi: 10.1136/qshc.2009.036954
Lee, H. O. W., & Cummings, G. G. (2008). Factors influencing job satisfaction of front line nurse managers: A systematic review. Journal of Nursing Management , 16(7), 768-783. doi: 10.1111/j.1365-2834.2008.00879.x
Lindenberger, E. C., Landefeld, C. S., Sands, L. P., Counsell, S. R., Fortinsky, R. H., Palmer, R. M., . . . Covinsky, K. E. (2003). Unsteadiness reported by older hospitalized patients predicts functional decline. Journa l of the American Geriatrics Society, 51(5), 621-626. doi: 10.1034/j.1600-0579.2003.00205.x
Lindquist, L., Go, L., Fleisher, J., Jain, N., & Baker, D. (2011). Improvements in cognition following hospital discharge of community dwelling seniors. Journal of General Internal Medicine, 26(7), 765-770. doi: 10.1007/s11606-011-1681-1
Lindquist, R., & Sendelbach, S. E. (2007). Maximizing safety of hosp italized elders. Crit ical Care Nursing C linics of North America, 19(3), 277-284. doi: 10.1016/j.ccell.2007.05.002
Long, L. E., Burkett, K., & McGee, S. (2009). Promotion of safe outcomes: Incorporating evidence into policies and procedures. Nurs ing C linics of North America, 44(1), 57-70. doi: 10.1016/j.cnur.2008.10.013
Longo, D., Hewett, J., Ge, B., & Schubert, S. (2007). Hospital patient safety: Characteristics of best-performing hospitals. Journal of healthcare management/American College of Healthcare Ex ecut ives, 52(3), 188-205.
Longo, D. R., Hewett, J. E., Ge, B., & Schubert, S. (2005). The long road to patient safety. JAMA : The Journal of the American Medical Assoc iat ion, 294(22), 2858-2865. doi: 10.1001/jama.294.22.2858
186
Luke, D. (2004). Mult i-level modeling: Se ries : Quant itat ive applicat ion in the socia l sciences. Thousand Oaks, CA: Sage Publications, Inc.
Lundström, M., Edlund, A., Karlsson, S., Brännström, B., Bucht, G., & Gustafson, Y. (2005). A multifactorial intervention program reduces the duration of delirium, length of hospitalization, and mortality in delirious patients. Journal of the American Geriatrics Soc iety, 53(4), 622-628. doi: 10.1111/j.1532-5415.2005.53210.x
Lynn, M. R. (1986). Determination and quantification of content validity. Nurs ing Research, 35(6), 382-385.
MacKenzie, E. J., Rivara, F. P., Jurkovich, G. J., Nathens, A. B., Frey, K. P., Egleston, B. L., . . . Scharfstein, D. O. (2006). A national evaluation of the effect of trauma-center care on mortality. New England Journal of Medic ine, 354(4), 366-378. doi: 10.1056/NEJMsa052049
MacKenzie, E. J., Rivara, F. P., Jurkovich, G. J., Nathens, A. B., Frey, K. P., Egleston, B. L., . . . Scharfstein, D. O. (2007). The national study on costs and outcomes of trauma. The Journal of Trauma and Acute Care Surgery, 63(6), S54-S67. doi: 10.1097/TA.0b013e31815acb09
MacKenzie, E. J., Weir, S., Rivara, F. P., Jurkovich, G. J., Nathens, A. B., Wang, W., . . . Salkever, D. S. (2010). The value of trauma center care. The Journal of Trauma and Acute Care Surgery, 69(1), 1-10. doi: 10.1097/TA.0b013e3181e03a21
Maggio, P. M., Brundage, S. I., Hernandez-Boussard, T., & Spain, D. A. (2009). Commitment to COT verification improves patient outcomes and financial performance. The Journa l of Trauma and Acute Care Surgery, 67(1), 190-195. doi: 10.1097/TA.0b013e3181a51b2f
Mahoney, J. E., Sager, M. A., & Jalaluddin, M. (1999). Use of an ambulation assistive device predicts functional decline associated with hospitalization. The Journa ls of Gerontology Series A: Biologica l Sciences and Medical Sciences, 54(2), M83-M88. doi: 10.1093/gerona/54.2.M83
Malone, M. L., Vollbrecht, M., Stephenson, J., Burke, L., Pagel, P., & Goodwin, J. S. (2010). Acute care for elders (ACE) tracker and e-geriatrician: Methods to disseminate ACE concepts to hospitals with no geriatricians on staff. Journa l of the American Geriatrics Society, 58(1), 161-167. doi: 10.1111/j.1532-5415.2009.02624.x
Mamon, J., Steinwachs, D. M., Fahey, M., Bone, L. R., Oktay, J., & Klein, L. (1992). Impact of hospital discharge planning on meeting patient needs after returning home. Hea lth Services Research, 27, 155-175.
187
Marcantonio, E., Ta, T., Duthie, E., & Resnick, N. M. (2002). Delirium severity and psychomotor types: Their relationship with outcomes after hip fracture repair. Journal of the American Geriatrics Society, 50(5), 850-857. doi: 10.1046/j.1532-5415.2002.50210.x
Marcantonio, E. R., Goldman, L., Mangione, C. M., Ludwig, L. E., Muraca, B., Haslauer, C. M., . . . Lee, T. H. (1994). A clinical prediction rule for delirium after elective noncardiac surgery. JAMA : The Journal of the American Medical Assoc iat ion, 271(2), 134-139. doi: 10.1001/jama.1994.03510260066030
Marcin, J. P., & Romano, P. S. (2004). Impact of between-hospital volume and within-hospital volume on mortality and readmission rates for trauma patients in California*. Crit ica l Care Medicine, 32(7), 1477-1483. doi: 10.1097/01.CCM.0000127781.08985.03
Marshall, L., Harbin, V., Hooker, J., Oswald, J., & Cummings, L. (2012). Safety net hospital performance on national quality of care process measures. Journal for Healthcare Quality, 34(2), 21-31. doi: 10.1111/j.1945-1474.2011.00186.x
Maxwell, C., & Mion, L. C. (2010, Unpublished Study-a). Availabil ity of geriatric resources : A descript ive study by states and trauma centers.
Maxwell, C., & Mion, L. C. (2010, Unpublished Study-b). Hospitalized injured older adults: A systemat ic review of predictors and outcomes.
McConnell, K. J., Newgard, C. D., Mullins, R. J., Arthur, M., & Hedges, J. R. (2005). Mortality benefit of transfer to level I versus level ii trauma centers for head-injured patients. Health Services Research, 40(2), 435-458. doi: 10.1111/j.1475-6773.2005.0u367.x
McCusker, J., Cole, M., Dendukuri, N., Belzile, É., & Primeau, F. (2001). Delirium in older medical inpatients and subsequent cognitive and functional status: A prospective study. Canadian Medical Assoc iat ion Journa l, 165(5), 575-583.
McCusker, J., Cole, M., Dendukuri, N., Han, L., & Belzile, É. (2003). The course of delirium in older medical inpatients. Journal of General Internal Medicine, 18(9), 696-704. doi: 10.1046/j.1525-1497.2003.20602.x
McCusker, J., Kakuma, R., & Abrahamowicz, M. (2002). Predictors of functional decline in hospitalized elderly patients. The Journa ls of Gerontology Series A: Biological Sciences and Medica l Sciences, 57(9), M569-M577. doi: 10.1093/gerona/57.9.M569
Menachemi, N., Chukmaitov, A., Saunders, C., & Brooks, R. G. (2008). Hospital quality of care: Does information technology matter? The relationship between information technology adoption and quality of care. Health Care Management Review, 33(1), 51-59. doi: 10.1097/01.HMR.0000304497.89684.36
188
Mezey, M., Kobayashi, M., Grossman, S., Firpo, A., Fulmer, T., & Mitty, E. (2004). Nurses improving care to health system elders (NICHE): Implementation of best practice models. Journa l of Nursing Administrat ion, 34(10), 451-457. doi: 10.1097/00005110-200410000-00005
Min, L., Yoon, W., Mariano, J., Wenger, N. S., Elliott, M. N., Kamberg, C., & Saliba, D. (2009). The vulnerable elders-13 survey predicts 5-year functional decline and mortality outcomes in older ambulatory care patients. Journa l of the American Geriatrics Society, 57(11), 2070-2076. doi: 10.1111/j.1532-5415.2009.02497.x
Minnick, A. (2001). Conducting an outcomes assessment. In R. Kleinpell (Ed.), Outcomes assessment in advanced pract ice nursing (pp. 91-102). New York: Springer.
Minnick, A., Young, W., & Roberts, M. (1995). 2,000 patients relate their hospital experiences. Nursing Management , 26(12), 25-31.
Minnick, A. F., Fogg, L., Mion, L. C., Catrambone, C., & Johnson, M. E. (2007). Resource clusters and variation in physical restraint use. Journa l of Nursing Scholarship, 39(4), 363-370. doi: 10.1111/j.1547-5069.2007.00194.x
Minnick, A. F., & Mion, L. C. (2009). Nurse labor data: The collection and interpretation of nurse to patient ratios. The Journal of nurs ing administrat ion, 39(9), 377-381. doi: 10.1097/NNA.0b013e3181b3b656
Minnick, A. F., Mion, L. C., Johnson, M. E., Catrambone, C., & Leipzig, R. (2007). Prevalence and variation of physical restraint use in acute care settings in the US. Journal of Nursing Schola rship, 39(1), 30-37. doi: 10.1111/j.1547-5069.2007.00140.x
Minnick, A. F., Roberts, M. J., Young, W. B., Kleinpell, R. M., & Marcantonio, R. J. (1997). What influences patients' reports of three aspects of hospital services? Medical Care, 35(4), 399-409.
Missildine, K., Bergstrom, N., Meininger, J., Richards, K., & Foreman, M. D. (2010). Sleep in hospitalized elders: A pilot study. Geriatric Nurs ing, 31(4), 263-271. doi: 10.1016/j.gerinurse.2010.02.013
Mittal, D., Majithia, D., Kennedy, R., & Rhudy, J. (2006). Differences in characteristics and outcome of delirium as based on referral patterns. Psychosomat ics, 47(5), 367-375. doi: 10.1176/appi.psy.47.5.367
Morris, B. A., Benetti, M., Marro, H., & Rosenthal, C. K. (2010). Clinical practice guidelines for early mobilization hours after surgery. Orthopaedic Nurs ing, 29(5), 290-316. doi: 10.1097/NOR.0b013e3181ef7a5d
189
Motamedi, S. M., Posadas-Calleja, J., Straus, S., Bates, D. W., Lorenzetti, D. L., Baylis, B., . . . Ghali, W. A. (2011). The efficacy of computer-enabled discharge communication interventions: A systematic review. BMJ Qua lity & Safety, 20(5), 403-415. doi: 10.1136/bmjqs.2009.034587
Mudge, A. M., Giebel, A. J., & Cutler, A. J. (2008). Exercising body and mind: An integrated approach to functional independence in hospitalized older people. Journal of the American Geriatrics Society, 56(4), 630-635. doi: 10.1111/j.1532-5415.2007.01607.x
Mundy, L. M., Leet, T. L., Darst, K., Schnitzler, M. A., & Dunagan, W. C. (2003). Early mobilization of patients hospitalized with community-acquired pneumonia. Chest , 124(3), 883-889. doi: 10.1378/chest.124.3.883
Munin, M. C., Rudy, T. E., Glynn, N. W., Crossett, L. S., & Rubash, H. E. (1998). Early inpatient rehabilitation after elective hip and knee arthroplasty. JAMA: The Journal of the American Medical Associat ion, 279(11), 847-852. doi: 10.1001/jama.279.11.847
Murphy, E. A. (2011). A key step for hospitalized elders: Comment on "early ambulation and length of stay in older adults hospitalized for acute illness". Archives of Internal Medicine, 171(3), 268-269. doi: 10.1001/archinternmed.2011.1
Nathens, A. B., Rivara, F. P., MacKenzie, E. J., Maier, R. V., Wang, J., Egleston, B., . . . Jurkovich, G. J. (2006). The impact of an intensivist-model ICU on trauma-related mortality. Annals of Surgery, 244(4), 545-554. doi: 10.1097/01.sla.0000239005.26353.49
Needleman, J., Buerhaus, P. I., Mattke, S., Stewart, M., Zelevinsky, K., & Health Resources Service Administration. (2001). Nurse staffing and patient outcomes in hospitals: Report no. 230-99-0021. Boston, MA: Harvard School of Public Health.
Nelson, A., Powell-Cope, G., Palacios, P., Luther, S., Black, T., Hillman, T., . . . Gross, J. (2007). Nurse staffing and patient outcomes in inpatient rehabilitation settings. Rehabi litat ion Nursing : The Off icial Journal of the Associat ion of Rehabil itat ion Nurses, 32(5), 179-202.
Neuman, M. D., Speck, R. M., Karlawish, J. H., Schwartz, J. S., & Shea, J. A. (2010). Hospital protocols for the inpatient care of older adults: Results from a statewide survey. Journal of the American Geriatrics Society, 58(10), 1959-1964. doi: 10.1111/j.1532-5415.2010.03056.x
O'Brien-Pallas, L., Li, X. M., Wang, S., Meyer, R. M., & Thomson, D. (2010). Evaluation of a patient care delivery model: System outcomes in acute cardiac care. CJNR (Canadian Journal of Nursing Resea rch), 42(4), 98-120.
190
Olds, D. M., & Clarke, S. P. (2010). The effect of work hours on adverse events and errors in health care. Journal of Safety Research, 41(2), 153-162. doi: 10.1016/j.jsr.2010.02.002
Oman, K. S., Duran, C., & Fink, R. (2008). Evidence-based policy and procedures: An algorithm for success. Journa l of Nursing Administrat ion, 38(1), 47-51. doi: 10.1097/01.NNA.0000295634.18463.4d
Papanikolaou, P. N., Christidi, G. D., & Ioannidis, J. P. A. (2006). Patient outcomes with teaching versus nonteaching healthcare: A systematic review. PLoS Med, 3(9), 1603-1615. doi: 10.1371/journal.pmed.0030341
Parrish, R. G. (2010). Measuring population health outcomes. Prevent ing Chronic Disease: Publ ic Hea lth Research, Pract ice, and Pol icy, 7(A71). Retrieved from http://www.cdc.gov/pcd/issues/2010/jul/pdf/10_0005.pdf
Patrician, P. A., Loan, L., McCarthy, M., Brosch, L. R., & Davey, K. S. (2010). Towards evidence-based management: Creating an informative database of nursing-sensitive indicators. Journal of Nursing Scholarship, 42(4), 358-366. doi: 10.1111/j.1547-5069.2010.01364.x
Pierce, C. A., Haut, E. R., Kardooni, S., Chang, D. C., Efron, D. T., Haider, A., . . . Cornwell, E. E. I. (2008). Surveillance bias and deep vein thrombosis in the national trauma data bank: The more we look, the more we find. The Journa l of Trauma and Acute Care Surgery, 64(4), 932-937. doi: 10.1097/TA.0b013e318166b808
Platts-Mills, T. F., Travers, D., Biese, K., McCall, B., Kizer, S., LaMantia, M., . . . Cairns, C. B. (2010). Accuracy of the emergency severity index triage instrument for identifying elder emergency department patients receiving an immediate life-saving intervention. Academic Emergency Medic ine, 17(3), 238-243. doi: 10.1111/j.1553-2712.2010.00670.x
Podrazik, P. M., & Whelan, C. T. (2008). Acute hospital care for the elderly patient: Its impact on clinical and hospital systems of care. Medica l C linics of North America, 92(2), 387-406. doi: 10.1016/j.mcna.2007.11.004
Polancich, S., Restrepo, E., & Prosser, J. (2006). Cautious use of administrative data for decubitus ulcer outcome reporting. American Journal of Medical Qual ity, 21(4), 262-268. doi: 10.1177/1062860606288244
Polit, D. F., & Beck, C. T. (2008). Nurs ing resea rch: Generat ing and assess ing evidence for nursing pract ice (8th ed.). Philadelphia, PA: Lippincott Williams & Wilkins.
Powell, A. E., Davies, H. T. O., & Thomson, R. G. (2003). Using routine comparative data to assess the quality of health care: Understanding and avoiding common
191
pitfalls. Qual ity and Safety in Health Care, 12(2), 122-128. doi: 10.1136/qhc.12.2.122
Prowse, M. (2007). Postoperative pain in older people: A review of the literature. Journa l of C linical Nurs ing, 16(1), 84-97. doi: 10.1111/j.1365-2702.2005.01482.x
Recinos, G., DuBose, J. J., Teixeira, P. G. R., Barmparas, G., Inaba, K., Plurad, D., . . . Belzberg, H. (2009). ACS trauma centre designation and outcomes of post-traumatic ards: NTDB analysis and implications for trauma quality improvement. Injury, 40(8), 856-859. doi: 10.1016/j.injury.2008.11.001
Reuben, D., Frank, J., Hirsch, S., McGuigan, K., & Maly, R. (1999). A randomized clinical trial of outpatient comprehensive geriatric assessment coupled with an intervention to increase adherence to recommendations. Journal of the American Geriatrics Society, 47(3), 269-276.
Riesenberg, L. A., Leisch, J., & Cunningham, J. M. (2010). Nursing handoffs: A systematic review of the literature. AJN The American Journal of Nursing, 110(4), 24-34. doi: 10.1097/01.NAJ.0000370154.79857.09
Riley, G. F. (2009). Administrative and claims records as sources of health care cost data. Medical Care, 47(7_Supplement_1), S51-S55. doi: 10.1097/MLR.0b013e31819c95aa
Rochefort, C. M., Ward, L., Ritchie, J. A., Girard, N., & Tamblyn, R. M. (2011). Registered nurses' job demands in relation to sitter use: Nested case-control study. Nursing Research, 60(4), 221-230. doi: 10.1097/NNR.0b013e318221b6ce
Rotondo, M. F., Bard, M. R., Sagraves, S. G., Toschlog, E. A., Schenarts, P. J., Goettler, C. E., . . . Robertson, M. J. (2009). What price commitment: What benefit? The cost of a saved life in a developing level I trauma center. The Journa l of Trauma and Acute Care Surgery, 67(5), 915-923. doi: 10.1097/TA.0b013e3181b848e7
Rubenstein, L., Stuck, A., Siu, A., & Wieland, D. (1991). Impacts of geriatric evaluation and management programs on defined outcomes: Overview of the evidence. Journal of the American Geriatrics Society, 39(9), 8S-16S.
Savitz, L. A., Jones, C. B., & Bernard, S. (1999). Nursing-sensitive quality indicators for acute care settings and ANA's safety and quality initiative. Retrieved 09/05/2011, from http://www.ahrq.gov/downloads/pub/advances/vol4/Savitz.pdf
Scheetz, L. J. (2005). Differences in survival, length of stay, and discharge disposition of older trauma patients admitted to trauma centers and nontrauma center hosp itals. Journal of Nursing Schola rship, 37(4), 361-366. doi: 10.1111/j.1547-5069.2005.00062.x
192
Schwartz, L. (2002). Is there an advocate in the house? The role of health care professionals in patient advocacy. Journa l of Medica l E thics, 28(1), 37-40. doi: 10.1136/jme.28.1.37
Sepucha, K. R., Fowler Jr., F. J., & Mulley Jr., A. G. (2004). Policy support for patient-centered care: The need for measurable improvements in decision quality. Hea lth Affairs. doi: 10.1377/hlthaff.var.54
Siddiqi, N., Holt, R., Britton, A., & Holmes, J. (2009). Interventions for preventing delirium in hospitalised patients. Cochrane Database of Systemat ic Reviews (Onl ine). Retrieved from http://onlinelibrary.wiley.com/doi/10.1002/14651858.CD005563.pub2/abstract doi:10.1002/14651858.CD005563.pub2
Silber, J. H., Rosenbaum, P. R., Romano, P. S., Rosen, A. K., Wang, Y., Teng, Y., . . . Volpp, K. G. (2009). Hospital teaching intensity, patient race, and surgical outcomes. Archives of Surgery, 144(2), 113-120. doi: 10.1001/archsurg.2008.569
Simunovic, N., Devereaux, P. J., Sprague, S., Guyatt, G. H., Schemitsch, E., DeBeer, J., & Bhandari, M. (2010). Effect of early surgery after hip fracture on mortality and complications: Systematic review and meta-analysis. Canadian Medica l Associat ion Journa l, 182(15), 1609-1616. doi: 10.1503/cmaj.092220
Singer, S. J., Gaba, D. M., Falwell, A., Lin, S., Hayes, J., & Baker, L. (2009). Patient safety climate in 92 US hospitals: Differences by work area and discipline. Medical Care, 47(1), 23-31. doi: 10.1097/MLR.0b013e31817e189d
Small, G. W., Rabins, P. V., Barry, P. P., Buckholtz, N. S., DeKosky, S. T., Ferris, S. H., . . . Tune, L. E. (1997). Diagnosis and treatment of Alzheimer disease and related disorders. JAMA: The Journa l of the American Medica l Associat ion, 278(16), 1363-1371. doi: 10.1001/jama.1997.03550160083043
Smith, E. B., Parvizi, J., & Purtill, J. J. (2011). Delayed surgery for patients with femur and hip fractures-risk of deep venous thrombosis. The Journa l of Trauma and Acute Care Surgery, 70(6), E113-E116. doi: 10.1097/TA.0b013e31821b8768
Squires, M. A. E., Tourangeau, A. N. N., Spence Laschinger, H. K., & Doran, D. (2010). The link between leadership and safety outcomes in hospitals. Journa l of Nursing Management , 18(8), 914-925. doi: 10.1111/j.1365-2834.2010.01181.x
Titler, M. G., Herr, K., Brooks, J. M., Xie, X.-J., Ardery, G., Schilling, M. L., . . . Clarke, W. R. (2009). Translating research into practice intervention improves management of acute pain in older hip fracture patients. Hea lth Services Research, 44(1), 264-287. doi: 10.1111/j.1475-6773.2008.00913.x
Toker, S., Hak, D. J., & Morgan, S. J. (2011). Deep vein thrombosis prophylaxis in trauma patients. Thormbos is, 40(60), 1-11. doi: 10.115/2011/505373
193
Tornetta, P., Mostafavi, H., Riina, J., Turen, C., Reimer, B., Levine, R., . . . Homel, P. (1999). Morbidity and mortality in elderly trauma patients. The Journal of Trauma and Acute Care Surgery, 46(4), 702-706.
Trinkoff, A. M., Johantgen, M., Storr, C. L., Gurses, A. P., Liang, Y., & Han, K. (2011). Nurses' work schedule characteristics, nurse staffing, and patient mortality. Nursing Research, 60(1), 1-8. doi: 10.1097/NNR.0b013e3181fff15d
Utter, G. H., Maier, R. V., Rivara, F. P., Mock, C. N., Jurkovich, G. J., & Nathens, A. B. (2006). Inclusive trauma systems: Do they improve triage or outcomes of the severely injured? The Journa l of Trauma and Acute Care Surgery, 60(3), 529-537. doi: 10.1097/01.ta.0000204022.36214.9e
Van Craen, K., Braes, T., Wellens, N., Denhaerynck, K., Flamaing, J., Moons, P., . . . Milisen, K. (2010). The effectiveness of inpatient geriatric evaluation and management units: A systematic review and meta-analysis. Journal of the American Geriatrics Soc iety, 58(1), 83-92. doi: 10.1111/j.1532-5415.2009.02621.x
van Walraven, C., Austin, P. C., Jennings, A., Quan, H., & Forster, A. J. (2009). A modification of the elixhauser comorbidity measures into a point system for hospital death using administrative data. Medica l Care, 47(6), 626-633. doi: 10.1097/MLR.0b013e31819432e5
VanGeest, J. B., Johnson, T. P., & Welch, V. L. (2007). Methodologies for improving response rates in surveys of physicians. Evaluat ion and the Health Professions, 30(4), 303-321. doi: 10.1177/0163278707307899
Vartak, S., Ward, M. M., & Vaughn, T. E. (2008). Do postoperative complications vary by hospital teaching status? Medica l Care, 46(1), 25-32. doi: 10.1097/MLR.0b013e3181484927
Vasilevskis, E. E., Knebel, R. J., Dudley, R. A., Wachter, R. M., & Auerbach, A. D. (2010). Cross-sectional analysis of hospitalist prevalence and quality of care in California. Journa l of Hospital Medic ine, 5(4), 200-207. doi: 10.1002/jhm.609
Watkin, L., Blanchard, M. R., Tookman, A., & Sampson, E. L. (2012). Prospective cohort study of adverse events in older people admitted to the acute general hospital: Risk factors and the impact of dementia. Internat ional Journa l of Geriatric Psychiatry, 27(1), 76-82. doi: 10.1002/gps.2693
Weir, S., Salkever, D. S., Rivara, F. P., Jurkovich, G. J., Nathens, A. B., & Mackenzie, E. J. (2010). One-year treatment costs of trauma care in the USA. Expert Review of Pharmacoeconomics and Outcomes Research, 10(2), 187-197. doi: 10.1586/erp.10.8
194
Wenger, N. S., Roth, C. P., Shekelle, P., & the, A. I. (2007). Introduction to the assessing care of vulnerable elders-3 quality indicator measurement set. Journal of the American Geriatrics Soc iety, 55(52), S247-S252. doi: 10.1111/j.1532-5415.2007.01328.x
Wenger, N. S., Shekelle, P. G., & ACOVE Investigators. (2001). Assessing care of vulnerable elders: ACOVE project overview. Anna ls of Internal Medicine, 135(Part 2), 642-646.
Whittington, K. T., & Briones, R. (2004). National prevalence and incidence study: 6-year sequential acute care data. Advances in Sk in & Wound Care, 17(9), 490-494.
Young, W. B., Minnick, A. F., & Marcantonio, R. (1996). How wide is the gap in defining quality care?: Comparison of patient and nurse perceptions of important aspects of patient care. Journa l of Nursing Administrat ion, 26(5), 15-20.