Embed Size (px)
Citation preview
17 1998 Annual Report
Adult Program Findings 1998
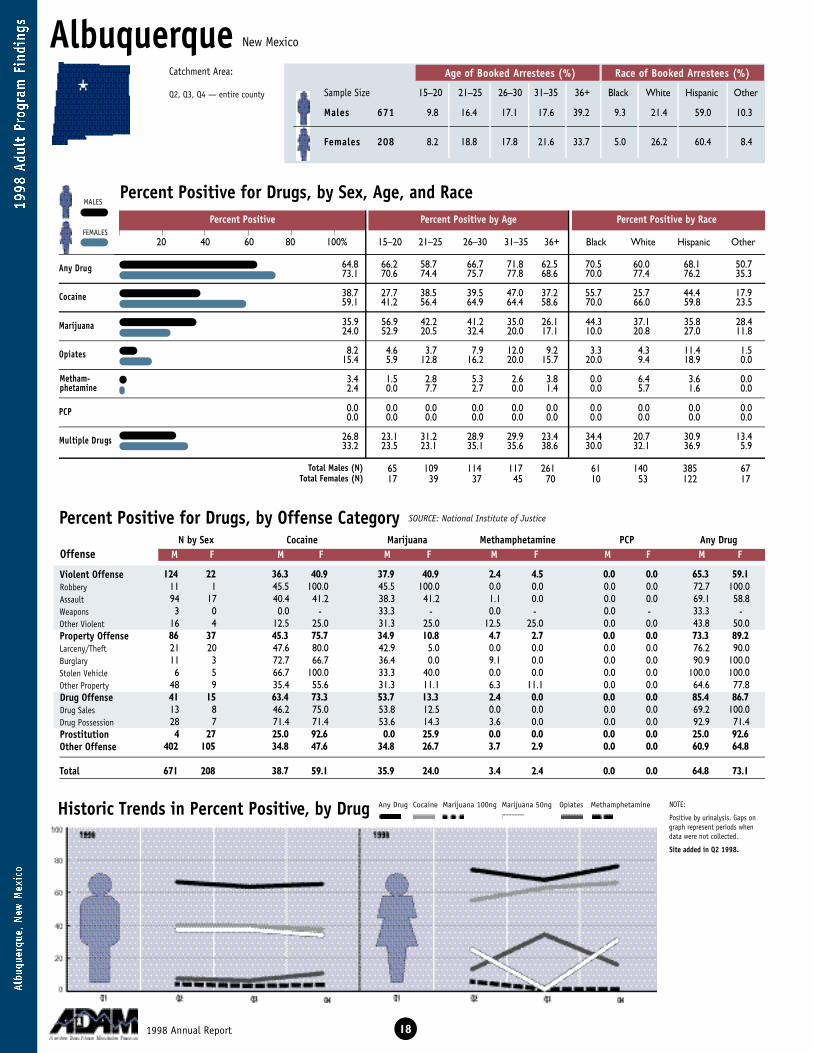
Percent Positive Percent Positive by Age Percent Positive by Race
20 40 60 80 100% 15–20 21–25 26–30 31–35 36+ Black White Hispanic Other
AlbuquerqueAge of Booked Arrestees (%) Race of Booked Arrestees (%)
Sample Size 15–20 21–25 26–30 31–35 36+ Black White Hispanic Other
Percent Positive for Drugs, by Sex, Age, and Race
Percent Positive for Drugs, by Offense Category
Historic Trends in Percent Positive, by Drug
A ny Drug
C o c a i n e
M a r i j u a n a
O p i a t e s
P C P
Multiple Drugs
NOTE:
Positive by urinalysis. Gaps ongraph represent periods whendata were not collected.
Site added in Q2 1998.
124 22 36.3 40.9 37.9 40.9 2.4 4.5 0.0 0.0 65.3 59.111 1 45.5 100.0 45.5 100.0 0.0 0.0 0.0 0.0 72.7 100.094 17 40.4 41.2 38.3 41.2 1.1 0.0 0.0 0.0 69.1 58.83 0 0.0 - 33.3 - 0.0 - 0.0 - 33.3 -
16 4 12.5 25.0 31.3 25.0 12.5 25.0 0.0 0.0 43.8 50.086 37 45.3 75.7 34.9 10.8 4.7 2.7 0.0 0.0 73.3 89.221 20 47.6 80.0 42.9 5.0 0.0 0.0 0.0 0.0 76.2 90.011 3 72.7 66.7 36.4 0.0 9.1 0.0 0.0 0.0 90.9 100.06 5 66.7 100.0 33.3 40.0 0.0 0.0 0.0 0.0 100.0 100.0
48 9 35.4 55.6 31.3 11.1 6.3 11.1 0.0 0.0 64.6 77.841 15 63.4 73.3 53.7 13.3 2.4 0.0 0.0 0.0 85.4 86.713 8 46.2 75.0 53.8 12.5 0.0 0.0 0.0 0.0 69.2 100.028 7 71.4 71.4 53.6 14.3 3.6 0.0 0.0 0.0 92.9 71.44 27 25.0 92.6 0.0 25.9 0.0 0.0 0.0 0.0 25.0 92.6
402 105 34.8 47.6 34.8 26.7 3.7 2.9 0.0 0.0 60.9 64.8
671 208 38.7 59.1 35.9 24.0 3.4 2.4 0.0 0.0 64.8 73.1
N by Sex Cocaine Marijuana Methamphetamine PCP Any DrugOffense M F M F M F M F M F M F
SOURCE: National Institute of Justice
181998 Annual Report
Any Drug Cocaine Marijuana 100ng Marijuana 50ng Opiates Methamphetamine
65 109 114 117 261 61 140 385 6717 39 37 45 70 10 53 122 17
9.8 16.4 17.1 17.6 39.2 9.3 21.4 59.0 10.3
8.2 18.8 17.8 21.6 33.7 5.0 26.2 60.4 8.4
M a l e s 6 7 1
Fe m a l e s 2 0 8
Total Males (N)Total Females (N)
Violent OffenseRobberyAssaultWeaponsOther ViolentProperty OffenseLarceny/TheftBurglaryStolen VehicleOther PropertyDrug OffenseDrug SalesDrug PossessionProstitutionOther Offense
Total
New Mexico
MALES
FEMALES
M e t h a m -p h e t a m i n e
64.8 66.2 58.7 66.7 71.8 62.5 70.5 60.0 68.1 50.773.1 70.6 74.4 75.7 77.8 68.6 70.0 77.4 76.2 35.3
38.7 27.7 38.5 39.5 47.0 37.2 55.7 25.7 44.4 17.959.1 41.2 56.4 64.9 64.4 58.6 70.0 66.0 59.8 23.5
35.9 56.9 42.2 41.2 35.0 26.1 44.3 37.1 35.8 28.424.0 52.9 20.5 32.4 20.0 17.1 10.0 20.8 27.0 11.8
8.2 4.6 3.7 7.9 12.0 9.2 3.3 4.3 11.4 1.515.4 5.9 12.8 16.2 20.0 15.7 20.0 9.4 18.9 0.0
3.4 1.5 2.8 5.3 2.6 3.8 0.0 6.4 3.6 0.02.4 0.0 7.7 2.7 0.0 1.4 0.0 5.7 1.6 0.0
0.0 0.0 0.0 0.0 0.0 0.0 0.0 0.0 0.0 0.00.0 0.0 0.0 0.0 0.0 0.0 0.0 0.0 0.0 0.0
26.8 23.1 31.2 28.9 29.9 23.4 34.4 20.7 30.9 13.433.2 23.5 23.1 35.1 35.6 38.6 30.0 32.1 36.9 5.9
Catchment Area:
Q2, Q3, Q4 — entire county

Cocaine
M a r i j u a n a
Opiates
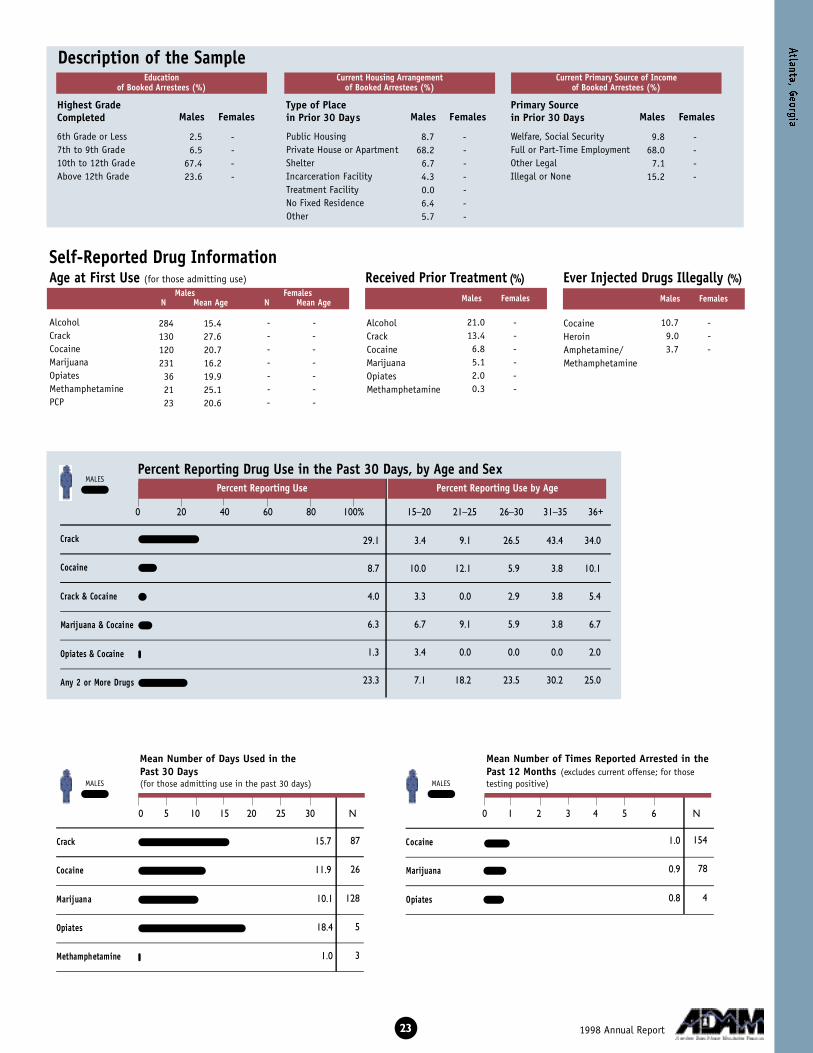
Description of the Sample
Self-Reported Drug Information
C ra c k
C o c a i n e
C rack & Cocaine
Marijuana & Cocaine
Opiates & Cocaine
A ny 2 or More Drugs
19
0 20 40 60 80 100% 15–20 21–25 26–30 31–35 36+
28.2 18.5 22.0 28.9 34.2 29.554.9 47.1 46.2 59.5 67.4 51.4
17.1 23.1 22.9 14.9 16.2 14.918.8 11.8 7.7 22.2 28.9 18.6
10.6 13.8 11.0 9.6 10.3 10.315.0 11.8 7.7 16.2 27.3 11.4
12.1 21.5 17.4 10.5 10.3 9.210.6 11.8 5.1 13.5 20.0 5.8
3.6 3.1 3.7 4.4 2.6 3.88.3 0.0 2.6 5.6 16.3 10.0
39.9 43.8 37.4 39.8 46.2 37.351.2 52.9 51.3 47.2 57.8 48.6
Highest Grade Completed
6th Grade or Less7th to 9th Grade10th to 12th GradeAbove 12th Grade
2.3 1.14.0 10.7
71.5 65.822.2 22.5
4.3 4.385.1 80.31.2 1.91.8 4.30.4 0.05.1 8.22.1 1.0
Males FemalesType of Place in Prior 30 Days
Public HousingPrivate House or ApartmentShelterIncarceration FacilityTreatment FacilityNo Fixed ResidenceOther
Males Females
7.6 19.470.4 33.08.3 11.7
13.7 35.9
Primary Sourcein Prior 30 Days
Welfare, Social SecurityFull or Part-Time EmploymentOther Legal Illegal or None
Males Females
Current Primary Source of Income of Booked Arrestees (%)
Current Housing Arrangement of Booked Arrestees (%)
Education of Booked Arrestees (%)
Males FemalesN Mean Age N Mean Age Males Females Males Females
Percent Reporting Drug Use in the Past 30 Days, by Age and SexPercent Reporting Use Percent Reporting Use by Age
Age at First Use (for those admitting use) Received Prior Treatment ( % ) Ever Injected Drugs Illegally ( % )
MALES
FEMALES
C ra c k
C o c a i n e
M a r i j u a n a
O p i a t e s
M e t h a m p h e t a m i n e
0 5 10 15 20 25 30 N
Mean Number of Days Used in the Past 30 Days(for those admitting use in the past 30 days)
12.617.7
6.88.7
12.210.3
15.920.9
9.78.8
189113
11539
32893
8842
6323
1.41.8
1.51.4
1.42.1
257123
24050
5532
1998 Annual Report
651 13.9336 26.1410 20.4572 14.4195 21.8244 21.0109 18.8
202 14.8141 24.8137 20.9177 14.882 23.468 21.034 16.8
AlcoholCrackCocaineMarijuanaOpiatesMethamphetaminePCP
35.4 29.88.7 20.37.8 12.58.5 6.37.3 16.53.3 5.3
AlcoholCrackCocaineMarijuanaOpiatesMethamphetamine
20.3 28.822.5 30.813.1 14.4
CocaineHeroinAmphetamine/Methamphetamine
MALES
FEMALES
0 1 2 3 4 5 6 N
Mean Number of Times Reported Arrested in thePast 12 Months (excludes current offense; for thosetesting positive)
MALES
FEMALES
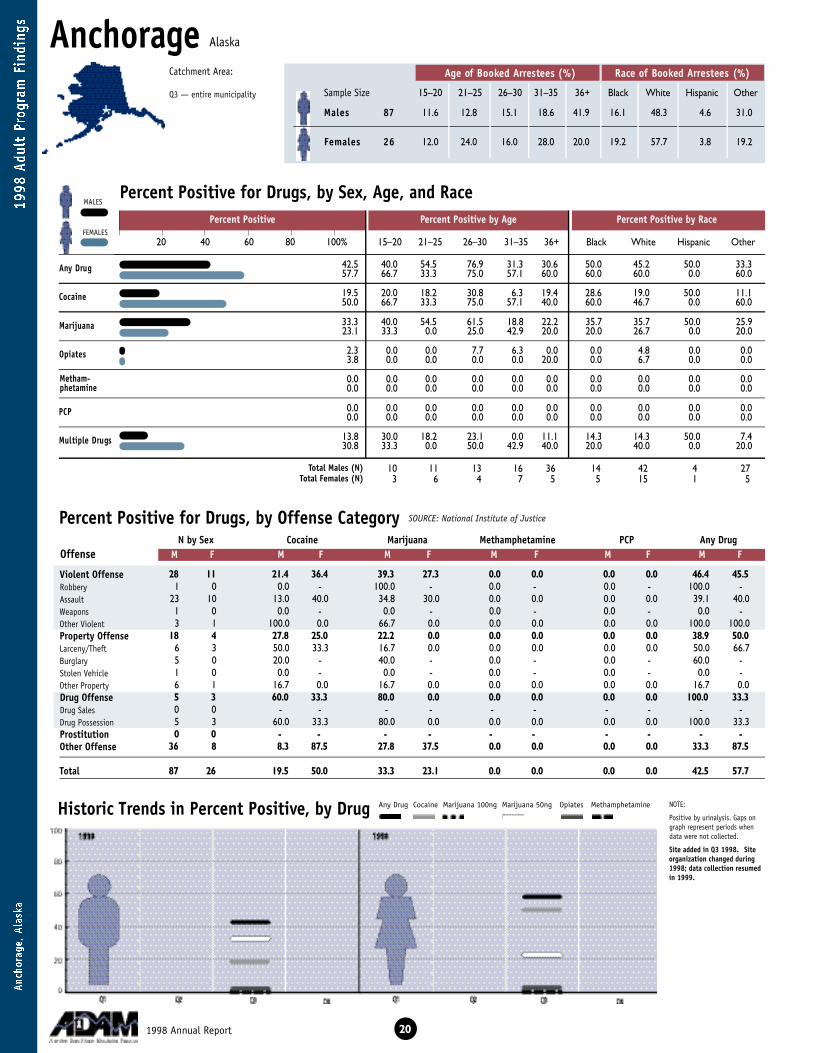
AnchorageAge of Booked Arrestees (%) Race of Booked Arrestees (%)
Sample Size 15–20 21–25 26–30 31–35 36+ Black White Hispanic Other
Percent Positive for Drugs, by Sex, Age, and Race
Percent Positive for Drugs, by Offense Category
Historic Trends in Percent Positive, by Drug
A ny Drug
C o c a i n e
M a r i j u a n a
O p i a t e s
P C P
Multiple Drugs
NOTE:
Positive by urinalysis. Gaps ongraph represent periods whendata were not collected.
Site added in Q3 1998. Siteorganization changed during1998; data collection resumedin 1999.
28 11 21.4 36.4 39.3 27.3 0.0 0.0 0.0 0.0 46.4 45.51 0 0.0 - 100.0 - 0.0 - 0.0 - 100.0 -
23 10 13.0 40.0 34.8 30.0 0.0 0.0 0.0 0.0 39.1 40.01 0 0.0 - 0.0 - 0.0 - 0.0 - 0.0 -3 1 100.0 0.0 66.7 0.0 0.0 0.0 0.0 0.0 100.0 100.0
18 4 27.8 25.0 22.2 0.0 0.0 0.0 0.0 0.0 38.9 50.06 3 50.0 33.3 16.7 0.0 0.0 0.0 0.0 0.0 50.0 66.75 0 20.0 - 40.0 - 0.0 - 0.0 - 60.0 -1 0 0.0 - 0.0 - 0.0 - 0.0 - 0.0 -6 1 16.7 0.0 16.7 0.0 0.0 0.0 0.0 0.0 16.7 0.05 3 60.0 33.3 80.0 0.0 0.0 0.0 0.0 0.0 100.0 33.30 0 - - - - - - - - - -5 3 60.0 33.3 80.0 0.0 0.0 0.0 0.0 0.0 100.0 33.30 0 - - - - - - - - - -
36 8 8.3 87.5 27.8 37.5 0.0 0.0 0.0 0.0 33.3 87.5
87 26 19.5 50.0 33.3 23.1 0.0 0.0 0.0 0.0 42.5 57.7
N by Sex Cocaine Marijuana Methamphetamine PCP Any DrugOffense M F M F M F M F M F M F
SOURCE: National Institute of Justice
201998 Annual Report
Any Drug Cocaine Marijuana 100ng Marijuana 50ng Opiates Methamphetamine
Percent Positive Percent Positive by Age Percent Positive by Race
20 40 60 80 100% 15–20 21–25 26–30 31–35 36+ Black White Hispanic Other
10 11 13 16 36 14 42 4 273 6 4 7 5 5 15 1 5
11.6 12.8 15.1 18.6 41.9 16.1 48.3 4.6 31.0
12.0 24.0 16.0 28.0 20.0 19.2 57.7 3.8 19.2
M a l e s 87
Fe m a l e s 2 6
Total Males (N)Total Females (N)
Violent OffenseRobberyAssaultWeaponsOther ViolentProperty OffenseLarceny/TheftBurglaryStolen VehicleOther PropertyDrug OffenseDrug SalesDrug PossessionProstitutionOther Offense
Total
Alaska
MALES
FEMALES
M e t h a m -p h e t a m i n e
42.5 40.0 54.5 76.9 31.3 30.6 50.0 45.2 50.0 33.357.7 66.7 33.3 75.0 57.1 60.0 60.0 60.0 0.0 60.0
19.5 20.0 18.2 30.8 6.3 19.4 28.6 19.0 50.0 11.150.0 66.7 33.3 75.0 57.1 40.0 60.0 46.7 0.0 60.0
33.3 40.0 54.5 61.5 18.8 22.2 35.7 35.7 50.0 25.923.1 33.3 0.0 25.0 42.9 20.0 20.0 26.7 0.0 20.0
2.3 0.0 0.0 7.7 6.3 0.0 0.0 4.8 0.0 0.03.8 0.0 0.0 0.0 0.0 20.0 0.0 6.7 0.0 0.0
0.0 0.0 0.0 0.0 0.0 0.0 0.0 0.0 0.0 0.00.0 0.0 0.0 0.0 0.0 0.0 0.0 0.0 0.0 0.0
0.0 0.0 0.0 0.0 0.0 0.0 0.0 0.0 0.0 0.00.0 0.0 0.0 0.0 0.0 0.0 0.0 0.0 0.0 0.0
13.8 30.0 18.2 23.1 0.0 11.1 14.3 14.3 50.0 7.430.8 33.3 0.0 50.0 42.9 40.0 20.0 40.0 0.0 20.0
Catchment Area:
Q3 — entire municipality

Cocaine
M a r i j u a n a
Opiates
Description of the Sample
Self-Reported Drug Information
C ra c k
C o c a i n e
C rack & Cocaine
Marijuana & Cocaine
Opiates & Cocaine
A ny 2 or More Drugs
21
0 20 40 60 80 100% 15–20 21–25 26–30 31–35 36+
17.4 20.0 0.0 15.4 26.7 19.436.0 0.0 0.0 33.3 42.9 100.0
16.3 30.0 27.3 15.4 20.0 8.312.0 0.0 20.0 25.0 0.0 20.0
8.1 20.0 0.0 7.7 13.3 5.64.0 0.0 0.0 0.0 0.0 20.0
14.0 30.0 27.3 7.7 13.3 8.37.7 0.0 16.7 0.0 0.0 20.0
0.0 0.0 0.0 0.0 0.0 0.00.0 0.0 0.0 0.0 0.0 0.0
24.7 55.6 27.3 25.0 18.8 19.430.8 0.0 16.7 50.0 28.6 60.0
Highest Grade Completed
6th Grade or Less7th to 9th Grade10th to 12th GradeAbove 12th Grade
1.3 0.02.5 4.3
75.0 73.921.3 21.7
3.4 3.882.8 92.34.6 0.03.4 0.01.1 0.01.1 3.83.4 0.0
Males FemalesType of Place in Prior 30 Days
Public HousingPrivate House or ApartmentShelterIncarceration FacilityTreatment FacilityNo Fixed ResidenceOther
Males Females
8.0 19.264.4 23.123.0 34.64.6 23.1
Primary Sourcein Prior 30 Days
Welfare, Social SecurityFull or Part-Time EmploymentOther Legal Illegal or None
Males Females
Current Primary Source of Income of Booked Arrestees (%)
Current Housing Arrangement of Booked Arrestees (%)
Education of Booked Arrestees (%)
Males FemalesN Mean Age N Mean Age Males Females Males Females
Percent Reporting Drug Use in the Past 30 Days, by Age and SexPercent Reporting Use Percent Reporting Use by Age
Age at First Use (for those admitting use) Received Prior Treatment ( % ) Ever Injected Drugs Illegally ( % )
MALES
FEMALES
C ra c k
C o c a i n e
M a r i j u a n a
O p i a t e s
M e t h a m p h e t a m i n e
0 5 10 15 20 25 30 N
Mean Number of Days Used in the Past 30 Days(for those admitting use in the past 30 days)
11.113.6
3.910.3
11.14.9
-2.0
2.030.0
159
143
3710
01
11
1.20.5
0.90.7
0.5-
1713
296
20
1998 Annual Report
86 13.638 25.245 19.174 14.210 22.122 21.712 18.3
25 14.614 27.515 19.821 13.54 24.05 21.03 18.7
AlcoholCrackCocaineMarijuanaOpiatesMethamphetaminePCP
49.4 26.93.4 15.42.3 0.05.7 3.81.1 0.01.1 0.0
AlcoholCrackCocaineMarijuanaOpiatesMethamphetamine
10.5 19.28.1 11.54.7 11.5
CocaineHeroinAmphetamine/Methamphetamine
MALES
FEMALES
0 1 2 3 4 5 6 N
Mean Number of Times Reported Arrested in thePast 12 Months (excludes current offense; for thosetesting positive)
MALES
FEMALES
Catchment Area:
Q1, Q2 — entire city
Percent Positive Percent Positive by Age Percent Positive by Race
20 40 60 80 100% 15–20 21–25 26–30 31–35 36+ Black White Hispanic Other
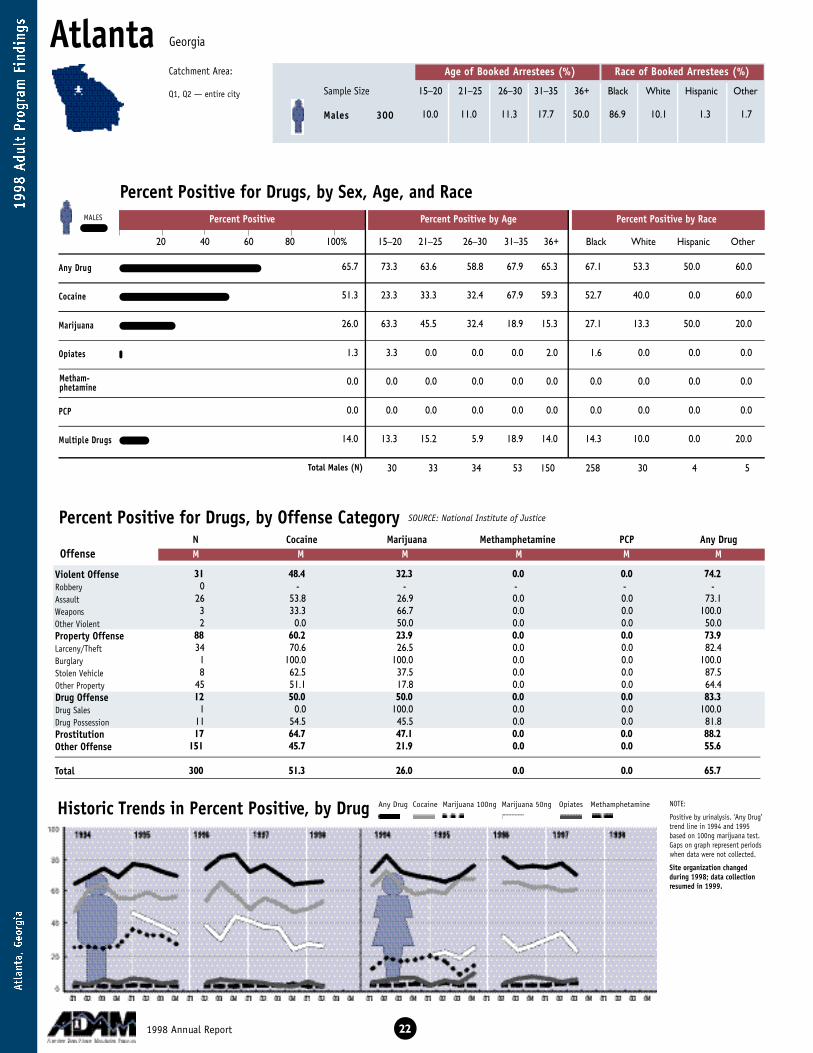
AtlantaAge of Booked Arrestees (%) Race of Booked Arrestees (%)
Sample Size 15–20 21–25 26–30 31–35 36+ Black White Hispanic Other
Percent Positive for Drugs, by Sex, Age, and Race
Percent Positive for Drugs, by Offense Category
Historic Trends in Percent Positive, by Drug
A ny Drug
C o c a i n e
M a r i j u a n a
O p i a t e s
P C P
Multiple Drugs
31 48.4 32.3 0.0 0.0 74.20 - - - - -
26 53.8 26.9 0.0 0.0 73.13 33.3 66.7 0.0 0.0 100.02 0.0 50.0 0.0 0.0 50.0
88 60.2 23.9 0.0 0.0 73.934 70.6 26.5 0.0 0.0 82.41 100.0 100.0 0.0 0.0 100.08 62.5 37.5 0.0 0.0 87.5
45 51.1 17.8 0.0 0.0 64.412 50.0 50.0 0.0 0.0 83.3
1 0.0 100.0 0.0 0.0 100.011 54.5 45.5 0.0 0.0 81.817 64.7 47.1 0.0 0.0 88.2
151 45.7 21.9 0.0 0.0 55.6
300 51.3 26.0 0.0 0.0 65.7
N Cocaine Marijuana Methamphetamine PCP Any DrugOffense M M M M M M
SOURCE: National Institute of Justice
22
Any Drug Cocaine Marijuana 100ng Marijuana 50ng Opiates Methamphetamine
30 33 34 53 150 258 30 4 5
10.0 11.0 11.3 17.7 50.0 86.9 10.1 1.3 1.7M a l e s 3 0 0
Total Males (N)
Violent OffenseRobberyAssaultWeaponsOther ViolentProperty OffenseLarceny/TheftBurglaryStolen VehicleOther PropertyDrug OffenseDrug SalesDrug PossessionProstitutionOther Offense
Total
Georgia
MALES
M e t h a m -p h e t a m i n e
65.7 73.3 63.6 58.8 67.9 65.3 67.1 53.3 50.0 60.0
51.3 23.3 33.3 32.4 67.9 59.3 52.7 40.0 0.0 60.0
26.0 63.3 45.5 32.4 18.9 15.3 27.1 13.3 50.0 20.0
1.3 3.3 0.0 0.0 0.0 2.0 1.6 0.0 0.0 0.0
0.0 0.0 0.0 0.0 0.0 0.0 0.0 0.0 0.0 0.0
0.0 0.0 0.0 0.0 0.0 0.0 0.0 0.0 0.0 0.0
14.0 13.3 15.2 5.9 18.9 14.0 14.3 10.0 0.0 20.0
NOTE:
Positive by urinalysis. ‘Any Drug’trend line in 1994 and 1995based on 100ng marijuana test.Gaps on graph represent periodswhen data were not collected.
Site organization changed during 1998; data collectionresumed in 1999.
1998 Annual Report
Cocaine
M a r i j u a n a
Opiates
Description of the Sample
Self-Reported Drug Information
C ra c k
C o c a i n e
C rack & Cocaine
Marijuana & Cocaine
Opiates & Cocaine
A ny 2 or More Drugs
23
0 20 40 60 80 100% 15–20 21–25 26–30 31–35 36+
29.1 3.4 9.1 26.5 43.4 34.0
8.7 10.0 12.1 5.9 3.8 10.1
4.0 3.3 0.0 2.9 3.8 5.4
6.3 6.7 9.1 5.9 3.8 6.7
1.3 3.4 0.0 0.0 0.0 2.0
23.3 7.1 18.2 23.5 30.2 25.0
Highest Grade Completed
6th Grade or Less7th to 9th Grade10th to 12th GradeAbove 12th Grade
2.5 -6.5 -
67.4 -23.6 -
8.7 -68.2 -6.7 -4.3 -0.0 -6.4 -5.7 -
Males FemalesType of Place in Prior 30 Days
Public HousingPrivate House or ApartmentShelterIncarceration FacilityTreatment FacilityNo Fixed ResidenceOther
Males Females
9.8 -68.0 -7.1 -
15.2 -
Primary Sourcein Prior 30 Days
Welfare, Social SecurityFull or Part-Time EmploymentOther Legal Illegal or None
Males Females
Current Primary Source of Income of Booked Arrestees (%)
Current Housing Arrangement of Booked Arrestees (%)
Education of Booked Arrestees (%)
Males FemalesN Mean Age N Mean Age Males Females Males Females
Percent Reporting Drug Use in the Past 30 Days, by Age and SexPercent Reporting Use Percent Reporting Use by Age
Age at First Use (for those admitting use) Received Prior Treatment ( % ) Ever Injected Drugs Illegally ( % )
MALES
C ra c k
C o c a i n e
Marijuana
Opiates
Methamphetamine
0 5 10 15 20 25 30 N
Mean Number of Days Used in the Past 30 Days(for those admitting use in the past 30 days)
15.7
11.9
10.1
18.4
1.0
87
26
128
5
3
1.0
0.9
0.8
154
78
4
1998 Annual Report
284 15.4130 27.6120 20.7231 16.236 19.921 25.123 20.6
- -- -- -- -- -- -- -
AlcoholCrackCocaineMarijuanaOpiatesMethamphetaminePCP
21.0 -13.4 -6.8 -5.1 -2.0 -0.3 -
AlcoholCrackCocaineMarijuanaOpiatesMethamphetamine
10.7 -9.0 -3.7 -
CocaineHeroinAmphetamine/Methamphetamine
MALES
0 1 2 3 4 5 6 N
Mean Number of Times Reported Arrested in thePast 12 Months (excludes current offense; for thosetesting positive)MALES
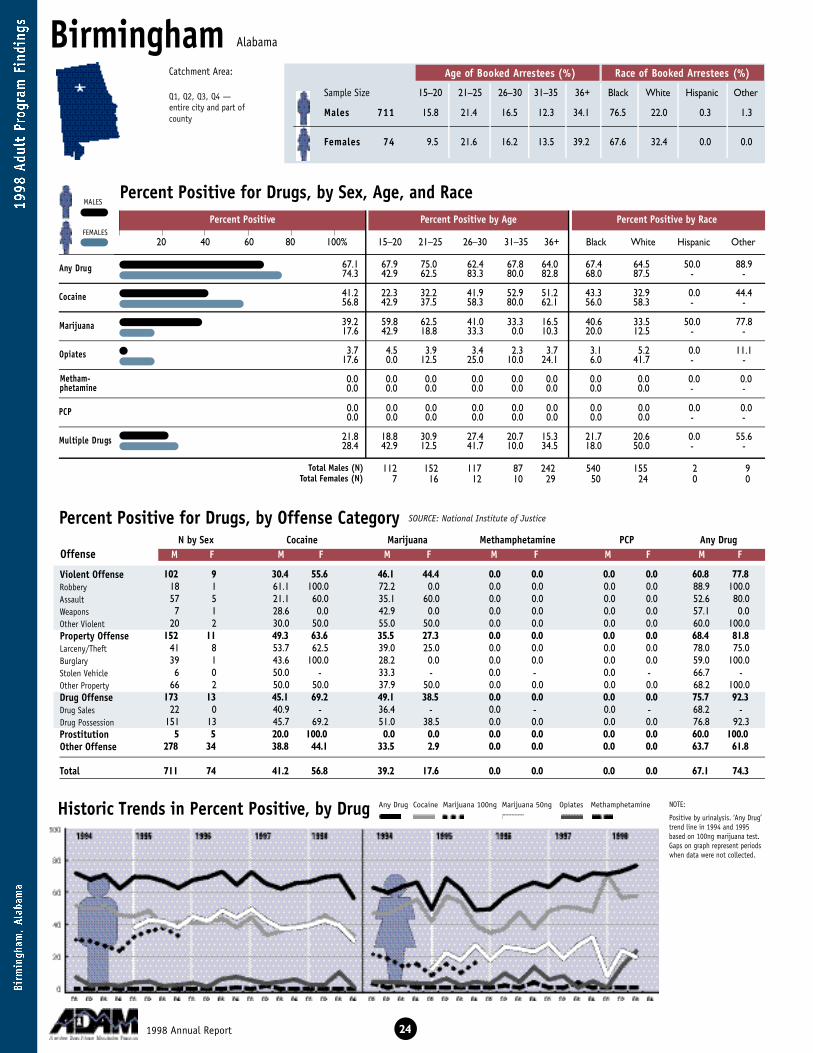
BirminghamAge of Booked Arrestees (%) Race of Booked Arrestees (%)
Sample Size 15–20 21–25 26–30 31–35 36+ Black White Hispanic Other
Percent Positive for Drugs, by Sex, Age, and Race
Percent Positive for Drugs, by Offense Category
Historic Trends in Percent Positive, by Drug
A ny Drug
C o c a i n e
M a r i j u a n a
O p i a t e s
P C P
Multiple Drugs
NOTE:
Positive by urinalysis. ‘Any Drug’trend line in 1994 and 1995based on 100ng marijuana test.Gaps on graph represent periodswhen data were not collected.
102 9 30.4 55.6 46.1 44.4 0.0 0.0 0.0 0.0 60.8 77.818 1 61.1 100.0 72.2 0.0 0.0 0.0 0.0 0.0 88.9 100.057 5 21.1 60.0 35.1 60.0 0.0 0.0 0.0 0.0 52.6 80.07 1 28.6 0.0 42.9 0.0 0.0 0.0 0.0 0.0 57.1 0.0
20 2 30.0 50.0 55.0 50.0 0.0 0.0 0.0 0.0 60.0 100.0152 11 49.3 63.6 35.5 27.3 0.0 0.0 0.0 0.0 68.4 81.8
41 8 53.7 62.5 39.0 25.0 0.0 0.0 0.0 0.0 78.0 75.039 1 43.6 100.0 28.2 0.0 0.0 0.0 0.0 0.0 59.0 100.06 0 50.0 - 33.3 - 0.0 - 0.0 - 66.7 -
66 2 50.0 50.0 37.9 50.0 0.0 0.0 0.0 0.0 68.2 100.0173 13 45.1 69.2 49.1 38.5 0.0 0.0 0.0 0.0 75.7 92.3
22 0 40.9 - 36.4 - 0.0 - 0.0 - 68.2 -151 13 45.7 69.2 51.0 38.5 0.0 0.0 0.0 0.0 76.8 92.3
5 5 20.0 100.0 0.0 0.0 0.0 0.0 0.0 0.0 60.0 100.0278 34 38.8 44.1 33.5 2.9 0.0 0.0 0.0 0.0 63.7 61.8
711 74 41.2 56.8 39.2 17.6 0.0 0.0 0.0 0.0 67.1 74.3
N by Sex Cocaine Marijuana Methamphetamine PCP Any DrugOffense M F M F M F M F M F M F
SOURCE: National Institute of Justice
241998 Annual Report
Any Drug Cocaine Marijuana 100ng Marijuana 50ng Opiates Methamphetamine
Percent Positive Percent Positive by Age Percent Positive by Race
20 40 60 80 100% 15–20 21–25 26–30 31–35 36+ Black White Hispanic Other
112 152 117 87 242 540 155 2 97 16 12 10 29 50 24 0 0
15.8 21.4 16.5 12.3 34.1 76.5 22.0 0.3 1.3
9.5 21.6 16.2 13.5 39.2 67.6 32.4 0.0 0.0
M a l e s 7 1 1
Fe m a l e s 7 4
Total Males (N)Total Females (N)
Violent OffenseRobberyAssaultWeaponsOther ViolentProperty OffenseLarceny/TheftBurglaryStolen VehicleOther PropertyDrug OffenseDrug SalesDrug PossessionProstitutionOther Offense
Total
Alabama
MALES
FEMALES
M e t h a m -p h e t a m i n e
67.1 67.9 75.0 62.4 67.8 64.0 67.4 64.5 50.0 88.974.3 42.9 62.5 83.3 80.0 82.8 68.0 87.5 - -
41.2 22.3 32.2 41.9 52.9 51.2 43.3 32.9 0.0 44.456.8 42.9 37.5 58.3 80.0 62.1 56.0 58.3 - -
39.2 59.8 62.5 41.0 33.3 16.5 40.6 33.5 50.0 77.817.6 42.9 18.8 33.3 0.0 10.3 20.0 12.5 - -
3.7 4.5 3.9 3.4 2.3 3.7 3.1 5.2 0.0 11.117.6 0.0 12.5 25.0 10.0 24.1 6.0 41.7 - -
0.0 0.0 0.0 0.0 0.0 0.0 0.0 0.0 0.0 0.00.0 0.0 0.0 0.0 0.0 0.0 0.0 0.0 - -
0.0 0.0 0.0 0.0 0.0 0.0 0.0 0.0 0.0 0.00.0 0.0 0.0 0.0 0.0 0.0 0.0 0.0 - -
21.8 18.8 30.9 27.4 20.7 15.3 21.7 20.6 0.0 55.628.4 42.9 12.5 41.7 10.0 34.5 18.0 50.0 - -
Catchment Area:
Q1, Q2, Q3, Q4 — entire city and part ofcounty

Cocaine
M a r i j u a n a
Opiates
Description of the Sample
Self-Reported Drug Information
C ra c k
C o c a i n e
C rack & Cocaine
Marijuana & Cocaine
Opiates & Cocaine
A ny 2 or More Drugs
25
0 20 40 60 80 100% 15–20 21–25 26–30 31–35 36+
26.3 8.0 11.8 21.1 45.3 39.732.4 14.3 18.8 25.0 70.0 34.5
10.5 17.0 12.7 6.0 9.3 8.79.5 0.0 0.0 0.0 10.0 20.7
5.4 3.6 4.6 1.7 8.0 7.55.4 0.0 0.0 0.0 10.0 10.3
9.1 17.0 11.3 6.0 7.0 6.25.4 0.0 0.0 0.0 10.0 10.3
1.4 1.8 1.3 0.0 1.1 2.10.0 0.0 0.0 0.0 0.0 0.0
25.2 23.6 23.5 21.6 27.4 28.027.0 28.6 12.5 16.7 40.0 34.5
Highest Grade Completed
6th Grade or Less7th to 9th Grade10th to 12th GradeAbove 12th Grade
0.9 1.43.8 1.4
80.5 72.914.7 24.3
8.3 12.283.8 81.11.5 1.42.3 1.40.3 1.43.2 2.70.6 0.0
Males FemalesType of Place in Prior 30 Days
Public HousingPrivate House or ApartmentShelterIncarceration FacilityTreatment FacilityNo Fixed ResidenceOther
Males Females
5.7 16.773.0 48.69.2 20.8
12.1 13.9
Primary Sourcein Prior 30 Days
Welfare, Social SecurityFull or Part-Time EmploymentOther Legal Illegal or None
Males Females
Current Primary Source of Income of Booked Arrestees (%)
Current Housing Arrangement of Booked Arrestees (%)
Education of Booked Arrestees (%)
Males FemalesN Mean Age N Mean Age Males Females Males Females
Percent Reporting Drug Use in the Past 30 Days, by Age and SexPercent Reporting Use Percent Reporting Use by Age
Age at First Use (for those admitting use) Received Prior Treatment ( % ) Ever Injected Drugs Illegally ( % )
MALES
FEMALES
C ra c k
C o c a i n e
M a r i j u a n a
O p i a t e s
M e t h a m p h e t a m i n e
0 5 10 15 20 25 30 N
Mean Number of Days Used in the Past 30 Days(for those admitting use in the past 30 days)
14.316.5
7.614.0
12.013.0
6.313.5
4.8-
18624
747
34024
268
40
0.71.1
0.80.2
0.81.2
29342
27713
2613
1998 Annual Report
677 14.9270 27.0274 21.6584 16.194 23.148 21.545 19.4
70 16.430 26.724 23.455 17.317 24.24 26.50 -
AlcoholCrackCocaineMarijuanaOpiatesMethamphetaminePCP
18.7 16.713.6 18.96.7 9.6
13.6 16.72.5 5.50.7 2.7
AlcoholCrackCocaineMarijuanaOpiatesMethamphetamine
7.0 6.85.4 5.41.3 2.7
CocaineHeroinAmphetamine/Methamphetamine
MALES
FEMALES
0 1 2 3 4 5 6 N
Mean Number of Times Reported Arrested in thePast 12 Months (excludes current offense; for thosetesting positive)
MALES
FEMALES
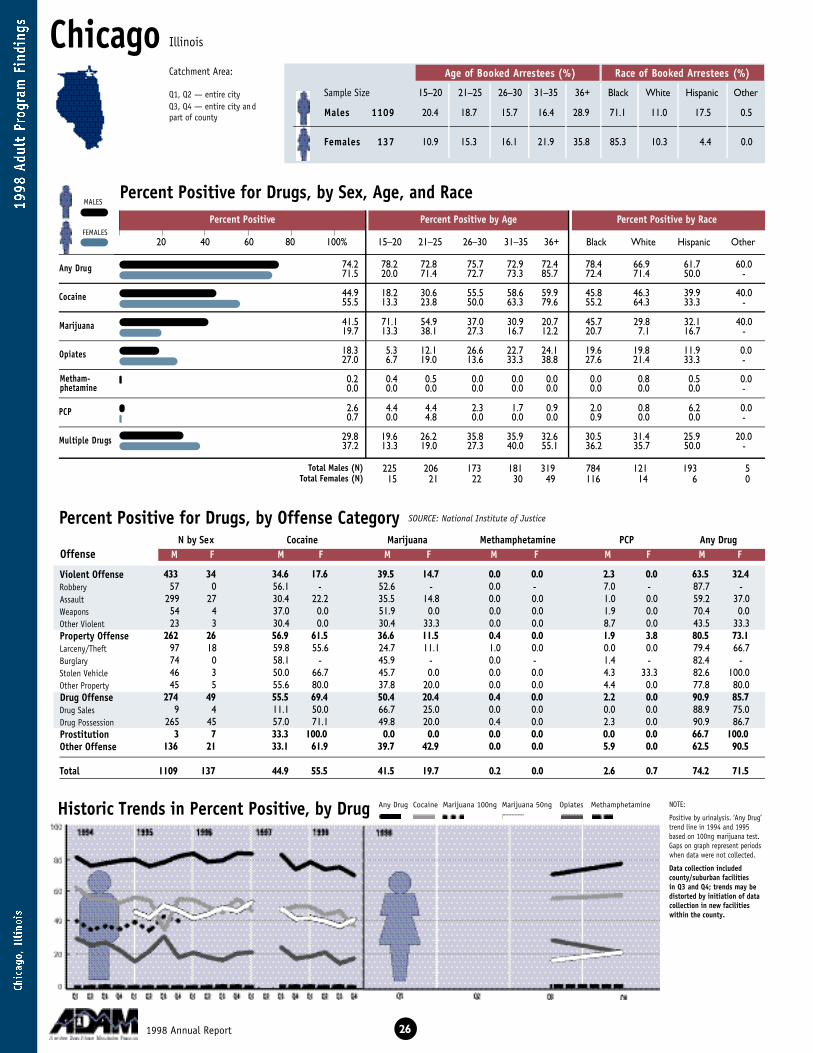
ChicagoAge of Booked Arrestees (%) Race of Booked Arrestees (%)
Sample Size 15–20 21–25 26–30 31–35 36+ Black White Hispanic Other
Percent Positive for Drugs, by Sex, Age, and Race
Percent Positive for Drugs, by Offense Category
Historic Trends in Percent Positive, by Drug
A ny Drug
C o c a i n e
M a r i j u a n a
O p i a t e s
P C P
Multiple Drugs
NOTE:
Positive by urinalysis. ‘Any Drug’trend line in 1994 and 1995based on 100ng marijuana test.Gaps on graph represent periodswhen data were not collected.
Data collection included county/suburban facilities in Q3 and Q4; trends may be distorted by initiation of datacollection in new facilitieswithin the county.
433 34 34.6 17.6 39.5 14.7 0.0 0.0 2.3 0.0 63.5 32.457 0 56.1 - 52.6 - 0.0 - 7.0 - 87.7 -
299 27 30.4 22.2 35.5 14.8 0.0 0.0 1.0 0.0 59.2 37.054 4 37.0 0.0 51.9 0.0 0.0 0.0 1.9 0.0 70.4 0.023 3 30.4 0.0 30.4 33.3 0.0 0.0 8.7 0.0 43.5 33.3
262 26 56.9 61.5 36.6 11.5 0.4 0.0 1.9 3.8 80.5 73.197 18 59.8 55.6 24.7 11.1 1.0 0.0 0.0 0.0 79.4 66.774 0 58.1 - 45.9 - 0.0 - 1.4 - 82.4 -46 3 50.0 66.7 45.7 0.0 0.0 0.0 4.3 33.3 82.6 100.045 5 55.6 80.0 37.8 20.0 0.0 0.0 4.4 0.0 77.8 80.0
274 49 55.5 69.4 50.4 20.4 0.4 0.0 2.2 0.0 90.9 85.79 4 11.1 50.0 66.7 25.0 0.0 0.0 0.0 0.0 88.9 75.0
265 45 57.0 71.1 49.8 20.0 0.4 0.0 2.3 0.0 90.9 86.73 7 33.3 100.0 0.0 0.0 0.0 0.0 0.0 0.0 66.7 100.0
136 21 33.1 61.9 39.7 42.9 0.0 0.0 5.9 0.0 62.5 90.5
1109 137 44.9 55.5 41.5 19.7 0.2 0.0 2.6 0.7 74.2 71.5
N by Sex Cocaine Marijuana Methamphetamine PCP Any DrugOffense M F M F M F M F M F M F
SOURCE: National Institute of Justice
261998 Annual Report
Any Drug Cocaine Marijuana 100ng Marijuana 50ng Opiates Methamphetamine
Percent Positive Percent Positive by Age Percent Positive by Race
20 40 60 80 100% 15–20 21–25 26–30 31–35 36+ Black White Hispanic Other
225 206 173 181 319 784 121 193 515 21 22 30 49 116 14 6 0
20.4 18.7 15.7 16.4 28.9 71.1 11.0 17.5 0.5
10.9 15.3 16.1 21.9 35.8 85.3 10.3 4.4 0.0
M a l e s 1 1 0 9
Fe m a l e s 1 3 7
Total Males (N)Total Females (N)
Violent OffenseRobberyAssaultWeaponsOther ViolentProperty OffenseLarceny/TheftBurglaryStolen VehicleOther PropertyDrug OffenseDrug SalesDrug PossessionProstitutionOther Offense
Total
Illinois
MALES
FEMALES
M e t h a m -p h e t a m i n e
74.2 78.2 72.8 75.7 72.9 72.4 78.4 66.9 61.7 60.071.5 20.0 71.4 72.7 73.3 85.7 72.4 71.4 50.0 -
44.9 18.2 30.6 55.5 58.6 59.9 45.8 46.3 39.9 40.055.5 13.3 23.8 50.0 63.3 79.6 55.2 64.3 33.3 -
41.5 71.1 54.9 37.0 30.9 20.7 45.7 29.8 32.1 40.019.7 13.3 38.1 27.3 16.7 12.2 20.7 7.1 16.7 -
18.3 5.3 12.1 26.6 22.7 24.1 19.6 19.8 11.9 0.027.0 6.7 19.0 13.6 33.3 38.8 27.6 21.4 33.3 -
0.2 0.4 0.5 0.0 0.0 0.0 0.0 0.8 0.5 0.00.0 0.0 0.0 0.0 0.0 0.0 0.0 0.0 0.0 -
2.6 4.4 4.4 2.3 1.7 0.9 2.0 0.8 6.2 0.00.7 0.0 4.8 0.0 0.0 0.0 0.9 0.0 0.0 -
29.8 19.6 26.2 35.8 35.9 32.6 30.5 31.4 25.9 20.037.2 13.3 19.0 27.3 40.0 55.1 36.2 35.7 50.0 -
Catchment Area:
Q1, Q2 — entire cityQ3, Q4 — entire city andpart of county
Cocaine
M a r i j u a n a
Opiates
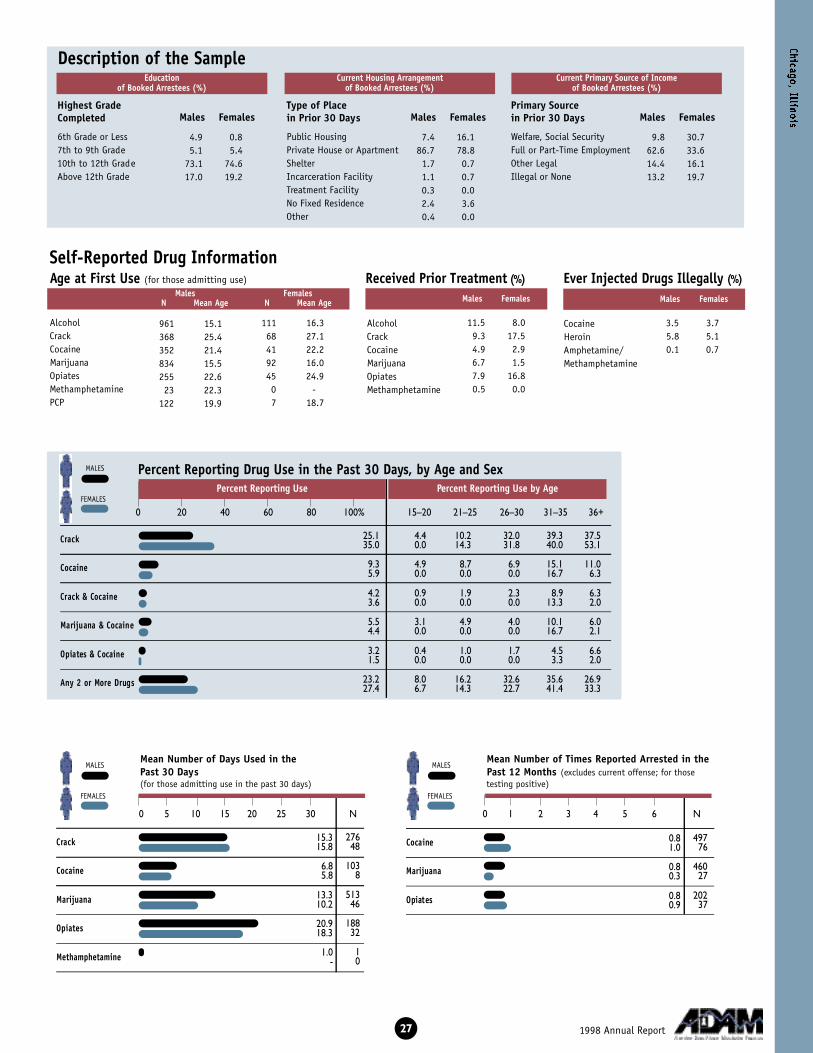
Description of the Sample
Self-Reported Drug Information
C ra c k
C o c a i n e
C rack & Cocaine
Marijuana & Cocaine
Opiates & Cocaine
A ny 2 or More Drugs
27
0 20 40 60 80 100% 15–20 21–25 26–30 31–35 36+
25.1 4.4 10.2 32.0 39.3 37.535.0 0.0 14.3 31.8 40.0 53.1
9.3 4.9 8.7 6.9 15.1 11.05.9 0.0 0.0 0.0 16.7 6.3
4.2 0.9 1.9 2.3 8.9 6.33.6 0.0 0.0 0.0 13.3 2.0
5.5 3.1 4.9 4.0 10.1 6.04.4 0.0 0.0 0.0 16.7 2.1
3.2 0.4 1.0 1.7 4.5 6.61.5 0.0 0.0 0.0 3.3 2.0
23.2 8.0 16.2 32.6 35.6 26.927.4 6.7 14.3 22.7 41.4 33.3
Highest Grade Completed
6th Grade or Less7th to 9th Grade10th to 12th GradeAbove 12th Grade
4.9 0.85.1 5.4
73.1 74.617.0 19.2
7.4 16.186.7 78.81.7 0.71.1 0.70.3 0.02.4 3.60.4 0.0
Males FemalesType of Place in Prior 30 Days
Public HousingPrivate House or ApartmentShelterIncarceration FacilityTreatment FacilityNo Fixed ResidenceOther
Males Females
9.8 30.762.6 33.614.4 16.113.2 19.7
Primary Sourcein Prior 30 Days
Welfare, Social SecurityFull or Part-Time EmploymentOther Legal Illegal or None
Males Females
Current Primary Source of Income of Booked Arrestees (%)
Current Housing Arrangement of Booked Arrestees (%)
Education of Booked Arrestees (%)
Males FemalesN Mean Age N Mean Age Males Females Males Females
Percent Reporting Drug Use in the Past 30 Days, by Age and SexPercent Reporting Use Percent Reporting Use by Age
Age at First Use (for those admitting use) Received Prior Treatment ( % ) Ever Injected Drugs Illegally ( % )
MALES
FEMALES
C ra c k
C o c a i n e
M a r i j u a n a
O p i a t e s
M e t h a m p h e t a m i n e
0 5 10 15 20 25 30 N
Mean Number of Days Used in the Past 30 Days(for those admitting use in the past 30 days)
15.315.8
6.85.8
13.310.2
20.918.3
1.0-
27648
1038
51346
18832
10
0.81.0
0.80.3
0.80.9
49776
46027
20237
1998 Annual Report
961 15.1368 25.4352 21.4834 15.5255 22.623 22.3
122 19.9
111 16.368 27.141 22.292 16.045 24.90 -7 18.7
AlcoholCrackCocaineMarijuanaOpiatesMethamphetaminePCP
11.5 8.09.3 17.54.9 2.96.7 1.57.9 16.80.5 0.0
AlcoholCrackCocaineMarijuanaOpiatesMethamphetamine
3.5 3.75.8 5.10.1 0.7
CocaineHeroinAmphetamine/Methamphetamine
MALES
FEMALES
0 1 2 3 4 5 6 N
Mean Number of Times Reported Arrested in thePast 12 Months (excludes current offense; for thosetesting positive)
MALES
FEMALES

ClevelandAge of Booked Arrestees (%) Race of Booked Arrestees (%)
Sample Size 15–20 21–25 26–30 31–35 36+ Black White Hispanic Other
Percent Positive for Drugs, by Sex, Age, and Race
Percent Positive for Drugs, by Offense Category
Historic Trends in Percent Positive, by Drug
A ny Drug
C o c a i n e
M a r i j u a n a
O p i a t e s
P C P
Multiple Drugs
NOTE:
Positive by urinalysis. ‘Any Drug’trend line in 1994 and 1995based on 100ng marijuana test.Gaps on graph represent periodswhen data were not collected.
Data collection included coun-ty/suburban facilities in Q3and Q4; data across quartersshould not be interpreted astrend data.
60 5 31.7 0.0 33.3 20.0 0.0 0.0 5.0 0.0 55.0 20.015 0 26.7 - 53.3 - 0.0 - 20.0 - 73.3 -31 4 29.0 0.0 22.6 25.0 0.0 0.0 0.0 0.0 45.2 25.05 0 40.0 - 40.0 - 0.0 - 0.0 - 60.0 -9 1 44.4 0.0 33.3 0.0 0.0 0.0 0.0 0.0 55.6 0.0
71 25 29.6 32.0 46.5 24.0 0.0 0.0 0.0 0.0 62.0 44.034 14 38.2 35.7 41.2 35.7 0.0 0.0 0.0 0.0 58.8 50.014 1 21.4 0.0 64.3 0.0 0.0 0.0 0.0 0.0 64.3 0.01 1 0.0 0.0 0.0 100.0 0.0 0.0 0.0 0.0 0.0 100.0
22 9 22.7 33.3 45.5 0.0 0.0 0.0 0.0 0.0 68.2 33.3156 10 48.1 40.0 46.2 40.0 0.0 0.0 9.0 0.0 79.5 60.0
26 0 46.2 - 50.0 - 0.0 - 0.0 - 76.9 -130 10 48.5 40.0 45.4 40.0 0.0 0.0 10.8 0.0 80.0 60.0
0 0 - - - - - - - - - -312 34 33.7 52.9 30.8 26.5 0.0 0.0 6.1 0.0 60.6 73.5
600 74 36.8 40.5 36.8 27.0 0.0 0.0 6.0 0.0 65.2 58.1
N by Sex Cocaine Marijuana Methamphetamine PCP Any DrugOffense M F M F M F M F M F M F
SOURCE: National Institute of Justice
281998 Annual Report
Any Drug Cocaine Marijuana 100ng Marijuana 50ng Opiates Methamphetamine
Percent Positive Percent Positive by Age Percent Positive by Race
20 40 60 80 100% 15–20 21–25 26–30 31–35 36+ Black White Hispanic Other
86 118 88 92 216 422 153 16 26 11 22 14 21 59 14 1 0
14.3 19.7 14.7 15.3 36.0 71.2 25.8 2.7 0.3
8.1 14.9 29.7 18.9 28.4 79.7 18.9 1.4 0.0
M a l e s 6 0 0
Fe m a l e s 7 4
Total Males (N)Total Females (N)
Violent OffenseRobberyAssaultWeaponsOther ViolentProperty OffenseLarceny/TheftBurglaryStolen VehicleOther PropertyDrug OffenseDrug SalesDrug PossessionProstitutionOther Offense
Total
Ohio
MALES
FEMALES
M e t h a m -p h e t a m i n e
65.2 76.7 68.6 61.4 62.0 61.6 69.7 54.2 75.0 0.058.1 100.0 45.5 54.5 57.1 57.1 62.7 42.9 0.0 -
36.8 17.4 17.8 35.2 45.7 51.9 41.2 26.8 31.3 0.040.5 16.7 9.1 40.9 50.0 57.1 42.4 35.7 0.0 -
36.8 68.6 58.5 39.8 28.3 14.8 39.3 30.7 43.8 0.027.0 83.3 45.5 18.2 35.7 4.8 32.2 7.1 0.0 -
6.0 1.2 0.8 4.5 5.4 11.6 4.0 10.5 12.5 0.01.4 0.0 0.0 0.0 0.0 4.8 1.7 0.0 0.0 -
0.0 0.0 0.0 0.0 0.0 0.0 0.0 0.0 0.0 0.00.0 0.0 0.0 0.0 0.0 0.0 0.0 0.0 0.0 -
6.0 15.1 13.6 4.5 1.1 0.9 8.5 0.0 0.0 0.00.0 0.0 0.0 0.0 0.0 0.0 0.0 0.0 0.0 -
21.3 25.6 20.3 22.7 20.7 19.9 21.3 22.2 18.8 0.012.2 0.0 9.1 4.5 35.7 9.5 13.6 7.1 0.0 -
Catchment Area:
Q1, Q2, Q3, Q4 — entire city and part ofcounty
Cocaine
M a r i j u a n a
Opiates
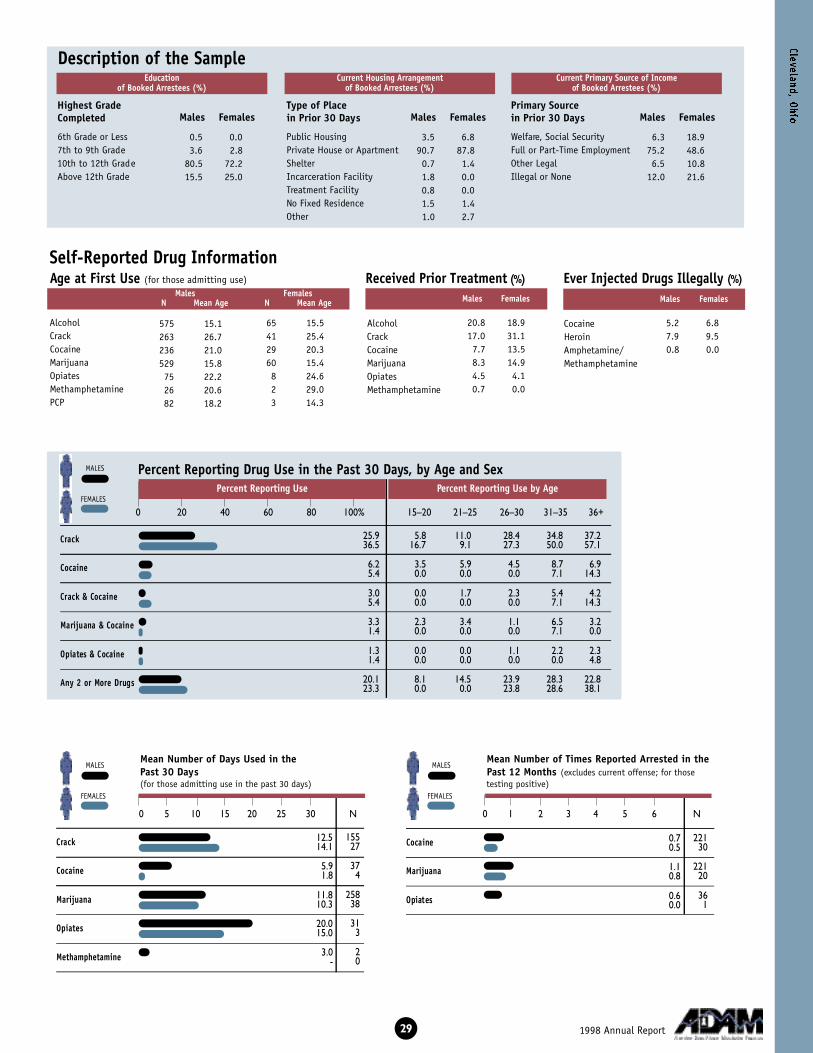
Description of the Sample
Self-Reported Drug Information
C ra c k
C o c a i n e
C rack & Cocaine
Marijuana & Cocaine
Opiates & Cocaine
A ny 2 or More Drugs
29
0 20 40 60 80 100% 15–20 21–25 26–30 31–35 36+
25.9 5.8 11.0 28.4 34.8 37.236.5 16.7 9.1 27.3 50.0 57.1
6.2 3.5 5.9 4.5 8.7 6.95.4 0.0 0.0 0.0 7.1 14.3
3.0 0.0 1.7 2.3 5.4 4.25.4 0.0 0.0 0.0 7.1 14.3
3.3 2.3 3.4 1.1 6.5 3.21.4 0.0 0.0 0.0 7.1 0.0
1.3 0.0 0.0 1.1 2.2 2.31.4 0.0 0.0 0.0 0.0 4.8
20.1 8.1 14.5 23.9 28.3 22.823.3 0.0 0.0 23.8 28.6 38.1
Highest Grade Completed
6th Grade or Less7th to 9th Grade10th to 12th GradeAbove 12th Grade
0.5 0.03.6 2.8
80.5 72.215.5 25.0
3.5 6.890.7 87.80.7 1.41.8 0.00.8 0.01.5 1.41.0 2.7
Males FemalesType of Place in Prior 30 Days
Public HousingPrivate House or ApartmentShelterIncarceration FacilityTreatment FacilityNo Fixed ResidenceOther
Males Females
6.3 18.975.2 48.66.5 10.8
12.0 21.6
Primary Sourcein Prior 30 Days
Welfare, Social SecurityFull or Part-Time EmploymentOther Legal Illegal or None
Males Females
Current Primary Source of Income of Booked Arrestees (%)
Current Housing Arrangement of Booked Arrestees (%)
Education of Booked Arrestees (%)
Males FemalesN Mean Age N Mean Age Males Females Males Females
Percent Reporting Drug Use in the Past 30 Days, by Age and SexPercent Reporting Use Percent Reporting Use by Age
Age at First Use (for those admitting use) Received Prior Treatment ( % ) Ever Injected Drugs Illegally ( % )
MALES
FEMALES
C ra c k
C o c a i n e
M a r i j u a n a
O p i a t e s
M e t h a m p h e t a m i n e
0 5 10 15 20 25 30 N
Mean Number of Days Used in the Past 30 Days(for those admitting use in the past 30 days)
12.514.1
5.91.8
11.810.3
20.015.0
3.0-
15527
374
25838
313
20
0.70.5
1.10.8
0.60.0
22130
22120
361
1998 Annual Report
575 15.1263 26.7236 21.0529 15.875 22.226 20.682 18.2
65 15.541 25.429 20.360 15.48 24.62 29.03 14.3
AlcoholCrackCocaineMarijuanaOpiatesMethamphetaminePCP
20.8 18.917.0 31.17.7 13.58.3 14.94.5 4.10.7 0.0
AlcoholCrackCocaineMarijuanaOpiatesMethamphetamine
5.2 6.87.9 9.50.8 0.0
CocaineHeroinAmphetamine/Methamphetamine
MALES
FEMALES
0 1 2 3 4 5 6 N
Mean Number of Times Reported Arrested in thePast 12 Months (excludes current offense; for thosetesting positive)
MALES
FEMALES
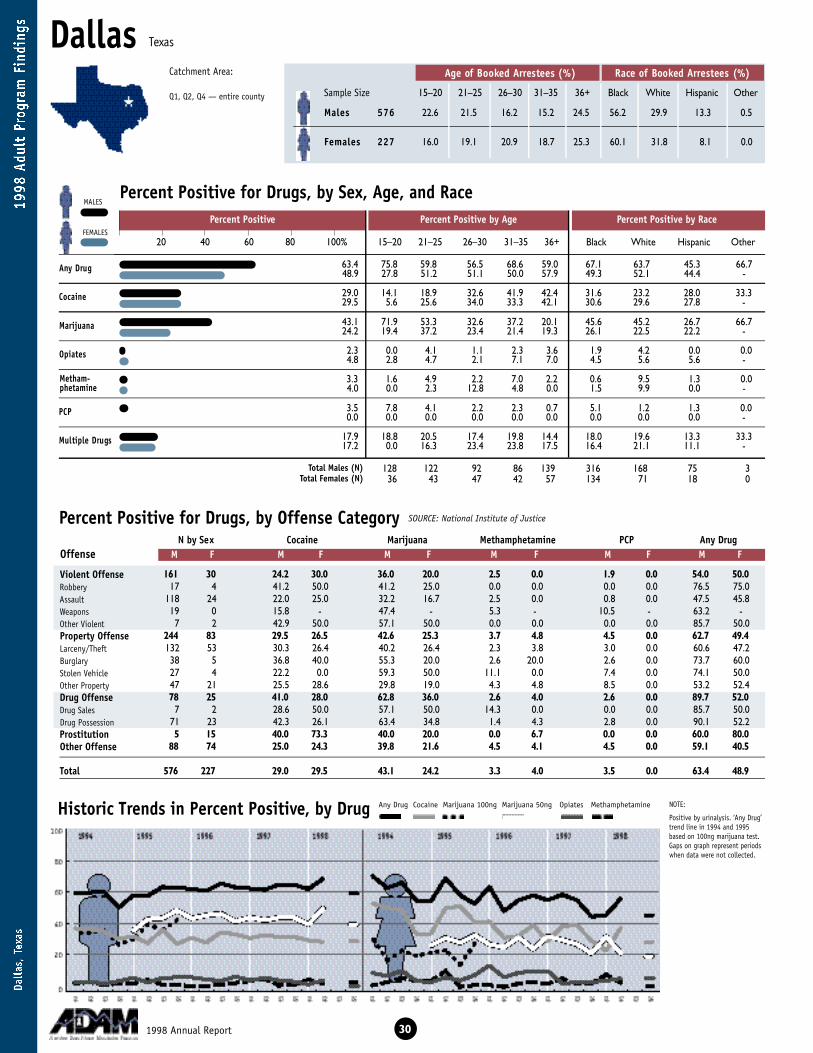
DallasAge of Booked Arrestees (%) Race of Booked Arrestees (%)
Sample Size 15–20 21–25 26–30 31–35 36+ Black White Hispanic Other
Percent Positive for Drugs, by Sex, Age, and Race
Percent Positive for Drugs, by Offense Category
Historic Trends in Percent Positive, by Drug
A ny Drug
C o c a i n e
M a r i j u a n a
O p i a t e s
P C P
Multiple Drugs
NOTE:
Positive by urinalysis. ‘Any Drug’trend line in 1994 and 1995based on 100ng marijuana test.Gaps on graph represent periodswhen data were not collected.
161 30 24.2 30.0 36.0 20.0 2.5 0.0 1.9 0.0 54.0 50.017 4 41.2 50.0 41.2 25.0 0.0 0.0 0.0 0.0 76.5 75.0
118 24 22.0 25.0 32.2 16.7 2.5 0.0 0.8 0.0 47.5 45.819 0 15.8 - 47.4 - 5.3 - 10.5 - 63.2 -7 2 42.9 50.0 57.1 50.0 0.0 0.0 0.0 0.0 85.7 50.0
244 83 29.5 26.5 42.6 25.3 3.7 4.8 4.5 0.0 62.7 49.4132 53 30.3 26.4 40.2 26.4 2.3 3.8 3.0 0.0 60.6 47.238 5 36.8 40.0 55.3 20.0 2.6 20.0 2.6 0.0 73.7 60.027 4 22.2 0.0 59.3 50.0 11.1 0.0 7.4 0.0 74.1 50.047 21 25.5 28.6 29.8 19.0 4.3 4.8 8.5 0.0 53.2 52.478 25 41.0 28.0 62.8 36.0 2.6 4.0 2.6 0.0 89.7 52.0
7 2 28.6 50.0 57.1 50.0 14.3 0.0 0.0 0.0 85.7 50.071 23 42.3 26.1 63.4 34.8 1.4 4.3 2.8 0.0 90.1 52.25 15 40.0 73.3 40.0 20.0 0.0 6.7 0.0 0.0 60.0 80.0
88 74 25.0 24.3 39.8 21.6 4.5 4.1 4.5 0.0 59.1 40.5
576 227 29.0 29.5 43.1 24.2 3.3 4.0 3.5 0.0 63.4 48.9
N by Sex Cocaine Marijuana Methamphetamine PCP Any DrugOffense M F M F M F M F M F M F
SOURCE: National Institute of Justice
301998 Annual Report
Any Drug Cocaine Marijuana 100ng Marijuana 50ng Opiates Methamphetamine
Percent Positive Percent Positive by Age Percent Positive by Race
20 40 60 80 100% 15–20 21–25 26–30 31–35 36+ Black White Hispanic Other
128 122 92 86 139 316 168 75 336 43 47 42 57 134 71 18 0
22.6 21.5 16.2 15.2 24.5 56.2 29.9 13.3 0.5
16.0 19.1 20.9 18.7 25.3 60.1 31.8 8.1 0.0
M a l e s 5 7 6
Fe m a l e s 2 2 7
Total Males (N)Total Females (N)
Violent OffenseRobberyAssaultWeaponsOther ViolentProperty OffenseLarceny/TheftBurglaryStolen VehicleOther PropertyDrug OffenseDrug SalesDrug PossessionProstitutionOther Offense
Total
Texas
MALES
FEMALES
M e t h a m -p h e t a m i n e
63.4 75.8 59.8 56.5 68.6 59.0 67.1 63.7 45.3 66.748.9 27.8 51.2 51.1 50.0 57.9 49.3 52.1 44.4 -
29.0 14.1 18.9 32.6 41.9 42.4 31.6 23.2 28.0 33.329.5 5.6 25.6 34.0 33.3 42.1 30.6 29.6 27.8 -
43.1 71.9 53.3 32.6 37.2 20.1 45.6 45.2 26.7 66.724.2 19.4 37.2 23.4 21.4 19.3 26.1 22.5 22.2 -
2.3 0.0 4.1 1.1 2.3 3.6 1.9 4.2 0.0 0.04.8 2.8 4.7 2.1 7.1 7.0 4.5 5.6 5.6 -
3.3 1.6 4.9 2.2 7.0 2.2 0.6 9.5 1.3 0.04.0 0.0 2.3 12.8 4.8 0.0 1.5 9.9 0.0 -
3.5 7.8 4.1 2.2 2.3 0.7 5.1 1.2 1.3 0.00.0 0.0 0.0 0.0 0.0 0.0 0.0 0.0 0.0 -
17.9 18.8 20.5 17.4 19.8 14.4 18.0 19.6 13.3 33.317.2 0.0 16.3 23.4 23.8 17.5 16.4 21.1 11.1 -
Catchment Area:
Q1, Q2, Q4 — entire county

Cocaine
M a r i j u a n a
Opiates
Description of the Sample
Self-Reported Drug Information
C ra c k
C o c a i n e
C rack & Cocaine
Marijuana & Cocaine
Opiates & Cocaine
A ny 2 or More Drugs
31
0 20 40 60 80 100% 15–20 21–25 26–30 31–35 36+
15.0 3.1 4.1 18.7 24.4 28.119.4 5.6 14.0 23.4 23.8 24.6
11.9 11.7 11.7 8.7 15.5 12.97.5 0.0 7.0 4.3 19.0 7.0
3.8 2.3 0.8 4.3 7.0 5.82.6 0.0 4.7 0.0 7.1 1.8
8.4 10.9 8.3 6.5 12.8 5.04.4 0.0 4.7 4.3 9.5 3.5
2.6 2.3 2.5 0.0 3.5 4.31.8 0.0 2.3 0.0 4.8 1.8
22.0 20.6 18.6 21.7 31.4 20.421.0 5.7 16.3 21.3 34.1 23.2
Highest Grade Completed
6th Grade or Less7th to 9th Grade10th to 12th GradeAbove 12th Grade
3.6 1.95.1 5.2
71.2 69.020.0 23.8
7.9 9.388.3 87.20.9 0.40.9 1.80.0 0.41.7 0.90.3 0.0
Males FemalesType of Place in Prior 30 Days
Public HousingPrivate House or ApartmentShelterIncarceration FacilityTreatment FacilityNo Fixed ResidenceOther
Males Females
1.6 11.677.7 59.410.5 14.710.2 14.3
Primary Sourcein Prior 30 Days
Welfare, Social SecurityFull or Part-Time EmploymentOther Legal Illegal or None
Males Females
Current Primary Source of Income of Booked Arrestees (%)
Current Housing Arrangement of Booked Arrestees (%)
Education of Booked Arrestees (%)
Males FemalesN Mean Age N Mean Age Males Females Males Females
Percent Reporting Drug Use in the Past 30 Days, by Age and SexPercent Reporting Use Percent Reporting Use by Age
Age at First Use (for those admitting use) Received Prior Treatment ( % ) Ever Injected Drugs Illegally ( % )
MALES
FEMALES
C ra c k
C o c a i n e
M a r i j u a n a
O p i a t e s
M e t h a m p h e t a m i n e
0 5 10 15 20 25 30 N
Mean Number of Days Used in the Past 30 Days(for those admitting use in the past 30 days)
13.515.9
9.28.9
15.911.6
13.019.8
13.319.4
8644
6817
27982
229
215
0.61.0
0.81.0
0.80.7
16567
24855
1311
1998 Annual Report
539 15.0150 24.4182 20.2426 15.360 22.961 19.847 17.9
201 16.675 23.660 20.6
150 15.921 23.519 18.36 14.5
AlcoholCrackCocaineMarijuanaOpiatesMethamphetaminePCP
8.9 7.56.1 7.53.2 2.74.6 3.61.7 2.71.1 1.8
AlcoholCrackCocaineMarijuanaOpiatesMethamphetamine
7.9 9.36.3 6.26.6 7.5
CocaineHeroinAmphetamine/Methamphetamine
MALES
FEMALES
0 1 2 3 4 5 6 N
Mean Number of Times Reported Arrested in thePast 12 Months (excludes current offense; for thosetesting positive)
MALES
FEMALES
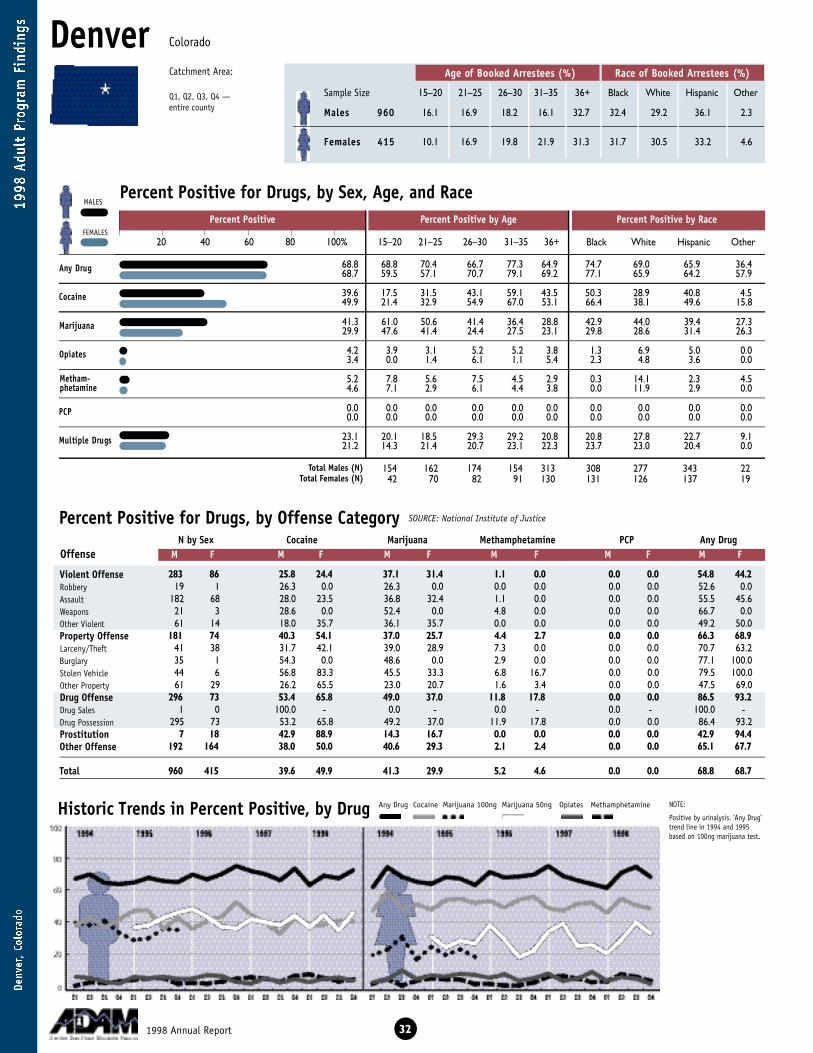
DenverAge of Booked Arrestees (%) Race of Booked Arrestees (%)
Sample Size 15–20 21–25 26–30 31–35 36+ Black White Hispanic Other
Percent Positive for Drugs, by Sex, Age, and Race
Percent Positive for Drugs, by Offense Category
Historic Trends in Percent Positive, by Drug
A ny Drug
C o c a i n e
M a r i j u a n a
O p i a t e s
P C P
Multiple Drugs
NOTE:
Positive by urinalysis. ‘Any Drug’trend line in 1994 and 1995based on 100ng marijuana test.
283 86 25.8 24.4 37.1 31.4 1.1 0.0 0.0 0.0 54.8 44.219 1 26.3 0.0 26.3 0.0 0.0 0.0 0.0 0.0 52.6 0.0
182 68 28.0 23.5 36.8 32.4 1.1 0.0 0.0 0.0 55.5 45.621 3 28.6 0.0 52.4 0.0 4.8 0.0 0.0 0.0 66.7 0.061 14 18.0 35.7 36.1 35.7 0.0 0.0 0.0 0.0 49.2 50.0
181 74 40.3 54.1 37.0 25.7 4.4 2.7 0.0 0.0 66.3 68.941 38 31.7 42.1 39.0 28.9 7.3 0.0 0.0 0.0 70.7 63.235 1 54.3 0.0 48.6 0.0 2.9 0.0 0.0 0.0 77.1 100.044 6 56.8 83.3 45.5 33.3 6.8 16.7 0.0 0.0 79.5 100.061 29 26.2 65.5 23.0 20.7 1.6 3.4 0.0 0.0 47.5 69.0
296 73 53.4 65.8 49.0 37.0 11.8 17.8 0.0 0.0 86.5 93.21 0 100.0 - 0.0 - 0.0 - 0.0 - 100.0 -
295 73 53.2 65.8 49.2 37.0 11.9 17.8 0.0 0.0 86.4 93.27 18 42.9 88.9 14.3 16.7 0.0 0.0 0.0 0.0 42.9 94.4
192 164 38.0 50.0 40.6 29.3 2.1 2.4 0.0 0.0 65.1 67.7
960 415 39.6 49.9 41.3 29.9 5.2 4.6 0.0 0.0 68.8 68.7
N by Sex Cocaine Marijuana Methamphetamine PCP Any DrugOffense M F M F M F M F M F M F
SOURCE: National Institute of Justice
321998 Annual Report
Any Drug Cocaine Marijuana 100ng Marijuana 50ng Opiates Methamphetamine
Percent Positive Percent Positive by Age Percent Positive by Race
20 40 60 80 100% 15–20 21–25 26–30 31–35 36+ Black White Hispanic Other
154 162 174 154 313 308 277 343 2242 70 82 91 130 131 126 137 19
16.1 16.9 18.2 16.1 32.7 32.4 29.2 36.1 2.3
10.1 16.9 19.8 21.9 31.3 31.7 30.5 33.2 4.6
M a l e s 9 6 0
Fe m a l e s 4 1 5
Total Males (N)Total Females (N)
Violent OffenseRobberyAssaultWeaponsOther ViolentProperty OffenseLarceny/TheftBurglaryStolen VehicleOther PropertyDrug OffenseDrug SalesDrug PossessionProstitutionOther Offense
Total
Colorado
MALES
FEMALES
M e t h a m -p h e t a m i n e
68.8 68.8 70.4 66.7 77.3 64.9 74.7 69.0 65.9 36.468.7 59.5 57.1 70.7 79.1 69.2 77.1 65.9 64.2 57.9
39.6 17.5 31.5 43.1 59.1 43.5 50.3 28.9 40.8 4.549.9 21.4 32.9 54.9 67.0 53.1 66.4 38.1 49.6 15.8
41.3 61.0 50.6 41.4 36.4 28.8 42.9 44.0 39.4 27.329.9 47.6 41.4 24.4 27.5 23.1 29.8 28.6 31.4 26.3
4.2 3.9 3.1 5.2 5.2 3.8 1.3 6.9 5.0 0.03.4 0.0 1.4 6.1 1.1 5.4 2.3 4.8 3.6 0.0
5.2 7.8 5.6 7.5 4.5 2.9 0.3 14.1 2.3 4.54.6 7.1 2.9 6.1 4.4 3.8 0.0 11.9 2.9 0.0
0.0 0.0 0.0 0.0 0.0 0.0 0.0 0.0 0.0 0.00.0 0.0 0.0 0.0 0.0 0.0 0.0 0.0 0.0 0.0
23.1 20.1 18.5 29.3 29.2 20.8 20.8 27.8 22.7 9.121.2 14.3 21.4 20.7 23.1 22.3 23.7 23.0 20.4 0.0
Catchment Area:
Q1, Q2, Q3, Q4 —entire county

C rack
C o c a i n e
C rack & Cocaine
Marijuana & Cocaine
Opiates & Cocaine
A ny 2 or More Drugs
Cocaine
M a r i j u a n a
Opiates
Description of the Sample
Self-Reported Drug Information
33
0 20 40 60 80 100% 15–20 21–25 26–30 31–35 36+
20.1 2.6 9.3 23.6 30.5 27.635.7 11.9 21.4 40.2 52.7 36.4
14.7 9.1 13.0 14.4 21.4 15.315.7 16.7 15.7 22.0 15.4 11.6
5.8 0.6 3.7 7.5 10.4 6.49.9 2.4 10.0 15.9 12.1 7.0
9.5 7.1 7.4 8.0 17.5 8.611.1 14.3 14.3 18.3 11.0 3.9
2.4 1.9 1.9 1.7 1.3 3.82.7 2.4 2.9 4.9 0.0 3.1
26.1 19.9 21.0 27.7 33.3 27.436.8 38.1 28.6 40.7 49.5 29.5
Highest Grade Completed
6th Grade or Less7th to 9th Grade10th to 12th GradeAbove 12th Grade
5.2 3.56.3 7.9
69.6 74.718.8 13.9
2.0 3.185.2 82.90.9 0.52.0 1.20.6 0.08.5 11.40.8 1.0
Males FemalesType of Place in Prior 30 Days
Public HousingPrivate House or ApartmentShelterIncarceration FacilityTreatment FacilityNo Fixed ResidenceOther
Males Females
4.9 14.874.6 44.77.2 11.4
13.2 29.1
Primary Sourcein Prior 30 Days
Welfare, Social SecurityFull or Part-Time EmploymentOther Legal Illegal or None
Males Females
Current Primary Source of Income of Booked Arrestees (%)
Current Housing Arrangement of Booked Arrestees (%)
Education of Booked Arrestees (%)
Males FemalesN Mean Age N Mean Age Males Females Males Females
Percent Reporting Drug Use in the Past 30 Days, by Age and SexPercent Reporting Use Percent Reporting Use by Age
Age at First Use (for those admitting use) Received Prior Treatment ( % ) Ever Injected Drugs Illegally ( % )
MALES
FEMALES
C ra c k
C o c a i n e
M a r i j u a n a
O p i a t e s
M e t h a m p h e t a m i n e
0 5 10 15 20 25 30 N
Mean Number of Days Used in the Past 30 Days(for those admitting use in the past 30 days)
11.812.5
6.25.9
11.79.4
19.119.8
10.79.0
193148
14165
471197
4519
6231
1.01.6
0.91.2
1.50.9
378203
395121
3914
1998 Annual Report
942 14.6367 25.4458 21.3819 15.2149 22.3191 21.675 18.6
398 15.7222 24.7199 21.7349 15.463 23.587 22.327 17.4
AlcoholCrackCocaineMarijuanaOpiatesMethamphetaminePCP
21.9 21.38.2 16.47.0 8.09.7 10.42.9 4.12.6 3.1
AlcoholCrackCocaineMarijuanaOpiatesMethamphetamine
11.9 15.710.7 12.17.2 6.3
CocaineHeroinAmphetamine/Methamphetamine
MALES
FEMALES
0 1 2 3 4 5 6 N
Mean Number of Times Reported Arrested in thePast 12 Months (excludes current offense; for thosetesting positive)
MALES
FEMALES

Catchment Area:
Q4 — entire county
Des MoinesAge of Booked Arrestees (%) Race of Booked Arrestees (%)
Sample Size 15–20 21–25 26–30 31–35 36+ Black White Hispanic Other
Percent Positive for Drugs, by Sex, Age, and Race
Percent Positive for Drugs, by Offense Category
Historic Trends in Percent Positive, by Drug
A ny Drug
C o c a i n e
M a r i j u a n a
O p i a t e s
P C P
Multiple Drugs
NOTE:
Positive by urinalysis.
Site added in Q4 1998.
49 7 12.2 28.6 34.7 14.3 4.1 0.0 0.0 0.0 46.9 57.14 0 0.0 - 75.0 - 0.0 - 0.0 - 75.0 -
32 7 12.5 28.6 28.1 14.3 3.1 0.0 0.0 0.0 40.6 57.15 0 20.0 - 80.0 - 20.0 - 0.0 - 80.0 -8 0 12.5 - 12.5 - 0.0 - 0.0 - 37.5 -
38 6 34.2 0.0 44.7 16.7 7.9 33.3 2.6 0.0 68.4 66.726 3 30.8 0.0 46.2 0.0 7.7 0.0 0.0 0.0 69.2 66.72 0 50.0 - 50.0 - 0.0 - 0.0 - 100.0 -0 0 - - - - - - - - - -
10 3 40.0 0.0 40.0 33.3 10.0 66.7 10.0 0.0 60.0 66.719 6 10.5 16.7 84.2 16.7 31.6 16.7 0.0 16.7 89.5 66.7
7 1 14.3 0.0 85.7 100.0 42.9 0.0 0.0 100.0 85.7 100.012 5 8.3 20.0 83.3 0.0 25.0 20.0 0.0 0.0 91.7 60.01 0 100.0 - 0.0 - 0.0 - 0.0 - 100.0 -
70 14 14.3 35.7 34.3 14.3 10.0 35.7 0.0 0.0 48.6 71.4
177 33 18.1 24.2 41.8 15.2 10.2 24.2 0.6 3.0 57.1 66.7
N by Sex Cocaine Marijuana Methamphetamine PCP Any DrugOffense M F M F M F M F M F M F
SOURCE: National Institute of Justice
341998 Annual Report
Percent Positive Percent Positive by Age Percent Positive by Race
20 40 60 80 100% 15–20 21–25 26–30 31–35 36+ Black White Hispanic Other
38 31 30 22 55 58 106 5 52 7 5 6 13 9 24 0 0
21.6 17.6 17.0 12.5 31.3 33.3 60.9 2.9 2.9
6.1 21.2 15.2 18.2 39.4 27.3 72.7 0.0 0.0
M a l e s 1 7 7
Fe m a l e s 3 3
Total Males (N)Total Females (N)
Violent OffenseRobberyAssaultWeaponsOther ViolentProperty OffenseLarceny/TheftBurglaryStolen VehicleOther PropertyDrug OffenseDrug SalesDrug PossessionProstitutionOther Offense
Total
Iowa
MALES
FEMALES
M e t h a m -p h e t a m i n e
57.1 68.4 58.1 50.0 77.3 43.6 70.7 53.8 20.0 20.066.7 0.0 85.7 40.0 66.7 76.9 77.8 62.5 - -
18.1 10.5 9.7 23.3 36.4 18.2 36.2 10.4 0.0 0.024.2 0.0 0.0 20.0 66.7 23.1 44.4 16.7 - -
41.8 68.4 54.8 26.7 36.4 25.5 48.3 41.5 20.0 0.015.2 0.0 42.9 0.0 0.0 15.4 33.3 8.3 - -
2.8 0.0 3.2 10.0 4.5 0.0 1.7 3.8 0.0 0.06.1 0.0 0.0 0.0 0.0 15.4 0.0 8.3 - -
10.2 0.0 3.2 10.0 22.7 16.4 1.7 16.0 0.0 0.024.2 0.0 42.9 20.0 0.0 30.8 0.0 33.3 - -
0.6 0.0 3.2 0.0 0.0 0.0 1.7 0.0 0.0 0.03.0 0.0 14.3 0.0 0.0 0.0 11.1 0.0 - -
19.2 13.2 16.1 30.0 27.3 16.4 19.0 20.8 0.0 20.030.3 0.0 57.1 0.0 16.7 38.5 22.2 33.3 - -
Any Drug Cocaine Marijuana 100ng Marijuana 50ng Opiates Methamphetamine

Cocaine
M a r i j u a n a
Opiates
Description of the Sample
Self-Reported Drug Information
C ra c k
C o c a i n e
C rack & Cocaine
Marijuana & Cocaine
Opiates & Cocaine
A ny 2 or More Drugs
35
0 20 40 60 80 100% 15–20 21–25 26–30 31–35 36+
15.3 7.9 9.7 23.3 31.8 13.030.3 0.0 42.9 20.0 66.7 15.4
8.5 10.8 9.7 6.7 13.6 5.56.1 0.0 28.6 0.0 0.0 0.0
3.4 0.0 6.5 3.3 9.1 1.86.1 0.0 28.6 0.0 0.0 0.0
6.8 10.8 9.7 3.3 13.6 1.86.1 0.0 28.6 0.0 0.0 0.0
0.6 0.0 0.0 3.3 0.0 0.00.0 0.0 0.0 0.0 0.0 0.0
29.7 35.1 22.6 33.3 42.9 23.630.3 0.0 71.4 40.0 16.7 15.4
Highest Grade Completed
6th Grade or Less7th to 9th Grade10th to 12th GradeAbove 12th Grade
5.5 13.35.5 10.0
72.6 56.716.5 20.0
4.5 0.081.4 78.83.4 9.11.1 6.10.0 3.05.1 3.04.5 0.0
Males FemalesType of Place in Prior 30 Days
Public HousingPrivate House or ApartmentShelterIncarceration FacilityTreatment FacilityNo Fixed ResidenceOther
Males Females
7.3 30.372.3 45.513.6 9.16.8 15.2
Primary Sourcein Prior 30 Days
Welfare, Social SecurityFull or Part-Time EmploymentOther Legal Illegal or None
Males Females
Current Primary Source of Income of Booked Arrestees (%)
Current Housing Arrangement of Booked Arrestees (%)
Education of Booked Arrestees (%)
Males FemalesN Mean Age N Mean Age Males Females Males Females
Percent Reporting Drug Use in the Past 30 Days, by Age and SexPercent Reporting Use Percent Reporting Use by Age
Age at First Use (for those admitting use) Received Prior Treatment ( % ) Ever Injected Drugs Illegally ( % )
MALES
FEMALES
C ra c k
C o c a i n e
M a r i j u a n a
O p i a t e s
M e t h a m p h e t a m i n e
0 5 10 15 20 25 30 N
Mean Number of Days Used in the Past 30 Days(for those admitting use in the past 30 days)
13.012.6
2.914.0
8.610.3
9.0-
10.217.6
2710
152
8813
30
337
2.81.0
1.32.2
0.40.0
328
745
52
1998 Annual Report
171 13.371 23.980 19.5
152 14.826 19.266 21.522 16.4
32 15.415 22.611 16.426 15.56 23.2
10 21.72 19.0
AlcoholCrackCocaineMarijuanaOpiatesMethamphetaminePCP
27.8 18.29.6 18.2
10.3 3.021.0 18.22.3 0.0
14.2 12.1
AlcoholCrackCocaineMarijuanaOpiatesMethamphetamine
11.9 15.67.4 6.3
14.8 21.9
CocaineHeroinAmphetamine/Methamphetamine
MALES
FEMALES
0 1 2 3 4 5 6 N
Mean Number of Times Reported Arrested in thePast 12 Months (excludes current offense; for thosetesting positive)
MALES
FEMALES
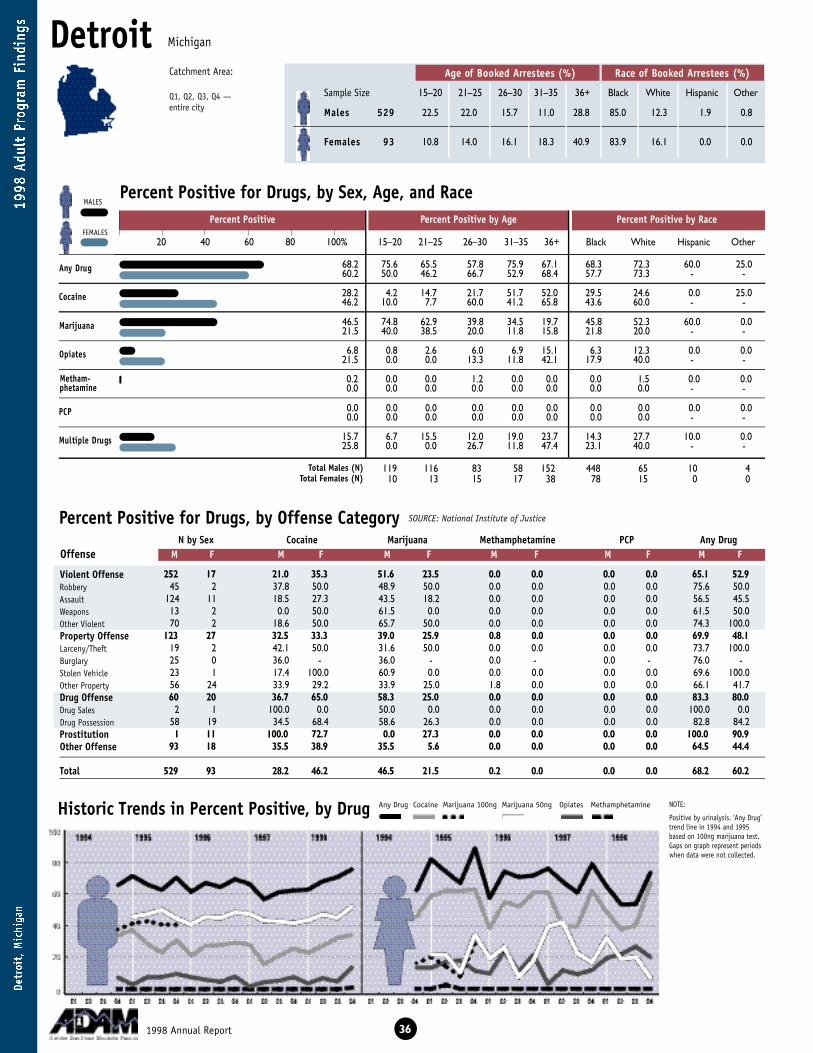
DetroitAge of Booked Arrestees (%) Race of Booked Arrestees (%)
Sample Size 15–20 21–25 26–30 31–35 36+ Black White Hispanic Other
Percent Positive for Drugs, by Sex, Age, and Race
Percent Positive for Drugs, by Offense Category
Historic Trends in Percent Positive, by Drug
A ny Drug
C o c a i n e
M a r i j u a n a
O p i a t e s
P C P
Multiple Drugs
NOTE:
Positive by urinalysis. ‘Any Drug’trend line in 1994 and 1995based on 100ng marijuana test.Gaps on graph represent periodswhen data were not collected.
252 17 21.0 35.3 51.6 23.5 0.0 0.0 0.0 0.0 65.1 52.945 2 37.8 50.0 48.9 50.0 0.0 0.0 0.0 0.0 75.6 50.0
124 11 18.5 27.3 43.5 18.2 0.0 0.0 0.0 0.0 56.5 45.513 2 0.0 50.0 61.5 0.0 0.0 0.0 0.0 0.0 61.5 50.070 2 18.6 50.0 65.7 50.0 0.0 0.0 0.0 0.0 74.3 100.0
123 27 32.5 33.3 39.0 25.9 0.8 0.0 0.0 0.0 69.9 48.119 2 42.1 50.0 31.6 50.0 0.0 0.0 0.0 0.0 73.7 100.025 0 36.0 - 36.0 - 0.0 - 0.0 - 76.0 -23 1 17.4 100.0 60.9 0.0 0.0 0.0 0.0 0.0 69.6 100.056 24 33.9 29.2 33.9 25.0 1.8 0.0 0.0 0.0 66.1 41.760 20 36.7 65.0 58.3 25.0 0.0 0.0 0.0 0.0 83.3 80.0
2 1 100.0 0.0 50.0 0.0 0.0 0.0 0.0 0.0 100.0 0.058 19 34.5 68.4 58.6 26.3 0.0 0.0 0.0 0.0 82.8 84.21 11 100.0 72.7 0.0 27.3 0.0 0.0 0.0 0.0 100.0 90.9
93 18 35.5 38.9 35.5 5.6 0.0 0.0 0.0 0.0 64.5 44.4
529 93 28.2 46.2 46.5 21.5 0.2 0.0 0.0 0.0 68.2 60.2
N by Sex Cocaine Marijuana Methamphetamine PCP Any DrugOffense M F M F M F M F M F M F
SOURCE: National Institute of Justice
361998 Annual Report
Any Drug Cocaine Marijuana 100ng Marijuana 50ng Opiates Methamphetamine
Percent Positive Percent Positive by Age Percent Positive by Race
20 40 60 80 100% 15–20 21–25 26–30 31–35 36+ Black White Hispanic Other
119 116 83 58 152 448 65 10 410 13 15 17 38 78 15 0 0
22.5 22.0 15.7 11.0 28.8 85.0 12.3 1.9 0.8
10.8 14.0 16.1 18.3 40.9 83.9 16.1 0.0 0.0
M a l e s 5 2 9
Fe m a l e s 9 3
Total Males (N)Total Females (N)
Violent OffenseRobberyAssaultWeaponsOther ViolentProperty OffenseLarceny/TheftBurglaryStolen VehicleOther PropertyDrug OffenseDrug SalesDrug PossessionProstitutionOther Offense
Total
Michigan
MALES
FEMALES
M e t h a m -p h e t a m i n e
68.2 75.6 65.5 57.8 75.9 67.1 68.3 72.3 60.0 25.060.2 50.0 46.2 66.7 52.9 68.4 57.7 73.3 - -
28.2 4.2 14.7 21.7 51.7 52.0 29.5 24.6 0.0 25.046.2 10.0 7.7 60.0 41.2 65.8 43.6 60.0 - -
46.5 74.8 62.9 39.8 34.5 19.7 45.8 52.3 60.0 0.021.5 40.0 38.5 20.0 11.8 15.8 21.8 20.0 - -
6.8 0.8 2.6 6.0 6.9 15.1 6.3 12.3 0.0 0.021.5 0.0 0.0 13.3 11.8 42.1 17.9 40.0 - -
0.2 0.0 0.0 1.2 0.0 0.0 0.0 1.5 0.0 0.00.0 0.0 0.0 0.0 0.0 0.0 0.0 0.0 - -
0.0 0.0 0.0 0.0 0.0 0.0 0.0 0.0 0.0 0.00.0 0.0 0.0 0.0 0.0 0.0 0.0 0.0 - -
15.7 6.7 15.5 12.0 19.0 23.7 14.3 27.7 10.0 0.025.8 0.0 0.0 26.7 11.8 47.4 23.1 40.0 - -
Catchment Area:
Q1, Q2, Q3, Q4 — entire city

Cocaine
M a r i j u a n a
Opiates
Description of the Sample
Self-Reported Drug Information
C ra c k
C o c a i n e
C rack & Cocaine
Marijuana & Cocaine
Opiates & Cocaine
A ny 2 or More Drugs
37
0 20 40 60 80 100% 15–20 21–25 26–30 31–35 36+
15.0 1.7 0.9 14.6 25.9 32.230.1 10.0 7.7 40.0 58.8 26.3
2.3 1.7 0.9 1.2 3.4 3.93.2 0.0 0.0 6.7 0.0 5.3
1.3 0.0 0.0 0.0 3.4 3.31.1 0.0 0.0 6.7 0.0 0.0
2.1 1.7 0.9 1.2 3.4 3.31.1 0.0 0.0 0.0 0.0 2.6
1.3 0.8 0.0 0.0 1.7 3.32.2 0.0 0.0 0.0 0.0 5.3
10.5 4.2 2.6 15.9 13.8 17.221.7 10.0 0.0 13.3 23.5 35.1
Highest Grade Completed
6th Grade or Less7th to 9th Grade10th to 12th GradeAbove 12th Grade
2.1 2.45.2 8.3
82.0 64.310.6 25.0
0.6 1.193.8 90.32.1 2.20.8 1.10.2 1.12.3 1.10.4 3.2
Males FemalesType of Place in Prior 30 Days
Public HousingPrivate House or ApartmentShelterIncarceration FacilityTreatment FacilityNo Fixed ResidenceOther
Males Females
8.0 32.364.2 39.816.1 16.111.7 11.8
Primary Sourcein Prior 30 Days
Welfare, Social SecurityFull or Part-Time EmploymentOther Legal Illegal or None
Males Females
Current Primary Source of Income of Booked Arrestees (%)
Current Housing Arrangement of Booked Arrestees (%)
Education of Booked Arrestees (%)
Males FemalesN Mean Age N Mean Age Males Females Males Females
Percent Reporting Drug Use in the Past 30 Days, by Age and SexPercent Reporting Use Percent Reporting Use by Age
Age at First Use (for those admitting use) Received Prior Treatment ( % ) Ever Injected Drugs Illegally ( % )
MALES
FEMALES
C ra c k
C o c a i n e
M a r i j u a n a
O p i a t e s
M e t h a m p h e t a m i n e
0 5 10 15 20 25 30 N
Mean Number of Days Used in the Past 30 Days(for those admitting use in the past 30 days)
13.415.0
6.315.3
11.77.8
17.921.0
2.030.0
7928
123
24225
3012
12
0.80.7
0.50.3
0.40.7
14943
24620
3620
1998 Annual Report
493 15.5126 27.2110 22.5422 16.160 22.911 22.215 21.3
82 16.142 25.020 22.069 16.718 22.69 23.03 21.7
AlcoholCrackCocaineMarijuanaOpiatesMethamphetaminePCP
8.2 8.68.5 15.10.8 3.23.6 3.23.2 8.60.2 3.3
AlcoholCrackCocaineMarijuanaOpiatesMethamphetamine
2.1 0.05.7 12.90.8 0.0
CocaineHeroinAmphetamine/Methamphetamine
MALES
FEMALES
0 1 2 3 4 5 6 N
Mean Number of Times Reported Arrested in thePast 12 Months (excludes current offense; for thosetesting positive)
MALES
FEMALES
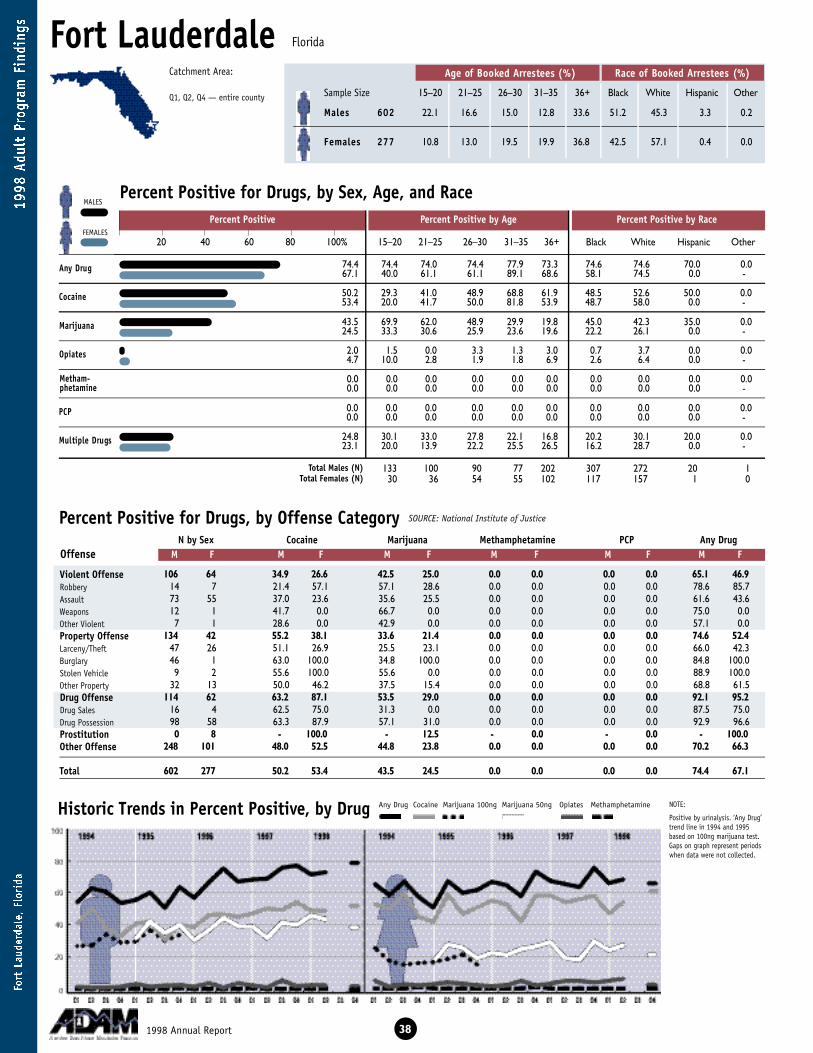
Fort LauderdaleAge of Booked Arrestees (%) Race of Booked Arrestees (%)
Sample Size 15–20 21–25 26–30 31–35 36+ Black White Hispanic Other
Percent Positive for Drugs, by Sex, Age, and Race
Percent Positive for Drugs, by Offense Category
Historic Trends in Percent Positive, by Drug
A ny Drug
C o c a i n e
M a r i j u a n a
O p i a t e s
P C P
Multiple Drugs
NOTE:
Positive by urinalysis. ‘Any Drug’trend line in 1994 and 1995based on 100ng marijuana test.Gaps on graph represent periodswhen data were not collected.
106 64 34.9 26.6 42.5 25.0 0.0 0.0 0.0 0.0 65.1 46.914 7 21.4 57.1 57.1 28.6 0.0 0.0 0.0 0.0 78.6 85.773 55 37.0 23.6 35.6 25.5 0.0 0.0 0.0 0.0 61.6 43.612 1 41.7 0.0 66.7 0.0 0.0 0.0 0.0 0.0 75.0 0.07 1 28.6 0.0 42.9 0.0 0.0 0.0 0.0 0.0 57.1 0.0
134 42 55.2 38.1 33.6 21.4 0.0 0.0 0.0 0.0 74.6 52.447 26 51.1 26.9 25.5 23.1 0.0 0.0 0.0 0.0 66.0 42.346 1 63.0 100.0 34.8 100.0 0.0 0.0 0.0 0.0 84.8 100.09 2 55.6 100.0 55.6 0.0 0.0 0.0 0.0 0.0 88.9 100.0
32 13 50.0 46.2 37.5 15.4 0.0 0.0 0.0 0.0 68.8 61.5114 62 63.2 87.1 53.5 29.0 0.0 0.0 0.0 0.0 92.1 95.2
16 4 62.5 75.0 31.3 0.0 0.0 0.0 0.0 0.0 87.5 75.098 58 63.3 87.9 57.1 31.0 0.0 0.0 0.0 0.0 92.9 96.60 8 - 100.0 - 12.5 - 0.0 - 0.0 - 100.0
248 101 48.0 52.5 44.8 23.8 0.0 0.0 0.0 0.0 70.2 66.3
602 277 50.2 53.4 43.5 24.5 0.0 0.0 0.0 0.0 74.4 67.1
N by Sex Cocaine Marijuana Methamphetamine PCP Any DrugOffense M F M F M F M F M F M F
SOURCE: National Institute of Justice
381998 Annual Report
Any Drug Cocaine Marijuana 100ng Marijuana 50ng Opiates Methamphetamine
Percent Positive Percent Positive by Age Percent Positive by Race
20 40 60 80 100% 15–20 21–25 26–30 31–35 36+ Black White Hispanic Other
133 100 90 77 202 307 272 20 130 36 54 55 102 117 157 1 0
22.1 16.6 15.0 12.8 33.6 51.2 45.3 3.3 0.2
10.8 13.0 19.5 19.9 36.8 42.5 57.1 0.4 0.0
M a l e s 6 0 2
Fe m a l e s 2 7 7
Total Males (N)Total Females (N)
Violent OffenseRobberyAssaultWeaponsOther ViolentProperty OffenseLarceny/TheftBurglaryStolen VehicleOther PropertyDrug OffenseDrug SalesDrug PossessionProstitutionOther Offense
Total
Florida
MALES
FEMALES
M e t h a m -p h e t a m i n e
74.4 74.4 74.0 74.4 77.9 73.3 74.6 74.6 70.0 0.067.1 40.0 61.1 61.1 89.1 68.6 58.1 74.5 0.0 -
50.2 29.3 41.0 48.9 68.8 61.9 48.5 52.6 50.0 0.053.4 20.0 41.7 50.0 81.8 53.9 48.7 58.0 0.0 -
43.5 69.9 62.0 48.9 29.9 19.8 45.0 42.3 35.0 0.024.5 33.3 30.6 25.9 23.6 19.6 22.2 26.1 0.0 -
2.0 1.5 0.0 3.3 1.3 3.0 0.7 3.7 0.0 0.04.7 10.0 2.8 1.9 1.8 6.9 2.6 6.4 0.0 -
0.0 0.0 0.0 0.0 0.0 0.0 0.0 0.0 0.0 0.00.0 0.0 0.0 0.0 0.0 0.0 0.0 0.0 0.0 -
0.0 0.0 0.0 0.0 0.0 0.0 0.0 0.0 0.0 0.00.0 0.0 0.0 0.0 0.0 0.0 0.0 0.0 0.0 -
24.8 30.1 33.0 27.8 22.1 16.8 20.2 30.1 20.0 0.023.1 20.0 13.9 22.2 25.5 26.5 16.2 28.7 0.0 -
Catchment Area:
Q1, Q2, Q4 — entire county

Cocaine
M a r i j u a n a
Opiates
Description of the Sample
Self-Reported Drug Information
C ra c k
C o c a i n e
C rack & Cocaine
Marijuana & Cocaine
Opiates & Cocaine
A ny 2 or More Drugs
39
0 20 40 60 80 100% 15–20 21–25 26–30 31–35 36+
24.8 0.8 8.0 26.7 42.9 41.137.0 6.7 22.2 34.0 65.5 37.3
17.4 10.5 19.0 20.0 27.3 16.312.3 13.3 8.3 16.7 21.8 5.9
6.6 0.0 2.0 6.7 18.2 8.97.9 6.7 5.6 7.4 16.4 4.9
13.1 10.5 17.0 17.8 16.9 9.410.1 13.3 5.6 14.8 18.2 3.9
1.8 0.0 3.0 3.3 1.3 2.02.2 6.7 0.0 3.7 3.6 0.0
26.2 18.0 23.0 34.4 33.8 26.726.4 13.3 19.4 31.5 43.6 20.8
Highest Grade Completed
6th Grade or Less7th to 9th Grade10th to 12th GradeAbove 12th Grade
1.5 1.16.9 6.8
73.7 66.918.0 25.2
1.2 1.492.5 92.10.3 0.40.7 0.00.5 0.44.0 3.60.8 2.2
Males FemalesType of Place in Prior 30 Days
Public HousingPrivate House or ApartmentShelterIncarceration FacilityTreatment FacilityNo Fixed ResidenceOther
Males Females
2.3 9.472.4 46.611.0 24.514.3 19.5
Primary Sourcein Prior 30 Days
Welfare, Social SecurityFull or Part-Time EmploymentOther Legal Illegal or None
Males Females
Current Primary Source of Income of Booked Arrestees (%)
Current Housing Arrangement of Booked Arrestees (%)
Education of Booked Arrestees (%)
Males FemalesN Mean Age N Mean Age Males Females Males Females
Percent Reporting Drug Use in the Past 30 Days, by Age and SexPercent Reporting Use Percent Reporting Use by Age
Age at First Use (for those admitting use) Received Prior Treatment ( % ) Ever Injected Drugs Illegally ( % )
MALES
FEMALES
C ra c k
C o c a i n e
M a r i j u a n a
O p i a t e s
M e t h a m p h e t a m i n e
0 5 10 15 20 25 30 N
Mean Number of Days Used in the Past 30 Days(for those admitting use in the past 30 days)
16.316.5
7.86.0
15.410.3
11.211.5
3.01.0
149102
10534
311103
1811
41
0.91.1
0.80.5
0.21.1
300145
26267
1213
1998 Annual Report
556 14.8225 26.4304 20.5506 15.482 20.668 19.962 18.6
262 15.7135 24.9156 20.3224 15.746 21.329 20.531 16.7
AlcoholCrackCocaineMarijuanaOpiatesMethamphetaminePCP
13.1 13.415.1 19.99.7 8.38.8 4.02.0 2.50.0 0.0
AlcoholCrackCocaineMarijuanaOpiatesMethamphetamine
7.7 12.77.2 12.72.5 1.8
CocaineHeroinAmphetamine/Methamphetamine
MALES
FEMALES
0 1 2 3 4 5 6 N
Mean Number of Times Reported Arrested in thePast 12 Months (excludes current offense; for thosetesting positive)
MALES
FEMALES
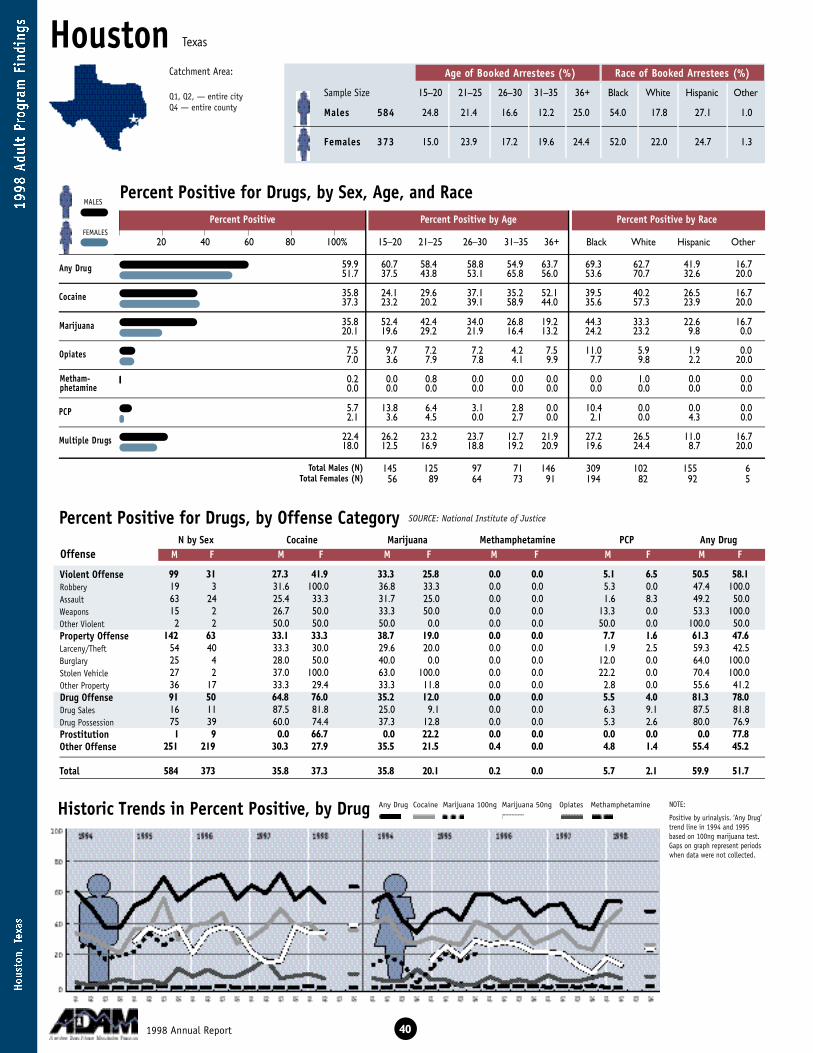
HoustonAge of Booked Arrestees (%) Race of Booked Arrestees (%)
Sample Size 15–20 21–25 26–30 31–35 36+ Black White Hispanic Other
Percent Positive for Drugs, by Sex, Age, and Race
Percent Positive for Drugs, by Offense Category
Historic Trends in Percent Positive, by Drug
A ny Drug
C o c a i n e
M a r i j u a n a
O p i a t e s
P C P
Multiple Drugs
NOTE:
Positive by urinalysis. ‘Any Drug’trend line in 1994 and 1995based on 100ng marijuana test.Gaps on graph represent periodswhen data were not collected.
99 31 27.3 41.9 33.3 25.8 0.0 0.0 5.1 6.5 50.5 58.119 3 31.6 100.0 36.8 33.3 0.0 0.0 5.3 0.0 47.4 100.063 24 25.4 33.3 31.7 25.0 0.0 0.0 1.6 8.3 49.2 50.015 2 26.7 50.0 33.3 50.0 0.0 0.0 13.3 0.0 53.3 100.02 2 50.0 50.0 50.0 0.0 0.0 0.0 50.0 0.0 100.0 50.0
142 63 33.1 33.3 38.7 19.0 0.0 0.0 7.7 1.6 61.3 47.654 40 33.3 30.0 29.6 20.0 0.0 0.0 1.9 2.5 59.3 42.525 4 28.0 50.0 40.0 0.0 0.0 0.0 12.0 0.0 64.0 100.027 2 37.0 100.0 63.0 100.0 0.0 0.0 22.2 0.0 70.4 100.036 17 33.3 29.4 33.3 11.8 0.0 0.0 2.8 0.0 55.6 41.291 50 64.8 76.0 35.2 12.0 0.0 0.0 5.5 4.0 81.3 78.016 11 87.5 81.8 25.0 9.1 0.0 0.0 6.3 9.1 87.5 81.875 39 60.0 74.4 37.3 12.8 0.0 0.0 5.3 2.6 80.0 76.91 9 0.0 66.7 0.0 22.2 0.0 0.0 0.0 0.0 0.0 77.8
251 219 30.3 27.9 35.5 21.5 0.4 0.0 4.8 1.4 55.4 45.2
584 373 35.8 37.3 35.8 20.1 0.2 0.0 5.7 2.1 59.9 51.7
N by Sex Cocaine Marijuana Methamphetamine PCP Any DrugOffense M F M F M F M F M F M F
SOURCE: National Institute of Justice
401998 Annual Report
Any Drug Cocaine Marijuana 100ng Marijuana 50ng Opiates Methamphetamine
Percent Positive Percent Positive by Age Percent Positive by Race
20 40 60 80 100% 15–20 21–25 26–30 31–35 36+ Black White Hispanic Other
145 125 97 71 146 309 102 155 656 89 64 73 91 194 82 92 5
24.8 21.4 16.6 12.2 25.0 54.0 17.8 27.1 1.0
15.0 23.9 17.2 19.6 24.4 52.0 22.0 24.7 1.3
M a l e s 5 8 4
Fe m a l e s 3 7 3
Total Males (N)Total Females (N)
Violent OffenseRobberyAssaultWeaponsOther ViolentProperty OffenseLarceny/TheftBurglaryStolen VehicleOther PropertyDrug OffenseDrug SalesDrug PossessionProstitutionOther Offense
Total
Texas
MALES
FEMALES
M e t h a m -p h e t a m i n e
59.9 60.7 58.4 58.8 54.9 63.7 69.3 62.7 41.9 16.751.7 37.5 43.8 53.1 65.8 56.0 53.6 70.7 32.6 20.0
35.8 24.1 29.6 37.1 35.2 52.1 39.5 40.2 26.5 16.737.3 23.2 20.2 39.1 58.9 44.0 35.6 57.3 23.9 20.0
35.8 52.4 42.4 34.0 26.8 19.2 44.3 33.3 22.6 16.720.1 19.6 29.2 21.9 16.4 13.2 24.2 23.2 9.8 0.0
7.5 9.7 7.2 7.2 4.2 7.5 11.0 5.9 1.9 0.07.0 3.6 7.9 7.8 4.1 9.9 7.7 9.8 2.2 20.0
0.2 0.0 0.8 0.0 0.0 0.0 0.0 1.0 0.0 0.00.0 0.0 0.0 0.0 0.0 0.0 0.0 0.0 0.0 0.0
5.7 13.8 6.4 3.1 2.8 0.0 10.4 0.0 0.0 0.02.1 3.6 4.5 0.0 2.7 0.0 2.1 0.0 4.3 0.0
22.4 26.2 23.2 23.7 12.7 21.9 27.2 26.5 11.0 16.718.0 12.5 16.9 18.8 19.2 20.9 19.6 24.4 8.7 20.0
Catchment Area:
Q1, Q2, — entire cityQ4 — entire county

Cocaine
M a r i j u a n a
Opiates
Description of the Sample
Self-Reported Drug Information
C ra c k
C o c a i n e
C rack & Cocaine
Marijuana & Cocaine
Opiates & Cocaine
A ny 2 or More Drugs
41
0 20 40 60 80 100% 15–20 21–25 26–30 31–35 36+
17.1 3.4 7.2 20.0 16.9 37.515.5 5.4 7.9 10.9 24.7 25.3
10.7 4.1 14.4 10.4 11.3 13.810.7 7.1 10.3 9.5 18.3 7.9
6.7 2.1 6.4 6.3 7.0 11.75.1 3.6 3.4 4.7 9.6 4.4
7.0 2.1 12.8 4.2 9.9 7.56.8 7.1 6.7 4.8 12.5 3.3
0.9 0.0 0.8 2.1 0.0 1.41.9 1.8 1.1 0.0 5.6 1.1
21.9 17.2 19.4 20.0 18.6 31.715.1 12.5 13.5 12.5 20.8 15.4
Highest Grade Completed
6th Grade or Less7th to 9th Grade10th to 12th GradeAbove 12th Grade
6.8 3.05.0 7.5
71.2 72.417.0 17.1
9.0 15.986.4 82.20.3 0.50.9 0.50.2 0.01.9 0.81.4 0.0
Males FemalesType of Place in Prior 30 Days
Public HousingPrivate House or ApartmentShelterIncarceration FacilityTreatment FacilityNo Fixed ResidenceOther
Males Females
2.6 9.479.0 57.16.9 21.3
11.4 12.1
Primary Sourcein Prior 30 Days
Welfare, Social SecurityFull or Part-Time EmploymentOther Legal Illegal or None
Males Females
Current Primary Source of Income of Booked Arrestees (%)
Current Housing Arrangement of Booked Arrestees (%)
Education of Booked Arrestees (%)
Males FemalesN Mean Age N Mean Age Males Females Males Females
Percent Reporting Drug Use in the Past 30 Days, by Age and SexPercent Reporting Use Percent Reporting Use by Age
Age at First Use (for those admitting use) Received Prior Treatment ( % ) Ever Injected Drugs Illegally ( % )
MALES
FEMALES
C ra c k
C o c a i n e
M a r i j u a n a
O p i a t e s
M e t h a m p h e t a m i n e
0 5 10 15 20 25 30 N
Mean Number of Days Used in the Past 30 Days(for those admitting use in the past 30 days)
12.015.9
8.27.2
13.010.9
21.118.5
4.810.5
9958
6239
229112
1112
46
0.90.5
1.10.4
0.70.5
209139
20975
4426
1998 Annual Report
528 15.0154 26.4166 20.9412 15.743 22.340 21.242 18.5
319 16.697 26.385 20.2
225 16.435 19.926 19.021 18.1
AlcoholCrackCocaineMarijuanaOpiatesMethamphetaminePCP
3.8 4.83.3 5.91.2 3.82.3 4.61.0 2.20.2 1.6
AlcoholCrackCocaineMarijuanaOpiatesMethamphetamine
7.2 9.15.7 6.72.2 2.7
CocaineHeroinAmphetamine/Methamphetamine
MALES
FEMALES
0 1 2 3 4 5 6 N
Mean Number of Times Reported Arrested in thePast 12 Months (excludes current offense; for thosetesting positive)
MALES
FEMALES

IndianapolisAge of Booked Arrestees (%) Race of Booked Arrestees (%)
Sample Size 15–20 21–25 26–30 31–35 36+ Black White Hispanic Other
Percent Positive for Drugs, by Sex, Age, and Race
Percent Positive for Drugs, by Offense Category
Historic Trends in Percent Positive, by Drug
A ny Drug
C o c a i n e
M a r i j u a n a
O p i a t e s
P C P
Multiple Drugs
NOTE:
Positive by urinalysis. ‘Any Drug’trend line in 1994 and 1995based on 100ng marijuana test.Gaps on graph represent periodswhen data were not collected.
147 52 33.3 30.8 49.0 32.7 1.4 0.0 0.7 0.0 69.4 55.811 3 9.1 100.0 63.6 33.3 0.0 0.0 0.0 0.0 81.8 100.0
101 41 34.7 24.4 44.6 34.1 2.0 0.0 0.0 0.0 66.3 53.719 0 26.3 - 63.2 - 0.0 - 5.3 - 68.4 -16 8 50.0 37.5 50.0 25.0 0.0 0.0 0.0 0.0 81.3 50.0
101 72 41.6 52.8 46.5 25.0 0.0 0.0 1.0 0.0 73.3 68.132 35 34.4 71.4 28.1 31.4 0.0 0.0 0.0 0.0 59.4 77.18 2 25.0 100.0 37.5 100.0 0.0 0.0 0.0 0.0 62.5 100.04 0 75.0 - 75.0 - 0.0 - 0.0 - 75.0 -
57 35 45.6 31.4 56.1 14.3 0.0 0.0 1.8 0.0 82.5 57.190 33 45.6 51.5 57.8 48.5 3.3 0.0 0.0 0.0 84.4 84.8
7 2 14.3 50.0 42.9 100.0 0.0 0.0 0.0 0.0 71.4 100.083 31 48.2 51.6 59.0 45.2 3.6 0.0 0.0 0.0 85.5 83.95 34 40.0 76.5 60.0 23.5 0.0 0.0 0.0 2.9 100.0 82.4
269 101 27.9 28.7 37.9 31.7 0.0 0.0 0.4 0.0 56.5 61.4
612 292 34.2 43.2 45.1 31.2 0.8 0.0 0.5 0.3 66.8 67.1
N by Sex Cocaine Marijuana Methamphetamine PCP Any DrugOffense M F M F M F M F M F M F
SOURCE: National Institute of Justice
421998 Annual Report
Any Drug Cocaine Marijuana 100ng Marijuana 50ng Opiates Methamphetamine
Percent Positive Percent Positive by Age Percent Positive by Race
20 40 60 80 100% 15–20 21–25 26–30 31–35 36+ Black White Hispanic Other
64 123 131 94 200 326 271 11 337 46 48 58 103 155 131 4 1
10.5 20.1 21.4 15.4 32.7 53.4 44.4 1.8 0.5
12.7 15.8 16.4 19.9 35.3 53.3 45.0 1.4 0.3
M a l e s 6 1 2
Fe m a l e s 2 9 2
Total Males (N)Total Females (N)
Violent OffenseRobberyAssaultWeaponsOther ViolentProperty OffenseLarceny/TheftBurglaryStolen VehicleOther PropertyDrug OffenseDrug SalesDrug PossessionProstitutionOther Offense
Total
Indiana
MALES
FEMALES
M e t h a m -p h e t a m i n e
66.8 76.6 67.5 62.6 74.5 62.5 73.6 59.8 45.5 33.367.1 56.8 71.7 62.5 74.1 67.0 69.0 66.4 0.0 100.0
34.2 12.5 26.0 29.8 48.9 42.0 46.3 20.7 9.1 0.043.2 5.4 37.0 43.8 60.3 49.5 52.9 32.1 0.0 100.0
45.1 76.6 60.2 40.5 37.2 32.5 46.3 44.6 27.3 33.331.2 48.6 47.8 27.1 25.9 22.3 29.0 35.1 0.0 0.0
1.8 0.0 3.3 0.8 1.1 2.5 2.1 1.1 9.1 0.04.5 0.0 4.3 0.0 1.7 9.7 5.2 3.8 0.0 0.0
0.8 0.0 0.0 0.8 3.2 0.5 0.0 1.8 0.0 0.0` 0.0 0.0 0.0 0.0 0.0 0.0 0.0 0.0 0.0 0.0
0.5 1.6 0.8 0.8 0.0 0.0 0.9 0.0 0.0 0.00.3 0.0 0.0 0.0 0.0 1.0 0.6 0.0 0.0 0.0
21.7 18.8 26.0 19.1 25.5 20.0 23.0 21.0 9.1 0.021.2 5.4 23.9 14.6 24.1 27.2 21.9 21.4 0.0 0.0
Catchment Area:
Q1, Q2, Q4 — entire county

Cocaine
M a r i j u a n a
Opiates
Description of the Sample
Self-Reported Drug Information
C ra c k
C o c a i n e
C rack & Cocaine
Marijuana & Cocaine
Opiates & Cocaine
A ny 2 or More Drugs
43
0 20 40 60 80 100% 15–20 21–25 26–30 31–35 36+
17.7 1.6 4.9 10.1 28.7 30.733.6 5.4 26.1 39.6 53.4 33.0
7.4 3.1 6.5 4.6 8.5 10.610.7 5.4 6.5 17.0 10.3 11.8
4.4 0.0 2.4 2.3 5.3 8.07.2 0.0 4.3 12.8 10.3 6.8
4.6 3.1 4.1 3.1 4.3 6.57.6 5.4 6.5 12.5 8.6 5.9
1.0 0.0 0.8 0.0 0.0 2.51.7 0.0 0.0 0.0 0.0 4.9
19.3 12.5 12.2 14.8 25.5 25.927.5 16.2 23.9 31.9 36.2 26.2
Highest Grade Completed
6th Grade or Less7th to 9th Grade10th to 12th GradeAbove 12th Grade
1.6 1.16.0 3.7
76.2 75.616.2 19.6
1.3 2.794.4 94.21.0 0.70.2 1.40.2 0.02.0 1.01.0 0.0
Males FemalesType of Place in Prior 30 Days
Public HousingPrivate House or ApartmentShelterIncarceration FacilityTreatment FacilityNo Fixed ResidenceOther
Males Females
4.3 12.477.9 55.26.4 12.8
11.5 19.7
Primary Sourcein Prior 30 Days
Welfare, Social SecurityFull or Part-Time EmploymentOther Legal Illegal or None
Males Females
Current Primary Source of Income of Booked Arrestees (%)
Current Housing Arrangement of Booked Arrestees (%)
Education of Booked Arrestees (%)
Males FemalesN Mean Age N Mean Age Males Females Males Females
Percent Reporting Drug Use in the Past 30 Days, by Age and SexPercent Reporting Use Percent Reporting Use by Age
Age at First Use (for those admitting use) Received Prior Treatment ( % ) Ever Injected Drugs Illegally ( % )
MALES
FEMALES
C ra c k
C o c a i n e
M a r i j u a n a
O p i a t e s
M e t h a m p h e t a m i n e
0 5 10 15 20 25 30 N
Mean Number of Days Used in the Past 30 Days(for those admitting use in the past 30 days)
9.913.8
7.99.3
12.68.0
6.417.9
10.32.5
10898
4531
303121
1012
44
1.01.0
1.00.6
0.30.7
209125
27691
1113
1998 Annual Report
588 14.6189 27.5214 22.2494 15.357 20.959 21.734 19.0
262 16.1132 26.3112 23.1229 16.531 24.119 21.312 19.6
AlcoholCrackCocaineMarijuanaOpiatesMethamphetaminePCP
25.5 17.96.1 13.15.0 6.38.8 6.71.1 1.70.3 0.7
AlcoholCrackCocaineMarijuanaOpiatesMethamphetamine
8.7 10.34.4 6.82.6 3.1
CocaineHeroinAmphetamine/Methamphetamine
MALES
FEMALES
0 1 2 3 4 5 6 N
Mean Number of Times Reported Arrested in thePast 12 Months (excludes current offense; for thosetesting positive)
MALES
FEMALES
Catchment Area:
Q4 — entire county
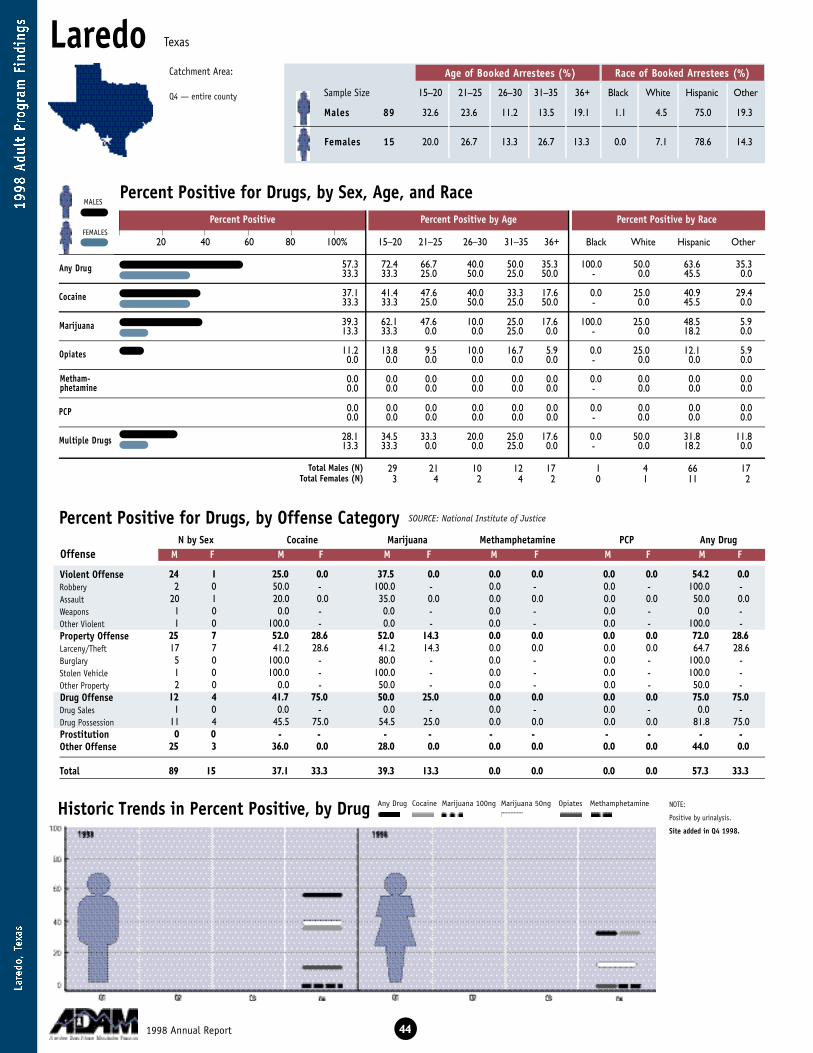
LaredoAge of Booked Arrestees (%) Race of Booked Arrestees (%)
Sample Size 15–20 21–25 26–30 31–35 36+ Black White Hispanic Other
Percent Positive for Drugs, by Sex, Age, and Race
Percent Positive for Drugs, by Offense Category
Historic Trends in Percent Positive, by Drug
A ny Drug
C o c a i n e
M a r i j u a n a
O p i a t e s
P C P
Multiple Drugs
NOTE:
Positive by urinalysis.
Site added in Q4 1998.
24 1 25.0 0.0 37.5 0.0 0.0 0.0 0.0 0.0 54.2 0.02 0 50.0 - 100.0 - 0.0 - 0.0 - 100.0 -
20 1 20.0 0.0 35.0 0.0 0.0 0.0 0.0 0.0 50.0 0.01 0 0.0 - 0.0 - 0.0 - 0.0 - 0.0 -1 0 100.0 - 0.0 - 0.0 - 0.0 - 100.0 -
25 7 52.0 28.6 52.0 14.3 0.0 0.0 0.0 0.0 72.0 28.617 7 41.2 28.6 41.2 14.3 0.0 0.0 0.0 0.0 64.7 28.65 0 100.0 - 80.0 - 0.0 - 0.0 - 100.0 -1 0 100.0 - 100.0 - 0.0 - 0.0 - 100.0 -2 0 0.0 - 50.0 - 0.0 - 0.0 - 50.0 -
12 4 41.7 75.0 50.0 25.0 0.0 0.0 0.0 0.0 75.0 75.01 0 0.0 - 0.0 - 0.0 - 0.0 - 0.0 -
11 4 45.5 75.0 54.5 25.0 0.0 0.0 0.0 0.0 81.8 75.00 0 - - - - - - - - - -
25 3 36.0 0.0 28.0 0.0 0.0 0.0 0.0 0.0 44.0 0.0
89 15 37.1 33.3 39.3 13.3 0.0 0.0 0.0 0.0 57.3 33.3
N by Sex Cocaine Marijuana Methamphetamine PCP Any DrugOffense M F M F M F M F M F M F
SOURCE: National Institute of Justice
441998 Annual Report
Percent Positive Percent Positive by Age Percent Positive by Race
20 40 60 80 100% 15–20 21–25 26–30 31–35 36+ Black White Hispanic Other
29 21 10 12 17 1 4 66 173 4 2 4 2 0 1 11 2
32.6 23.6 11.2 13.5 19.1 1.1 4.5 75.0 19.3
20.0 26.7 13.3 26.7 13.3 0.0 7.1 78.6 14.3
M a l e s 8 9
Fe m a l e s 1 5
Total Males (N)Total Females (N)
Violent OffenseRobberyAssaultWeaponsOther ViolentProperty OffenseLarceny/TheftBurglaryStolen VehicleOther PropertyDrug OffenseDrug SalesDrug PossessionProstitutionOther Offense
Total
Texas
MALES
FEMALES
M e t h a m -p h e t a m i n e
57.3 72.4 66.7 40.0 50.0 35.3 100.0 50.0 63.6 35.333.3 33.3 25.0 50.0 25.0 50.0 - 0.0 45.5 0.0
37.1 41.4 47.6 40.0 33.3 17.6 0.0 25.0 40.9 29.433.3 33.3 25.0 50.0 25.0 50.0 - 0.0 45.5 0.0
39.3 62.1 47.6 10.0 25.0 17.6 100.0 25.0 48.5 5.913.3 33.3 0.0 0.0 25.0 0.0 - 0.0 18.2 0.0
11.2 13.8 9.5 10.0 16.7 5.9 0.0 25.0 12.1 5.90.0 0.0 0.0 0.0 0.0 0.0 - 0.0 0.0 0.0
0.0 0.0 0.0 0.0 0.0 0.0 0.0 0.0 0.0 0.00.0 0.0 0.0 0.0 0.0 0.0 - 0.0 0.0 0.0
0.0 0.0 0.0 0.0 0.0 0.0 0.0 0.0 0.0 0.00.0 0.0 0.0 0.0 0.0 0.0 - 0.0 0.0 0.0
28.1 34.5 33.3 20.0 25.0 17.6 0.0 50.0 31.8 11.813.3 33.3 0.0 0.0 25.0 0.0 - 0.0 18.2 0.0
Any Drug Cocaine Marijuana 100ng Marijuana 50ng Opiates Methamphetamine
Cocaine
M a r i j u a n a
Opiates
Description of the Sample
Self-Reported Drug Information
C ra c k
C o c a i n e
C rack & Cocaine
Marijuana & Cocaine
Opiates & Cocaine
A ny 2 or More Drugs
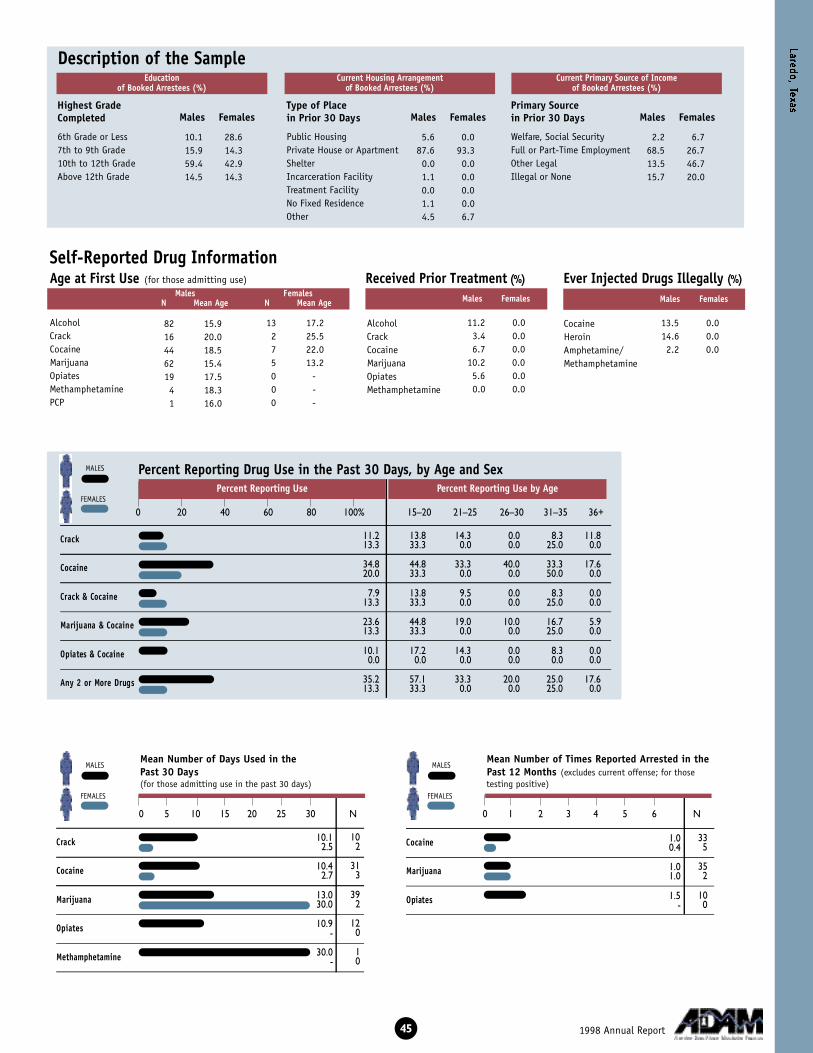
45
0 20 40 60 80 100% 15–20 21–25 26–30 31–35 36+
11.2 13.8 14.3 0.0 8.3 11.813.3 33.3 0.0 0.0 25.0 0.0
34.8 44.8 33.3 40.0 33.3 17.620.0 33.3 0.0 0.0 50.0 0.0
7.9 13.8 9.5 0.0 8.3 0.013.3 33.3 0.0 0.0 25.0 0.0
23.6 44.8 19.0 10.0 16.7 5.913.3 33.3 0.0 0.0 25.0 0.0
10.1 17.2 14.3 0.0 8.3 0.00.0 0.0 0.0 0.0 0.0 0.0
35.2 57.1 33.3 20.0 25.0 17.613.3 33.3 0.0 0.0 25.0 0.0
Highest Grade Completed
6th Grade or Less7th to 9th Grade10th to 12th GradeAbove 12th Grade
10.1 28.615.9 14.359.4 42.914.5 14.3
5.6 0.087.6 93.30.0 0.01.1 0.00.0 0.01.1 0.04.5 6.7
Males FemalesType of Place in Prior 30 Days
Public HousingPrivate House or ApartmentShelterIncarceration FacilityTreatment FacilityNo Fixed ResidenceOther
Males Females
2.2 6.768.5 26.713.5 46.715.7 20.0
Primary Sourcein Prior 30 Days
Welfare, Social SecurityFull or Part-Time EmploymentOther Legal Illegal or None
Males Females
Current Primary Source of Income of Booked Arrestees (%)
Current Housing Arrangement of Booked Arrestees (%)
Education of Booked Arrestees (%)
Males FemalesN Mean Age N Mean Age Males Females Males Females
Percent Reporting Drug Use in the Past 30 Days, by Age and SexPercent Reporting Use Percent Reporting Use by Age
Age at First Use (for those admitting use) Received Prior Treatment ( % ) Ever Injected Drugs Illegally ( % )
MALES
FEMALES
C ra c k
C o c a i n e
M a r i j u a n a
O p i a t e s
M e t h a m p h e t a m i n e
0 5 10 15 20 25 30 N
Mean Number of Days Used in the Past 30 Days(for those admitting use in the past 30 days)
10.12.5
10.42.7
13.030.0
10.9-
30.0-
102
313
392
120
10
1.00.4
1.01.0
1.5-
335
352
100
1998 Annual Report
82 15.916 20.044 18.562 15.419 17.54 18.31 16.0
13 17.22 25.57 22.05 13.20 -0 -0 -
AlcoholCrackCocaineMarijuanaOpiatesMethamphetaminePCP
11.2 0.03.4 0.06.7 0.0
10.2 0.05.6 0.00.0 0.0
AlcoholCrackCocaineMarijuanaOpiatesMethamphetamine
13.5 0.014.6 0.02.2 0.0
CocaineHeroinAmphetamine/Methamphetamine
MALES
FEMALES
0 1 2 3 4 5 6 N
Mean Number of Times Reported Arrested in thePast 12 Months (excludes current offense; for thosetesting positive)
MALES
FEMALES
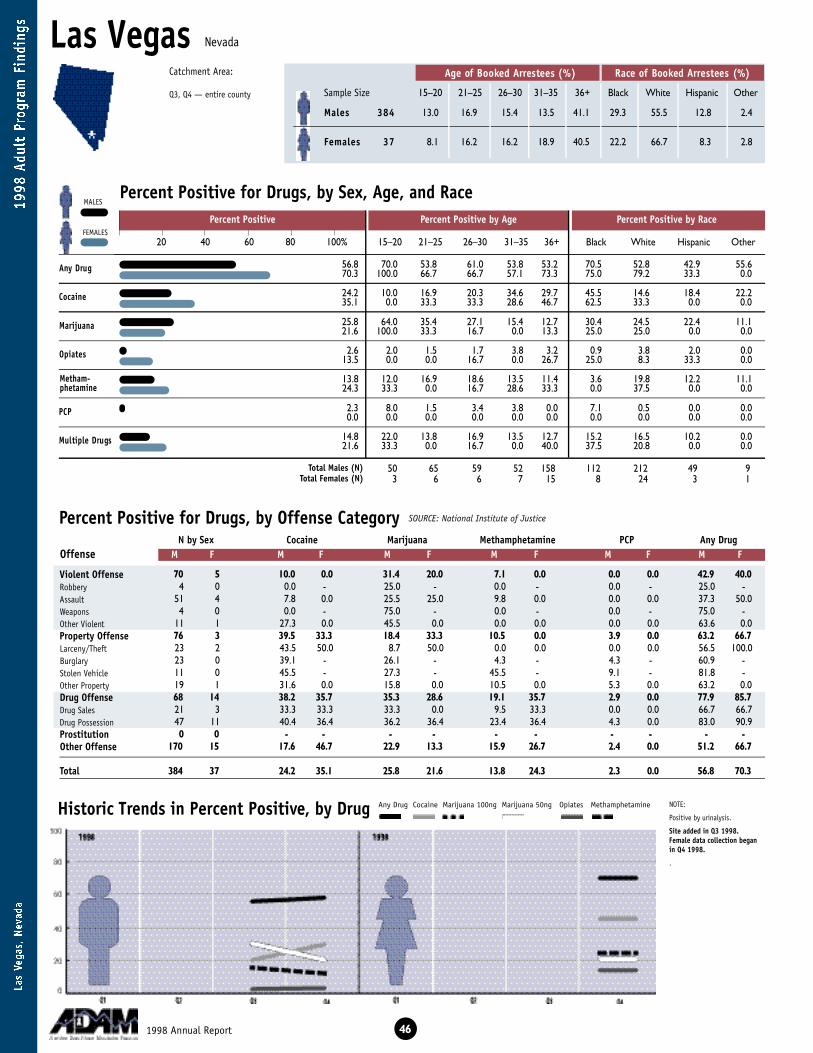
Las VegasAge of Booked Arrestees (%) Race of Booked Arrestees (%)
Sample Size 15–20 21–25 26–30 31–35 36+ Black White Hispanic Other
Percent Positive for Drugs, by Sex, Age, and Race
Percent Positive for Drugs, by Offense Category
Historic Trends in Percent Positive, by Drug
A ny Drug
C o c a i n e
M a r i j u a n a
O p i a t e s
P C P
Multiple Drugs
NOTE:
Positive by urinalysis.
Site added in Q3 1998.Female data collection beganin Q4 1998.
.
70 5 10.0 0.0 31.4 20.0 7.1 0.0 0.0 0.0 42.9 40.04 0 0.0 - 25.0 - 0.0 - 0.0 - 25.0 -
51 4 7.8 0.0 25.5 25.0 9.8 0.0 0.0 0.0 37.3 50.04 0 0.0 - 75.0 - 0.0 - 0.0 - 75.0 -
11 1 27.3 0.0 45.5 0.0 0.0 0.0 0.0 0.0 63.6 0.076 3 39.5 33.3 18.4 33.3 10.5 0.0 3.9 0.0 63.2 66.723 2 43.5 50.0 8.7 50.0 0.0 0.0 0.0 0.0 56.5 100.023 0 39.1 - 26.1 - 4.3 - 4.3 - 60.9 -11 0 45.5 - 27.3 - 45.5 - 9.1 - 81.8 -19 1 31.6 0.0 15.8 0.0 10.5 0.0 5.3 0.0 63.2 0.068 14 38.2 35.7 35.3 28.6 19.1 35.7 2.9 0.0 77.9 85.721 3 33.3 33.3 33.3 0.0 9.5 33.3 0.0 0.0 66.7 66.747 11 40.4 36.4 36.2 36.4 23.4 36.4 4.3 0.0 83.0 90.90 0 - - - - - - - - - -
170 15 17.6 46.7 22.9 13.3 15.9 26.7 2.4 0.0 51.2 66.7
384 37 24.2 35.1 25.8 21.6 13.8 24.3 2.3 0.0 56.8 70.3
N by Sex Cocaine Marijuana Methamphetamine PCP Any DrugOffense M F M F M F M F M F M F
SOURCE: National Institute of Justice
461998 Annual Report
Any Drug Cocaine Marijuana 100ng Marijuana 50ng Opiates Methamphetamine
Percent Positive Percent Positive by Age Percent Positive by Race
20 40 60 80 100% 15–20 21–25 26–30 31–35 36+ Black White Hispanic Other
50 65 59 52 158 112 212 49 93 6 6 7 15 8 24 3 1
13.0 16.9 15.4 13.5 41.1 29.3 55.5 12.8 2.4
8.1 16.2 16.2 18.9 40.5 22.2 66.7 8.3 2.8
M a l e s 3 8 4
Fe m a l e s 3 7
Total Males (N)Total Females (N)
Violent OffenseRobberyAssaultWeaponsOther ViolentProperty OffenseLarceny/TheftBurglaryStolen VehicleOther PropertyDrug OffenseDrug SalesDrug PossessionProstitutionOther Offense
Total
Nevada
MALES
FEMALES
M e t h a m -p h e t a m i n e
56.8 70.0 53.8 61.0 53.8 53.2 70.5 52.8 42.9 55.670.3 100.0 66.7 66.7 57.1 73.3 75.0 79.2 33.3 0.0
24.2 10.0 16.9 20.3 34.6 29.7 45.5 14.6 18.4 22.235.1 0.0 33.3 33.3 28.6 46.7 62.5 33.3 0.0 0.0
25.8 64.0 35.4 27.1 15.4 12.7 30.4 24.5 22.4 11.121.6 100.0 33.3 16.7 0.0 13.3 25.0 25.0 0.0 0.0
2.6 2.0 1.5 1.7 3.8 3.2 0.9 3.8 2.0 0.013.5 0.0 0.0 16.7 0.0 26.7 25.0 8.3 33.3 0.0
13.8 12.0 16.9 18.6 13.5 11.4 3.6 19.8 12.2 11.124.3 33.3 0.0 16.7 28.6 33.3 0.0 37.5 0.0 0.0
2.3 8.0 1.5 3.4 3.8 0.0 7.1 0.5 0.0 0.00.0 0.0 0.0 0.0 0.0 0.0 0.0 0.0 0.0 0.0
14.8 22.0 13.8 16.9 13.5 12.7 15.2 16.5 10.2 0.021.6 33.3 0.0 16.7 0.0 40.0 37.5 20.8 0.0 0.0
Catchment Area:
Q3, Q4 — entire county

C ra c k
C o c a i n e
M a r i j u a n a
O p i a t e s
M e t h a m p h e t a m i n e
Cocaine
M a r i j u a n a
Opiates
Description of the Sample
Self-Reported Drug Information
C ra c k
C o c a i n e
C rack & Cocaine
Marijuana & Cocaine
Opiates & Cocaine
A ny 2 or More Drugs
47
0 20 40 60 80 100% 15–20 21–25 26–30 31–35 36+
14.7 0.0 6.3 8.5 23.1 22.432.4 0.0 33.3 33.3 28.6 40.0
8.4 12.0 12.3 1.7 7.8 8.318.9 66.7 0.0 16.7 0.0 26.7
2.9 0.0 3.1 0.0 5.8 3.910.8 0.0 0.0 16.7 0.0 20.0
5.7 12.0 9.2 1.7 5.8 3.813.5 66.7 0.0 16.7 0.0 13.3
1.6 0.0 0.0 0.0 1.9 3.25.4 0.0 0.0 0.0 0.0 13.3
27.6 34.0 28.6 27.1 33.3 23.440.5 66.7 50.0 50.0 0.0 46.7
Highest Grade Completed
6th Grade or Less7th to 9th Grade10th to 12th GradeAbove 12th Grade
2.2 8.82.2 8.8
65.4 64.730.2 17.6
2.1 0.086.5 86.50.8 0.01.3 0.00.3 0.07.3 5.41.8 8.1
Males FemalesType of Place in Prior 30 Days
Public HousingPrivate House or ApartmentShelterIncarceration FacilityTreatment FacilityNo Fixed ResidenceOther
Males Females
4.5 13.571.5 40.512.1 13.511.9 32.4
Primary Sourcein Prior 30 Days
Welfare, Social SecurityFull or Part-Time EmploymentOther Legal Illegal or None
Males Females
Current Primary Source of Income of Booked Arrestees (%)
Current Housing Arrangement of Booked Arrestees (%)
Education of Booked Arrestees (%)
Males FemalesN Mean Age N Mean Age Males Females Males Females
Percent Reporting Drug Use in the Past 30 Days, by Age and SexPercent Reporting Use Percent Reporting Use by Age
Age at First Use (for those admitting use) Received Prior Treatment ( % ) Ever Injected Drugs Illegally ( % )
MALES
FEMALES
0 5 10 15 20 25 30 N
Mean Number of Days Used in the Past 30 Days(for those admitting use in the past 30 days)
14.017.6
7.99.7
10.79.6
13.219.7
11.317.7
5612
327
14416
123
6312
2.03.6
1.00.8
0.20.8
8913
998
105
1998 Annual Report
372 14.2129 26.1164 20.0318 15.360 22.5
137 21.970 17.8
34 15.518 25.218 19.232 15.37 22.9
18 22.28 19.0
AlcoholCrackCocaineMarijuanaOpiatesMethamphetaminePCP
16.7 13.57.6 5.43.9 13.56.0 10.82.1 2.75.8 10.8
AlcoholCrackCocaineMarijuanaOpiatesMethamphetamine
9.4 10.88.6 13.58.9 10.8
CocaineHeroinAmphetamine/Methamphetamine
MALES
FEMALES
0 1 2 3 4 5 6 N
Mean Number of Times Reported Arrested in thePast 12 Months (excludes current offense; for thosetesting positive)
MALES
FEMALES
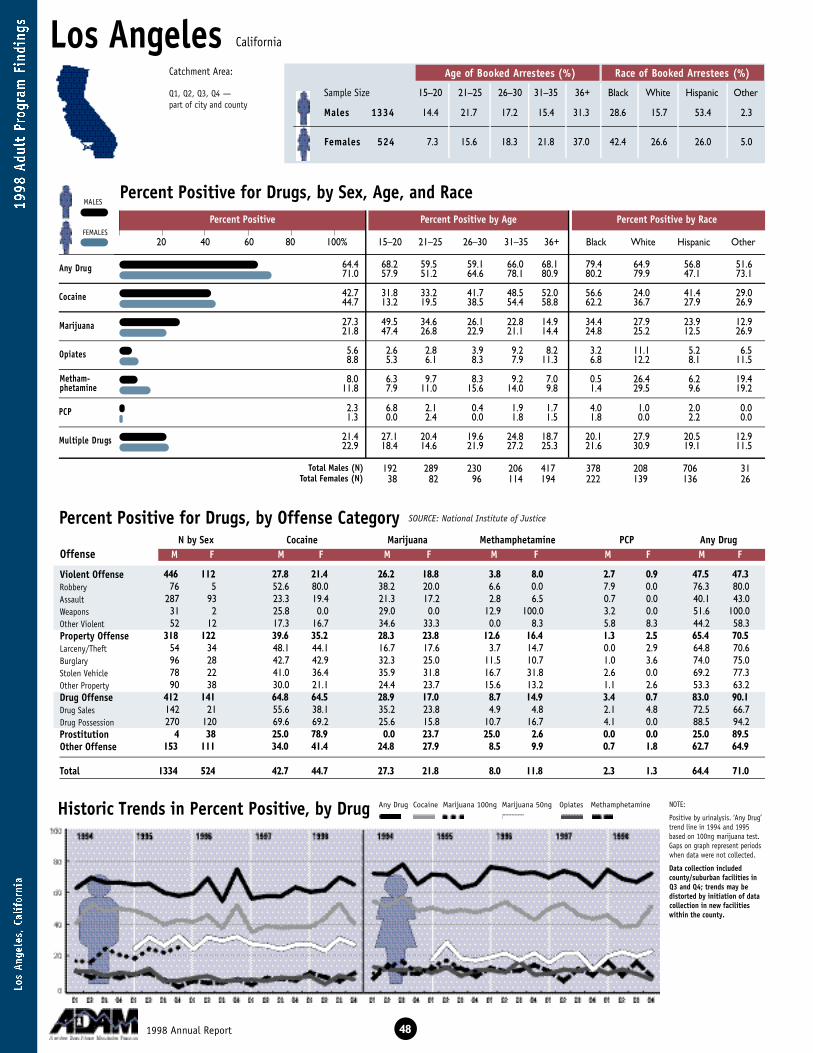
Los AngelesAge of Booked Arrestees (%) Race of Booked Arrestees (%)
Sample Size 15–20 21–25 26–30 31–35 36+ Black White Hispanic Other
Percent Positive for Drugs, by Sex, Age, and Race
Percent Positive for Drugs, by Offense Category
Historic Trends in Percent Positive, by Drug
A ny Drug
C o c a i n e
M a r i j u a n a
O p i a t e s
P C P
Multiple Drugs
NOTE:
Positive by urinalysis. ‘Any Drug’trend line in 1994 and 1995based on 100ng marijuana test.Gaps on graph represent periodswhen data were not collected.
Data collection included county/suburban facilities inQ3 and Q4; trends may be distorted by initiation of datacollection in new facilitieswithin the county.
446 112 27.8 21.4 26.2 18.8 3.8 8.0 2.7 0.9 47.5 47.376 5 52.6 80.0 38.2 20.0 6.6 0.0 7.9 0.0 76.3 80.0
287 93 23.3 19.4 21.3 17.2 2.8 6.5 0.7 0.0 40.1 43.031 2 25.8 0.0 29.0 0.0 12.9 100.0 3.2 0.0 51.6 100.052 12 17.3 16.7 34.6 33.3 0.0 8.3 5.8 8.3 44.2 58.3
318 122 39.6 35.2 28.3 23.8 12.6 16.4 1.3 2.5 65.4 70.554 34 48.1 44.1 16.7 17.6 3.7 14.7 0.0 2.9 64.8 70.696 28 42.7 42.9 32.3 25.0 11.5 10.7 1.0 3.6 74.0 75.078 22 41.0 36.4 35.9 31.8 16.7 31.8 2.6 0.0 69.2 77.390 38 30.0 21.1 24.4 23.7 15.6 13.2 1.1 2.6 53.3 63.2
412 141 64.8 64.5 28.9 17.0 8.7 14.9 3.4 0.7 83.0 90.1142 21 55.6 38.1 35.2 23.8 4.9 4.8 2.1 4.8 72.5 66.7270 120 69.6 69.2 25.6 15.8 10.7 16.7 4.1 0.0 88.5 94.2
4 38 25.0 78.9 0.0 23.7 25.0 2.6 0.0 0.0 25.0 89.5153 111 34.0 41.4 24.8 27.9 8.5 9.9 0.7 1.8 62.7 64.9
1334 524 42.7 44.7 27.3 21.8 8.0 11.8 2.3 1.3 64.4 71.0
N by Sex Cocaine Marijuana Methamphetamine PCP Any DrugOffense M F M F M F M F M F M F
SOURCE: National Institute of Justice
481998 Annual Report
Any Drug Cocaine Marijuana 100ng Marijuana 50ng Opiates Methamphetamine
Percent Positive Percent Positive by Age Percent Positive by Race
20 40 60 80 100% 15–20 21–25 26–30 31–35 36+ Black White Hispanic Other
192 289 230 206 417 378 208 706 3138 82 96 114 194 222 139 136 26
14.4 21.7 17.2 15.4 31.3 28.6 15.7 53.4 2.3
7.3 15.6 18.3 21.8 37.0 42.4 26.6 26.0 5.0
M a l e s 1 3 3 4
Fe m a l e s 5 2 4
Total Males (N)Total Females (N)
Violent OffenseRobberyAssaultWeaponsOther ViolentProperty OffenseLarceny/TheftBurglaryStolen VehicleOther PropertyDrug OffenseDrug SalesDrug PossessionProstitutionOther Offense
Total
California
MALES
FEMALES
M e t h a m -p h e t a m i n e
64.4 68.2 59.5 59.1 66.0 68.1 79.4 64.9 56.8 51.671.0 57.9 51.2 64.6 78.1 80.9 80.2 79.9 47.1 73.1
42.7 31.8 33.2 41.7 48.5 52.0 56.6 24.0 41.4 29.044.7 13.2 19.5 38.5 54.4 58.8 62.2 36.7 27.9 26.9
27.3 49.5 34.6 26.1 22.8 14.9 34.4 27.9 23.9 12.921.8 47.4 26.8 22.9 21.1 14.4 24.8 25.2 12.5 26.9
5.6 2.6 2.8 3.9 9.2 8.2 3.2 11.1 5.2 6.58.8 5.3 6.1 8.3 7.9 11.3 6.8 12.2 8.1 11.5
8.0 6.3 9.7 8.3 9.2 7.0 0.5 26.4 6.2 19.411.8 7.9 11.0 15.6 14.0 9.8 1.4 29.5 9.6 19.2
2.3 6.8 2.1 0.4 1.9 1.7 4.0 1.0 2.0 0.01.3 0.0 2.4 0.0 1.8 1.5 1.8 0.0 2.2 0.0
21.4 27.1 20.4 19.6 24.8 18.7 20.1 27.9 20.5 12.922.9 18.4 14.6 21.9 27.2 25.3 21.6 30.9 19.1 11.5
Catchment Area:
Q1, Q2, Q3, Q4 — part of city and county
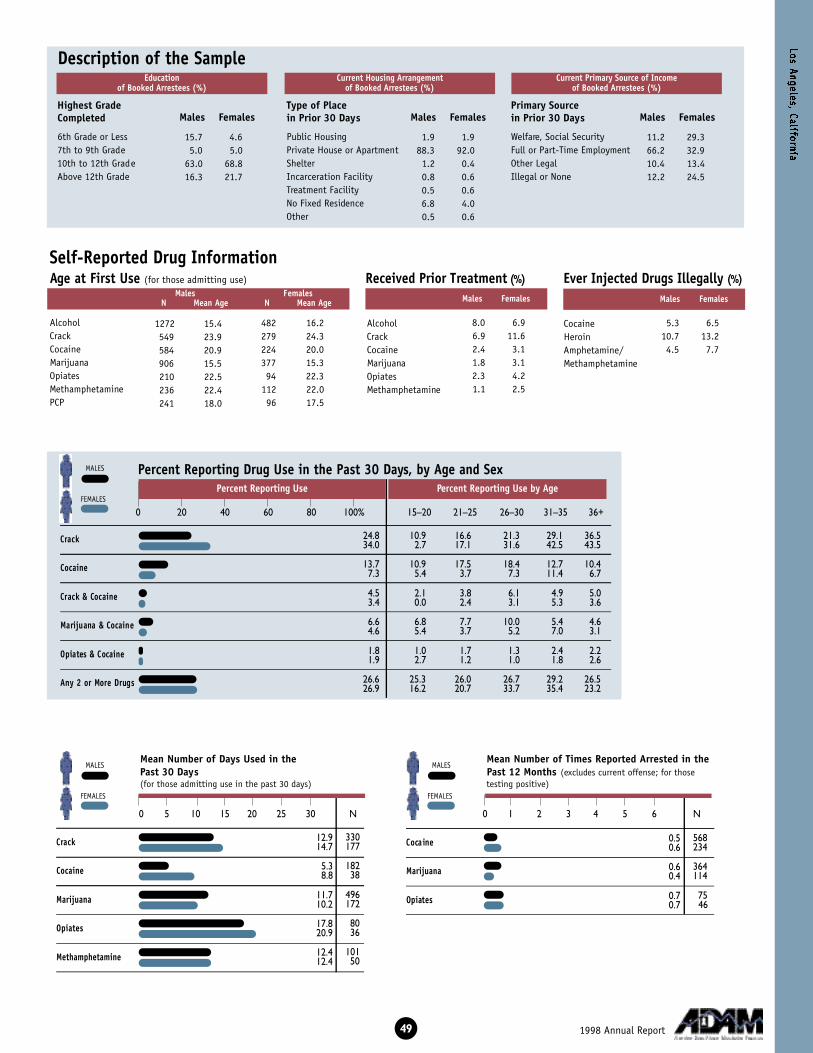
Cocaine
M a r i j u a n a
Opiates
Description of the Sample
Self-Reported Drug Information
C ra c k
C o c a i n e
C rack & Cocaine
Marijuana & Cocaine
Opiates & Cocaine
A ny 2 or More Drugs
49
0 20 40 60 80 100% 15–20 21–25 26–30 31–35 36+
24.8 10.9 16.6 21.3 29.1 36.534.0 2.7 17.1 31.6 42.5 43.5
13.7 10.9 17.5 18.4 12.7 10.47.3 5.4 3.7 7.3 11.4 6.7
4.5 2.1 3.8 6.1 4.9 5.03.4 0.0 2.4 3.1 5.3 3.6
6.6 6.8 7.7 10.0 5.4 4.64.6 5.4 3.7 5.2 7.0 3.1
1.8 1.0 1.7 1.3 2.4 2.21.9 2.7 1.2 1.0 1.8 2.6
26.6 25.3 26.0 26.7 29.2 26.526.9 16.2 20.7 33.7 35.4 23.2
Highest Grade Completed
6th Grade or Less7th to 9th Grade10th to 12th GradeAbove 12th Grade
15.7 4.65.0 5.0
63.0 68.816.3 21.7
1.9 1.988.3 92.01.2 0.40.8 0.60.5 0.66.8 4.00.5 0.6
Males FemalesType of Place in Prior 30 Days
Public HousingPrivate House or ApartmentShelterIncarceration FacilityTreatment FacilityNo Fixed ResidenceOther
Males Females
11.2 29.366.2 32.910.4 13.412.2 24.5
Primary Sourcein Prior 30 Days
Welfare, Social SecurityFull or Part-Time EmploymentOther Legal Illegal or None
Males Females
Current Primary Source of Income of Booked Arrestees (%)
Current Housing Arrangement of Booked Arrestees (%)
Education of Booked Arrestees (%)
Males FemalesN Mean Age N Mean Age Males Females Males Females
Percent Reporting Drug Use in the Past 30 Days, by Age and SexPercent Reporting Use Percent Reporting Use by Age
Age at First Use (for those admitting use) Received Prior Treatment ( % ) Ever Injected Drugs Illegally ( % )
MALES
FEMALES
C ra c k
C o c a i n e
M a r i j u a n a
O p i a t e s
M e t h a m p h e t a m i n e
0 5 10 15 20 25 30 N
Mean Number of Days Used in the Past 30 Days(for those admitting use in the past 30 days)
12.914.7
5.38.8
11.710.2
17.820.9
12.412.4
330177
18238
496172
8036
10150
0.50.6
0.60.4
0.70.7
568234
364114
7546
1998 Annual Report
1272 15.4549 23.9584 20.9906 15.5210 22.5236 22.4241 18.0
482 16.2279 24.3224 20.0377 15.394 22.3
112 22.096 17.5
AlcoholCrackCocaineMarijuanaOpiatesMethamphetaminePCP
8.0 6.96.9 11.62.4 3.11.8 3.12.3 4.21.1 2.5
AlcoholCrackCocaineMarijuanaOpiatesMethamphetamine
5.3 6.510.7 13.24.5 7.7
CocaineHeroinAmphetamine/Methamphetamine
MALES
FEMALES
0 1 2 3 4 5 6 N
Mean Number of Times Reported Arrested in thePast 12 Months (excludes current offense; for thosetesting positive)
MALES
FEMALES
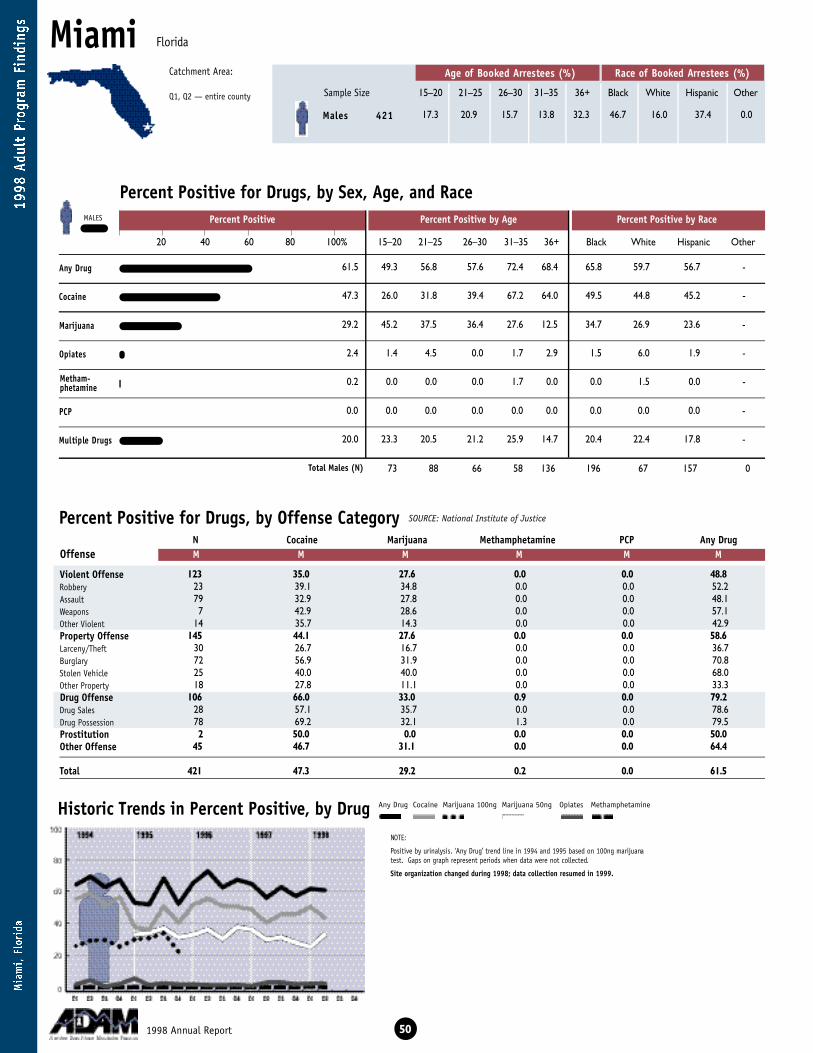
Catchment Area:
Q1, Q2 — entire county
Percent Positive Percent Positive by Age Percent Positive by Race
20 40 60 80 100% 15–20 21–25 26–30 31–35 36+ Black White Hispanic Other
MiamiAge of Booked Arrestees (%) Race of Booked Arrestees (%)
Sample Size 15–20 21–25 26–30 31–35 36+ Black White Hispanic Other
Percent Positive for Drugs, by Sex, Age, and Race
Percent Positive for Drugs, by Offense Category
Historic Trends in Percent Positive, by Drug
A ny Drug
C o c a i n e
M a r i j u a n a
O p i a t e s
P C P
Multiple Drugs
NOTE:
Positive by urinalysis. ‘Any Drug’ trend line in 1994 and 1995 based on 100ng marijuanatest. Gaps on graph represent periods when data were not collected.
Site organization changed during 1998; data collection resumed in 1999.
123 35.0 27.6 0.0 0.0 48.823 39.1 34.8 0.0 0.0 52.279 32.9 27.8 0.0 0.0 48.17 42.9 28.6 0.0 0.0 57.1
14 35.7 14.3 0.0 0.0 42.9145 44.1 27.6 0.0 0.0 58.6
30 26.7 16.7 0.0 0.0 36.772 56.9 31.9 0.0 0.0 70.825 40.0 40.0 0.0 0.0 68.018 27.8 11.1 0.0 0.0 33.3
106 66.0 33.0 0.9 0.0 79.228 57.1 35.7 0.0 0.0 78.678 69.2 32.1 1.3 0.0 79.52 50.0 0.0 0.0 0.0 50.0
45 46.7 31.1 0.0 0.0 64.4
421 47.3 29.2 0.2 0.0 61.5
N Cocaine Marijuana Methamphetamine PCP Any DrugOffense M M M M M M
SOURCE: National Institute of Justice
501998 Annual Report
Any Drug Cocaine Marijuana 100ng Marijuana 50ng Opiates Methamphetamine
73 88 66 58 136 196 67 157 0
17.3 20.9 15.7 13.8 32.3 46.7 16.0 37.4 0.0M a l e s 4 2 1
Total Males (N)
Violent OffenseRobberyAssaultWeaponsOther ViolentProperty OffenseLarceny/TheftBurglaryStolen VehicleOther PropertyDrug OffenseDrug SalesDrug PossessionProstitutionOther Offense
Total
Florida
MALES
M e t h a m -p h e t a m i n e
61.5 49.3 56.8 57.6 72.4 68.4 65.8 59.7 56.7 -
47.3 26.0 31.8 39.4 67.2 64.0 49.5 44.8 45.2 -
29.2 45.2 37.5 36.4 27.6 12.5 34.7 26.9 23.6 -
2.4 1.4 4.5 0.0 1.7 2.9 1.5 6.0 1.9 -
0.2 0.0 0.0 0.0 1.7 0.0 0.0 1.5 0.0 -
0.0 0.0 0.0 0.0 0.0 0.0 0.0 0.0 0.0 -
20.0 23.3 20.5 21.2 25.9 14.7 20.4 22.4 17.8 -

Cocaine
M a r i j u a n a
Opiates
Description of the Sample
Self-Reported Drug Information
C ra c k
C o c a i n e
C rack & Cocaine
Marijuana & Cocaine
Opiates & Cocaine
A ny 2 or More Drugs
51
0 20 40 60 80 100% 15–20 21–25 26–30 31–35 36+
18.6 2.8 10.2 15.2 24.1 31.6
17.4 8.2 20.5 18.2 27.6 15.7
7.9 2.7 9.1 7.6 12.1 8.2
11.5 6.8 14.8 15.2 19.0 6.7
1.4 0.0 2.3 3.0 0.0 1.5
18.3 8.2 18.2 21.5 24.1 19.9
Highest Grade Completed
6th Grade or Less7th to 9th Grade10th to 12th GradeAbove 12th Grade
8.8 -5.9 -
67.7 -17.6 -
1.7 -90.7 -0.2 -0.5 -0.2 -5.9 -0.7 -
Males FemalesType of Place in Prior 30 Days
Public HousingPrivate House or ApartmentShelterIncarceration FacilityTreatment FacilityNo Fixed ResidenceOther
Males Females
2.4 -73.3 -8.3 -
16.0 -
Primary Sourcein Prior 30 Days
Welfare, Social SecurityFull or Part-Time EmploymentOther Legal Illegal or None
Males Females
Current Primary Source of Income of Booked Arrestees (%)
Current Housing Arrangement of Booked Arrestees (%)
Education of Booked Arrestees (%)
Males FemalesN Mean Age N Mean Age Males Females Males Females
Percent Reporting Drug Use in the Past 30 Days, by Age and SexPercent Reporting Use Percent Reporting Use by Age
Age at First Use (for those admitting use) Received Prior Treatment ( % ) Ever Injected Drugs Illegally ( % )
MALES
C ra c k
C o c a i n e
M a r i j u a n a
O p i a t e s
M e t h a m p h e t a m i n e
0 5 10 15 20 25 30 N
Mean Number of Days Used in the Past 30 Days(for those admitting use in the past 30 days)
18.9
13.1
14.9
14.4
8.0
78
73
141
8
1
0.8
0.7
0.4
199
122
10
1998 Annual Report
381 15.7110 26.8160 21.2269 16.129 23.320 21.414 20.1
- -- -- -- -- -- -- -
AlcoholCrackCocaineMarijuanaOpiatesMethamphetaminePCP
11.2 -10.2 -8.1 -7.2 -2.1 -1.2 -
AlcoholCrackCocaineMarijuanaOpiatesMethamphetamine
3.6 -3.6 -1.7 -
CocaineHeroinAmphetamine/Methamphetamine
MALES
0 1 2 3 4 5 6 N
Mean Number of Times Reported Arrested in thePast 12 Months (excludes current offense; for thosetesting positive)MALES
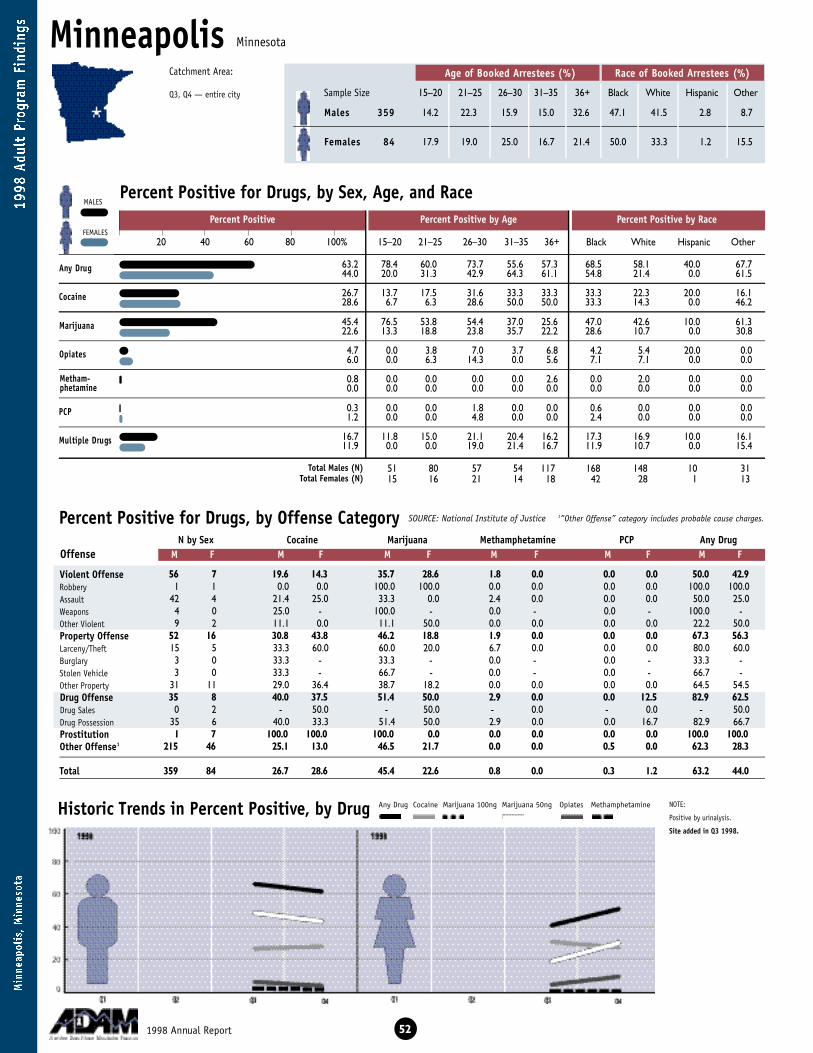
MinneapolisAge of Booked Arrestees (%) Race of Booked Arrestees (%)
Sample Size 15–20 21–25 26–30 31–35 36+ Black White Hispanic Other
Percent Positive for Drugs, by Sex, Age, and Race
Percent Positive for Drugs, by Offense Category
Historic Trends in Percent Positive, by Drug
A ny Drug
C o c a i n e
M a r i j u a n a
O p i a t e s
P C P
Multiple Drugs
NOTE:
Positive by urinalysis.
Site added in Q3 1998.
56 7 19.6 14.3 35.7 28.6 1.8 0.0 0.0 0.0 50.0 42.91 1 0.0 0.0 100.0 100.0 0.0 0.0 0.0 0.0 100.0 100.0
42 4 21.4 25.0 33.3 0.0 2.4 0.0 0.0 0.0 50.0 25.04 0 25.0 - 100.0 - 0.0 - 0.0 - 100.0 -9 2 11.1 0.0 11.1 50.0 0.0 0.0 0.0 0.0 22.2 50.0
52 16 30.8 43.8 46.2 18.8 1.9 0.0 0.0 0.0 67.3 56.315 5 33.3 60.0 60.0 20.0 6.7 0.0 0.0 0.0 80.0 60.03 0 33.3 - 33.3 - 0.0 - 0.0 - 33.3 -3 0 33.3 - 66.7 - 0.0 - 0.0 - 66.7 -
31 11 29.0 36.4 38.7 18.2 0.0 0.0 0.0 0.0 64.5 54.535 8 40.0 37.5 51.4 50.0 2.9 0.0 0.0 12.5 82.9 62.5
0 2 - 50.0 - 50.0 - 0.0 - 0.0 - 50.035 6 40.0 33.3 51.4 50.0 2.9 0.0 0.0 16.7 82.9 66.71 7 100.0 100.0 100.0 0.0 0.0 0.0 0.0 0.0 100.0 100.0
215 46 25.1 13.0 46.5 21.7 0.0 0.0 0.5 0.0 62.3 28.3
359 84 26.7 28.6 45.4 22.6 0.8 0.0 0.3 1.2 63.2 44.0
N by Sex Cocaine Marijuana Methamphetamine PCP Any DrugOffense M F M F M F M F M F M F
SOURCE: National Institute of Justice 1”Other Offense” category includes probable cause charges.
521998 Annual Report
Any Drug Cocaine Marijuana 100ng Marijuana 50ng Opiates Methamphetamine
Percent Positive Percent Positive by Age Percent Positive by Race
20 40 60 80 100% 15–20 21–25 26–30 31–35 36+ Black White Hispanic Other
51 80 57 54 117 168 148 10 3115 16 21 14 18 42 28 1 13
14.2 22.3 15.9 15.0 32.6 47.1 41.5 2.8 8.7
17.9 19.0 25.0 16.7 21.4 50.0 33.3 1.2 15.5
M a l e s 3 5 9
Fe m a l e s 8 4
Total Males (N)Total Females (N)
Violent OffenseRobberyAssaultWeaponsOther ViolentProperty OffenseLarceny/TheftBurglaryStolen VehicleOther PropertyDrug OffenseDrug SalesDrug PossessionProstitutionOther Offense1
Total
Minnesota
MALES
FEMALES
M e t h a m -p h e t a m i n e
63.2 78.4 60.0 73.7 55.6 57.3 68.5 58.1 40.0 67.744.0 20.0 31.3 42.9 64.3 61.1 54.8 21.4 0.0 61.5
26.7 13.7 17.5 31.6 33.3 33.3 33.3 22.3 20.0 16.128.6 6.7 6.3 28.6 50.0 50.0 33.3 14.3 0.0 46.2
45.4 76.5 53.8 54.4 37.0 25.6 47.0 42.6 10.0 61.322.6 13.3 18.8 23.8 35.7 22.2 28.6 10.7 0.0 30.8
4.7 0.0 3.8 7.0 3.7 6.8 4.2 5.4 20.0 0.06.0 0.0 6.3 14.3 0.0 5.6 7.1 7.1 0.0 0.0
0.8 0.0 0.0 0.0 0.0 2.6 0.0 2.0 0.0 0.00.0 0.0 0.0 0.0 0.0 0.0 0.0 0.0 0.0 0.0
0.3 0.0 0.0 1.8 0.0 0.0 0.6 0.0 0.0 0.01.2 0.0 0.0 4.8 0.0 0.0 2.4 0.0 0.0 0.0
16.7 11.8 15.0 21.1 20.4 16.2 17.3 16.9 10.0 16.111.9 0.0 0.0 19.0 21.4 16.7 11.9 10.7 0.0 15.4
Catchment Area:
Q3, Q4 — entire city
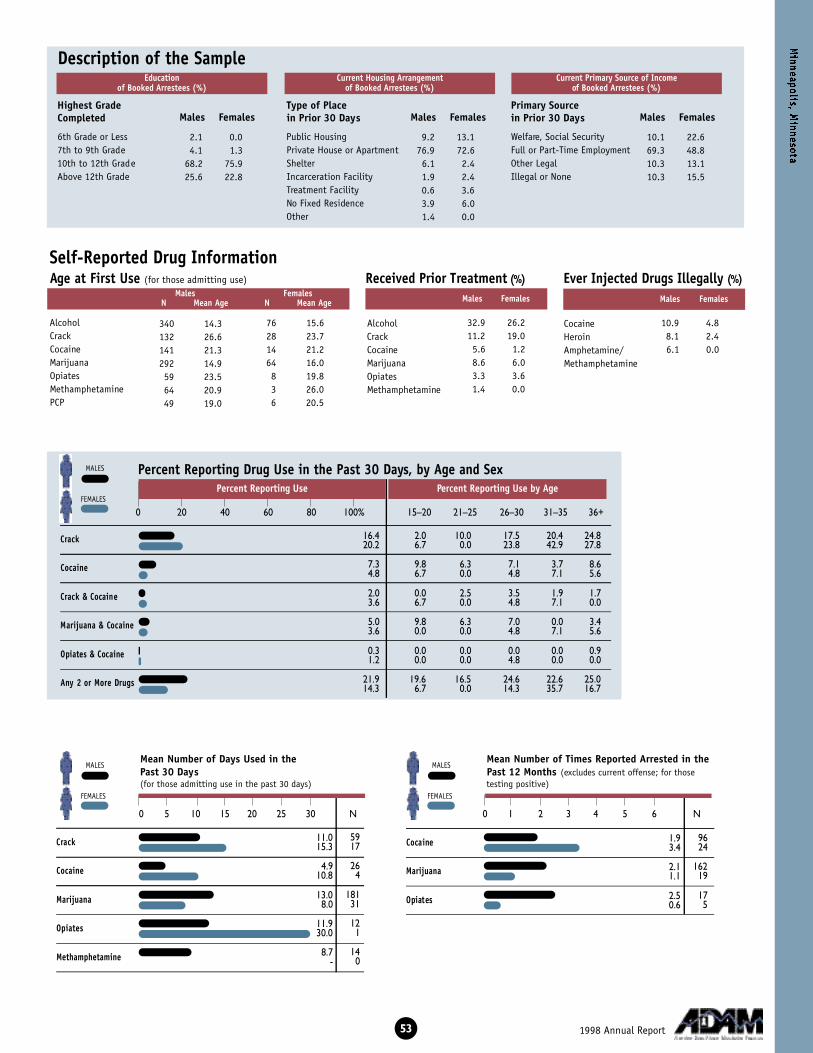
C ra c k
C o c a i n e
C rack & Cocaine
Marijuana & Cocaine
Opiates & Cocaine
A ny 2 or More Drugs
Cocaine
M a r i j u a n a
Opiates
Description of the Sample
Self-Reported Drug Information
53
0 20 40 60 80 100% 15–20 21–25 26–30 31–35 36+
16.4 2.0 10.0 17.5 20.4 24.820.2 6.7 0.0 23.8 42.9 27.8
7.3 9.8 6.3 7.1 3.7 8.64.8 6.7 0.0 4.8 7.1 5.6
2.0 0.0 2.5 3.5 1.9 1.73.6 6.7 0.0 4.8 7.1 0.0
5.0 9.8 6.3 7.0 0.0 3.43.6 0.0 0.0 4.8 7.1 5.6
0.3 0.0 0.0 0.0 0.0 0.91.2 0.0 0.0 4.8 0.0 0.0
21.9 19.6 16.5 24.6 22.6 25.014.3 6.7 0.0 14.3 35.7 16.7
Highest Grade Completed
6th Grade or Less7th to 9th Grade10th to 12th GradeAbove 12th Grade
2.1 0.04.1 1.3
68.2 75.925.6 22.8
9.2 13.176.9 72.66.1 2.41.9 2.40.6 3.63.9 6.01.4 0.0
Males FemalesType of Place in Prior 30 Days
Public HousingPrivate House or ApartmentShelterIncarceration FacilityTreatment FacilityNo Fixed ResidenceOther
Males Females
10.1 22.669.3 48.810.3 13.110.3 15.5
Primary Sourcein Prior 30 Days
Welfare, Social SecurityFull or Part-Time EmploymentOther Legal Illegal or None
Males Females
Current Primary Source of Income of Booked Arrestees (%)
Current Housing Arrangement of Booked Arrestees (%)
Education of Booked Arrestees (%)
Males FemalesN Mean Age N Mean Age Males Females Males Females
Percent Reporting Drug Use in the Past 30 Days, by Age and SexPercent Reporting Use Percent Reporting Use by Age
Age at First Use (for those admitting use) Received Prior Treatment ( % ) Ever Injected Drugs Illegally ( % )
MALES
FEMALES
C ra c k
C o c a i n e
M a r i j u a n a
O p i a t e s
M e t h a m p h e t a m i n e
0 5 10 15 20 25 30 N
Mean Number of Days Used in the Past 30 Days(for those admitting use in the past 30 days)
11.015.3
4.910.8
13.08.0
11.930.0
8.7-
5917
264
18131
121
140
1.93.4
2.11.1
2.50.6
9624
16219
175
1998 Annual Report
340 14.3132 26.6141 21.3292 14.959 23.564 20.949 19.0
76 15.628 23.714 21.264 16.08 19.83 26.06 20.5
AlcoholCrackCocaineMarijuanaOpiatesMethamphetaminePCP
32.9 26.211.2 19.05.6 1.28.6 6.03.3 3.61.4 0.0
AlcoholCrackCocaineMarijuanaOpiatesMethamphetamine
10.9 4.88.1 2.46.1 0.0
CocaineHeroinAmphetamine/Methamphetamine
MALES
FEMALES
0 1 2 3 4 5 6 N
Mean Number of Times Reported Arrested in thePast 12 Months (excludes current offense; for thosetesting positive)
MALES
FEMALES

New OrleansAge of Booked Arrestees (%) Race of Booked Arrestees (%)
Sample Size 15–20 21–25 26–30 31–35 36+ Black White Hispanic Other
Percent Positive for Drugs, by Sex, Age, and Race
Percent Positive for Drugs, by Offense Category
Historic Trends in Percent Positive, by Drug
A ny Drug
C o c a i n e
M a r i j u a n a
O p i a t e s
P C P
Multiple Drugs
NOTE:
Positive by urinalysis. ‘Any Drug’trend line in 1994 and 1995based on 100ng marijuana test.
256 81 37.9 18.5 39.5 19.8 0.0 0.0 0.0 0.0 64.5 32.147 1 46.8 0.0 44.7 0.0 0.0 0.0 0.0 0.0 76.6 0.0
150 76 37.3 19.7 38.7 18.4 0.0 0.0 0.0 0.0 63.3 31.636 1 36.1 0.0 47.2 100.0 0.0 0.0 0.0 0.0 66.7 100.023 3 26.1 0.0 21.7 33.3 0.0 0.0 0.0 0.0 43.5 33.3
304 126 50.3 38.1 36.5 15.1 0.3 0.0 0.0 0.0 68.1 46.089 65 62.9 27.7 42.7 13.8 1.1 0.0 0.0 0.0 77.5 38.559 11 44.1 54.5 28.8 27.3 0.0 0.0 0.0 0.0 61.0 63.651 7 45.1 42.9 41.2 28.6 0.0 0.0 0.0 0.0 70.6 42.9
105 43 45.7 48.8 33.3 11.6 0.0 0.0 0.0 0.0 62.9 53.5126 46 60.3 58.7 51.6 32.6 0.8 0.0 0.0 0.0 81.7 69.6
25 9 64.0 44.4 48.0 22.2 4.0 0.0 0.0 0.0 84.0 44.4101 37 59.4 62.2 52.5 35.1 0.0 0.0 0.0 0.0 81.2 75.7
7 14 14.3 57.1 42.9 21.4 0.0 0.0 0.0 0.0 42.9 64.3284 113 43.0 43.4 33.1 27.4 0.0 0.9 0.4 0.0 63.4 59.3
977 380 46.0 38.7 38.3 22.1 0.2 0.3 0.1 0.0 67.3 50.5
N by Sex Cocaine Marijuana Methamphetamine PCP Any DrugOffense M F M F M F M F M F M F
SOURCE: National Institute of Justice
541998 Annual Report
Any Drug Cocaine Marijuana 100ng Marijuana 50ng Opiates Methamphetamine
Percent Positive Percent Positive by Age Percent Positive by Race
20 40 60 80 100% 15–20 21–25 26–30 31–35 36+ Black White Hispanic Other
203 202 149 132 290 832 120 5 948 65 71 79 117 320 53 4 1
20.8 20.7 15.3 13.5 29.7 86.1 12.4 0.5 0.9
12.6 17.1 18.7 20.8 30.8 84.7 14.0 1.1 0.3
M a l e s 9 7 7
Fe m a l e s 3 8 0
Total Males (N)Total Females (N)
Violent OffenseRobberyAssaultWeaponsOther ViolentProperty OffenseLarceny/TheftBurglaryStolen VehicleOther PropertyDrug OffenseDrug SalesDrug PossessionProstitutionOther Offense
Total
Louisiana
MALES
FEMALES
M e t h a m -p h e t a m i n e
67.3 74.4 65.3 63.8 66.7 66.2 67.8 70.0 60.0 22.250.5 47.9 33.8 46.5 58.2 58.1 49.4 62.3 0.0 0.0
46.0 38.9 31.7 47.0 55.3 56.2 47.4 40.8 40.0 22.238.7 27.1 10.8 35.2 54.4 50.4 37.5 50.9 0.0 0.0
38.3 61.6 45.5 36.9 26.5 23.1 38.1 43.3 20.0 0.022.1 35.4 20.0 28.2 17.7 17.1 21.6 26.4 0.0 0.0
12.9 21.2 20.3 9.4 7.6 6.2 13.9 6.7 20.0 0.03.4 4.2 4.6 1.4 1.3 5.1 2.8 7.5 0.0 0.0
0.2 1.0 0.0 0.0 0.0 0.0 0.0 1.7 0.0 0.00.3 0.0 0.0 1.4 0.0 0.0 0.3 0.0 0.0 0.0
0.1 0.0 0.0 0.0 0.0 0.3 0.1 0.0 0.0 0.00.0 0.0 0.0 0.0 0.0 0.0 0.0 0.0 0.0 0.0
27.8 38.9 29.2 24.8 24.2 22.4 27.9 30.8 20.0 0.015.8 18.8 6.2 18.3 19.0 16.2 13.8 30.2 0.0 0.0
Catchment Area:
Q1, Q2, Q3, Q4 —entire parish

Cocaine
M a r i j u a n a
Opiates
Description of the Sample
Self-Reported Drug Information
C ra c k
C o c a i n e
C rack & Cocaine
Marijuana & Cocaine
Opiates & Cocaine
A ny 2 or More Drugs
55
0 20 40 60 80 100% 15–20 21–25 26–30 31–35 36+
21.9 4.0 7.9 30.2 33.3 35.031.7 10.4 9.4 25.4 46.8 46.6
13.4 16.9 16.4 17.8 5.4 10.16.9 8.3 6.3 4.2 7.6 7.7
4.7 1.5 3.5 10.2 3.8 5.65.3 4.2 4.7 2.8 6.3 6.8
10.0 15.9 12.9 13.0 2.3 5.95.5 6.3 6.2 2.8 7.6 5.1
6.5 11.9 10.0 6.0 1.5 2.82.6 4.2 4.8 1.4 1.3 2.6
26.4 29.6 25.5 32.2 22.7 23.720.2 10.4 9.4 15.5 30.8 26.1
Highest Grade Completed
6th Grade or Less7th to 9th Grade10th to 12th GradeAbove 12th Grade
2.3 1.89.5 5.1
75.4 76.812.8 16.3
13.0 19.783.1 77.40.9 0.80.9 0.00.1 0.81.5 1.10.4 0.3
Males FemalesType of Place in Prior 30 Days
Public HousingPrivate House or ApartmentShelterIncarceration FacilityTreatment FacilityNo Fixed ResidenceOther
Males Females
7.9 25.671.7 44.710.5 17.39.9 12.4
Primary Sourcein Prior 30 Days
Welfare, Social SecurityFull or Part-Time EmploymentOther Legal Illegal or None
Males Females
Current Primary Source of Income of Booked Arrestees (%)
Current Housing Arrangement of Booked Arrestees (%)
Education of Booked Arrestees (%)
Males FemalesN Mean Age N Mean Age Males Females Males Females
Percent Reporting Drug Use in the Past 30 Days, by Age and SexPercent Reporting Use Percent Reporting Use by Age
Age at First Use (for those admitting use) Received Prior Treatment ( % ) Ever Injected Drugs Illegally ( % )
MALES
FEMALES
C ra c k
C o c a i n e
M a r i j u a n a
O p i a t e s
M e t h a m p h e t a m i n e
0 5 10 15 20 25 30 N
Mean Number of Days Used in the Past 30 Days(for those admitting use in the past 30 days)
14.614.9
11.010.1
14.210.3
16.112.4
7.6-
213120
12926
451127
13417
110
0.90.8
0.90.5
0.80.5
447146
37183
12513
1998 Annual Report
857 15.2303 25.2340 20.4756 15.7217 19.535 21.575 19.3
338 16.8157 25.9108 21.6257 16.933 20.311 21.515 18.5
AlcoholCrackCocaineMarijuanaOpiatesMethamphetaminePCP
6.1 6.67.6 14.33.9 4.04.5 4.03.5 1.10.0 0.0
AlcoholCrackCocaineMarijuanaOpiatesMethamphetamine
8.4 8.010.5 5.31.1 0.5
CocaineHeroinAmphetamine/Methamphetamine
MALES
FEMALES
0 1 2 3 4 5 6 N
Mean Number of Times Reported Arrested in thePast 12 Months (excludes current offense; for thosetesting positive)
MALES
FEMALES

New York CityAge of Booked Arrestees (%) Race of Booked Arrestees (%)
Sample Size 15–20 21–25 26–30 31–35 36+ Black White Hispanic Other
Percent Positive for Drugs, by Sex, Age, and Race
Percent Positive for Drugs, by Offense Category
Historic Trends in Percent Positive, by Drug
A ny Drug
C o c a i n e
M a r i j u a n a
O p i a t e s
P C P
Multiple Drugs
NOTE:
Positive by urinalysis. ‘Any Drug’trend line in 1994 and 1995based on 100ng marijuana test.Gaps on graph represent periodswhen data were not collected.
Data for Q3 and Q4 1998 rep-resent all 5 boroughs ratherthan Manhattan alone.
379 120 37.5 43.3 40.6 20.0 0.0 0.0 0.8 0.0 68.1 60.075 18 33.3 50.0 44.0 16.7 0.0 0.0 1.3 0.0 69.3 66.7
242 85 40.1 44.7 40.1 20.0 0.0 0.0 0.8 0.0 69.4 58.823 3 17.4 66.7 52.2 33.3 0.0 0.0 0.0 0.0 60.9 66.739 14 41.0 21.4 30.8 21.4 0.0 0.0 0.0 0.0 61.5 57.1
394 184 56.1 71.2 33.5 20.1 0.0 0.0 1.3 1.1 78.2 84.8132 61 58.3 57.4 33.3 11.5 0.0 0.0 0.0 1.6 80.3 68.959 4 52.5 50.0 40.7 25.0 0.0 0.0 3.4 0.0 88.1 75.05 0 60.0 - 60.0 - 0.0 - 0.0 - 80.0 -
198 119 55.6 79.0 30.8 24.4 0.0 0.0 1.5 0.8 73.7 93.3466 341 52.4 81.2 46.4 24.9 0.0 0.0 1.3 0.9 89.9 93.3104 77 51.0 77.9 32.7 24.7 0.0 0.0 0.0 1.3 86.5 88.3362 264 52.8 82.2 50.3 25.0 0.0 0.0 1.7 0.8 90.9 94.716 55 25.0 41.8 12.5 34.5 0.0 0.0 0.0 0.0 37.5 74.5
398 96 41.7 53.1 34.4 21.9 0.0 0.0 1.0 1.0 70.4 69.8
1657 799 47.1 67.0 38.7 23.4 0.0 0.0 1.1 0.8 76.9 82.1
N by Sex Cocaine Marijuana Methamphetamine PCP Any DrugOffense M F M F M F M F M F M F
SOURCE: National Institute of Justice
561998 Annual Report
Any Drug Cocaine Marijuana 100ng Marijuana 50ng Opiates Methamphetamine
Percent Positive Percent Positive by Age Percent Positive by Race
20 40 60 80 100% 15–20 21–25 26–30 31–35 36+ Black White Hispanic Other
302 237 235 265 593 863 223 491 3072 91 121 175 338 496 82 205 10
18.5 14.5 14.4 16.2 36.3 53.7 13.9 30.6 1.9
9.0 11.4 15.2 22.0 42.4 62.5 10.3 25.9 1.3
M a l e s 1 6 5 7
Fe m a l e s 7 9 9
Total Males (N)Total Females (N)
Violent OffenseRobberyAssaultWeaponsOther ViolentProperty OffenseLarceny/TheftBurglaryStolen VehicleOther PropertyDrug OffenseDrug SalesDrug PossessionProstitutionOther Offense
Total
New York
MALES
FEMALES
M e t h a m -p h e t a m i n e
76.9 73.8 67.9 74.9 83.8 79.6 79.7 71.3 75.8 43.382.1 55.6 71.4 76.0 89.1 89.1 82.3 84.1 82.4 50.0
47.1 16.2 25.3 50.2 61.9 63.1 50.1 42.2 44.2 23.367.0 15.3 39.6 62.8 79.4 80.5 68.3 59.8 67.8 40.0
38.7 67.9 53.2 38.7 33.2 20.2 41.6 31.8 37.9 26.723.4 43.1 45.1 20.7 22.9 14.5 24.8 23.2 19.5 40.0
16.2 4.3 9.3 15.7 21.5 23.1 11.5 20.2 23.0 3.321.8 1.4 18.7 20.7 18.9 28.7 14.3 34.1 35.6 10.0
0.0 0.0 0.0 0.0 0.0 0.0 0.0 0.0 0.0 0.00.0 0.0 0.0 0.0 0.0 0.0 0.0 0.0 0.0 0.0
1.1 2.3 0.8 0.0 1.9 0.7 1.2 0.9 0.8 0.00.8 0.0 0.0 0.0 1.7 0.9 0.8 0.0 1.0 0.0
29.3 15.6 19.0 31.1 41.5 34.1 26.0 32.3 34.2 13.336.7 5.6 27.5 31.4 38.3 46.7 31.0 42.7 48.3 40.0
Catchment Area:
Q1, Q2 — Manhattan onlyQ3, Q4 — entire city

Cocaine
M a r i j u a n a
Opiates
Description of the Sample
Self-Reported Drug Information
C ra c k
C o c a i n e
C rack & Cocaine
Marijuana & Cocaine
Opiates & Cocaine
A ny 2 or More Drugs
57
0 20 40 60 80 100% 15–20 21–25 26–30 31–35 36+
23.4 4.7 8.5 19.7 32.5 35.743.8 5.7 25.3 44.2 46.8 54.9
19.4 5.3 11.4 20.5 26.1 26.516.3 11.1 9.9 19.3 13.9 19.6
7.0 1.3 1.7 7.3 12.1 9.88.6 0.0 5.5 8.5 8.6 11.4
10.6 4.3 7.6 14.1 15.7 11.28.0 9.7 6.6 10.0 8.7 6.9
6.5 0.3 3.8 4.3 10.2 10.27.4 2.8 4.4 7.4 5.7 10.1
28.9 10.0 18.8 29.5 41.1 36.629.3 12.9 23.1 34.2 30.8 32.1
Highest Grade Completed
6th Grade or Less7th to 9th Grade10th to 12th GradeAbove 12th Grade
2.1 2.26.8 4.7
77.5 73.113.6 20.1
21.5 35.568.0 52.32.8 5.40.4 1.00.7 0.05.7 4.81.0 1.1
Males FemalesType of Place in Prior 30 Days
Public HousingPrivate House or ApartmentShelterIncarceration FacilityTreatment FacilityNo Fixed ResidenceOther
Males Females
17.7 35.349.8 20.215.7 17.816.8 26.8
Primary Sourcein Prior 30 Days
Welfare, Social SecurityFull or Part-Time EmploymentOther Legal Illegal or None
Males Females
Current Primary Source of Income of Booked Arrestees (%)
Current Housing Arrangement of Booked Arrestees (%)
Education of Booked Arrestees (%)
Males FemalesN Mean Age N Mean Age Males Females Males Females
Percent Reporting Drug Use in the Past 30 Days, by Age and SexPercent Reporting Use Percent Reporting Use by Age
Age at First Use (for those admitting use) Received Prior Treatment ( % ) Ever Injected Drugs Illegally ( % )
MALES
FEMALES
C ra c k
C o c a i n e
M a r i j u a n a
O p i a t e s
M e t h a m p h e t a m i n e
0 5 10 15 20 25 30 N
Mean Number of Days Used in the Past 30 Days(for those admitting use in the past 30 days)
16.017.9
12.511.6
16.013.2
21.121.0
--
386347
318129
827251
278156
00
1.11.2
0.81.0
0.91.3
776533
638186
268174
1998 Annual Report
1378 14.7534 25.8650 19.8
1271 15.3405 19.938 20.9
205 17.6
550 16.1401 25.3256 21.2418 15.8219 23.1
3 20.028 17.9
AlcoholCrackCocaineMarijuanaOpiatesMethamphetaminePCP
10.1 8.910.6 26.08.2 10.33.8 5.2
12.6 18.80.2 0.0
AlcoholCrackCocaineMarijuanaOpiatesMethamphetamine
7.7 5.811.5 9.80.5 0.1
CocaineHeroinAmphetamine/Methamphetamine
MALES
FEMALES
0 1 2 3 4 5 6 N
Mean Number of Times Reported Arrested in thePast 12 Months (excludes current offense; for thosetesting positive)
MALES
FEMALES
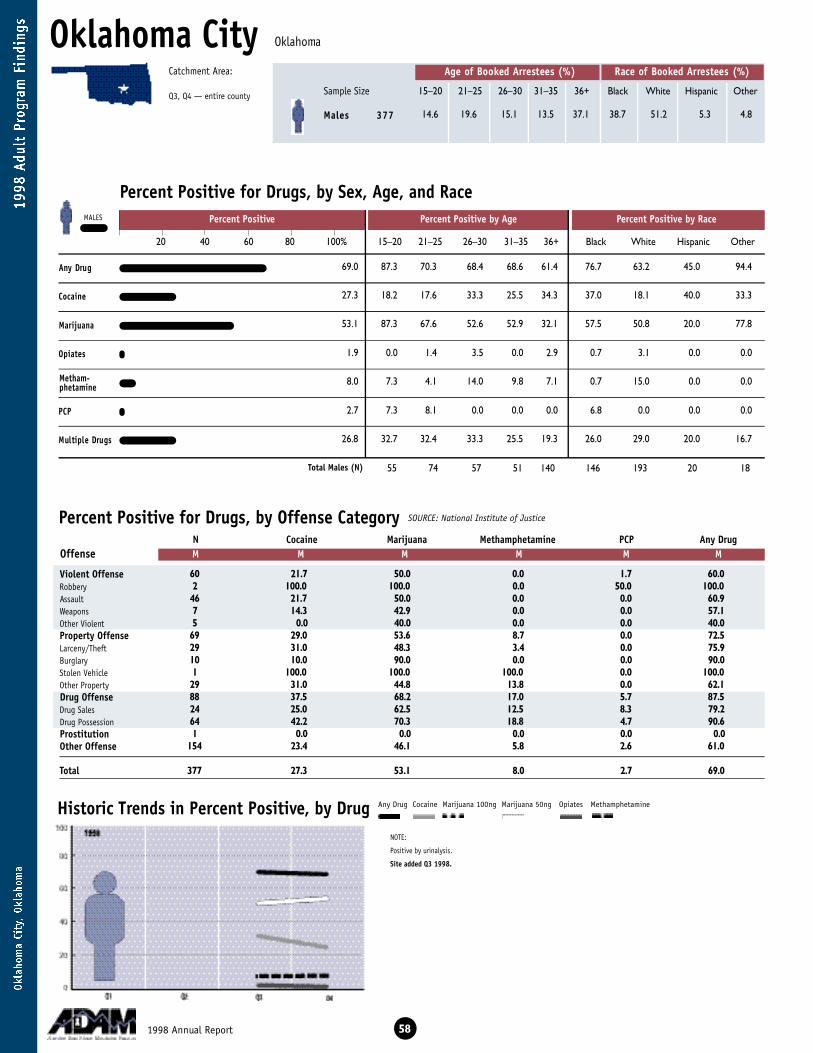
Catchment Area:
Q3, Q4 — entire county
Percent Positive Percent Positive by Age Percent Positive by Race
20 40 60 80 100% 15–20 21–25 26–30 31–35 36+ Black White Hispanic Other
Oklahoma CityAge of Booked Arrestees (%) Race of Booked Arrestees (%)
Sample Size 15–20 21–25 26–30 31–35 36+ Black White Hispanic Other
Percent Positive for Drugs, by Sex, Age, and Race
Percent Positive for Drugs, by Offense Category
Historic Trends in Percent Positive, by Drug
A ny Drug
C o c a i n e
M a r i j u a n a
O p i a t e s
P C P
Multiple Drugs
NOTE:
Positive by urinalysis.
Site added Q3 1998.
60 21.7 50.0 0.0 1.7 60.02 100.0 100.0 0.0 50.0 100.046 21.7 50.0 0.0 0.0 60.97 14.3 42.9 0.0 0.0 57.15 0.0 40.0 0.0 0.0 40.0
69 29.0 53.6 8.7 0.0 72.529 31.0 48.3 3.4 0.0 75.910 10.0 90.0 0.0 0.0 90.01 100.0 100.0 100.0 0.0 100.0
29 31.0 44.8 13.8 0.0 62.188 37.5 68.2 17.0 5.7 87.524 25.0 62.5 12.5 8.3 79.264 42.2 70.3 18.8 4.7 90.61 0.0 0.0 0.0 0.0 0.0
154 23.4 46.1 5.8 2.6 61.0
377 27.3 53.1 8.0 2.7 69.0
N Cocaine Marijuana Methamphetamine PCP Any DrugOffense M M M M M M
SOURCE: National Institute of Justice
58
Any Drug Cocaine Marijuana 100ng Marijuana 50ng Opiates Methamphetamine
55 74 57 51 140 146 193 20 18
14.6 19.6 15.1 13.5 37.1 38.7 51.2 5.3 4.8M a l e s 3 7 7
Total Males (N)
Violent OffenseRobberyAssaultWeaponsOther ViolentProperty OffenseLarceny/TheftBurglaryStolen VehicleOther PropertyDrug OffenseDrug SalesDrug PossessionProstitutionOther Offense
Total
Oklahoma
MALES
M e t h a m -p h e t a m i n e
69.0 87.3 70.3 68.4 68.6 61.4 76.7 63.2 45.0 94.4
27.3 18.2 17.6 33.3 25.5 34.3 37.0 18.1 40.0 33.3
53.1 87.3 67.6 52.6 52.9 32.1 57.5 50.8 20.0 77.8
1.9 0.0 1.4 3.5 0.0 2.9 0.7 3.1 0.0 0.0
8.0 7.3 4.1 14.0 9.8 7.1 0.7 15.0 0.0 0.0
2.7 7.3 8.1 0.0 0.0 0.0 6.8 0.0 0.0 0.0
26.8 32.7 32.4 33.3 25.5 19.3 26.0 29.0 20.0 16.7
1998 Annual Report

Cocaine
M a r i j u a n a
Opiates
Description of the Sample
Self-Reported Drug Information
C ra c k
C o c a i n e
C rack & Cocaine
Marijuana & Cocaine
Opiates & Cocaine
A ny 2 or More Drugs
59
0 20 40 60 80 100% 15–20 21–25 26–30 31–35 36+
15.3 0.0 9.6 16.4 15.7 23.9
11.9 9.1 12.5 14.5 17.6 9.4
4.5 0.0 4.1 5.4 5.9 5.8
9.9 9.1 11.1 12.5 13.7 7.2
1.3 0.0 0.0 1.8 2.0 2.1
29.9 27.8 32.9 37.0 30.6 26.1
Highest Grade Completed
6th Grade or Less7th to 9th Grade10th to 12th GradeAbove 12th Grade
1.1 -10.9 -68.4 -19.5 -
6.4 -87.5 -0.5 -0.5 -0.8 -1.9 -2.4 -
Males FemalesType of Place in Prior 30 Days
Public HousingPrivate House or ApartmentShelterIncarceration FacilityTreatment FacilityNo Fixed ResidenceOther
Males Females
4.8 -75.9 -7.2 -
12.1 -
Primary Sourcein Prior 30 Days
Welfare, Social SecurityFull or Part-Time EmploymentOther Legal Illegal or None
Males Females
Current Primary Source of Income of Booked Arrestees (%)
Current Housing Arrangement of Booked Arrestees (%)
Education of Booked Arrestees (%)
Males FemalesN Mean Age N Mean Age Males Females Males Females
Percent Reporting Drug Use in the Past 30 Days, by Age and SexPercent Reporting Use Percent Reporting Use by Age
Age at First Use (for those admitting use) Received Prior Treatment ( % ) Ever Injected Drugs Illegally ( % )
MALES
C ra c k
C o c a i n e
Marijuana
Opiates
M e t h a m p h e t a m i n e
0 5 10 15 20 25 30 N
Mean Number of Days Used in the Past 30 Days(for those admitting use in the past 30 days)
11.8
7.3
13.8
9.8
9.2
57
44
216
8
43
0.7
0.9
0.6
102
199
7
1998 Annual Report
368 13.7123 26.6164 21.7338 15.253 23.5
112 20.463 19.8
- -- -- -- -- -- -- -
AlcoholCrackCocaineMarijuanaOpiatesMethamphetaminePCP
24.2 -5.9 -3.0 -7.0 -1.1 -2.9 -
AlcoholCrackCocaineMarijuanaOpiatesMethamphetamine
16.8 -10.1 -17.6 -
CocaineHeroinAmphetamine/Methamphetamine
MALES
0 1 2 3 4 5 6 N
Mean Number of Times Reported Arrested in thePast 12 Months (excludes current offense; for thosetesting positive)MALES
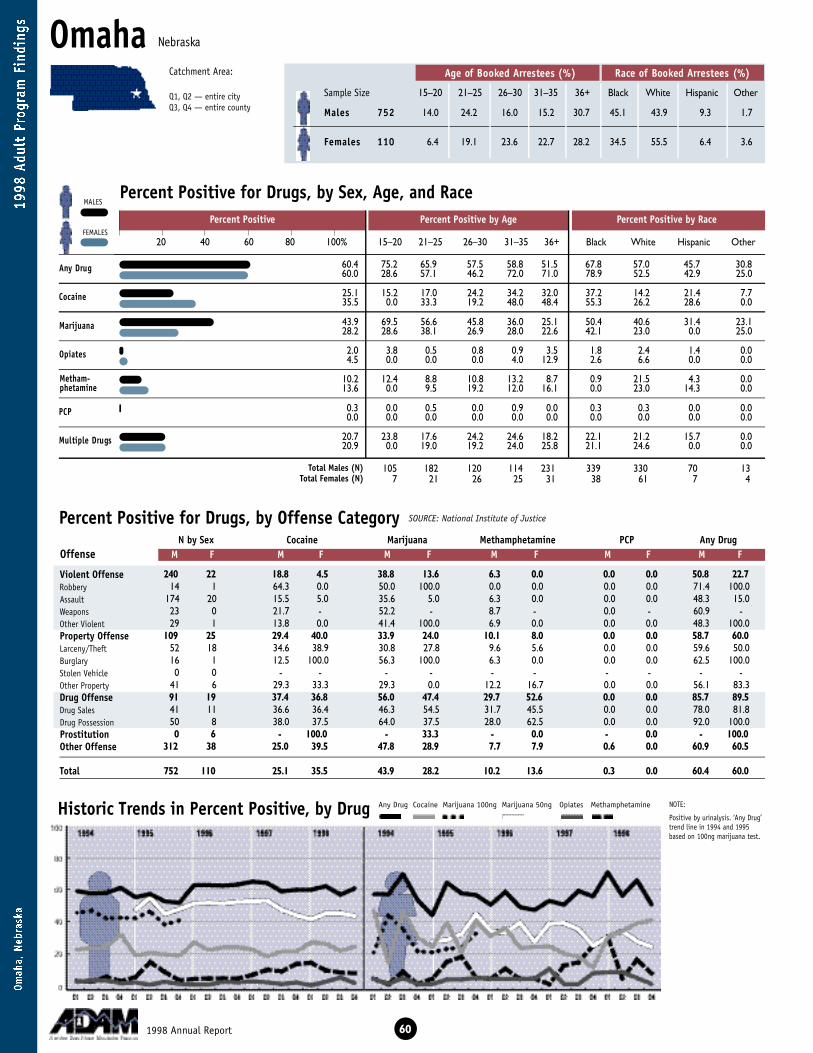
OmahaAge of Booked Arrestees (%) Race of Booked Arrestees (%)
Sample Size 15–20 21–25 26–30 31–35 36+ Black White Hispanic Other
Percent Positive for Drugs, by Sex, Age, and Race
Percent Positive for Drugs, by Offense Category
Historic Trends in Percent Positive, by Drug
A ny Drug
C o c a i n e
M a r i j u a n a
O p i a t e s
P C P
Multiple Drugs
NOTE:
Positive by urinalysis. ‘Any Drug’trend line in 1994 and 1995based on 100ng marijuana test.
240 22 18.8 4.5 38.8 13.6 6.3 0.0 0.0 0.0 50.8 22.714 1 64.3 0.0 50.0 100.0 0.0 0.0 0.0 0.0 71.4 100.0
174 20 15.5 5.0 35.6 5.0 6.3 0.0 0.0 0.0 48.3 15.023 0 21.7 - 52.2 - 8.7 - 0.0 - 60.9 -29 1 13.8 0.0 41.4 100.0 6.9 0.0 0.0 0.0 48.3 100.0
109 25 29.4 40.0 33.9 24.0 10.1 8.0 0.0 0.0 58.7 60.052 18 34.6 38.9 30.8 27.8 9.6 5.6 0.0 0.0 59.6 50.016 1 12.5 100.0 56.3 100.0 6.3 0.0 0.0 0.0 62.5 100.00 0 - - - - - - - - - -
41 6 29.3 33.3 29.3 0.0 12.2 16.7 0.0 0.0 56.1 83.391 19 37.4 36.8 56.0 47.4 29.7 52.6 0.0 0.0 85.7 89.541 11 36.6 36.4 46.3 54.5 31.7 45.5 0.0 0.0 78.0 81.850 8 38.0 37.5 64.0 37.5 28.0 62.5 0.0 0.0 92.0 100.00 6 - 100.0 - 33.3 - 0.0 - 0.0 - 100.0
312 38 25.0 39.5 47.8 28.9 7.7 7.9 0.6 0.0 60.9 60.5
752 110 25.1 35.5 43.9 28.2 10.2 13.6 0.3 0.0 60.4 60.0
N by Sex Cocaine Marijuana Methamphetamine PCP Any DrugOffense M F M F M F M F M F M F
SOURCE: National Institute of Justice
601998 Annual Report
Any Drug Cocaine Marijuana 100ng Marijuana 50ng Opiates Methamphetamine
Percent Positive Percent Positive by Age Percent Positive by Race
20 40 60 80 100% 15–20 21–25 26–30 31–35 36+ Black White Hispanic Other
105 182 120 114 231 339 330 70 137 21 26 25 31 38 61 7 4
14.0 24.2 16.0 15.2 30.7 45.1 43.9 9.3 1.7
6.4 19.1 23.6 22.7 28.2 34.5 55.5 6.4 3.6
M a l e s 7 5 2
Fe m a l e s 1 1 0
Total Males (N)Total Females (N)
Violent OffenseRobberyAssaultWeaponsOther ViolentProperty OffenseLarceny/TheftBurglaryStolen VehicleOther PropertyDrug OffenseDrug SalesDrug PossessionProstitutionOther Offense
Total
Nebraska
MALES
FEMALES
M e t h a m -p h e t a m i n e
60.4 75.2 65.9 57.5 58.8 51.5 67.8 57.0 45.7 30.860.0 28.6 57.1 46.2 72.0 71.0 78.9 52.5 42.9 25.0
25.1 15.2 17.0 24.2 34.2 32.0 37.2 14.2 21.4 7.735.5 0.0 33.3 19.2 48.0 48.4 55.3 26.2 28.6 0.0
43.9 69.5 56.6 45.8 36.0 25.1 50.4 40.6 31.4 23.128.2 28.6 38.1 26.9 28.0 22.6 42.1 23.0 0.0 25.0
2.0 3.8 0.5 0.8 0.9 3.5 1.8 2.4 1.4 0.04.5 0.0 0.0 0.0 4.0 12.9 2.6 6.6 0.0 0.0
10.2 12.4 8.8 10.8 13.2 8.7 0.9 21.5 4.3 0.013.6 0.0 9.5 19.2 12.0 16.1 0.0 23.0 14.3 0.0
0.3 0.0 0.5 0.0 0.9 0.0 0.3 0.3 0.0 0.00.0 0.0 0.0 0.0 0.0 0.0 0.0 0.0 0.0 0.0
20.7 23.8 17.6 24.2 24.6 18.2 22.1 21.2 15.7 0.020.9 0.0 19.0 19.2 24.0 25.8 21.1 24.6 0.0 0.0
Catchment Area:
Q1, Q2 — entire cityQ3, Q4 — entire county

C ra c k
C o c a i n e
M a r i j u a n a
O p i a t e s
M e t h a m p h e t a m i n e
C ra c k
C o c a i n e
C rack & Cocaine
Marijuana & Cocaine
Opiates & Cocaine
A ny 2 or More Drugs
Cocaine
M a r i j u a n a
Opiates
Description of the Sample
Self-Reported Drug Information
61
0 20 40 60 80 100% 15–20 21–25 26–30 31–35 36+
13.2 6.7 6.0 14.2 18.4 18.623.6 0.0 14.3 23.1 32.0 29.0
6.5 8.6 7.7 8.3 1.8 6.19.1 0.0 4.8 0.0 16.0 16.1
2.4 2.9 1.6 5.0 0.0 2.64.5 0.0 0.0 0.0 8.0 9.7
5.1 7.6 6.0 6.7 1.8 3.95.5 0.0 4.8 0.0 8.0 9.7
0.7 1.0 0.0 1.7 0.0 0.90.9 0.0 0.0 0.0 4.0 0.0
22.7 22.9 18.7 26.9 25.7 22.127.5 14.3 14.3 34.6 40.0 23.3
Highest Grade Completed
6th Grade or Less7th to 9th Grade10th to 12th GradeAbove 12th Grade
3.6 0.05.3 3.8
71.3 72.419.7 23.8
1.5 1.892.8 95.51.2 0.92.4 0.00.4 0.91.7 0.00.0 0.9
Males FemalesType of Place in Prior 30 Days
Public HousingPrivate House or ApartmentShelterIncarceration FacilityTreatment FacilityNo Fixed ResidenceOther
Males Females
4.5 20.976.4 50.96.1 11.8
12.9 16.4
Primary Sourcein Prior 30 Days
Welfare, Social SecurityFull or Part-Time EmploymentOther Legal Illegal or None
Males Females
Current Primary Source of Income of Booked Arrestees (%)
Current Housing Arrangement of Booked Arrestees (%)
Education of Booked Arrestees (%)
Males FemalesN Mean Age N Mean Age Males Females Males Females
Percent Reporting Drug Use in the Past 30 Days, by Age and SexPercent Reporting Use Percent Reporting Use by Age
Age at First Use (for those admitting use) Received Prior Treatment ( % ) Ever Injected Drugs Illegally ( % )
MALES
FEMALES
0 5 10 15 20 25 30 N
Mean Number of Days Used in the Past 30 Days(for those admitting use in the past 30 days)
10.515.5
6.25.8
14.410.2
25.218.0
11.010.7
9926
4910
38144
62
626
0.80.9
0.81.0
0.71.6
18939
33031
155
1998 Annual Report
727 14.8197 26.2252 20.7616 15.369 21.4
158 21.057 18.7
108 16.243 26.441 21.585 16.57 24.9
17 23.63 20.0
AlcoholCrackCocaineMarijuanaOpiatesMethamphetaminePCP
22.2 17.45.1 14.53.5 5.57.6 4.51.6 0.02.4 0.0
AlcoholCrackCocaineMarijuanaOpiatesMethamphetamine
8.1 9.15.1 4.57.4 8.2
CocaineHeroinAmphetamine/Methamphetamine
MALES
FEMALES
0 1 2 3 4 5 6 N
Mean Number of Times Reported Arrested in thePast 12 Months (excludes current offense; for thosetesting positive)
MALES
FEMALES
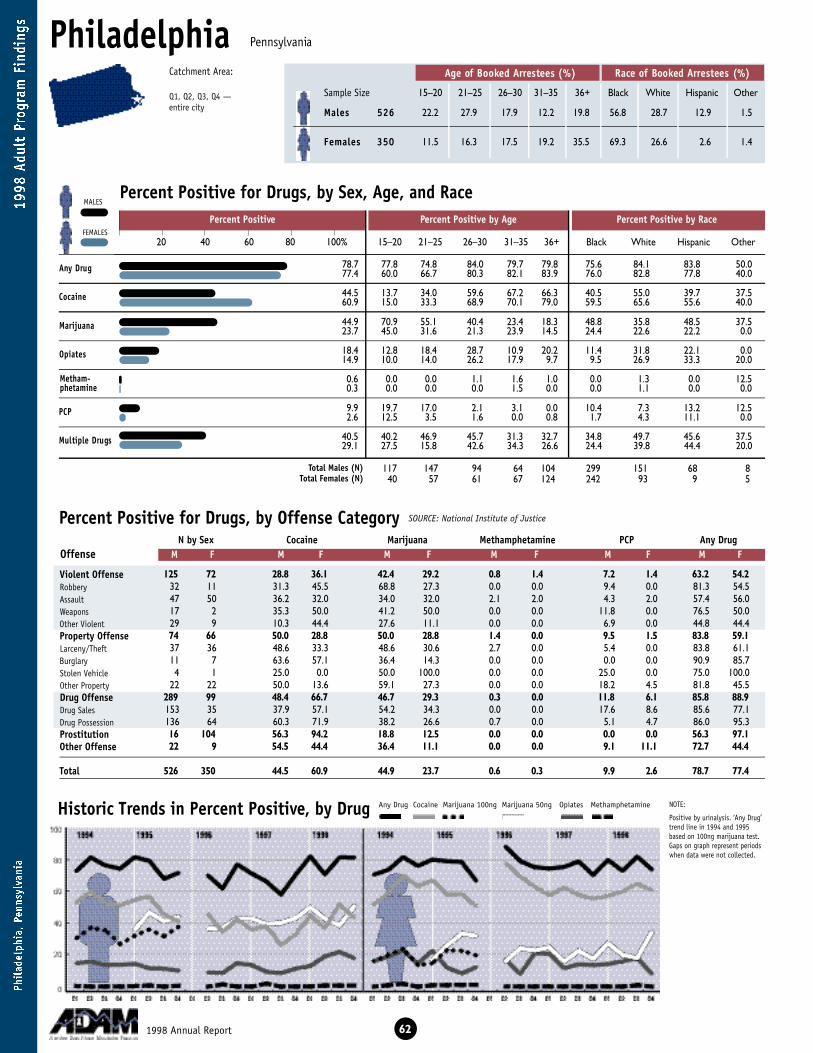
Catchment Area:
Q1, Q2, Q3, Q4 — entire city
PhiladelphiaAge of Booked Arrestees (%) Race of Booked Arrestees (%)
Sample Size 15–20 21–25 26–30 31–35 36+ Black White Hispanic Other
Percent Positive for Drugs, by Sex, Age, and Race
Percent Positive for Drugs, by Offense Category
Historic Trends in Percent Positive, by Drug
A ny Drug
C o c a i n e
M a r i j u a n a
O p i a t e s
P C P
Multiple Drugs
NOTE:
Positive by urinalysis. ‘Any Drug’trend line in 1994 and 1995based on 100ng marijuana test.Gaps on graph represent periodswhen data were not collected.
125 72 28.8 36.1 42.4 29.2 0.8 1.4 7.2 1.4 63.2 54.232 11 31.3 45.5 68.8 27.3 0.0 0.0 9.4 0.0 81.3 54.547 50 36.2 32.0 34.0 32.0 2.1 2.0 4.3 2.0 57.4 56.017 2 35.3 50.0 41.2 50.0 0.0 0.0 11.8 0.0 76.5 50.029 9 10.3 44.4 27.6 11.1 0.0 0.0 6.9 0.0 44.8 44.474 66 50.0 28.8 50.0 28.8 1.4 0.0 9.5 1.5 83.8 59.137 36 48.6 33.3 48.6 30.6 2.7 0.0 5.4 0.0 83.8 61.111 7 63.6 57.1 36.4 14.3 0.0 0.0 0.0 0.0 90.9 85.74 1 25.0 0.0 50.0 100.0 0.0 0.0 25.0 0.0 75.0 100.0
22 22 50.0 13.6 59.1 27.3 0.0 0.0 18.2 4.5 81.8 45.5289 99 48.4 66.7 46.7 29.3 0.3 0.0 11.8 6.1 85.8 88.9153 35 37.9 57.1 54.2 34.3 0.0 0.0 17.6 8.6 85.6 77.1136 64 60.3 71.9 38.2 26.6 0.7 0.0 5.1 4.7 86.0 95.316 104 56.3 94.2 18.8 12.5 0.0 0.0 0.0 0.0 56.3 97.122 9 54.5 44.4 36.4 11.1 0.0 0.0 9.1 11.1 72.7 44.4
526 350 44.5 60.9 44.9 23.7 0.6 0.3 9.9 2.6 78.7 77.4
N by Sex Cocaine Marijuana Methamphetamine PCP Any DrugOffense M F M F M F M F M F M F
SOURCE: National Institute of Justice
621998 Annual Report
Any Drug Cocaine Marijuana 100ng Marijuana 50ng Opiates Methamphetamine
Percent Positive Percent Positive by Age Percent Positive by Race
20 40 60 80 100% 15–20 21–25 26–30 31–35 36+ Black White Hispanic Other
117 147 94 64 104 299 151 68 840 57 61 67 124 242 93 9 5
22.2 27.9 17.9 12.2 19.8 56.8 28.7 12.9 1.5
11.5 16.3 17.5 19.2 35.5 69.3 26.6 2.6 1.4
M a l e s 5 2 6
Fe m a l e s 3 5 0
Total Males (N)Total Females (N)
Violent OffenseRobberyAssaultWeaponsOther ViolentProperty OffenseLarceny/TheftBurglaryStolen VehicleOther PropertyDrug OffenseDrug SalesDrug PossessionProstitutionOther Offense
Total
Pennsylvania
MALES
FEMALES
M e t h a m -p h e t a m i n e
78.7 77.8 74.8 84.0 79.7 79.8 75.6 84.1 83.8 50.077.4 60.0 66.7 80.3 82.1 83.9 76.0 82.8 77.8 40.0
44.5 13.7 34.0 59.6 67.2 66.3 40.5 55.0 39.7 37.560.9 15.0 33.3 68.9 70.1 79.0 59.5 65.6 55.6 40.0
44.9 70.9 55.1 40.4 23.4 18.3 48.8 35.8 48.5 37.523.7 45.0 31.6 21.3 23.9 14.5 24.4 22.6 22.2 0.0
18.4 12.8 18.4 28.7 10.9 20.2 11.4 31.8 22.1 0.014.9 10.0 14.0 26.2 17.9 9.7 9.5 26.9 33.3 20.0
0.6 0.0 0.0 1.1 1.6 1.0 0.0 1.3 0.0 12.50.3 0.0 0.0 0.0 1.5 0.0 0.0 1.1 0.0 0.0
9.9 19.7 17.0 2.1 3.1 0.0 10.4 7.3 13.2 12.52.6 12.5 3.5 1.6 0.0 0.8 1.7 4.3 11.1 0.0
40.5 40.2 46.9 45.7 31.3 32.7 34.8 49.7 45.6 37.529.1 27.5 15.8 42.6 34.3 26.6 24.4 39.8 44.4 20.0

Cocaine
M a r i j u a n a
Opiates
Description of the Sample
Self-Reported Drug Information
C ra c k
C o c a i n e
C rack & Cocaine
Marijuana & Cocaine
Opiates & Cocaine
A ny 2 or More Drugs
63
0 20 40 60 80 100% 15–20 21–25 26–30 31–35 36+
29.9 6.0 16.3 37.2 53.1 55.346.6 7.5 25.9 54.1 58.2 58.9
10.1 6.1 12.2 4.3 10.9 16.510.0 10.0 1.8 9.8 10.4 13.7
5.1 1.7 3.4 2.1 9.4 11.56.6 5.0 1.7 8.2 6.0 8.9
5.9 6.0 5.4 4.3 7.8 6.75.7 7.5 0.0 4.9 9.0 6.5
3.6 0.9 4.8 2.1 1.6 7.73.7 5.0 0.0 1.6 6.0 4.8
35.4 24.1 38.4 37.6 34.4 42.334.8 30.0 22.4 38.3 43.3 35.8
Highest Grade Completed
6th Grade or Less7th to 9th Grade10th to 12th GradeAbove 12th Grade
1.9 1.25.0 5.6
83.3 82.79.8 10.5
4.4 4.689.9 88.00.6 0.62.7 1.70.2 0.01.1 2.91.1 2.3
Males FemalesType of Place in Prior 30 Days
Public HousingPrivate House or ApartmentShelterIncarceration FacilityTreatment FacilityNo Fixed ResidenceOther
Males Females
14.3 37.751.3 22.315.6 17.418.8 22.6
Primary Sourcein Prior 30 Days
Welfare, Social SecurityFull or Part-Time EmploymentOther Legal Illegal or None
Males Females
Current Primary Source of Income of Booked Arrestees (%)
Current Housing Arrangement of Booked Arrestees (%)
Education of Booked Arrestees (%)
Males FemalesN Mean Age N Mean Age Males Females Males Females
Percent Reporting Drug Use in the Past 30 Days, by Age and SexPercent Reporting Use Percent Reporting Use by Age
Age at First Use (for those admitting use) Received Prior Treatment ( % ) Ever Injected Drugs Illegally ( % )
MALES
FEMALES
C ra c k
C o c a i n e
M a r i j u a n a
O p i a t e s
M e t h a m p h e t a m i n e
0 5 10 15 20 25 30 N
Mean Number of Days Used in the Past 30 Days(for those admitting use in the past 30 days)
14.216.2
8.09.8
14.211.4
22.521.5
4.5-
157163
5335
268138
7950
20
0.40.4
0.50.8
0.50.5
234212
23683
9752
1998 Annual Report
454 14.8204 24.3187 19.1421 14.8123 22.834 18.4
111 17.5
308 15.7200 24.9144 20.9252 15.979 22.823 18.645 19.0
AlcoholCrackCocaineMarijuanaOpiatesMethamphetaminePCP
14.1 13.413.1 22.96.7 4.07.5 5.49.9 9.40.2 0.6
AlcoholCrackCocaineMarijuanaOpiatesMethamphetamine
5.9 7.710.2 12.32.3 3.1
CocaineHeroinAmphetamine/Methamphetamine
MALES
FEMALES
0 1 2 3 4 5 6 N
Mean Number of Times Reported Arrested in thePast 12 Months (excludes current offense; for thosetesting positive)
MALES
FEMALES
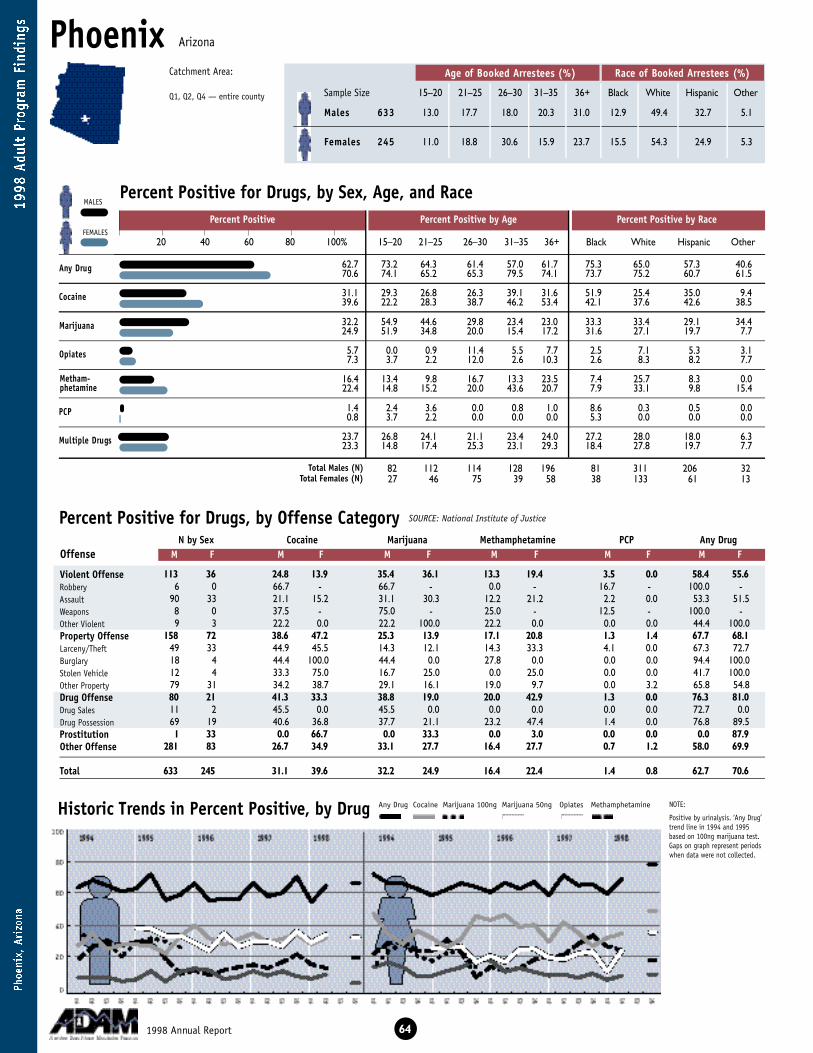
PhoenixAge of Booked Arrestees (%) Race of Booked Arrestees (%)
Sample Size 15–20 21–25 26–30 31–35 36+ Black White Hispanic Other
Percent Positive for Drugs, by Sex, Age, and Race
Percent Positive for Drugs, by Offense Category
Historic Trends in Percent Positive, by Drug
A ny Drug
C o c a i n e
M a r i j u a n a
O p i a t e s
P C P
Multiple Drugs
NOTE:
Positive by urinalysis. ‘Any Drug’trend line in 1994 and 1995based on 100ng marijuana test.Gaps on graph represent periodswhen data were not collected.
113 36 24.8 13.9 35.4 36.1 13.3 19.4 3.5 0.0 58.4 55.66 0 66.7 - 66.7 - 0.0 - 16.7 - 100.0 -
90 33 21.1 15.2 31.1 30.3 12.2 21.2 2.2 0.0 53.3 51.58 0 37.5 - 75.0 - 25.0 - 12.5 - 100.0 -9 3 22.2 0.0 22.2 100.0 22.2 0.0 0.0 0.0 44.4 100.0
158 72 38.6 47.2 25.3 13.9 17.1 20.8 1.3 1.4 67.7 68.149 33 44.9 45.5 14.3 12.1 14.3 33.3 4.1 0.0 67.3 72.718 4 44.4 100.0 44.4 0.0 27.8 0.0 0.0 0.0 94.4 100.012 4 33.3 75.0 16.7 25.0 0.0 25.0 0.0 0.0 41.7 100.079 31 34.2 38.7 29.1 16.1 19.0 9.7 0.0 3.2 65.8 54.880 21 41.3 33.3 38.8 19.0 20.0 42.9 1.3 0.0 76.3 81.011 2 45.5 0.0 45.5 0.0 0.0 0.0 0.0 0.0 72.7 0.069 19 40.6 36.8 37.7 21.1 23.2 47.4 1.4 0.0 76.8 89.51 33 0.0 66.7 0.0 33.3 0.0 3.0 0.0 0.0 0.0 87.9
281 83 26.7 34.9 33.1 27.7 16.4 27.7 0.7 1.2 58.0 69.9
633 245 31.1 39.6 32.2 24.9 16.4 22.4 1.4 0.8 62.7 70.6
N by Sex Cocaine Marijuana Methamphetamine PCP Any DrugOffense M F M F M F M F M F M F
SOURCE: National Institute of Justice
641998 Annual Report
Any Drug Cocaine Marijuana 100ng Marijuana 50ng Opiates Methamphetamine
Percent Positive Percent Positive by Age Percent Positive by Race
20 40 60 80 100% 15–20 21–25 26–30 31–35 36+ Black White Hispanic Other
82 112 114 128 196 81 311 206 3227 46 75 39 58 38 133 61 13
13.0 17.7 18.0 20.3 31.0 12.9 49.4 32.7 5.1
11.0 18.8 30.6 15.9 23.7 15.5 54.3 24.9 5.3
M a l e s 6 3 3
Fe m a l e s 2 4 5
Total Males (N)Total Females (N)
Violent OffenseRobberyAssaultWeaponsOther ViolentProperty OffenseLarceny/TheftBurglaryStolen VehicleOther PropertyDrug OffenseDrug SalesDrug PossessionProstitutionOther Offense
Total
Arizona
MALES
FEMALES
M e t h a m -p h e t a m i n e
62.7 73.2 64.3 61.4 57.0 61.7 75.3 65.0 57.3 40.670.6 74.1 65.2 65.3 79.5 74.1 73.7 75.2 60.7 61.5
31.1 29.3 26.8 26.3 39.1 31.6 51.9 25.4 35.0 9.439.6 22.2 28.3 38.7 46.2 53.4 42.1 37.6 42.6 38.5
32.2 54.9 44.6 29.8 23.4 23.0 33.3 33.4 29.1 34.424.9 51.9 34.8 20.0 15.4 17.2 31.6 27.1 19.7 7.7
5.7 0.0 0.9 11.4 5.5 7.7 2.5 7.1 5.3 3.17.3 3.7 2.2 12.0 2.6 10.3 2.6 8.3 8.2 7.7
16.4 13.4 9.8 16.7 13.3 23.5 7.4 25.7 8.3 0.022.4 14.8 15.2 20.0 43.6 20.7 7.9 33.1 9.8 15.4
1.4 2.4 3.6 0.0 0.8 1.0 8.6 0.3 0.5 0.00.8 3.7 2.2 0.0 0.0 0.0 5.3 0.0 0.0 0.0
23.7 26.8 24.1 21.1 23.4 24.0 27.2 28.0 18.0 6.323.3 14.8 17.4 25.3 23.1 29.3 18.4 27.8 19.7 7.7
Catchment Area:
Q1, Q2, Q4 — entire county

C ra c k
C o c a i n e
C rack & Cocaine
Marijuana & Cocaine
Opiates & Cocaine
A ny 2 or More Drugs
C ra c k
C o c a i n e
M a r i j u a n a
O p i a t e s
M e t h a m p h e t a m i n e
Cocaine
M a r i j u a n a
Opiates
Description of the Sample
Self-Reported Drug Information
65
0 20 40 60 80 100% 15–20 21–25 26–30 31–35 36+
20.1 12.2 10.7 15.0 27.3 27.033.5 11.1 19.6 33.3 43.6 48.3
15.1 12.5 16.2 14.0 18.1 14.411.1 23.1 10.9 9.3 10.3 8.6
8.4 6.1 5.4 8.8 10.9 9.26.1 7.4 6.5 5.3 5.1 6.9
8.6 8.6 9.9 7.9 9.4 7.76.1 11.5 8.7 4.0 7.7 3.4
4.9 1.2 2.7 6.1 4.7 7.23.7 3.7 4.3 5.3 0.0 3.4
32.3 31.3 28.6 32.5 36.5 32.332.9 37.0 22.2 36.5 46.2 25.9
Highest Grade Completed
6th Grade or Less7th to 9th Grade10th to 12th GradeAbove 12th Grade
2.9 2.311.4 11.964.0 62.121.7 23.7
0.6 1.288.9 91.01.3 0.80.5 2.00.3 0.07.9 4.10.5 0.8
Males FemalesType of Place in Prior 30 Days
Public HousingPrivate House or ApartmentShelterIncarceration FacilityTreatment FacilityNo Fixed ResidenceOther
Males Females
2.5 13.572.9 37.66.3 14.3
18.2 34.7
Primary Sourcein Prior 30 Days
Welfare, Social SecurityFull or Part-Time EmploymentOther Legal Illegal or None
Males Females
Current Primary Source of Income of Booked Arrestees (%)
Current Housing Arrangement of Booked Arrestees (%)
Education of Booked Arrestees (%)
Males FemalesN Mean Age N Mean Age Males Females Males Females
Percent Reporting Drug Use in the Past 30 Days, by Age and SexPercent Reporting Use Percent Reporting Use by Age
Age at First Use (for those admitting use) Received Prior Treatment ( % ) Ever Injected Drugs Illegally ( % )
MALES
FEMALES
0 5 10 15 20 25 30 N
Mean Number of Days Used in the Past 30 Days(for those admitting use in the past 30 days)
13.415.3
9.110.6
11.29.9
19.723.0
12.014.0
12782
9527
27187
5612
12754
1.30.9
1.12.5
1.81.1
19697
20461
3618
1998 Annual Report
607 14.0245 24.4308 19.8502 14.3125 21.6255 21.387 17.9
236 14.4125 23.9129 19.5196 15.042 20.5
104 21.324 17.0
AlcoholCrackCocaineMarijuanaOpiatesMethamphetaminePCP
14.1 11.14.3 6.54.8 3.33.5 2.52.8 2.05.2 3.3
AlcoholCrackCocaineMarijuanaOpiatesMethamphetamine
11.4 9.414.8 11.812.3 11.4
CocaineHeroinAmphetamine/Methamphetamine
MALES
FEMALES
0 1 2 3 4 5 6 N
Mean Number of Times Reported Arrested in thePast 12 Months (excludes current offense; for thosetesting positive)
MALES
FEMALES
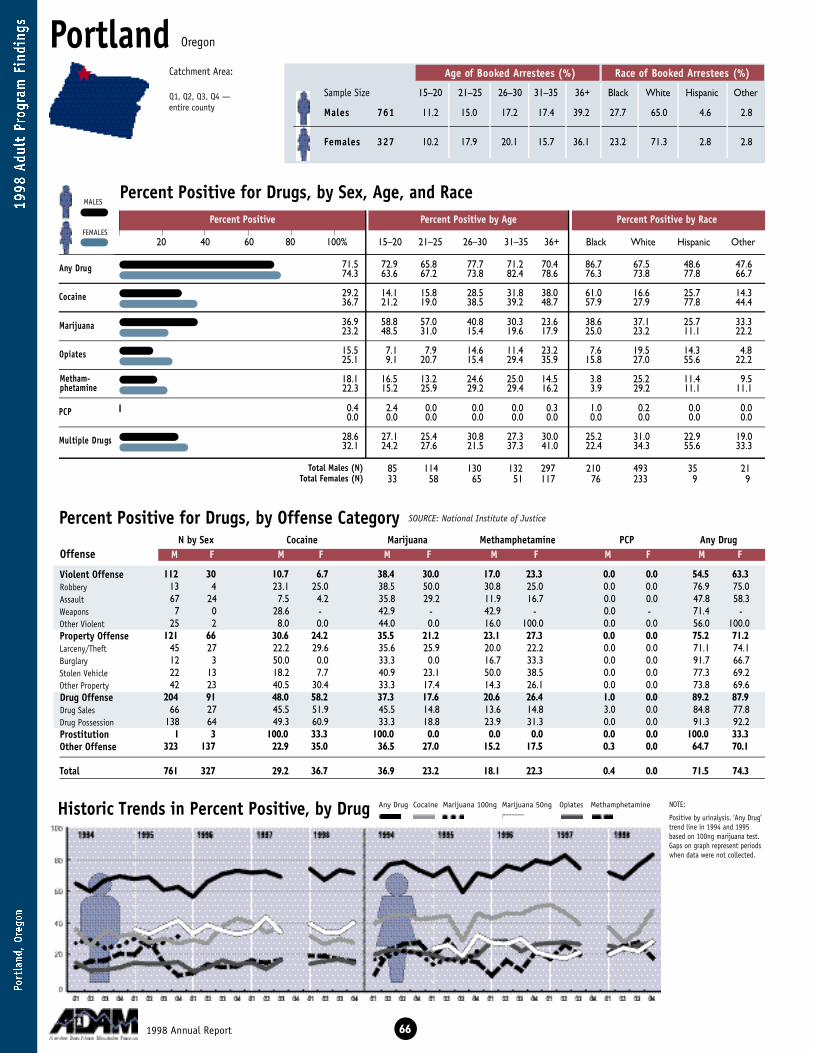
PortlandAge of Booked Arrestees (%) Race of Booked Arrestees (%)
Sample Size 15–20 21–25 26–30 31–35 36+ Black White Hispanic Other
Percent Positive for Drugs, by Sex, Age, and Race
Percent Positive for Drugs, by Offense Category
Historic Trends in Percent Positive, by Drug
A ny Drug
C o c a i n e
M a r i j u a n a
O p i a t e s
P C P
Multiple Drugs
NOTE:
Positive by urinalysis. ‘Any Drug’trend line in 1994 and 1995based on 100ng marijuana test.Gaps on graph represent periodswhen data were not collected.
112 30 10.7 6.7 38.4 30.0 17.0 23.3 0.0 0.0 54.5 63.313 4 23.1 25.0 38.5 50.0 30.8 25.0 0.0 0.0 76.9 75.067 24 7.5 4.2 35.8 29.2 11.9 16.7 0.0 0.0 47.8 58.37 0 28.6 - 42.9 - 42.9 - 0.0 - 71.4 -
25 2 8.0 0.0 44.0 0.0 16.0 100.0 0.0 0.0 56.0 100.0121 66 30.6 24.2 35.5 21.2 23.1 27.3 0.0 0.0 75.2 71.2
45 27 22.2 29.6 35.6 25.9 20.0 22.2 0.0 0.0 71.1 74.112 3 50.0 0.0 33.3 0.0 16.7 33.3 0.0 0.0 91.7 66.722 13 18.2 7.7 40.9 23.1 50.0 38.5 0.0 0.0 77.3 69.242 23 40.5 30.4 33.3 17.4 14.3 26.1 0.0 0.0 73.8 69.6
204 91 48.0 58.2 37.3 17.6 20.6 26.4 1.0 0.0 89.2 87.966 27 45.5 51.9 45.5 14.8 13.6 14.8 3.0 0.0 84.8 77.8
138 64 49.3 60.9 33.3 18.8 23.9 31.3 0.0 0.0 91.3 92.21 3 100.0 33.3 100.0 0.0 0.0 0.0 0.0 0.0 100.0 33.3
323 137 22.9 35.0 36.5 27.0 15.2 17.5 0.3 0.0 64.7 70.1
761 327 29.2 36.7 36.9 23.2 18.1 22.3 0.4 0.0 71.5 74.3
N by Sex Cocaine Marijuana Methamphetamine PCP Any DrugOffense M F M F M F M F M F M F
SOURCE: National Institute of Justice
661998 Annual Report
Any Drug Cocaine Marijuana 100ng Marijuana 50ng Opiates Methamphetamine
Percent Positive Percent Positive by Age Percent Positive by Race
20 40 60 80 100% 15–20 21–25 26–30 31–35 36+ Black White Hispanic Other
85 114 130 132 297 210 493 35 2133 58 65 51 117 76 233 9 9
11.2 15.0 17.2 17.4 39.2 27.7 65.0 4.6 2.8
10.2 17.9 20.1 15.7 36.1 23.2 71.3 2.8 2.8
M a l e s 7 6 1
Fe m a l e s 3 2 7
Total Males (N)Total Females (N)
Violent OffenseRobberyAssaultWeaponsOther ViolentProperty OffenseLarceny/TheftBurglaryStolen VehicleOther PropertyDrug OffenseDrug SalesDrug PossessionProstitutionOther Offense
Total
Oregon
MALES
FEMALES
M e t h a m -p h e t a m i n e
71.5 72.9 65.8 77.7 71.2 70.4 86.7 67.5 48.6 47.674.3 63.6 67.2 73.8 82.4 78.6 76.3 73.8 77.8 66.7
29.2 14.1 15.8 28.5 31.8 38.0 61.0 16.6 25.7 14.336.7 21.2 19.0 38.5 39.2 48.7 57.9 27.9 77.8 44.4
36.9 58.8 57.0 40.8 30.3 23.6 38.6 37.1 25.7 33.323.2 48.5 31.0 15.4 19.6 17.9 25.0 23.2 11.1 22.2
15.5 7.1 7.9 14.6 11.4 23.2 7.6 19.5 14.3 4.825.1 9.1 20.7 15.4 29.4 35.9 15.8 27.0 55.6 22.2
18.1 16.5 13.2 24.6 25.0 14.5 3.8 25.2 11.4 9.522.3 15.2 25.9 29.2 29.4 16.2 3.9 29.2 11.1 11.1
0.4 2.4 0.0 0.0 0.0 0.3 1.0 0.2 0.0 0.00.0 0.0 0.0 0.0 0.0 0.0 0.0 0.0 0.0 0.0
28.6 27.1 25.4 30.8 27.3 30.0 25.2 31.0 22.9 19.032.1 24.2 27.6 21.5 37.3 41.0 22.4 34.3 55.6 33.3
Catchment Area:
Q1, Q2, Q3, Q4 —entire county

C ra c k
C o c a i n e
C rack & Cocaine
Marijuana & Cocaine
Opiates & Cocaine
A ny 2 or More Drugs
Cocaine
M a r i j u a n a
Opiates
Description of the Sample
Self-Reported Drug Information
67
0 20 40 60 80 100% 15–20 21–25 26–30 31–35 36+
18.0 3.6 8.8 14.6 22.7 25.327.8 12.1 24.1 24.6 23.5 37.6
11.1 4.8 7.9 6.9 13.7 14.917.2 3.0 10.5 13.8 17.6 26.5
4.6 1.2 4.4 2.3 5.3 6.48.9 0.0 8.6 3.1 7.8 15.4
5.8 2.4 6.1 4.6 6.8 6.78.0 3.0 6.9 7.7 9.8 9.4
6.1 2.4 5.3 6.2 4.5 8.111.7 0.0 8.8 6.2 9.8 20.7
31.7 30.0 31.3 27.7 35.6 32.839.5 21.2 35.1 32.8 41.2 50.0
Highest Grade Completed
6th Grade or Less7th to 9th Grade10th to 12th GradeAbove 12th Grade
1.9 2.66.8 7.6
68.4 63.822.9 26.0
2.4 2.579.1 81.61.8 2.51.7 0.30.7 1.2
12.4 8.32.0 3.7
Males FemalesType of Place in Prior 30 Days
Public HousingPrivate House or ApartmentShelterIncarceration FacilityTreatment FacilityNo Fixed ResidenceOther
Males Females
8.9 18.856.8 31.213.8 21.020.4 29.0
Primary Sourcein Prior 30 Days
Welfare, Social SecurityFull or Part-Time EmploymentOther Legal Illegal or None
Males Females
Current Primary Source of Income of Booked Arrestees (%)
Current Housing Arrangement of Booked Arrestees (%)
Education of Booked Arrestees (%)
Males FemalesN Mean Age N Mean Age Males Females Males Females
Percent Reporting Drug Use in the Past 30 Days, by Age and SexPercent Reporting Use Percent Reporting Use by Age
Age at First Use (for those admitting use) Received Prior Treatment ( % ) Ever Injected Drugs Illegally ( % )
MALES
FEMALES
C ra c k
C o c a i n e
M a r i j u a n a
O p i a t e s
M e t h a m p h e t a m i n e
0 5 10 15 20 25 30 N
Mean Number of Days Used in the Past 30 Days(for those admitting use in the past 30 days)
12.014.5
10.012.9
9.68.1
17.122.1
10.510.4
13791
8456
327122
11077
13555
1.92.1
0.91.1
1.91.8
217117
27975
11681
1998 Annual Report
746 13.9324 25.0409 20.1664 14.7248 22.9322 20.8104 18.8
317 14.2170 23.9188 19.6282 15.1132 21.6162 20.345 18.1
AlcoholCrackCocaineMarijuanaOpiatesMethamphetaminePCP
22.8 24.211.8 12.59.0 10.79.7 8.6
10.1 20.68.2 9.8
AlcoholCrackCocaineMarijuanaOpiatesMethamphetamine
20.8 28.725.7 35.520.4 26.0
CocaineHeroinAmphetamine/Methamphetamine
MALES
FEMALES
0 1 2 3 4 5 6 N
Mean Number of Times Reported Arrested in thePast 12 Months (excludes current offense; for thosetesting positive)
MALES
FEMALES
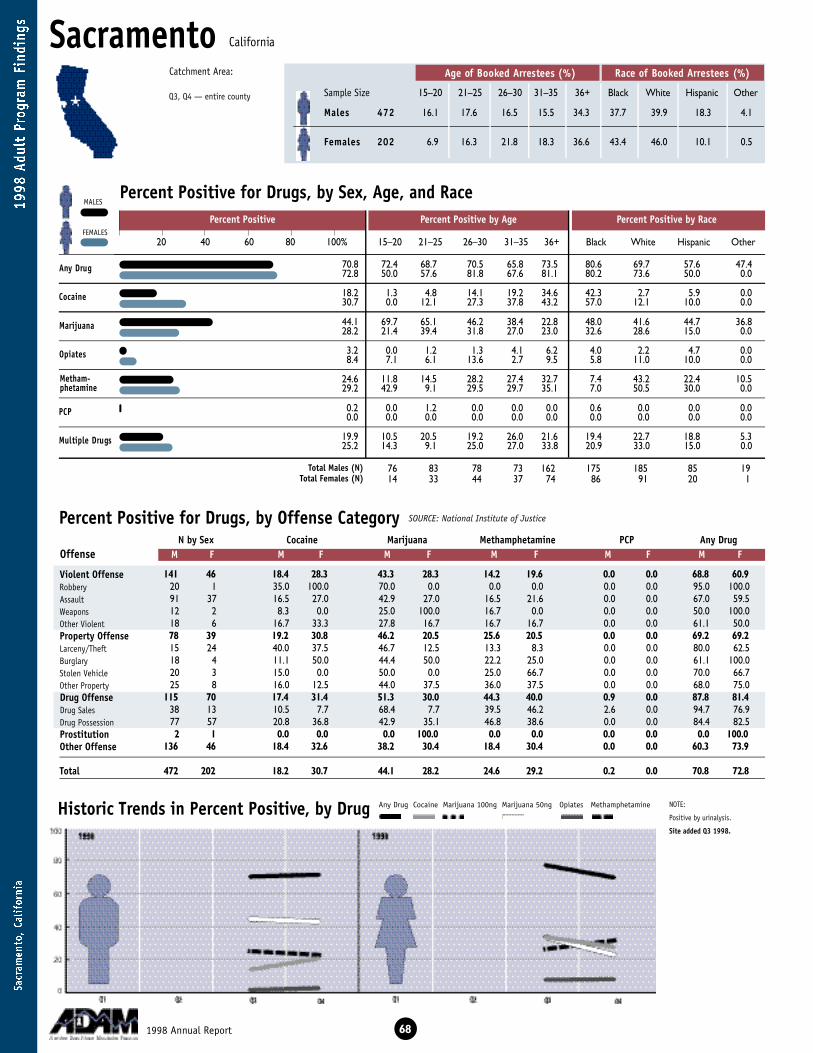
SacramentoAge of Booked Arrestees (%) Race of Booked Arrestees (%)
Sample Size 15–20 21–25 26–30 31–35 36+ Black White Hispanic Other
Percent Positive for Drugs, by Sex, Age, and Race
Percent Positive for Drugs, by Offense Category
Historic Trends in Percent Positive, by Drug
A ny Drug
C o c a i n e
M a r i j u a n a
O p i a t e s
P C P
Multiple Drugs
NOTE:
Positive by urinalysis.
Site added Q3 1998.
141 46 18.4 28.3 43.3 28.3 14.2 19.6 0.0 0.0 68.8 60.920 1 35.0 100.0 70.0 0.0 0.0 0.0 0.0 0.0 95.0 100.091 37 16.5 27.0 42.9 27.0 16.5 21.6 0.0 0.0 67.0 59.512 2 8.3 0.0 25.0 100.0 16.7 0.0 0.0 0.0 50.0 100.018 6 16.7 33.3 27.8 16.7 16.7 16.7 0.0 0.0 61.1 50.078 39 19.2 30.8 46.2 20.5 25.6 20.5 0.0 0.0 69.2 69.215 24 40.0 37.5 46.7 12.5 13.3 8.3 0.0 0.0 80.0 62.518 4 11.1 50.0 44.4 50.0 22.2 25.0 0.0 0.0 61.1 100.020 3 15.0 0.0 50.0 0.0 25.0 66.7 0.0 0.0 70.0 66.725 8 16.0 12.5 44.0 37.5 36.0 37.5 0.0 0.0 68.0 75.0
115 70 17.4 31.4 51.3 30.0 44.3 40.0 0.9 0.0 87.8 81.438 13 10.5 7.7 68.4 7.7 39.5 46.2 2.6 0.0 94.7 76.977 57 20.8 36.8 42.9 35.1 46.8 38.6 0.0 0.0 84.4 82.52 1 0.0 0.0 0.0 100.0 0.0 0.0 0.0 0.0 0.0 100.0
136 46 18.4 32.6 38.2 30.4 18.4 30.4 0.0 0.0 60.3 73.9
472 202 18.2 30.7 44.1 28.2 24.6 29.2 0.2 0.0 70.8 72.8
N by Sex Cocaine Marijuana Methamphetamine PCP Any DrugOffense M F M F M F M F M F M F
SOURCE: National Institute of Justice
681998 Annual Report
Any Drug Cocaine Marijuana 100ng Marijuana 50ng Opiates Methamphetamine
Percent Positive Percent Positive by Age Percent Positive by Race
20 40 60 80 100% 15–20 21–25 26–30 31–35 36+ Black White Hispanic Other
76 83 78 73 162 175 185 85 1914 33 44 37 74 86 91 20 1
16.1 17.6 16.5 15.5 34.3 37.7 39.9 18.3 4.1
6.9 16.3 21.8 18.3 36.6 43.4 46.0 10.1 0.5
M a l e s 4 7 2
Fe m a l e s 2 0 2
Total Males (N)Total Females (N)
Violent OffenseRobberyAssaultWeaponsOther ViolentProperty OffenseLarceny/TheftBurglaryStolen VehicleOther PropertyDrug OffenseDrug SalesDrug PossessionProstitutionOther Offense
Total
California
MALES
FEMALES
M e t h a m -p h e t a m i n e
70.8 72.4 68.7 70.5 65.8 73.5 80.6 69.7 57.6 47.472.8 50.0 57.6 81.8 67.6 81.1 80.2 73.6 50.0 0.0
18.2 1.3 4.8 14.1 19.2 34.6 42.3 2.7 5.9 0.030.7 0.0 12.1 27.3 37.8 43.2 57.0 12.1 10.0 0.0
44.1 69.7 65.1 46.2 38.4 22.8 48.0 41.6 44.7 36.828.2 21.4 39.4 31.8 27.0 23.0 32.6 28.6 15.0 0.0
3.2 0.0 1.2 1.3 4.1 6.2 4.0 2.2 4.7 0.08.4 7.1 6.1 13.6 2.7 9.5 5.8 11.0 10.0 0.0
24.6 11.8 14.5 28.2 27.4 32.7 7.4 43.2 22.4 10.529.2 42.9 9.1 29.5 29.7 35.1 7.0 50.5 30.0 0.0
0.2 0.0 1.2 0.0 0.0 0.0 0.6 0.0 0.0 0.00.0 0.0 0.0 0.0 0.0 0.0 0.0 0.0 0.0 0.0
19.9 10.5 20.5 19.2 26.0 21.6 19.4 22.7 18.8 5.325.2 14.3 9.1 25.0 27.0 33.8 20.9 33.0 15.0 0.0
Catchment Area:
Q3, Q4 — entire county

Cocaine
M a r i j u a n a
Opiates
Description of the Sample
Self-Reported Drug Information
C ra c k
C o c a i n e
C rack & Cocaine
Marijuana & Cocaine
Opiates & Cocaine
A ny 2 or More Drugs
69
0 20 40 60 80 100% 15–20 21–25 26–30 31–35 36+
12.8 2.6 2.4 10.4 12.3 24.524.0 0.0 9.4 16.3 35.1 33.8
3.0 0.0 6.0 6.4 2.8 1.32.0 0.0 3.0 4.7 2.7 0.0
0.4 0.0 0.0 0.0 1.4 0.60.5 0.0 0.0 0.0 2.7 0.0
2.3 0.0 4.8 6.4 1.4 0.60.5 0.0 3.0 0.0 0.0 0.0
0.2 0.0 0.0 0.0 1.4 0.00.0 0.0 0.0 0.0 0.0 0.0
35.7 25.7 30.4 39.0 40.0 39.534.2 35.7 16.1 27.5 44.4 40.3
Highest Grade Completed
6th Grade or Less7th to 9th Grade10th to 12th GradeAbove 12th Grade
2.5 0.53.8 4.3
74.6 72.019.1 23.1
3.4 7.986.2 85.61.5 0.52.1 1.50.2 0.05.3 3.51.3 1.0
Males FemalesType of Place in Prior 30 Days
Public HousingPrivate House or ApartmentShelterIncarceration FacilityTreatment FacilityNo Fixed ResidenceOther
Males Females
16.8 45.558.3 29.512.5 14.012.5 11.0
Primary Sourcein Prior 30 Days
Welfare, Social SecurityFull or Part-Time EmploymentOther Legal Illegal or None
Males Females
Current Primary Source of Income of Booked Arrestees (%)
Current Housing Arrangement of Booked Arrestees (%)
Education of Booked Arrestees (%)
Males FemalesN Mean Age N Mean Age Males Females Males Females
Percent Reporting Drug Use in the Past 30 Days, by Age and SexPercent Reporting Use Percent Reporting Use by Age
Age at First Use (for those admitting use) Received Prior Treatment ( % ) Ever Injected Drugs Illegally ( % )
MALES
FEMALES
C ra c k
C o c a i n e
M a r i j u a n a
O p i a t e s
M e t h a m p h e t a m i n e
0 5 10 15 20 25 30 N
Mean Number of Days Used in the Past 30 Days(for those admitting use in the past 30 days)
12.512.9
4.51.0
12.710.3
15.117.6
12.411.5
6048
144
27483
238
12352
0.80.9
1.00.5
0.71.2
8662
20657
1517
1998 Annual Report
457 14.3150 25.0184 19.7407 14.571 22.0
211 19.970 19.1
192 15.880 25.582 21.2
165 15.935 24.598 21.316 19.3
AlcoholCrackCocaineMarijuanaOpiatesMethamphetaminePCP
13.9 11.44.7 10.02.6 1.54.5 0.53.0 5.06.4 8.0
AlcoholCrackCocaineMarijuanaOpiatesMethamphetamine
5.9 5.59.6 13.4
15.5 16.4
CocaineHeroinAmphetamine/Methamphetamine
MALES
FEMALES
0 1 2 3 4 5 6 N
Mean Number of Times Reported Arrested in thePast 12 Months (excludes current offense; for thosetesting positive)
MALES
FEMALES
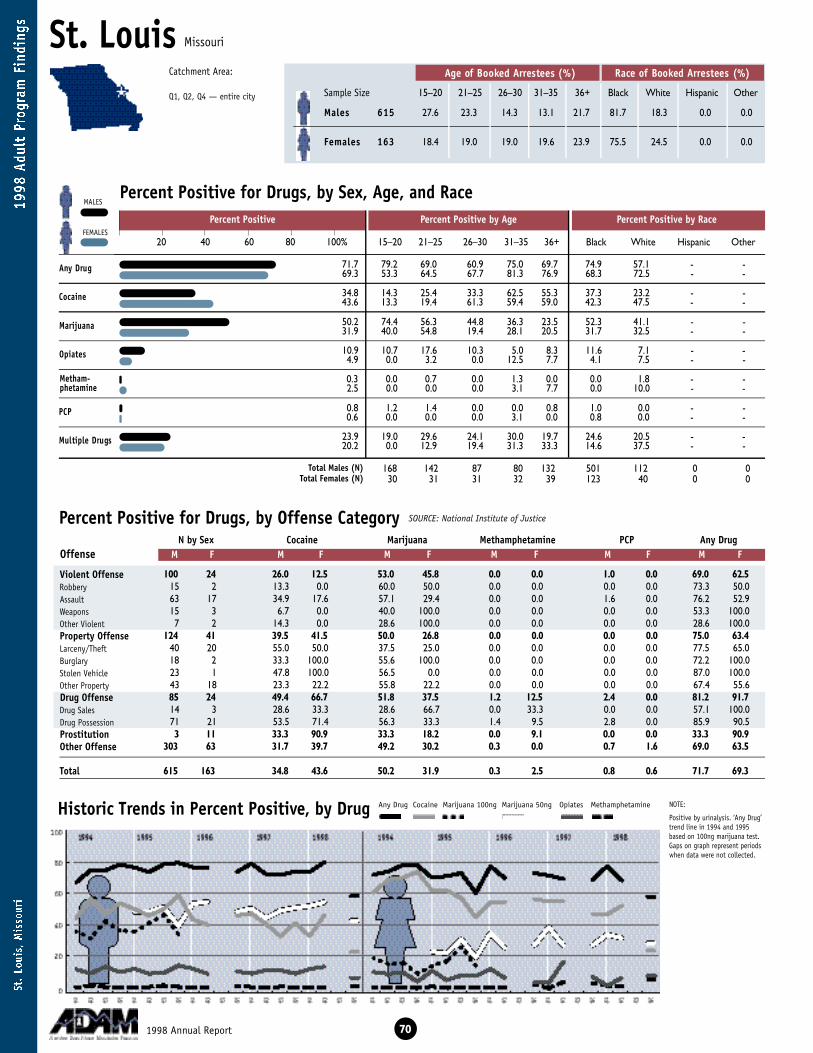
St. LouisAge of Booked Arrestees (%) Race of Booked Arrestees (%)
Sample Size 15–20 21–25 26–30 31–35 36+ Black White Hispanic Other
Percent Positive for Drugs, by Sex, Age, and Race
Percent Positive for Drugs, by Offense Category
Historic Trends in Percent Positive, by Drug
A ny Drug
C o c a i n e
M a r i j u a n a
O p i a t e s
P C P
Multiple Drugs
NOTE:
Positive by urinalysis. ‘Any Drug’trend line in 1994 and 1995based on 100ng marijuana test.Gaps on graph represent periodswhen data were not collected.
100 24 26.0 12.5 53.0 45.8 0.0 0.0 1.0 0.0 69.0 62.515 2 13.3 0.0 60.0 50.0 0.0 0.0 0.0 0.0 73.3 50.063 17 34.9 17.6 57.1 29.4 0.0 0.0 1.6 0.0 76.2 52.915 3 6.7 0.0 40.0 100.0 0.0 0.0 0.0 0.0 53.3 100.07 2 14.3 0.0 28.6 100.0 0.0 0.0 0.0 0.0 28.6 100.0
124 41 39.5 41.5 50.0 26.8 0.0 0.0 0.0 0.0 75.0 63.440 20 55.0 50.0 37.5 25.0 0.0 0.0 0.0 0.0 77.5 65.018 2 33.3 100.0 55.6 100.0 0.0 0.0 0.0 0.0 72.2 100.023 1 47.8 100.0 56.5 0.0 0.0 0.0 0.0 0.0 87.0 100.043 18 23.3 22.2 55.8 22.2 0.0 0.0 0.0 0.0 67.4 55.685 24 49.4 66.7 51.8 37.5 1.2 12.5 2.4 0.0 81.2 91.714 3 28.6 33.3 28.6 66.7 0.0 33.3 0.0 0.0 57.1 100.071 21 53.5 71.4 56.3 33.3 1.4 9.5 2.8 0.0 85.9 90.53 11 33.3 90.9 33.3 18.2 0.0 9.1 0.0 0.0 33.3 90.9
303 63 31.7 39.7 49.2 30.2 0.3 0.0 0.7 1.6 69.0 63.5
615 163 34.8 43.6 50.2 31.9 0.3 2.5 0.8 0.6 71.7 69.3
N by Sex Cocaine Marijuana Methamphetamine PCP Any DrugOffense M F M F M F M F M F M F
SOURCE: National Institute of Justice
701998 Annual Report
Any Drug Cocaine Marijuana 100ng Marijuana 50ng Opiates Methamphetamine
Percent Positive Percent Positive by Age Percent Positive by Race
20 40 60 80 100% 15–20 21–25 26–30 31–35 36+ Black White Hispanic Other
168 142 87 80 132 501 112 0 030 31 31 32 39 123 40 0 0
27.6 23.3 14.3 13.1 21.7 81.7 18.3 0.0 0.0
18.4 19.0 19.0 19.6 23.9 75.5 24.5 0.0 0.0
M a l e s 6 1 5
Fe m a l e s 1 6 3
Total Males (N)Total Females (N)
Violent OffenseRobberyAssaultWeaponsOther ViolentProperty OffenseLarceny/TheftBurglaryStolen VehicleOther PropertyDrug OffenseDrug SalesDrug PossessionProstitutionOther Offense
Total
Missouri
MALES
FEMALES
M e t h a m -p h e t a m i n e
71.7 79.2 69.0 60.9 75.0 69.7 74.9 57.1 - -69.3 53.3 64.5 67.7 81.3 76.9 68.3 72.5 - -
34.8 14.3 25.4 33.3 62.5 55.3 37.3 23.2 - -43.6 13.3 19.4 61.3 59.4 59.0 42.3 47.5 - -
50.2 74.4 56.3 44.8 36.3 23.5 52.3 41.1 - -31.9 40.0 54.8 19.4 28.1 20.5 31.7 32.5 - -
10.9 10.7 17.6 10.3 5.0 8.3 11.6 7.1 - -4.9 0.0 3.2 0.0 12.5 7.7 4.1 7.5 - -
0.3 0.0 0.7 0.0 1.3 0.0 0.0 1.8 - -2.5 0.0 0.0 0.0 3.1 7.7 0.0 10.0 - -
0.8 1.2 1.4 0.0 0.0 0.8 1.0 0.0 - -0.6 0.0 0.0 0.0 3.1 0.0 0.8 0.0 - -
23.9 19.0 29.6 24.1 30.0 19.7 24.6 20.5 - -20.2 0.0 12.9 19.4 31.3 33.3 14.6 37.5 - -
Catchment Area:
Q1, Q2, Q4 — entire city

Cocaine
M a r i j u a n a
Opiates
Description of the Sample
Self-Reported Drug Information
C ra c k
C o c a i n e
C rack & Cocaine
Marijuana & Cocaine
Opiates & Cocaine
A ny 2 or More Drugs
71
0 20 40 60 80 100% 15–20 21–25 26–30 31–35 36+
17.4 3.0 7.7 14.0 35.0 38.632.5 13.3 6.5 41.9 53.1 43.6
5.9 2.4 8.5 5.7 7.5 6.88.0 3.3 9.7 12.9 6.3 7.7
2.9 1.8 2.1 3.4 3.8 4.56.7 3.3 3.2 12.9 6.3 7.7
4.1 2.4 7.7 5.7 2.5 2.35.5 3.3 6.5 9.7 6.3 2.6
2.6 0.6 4.2 2.3 2.5 3.84.9 3.3 6.5 6.5 3.1 5.1
20.5 13.8 19.3 16.5 33.8 25.825.2 13.3 12.9 35.5 31.3 30.8
Highest Grade Completed
6th Grade or Less7th to 9th Grade10th to 12th GradeAbove 12th Grade
0.7 0.04.7 6.1
83.8 79.710.9 14.2
6.3 3.187.6 92.61.8 1.21.6 1.80.5 0.01.8 1.20.3 0.0
Males FemalesType of Place in Prior 30 Days
Public HousingPrivate House or ApartmentShelterIncarceration FacilityTreatment FacilityNo Fixed ResidenceOther
Males Females
9.3 28.468.9 49.412.4 9.99.4 12.3
Primary Sourcein Prior 30 Days
Welfare, Social SecurityFull or Part-Time EmploymentOther Legal Illegal or None
Males Females
Current Primary Source of Income of Booked Arrestees (%)
Current Housing Arrangement of Booked Arrestees (%)
Education of Booked Arrestees (%)
Males FemalesN Mean Age N Mean Age Males Females Males Females
Percent Reporting Drug Use in the Past 30 Days, by Age and SexPercent Reporting Use Percent Reporting Use by Age
Age at First Use (for those admitting use) Received Prior Treatment ( % ) Ever Injected Drugs Illegally ( % )
MALES
FEMALES
C ra c k
C o c a i n e
M a r i j u a n a
O p i a t e s
M e t h a m p h e t a m i n e
0 5 10 15 20 25 30 N
Mean Number of Days Used in the Past 30 Days(for those admitting use in the past 30 days)
12.412.9
9.96.9
14.311.3
17.512.2
7.59.6
10753
3613
34468
5518
85
1.41.3
1.50.8
1.10.6
21370
30852
678
1998 Annual Report
587 14.6181 25.7148 21.0529 15.1114 21.448 19.785 19.1
148 15.974 24.849 20.4
136 15.732 23.918 23.721 18.3
AlcoholCrackCocaineMarijuanaOpiatesMethamphetaminePCP
14.3 16.09.6 19.63.9 6.89.0 9.84.6 6.81.3 3.1
AlcoholCrackCocaineMarijuanaOpiatesMethamphetamine
6.0 11.06.7 9.22.3 4.3
CocaineHeroinAmphetamine/Methamphetamine
MALES
FEMALES
0 1 2 3 4 5 6 N
Mean Number of Times Reported Arrested in thePast 12 Months (excludes current offense; for thosetesting positive)
MALES
FEMALES
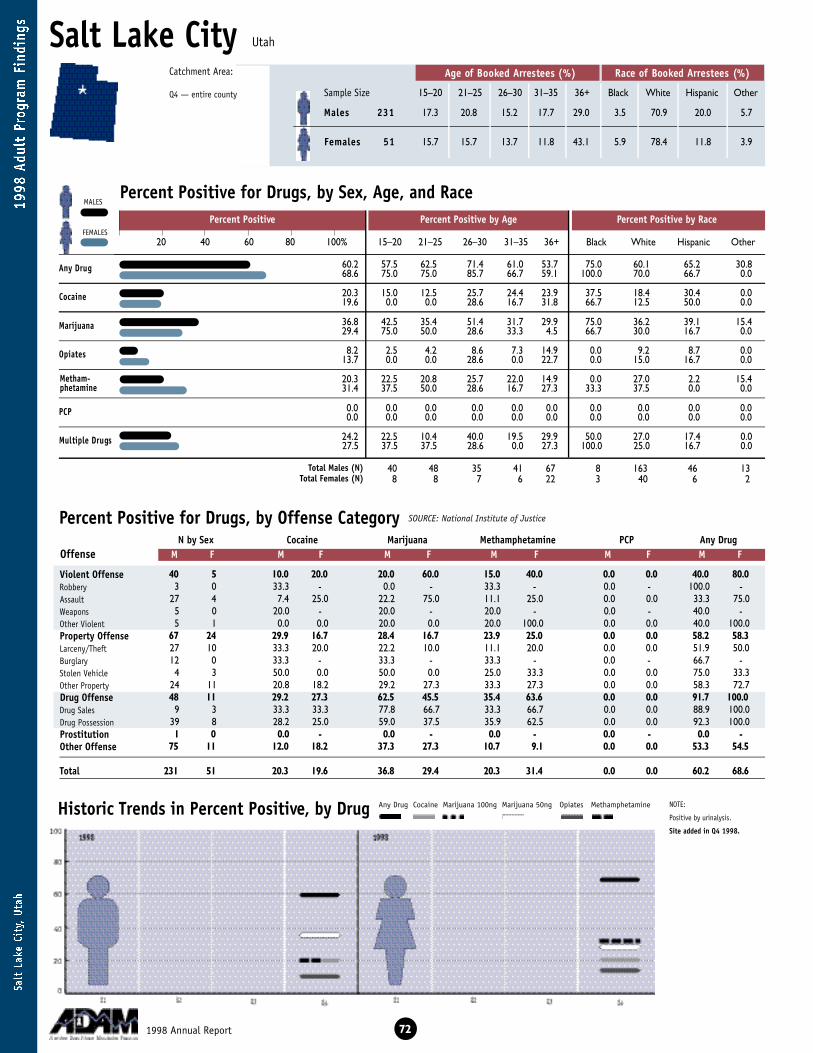
Salt Lake City
Percent Positive for Drugs, by Sex, Age, and Race
Percent Positive for Drugs, by Offense Category
Historic Trends in Percent Positive, by Drug
A ny Drug
C o c a i n e
M a r i j u a n a
O p i a t e s
P C P
Multiple Drugs
NOTE:
Positive by urinalysis.
Site added in Q4 1998.
40 5 10.0 20.0 20.0 60.0 15.0 40.0 0.0 0.0 40.0 80.03 0 33.3 - 0.0 - 33.3 - 0.0 - 100.0 -
27 4 7.4 25.0 22.2 75.0 11.1 25.0 0.0 0.0 33.3 75.05 0 20.0 - 20.0 - 20.0 - 0.0 - 40.0 -5 1 0.0 0.0 20.0 0.0 20.0 100.0 0.0 0.0 40.0 100.0
67 24 29.9 16.7 28.4 16.7 23.9 25.0 0.0 0.0 58.2 58.327 10 33.3 20.0 22.2 10.0 11.1 20.0 0.0 0.0 51.9 50.012 0 33.3 - 33.3 - 33.3 - 0.0 - 66.7 -4 3 50.0 0.0 50.0 0.0 25.0 33.3 0.0 0.0 75.0 33.3
24 11 20.8 18.2 29.2 27.3 33.3 27.3 0.0 0.0 58.3 72.748 11 29.2 27.3 62.5 45.5 35.4 63.6 0.0 0.0 91.7 100.0
9 3 33.3 33.3 77.8 66.7 33.3 66.7 0.0 0.0 88.9 100.039 8 28.2 25.0 59.0 37.5 35.9 62.5 0.0 0.0 92.3 100.01 0 0.0 - 0.0 - 0.0 - 0.0 - 0.0 -
75 11 12.0 18.2 37.3 27.3 10.7 9.1 0.0 0.0 53.3 54.5
231 51 20.3 19.6 36.8 29.4 20.3 31.4 0.0 0.0 60.2 68.6
N by Sex Cocaine Marijuana Methamphetamine PCP Any DrugOffense M F M F M F M F M F M F
SOURCE: National Institute of Justice
721998 Annual Report
Any Drug Cocaine Marijuana 100ng Marijuana 50ng Opiates Methamphetamine
Percent Positive Percent Positive by Age Percent Positive by Race
20 40 60 80 100% 15–20 21–25 26–30 31–35 36+ Black White Hispanic Other
40 48 35 41 67 8 163 46 138 8 7 6 22 3 40 6 2
17.3 20.8 15.2 17.7 29.0 3.5 70.9 20.0 5.7
15.7 15.7 13.7 11.8 43.1 5.9 78.4 11.8 3.9
M a l e s 2 3 1
Fe m a l e s 5 1
Total Males (N)Total Females (N)
Violent OffenseRobberyAssaultWeaponsOther ViolentProperty OffenseLarceny/TheftBurglaryStolen VehicleOther PropertyDrug OffenseDrug SalesDrug PossessionProstitutionOther Offense
Total
Utah
MALES
FEMALES
M e t h a m -p h e t a m i n e
60.2 57.5 62.5 71.4 61.0 53.7 75.0 60.1 65.2 30.868.6 75.0 75.0 85.7 66.7 59.1 100.0 70.0 66.7 0.0
20.3 15.0 12.5 25.7 24.4 23.9 37.5 18.4 30.4 0.019.6 0.0 0.0 28.6 16.7 31.8 66.7 12.5 50.0 0.0
36.8 42.5 35.4 51.4 31.7 29.9 75.0 36.2 39.1 15.429.4 75.0 50.0 28.6 33.3 4.5 66.7 30.0 16.7 0.0
8.2 2.5 4.2 8.6 7.3 14.9 0.0 9.2 8.7 0.013.7 0.0 0.0 28.6 0.0 22.7 0.0 15.0 16.7 0.0
20.3 22.5 20.8 25.7 22.0 14.9 0.0 27.0 2.2 15.431.4 37.5 50.0 28.6 16.7 27.3 33.3 37.5 0.0 0.0
0.0 0.0 0.0 0.0 0.0 0.0 0.0 0.0 0.0 0.00.0 0.0 0.0 0.0 0.0 0.0 0.0 0.0 0.0 0.0
24.2 22.5 10.4 40.0 19.5 29.9 50.0 27.0 17.4 0.027.5 37.5 37.5 28.6 0.0 27.3 100.0 25.0 16.7 0.0
Catchment Area:
Q4 — entire county
Age of Booked Arrestees (%) Race of Booked Arrestees (%)
Sample Size 15–20 21–25 26–30 31–35 36+ Black White Hispanic Other
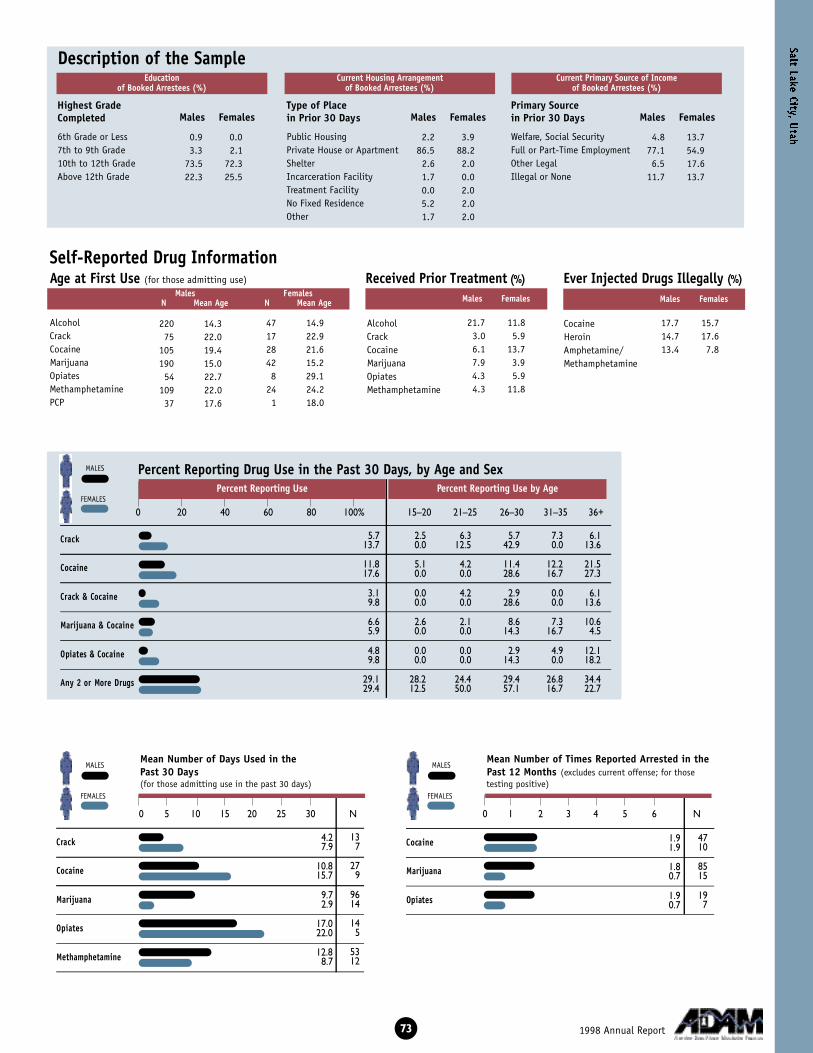
C ra c k
C o c a i n e
C rack & Cocaine
Marijuana & Cocaine
Opiates & Cocaine
A ny 2 or More Drugs
Cocaine
M a r i j u a n a
Opiates
Description of the Sample
Self-Reported Drug Information
73
0 20 40 60 80 100% 15–20 21–25 26–30 31–35 36+
5.7 2.5 6.3 5.7 7.3 6.113.7 0.0 12.5 42.9 0.0 13.6
11.8 5.1 4.2 11.4 12.2 21.517.6 0.0 0.0 28.6 16.7 27.3
3.1 0.0 4.2 2.9 0.0 6.19.8 0.0 0.0 28.6 0.0 13.6
6.6 2.6 2.1 8.6 7.3 10.65.9 0.0 0.0 14.3 16.7 4.5
4.8 0.0 0.0 2.9 4.9 12.19.8 0.0 0.0 14.3 0.0 18.2
29.1 28.2 24.4 29.4 26.8 34.429.4 12.5 50.0 57.1 16.7 22.7
Highest Grade Completed
6th Grade or Less7th to 9th Grade10th to 12th GradeAbove 12th Grade
0.9 0.03.3 2.1
73.5 72.322.3 25.5
2.2 3.986.5 88.22.6 2.01.7 0.00.0 2.05.2 2.01.7 2.0
Males FemalesType of Place in Prior 30 Days
Public HousingPrivate House or ApartmentShelterIncarceration FacilityTreatment FacilityNo Fixed ResidenceOther
Males Females
4.8 13.777.1 54.96.5 17.6
11.7 13.7
Primary Sourcein Prior 30 Days
Welfare, Social SecurityFull or Part-Time EmploymentOther Legal Illegal or None
Males Females
Current Primary Source of Income of Booked Arrestees (%)
Current Housing Arrangement of Booked Arrestees (%)
Education of Booked Arrestees (%)
Males FemalesN Mean Age N Mean Age Males Females Males Females
Percent Reporting Drug Use in the Past 30 Days, by Age and SexPercent Reporting Use Percent Reporting Use by Age
Age at First Use (for those admitting use) Received Prior Treatment ( % ) Ever Injected Drugs Illegally ( % )
MALES
FEMALES
C ra c k
C o c a i n e
M a r i j u a n a
O p i a t e s
M e t h a m p h e t a m i n e
0 5 10 15 20 25 30 N
Mean Number of Days Used in the Past 30 Days(for those admitting use in the past 30 days)
4.27.9
10.815.7
9.72.9
17.022.0
12.88.7
137
279
9614
145
5312
1.91.9
1.80.7
1.90.7
4710
8515
197
1998 Annual Report
220 14.375 22.0
105 19.4190 15.054 22.7
109 22.037 17.6
47 14.917 22.928 21.642 15.28 29.1
24 24.21 18.0
AlcoholCrackCocaineMarijuanaOpiatesMethamphetaminePCP
21.7 11.83.0 5.96.1 13.77.9 3.94.3 5.94.3 11.8
AlcoholCrackCocaineMarijuanaOpiatesMethamphetamine
17.7 15.714.7 17.613.4 7.8
CocaineHeroinAmphetamine/Methamphetamine
MALES
FEMALES
0 1 2 3 4 5 6 N
Mean Number of Times Reported Arrested in thePast 12 Months (excludes current offense; for thosetesting positive)
MALES
FEMALES
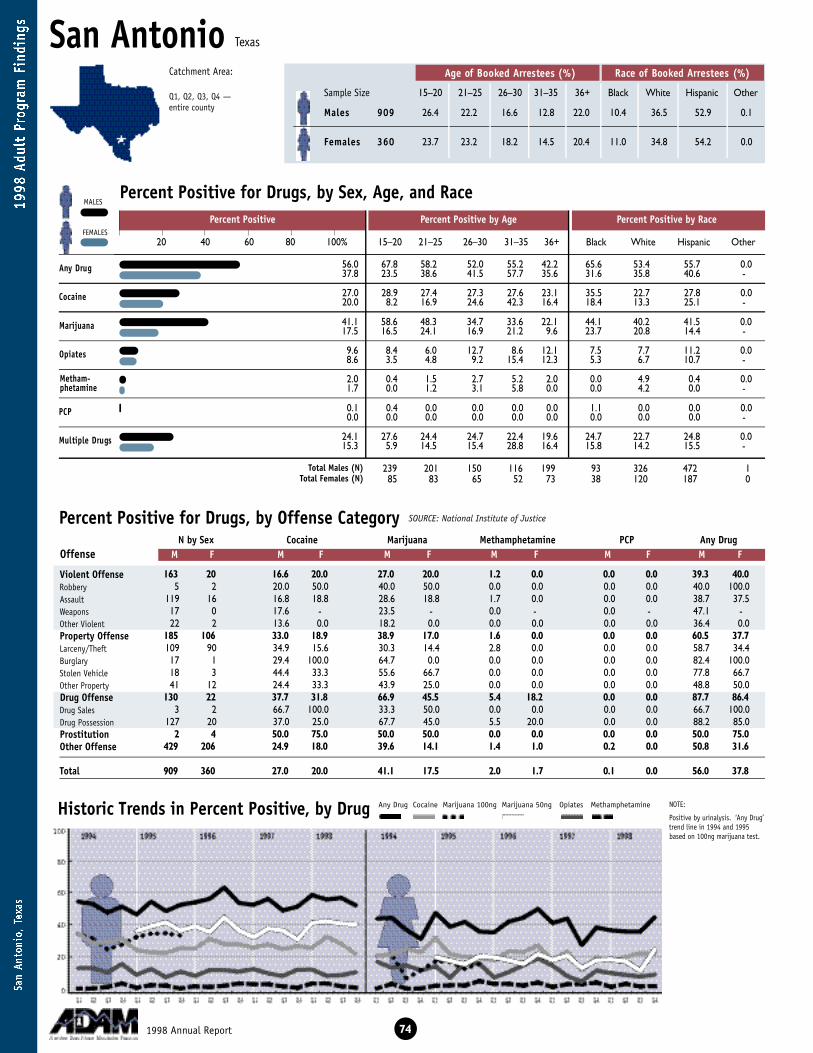
San AntonioAge of Booked Arrestees (%) Race of Booked Arrestees (%)
Sample Size 15–20 21–25 26–30 31–35 36+ Black White Hispanic Other
Percent Positive for Drugs, by Sex, Age, and Race
Percent Positive for Drugs, by Offense Category
Historic Trends in Percent Positive, by Drug
A ny Drug
C o c a i n e
M a r i j u a n a
O p i a t e s
P C P
Multiple Drugs
NOTE:
Positive by urinalysis. ‘Any Drug’trend line in 1994 and 1995based on 100ng marijuana test.
163 20 16.6 20.0 27.0 20.0 1.2 0.0 0.0 0.0 39.3 40.05 2 20.0 50.0 40.0 50.0 0.0 0.0 0.0 0.0 40.0 100.0
119 16 16.8 18.8 28.6 18.8 1.7 0.0 0.0 0.0 38.7 37.517 0 17.6 - 23.5 - 0.0 - 0.0 - 47.1 -22 2 13.6 0.0 18.2 0.0 0.0 0.0 0.0 0.0 36.4 0.0
185 106 33.0 18.9 38.9 17.0 1.6 0.0 0.0 0.0 60.5 37.7109 90 34.9 15.6 30.3 14.4 2.8 0.0 0.0 0.0 58.7 34.417 1 29.4 100.0 64.7 0.0 0.0 0.0 0.0 0.0 82.4 100.018 3 44.4 33.3 55.6 66.7 0.0 0.0 0.0 0.0 77.8 66.741 12 24.4 33.3 43.9 25.0 0.0 0.0 0.0 0.0 48.8 50.0
130 22 37.7 31.8 66.9 45.5 5.4 18.2 0.0 0.0 87.7 86.43 2 66.7 100.0 33.3 50.0 0.0 0.0 0.0 0.0 66.7 100.0
127 20 37.0 25.0 67.7 45.0 5.5 20.0 0.0 0.0 88.2 85.02 4 50.0 75.0 50.0 50.0 0.0 0.0 0.0 0.0 50.0 75.0
429 206 24.9 18.0 39.6 14.1 1.4 1.0 0.2 0.0 50.8 31.6
909 360 27.0 20.0 41.1 17.5 2.0 1.7 0.1 0.0 56.0 37.8
N by Sex Cocaine Marijuana Methamphetamine PCP Any DrugOffense M F M F M F M F M F M F
SOURCE: National Institute of Justice
741998 Annual Report
Any Drug Cocaine Marijuana 100ng Marijuana 50ng Opiates Methamphetamine
Percent Positive Percent Positive by Age Percent Positive by Race
20 40 60 80 100% 15–20 21–25 26–30 31–35 36+ Black White Hispanic Other
239 201 150 116 199 93 326 472 185 83 65 52 73 38 120 187 0
26.4 22.2 16.6 12.8 22.0 10.4 36.5 52.9 0.1
23.7 23.2 18.2 14.5 20.4 11.0 34.8 54.2 0.0
M a l e s 9 0 9
Fe m a l e s 3 6 0
Total Males (N)Total Females (N)
Violent OffenseRobberyAssaultWeaponsOther ViolentProperty OffenseLarceny/TheftBurglaryStolen VehicleOther PropertyDrug OffenseDrug SalesDrug PossessionProstitutionOther Offense
Total
Texas
MALES
FEMALES
M e t h a m -p h e t a m i n e
56.0 67.8 58.2 52.0 55.2 42.2 65.6 53.4 55.7 0.037.8 23.5 38.6 41.5 57.7 35.6 31.6 35.8 40.6 -
27.0 28.9 27.4 27.3 27.6 23.1 35.5 22.7 27.8 0.020.0 8.2 16.9 24.6 42.3 16.4 18.4 13.3 25.1 -
41.1 58.6 48.3 34.7 33.6 22.1 44.1 40.2 41.5 0.017.5 16.5 24.1 16.9 21.2 9.6 23.7 20.8 14.4 -
9.6 8.4 6.0 12.7 8.6 12.1 7.5 7.7 11.2 0.08.6 3.5 4.8 9.2 15.4 12.3 5.3 6.7 10.7 -
2.0 0.4 1.5 2.7 5.2 2.0 0.0 4.9 0.4 0.01.7 0.0 1.2 3.1 5.8 0.0 0.0 4.2 0.0 -
0.1 0.4 0.0 0.0 0.0 0.0 1.1 0.0 0.0 0.00.0 0.0 0.0 0.0 0.0 0.0 0.0 0.0 0.0 -
24.1 27.6 24.4 24.7 22.4 19.6 24.7 22.7 24.8 0.015.3 5.9 14.5 15.4 28.8 16.4 15.8 14.2 15.5 -
Catchment Area:
Q1, Q2, Q3, Q4 — entire county

Cocaine
M a r i j u a n a
Opiates
Description of the Sample
Self-Reported Drug Information
C ra c k
C o c a i n e
C rack & Cocaine
Marijuana & Cocaine
Opiates & Cocaine
A ny 2 or More Drugs
75
0 20 40 60 80 100% 15–20 21–25 26–30 31–35 36+
4.4 3.3 2.0 4.0 5.2 8.01.9 0.0 1.2 4.6 1.9 2.8
14.6 16.3 17.4 14.7 12.1 11.611.7 10.6 9.6 4.6 26.9 9.6
2.3 1.7 1.5 3.3 1.7 3.51.1 0.0 1.2 1.5 1.9 1.4
10.3 12.6 13.9 10.0 4.3 8.05.8 7.1 7.2 1.5 7.7 5.5
3.7 2.5 5.5 6.0 1.7 3.04.2 3.5 2.4 1.5 13.5 2.7
15.1 17.6 17.9 14.8 10.3 12.611.4 8.3 10.8 7.7 28.8 6.8
Highest Grade Completed
6th Grade or Less7th to 9th Grade10th to 12th GradeAbove 12th Grade
5.1 5.48.6 6.9
72.6 74.413.7 13.2
11.1 12.883.4 85.60.8 0.00.2 0.00.1 0.04.0 1.10.4 0.6
Males FemalesType of Place in Prior 30 Days
Public HousingPrivate House or ApartmentShelterIncarceration FacilityTreatment FacilityNo Fixed ResidenceOther
Males Females
3.9 17.177.6 49.07.2 18.5
11.4 15.4
Primary Sourcein Prior 30 Days
Welfare, Social SecurityFull or Part-Time EmploymentOther Legal Illegal or None
Males Females
Current Primary Source of Income of Booked Arrestees (%)
Current Housing Arrangement of Booked Arrestees (%)
Education of Booked Arrestees (%)
Males FemalesN Mean Age N Mean Age Males Females Males Females
Percent Reporting Drug Use in the Past 30 Days, by Age and SexPercent Reporting Use Percent Reporting Use by Age
Age at First Use (for those admitting use) Received Prior Treatment ( % ) Ever Injected Drugs Illegally ( % )
MALES
FEMALES
C ra c k
C o c a i n e
M a r i j u a n a
O p i a t e s
M e t h a m p h e t a m i n e
0 5 10 15 20 25 30 N
Mean Number of Days Used in the Past 30 Days(for those admitting use in the past 30 days)
8.36.6
8.311.5
12.47.8
19.320.3
8.85.5
407
13342
33772
5824
104
0.80.8
0.60.4
1.00.9
24472
37363
8731
1998 Annual Report
850 15.1105 22.5279 18.9582 15.0120 19.462 19.328 18.7
299 17.422 24.098 20.5
175 15.833 22.018 21.27 18.3
AlcoholCrackCocaineMarijuanaOpiatesMethamphetaminePCP
4.0 1.90.9 0.02.6 1.71.9 0.33.4 1.90.7 0.0
AlcoholCrackCocaineMarijuanaOpiatesMethamphetamine
7.2 7.58.7 8.32.6 1.1
CocaineHeroinAmphetamine/Methamphetamine
MALES
FEMALES
0 1 2 3 4 5 6 N
Mean Number of Times Reported Arrested in thePast 12 Months (excludes current offense; for thosetesting positive)
MALES
FEMALES
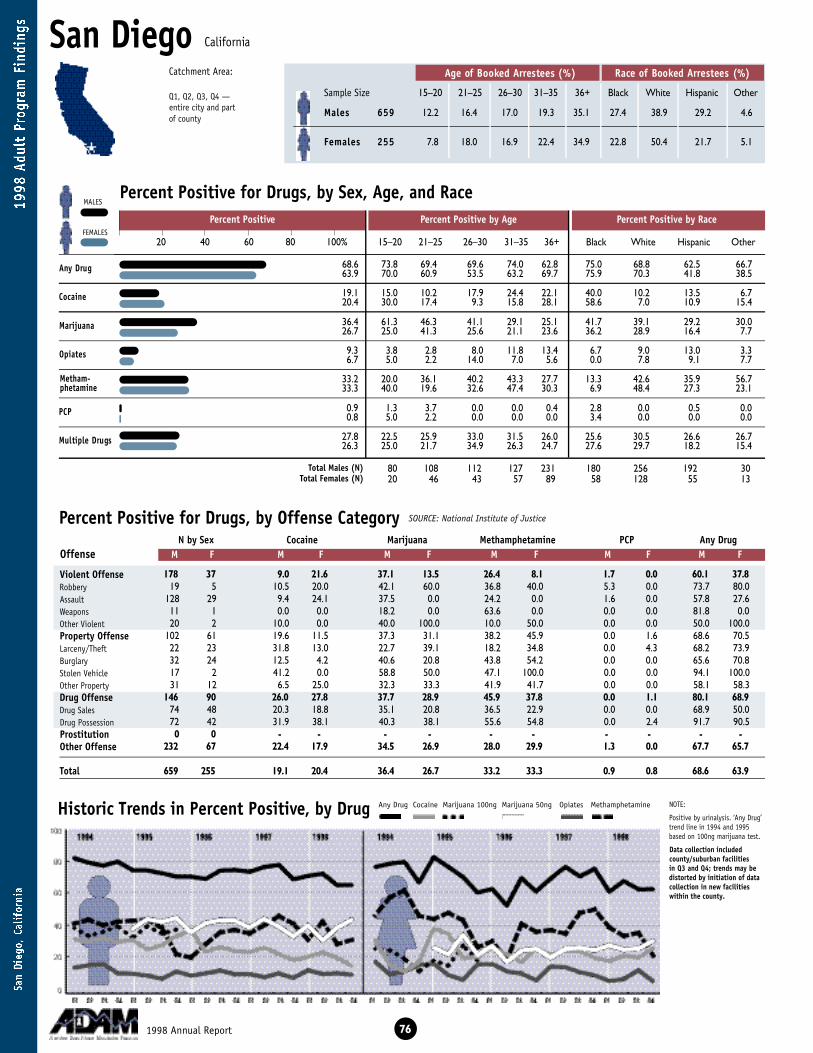
San DiegoAge of Booked Arrestees (%) Race of Booked Arrestees (%)
Sample Size 15–20 21–25 26–30 31–35 36+ Black White Hispanic Other
Percent Positive for Drugs, by Sex, Age, and Race
Percent Positive for Drugs, by Offense Category
Historic Trends in Percent Positive, by Drug
A ny Drug
C o c a i n e
M a r i j u a n a
O p i a t e s
P C P
Multiple Drugs
NOTE:
Positive by urinalysis. ‘Any Drug’trend line in 1994 and 1995based on 100ng marijuana test.
Data collection included county/suburban facilities in Q3 and Q4; trends may bedistorted by initiation of datacollection in new facilitieswithin the county.
178 37 9.0 21.6 37.1 13.5 26.4 8.1 1.7 0.0 60.1 37.819 5 10.5 20.0 42.1 60.0 36.8 40.0 5.3 0.0 73.7 80.0
128 29 9.4 24.1 37.5 0.0 24.2 0.0 1.6 0.0 57.8 27.611 1 0.0 0.0 18.2 0.0 63.6 0.0 0.0 0.0 81.8 0.020 2 10.0 0.0 40.0 100.0 10.0 50.0 0.0 0.0 50.0 100.0
102 61 19.6 11.5 37.3 31.1 38.2 45.9 0.0 1.6 68.6 70.522 23 31.8 13.0 22.7 39.1 18.2 34.8 0.0 4.3 68.2 73.932 24 12.5 4.2 40.6 20.8 43.8 54.2 0.0 0.0 65.6 70.817 2 41.2 0.0 58.8 50.0 47.1 100.0 0.0 0.0 94.1 100.031 12 6.5 25.0 32.3 33.3 41.9 41.7 0.0 0.0 58.1 58.3
146 90 26.0 27.8 37.7 28.9 45.9 37.8 0.0 1.1 80.1 68.974 48 20.3 18.8 35.1 20.8 36.5 22.9 0.0 0.0 68.9 50.072 42 31.9 38.1 40.3 38.1 55.6 54.8 0.0 2.4 91.7 90.50 0 - - - - - - - - - -
232 67 22.4 17.9 34.5 26.9 28.0 29.9 1.3 0.0 67.7 65.7
659 255 19.1 20.4 36.4 26.7 33.2 33.3 0.9 0.8 68.6 63.9
N by Sex Cocaine Marijuana Methamphetamine PCP Any DrugOffense M F M F M F M F M F M F
SOURCE: National Institute of Justice
761998 Annual Report
Any Drug Cocaine Marijuana 100ng Marijuana 50ng Opiates Methamphetamine
Percent Positive Percent Positive by Age Percent Positive by Race
20 40 60 80 100% 15–20 21–25 26–30 31–35 36+ Black White Hispanic Other
80 108 112 127 231 180 256 192 3020 46 43 57 89 58 128 55 13
12.2 16.4 17.0 19.3 35.1 27.4 38.9 29.2 4.6
7.8 18.0 16.9 22.4 34.9 22.8 50.4 21.7 5.1
M a l e s 6 5 9
Fe m a l e s 2 5 5
Total Males (N)Total Females (N)
Violent OffenseRobberyAssaultWeaponsOther ViolentProperty OffenseLarceny/TheftBurglaryStolen VehicleOther PropertyDrug OffenseDrug SalesDrug PossessionProstitutionOther Offense
Total
California
MALES
FEMALES
M e t h a m -p h e t a m i n e
68.6 73.8 69.4 69.6 74.0 62.8 75.0 68.8 62.5 66.763.9 70.0 60.9 53.5 63.2 69.7 75.9 70.3 41.8 38.5
19.1 15.0 10.2 17.9 24.4 22.1 40.0 10.2 13.5 6.720.4 30.0 17.4 9.3 15.8 28.1 58.6 7.0 10.9 15.4
36.4 61.3 46.3 41.1 29.1 25.1 41.7 39.1 29.2 30.026.7 25.0 41.3 25.6 21.1 23.6 36.2 28.9 16.4 7.7
9.3 3.8 2.8 8.0 11.8 13.4 6.7 9.0 13.0 3.36.7 5.0 2.2 14.0 7.0 5.6 0.0 7.8 9.1 7.7
33.2 20.0 36.1 40.2 43.3 27.7 13.3 42.6 35.9 56.733.3 40.0 19.6 32.6 47.4 30.3 6.9 48.4 27.3 23.1
0.9 1.3 3.7 0.0 0.0 0.4 2.8 0.0 0.5 0.00.8 5.0 2.2 0.0 0.0 0.0 3.4 0.0 0.0 0.0
27.8 22.5 25.9 33.0 31.5 26.0 25.6 30.5 26.6 26.726.3 25.0 21.7 34.9 26.3 24.7 27.6 29.7 18.2 15.4
Catchment Area:
Q1, Q2, Q3, Q4 —entire city and partof county

C ra c k
C o c a i n e
M a r i j u a n a
O p i a t e s
M e t h a m p h e t a m i n e
C ra c k
C o c a i n e
C rack & Cocaine
Marijuana & Cocaine
Opiates & Cocaine
A ny 2 or More Drugs
Cocaine
M a r i j u a n a
Opiates
Description of the Sample
Self-Reported Drug Information
77
0 20 40 60 80 100% 15–20 21–25 26–30 31–35 36+
10.8 6.3 6.5 9.8 11.8 14.315.3 15.0 15.2 4.7 10.5 23.6
6.7 8.9 6.5 8.1 7.1 5.26.3 5.0 4.3 2.3 7.0 9.0
2.7 3.8 1.9 4.5 1.6 2.62.4 0.0 0.0 0.0 0.0 6.7
4.0 6.3 5.6 3.6 3.9 2.64.7 5.0 4.3 2.3 1.8 7.9
3.0 3.8 0.9 4.5 3.1 3.02.7 0.0 0.0 2.3 3.5 4.5
27.9 27.5 26.9 32.7 33.3 23.435.3 35.0 32.6 30.2 36.8 38.2
Highest Grade Completed
6th Grade or Less7th to 9th Grade10th to 12th GradeAbove 12th Grade
3.9 0.83.7 7.2
67.7 55.924.6 36.0
0.8 0.888.6 88.21.4 0.01.4 0.80.8 1.26.2 7.50.9 1.6
Males FemalesType of Place in Prior 30 Days
Public HousingPrivate House or ApartmentShelterIncarceration FacilityTreatment FacilityNo Fixed ResidenceOther
Males Females
7.9 25.963.9 34.914.6 23.913.7 15.3
Primary Sourcein Prior 30 Days
Welfare, Social SecurityFull or Part-Time EmploymentOther Legal Illegal or None
Males Females
Current Primary Source of Income of Booked Arrestees (%)
Current Housing Arrangement of Booked Arrestees (%)
Education of Booked Arrestees (%)
Males FemalesN Mean Age N Mean Age Males Females Males Females
Percent Reporting Drug Use in the Past 30 Days, by Age and SexPercent Reporting Use Percent Reporting Use by Age
Age at First Use (for those admitting use) Received Prior Treatment ( % ) Ever Injected Drugs Illegally ( % )
MALES
FEMALES
0 5 10 15 20 25 30 N
Mean Number of Days Used in the Past 30 Days(for those admitting use in the past 30 days)
12.618.0
9.28.8
13.512.0
17.914.9
14.013.3
7139
4416
258100
4016
16682
0.61.0
0.70.6
0.60.6
12552
24068
6117
1998 Annual Report
645 14.1209 24.8321 19.8564 14.7142 22.6352 21.3156 18.3
244 14.988 24.3
129 19.8208 15.357 23.4
158 21.456 17.3
AlcoholCrackCocaineMarijuanaOpiatesMethamphetaminePCP
11.4 13.74.3 11.43.8 5.94.7 7.15.0 6.7
10.7 18.0
AlcoholCrackCocaineMarijuanaOpiatesMethamphetamine
10.8 10.214.5 15.413.6 16.5
CocaineHeroinAmphetamine/Methamphetamine
MALES
FEMALES
0 1 2 3 4 5 6 N
Mean Number of Times Reported Arrested in thePast 12 Months (excludes current offense; for thosetesting positive)
MALES
FEMALES
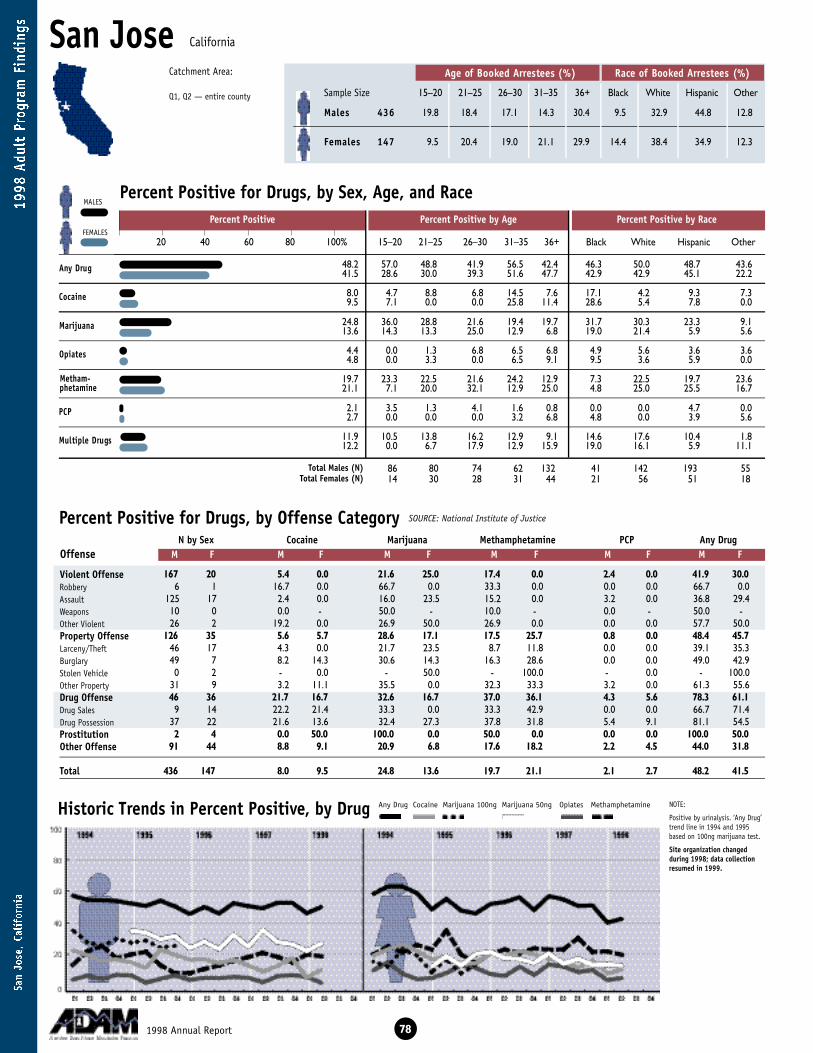
San JoseAge of Booked Arrestees (%) Race of Booked Arrestees (%)
Sample Size 15–20 21–25 26–30 31–35 36+ Black White Hispanic Other
Percent Positive for Drugs, by Sex, Age, and Race
Percent Positive for Drugs, by Offense Category
Historic Trends in Percent Positive, by Drug
A ny Drug
C o c a i n e
M a r i j u a n a
O p i a t e s
P C P
Multiple Drugs
NOTE:
Positive by urinalysis. ‘Any Drug’trend line in 1994 and 1995based on 100ng marijuana test.
Site organization changed during 1998; data collectionresumed in 1999.
167 20 5.4 0.0 21.6 25.0 17.4 0.0 2.4 0.0 41.9 30.06 1 16.7 0.0 66.7 0.0 33.3 0.0 0.0 0.0 66.7 0.0
125 17 2.4 0.0 16.0 23.5 15.2 0.0 3.2 0.0 36.8 29.410 0 0.0 - 50.0 - 10.0 - 0.0 - 50.0 -26 2 19.2 0.0 26.9 50.0 26.9 0.0 0.0 0.0 57.7 50.0
126 35 5.6 5.7 28.6 17.1 17.5 25.7 0.8 0.0 48.4 45.746 17 4.3 0.0 21.7 23.5 8.7 11.8 0.0 0.0 39.1 35.349 7 8.2 14.3 30.6 14.3 16.3 28.6 0.0 0.0 49.0 42.90 2 - 0.0 - 50.0 - 100.0 - 0.0 - 100.0
31 9 3.2 11.1 35.5 0.0 32.3 33.3 3.2 0.0 61.3 55.646 36 21.7 16.7 32.6 16.7 37.0 36.1 4.3 5.6 78.3 61.1
9 14 22.2 21.4 33.3 0.0 33.3 42.9 0.0 0.0 66.7 71.437 22 21.6 13.6 32.4 27.3 37.8 31.8 5.4 9.1 81.1 54.52 4 0.0 50.0 100.0 0.0 50.0 0.0 0.0 0.0 100.0 50.0
91 44 8.8 9.1 20.9 6.8 17.6 18.2 2.2 4.5 44.0 31.8
436 147 8.0 9.5 24.8 13.6 19.7 21.1 2.1 2.7 48.2 41.5
N by Sex Cocaine Marijuana Methamphetamine PCP Any DrugOffense M F M F M F M F M F M F
SOURCE: National Institute of Justice
781998 Annual Report
Any Drug Cocaine Marijuana 100ng Marijuana 50ng Opiates Methamphetamine
Percent Positive Percent Positive by Age Percent Positive by Race
20 40 60 80 100% 15–20 21–25 26–30 31–35 36+ Black White Hispanic Other
86 80 74 62 132 41 142 193 5514 30 28 31 44 21 56 51 18
19.8 18.4 17.1 14.3 30.4 9.5 32.9 44.8 12.8
9.5 20.4 19.0 21.1 29.9 14.4 38.4 34.9 12.3
M a l e s 4 3 6
Fe m a l e s 1 4 7
Total Males (N)Total Females (N)
Violent OffenseRobberyAssaultWeaponsOther ViolentProperty OffenseLarceny/TheftBurglaryStolen VehicleOther PropertyDrug OffenseDrug SalesDrug PossessionProstitutionOther Offense
Total
California
MALES
FEMALES
M e t h a m -p h e t a m i n e
48.2 57.0 48.8 41.9 56.5 42.4 46.3 50.0 48.7 43.641.5 28.6 30.0 39.3 51.6 47.7 42.9 42.9 45.1 22.2
8.0 4.7 8.8 6.8 14.5 7.6 17.1 4.2 9.3 7.39.5 7.1 0.0 0.0 25.8 11.4 28.6 5.4 7.8 0.0
24.8 36.0 28.8 21.6 19.4 19.7 31.7 30.3 23.3 9.113.6 14.3 13.3 25.0 12.9 6.8 19.0 21.4 5.9 5.6
4.4 0.0 1.3 6.8 6.5 6.8 4.9 5.6 3.6 3.64.8 0.0 3.3 0.0 6.5 9.1 9.5 3.6 5.9 0.0
19.7 23.3 22.5 21.6 24.2 12.9 7.3 22.5 19.7 23.621.1 7.1 20.0 32.1 12.9 25.0 4.8 25.0 25.5 16.7
2.1 3.5 1.3 4.1 1.6 0.8 0.0 0.0 4.7 0.02.7 0.0 0.0 0.0 3.2 6.8 4.8 0.0 3.9 5.6
11.9 10.5 13.8 16.2 12.9 9.1 14.6 17.6 10.4 1.812.2 0.0 6.7 17.9 12.9 15.9 19.0 16.1 5.9 11.1
Catchment Area:
Q1, Q2 — entire county
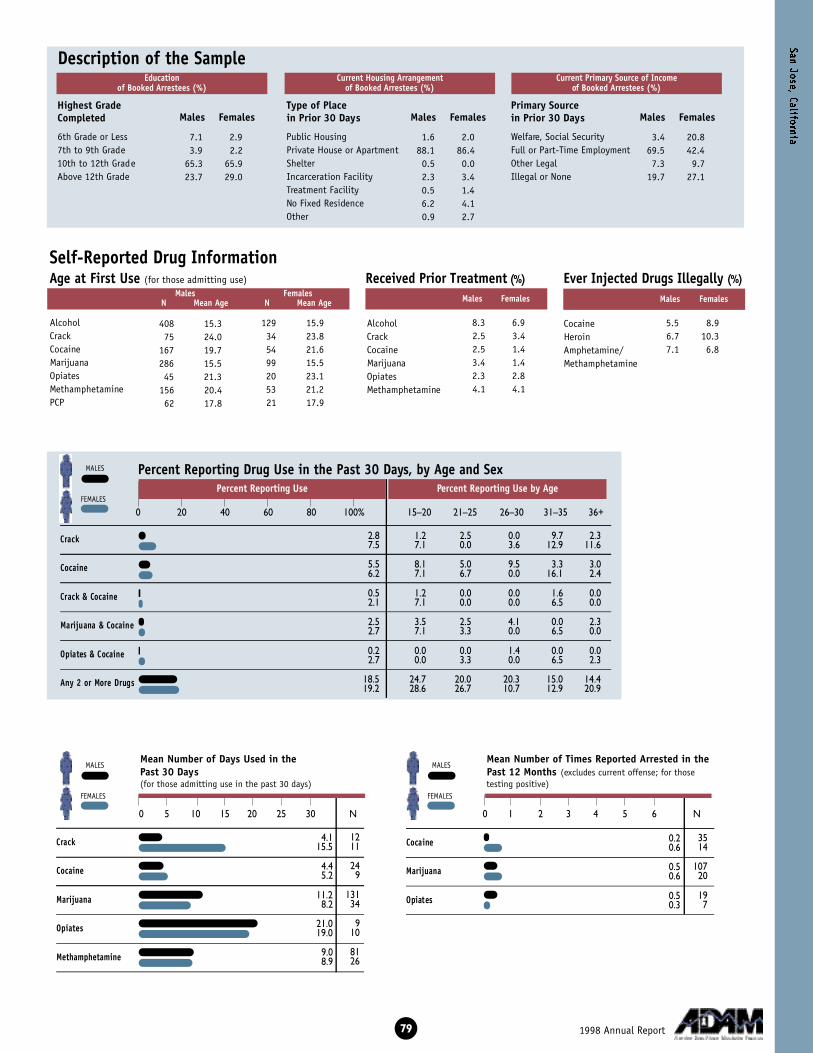
Cocaine
M a r i j u a n a
Opiates
Description of the Sample
Self-Reported Drug Information
C ra c k
C o c a i n e
C rack & Cocaine
Marijuana & Cocaine
Opiates & Cocaine
A ny 2 or More Drugs
79
0 20 40 60 80 100% 15–20 21–25 26–30 31–35 36+
2.8 1.2 2.5 0.0 9.7 2.37.5 7.1 0.0 3.6 12.9 11.6
5.5 8.1 5.0 9.5 3.3 3.06.2 7.1 6.7 0.0 16.1 2.4
0.5 1.2 0.0 0.0 1.6 0.02.1 7.1 0.0 0.0 6.5 0.0
2.5 3.5 2.5 4.1 0.0 2.32.7 7.1 3.3 0.0 6.5 0.0
0.2 0.0 0.0 1.4 0.0 0.02.7 0.0 3.3 0.0 6.5 2.3
18.5 24.7 20.0 20.3 15.0 14.419.2 28.6 26.7 10.7 12.9 20.9
Highest Grade Completed
6th Grade or Less7th to 9th Grade10th to 12th GradeAbove 12th Grade
7.1 2.93.9 2.2
65.3 65.923.7 29.0
1.6 2.088.1 86.40.5 0.02.3 3.40.5 1.46.2 4.10.9 2.7
Males FemalesType of Place in Prior 30 Days
Public HousingPrivate House or ApartmentShelterIncarceration FacilityTreatment FacilityNo Fixed ResidenceOther
Males Females
3.4 20.869.5 42.47.3 9.7
19.7 27.1
Primary Sourcein Prior 30 Days
Welfare, Social SecurityFull or Part-Time EmploymentOther Legal Illegal or None
Males Females
Current Primary Source of Income of Booked Arrestees (%)
Current Housing Arrangement of Booked Arrestees (%)
Education of Booked Arrestees (%)
Males FemalesN Mean Age N Mean Age Males Females Males Females
Percent Reporting Drug Use in the Past 30 Days, by Age and SexPercent Reporting Use Percent Reporting Use by Age
Age at First Use (for those admitting use) Received Prior Treatment ( % ) Ever Injected Drugs Illegally ( % )
MALES
FEMALES
C ra c k
C o c a i n e
M a r i j u a n a
O p i a t e s
M e t h a m p h e t a m i n e
0 5 10 15 20 25 30 N
Mean Number of Days Used in the Past 30 Days(for those admitting use in the past 30 days)
4.115.5
4.45.2
11.28.2
21.019.0
9.08.9
1211
249
13134
910
8126
0.20.6
0.50.6
0.50.3
3514
10720
197
1998 Annual Report
408 15.375 24.0
167 19.7286 15.545 21.3
156 20.462 17.8
129 15.934 23.854 21.699 15.520 23.153 21.221 17.9
AlcoholCrackCocaineMarijuanaOpiatesMethamphetaminePCP
8.3 6.92.5 3.42.5 1.43.4 1.42.3 2.84.1 4.1
AlcoholCrackCocaineMarijuanaOpiatesMethamphetamine
5.5 8.96.7 10.37.1 6.8
CocaineHeroinAmphetamine/Methamphetamine
MALES
FEMALES
0 1 2 3 4 5 6 N
Mean Number of Times Reported Arrested in thePast 12 Months (excludes current offense; for thosetesting positive)
MALES
FEMALES
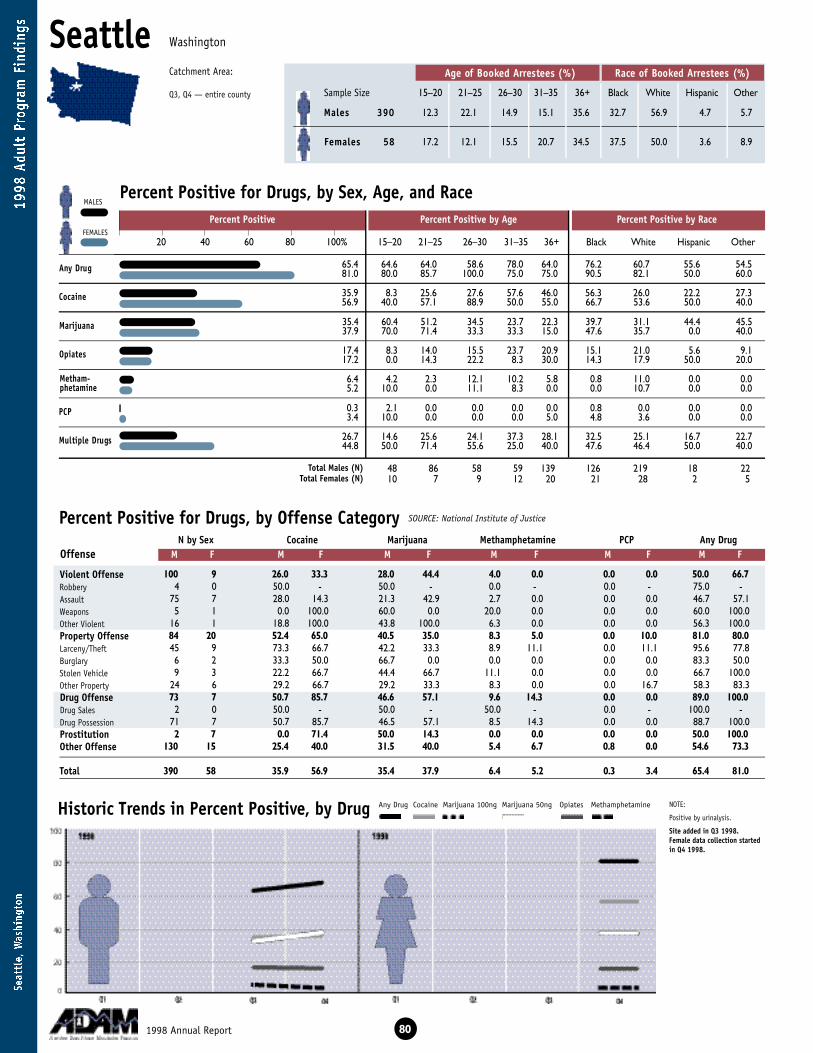
SeattleAge of Booked Arrestees (%) Race of Booked Arrestees (%)
Sample Size 15–20 21–25 26–30 31–35 36+ Black White Hispanic Other
Percent Positive for Drugs, by Sex, Age, and Race
Percent Positive for Drugs, by Offense Category
Historic Trends in Percent Positive, by Drug
A ny Drug
C o c a i n e
M a r i j u a n a
O p i a t e s
P C P
Multiple Drugs
NOTE:
Positive by urinalysis.
Site added in Q3 1998.Female data collection startedin Q4 1998.
100 9 26.0 33.3 28.0 44.4 4.0 0.0 0.0 0.0 50.0 66.74 0 50.0 - 50.0 - 0.0 - 0.0 - 75.0 -
75 7 28.0 14.3 21.3 42.9 2.7 0.0 0.0 0.0 46.7 57.15 1 0.0 100.0 60.0 0.0 20.0 0.0 0.0 0.0 60.0 100.0
16 1 18.8 100.0 43.8 100.0 6.3 0.0 0.0 0.0 56.3 100.084 20 52.4 65.0 40.5 35.0 8.3 5.0 0.0 10.0 81.0 80.045 9 73.3 66.7 42.2 33.3 8.9 11.1 0.0 11.1 95.6 77.86 2 33.3 50.0 66.7 0.0 0.0 0.0 0.0 0.0 83.3 50.09 3 22.2 66.7 44.4 66.7 11.1 0.0 0.0 0.0 66.7 100.0
24 6 29.2 66.7 29.2 33.3 8.3 0.0 0.0 16.7 58.3 83.373 7 50.7 85.7 46.6 57.1 9.6 14.3 0.0 0.0 89.0 100.0
2 0 50.0 - 50.0 - 50.0 - 0.0 - 100.0 -71 7 50.7 85.7 46.5 57.1 8.5 14.3 0.0 0.0 88.7 100.02 7 0.0 71.4 50.0 14.3 0.0 0.0 0.0 0.0 50.0 100.0
130 15 25.4 40.0 31.5 40.0 5.4 6.7 0.8 0.0 54.6 73.3
390 58 35.9 56.9 35.4 37.9 6.4 5.2 0.3 3.4 65.4 81.0
N by Sex Cocaine Marijuana Methamphetamine PCP Any DrugOffense M F M F M F M F M F M F
SOURCE: National Institute of Justice
801998 Annual Report
Any Drug Cocaine Marijuana 100ng Marijuana 50ng Opiates Methamphetamine
Percent Positive Percent Positive by Age Percent Positive by Race
20 40 60 80 100% 15–20 21–25 26–30 31–35 36+ Black White Hispanic Other
48 86 58 59 139 126 219 18 2210 7 9 12 20 21 28 2 5
12.3 22.1 14.9 15.1 35.6 32.7 56.9 4.7 5.7
17.2 12.1 15.5 20.7 34.5 37.5 50.0 3.6 8.9
M a l e s 3 9 0
Fe m a l e s 5 8
Total Males (N)Total Females (N)
Violent OffenseRobberyAssaultWeaponsOther ViolentProperty OffenseLarceny/TheftBurglaryStolen VehicleOther PropertyDrug OffenseDrug SalesDrug PossessionProstitutionOther Offense
Total
Washington
MALES
FEMALES
M e t h a m -p h e t a m i n e
65.4 64.6 64.0 58.6 78.0 64.0 76.2 60.7 55.6 54.581.0 80.0 85.7 100.0 75.0 75.0 90.5 82.1 50.0 60.0
35.9 8.3 25.6 27.6 57.6 46.0 56.3 26.0 22.2 27.356.9 40.0 57.1 88.9 50.0 55.0 66.7 53.6 50.0 40.0
35.4 60.4 51.2 34.5 23.7 22.3 39.7 31.1 44.4 45.537.9 70.0 71.4 33.3 33.3 15.0 47.6 35.7 0.0 40.0
17.4 8.3 14.0 15.5 23.7 20.9 15.1 21.0 5.6 9.117.2 0.0 14.3 22.2 8.3 30.0 14.3 17.9 50.0 20.0
6.4 4.2 2.3 12.1 10.2 5.8 0.8 11.0 0.0 0.05.2 10.0 0.0 11.1 8.3 0.0 0.0 10.7 0.0 0.0
0.3 2.1 0.0 0.0 0.0 0.0 0.8 0.0 0.0 0.03.4 10.0 0.0 0.0 0.0 5.0 4.8 3.6 0.0 0.0
26.7 14.6 25.6 24.1 37.3 28.1 32.5 25.1 16.7 22.744.8 50.0 71.4 55.6 25.0 40.0 47.6 46.4 50.0 40.0
Catchment Area:
Q3, Q4 — entire county

C ra c k
C o c a i n e
C rack & Cocaine
Marijuana & Cocaine
Opiates & Cocaine
A ny 2 or More Drugs
Cocaine
M a r i j u a n a
Opiates
Description of the Sample
Self-Reported Drug Information
81
0 20 40 60 80 100% 15–20 21–25 26–30 31–35 36+
25.2 8.5 8.1 22.4 45.8 33.834.5 0.0 28.6 66.7 25.0 45.0
16.6 10.6 10.6 17.9 25.4 18.117.2 10.0 28.6 44.4 8.3 10.0
8.5 2.1 3.5 8.8 16.9 10.16.9 0.0 0.0 33.3 0.0 5.0
10.4 6.4 7.1 16.1 18.6 8.08.6 10.0 28.6 22.2 0.0 0.0
8.5 6.3 2.4 12.3 13.6 9.410.3 0.0 0.0 33.3 8.3 10.0
33.6 29.8 17.9 36.2 52.6 35.543.1 50.0 57.1 55.6 33.3 35.0
Highest Grade Completed
6th Grade or Less7th to 9th Grade10th to 12th GradeAbove 12th Grade
2.2 3.85.6 11.3
64.1 56.628.1 28.3
3.6 1.883.8 84.22.1 1.81.0 0.00.3 0.07.4 8.81.8 3.5
Males FemalesType of Place in Prior 30 Days
Public HousingPrivate House or ApartmentShelterIncarceration FacilityTreatment FacilityNo Fixed ResidenceOther
Males Females
8.2 20.769.6 34.510.6 17.211.6 27.6
Primary Sourcein Prior 30 Days
Welfare, Social SecurityFull or Part-Time EmploymentOther Legal Illegal or None
Males Females
Current Primary Source of Income of Booked Arrestees (%)
Current Housing Arrangement of Booked Arrestees (%)
Education of Booked Arrestees (%)
Males FemalesN Mean Age N Mean Age Males Females Males Females
Percent Reporting Drug Use in the Past 30 Days, by Age and SexPercent Reporting Use Percent Reporting Use by Age
Age at First Use (for those admitting use) Received Prior Treatment ( % ) Ever Injected Drugs Illegally ( % )
MALES
FEMALES
C ra c k
C o c a i n e
M a r i j u a n a
O p i a t e s
M e t h a m p h e t a m i n e
0 5 10 15 20 25 30 N
Mean Number of Days Used in the Past 30 Days(for those admitting use in the past 30 days)
11.215.4
9.75.6
11.811.0
23.516.0
8.415.5
9820
6410
18027
5711
366
1.61.8
1.31.8
1.42.0
13930
13722
689
1998 Annual Report
361 13.6165 24.8202 20.1317 14.2107 21.7121 20.852 17.7
53 13.633 22.936 19.050 14.425 22.421 18.812 16.7
AlcoholCrackCocaineMarijuanaOpiatesMethamphetaminePCP
27.0 31.09.2 17.29.5 15.58.8 10.38.5 8.92.9 5.2
AlcoholCrackCocaineMarijuanaOpiatesMethamphetamine
21.8 22.422.8 31.012.1 12.1
CocaineHeroinAmphetamine/Methamphetamine
MALES
FEMALES
0 1 2 3 4 5 6 N
Mean Number of Times Reported Arrested in thePast 12 Months (excludes current offense; for thosetesting positive)
MALES
FEMALES
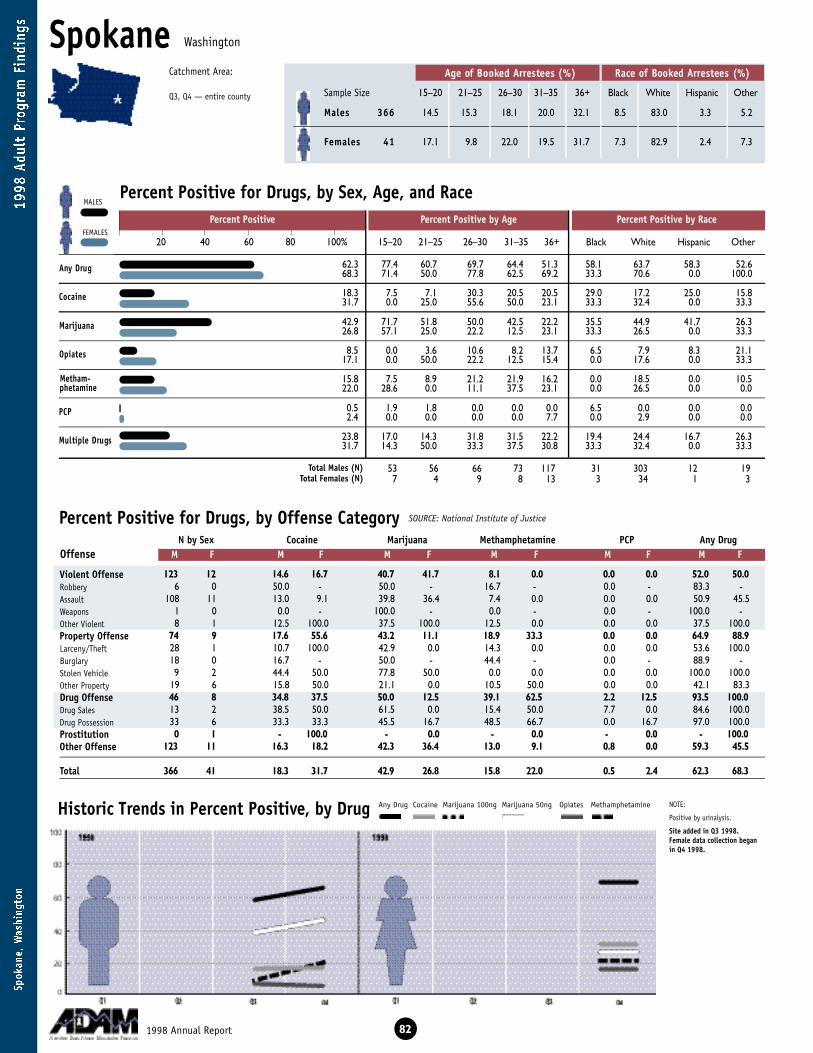
SpokaneAge of Booked Arrestees (%) Race of Booked Arrestees (%)
Sample Size 15–20 21–25 26–30 31–35 36+ Black White Hispanic Other
Percent Positive for Drugs, by Sex, Age, and Race
Percent Positive for Drugs, by Offense Category
Historic Trends in Percent Positive, by Drug
A ny Drug
C o c a i n e
M a r i j u a n a
O p i a t e s
P C P
Multiple Drugs
NOTE:
Positive by urinalysis.
Site added in Q3 1998.Female data collection beganin Q4 1998.
123 12 14.6 16.7 40.7 41.7 8.1 0.0 0.0 0.0 52.0 50.06 0 50.0 - 50.0 - 16.7 - 0.0 - 83.3 -
108 11 13.0 9.1 39.8 36.4 7.4 0.0 0.0 0.0 50.9 45.51 0 0.0 - 100.0 - 0.0 - 0.0 - 100.0 -8 1 12.5 100.0 37.5 100.0 12.5 0.0 0.0 0.0 37.5 100.0
74 9 17.6 55.6 43.2 11.1 18.9 33.3 0.0 0.0 64.9 88.928 1 10.7 100.0 42.9 0.0 14.3 0.0 0.0 0.0 53.6 100.018 0 16.7 - 50.0 - 44.4 - 0.0 - 88.9 -9 2 44.4 50.0 77.8 50.0 0.0 0.0 0.0 0.0 100.0 100.0
19 6 15.8 50.0 21.1 0.0 10.5 50.0 0.0 0.0 42.1 83.346 8 34.8 37.5 50.0 12.5 39.1 62.5 2.2 12.5 93.5 100.013 2 38.5 50.0 61.5 0.0 15.4 50.0 7.7 0.0 84.6 100.033 6 33.3 33.3 45.5 16.7 48.5 66.7 0.0 16.7 97.0 100.00 1 - 100.0 - 0.0 - 0.0 - 0.0 - 100.0
123 11 16.3 18.2 42.3 36.4 13.0 9.1 0.8 0.0 59.3 45.5
366 41 18.3 31.7 42.9 26.8 15.8 22.0 0.5 2.4 62.3 68.3
N by Sex Cocaine Marijuana Methamphetamine PCP Any DrugOffense M F M F M F M F M F M F
SOURCE: National Institute of Justice
821998 Annual Report
Any Drug Cocaine Marijuana 100ng Marijuana 50ng Opiates Methamphetamine
Percent Positive Percent Positive by Age Percent Positive by Race
20 40 60 80 100% 15–20 21–25 26–30 31–35 36+ Black White Hispanic Other
53 56 66 73 117 31 303 12 197 4 9 8 13 3 34 1 3
14.5 15.3 18.1 20.0 32.1 8.5 83.0 3.3 5.2
17.1 9.8 22.0 19.5 31.7 7.3 82.9 2.4 7.3
M a l e s 3 6 6
Fe m a l e s 4 1
Total Males (N)Total Females (N)
Violent OffenseRobberyAssaultWeaponsOther ViolentProperty OffenseLarceny/TheftBurglaryStolen VehicleOther PropertyDrug OffenseDrug SalesDrug PossessionProstitutionOther Offense
Total
Washington
MALES
FEMALES
M e t h a m -p h e t a m i n e
62.3 77.4 60.7 69.7 64.4 51.3 58.1 63.7 58.3 52.668.3 71.4 50.0 77.8 62.5 69.2 33.3 70.6 0.0 100.0
18.3 7.5 7.1 30.3 20.5 20.5 29.0 17.2 25.0 15.831.7 0.0 25.0 55.6 50.0 23.1 33.3 32.4 0.0 33.3
42.9 71.7 51.8 50.0 42.5 22.2 35.5 44.9 41.7 26.326.8 57.1 25.0 22.2 12.5 23.1 33.3 26.5 0.0 33.3
8.5 0.0 3.6 10.6 8.2 13.7 6.5 7.9 8.3 21.117.1 0.0 50.0 22.2 12.5 15.4 0.0 17.6 0.0 33.3
15.8 7.5 8.9 21.2 21.9 16.2 0.0 18.5 0.0 10.522.0 28.6 0.0 11.1 37.5 23.1 0.0 26.5 0.0 0.0
0.5 1.9 1.8 0.0 0.0 0.0 6.5 0.0 0.0 0.02.4 0.0 0.0 0.0 0.0 7.7 0.0 2.9 0.0 0.0
23.8 17.0 14.3 31.8 31.5 22.2 19.4 24.4 16.7 26.331.7 14.3 50.0 33.3 37.5 30.8 33.3 32.4 0.0 33.3
Catchment Area:
Q3, Q4 — entire county

C ra c k
C o c a i n e
C rack & Cocaine
Marijuana & Cocaine
Opiates & Cocaine
A ny 2 or More Drugs
Cocaine
M a r i j u a n a
Opiates
Description of the Sample
Self-Reported Drug Information
83
0 20 40 60 80 100% 15–20 21–25 26–30 31–35 36+
21.7 5.7 12.7 35.4 26.0 23.129.3 14.3 25.0 44.4 37.5 23.1
9.1 5.7 5.6 10.8 13.9 8.612.2 0.0 0.0 22.2 25.0 7.7
5.8 1.9 3.6 9.2 8.2 5.19.8 0.0 0.0 22.2 12.5 7.7
8.3 5.7 5.6 9.2 12.3 7.87.3 0.0 0.0 22.2 0.0 7.7
4.1 1.9 1.8 6.1 4.1 5.14.9 0.0 0.0 11.1 0.0 7.7
40.4 28.8 37.7 50.8 54.4 33.041.5 57.1 25.0 55.6 50.0 23.1
Highest Grade Completed
6th Grade or Less7th to 9th Grade10th to 12th GradeAbove 12th Grade
2.4 2.57.5 15.0
69.0 60.021.2 22.5
5.2 2.483.9 95.10.5 0.01.6 0.00.0 0.03.6 2.45.2 0.0
Males FemalesType of Place in Prior 30 Days
Public HousingPrivate House or ApartmentShelterIncarceration FacilityTreatment FacilityNo Fixed ResidenceOther
Males Females
7.7 19.560.7 29.315.4 26.816.2 24.4
Primary Sourcein Prior 30 Days
Welfare, Social SecurityFull or Part-Time EmploymentOther Legal Illegal or None
Males Females
Current Primary Source of Income of Booked Arrestees (%)
Current Housing Arrangement of Booked Arrestees (%)
Education of Booked Arrestees (%)
Males FemalesN Mean Age N Mean Age Males Females Males Females
Percent Reporting Drug Use in the Past 30 Days, by Age and SexPercent Reporting Use Percent Reporting Use by Age
Age at First Use (for those admitting use) Received Prior Treatment ( % ) Ever Injected Drugs Illegally ( % )
MALES
FEMALES
C ra c k
C o c a i n e
M a r i j u a n a
O p i a t e s
M e t h a m p h e t a m i n e
0 5 10 15 20 25 30 N
Mean Number of Days Used in the Past 30 Days(for those admitting use in the past 30 days)
8.313.7
4.810.2
11.913.6
14.915.7
10.68.2
7912
335
21318
377
8811
1.52.1
1.50.8
1.60.6
6713
15611
317
1998 Annual Report
350 12.7192 24.6223 20.0336 13.4107 22.3188 21.474 17.8
39 14.322 24.124 21.737 15.78 27.5
17 21.04 17.8
AlcoholCrackCocaineMarijuanaOpiatesMethamphetaminePCP
35.5 34.15.8 14.66.9 7.3
11.0 7.34.1 0.06.3 7.3
AlcoholCrackCocaineMarijuanaOpiatesMethamphetamine
19.7 17.121.6 22.018.9 17.1
CocaineHeroinAmphetamine/Methamphetamine
MALES
FEMALES
0 1 2 3 4 5 6 N
Mean Number of Times Reported Arrested in thePast 12 Months (excludes current offense; for thosetesting positive)
MALES
FEMALES
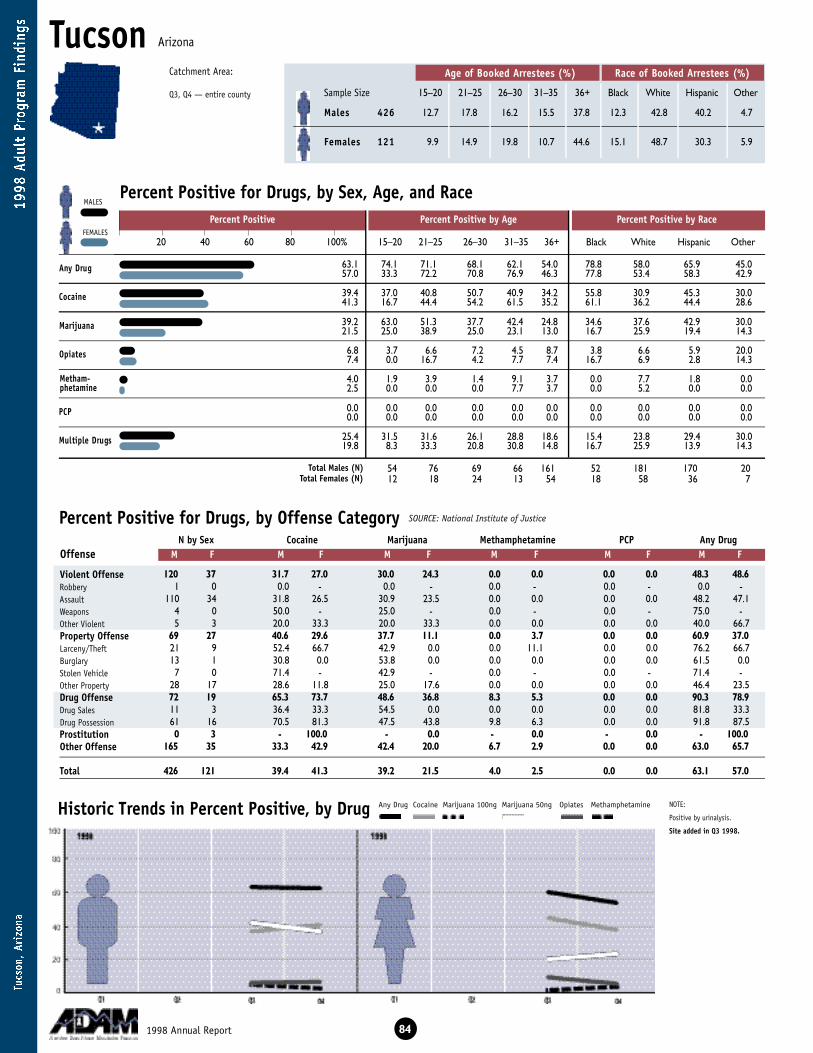
TucsonAge of Booked Arrestees (%) Race of Booked Arrestees (%)
Sample Size 15–20 21–25 26–30 31–35 36+ Black White Hispanic Other
Percent Positive for Drugs, by Sex, Age, and Race
Percent Positive for Drugs, by Offense Category
Historic Trends in Percent Positive, by Drug
A ny Drug
C o c a i n e
M a r i j u a n a
O p i a t e s
P C P
Multiple Drugs
NOTE:
Positive by urinalysis.
Site added in Q3 1998.
120 37 31.7 27.0 30.0 24.3 0.0 0.0 0.0 0.0 48.3 48.61 0 0.0 - 0.0 - 0.0 - 0.0 - 0.0 -
110 34 31.8 26.5 30.9 23.5 0.0 0.0 0.0 0.0 48.2 47.14 0 50.0 - 25.0 - 0.0 - 0.0 - 75.0 -5 3 20.0 33.3 20.0 33.3 0.0 0.0 0.0 0.0 40.0 66.7
69 27 40.6 29.6 37.7 11.1 0.0 3.7 0.0 0.0 60.9 37.021 9 52.4 66.7 42.9 0.0 0.0 11.1 0.0 0.0 76.2 66.713 1 30.8 0.0 53.8 0.0 0.0 0.0 0.0 0.0 61.5 0.07 0 71.4 - 42.9 - 0.0 - 0.0 - 71.4 -
28 17 28.6 11.8 25.0 17.6 0.0 0.0 0.0 0.0 46.4 23.572 19 65.3 73.7 48.6 36.8 8.3 5.3 0.0 0.0 90.3 78.911 3 36.4 33.3 54.5 0.0 0.0 0.0 0.0 0.0 81.8 33.361 16 70.5 81.3 47.5 43.8 9.8 6.3 0.0 0.0 91.8 87.50 3 - 100.0 - 0.0 - 0.0 - 0.0 - 100.0
165 35 33.3 42.9 42.4 20.0 6.7 2.9 0.0 0.0 63.0 65.7
426 121 39.4 41.3 39.2 21.5 4.0 2.5 0.0 0.0 63.1 57.0
N by Sex Cocaine Marijuana Methamphetamine PCP Any DrugOffense M F M F M F M F M F M F
SOURCE: National Institute of Justice
841998 Annual Report
Any Drug Cocaine Marijuana 100ng Marijuana 50ng Opiates Methamphetamine
Percent Positive Percent Positive by Age Percent Positive by Race
20 40 60 80 100% 15–20 21–25 26–30 31–35 36+ Black White Hispanic Other
54 76 69 66 161 52 181 170 2012 18 24 13 54 18 58 36 7
12.7 17.8 16.2 15.5 37.8 12.3 42.8 40.2 4.7
9.9 14.9 19.8 10.7 44.6 15.1 48.7 30.3 5.9
M a l e s 4 2 6
Fe m a l e s 1 2 1
Total Males (N)Total Females (N)
Violent OffenseRobberyAssaultWeaponsOther ViolentProperty OffenseLarceny/TheftBurglaryStolen VehicleOther PropertyDrug OffenseDrug SalesDrug PossessionProstitutionOther Offense
Total
Arizona
MALES
FEMALES
M e t h a m -p h e t a m i n e
63.1 74.1 71.1 68.1 62.1 54.0 78.8 58.0 65.9 45.057.0 33.3 72.2 70.8 76.9 46.3 77.8 53.4 58.3 42.9
39.4 37.0 40.8 50.7 40.9 34.2 55.8 30.9 45.3 30.041.3 16.7 44.4 54.2 61.5 35.2 61.1 36.2 44.4 28.6
39.2 63.0 51.3 37.7 42.4 24.8 34.6 37.6 42.9 30.021.5 25.0 38.9 25.0 23.1 13.0 16.7 25.9 19.4 14.3
6.8 3.7 6.6 7.2 4.5 8.7 3.8 6.6 5.9 20.07.4 0.0 16.7 4.2 7.7 7.4 16.7 6.9 2.8 14.3
4.0 1.9 3.9 1.4 9.1 3.7 0.0 7.7 1.8 0.02.5 0.0 0.0 0.0 7.7 3.7 0.0 5.2 0.0 0.0
0.0 0.0 0.0 0.0 0.0 0.0 0.0 0.0 0.0 0.00.0 0.0 0.0 0.0 0.0 0.0 0.0 0.0 0.0 0.0
25.4 31.5 31.6 26.1 28.8 18.6 15.4 23.8 29.4 30.019.8 8.3 33.3 20.8 30.8 14.8 16.7 25.9 13.9 14.3
Catchment Area:
Q3, Q4 — entire county

C ra c k
C o c a i n e
M a r i j u a n a
O p i a t e s
M e t h a m p h e t a m i n e
C ra c k
C o c a i n e
C rack & Cocaine
Marijuana & Cocaine
Opiates & Cocaine
A ny 2 or More Drugs
Cocaine
M a r i j u a n a
Opiates
Description of the Sample
Self-Reported Drug Information
85
0 20 40 60 80 100% 15–20 21–25 26–30 31–35 36+
19.3 9.3 14.5 19.1 18.2 25.529.8 8.3 16.7 25.0 46.2 37.0
17.3 20.4 17.6 25.0 14.1 14.120.0 8.3 22.2 12.5 30.8 22.6
6.4 5.6 6.8 7.4 4.7 6.910.7 0.0 0.0 8.3 15.4 16.7
11.5 16.7 13.3 16.2 9.4 7.614.2 8.3 16.7 8.3 15.4 17.0
3.5 1.9 0.0 2.9 1.5 6.83.3 0.0 0.0 0.0 0.0 7.4
27.5 27.8 25.3 33.8 26.6 26.031.1 25.0 27.8 20.8 30.8 38.5
Highest Grade Completed
6th Grade or Less7th to 9th Grade10th to 12th GradeAbove 12th Grade
4.5 2.65.6 6.1
66.1 61.423.8 29.8
1.7 6.784.2 88.30.0 0.01.9 0.00.5 0.8
10.8 3.30.9 0.8
Males FemalesType of Place in Prior 30 Days
Public HousingPrivate House or ApartmentShelterIncarceration FacilityTreatment FacilityNo Fixed ResidenceOther
Males Females
6.3 12.668.8 47.113.4 31.911.5 8.4
Primary Sourcein Prior 30 Days
Welfare, Social SecurityFull or Part-Time EmploymentOther Legal Illegal or None
Males Females
Current Primary Source of Income of Booked Arrestees (%)
Current Housing Arrangement of Booked Arrestees (%)
Education of Booked Arrestees (%)
Males FemalesN Mean Age N Mean Age Males Females Males Females
Percent Reporting Drug Use in the Past 30 Days, by Age and SexPercent Reporting Use Percent Reporting Use by Age
Age at First Use (for those admitting use) Received Prior Treatment ( % ) Ever Injected Drugs Illegally ( % )
MALES
FEMALES
0 5 10 15 20 25 30 N
Mean Number of Days Used in the Past 30 Days(for those admitting use in the past 30 days)
12.513.6
7.58.2
10.19.4
20.825.5
8.69.3
8236
7224
18846
266
276
1.32.3
1.30.3
1.52.2
16850
16726
289
1998 Annual Report
415 14.1151 24.8225 19.9335 14.979 22.4
105 22.345 18.2
115 15.749 26.265 21.798 15.825 22.034 23.913 16.8
AlcoholCrackCocaineMarijuanaOpiatesMethamphetaminePCP
21.2 18.25.0 9.17.0 8.44.3 4.24.0 5.02.4 2.5
AlcoholCrackCocaineMarijuanaOpiatesMethamphetamine
12.0 16.713.4 19.26.1 7.5
CocaineHeroinAmphetamine/Methamphetamine
MALES
FEMALES
0 1 2 3 4 5 6 N
Mean Number of Times Reported Arrested in thePast 12 Months (excludes current offense; for thosetesting positive)
MALES
FEMALES
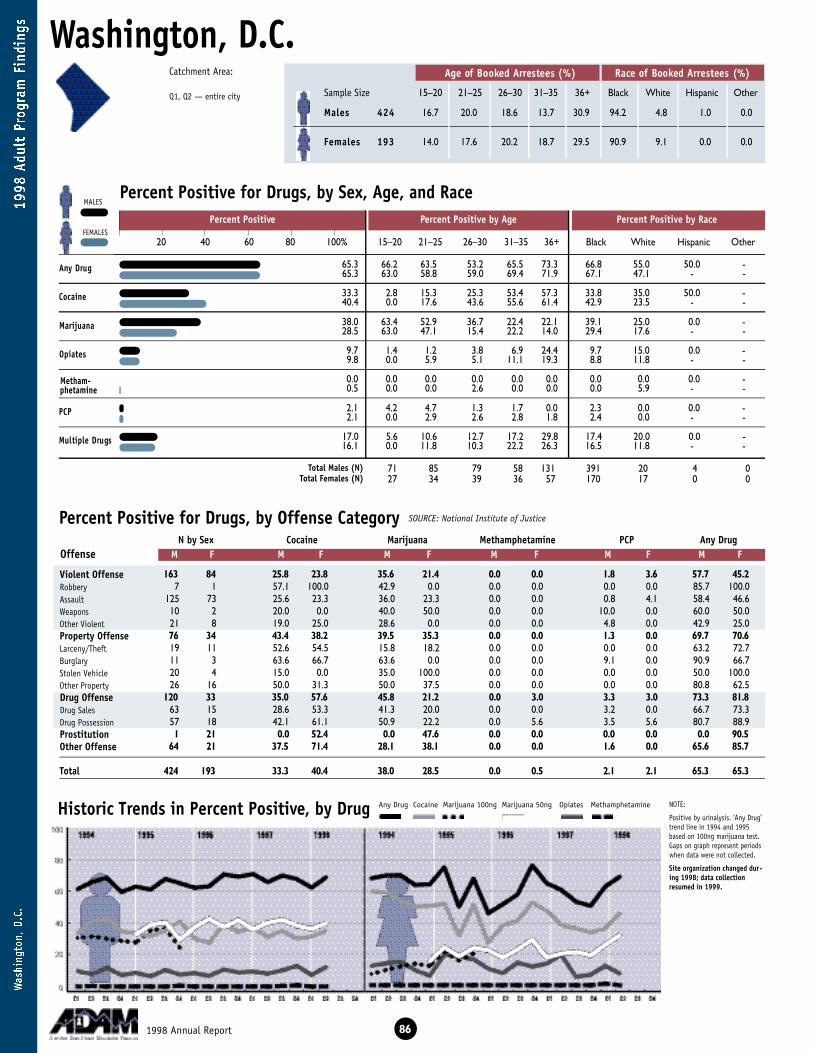
Catchment Area:
Q1, Q2 — entire city
Washington, D.C.Age of Booked Arrestees (%) Race of Booked Arrestees (%)
Sample Size 15–20 21–25 26–30 31–35 36+ Black White Hispanic Other
Percent Positive for Drugs, by Sex, Age, and Race
Percent Positive for Drugs, by Offense Category
Historic Trends in Percent Positive, by Drug
A ny Drug
C o c a i n e
M a r i j u a n a
O p i a t e s
P C P
Multiple Drugs
NOTE:
Positive by urinalysis. ‘Any Drug’trend line in 1994 and 1995based on 100ng marijuana test.Gaps on graph represent periodswhen data were not collected.
Site organization changed dur-ing 1998; data collectionresumed in 1999.
163 84 25.8 23.8 35.6 21.4 0.0 0.0 1.8 3.6 57.7 45.27 1 57.1 100.0 42.9 0.0 0.0 0.0 0.0 0.0 85.7 100.0
125 73 25.6 23.3 36.0 23.3 0.0 0.0 0.8 4.1 58.4 46.610 2 20.0 0.0 40.0 50.0 0.0 0.0 10.0 0.0 60.0 50.021 8 19.0 25.0 28.6 0.0 0.0 0.0 4.8 0.0 42.9 25.076 34 43.4 38.2 39.5 35.3 0.0 0.0 1.3 0.0 69.7 70.619 11 52.6 54.5 15.8 18.2 0.0 0.0 0.0 0.0 63.2 72.711 3 63.6 66.7 63.6 0.0 0.0 0.0 9.1 0.0 90.9 66.720 4 15.0 0.0 35.0 100.0 0.0 0.0 0.0 0.0 50.0 100.026 16 50.0 31.3 50.0 37.5 0.0 0.0 0.0 0.0 80.8 62.5
120 33 35.0 57.6 45.8 21.2 0.0 3.0 3.3 3.0 73.3 81.863 15 28.6 53.3 41.3 20.0 0.0 0.0 3.2 0.0 66.7 73.357 18 42.1 61.1 50.9 22.2 0.0 5.6 3.5 5.6 80.7 88.91 21 0.0 52.4 0.0 47.6 0.0 0.0 0.0 0.0 0.0 90.5
64 21 37.5 71.4 28.1 38.1 0.0 0.0 1.6 0.0 65.6 85.7
424 193 33.3 40.4 38.0 28.5 0.0 0.5 2.1 2.1 65.3 65.3
N by Sex Cocaine Marijuana Methamphetamine PCP Any DrugOffense M F M F M F M F M F M F
SOURCE: National Institute of Justice
861998 Annual Report
Any Drug Cocaine Marijuana 100ng Marijuana 50ng Opiates Methamphetamine
Percent Positive Percent Positive by Age Percent Positive by Race
20 40 60 80 100% 15–20 21–25 26–30 31–35 36+ Black White Hispanic Other
71 85 79 58 131 391 20 4 027 34 39 36 57 170 17 0 0
16.7 20.0 18.6 13.7 30.9 94.2 4.8 1.0 0.0
14.0 17.6 20.2 18.7 29.5 90.9 9.1 0.0 0.0
M a l e s 4 2 4
Fe m a l e s 1 9 3
Total Males (N)Total Females (N)
Violent OffenseRobberyAssaultWeaponsOther ViolentProperty OffenseLarceny/TheftBurglaryStolen VehicleOther PropertyDrug OffenseDrug SalesDrug PossessionProstitutionOther Offense
Total
MALES
FEMALES
65.3 66.2 63.5 53.2 65.5 73.3 66.8 55.0 50.0 -65.3 63.0 58.8 59.0 69.4 71.9 67.1 47.1 - -
33.3 2.8 15.3 25.3 53.4 57.3 33.8 35.0 50.0 -40.4 0.0 17.6 43.6 55.6 61.4 42.9 23.5 - -
38.0 63.4 52.9 36.7 22.4 22.1 39.1 25.0 0.0 -28.5 63.0 47.1 15.4 22.2 14.0 29.4 17.6 - -
9.7 1.4 1.2 3.8 6.9 24.4 9.7 15.0 0.0 -9.8 0.0 5.9 5.1 11.1 19.3 8.8 11.8 - -
0.0 0.0 0.0 0.0 0.0 0.0 0.0 0.0 0.0 -0.5 0.0 0.0 2.6 0.0 0.0 0.0 5.9 - -
2.1 4.2 4.7 1.3 1.7 0.0 2.3 0.0 0.0 -2.1 0.0 2.9 2.6 2.8 1.8 2.4 0.0 - -
17.0 5.6 10.6 12.7 17.2 29.8 17.4 20.0 0.0 -16.1 0.0 11.8 10.3 22.2 26.3 16.5 11.8 - -
M e t h a m -p h e t a m i n e

Cocaine
M a r i j u a n a
Opiates
Description of the Sample
Self-Reported Drug Information
C ra c k
C o c a i n e
C rack & Cocaine
Marijuana & Cocaine
Opiates & Cocaine
A ny 2 or More Drugs
87
0 20 40 60 80 100% 15–20 21–25 26–30 31–35 36+
16.6 0.0 3.6 10.1 24.1 34.429.0 0.0 11.8 30.8 36.1 47.4
5.9 1.4 2.4 2.5 6.9 12.24.1 0.0 2.9 5.1 2.8 7.0
2.1 0.0 1.2 1.3 3.4 3.82.6 0.0 0.0 2.6 0.0 7.0
2.4 1.4 1.2 1.3 3.4 3.81.6 0.0 0.0 2.6 2.8 1.8
2.8 0.0 0.0 0.0 0.0 9.22.6 0.0 0.0 2.6 2.8 5.3
14.6 2.9 8.3 8.9 15.5 28.115.1 0.0 2.9 12.8 22.2 26.3
Highest Grade Completed
6th Grade or Less7th to 9th Grade10th to 12th GradeAbove 12th Grade
1.0 1.14.0 3.8
72.0 78.923.0 16.2
8.1 14.586.0 78.21.9 3.11.7 0.50.0 0.01.9 3.60.5 0.0
Males FemalesType of Place in Prior 30 Days
Public HousingPrivate House or ApartmentShelterIncarceration FacilityTreatment FacilityNo Fixed ResidenceOther
Males Females
5.7 27.562.5 32.622.4 21.29.4 18.7
Primary Sourcein Prior 30 Days
Welfare, Social SecurityFull or Part-Time EmploymentOther Legal Illegal or None
Males Females
Current Primary Source of Income of Booked Arrestees (%)
Current Housing Arrangement of Booked Arrestees (%)
Education of Booked Arrestees (%)
Males FemalesN Mean Age N Mean Age Males Females Males Females
Percent Reporting Drug Use in the Past 30 Days, by Age and SexPercent Reporting Use Percent Reporting Use by Age
Age at First Use (for those admitting use) Received Prior Treatment ( % ) Ever Injected Drugs Illegally ( % )
MALES
FEMALES
C ra c k
C o c a i n e
M a r i j u a n a
O p i a t e s
M e t h a m p h e t a m i n e
0 5 10 15 20 25 30 N
Mean Number of Days Used in the Past 30 Days(for those admitting use in the past 30 days)
12.113.2
5.18.4
12.510.0
19.020.6
2.0-
7056
258
16562
3914
10
0.60.4
0.60.5
0.40.3
14078
16155
4119
1998 Annual Report
364 16.3125 27.0106 20.8298 16.070 22.012 17.475 18.9
162 17.075 24.937 22.2
128 16.827 22.72 20.5
28 19.0
AlcoholCrackCocaineMarijuanaOpiatesMethamphetaminePCP
10.6 8.310.0 16.13.1 3.17.6 4.24.0 6.20.5 0.0
AlcoholCrackCocaineMarijuanaOpiatesMethamphetamine
4.3 4.78.4 7.80.7 0.0
CocaineHeroinAmphetamine/Methamphetamine
MALES
FEMALES
0 1 2 3 4 5 6 N
Mean Number of Times Reported Arrested in thePast 12 Months (excludes current offense; for thosetesting positive)
MALES
FEMALES