Embed Size (px)
Citation preview
AdvAnces in Physics: X, 2017vOL. 2, nO. 1, 169–187http://dx.doi.org/10.1080/23746149.2016.1271285
REVIEW ARTICLE
Quartz–enhanced photoacoustic spectrophones exploiting custom tuning forks: a review
Pietro Patimiscoa,b , Angelo Sampaoloa,b, Huadan Zhengb,c, Lei Dongc, Frank K. Tittelb and Vincenzo Spagnoloa adipartimento interateneo di Fisica, Università degli studi di Bari and Politecnico di Bari, cnR-iFn BARi, via Amendola 173, Bari, italy; bdepartment of electrical and computer engineering, Rice University, houston, TX, UsA; cstate Key Laboratory of Quantum Optics and Quantum Optics devices, institute of Laser spectroscopy, shanxi University, Taiyuan, china
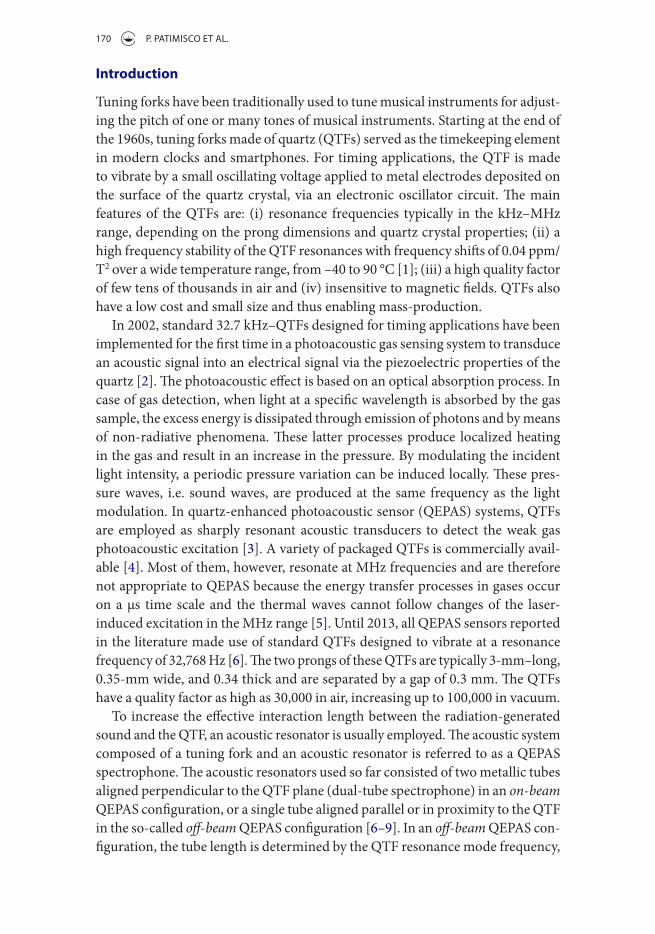
ABSTRACTA detailed review on the design and realization of spectrophones exploiting custom quartz tuning forks (QTFs) aimed to applications of quartz-enhanced photoacoustic (QEPAS) trace-gas sensors is reported. A spectrophone consists of a custom QTF and a micro-resonator system based on a pair of tubes (dual-tube configuration) or a single-tube. The influence of the QTF and resonator tube geometry and sizes on the main spectrophone parameters determining the QEPAS performance, specifically the quality factor Q and the resonance frequency has been investigated. Results obtained previously are reviewed both when the QTF vibrates on the fundamental and the first overtone flexural modes. We also report new results obtained with a novel QTF design. Finally, we compare the QEPAS performance of all the different spectrophone configurations reported in terms of signal-to-noise ratio and provide relevant and useful conclusions from this analysis.
© 2016 The Author(s). Published by informa UK Limited, trading as Taylor & Francis Group.This is an Open Access article distributed under the terms of the creative commons Attribution License (http://creativecommons.org/licenses/by/4.0/), which permits unrestricted use, distribution, and reproduction in any medium, provided the original work is properly cited.
KEYWORDSQuartz resonator; flexural modes; photoacoustic effect; gas sensing; laser spectroscopy
PACS77.65.Fs electromechanical resonance; quartz resonators; 82.80.Kq energy-conversion spectro-analytical methods (e.g., photoacoustic, photothermal, and optogalvanic spectroscopic methods); 07.07.df sensors (chemical, optical, electrical, movement, gas, etc.); remote sensing; 43.38.Fx, Piezoelectric and ferroelectric transducers
ARTICLE HISTORYReceived 3 november 2016 Accepted 5 december 2016
CONTACT vincenzo spagnolo [email protected]
OPEN ACCESS
170 P. PATIMISCO ET AL.
Introduction
Tuning forks have been traditionally used to tune musical instruments for adjust-ing the pitch of one or many tones of musical instruments. Starting at the end of the 1960s, tuning forks made of quartz (QTFs) served as the timekeeping element in modern clocks and smartphones. For timing applications, the QTF is made to vibrate by a small oscillating voltage applied to metal electrodes deposited on the surface of the quartz crystal, via an electronic oscillator circuit. The main features of the QTFs are: (i) resonance frequencies typically in the kHz–MHz range, depending on the prong dimensions and quartz crystal properties; (ii) a high frequency stability of the QTF resonances with frequency shifts of 0.04 ppm/T2 over a wide temperature range, from –40 to 90 °C [1]; (iii) a high quality factor of few tens of thousands in air and (iv) insensitive to magnetic fields. QTFs also have a low cost and small size and thus enabling mass-production.
In 2002, standard 32.7 kHz–QTFs designed for timing applications have been implemented for the first time in a photoacoustic gas sensing system to transduce an acoustic signal into an electrical signal via the piezoelectric properties of the quartz [2]. The photoacoustic effect is based on an optical absorption process. In case of gas detection, when light at a specific wavelength is absorbed by the gas sample, the excess energy is dissipated through emission of photons and by means of non-radiative phenomena. These latter processes produce localized heating in the gas and result in an increase in the pressure. By modulating the incident light intensity, a periodic pressure variation can be induced locally. These pres-sure waves, i.e. sound waves, are produced at the same frequency as the light modulation. In quartz-enhanced photoacoustic sensor (QEPAS) systems, QTFs are employed as sharply resonant acoustic transducers to detect the weak gas photoacoustic excitation [3]. A variety of packaged QTFs is commercially avail-able [4]. Most of them, however, resonate at MHz frequencies and are therefore not appropriate to QEPAS because the energy transfer processes in gases occur on a μs time scale and the thermal waves cannot follow changes of the laser- induced excitation in the MHz range [5]. Until 2013, all QEPAS sensors reported in the literature made use of standard QTFs designed to vibrate at a resonance frequency of 32,768 Hz [6]. The two prongs of these QTFs are typically 3-mm–long, 0.35-mm wide, and 0.34 thick and are separated by a gap of 0.3 mm. The QTFs have a quality factor as high as 30,000 in air, increasing up to 100,000 in vacuum.
To increase the effective interaction length between the radiation-generated sound and the QTF, an acoustic resonator is usually employed. The acoustic system composed of a tuning fork and an acoustic resonator is referred to as a QEPAS spectrophone. The acoustic resonators used so far consisted of two metallic tubes aligned perpendicular to the QTF plane (dual-tube spectrophone) in an on-beam QEPAS configuration, or a single tube aligned parallel or in proximity to the QTF in the so-called off-beam QEPAS configuration [6–9]. In an off-beam QEPAS con-figuration, the tube length is determined by the QTF resonance mode frequency,
ADVANCES IN PHYSICS: X 171
since the resonant acoustic pressure antinode must be located at the center of the tube. A small slit is opened in the middle of the tube, and the QTF is positioned near this aperture in order to sense the pressure waves coming out from the microresonator. Although the off-beam QEPAS configuration facilitates optical alignment, this approach does not achieve the same level of detection sensitivity of on-beam QEPAS system [6]. Therefore, we will focus on the on-beam QEPAS configuration in this review.
The design parameters of the two tubes composing an on-beam QEPAS sys-tem, namely the inner diameter (ID) and the outer diameter (OD) that maximize the QEPAS response were determined experimentally and occur in the range of 0.5–0.84 mm for the ID, of 0.8–1.2 mm for the OD, while the length of a single tube falls in the range of 3.9–5.1 mm [10,11].
One of the main issues in QEPAS-based sensor systems is the required precise focusing between the QTF prongs. The laser beam must not hit the prongs since otherwise a large undesirable non-zero background arises due to the photo-ther-mal contribution, which limits the sensor detection sensitivity [12,13]. In 2013, a custom-made tuning fork was installed for the first time in a QEPAS sensor operated in the THz range employing a quantum cascade laser (QCL) [14,15]. In this case, the use of a QTF with larger prongs spacing was mandatory in order to extend QEPAS operation into the THz range, since THz sources are charac-terized by a long wavelength (60–300 μm), low beam spatial qualities, and high divergence angles, making their focusing between the two prongs of a standard QTF, spaced by only 300 μm apart, without hitting the prongs difficult. Recently, several QTFs designs were realized, tested, and implemented in QEPAS spectro-phones for gas sensing. For example, the use of QTF with prongs spacing ≥700 μm allowed extending QEPAS operation to powerful but with poor beam quality laser sources, such as near-IR fiber amplified lasers [16]. Furthermore, the use of QTFs with such large prongs spacing allowed the realization of a novel spectrophone configuration in which a single tube is inserted between the prongs of the QTF (single-tube spectrophone) [17,18].
In this work, we review the results obtained so far with QEPAS spectrophones operating with custom-made QTFs. A detailed study of spectrophone properties is described with the aim to relate the QTF main parameters, its resonance fre-quency, and quality factor to the spectrophone geometry and assembly. Different spectrophones configurations: from the standard dual-tube configuration to a novel single-tube structural design as well as QEPAS operation with fundamental and first overtone flexural mode were investigated. We also describe our results obtained using a QTF with a novel design, by coupling it with a dual- and sin-gle-tube configuration and testing both systems in the mid-infrared spectral range. Finally, we compare the QEPAS performance of all the investigated spectrophones in terms of QEPAS signal-to-noise ratio (SNR).
172 P. PATIMISCO ET AL.
Custom-made tuning forks
To a first approximation, a tuning fork can be considered to be composed by two cantilevers bars (prongs) joined at a common base. The in-plane flexural modes of vibrations of the QTFs can be classified into two groups: symmetrical modes, in which the prongs moves along the same direction and anti-symmetrical modes, in which the two prongs oscillate along opposite directions [19]. The in-plane anti-symmetrical modes will be the predominant modes when a sound source is positioned between the prongs, forcing them to move in the opposite directions. In QEPAS sensors, the light source (typically a laser) is focused between the QTF prongs and the sound waves produced by the modulated absorption of the gas are located between the QTF prongs and force them to vibrate anti-symmetrically back and forth (in-plane anti-symmetrical mode). When these oscillations occur at one of the resonance frequencies of the QTF, the induced strain field generates surface electric charges due to the quartz piezoelectricity and the total charge is proportional to the intensity of the sound waves incident on the QTF prongs. The generated charges are collected using a transimpedance amplifier and the measured electrical signal is proportional to the concentration of the absorbing gas specie. The QEPAS technique is also characterized by a very large dynamic range from the parts-per-trillion (ppt) level to a few % concentration levels [6].
The ability of the gas target to rapidly relax the excess energy absorbed from the incident radiation plays a crucial role in determining the QEPAS minimum detec-tion limit (MDL). When the target gas absorbs the exciting laser light, the excess energy is mainly dissipated through non-radiative relaxation processes, involving vibrational and rotational excited states. The generation of a photoacoustic wave involves an energy transfer from the excited states to translational molecular degrees of freedom. The time constant τ for these processes typically falls in the microsecond range depending also on the specific gas carrier [20]. Ideally, the condition f << 1/2πτ should be satisfied, where f is the laser modulation frequency, which corresponds to one of the QTF resonances. Hence, the gas response to the modulation of the incident laser radiation is related to the ability of the gas to follow this fast modulation and differs for each gas. Water (H2O), propylene (C3H6) and sulfur hexafluoride (SF6) are fast-relaxing gases and are expected to show the best performance when detected using a QEPAS-based sensor system. These three gases were also used as relaxation promoters in order to enhance the energy relaxation processes in the gas mixture when slow relaxing gases (such as CO, CO2 and NO) are detected [21].
The record QEPAS sensitivity was obtained in the mid-IR (@ 10.54 μm) for SF6 detection and corresponds to a minimum concentration level of 50 ppt in volume with a 1-s integration time [13,22]. This minimum concentration level can be attributed to two critical features. First, the large measured QEPAS response due to the SF6 fast-relaxing properties and its exceptionally large absorption cross- sections in the mid-IR. Second, the very low signal noise, obtained by improving
ADVANCES IN PHYSICS: X 173
the spatial quality of the focused laser beam, which reduces the noise contribution due to radiation incident on the spectrophone. This result was accomplished by coupling the laser source to the QTF with a hollow core waveguide. The wave-guide acts as a spatial modal filter leading to a single mode, Gaussian-like output [23–25]. The beam waist diameter at the focal plane where the QTF is located was ~ 160 μm, well below the gap between the QTF prongs (300 μm). As a result, 99.4% of the laser beam exiting from the fiber was transmitted through the spec-trophone without hitting the QTF [22].
These considerations determine the directions that should be followed for real-izing novel QTFs optimized for QEPAS sensing applications. The quality factor (Q) must be kept as high as possible by: (i) a reduction of the QTF fundamental frequency down to a few KHz, in order to increase the QEPAS response in the slow-relaxing gases without adding any relaxation promoter; (ii) an increase in the prongs spacing in order to minimize the noise signal due to fraction of the optical power that may hit the internal surface of the micro-resonator tubes and of the QTF. In addition, lowering the fundamental resonance frequency reduces also the overtone frequencies, enabling their use for QEPAS based trace gas sensing. Large QTF prongs spacings allow the use of laser sources with low spatial beam quality, such as LEDs, VCSELs, fiber-amplified and terahertz QCLs [26].
The first custom-made QTF was implemented in a QEPAS sensor employing a THz QCL for methanol detection [12,13]. The QTF prongs were 20-mm long, 1.4-mm wide and 0.8 mm thick and separated by a gap of 1 mm. The fundamen-tal mode falls at 4,246 Hz with a quality factor >30,000 at atmospheric pressure. The laser beam was focused between the prongs with a ~ 430 μm beam waist and allowed ~100% of laser light to pass through the QTF without hitting it. A MDL of 15 ppm with a 3 s of signal integration time was achieved. The same THz QEPAS platform was updated with a novel custom-made QTF [27,28]. In the new design, the prongs spacing was decreased to 700 μm, large enough to allow >96% of the light intensity to pass through the gap spacing of the QTF prongs. Furthermore, the prong thickness was reduced to 1 mm and the prong length to 17 mm, thereby lowering the resonance frequency to 2,871 Hz, while the quality factor remained as high as 18,600 at 10 Torr. The MDL was improved by nearly a factor of 10 (1.7 ppm in 3 s integration time), while noise fluctuations (30 μV) remained similar to those recorded in the initial setup (25 μV), proving that the amount of laser light incident on the QTF prongs is negligible in both cases. These results confirm that the prongs spacing should be chosen based on the expected beam waist of the employed laser source, since this parameter plays a crucial role in the QTF acousto-electric transduction efficiency. The large divergence of the beam exiting from THz laser chips affects both the beam diameter and the numerical aperture and prevents the use of micro-resonator tubes for acoustic wave amplification.
A set of six QTFs with different values of spacing between the prongs, their length and thickness was designed in order to study the dependence of the QTF
174 P. PATIMISCO ET AL.
parameters on performance based on their relevant dimensions. In [29] we reported the results of this detailed analysis.
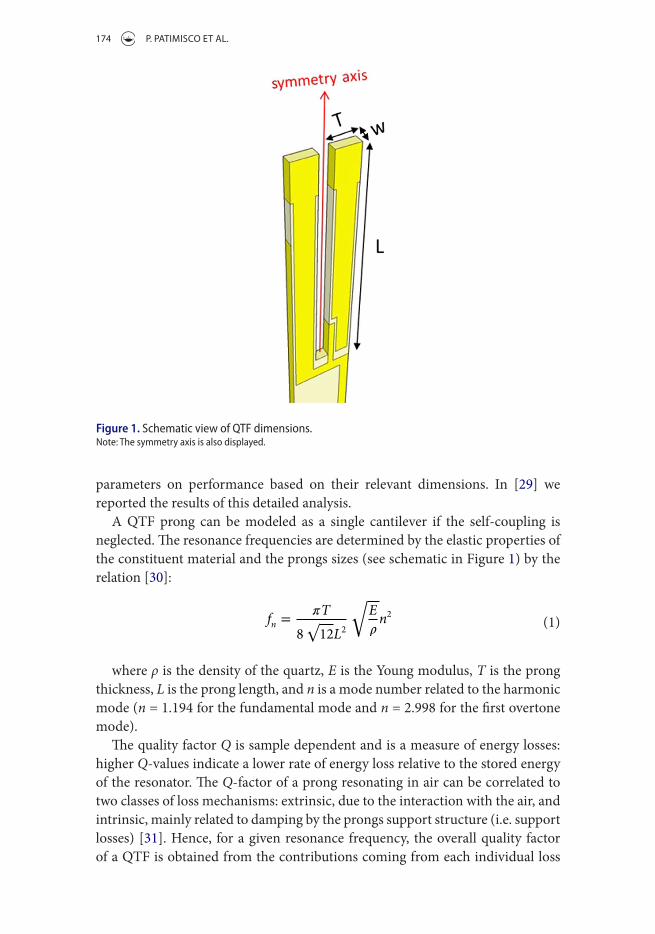
A QTF prong can be modeled as a single cantilever if the self-coupling is neglected. The resonance frequencies are determined by the elastic properties of the constituent material and the prongs sizes (see schematic in Figure 1) by the relation [30]:
where ρ is the density of the quartz, E is the Young modulus, T is the prong thickness, L is the prong length, and n is a mode number related to the harmonic mode (n = 1.194 for the fundamental mode and n = 2.998 for the first overtone mode).
The quality factor Q is sample dependent and is a measure of energy losses: higher Q-values indicate a lower rate of energy loss relative to the stored energy of the resonator. The Q-factor of a prong resonating in air can be correlated to two classes of loss mechanisms: extrinsic, due to the interaction with the air, and intrinsic, mainly related to damping by the prongs support structure (i.e. support losses) [31]. Hence, for a given resonance frequency, the overall quality factor of a QTF is obtained from the contributions coming from each individual loss
(1)fn =�T
8√
12L2
�
E
�n2
Figure 1. schematic view of QTF dimensions.note: The symmetry axis is also displayed.
ADVANCES IN PHYSICS: X 175
mechanism. For the fundamental mode, the support losses can be neglected and the overall quality factor can be phenomenologically related to the prong sizes by [29]:
where w is the prong width. This relation suggests that the overall quality factor of the fundamental mode can be increased by reducing the prong length and increasing both thickness and crystal width. However, the resonance frequency f0 is proportional to T/L2 and therefore the non-radiative gas absorption relaxation rates should be not exceeded.
When the fundamental resonance frequency approaches a few kHz, the first overtone reaches a range accessible for QEPAS operations. The first overtone mode frequency is ~6.3 times higher than the fundamental one (see Equation (1)). For example, when the fundamental mode frequency is reduced to 3 kHz, the overtone mode is <20 kHz. The quality factor of an overtone mode is mainly dominated by the support losses that can be expressed by [32,33]:
Thus, although these kind of losses increase with the mode number, it is still possible to obtain a larger Q-factor for the first overtone mode with respect to the fundamental one by increasing the L/T ratio. However, the prong thickness T cannot be too thin; otherwise, the extrinsic losses dominate thereby deteriorating the overall Q-factor [34].
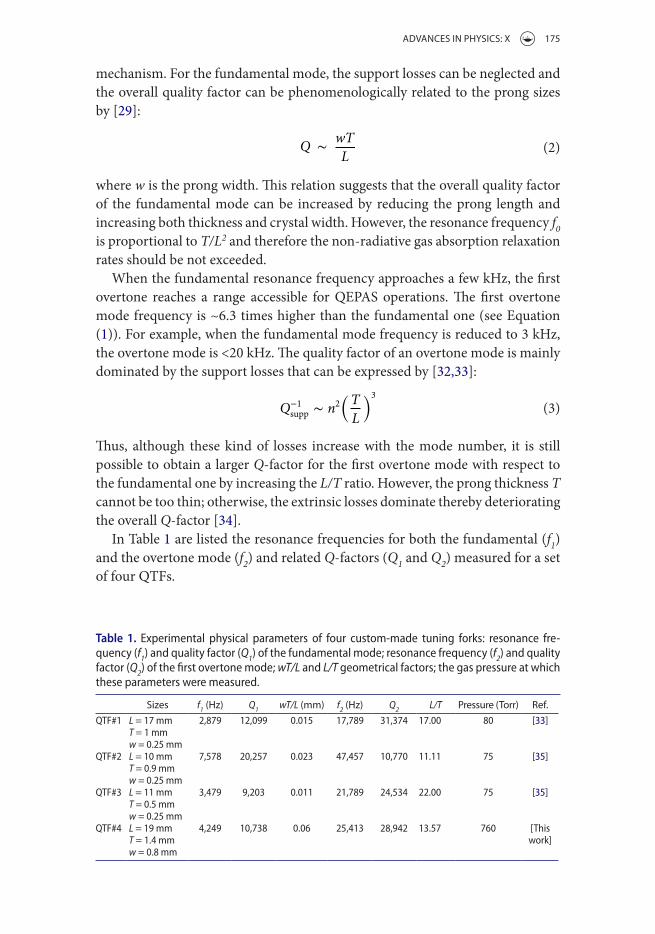
In Table 1 are listed the resonance frequencies for both the fundamental (f1) and the overtone mode (f2) and related Q-factors (Q1 and Q2) measured for a set of four QTFs.
(2)Q ∼
wT
L
(3)Q−1supp ∼ n2
(
T
L
)3
Table 1. experimental physical parameters of four custom-made tuning forks: resonance fre-quency (f1) and quality factor (Q1) of the fundamental mode; resonance frequency (f2) and quality factor (Q2) of the first overtone mode; wT/L and L/T geometrical factors; the gas pressure at which these parameters were measured.
Sizes f1 (Hz) Q1 wT/L (mm) f2 (Hz) Q2 L/T Pressure (Torr) Ref.QTF#1 L = 17 mm 2,879 12,099 0.015 17,789 31,374 17.00 80 [33]
T = 1 mmw = 0.25 mm
QTF#2 L = 10 mm 7,578 20,257 0.023 47,457 10,770 11.11 75 [35]T = 0.9 mmw = 0.25 mm
QTF#3 L = 11 mm 3,479 9,203 0.011 21,789 24,534 22.00 75 [35]T = 0.5 mmw = 0.25 mm
QTF#4 L = 19 mm 4,249 10,738 0.06 25,413 28,942 13.57 760 [This work]T = 1.4 mm
w = 0.8 mm
176 P. PATIMISCO ET AL.
Despite that, QTF#3 exhibits the highest L/T value; its Q2-value is lower than those measured for QTF#1 and QTF#4. This observation can be attributed to the fact that QTF#3 has a small prong thickness (T = 0.5 mm), indicating that extrinsic losses can become significant. For the same reason, QTF#4 exhibits the highest Q2-value, since its prongs are 1.4mm wide and in this case, extrinsic losses could not play any role in determining the quality factor of the overtone resonance mode.
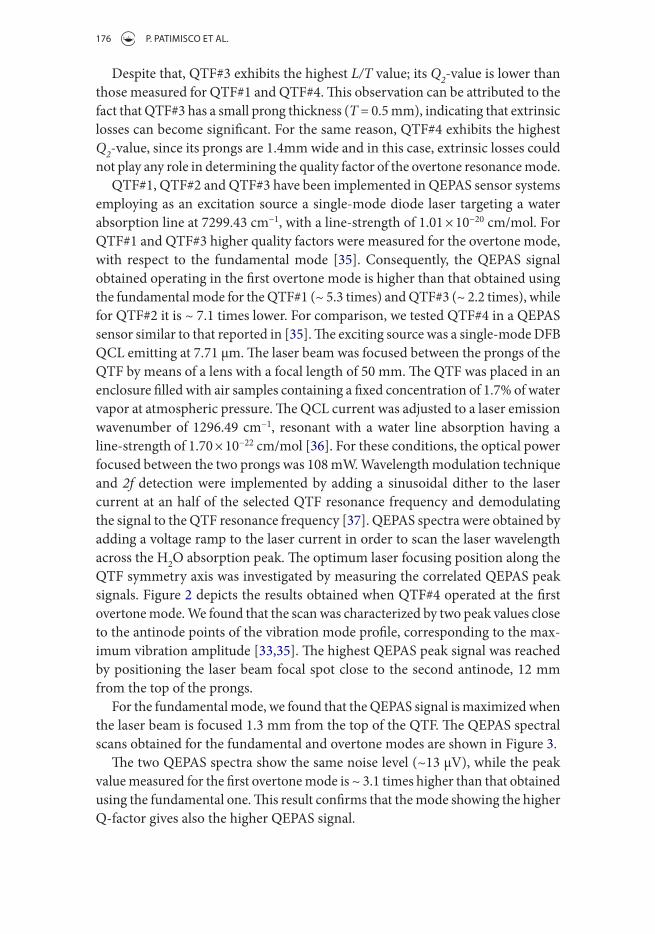
QTF#1, QTF#2 and QTF#3 have been implemented in QEPAS sensor systems employing as an excitation source a single-mode diode laser targeting a water absorption line at 7299.43 cm−1, with a line-strength of 1.01 × 10⁻²⁰ cm/mol. For QTF#1 and QTF#3 higher quality factors were measured for the overtone mode, with respect to the fundamental mode [35]. Consequently, the QEPAS signal obtained operating in the first overtone mode is higher than that obtained using the fundamental mode for the QTF#1 (~ 5.3 times) and QTF#3 (~ 2.2 times), while for QTF#2 it is ~ 7.1 times lower. For comparison, we tested QTF#4 in a QEPAS sensor similar to that reported in [35]. The exciting source was a single-mode DFB QCL emitting at 7.71 μm. The laser beam was focused between the prongs of the QTF by means of a lens with a focal length of 50 mm. The QTF was placed in an enclosure filled with air samples containing a fixed concentration of 1.7% of water vapor at atmospheric pressure. The QCL current was adjusted to a laser emission wavenumber of 1296.49 cm−1, resonant with a water line absorption having a line-strength of 1.70 × 10⁻²² cm/mol [36]. For these conditions, the optical power focused between the two prongs was 108 mW. Wavelength modulation technique and 2f detection were implemented by adding a sinusoidal dither to the laser current at an half of the selected QTF resonance frequency and demodulating the signal to the QTF resonance frequency [37]. QEPAS spectra were obtained by adding a voltage ramp to the laser current in order to scan the laser wavelength across the H2O absorption peak. The optimum laser focusing position along the QTF symmetry axis was investigated by measuring the correlated QEPAS peak signals. Figure 2 depicts the results obtained when QTF#4 operated at the first overtone mode. We found that the scan was characterized by two peak values close to the antinode points of the vibration mode profile, corresponding to the max-imum vibration amplitude [33,35]. The highest QEPAS peak signal was reached by positioning the laser beam focal spot close to the second antinode, 12 mm from the top of the prongs.
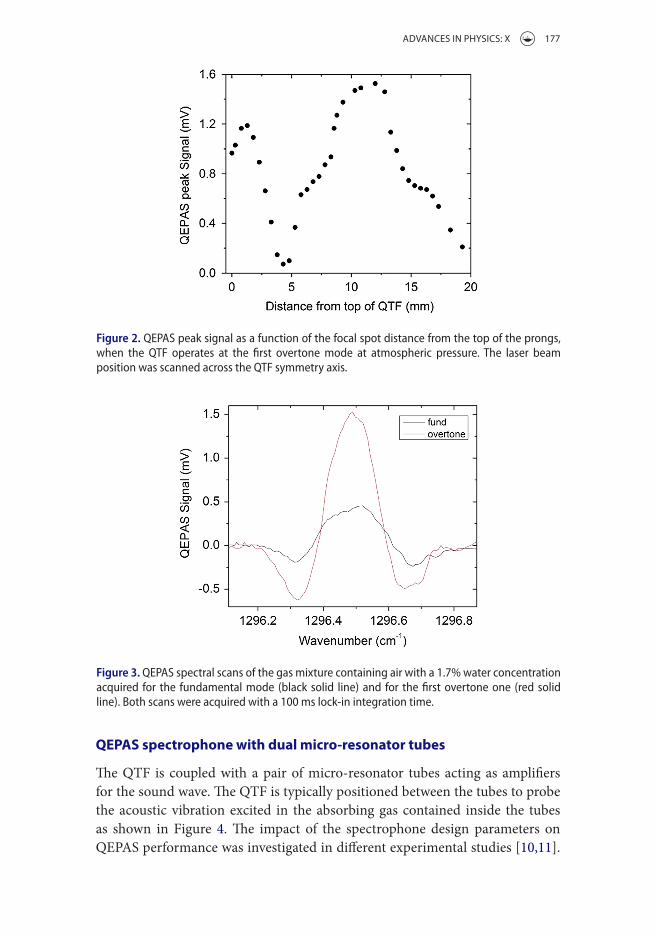
For the fundamental mode, we found that the QEPAS signal is maximized when the laser beam is focused 1.3 mm from the top of the QTF. The QEPAS spectral scans obtained for the fundamental and overtone modes are shown in Figure 3.
The two QEPAS spectra show the same noise level (~13 μV), while the peak value measured for the first overtone mode is ~ 3.1 times higher than that obtained using the fundamental one. This result confirms that the mode showing the higher Q-factor gives also the higher QEPAS signal.
ADVANCES IN PHYSICS: X 177
QEPAS spectrophone with dual micro-resonator tubes
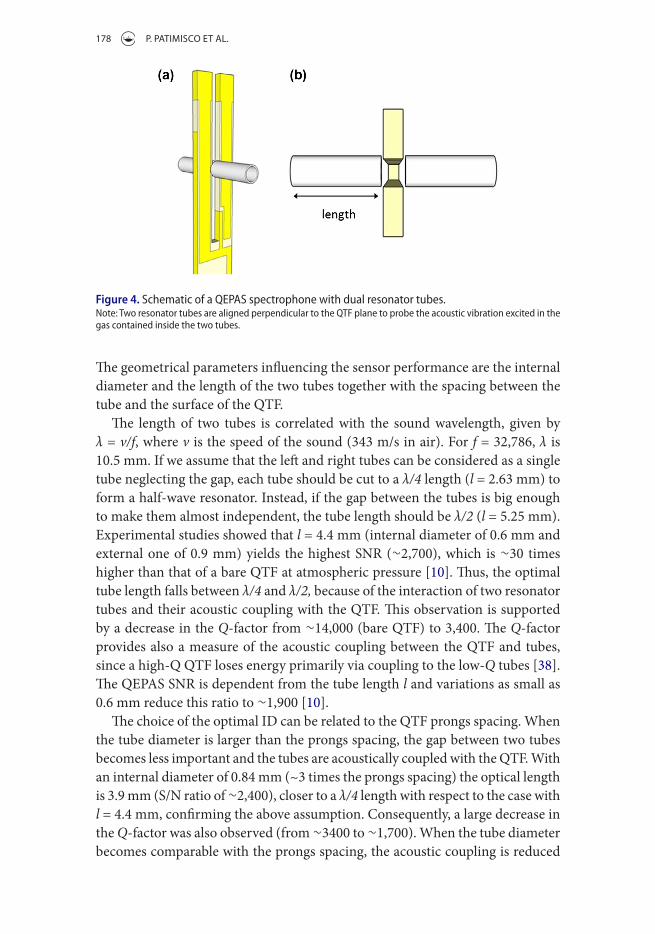
The QTF is coupled with a pair of micro-resonator tubes acting as amplifiers for the sound wave. The QTF is typically positioned between the tubes to probe the acoustic vibration excited in the absorbing gas contained inside the tubes as shown in Figure 4. The impact of the spectrophone design parameters on QEPAS performance was investigated in different experimental studies [10,11].
Figure 3. QePAs spectral scans of the gas mixture containing air with a 1.7% water concentration acquired for the fundamental mode (black solid line) and for the first overtone one (red solid line). Both scans were acquired with a 100 ms lock-in integration time.
Figure 2. QePAs peak signal as a function of the focal spot distance from the top of the prongs, when the QTF operates at the first overtone mode at atmospheric pressure. The laser beam position was scanned across the QTF symmetry axis.
178 P. PATIMISCO ET AL.
The geometrical parameters influencing the sensor performance are the internal diameter and the length of the two tubes together with the spacing between the tube and the surface of the QTF.
The length of two tubes is correlated with the sound wavelength, given by λ = v/f, where v is the speed of the sound (343 m/s in air). For f = 32,786, λ is 10.5 mm. If we assume that the left and right tubes can be considered as a single tube neglecting the gap, each tube should be cut to a λ/4 length (l = 2.63 mm) to form a half-wave resonator. Instead, if the gap between the tubes is big enough to make them almost independent, the tube length should be λ/2 (l = 5.25 mm). Experimental studies showed that l = 4.4 mm (internal diameter of 0.6 mm and external one of 0.9 mm) yields the highest SNR (∼2,700), which is ∼30 times higher than that of a bare QTF at atmospheric pressure [10]. Thus, the optimal tube length falls between λ/4 and λ/2, because of the interaction of two resonator tubes and their acoustic coupling with the QTF. This observation is supported by a decrease in the Q-factor from ∼14,000 (bare QTF) to 3,400. The Q-factor provides also a measure of the acoustic coupling between the QTF and tubes, since a high-Q QTF loses energy primarily via coupling to the low-Q tubes [38]. The QEPAS SNR is dependent from the tube length l and variations as small as 0.6 mm reduce this ratio to ∼1,900 [10].
The choice of the optimal ID can be related to the QTF prongs spacing. When the tube diameter is larger than the prongs spacing, the gap between two tubes becomes less important and the tubes are acoustically coupled with the QTF. With an internal diameter of 0.84 mm (~3 times the prongs spacing) the optical length is 3.9 mm (S/N ratio of ∼2,400), closer to a λ/4 length with respect to the case with l = 4.4 mm, confirming the above assumption. Consequently, a large decrease in the Q-factor was also observed (from ∼3400 to ∼1,700). When the tube diameter becomes comparable with the prongs spacing, the acoustic coupling is reduced
Figure 4. schematic of a QePAs spectrophone with dual resonator tubes.note: Two resonator tubes are aligned perpendicular to the QTF plane to probe the acoustic vibration excited in the gas contained inside the two tubes.
ADVANCES IN PHYSICS: X 179
and the SNR decreases. For an ID = 0.41 mm, the smallest ID tested, the Q-factor increased up to ~7,500 and the SNR was reduced to ~2,400.
The gaps size between the QTF and the tubes is a difficult parameter to con-trol during the spectrophone assembly and it has a significant effect on its final performance. With a large gap, the diverging flow from the two tubes ends cannot efficiently push against the QTF prong. Therefore, the gap should not be wider than 50 μm, when the gap is reduced from 50 to 25 μm, the SNR increases by 13% [10].
The first implementation of micro-resonator tubes with a custom-made QTF was reported in [16]. The tuning fork employed had the same design of QTF#2 with a prongs spacing of 0.8 mm, characterized by a fundamental resonance fre-quency of 7,205 Hz and a quality factor of 8,530 at atmospheric pressure. The used pair of tubes has ID of 1.3 mm. The gap between the QTF and the tubes was fixed to 30 μm. Five different lengths ranging from 8.4 to 23 mm (half of the sound wavelength) were tested. Longer tubes were not tested due to the difficulty in laser beam alignment and focalization between the QTF prongs. An erbium-doped fiber amplified laser with an output power of 1500 mW was employed as the available excitation source. A CO2 absorption feature located at 6,325.14 cm−1 with a line intensity of 1.155 × 10⁻²³ cm−1/mol was selected as the optimum target line. These studies revealed that for tube length of l = 23 mm the SNR was improved by a fac-tor of ~ 40 compared to that measured for the bare QTF. With this spectrophone configuration, the reported Q-factor decreased to ~ 6,300, ~ 26% with respect to the bare QTF. The study in [16] lacks an investigation into different internal diameters. In addition, the influence of the spacing between the prongs and the QTF on the SNR was not studied.
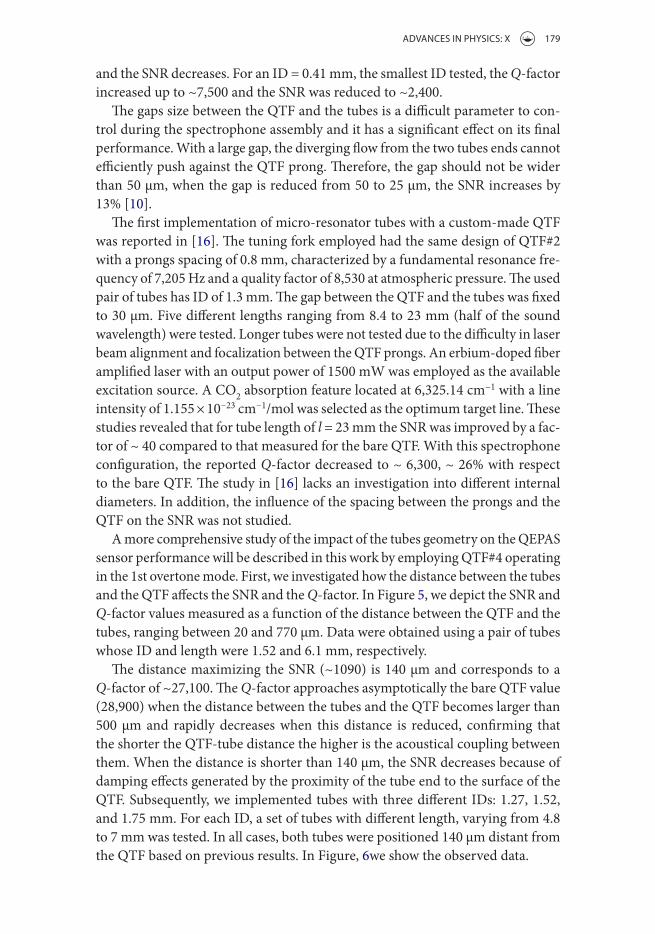
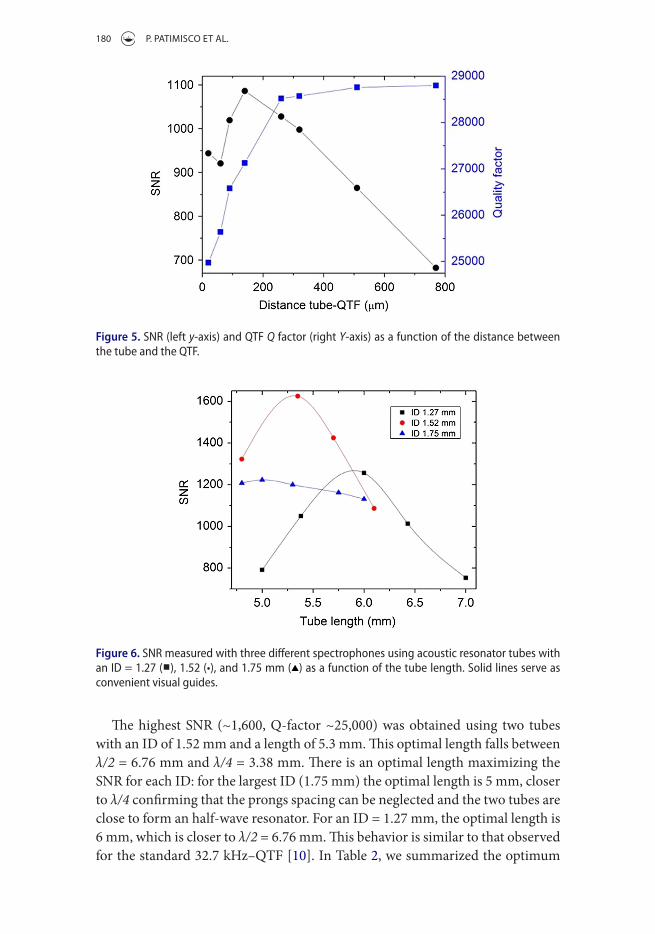
A more comprehensive study of the impact of the tubes geometry on the QEPAS sensor performance will be described in this work by employing QTF#4 operating in the 1st overtone mode. First, we investigated how the distance between the tubes and the QTF affects the SNR and the Q-factor. In Figure 5, we depict the SNR and Q-factor values measured as a function of the distance between the QTF and the tubes, ranging between 20 and 770 μm. Data were obtained using a pair of tubes whose ID and length were 1.52 and 6.1 mm, respectively.
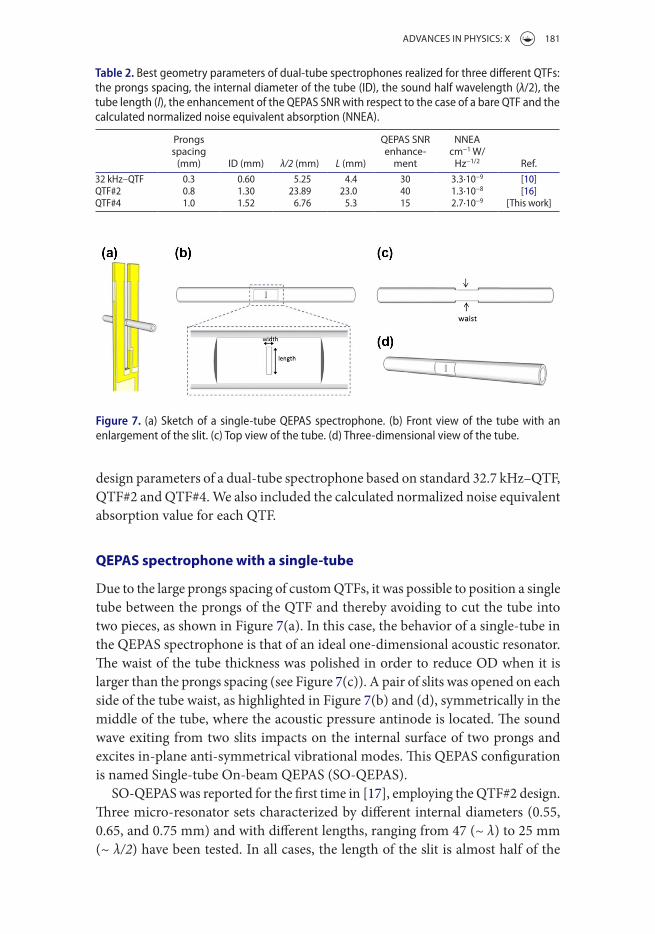
The distance maximizing the SNR (~1090) is 140 μm and corresponds to a Q-factor of ~27,100. The Q-factor approaches asymptotically the bare QTF value (28,900) when the distance between the tubes and the QTF becomes larger than 500 μm and rapidly decreases when this distance is reduced, confirming that the shorter the QTF-tube distance the higher is the acoustical coupling between them. When the distance is shorter than 140 μm, the SNR decreases because of damping effects generated by the proximity of the tube end to the surface of the QTF. Subsequently, we implemented tubes with three different IDs: 1.27, 1.52, and 1.75 mm. For each ID, a set of tubes with different length, varying from 4.8 to 7 mm was tested. In all cases, both tubes were positioned 140 μm distant from the QTF based on previous results. In Figure, 6we show the observed data.
180 P. PATIMISCO ET AL.
The highest SNR (~1,600, Q-factor ~25,000) was obtained using two tubes with an ID of 1.52 mm and a length of 5.3 mm. This optimal length falls between λ/2 = 6.76 mm and λ/4 = 3.38 mm. There is an optimal length maximizing the SNR for each ID: for the largest ID (1.75 mm) the optimal length is 5 mm, closer to λ/4 confirming that the prongs spacing can be neglected and the two tubes are close to form an half-wave resonator. For an ID = 1.27 mm, the optimal length is 6 mm, which is closer to λ/2 = 6.76 mm. This behavior is similar to that observed for the standard 32.7 kHz–QTF [10]. In Table 2, we summarized the optimum
Figure 5. snR (left y-axis) and QTF Q factor (right Y-axis) as a function of the distance between the tube and the QTF.
Figure 6. snR measured with three different spectrophones using acoustic resonator tubes with an id = 1.27 (■), 1.52 (•), and 1.75 mm (▴) as a function of the tube length. solid lines serve as convenient visual guides.
ADVANCES IN PHYSICS: X 181
design parameters of a dual-tube spectrophone based on standard 32.7 kHz–QTF, QTF#2 and QTF#4. We also included the calculated normalized noise equivalent absorption value for each QTF.
QEPAS spectrophone with a single-tube
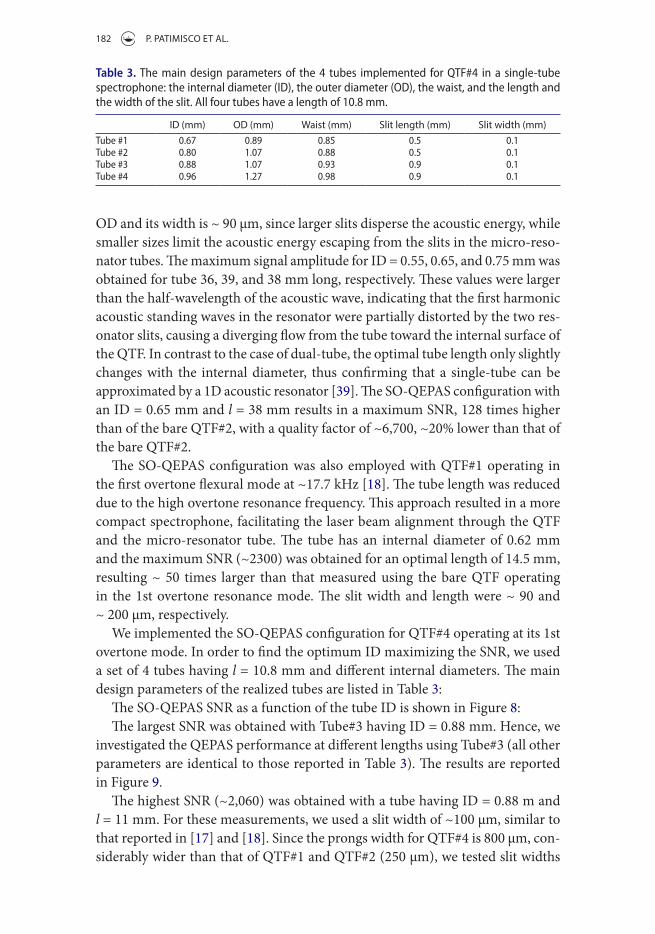
Due to the large prongs spacing of custom QTFs, it was possible to position a single tube between the prongs of the QTF and thereby avoiding to cut the tube into two pieces, as shown in Figure 7(a). In this case, the behavior of a single-tube in the QEPAS spectrophone is that of an ideal one-dimensional acoustic resonator. The waist of the tube thickness was polished in order to reduce OD when it is larger than the prongs spacing (see Figure 7(c)). A pair of slits was opened on each side of the tube waist, as highlighted in Figure 7(b) and (d), symmetrically in the middle of the tube, where the acoustic pressure antinode is located. The sound wave exiting from two slits impacts on the internal surface of two prongs and excites in-plane anti-symmetrical vibrational modes. This QEPAS configuration is named Single-tube On-beam QEPAS (SO-QEPAS).
SO-QEPAS was reported for the first time in [17], employing the QTF#2 design. Three micro-resonator sets characterized by different internal diameters (0.55, 0.65, and 0.75 mm) and with different lengths, ranging from 47 (~ λ) to 25 mm (~ λ/2) have been tested. In all cases, the length of the slit is almost half of the
Table 2. Best geometry parameters of dual-tube spectrophones realized for three different QTFs: the prongs spacing, the internal diameter of the tube (id), the sound half wavelength (λ/2), the tube length (l), the enhancement of the QePAs snR with respect to the case of a bare QTF and the calculated normalized noise equivalent absorption (nneA).
Prongs spacing
(mm) ID (mm) λ/2 (mm) L (mm)
QEPAS SNR enhance-
ment
NNEA cm−1 W/
Hz−1/2 Ref.32 khz–QTF 0.3 0.60 5.25 4.4 30 3.3·10−9 [10]QTF#2 0.8 1.30 23.89 23.0 40 1.3·10−8 [16]QTF#4 1.0 1.52 6.76 5.3 15 2.7·10−9 [This work]
Figure 7. (a) sketch of a single-tube QePAs spectrophone. (b) Front view of the tube with an enlargement of the slit. (c) Top view of the tube. (d) Three-dimensional view of the tube.
182 P. PATIMISCO ET AL.
OD and its width is ~ 90 μm, since larger slits disperse the acoustic energy, while smaller sizes limit the acoustic energy escaping from the slits in the micro-reso-nator tubes. The maximum signal amplitude for ID = 0.55, 0.65, and 0.75 mm was obtained for tube 36, 39, and 38 mm long, respectively. These values were larger than the half-wavelength of the acoustic wave, indicating that the first harmonic acoustic standing waves in the resonator were partially distorted by the two res-onator slits, causing a diverging flow from the tube toward the internal surface of the QTF. In contrast to the case of dual-tube, the optimal tube length only slightly changes with the internal diameter, thus confirming that a single-tube can be approximated by a 1D acoustic resonator [39]. The SO-QEPAS configuration with an ID = 0.65 mm and l = 38 mm results in a maximum SNR, 128 times higher than of the bare QTF#2, with a quality factor of ~6,700, ~20% lower than that of the bare QTF#2.
The SO-QEPAS configuration was also employed with QTF#1 operating in the first overtone flexural mode at ~17.7 kHz [18]. The tube length was reduced due to the high overtone resonance frequency. This approach resulted in a more compact spectrophone, facilitating the laser beam alignment through the QTF and the micro-resonator tube. The tube has an internal diameter of 0.62 mm and the maximum SNR (~2300) was obtained for an optimal length of 14.5 mm, resulting ~ 50 times larger than that measured using the bare QTF operating in the 1st overtone resonance mode. The slit width and length were ~ 90 and ~ 200 μm, respectively.
We implemented the SO-QEPAS configuration for QTF#4 operating at its 1st overtone mode. In order to find the optimum ID maximizing the SNR, we used a set of 4 tubes having l = 10.8 mm and different internal diameters. The main design parameters of the realized tubes are listed in Table 3:
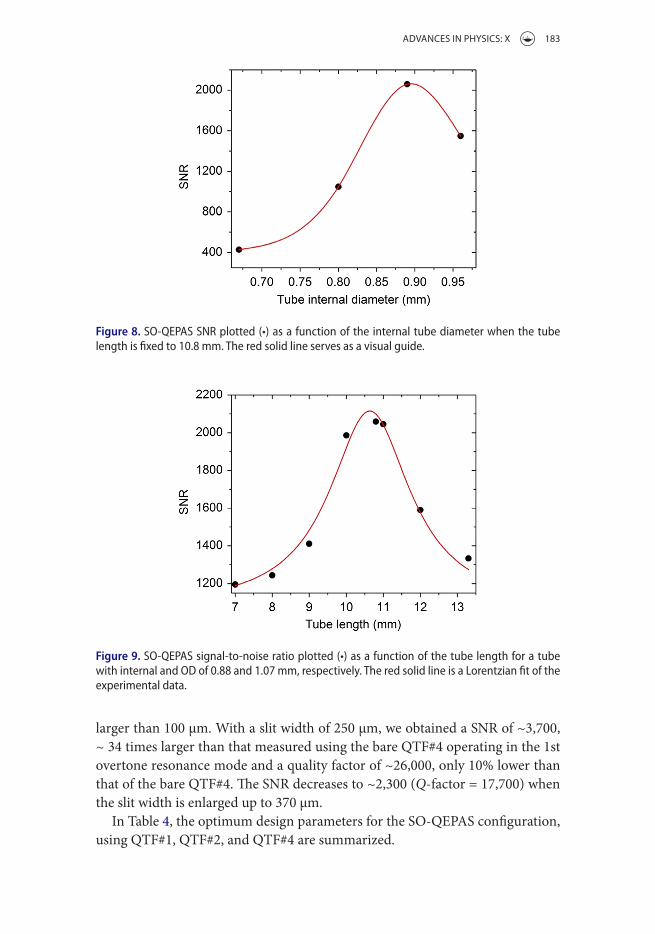
The SO-QEPAS SNR as a function of the tube ID is shown in Figure 8:The largest SNR was obtained with Tube#3 having ID = 0.88 mm. Hence, we
investigated the QEPAS performance at different lengths using Tube#3 (all other parameters are identical to those reported in Table 3). The results are reported in Figure 9.
The highest SNR (~2,060) was obtained with a tube having ID = 0.88 m and l = 11 mm. For these measurements, we used a slit width of ~100 μm, similar to that reported in [17] and [18]. Since the prongs width for QTF#4 is 800 μm, con-siderably wider than that of QTF#1 and QTF#2 (250 μm), we tested slit widths
Table 3. The main design parameters of the 4 tubes implemented for QTF#4 in a single-tube spectrophone: the internal diameter (id), the outer diameter (Od), the waist, and the length and the width of the slit. All four tubes have a length of 10.8 mm.
ID (mm) OD (mm) Waist (mm) Slit length (mm) Slit width (mm)Tube #1 0.67 0.89 0.85 0.5 0.1Tube #2 0.80 1.07 0.88 0.5 0.1Tube #3 0.88 1.07 0.93 0.9 0.1Tube #4 0.96 1.27 0.98 0.9 0.1
ADVANCES IN PHYSICS: X 183
larger than 100 μm. With a slit width of 250 μm, we obtained a SNR of ~3,700, ~ 34 times larger than that measured using the bare QTF#4 operating in the 1st overtone resonance mode and a quality factor of ~26,000, only 10% lower than that of the bare QTF#4. The SNR decreases to ~2,300 (Q-factor = 17,700) when the slit width is enlarged up to 370 μm.
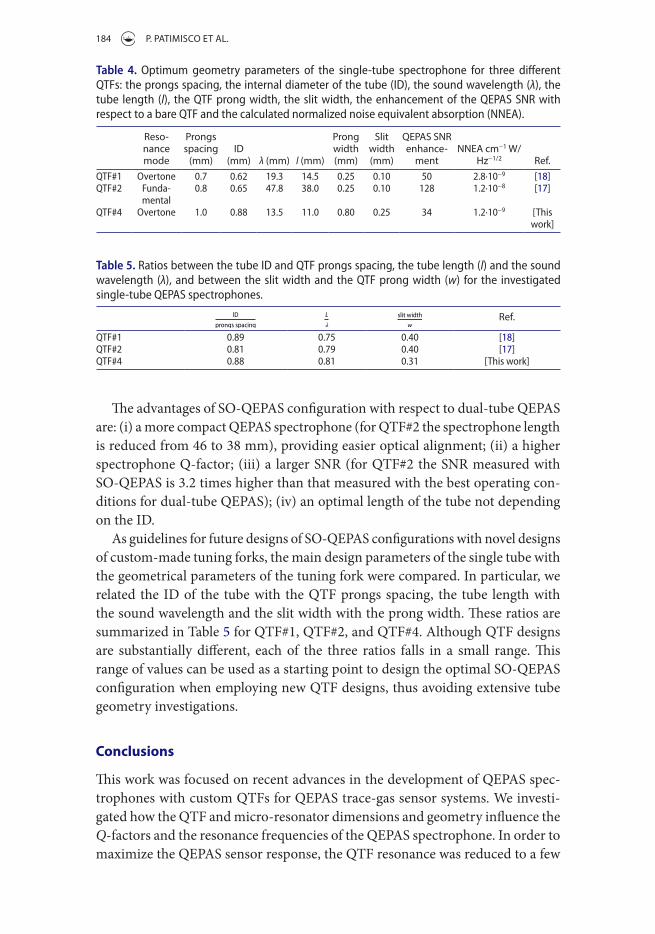
In Table 4, the optimum design parameters for the SO-QEPAS configuration, using QTF#1, QTF#2, and QTF#4 are summarized.
Figure 8. sO-QePAs snR plotted (•) as a function of the internal tube diameter when the tube length is fixed to 10.8 mm. The red solid line serves as a visual guide.
Figure 9. sO-QePAs signal-to-noise ratio plotted (•) as a function of the tube length for a tube with internal and Od of 0.88 and 1.07 mm, respectively. The red solid line is a Lorentzian fit of the experimental data.
184 P. PATIMISCO ET AL.
The advantages of SO-QEPAS configuration with respect to dual-tube QEPAS are: (i) a more compact QEPAS spectrophone (for QTF#2 the spectrophone length is reduced from 46 to 38 mm), providing easier optical alignment; (ii) a higher spectrophone Q-factor; (iii) a larger SNR (for QTF#2 the SNR measured with SO-QEPAS is 3.2 times higher than that measured with the best operating con-ditions for dual-tube QEPAS); (iv) an optimal length of the tube not depending on the ID.
As guidelines for future designs of SO-QEPAS configurations with novel designs of custom-made tuning forks, the main design parameters of the single tube with the geometrical parameters of the tuning fork were compared. In particular, we related the ID of the tube with the QTF prongs spacing, the tube length with the sound wavelength and the slit width with the prong width. These ratios are summarized in Table 5 for QTF#1, QTF#2, and QTF#4. Although QTF designs are substantially different, each of the three ratios falls in a small range. This range of values can be used as a starting point to design the optimal SO-QEPAS configuration when employing new QTF designs, thus avoiding extensive tube geometry investigations.
Conclusions
This work was focused on recent advances in the development of QEPAS spec-trophones with custom QTFs for QEPAS trace-gas sensor systems. We investi-gated how the QTF and micro-resonator dimensions and geometry influence the Q-factors and the resonance frequencies of the QEPAS spectrophone. In order to maximize the QEPAS sensor response, the QTF resonance was reduced to a few
Table 5. Ratios between the tube id and QTF prongs spacing, the tube length (l) and the sound wavelength (λ), and between the slit width and the QTF prong width (w) for the investigated single-tube QePAs spectrophones.
ID
prongs spacing
L
�
slit width
w
Ref.
QTF#1 0.89 0.75 0.40 [18]QTF#2 0.81 0.79 0.40 [17]QTF#4 0.88 0.81 0.31 [This work]
Table 4. Optimum geometry parameters of the single-tube spectrophone for three different QTFs: the prongs spacing, the internal diameter of the tube (id), the sound wavelength (λ), the tube length (l), the QTF prong width, the slit width, the enhancement of the QePAs snR with respect to a bare QTF and the calculated normalized noise equivalent absorption (nneA).
Reso-nance mode
Prongs spacing
(mm)ID
(mm) λ (mm) l (mm)
Prong width (mm)
Slit width (mm)
QEPAS SNR enhance-
mentNNEA cm−1 W/
Hz−1/2 Ref.QTF#1 Overtone 0.7 0.62 19.3 14.5 0.25 0.10 50 2.8·10−9 [18]QTF#2 Funda-
mental0.8 0.65 47.8 38.0 0.25 0.10 128 1.2·10−8 [17]
QTF#4 Overtone 1.0 0.88 13.5 11.0 0.80 0.25 34 1.2·10−9 [This work]
ADVANCES IN PHYSICS: X 185
kHz to permit the thermal waves to follow changes of the laser-induced excita-tion. A decreasing of the fundamental resonance frequency allows the use of the 1st overtone resonance for QEPAS sensing. Since fundamental and 1st overtone modes resonances undergo different losses mechanisms, it is possible to design QTFs providing higher Q-factor for the 1st overtone mode with respect to the fundamental mode and vice versa. Furthermore, the prongs spacing was increased with respect to the standard 32.7 kHz–QTF in order to reduce the noise due to the laser light hitting the internal surface of the micro-resonator tubes and the QTF. Two different QEPAS spectrophone configurations were analyzed and discussed: a dual-tube spectrophone, with two tubes aligned on both sides of the QTF, and a single-tube spectrophone, with one tube inserted between the prongs of the QTF. The optimal results were obtained using a single-tube configuration, which allows improving the signal-to-noise ratio up to two orders of magnitude with respect to a bare QTF. Furthermore, this approach reduces the spectrophone size compared to a traditional dual-tube spectrophone configuration, thereby facilitating laser beam alignment.
When operating with the 1st overtone QTF resonance, further improvements in the detection sensitivity can be expected by designing and implementing an octupole gold pattern configuration in order to increase the charge collection efficiency [40]. Finally, inserting a QEPAS spectrophone within a high-finesse power build-up cavity can further increase the effective optical pathlength and correspondingly the ultimate QEPAS detection sensitivity [41,42].
Acknowledgements
Frank Tittel acknowledges support by the Welch Foundation (Grant R4925S). The authors from Dipartimento Interateneo di Fisica di Bari acknowledge financial support from two Italian research projects: PON02 00675 and PON02 00576.
Disclosure statement
No potential conflict of interest was reported by the authors.
Funding
This work was supported by the Welch Foundation [grant number R4925S] to Frank Tittel. The authors from Dipartimento Interateneo di Fisica di Bari are financially support from two Italian research projects [grant number PON02 00675], [grant number PON02 00576].
ORCID
Pietro Patimisco http://orcid.org/0000-0002-7822-2397Frank K. Tittel http://orcid.org/0000-0003-2245-7565Vincenzo Spagnolo http://orcid.org/0000-0002-4867-8166
186 P. PATIMISCO ET AL.
References
[1] J.-M. Friedt and É. Carry, Am. J. Phys. 75 (2007) p.415. [2] A.A. Kosterev, Y.A. Bakhirkin, R.F. Curl and F.K. Tittel, Opt. Lett. 27 (2002) p.1902. [3] A.A. Kosterev, F.K. Tittel, D. Serebryakov, A. Malinovsky and A. Morozov, Rev. Sci.
Instrum. 76 (2005) p.043105. [4] www.statek.com [5] W.H. Flygare, Acc. Chem. Res. 1 (1968) p.121. [6] P. Patimisco, G. Scamarcio, F.K. Tittel and V. Spagnolo, Sensors 14 (2014) p.6165. [7] K. Liu, X. Guo, H. Yi, W. Chen, W. Zhang and X. Gao, Opt. Lett. 34 (2009) p.1594. [8] M. Lassen, L. Lamard, Y. Feng, A. Peremans and J.C. Petersen, Opt. Lett. 41 (2016) p.4118. [9] Z. Li, C. Shi and W. Ren, Opt. Lett. 41 (2016) p.4095.[10] L. Dong, A.A. Kosterev, D. Thomazy and F.K. Tittel, Appl. Phys. B 100 (2010) p.627.[11] H. Wu, L. Dong, W. Ren, W. Yin, W. Ma, L. Zhang, S. Jia and F.K. Tittel, Sens. Actuat.
B-Chem. 206 (2015) p.364.[12] V. Spagnolo, A.A. Kosterev, L. Dong, R. Lewicki and F.K. Tittel, Appl. Phys. B 100 (2010)
p.125.[13] V. Spagnolo, P. Patimisco, S. Borri, G. Scamarcio, B.E. Bernacki and J. Kriesel, Appl. Phys.
B 112 (2013) p.25.[14] S. Borri, P. Patimisco, A. Sampaolo, H.E. Beere, D.A. Ritchie, M.S. Vitiello, G. Scamarcio
and V. Spagnolo, Appl. Phys. Lett. 103 (2013) p.021105.[15] P. Patimisco, S. Borri, A. Sampaolo, H.E. Beere, D.A. Ritchie, M.S. Vitiello, G. Scamarcio
and V. Spagnolo, Analyst 139 (2014) p.2079.[16] H. Wu, A. Sampaolo, L. Dong, P. Patimisco, X. Liu, H. Zheng, X. Yin, W. Ma, L. Zhang,
W. Yin, V. Spagnolo, S. Jia and F.K. Tittel, Appl. Phys. Lett. 107 (2015) p.111104.[17] H. Zheng, L. Dong, A. Sampaolo, H. Wu, P. Patimisco, X. Yin, W. Ma, L. Zhang, W. Yin,
V. Spagnolo, S. Jia and F.K. Tittel, Opt. Lett. 41 (2016) p.978.[18] H. Zheng, L. Dong, A. Sampaolo, H. Wu, P. Patimisco, W. Ma, L. Zhang, W. Yin, L. Xiao,
V. Spagnolo, S. Jia and F.K. Tittel, Appl. Phys. Lett. 109 (2016) p.111103.[19] T.D. Rossing, D.A. Russell and D.E. Brown, Am. J. Phys. 60 (1992) p.620.[20] G. Wysocki, A.A. Kosterev and F.K. Tittel, Appl. Phys. B 85 (2006) p.301.[21] A.A. Kosterev, T.S. Mosely and F.K. Tittel, Appl. Phys. B 85 (2006) p.295.[22] V. Spagnolo, P. Patimisco, S. Borri, G. Scamarcio, B.E. Bernacki and J. Kriesel, Opt. Lett.
37 (2012) p.4461.[23] A. Sampaolo, P. Patimisco, J.M. Kriesel, F.K. Tittel, G. Scamarcio and V. Spagnolo, Opt.
Express 23 (2015) p.195.[24] P. Patimisco, V. Spagnolo, M.S. Vitiello, A. Tredicucci, G. Scamarcio, C.M. Bledt and J.A.
Harrington, Sensors 13 (2013) p.1329.[25] M. Siciliani de Cumis, S. Viciani, S. Borri, P. Patimisco, A. Sampaolo, G. Scamarcio, P. De
Natale, F. D’Amato and V. Spagnolo, Opt. Express 21 (2014) p.28222.[26] S. Bottger, M. Koehring, U. Willer and W. Schade, Appl. Phys. B 113 (2013) p.227.[27] V. Spagnolo, P. Patimisco, R. Pennetta, A. Sampaolo, G. Scamarcio, M.S. Vitiello and F.K.
Tittel, Opt. Express 23 (2015) p.7574.[28] A. Sampaolo, P. Patimisco, M. Giglio, M.S. Vitiello, H.E. Beere, D.A. Ritchie, G. Scamarcio,
F.K. Tittel and V. Spagnolo, Sensors 16 (2016) p.439.[29] P. Patimisco, A. Sampaolo, L. Dong, M. Giglio, G. Scamarcio, F.K. Tittel and V. Spagnolo,
Sens. Actuat. B-Chem. 227 (2016) p.539.[30] M. Christen, Sens. Actuat. 4 (1983) p.555.[31] G. Aoust, R. Levy, B. Verlhac and O. Le Traon, Sensor. Actuat. A-Phys. 243 (2016) p.134.[32] Z. Hao, A. Erbil and F. Ayazi, Sens. Actuat. A-Phys. 109 (2003) p.156.
ADVANCES IN PHYSICS: X 187
[33] A. Sampaolo, P. Patimisco, L. Dong, A. Geras, G. Scamarcio, T. Starecki, F.K. Tittel and V. Spagnolo, Appl. Phys. Lett. 107 (2015) p.231102.
[34] H. Hosaka, K. Itao and S. Kuroda, Sens. Actuat. A-Phys. 49 (1995) p.87.[35] F.K. Tittel, A. Sampaolo, P. Patimisco, L. Dong, A. Geras, T. Starecki and V. Spagnolo,
Opt. Express 24 (2016) p.A682.[36] L.S. Rothman, I.E. Gordon, Y. Babikov, A. Barbe, D. Chris Benner, P.F. Bernath,
M. Birk, L. Bizzocchi, V. Boudon, L.R. Brown, A. Campargue, K. Chance, E.A. Cohen, L.H. Coudert and V.M. Devi, B.J. Drouin, A. Fayt, J.-M. Flaud, R.R. Gamache, J.J. Harrison, J.-M. Hartmann, C. Hill, J.T. Hodges, D. Jacquemart, A. Jolly, J. Lamouroux, R.J. Le Roy, G. Li, D.A. Long, O.M. Lyulin, C.J. Mackie, S.T. Massie, S. Mikhailenko, H.S.P. Müller, O.V. Naumenko, A.V. Nikitin, J. Orphal, V. Perevalov, A. Perrin, E.R. Polovtseva, C. Richard, M.A.H. Smith, E. Starikova, K. Sung, S. Tashkun, J. Tennyson, G.C. Toon, V.G. Tyuterev and G. Wagner, J. Quant. Spectros. Radiat. Transfer 130 (2013) p.4.
[37] S. Schilt, L. Thévenaz and P. Robert, Appl. Opt. 42 (2003) p.6728.[38] M.J. Moloney and D.L. Hatten, Am. J. Phys. 69 (2001) p.311.[39] D.V. Serebryakov, I.V. Morozov, A.A. Kosterev and V.S. Letokhov, Quant. Electron 40
(2010) p.167.[40] S.S. Chuang, in Proceeding 35th Annual Frequency Control Symposium, eds, Institute of
Electrical and Electronics Engineers, New York, 1981, p.130.[41] S. Borri, P. Patimisco, I. Galli, D. Mazzotti, G. Giusfredi, N. Akikusa, M. Yamanishi,
G. Scamarcio, P. De Natale and V. Spagnolo, Appl. Phys. Lett. 104 (2014) p.091114.[42] P. Patimisco, S. Borri, I. Galli, D. Mazzotti, G. Giusfredi, N. Akikusa, M. Yamanishi,
G. Scamarcio, P. De Natale and V. Spagnolo, Analyst 140 (2015) p.736.