Embed Size (px)
DESCRIPTION
advertising-effectiveness-benchmarks-and-best-practices
Citation preview
© comScore, Inc. Proprietary.
Advertising Effectiveness:
Benchmarks and Best Practices
A review of the latest benchmarks and best practices
Joe Nguyen, Senior Vice President, Asia Pacific | 26 June 2014
t: @jnguyen
© comScore, Inc. Proprietary. 2
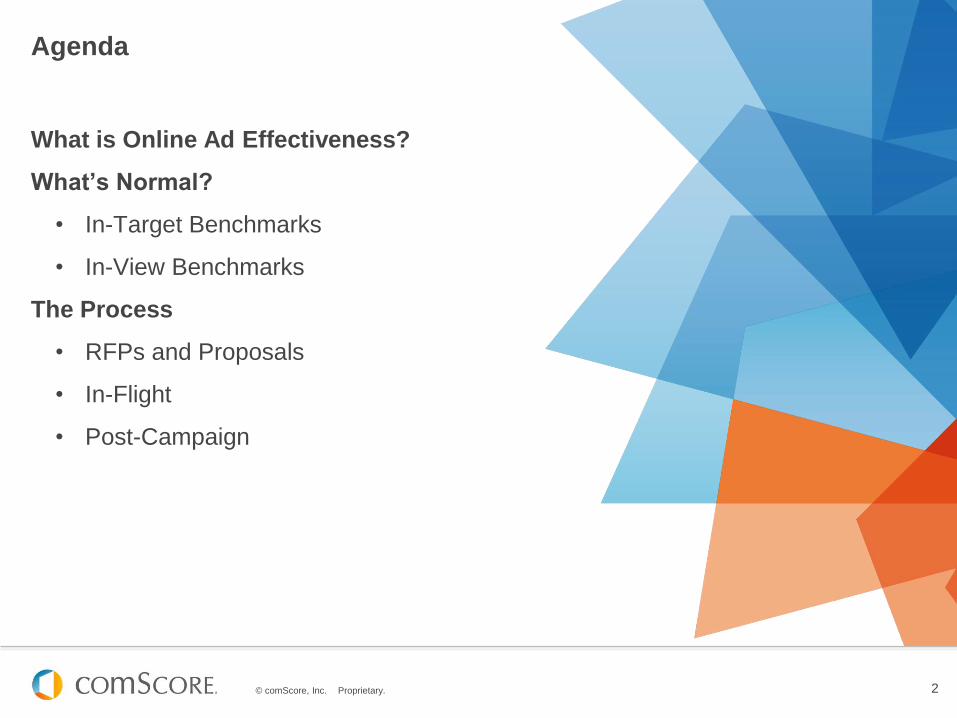
Agenda
What is Online Ad Effectiveness?
What’s Normal?
• In-Target Benchmarks
• In-View Benchmarks
The Process
• RFPs and Proposals
• In-Flight
• Post-Campaign
© comScore, Inc. Proprietary. 3
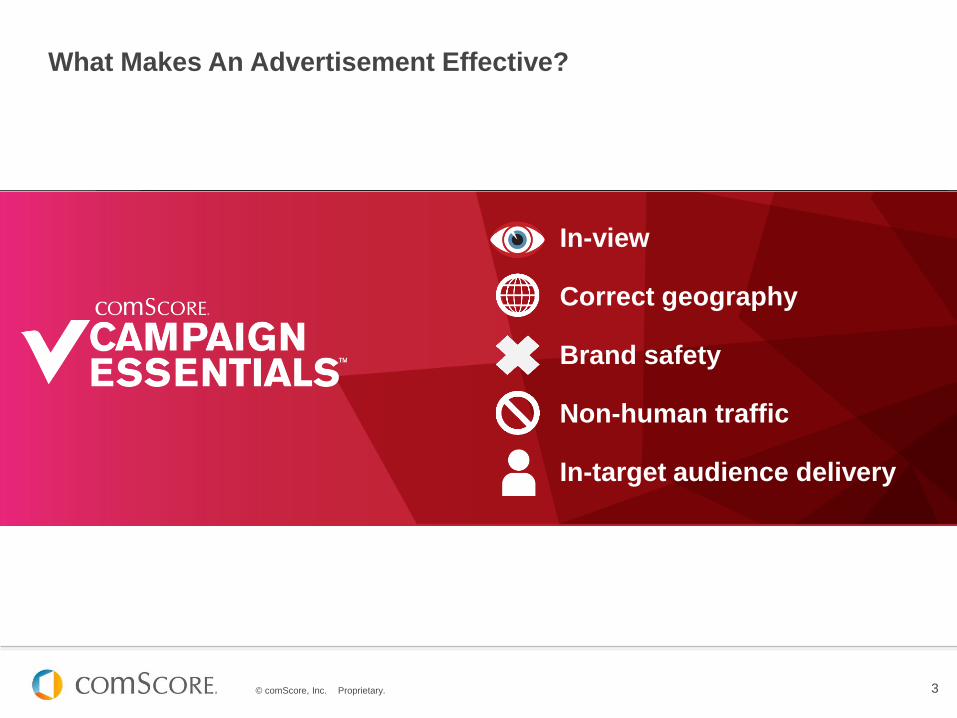
In-view
Correct geography
Brand safety
Non-human traffic
In-target audience delivery
What Makes An Advertisement Effective?
© comScore, Inc. Proprietary. 4
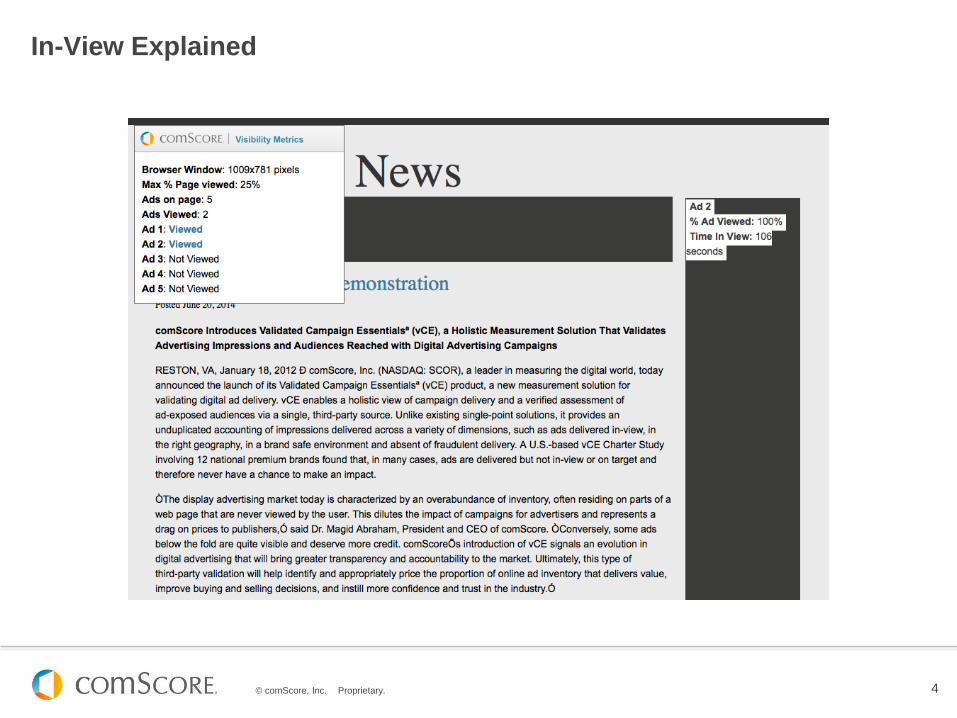
In-View Explained
© comScore, Inc. Proprietary. 5
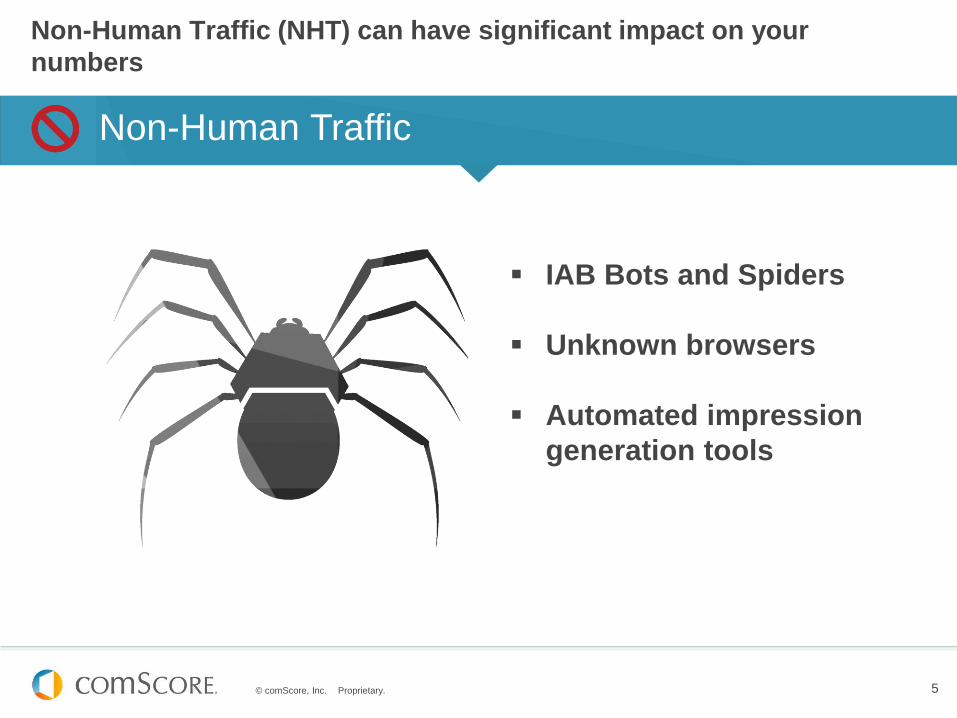
Non-Human Traffic (NHT) can have significant impact on your
numbers
Non-Human Traffic
IAB Bots and Spiders
Unknown browsers
Automated impression
generation tools
© comScore, Inc. Proprietary. © comScore, Inc. Proprietary.
What’s Normal?
In-Target Benchmarks
The latest data from comScore validated Campaign Essentials™
© comScore, Inc. Proprietary. 7
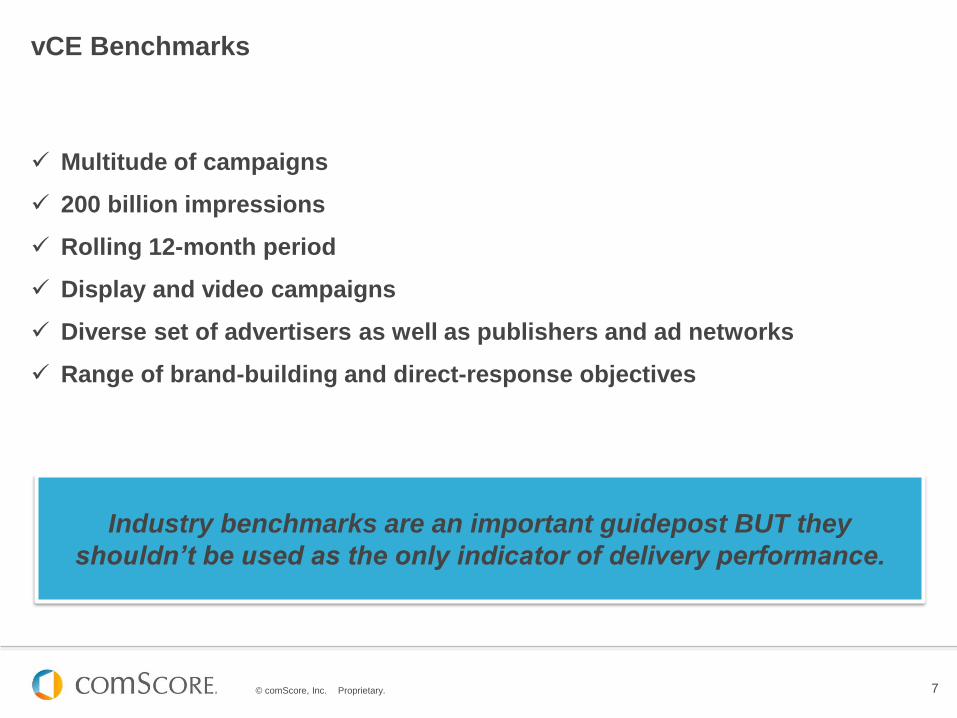
Multitude of campaigns
200 billion impressions
Rolling 12-month period
Display and video campaigns
Diverse set of advertisers as well as publishers and ad networks
Range of brand-building and direct-response objectives
vCE Benchmarks
Industry benchmarks are an important guidepost BUT they
shouldn’t be used as the only indicator of delivery performance.
© comScore, Inc. Proprietary. 8
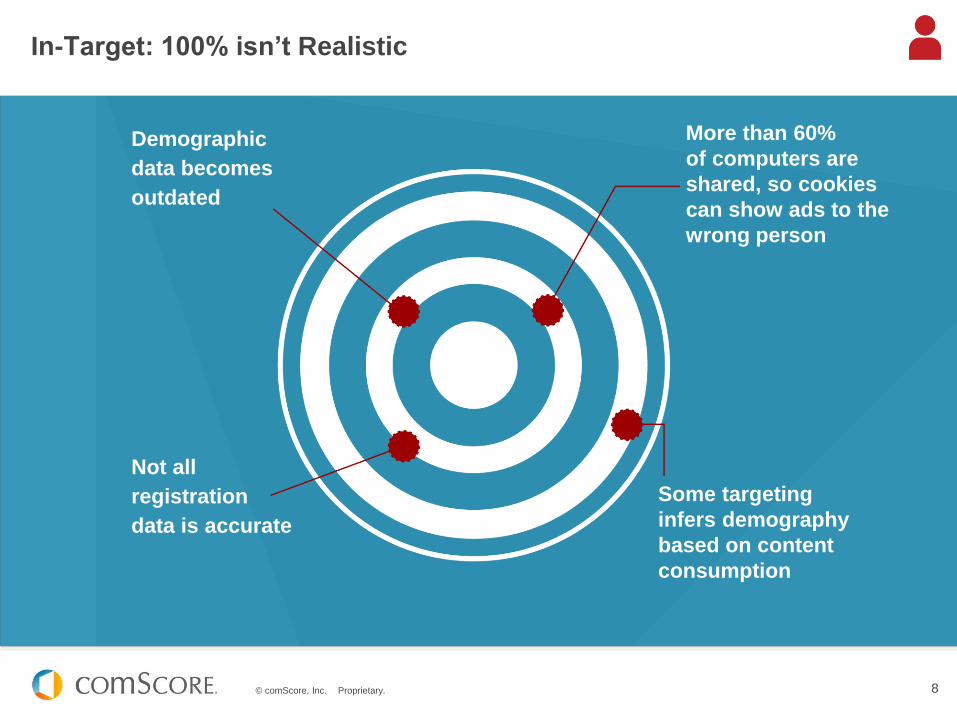
In-Target: 100% isn’t Realistic
Demographic
data becomes
outdated
Not all
registration
data is accurate
More than 60%
of computers are
shared, so cookies
can show ads to the
wrong person
Some targeting
infers demography
based on content
consumption
© comScore, Inc. Proprietary. 9
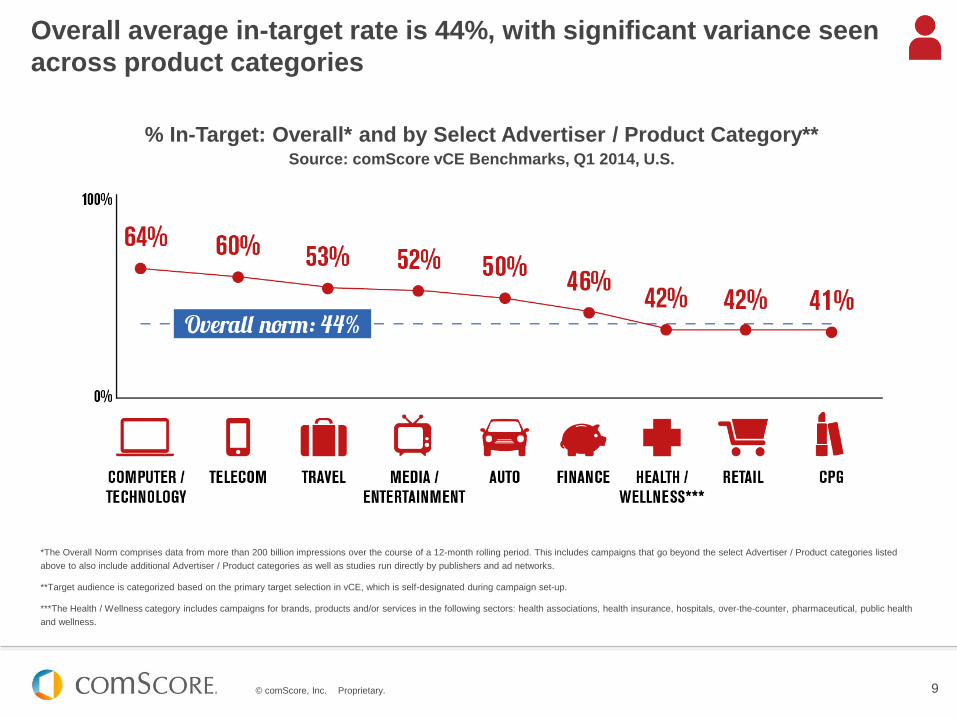
*The Overall Norm comprises data from more than 200 billion impressions over the course of a 12-month rolling period. This includes campaigns that go beyond the select Advertiser / Product categories listed
above to also include additional Advertiser / Product categories as well as studies run directly by publishers and ad networks.
**Target audience is categorized based on the primary target selection in vCE, which is self-designated during campaign set-up.
***The Health / Wellness category includes campaigns for brands, products and/or services in the following sectors: health associations, health insurance, hospitals, over-the-counter, pharmaceutical, public health
and wellness.
Overall average in-target rate is 44%, with significant variance seen
across product categories
% In-Target: Overall* and by Select Advertiser / Product Category** Source: comScore vCE Benchmarks, Q1 2014, U.S.
© comScore, Inc. Proprietary. 10
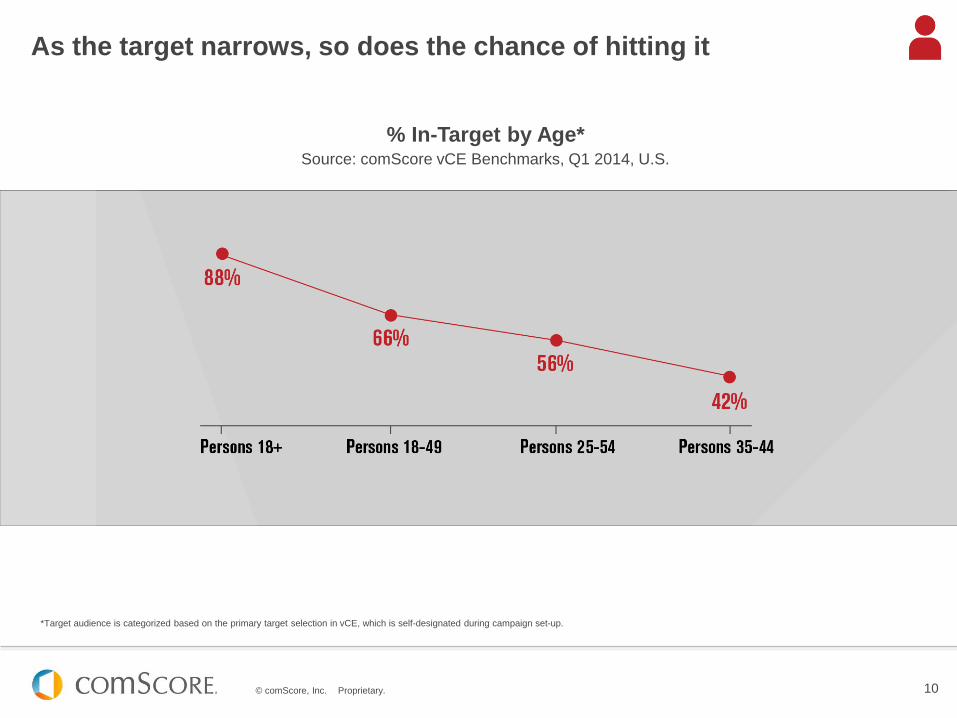
As the target narrows, so does the chance of hitting it
% In-Target by Age* Source: comScore vCE Benchmarks, Q1 2014, U.S.
*Target audience is categorized based on the primary target selection in vCE, which is self-designated during campaign set-up.
© comScore, Inc. Proprietary. 11
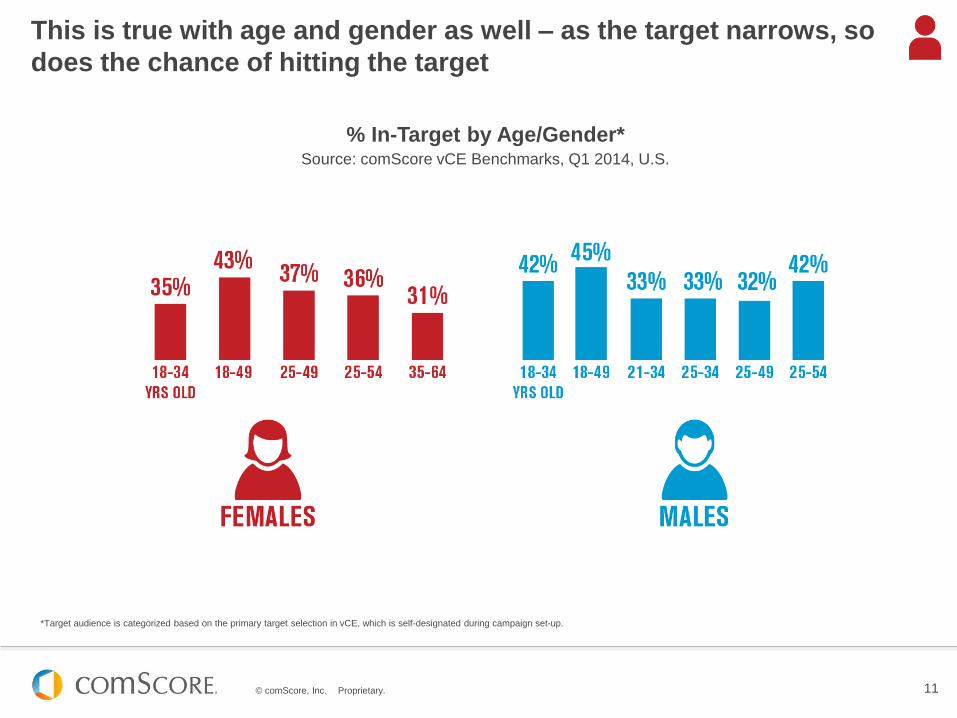
This is true with age and gender as well – as the target narrows, so
does the chance of hitting the target
% In-Target by Age/Gender* Source: comScore vCE Benchmarks, Q1 2014, U.S.
*Target audience is categorized based on the primary target selection in vCE, which is self-designated during campaign set-up.
© comScore, Inc. Proprietary. 12
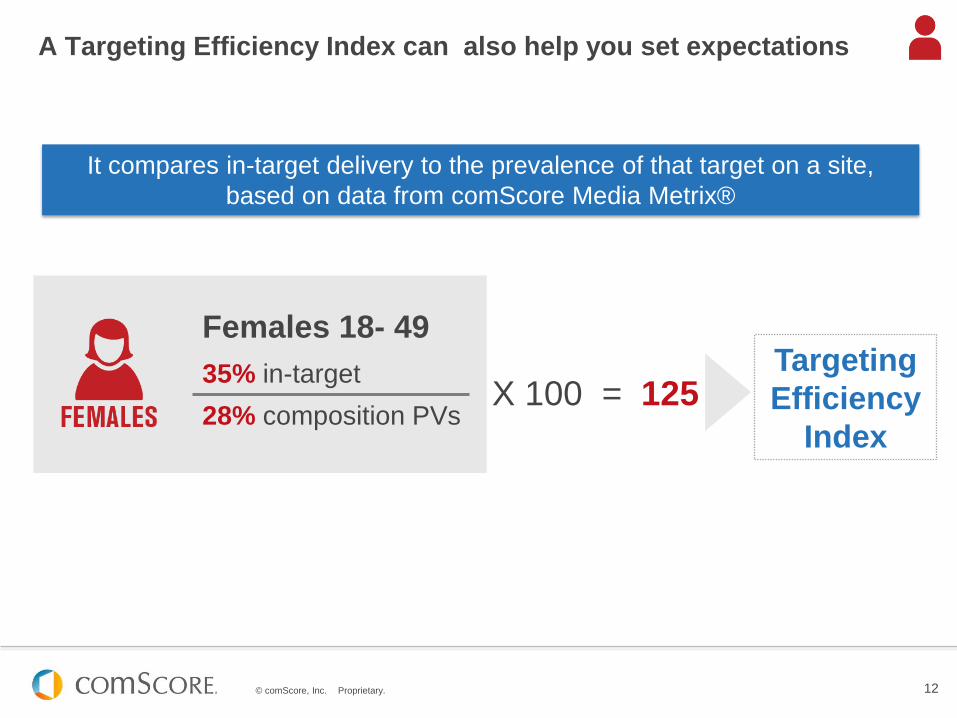
A Targeting Efficiency Index can also help you set expectations
It compares in-target delivery to the prevalence of that target on a site,
based on data from comScore Media Metrix®
Females 18- 49
35% in-target
28% composition PVs
Targeting
Efficiency
Index
X 100 = 125
© comScore, Inc. Proprietary. © comScore, Inc. Proprietary.
What’s Normal?
In-View Benchmarks
The latest data from comScore validated Campaign Essentials
© comScore, Inc. Proprietary. 14
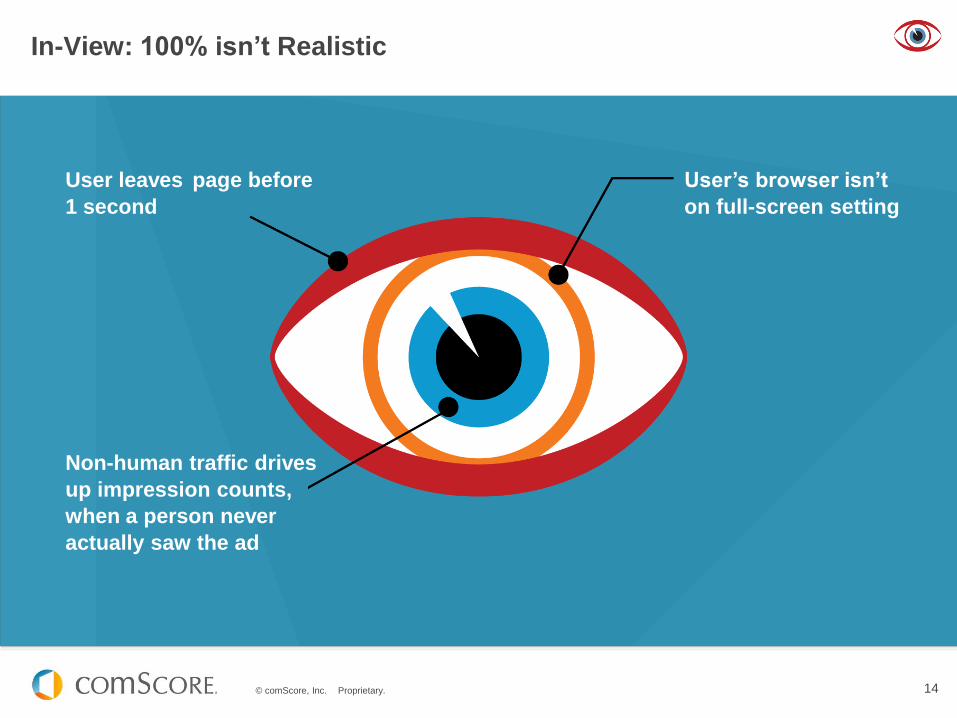
In-View: 100% isn’t Realistic
User leaves page before
1 second User’s browser isn’t
on full-screen setting
Non-human traffic drives
up impression counts,
when a person never
actually saw the ad
© comScore, Inc. Proprietary. 15
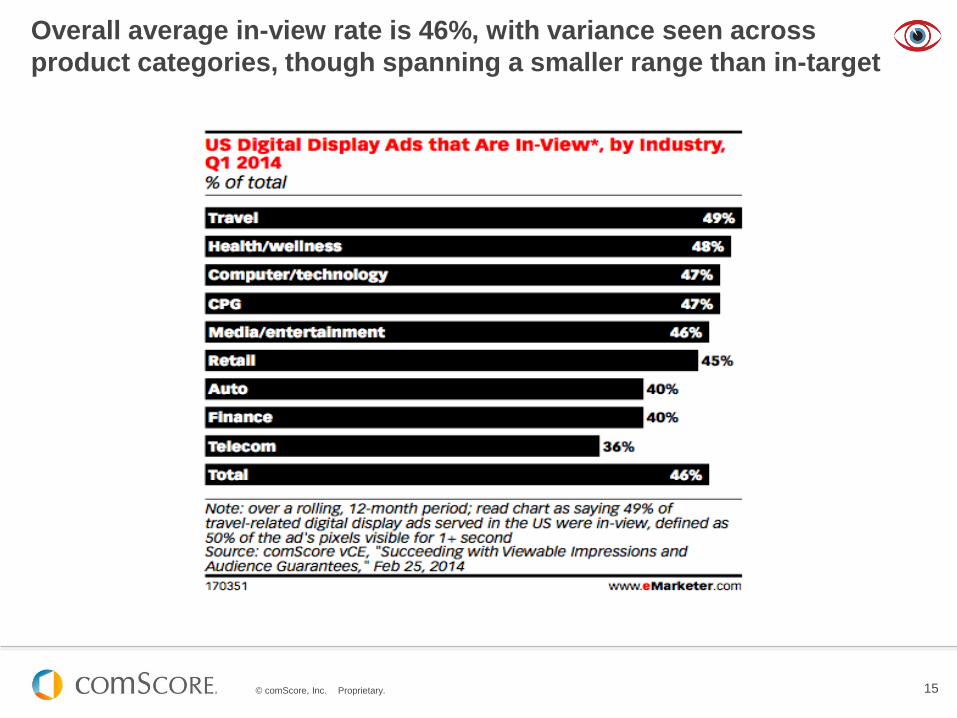
Overall average in-view rate is 46%, with variance seen across
product categories, though spanning a smaller range than in-target
© comScore, Inc. Proprietary. 16
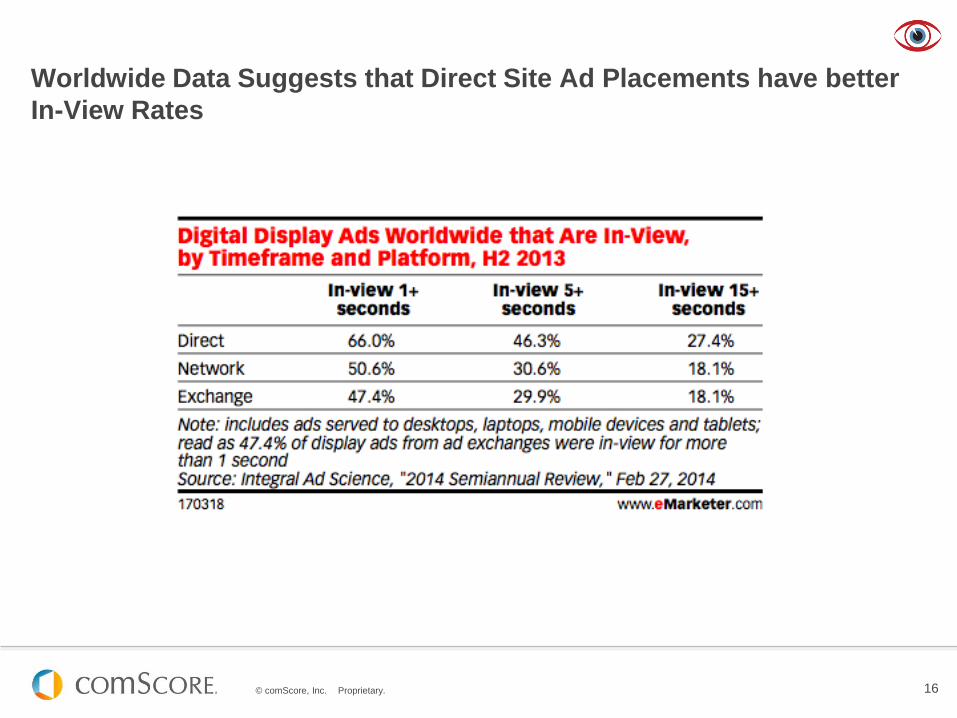
Worldwide Data Suggests that Direct Site Ad Placements have better
In-View Rates
© comScore, Inc. Proprietary. © comScore, Inc. Proprietary.
The Process: RFPs & Proposals
Best practices for outlining campaign goals, setting expectations and eliminating painful
post-campaign renegotiations
© comScore, Inc. Proprietary. 18
Audience Considerations
© comScore, Inc. Proprietary. 19
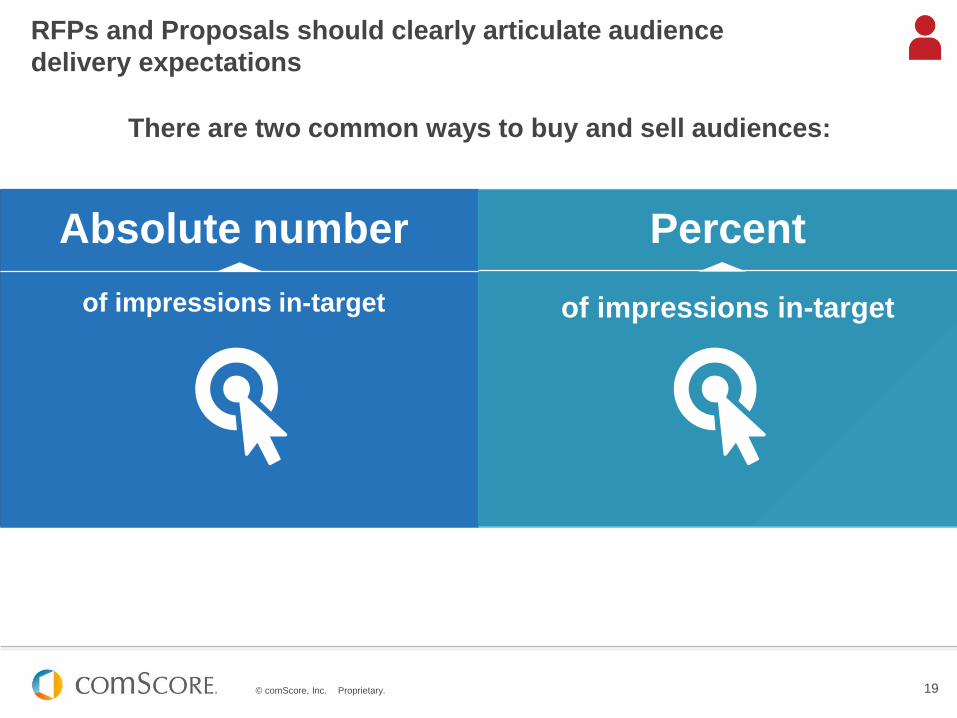
RFPs and Proposals should clearly articulate audience
delivery expectations
Absolute number
of impressions in-target
Percent
of impressions in-target
There are two common ways to buy and sell audiences:
© comScore, Inc. Proprietary. 20
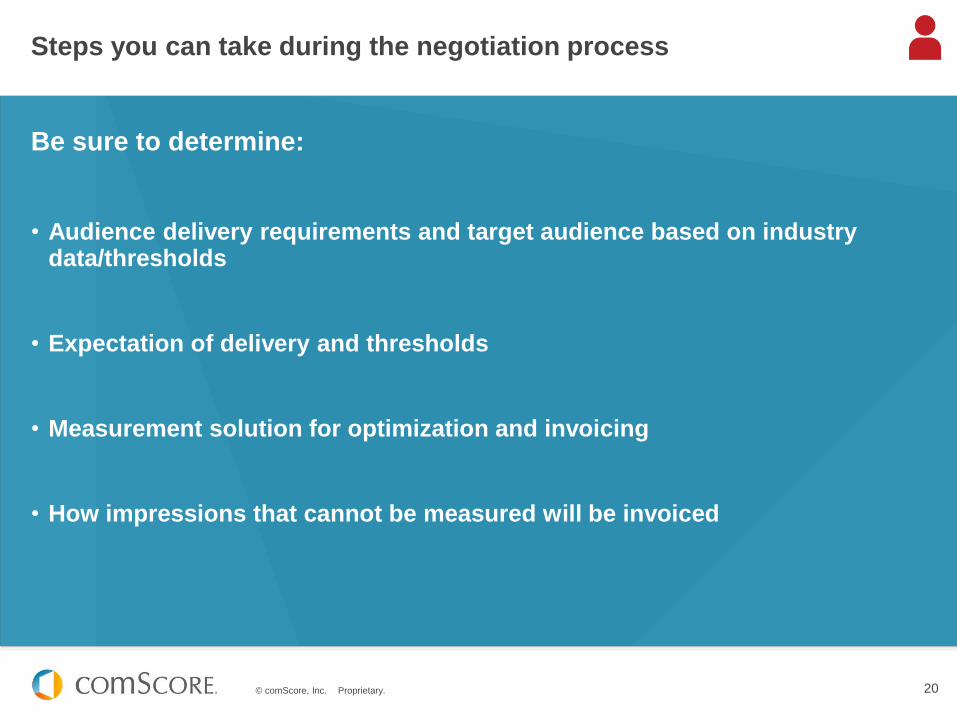
Steps you can take during the negotiation process
Be sure to determine:
• Audience delivery requirements and target audience based on industry data/thresholds
• Expectation of delivery and thresholds
• Measurement solution for optimization and invoicing
• How impressions that cannot be measured will be invoiced
© comScore, Inc. Proprietary. 21
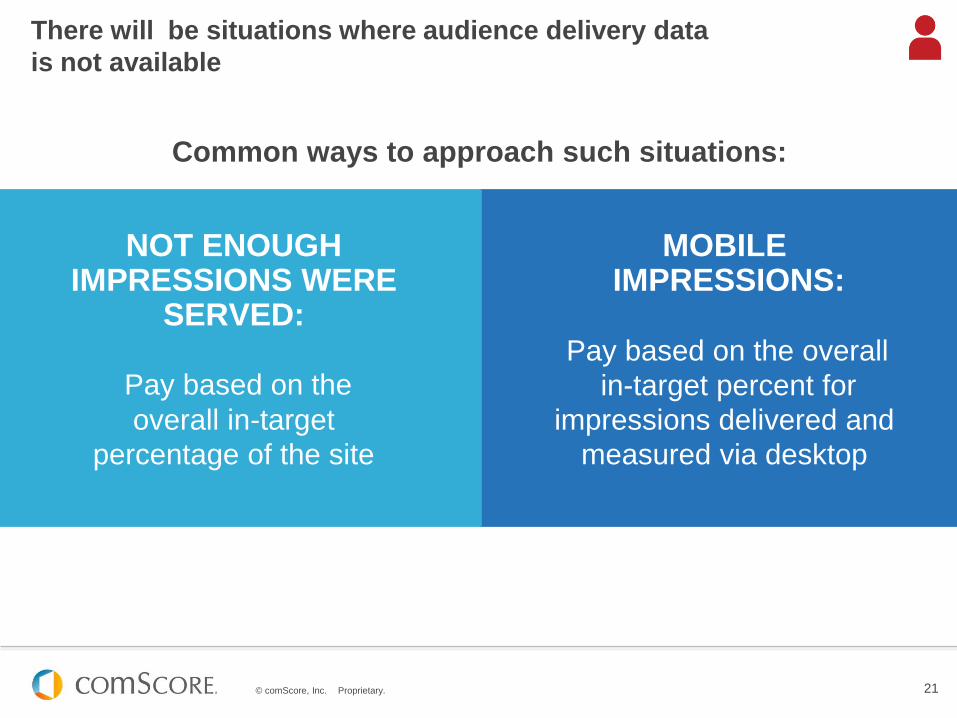
NOT ENOUGH IMPRESSIONS WERE
SERVED:
Pay based on the
overall in-target
percentage of the site
There will be situations where audience delivery data
is not available
MOBILE IMPRESSIONS:
Pay based on the overall
in-target percent for
impressions delivered and
measured via desktop
Common ways to approach such situations:
© comScore, Inc. Proprietary. 22
Viewability Considerations
© comScore, Inc. Proprietary. 23
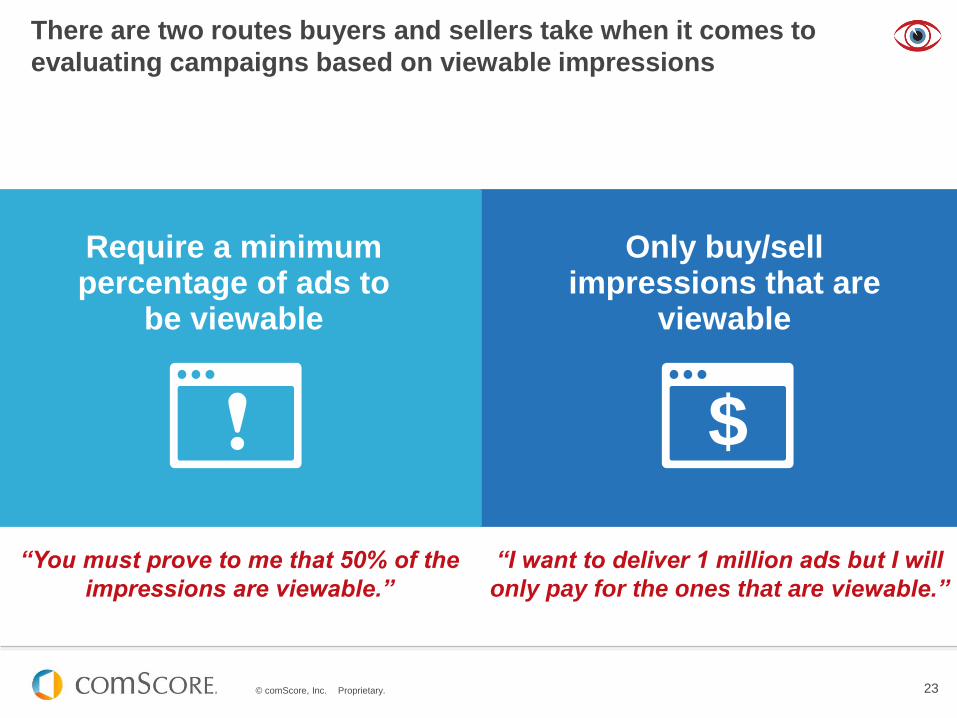
Require a minimum percentage of ads to
be viewable
There are two routes buyers and sellers take when it comes to
evaluating campaigns based on viewable impressions
Only buy/sell impressions that are
viewable
$
“I want to deliver 1 million ads but I will
only pay for the ones that are viewable.”
“You must prove to me that 50% of the
impressions are viewable.”
© comScore, Inc. Proprietary. 24
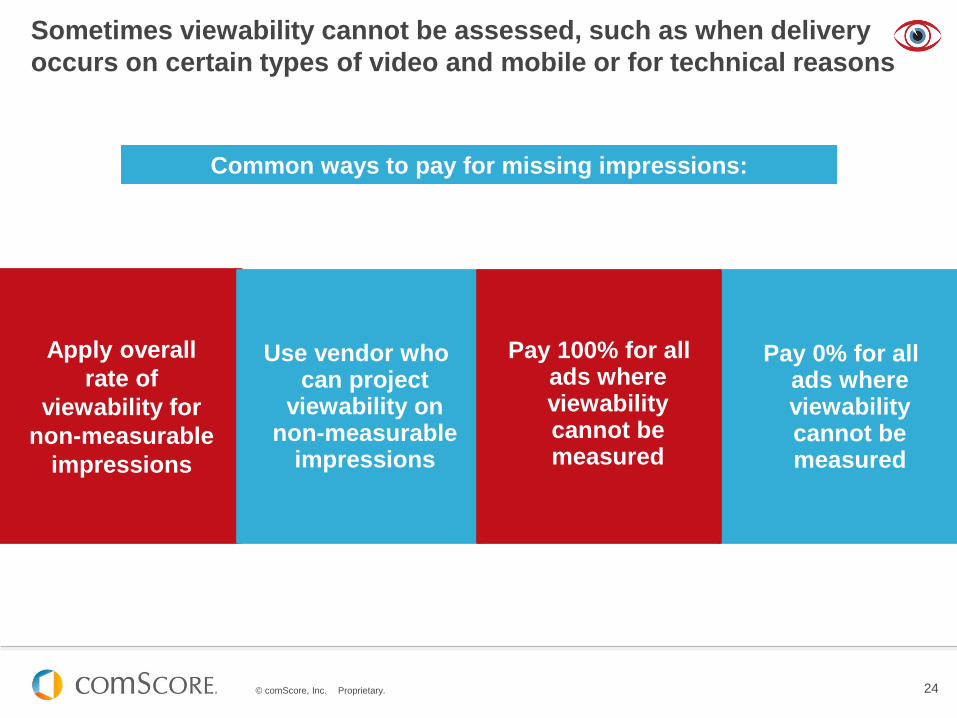
Sometimes viewability cannot be assessed, such as when delivery
occurs on certain types of video and mobile or for technical reasons
Common ways to pay for missing impressions:
Apply overall
rate of
viewability for
non-measurable
impressions
Use vendor who can project
viewability on non-measurable
impressions
Pay 0% for all ads where viewability cannot be measured
Pay 100% for all ads where viewability cannot be measured
© comScore, Inc. Proprietary. 25
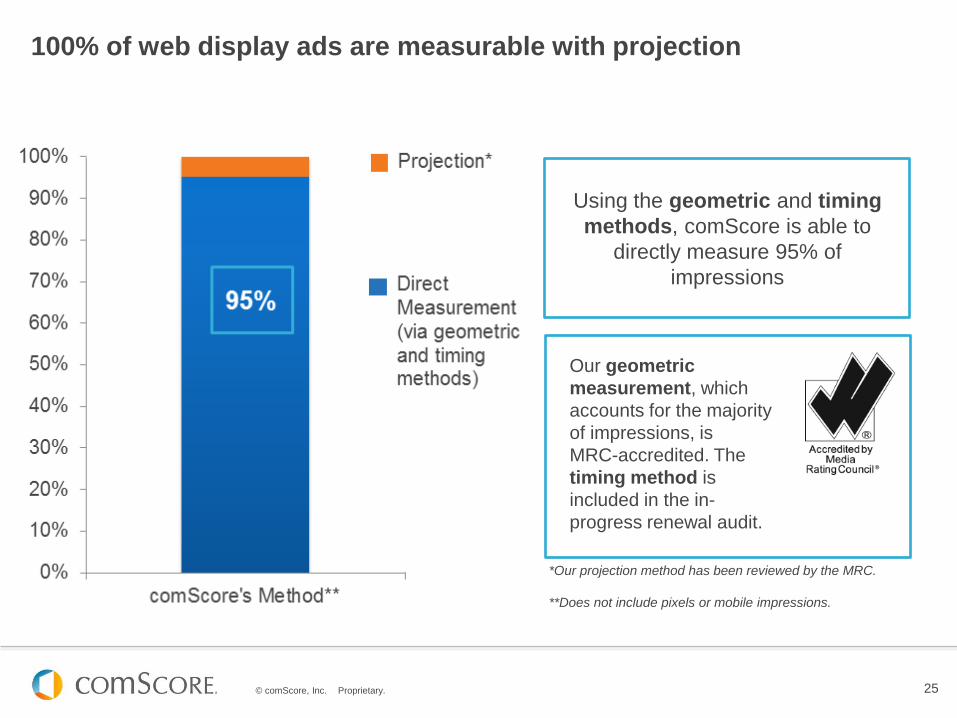
100% of web display ads are measurable with projection
Our geometric
measurement, which
accounts for the majority
of impressions, is
MRC-accredited. The
timing method is
included in the in-
progress renewal audit.
*Our projection method has been reviewed by the MRC.
**Does not include pixels or mobile impressions.
Using the geometric and timing
methods, comScore is able to
directly measure 95% of
impressions
95%
© comScore, Inc. Proprietary. 26
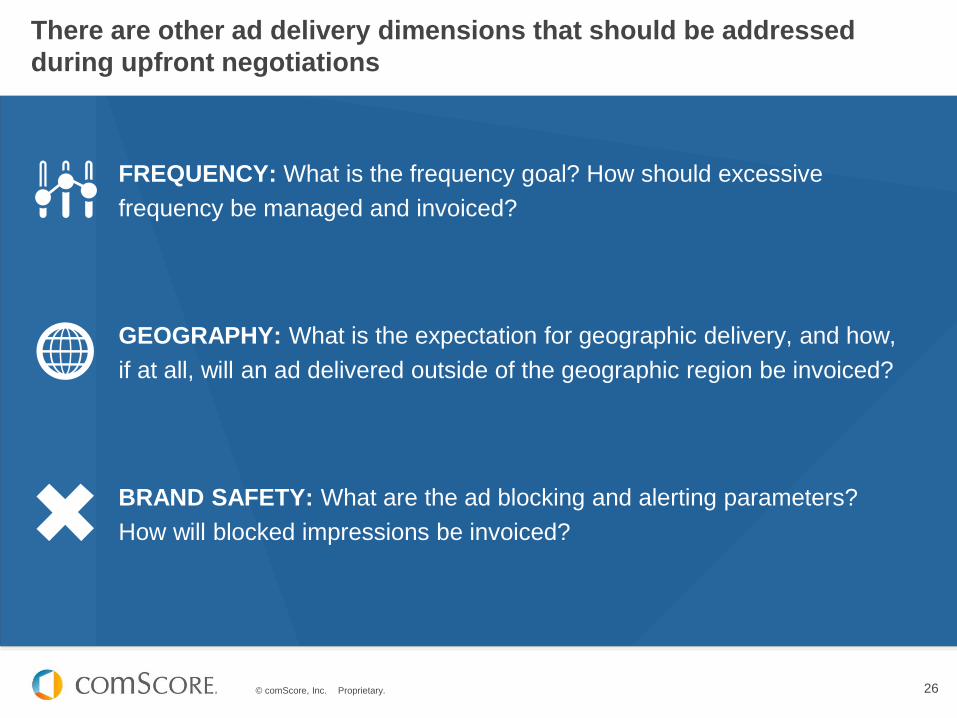
There are other ad delivery dimensions that should be addressed
during upfront negotiations
FREQUENCY: What is the frequency goal? How should excessive
frequency be managed and invoiced?
GEOGRAPHY: What is the expectation for geographic delivery, and how,
if at all, will an ad delivered outside of the geographic region be invoiced?
BRAND SAFETY: What are the ad blocking and alerting parameters?
How will blocked impressions be invoiced?
© comScore, Inc. Proprietary. 27
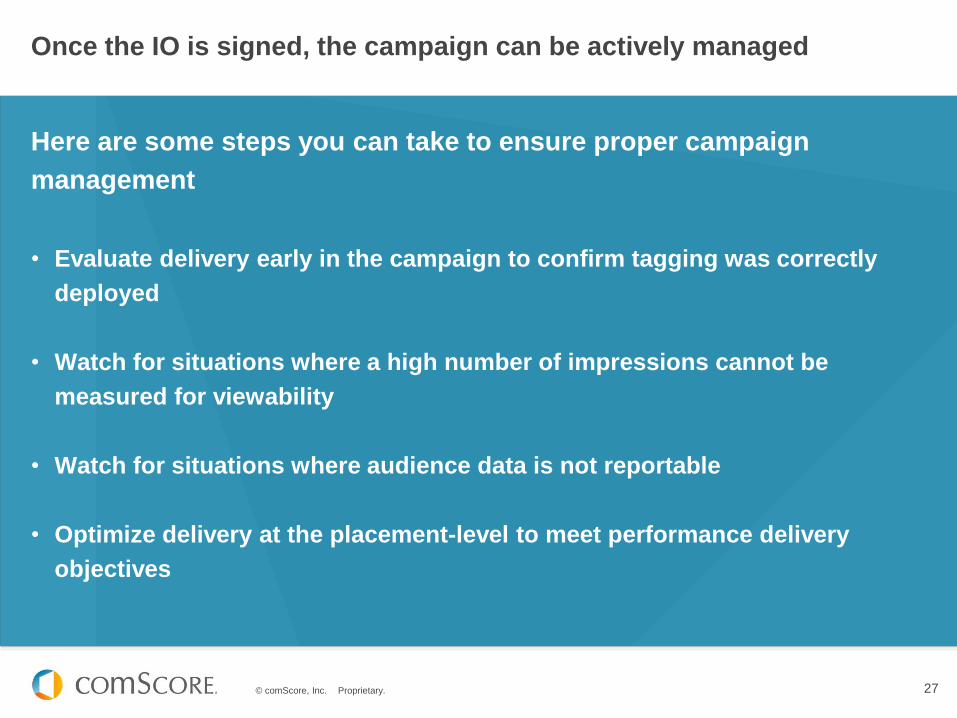
Once the IO is signed, the campaign can be actively managed
Here are some steps you can take to ensure proper campaign
management
• Evaluate delivery early in the campaign to confirm tagging was correctly
deployed
• Watch for situations where a high number of impressions cannot be
measured for viewability
• Watch for situations where audience data is not reportable
• Optimize delivery at the placement-level to meet performance delivery
objectives

© comScore, Inc. Proprietary. © comScore, Inc. Proprietary.
Summary
© comScore, Inc. Proprietary. 29
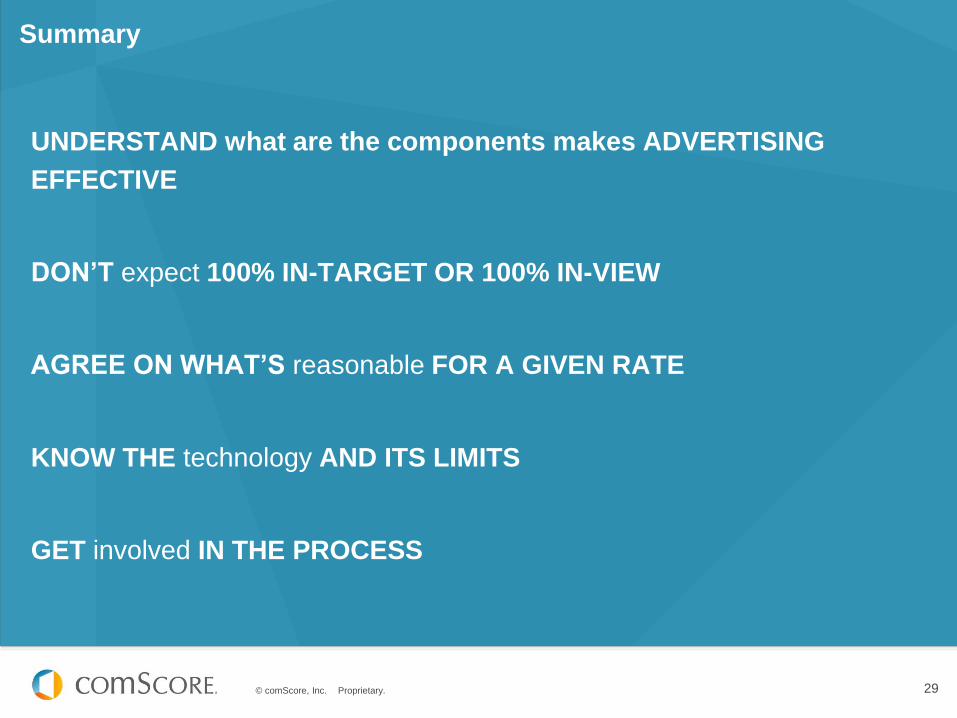
Summary
UNDERSTAND what are the components makes ADVERTISING
EFFECTIVE
DON’T expect 100% IN-TARGET OR 100% IN-VIEW
AGREE ON WHAT’S reasonable FOR A GIVEN RATE
KNOW THE technology AND ITS LIMITS
GET involved IN THE PROCESS
© comScore, Inc. Proprietary. 30
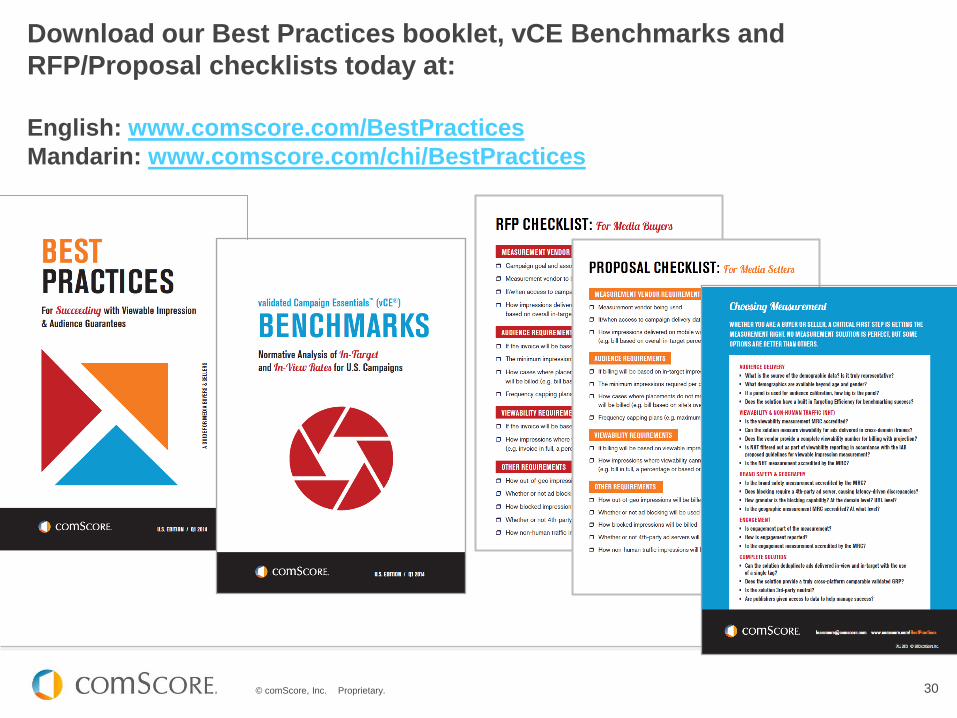
Download our Best Practices booklet, vCE Benchmarks and
RFP/Proposal checklists today at:
English: www.comscore.com/BestPractices
Mandarin: www.comscore.com/chi/BestPractices

© comScore, Inc. Proprietary. © comScore, Inc. Proprietary.
Q&A

© comScore, Inc. Proprietary.
Advertising Effectiveness:
Benchmarks and Best Practices
A review of the latest benchmarks and best practices
Joe Nguyen, Senior Vice President, Asia Pacific | 26 June 2014
t: @jnguyen