Embed Size (px)
Citation preview
Aerodynamic Performance of a Flow Controlled Compressor Stator Using an Imbedded Ejector Pump.
Casey J. Carter
Thesis submitted to the Faculty of the Virginia Polytechnic Institute and State University in partial fulfillment of the requirements for the degree of
Master of Science
in
Mechanical Engineering
Dr. Wing Fai Ng, Chair
Dr. Ricardo Burdisso
Dr. Clint Dancey
February 21, 2001
Blacksburg, VA
Keywords: Flow Control, Trailing Edge Blowing, Boundary Layer Suction, Aerodynamic Loss, Compressor Cascade.
Copyright 2001, Casey J. Carter
Aerodynamic Performance of a Flow Controlled Compressor Stator
Using an Imbedded Ejector Pump.
Casey J. Carter
(Abstract)
A high-turning compressor stator with a unique flow control design was developed and tested.
Both boundary layer suction and trailing edge blowing developed from a single supplied motive
pressure source are employed on the stator. Massflow removed through boundary layer suction
is added to the motive massflow, and the resulting combined flow is used for trailing edge
blowing to reduce the total pressure deficit generated by the stator wake. The effectiveness of
the flow control design was investigated experimentally by measuring the reduction in the total
pressure loss coefficient. The experiment was conducted in a linear transonic blowdown cascade
wind tunnel. The inlet Mach number for all tests was 0.79, with a Reynolds number based on
stator chordlength of 2 × 10⁶. A range of inlet cascade angles was tested to identify the useful
range of the flow control design. The effect of different supply massflows represented as a
percentage of the passage throughflow was also documented. Significant reductions in the total
pressure loss coefficient were accomplished with flow control at low cascade angles. A
maximum reduction of 65% in the baseline (no flow control) loss coefficient was achieved by
using a motive massflow of 1.6% of the passage throughflow, at cascade angle of 0°. The
corresponding suction and blowing massflow ratio was approximately 1:3.6. Cascade angle
results near 0° showed significant reductions in the loss coefficient, while increases in the
cascade angle diminished the effects of flow control. Considerable suction side separation and
the presence of a leading edge shock are noticeable as the cascade angle is increased, and
contribute to the losses across the stator surface. Also identified was the estimated increase in
wake turning due to flow control of up to 4.5°.

i
Acknowledgements:
I would like to thank Dr. Wing Ng for the opportunity and funding to work on this project. His
knowledge, expertise, and professionalism helped immensely in the completion of this research.
I would also like to thank Dr. Ricardo Burdisso and Dr. Clint Dancey for serving on my advisory
committee and their helpful comments and suggestions.
A very special thanks to Dr. Shiming Li and Justin Douglas for their countless hours of work in
the “Tunnel”, and whose help kept the facility running when hope was nearly lost. Thanks to all
of my coworkers at Virginia Tech and Techsburg: Bo Song, Dr. Jinwei Feng, Dr. Jeff Kozak, Dr.
Jon Fleming, Dr. Semih Olcmen, Matt Langford, Jay Shultis and Angie Rabe. I am especially
grateful for the help of Stephen Guillot and Todd Bailie. If it were not for their assistance and
knowledge I would not know half as much as I do now. Thanks to Greg Dudding for his
assistance and time in making most everything I needed and when I needed it to finish this
project.
To Dr. William Copenhaver at the Air Force Research Lab for his exceptional insight into
turbomachinary and his generous contributions to this project. And to Peter Koch for his time
and commitment in obtaining CFD results for this project. Thanks to Dr. Jordi Estevadeordal for
setting up, taking, and helping to process the PIV data.
Finally I would like to thank my parents, Tom and Sharon, and my brother and sister, Curtiss and
Carissa Carter, along with my friends, especially Fernando Goncalves and Erin Tudor, whose
support and quality discussions helped me finish what I started.
ii
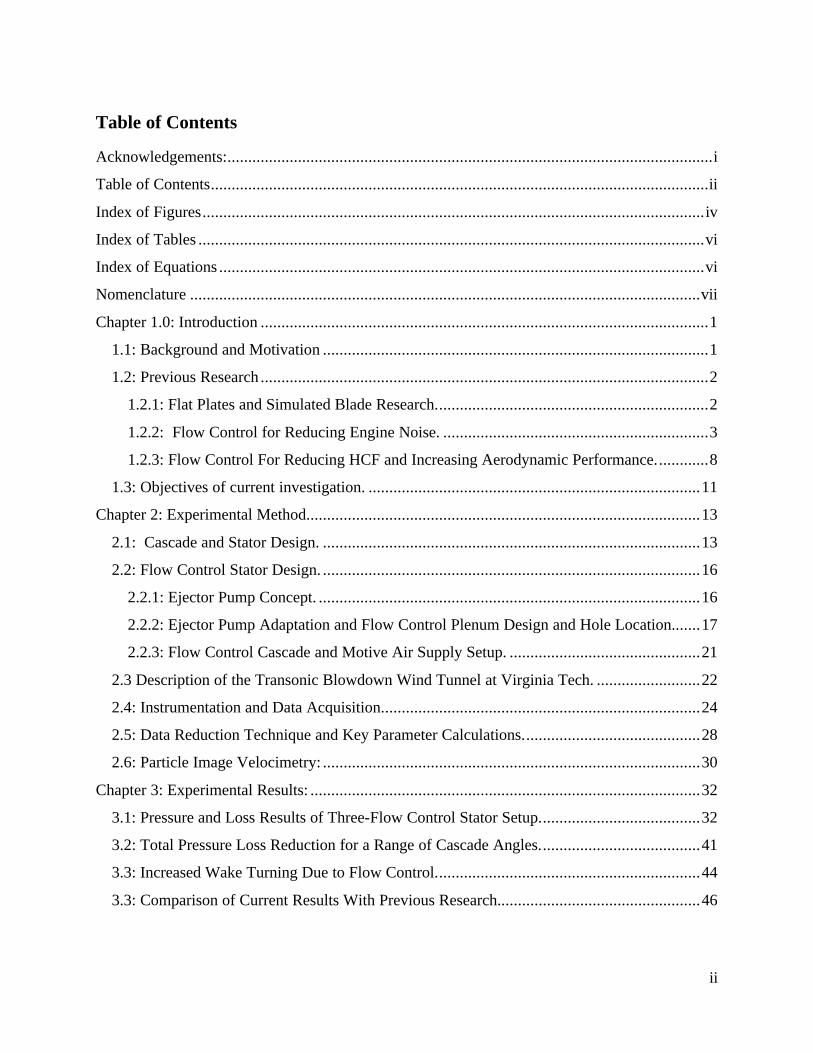
Table of Contents
Acknowledgements:.....................................................................................................................i
Table of Contents........................................................................................................................ii
Index of Figures.........................................................................................................................iv
Index of Tables ..........................................................................................................................vi
Index of Equations .....................................................................................................................vi
Nomenclature ...........................................................................................................................vii
Chapter 1.0: Introduction ............................................................................................................1
1.1: Background and Motivation .............................................................................................1
1.2: Previous Research ............................................................................................................2
1.2.1: Flat Plates and Simulated Blade Research..................................................................2
1.2.2: Flow Control for Reducing Engine Noise. ................................................................3
1.2.3: Flow Control For Reducing HCF and Increasing Aerodynamic Performance.............8
1.3: Objectives of current investigation. ................................................................................11
Chapter 2: Experimental Method...............................................................................................13
2.1: Cascade and Stator Design. ...........................................................................................13
2.2: Flow Control Stator Design. ...........................................................................................16
2.2.1: Ejector Pump Concept. ............................................................................................16
2.2.2: Ejector Pump Adaptation and Flow Control Plenum Design and Hole Location.......17
2.2.3: Flow Control Cascade and Motive Air Supply Setup. ..............................................21
2.3 Description of the Transonic Blowdown Wind Tunnel at Virginia Tech. .........................22
2.4: Instrumentation and Data Acquisition.............................................................................24
2.5: Data Reduction Technique and Key Parameter Calculations...........................................28
2.6: Particle Image Velocimetry: ...........................................................................................30
Chapter 3: Experimental Results: ..............................................................................................32
3.1: Pressure and Loss Results of Three-Flow Control Stator Setup.......................................32
3.2: Total Pressure Loss Reduction for a Range of Cascade Angles.......................................41
3.3: Increased Wake Turning Due to Flow Control................................................................44
3.3: Comparison of Current Results With Previous Research.................................................46

iii
Chapter 4: Conclusions and Recommendations: ........................................................................51
References: ...............................................................................................................................54
Appendix 1: Solid Stator and Flow Separation Location: ..........................................................57
A1.1 Surface Oil Flow Visualization and CFD:.....................................................................57
A1.2: Pressure Measurements. ..............................................................................................61
Appendix 2: Single Flow Control Stator Results .......................................................................64
Appendix 3: Modified Single Flow Control Stator Results. .......................................................69
Appendix 4: PIV Results...........................................................................................................74
Appendix 5: Uncertainty Analysis.............................................................................................79
Vita:..........................................................................................................................................81
iv
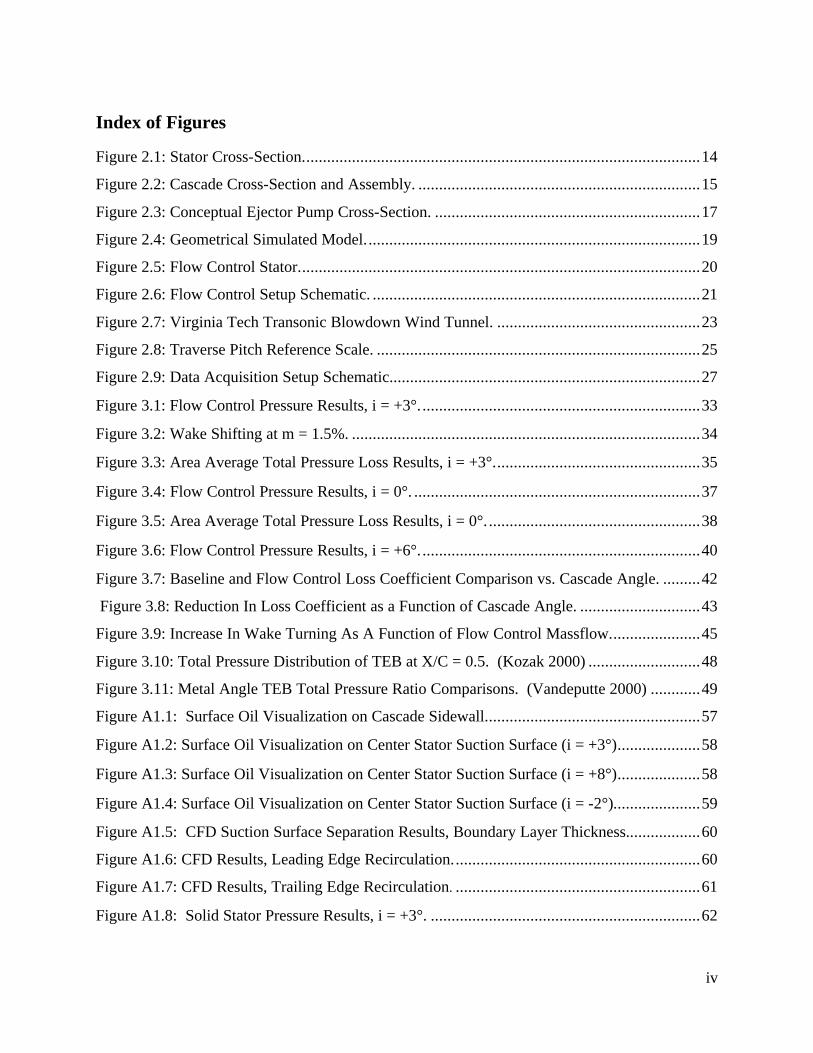
Index of Figures
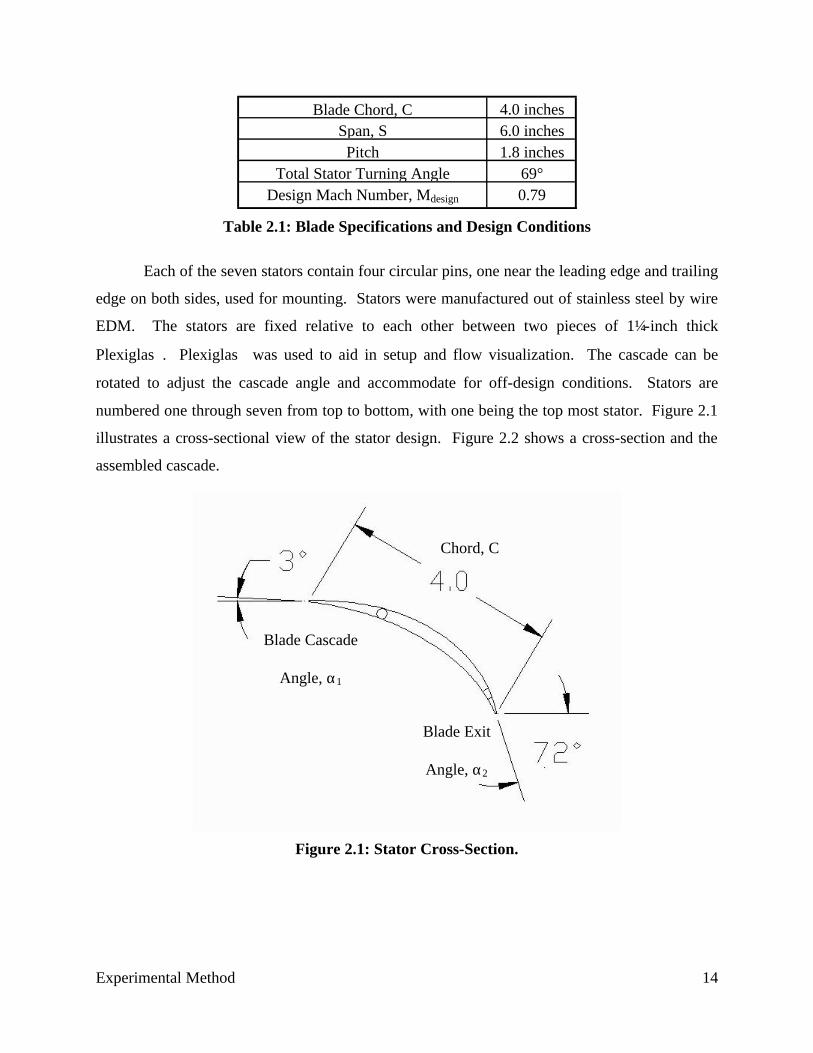
Figure 2.1: Stator Cross-Section................................................................................................14
Figure 2.2: Cascade Cross-Section and Assembly. ....................................................................15
Figure 2.3: Conceptual Ejector Pump Cross-Section. ................................................................17
Figure 2.4: Geometrical Simulated Model.................................................................................19
Figure 2.5: Flow Control Stator.................................................................................................20
Figure 2.6: Flow Control Setup Schematic. ...............................................................................21
Figure 2.7: Virginia Tech Transonic Blowdown Wind Tunnel. .................................................23
Figure 2.8: Traverse Pitch Reference Scale. ..............................................................................25
Figure 2.9: Data Acquisition Setup Schematic...........................................................................27
Figure 3.1: Flow Control Pressure Results, i = +3°. ...................................................................33
Figure 3.2: Wake Shifting at m = 1.5%. ....................................................................................34
Figure 3.3: Area Average Total Pressure Loss Results, i = +3°..................................................35
Figure 3.4: Flow Control Pressure Results, i = 0°. .....................................................................37
Figure 3.5: Area Average Total Pressure Loss Results, i = 0°. ...................................................38
Figure 3.6: Flow Control Pressure Results, i = +6°. ...................................................................40
Figure 3.7: Baseline and Flow Control Loss Coefficient Comparison vs. Cascade Angle. .........42
Figure 3.8: Reduction In Loss Coefficient as a Function of Cascade Angle. .............................43
Figure 3.9: Increase In Wake Turning As A Function of Flow Control Massflow......................45
Figure 3.10: Total Pressure Distribution of TEB at X/C = 0.5. (Kozak 2000) ...........................48
Figure 3.11: Metal Angle TEB Total Pressure Ratio Comparisons. (Vandeputte 2000) ............49
Figure A1.1: Surface Oil Visualization on Cascade Sidewall....................................................57
Figure A1.2: Surface Oil Visualization on Center Stator Suction Surface (i = +3°)....................58
Figure A1.3: Surface Oil Visualization on Center Stator Suction Surface (i = +8°)....................58
Figure A1.4: Surface Oil Visualization on Center Stator Suction Surface (i = -2°).....................59
Figure A1.5: CFD Suction Surface Separation Results, Boundary Layer Thickness..................60
Figure A1.6: CFD Results, Leading Edge Recirculation............................................................60
Figure A1.7: CFD Results, Trailing Edge Recirculation. ...........................................................61
Figure A1.8: Solid Stator Pressure Results, i = +3°. .................................................................62
v
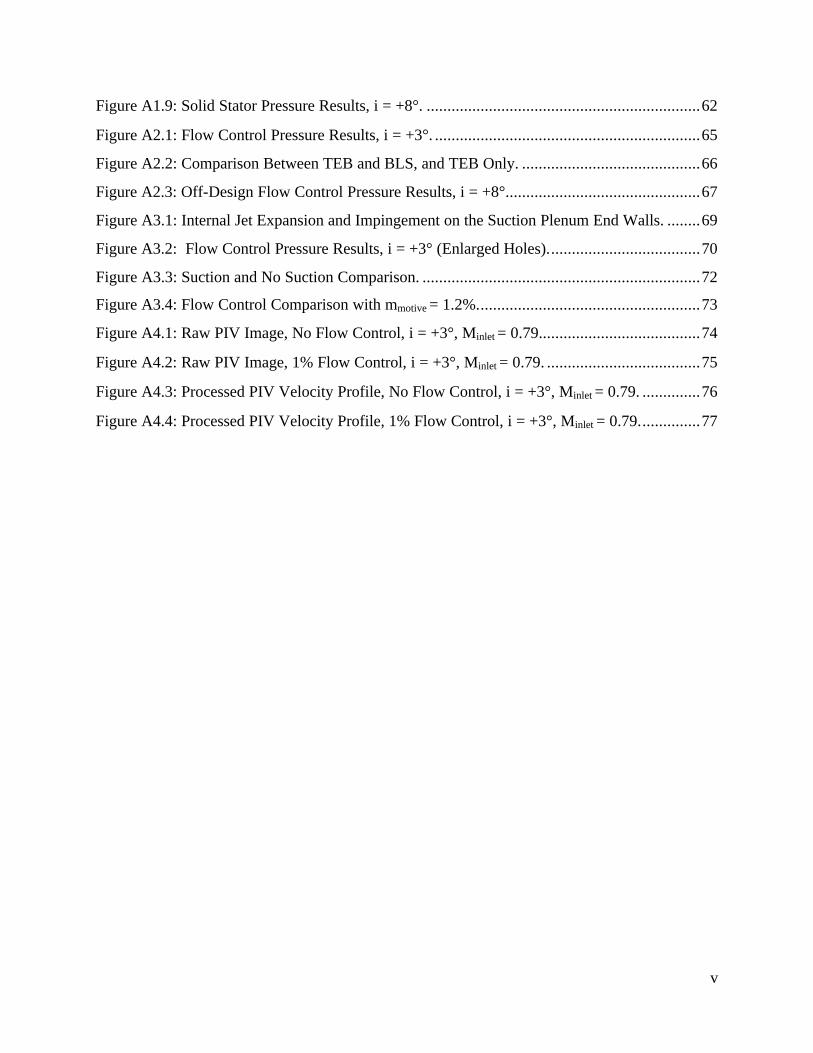
Figure A1.9: Solid Stator Pressure Results, i = +8°. ..................................................................62
Figure A2.1: Flow Control Pressure Results, i = +3°. ................................................................65
Figure A2.2: Comparison Between TEB and BLS, and TEB Only. ...........................................66
Figure A2.3: Off-Design Flow Control Pressure Results, i = +8°...............................................67
Figure A3.1: Internal Jet Expansion and Impingement on the Suction Plenum End Walls. ........69
Figure A3.2: Flow Control Pressure Results, i = +3° (Enlarged Holes).....................................70
Figure A3.3: Suction and No Suction Comparison. ...................................................................72
Figure A3.4: Flow Control Comparison with mmotive = 1.2%......................................................73
Figure A4.1: Raw PIV Image, No Flow Control, i = +3°, Minlet = 0.79.......................................74
Figure A4.2: Raw PIV Image, 1% Flow Control, i = +3°, Minlet = 0.79. .....................................75
Figure A4.3: Processed PIV Velocity Profile, No Flow Control, i = +3°, Minlet = 0.79. ..............76
Figure A4.4: Processed PIV Velocity Profile, 1% Flow Control, i = +3°, Minlet = 0.79...............77
vi
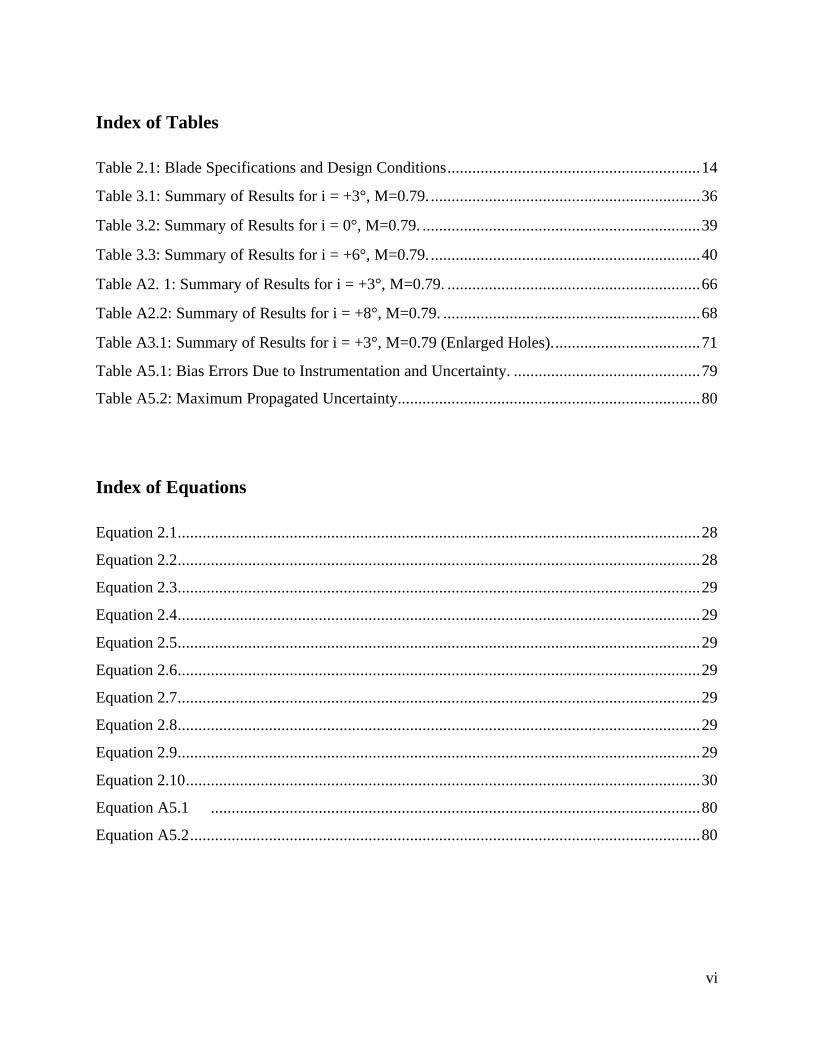
Index of Tables
Table 2.1: Blade Specifications and Design Conditions.............................................................14
Table 3.1: Summary of Results for i = +3°, M=0.79. .................................................................36
Table 3.2: Summary of Results for i = 0°, M=0.79. ...................................................................39
Table 3.3: Summary of Results for i = +6°, M=0.79. .................................................................40
Table A2. 1: Summary of Results for i = +3°, M=0.79. .............................................................66
Table A2.2: Summary of Results for i = +8°, M=0.79. ..............................................................68
Table A3.1: Summary of Results for i = +3°, M=0.79 (Enlarged Holes)....................................71
Table A5.1: Bias Errors Due to Instrumentation and Uncertainty. .............................................79
Table A5.2: Maximum Propagated Uncertainty.........................................................................80
Index of Equations
Equation 2.1..............................................................................................................................28
Equation 2.2..............................................................................................................................28
Equation 2.3..............................................................................................................................29
Equation 2.4..............................................................................................................................29
Equation 2.5..............................................................................................................................29
Equation 2.6..............................................................................................................................29
Equation 2.7..............................................................................................................................29
Equation 2.8..............................................................................................................................29
Equation 2.9..............................................................................................................................29
Equation 2.10............................................................................................................................30
Equation A5.1 ......................................................................................................................80
Equation A5.2...........................................................................................................................80

vii
Nomenclature
A Area
C Overall stator chord length
Cd Discharge coefficient of a flow passage (effective flow area/geometric area)
i Cascade angle
IGV Inlet Guide Vane
M Local Mach number
Mdesign Design Mach number
Minlet Inlet Mach number
M∞ Freestream Mach number
•
m Massflow
P Static Pressure
Pt Total Pressure
R Gas Constant
Re Reynolds Number
S Stator span
T Static Temperature
Tt Total Temperature
u Local flow velocity
U∞ Local freestream velocity
VGJ Vortex Generator Jet
TEB Trailing Edge Blowing
BLS Boundary Layer Suction
α Blade Angle
∆P Differential Pressure
∆Psuction Differential suction pressure
γ Specific heat ratio for air
θstagger Stagger Angle
ρ Density
ω Area averaged total pressure loss coefficient
Introduction 1
Chapter 1.0: Introduction
1.1: Background and Motivation
Increasing performance and engine life, and decreases in cost, size, weight and noise are all
major goals of the turbomachinery community. Current investigations show that unsteady stator
and rotor interaction can contribute to the decay of engine health, along with generating
excessive engine noise. Pressure deficits created from upstream stators impose an unsteady and
non-uniform flowfield on the downstream rotor. The pressure deficits act as an unsteady forcing
function and have been identified to cause high cycle fatigue (HCF) in the rotating components
of gas turbines (Manwaring and Wisler, 1993). The unsteady interactions also generate tonal
noise, known as the blade passing frequency (BPF) tone, and contribute greatly to the overall
engine acoustic spectrum (Cumptsy, 1989).
The United States Air Force has identified HCF as contributing to a large number of gas
turbine failures on military aircraft. Up to 30% of the USAF’s yearly maintenance cost have
been blamed on HCF. An estimated 55% of the USAF’s Class “A” cascades since 1982 have
also been attributed to HCF. A Class “A” mishap results in $1 million or more in damage, or
loss of the aircraft (Thomson and Griffin, 1999). Increased performance requirements and
industry trends of closer stator-rotor spacing will only intensify the effects of HCF.
A high turning axial compressor stator was researched in this thesis, with the primary
objective being to reduce the total pressure losses across the stator surface. Total pressure losses
due to boundary layers and separated flows are generated through viscous effects. These losses
lead to a decrease in engine efficiency (Lakshminarayana, 1996), and the corresponding
unsteadiness leads to vibration and engine noise. In this thesis two flow control techniques,
trailing edge blowing (TEB) and boundary layer suction (BLS), were used in an attempt to
reduce the total pressure losses incurred by these viscous effects. The inlet Mach number for all
tests was 0.79, with a corresponding average exit plane Mach number of 0.6 and a Reynolds
number based on chordlength of approximately 2×10⁶.
TEB is used to re-energize the wake regions by introducing high momentum fluid directly
into the wake and enhancing the uniformity of the rotor inlet flowfield (Bailie et al, 2000,
Vandeputte, 2000). Losses occurring on the suction surface boundary layer and separated flow
Introduction 2
regions can be reduced through the application of BLS. BLS removes low momentum fluid from
these regions, thus reducing the boundary layer thickness and wake width. A reduction in the
momentum deficit leads to a more uniform total pressure profile, and reduces the amount of
energy dissipated during the mixing process (Lakshminarayana, 1996).
Prior studies range from understanding the flow of wake regions, to low speed flow control
techniques, to applying flow control in reducing engine noise. However, very few investigations
into the effects of flow control on reducing losses and increasing the performance of compressor
components have been reported. Several studies with flat plates, non-turning inlet guide vanes
(IGV), or simulated blades have been performed to validate the usage of flow control. The
majority of previous research was carried out under low flow speeds or for the evaluation of
acoustic reduction. Experimental research with flow control under transonic flow conditions or
airfoils with flow turning capabilities have only recently been studied. The following section
reviews some of these past experiments and their findings.
1.2: Previous Research
1.2.1: Flat Plates and Simulated Blade Research.
Flat plates or simulated blades were used in preliminary flow control experiments to
determine suitable configurations and techniques in an effort to produce a momentumless wake.
A momentumless wake in this case has an area averaged momentum flux equal to that of the
freestream. Park and Cimbala (1991) employed a flat plate of constant thickness with no flow
turning and measured the velocity profiles downstream of the trailing edge. Three blowing
configurations were used and a comparison was drawn between the velocity profiles of these
wakes and a wake without trailing edge blowing. The three two-dimensional (slot) TEB models
consisted of a central single jet, an asymmetric single jet, and a dual jet configuration tested in a
low speed (U∞ = 4.2 m/s) wind tunnel.
A momentumless wake was achievable by each configuration. However, a jet like region
where the normalized mean velocity profile reached quantities above zero, and a wake like
region with velocity profile less than zero were identified in each case at close measurement
Introduction 3
locations. The wake for the dual jet configuration dissipated the quickest, and resulted in an
overshoot of less than 1% of U∞ at a distance of 20 x/d from the trailing edge, with the single jet
setup dissipating to less than 1% at a x/d of 45. Conversely, the single jet configuration had a
narrower wake when compared to the dual jet at the same axial location. Park and Cimbala
concluded that the initial conditions of the jets are felt very far downstream and that the
momentumless wake is strongly dependent on the jet injection configuration.
Naumann (1992) examined the attenuation of wake deficits by trailing edge blowing on a
simulated blade in a large-scale water channel test section. Particle image velocimetry (PIV)
was used to make velocity measurements. The single, constant thickness, non-turning blade
setup was capable of measuring mean and fluctuating velocities. Several blowing rates were
examined for three separate TEB configurations, a single continuous slot, a double continuous
slot, and a discrete jet array. Vortex generators were also applied to the trailing edge of the
blades for some experiments. Naumann’s goal was to achieve maximum wake attenuation while
minimizing the required blowing rate. Under fully turbulent conditions the discrete jet
configuration proved more efficient than a continuous slot configuration at reducing the mean
velocity and turbulence values across the wake. With a jet velocity of four times the freestream
it was possible to fully attenuate the wake. By promoting mixing effects of the jets with the
addition of vortex generators to the discrete jet configuration, a quicker rate of wake attenuation
was achievable.
1.2.2: Flow Control for Reducing Engine Noise.
In response for the demand of quieter gas turbine engines, flow control has been applied
to compressor stators, rotors, IGV’s, and fan blades. Several research experiments have shown
that noise reduction is achievable by employing flow control techniques. Improvements in flow
control techniques were also developed, however the majority of these experiments were at
relatively low flow speeds or with non-turning airfoils.
Waitz et al (1996) combined numerical and experimental analysis of reducing the noise
generated by a turbomachinery fan. This study was one of the first to incorporate flow control as
a means of reducing the rotor-stator interaction noise. Massflow addition and/or removal on a
Introduction 4
next generation two-dimensional fan blade were used to control the unsteady loading and flow
uniformity into the downstream stator. The CFD code MISES was used to numerically model
the two-dimensional steady viscous effects on the rotor. Unsteady predictions of the thin shear
layer on the stator were found using the Navier-Stokes based code UNSFLO. Massflow
removal, via boundary layer suction was applied on the blade suction surface at 50%, 80% and
90% chordlengths downstream of the leading edge. Massflow removal was conducted at an
equivalent rate of 0%, 25%, 50%, and 75% of the local momentum thickness. Numerical
solutions showed that a 75% removal rate and at a location of 90% chordlengths resulted in a
reduction of the suction side boundary layer thickness and a 21% decreases in the time mean
wake width and a 40% reduction of the peak wake deficit.
In experimental cascade experiments Waitz used a fan blade with a chord of 9.8 in
(25cm) and a span of 11.8 in (30cm). Both TEB and BLS experiments were conducted at a
freestream flow speed of 18 m/s, with hot wire anemometer measurements taken at 0, 0.5, 1.5,
and 2.5 chordlengths downstream of the blade’s trailing edge. With a TEB massflow rate of
0.9% of the fan throughflow and 1.5 chordlengths downstream of the trailing edge the time mean
wake deficit was reduced by 50%, with a 50% reduction in the rms of the turbulent velocity
fluctuations. Acoustic results showed an improvement of 11.4 dB in the amplitude of the
primary propagating acoustic mode, with a 6 dB reduction in the broadband noise component
associated with the unsteady wake.
However, BLS experiments proved less effective, with a suction surface BLS location at
80% chord and a removal massflow rate of 2.2% of the fan throughflow. The time mean wake
deficit was reduced by 40%, with a 35% reduction in the rms of the turbulent velocity
fluctuations. A 4.4 dB reduction in the primary propagating circumferential acoustic mode was
achieved, with a 3.7 dB drop in the broadband noise. Waitz concluded that a limiting factor of
the design was the choking of internal passages used to supply the blowing and suction sources.
Experimental optimization and further numerical analysis would be conducted to improve the
benefits of TEB and BLS in reducing fan noise.
Sell (1997) continued the experimental cascade research done by Waitz et al (1996) with
a modified TEB and BLS design. The test section used three Pratt and Whitney Advanced
Ducted Propulsor (ADP) first stage blades with a 14 in (35.56cm) span and a chord length of
Introduction 5
9.875 in (25.09cm), creating two complete passageways. The inlet flow field was consistent
with conditions seen by an aircraft gas turbine engine at takeoff. Hot wire wake surveys were
taken at 0.0, 0.5, 1.0, 1.5, and 2.5 chordlengths downstream of the blades trailing edge. Sell used
three TEB configurations, each with port diameters of 1/16 in (1.59mm) and a spanwise spacing
of 1/32 in (0.794mm). One design consisted of an array of ports exiting at 91.2% chord, with an
estimated jet exit angle of 10° with respect to the exit angle of the blade. The second design used
an array of ports directly at the trailing edge of the blade with a jet angle matching that of the
blade exit (metal) angle. The final design alternated across the span between deviation and blade
angle ports. Suction was implemented with an array of 0.5 in (12.7mm) long and 0.062 in
(1.57mm) wide slots, with a 0.125 in (3.175mm) spacing between slots. Arrays were located at
50% and 80% chord on both the suction and pressure surfaces. Arrays could be covered to allow
for analysis and comparison between configurations. Limitations in the design setup did not
allow for simultaneous BLS and TEB.
Sell focused on reducing tonal and broadband noise, and showed that both BLS and TEB
were beneficial in achieving this goal. Suction results at 80% chord on the suction surface with a
massflow removal rate of 1.25% of the fan throughflow, or 102% of the boundary layer
massflow, reduced the wake momentum thickness by 50% and the wake deficit by 43%.
Increases in the suction massflow and at other suction array locations did not yield dramatic
improvements. The thin boundary layer of the pressure surface did not allow for the BLS arrays
on the pressure surface to make any substantial improvement in the wake width and depth. It
was also noted that upon completely removing both suction and pressure surface boundary layers
a wake would still be generated equal to the finite thickness of the blade trailing edge.
Trailing edge blowing results proved that massflow addition was again more beneficial
than BLS in achieving wake filling. A TEB setup with jets exiting at an angle and chord position
equal to the centerline of the wake was found to be most effective. A momentumless wake was
achievable for the blade angle array, deviation angle array, and alternating array with 1.02%,
1.08% and 1.23% of the fan throughflow, respectively. However, the momentumless wakes
developed produced some overshoot where signs of both wake and jet profiles were visible. Sell
concluded that the deviation angle array configuration was most effective and produced the most
symmetric wake profile. The deviation angle geometry also produced the greatest amount of
Introduction 6
reduction in unsteadiness and wake size. Acoustic results also showed that deviation angle
geometry produced the greatest estimated reductions in noise: 24.4 dB, 18.6 dB, 13.2 dB, and 7.6
dB for the second through the fifth BPF harmonics and a 7.0 dB reduction in the broadband
noise.
Sell also identified the need to model a three-dimensional rotating system to fully
understand the effectiveness of flow control in reducing engine noise. Brookfield and Waitz
(2000) studied a rotating one-sixth-scale high bypass ratio fan stage with trailing edge blowing to
reduce rotor wake-stator interaction noise. The fan stage has a mass averaged total to static
pressure ratio of 1.2, with an inlet and tip Mach number of 0.45 and 0.8, respectively. The stage
consisted of 16 fan blades and 40 stators, with a rotor-stator spacing of 1.7 rotor midspan axial
chordlengths. Kulite pressure transducers were used to make flowfield measurements at 0.5
chordlengths upstream and 0.1, 0.5, 1.0, and 1.5 chordlengths downstream of the rotor. Five
internal passages, similar to those on cooled turbine blades, were used to supply the array of TEB
holes on the suction surface of the blade. TEB massflows were regulated across the span of the
blade in order to produce an ideal spanwise momentumless wake. To achieve a spanwise
momentumless wake the blowing massflow near the tip required 1.6-1.8 times the massflow near
the hub.
Baseline experiments with the modified TEB fan blades and without mass injection did
not significantly hinder stage performance, when compared to a solid blade design. Although a
uniform momentumless wake was desired, Brookfield and Waitz were unable to achieve this
across the entire span. Mass injection was able to moderately reduce the wake size near the hub
and significantly reduce the wake mean profile at the outer half of the span. Under these
conditions a momentumless wake was achieved at approximately 80% span, while the wake at
the hub was under filled and the tip was overblown. The TEB massflow was approximately 1.9%
of the fan throughflow, and measurements were taken at 0.1 chords downstream of the fan exit.
The amplitudes of the first and second harmonic of the BPF were reduced experimentally by 70-
85%, while reductions measured at the 0.1 chord location with TEB compared to the amplitudes
found at the 1.5 chord location without blowing. Thus, Brookfield and Waitz concluded that
considerable reduction of the rotor-stator spacing maybe possible with no increase in the
generated noise by using a trailing edge blowing equipped rotor.
Introduction 7
Flow control research on a 1/14-scale turbofan simulator by Leitch et al (1999), Rao
(1999), Rao et al (1999) and Feng (2000) again showed the benefits of TEB on noise reduction
and stator-rotor interaction. Unlike the research conducted by Waitz et al and Sell, efforts were
conducted in reducing stator wake interactions with the downstream rotor. A set of centerbody
non-turning support struts was added to the single-stage small-scale simulator to generate inlet
distortions. All experiments were performed in an anechoic chamber, where far-field acoustic
measurements could be made with little ambient interference.
Leitch et al (1999) made measurements of the aerodynamic flow-field and acoustic far-
field. The aeroacoustic performance of TEB was evaluated at simulator speeds of 30k, 50k, and
70k rpm. The non-turning struts employed a set of six non-uniform TEB hole sizes. The various
hole sizes provide a uniform spanwise reenergizing of the stator wakes. This design was based
on research conducted by Leitch (1997). Traverse measurements behind the struts using the
addition of less than 1% of the mass throughflow for TEB, resulted in the complete filling of the
wake pressure deficit. Acoustic results showed a considerable decrease in the sound pressure
level of the BPF and in the overall sound pressure level (SPL) at most measurement locations.
Results at the 30k rpm fan speed proved the most dramatic, with a 8.9 dB reduction in the BPF,
and an average reduction of 6.2 dB in the far-field SPL between 30° and 90°. Leitch et al
concluded that TEB was effective in reducing the unsteady stator-rotor interactions and the
generated forward radiated fan noise.
Rao (1999) employed a MEMS based microvalve TEB system that could adapt to
variations in the flow parameters. Microvalves are actuated by a PID controller, which uses
wake and freestream velocities and attempts to minimize their difference. Struts were placed 1.0
strut chordlengths upstream of the rotor. The TEB design consisted of 6 blowing holes with a
diameter of 1/16 inch. Two simulator speeds were used during testing, 29.5k rpm and 40k rpm,
and results with and without TEB were compared. Rao predominantly reported the acoustic
results of TEB and showed that it was effective in reducing the stator wake and thus the noise
generated by the stator-rotor interaction. A maximum reduction of 8.2 dB and 7.3 dB, at 29.5k
rpm and 40k rpm, respectively, was achievable. The first five harmonics of the BPF were
reduced by 2.9 dB or more. Far-field directivity measurements showed a decrease in the sound
pressure level of 4.4 dB and 2.9 dB at 29.5k rpm and 40k rpm, respectively. The control system
Introduction 8
allowed for responsive automatic adjustment in the blowing rate, and was able to achieve
optimum wake filling after approximately 8 seconds.
Feng (2000) continued the research conducted by Rao (1999) in developing a more
responsive active flow control system for the reduction of unsteady stator-rotor interaction.
Where Rao used Pitot probes to sense differences between freestream and wake pressures, Feng
employed non-intrusive microphones as a sensing approach. These microphones were mounted
flush with the fan case and would sense noise generated by the BPF. By using acoustic tonal
amplitude information and phase error, Feng was able to achieve convergence between the wake
velocity and freestream velocity at a rate comparable to that of the Pitot probe controller.
Acoustic reductions were comparable to those reported by Rao at simulator speeds of 29.5k and
40k rpm. This use of non-intrusive microphones is an applicable method of measuring and
actively controlling the flow control massflow rate, and could be configured to be used in a
realistic turbomachinary environment.
1.2.3: Flow Control For Reducing HCF and Increasing Aerodynamic Performance.
As previously stated, vibration caused by unsteady stator-rotor interaction can lead to the
high cycle fatigue of rotor blades. By re-energizing the wakes shed by upstream stators with
TEB the rotor inlet flowfield becomes more uniform and decreases the effects of vibration.
Research by Kozak (2000) and Bailie (2000) used non-turning wake generators equipped with
TEB to demonstrate the influence of reducing stator wake size and its possible impact on HCF.
However, reducing the potential effects of HCF is not the only benefit of flow control.
Experimental evaluation by Dirlik et al (1992) of an airfoil with blowing and suction boundary
layer control investigated the effects of flow control on drag. Bons et al (2000) demonstrated the
benefits of pulsed vortex generator jets (VGJ), a method very similar to TEB, on the pressure
loss across a turbine blade. Both TEB and BLS were used by Vandeputte (2000) to show the
effects of flow control on the aerodynamics of a tandem inlet guide vane. This previous research
has the most relevance to the current investigation on the aerodynamic performance of a
compressor stator.
Kozak (2000) conducted a series of experiments on an Allied Signal F109 turbofan
engine to investigate the wake profile of a non-turning airfoil shaped inlet guide vane. The
Introduction 9
NACA0015 airfoil produced a wake profile comparable to a modern IGV, and was placed
upstream of the fan at a typical spacing of 0.43 fan chords. Twenty-one 1/16 inch flow control
holes were placed along the trailing edge of the IGV at a spacing of 0.25 inch. Baseline
experiments showed that at subsonic fans speeds TEB was able to completely eliminate the wake
with only 0.03% of the total engine massflow per IGV. The jet velocity required for wake filling
was found to be 1.5 times the inlet velocity with a total pressure of 1.4 times the inlet total
pressure. At transonic fan speeds the pressure loss coefficient was reduced by 68% but required
2.6 times the massflow used for subsonic fan speeds. Kozak concluded that reductions of the
viscous wake generated by an IGV and its subsequent forcing function on the fan blade were
achievable through TEB at practical IGV/rotor spacings.
Bailie et al (2000) conducted experiments on a single-stage transonic compressor rig to
investigate the wake filling and rotor HCF reduction potential of TEB. A row of 12 non-turning
wake generator vanes with TEB capabilities was installed 0.26 chords upstream of the rotor
blisk. The rotor blisk was instrumented with strain gages, and data was recorded at rotor speeds
of 80%, 93% (second leading edge bending mode resonance speed) and 101% (first torsional
mode resonance speed) of the corrected shaft speed. Each wake generator employed seven TEB
holes with a diameter of 0.082 in (2.08mm). Four independently controllable lines supplied
compressed air to a pair of TEB holes, with the exception of the single tip hole, so that spanwise
wake filling uniformity could be achieved. With a flow control massflow of 0.8% of the
compressor throughflow the peak-to-peak strain amplitude was reduced by as much as 69% at a
rotor speed of 101%. A nearly 80% reduction in the peak-to-peak strain amplitude was achieved
at the 93% Nc with only 0.6% TEB massflow. At 80% Nc the strain amplitude was again
reduced by approximately 80%, with a TEB massflow of only 0.3% of the throughflow. In each
case the TEB blowing rate was not thought to be optimized, leading to the possibility that even
further reductions in strain amplitude could be achieved. Bailie et al concluded that the
reduction in rotor vibration strongly demonstrates the potential usefulness of TEB in a modern
transonic compressor.
Dirlik et al (1992) determined the effects of blowing and suction on the lift and wake
drag on a 46% thick symmetrical airfoil. Suction and blowing were provided by spanwise slots
and could be tested simultaneously or in a blowing only configuration. Experiments were
Introduction 10
conducted at Reynolds numbers of 0.7x10⁶ and 0.9x10⁶ over various angles of attack and flow
control massflow rates. Results showed suction had little effect on lift at low massflow rates,
and at higher levels seemed to have an adverse effect. Suction was less advantageous than
blowing; where at a blowing massflow rate of 0.4 lbs/s the equivalent drag was minimized.
Blowing also proved beneficial in delaying the stall angle of attack, creating higher lift
coefficients at increased angles of attack. It was concluded that boundary layer control,
specifically TEB, could enhance the performance characteristics of an airfoil and increase its
operating range.
Pulsed vortex generator jets (VGJ) were applied by Bons et al (2000) in controlling the
separation on the suction surface of a low-pressure turbine blade. Test conditions are
comparable to those seen by high altitude aircraft engines. The VGJ array is constructed with
1mm diameter holes and has a 30° pitch and a 90° skew with the freestream direction at chord
locations of 45% and 63%. The jets could be pulsed at a rate up to 100 Hz. The benefits of
pulsed VGJ are to increase the mixing capabilities of flow control and lower the necessary
supply massflow needed to achieve separation control. Under steady conditions the VGJ were
able to reduce the wake loss coefficient by 30% at a Reynolds number equal to 25000 with an
injection massflow of approximately 0.2% of the turbine throughflow. Comparatively, under
pulsed conditions a 50% reduction in the wake loss coefficient was achieved with an order of
magnitude less massflow addition, or 0.02%, of the throughflow. A pulse rate of 10Hz was used
with a 50% duty cycle to create a Strouhal number near unity, the most effective condition for
preventing separation. Bons et al concluded that pulsed VGJ have great potential for controlling
the separation of turbine blades under low Reynolds number conditions, and required
considerably less blowing massflow then conventional TEB techniques or steady VGJ.
The aerodynamic performance of a tandem IGV cascade with combined BLS and TEB
operating at realistic flow conditions was investigated by Vandeputte (2000) in a linear transonic
blowdown wind tunnel. Single blade rows can be replaced by tandem blade rows to increase the
operating range of an engine. The tandem blade configuration used has an overall blade-turning
angle of 55°, and is comparable to an aircraft operating at approach conditions. An inlet Mach
number of 0.3 and a total pressure of 2.6 psig yielded a Reynolds number, based on chordlength,
greater than 500,000. Baseline test without flow control showed significant suction surface flow
Introduction 11
separation. Flow control was applied to the back tandem to reduce the effects of the viscous
wake and flow separation. The BLS design consisted of an array of 1/32-inch diameter holes
spaced 0.08 inches apart on the suction surface, at 0.59 chords from the leading edge and were
angled toward the incoming flow by 70° from local blade surface. A metal-angle and a
deviation-angle blowing TEB configuration consisting of 3/64-inch diameter holes spaced at 0.08
inches were tested separately. The metal-angle blowing configuration was located at the trailing
edge with an exit deviation of 1.5° from the blade exit angle. The deviation-angle blowing holes
were located at 0.96 chords from the leading edge and angled at 14° from the local blade surface.
Results showed that BLS was successful in delaying the suction surface separation and in
reducing the total pressure loss in the wake. The area averaged turbine total pressure loss
coefficient and wake momentum thickness were both reduced by 22% by removing only 0.4% of
the passage throughflow. BLS plus TEB at the metal-angle location reduced the total pressure
loss coefficient and wake momentum thickness 48% and 38%, respectively. However, a blowing
massflow of 3.1% of the passage through flow was required to achieve these results. Results
with the deviation angle configuration proved less effective. In fact the loss coefficient
increased with TEB by 14%, for a 3.1% massflow addition rate. With suction only the loss
coefficient was reduced by 17% and wake momentum thickness by 15%, with an equivalent
suction massflow of 0.33% of the passage throughflow. Combined suction and blowing efforts
at the deviation angle configuration yielded an 11% and 14% reduction in the loss coefficient
and wake momentum thickness, respectively. The poor results of the deviation angle TEB array
were attributed to a manufacturing error that distorted the flow of the blowing jets by producing
a difference between the jet centerline and the actual hole centerline, and contradicted the design
goals. Vandeputte reiterated the fact that hole design and location are imperative to maximizing
the positive effects of flow control. It was also concluded that a properly designed deviation
angle array of TEB holes would allow for momentum input from the trailing edge jets to be
maximized and produce a more symmetrical wake.
1.3: Objectives of current investigation.
Prior experiments and analysis have shown that flow control yields to benefits in engine
Introduction 12
noise suppression, aerodynamic enhancement by reducing wake pressure deficits, and
minimizing the unsteady stator-rotor interaction that generates engine damage or failure due to
high cycle fatigue. However, the majority of this research was conducted at relatively low flow
speeds and with flat plates or non-turning airfoils with either trailing edge blowing or boundary
layer suction. The effects of flow control at transonic flow speeds or with flow turning airfoils
have only recently been published. Several of these techniques required optimization or design
changes that further promoted the advantages associated with flow control.
The primary objective of this research is to investigate the aerodynamic effects of
applying flow control to a high turning compressor stator under transonic flow conditions, with a
new flow control design that allows for simultaneous BLS and TEB from a single motive
pressure source. The flow control design operates similar to an ejector pump, and mixes the
massflow removed through BLS with the motive massflow to produce a TEB massflow greater
than that originally supplied. This configuration is different from previous BLS applications
where a separate suction source was required and the massflow removed was lost to the
atmosphere. However, suction massflow is dependent on the flow control design, hole
geometry, and motive supply massflow, and is therefore not independently controllable.
Tests would be conducted in a linear transonic blowdown cascade wind tunnel, where
various cascade angles and flow speeds could be achieved. The reduction of the suction surface
flow separation and wake pressure losses were quantified in terms of a total pressure loss
coefficient. Supply massflows were varied in order to document a trend of the effectiveness of
flow control on total pressure loss as well as the benefits of the ejector design and suction
massflow. Preliminary tests were conducted with only one flow control stator, while later tests
added two additional stators with flow control capabilities. This allowed for two complete
passageways to be exposed to the effects of flow control.
Further analysis would lead to the documentation of additional benefits of flow control,
such as increased flow turning. Particle injection velocimetry (PIV) experiments were also
briefly conducted. These results offered a first ever glimpse into the flow field of a high turning,
high speed, flow controlled stator. This research was conducted in hopes to lay a foundation for
further investigations and applications of stator flow control in a transonic compressor.

Experimental Method 13
Chapter 2: Experimental Method
The following is a description of the component design and experimental setup of the
equipment used in conjunction with this research. The cascade and solid stator design is
described in Section 2.1. The flow control stator design is presented in Section 2.2. The
Virginia Tech Transonic Blowdown Wind tunnel is described in Section 2.3. Instrumentation
and data acquisition techniques are recorded in Section 2.4, and measurement and data reduction
methods in Section 2.5. PIV testing is briefly mentioned in Section 2.6.
2.1: Cascade and Stator Design.
The stator geometry is based on the experimental USAF TESCOM compressor. A two-
dimensional cross-section of the three-dimensional stator shape was chosen. The high-turning
design is atypical and is representative of current trends in compressor design. Stator chord
length is four (4) inches (10.16 cm), with a span equal to six (6) inches (15.24 cm). The
distance, pitch, between stators is 1.8 inches (4.57 cm). There is a total blade turning angle of
69°. A range of cascade angles (i) were tested, where the cascade angle was defined as the angle
of the mean camber line with respect to the horizontal. A cascade angle of +3° was considered
as the primary angle of interest based on sponsor provided information, and the majority of data
recorded was taken at this angle. This angle is not considered to be the incidence angle, due to
the fact that the wind tunnel inlet flow angle may not be horizontal. The wind tunnel inlet flow
angle has been documented in past experiments to differ by as much as +3° with respect to the
horizontal. However, the inlet flow angle was not documented for these experiments and may
not differ by the same magnitude. For example a cascade angle of 0° could correspond to an
incidence of +3°. Design inlet flow speed is Mach 0.79 for the given geometry. The Reynolds
number based on chord length is 2 × 10⁶. Table 2.1 summarizes the design geometry and flow
conditions for the tested stator.
Experimental Method 14
Table 2.1: Blade Specifications and Design Conditions
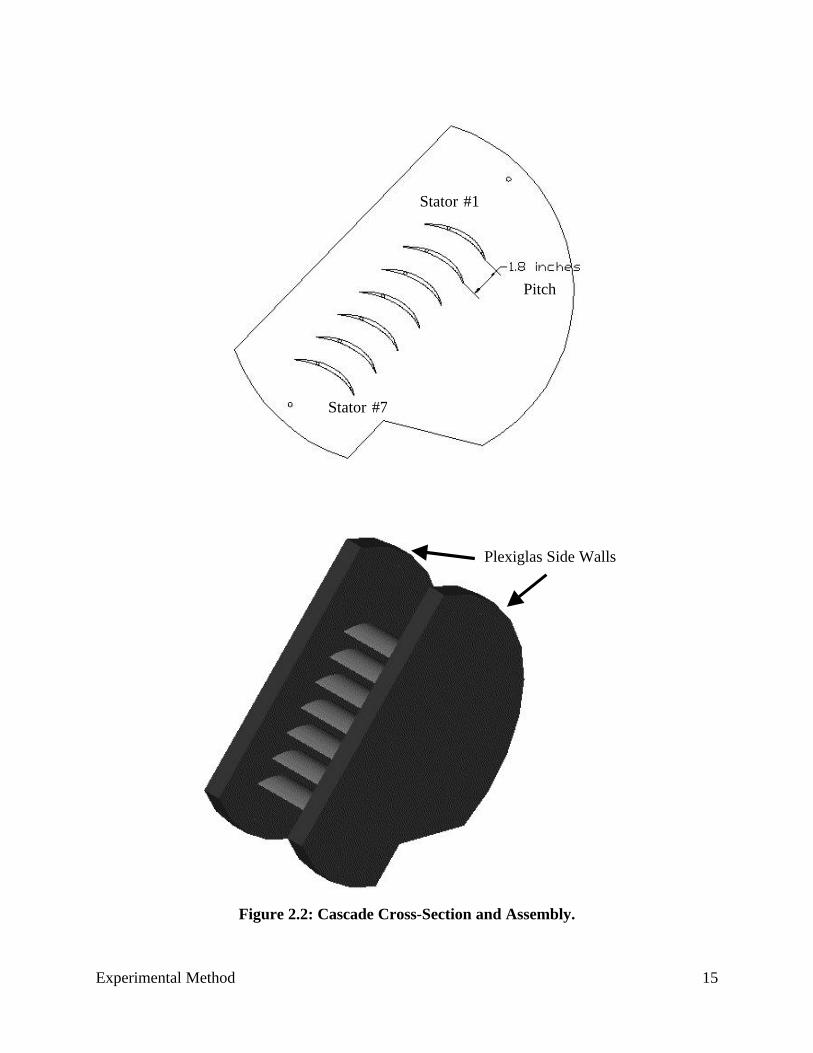
Each of the seven stators contain four circular pins, one near the leading edge and trailing
edge on both sides, used for mounting. Stators were manufactured out of stainless steel by wire
EDM. The stators are fixed relative to each other between two pieces of 1¼-inch thick
Plexiglas. Plexiglas was used to aid in setup and flow visualization. The cascade can be
rotated to adjust the cascade angle and accommodate for off-design conditions. Stators are
numbered one through seven from top to bottom, with one being the top most stator. Figure 2.1
illustrates a cross-sectional view of the stator design. Figure 2.2 shows a cross-section and the
assembled cascade.
Figure 2.1: Stator Cross-Section.
Blade Cascade
Angle, α1
Blade Exit
Angle, α2
Chord, C
Blade Chord, C 4.0 inchesSpan, S 6.0 inchesPitch 1.8 inches
Total Stator Turning Angle 69°Design Mach Number, Mdesign 0.79
Experimental Method 15
Figure 2.2: Cascade Cross-Section and Assembly.
Stator #1
Stator #7
Pitch
Plexiglas Side Walls
Experimental Method 16
2.2: Flow Control Stator Design.
2.2.1: Ejector Pump Concept.
The flow control design used in this research provides both boundary layer suction (BLS)
and trailing edge blowing (TEB). Internal plenum and passage geometry is based on the idea of
an ejector pump. Ejector pumps develop suction from a high-pressure motive supply source.
Since pressure sources are easily attainable, ejector pumps are widely used for this purpose. In
previous flow control experiments the mass flow removed through BLS was lost and ejected into
the surrounding atmosphere. By using an imbedded ejector pump the massflow removed by
BLS is added to the supplied motive massflow and the combined massflows exit through the
TEB location.
There are a wide variety of commercially available ejector pumps, also known as jet
pumps or Venturi pumps, for a range of applications. Ejector pumps are used in such areas as;
materials handling, sewage removal, fluid evacuation (i.e. smoke filled rooms, dust removal),
automotive industry, electronics cooling, and a wide variety of other applications were a vacuum
source is required. Ejector pumps have no moving parts and therefore easily constructed and
reliable once a design is developed based on the defined requirements. These design
requirements are usually based on the amount of suction massflow developed versus the motive
supply massflow, or the amount of vacuum pressure required by the application. Ejector pumps
utilize fluids in motion under controlled conditions, where a motive fluid massflow supplied by a
high-pressure source is directed through a nozzle creating a high-velocity jet. This high-velocity
jet creates a low-pressure region in a mixing chamber where additional fluid is entrained from
the surrounding environment, thus creating a suction source. (Karassik et al, 1986)
The majority of commercial available ejector pumps contain either an internal
converging-diverging nozzle where the jet velocity can reach supersonic speeds at the nozzle
exit, or a converging nozzle or Venturi section where the jet can expand supersonically and thus
create a low-pressure region for fluid entrainment. Ejector pumps are commercial available from
a variety of sources with types and designs based on the costumers needs. Performance
characteristics are based on the amount of suction massflow developed and at what pressures for
a given motive massflow, along with the evacuation rate or the time required to remove a certain
volume of fluid. Entrained suction massflow to motive massflow ratios for commercially
Experimental Method 17
available ejector pumps range from 0.1 or lower for very high vacuum levels or as large as 50 for
applications that require a very large massflow removal with very low amounts of suction. The
performance of an ejector pump is highly dependent on the customers needs and the application
in which it will be used. Suction massflow rates are usually adjustable and are based on the
amount of motive supplied.
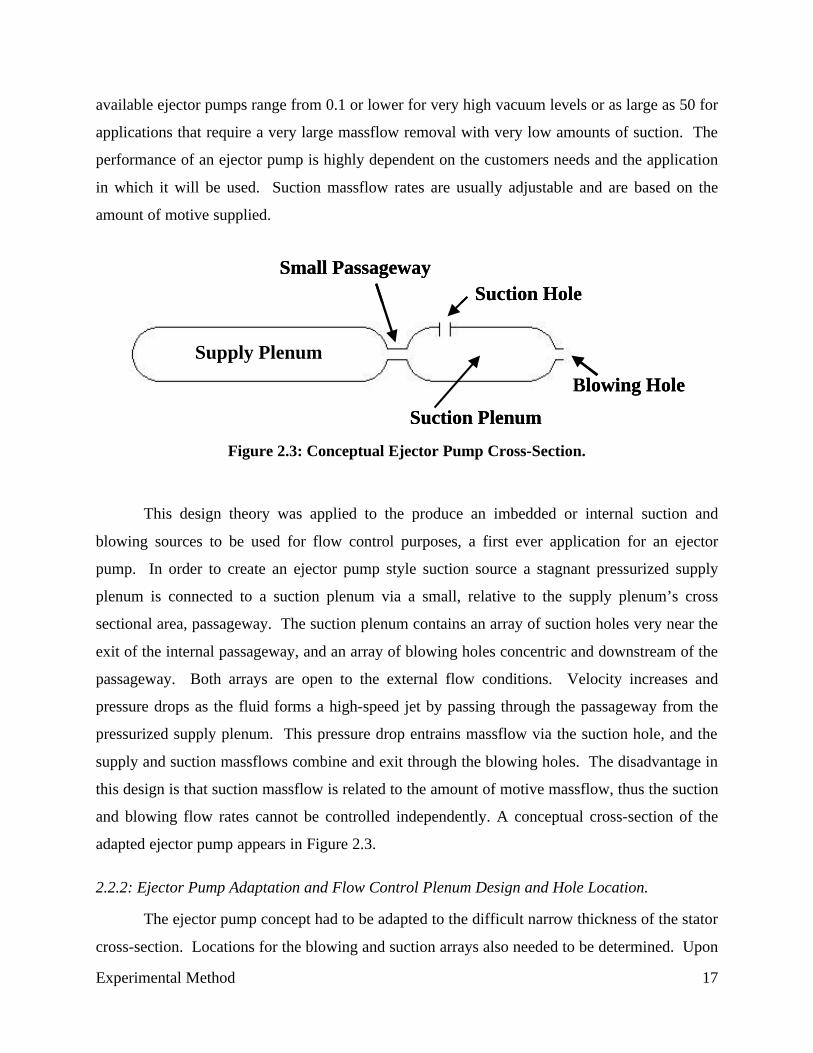
Figure 2.3: Conceptual Ejector Pump Cross-Section.
This design theory was applied to the produce an imbedded or internal suction and
blowing sources to be used for flow control purposes, a first ever application for an ejector
pump. In order to create an ejector pump style suction source a stagnant pressurized supply
plenum is connected to a suction plenum via a small, relative to the supply plenum’s cross
sectional area, passageway. The suction plenum contains an array of suction holes very near the
exit of the internal passageway, and an array of blowing holes concentric and downstream of the
passageway. Both arrays are open to the external flow conditions. Velocity increases and
pressure drops as the fluid forms a high-speed jet by passing through the passageway from the
pressurized supply plenum. This pressure drop entrains massflow via the suction hole, and the
supply and suction massflows combine and exit through the blowing holes. The disadvantage in
this design is that suction massflow is related to the amount of motive massflow, thus the suction
and blowing flow rates cannot be controlled independently. A conceptual cross-section of the
adapted ejector pump appears in Figure 2.3.
2.2.2: Ejector Pump Adaptation and Flow Control Plenum Design and Hole Location.
The ejector pump concept had to be adapted to the difficult narrow thickness of the stator
cross-section. Locations for the blowing and suction arrays also needed to be determined. Upon
Supply Plenum
Small Passageway
Suction Plenum
Suction Hole
Blowing Hole
Supply Plenum
Small Passageway
Suction Plenum
Suction Hole
Blowing Hole
Experimental Method 18
defining array locations, plenums could be fitted to the local stator thickness and curvature. A
combination of sponsor provided CFD and cascade oil flow visualization were used to determine
a suction surface separation point. The array of discrete suction holes would be located slightly
downstream of this separation point, and blowing holes at an optimal distance further
downstream based on the available stator thickness.
Surface oil flow visualization is routinely used in the Virginia Tech transonic wind tunnel
to locate separation points, shock locations, and boundary layer effects. The stator surface is
coated with a florescent oil dye, placed in the wind tunnel, and the experiment is conducted in
the same manner as if aerodynamic measurements were being taken. Results from oil surface
visualization at design and off-design cascades appear in Appendix 1, along with limited CFD
data.
The suction array location was placed at an axial position of 0.805 chordlengths from the
leading edge, based on separation point results. With the suction array location determined the
internal plenums could be designed to maximize their cross-sectional area, and a blowing array
position defined. The motive plenum was made as large as possible to provide true plenum
(stagnation) conditions with a total cross-sectional area of 0.0873 in2 (0.563cm2). The motive
plenum is connected to the suction plenum through a total of 17-0.03125-inch (0.794mm)
diameter passageways. The result is a plenum to passageway area ratio of nearly 6.7. The
suction plenum has a teardrop cross-section providing a cross-sectional area of 0.0182 in2
(0.117cm2). The blowing array is located at an axial position of 0.895 chordlengths from the
leading edge.
Experimental Method 19
Figure 2.4: Geometrical Simulated Model.
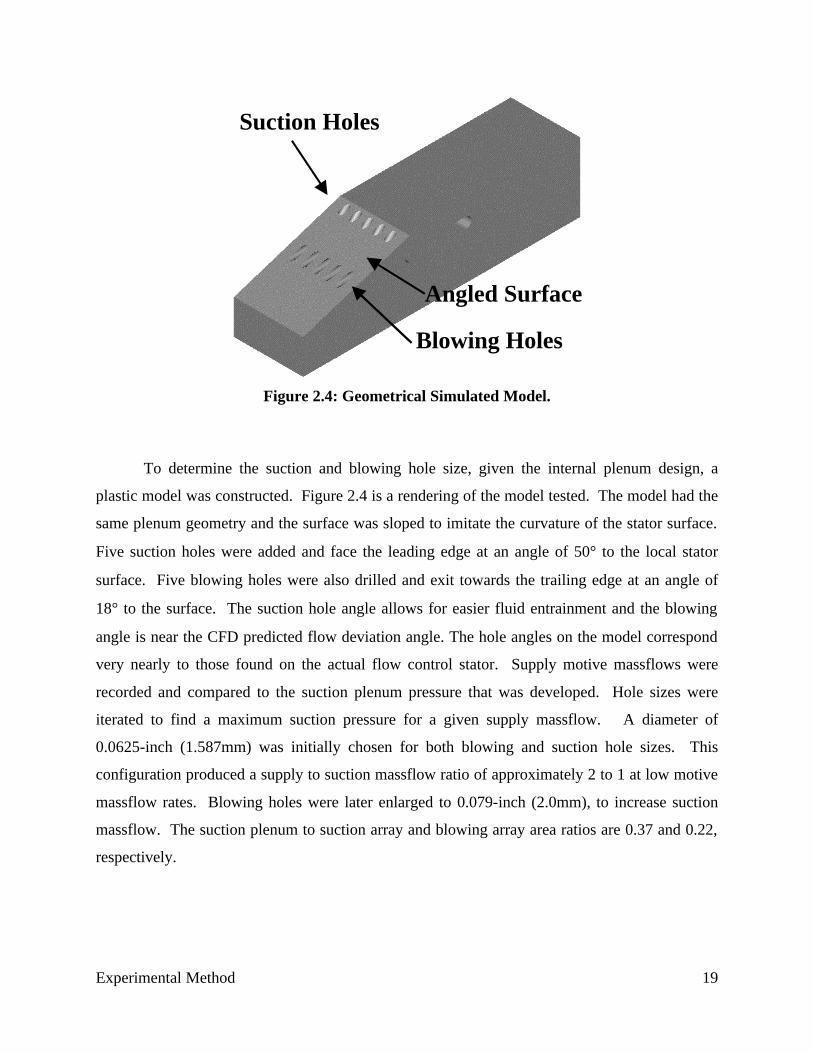
To determine the suction and blowing hole size, given the internal plenum design, a
plastic model was constructed. Figure 2.4 is a rendering of the model tested. The model had the
same plenum geometry and the surface was sloped to imitate the curvature of the stator surface.
Five suction holes were added and face the leading edge at an angle of 50° to the local stator
surface. Five blowing holes were also drilled and exit towards the trailing edge at an angle of
18° to the surface. The suction hole angle allows for easier fluid entrainment and the blowing
angle is near the CFD predicted flow deviation angle. The hole angles on the model correspond
very nearly to those found on the actual flow control stator. Supply motive massflows were
recorded and compared to the suction plenum pressure that was developed. Hole sizes were
iterated to find a maximum suction pressure for a given supply massflow. A diameter of
0.0625-inch (1.587mm) was initially chosen for both blowing and suction hole sizes. This
configuration produced a supply to suction massflow ratio of approximately 2 to 1 at low motive
massflow rates. Blowing holes were later enlarged to 0.079-inch (2.0mm), to increase suction
massflow. The suction plenum to suction array and blowing array area ratios are 0.37 and 0.22,
respectively.
Suction Holes
Blowing Holes
Angled Surface
Experimental Method 20
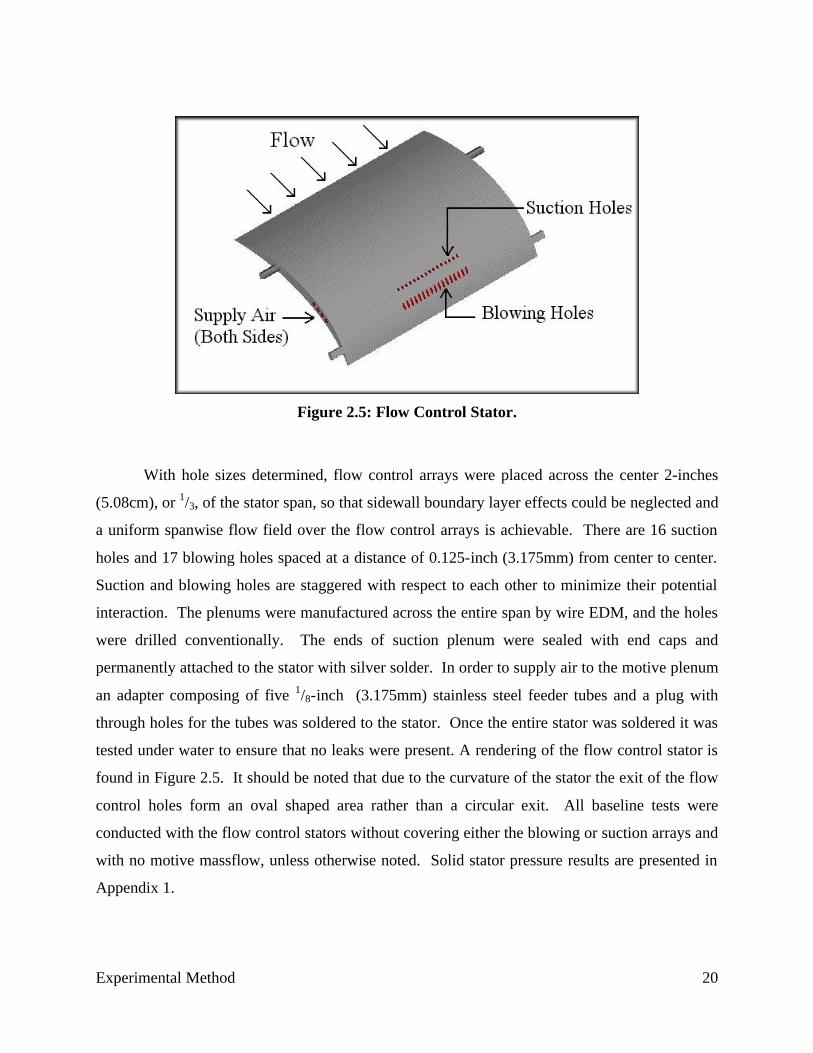
Figure 2.5: Flow Control Stator.
With hole sizes determined, flow control arrays were placed across the center 2-inches
(5.08cm), or 1/3, of the stator span, so that sidewall boundary layer effects could be neglected and
a uniform spanwise flow field over the flow control arrays is achievable. There are 16 suction
holes and 17 blowing holes spaced at a distance of 0.125-inch (3.175mm) from center to center.
Suction and blowing holes are staggered with respect to each other to minimize their potential
interaction. The plenums were manufactured across the entire span by wire EDM, and the holes
were drilled conventionally. The ends of suction plenum were sealed with end caps and
permanently attached to the stator with silver solder. In order to supply air to the motive plenum
an adapter composing of five 1/8-inch (3.175mm) stainless steel feeder tubes and a plug with
through holes for the tubes was soldered to the stator. Once the entire stator was soldered it was
tested under water to ensure that no leaks were present. A rendering of the flow control stator is
found in Figure 2.5. It should be noted that due to the curvature of the stator the exit of the flow
control holes form an oval shaped area rather than a circular exit. All baseline tests were
conducted with the flow control stators without covering either the blowing or suction arrays and
with no motive massflow, unless otherwise noted. Solid stator pressure results are presented in
Appendix 1.
Experimental Method 21
2.2.3: Flow Control Cascade and Motive Air Supply Setup.
The flow control stators are located in the center three, or the number 3, 4, and 5,
positions of the seven-blade cascade. Air is fed through a slot from both Plexiglas sidewalls
with the five stainless steel tubes soldered to the stator protruding through by ¼-inch (6.35mm).
Silicone is added to the slot to ensure that all air supplied reaches the motive supply plenum. An
aluminum adaptor is screwed to the outside of the Plexiglas and supplies pressurized air to the
stainless steel tubing via a half-inch nylon hose.
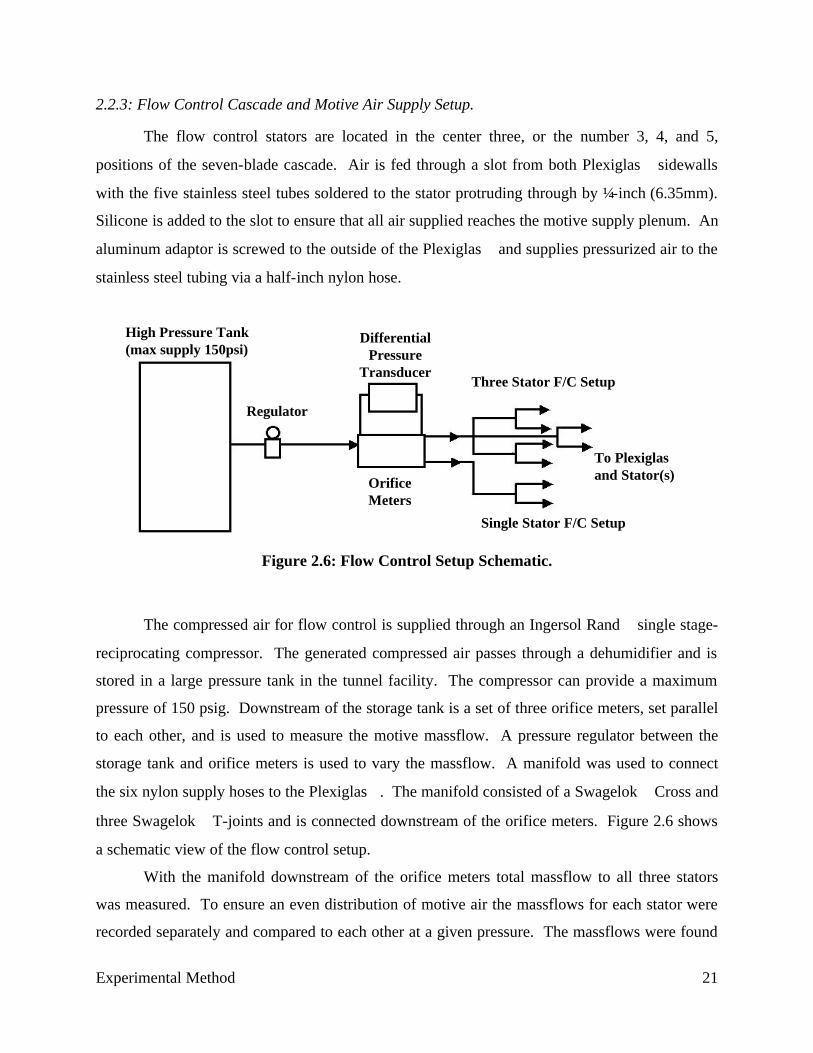
Figure 2.6: Flow Control Setup Schematic.
The compressed air for flow control is supplied through an Ingersol Rand single stage-
reciprocating compressor. The generated compressed air passes through a dehumidifier and is
stored in a large pressure tank in the tunnel facility. The compressor can provide a maximum
pressure of 150 psig. Downstream of the storage tank is a set of three orifice meters, set parallel
to each other, and is used to measure the motive massflow. A pressure regulator between the
storage tank and orifice meters is used to vary the massflow. A manifold was used to connect
the six nylon supply hoses to the Plexiglas. The manifold consisted of a Swagelok Cross and
three Swagelok T-joints and is connected downstream of the orifice meters. Figure 2.6 shows
a schematic view of the flow control setup.
With the manifold downstream of the orifice meters total massflow to all three stators
was measured. To ensure an even distribution of motive air the massflows for each stator were
recorded separately and compared to each other at a given pressure. The massflows were found
High Pressure Tank (max supply 150psi)
Three Stator F/C Setup
Single Stator F/C Setup
Regulator
Differential Pressure
Transducer
Orifice Meters
To Plexiglas and Stator(s)
High Pressure Tank (max supply 150psi)
Three Stator F/C Setup
Single Stator F/C Setup
Regulator
Differential Pressure
Transducer
Orifice Meters
High Pressure Tank (max supply 150psi)
Three Stator F/C Setup
Single Stator F/C Setup
Regulator
Differential Pressure
Transducer
Orifice Meters
To Plexiglas and Stator(s)

Experimental Method 22
to differ by up to 8%. This dissimilarity can be attributed to small manufacturing and assembly
differences in the stators. The reported motive massflow in each case is that of the center flow
control stator and was adjusted to accommodate for these differences.
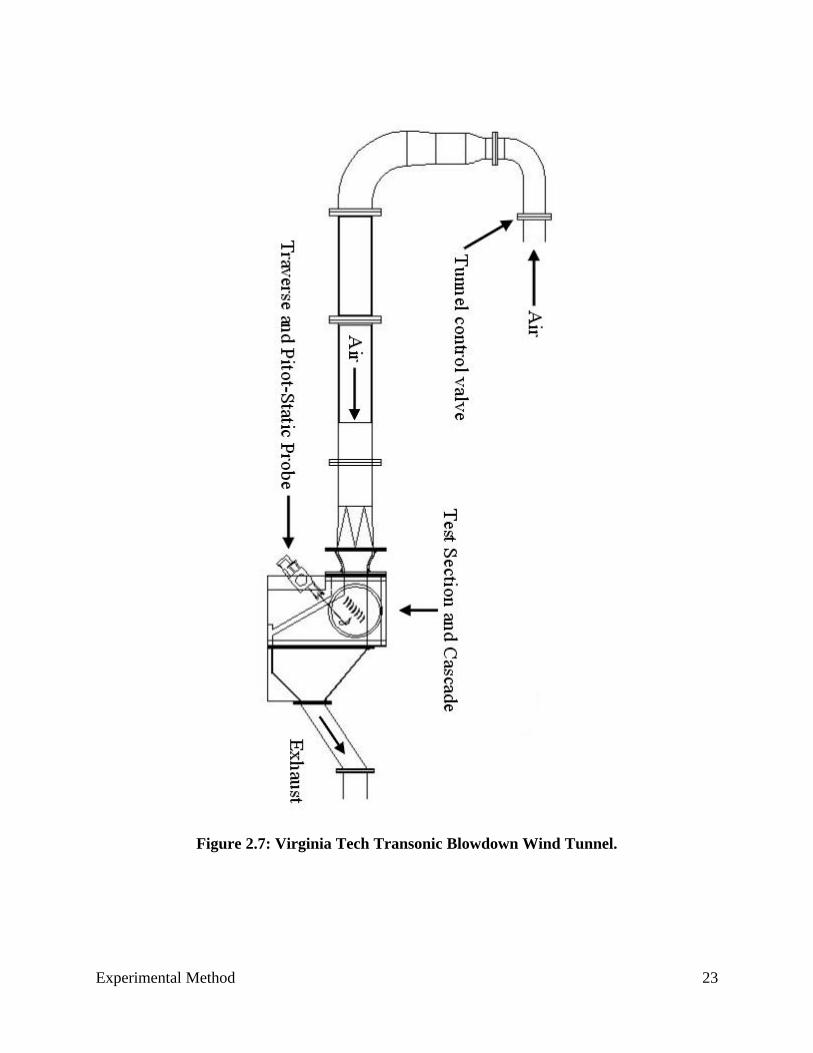
2.3 Description of the Transonic Blowdown Wind Tunnel at Virginia Tech.
The cascade employed in this experiment was tested in the transonic blowdown wind
tunnel facility at Virginia Polytechnic Institute and State Institute. Compressed air from a four
stage, reciprocating Ingersol Rand compressor is stored in two storage tanks located in the
same room as the compressor. The air is dried and cooled prior to being discharged into the
wind tunnel in the adjacent room. The Mach number is based on the total pressure of the tunnel
and is set prior to running. The total inlet pressure is held constant through a pneumatic butterfly
valve controlled via a personal computer based program. The tunnel control program is based on
several constants, which can be adjusted to accommodate different test sections, cascades, and
flow conditions. The pressure feedback loop allows the tunnel control program to generate a
voltage signal to pass through an electro-pneumatic converter and to open or close the butterfly
valve accordingly.
Incoming flow is straightened and passes through a series of wire-mesh grids to generate
a uniform flow field at the inlet of the test section. A nozzle upstream of the test section
accelerates the flow as it enters the cascade. Downstream of the previously described cascade
the flow exits through an exhaust duct and muffler venting to the atmospheric conditions outside
of the testing facility. Neither tailboard nor turbulence grid were used during these experiments.
Figure 2.7 shows the basic layout of the transonic wind tunnel.
Experimental Method 23
Figure 2.7: Virginia Tech Transonic Blowdown Wind Tunnel.

Experimental Method 24
2.4: Instrumentation and Data Acquisition.
Data collected consisted solely of pressure and temperature information and were used to
quantify the aerodynamic performance of the cascade. These aerodynamic measurements
consisted of:
Ø Upstream Total Pressure, PT1
Ø Upstream Static Wall Pressure, P1
Ø Upstream Total Temperature, TT1
Ø Upstream Less Downstream Differential Total Pressure, PT1 – PT2, ∆PT
Ø Downstream Static Pressure, P2
Ø Suction Plenum Static Pressure, Psuction
All pressure measurement instruments were connected to a 20-channel pressure transducer
box. The pressure box uses Lucan Nova Sensor NPC-410 micromachined piezoresistive
pressure transducers to convert pressure data into voltages. All pressures were recorded using a
transducer range of 0-5 psi, with the exception of the upstream total pressure, which was
measured on a 0-15 psi transducer. The nominal accuracy of the transducers is ±0.5%. Gage
pressure was measured for all but the downstream total pressure, which was measured with
respect to the upstream total pressure, PT1 – PT2. The pressure transducers were calibrated prior
to running each set of experiments with a 0-30psi Fluke pressure calibrator. Standard 9-volt
batteries were used as the power source for the pressure transducers. Consequently zero pressure
data was recorded each day to account for any changes in battery voltage. Local atmospheric
pressure was measured daily with a Kahlsico Precision Aneroid Barometer MK2, in a room
adjacent to the tunnel.
A fixed Pitot probe placed approximately two feet upstream of the test section was used to
measure the upstream total pressure, PT1. Upstream static pressure, P1, was measured with a
static tap through the Plexiglas sidewall. The static tap was located 1.5 pitchlengths in the
streamwise direction upstream of the center stator leading edge. A conventional Pitot-static
probe was used to record downstream static pressure, P2, and differential total pressure, ∆PT.
The probe has a tip diameter of 1/16 inch (1.588mm) and a total pressure sensing hole diameter
of 1/32 in (0.794mm). Four static pressure holes 0.5 inch (12.7mm) downstream of the probe tip
are spaced 908 around the circumference with a diameter of 1/64 in (0.397mm). The probe is
sensitive to ±88. Due to this fact the probe tip was angled to match the expected freestream exit
Experimental Method 25
flow angle. The suction plenum pressure was measured by the use of a static tap drilled and
soldered into the end cap of the plenum. The 1/16 stainless steel tube used for the static tap
protruded through a hole drilled in the Plexiglas sidewall. Tygon pressure tubing was used
to connect the pressure probes and taps to the pressure box.
A K-type thermocouple was used to measure the tunnel upstream total temperature, TT1. The
thermocouple has a nominal accuracy of ±28K and is located at approximately the same location
as the upstream total pressure probe. Thermocouple output is recorded and converted through
the data acquisition system and software.
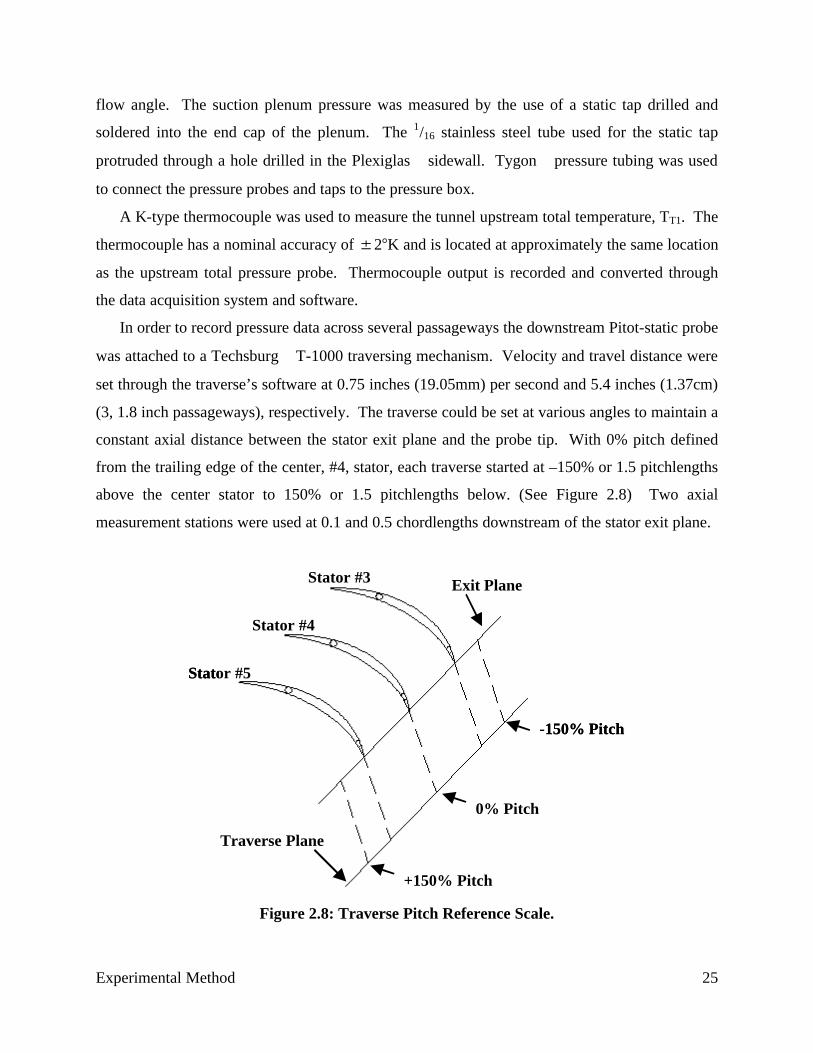
In order to record pressure data across several passageways the downstream Pitot-static probe
was attached to a Techsburg T-1000 traversing mechanism. Velocity and travel distance were
set through the traverse’s software at 0.75 inches (19.05mm) per second and 5.4 inches (1.37cm)
(3, 1.8 inch passageways), respectively. The traverse could be set at various angles to maintain a
constant axial distance between the stator exit plane and the probe tip. With 0% pitch defined
from the trailing edge of the center, #4, stator, each traverse started at –150% or 1.5 pitchlengths
above the center stator to 150% or 1.5 pitchlengths below. (See Figure 2.8) Two axial
measurement stations were used at 0.1 and 0.5 chordlengths downstream of the stator exit plane.
Figure 2.8: Traverse Pitch Reference Scale.
Stator #3
Stator #4
Stator #5
Exit Plane
Traverse Plane
+150% Pitch
0% Pitch
-150% Pitch
Stator #3
Stator #4
Stator #5
Exit Plane
Traverse Plane
+150% Pitch
0% Pitch
-150% Pitch

Experimental Method 26
Motive massflows were measured with the previously mentioned orifice meters. Three
different diameters, 0.180, 0.280, 0.440 inches, of Lambda Square orifice meters were
available to accurately measure a wide range of massflows. Upstream supply pressure is
measured by an analog pressure gage and controlled by a manual pressure regulator. Upstream
total temperature was measured with an Omega K-type thermocouple and digital hand readout.
A Validyne differential pressure transducer with a range of 0-3psid measured the pressure drop
across the orifice meter.
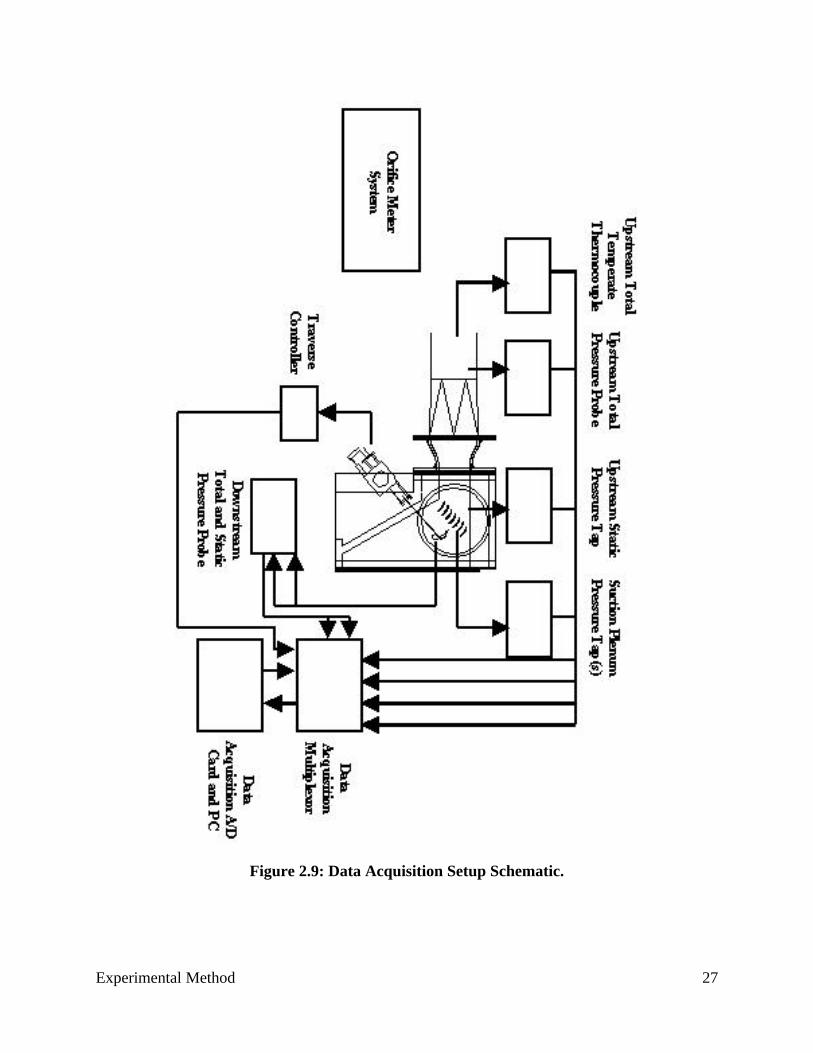
A PC based Labview data acquisition system was employed to sample and record pressure
and thermocouple voltage data. Low impedance BNC cables from the pressure box were
connected to a 64-channel (32 voltage signals and 32 thermocouple signals) multiplexor. A
National Instruments A/D PC board samples the signals at a user defined sampling rate and
time interval. All data recorded was sampled at a rate of 200 Hz.
Signals recorded by the data acquisition are as follow:
Ø Upstream Total Pressure, PT1
Ø Upstream Static Wall Pressure, P1
Ø Upstream Total Temperature, TT1
Ø Upstream Less Downstream Differential Total Pressure, PT1 – PT2, ∆PT
Ø Downstream Static Pressure, P2
Ø Suction Plenum Static Pressure, Psuction.
Ø Traverse Voltage.
A visual layout of the data acquisition system is shown in Figure 2.9.
Experimental Method 27
Figure 2.9: Data Acquisition Setup Schematic.

Experimental Method 28
2.5: Data Reduction Technique and Key Parameter Calculations.
The saved Labview data file was calibrated and reduced in a Microsoft Excel
spreadsheet template where all noteworthy parameters and plots were generated and compiled.
Flow control effectiveness was primarily quantified in terms of pressure loss, ω, and was iterated
over a range of motive massflows and compared to a no flow control baseline. Ejector pump
properties were measured in terms of the suction plenum pressure. The difference between
baseline plenum pressure and plenum pressure with flow control was defined as ∆Psuction.
Viscous effects across a stator generate a total pressure loss represented in a wake
traverse plot. The total pressure ratio, PT2/PT1 in the freestream is approximately unity, and drops
in the presence of the stator wake. The total pressure loss coefficient for these experiments is
quantified as follows.
Equation 2.1
or
Equation 2.2
In Equation 2.1 i = 1 is indicated as the starting position of the wake traverse or 50%
pitch above the stator’s trailing edge, i = n is representative as 50% below. Therefore, the total
pressure loss coefficient is represented here as the ratio of average differential total pressure
across the passageway, over the average difference between the upstream total and static
pressure across the same interval. A total of three passageways were traversed across, with the
starting point defined as –150% pitch, or 50% (0.9inches) above the #3 stator, with an ending
point of 150% or 50% (0.9inches) below the # 5 stator. The zero pitch reference is located at the
trailing edge of the center, #4, stator. See Figure 2.8 for a graphical depiction of the pitch
1ni1i1T
n
1i
i2Ti1T
n
1i
yy
y
)P(P
)P(P
−∆
−Σ
−Σ=ω
−
−
,Average1,Average1T
,Average2T,Average1T
PP
PP
−−
=ω

Experimental Method 29
reference scale used. Other parameters found included the inlet Mach number, M1, and delta
suction plenum pressure, ∆Psuction. The inlet Mach number was found as follows:
Equation 2.3
Performance of the imbedded ejector pump is characterized by the amount of suction
pressure generated. The difference between a no flow control plenum pressure and a plenum
pressure with flow control is defined as the delta suction plenum pressure, ∆Psuction.
Equation 2.4
Where Psuction, o is the plenum pressure with no flow control, and Psuction, F/C the pressure under
flow control.
Motive supply massflow was varied and its effectiveness on the loss coefficient
investigated. Motive massflow is non-dimensionalized by dividing by the passage throughflow
and represented as a percentage. Inlet conditions are used to find the massflow through the stator
passage.
Equation 2.5
where:
Equation 2.6
Equation 2.7
Equation 2.8
with
Equation 2.9
−
−γ
=γ−γ
1P
P
1
2M
1
1
1T1
C/F,suctiono,suctionsuction PPP −=∆
)(sin )Pitch)(Span(A staggerpassage θ=
111 RTMV γ=
21
1T1
M2
11
TT
−γ+
=
1
•
ρ= 1passage V Am
1
1
RT
P=ρ 1
Experimental Method 30
All of the above variables are either measured parameters or defined geometric
properties.
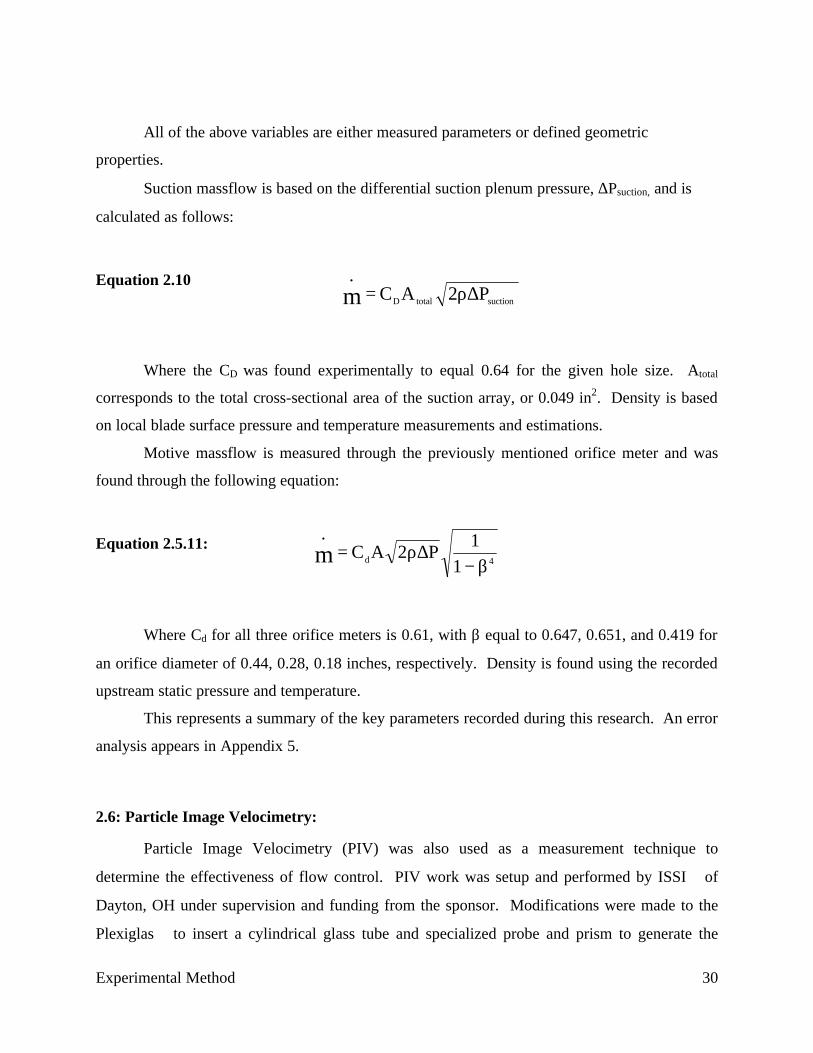
Suction massflow is based on the differential suction plenum pressure, ∆Psuction, and is
calculated as follows:
Equation 2.10
Where the CD was found experimentally to equal 0.64 for the given hole size. Atotal
corresponds to the total cross-sectional area of the suction array, or 0.049 in2. Density is based
on local blade surface pressure and temperature measurements and estimations.
Motive massflow is measured through the previously mentioned orifice meter and was
found through the following equation:
Equation 2.5.11:
Where Cd for all three orifice meters is 0.61, with β equal to 0.647, 0.651, and 0.419 for
an orifice diameter of 0.44, 0.28, 0.18 inches, respectively. Density is found using the recorded
upstream static pressure and temperature.
This represents a summary of the key parameters recorded during this research. An error
analysis appears in Appendix 5.
2.6: Particle Image Velocimetry:
Particle Image Velocimetry (PIV) was also used as a measurement technique to
determine the effectiveness of flow control. PIV work was setup and performed by ISSI of
Dayton, OH under supervision and funding from the sponsor. Modifications were made to the
Plexiglas to insert a cylindrical glass tube and specialized probe and prism to generate the
4d 1
1P2ACm β−
∆ρ=•
suctiontotalD P2ACm ∆ρ=•
Experimental Method 31
necessary laser sheet. The sheet was focused over a blowing hole on the center stator. Alumina
dioxide particles were used to seed both the freestream and flow control motive air. PIV was
only conducted on the three-flow control stator setup. For further details into a similar PIV setup
and functionality consult the following reference. Selected results appear in Appendix 4
J. Estevadeordal, S. Gogineni, L. Goss, W. Copenhaver, S. Gorrell; Study of Flow-Field
Interactions in a Transonic Compressor using DPIV; AIAA 00-0378; 38th Aerospace Sciences
Meeting and Exhibit, January 00, Reno, NV

Experimental Results 32
Chapter 3: Experimental Results:
The following is a review of the results obtained from cascade experiments with a unique
imbedded ejector pump flow control design. This new design allows for simultaneous boundary
layer suction (BLS) and trailing edge blowing (TEB). Testing with flow control proved that a
significant reduction in the total pressure loss coefficient is achievable. A range of flow control
motive massflows was compared under the same flow conditions. To find the effective range of
the flow control design the cascade angle was varied. Also identified was the benefit of
additional flow turning due to flow control. The total pressure ratio data and area averaged total
pressure loss coefficients presented here (except where noted) are from a three-flow control
stator setup. This setup was tested after developing and proving the flow control design with a
single flow control stator in the center of the seven-stator linear cascade. The inlet Mach number
for all experiments is 0.79, and corresponds to a freestream exit Mach number of approximately
0.6. The Reynolds number based on chord length is 2 × 10⁶.
Solid stator experiments were conducted to identify a separation point and characterize
the stator performance, these results appear in Appendix 1. Appendix 2 contains the results of
the original flow control design. The flow control design was modified by enlarging the blowing
holes, and as a result the suction massflow was increased. Results from the modified single
stator flow control experiments can be found in Appendix 3. A brief set of particle injection
velocimetry (PIV) measurements were also taken with the three-flow control stator setup and are
summarized in Appendix 4. An error analysis for all measurements is provided in Appendix 5.
3.1: Pressure and Loss Results of Three-Flow Control Stator Setup.
Upon reaching a final flow control design, two additional flow control stators were
manufactured and placed into positions 3 and 5 of the seven-stator cascade (see Figure 2.2). This
allowed the center (#4) stator to have one complete passageway above and below under the
influence of flow control. For all results only the center stator traverse data are plotted and
summarized.
Baseline and flow control total pressure ratio data for a cascade angle of +3° and an inlet
Mach number of 0.79 are presented in Figure 3.1. All baseline conditions refer to the flow
control stator with the BLS and TEB arrays uncovered, but without flow control massflow.
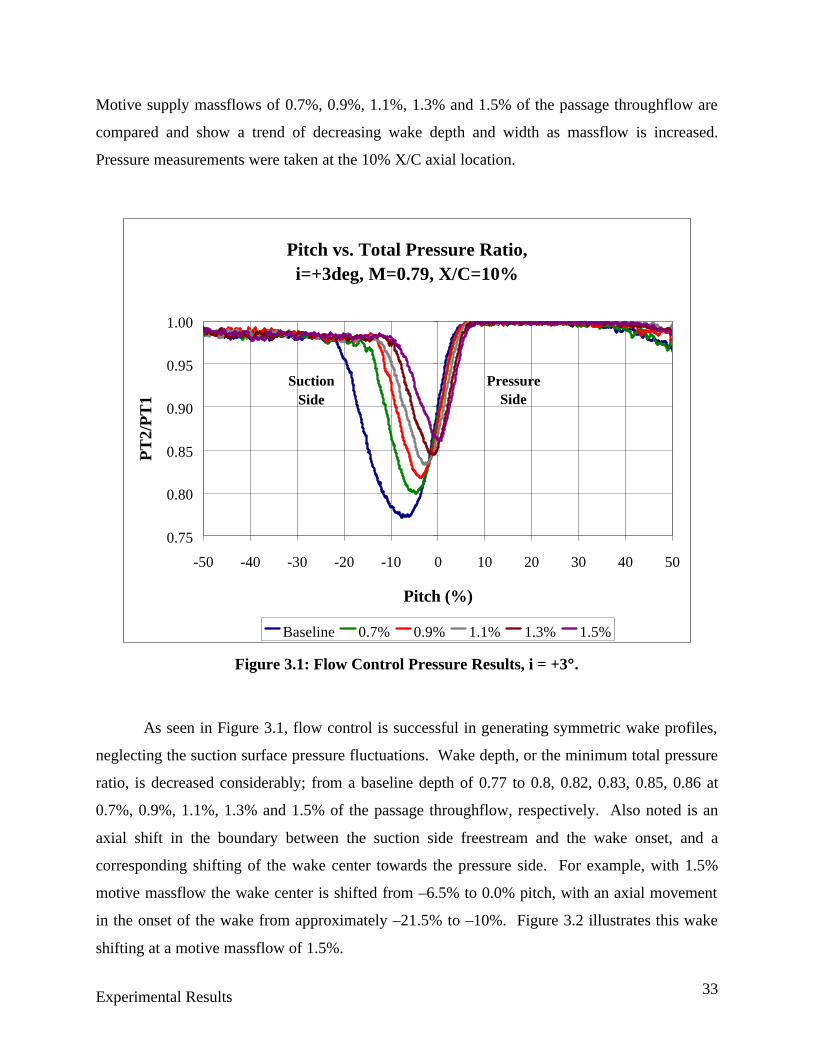
Experimental Results 33
Motive supply massflows of 0.7%, 0.9%, 1.1%, 1.3% and 1.5% of the passage throughflow are
compared and show a trend of decreasing wake depth and width as massflow is increased.
Pressure measurements were taken at the 10% X/C axial location.
Figure 3.1: Flow Control Pressure Results, i = +3°°.
As seen in Figure 3.1, flow control is successful in generating symmetric wake profiles,
neglecting the suction surface pressure fluctuations. Wake depth, or the minimum total pressure
ratio, is decreased considerably; from a baseline depth of 0.77 to 0.8, 0.82, 0.83, 0.85, 0.86 at
0.7%, 0.9%, 1.1%, 1.3% and 1.5% of the passage throughflow, respectively. Also noted is an
axial shift in the boundary between the suction side freestream and the wake onset, and a
corresponding shifting of the wake center towards the pressure side. For example, with 1.5%
motive massflow the wake center is shifted from –6.5% to 0.0% pitch, with an axial movement
in the onset of the wake from approximately –21.5% to –10%. Figure 3.2 illustrates this wake
shifting at a motive massflow of 1.5%.
Pitch vs. Total Pressure Ratio, i=+3deg, M=0.79, X/C=10%
0.75
0.80
0.85
0.90
0.95
1.00
-50 -40 -30 -20 -10 0 10 20 30 40 50
Pitch (%)
PT
2/P
T1
Baseline 0.7% 0.9% 1.1% 1.3% 1.5%
Pressure Side
Suction Side
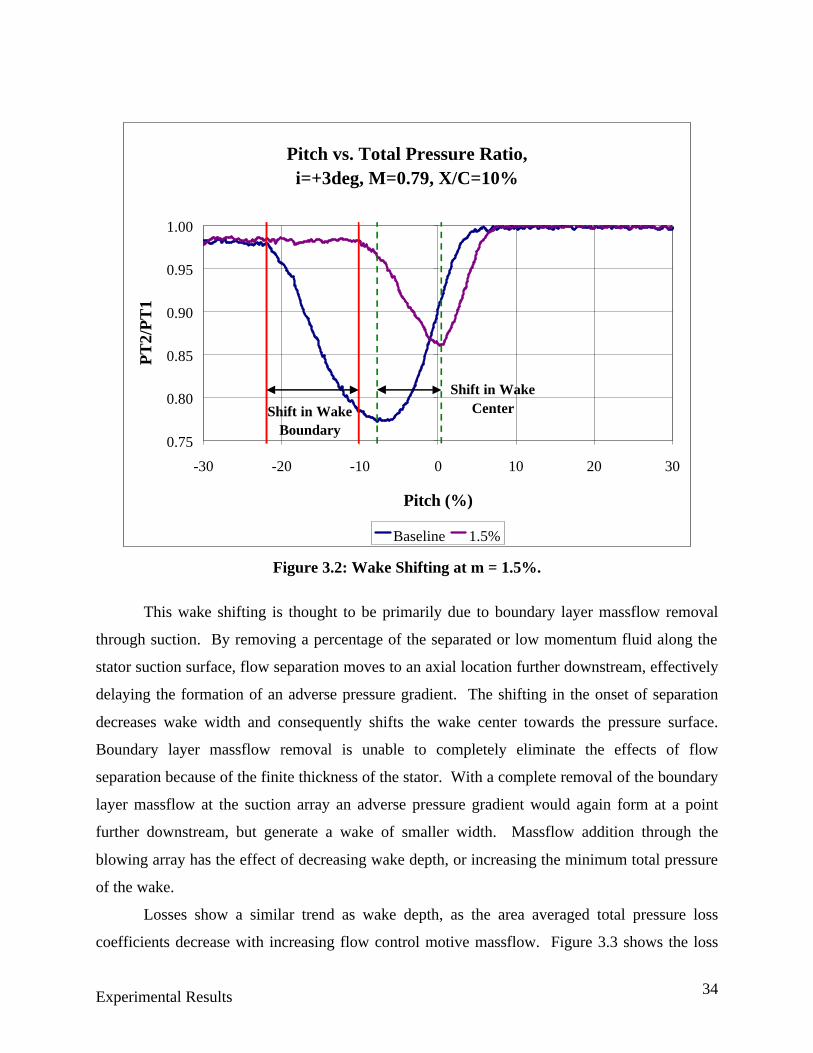
Experimental Results 34
Figure 3.2: Wake Shifting at m = 1.5%.
This wake shifting is thought to be primarily due to boundary layer massflow removal
through suction. By removing a percentage of the separated or low momentum fluid along the
stator suction surface, flow separation moves to an axial location further downstream, effectively
delaying the formation of an adverse pressure gradient. The shifting in the onset of separation
decreases wake width and consequently shifts the wake center towards the pressure surface.
Boundary layer massflow removal is unable to completely eliminate the effects of flow
separation because of the finite thickness of the stator. With a complete removal of the boundary
layer massflow at the suction array an adverse pressure gradient would again form at a point
further downstream, but generate a wake of smaller width. Massflow addition through the
blowing array has the effect of decreasing wake depth, or increasing the minimum total pressure
of the wake.
Losses show a similar trend as wake depth, as the area averaged total pressure loss
coefficients decrease with increasing flow control motive massflow. Figure 3.3 shows the loss
Pitch vs. Total Pressure Ratio, i=+3deg, M=0.79, X/C=10%
0.75
0.80
0.85
0.90
0.95
1.00
-30 -20 -10 0 10 20 30
Pitch (%)
PT
2/P
T1
Baseline 1.5%
Shift in Wake Boundary
Shift in Wake Center
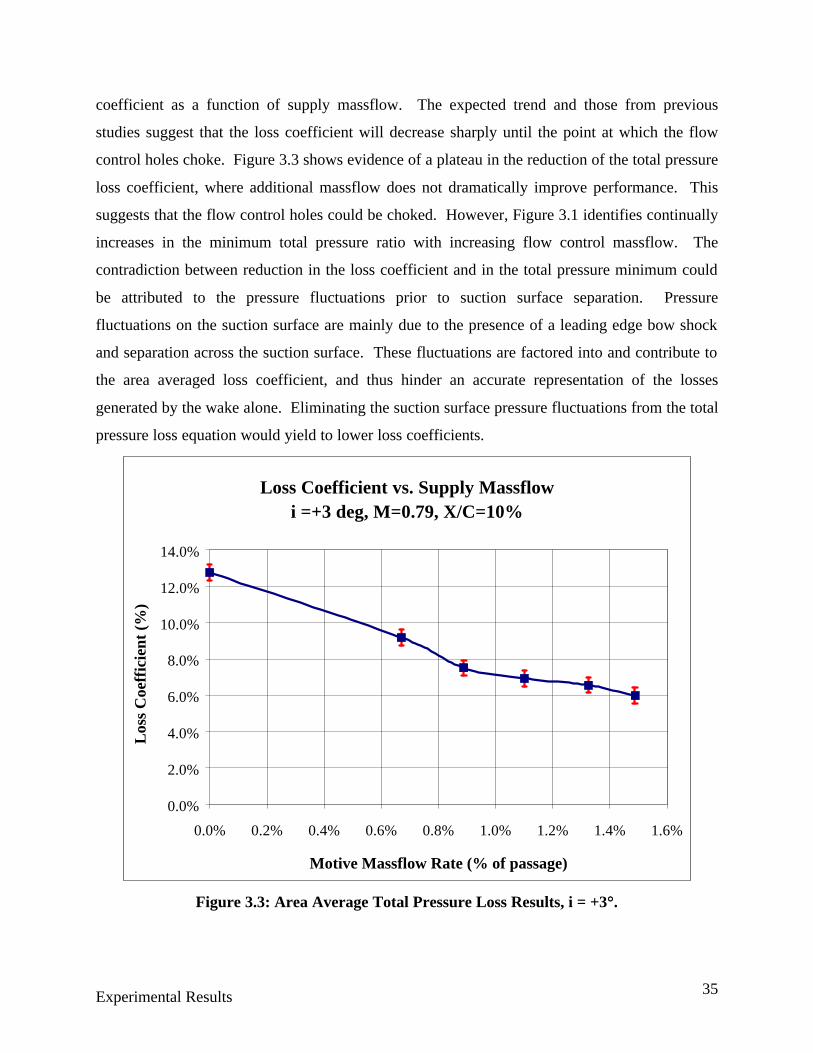
Experimental Results 35
coefficient as a function of supply massflow. The expected trend and those from previous
studies suggest that the loss coefficient will decrease sharply until the point at which the flow
control holes choke. Figure 3.3 shows evidence of a plateau in the reduction of the total pressure
loss coefficient, where additional massflow does not dramatically improve performance. This
suggests that the flow control holes could be choked. However, Figure 3.1 identifies continually
increases in the minimum total pressure ratio with increasing flow control massflow. The
contradiction between reduction in the loss coefficient and in the total pressure minimum could
be attributed to the pressure fluctuations prior to suction surface separation. Pressure
fluctuations on the suction surface are mainly due to the presence of a leading edge bow shock
and separation across the suction surface. These fluctuations are factored into and contribute to
the area averaged loss coefficient, and thus hinder an accurate representation of the losses
generated by the wake alone. Eliminating the suction surface pressure fluctuations from the total
pressure loss equation would yield to lower loss coefficients.
Figure 3.3: Area Average Total Pressure Loss Results, i = +3°°.
Loss Coefficient vs. Supply Massflowi =+3 deg, M=0.79, X/C=10%
0.0%
2.0%
4.0%
6.0%
8.0%
10.0%
12.0%
14.0%
0.0% 0.2% 0.4% 0.6% 0.8% 1.0% 1.2% 1.4% 1.6%
Motive Massflow Rate (% of passage)
Los
s C
oeff
icie
nt (
%)
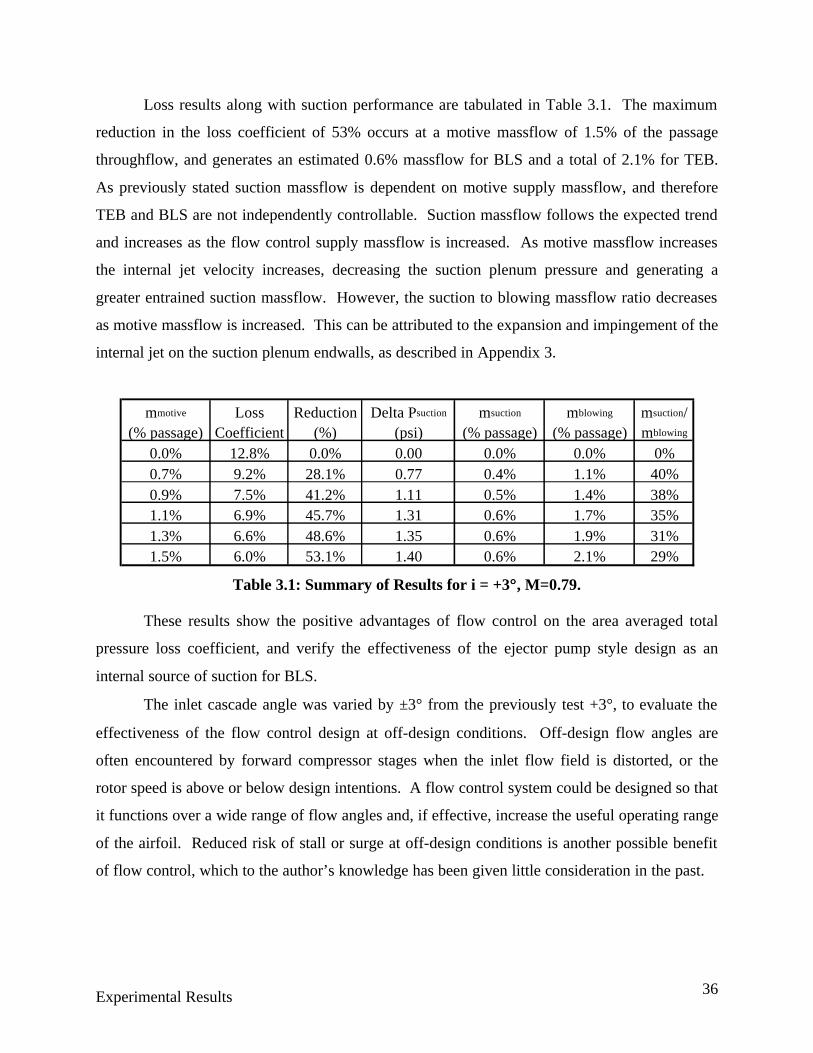
Experimental Results 36
Loss results along with suction performance are tabulated in Table 3.1. The maximum
reduction in the loss coefficient of 53% occurs at a motive massflow of 1.5% of the passage
throughflow, and generates an estimated 0.6% massflow for BLS and a total of 2.1% for TEB.
As previously stated suction massflow is dependent on motive supply massflow, and therefore
TEB and BLS are not independently controllable. Suction massflow follows the expected trend
and increases as the flow control supply massflow is increased. As motive massflow increases
the internal jet velocity increases, decreasing the suction plenum pressure and generating a
greater entrained suction massflow. However, the suction to blowing massflow ratio decreases
as motive massflow is increased. This can be attributed to the expansion and impingement of the
internal jet on the suction plenum endwalls, as described in Appendix 3.
Table 3.1: Summary of Results for i = +3°°, M=0.79.
These results show the positive advantages of flow control on the area averaged total
pressure loss coefficient, and verify the effectiveness of the ejector pump style design as an
internal source of suction for BLS.
The inlet cascade angle was varied by ±3° from the previously test +3°, to evaluate the
effectiveness of the flow control design at off-design conditions. Off-design flow angles are
often encountered by forward compressor stages when the inlet flow field is distorted, or the
rotor speed is above or below design intentions. A flow control system could be designed so that
it functions over a wide range of flow angles and, if effective, increase the useful operating range
of the airfoil. Reduced risk of stall or surge at off-design conditions is another possible benefit
of flow control, which to the author’s knowledge has been given little consideration in the past.
mmotive
(% passage)Loss
CoefficientReduction
(%)Delta Psuction
(psi)msuction
(% passage)mblowing
(% passage)msuction/mblowing
0.0% 12.8% 0.0% 0.00 0.0% 0.0% 0%0.7% 9.2% 28.1% 0.77 0.4% 1.1% 40%0.9% 7.5% 41.2% 1.11 0.5% 1.4% 38%1.1% 6.9% 45.7% 1.31 0.6% 1.7% 35%1.3% 6.6% 48.6% 1.35 0.6% 1.9% 31%1.5% 6.0% 53.1% 1.40 0.6% 2.1% 29%
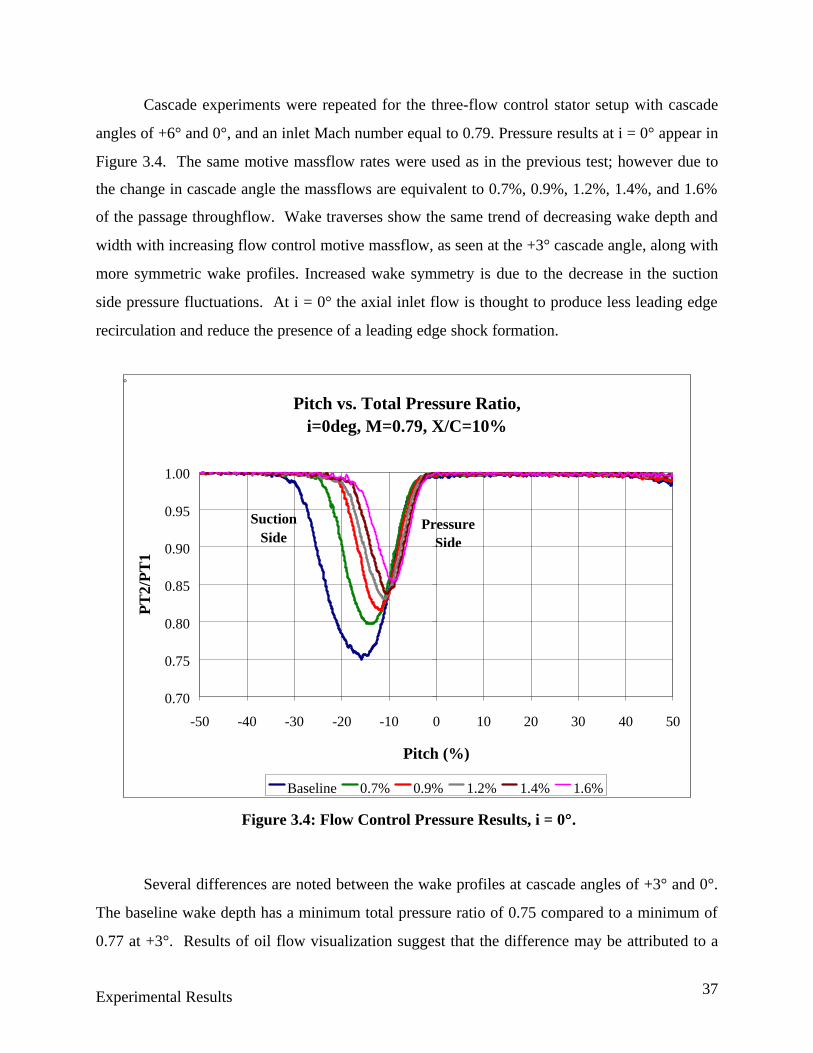
Experimental Results 37
Cascade experiments were repeated for the three-flow control stator setup with cascade
angles of +6° and 0°, and an inlet Mach number equal to 0.79. Pressure results at i = 0° appear in
Figure 3.4. The same motive massflow rates were used as in the previous test; however due to
the change in cascade angle the massflows are equivalent to 0.7%, 0.9%, 1.2%, 1.4%, and 1.6%
of the passage throughflow. Wake traverses show the same trend of decreasing wake depth and
width with increasing flow control motive massflow, as seen at the +3° cascade angle, along with
more symmetric wake profiles. Increased wake symmetry is due to the decrease in the suction
side pressure fluctuations. At i = 0° the axial inlet flow is thought to produce less leading edge
recirculation and reduce the presence of a leading edge shock formation.
Figure 3.4: Flow Control Pressure Results, i = 0°°.
Several differences are noted between the wake profiles at cascade angles of +3° and 0°.
The baseline wake depth has a minimum total pressure ratio of 0.75 compared to a minimum of
0.77 at +3°. Results of oil flow visualization suggest that the difference may be attributed to a
Pitch vs. Total Pressure Ratio, i=0deg, M=0.79, X/C=10%
0.70
0.75
0.80
0.85
0.90
0.95
1.00
-50 -40 -30 -20 -10 0 10 20 30 40 50
Pitch (%)
PT
2/P
T1
Baseline 0.7% 0.9% 1.2% 1.4% 1.6%
Suction Side
Pressure Side
°
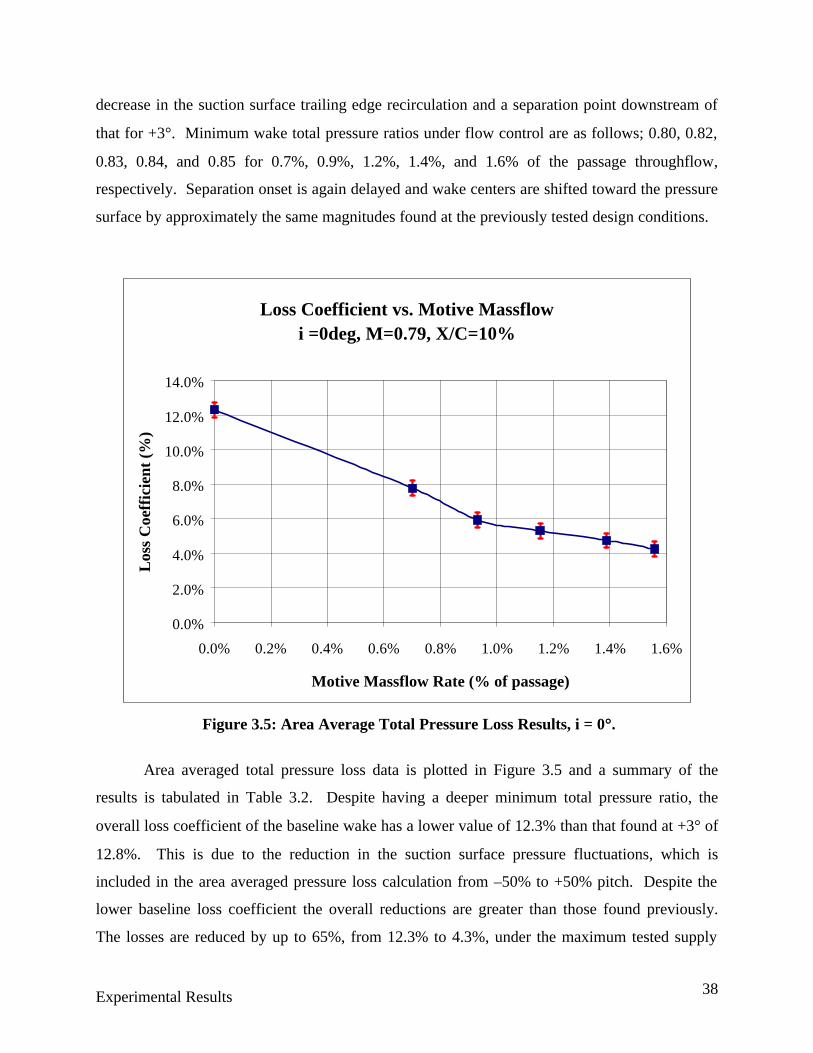
Experimental Results 38
decrease in the suction surface trailing edge recirculation and a separation point downstream of
that for +3°. Minimum wake total pressure ratios under flow control are as follows; 0.80, 0.82,
0.83, 0.84, and 0.85 for 0.7%, 0.9%, 1.2%, 1.4%, and 1.6% of the passage throughflow,
respectively. Separation onset is again delayed and wake centers are shifted toward the pressure
surface by approximately the same magnitudes found at the previously tested design conditions.
Figure 3.5: Area Average Total Pressure Loss Results, i = 0°°.
Area averaged total pressure loss data is plotted in Figure 3.5 and a summary of the
results is tabulated in Table 3.2. Despite having a deeper minimum total pressure ratio, the
overall loss coefficient of the baseline wake has a lower value of 12.3% than that found at +3° of
12.8%. This is due to the reduction in the suction surface pressure fluctuations, which is
included in the area averaged pressure loss calculation from –50% to +50% pitch. Despite the
lower baseline loss coefficient the overall reductions are greater than those found previously.
The losses are reduced by up to 65%, from 12.3% to 4.3%, under the maximum tested supply
Loss Coefficient vs. Motive Massflowi =0deg, M=0.79, X/C=10%
0.0%
2.0%
4.0%
6.0%
8.0%
10.0%
12.0%
14.0%
0.0% 0.2% 0.4% 0.6% 0.8% 1.0% 1.2% 1.4% 1.6%
Motive Massflow Rate (% of passage)
Los
s C
oeff
icie
nt (
%)
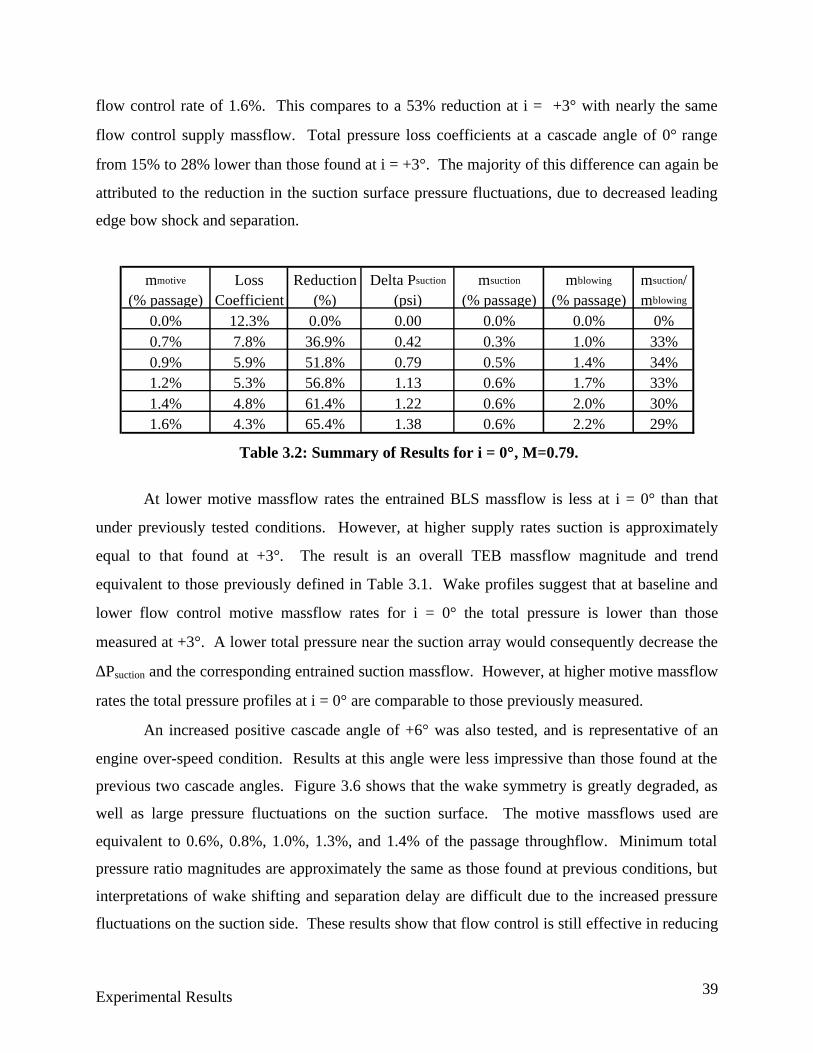
Experimental Results 39
flow control rate of 1.6%. This compares to a 53% reduction at i = +3° with nearly the same
flow control supply massflow. Total pressure loss coefficients at a cascade angle of 0° range
from 15% to 28% lower than those found at i = +3°. The majority of this difference can again be
attributed to the reduction in the suction surface pressure fluctuations, due to decreased leading
edge bow shock and separation.
Table 3.2: Summary of Results for i = 0°°, M=0.79.
At lower motive massflow rates the entrained BLS massflow is less at i = 0° than that
under previously tested conditions. However, at higher supply rates suction is approximately
equal to that found at +3°. The result is an overall TEB massflow magnitude and trend
equivalent to those previously defined in Table 3.1. Wake profiles suggest that at baseline and
lower flow control motive massflow rates for i = 0° the total pressure is lower than those
measured at +3°. A lower total pressure near the suction array would consequently decrease the
∆Psuction and the corresponding entrained suction massflow. However, at higher motive massflow
rates the total pressure profiles at i = 0° are comparable to those previously measured.
An increased positive cascade angle of +6° was also tested, and is representative of an
engine over-speed condition. Results at this angle were less impressive than those found at the
previous two cascade angles. Figure 3.6 shows that the wake symmetry is greatly degraded, as
well as large pressure fluctuations on the suction surface. The motive massflows used are
equivalent to 0.6%, 0.8%, 1.0%, 1.3%, and 1.4% of the passage throughflow. Minimum total
pressure ratio magnitudes are approximately the same as those found at previous conditions, but
interpretations of wake shifting and separation delay are difficult due to the increased pressure
fluctuations on the suction side. These results show that flow control is still effective in reducing
mmotive
(% passage)Loss
CoefficientReduction
(%)Delta Psuction
(psi)msuction
(% passage)mblowing
(% passage)msuction/mblowing
0.0% 12.3% 0.0% 0.00 0.0% 0.0% 0%0.7% 7.8% 36.9% 0.42 0.3% 1.0% 33%0.9% 5.9% 51.8% 0.79 0.5% 1.4% 34%1.2% 5.3% 56.8% 1.13 0.6% 1.7% 33%1.4% 4.8% 61.4% 1.22 0.6% 2.0% 30%1.6% 4.3% 65.4% 1.38 0.6% 2.2% 29%
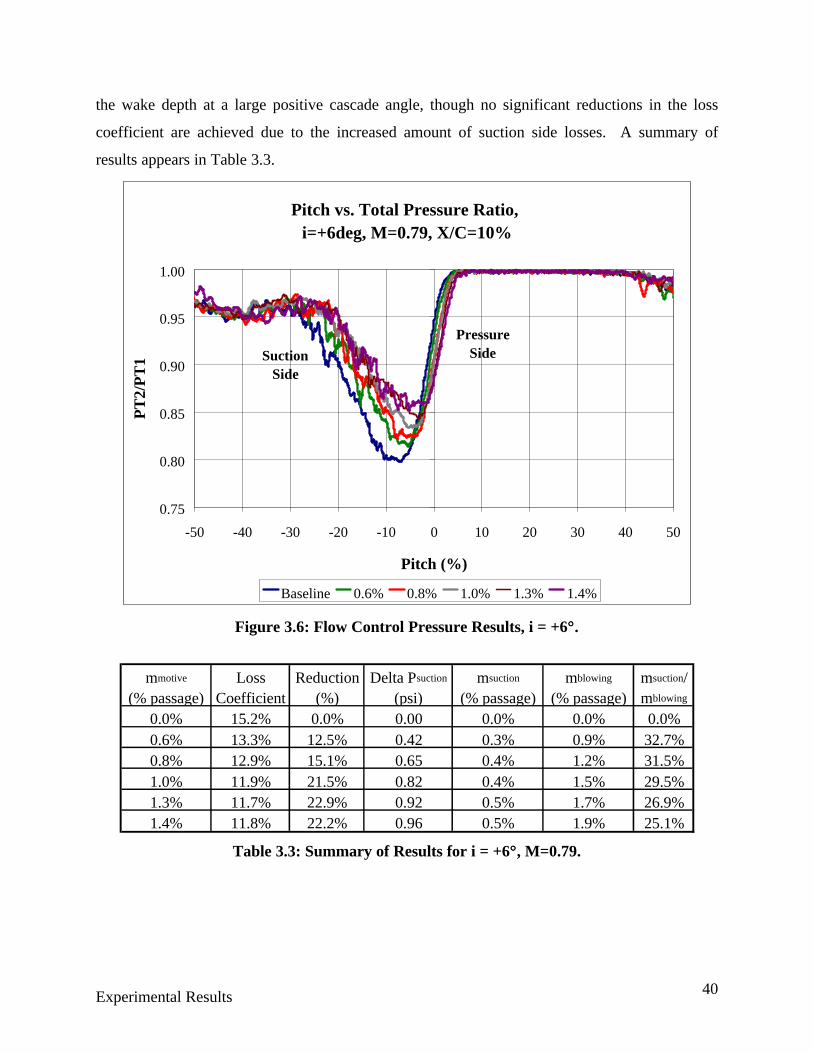
Experimental Results 40
the wake depth at a large positive cascade angle, though no significant reductions in the loss
coefficient are achieved due to the increased amount of suction side losses. A summary of
results appears in Table 3.3.
Figure 3.6: Flow Control Pressure Results, i = +6°°.
Table 3.3: Summary of Results for i = +6°°, M=0.79.
Pitch vs. Total Pressure Ratio, i=+6deg, M=0.79, X/C=10%
0.75
0.80
0.85
0.90
0.95
1.00
-50 -40 -30 -20 -10 0 10 20 30 40 50
Pitch (%)
PT
2/P
T1
Baseline 0.6% 0.8% 1.0% 1.3% 1.4%
Suction Side
Pressure Side
mmotive
(% passage)Loss
CoefficientReduction
(%)Delta Psuction
(psi)msuction
(% passage)mblowing
(% passage)msuction/mblowing
0.0% 15.2% 0.0% 0.00 0.0% 0.0% 0.0%0.6% 13.3% 12.5% 0.42 0.3% 0.9% 32.7%0.8% 12.9% 15.1% 0.65 0.4% 1.2% 31.5%1.0% 11.9% 21.5% 0.82 0.4% 1.5% 29.5%1.3% 11.7% 22.9% 0.92 0.5% 1.7% 26.9%1.4% 11.8% 22.2% 0.96 0.5% 1.9% 25.1%

Experimental Results 41
The baseline total pressure loss coefficient increases by 19% compared to the 12.8% at i
= +3° to 15.2% at i = +6°. Flow control reduces losses by a maximum of 22.9% at a motive
massflow of 1.3%, generating a loss coefficient of 11.7%. The asymmetry of the wakes between
the suction and pressure surfaces and pressure fluctuations generated by the suction surface
separation accounts for a majority of the decrease in flow control effectiveness. Suction
massflows at this cascade angle are considerably less then those generated at the previous two
inlet conditions. The suction holes are angled forward by approximately 40° from the local blade
surface, allowing part of the massflow entrainment to be generated by natural fluid circulation, or
scoop effect, through the holes. The early flow separation at the positive cascade angle occurs
upstream of the suction array. An early separation point would act by greatly reducing the flow
velocity at the suction array location, thus decreasing the suction massflow entrained through
fluid circulation. Separation generates a low-pressure region as well and contributes to the
decrease in effectiveness of the imbedded ejector pump design. A lower baseline suction plenum
leads to a lower ∆Psuction as the pressure along the stator surface near the suction array is lowered.
The suction massflow estimation is based on the ∆Psuction, consequently any decrease in ∆Psuction
is negatively related to the entrained massflow.
Early flow separation also generates an increased deviation angle, where the angle
between the flow direction and the blade surface differ greatly. The TEB array is located at an
axial location and angled so as to inject mass into the wake at approximately the flow deviation
angle for lower cascade angles. Thus, at lower cascade angles conditions massflow is added
very near the wake center, producing symmetric wake profiles. When the deviation angle is
greater than expected TEB massflow additions are shifted towards the pressure side of the wake.
Therefore, under these circumstances mass addition has little effect as a method of flow control
for total pressure loss reduction.
3.2: Total Pressure Loss Reduction for a Range of Cascade Angles.
As described in the previous section the effectiveness of the flow control design on the
area averaged total pressure loss coefficient is sensitive to the inlet cascade angle. A closer
investigation of the useful range of the flow control design was required. The inlet Mach
number was held at 0.79 while the cascade angle was varied from -2° to +6°. At each cascade
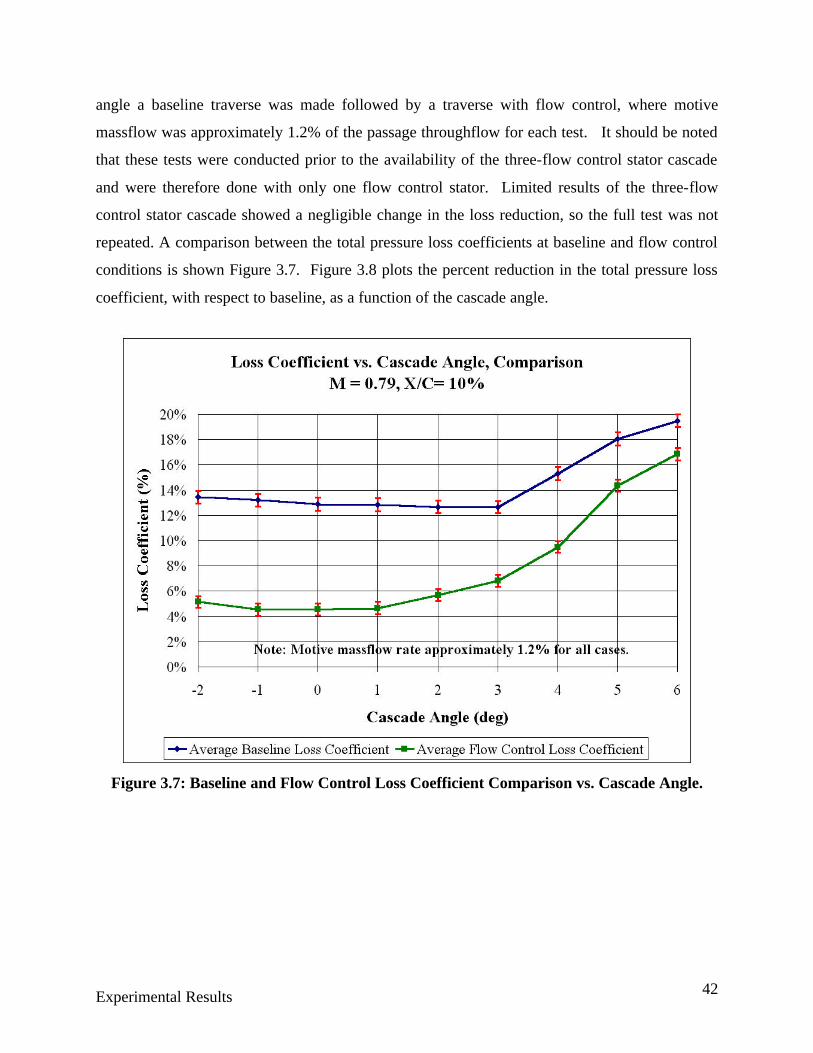
Experimental Results 42
angle a baseline traverse was made followed by a traverse with flow control, where motive
massflow was approximately 1.2% of the passage throughflow for each test. It should be noted
that these tests were conducted prior to the availability of the three-flow control stator cascade
and were therefore done with only one flow control stator. Limited results of the three-flow
control stator cascade showed a negligible change in the loss reduction, so the full test was not
repeated. A comparison between the total pressure loss coefficients at baseline and flow control
conditions is shown Figure 3.7. Figure 3.8 plots the percent reduction in the total pressure loss
coefficient, with respect to baseline, as a function of the cascade angle.
Figure 3.7: Baseline and Flow Control Loss Coefficient Comparison vs. Cascade Angle.
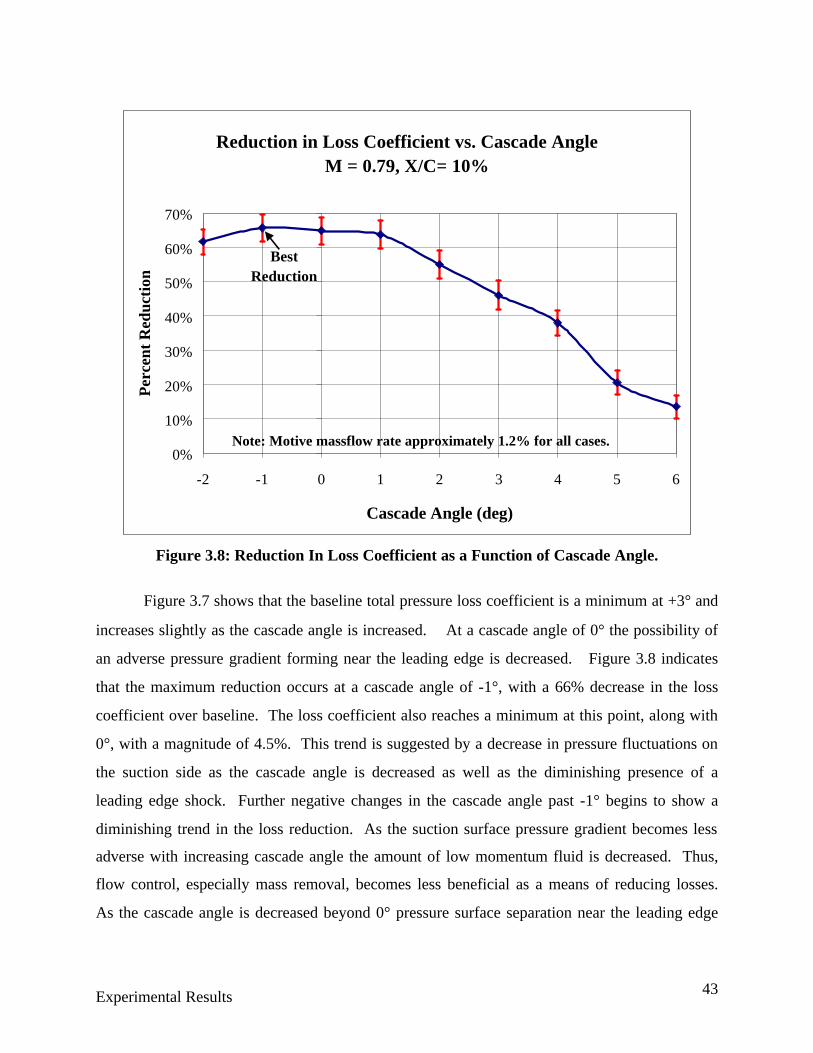
Experimental Results 43
Figure 3.8: Reduction In Loss Coefficient as a Function of Cascade Angle.
Figure 3.7 shows that the baseline total pressure loss coefficient is a minimum at +3° and
increases slightly as the cascade angle is increased. At a cascade angle of 0° the possibility of
an adverse pressure gradient forming near the leading edge is decreased. Figure 3.8 indicates
that the maximum reduction occurs at a cascade angle of -1°, with a 66% decrease in the loss
coefficient over baseline. The loss coefficient also reaches a minimum at this point, along with
0°, with a magnitude of 4.5%. This trend is suggested by a decrease in pressure fluctuations on
the suction side as the cascade angle is decreased as well as the diminishing presence of a
leading edge shock. Further negative changes in the cascade angle past -1° begins to show a
diminishing trend in the loss reduction. As the suction surface pressure gradient becomes less
adverse with increasing cascade angle the amount of low momentum fluid is decreased. Thus,
flow control, especially mass removal, becomes less beneficial as a means of reducing losses.
As the cascade angle is decreased beyond 0° pressure surface separation near the leading edge
Reduction in Loss Coefficient vs. Cascade AngleM = 0.79, X/C= 10%
0%
10%
20%
30%
40%
50%
60%
70%
-2 -1 0 1 2 3 4 5 6
Cascade Angle (deg)
Per
cent
Red
ucti
on
Best Reduction
Note: Motive massflow rate approximately 1.2% for all cases.
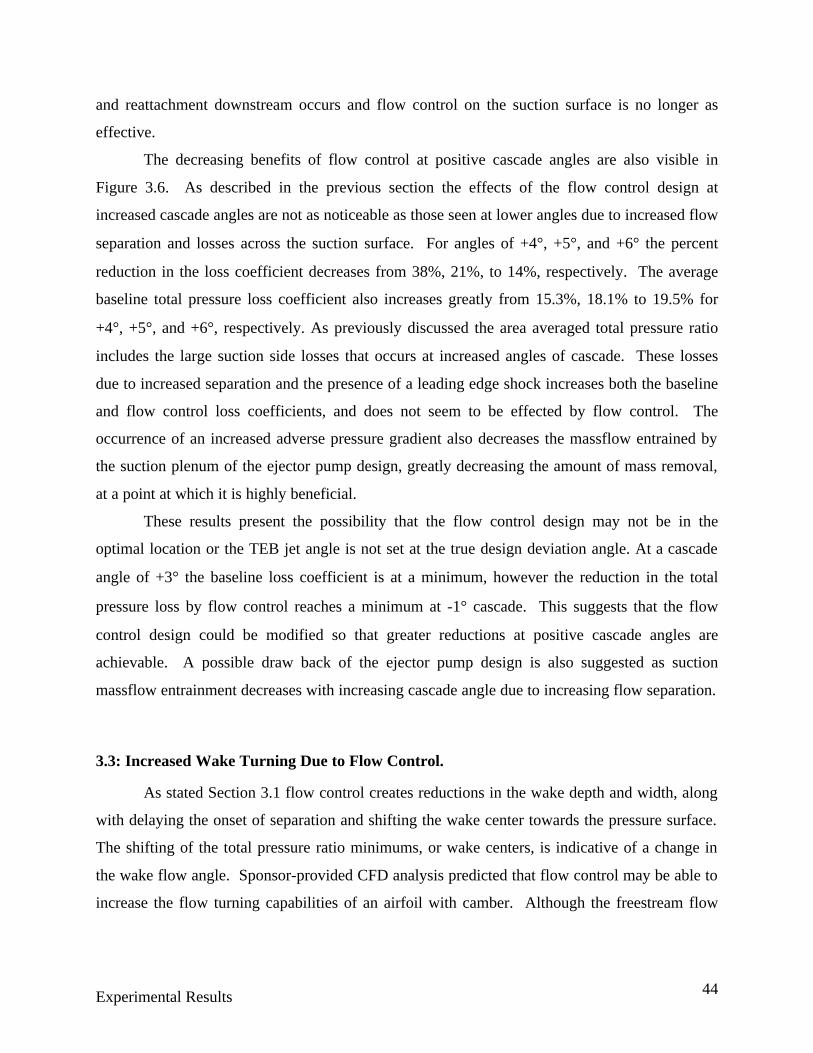
Experimental Results 44
and reattachment downstream occurs and flow control on the suction surface is no longer as
effective.
The decreasing benefits of flow control at positive cascade angles are also visible in
Figure 3.6. As described in the previous section the effects of the flow control design at
increased cascade angles are not as noticeable as those seen at lower angles due to increased flow
separation and losses across the suction surface. For angles of +4°, +5°, and +6° the percent
reduction in the loss coefficient decreases from 38%, 21%, to 14%, respectively. The average
baseline total pressure loss coefficient also increases greatly from 15.3%, 18.1% to 19.5% for
+4°, +5°, and +6°, respectively. As previously discussed the area averaged total pressure ratio
includes the large suction side losses that occurs at increased angles of cascade. These losses
due to increased separation and the presence of a leading edge shock increases both the baseline
and flow control loss coefficients, and does not seem to be effected by flow control. The
occurrence of an increased adverse pressure gradient also decreases the massflow entrained by
the suction plenum of the ejector pump design, greatly decreasing the amount of mass removal,
at a point at which it is highly beneficial.
These results present the possibility that the flow control design may not be in the
optimal location or the TEB jet angle is not set at the true design deviation angle. At a cascade
angle of +3° the baseline loss coefficient is at a minimum, however the reduction in the total
pressure loss by flow control reaches a minimum at -1° cascade. This suggests that the flow
control design could be modified so that greater reductions at positive cascade angles are
achievable. A possible draw back of the ejector pump design is also suggested as suction
massflow entrainment decreases with increasing cascade angle due to increasing flow separation.
3.3: Increased Wake Turning Due to Flow Control.
As stated Section 3.1 flow control creates reductions in the wake depth and width, along
with delaying the onset of separation and shifting the wake center towards the pressure surface.
The shifting of the total pressure ratio minimums, or wake centers, is indicative of a change in
the wake flow angle. Sponsor-provided CFD analysis predicted that flow control may be able to
increase the flow turning capabilities of an airfoil with camber. Although the freestream flow
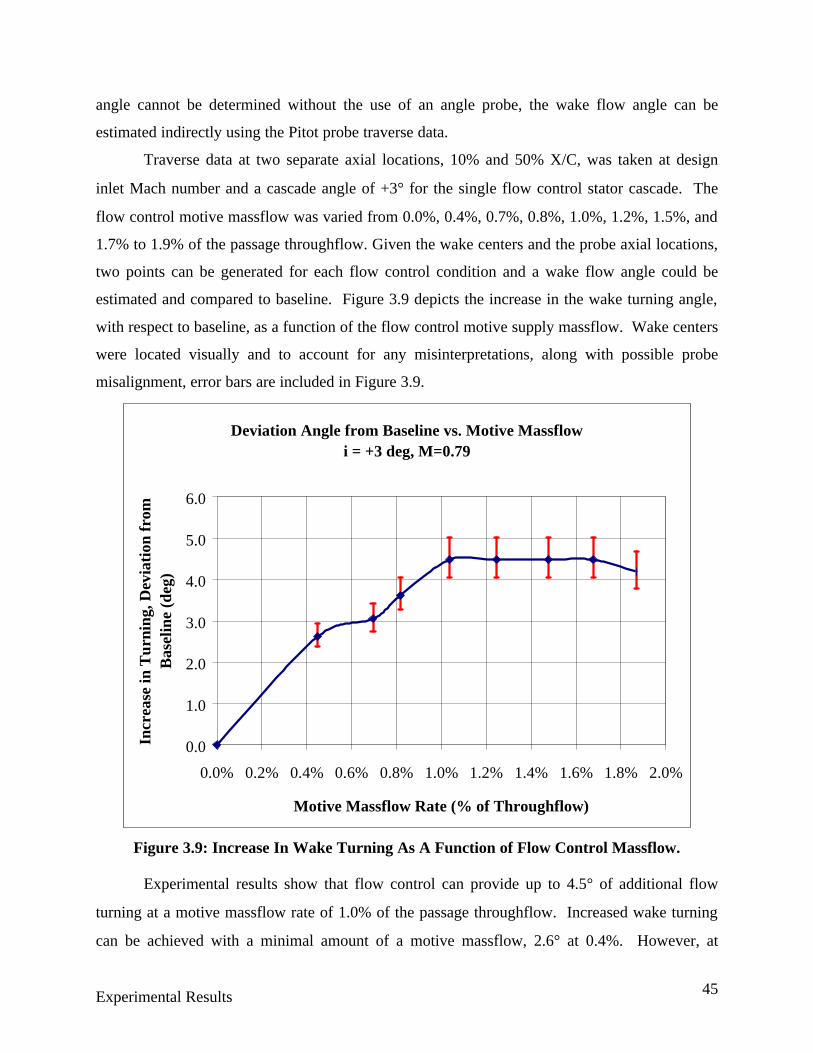
Experimental Results 45
angle cannot be determined without the use of an angle probe, the wake flow angle can be
estimated indirectly using the Pitot probe traverse data.
Traverse data at two separate axial locations, 10% and 50% X/C, was taken at design
inlet Mach number and a cascade angle of +3° for the single flow control stator cascade. The
flow control motive massflow was varied from 0.0%, 0.4%, 0.7%, 0.8%, 1.0%, 1.2%, 1.5%, and
1.7% to 1.9% of the passage throughflow. Given the wake centers and the probe axial locations,
two points can be generated for each flow control condition and a wake flow angle could be
estimated and compared to baseline. Figure 3.9 depicts the increase in the wake turning angle,
with respect to baseline, as a function of the flow control motive supply massflow. Wake centers
were located visually and to account for any misinterpretations, along with possible probe
misalignment, error bars are included in Figure 3.9.
Figure 3.9: Increase In Wake Turning As A Function of Flow Control Massflow.
Experimental results show that flow control can provide up to 4.5° of additional flow
turning at a motive massflow rate of 1.0% of the passage throughflow. Increased wake turning
can be achieved with a minimal amount of a motive massflow, 2.6° at 0.4%. However, at
Deviation Angle from Baseline vs. Motive Massflowi = +3 deg, M=0.79
0.0
1.0
2.0
3.0
4.0
5.0
6.0
0.0% 0.2% 0.4% 0.6% 0.8% 1.0% 1.2% 1.4% 1.6% 1.8% 2.0%
Motive Massflow Rate (% of Throughflow)
Incr
ease
in T
urni
ng, D
evia
tion
fro
m
Bas
elin
e (d
eg)
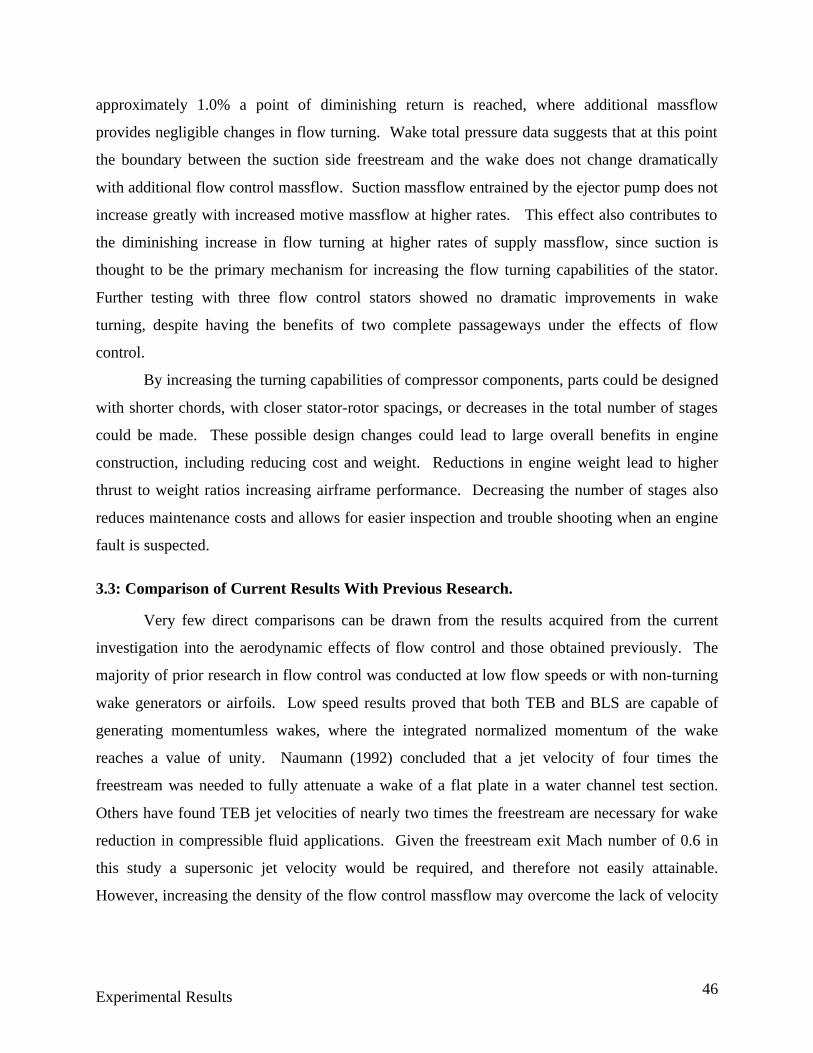
Experimental Results 46
approximately 1.0% a point of diminishing return is reached, where additional massflow
provides negligible changes in flow turning. Wake total pressure data suggests that at this point
the boundary between the suction side freestream and the wake does not change dramatically
with additional flow control massflow. Suction massflow entrained by the ejector pump does not
increase greatly with increased motive massflow at higher rates. This effect also contributes to
the diminishing increase in flow turning at higher rates of supply massflow, since suction is
thought to be the primary mechanism for increasing the flow turning capabilities of the stator.
Further testing with three flow control stators showed no dramatic improvements in wake
turning, despite having the benefits of two complete passageways under the effects of flow
control.
By increasing the turning capabilities of compressor components, parts could be designed
with shorter chords, with closer stator-rotor spacings, or decreases in the total number of stages
could be made. These possible design changes could lead to large overall benefits in engine
construction, including reducing cost and weight. Reductions in engine weight lead to higher
thrust to weight ratios increasing airframe performance. Decreasing the number of stages also
reduces maintenance costs and allows for easier inspection and trouble shooting when an engine
fault is suspected.
3.3: Comparison of Current Results With Previous Research.
Very few direct comparisons can be drawn from the results acquired from the current
investigation into the aerodynamic effects of flow control and those obtained previously. The
majority of prior research in flow control was conducted at low flow speeds or with non-turning
wake generators or airfoils. Low speed results proved that both TEB and BLS are capable of
generating momentumless wakes, where the integrated normalized momentum of the wake
reaches a value of unity. Naumann (1992) concluded that a jet velocity of four times the
freestream was needed to fully attenuate a wake of a flat plate in a water channel test section.
Others have found TEB jet velocities of nearly two times the freestream are necessary for wake
reduction in compressible fluid applications. Given the freestream exit Mach number of 0.6 in
this study a supersonic jet velocity would be required, and therefore not easily attainable.
However, increasing the density of the flow control massflow may overcome the lack of velocity

Experimental Results 47
and increase jet momentum to match that of the freestream. In addition, previous research has
not identified additional flow turning as a benefit of flow control, to the author’s knowledge.
Recent studies by Vandeputte (2000) and Kozak (2000) are applicable to the current
investigation. Kozak tested a non-turning airfoil-shaped stator with TEB on an Allied Signal
F109 engine at subsonic and transonic fan speeds. Vandeputte used the same transonic cascade
wind tunnel as this experiment to investigate the aerodynamic effects of flow control on a
tandem inlet guide vane. Both TEB and BLS were used by Vandeputte at very nearly the same
exit Mach number.
At subsonic inlet Mach numbers Kozak was able to produce wakes with a spanwise total
pressure ratio profile equal to unity, corresponding to a loss coefficient equal to zero, by TEB.
Several engine speeds were tested and in each case the wake was fully attenuated using a
minimal amount of massflow for TEB. Figure 3.10 depicts the baseline and flow control total
pressure ratio wakes at engine speeds of 7k, 9k, 12k and 14k rpm. Measurements were taken at
an axial location of 0.5 vane chords downstream of the trailing edge. Note that the wake depth in
the experiments of Kozak is much less than that achieved in the current investigation.
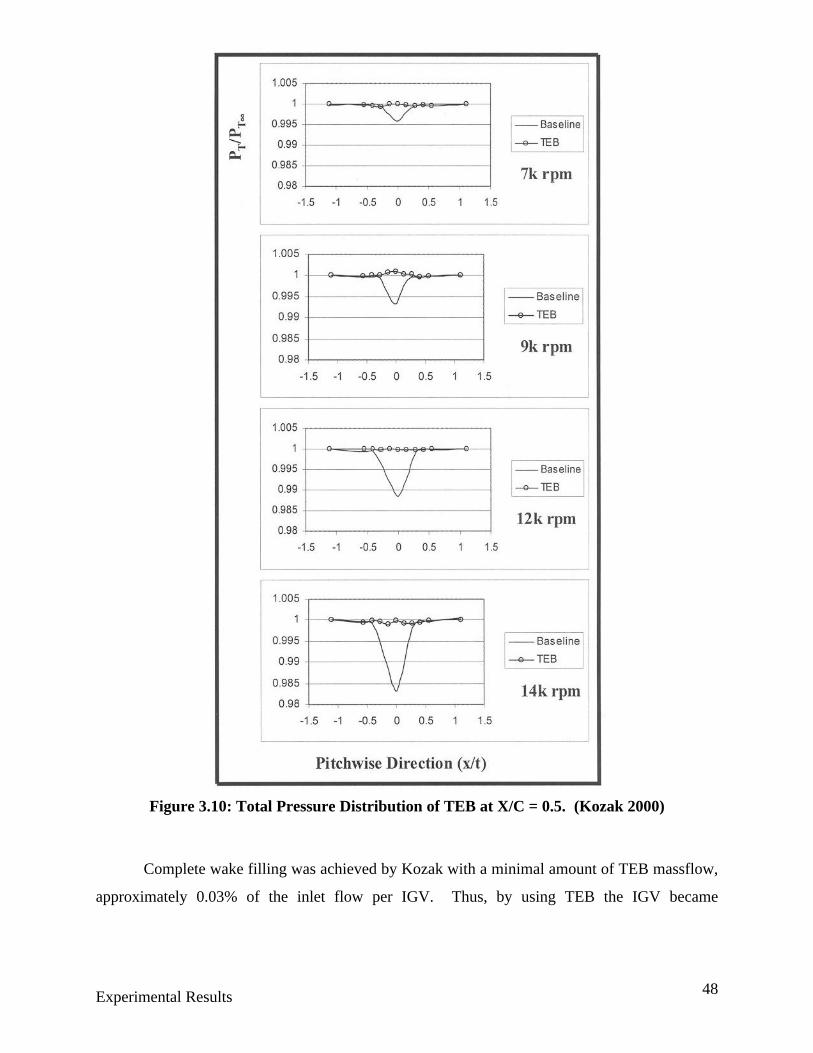
Experimental Results 48
Figure 3.10: Total Pressure Distribution of TEB at X/C = 0.5. (Kozak 2000)
Complete wake filling was achieved by Kozak with a minimal amount of TEB massflow,
approximately 0.03% of the inlet flow per IGV. Thus, by using TEB the IGV became
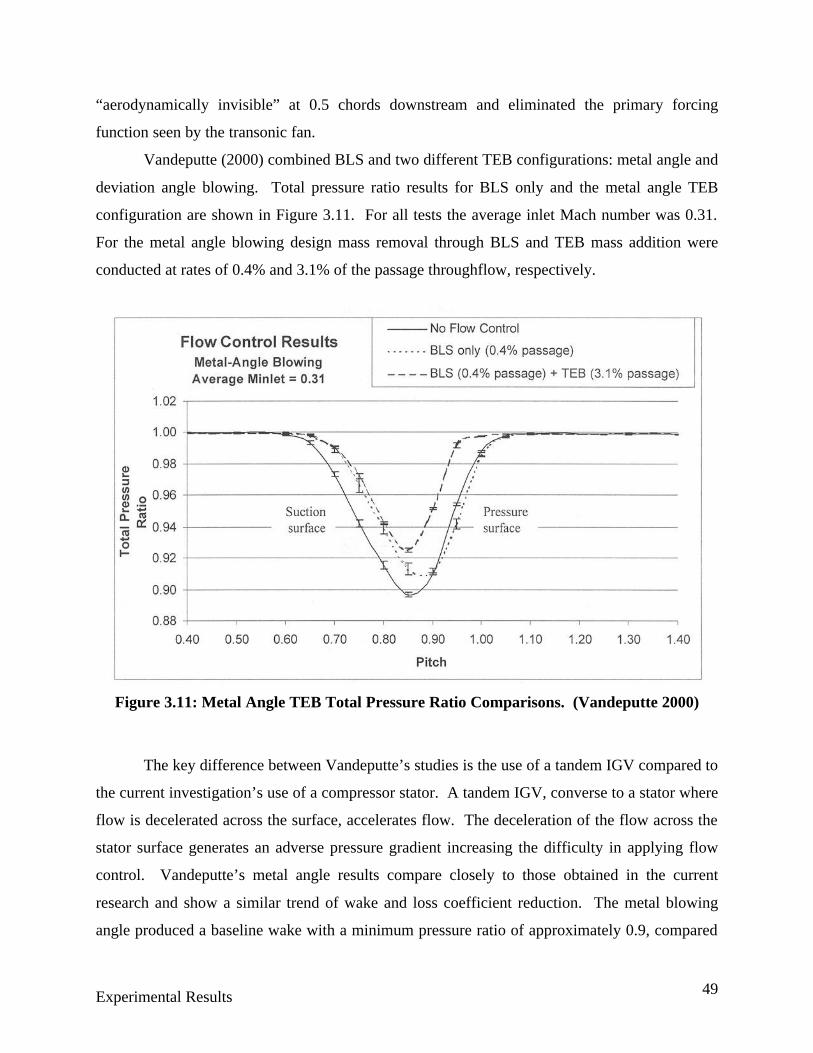
Experimental Results 49
“aerodynamically invisible” at 0.5 chords downstream and eliminated the primary forcing
function seen by the transonic fan.
Vandeputte (2000) combined BLS and two different TEB configurations: metal angle and
deviation angle blowing. Total pressure ratio results for BLS only and the metal angle TEB
configuration are shown in Figure 3.11. For all tests the average inlet Mach number was 0.31.
For the metal angle blowing design mass removal through BLS and TEB mass addition were
conducted at rates of 0.4% and 3.1% of the passage throughflow, respectively.
Figure 3.11: Metal Angle TEB Total Pressure Ratio Comparisons. (Vandeputte 2000)
The key difference between Vandeputte’s studies is the use of a tandem IGV compared to
the current investigation’s use of a compressor stator. A tandem IGV, converse to a stator where
flow is decelerated across the surface, accelerates flow. The deceleration of the flow across the
stator surface generates an adverse pressure gradient increasing the difficulty in applying flow
control. Vandeputte’s metal angle results compare closely to those obtained in the current
research and show a similar trend of wake and loss coefficient reduction. The metal blowing
angle produced a baseline wake with a minimum pressure ratio of approximately 0.9, compared
Experimental Results 50
to the baseline in the current investigation of 0.77 at +3°. The wake width was wider than that of
the current investigation with a total pressure loss coefficient of 23%, nearly twice that of the
stator used in this experiment, at 12.3%. Reduction in the loss coefficient for this investigation
was slightly improved over those achieved by Vandeputte. However, Vandeputte used the
turbine expression for the area averaged total pressure loss coefficient and the compressor
formulation (Equation 2.3) used in this research. At a BLS rate of 0.4% and TEB of 3.1% in
Vandeputte’s experiment the loss coefficient was reduced by 48%, compared to a 53% reduction
with 0.6% BLS and 2.1% TEB in current investigation.
Also noted was that mass flow removal was limited by the capabilities of the suction
system and improved wake reduction may have been possible with increased BLS. Vandeputte’s
results closely compared with those published by Sell (1997) and Bons et al (1999). These low
flow speed investigations also showed similar trends as Vandeputte’s investigation, with large
reductions in the momentum thickness and wake size using TEB and BLS (Sell) or vortex
generator jet (VGJ) (Bons) blowing arrays.
Despite the significantly larger wake depth, high-speed exit plane flow conditions, and
high-turning design of the stator investigated in the present study, resulting trends were
comparable to those achieved in previous studies. Increased reductions in the loss coefficient
from those stated by Vandeputte were obtained, at nearly the same exit conditions. However,
other direct comparisons could not be made, due to the lack of previous research into the
aerodynamic performance of compressor stators with flow control at transonic flow conditions.
Also noted is the increase in flow turning due to flow control, which to the author’s knowledge
has not been reported in previous studies. This increase in flow turning capabilities is thought to
be a benefit of boundary layer suction and it is effect on axially shifting the location of the wake
onset along the stator surface. Further investigations with the current stator geometry and a
modified flow control design, along with wind tunnel modifications, such as the use of a
tailboard and/or upstream turbulence grid, may lead to further confirmation of the effectiveness
of flow control at these flow conditions and with modern compressor design.
Conclusions and Recommendations 51
Chapter 4: Conclusions and Recommendations:
The aerodynamic performance of a high-turning compressor stator with flow control was
investigated. A unique flow control design was implemented based on the concept of an ejector
pump. This flow control design was capable of producing a suction source for boundary layer
suction (BLS) and a pressure source for trailing edge blowing (TEB) from a single pressure
supply. This concept allows suction massflow to be combined with the motive supply massflow
and ejected through TEB without the use of external suction pumps or devices, which require
additional work input. In previous BLS research, massflow was removed from the boundary
layer and dumped into the atmosphere, where in a realistic application this massflow would be
lost and decrease the efficiency of the compressor or turbine. The imbedded ejector pump flow
control design in this research is greatly simplified compared to the flow control designs of prior
studies when BLS and TEB were combined. Without the need for excessive equipment to
generate suction and the combining of the entrained suction massflow to supply massflow for
blowing, decreases in the overall costs of implementing a flow control system, both in
manufacturing and efficiency, could be made.
Flow velocities for this experiment were higher than those previously reported. An inlet
Mach number of 0.79 was considered the design speed for the tested stator geometry and
generated an average exit Mach number of 0.6. The primary cascade angle of interest for this
flow speed was +3°, and was varied to identify the effective range of the flow control design.
The Reynolds number based on stator chord length is approximately 2 × 10⁶. The seven-stator
cascade was tested in a linear transonic blowdown wind tunnel. Reductions in the area average
total pressure loss coefficient were achieved for a range of motive massflows.
Preliminary studies with a single flow control stator installed in the center of a seven-
stator cascade showed that significant wake reductions were feasible at design conditions. These
results appear in Appendix 2 and Appendix 3. After increasing the TEB hole size, in order to
generate increased suction for BLS, two additional flow control stators were manufactured.
With three flow control stators two complete passageways were under the influence of flow
control. This allowed for better periodicity and thus a more accurate investigation into the
effects of flow control on the center stator of the cascade. With a cascade angle of +3° a baseline
total pressure loss coefficient of 12.8% was measured without flow control. With supply,
Conclusions and Recommendations 52
suction, and blowing massflows of 1.1%, 0.6% and 1.7% of the passage throughflow,
respectively, the loss coefficient was reduced by approximately 46%, to 6.9% overall. At the
same inlet conditions a maximum reduction of 53% was achieved with the highest tested motive
massflow rate of 1.5% of the passage throughflow.
These results were compared to those achieved by Vandeputte (2000) under similar exit
flow conditions and show improvements as a high-speed flow control design. Significantly
higher reductions in the loss coefficient were achieved by using less supply massflow.
Comparisons to other studies at low flow speeds show results that follow similar trends in loss
reduction and wake size, with similar flow control massflows.
A range of cascade angles was tested with the same inlet Mach number for a flow control
motive supply massflow of 1.2% of the throughflow. These results show that a reduction of 66%
was achievable at a cascade angle of -1°, reducing the baseline loss coefficient of 13.2% to 4.5%.
The trend shows that despite slightly increasing baseline wake coefficients, reductions due to
flow control increase with decreasing cascade angles of +3° to -1°. Conversely flow control
proves less effective at increased cascade angles, while baseline loss coefficients increase
significantly along with suction surface separation and pressure fluctuations due to a leading
edge shock.
Also identified for the first time, to the author’s knowledge, is the increase in flow
turning due to flow control. This benefit was first evaluated through sponsor-provided CFD
results, and was later estimated experimentally by measuring the shifting of the wake centers. It
was estimated that, at a cascade angle of +3° with a flow control motive massflow of 1.0% or
greater of the passage throughflow, an increase in the wake turning angle of approximately 4.5°
was achieved. Further investigation with an angle probe is needed to determine whether the
freestream flow turning angle is increased, or simply that of the wake. Increases in the flow
turning capabilities of compressor components could lead to decreased chord lengths or stage
sizes, or decreases in the overall number of stages.
This and other previous research has achieved practical uses of flow control for
turbomachinery applications. An active flow control system using non-intrusive methods was
developed by Feng (2000) for a single-stage turbofan simulator. Reduction of rotor vibration in
a transonic compressor rig was accomplished by Bailie et al (2000). Others have attained
beneficial results with flow control in realistic turbomachinery applications. However, a

Conclusions and Recommendations 53
complete flow control system has not been tested. A complete closed-loop system would use
downstream high-pressure bleed air to supply flow control to an upstream stage or stages.
Results of Bailie et al suggest that flow control may increase flow capacity, stage loading, and
efficiency of the compressor. A complete system study would show the effects of flow control
and bleeding downstream air on the overall system efficiency.
This research was conducted to investigate the usefulness of the ejector pump style
design, so that it could be applied in a transonic compressor rig at the Air Force Research
Laboratory. These tests were conducted without the use of a tailboard. Future tests with the
current cascade and flow control design may provide improved results with the use of a tailboard
and/or upstream turbulence grid. Modifications to the flow control design could also be
introduced to increase the suction performance and loss reductions at positive off-design cascade
angles. An increase in the blowing jet velocity or momentum would be extremely beneficial, but
may be difficult to achieve. The introduction of vortex generator jets (VGJ) or pulsed VGJ could
drastically reduce the required massflow for wake reduction by promoting mixing and decreasing
the need to increase jet velocity. PIV investigations could lead to a better understanding of the
flow field and the performance of the flow control design.

54
References:
Bailie, S.T., Burdisso, R.A. and Ng, W.F., “Wake Filling and Reduction of Rotor HCF Using Stator Trailing Edge Blowing”, AIAA-2000-3101, 38th AIAA/ASME/SAE/ASEE Joint Propulsion Confernece & Exhibit Conference, Huntsville, AL, July 2000.
Bons, J.P., Sondergaard, R., and Rivir, R.B., “Control of Low Pressure Turbine Separation Using
Vortex Generator Jets”, 37th Aerospace Sciences Meeting and Exhibit, AIAA 99-0367, Reno, NV, January 1999.
Bons, J.P., Sondergaard, R., and Rivir, R.B., “Turbine Separation Control Using Pulsed Vortex Generator Jets”, 2000-GT-0262, ASME TurboExpo 2000, Munich, Germany, May, 2000.
Brookfield, J.M., Waitz, I.A.,, “Trailing-Edge Blowing for Reduction of Turbomachinery Fan Noise”, Journal of Propulsion and Power, Vol. 16, No. 1, 2000, pp. 57-64.
Cimbala, J.M. and Park W.J., “An Experimental Investigation of the Turbulent Structure in a Two-Dimensional Momentumless Wake”, Journal of Fluid Mechanics, Vol 213, pp 479-509, 1990
Corcoran, T.E., “Control of the Wake from a Simulated Blade by Trailing Edge Blowing”,
M.S. Thesis, Lehigh University, Bethlehem, PA, 1992.
Cumpsty, N.A., “Vibration and Noise – Compressor Aerodynamics”, Longman Scientific and Technical, 1st Edition, 1989.
Dirlik, S.P., Kimmel, K.R., Sekelsky, A., and Slomski, J.F., “Experimental Evaluation of a 50-Percent Thick Airfoil With Blowing and Suction Boundary Layer Control”, AIAA-92-4500-CP
Dixon, S.L., Fluid Mechanics and Thermodynamics of Turbomachinery, 4th ed., Butterworth-Heinemann, 1995.
Feng, J, “Active Flow Control For Reduction of Unsteady Stator-Rotor Interaction in a Turbofan Simulator.”, Ph.D. Dissertation, Virginia Polytechnic Institute and State University, Blacksburg, VA, 2000.
Karassik, I.J., Krutzsch, W.C., Fraser, W.H., Messina, J.P., Pump Handbook, 2nd ed., McGraw-Hill, 1986.

55
Kozak, J.D. and Ng, W.F., “Investigation of IGV Trailing Edge Blowing in a F109 Turbofan Engine”, AIAA-2000-0224, 38th AIAA Aerospace Sciences Conference, Reno, NV, Jan 2000.
Kozak, J.D., “Investigation of Inlet Guide Vane Wakes in a F109 Turbofan Engine with and
without Flow Control”, Ph.D. Dissertation, Virginia Polytechnic Institute and State University, Blacksburg, VA, 2000.
Lackshminarayana, B., Fluid Dynamics and Heat Transfer of Turbomachinery, John Wiley & Sons, 1996.
Leitch, T.A., Saunders, C.A. and Ng, W.F., “Reduction of Unsteady Stator-Rotor Interaction using Trailing Edge Blowing”, AIAA-99-1952, 5th AIAA/CEAS Aeroacoustics Conference, Seattle, WA, May 1999.
Leitch, T.A., “Reduction of Unsteady Stator-Rotor Interaction by Trailing Edge Blowing”, M.S. Thesis, Virginia Polytechnic Institute and State University, Blacksburg, VA, 1997.
Manwaring, S.R. and Wisler, D.C., “Unsteady Aerodynamic and Gust Response in Compressors and Turbines”, ASME J. of Turbomachinery, Oct. 1993, Vol. 115, pp.724-40.
Munson, B.R., Young, D.F., and Okiishi, T.H., Fundamentals of Fluid Mechanics, 3rd ed., John
Wiley & Sons, 1998.
Naumann, R.G., “Control of the Wake from a Simulated Blade by Trailing Edge Blowing”, M.S. Thesis, Lehigh University, Bethlehem, PA, 1992.
Oosthuizen, P.H., and Carscallen, W.E., Compressible Fluid Flow, McGraw-Hill, 1997.
Park, W.J. and Cimbala, J.M., “The Effect of Jet Injection Geometry on Two-Dimensional Momentumless Wakes”, Journal of Fluid Mechanics, Vol. 224, March 1991, pp. 29-47.
Rao, N.M., “Reduction of Unsteady Stator Rotor Interaction by Trailing Edge Blowing Using MEMS Based Microvalves” MS Thesis, Virginia Polytechnic Institute and State University, Blacksburg, VA, April, 1999.
56
Rao, N.M., Feng, J., Burdisso, R.A. and Ng, W.F., “Active Flow Control to Reduce Fan Blade Vibration and Noise”, AIAA-99-1806, 5th AIAA/CEAS Aeroacoustics Conference, Seattle, WA, May 1999.
Sell, J. “Cascade Testing to Assess the Effectiveness of Mass Addition/Removal Wake Management Strategies for Reduction of Rotor-Stator Interaction Noise”, Masters Thesis, Department of Aeronautics and Astronautics, Massachusetts Institute of Technology, Cambridge, MA, February 1997.
Thomson, D.E. and Griffin, J.T., “The National Turbine Engine High Cycle Fatigue Program”, Memo describing the National HCF Program, 1999.
Vandeputte, T.W., “Effects of Flow Control on the Aerodynamics of a Tandem Inlet Guide
Vane”, MS Thesis, Virginia Polytechnic Institute and State University, Blacksburg, VA, January, 2000.
Waitz, I.A., Brookfield, J.M., Sell, J. and Hayden, B.J., “Preliminary Assessment of Wake Management Strategies for Reduction of Turbomachinery Fan Noise”, Journal of Propulsion and Power, Vol. 12, No. 5, 1996, pp. 958-66.
White, F.M., Fluid Mechanics, 4th ed., McGraw-Hill, 1999.
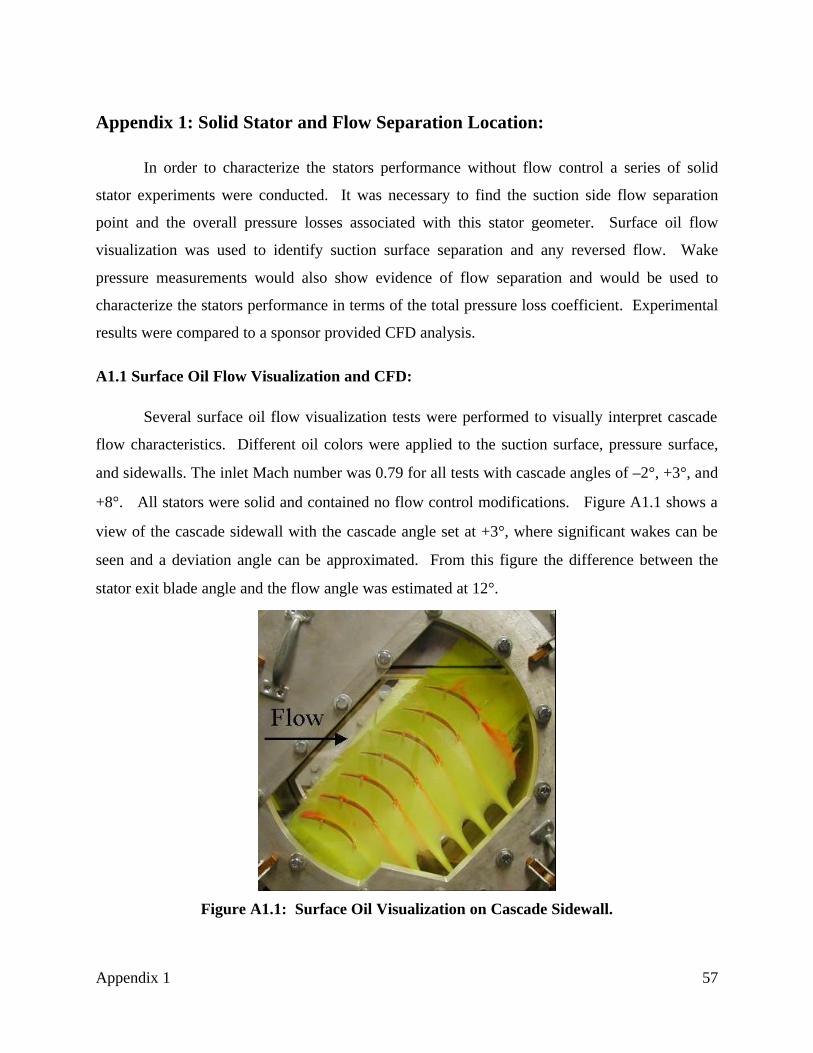
Appendix 1 57
Appendix 1: Solid Stator and Flow Separation Location:
In order to characterize the stators performance without flow control a series of solid
stator experiments were conducted. It was necessary to find the suction side flow separation
point and the overall pressure losses associated with this stator geometer. Surface oil flow
visualization was used to identify suction surface separation and any reversed flow. Wake
pressure measurements would also show evidence of flow separation and would be used to
characterize the stators performance in terms of the total pressure loss coefficient. Experimental
results were compared to a sponsor provided CFD analysis.
A1.1 Surface Oil Flow Visualization and CFD:
Several surface oil flow visualization tests were performed to visually interpret cascade
flow characteristics. Different oil colors were applied to the suction surface, pressure surface,
and sidewalls. The inlet Mach number was 0.79 for all tests with cascade angles of –2°, +3°, and
+8°. All stators were solid and contained no flow control modifications. Figure A1.1 shows a
view of the cascade sidewall with the cascade angle set at +3°, where significant wakes can be
seen and a deviation angle can be approximated. From this figure the difference between the
stator exit blade angle and the flow angle was estimated at 12°.
Figure A1.1: Surface Oil Visualization on Cascade Sidewall.

Appendix 1 58
Figure A1.2: Surface Oil Visualization on Center Stator Suction Surface (i = +3°°)
Figure A1.3: Surface Oil Visualization on Center Stator Suction Surface (i = +8°°)
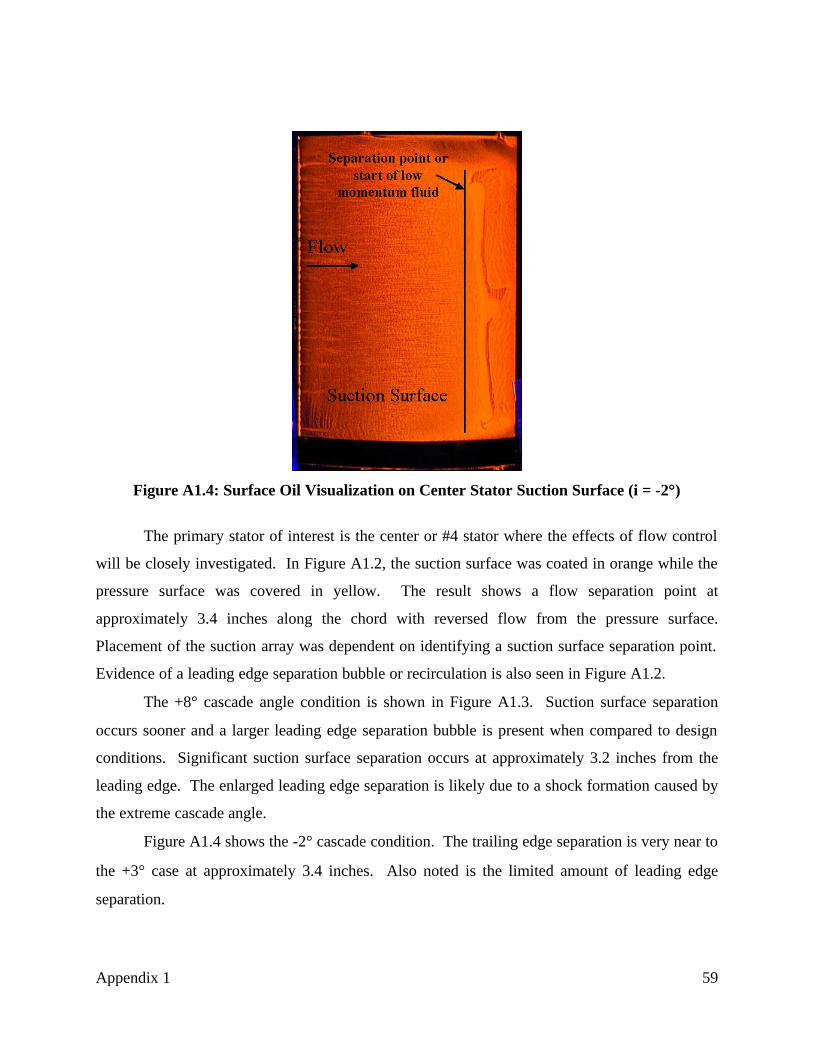
Appendix 1 59
Figure A1.4: Surface Oil Visualization on Center Stator Suction Surface (i = -2°°)
The primary stator of interest is the center or #4 stator where the effects of flow control
will be closely investigated. In Figure A1.2, the suction surface was coated in orange while the
pressure surface was covered in yellow. The result shows a flow separation point at
approximately 3.4 inches along the chord with reversed flow from the pressure surface.
Placement of the suction array was dependent on identifying a suction surface separation point.
Evidence of a leading edge separation bubble or recirculation is also seen in Figure A1.2.
The +8° cascade angle condition is shown in Figure A1.3. Suction surface separation
occurs sooner and a larger leading edge separation bubble is present when compared to design
conditions. Significant suction surface separation occurs at approximately 3.2 inches from the
leading edge. The enlarged leading edge separation is likely due to a shock formation caused by
the extreme cascade angle.
Figure A1.4 shows the -2° cascade condition. The trailing edge separation is very near to
the +3° case at approximately 3.4 inches. Also noted is the limited amount of leading edge
separation.
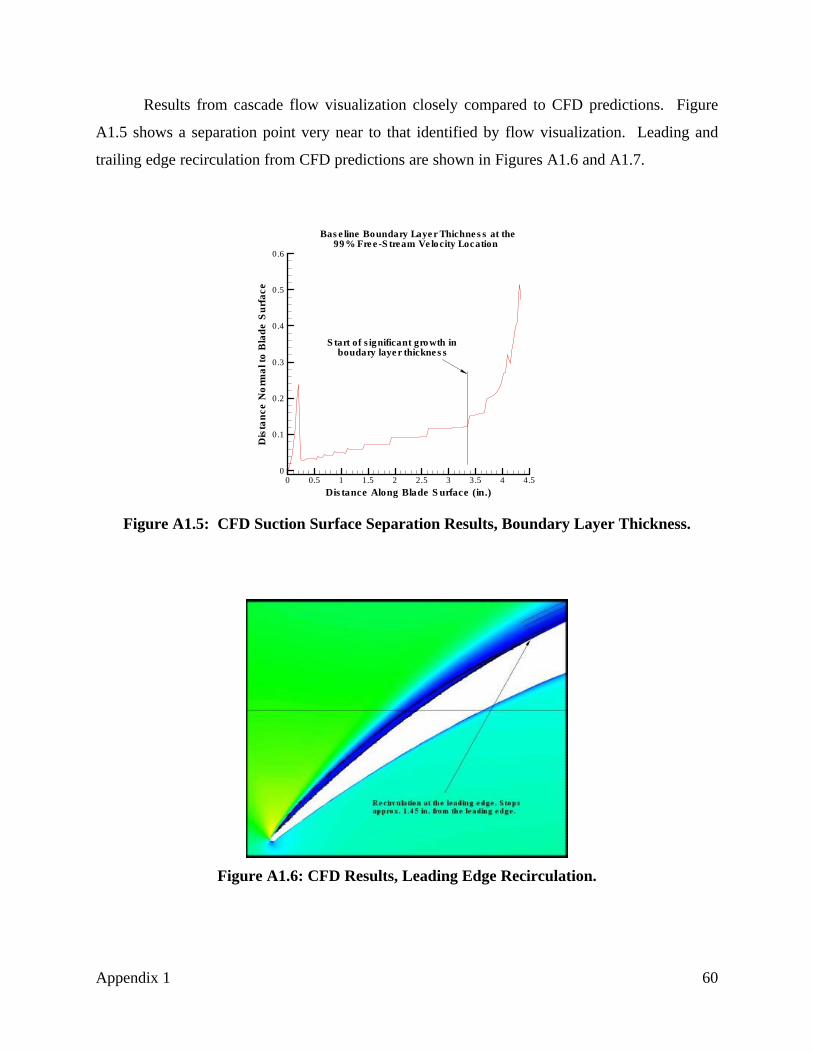
Appendix 1 60
Results from cascade flow visualization closely compared to CFD predictions. Figure
A1.5 shows a separation point very near to that identified by flow visualization. Leading and
trailing edge recirculation from CFD predictions are shown in Figures A1.6 and A1.7.
Figure A1.5: CFD Suction Surface Separation Results, Boundary Layer Thickness.
Figure A1.6: CFD Results, Leading Edge Recirculation.
Dis tance Along Blade S urface (in.)
Dis
tan
ceN
orm
alt
oB
lad
eS
urf
ace
0 0.5 1 1.5 2 2.5 3 3.5 4 4.50
0.1
0.2
0.3
0.4
0.5
0.6
Bas e line Boundary Laye r Thichne s s at the99% Fre e -S tream Ve locity Location
S tart of s ignificant growth inboudary laye r thickne s s

Appendix 1 61
Figure A1.7: CFD Results, Trailing Edge Recirculation.
A1.2: Pressure Measurements.
Baseline pressure measurements were taken to quantify the aerodynamic performance of
the stator geometry. The original test section setup allowed for an axial traverse location of 0.41
chordlengths downstream of the trailing edge. All future flow control testing was performed at
0.1 or 0.5 chordlengths. Therefore, a direct comparison could not be made between the baseline
performance of a flow control stator and a solid stator prior flow control modifications.
At +3° the total pressure loss coefficient for stator 4 is equal to 13.8%. However, Figure
A1.8 of the total pressure ratio versus pitch shows less than ideal periodicity across stators 3, 4,
and 5. Stator 3 shows a much smaller wake depth than stators 4 and 5, with minimum total
pressure ratios of 0.90, 0.865, and 0.87, respectively. Also noticeable is the asymmetric
transition between suction and pressure surfaces due to suction surface separation.
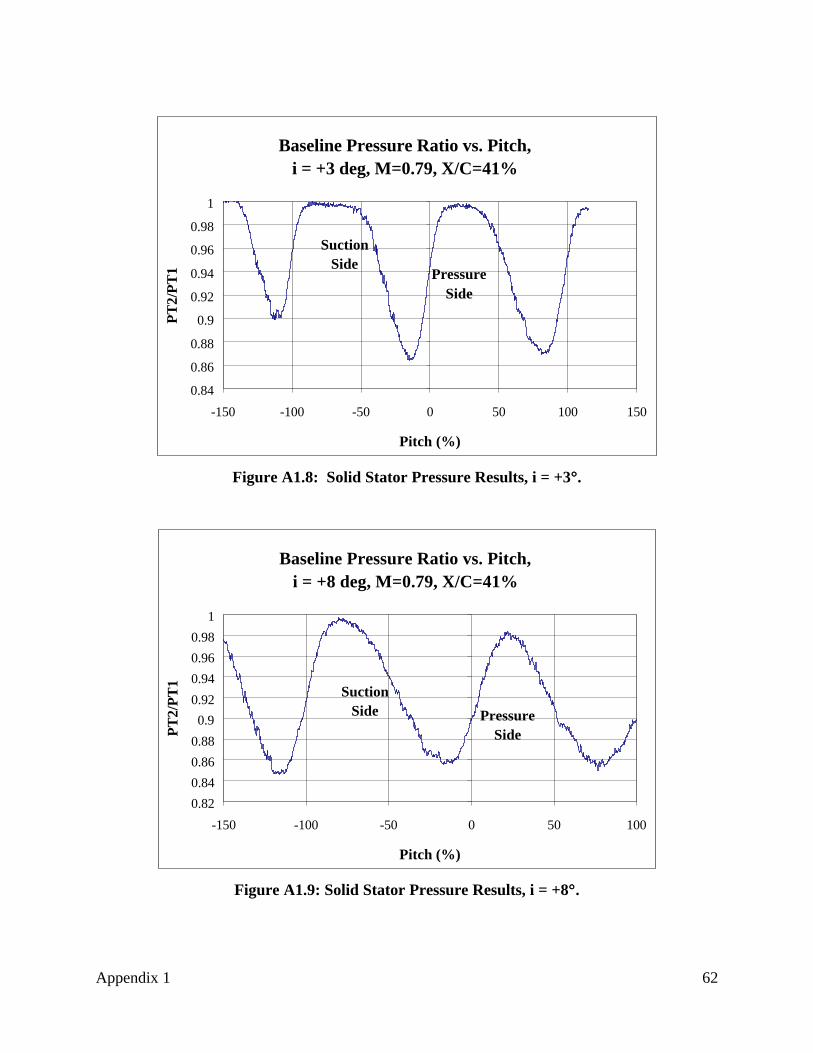
Appendix 1 62
Figure A1.8: Solid Stator Pressure Results, i = +3°°.
Figure A1.9: Solid Stator Pressure Results, i = +8°°.
Baseline Pressure Ratio vs. Pitch, i = +3 deg, M=0.79, X/C=41%
0.84
0.86
0.88
0.9
0.92
0.94
0.96
0.98
1
-150 -100 -50 0 50 100 150
Pitch (%)
PT
2/P
T1 Pressure
Side
Suction Side
Baseline Pressure Ratio vs. Pitch, i = +8 deg, M=0.79, X/C=41%
0.82
0.84
0.86
0.88
0.9
0.92
0.94
0.96
0.98
1
-150 -100 -50 0 50 100
Pitch (%)
PT
2/P
T1
Pressure Side
Suction Side

Appendix 1 63
Performance at a cascade angle of +8° with a Mach number of 0.79 was also examined.
The total pressure loss coefficient of stator 4 was 22.3%, considerably larger than the value
obtained at i = +3°. The large loss is due to increased separation at the trailing edge of the
suction surface and shock formation at the leading edge. Figure A1.9 shows the wake traverse at
these conditions. Again non-periodic wakes are visible, including dissimilar values for the
minimum pressure ratio between each wake.
Tests were conducted several times and showed good repeatability between runs, despite
the non-periodic wake dimensions. The dissimilarities between the wakes of stators 3, 4, and 5
are most likely due to the absence of a tailboard and unbalanced inlet and exit areas. However,
since the data is repeatable and only the wake of stator 4 is of interest, the flow conditions are
acceptable.
Results from these tests were applied to the design and location of the flow control
plenums and arrays, as described in Section 2.2.

Appendix 2 64
Appendix 2: Single Flow Control Stator Results
Trailing edge blowing and boundary layer suction was applied to the center stator of the
cascade by means of an imbedded ejector pump as described in Chapter 2. Several inlet
conditions were tested in order to identify the useful range and functionality of the flow control
design. The loss coefficient was reduced across a range of increasing motive supply massflow
rates. The amount of suction obtained by a given massflow was also measured. Two blowing
hole sizes were used during the single flow control stator testing.
The original flow control design as described in Appendix 2, with a blowing hole
diameter of 0.0625 (1.5875mm) inches was tested first. Six different motive massflow rates
were compared to a flow control baseline. Baseline tested where conducted with the flow
control stator with no supply massflow and the suction and blowing arrays uncovered.
Massflows of 0.8%, 1.0%, 1.3%, 1.5%, 1.7%, and 1.9% of the passage throughflow, correspond
to motive pressures of 30, 40, 50, 60, 70, and 80 psi, respectively. Inlet conditions were held
constant given the facilities capabilities.
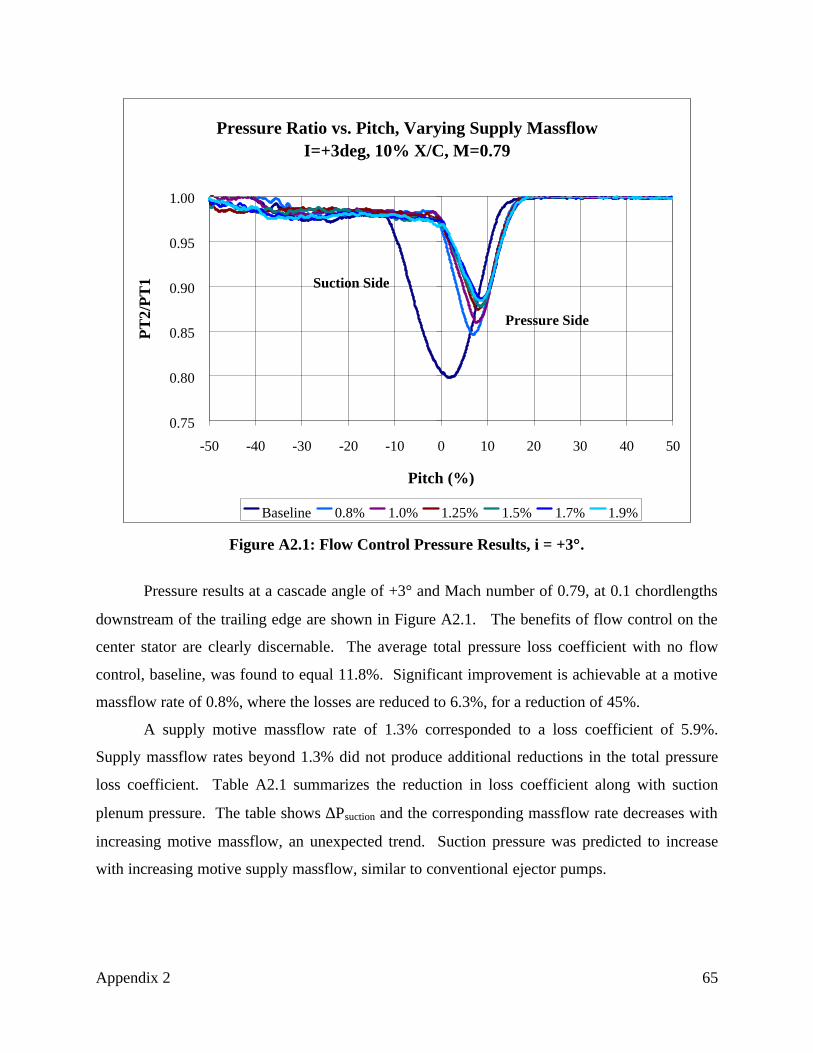
Appendix 2 65
Figure A2.1: Flow Control Pressure Results, i = +3°°.
Pressure results at a cascade angle of +3° and Mach number of 0.79, at 0.1 chordlengths
downstream of the trailing edge are shown in Figure A2.1. The benefits of flow control on the
center stator are clearly discernable. The average total pressure loss coefficient with no flow
control, baseline, was found to equal 11.8%. Significant improvement is achievable at a motive
massflow rate of 0.8%, where the losses are reduced to 6.3%, for a reduction of 45%.
A supply motive massflow rate of 1.3% corresponded to a loss coefficient of 5.9%.
Supply massflow rates beyond 1.3% did not produce additional reductions in the total pressure
loss coefficient. Table A2.1 summarizes the reduction in loss coefficient along with suction
plenum pressure. The table shows ∆Psuction and the corresponding massflow rate decreases with
increasing motive massflow, an unexpected trend. Suction pressure was predicted to increase
with increasing motive supply massflow, similar to conventional ejector pumps.
Pressure Ratio vs. Pitch, Varying Supply MassflowI=+3deg, 10% X/C, M=0.79
0.75
0.80
0.85
0.90
0.95
1.00
-50 -40 -30 -20 -10 0 10 20 30 40 50
Pitch (%)
PT
2/P
T1
Baseline 0.8% 1.0% 1.25% 1.5% 1.7% 1.9%
Suction Side
Pressure Side
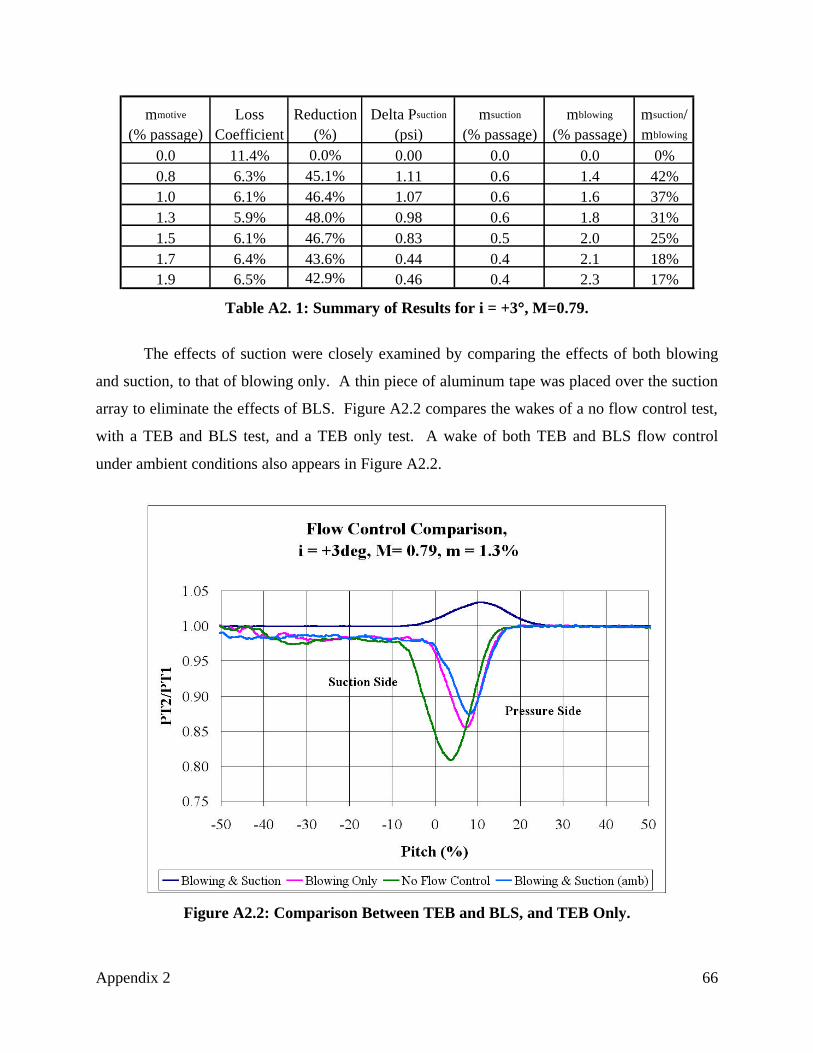
Appendix 2 66
Table A2. 1: Summary of Results for i = +3°°, M=0.79.
The effects of suction were closely examined by comparing the effects of both blowing
and suction, to that of blowing only. A thin piece of aluminum tape was placed over the suction
array to eliminate the effects of BLS. Figure A2.2 compares the wakes of a no flow control test,
with a TEB and BLS test, and a TEB only test. A wake of both TEB and BLS flow control
under ambient conditions also appears in Figure A2.2.
Figure A2.2: Comparison Between TEB and BLS, and TEB Only.
mmotive
(% passage)Loss
CoefficientReduction
(%)Delta Psuction
(psi)msuction
(% passage)mblowing
(% passage)msuction/mblowing
0.0 11.4% 0.0% 0.00 0.0 0.0 0%0.8 6.3% 45.1% 1.11 0.6 1.4 42%1.0 6.1% 46.4% 1.07 0.6 1.6 37%1.3 5.9% 48.0% 0.98 0.6 1.8 31%1.5 6.1% 46.7% 0.83 0.5 2.0 25%1.7 6.4% 43.6% 0.44 0.4 2.1 18%1.9 6.5% 42.9% 0.46 0.4 2.3 17%
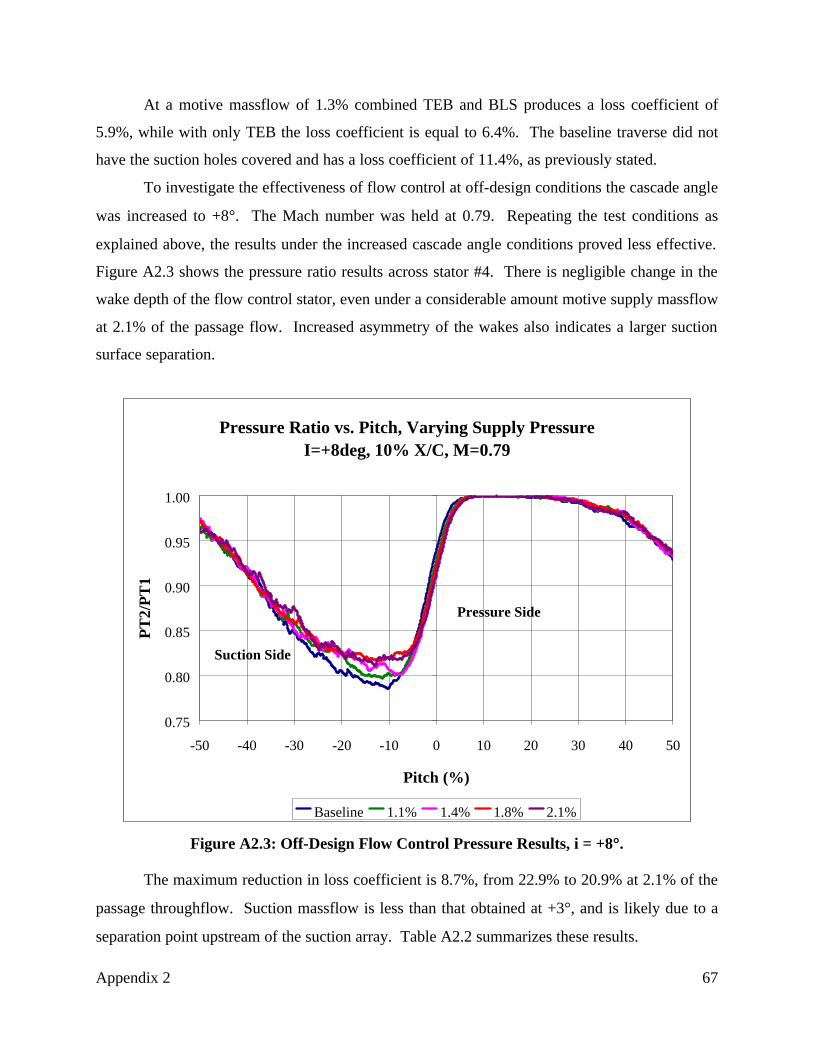
Appendix 2 67
At a motive massflow of 1.3% combined TEB and BLS produces a loss coefficient of
5.9%, while with only TEB the loss coefficient is equal to 6.4%. The baseline traverse did not
have the suction holes covered and has a loss coefficient of 11.4%, as previously stated.
To investigate the effectiveness of flow control at off-design conditions the cascade angle
was increased to +8°. The Mach number was held at 0.79. Repeating the test conditions as
explained above, the results under the increased cascade angle conditions proved less effective.
Figure A2.3 shows the pressure ratio results across stator #4. There is negligible change in the
wake depth of the flow control stator, even under a considerable amount motive supply massflow
at 2.1% of the passage flow. Increased asymmetry of the wakes also indicates a larger suction
surface separation.
Figure A2.3: Off-Design Flow Control Pressure Results, i = +8°°.
The maximum reduction in loss coefficient is 8.7%, from 22.9% to 20.9% at 2.1% of the
passage throughflow. Suction massflow is less than that obtained at +3°, and is likely due to a
separation point upstream of the suction array. Table A2.2 summarizes these results.
Pressure Ratio vs. Pitch, Varying Supply PressureI=+8deg, 10% X/C, M=0.79
0.75
0.80
0.85
0.90
0.95
1.00
-50 -40 -30 -20 -10 0 10 20 30 40 50
Pitch (%)
PT
2/P
T1
Baseline 1.1% 1.4% 1.8% 2.1%
Suction Side
Pressure Side
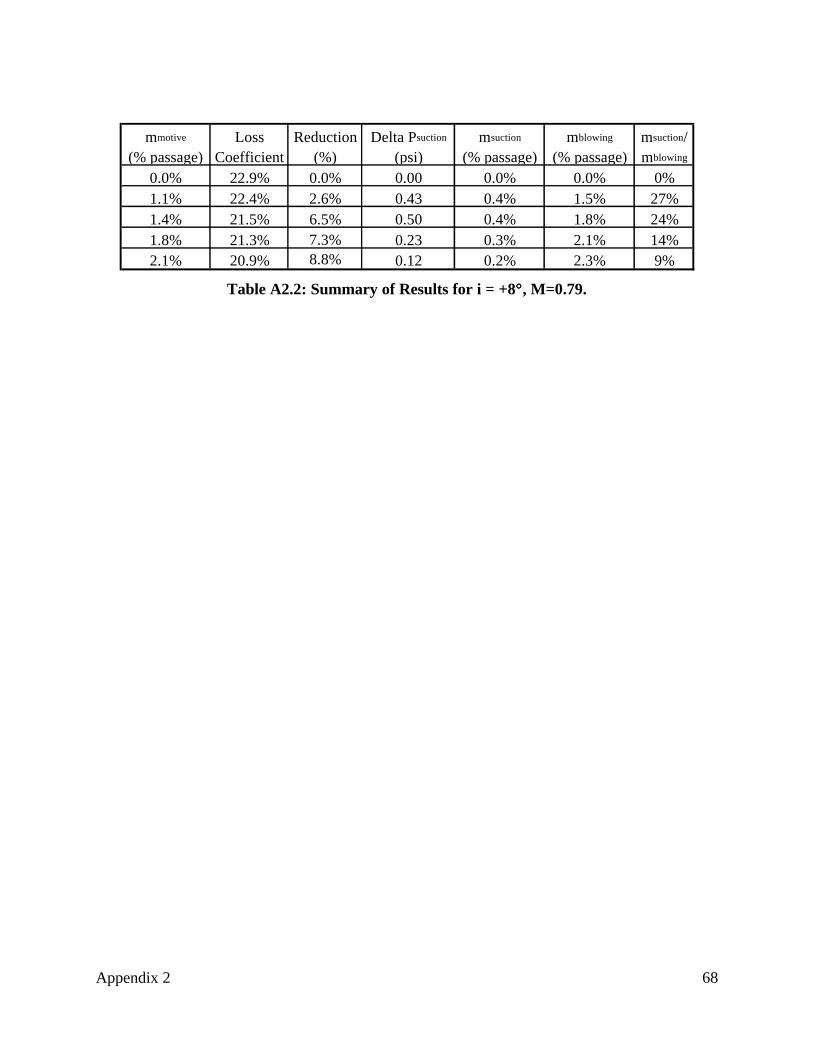
Appendix 2 68
Table A2.2: Summary of Results for i = +8°°, M=0.79.
mmotive
(% passage)Loss
CoefficientReduction
(%)Delta Psuction
(psi)msuction
(% passage)mblowing
(% passage)msuction/mblowing
0.0% 22.9% 0.0% 0.00 0.0% 0.0% 0%1.1% 22.4% 2.6% 0.43 0.4% 1.5% 27%1.4% 21.5% 6.5% 0.50 0.4% 1.8% 24%1.8% 21.3% 7.3% 0.23 0.3% 2.1% 14%2.1% 20.9% 8.8% 0.12 0.2% 2.3% 9%
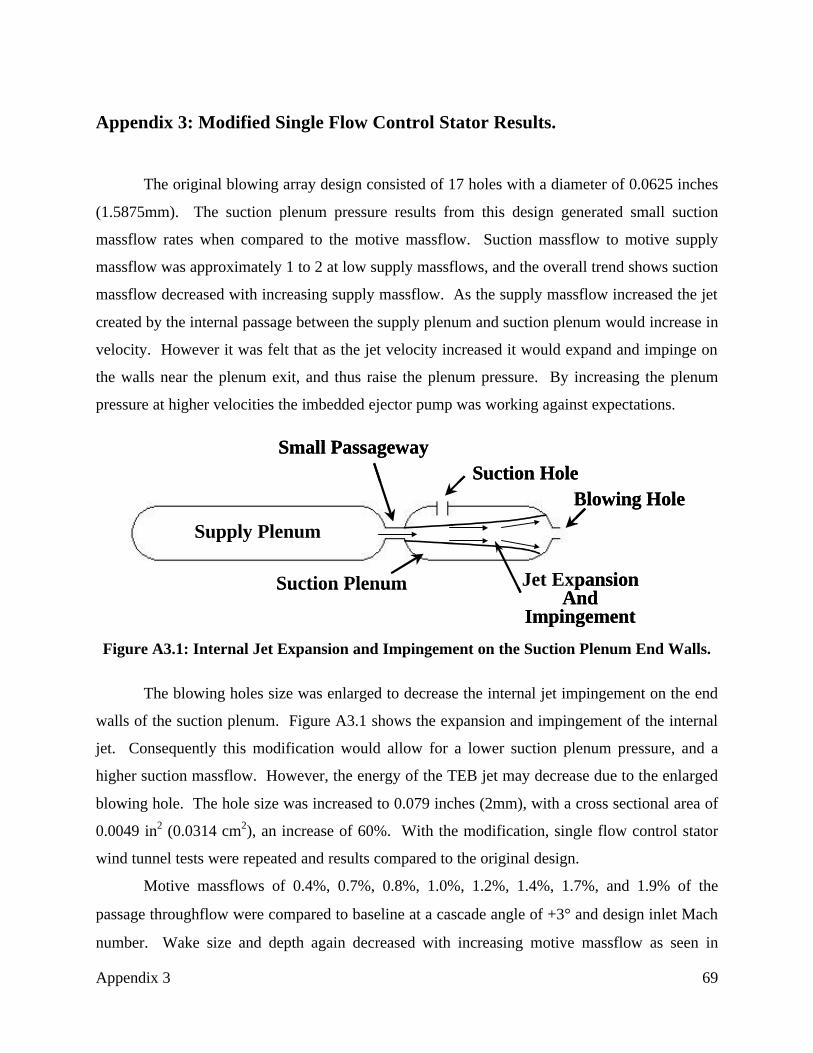
Appendix 3 69
Appendix 3: Modified Single Flow Control Stator Results.
The original blowing array design consisted of 17 holes with a diameter of 0.0625 inches
(1.5875mm). The suction plenum pressure results from this design generated small suction
massflow rates when compared to the motive massflow. Suction massflow to motive supply
massflow was approximately 1 to 2 at low supply massflows, and the overall trend shows suction
massflow decreased with increasing supply massflow. As the supply massflow increased the jet
created by the internal passage between the supply plenum and suction plenum would increase in
velocity. However it was felt that as the jet velocity increased it would expand and impinge on
the walls near the plenum exit, and thus raise the plenum pressure. By increasing the plenum
pressure at higher velocities the imbedded ejector pump was working against expectations.
Figure A3.1: Internal Jet Expansion and Impingement on the Suction Plenum End Walls.
The blowing holes size was enlarged to decrease the internal jet impingement on the end
walls of the suction plenum. Figure A3.1 shows the expansion and impingement of the internal
jet. Consequently this modification would allow for a lower suction plenum pressure, and a
higher suction massflow. However, the energy of the TEB jet may decrease due to the enlarged
blowing hole. The hole size was increased to 0.079 inches (2mm), with a cross sectional area of
0.0049 in2 (0.0314 cm2), an increase of 60%. With the modification, single flow control stator
wind tunnel tests were repeated and results compared to the original design.
Motive massflows of 0.4%, 0.7%, 0.8%, 1.0%, 1.2%, 1.4%, 1.7%, and 1.9% of the
passage throughflow were compared to baseline at a cascade angle of +3° and design inlet Mach
number. Wake size and depth again decreased with increasing motive massflow as seen in
Supply Plenum
Small Passageway
Suction Plenum
Suction HoleBlowing Hole
Jet ExpansionAnd
Impingement
Supply Plenum
Small Passageway
Suction Plenum
Suction HoleBlowing Hole
Jet ExpansionAnd
Impingement
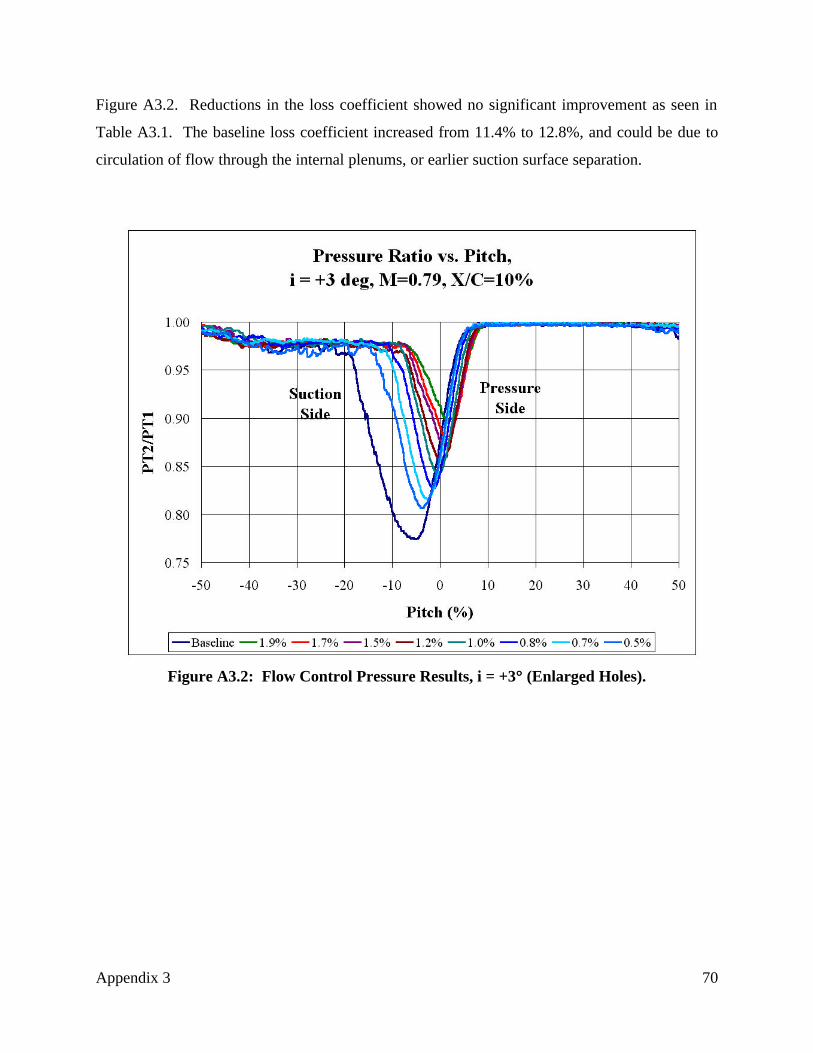
Appendix 3 70
Figure A3.2. Reductions in the loss coefficient showed no significant improvement as seen in
Table A3.1. The baseline loss coefficient increased from 11.4% to 12.8%, and could be due to
circulation of flow through the internal plenums, or earlier suction surface separation.
Figure A3.2: Flow Control Pressure Results, i = +3°° (Enlarged Holes).
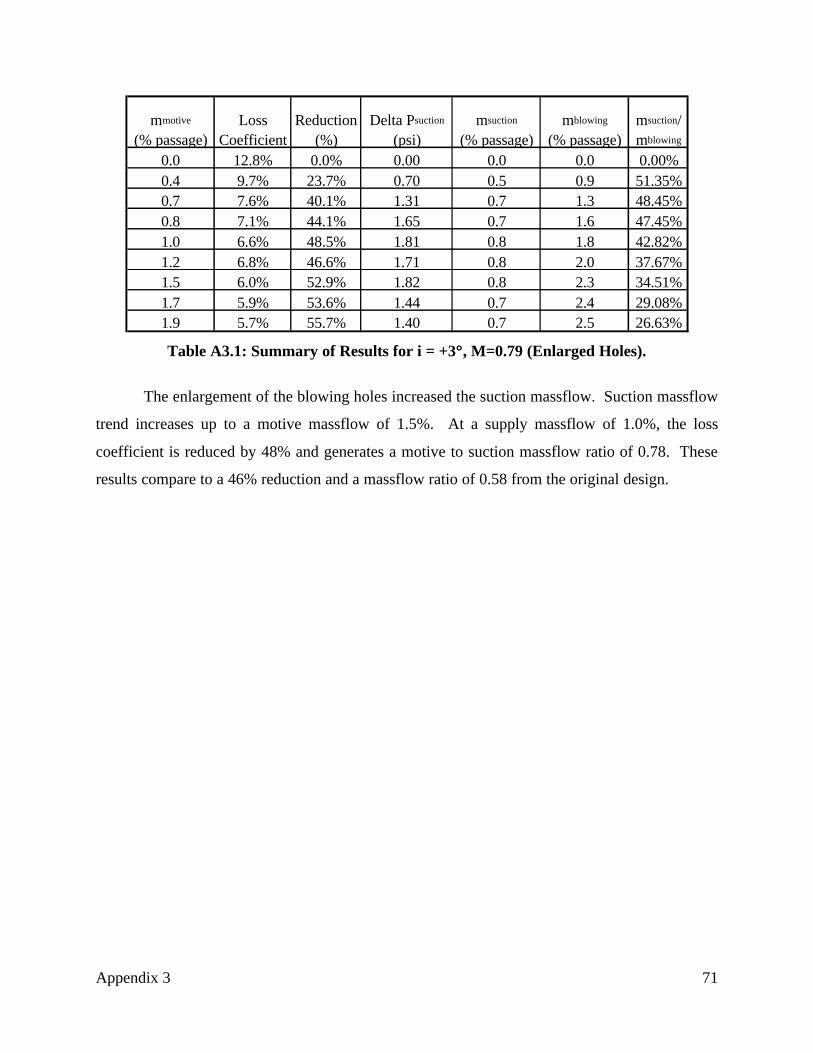
Appendix 3 71
Table A3.1: Summary of Results for i = +3°°, M=0.79 (Enlarged Holes).
The enlargement of the blowing holes increased the suction massflow. Suction massflow
trend increases up to a motive massflow of 1.5%. At a supply massflow of 1.0%, the loss
coefficient is reduced by 48% and generates a motive to suction massflow ratio of 0.78. These
results compare to a 46% reduction and a massflow ratio of 0.58 from the original design.
mmotive
(% passage)Loss
CoefficientReduction
(%)Delta Psuction
(psi)msuction
(% passage)mblowing
(% passage)msuction/mblowing
0.0 12.8% 0.0% 0.00 0.0 0.0 0.00%0.4 9.7% 23.7% 0.70 0.5 0.9 51.35%0.7 7.6% 40.1% 1.31 0.7 1.3 48.45%0.8 7.1% 44.1% 1.65 0.7 1.6 47.45%1.0 6.6% 48.5% 1.81 0.8 1.8 42.82%1.2 6.8% 46.6% 1.71 0.8 2.0 37.67%1.5 6.0% 52.9% 1.82 0.8 2.3 34.51%1.7 5.9% 53.6% 1.44 0.7 2.4 29.08%1.9 5.7% 55.7% 1.40 0.7 2.5 26.63%
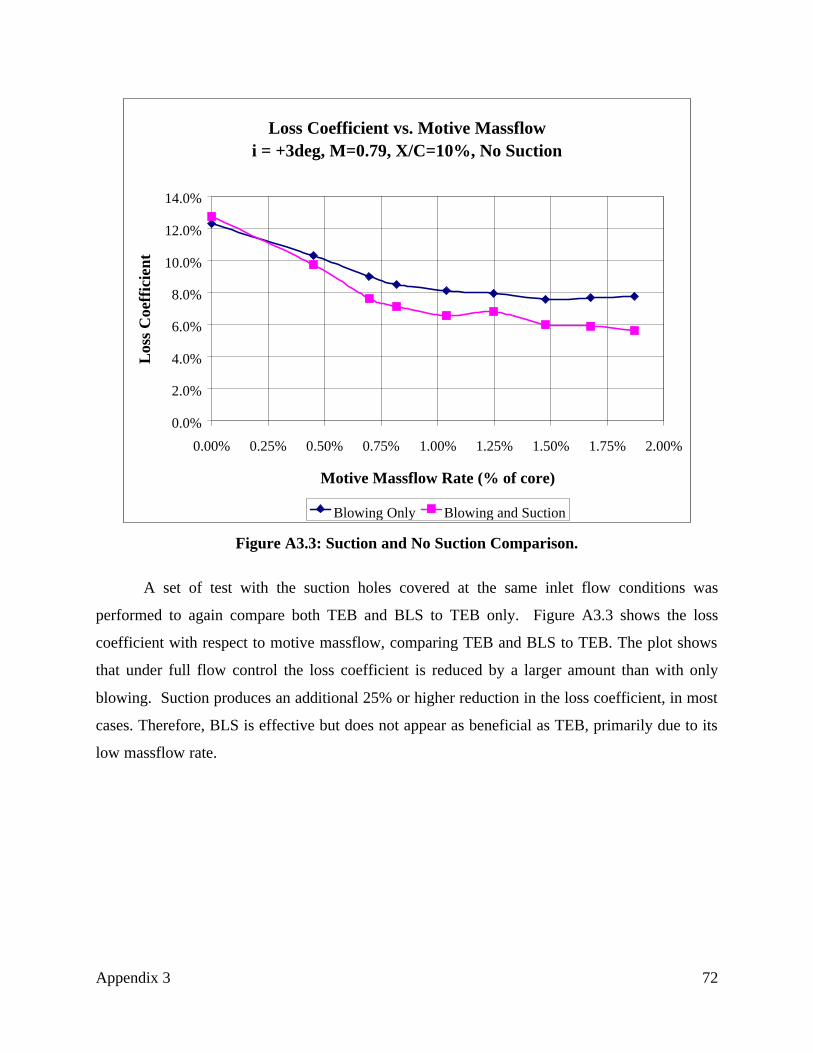
Appendix 3 72
Figure A3.3: Suction and No Suction Comparison.
A set of test with the suction holes covered at the same inlet flow conditions was
performed to again compare both TEB and BLS to TEB only. Figure A3.3 shows the loss
coefficient with respect to motive massflow, comparing TEB and BLS to TEB. The plot shows
that under full flow control the loss coefficient is reduced by a larger amount than with only
blowing. Suction produces an additional 25% or higher reduction in the loss coefficient, in most
cases. Therefore, BLS is effective but does not appear as beneficial as TEB, primarily due to its
low massflow rate.
Loss Coefficient vs. Motive Massflowi = +3deg, M=0.79, X/C=10%, No Suction
0.0%
2.0%
4.0%
6.0%
8.0%
10.0%
12.0%
14.0%
0.00% 0.25% 0.50% 0.75% 1.00% 1.25% 1.50% 1.75% 2.00%
Motive Massflow Rate (% of core)
Los
s C
oeff
icie
nt
Blowing Only Blowing and Suction
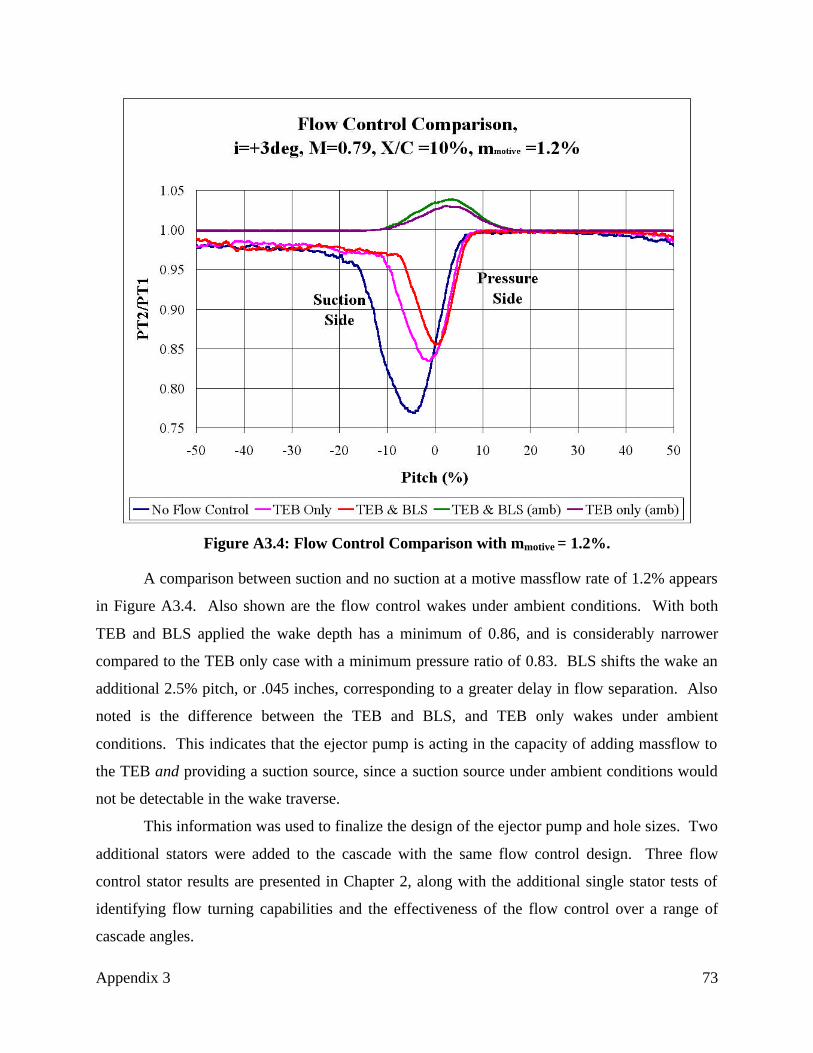
Appendix 3 73
Figure A3.4: Flow Control Comparison with mmotive = 1.2%.
A comparison between suction and no suction at a motive massflow rate of 1.2% appears
in Figure A3.4. Also shown are the flow control wakes under ambient conditions. With both
TEB and BLS applied the wake depth has a minimum of 0.86, and is considerably narrower
compared to the TEB only case with a minimum pressure ratio of 0.83. BLS shifts the wake an
additional 2.5% pitch, or .045 inches, corresponding to a greater delay in flow separation. Also
noted is the difference between the TEB and BLS, and TEB only wakes under ambient
conditions. This indicates that the ejector pump is acting in the capacity of adding massflow to
the TEB and providing a suction source, since a suction source under ambient conditions would
not be detectable in the wake traverse.
This information was used to finalize the design of the ejector pump and hole sizes. Two
additional stators were added to the cascade with the same flow control design. Three flow
control stator results are presented in Chapter 2, along with the additional single stator tests of
identifying flow turning capabilities and the effectiveness of the flow control over a range of
cascade angles.
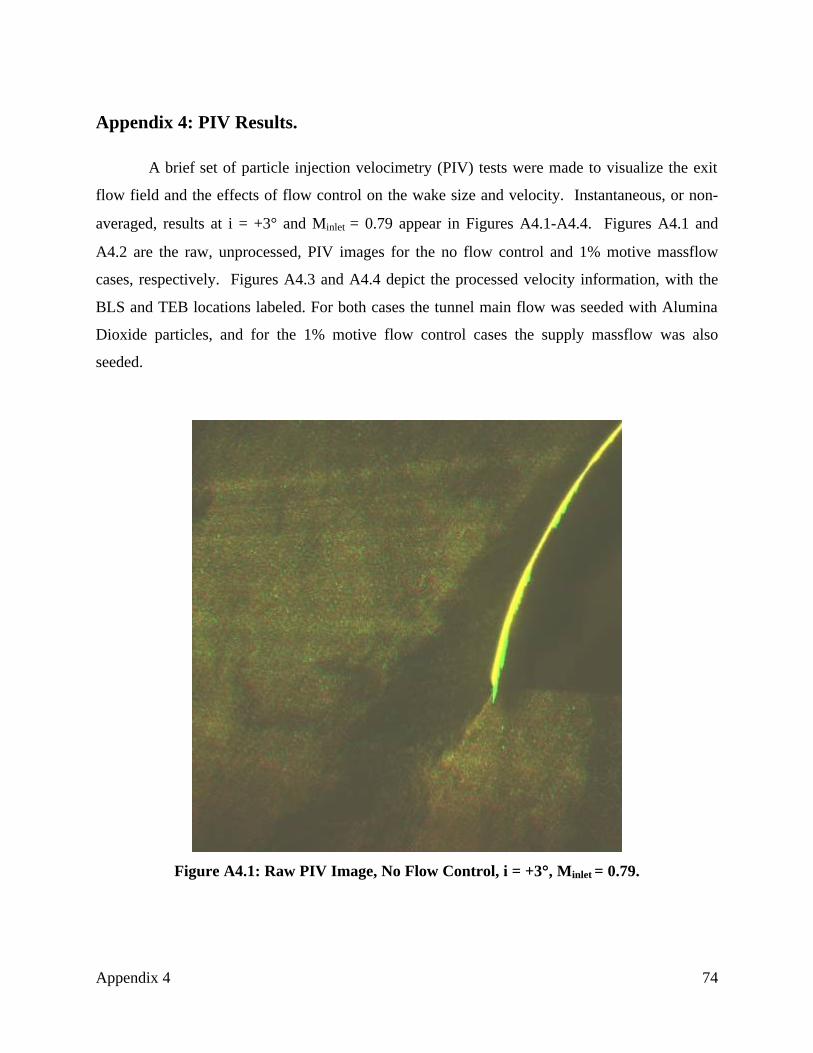
Appendix 4 74
Appendix 4: PIV Results.
A brief set of particle injection velocimetry (PIV) tests were made to visualize the exit
flow field and the effects of flow control on the wake size and velocity. Instantaneous, or non-
averaged, results at i = +3° and Minlet = 0.79 appear in Figures A4.1-A4.4. Figures A4.1 and
A4.2 are the raw, unprocessed, PIV images for the no flow control and 1% motive massflow
cases, respectively. Figures A4.3 and A4.4 depict the processed velocity information, with the
BLS and TEB locations labeled. For both cases the tunnel main flow was seeded with Alumina
Dioxide particles, and for the 1% motive flow control cases the supply massflow was also
seeded.
Figure A4.1: Raw PIV Image, No Flow Control, i = +3°°, Minlet = 0.79.
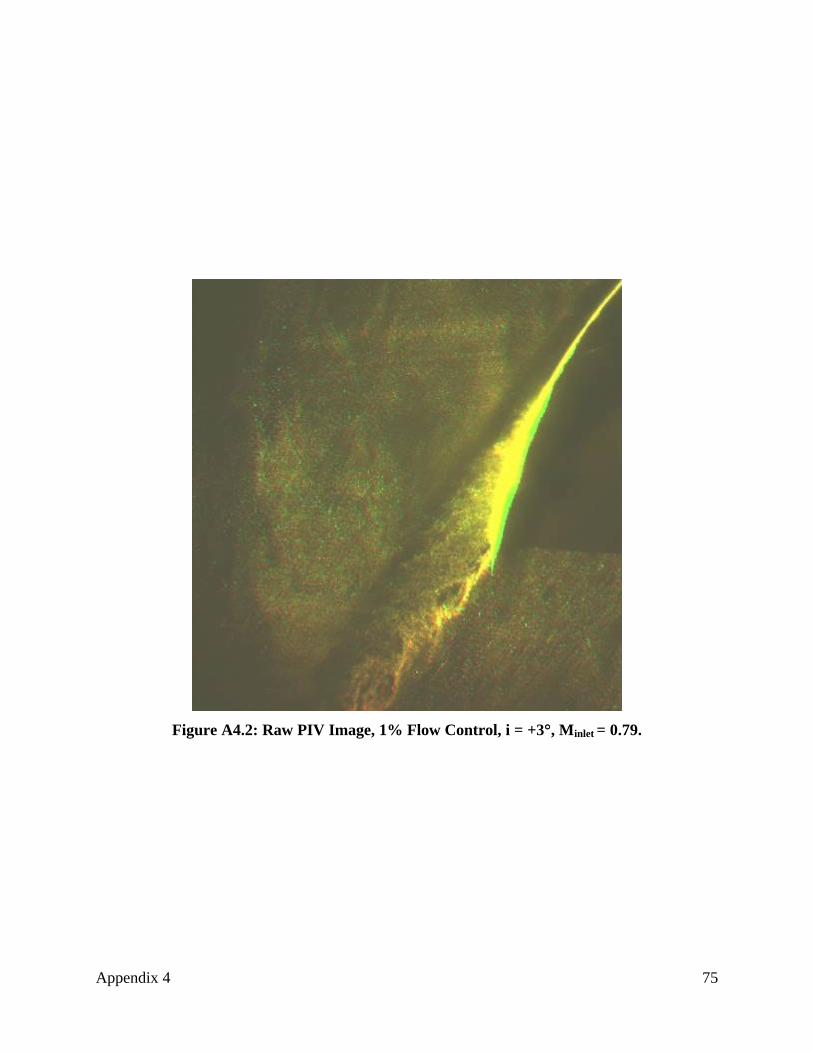
Appendix 4 75
Figure A4.2: Raw PIV Image, 1% Flow Control, i = +3°°, Minlet = 0.79.
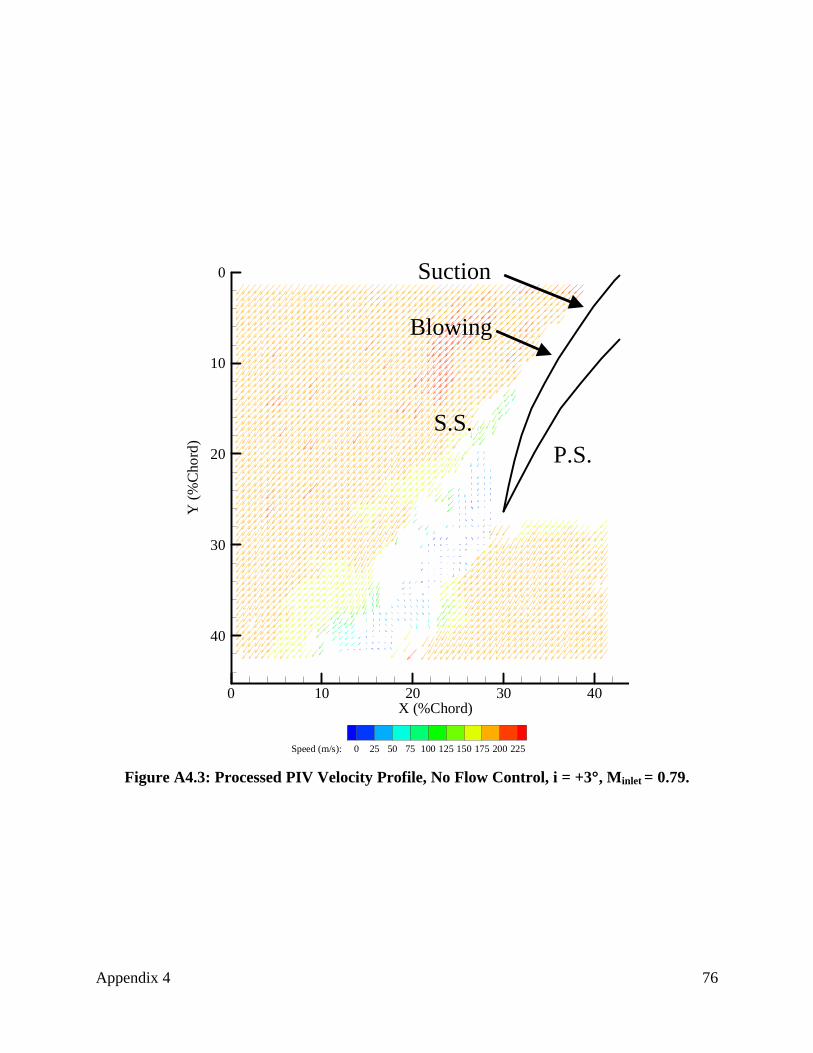
Appendix 4 76
Figure A4.3: Processed PIV Velocity Profile, No Flow Control, i = +3°°, Minlet = 0.79.
X (%Chord)
Y(%
Cho
rd)
0 10 20 30 40
0
10
20
30
40
Speed (m/s): 0 25 50 75 100 125 150 175 200 225
Suction
Blowing
S.S.P.S.
X (%Chord)
Y(%
Cho
rd)
0 10 20 30 40
0
10
20
30
40
Speed (m/s): 0 25 50 75 100 125 150 175 200 225
Suction
Blowing
S.S.P.S.
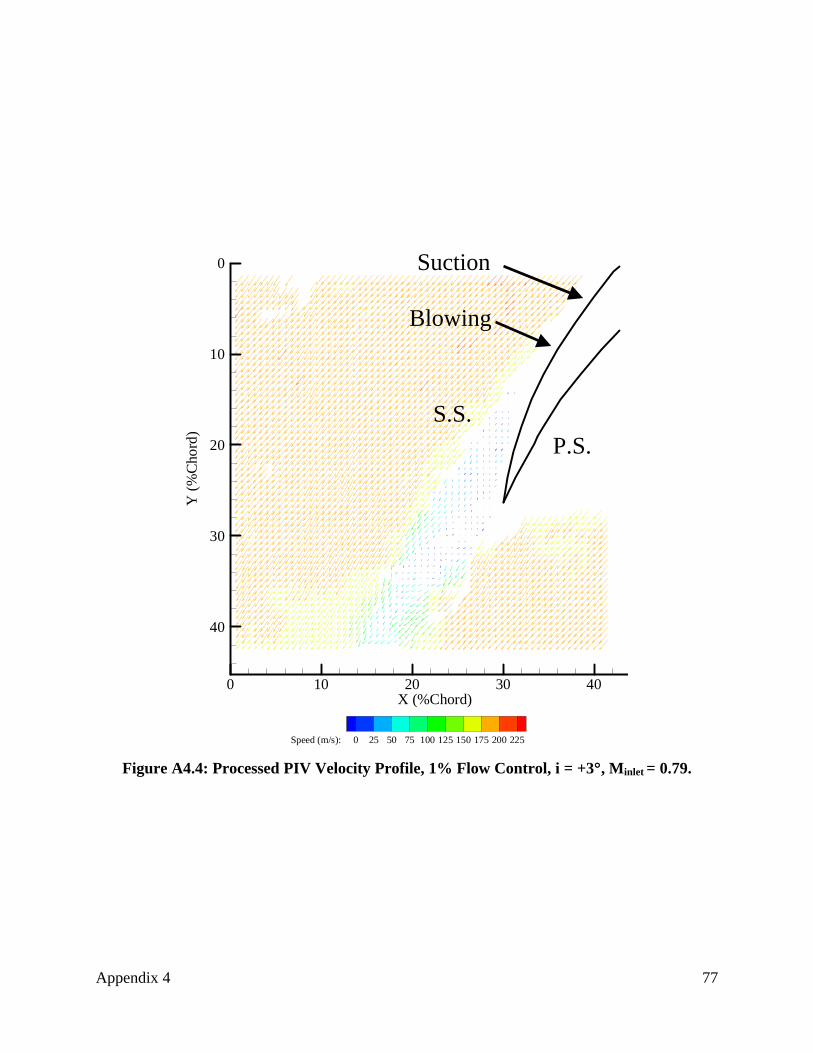
Appendix 4 77
Figure A4.4: Processed PIV Velocity Profile, 1% Flow Control, i = +3°°, Minlet = 0.79.
X (%Chord)
Y(%
Cho
rd)
0 10 20 30 40
0
10
20
30
40
Speed (m/s): 0 25 50 75 100 125 150 175 200 225
Suction
Blowing
S.S.P.S.
X (%Chord)
Y(%
Cho
rd)
0 10 20 30 40
0
10
20
30
40
Speed (m/s): 0 25 50 75 100 125 150 175 200 225
Suction
Blowing
S.S.P.S.
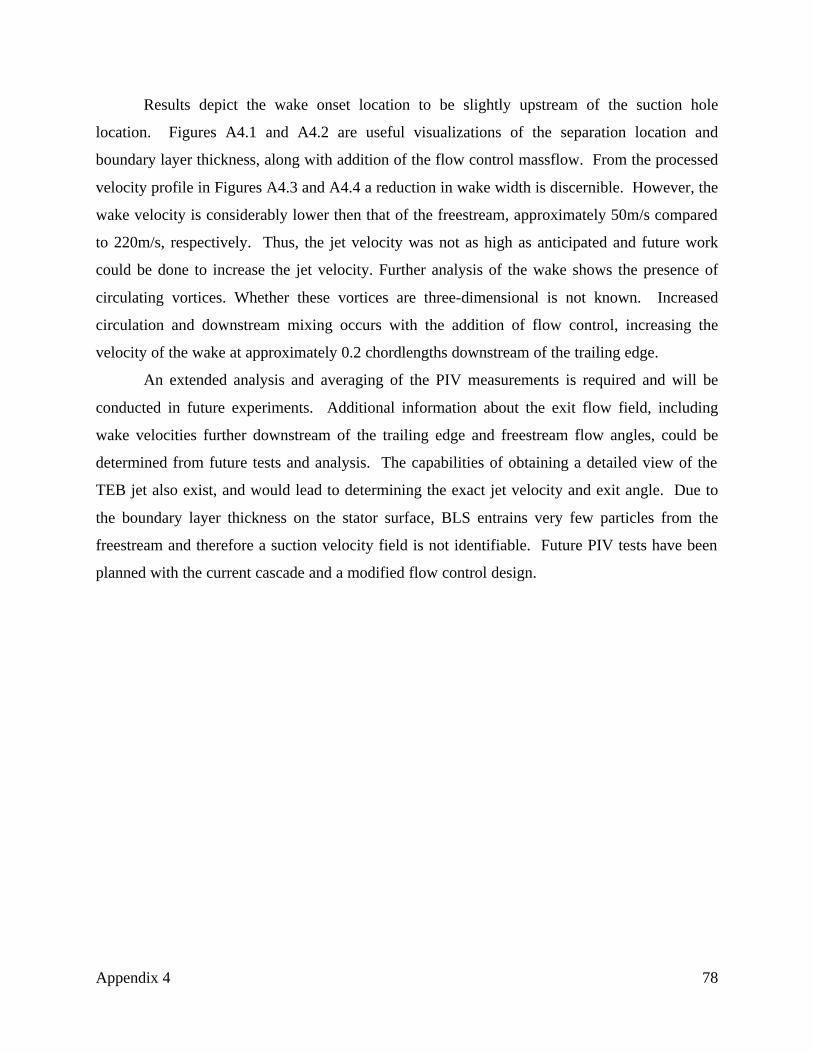
Appendix 4 78
Results depict the wake onset location to be slightly upstream of the suction hole
location. Figures A4.1 and A4.2 are useful visualizations of the separation location and
boundary layer thickness, along with addition of the flow control massflow. From the processed
velocity profile in Figures A4.3 and A4.4 a reduction in wake width is discernible. However, the
wake velocity is considerably lower then that of the freestream, approximately 50m/s compared
to 220m/s, respectively. Thus, the jet velocity was not as high as anticipated and future work
could be done to increase the jet velocity. Further analysis of the wake shows the presence of
circulating vortices. Whether these vortices are three-dimensional is not known. Increased
circulation and downstream mixing occurs with the addition of flow control, increasing the
velocity of the wake at approximately 0.2 chordlengths downstream of the trailing edge.
An extended analysis and averaging of the PIV measurements is required and will be
conducted in future experiments. Additional information about the exit flow field, including
wake velocities further downstream of the trailing edge and freestream flow angles, could be
determined from future tests and analysis. The capabilities of obtaining a detailed view of the
TEB jet also exist, and would lead to determining the exact jet velocity and exit angle. Due to
the boundary layer thickness on the stator surface, BLS entrains very few particles from the
freestream and therefore a suction velocity field is not identifiable. Future PIV tests have been
planned with the current cascade and a modified flow control design.
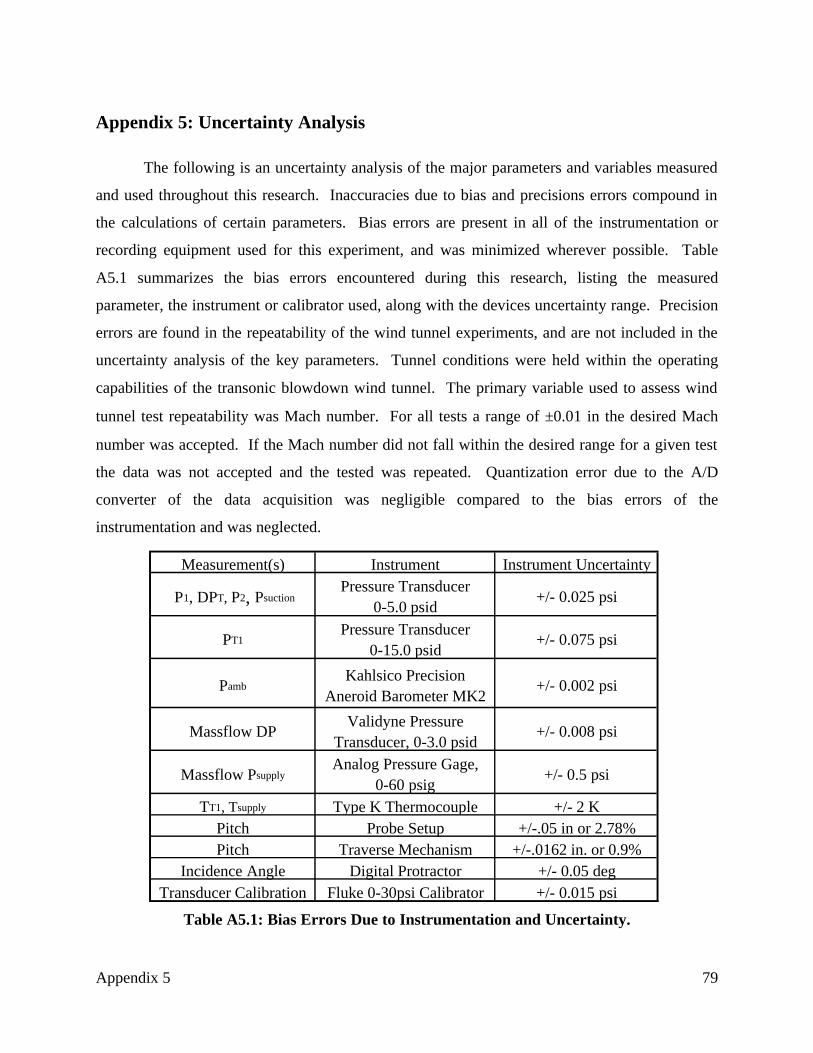
Appendix 5 79
Appendix 5: Uncertainty Analysis
The following is an uncertainty analysis of the major parameters and variables measured
and used throughout this research. Inaccuracies due to bias and precisions errors compound in
the calculations of certain parameters. Bias errors are present in all of the instrumentation or
recording equipment used for this experiment, and was minimized wherever possible. Table
A5.1 summarizes the bias errors encountered during this research, listing the measured
parameter, the instrument or calibrator used, along with the devices uncertainty range. Precision
errors are found in the repeatability of the wind tunnel experiments, and are not included in the
uncertainty analysis of the key parameters. Tunnel conditions were held within the operating
capabilities of the transonic blowdown wind tunnel. The primary variable used to assess wind
tunnel test repeatability was Mach number. For all tests a range of ±0.01 in the desired Mach
number was accepted. If the Mach number did not fall within the desired range for a given test
the data was not accepted and the tested was repeated. Quantization error due to the A/D
converter of the data acquisition was negligible compared to the bias errors of the
instrumentation and was neglected.
Table A5.1: Bias Errors Due to Instrumentation and Uncertainty.
Measurement(s) Instrument Instrument Uncertainty
P1, DPT, P2, PsuctionPressure Transducer
0-5.0 psid+/- 0.025 psi
PT1Pressure Transducer
0-15.0 psid+/- 0.075 psi
PambKahlsico Precision
Aneroid Barometer MK2+/- 0.002 psi
Massflow DPValidyne Pressure
Transducer, 0-3.0 psid+/- 0.008 psi
Massflow PsupplyAnalog Pressure Gage,
0-60 psig+/- 0.5 psi
TT1, Tsupply Type K Thermocouple +/- 2 KPitch Probe Setup +/-.05 in or 2.78%Pitch Traverse Mechanism +/-.0162 in. or 0.9%
Incidence Angle Digital Protractor +/- 0.05 degTransducer Calibration Fluke 0-30psi Calibrator +/- 0.015 psi

Appendix 5 80
As key parameters (M1, ω, ∆Psuction, msupply, msuction) were calculated using the data
measured through instrumentation listed in Table A5.1 errors compounded and propagated. The
primary parameter of interest throughout this experiment was the area averaged total pressure
loss coefficient, ω. The loss coefficient is found in its discrete form by using Equation 2.2 and
its uncertainty is found as follows.
Equation A5.1
Total pressure loss coefficient is represented in Chapter 2 by the use of error bars.
Uncertainty of the inlet Mach number from Equation 2.3.
Equation A5.2
The same method was used to identify the uncertainty of the total pressure ratio, ∆Psuction,
msuction, msupply and their values summarized in Table A5.2. The uncertainty for msupply was found
by Kozak (2000). The uncertainty values appearing below represent the maximum errors
encountered during experimentation, therefore the actually error for a given parameter may be
less than the value stated in Table A5.2.
Table A5.2: Maximum Propagated Uncertainty.
Calculated ParameterMaximum Propagated
Uncertainty
Loss Coeff, w +/- .005 or +/- 0.5%
Inlet Mach, M1 +/- 0.015
Total Pressure Ratio +/- 0.005
DPsuction +/- 0.041 psi
mpassage +/- 2.0% of value
msupply +/- 0.714% of value
msuction +/- 2.0% of value
2
1
1
2
1T
1T
2
T
T
PP
PP
PP
δ
∂
ω∂+
δ
∂
ω∂+
∆δ
∆∂ω∂
=δω
2
1
1
2
1T
1T
PP
MP
P
MM
δ
∂∂
+
δ
∂∂
=δ

81
Vita:
Casey J. Carter
Casey J. Carter was born in Portland, Maine on January 25, 1977 to Thomas and Sharon Carter.
He attended Brewer High School, of Brewer, Maine, and graduated in 1995. He graduated from
Clarkson University in Potsdam, NY, in 1999 with Great Distinction, with a Bachelor of Science
Degree in Mechanical Engineering. Upon completing and defending his research, the author will
begin work at BFGoodrich Aerospace in Vergennes, Vermont.