Embed Size (px)
Citation preview

25 February 2008Business Update and Half Year Results Announcement for Half Year Ended 31 December 20071
BUSINESS UPDATE AND HALF YEAR RESULTS ANNOUNCEMENTHALF YEAR ENDED 31 DECEMBER 2007
25 February 2008David Clarke Chief Executive OfficerTim Dodd Chief Financial Officer
For
per
sona
l use
onl
y
25 February 2008Business Update and Half Year Results Announcement for Half Year Ended 31 December 20072
Agenda
1.1. Current SituationCurrent Situation2. First Half Business Review3. Financial Performance4. Balance Sheet, Funding and Liquidity5. Summary6. Appendix
For
per
sona
l use
onl
y
25 February 2008Business Update and Half Year Results Announcement for Half Year Ended 31 December 20073
What Happened?
� Allco was committed to a growth strategy and was making financial commitments to acquire assets, build funds and grow its organisation.
� Subsequent dislocation in global credit markets and associated volatility in equity markets significantly impacted Allco’s operations, financial position and outlook.
� Shareholders and investors lost confidence in Allco:� Concern regarding related party transactions.� Falling share price.� Margin calls on substantial shareholder.� Continued short selling of AFG shares.� Focus on debt levels and complexity of business.
� Fund investors have not proceeded with stated commitments at this time.
For
per
sona
l use
onl
y
25 February 2008Business Update and Half Year Results Announcement for Half Year Ended 31 December 20074
What Happened? (cont.)
� Market capitalisation trigger enabled banks to review all seniorfacilities:� We are not in breach of financial covenants.� There have been no default or late interest payments.
� Constructive discussions with banks continue regarding restructuring terms and conditions of facilities.
� Anticipate successful outcome of these negotiations.
� We did not anticipate all these things occurring simultaneously. Led to insufficient liquidity to deal with these events.
� These events have led to management commencing an aggressive business restructuring program to ensure viability and rehabilitate the business.
For
per
sona
l use
onl
y
25 February 2008Business Update and Half Year Results Announcement for Half Year Ended 31 December 20075
Update on Funding Position
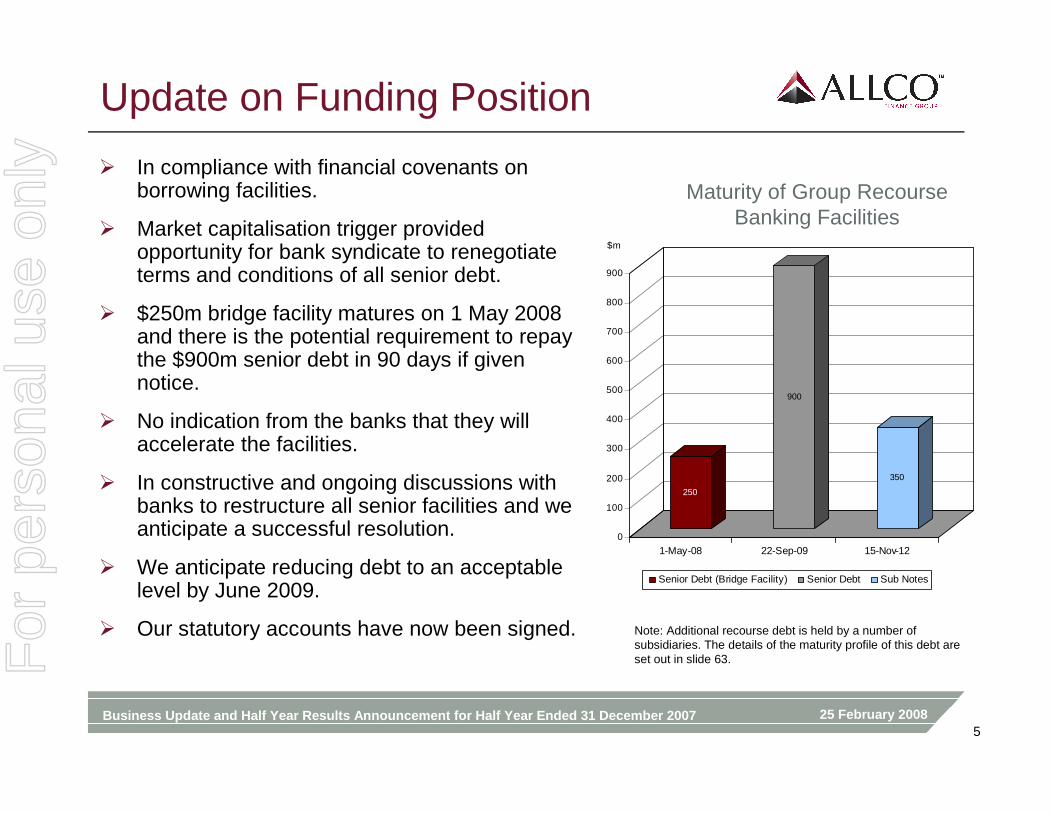
� In compliance with financial covenants on borrowing facilities.
� Market capitalisation trigger provided opportunity for bank syndicate to renegotiate terms and conditions of all senior debt.
� $250m bridge facility matures on 1 May 2008 and there is the potential requirement to repay the $900m senior debt in 90 days if given notice.
� No indication from the banks that they will accelerate the facilities.
� In constructive and ongoing discussions with banks to restructure all senior facilities and we anticipate a successful resolution.
� We anticipate reducing debt to an acceptable level by June 2009.
� Our statutory accounts have now been signed.
Maturity of Group Recourse Banking Facilities
250
900
350
0
100
200
300
400
500
600
700
800
900
$m
1-May-08 22-Sep-09 15-Nov-12
Senior Debt (Bridge Facility) Senior Debt Sub Notes
Note: Additional recourse debt is held by a number of subsidiaries. The details of the maturity profile of this debt are set out in slide 63.F
or p
erso
nal u
se o
nly
25 February 2008Business Update and Half Year Results Announcement for Half Year Ended 31 December 20076
What are we Doing?� We are developing a business restructuring program to focus on core activities:
� Focus on Aviation, Shipping, Rail and Real Estate.
� Through the orderly sale and wind-back of involvement:
� Exiting capital intensive Infrastructure business.
� Exiting Financial Assets which aren’t consistent with our focus on real assets.
� Sale of non-core assets to reduce debt.
� Implement measures designed to reduce the gap between net tangible assets of listed real estate funds and their trading prices.
� Active discussions with parties interested in acquiring selective non-core assets and / or businesses.
� Agreed transaction with Industry Funds Management to dispose of our interest in the Consolidated Edison portfolio of power stations which will result in a pre-tax loss of $72.1m in second half of FY08. No further financial commitment.
� No interim dividend to be paid and no full year dividend currently anticipated.
� Repositioned business requires significantly less headcount:� Core businesses will continue to be appropriately resourced.
� Continue to explore options that would strengthen financial position and enhance value of core businesses.
For
per
sona
l use
onl
y
25 February 2008Business Update and Half Year Results Announcement for Half Year Ended 31 December 20077
Business Model Going Forward� Allco will continue to be an alternative asset manager focused on “real
assets”:� Focus on our core asset classes of Aviation, Shipping, Rail and Real Estate.
� Assets Allco invests in complement investment portfolios comprised of traditional and other alternative investments.
� Continued access to debt funding in our core asset classes.
� Continued strong demand from our operating clients for our core assets, which remain critical to their business.
� Board and Management remain confident in the business model and the ability to restore financial stability and build value over time.
� Progress has been made in building a funds management platform and we will continue to build on our capabilities:� Focus on investor requirements rather than on product design in creating funds.� Simplify investment propositions, structure and terms.� Remunerate fund managers based on fund performance.� Through co-investment of funds, align interests of Allco with investors.
� The leadership team is absolutely committed to rebuilding Allco.For
per
sona
l use
onl
y
25 February 2008Business Update and Half Year Results Announcement for Half Year Ended 31 December 20078
Agenda
1. Current Situation
2.2. First Half Business ReviewFirst Half Business Review3. Financial Performance 4. Balance Sheet, Funding and Liquidity5. Summary6. Appendix
For
per
sona
l use
onl
y
25 February 2008Business Update and Half Year Results Announcement for Half Year Ended 31 December 20079
Aviation Overview
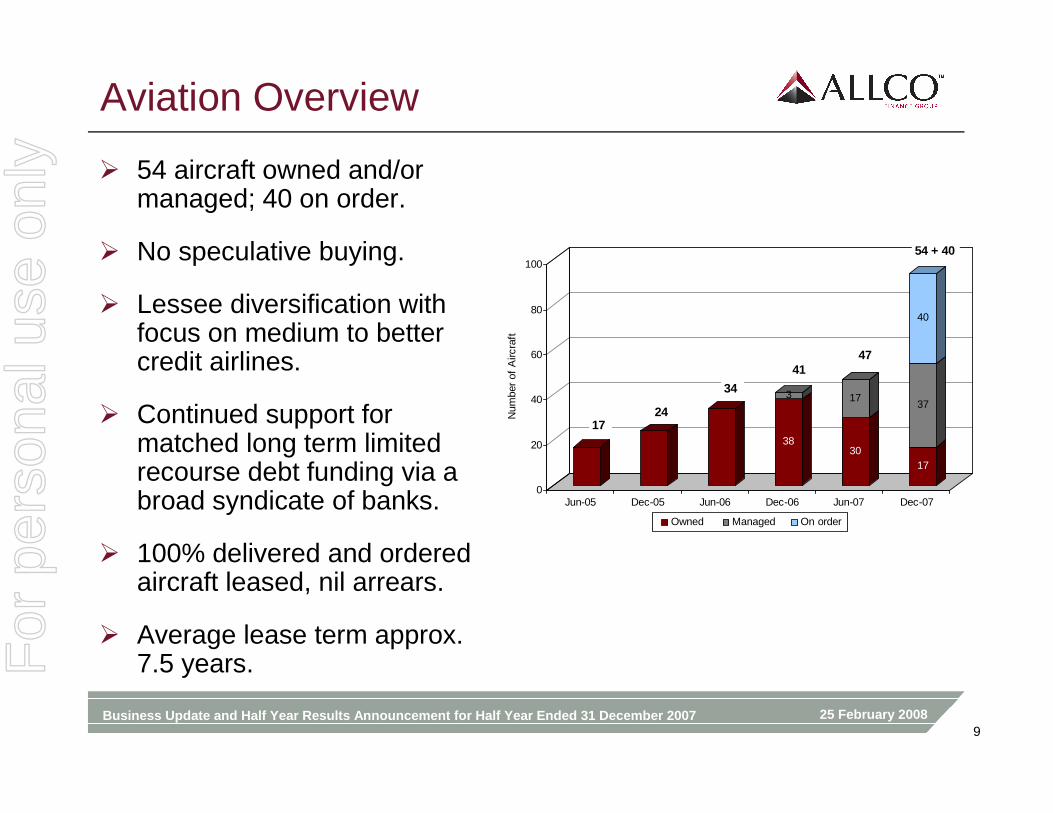
� 54 aircraft owned and/or managed; 40 on order.
� No speculative buying.
� Lessee diversification with focus on medium to better credit airlines.
� Continued support for matched long term limited recourse debt funding via a broad syndicate of banks.
� 100% delivered and ordered aircraft leased, nil arrears.
� Average lease term approx. 7.5 years.
38
3
30
17
17
37
40
0
20
40
60
80
100
Num
ber
of A
ircra
ftJun-05 Dec-05 Jun-06 Dec-06 Jun-07 Dec-07
Owned Managed On order
1724
34
54 + 40
4741
For
per
sona
l use
onl
y
25 February 2008Business Update and Half Year Results Announcement for Half Year Ended 31 December 200710
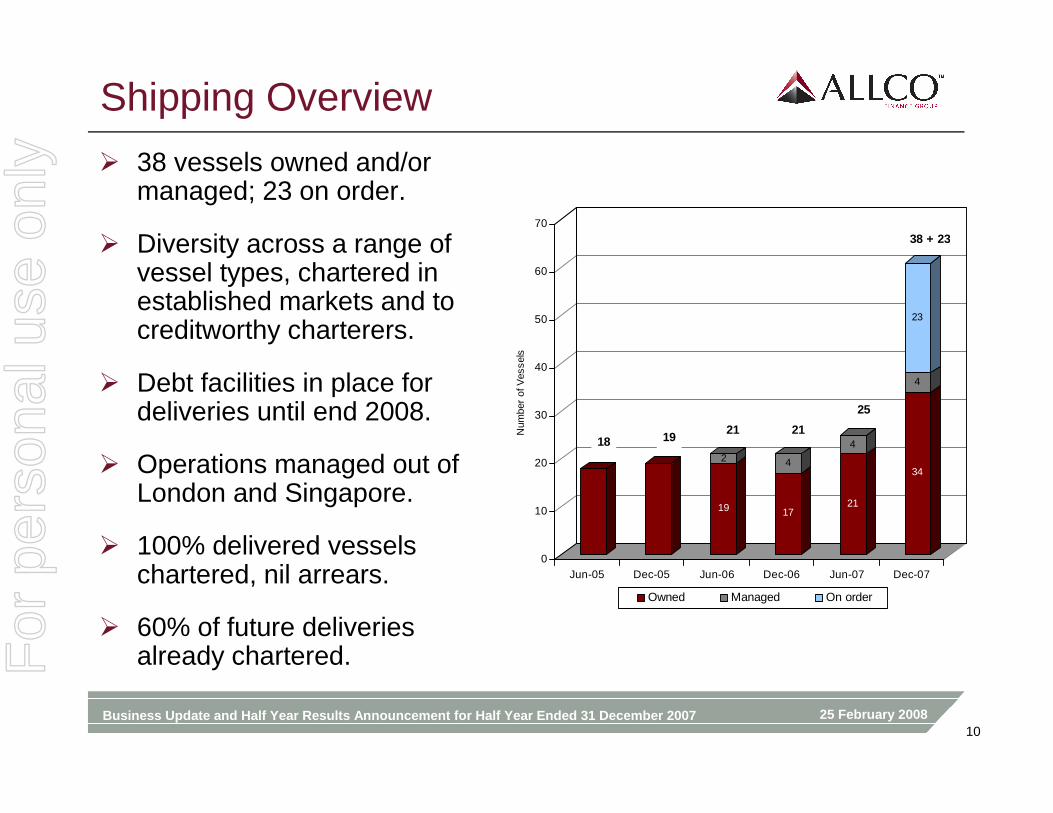
Shipping Overview
� 38 vessels owned and/or managed; 23 on order.
� Diversity across a range of vessel types, chartered in established markets and to creditworthy charterers.
� Debt facilities in place for deliveries until end 2008.
� Operations managed out of London and Singapore.
� 100% delivered vessels chartered, nil arrears.
� 60% of future deliveries already chartered.
19
2
17
4
21
4
34
4
23
0
10
20
30
40
50
60
70
Num
ber
of V
esse
ls
Jun-05 Dec-05 Jun-06 Dec-06 Jun-07 Dec-07
Owned Managed On order
21 21
38 + 23
25
18 19
For
per
sona
l use
onl
y
25 February 2008Business Update and Half Year Results Announcement for Half Year Ended 31 December 200711
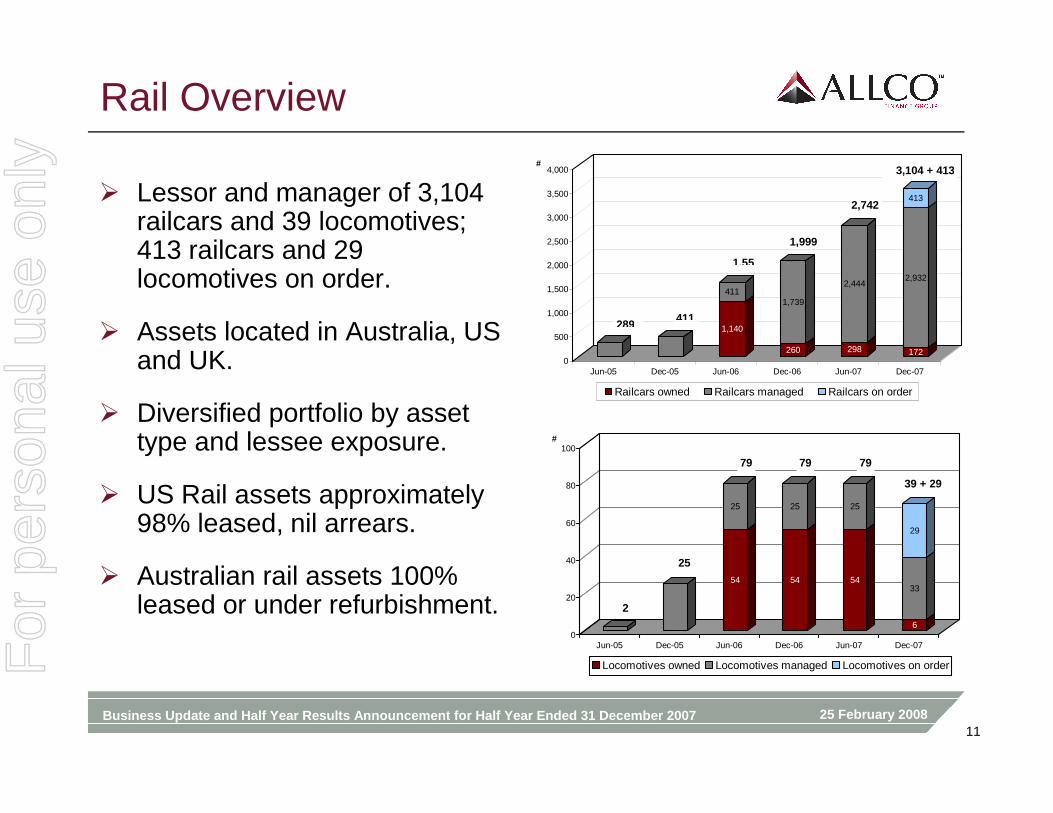
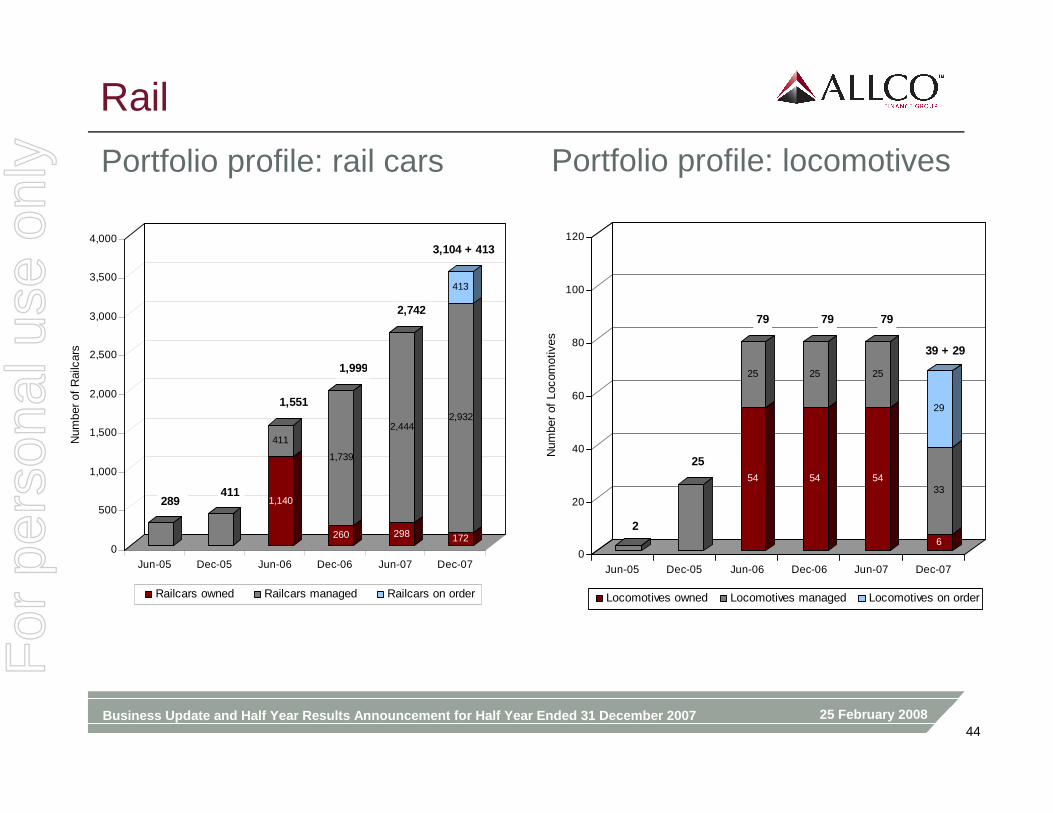
Rail Overview
� Lessor and manager of 3,104 railcars and 39 locomotives; 413 railcars and 29 locomotives on order.
� Assets located in Australia, US and UK.
� Diversified portfolio by asset type and lessee exposure.
� US Rail assets approximately 98% leased, nil arrears.
� Australian rail assets 100% leased or under refurbishment.
1,140
411
260
1,739
298
2,444
172
2,932
413
0
500
1,000
1,500
2,000
2,500
3,000
3,500
4,000#
Jun-05 Dec-05 Jun-06 Dec-06 Jun-07 Dec-07
Railcars owned Railcars managed Railcars on order
3,104 + 413
289 411
1,55
1,999
2,742
54
25
54
25
54
25
6
33
29
0
20
40
60
80
100#
Jun-05 Dec-05 Jun-06 Dec-06 Jun-07 Dec-07
Locomotives owned Locomotives managed Locomotives on order
39 + 29
2
25
79 79 79
For
per
sona
l use
onl
y
25 February 2008Business Update and Half Year Results Announcement for Half Year Ended 31 December 200712
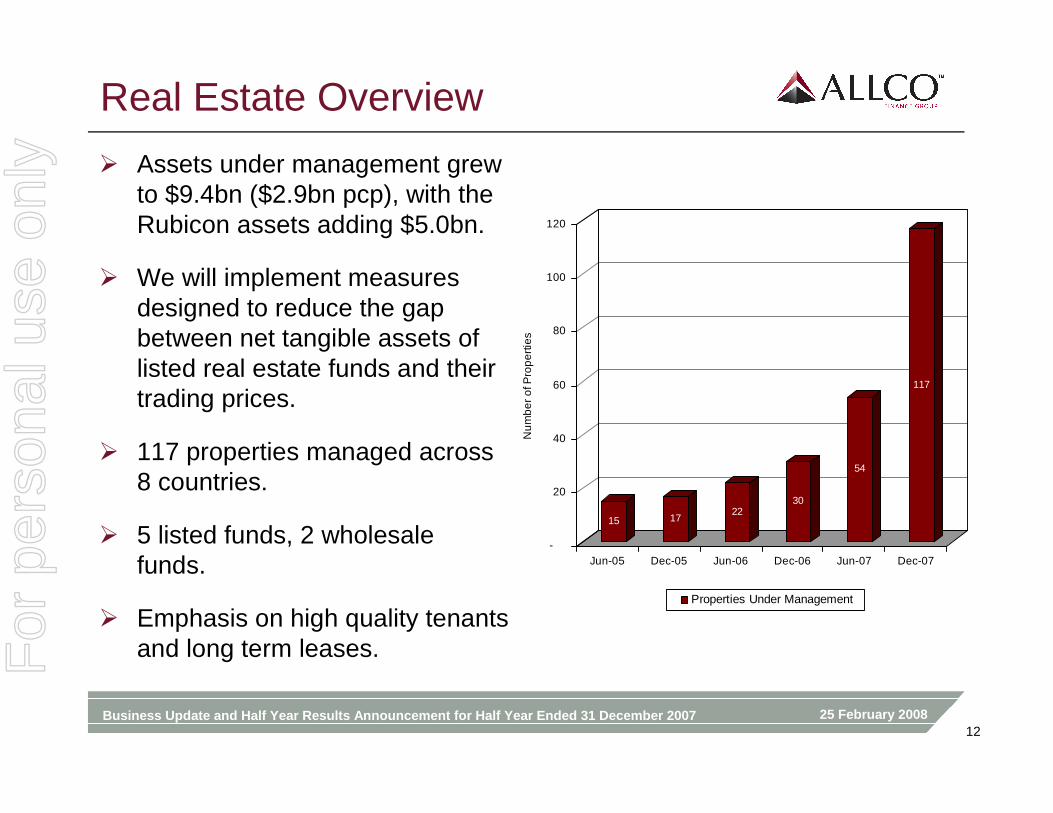
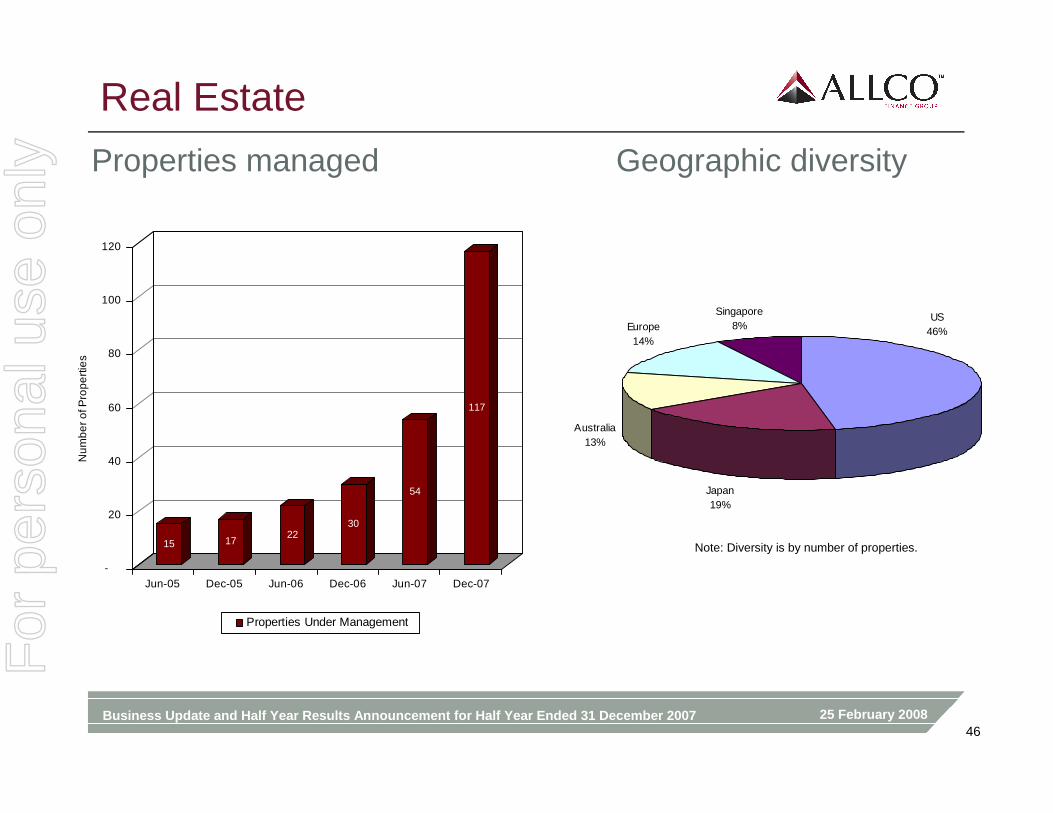
Real Estate Overview
� Assets under management grew to $9.4bn ($2.9bn pcp), with the Rubicon assets adding $5.0bn.
� We will implement measures designed to reduce the gap between net tangible assets of listed real estate funds and their trading prices.
� 117 properties managed across 8 countries.
� 5 listed funds, 2 wholesale funds.
� Emphasis on high quality tenants and long term leases.
15 1722
30
54
117
-
20
40
60
80
100
120
Nu
mb
er o
f Pro
per
ties
Jun-05 Dec-05 Jun-06 Dec-06 Jun-07 Dec-07
Properties Under Management
For
per
sona
l use
onl
y
25 February 2008Business Update and Half Year Results Announcement for Half Year Ended 31 December 200713
Agenda
1. Current Situation2. First Half Business Review
3.3. Financial PerformanceFinancial Performance4. Balance Sheet, Funding and Liquidity5. Summary6. Appendix
For
per
sona
l use
onl
y
25 February 2008Business Update and Half Year Results Announcement for Half Year Ended 31 December 200714
Financial Overview
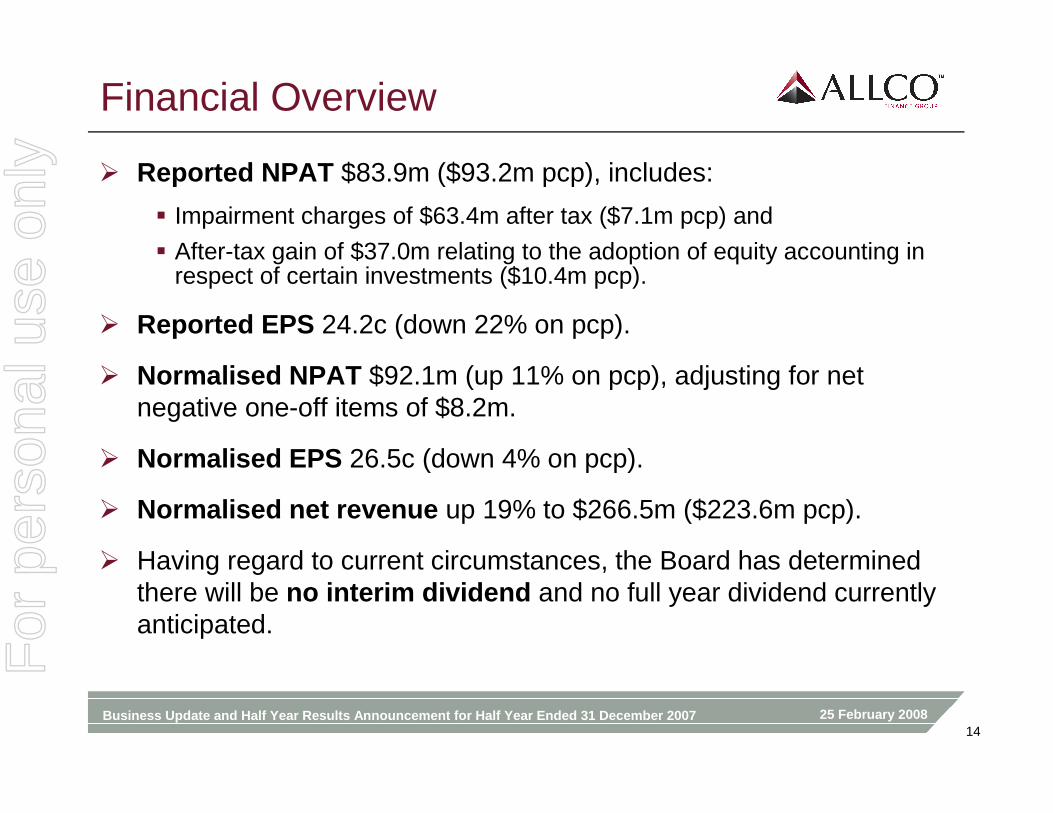
� Reported NPAT $83.9m ($93.2m pcp), includes:
� Impairment charges of $63.4m after tax ($7.1m pcp) and
� After-tax gain of $37.0m relating to the adoption of equity accounting in respect of certain investments ($10.4m pcp).
� Reported EPS 24.2c (down 22% on pcp).
� Normalised NPAT $92.1m (up 11% on pcp), adjusting for net negative one-off items of $8.2m.
� Normalised EPS 26.5c (down 4% on pcp).
� Normalised net revenue up 19% to $266.5m ($223.6m pcp).
� Having regard to current circumstances, the Board has determinedthere will be no interim dividend and no full year dividend currently anticipated.
For
per
sona
l use
onl
y
25 February 2008Business Update and Half Year Results Announcement for Half Year Ended 31 December 200715
Summary Financials (normalised)
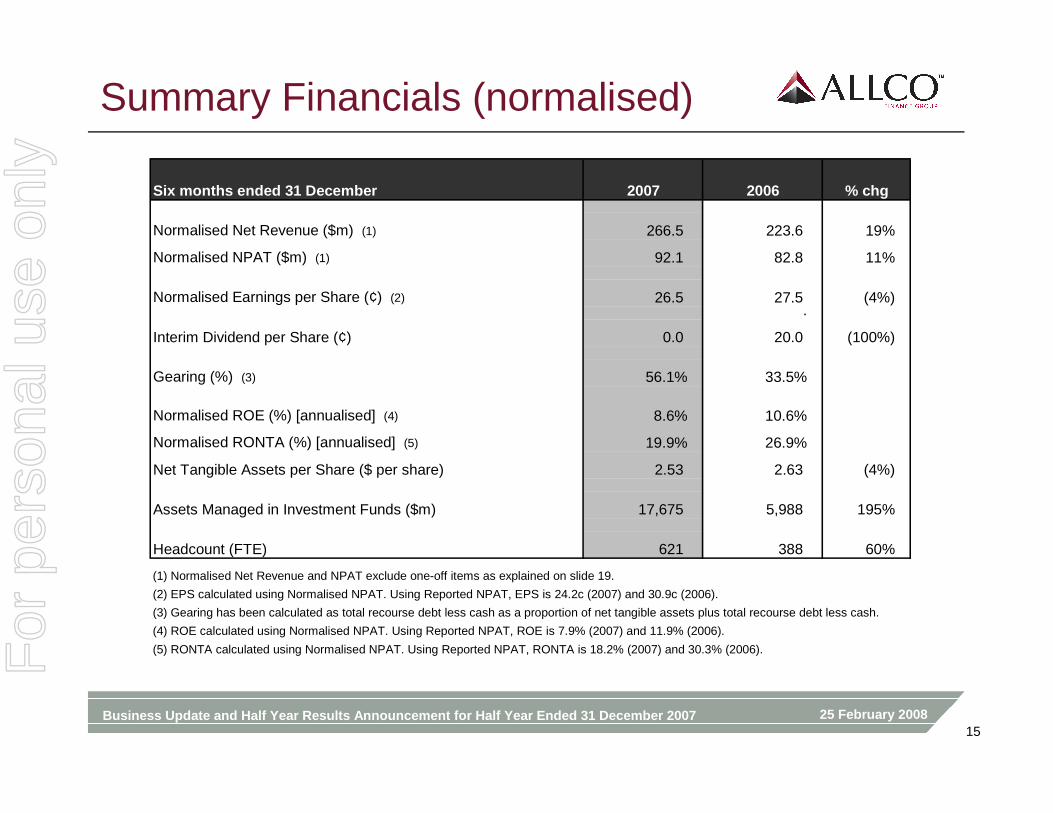
Six months ended 31 December 2007 2006 % chg
Normalised Net Revenue ($m) (1) 266.5 223.6 19%
Normalised NPAT ($m) (1) 92.1 82.8 11%
Normalised Earnings per Share (¢) (2) 26.5 27.5 (4%).
Interim Dividend per Share (¢) 0.0 20.0 (100%)
Gearing (%) (3) 56.1% 33.5%
Normalised ROE (%) [annualised] (4) 8.6% 10.6%
Normalised RONTA (%) [annualised] (5) 19.9% 26.9%
Net Tangible Assets per Share ($ per share) 2.53 2.63 (4%)
Assets Managed in Investment Funds ($m) 17,675 5,988 195%
Headcount (FTE) 621 388 60%
(1) Normalised Net Revenue and NPAT exclude one-off items as explained on slide 19.
(2) EPS calculated using Normalised NPAT. Using Reported NPAT, EPS is 24.2c (2007) and 30.9c (2006).
(3) Gearing has been calculated as total recourse debt less cash as a proportion of net tangible assets plus total recourse debt less cash.
(4) ROE calculated using Normalised NPAT. Using Reported NPAT, ROE is 7.9% (2007) and 11.9% (2006).
(5) RONTA calculated using Normalised NPAT. Using Reported NPAT, RONTA is 18.2% (2007) and 30.3% (2006).For
per
sona
l use
onl
y
25 February 2008Business Update and Half Year Results Announcement for Half Year Ended 31 December 200716
Movement in Normalised Earnings
Six months ended 31 December$m % chg
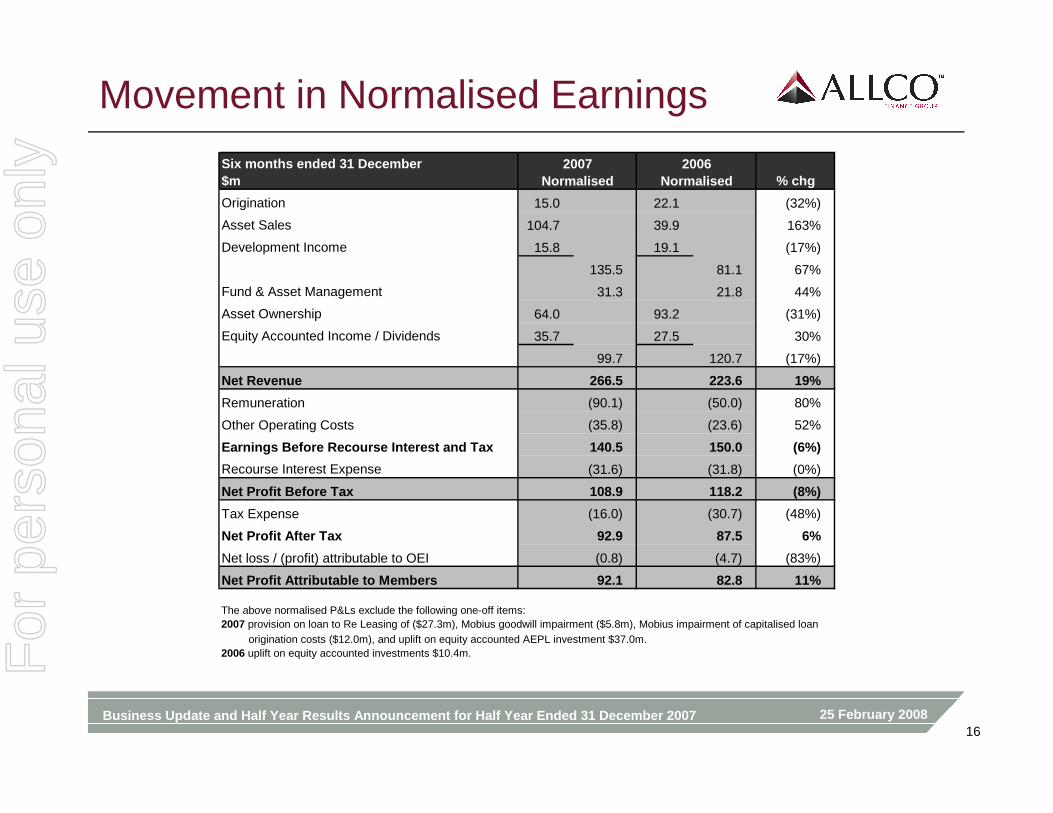
Origination 15.0 22.1 (32%)
Asset Sales 104.7 39.9 163%
Development Income 15.8 19.1 (17%)
135.5 81.1 67%
Fund & Asset Management 31.3 21.8 44%
Asset Ownership 64.0 93.2 (31%)
Equity Accounted Income / Dividends 35.7 27.5 30%
99.7 120.7 (17%)
Net Revenue 266.5 223.6 19%
Remuneration (90.1) (50.0) 80%
Other Operating Costs (35.8) (23.6) 52%
Earnings Before Recourse Interest and Tax 140.5 150.0 (6%)
Recourse Interest Expense (31.6) (31.8) (0%)
Net Profit Before Tax 108.9 118.2 (8%)
Tax Expense (16.0) (30.7) (48%)
Net Profit After Tax 92.9 87.5 6%
Net loss / (profit) attributable to OEI (0.8) (4.7) (83%)
Net Profit Attributable to Members 92.1 82.8 11%
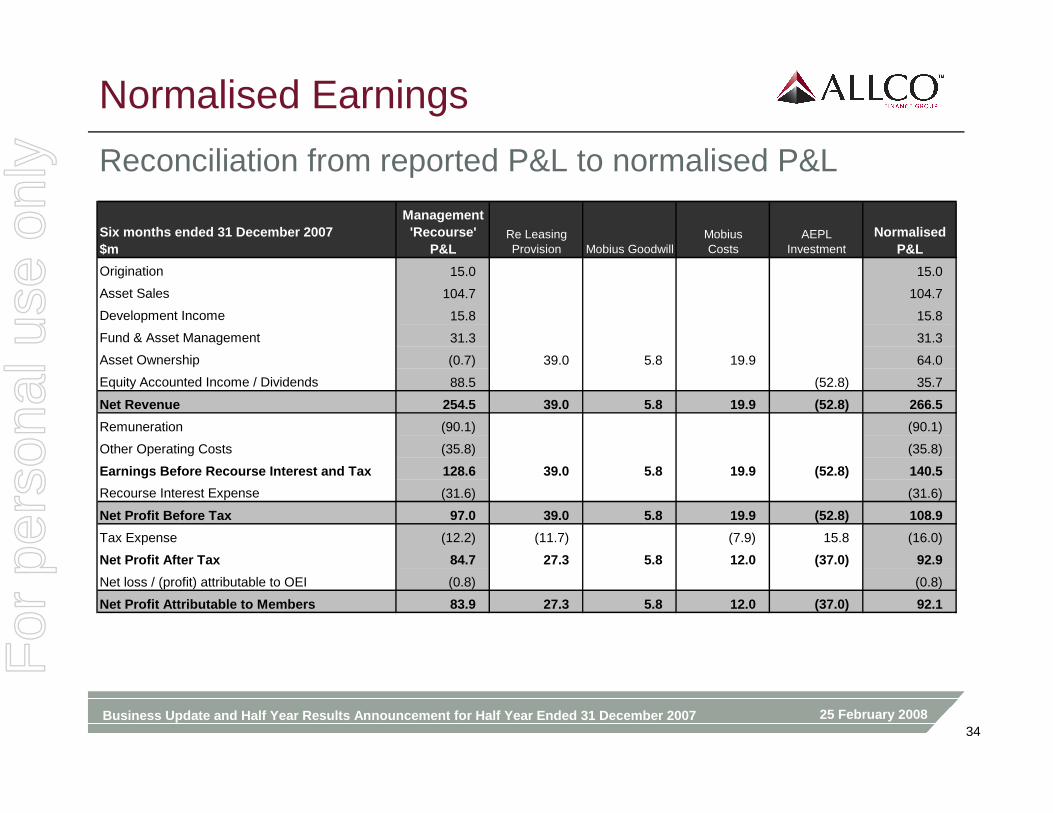
The above normalised P&Ls exclude the following one-off items:2007 provision on loan to Re Leasing of ($27.3m), Mobius goodwill impairment ($5.8m), Mobius impairment of capitalised loan origination costs ($12.0m), and uplift on equity accounted AEPL investment $37.0m.2006 uplift on equity accounted investments $10.4m.
2007Normalised
2006Normalised
For
per
sona
l use
onl
y
25 February 2008Business Update and Half Year Results Announcement for Half Year Ended 31 December 200717
Net Revenue Movements
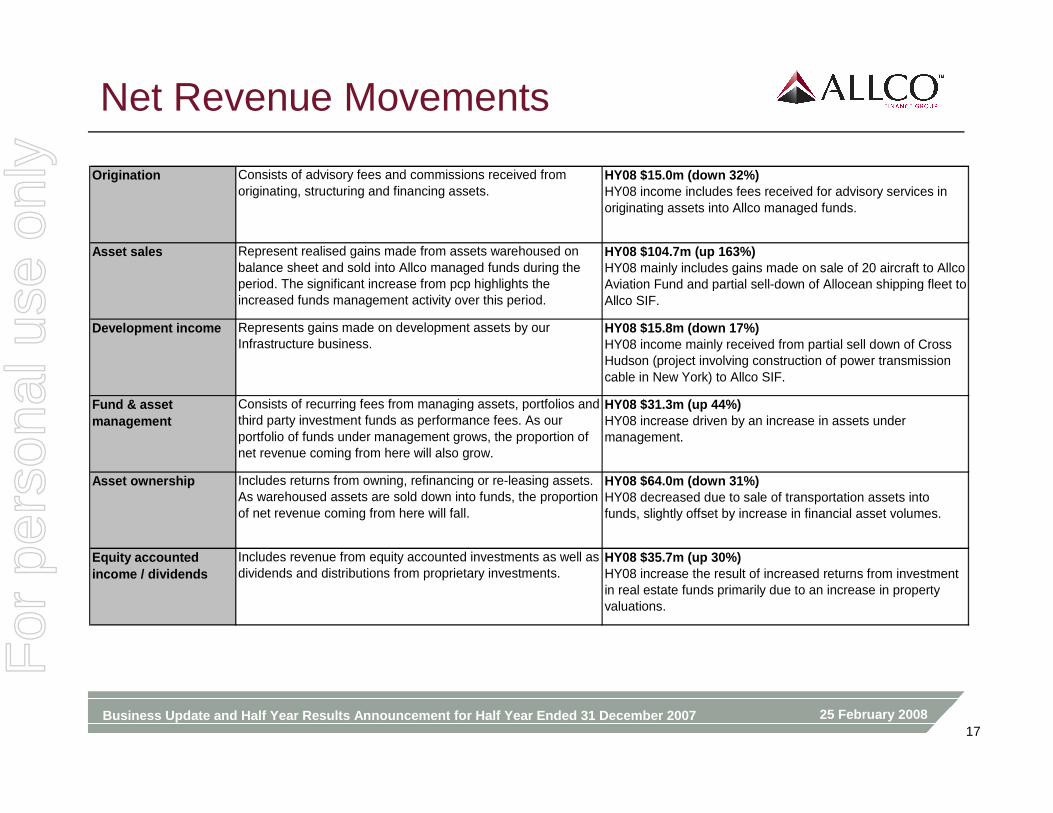
Origination Consists of advisory fees and commissions received from originating, structuring and financing assets.
HY08 $15.0m (down 32%)HY08 income includes fees received for advisory services in originating assets into Allco managed funds.
Asset sales Represent realised gains made from assets warehoused on balance sheet and sold into Allco managed funds during the period. The significant increase from pcp highlights the increased funds management activity over this period.
HY08 $104.7m (up 163%)HY08 mainly includes gains made on sale of 20 aircraft to Allco Aviation Fund and partial sell-down of Allocean shipping fleet to Allco SIF.
Development income Represents gains made on development assets by our Infrastructure business.
HY08 $15.8m (down 17%)HY08 income mainly received from partial sell down of Cross Hudson (project involving construction of power transmission cable in New York) to Allco SIF.
Fund & asset management
Consists of recurring fees from managing assets, portfolios and third party investment funds as performance fees. As our portfolio of funds under management grows, the proportion of net revenue coming from here will also grow.
HY08 $31.3m (up 44%)HY08 increase driven by an increase in assets under management.
Asset ownership Includes returns from owning, refinancing or re-leasing assets. As warehoused assets are sold down into funds, the proportion of net revenue coming from here will fall.
HY08 $64.0m (down 31%)HY08 decreased due to sale of transportation assets into funds, slightly offset by increase in financial asset volumes.
Equity accounted income / dividends
Includes revenue from equity accounted investments as well as dividends and distributions from proprietary investments.
HY08 $35.7m (up 30%)HY08 increase the result of increased returns from investment in real estate funds primarily due to an increase in property valuations.
For
per
sona
l use
onl
y
25 February 2008Business Update and Half Year Results Announcement for Half Year Ended 31 December 200718
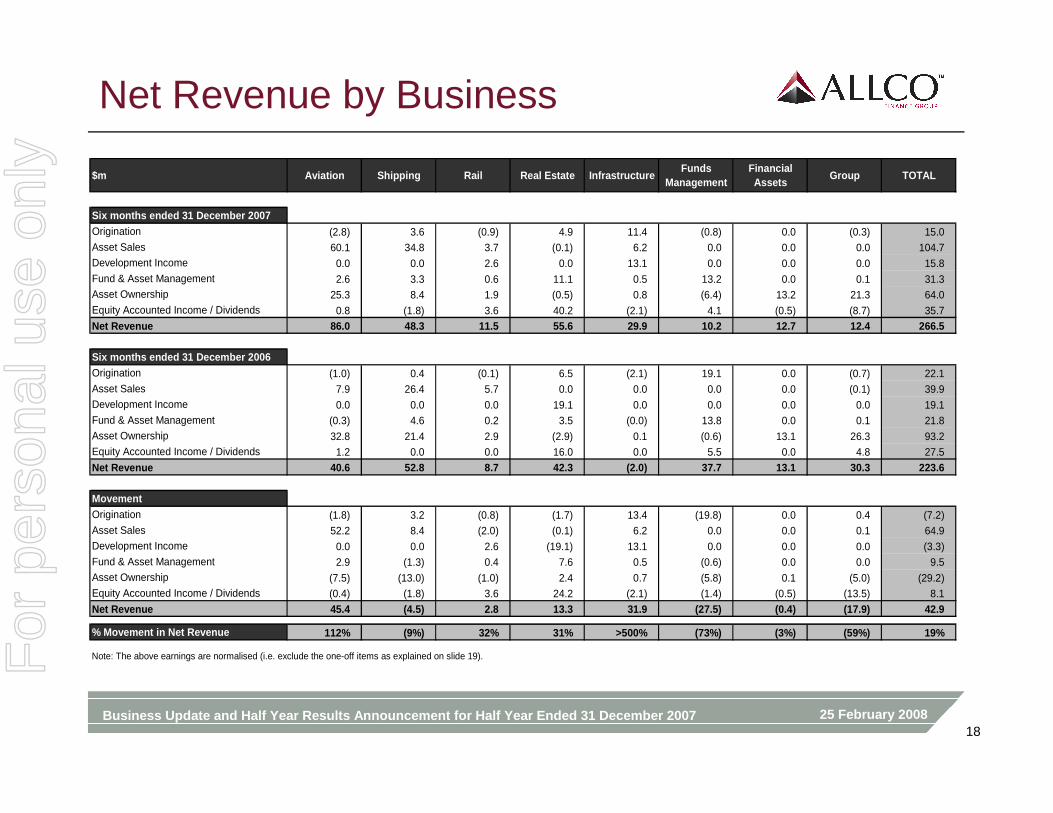
Net Revenue by Business
$m Aviation Shipping Rail Real Estate InfrastructureFunds
ManagementFinancial Assets
Group TOTAL
Six months ended 31 December 2007Origination (2.8) 3.6 (0.9) 4.9 11.4 (0.8) 0.0 (0.3) 15.0Asset Sales 60.1 34.8 3.7 (0.1) 6.2 0.0 0.0 0.0 104.7Development Income 0.0 0.0 2.6 0.0 13.1 0.0 0.0 0.0 15.8Fund & Asset Management 2.6 3.3 0.6 11.1 0.5 13.2 0.0 0.1 31.3Asset Ownership 25.3 8.4 1.9 (0.5) 0.8 (6.4) 13.2 21.3 64.0Equity Accounted Income / Dividends 0.8 (1.8) 3.6 40.2 (2.1) 4.1 (0.5) (8.7) 35.7Net Revenue 86.0 48.3 11.5 55.6 29.9 10.2 12.7 12.4 266.5
Six months ended 31 December 2006Origination (1.0) 0.4 (0.1) 6.5 (2.1) 19.1 0.0 (0.7) 22.1Asset Sales 7.9 26.4 5.7 0.0 0.0 0.0 0.0 (0.1) 39.9Development Income 0.0 0.0 0.0 19.1 0.0 0.0 0.0 0.0 19.1Fund & Asset Management (0.3) 4.6 0.2 3.5 (0.0) 13.8 0.0 0.1 21.8Asset Ownership 32.8 21.4 2.9 (2.9) 0.1 (0.6) 13.1 26.3 93.2Equity Accounted Income / Dividends 1.2 0.0 0.0 16.0 0.0 5.5 0.0 4.8 27.5
Net Revenue 40.6 52.8 8.7 42.3 (2.0) 37.7 13.1 30.3 223.6
MovementOrigination (1.8) 3.2 (0.8) (1.7) 13.4 (19.8) 0.0 0.4 (7.2)Asset Sales 52.2 8.4 (2.0) (0.1) 6.2 0.0 0.0 0.1 64.9Development Income 0.0 0.0 2.6 (19.1) 13.1 0.0 0.0 0.0 (3.3)Fund & Asset Management 2.9 (1.3) 0.4 7.6 0.5 (0.6) 0.0 0.0 9.5Asset Ownership (7.5) (13.0) (1.0) 2.4 0.7 (5.8) 0.1 (5.0) (29.2)Equity Accounted Income / Dividends (0.4) (1.8) 3.6 24.2 (2.1) (1.4) (0.5) (13.5) 8.1
Net Revenue 45.4 (4.5) 2.8 13.3 31.9 (27.5) (0.4) (17.9) 42.9
% Movement in Net Revenue 112% (9%) 32% 31% >500% (73%) (3%) (59%) 19%
Note: The above earnings are normalised (i.e. exclude the one-off items as explained on slide 19).For
per
sona
l use
onl
y
25 February 2008Business Update and Half Year Results Announcement for Half Year Ended 31 December 200719
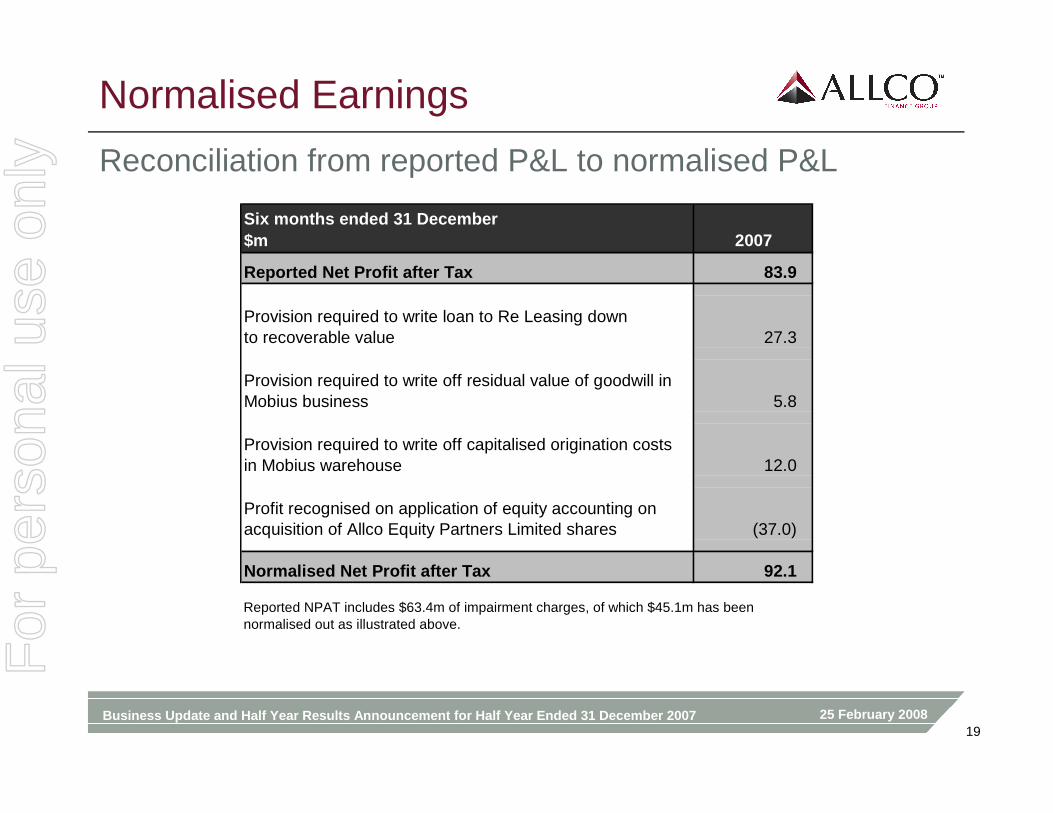
Normalised Earnings
Reconciliation from reported P&L to normalised P&L
Six months ended 31 December$m 2007
Reported Net Profit after Tax 83.9
Provision required to write loan to Re Leasing downto recoverable value 27.3
Provision required to write off residual value of goodwill in Mobius business 5.8
Provision required to write off capitalised origination costs in Mobius warehouse 12.0
Profit recognised on application of equity accounting on acquisition of Allco Equity Partners Limited shares (37.0)
Normalised Net Profit after Tax 92.1
Reported NPAT includes $63.4m of impairment charges, of which $45.1m has been normalised out as illustrated above.
For
per
sona
l use
onl
y
25 February 2008Business Update and Half Year Results Announcement for Half Year Ended 31 December 200720
Agenda
1. Current Situation2. First Half Business Review3. Financial Performance
4.4. Balance Sheet, Funding and LiquidityBalance Sheet, Funding and Liquidity5. Summary6. Appendix
For
per
sona
l use
onl
y
25 February 2008Business Update and Half Year Results Announcement for Half Year Ended 31 December 200721
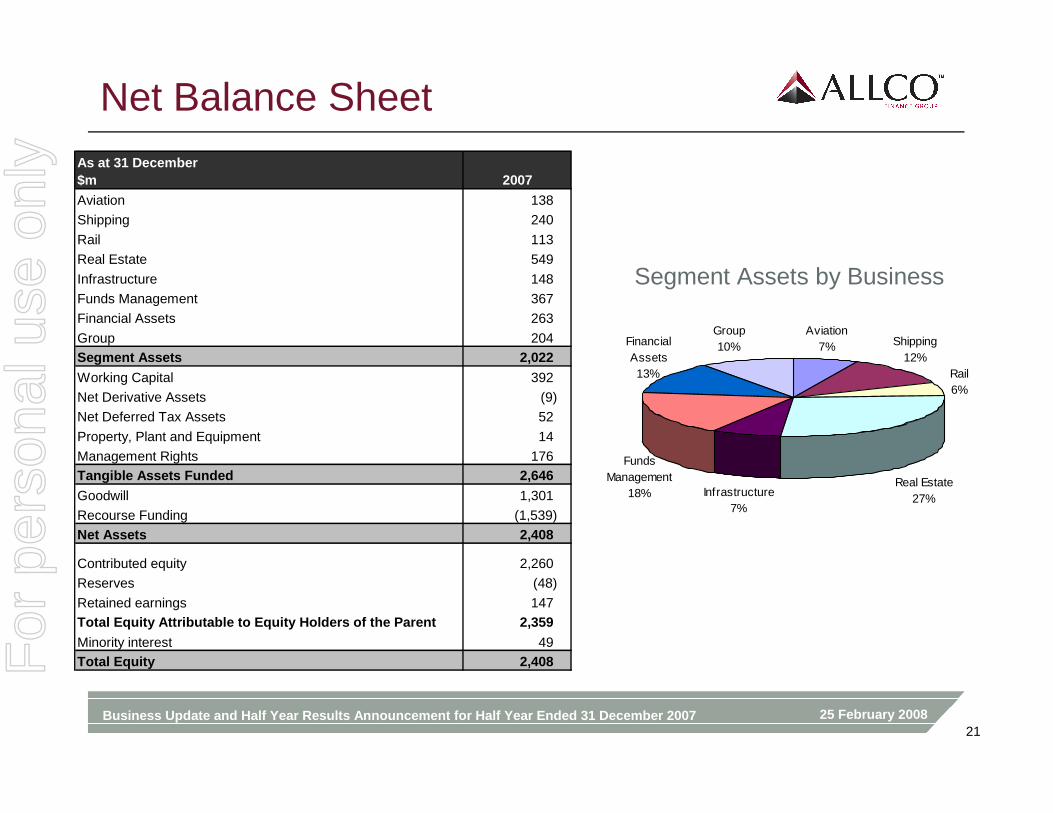
Net Balance SheetAs at 31 December$m 2007
Aviation 138
Shipping 240
Rail 113
Real Estate 549
Infrastructure 148
Funds Management 367
Financial Assets 263
Group 204 Segment Assets 2,022
Working Capital 392
Net Derivative Assets (9)
Net Deferred Tax Assets 52
Property, Plant and Equipment 14
Management Rights 176 Tangible Assets Funded 2,646
Goodwill 1,301
Recourse Funding (1,539)Net Assets 2,408
Contributed equity 2,260
Reserves (48)
Retained earnings 147 Total Equity Attributable to Equity Holders of the Parent 2,359
Minority interest 49 Total Equity 2,408
Group10%
Real Estate27%Infrastructure
7%
Rail6%
Aviation7% Shipping
12%Financial Assets13%
Funds Management
18%
Segment Assets by Business
For
per
sona
l use
onl
y
25 February 2008Business Update and Half Year Results Announcement for Half Year Ended 31 December 200722
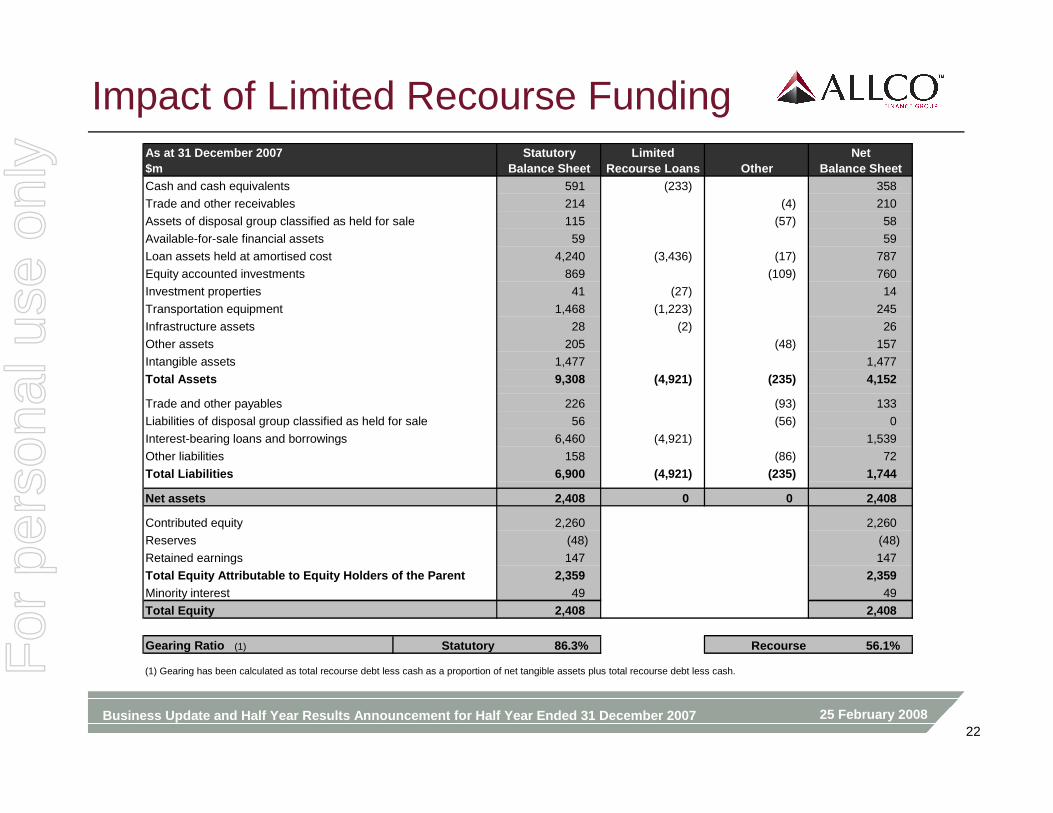
Impact of Limited Recourse FundingAs at 31 December 2007$m
StatutoryBalance Sheet
Limited Recourse Loans Other
NetBalance Sheet
Cash and cash equivalents 591 (233) 358
Trade and other receivables 214 (4) 210
Assets of disposal group classified as held for sale 115 (57) 58
Available-for-sale financial assets 59 59
Loan assets held at amortised cost 4,240 (3,436) (17) 787
Equity accounted investments 869 (109) 760
Investment properties 41 (27) 14
Transportation equipment 1,468 (1,223) 245
Infrastructure assets 28 (2) 26
Other assets 205 (48) 157
Intangible assets 1,477 1,477
Total Assets 9,308 (4,921) (235) 4,152
Trade and other payables 226 (93) 133
Liabilities of disposal group classified as held for sale 56 (56) 0
Interest-bearing loans and borrowings 6,460 (4,921) 1,539
Other liabilities 158 (86) 72
Total Liabilities 6,900 (4,921) (235) 1,744
Net assets 2,408 0 0 2,408
Contributed equity 2,260 2,260
Reserves (48) (48)
Retained earnings 147 147
Total Equity Attributable to Equity Holders of the Parent 2,359 2,359 Minority interest 49 49
Total Equity 2,408 2,408
Gearing Ratio (1) Statutory 86.3% Recourse 56.1%
(1) Gearing has been calculated as total recourse debt less cash as a proportion of net tangible assets plus total recourse debt less cash.For
per
sona
l use
onl
y
25 February 2008Business Update and Half Year Results Announcement for Half Year Ended 31 December 200723
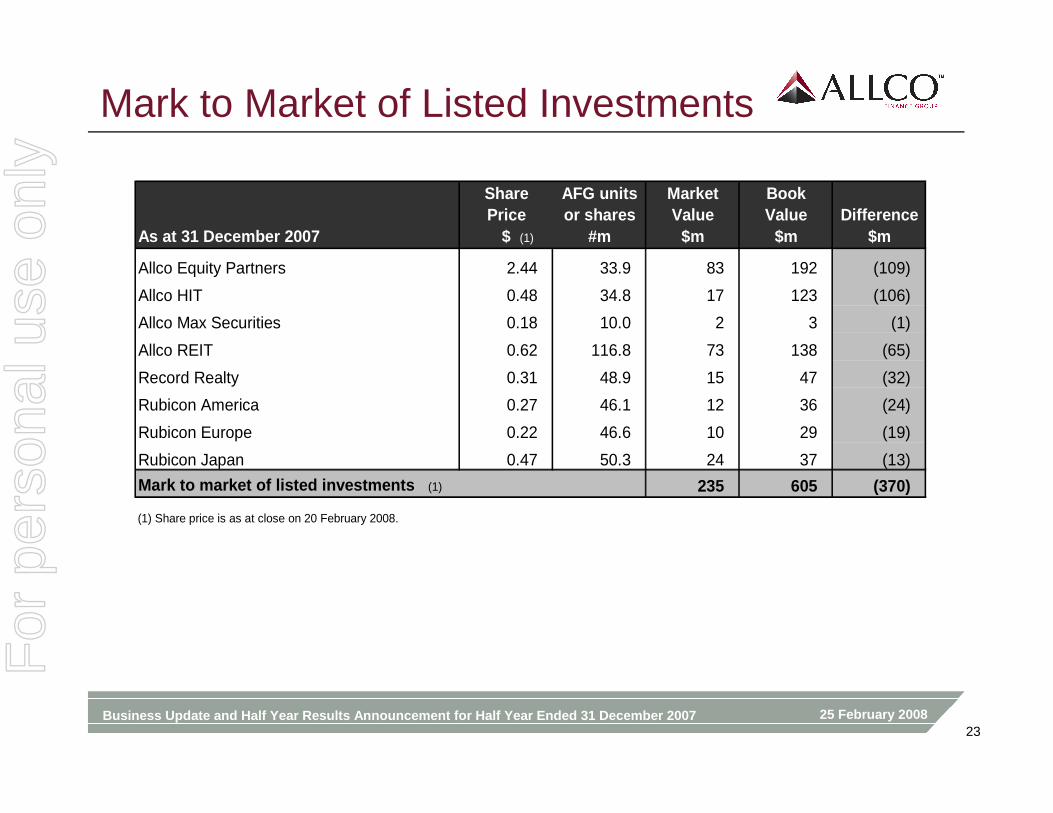
Mark to Market of Listed Investments
As at 31 December 2007
SharePrice
$ (1)
AFG unitsor shares
#m
MarketValue
$m
BookValue
$mDifference
$m
Allco Equity Partners 2.44 33.9 83 192 (109)
Allco HIT 0.48 34.8 17 123 (106)
Allco Max Securities 0.18 10.0 2 3 (1)
Allco REIT 0.62 116.8 73 138 (65)
Record Realty 0.31 48.9 15 47 (32)
Rubicon America 0.27 46.1 12 36 (24)
Rubicon Europe 0.22 46.6 10 29 (19)
Rubicon Japan 0.47 50.3 24 37 (13)
Mark to market of listed investments (1) 235 605 (370)
(1) Share price is as at close on 20 February 2008.
For
per
sona
l use
onl
y
25 February 2008Business Update and Half Year Results Announcement for Half Year Ended 31 December 200724
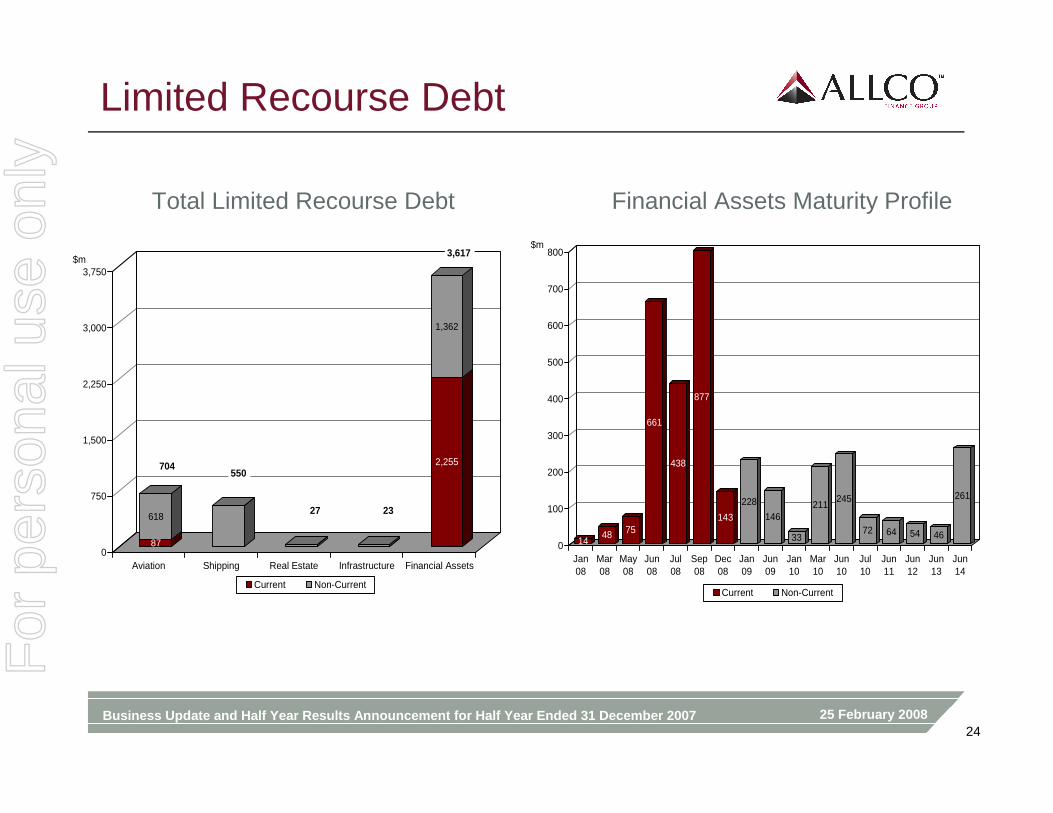
Limited Recourse Debt
Total Limited Recourse Debt Financial Assets Maturity Profile
87
618
2,255
1,362
0
750
1,500
2,250
3,000
3,750$m
Aviation Shipping Real Estate Infrastructure Financial Assets
Current Non-Current
704550
27 23
3,617
1448 75
661
438
877
143
228
146
33
211245
72 64 54 46
261
0
100
200
300
400
500
600
700
800$m
Jan08
Mar08
May08
Jun08
Jul08
Sep08
Dec08
Jan09
Jun09
Jan10
Mar10
Jun10
Jul10
Jun11
Jun12
Jun13
Jun14
Current Non-Current
For
per
sona
l use
onl
y
25 February 2008Business Update and Half Year Results Announcement for Half Year Ended 31 December 200725
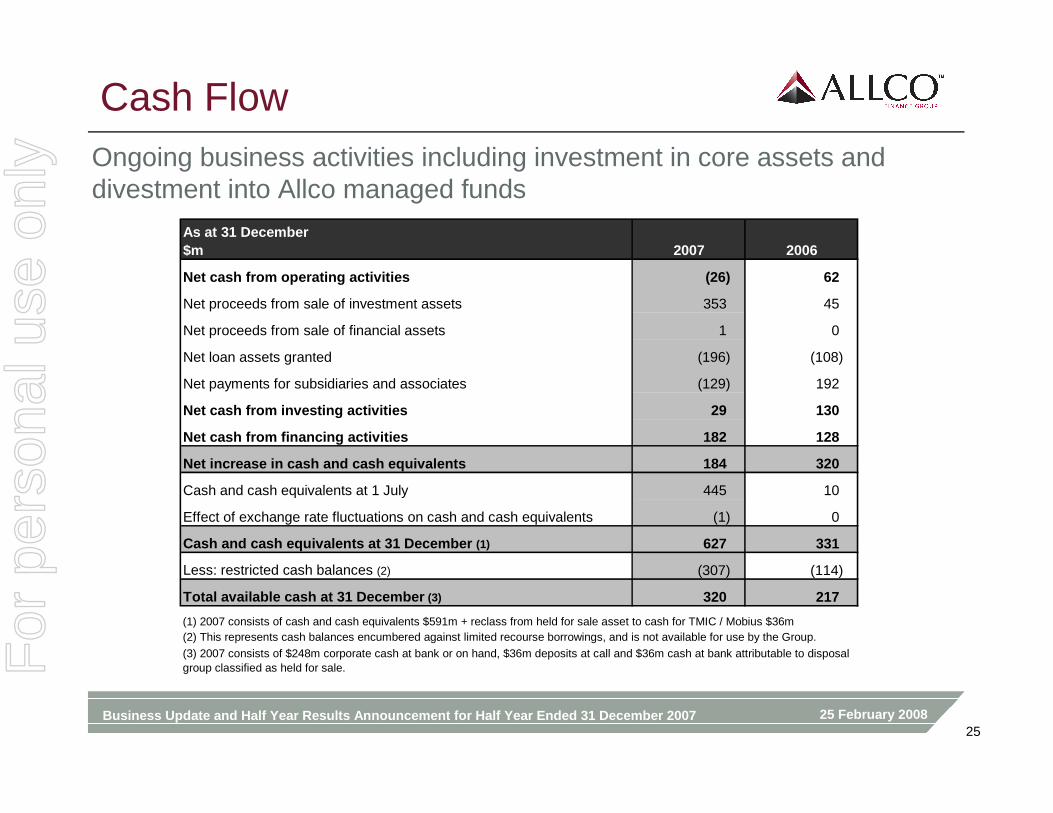
Cash FlowOngoing business activities including investment in core assets and divestment into Allco managed funds
As at 31 December$m 2007 2006
Net cash from operating activities (26) 62
Net proceeds from sale of investment assets 353 45
Net proceeds from sale of financial assets 1 0
Net loan assets granted (196) (108)
Net payments for subsidiaries and associates (129) 192
Net cash from investing activities 29 130
Net cash from financing activities 182 128
Net increase in cash and cash equivalents 184 320
Cash and cash equivalents at 1 July 445 10
Effect of exchange rate fluctuations on cash and cash equivalents (1) 0
Cash and cash equivalents at 31 December (1) 627 331
Less: restricted cash balances (2) (307) (114)
Total available cash at 31 December (3) 320 217
(1) 2007 consists of cash and cash equivalents $591m + reclass from held for sale asset to cash for TMIC / Mobius $36m(2) This represents cash balances encumbered against limited recourse borrowings, and is not available for use by the Group.
(3) 2007 consists of $248m corporate cash at bank or on hand, $36m deposits at call and $36m cash at bank attributable to disposal group classified as held for sale.For
per
sona
l use
onl
y
25 February 2008Business Update and Half Year Results Announcement for Half Year Ended 31 December 200726
Agenda
1. Current Situation2. First Half Business Review3. Financial Performance 4. Balance Sheet, Funding and Liquidity
5.5. SummarySummary6. Appendix
For
per
sona
l use
onl
y
25 February 2008Business Update and Half Year Results Announcement for Half Year Ended 31 December 200727
Summary
� Complete the development of and implement the business restructuring program:� Focus on our core asset classes of Aviation, Shipping, Rail and Real Estate.
� Exit the businesses of Infrastructure and Financial Assets, through an orderly program to sell and wind-back involvement in these activities.
� Undertake a targeted sale of non-core assets to reduce debt.
� Implement measures designed to reduce the gap between net tangible assets of listed real estate funds and their trading prices.
� Successfully restructure our senior banking facilities with support of our banks.
� Anticipate to have our debt at an acceptable level by June 2009.
� Build value from refocused operations.
For
per
sona
l use
onl
y

25 February 2008Business Update and Half Year Results Announcement for Half Year Ended 31 December 200728
BUSINESS UPDATE AND HALF YEAR RESULTS ANNOUNCEMENTHALF YEAR ENDED 31 DECEMBER 2007
THANK YOU
For
per
sona
l use
onl
y
25 February 2008Business Update and Half Year Results Announcement for Half Year Ended 31 December 200729
Agenda
1. Current Situation2. First Half Business Review3. Financial Performance 4. Balance Sheet, Funding and Liquidity5. Summary
6.6. AppendixAppendix
For
per
sona
l use
onl
y
25 February 2008Business Update and Half Year Results Announcement for Half Year Ended 31 December 200730
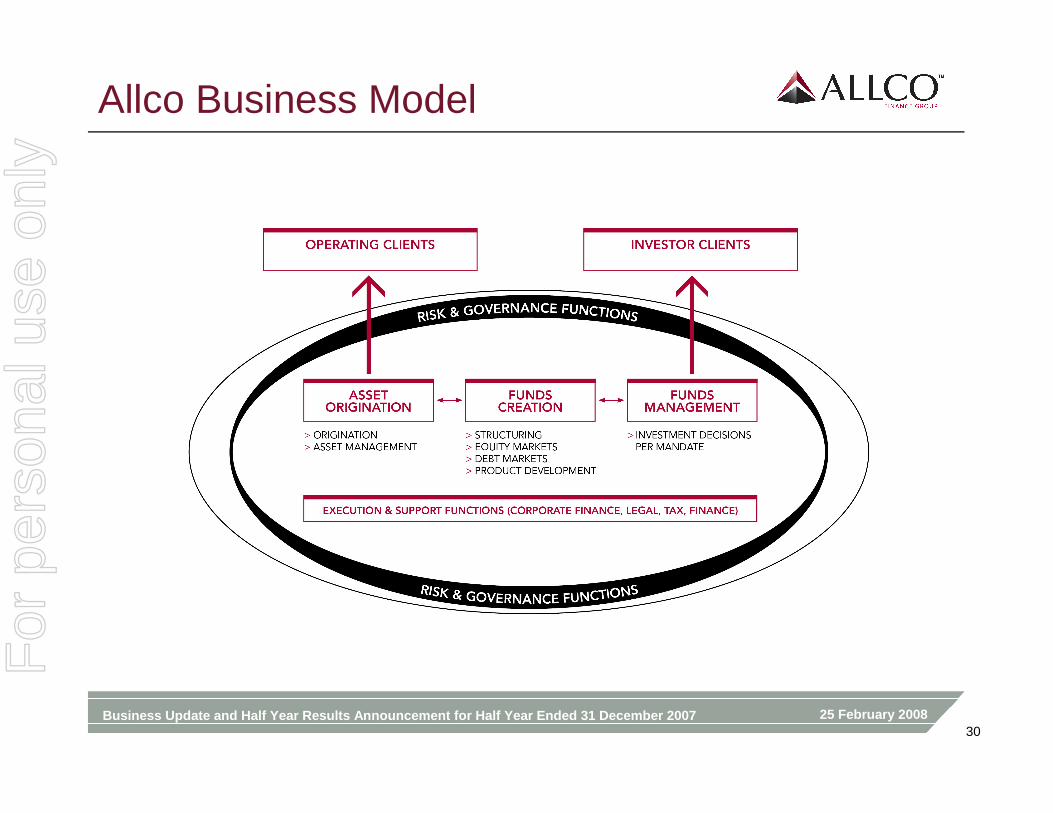
Allco Business Model
For
per
sona
l use
onl
y
25 February 2008Business Update and Half Year Results Announcement for Half Year Ended 31 December 200731
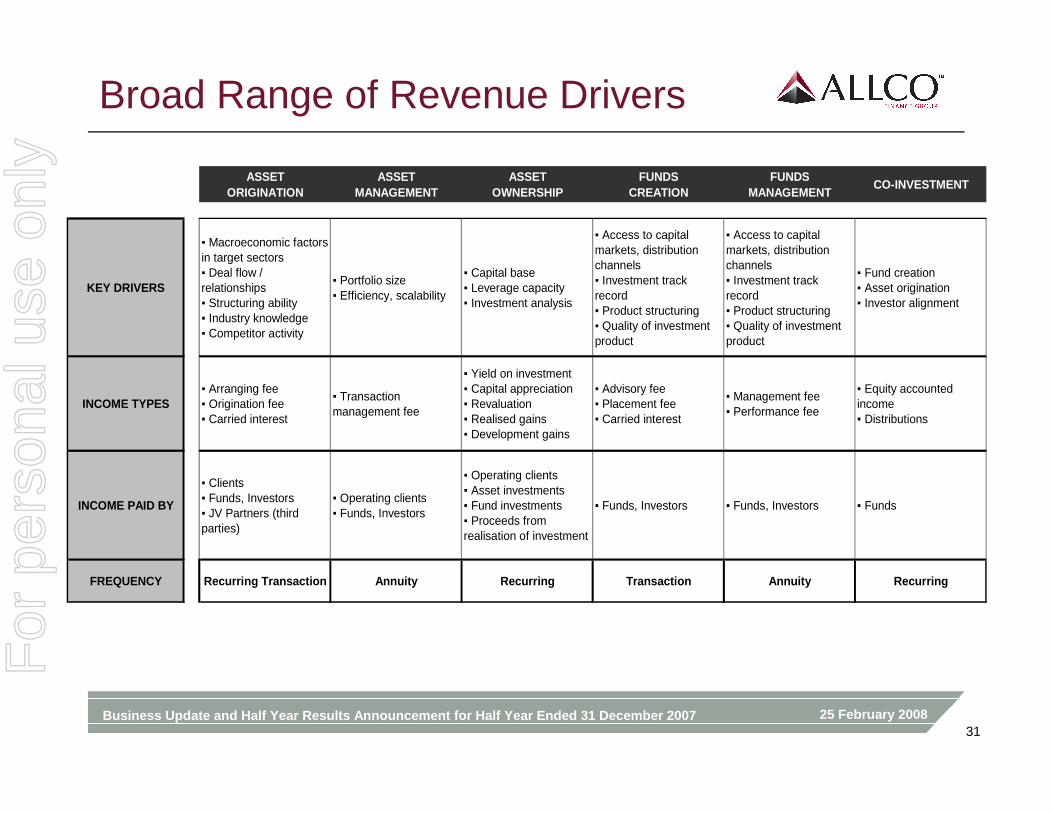
Broad Range of Revenue Drivers
ASSETORIGINATION
ASSETMANAGEMENT
ASSETOWNERSHIP
FUNDSCREATION
FUNDSMANAGEMENT
CO-INVESTMENT
KEY DRIVERS
▪ Macroeconomic factors in target sectors▪ Deal flow / relationships▪ Structuring ability▪ Industry knowledge▪ Competitor activity
▪ Portfolio size▪ Efficiency, scalability
▪ Capital base▪ Leverage capacity▪ Investment analysis
▪ Access to capital markets, distribution channels▪ Investment track record▪ Product structuring▪ Quality of investment product
▪ Access to capital markets, distribution channels▪ Investment track record▪ Product structuring▪ Quality of investment product
▪ Fund creation▪ Asset origination▪ Investor alignment
INCOME TYPES▪ Arranging fee▪ Origination fee▪ Carried interest
▪ Transaction management fee
▪ Yield on investment▪ Capital appreciation▪ Revaluation▪ Realised gains▪ Development gains
▪ Advisory fee▪ Placement fee▪ Carried interest
▪ Management fee▪ Performance fee
▪ Equity accounted income▪ Distributions
INCOME PAID BY
▪ Clients▪ Funds, Investors▪ JV Partners (third parties)
▪ Operating clients▪ Funds, Investors
▪ Operating clients▪ Asset investments▪ Fund investments▪ Proceeds from realisation of investment
▪ Funds, Investors ▪ Funds, Investors ▪ Funds
FREQUENCY Recurring Transaction Annuity Recurring Trans action Annuity Recurring
For
per
sona
l use
onl
y
25 February 2008Business Update and Half Year Results Announcement for Half Year Ended 31 December 200732
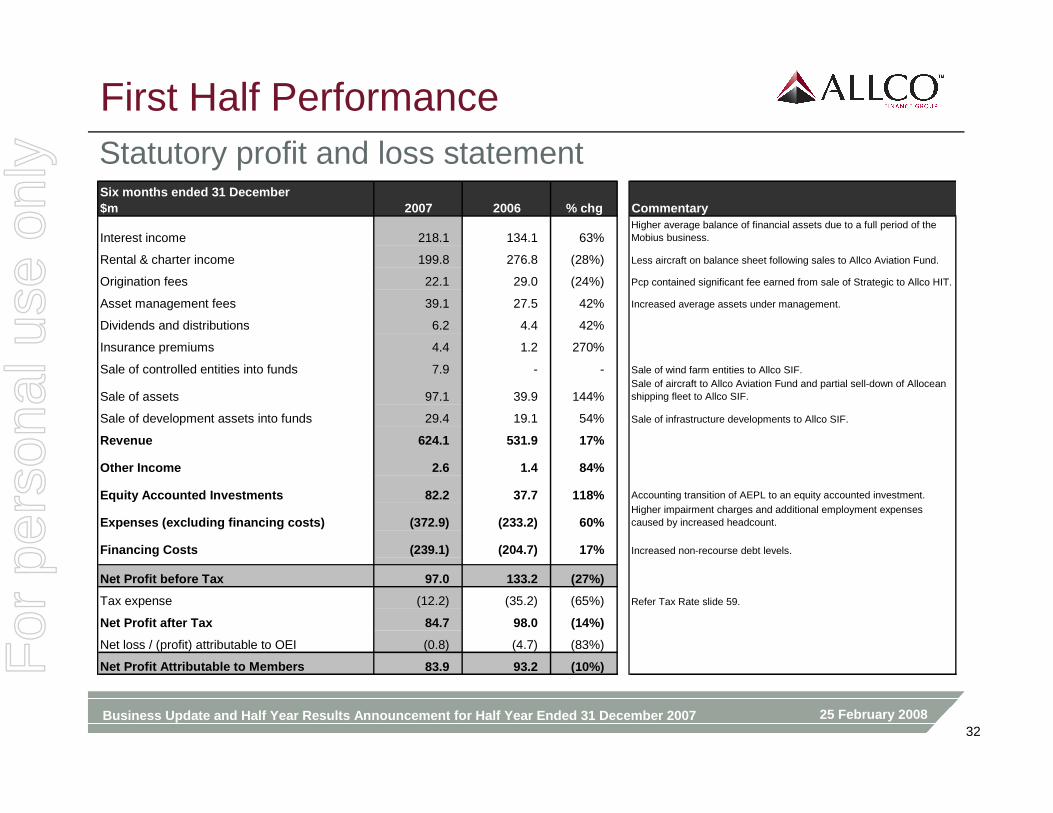
First Half PerformanceStatutory profit and loss statementSix months ended 31 December$m 2007 2006 % chg Commentary
Interest income 218.1 134.1 63%Higher average balance of financial assets due to a full period of the Mobius business.
Rental & charter income 199.8 276.8 (28%) Less aircraft on balance sheet following sales to Allco Aviation Fund.
Origination fees 22.1 29.0 (24%) Pcp contained significant fee earned from sale of Strategic to Allco HIT.
Asset management fees 39.1 27.5 42% Increased average assets under management.
Dividends and distributions 6.2 4.4 42%
Insurance premiums 4.4 1.2 270%
Sale of controlled entities into funds 7.9 - - Sale of wind farm entities to Allco SIF.
Sale of assets 97.1 39.9 144%Sale of aircraft to Allco Aviation Fund and partial sell-down of Allocean shipping fleet to Allco SIF.
Sale of development assets into funds 29.4 19.1 54% Sale of infrastructure developments to Allco SIF.
Revenue 624.1 531.9 17%
Other Income 2.6 1.4 84%
Equity Accounted Investments 82.2 37.7 118% Accounting transition of AEPL to an equity accounted investment.
Expenses (excluding financing costs) (372.9) (233.2) 6 0%Higher impairment charges and additional employment expenses caused by increased headcount.
Financing Costs (239.1) (204.7) 17% Increased non-recourse debt levels.
Net Profit before Tax 97.0 133.2 (27%)
Tax expense (12.2) (35.2) (65%) Refer Tax Rate slide 59.
Net Profit after Tax 84.7 98.0 (14%)
Net loss / (profit) attributable to OEI (0.8) (4.7) (83%)
Net Profit Attributable to Members 83.9 93.2 (10%)For
per
sona
l use
onl
y
25 February 2008Business Update and Half Year Results Announcement for Half Year Ended 31 December 200733
First Half Performance
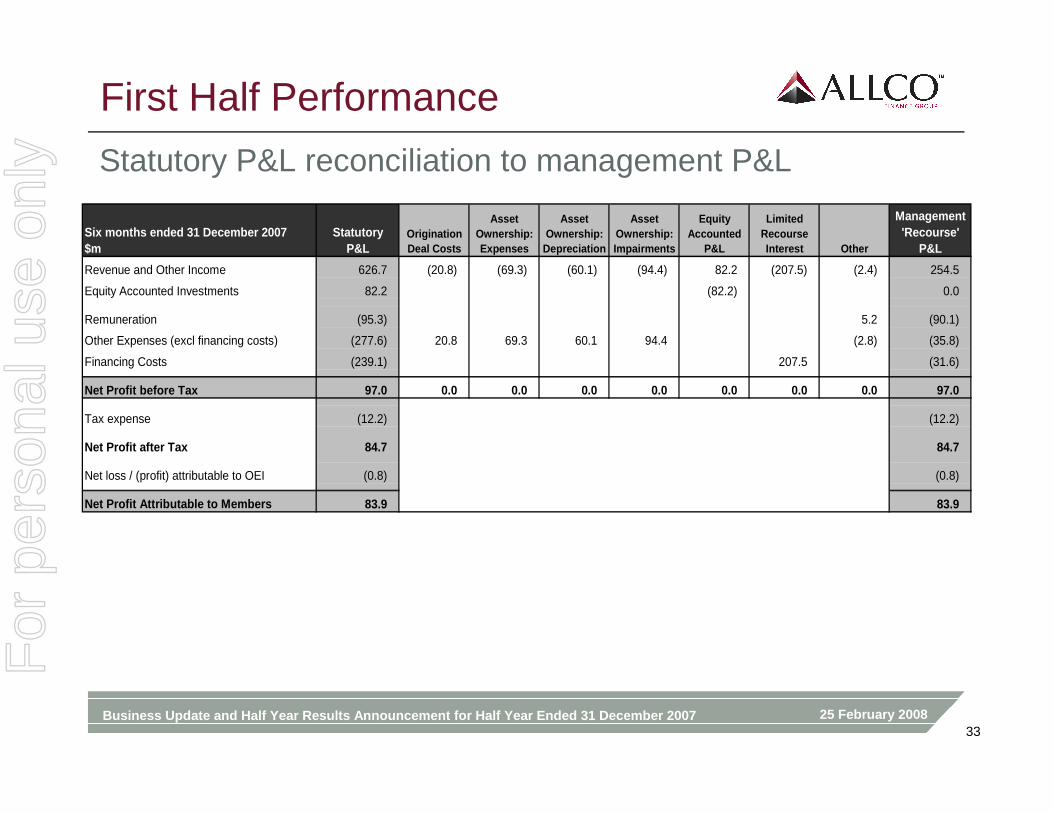
Statutory P&L reconciliation to management P&L
Six months ended 31 December 2007$m
StatutoryP&L
Origination Deal Costs
Asset Ownership: Expenses
Asset Ownership:
Depreciation
Asset Ownership: Impairments
Equity Accounted
P&L
Limited Recourse Interest Other
Management'Recourse'
P&L
Revenue and Other Income 626.7 (20.8) (69.3) (60.1) (94.4) 82.2 (207.5) (2.4) 254.5
Equity Accounted Investments 82.2 (82.2) 0.0
Remuneration (95.3) 5.2 (90.1)
Other Expenses (excl financing costs) (277.6) 20.8 69.3 60.1 94.4 (2.8) (35.8)
Financing Costs (239.1) 207.5 (31.6)
Net Profit before Tax 97.0 0.0 0.0 0.0 0.0 0.0 0.0 0.0 97.0
Tax expense (12.2) (12.2)
Net Profit after Tax 84.7 84.7
Net loss / (profit) attributable to OEI (0.8) (0.8)
Net Profit Attributable to Members 83.9 83.9
For
per
sona
l use
onl
y
25 February 2008Business Update and Half Year Results Announcement for Half Year Ended 31 December 200734
Normalised Earnings
Reconciliation from reported P&L to normalised P&L
Six months ended 31 December 2007$m
Management'Recourse'
P&LRe Leasing Provision Mobius Goodwill
MobiusCosts
AEPL Investment
NormalisedP&L
Origination 15.0 15.0
Asset Sales 104.7 104.7
Development Income 15.8 15.8
Fund & Asset Management 31.3 31.3
Asset Ownership (0.7) 39.0 5.8 19.9 64.0
Equity Accounted Income / Dividends 88.5 (52.8) 35.7
Net Revenue 254.5 39.0 5.8 19.9 (52.8) 266.5
Remuneration (90.1) (90.1)
Other Operating Costs (35.8) (35.8)
Earnings Before Recourse Interest and Tax 128.6 39.0 5 .8 19.9 (52.8) 140.5
Recourse Interest Expense (31.6) (31.6)
Net Profit Before Tax 97.0 39.0 5.8 19.9 (52.8) 108.9
Tax Expense (12.2) (11.7) (7.9) 15.8 (16.0)
Net Profit After Tax 84.7 27.3 5.8 12.0 (37.0) 92.9
Net loss / (profit) attributable to OEI (0.8) (0.8)
Net Profit Attributable to Members 83.9 27.3 5.8 12.0 (3 7.0) 92.1
For
per
sona
l use
onl
y
25 February 2008Business Update and Half Year Results Announcement for Half Year Ended 31 December 200735
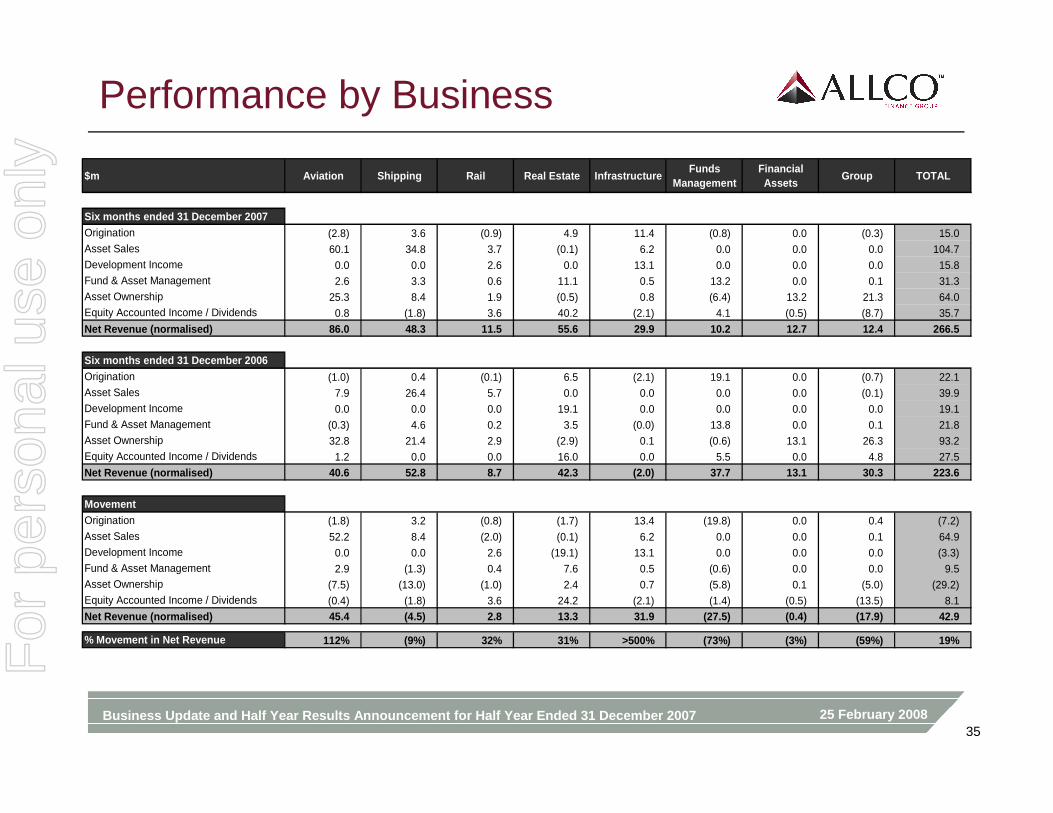
Performance by Business
$m Aviation Shipping Rail Real Estate InfrastructureFunds
ManagementFinancial Assets
Group TOTAL
Six months ended 31 December 2007Origination (2.8) 3.6 (0.9) 4.9 11.4 (0.8) 0.0 (0.3) 15.0Asset Sales 60.1 34.8 3.7 (0.1) 6.2 0.0 0.0 0.0 104.7Development Income 0.0 0.0 2.6 0.0 13.1 0.0 0.0 0.0 15.8Fund & Asset Management 2.6 3.3 0.6 11.1 0.5 13.2 0.0 0.1 31.3Asset Ownership 25.3 8.4 1.9 (0.5) 0.8 (6.4) 13.2 21.3 64.0Equity Accounted Income / Dividends 0.8 (1.8) 3.6 40.2 (2.1) 4.1 (0.5) (8.7) 35.7
Net Revenue (normalised) 86.0 48.3 11.5 55.6 29.9 10.2 12. 7 12.4 266.5
Six months ended 31 December 2006Origination (1.0) 0.4 (0.1) 6.5 (2.1) 19.1 0.0 (0.7) 22.1Asset Sales 7.9 26.4 5.7 0.0 0.0 0.0 0.0 (0.1) 39.9Development Income 0.0 0.0 0.0 19.1 0.0 0.0 0.0 0.0 19.1Fund & Asset Management (0.3) 4.6 0.2 3.5 (0.0) 13.8 0.0 0.1 21.8Asset Ownership 32.8 21.4 2.9 (2.9) 0.1 (0.6) 13.1 26.3 93.2Equity Accounted Income / Dividends 1.2 0.0 0.0 16.0 0.0 5.5 0.0 4.8 27.5Net Revenue (normalised) 40.6 52.8 8.7 42.3 (2.0) 37.7 13. 1 30.3 223.6
MovementOrigination (1.8) 3.2 (0.8) (1.7) 13.4 (19.8) 0.0 0.4 (7.2)Asset Sales 52.2 8.4 (2.0) (0.1) 6.2 0.0 0.0 0.1 64.9Development Income 0.0 0.0 2.6 (19.1) 13.1 0.0 0.0 0.0 (3.3)Fund & Asset Management 2.9 (1.3) 0.4 7.6 0.5 (0.6) 0.0 0.0 9.5Asset Ownership (7.5) (13.0) (1.0) 2.4 0.7 (5.8) 0.1 (5.0) (29.2)Equity Accounted Income / Dividends (0.4) (1.8) 3.6 24.2 (2.1) (1.4) (0.5) (13.5) 8.1Net Revenue (normalised) 45.4 (4.5) 2.8 13.3 31.9 (27.5) ( 0.4) (17.9) 42.9
% Movement in Net Revenue 112% (9%) 32% 31% >500% (73%) (3%) (59%) 19%For
per
sona
l use
onl
y
25 February 2008Business Update and Half Year Results Announcement for Half Year Ended 31 December 200736
Performance by Business
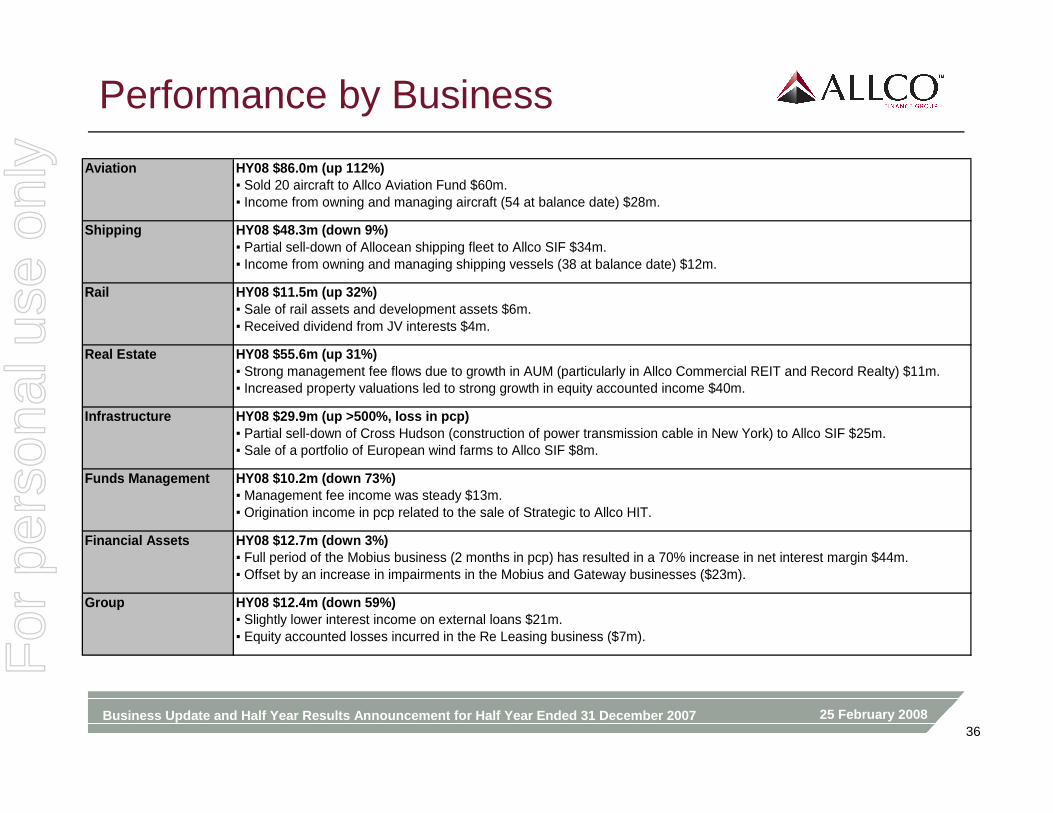
Aviation HY08 $86.0m (up 112%)▪ Sold 20 aircraft to Allco Aviation Fund $60m.▪ Income from owning and managing aircraft (54 at balance date) $28m.
Shipping HY08 $48.3m (down 9%)▪ Partial sell-down of Allocean shipping fleet to Allco SIF $34m.▪ Income from owning and managing shipping vessels (38 at balance date) $12m.
Rail HY08 $11.5m (up 32%)▪ Sale of rail assets and development assets $6m.▪ Received dividend from JV interests $4m.
Real Estate HY08 $55.6m (up 31%)▪ Strong management fee flows due to growth in AUM (particularly in Allco Commercial REIT and Record Realty) $11m.▪ Increased property valuations led to strong growth in equity accounted income $40m.
Infrastructure HY08 $29.9m (up >500%, loss in pcp)▪ Partial sell-down of Cross Hudson (construction of power transmission cable in New York) to Allco SIF $25m.▪ Sale of a portfolio of European wind farms to Allco SIF $8m.
Funds Management HY08 $10.2m (down 73%)▪ Management fee income was steady $13m.▪ Origination income in pcp related to the sale of Strategic to Allco HIT.
Financial Assets HY08 $12.7m (down 3%)▪ Full period of the Mobius business (2 months in pcp) has resulted in a 70% increase in net interest margin $44m.▪ Offset by an increase in impairments in the Mobius and Gateway businesses ($23m).
Group HY08 $12.4m (down 59%)▪ Slightly lower interest income on external loans $21m.▪ Equity accounted losses incurred in the Re Leasing business ($7m).
For
per
sona
l use
onl
y
25 February 2008Business Update and Half Year Results Announcement for Half Year Ended 31 December 200737
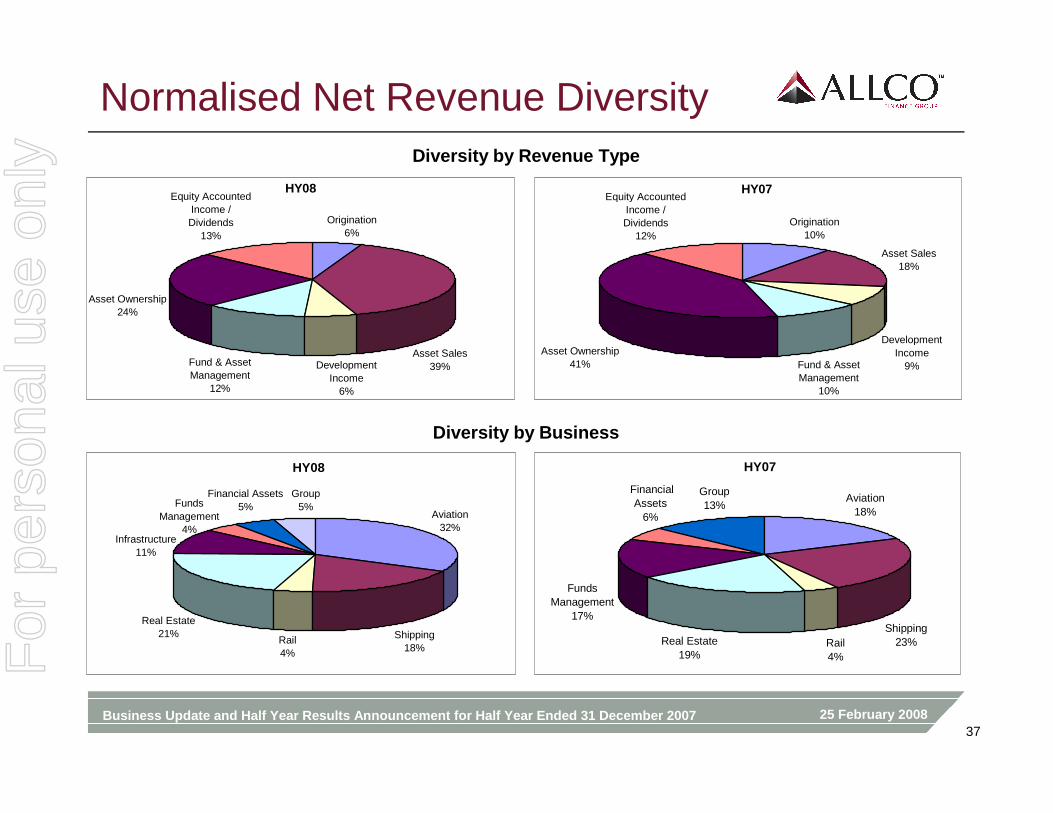
Normalised Net Revenue DiversityDiversity by Revenue Type
Diversity by Business
HY08
Origination6%
Development Income
6%
Fund & Asset Management
12%
Equity Accounted Income / Dividends
13%
Asset Ownership24%
Asset Sales39%
Origination10%
Asset Sales18%
Equity Accounted Income / Dividends
12%
Asset Ownership41% Fund & Asset
Management10%
Development Income
9%
HY07
Shipping18%
Rail4%
Real Estate21%
Group5%
Financial Assets5%
Infrastructure11%
Aviation32%
FundsManagement
4%
HY08
Aviation18%
Real Estate19%
Funds Management
17%
Group13%
Rail4%
Shipping23%
Financial Assets
6%
HY07
For
per
sona
l use
onl
y
25 February 2008Business Update and Half Year Results Announcement for Half Year Ended 31 December 200738
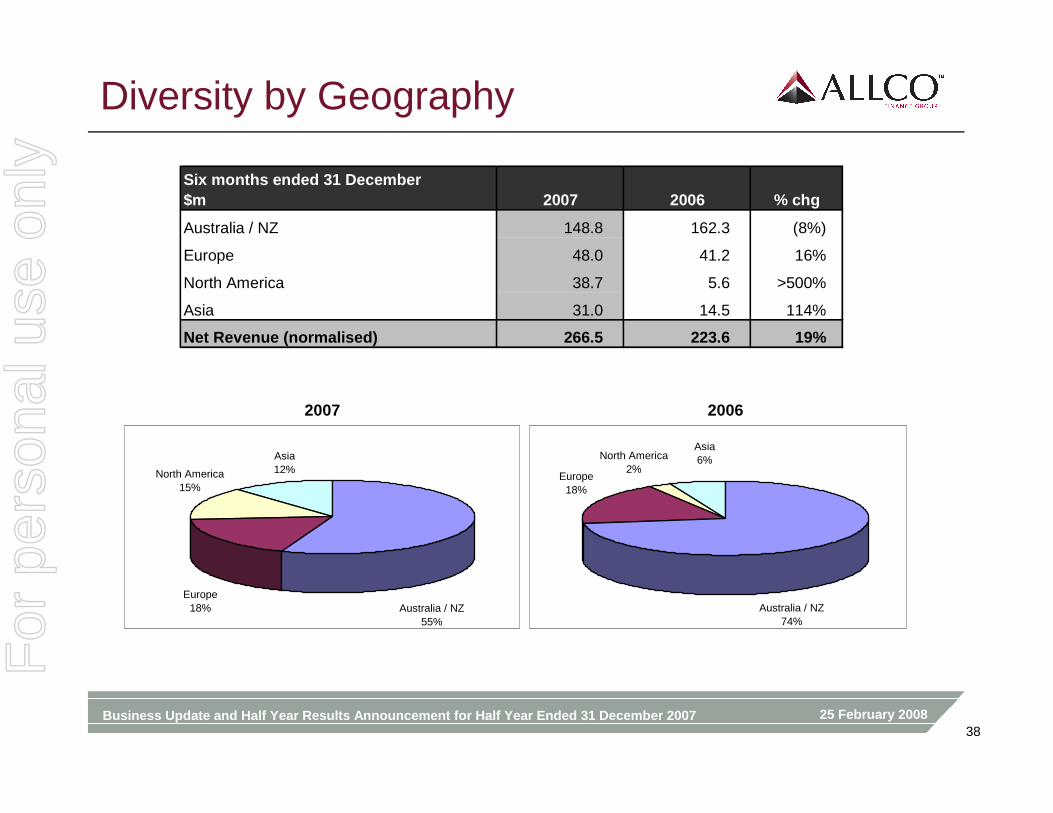
Diversity by Geography
2007 2006
Asia12%
Australia / NZ55%
North America15%
Europe18% Australia / NZ
74%
Europe18%
Asia6%North America
2%
Six months ended 31 December$m 2007 2006 % chg
Australia / NZ 148.8 162.3 (8%)
Europe 48.0 41.2 16%
North America 38.7 5.6 >500%
Asia 31.0 14.5 114%
Net Revenue (normalised) 266.5 223.6 19%
For
per
sona
l use
onl
y
25 February 2008Business Update and Half Year Results Announcement for Half Year Ended 31 December 200739
Aviation
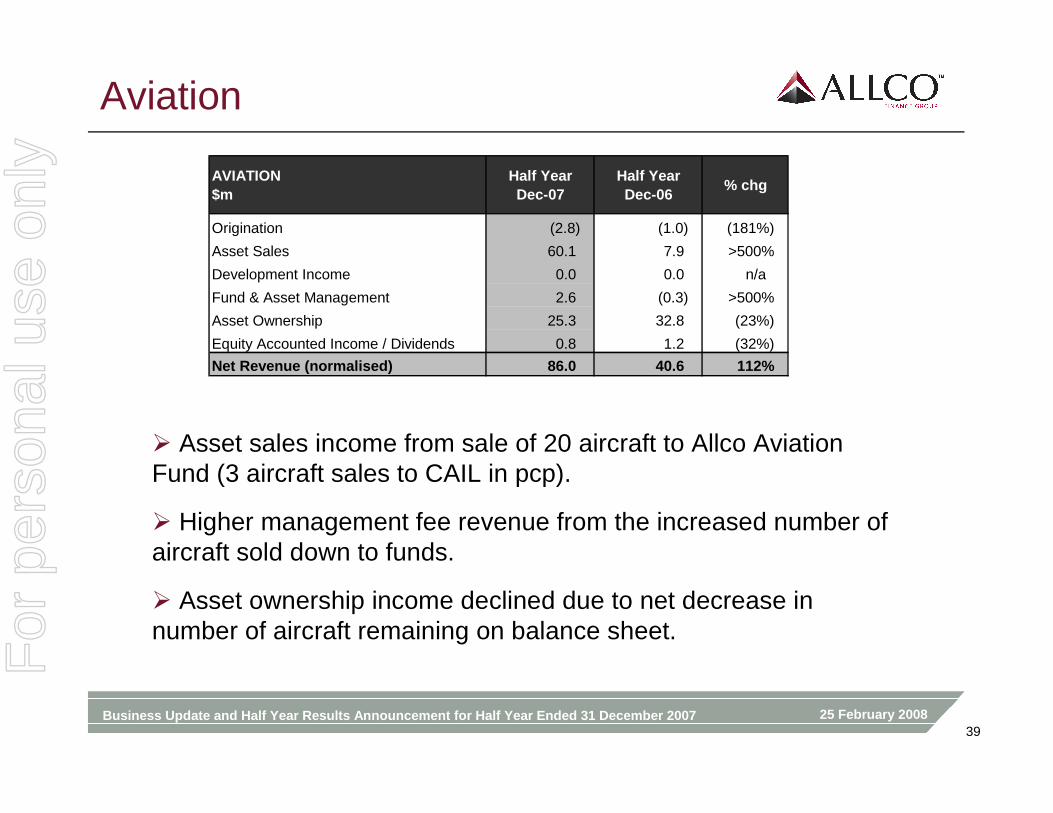
� Asset sales income from sale of 20 aircraft to Allco Aviation Fund (3 aircraft sales to CAIL in pcp).
� Higher management fee revenue from the increased number of aircraft sold down to funds.
� Asset ownership income declined due to net decrease in number of aircraft remaining on balance sheet.
AVIATION$m
Half YearDec-07
Half YearDec-06
% chg
Origination (2.8) (1.0) (181%)
Asset Sales 60.1 7.9 >500%
Development Income 0.0 0.0 n/a
Fund & Asset Management 2.6 (0.3) >500%
Asset Ownership 25.3 32.8 (23%)
Equity Accounted Income / Dividends 0.8 1.2 (32%)
Net Revenue (normalised) 86.0 40.6 112%
For
per
sona
l use
onl
y
25 February 2008Business Update and Half Year Results Announcement for Half Year Ended 31 December 200740
Aviation
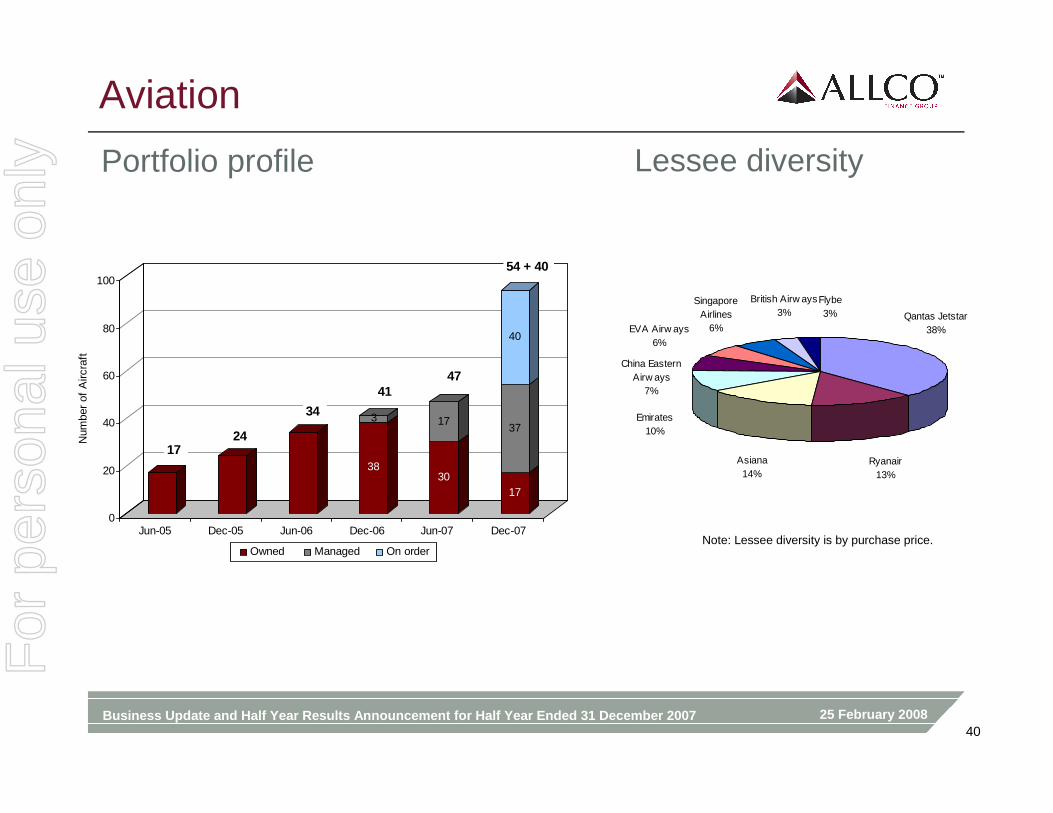
Portfolio profile Lessee diversity
Note: Lessee diversity is by purchase price.
Ryanair13%
Asiana14%
Qantas Jetstar38%
Emirates10%
EVA Airw ays6%
China Eastern Airw ays
7%
Flybe3%
British Airw ays3%
Singapore Airlines
6%
38
3
30
17
17
37
40
0
20
40
60
80
100
Num
ber
of A
ircra
ft
Jun-05 Dec-05 Jun-06 Dec-06 Jun-07 Dec-07
Owned Managed On order
1724
34
54 + 40
4741
For
per
sona
l use
onl
y
25 February 2008Business Update and Half Year Results Announcement for Half Year Ended 31 December 200741
Shipping
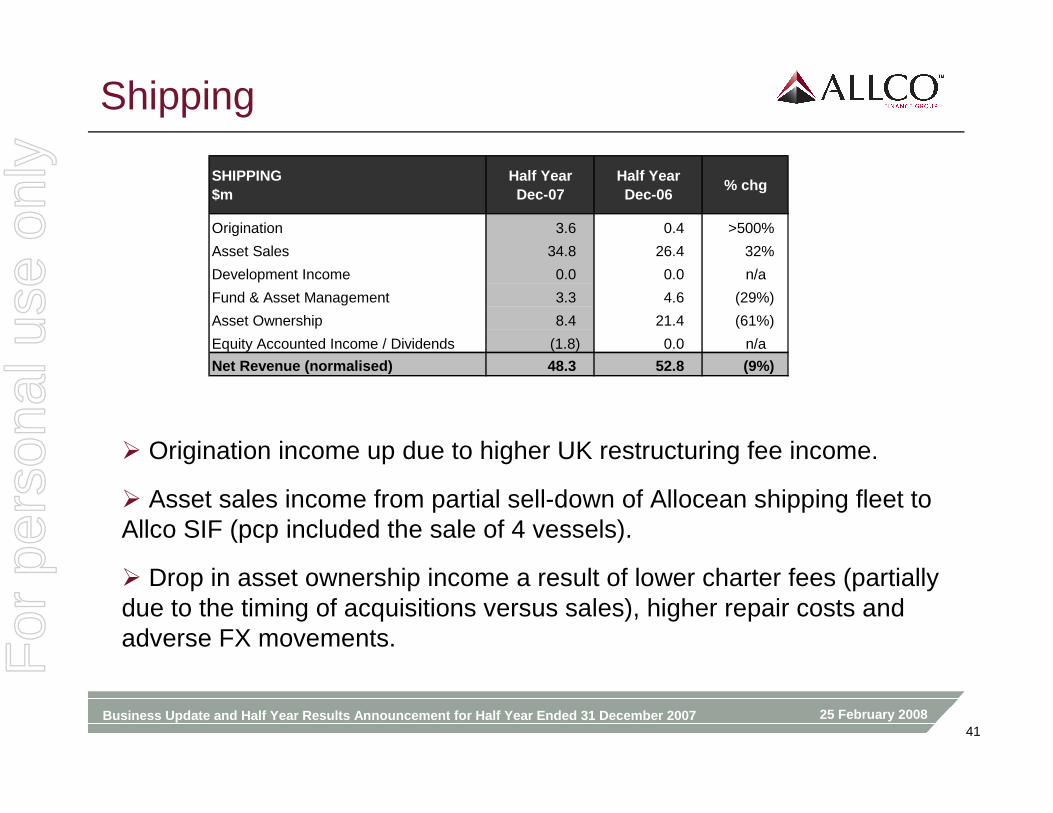
� Origination income up due to higher UK restructuring fee income.
� Asset sales income from partial sell-down of Allocean shipping fleet to Allco SIF (pcp included the sale of 4 vessels).
� Drop in asset ownership income a result of lower charter fees (partially due to the timing of acquisitions versus sales), higher repair costs andadverse FX movements.
SHIPPING$m
Half YearDec-07
Half YearDec-06
% chg
Origination 3.6 0.4 >500%
Asset Sales 34.8 26.4 32%
Development Income 0.0 0.0 n/a
Fund & Asset Management 3.3 4.6 (29%)
Asset Ownership 8.4 21.4 (61%)
Equity Accounted Income / Dividends (1.8) 0.0 n/a
Net Revenue (normalised) 48.3 52.8 (9%)
For
per
sona
l use
onl
y
25 February 2008Business Update and Half Year Results Announcement for Half Year Ended 31 December 200742
Shipping
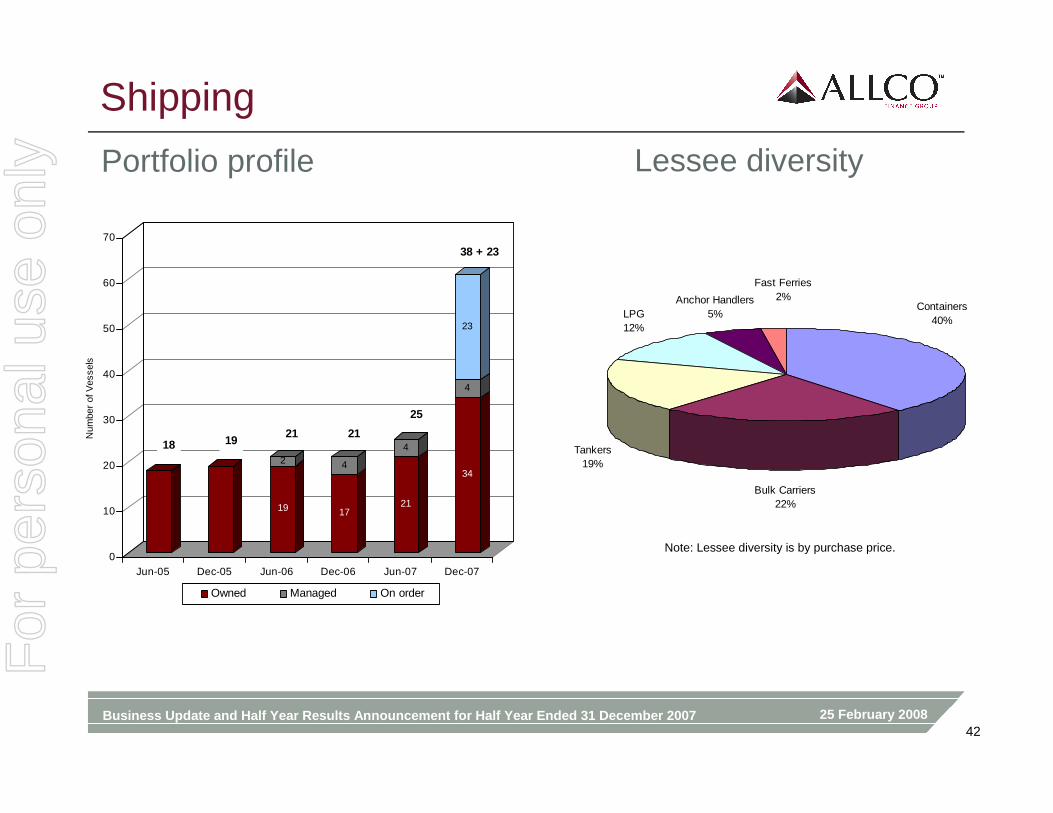
Portfolio profile Lessee diversity
Anchor Handlers5%
Fast Ferries2%
LPG12%
Containers40%
Tankers19%
Bulk Carriers22%
Note: Lessee diversity is by purchase price.
19
2
17
4
21
4
34
4
23
0
10
20
30
40
50
60
70
Num
ber
of V
esse
ls
Jun-05 Dec-05 Jun-06 Dec-06 Jun-07 Dec-07
Owned Managed On order
21 21
38 + 23
25
18 19
For
per
sona
l use
onl
y
25 February 2008Business Update and Half Year Results Announcement for Half Year Ended 31 December 200743
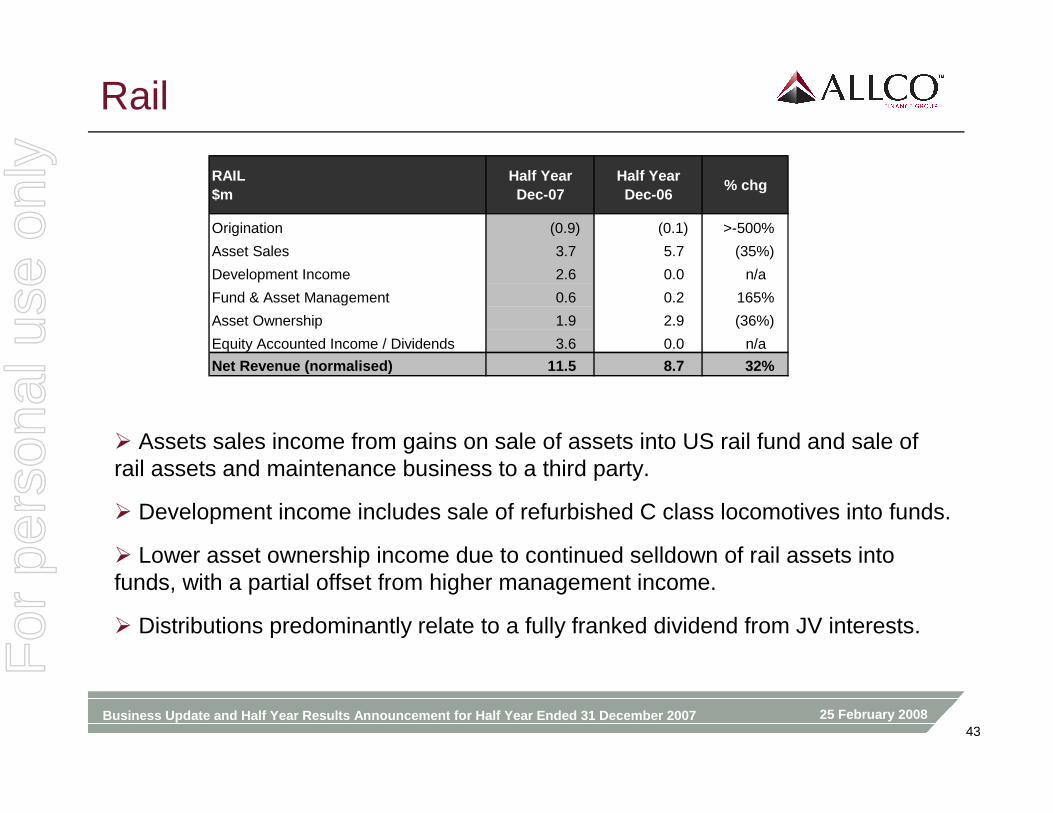
Rail
� Assets sales income from gains on sale of assets into US rail fund and sale of rail assets and maintenance business to a third party.
� Development income includes sale of refurbished C class locomotives into funds.
� Lower asset ownership income due to continued selldown of rail assets into funds, with a partial offset from higher management income.
� Distributions predominantly relate to a fully franked dividend from JV interests.
RAIL$m
Half YearDec-07
Half YearDec-06
% chg
Origination (0.9) (0.1) >-500%
Asset Sales 3.7 5.7 (35%)
Development Income 2.6 0.0 n/a
Fund & Asset Management 0.6 0.2 165%
Asset Ownership 1.9 2.9 (36%)
Equity Accounted Income / Dividends 3.6 0.0 n/a
Net Revenue (normalised) 11.5 8.7 32%
For
per
sona
l use
onl
y
25 February 2008Business Update and Half Year Results Announcement for Half Year Ended 31 December 200744
Rail
Portfolio profile: rail cars Portfolio profile: locomotives
1,140
411
260
1,739
298
2,444
172
2,932
413
0
500
1,000
1,500
2,000
2,500
3,000
3,500
4,000
Num
ber
of R
ailc
ars
Jun-05 Dec-05 Jun-06 Dec-06 Jun-07 Dec-07
Railcars owned Railcars managed Railcars on order
3,104 + 413
289411
1,551
1,999
2,742
54
25
54
25
54
25
6
33
29
0
20
40
60
80
100
120
Num
ber
of L
ocom
otiv
es
Jun-05 Dec-05 Jun-06 Dec-06 Jun-07 Dec-07
Locomotives owned Locomotives managed Locomotives on order
39 + 29
2
25
79 79 79
For
per
sona
l use
onl
y
25 February 2008Business Update and Half Year Results Announcement for Half Year Ended 31 December 200745
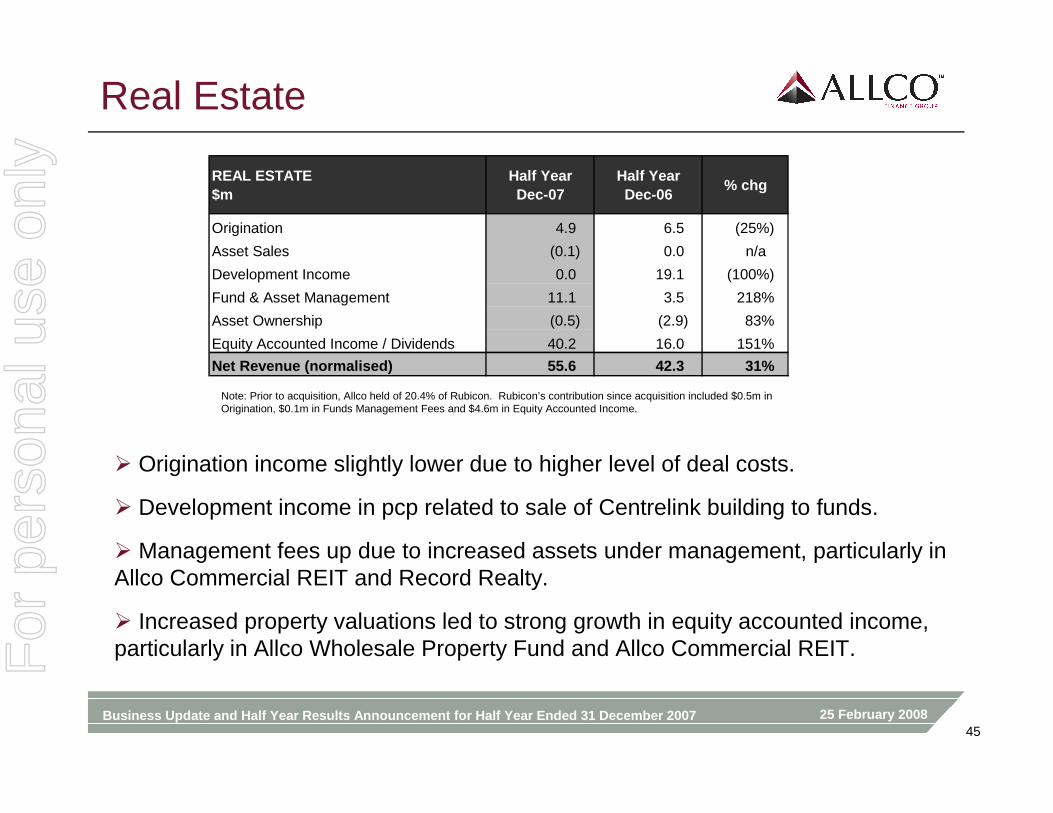
Real Estate
� Origination income slightly lower due to higher level of deal costs.
� Development income in pcp related to sale of Centrelink building to funds.
� Management fees up due to increased assets under management, particularly in Allco Commercial REIT and Record Realty.
� Increased property valuations led to strong growth in equity accounted income, particularly in Allco Wholesale Property Fund and Allco Commercial REIT.
Note: Prior to acquisition, Allco held of 20.4% of Rubicon. Rubicon’s contribution since acquisition included $0.5m in Origination, $0.1m in Funds Management Fees and $4.6m in Equity Accounted Income.
REAL ESTATE$m
Half YearDec-07
Half YearDec-06
% chg
Origination 4.9 6.5 (25%)
Asset Sales (0.1) 0.0 n/a
Development Income 0.0 19.1 (100%)
Fund & Asset Management 11.1 3.5 218%
Asset Ownership (0.5) (2.9) 83%
Equity Accounted Income / Dividends 40.2 16.0 151%
Net Revenue (normalised) 55.6 42.3 31%
For
per
sona
l use
onl
y
25 February 2008Business Update and Half Year Results Announcement for Half Year Ended 31 December 200746
Real Estate
Properties managed Geographic diversity
Singapore8%Europe
14%
US46%
Australia13%
Japan19%
Note: Diversity is by number of properties.15 1722
30
54
117
-
20
40
60
80
100
120
Num
ber o
f Pro
perti
es
Jun-05 Dec-05 Jun-06 Dec-06 Jun-07 Dec-07
Properties Under Management
For
per
sona
l use
onl
y
25 February 2008Business Update and Half Year Results Announcement for Half Year Ended 31 December 200747
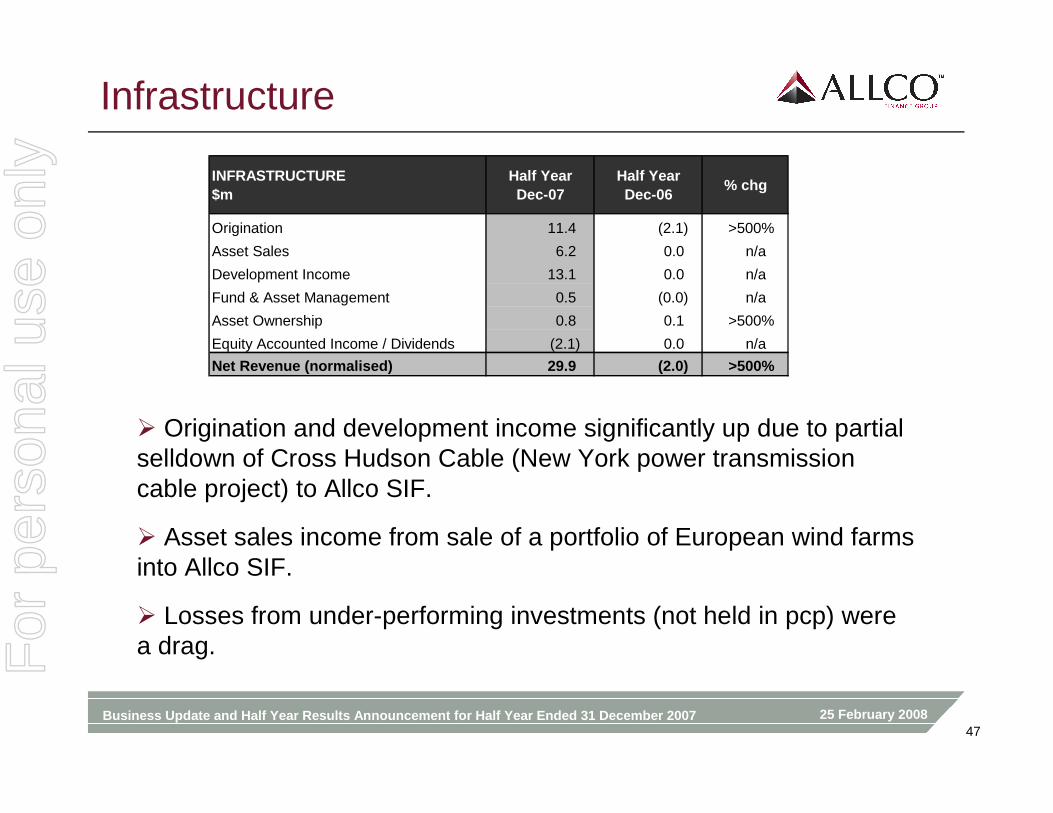
Infrastructure
� Origination and development income significantly up due to partial selldown of Cross Hudson Cable (New York power transmission cable project) to Allco SIF.
� Asset sales income from sale of a portfolio of European wind farms into Allco SIF.
� Losses from under-performing investments (not held in pcp) were a drag.
INFRASTRUCTURE$m
Half YearDec-07
Half YearDec-06
% chg
Origination 11.4 (2.1) >500%
Asset Sales 6.2 0.0 n/a
Development Income 13.1 0.0 n/a
Fund & Asset Management 0.5 (0.0) n/a
Asset Ownership 0.8 0.1 >500%
Equity Accounted Income / Dividends (2.1) 0.0 n/a
Net Revenue (normalised) 29.9 (2.0) >500%
For
per
sona
l use
onl
y
25 February 2008Business Update and Half Year Results Announcement for Half Year Ended 31 December 200748
Infrastructure
� Focus on energy generation and related assets. Core investments in power generation (gas-fired and renewable) and transmission.
� Value creation: carbon footprint and generation constrained markets.
� Gas-fired generation:� Cross Hudson Cable. Development of a transmission cable between New
Jersey and New York in partnership with Cavallo.
� Wind Energy:� Development of 2,000 MW in Tehachapi, California, as well as other US,
European, and Asia Pacific pipeline (1,500MW).
� 50MW of European & US wind projects in construction with commercial operation in FY08.
For
per
sona
l use
onl
y
25 February 2008Business Update and Half Year Results Announcement for Half Year Ended 31 December 200749
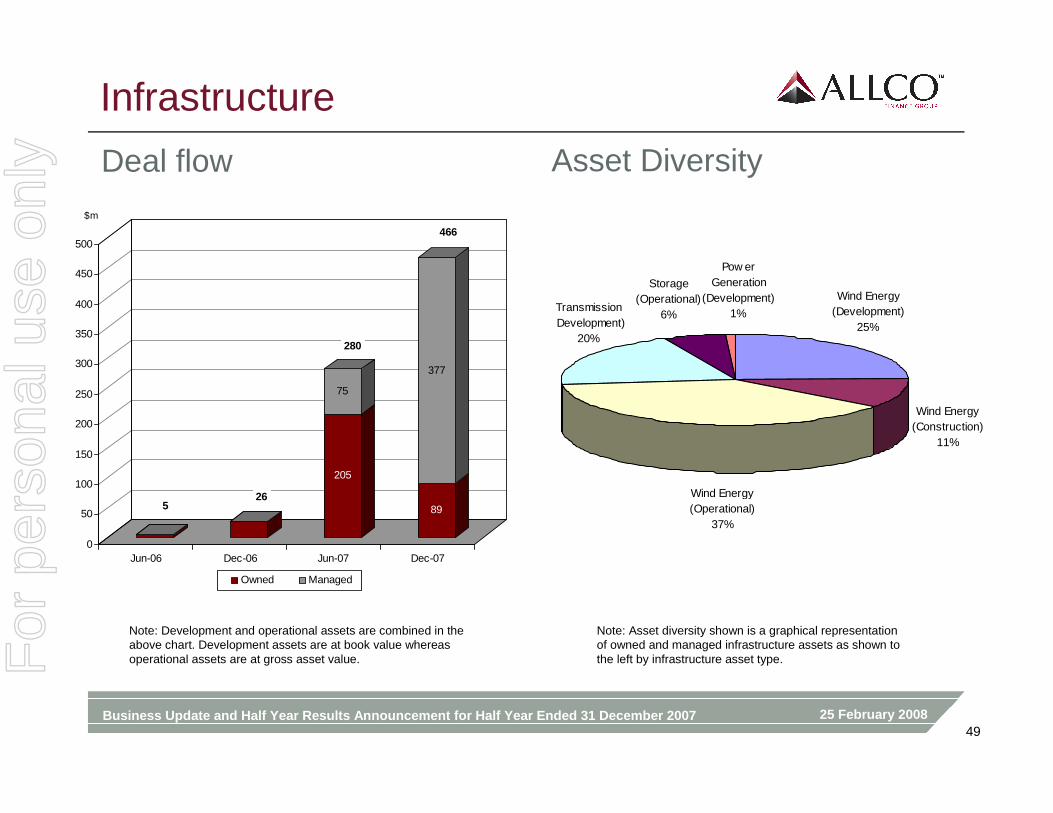
Infrastructure
Deal flow Asset Diversity
Note: Development and operational assets are combined in the above chart. Development assets are at book value whereas operational assets are at gross asset value.
Note: Asset diversity shown is a graphical representation of owned and managed infrastructure assets as shown to the left by infrastructure asset type.
Pow er Generation
(Development)1%
Storage (Operational)
6%
Wind Energy (Construction)
11%
Wind Energy (Operational)
37%
Wind Energy (Development)
25%
Transmission (Development)
20%
205
75
89
377
0
50
100
150
200
250
300
350
400
450
500
$m
Jun-06 Dec-06 Jun-07 Dec-07
Owned Managed
26
280
466
5
For
per
sona
l use
onl
y
25 February 2008Business Update and Half Year Results Announcement for Half Year Ended 31 December 200750
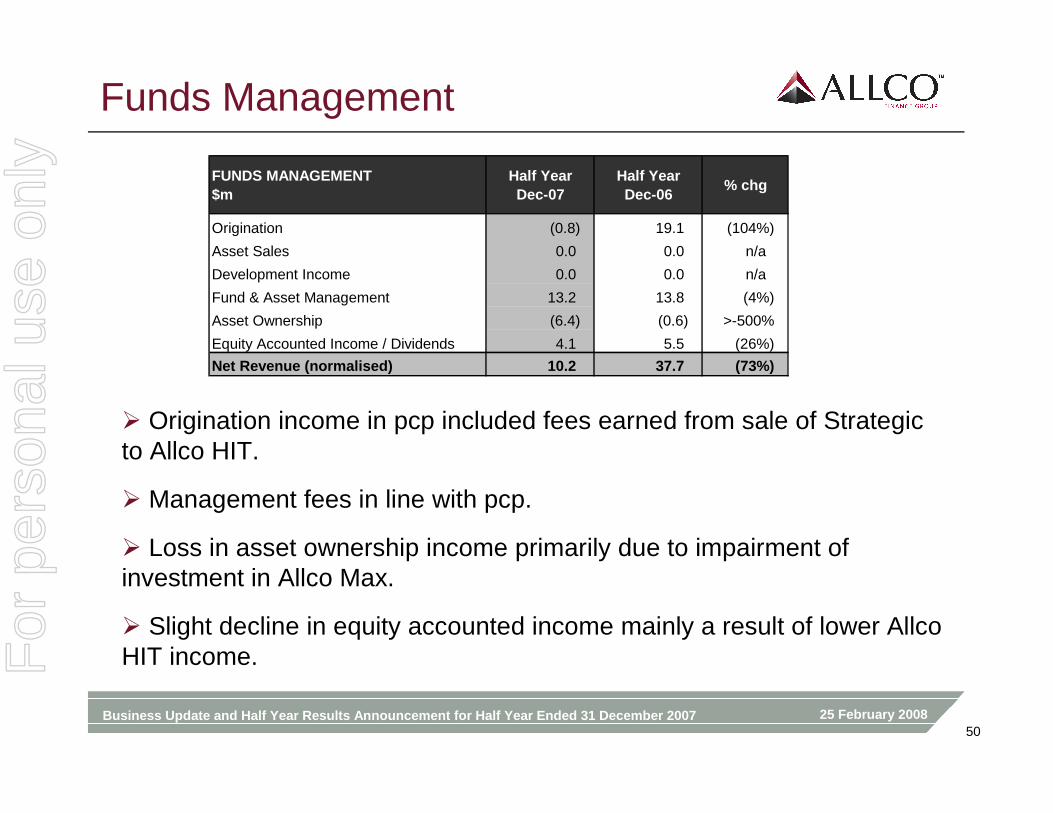
Funds Management
� Origination income in pcp included fees earned from sale of Strategic to Allco HIT.
� Management fees in line with pcp.
� Loss in asset ownership income primarily due to impairment of investment in Allco Max.
� Slight decline in equity accounted income mainly a result of lower Allco HIT income.
FUNDS MANAGEMENT$m
Half YearDec-07
Half YearDec-06
% chg
Origination (0.8) 19.1 (104%)
Asset Sales 0.0 0.0 n/a
Development Income 0.0 0.0 n/a
Fund & Asset Management 13.2 13.8 (4%)
Asset Ownership (6.4) (0.6) >-500%
Equity Accounted Income / Dividends 4.1 5.5 (26%)
Net Revenue (normalised) 10.2 37.7 (73%)
For
per
sona
l use
onl
y
25 February 2008Business Update and Half Year Results Announcement for Half Year Ended 31 December 200751
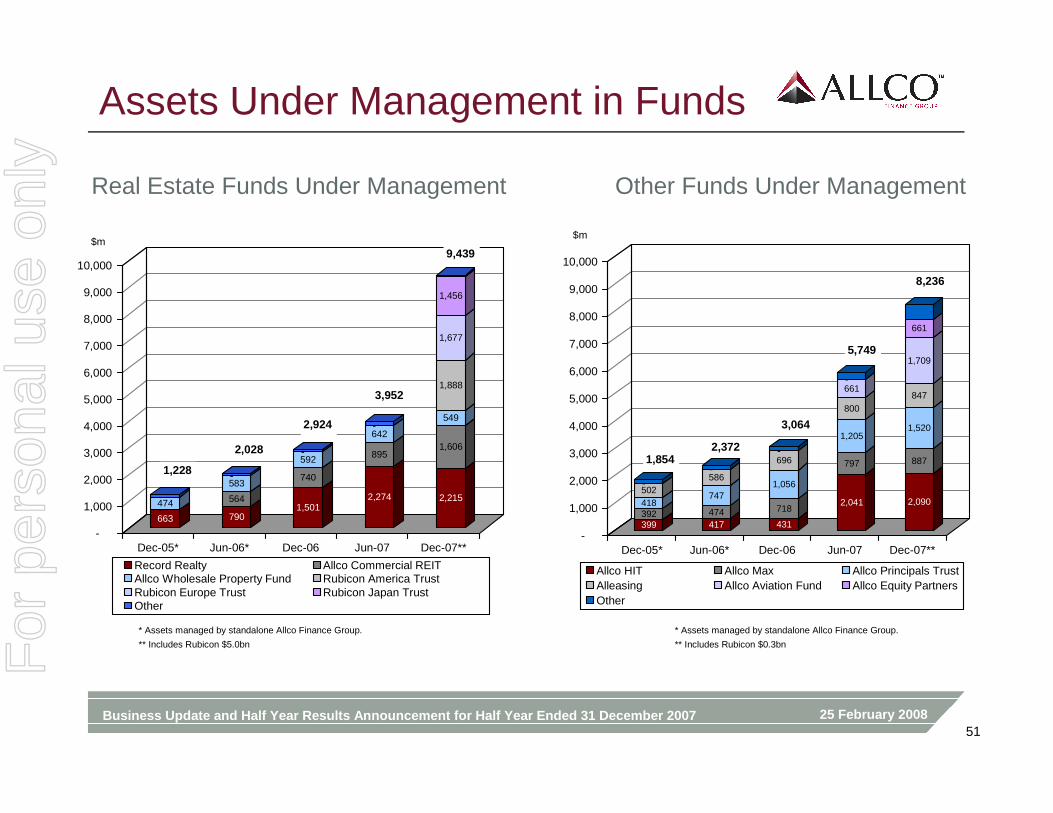
Assets Under Management in Funds
* Assets managed by standalone Allco Finance Group. * Assets managed by standalone Allco Finance Group.
** Includes Rubicon $5.0bn ** Includes Rubicon $0.3bn
663-474---
790
564
583---
1,501
740
592---
2,274
895
642---
2,215
1,606
549
1,888
1,677
1,456
-
1,000
2,000
3,000
4,000
5,000
6,000
7,000
8,000
9,000
10,000
$m
Dec-05* Jun-06* Dec-06 Jun-07 Dec-07**
Record Realty Allco Commercial REITAllco Wholesale Property Fund Rubicon America TrustRubicon Europe Trust Rubicon Japan TrustOther
399392418502--
417474
747
586--
431
718
1,056
696--
2,041
797
1,205
800
661-
2,090
887
1,520
847
1,709
661
-
1,000
2,000
3,000
4,000
5,000
6,000
7,000
8,000
9,000
10,000
$m
Dec-05* Jun-06* Dec-06 Jun-07 Dec-07**
Allco HIT Allco Max Allco Principals TrustAlleasing Allco Aviation Fund Allco Equity PartnersOther
1,8542,372
3,064
5,749
8,236
1,228
2,028
2,924
3,952
9,439
Real Estate Funds Under Management Other Funds Under Management
For
per
sona
l use
onl
y
25 February 2008Business Update and Half Year Results Announcement for Half Year Ended 31 December 200752
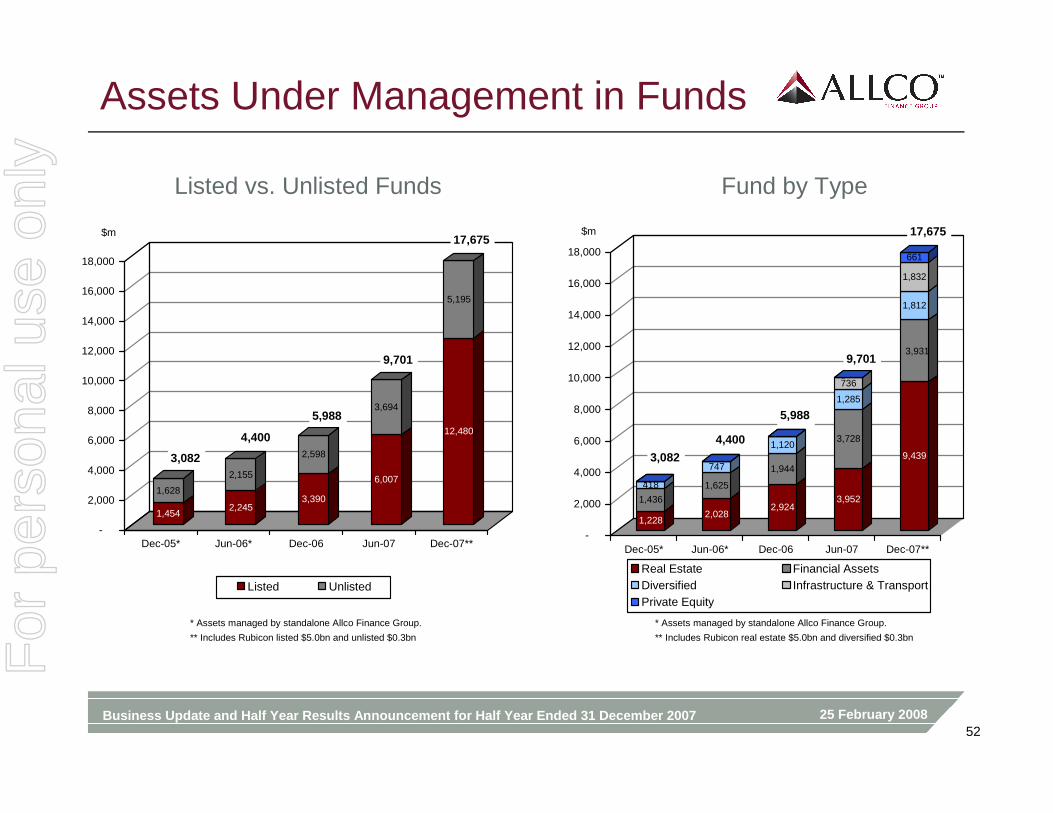
Assets Under Management in Funds
* Assets managed by standalone Allco Finance Group. * Assets managed by standalone Allco Finance Group.
** Includes Rubicon listed $5.0bn and unlisted $0.3bn ** Includes Rubicon real estate $5.0bn and diversified $0.3bn
1,454
1,628
2,245
2,155
3,390
2,598
6,007
3,694
12,480
5,195
-
2,000
4,000
6,000
8,000
10,000
12,000
14,000
16,000
18,000
$m
Dec-05* Jun-06* Dec-06 Jun-07 Dec-07**
Listed Unlisted
1,228
1,436
418--
2,028
1,625
747--
2,924
1,944
1,120--
3,952
3,728
1,285
736-
9,439
3,931
1,812
1,832
661
-
2,000
4,000
6,000
8,000
10,000
12,000
14,000
16,000
18,000
$m
Dec-05* Jun-06* Dec-06 Jun-07 Dec-07**
Real Estate Financial AssetsDiversified Infrastructure & TransportPrivate Equity
3,082
4,400
5,988
9,701
17,675
3,082
4,400
5,988
9,701
17,675
Listed vs. Unlisted Funds Fund by Type
For
per
sona
l use
onl
y
25 February 2008Business Update and Half Year Results Announcement for Half Year Ended 31 December 200753
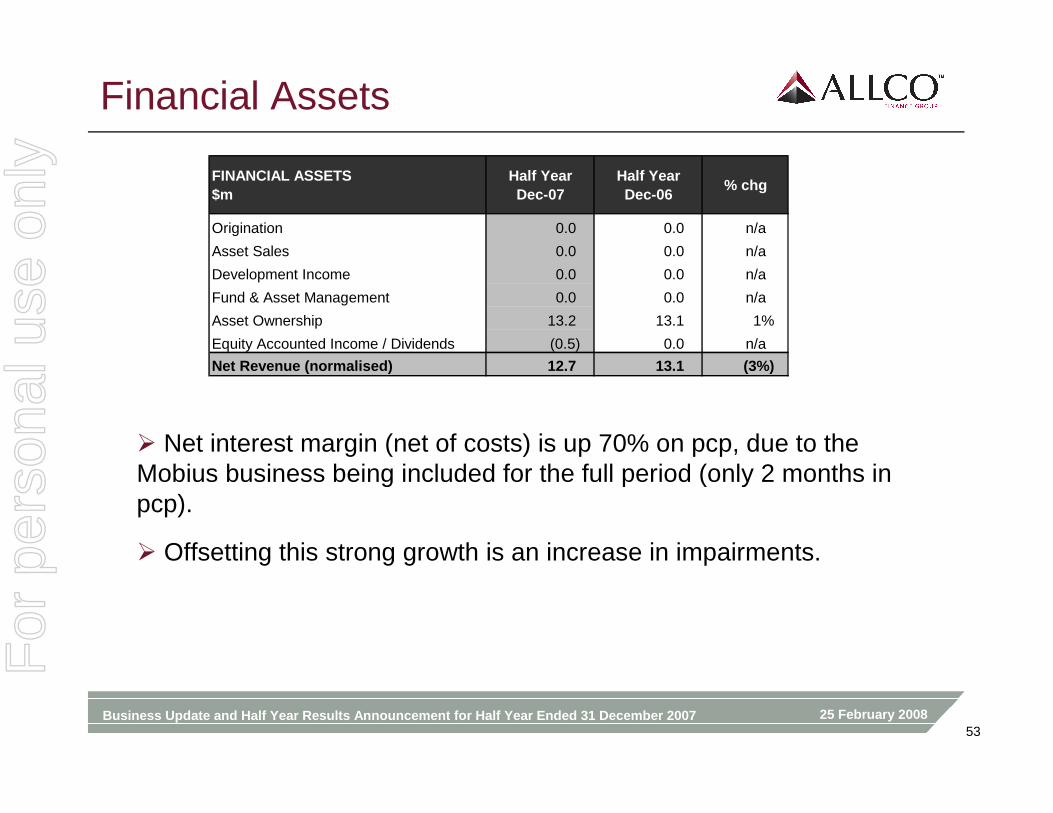
Financial Assets
� Net interest margin (net of costs) is up 70% on pcp, due to theMobius business being included for the full period (only 2 months in pcp).
� Offsetting this strong growth is an increase in impairments.
FINANCIAL ASSETS$m
Half YearDec-07
Half YearDec-06
% chg
Origination 0.0 0.0 n/a
Asset Sales 0.0 0.0 n/a
Development Income 0.0 0.0 n/a
Fund & Asset Management 0.0 0.0 n/a
Asset Ownership 13.2 13.1 1%
Equity Accounted Income / Dividends (0.5) 0.0 n/a
Net Revenue (normalised) 12.7 13.1 (3%)
For
per
sona
l use
onl
y
25 February 2008Business Update and Half Year Results Announcement for Half Year Ended 31 December 200754
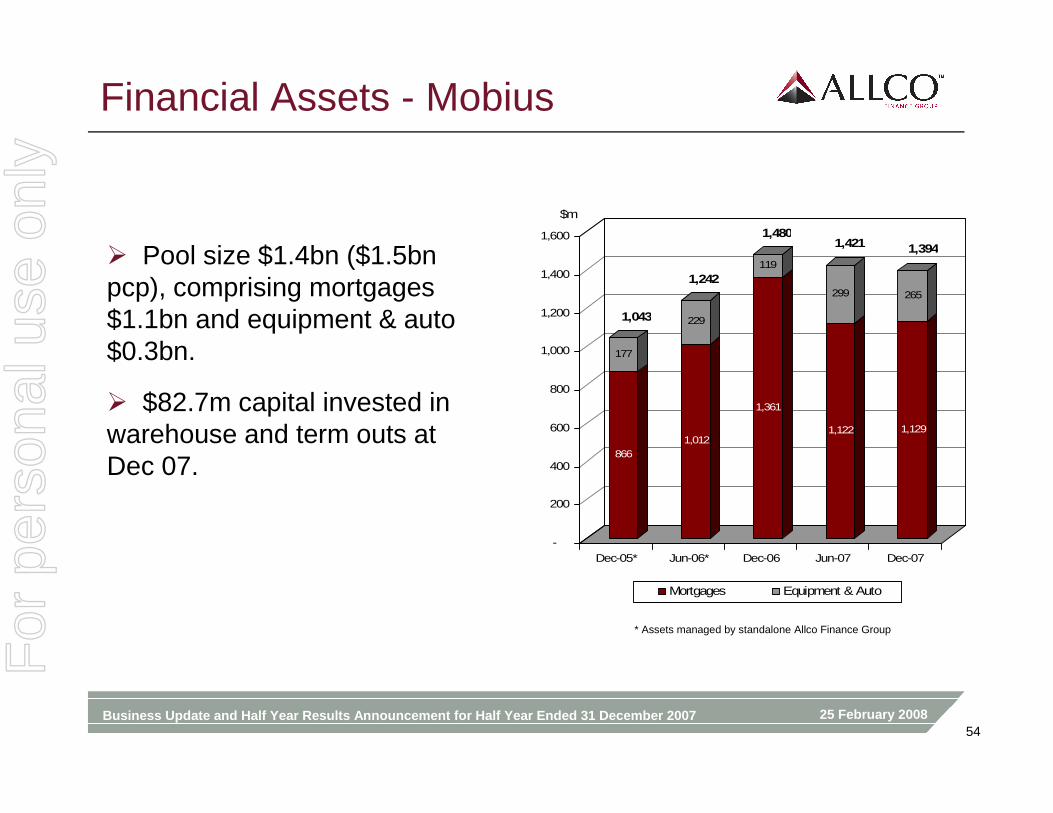
Financial Assets - Mobius
� Pool size $1.4bn ($1.5bn pcp), comprising mortgages $1.1bn and equipment & auto $0.3bn.
� $82.7m capital invested in warehouse and term outs at Dec 07.
* Assets managed by standalone Allco Finance Group
866
177
1,012
229
1,361
119
1,122
299
1,129
265
-
200
400
600
800
1,000
1,200
1,400
1,600
$m
Dec-05* Jun-06* Dec-06 Jun-07 Dec-07
Mortgages Equipment & Auto
1,043
1,242
1,4801,421 1,394
For
per
sona
l use
onl
y
25 February 2008Business Update and Half Year Results Announcement for Half Year Ended 31 December 200755
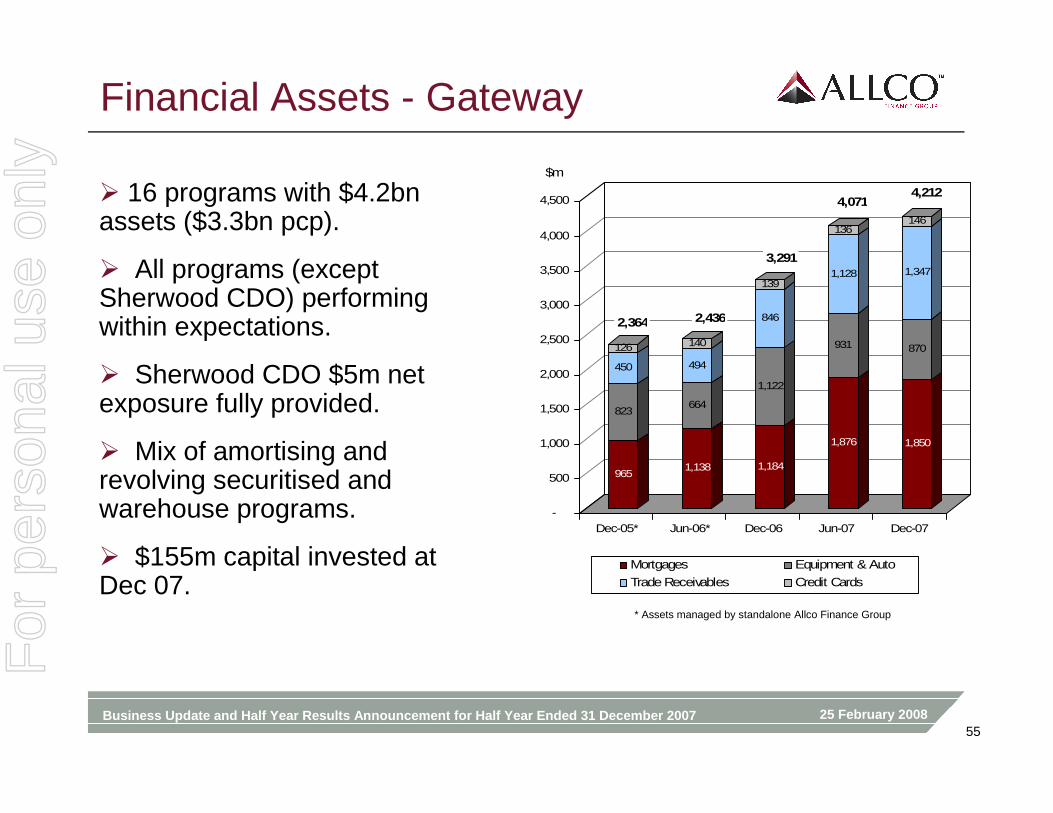
Financial Assets - Gateway
� 16 programs with $4.2bn assets ($3.3bn pcp).
� All programs (except Sherwood CDO) performing within expectations.
� Sherwood CDO $5m net exposure fully provided.
� Mix of amortising and revolving securitised and warehouse programs.
� $155m capital invested at Dec 07.
* Assets managed by standalone Allco Finance Group
965
823
450
126
1,138
664
494
140
1,184
1,122
846
139
1,876
931
1,128
136
1,850
870
1,347
146
-
500
1,000
1,500
2,000
2,500
3,000
3,500
4,000
4,500
$m
Dec-05* Jun-06* Dec-06 Jun-07 Dec-07
Mortgages Equipment & Auto
Trade Receivables Credit Cards
2,364 2,436
3,291
4,0714,212
For
per
sona
l use
onl
y
25 February 2008Business Update and Half Year Results Announcement for Half Year Ended 31 December 200756
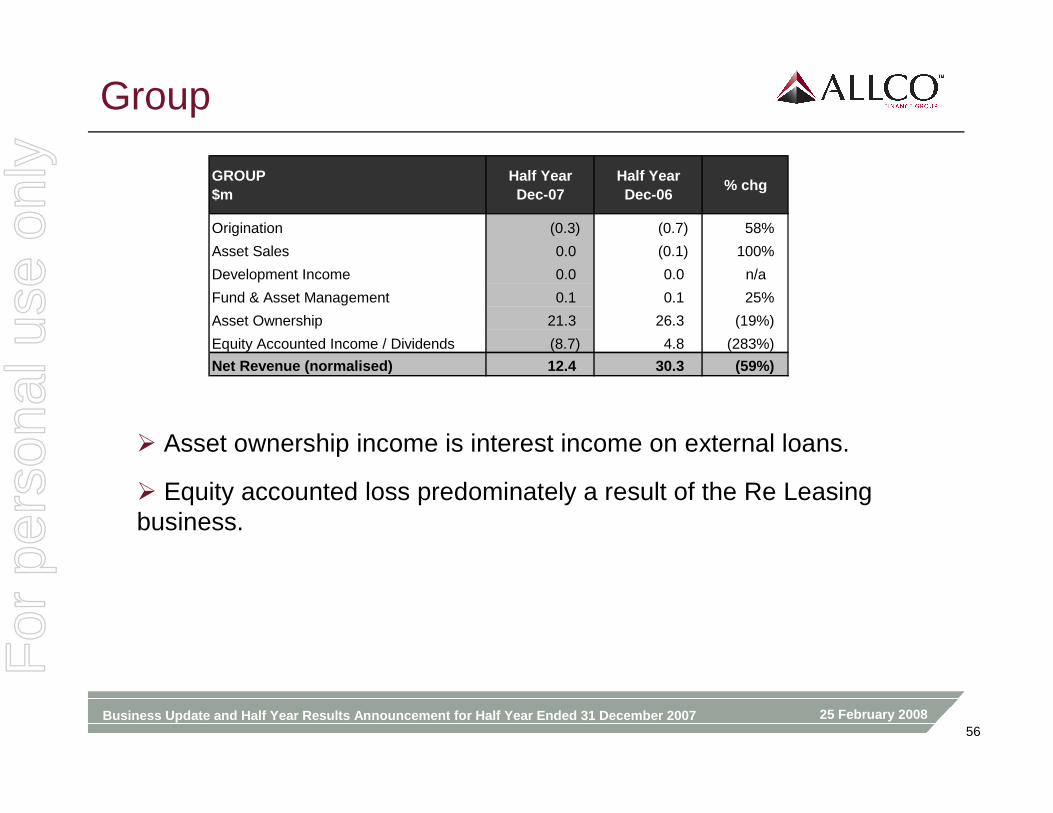
Group
� Asset ownership income is interest income on external loans.
� Equity accounted loss predominately a result of the Re Leasing business.
GROUP$m
Half YearDec-07
Half YearDec-06
% chg
Origination (0.3) (0.7) 58%
Asset Sales 0.0 (0.1) 100%
Development Income 0.0 0.0 n/a
Fund & Asset Management 0.1 0.1 25%
Asset Ownership 21.3 26.3 (19%)
Equity Accounted Income / Dividends (8.7) 4.8 (283%)
Net Revenue (normalised) 12.4 30.3 (59%)
For
per
sona
l use
onl
y
25 February 2008Business Update and Half Year Results Announcement for Half Year Ended 31 December 200757
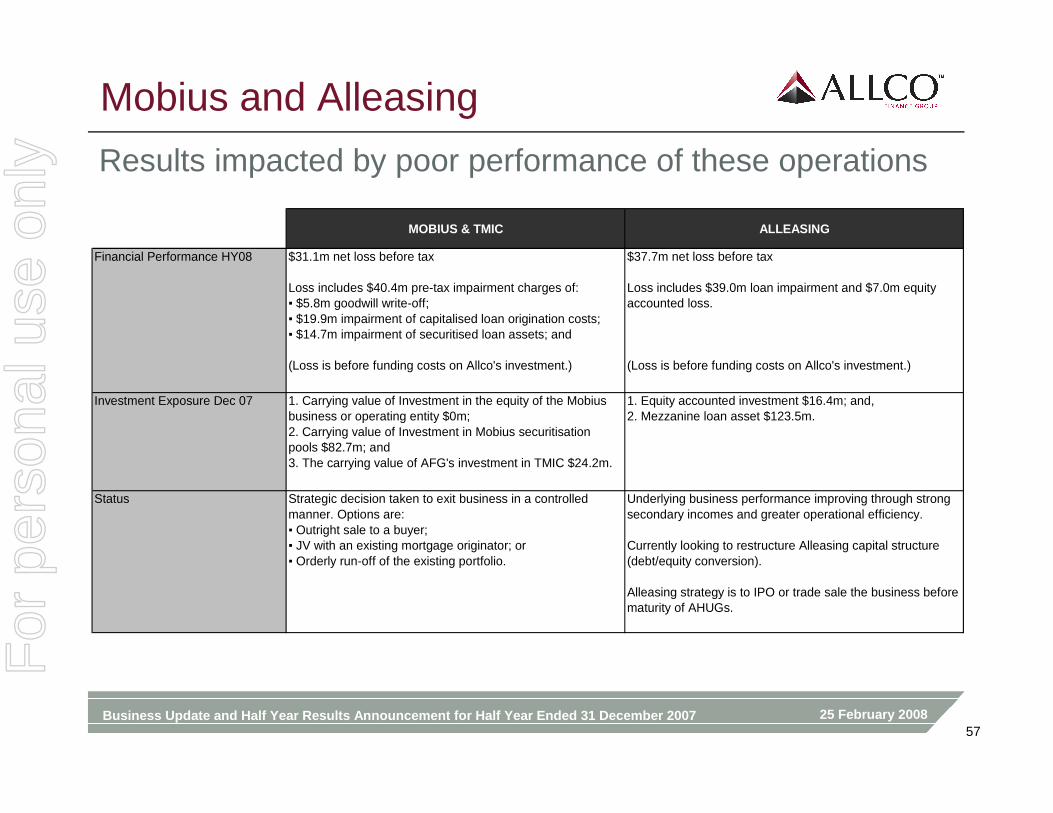
Mobius and Alleasing
Results impacted by poor performance of these operations
MOBIUS & TMIC ALLEASING
Financial Performance HY08 $31.1m net loss before tax
Loss includes $40.4m pre-tax impairment charges of:▪ $5.8m goodwill write-off;▪ $19.9m impairment of capitalised loan origination costs;▪ $14.7m impairment of securitised loan assets; and
(Loss is before funding costs on Allco's investment.)
$37.7m net loss before tax
Loss includes $39.0m loan impairment and $7.0m equity accounted loss.
(Loss is before funding costs on Allco's investment.)
Investment Exposure Dec 07 1. Carrying value of Investment in the equity of the Mobius business or operating entity $0m;2. Carrying value of Investment in Mobius securitisation pools $82.7m; and3. The carrying value of AFG's investment in TMIC $24.2m.
1. Equity accounted investment $16.4m; and,2. Mezzanine loan asset $123.5m.
Status Strategic decision taken to exit business in a controlled manner. Options are:▪ Outright sale to a buyer;▪ JV with an existing mortgage originator; or▪ Orderly run-off of the existing portfolio.
Underlying business performance improving through strong secondary incomes and greater operational efficiency.
Currently looking to restructure Alleasing capital structure (debt/equity conversion).
Alleasing strategy is to IPO or trade sale the business before maturity of AHUGs.
For
per
sona
l use
onl
y
25 February 2008Business Update and Half Year Results Announcement for Half Year Ended 31 December 200758
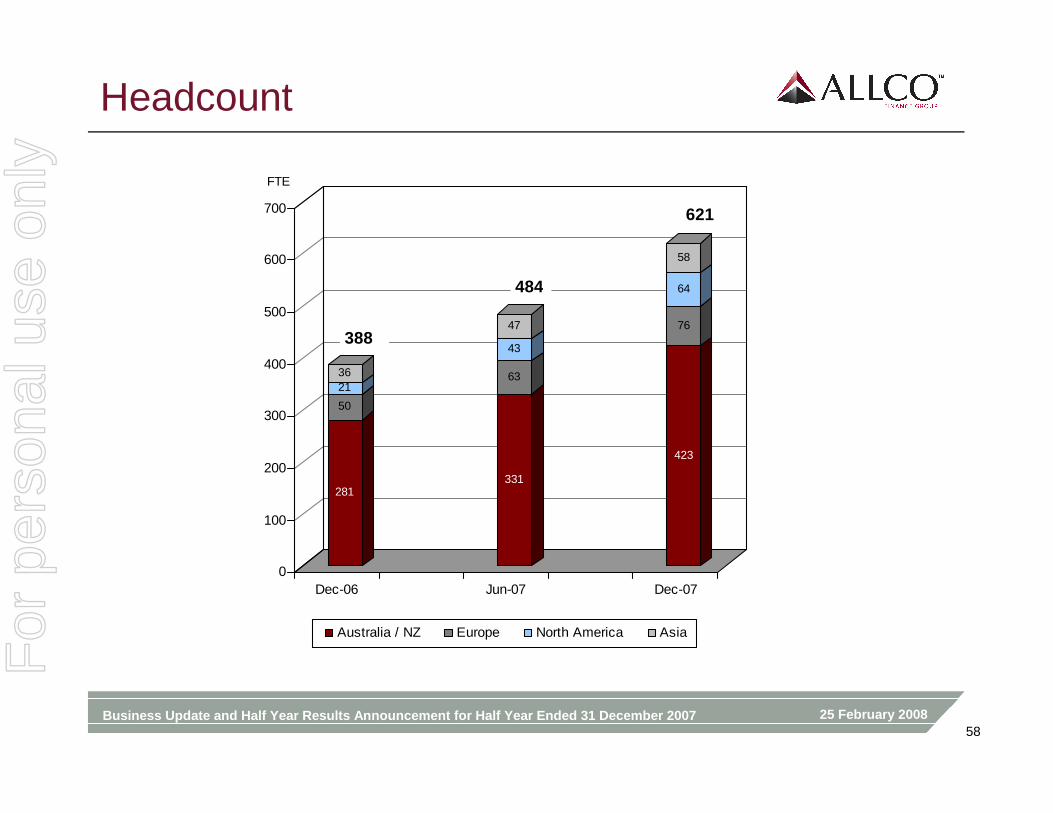
Headcount
281
50
2136
331
63
43
47
423
76
64
58
0
100
200
300
400
500
600
700
FTE
Dec-06 Jun-07 Dec-07
Australia / NZ Europe North America Asia
388
484
621
For
per
sona
l use
onl
y
25 February 2008Business Update and Half Year Results Announcement for Half Year Ended 31 December 200759
Tax Rate
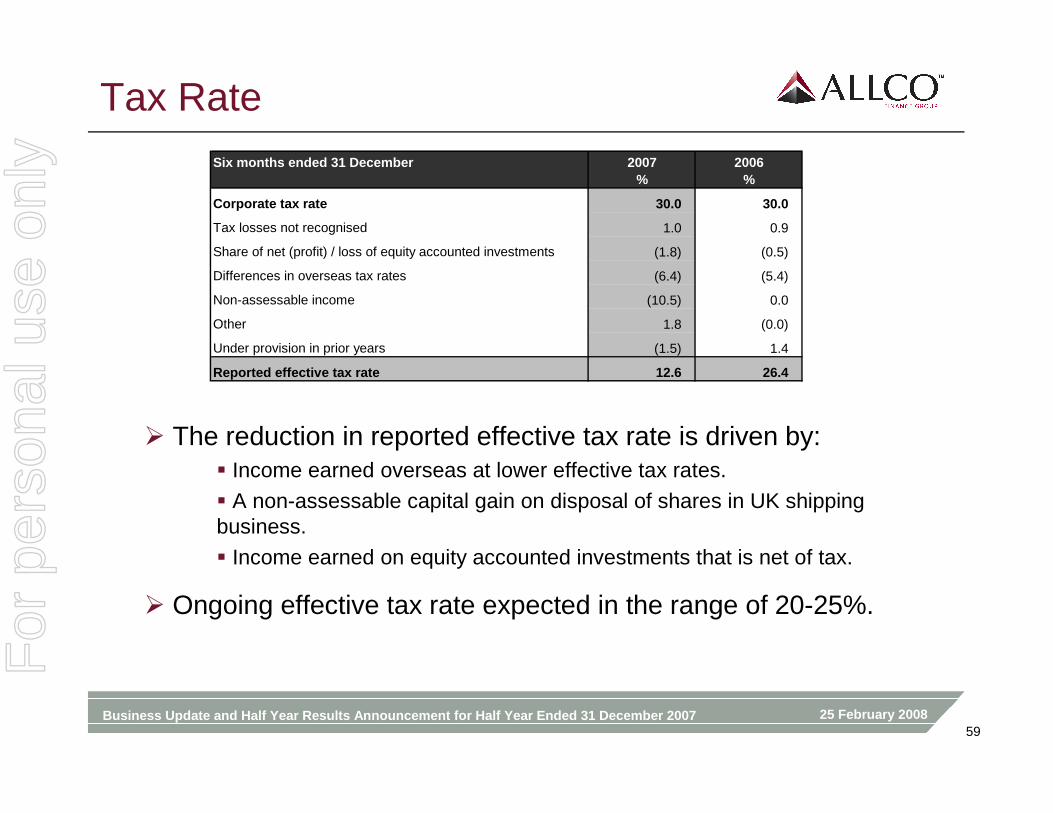
� The reduction in reported effective tax rate is driven by:� Income earned overseas at lower effective tax rates.
� A non-assessable capital gain on disposal of shares in UK shipping business.
� Income earned on equity accounted investments that is net of tax.
� Ongoing effective tax rate expected in the range of 20-25%.
Six months ended 31 December 2007%
2006%
Corporate tax rate 30.0 30.0
Tax losses not recognised 1.0 0.9
Share of net (profit) / loss of equity accounted investments (1.8) (0.5)
Differences in overseas tax rates (6.4) (5.4)
Non-assessable income (10.5) 0.0
Other 1.8 (0.0)
Under provision in prior years (1.5) 1.4
Reported effective tax rate 12.6 26.4
For
per
sona
l use
onl
y
25 February 2008Business Update and Half Year Results Announcement for Half Year Ended 31 December 200760
2007 EBITDA Income Statement
Six months ended 31 December$m 2007
Re LeasingProvision
MobiusGoodwill
MobiusCosts
AEPLInvestment
2007 Normalised
2006 Normalised % chg
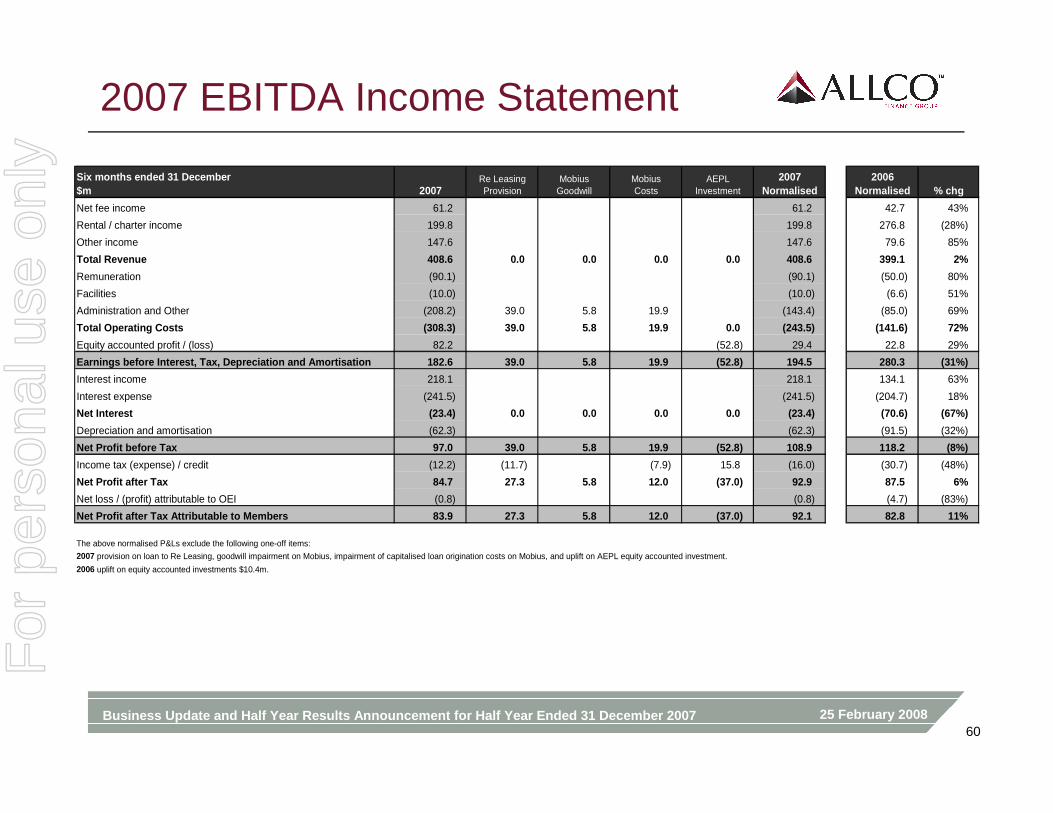
Net fee income 61.2 61.2 42.7 43%
Rental / charter income 199.8 199.8 276.8 (28%)
Other income 147.6 147.6 79.6 85%
Total Revenue 408.6 0.0 0.0 0.0 0.0 408.6 399.1 2%
Remuneration (90.1) (90.1) (50.0) 80%
Facilities (10.0) (10.0) (6.6) 51%
Administration and Other (208.2) 39.0 5.8 19.9 (143.4) (85.0) 69%
Total Operating Costs (308.3) 39.0 5.8 19.9 0.0 (243.5) (141.6) 72%
Equity accounted profit / (loss) 82.2 (52.8) 29.4 22.8 29%
Earnings before Interest, Tax, Depreciation and Amo rtisation 182.6 39.0 5.8 19.9 (52.8) 194.5 280.3 (31% )
Interest income 218.1 218.1 134.1 63%
Interest expense (241.5) (241.5) (204.7) 18%
Net Interest (23.4) 0.0 0.0 0.0 0.0 (23.4) (70.6) (67%)
Depreciation and amortisation (62.3) (62.3) (91.5) (32%)
Net Profit before Tax 97.0 39.0 5.8 19.9 (52.8) 108.9 118.2 (8%)
Income tax (expense) / credit (12.2) (11.7) (7.9) 15.8 (16.0) (30.7) (48%)
Net Profit after Tax 84.7 27.3 5.8 12.0 (37.0) 92.9 87.5 6%
Net loss / (profit) attributable to OEI (0.8) (0.8) (4.7) (83%)
Net Profit after Tax Attributable to Members 83.9 27 .3 5.8 12.0 (37.0) 92.1 82.8 11%
The above normalised P&Ls exclude the following one-off items:
2007 provision on loan to Re Leasing, goodwill impairment on Mobius, impairment of capitalised loan origination costs on Mobius, and uplift on AEPL equity accounted investment.
2006 uplift on equity accounted investments $10.4m.
For
per
sona
l use
onl
y
25 February 2008Business Update and Half Year Results Announcement for Half Year Ended 31 December 200761
Recourse vs. Limited Recourse Debt
� Assets acquired by Allco typically include elements of limited recourse debt – that is, debt which has recourse to the assets it finances. Allco’s exposure is limited to its investment in these vehicles.
� Asset finance debt continues to be available.
� Debt terms are directly factored into asset valuations and bids.
� Refinance gains are not factored into base case economics.
For
per
sona
l use
onl
y
25 February 2008Business Update and Half Year Results Announcement for Half Year Ended 31 December 200762
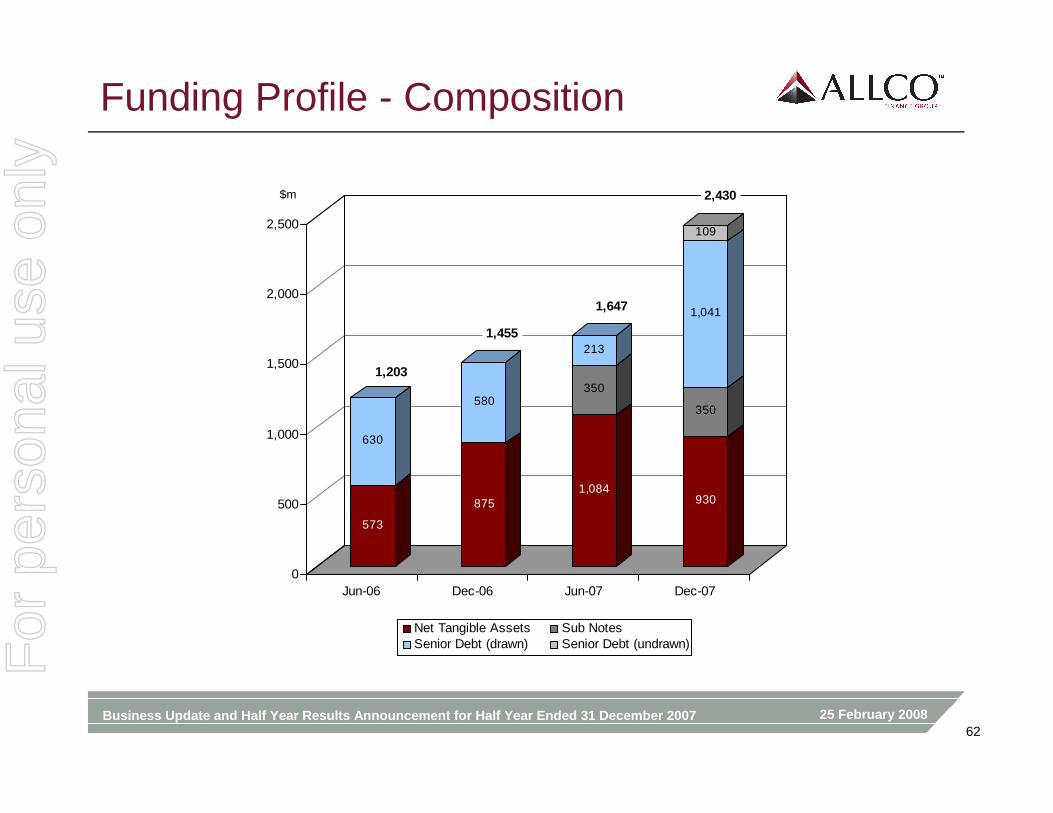
Funding Profile - Composition
573
630
875
580
1,084
350
213
930
350
1,041
109
0
500
1,000
1,500
2,000
2,500
$m
Jun-06 Dec-06 Jun-07 Dec-07
Net Tangible Assets Sub NotesSenior Debt (drawn) Senior Debt (undrawn)
1,203
1,455
1,647
2,430
For
per
sona
l use
onl
y
25 February 2008Business Update and Half Year Results Announcement for Half Year Ended 31 December 200763
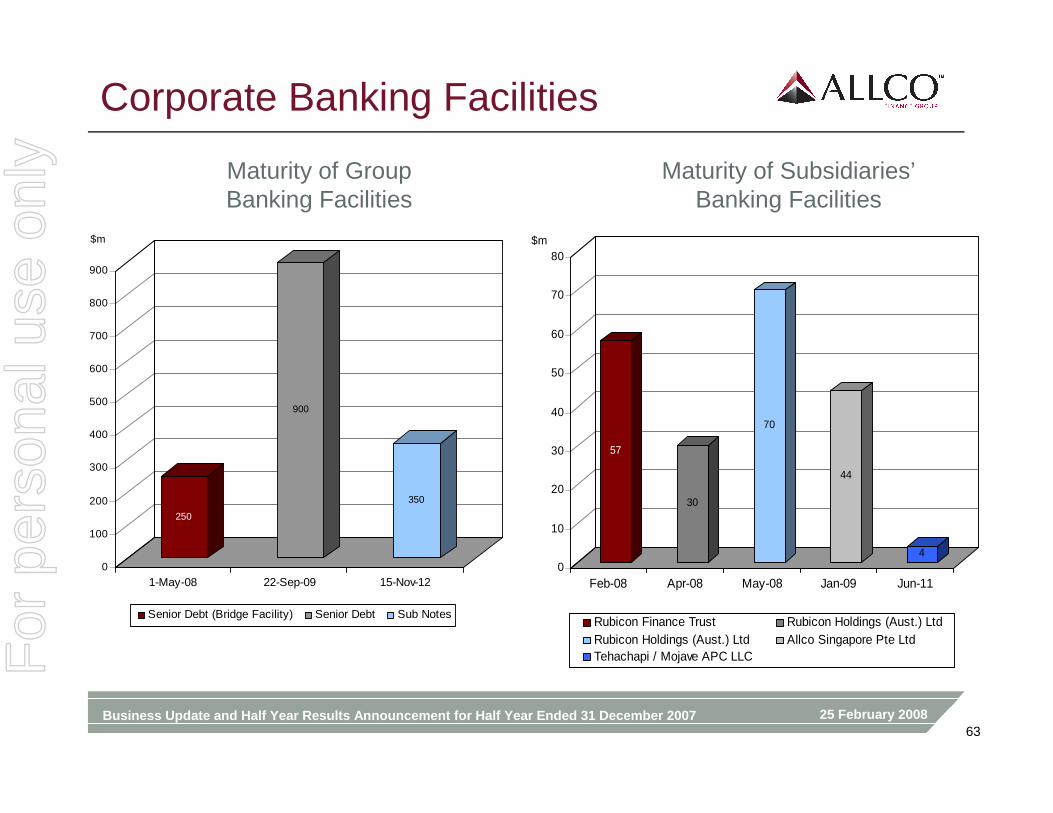
Corporate Banking Facilities
57
30
70
44
40
10
20
30
40
50
60
70
80$m
Feb-08 Apr-08 May-08 Jan-09 Jun-11
Rubicon Finance Trust Rubicon Holdings (Aust.) LtdRubicon Holdings (Aust.) Ltd Allco Singapore Pte LtdTehachapi / Mojave APC LLC
Maturity of Group Banking Facilities
Maturity of Subsidiaries’Banking Facilities
250
900
350
0
100
200
300
400
500
600
700
800
900
$m
1-May-08 22-Sep-09 15-Nov-12
Senior Debt (Bridge Facility) Senior Debt Sub Notes
For
per
sona
l use
onl
y
25 February 2008Business Update and Half Year Results Announcement for Half Year Ended 31 December 200764
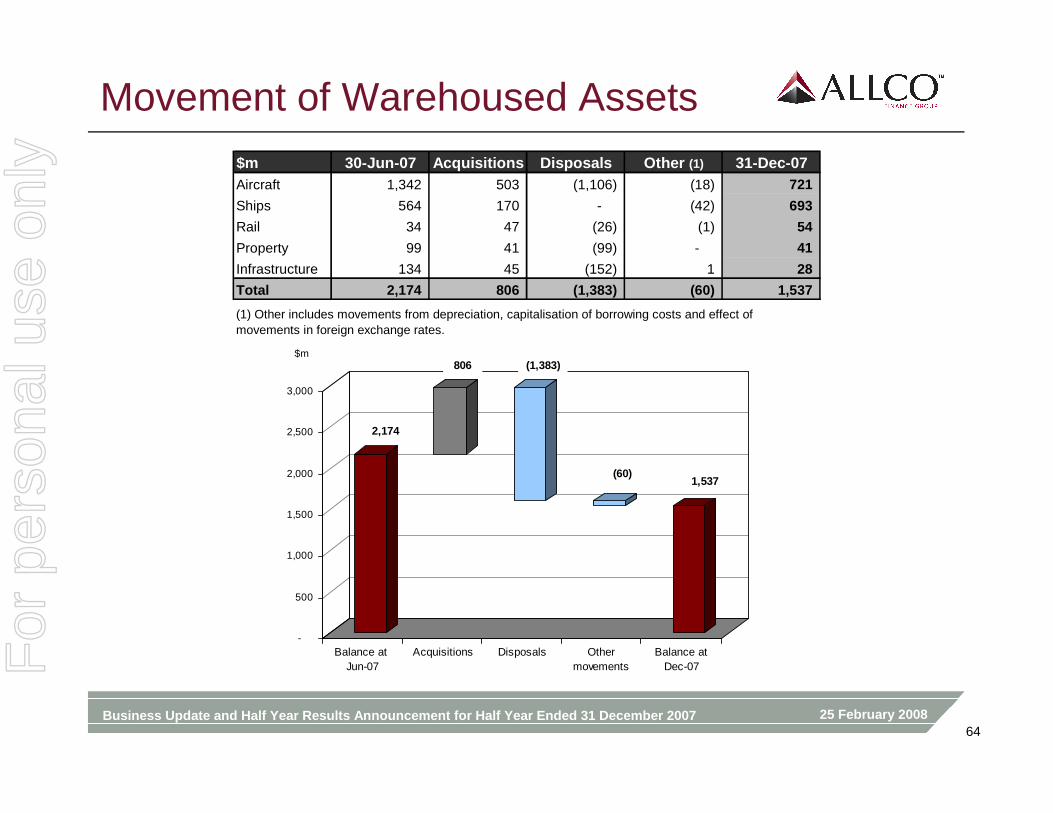
Movement of Warehoused Assets
-
500
1,000
1,500
2,000
2,500
3,000
$m
Balance at Jun-07
Acquisitions Disposals Othermovements
Balance atDec-07
806 (1,383)
(60)1,537
2,174
$m 30-Jun-07 Acquisitions Disposals Other (1) 31-Dec-07Aircraft 1,342 503 (1,106) (18) 721
Ships 564 170 - (42) 693
Rail 34 47 (26) (1) 54
Property 99 41 (99) - 41
Infrastructure 134 45 (152) 1 28
Total 2,174 806 (1,383) (60) 1,537
(1) Other includes movements from depreciation, capitalisation of borrowing costs and effect of movements in foreign exchange rates.
For
per
sona
l use
onl
y
25 February 2008Business Update and Half Year Results Announcement for Half Year Ended 31 December 200765
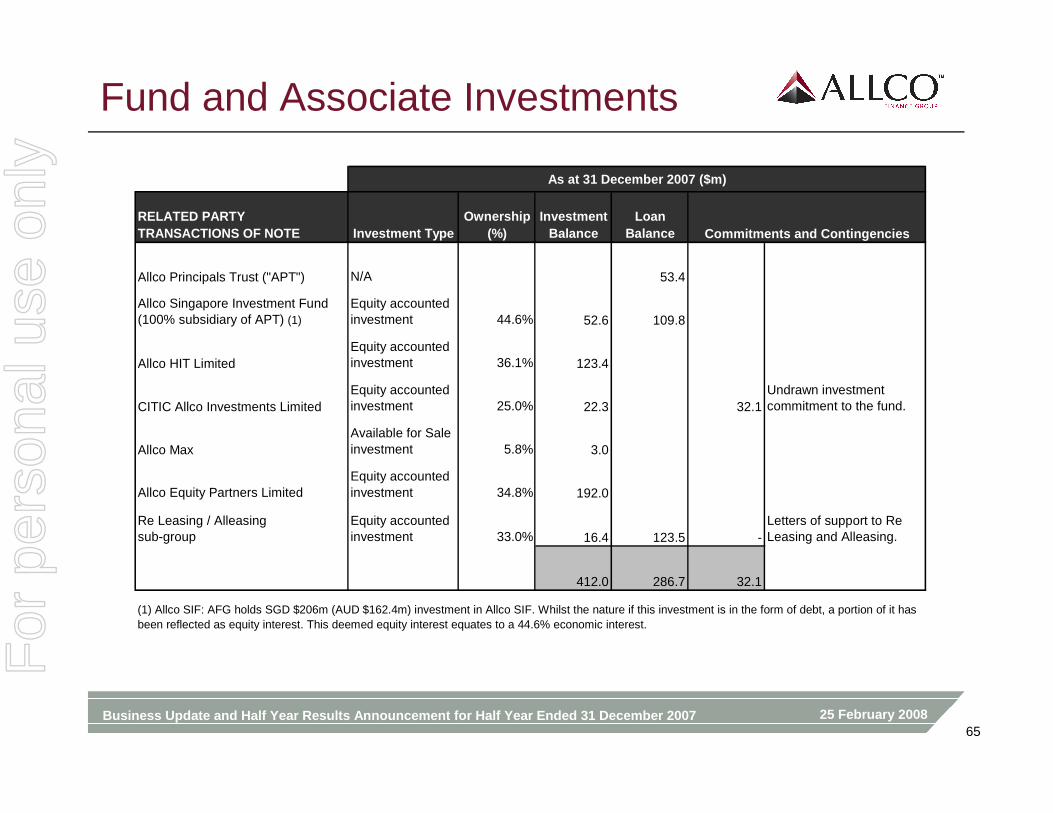
Fund and Associate Investments
As at 31 December 2007 ($m)
RELATED PARTYTRANSACTIONS OF NOTE Investment Type
Ownership (%)
InvestmentBalance
LoanBalance
Allco Principals Trust ("APT") N/A 53.4
Allco Singapore Investment Fund(100% subsidiary of APT) (1)
Equity accounted investment 44.6% 52.6 109.8
Allco HIT LimitedEquity accounted investment 36.1% 123.4
CITIC Allco Investments LimitedEquity accounted investment 25.0% 22.3 32.1
Undrawn investment commitment to the fund.
Allco MaxAvailable for Sale investment 5.8% 3.0
Allco Equity Partners LimitedEquity accounted investment 34.8% 192.0
Re Leasing / Alleasingsub-group
Equity accounted investment 33.0% 16.4 123.5 -
Letters of support to Re Leasing and Alleasing.
412.0 286.7 32.1
(1) Allco SIF: AFG holds SGD $206m (AUD $162.4m) investment in Allco SIF. Whilst the nature if this investment is in the form of debt, a portion of it has been reflected as equity interest. This deemed equity interest equates to a 44.6% economic interest.
Commitments and Contingencies
For
per
sona
l use
onl
y
25 February 2008Business Update and Half Year Results Announcement for Half Year Ended 31 December 200766
Important NoticeThe material above is a presentation of general background information about Allco’s activities current at the date of the presentation, 25 February 2008. It is information given in summary form and does not purport to be complete.
This presentation is not an offer or invitation for subscription or purchase of or a recommendation of securities. It is not intended to be relied upon as advice to investors or potential investors and does not take into account the investment objectives, financial situation or needs of any particular investor. These should be considered, with or without professional advice, when deciding if an investment is appropriate.
Information, including forecast financial information, in this presentation should not be considered as a recommendation in relation to holding, purchasing or selling shares, securities or other instruments in Allco. Due care and attention has been used in the preparation of forecast information. However, actual results may vary from forecasts and any variation may be materially positive or negative. Forecasts by their very nature, are subject to uncertainty and contingencies many of which are outside the control of Allco. Past performance is not a reliable indication of future performance.
The information in this presentation remains subject to change without notice. Circumstances may change and the contents of this presentation may become outdated as a result.
For
per
sona
l use
onl
y