Embed Size (px)
Citation preview
Forging the Dream
Proceedings of Symposium IV on
April 2000
African-AmericanMobility Issues
April 30 - May 2, 1997Wyndham Harbour Island Hotel
Tampa, Florida
Forging the Dream
Proceedings of Symposium IV on
April 2000
Beverly G. Ward, EditorDirector for
Ethnography and Transportation SystemsCenter for Urban Transportation Research
University of South Florida
African-AmericanMobility Issues
April 30 - May 2, 1997Wyndham Harbour Island Hotel
Tampa, Florida
3CONTENTS ❐PROCEEDINGS OF SYMPOSIUM IV ON
AFRICAN AMERICAN MOBILITY ISSUES
Contents
Acknowledgements ..................................................................................................................................... 5
Summary ......................................................................................................................................................... 7
Program ........................................................................................................................................................... 9
Facilitators, Presenters, and Speakers ................................................................................................. 19
Transportation Issues in Welfare-to-Work Programs .................................................................... 23Lois Bell, U. S. Department of Health and Human Services, Administration for Children andFamilies
Van Service Access in Detroit for Low-Income Women Needing Prenatal Care ................. 25Talia McCray, University of Michigan
Daily Travel by Persons with Low Income ........................................................................................ 35Elaine Murakami, Federal Highway Administration, U. S. Department of Transportation
Implementing Effective Public Involvement Methods to Increase Participation by AfricanAmericans in Transportation Planning....................................................................................... 41Patrice Koonce Rosemond, Miami-Dade Transit Agency
The Los Angeles Neighborhood Initiative (LANI): A Model for Community Participationand Empowerment ............................................................................................................................ 47Joyce Perkins, Los Angeles Neighborhood Initiative (LANI)
Summary of the “Human Environment” Requirements of the National EnvironmentalPolicy Act: Implications for Environmental Justice ............................................................... 51Cheryl Calloway and Karen L. Ferguson, Cooley Law School
Location Characteristics of Inner-City Neighborhoods and Employment Accessibility ofLow-Wage Workers ........................................................................................................................... 59Qing Shen, Massachusetts Institute of Technology
Location Efficient Mortgage Project: Capturing the Benefits of Public Transportation .... 75Jacky Grimshaw, Center for Neighborhood Technology
Public Education in Urban Centers: Analysis’ Trends and Policy Issues ................................ 81Lora G. Mayo, Commissioner, Baltimore City Public Schools
The Church: An Alternative Urban Transportation Amenity ..................................................... 85Charles Wright, Ph.D., P.E., Florida Agricultural and Mechanical University
4 ❐ PROCEEDINGS OF SYMPOSIUM IV ON AFRICAN-AMERICAN MOBILITY ISSUES
Traffic Calming and Its Role in Creating Livable Inner- City Communities ......................... 87Ian Lockwood, City of West Palm Beach
Technology, Transportation, and African Americans : No Innovations in Policy Direc-tives ......................................................................................................................................................... 95Terrence A. Taylor, Miami-Dade Metropolitan Planning Organization
Broward County Minibus Demonstration Project ........................................................................105 Fabian Cevallos, Broward County Transit, Pompano Beach
First Report from the Field on the Bridges to Work Demonstration .......................................109Richard Presha, Public/Private Ventures
Future Research Needs and Policy Implications ...........................................................................113
Evaluation Summary ..............................................................................................................................115
Afterword ...................................................................................................................................................119
5ACKNOWLEDGEMENTS ❐
AcknowledgementsAcknowledgements
The Center for Urban Transportation Research (CUTR) at the University of South Florida (USF); the American PublicTransit Association (APTA); Amtrak, National Railroad Passenger Corporation; the Conference on Minority Transporta-tion Officials (COMTO); the Federal Highway Administration (FHWA); Federal Transit Administration (FTA);Florida Agricultural & Mechanical University; the Florida Transit Association; General Motors, Inc.; Hillsborough RegionalTransit Authority (HARTLine); Institute on Black Life at the University of South Florida; National Transportation Consortiumof Minority Colleges and Universities; National Transportation Consortium of States; the National Urban Transit Institute(NUTI) at the University of South Florida; Project ACTION; Sverdrup Civil, Inc.; and the Women’s Transportation Seminar(WTS) sponsored the 1997 symposium.
The symposium team members were:
Demetrus “Mike” Crittenden, Senior Research Associate, CUTREric T. Hill, Senior Research Associate, CUTRBeverly G. Ward, Director for Ethnography and Transportation Systems, CUTR
and
Fredalyn M. Frasier, Assistant Director, Bureau of Planning, City of Atlanta
The following Steering Committee Members provided guidance and had an active role in making the symposium asuccess:
Deborah A. Price, Co-chairperson, District of Columbia Department of Public Works
Franklin E. White, Co-chairperson, Independent Consultant
Sharon Banks, Alameda-Contra Costa Transit District
Sheron D. Bellamy, Hillsborough Area Regional Transit Authority
Cecil W. Bond, Jr., Southeastern Pennsylvania Transportation Authority
Alyce Boyd-Stewart, J.D., Office of the Secretary, U. S. Department of Transportation
Gary L. Brosch, Center for Urban Transportation Research
Gwendolyn Chisholm, Transportation Research Board
Gwendolyn Cooper, Federal Transit Administration
Lee Davis, National Transportation Consortium of Minority Colleges
Frank Enty, Ph. D., Department of Health and Human Services
Raymond M. Flood, Student, Florida Agricultural and Mechanical University
Marion Hart, Florida Department of Transportation
6 ❐ PROCEEDINGS OF SYMPOSIUM IV ON AFRICAN-AMERICAN MOBILITY ISSUES
Gayle Holliday, Kansas City Area Transportation Authority
Gloria J. Jeff, Federal Highway Administration
Sylvan C. Jolibois, Jr., Ph.D., Florida International University
Joyce Johnson,Transportation Institute, North Carolina Agricultural & Technical State University
The Honorable Arthur W. Kennedy, Florida Transportation Commission
Joyce E. Latson, Hillsborough County Clerk of the Circuit Court
Wade Lawson, South Jersey Transportation Authority
William H. McCloud, ATC/VANCOM
Ilene Payne, Ph.D., Federal Highway Administration
Sharon Ransome-Smith, Project ACTION, National Easter Seal Society
Stephanie Nellons Robinson, Ryder/ATE Management & Service Company, Inc.
Rosalyn M. Simon, Ph. D., Amtrak, National Railroad Passenger Corporation
Joel Volinski , Center for Urban Transportation Research
Tom C. Whitney, Ph.D., South Carolina State University
Vivienne Williams, American Public Transit Association
Charles Wright, Ph. D., P. E., Florida Agricultural & Mechanical University
Developing the symposium required significant technical assistance from CUTR staff members and local privateand public service providers, both during and afterwards. These individuals were:
Vasti Amaro, Sharon Dent, Rickey Kendall, Terri Murph, and Albert Perry, Hillsborough Area Regional TransitAuthority (HARTline)
W. Joseph Balderson, Program Assistant, CUTRPatricia Baptiste, Program Assistant, CUTRMaria Berlin, Berlin DesignsR. Colette Glover-Hannah, Public Affairs, University of South FloridaJulée Green, Program Assistant, CUTRNevine Georggi, Librarian, CUTRGwen Hollis, Senior Secretary, CUTRPamela LaPaugh, Clerk, CUTRRosemary Mathias, Paratransit Program Manager, CUTRSteve Polzin, Deputy Director for Institutes, CUTRCindy Wooten, MIS Manager, CUTRVicki Zambito, Training Coordinator, CUTR
CUTR and the AAMS Steering Committee extend a special thank you to Angie Summons and the staff ofMultiConsultant Associates!
7SUMMARY ❐
SummarySummary
In March 1994, the Center for Ur-ban Transportation Research(CUTR) at the Unversity of South
Florida convened a symposium on African-American mobility issues. African-Ameri-can faculty members at CUTR acted as theprincipal investigators. More than 60 par-ticipants attended and the symposium re-ceived a good rating. Participants stronglyrecommended that the symposium be re-peated in 1995 and expanded to a two-dayformat.
In April 1995, CUTR convened a secondsymposium for two days. The 1995 sympo-sium was significant in that it featured thekeynote addresses by Mr. Gordon Linton,Administrator of the Federal Transit Admin-istration and Mr. Rodney Slater, then Ad-ministrator of the Federal Highway Admin-istration, and a presentation by Florida StateSenator James Hargrett. Panelists and at-tendees at the 1995 symposium gave theevent a good rating again and pledged theirsupport of future meetings.
The 1996 symposium , held April 14through 16, built on the experiences and is-sues provided from the earlier symposia andcontinued the discourse on the special trans-portation needs of the African-Americancommunity. It provided a forum for con-tinuing the exchange of ideas, information,and for discussion of transportation plan-ning, programming, and policy issues asthey relate to the African-American popu-lation. That year’s symposium includedadditional information and technologytransfer activites that extended beyond theconvening of the symposium, including theestablishment of an Internet presence andvideo production of the inspirational key-note address of the Honorable Alcee
Hastings, U. S. House of Representatives,23rd District.
Based on the ratings and recommenda-tions received in 1996, a fourth symposiumwas convened, again, in Tampa. The fourthsymposium was attended by more than 230participants from the United States and theCaribbean. The principal investigators wereparticularly pleased with the level of studentparticipation, notably from Florida Agricul-tural and Mechanical University, Florida In-ternational University, South Carolina StateUniversity and the University of SouthFlorida.
As in previous years, the project was acollaborative effort. Sponsors included theCenter for Urban Transportation Research(CUTR), the University of South Florida(USF), . the American Public Transit Asso-ciation (APTA); Amtrak, National RailroadPassenger Corporation; the Conference onMinority Transportation Officials (COMTO);the Federal Highway Administration(FHWA); Federal Transit Administration(FTA); Florida Agricultural & MechanicalUniversity; the Florida Transit Association;General Motors, Inc.; Hillsborough RegionalTransit Authority (HARTLine); Institute onBlack Life at the University of South Florida;National Transportation Consortium of Mi-nority Colleges and Universities; NationalTransportation Consortium of States; theNational Urban Transit Institute (NUTI) atthe University of South Florida; Project AC-TION; Sverdrup Civil, Inc.; and the Women’sTransportation Seminar (WTS) A steeringcommittee, representing transportation andpublic officials, was established to assist theproject team in developing topics, sympo-sium format, and potential speakers.
9PROGRAM ❐SYMPOSIUM IV ON
African-American Mobility IssuesAfrican-American Mobility Issues
April 30 - May 2, 1997Wyndham Harbour Island Hotel Tampa, Florida
ProgramProgram
Wednesday, April 30, 1997
11:30 a.m. - Ongoing.............. Registration
11:30 a.m. - 4.30 p.m. ............ Marketplace
1:30 p.m. - 3:15 p.m. ............... Issue Forums
Welfare Reform
Moderator:Rosalyn Simon, Ph.D., Senior Director, Customer Advocacy, National Railroad PassengerCorporation, Washington, D.C.
Presenters:❐ Lois Bell, Technical Assistance and Coordination, Administration for Children andFamilies, Washington, D.C.
Jeannee Elswick-Morrison, Special Populations Coordinator, Department of Childrenand Families, Tallahassee, Florida
Affirmative Action Post-Adarand
Facilitator: Paula Alexander, General Counsel, The Metropolitan Transit Authority of HarrisCounty, Houston, Texas
3:00 p.m. - 3:30 p.m. ............... Break
3:30 p.m. - 4:15 p.m. ............... Poster Session
“Challenges and Opportunities for Minorities Presented by Recent Trends in the TransportationIndustry,” Lewis P. Clopton, Ph.D., P.E., Morgan State University, Baltimore, Maryland
“The Effects of Intelligent Transportation Systems (ITS) on Urban Populations,” HowardTurner, Florida Agricultural and Mechanical University, Tallahassee, Florida
4:15 p.m. - 4:30 p.m. ............... Break
4:30 p.m. - 5:30 p.m. ............... Welcome and Opening Session
10 ❐ PROCEEDINGS OF SYMPOSIUM IV ON AFRICAN-AMERICAN MOBILITY ISSUES
❐ Presentation appears in this volume.
Program (continued)
PresidingGary L. Brosch, Director, Center for Urban Transportation Research (CUTR)
Welcome RemarksDeborah A. Price, Symposium Co-chairperson and Administrator, Office of MassTransit, District of Columbia Department of Public Works, Washington, D. C.
GreetingsMichael G. Kovac, Ph.D., Dean, University of South Florida, College of Engineering,Tampa, Florida
Keynote AddressThe Honorable Gordon J. Linton, Administrator, Federal Transit Administration, U. S.Department of Transportation, Washington, D.C.
Closing RemarksDeborah A. Price
6:00 p.m. - 7:30 p.m. ............... Reception and Marketplace Open
Thursday, May 1, 1997
7:30 a.m. ..................................... Registration
7:30 a.m. - 8:15 a.m. ................ Continental Breakfast
8:30 a.m. - 10:00 a.m. ............. Opening Plenary Session and Symposium Overview
“Transportation and the African-American Community: Opportunities for the 21stCentury”
Presiding: Franklin E. White, Symposium Co-chairperson and Independent Consultant, LosAngeles, California
Keynote Speaker:Gloria J. Jeff, Associate Administrator for Policy, Federal Highway Administration, U.S. Department of Transportation, Washington, D.C.
10:00 a.m. - 10:15 a.m. ........... Break
10:15 a.m. - 12:00 noon .......... Concurrent Workshops
11PROGRAM ❐
❐ Presentation appears in this volume.
Program (continued)
Workshop I
TRAVEL PATTERNS
Moderator:Alyce Boyd-Stewart, Senior Equal Opportunity Specialist, U. S. Department ofTransportation, Washington, D. C.
Presenters:❐ “Van Service Access in Detroit for Low-Income Women Needing Prenatal Care(Paper),” Talia McCray, University of Michigan, Ann Arbor
“Ethnic and Racial Differences in Commuting Behavior of Men and Women (Paper),”Rudolph Wilson, Ph.D., Chair, Norfolk State University, Norfolk, Virginia
❐ “Daily Travel by Persons with Low Income,” Elaine Murakami, Community Planner,Federal Highway Administration, U. S. Department of Transportation, Washington, D.C.
Workshop II
PUBLIC PARTICIPATION
Moderator:Grover Hankins, Ph.D., Thurgood Marshall School of Law, Houston, Texas
Presenters:❐ “Implementing Effective Public Involvement Methods to Increase Participation inTransportation Planning by African-Americans (Paper),” Patrice Koonce Rosemond,Miami-Dade Transit Agency, Miami, Florida
❐ “Los Angeles Neighborhood Initiative: A Model for Economic Revitalization UsingCitizen-Driven Transportation Improvements,” Joyce Perkins, Los AngelesNeighborhood Initiative (LANI), Los Angeles, California
“The Political, Economic, Social, and Ecological Impact of Eliminating the Federal TransitOperating Subsidy,” Christopher Niles, Organizing and Research Consultant, The NilesFiles, Takoma Park, Maryland
Workshop III
ENVIRONMENTAL JUSTICE
Moderator: Michele DePass, Esquire, New York City Environmental Justice Alliance,New York, New York
❐ Presentation appears in this volume.
12 ❐ PROCEEDINGS OF SYMPOSIUM IV ON AFRICAN-AMERICAN MOBILITY ISSUES
Program (continued)
Presenters:“Environmental Justice: Past, Present, and Future,” Robert Knox, Deputy Director, Officeof Environmental Justice, Environmental Protection Agency, Washington, D. C.
“Environmental Justice Overview,” Eugene Cleckley, Chief, Environmental OperationsDivision, Federal Highway Administration, Washington, D. C.
“The Blast at Ground Level,” Marilyn Ababio, Sunshine Environmental Services,Willingboro, New Jersey
❐ “Consideration of Environmental Justice Issues During the NEPA Evaluation (Paper),”Cheryl Calloway, Cooley Law School, Lansing, Michigan
Workshop IV
AMERICANS WITH DISABILITIES
Moderator: Sharon Ransome-Smith, Project Manager NIAT, Project ACTION, NationalEaster Seal Society, Washington, D. C.
Presenters:
“Legal Realities of the ADA for Transit Providers and People with Disabilities,”Clementine W. Morris, Ed.D., Principal, C. W. M. Associates, Louisville, Kentucky
“ADA Challenges and Opportunities: Paratransit Contracting Methods,” Rosalyn Simon,Ph.D., Senior Director, Customer Advocacy, Amtrak, National Railroad PassengerCorporation, Washington, D.C.
12:15 p.m. - 2:00 p.m. ............. Luncheon
Presiding:Ronald L. Barnes, National President and Board Chair, Conference of MinorityTransportation Officials, and Deputy General Manager, Greater Cleveland RegionalTransit Authority, Cleveland, Ohio
Invocation:Reverend Thomas Scott, Commissioner, Hillsborough County, Tampa, Florida
Introduction of Keynote Speaker:The Honorable Arthenia L. Joyner, Commissioner, Hillsborough County AviationAuthority, Tampa, Florida
Keynote Speaker:Mark Alan Hughes, Ph.D., Vice President for Policy Development, Public/PrivateVentures, Philadelphia, Pennsylvania
❐ Presentation appears in this volume.
13PROGRAM ❐
Program (continued)
2:00 p.m. - 2:15 p.m. ............... Break
2:15 p.m. - 3:45 p.m. ............... Concurrent Workshops
Workshop V
TRANSPORTATION AND LAND-USE
Moderator:Joel Volinski, Deputy Director for Transit, Center for Urban Transportation Research,University of South Florida, Tampa
Presenters:❐ “Location Characteristics of Inner-City Neighborhoods and Employment Accessibilityof Low-wage Workers (Paper),” Qing Shen, Massachusetts Institute of Technology,Cambridge, Massachusetts
❐ “Location Efficient Mortgage Project,” Jacky Grimshaw, Coordinator, Transportationand Air Quality, Center for Neighborhood Technology, Chicago, Illinois
Workshop VI
PUBLIC EDUCATION
Moderator:Ilene Payne, Ph.D., Director, Universities and Grants Programs, National HighwayInstitute, Federal Highway Administration, U. S. Department of Transportation,Washington, D. C.
Presenters:❐ “Public Education in Urban Centers: Analysis, Trends, and Policy Issues,” Lora G.Mayo, Commissioner, Baltimore City Public Schools, Baltimore, Maryland
❐ “The Church: An Alternative Urban Transportation Amenity (Paper),” CharlesWright, Ph.D., P.E., Florida Agricultural and Mechanical University, Tallahassee, Florida
Workshop VII
LIVABLE COMMUNITIES
Moderator:Gwendolyn Chisholm, Senior Program Officer, Transportation Research Board,Washington, D. C.
❐ Presentation appears in this volume.
14 ❐ PROCEEDINGS OF SYMPOSIUM IV ON AFRICAN-AMERICAN MOBILITY ISSUES
Program (continued)
Presenters:❐ “Traffic Calming and its Role in Creating Livable Inner City Communities (Paper),”Ian Lockwood, City of West Palm Beach, Florida
“The Livable Communities Project,” Aurelia Jones-Taylor, Executive Director,Community Health Center, Clarksdale, Mississippi
“Livable Communities,” Fernando Benavidez, Project Manager, Corpus Christi RegionalTransportation Authority, Corpus Christi, Texas
Workshop VIII
TRANSPORTATION AND THE EMPLOYMENT MISMATCH
Moderator:Gloria J. Jeff, Associate Administrator for Policy, Federal Highway Administration,Washington, D. C.
Presenters:“It’s Economic Development, Not a Poverty Program,” Ernest Maddox, The World ofWork, Ltd., St. Clair Shores, Michigan
“Time-Limited Welfare,” Neil Bania, Ph.D., Associate Director for Community Analysis,Center on Urban Poverty and Social Change, Cleveland, Ohio
“Transit and Welfare Reform,” Diana Carsey, Hillsborough Area Regional TransitAuthority (HARTLine), Tampa, Florida
3:45 p.m. - 4:00 p.m. ............... Break
4:00 p.m. - 5:30 p.m. ............... Concurrent Sessions
Workshop IX
INTERMODALISM
Moderator:William H. McCloud, Senior Vice President, ATC/VANCOM, Oakbrook Terrace, Illinois
Presenters:“Intermodal Flexibility and Opportunities: Community/Stakeholder Partnerships(Paper),” Francis Wambalaba, Ph.D., Tri-Met, Portland, Oregon
“Mobility for Minorities,” Lucie Ayer, Executive Director, Hillsborough CountyMetropolitan Planning Organization, Tampa, Florida
❐ Presentation appears in this volume.
15PROGRAM ❐
Program (continued)
“The Intermodal Transit System of the Future: Where Do We Go From Here and WhatDoes It Mean for the Communities Served?,” Emmett Crockett, Associate Director Officeof Business Planning and Development, Washington Metropolitan Area TransportationAuthority, Washington, D. C.
Workshop X
ADVANCED TECHNOLOGIES
Moderator: Sylvan C. Jolibois, Jr., Ph.D., Assistant Professor and Deputy Director, Lehman Centerfor Transportation Research, Florida International University, Miami
Presenters:❐ “Technology, Transportation, and African-Americans: No Innovations in PolicyDirectives (Paper),” Terrence Taylor, Miami-Dade Metropolitan Planning Organization,Miami, Florida
“The Impacts of Intelligent Transportation Systems on Minority and RuralCommunities,” Stephen Blake, Center for Transportation Training, Education, andResearch, Springfield, Virginia
“Emerging Fare Collection Technologies in Mass Transit and the Low-Income African-American Population,” Nii O. Attoh-Okine, Ph.D., Department of Civil andEnvironmental Engineering, Florida International University, Miami, Florida
Workshop XI
ACCESS TO JOBS
Moderator:Gayle Holliday, Deputy General Manager, Kansas City Transit Authority, Kansas City,Missouri
Presenters:❐ “Broward County Minibus Demonstration Project (Paper),” Fabian Cevallos, BrowardCounty Transit, Pompano Beach, Florida
“Lower Income Market and Welfare Reform: A Market Opportunity for TransitSystems,” Morris Davis, M. Davis and Company, Philadelphia, Pennsylvania
❐ “First Report from the Field on the Bridges to Work Demonstration,” Richard Presha,Public/Private Ventures, Philadelphia, Pennsylvania
❐ Presentation appears in this volume.
16 ❐ PROCEEDINGS OF SYMPOSIUM IV ON AFRICAN-AMERICAN MOBILITY ISSUES
Program (continued)
“Federal Access to Jobs Initiatives,” Gwendolyn R. Cooper, Office of ResearchManagement, Federal Transit Administration, U. S. Department of Transportation,Washington, D. C.
5:30 p.m. .................................... Adjourn
7:00 p.m. .................................... SPECIAL EVENT: Blues Ship, Ybor City
Friday, May 2, 1997
8:00 a.m. ..................................... Continental Breakfast
8:30 a.m. - 10:15 a.m. ............ Plenary Session
NEXTEA PANEL
Moderator:Jomoya S. Mobutu, Chief, Fair Employment Practices, Metro-Dade Transit Agency,Miami, Florida
Panelists:Reverend Jerry Moore, Interim Executive Director, Conference of MinorityTransportation Officials (COMTO), Washington, D. C.
Scott Paine, Ph.D., Councillor, Tampa, and, Chairperson, Hillsborough CountyMetropolitan Planning Organization, Tampa, Florida
The Honorable Edward L. Jennings, Sr., Mayor, City of Gainesville, Gainesville, Florida,and Representative, National Conference of Black Mayors
10:15 a.m. - 10:45 a.m. ........... Break
10:45 a.m. - 12:00 noon .......... Plenary Session
❐ FUTURE RESEARCH NEEDS AND POLICY IMPLICATIONS
Moderator: Franklin E. White, Symposium Co-chairperson and Independent Consultant,Los Angeles, California
Presenters:Ronald L. Barnes, National President and Board Chair, Conference of MinorityTransportation Officials (COMTO), and Deputy General Manager, Greater ClevelandRegional Transit Authority, Cleveland, Ohio
❐ Presentation appears in this volume.
17PROGRAM ❐
Program (continued)
Alyce Boyd-Stewart, Senior Equal Opportunity Specialist, Office of the Secretary, U. S.Department of Transportation, Washington, D. C.
Gwendolyn R. Cooper, Office of Research Management, Federal Transit Administration,U. S. Department of Transportation, Washington, D. C.
Gloria Jeff, Associate Administrator for Policy, Federal Highway Administration, U. S.Department of Transportation, Washington, D. C.
Ilene Payne, Ph.D., Director, Universities and Grants Programs, National HighwayInstitute, Federal Highway Administration, U. S. Department of Transportation,Arlington, Virginia
Sharon Ransome-Smith, Project Manager NIAT, Project ACTION, National Easter SealSociety, Washington, D. C.
12:00 noon ................................. Final Session and Evaluations
Closing RemarksFranklin E. White, Symposium Co-chairperson and Independent Consultant, LosAngeles, California
12:30 p.m. .................................. Adjourn
❐ Presentation appears in this volume.

18 ❐ PROCEEDINGS OF SYMPOSIUM IV ON AFRICAN-AMERICAN MOBILITY ISSUES
19PROGRAM ❐
Marilyn Ababio is an entrepreneur and Chief OperationsOfficer of Sunshine Environmental Services,Willingboro, New Jersey.
Paula Alexander, Esq., is General Counsel of the Metro-politan Transit Authority of Harris County in Hous-ton, Texas.
Nii O. Attoh-Okine, Ph.D., is AssistantProfessor of Trans-portation Engineering in theDepartment of Civil andEnvironmental Engineering at Florida InternationalUniversity in Miami.
Lucilla L. Ayer, AICP , is Executive Director of theHillsborough County Metropolitan Planning Orga-nization in Tampa.
Neil Bania, Ph.D., is Associate Director for CommunityAnalysis of the Center on Urban Poverty and SocialChange, Case Western Reserve University, Cleve-land, Ohio.
Ronald L. Barnes is National President and Board Chairof the Conference of Minority Transportation Offi-cials and General Manager of the Columbus OhioTransit Authority.
Lois A. Bell is Chief, TANF Technical Assistance and Co-ordination of the Office of Family Assistance Ad-ministration for Children and Families, U. S. Depart-ment of Health and Human Servicesin Washington,D.C.
Fernando Benavidez is Project Manager at the CorpusChristi Regional Transportation Authority in Texas.
SYMPOSIUM IV ON
African-American Mobility IssuesAfrican-American Mobility Issues
April 30 - May 2, 1997Wyndham Harbour Island Hotel Tampa, Florida
Facilitators, Presenters, and SpeakersFacilitators, Presenters, and Speakers
Stephen Blake is with the Center for Transportation Train-ing, Education, and Research in Springfield, Virginia
Alyce Boyd-Stewart, Esq., is Senior Equal Opportunity Spe-cialist of the U. S. Department of Transportation,Washington, D. C.
Gary L. Brosch is Director of the Center for Urban Trans-portation Research (CUTR) at the University of ofSouth Florida in Tampa.
Cheryl Calloway is Adjunct Professor of EnvironmentalLaw at the Thomas S. Cooley Law School and Presi-dent of ENVIRONICS in Lansing, Michigan.
Diana Carsey is Director of Planning of the HillsboroughArea Regional Transit Authority (HARTLine) inTampa.
Fabian G. Cevallos is Assistant Planner of the BrowardCounty Commission, Mass Transit Division in Pom-pano Beach.
Gwendolyn Chisholm isSenior Program Officer of the Tran-sit Cooperative Research Program, TransportationResearch Board, Washington, D. C.
Eugene W. Cleckley is Chief of theEnvironmental Opera-tions Division, Federal Highway Administration, U.S. Department of Transportation inWashington, D.C.
Lewis P. Clopton, Ph.D., P.E., is Director of the Office ofResearch Management, Federal Transit Administra-
20 ❐ PROCEEDINGS OF SYMPOSIUM IV ON AFRICAN-AMERICAN MOBILITY ISSUES
tion, U. S. Department of Transportation in Wash-ington, D.C.
Gwendolyn R. Cooper is with the Office of Research Man-agement in the Federal Transit Administration, U.S. Department of Transportation in Washington, D.C.
Emmett Crockett is Associate Director of theOffice of Busi-ness Planning and Development at the WashingtonMetropolitan Area Transportation Authority inWashington, D. C.
Morris Davis is Principal of M. Davis and Company,Philadelphia, Pennsylvania.
Michele DePass, Esq., is Executive Director of the NewYork City Environmental Justice Alliance, New York,New York
Jeannee Elswick-Morrison is Special Populations Coordi-nator of the Department of Children and Families inTallahassee, Florida
Jacky Grimshaw is Coordinator, Transportation and AirQuality of the Center for Neighborhood Technology,Chicago, Illinois.
Grover G. Hankins, Esq., is Professor and Director of theEnvironmental Justice Clinic, Thurgood MarshallSchool of Law at Texas Southern University in Hous-ton, Texas.
Gayle Holliday is Deputy General Manager of the KansasCity Area Transit Authority in Kansas City, Missouri.
Mark Alan Hughes, Ph.D., is Vice President for PolicyDevelopment of Public/Private Ventures in Phila-delphia, Pennsylvania.
The Honorable Gloria J. Jeff is Associate Administrator forPolicy of the Federal Highway Administration, U.S. Department of Transportation, Washington, D.C.
The Honorable Edward L. Jennings, Sr., is Mayor of the Cityof Gainesville and a Representative of the NationalConference of Black Mayors.
Aurelia Jones-Taylor is Executive Director of the AaronHenry Community Health Center in Clarksdale, Mis-sissippi.
Sylvan C. Jolibois, Jr., Ph.D., is Assistant Professor ofTransportation Engineering and Deputy Director ofthe Lehman Center for Transportation Research atFlorida International University, in Miami.
The Honorable Arthenia L. Joyner, Esq. is a Commissionerof Hillsborough County Aviation Authority inFlorida.
Robert Knox is Deputy Director of the Office of Environ-mental Justice, Environmental Protection Agency,Washington, D. C.
Michael G. Kovac, Ph.D., P.E., is Dean of the College ofEngineering at the University of South Florida inTampa.
The Honorable Gordon J. Linton isAdministrator of the Fed-eral Transit Administration, U. S. Department ofTransportation in Washington, D.C.Deborah A. Priceis Administrator, Office of Mass Transit, District ofColumbia Department of Public WorksinWashington, D. C.
Ian Lockwood is City Transportation Planner of West PalmBeach.
Ernest Maddox is Principal of The World of Work, Ltd.,St. Clair Shores, Michigan.
Lora G. Mayo is a Commissioner of the Baltimore CityPublic Schools System in Maryland and SoftwareApplications Developer of the Washington Metro-politan Area Transit Authority, Washington, D. C.
William H. McCloud is Senior Vice President of ATC/VANCOM in Oakbrook Terrace, Illinois.
Talia M. McCray is a graduate student of the Horace H.Rackham School of Graduate Studies at the Univer-sity of Michigan in Ann Arbor.
Reverend Jerry Moore is a Board Member of the Confer-ence of Minority Transportation Officials (COMTO),Washington, D. C.
Clementine W. Morris, Ed.D., is Principal of C. W. M. As-sociates in Louisville, Kentucky.
Jomoya S. Mobutu is with the Washington MetropolitanArea Transportation Authority in Washington, D.C.
21PROGRAM ❐
Elaine Murakami is Community Planner of the FederalHighway Administration, U. S. Department ofTransportation, Washington, D. C.
Christopher Niles isOrganizing and Research Consultantof The Niles Files, Takoma Park, Maryland.
Scott Paine, Ph.D., is a Council Member for the City ofTampa and Chairperson of the Hillsborough CountyMetropolitan Planning Organization.
Ilene Payne, Ph.D., is Director of the Universities andGrants Programs at the National Highway Institute,Federal Highway Administration, U. S. Departmentof Transportation, Washington, D. C.
Joyce Perkins is Research and Organizing Consultant forthe Los Angeles Neighborhood Initiative (LANI) inCalifornia.
Richard Presha is Director of Operations, Public/PrivateVentures in Philadelphia, Pennsylvania.
Sharon Ransome-Smith is Project Manager NIAT, ProjectACTION, National Easter Seal Society in Washing-ton, D. C.
Patrice Koonce Rosemond is Chief of the Public Involve-ment , Miami-Dade Transit Agency in Miami.
The Honorable Reverend Thomas Scott is a Commissionerof Hillsborough County in Florida.
Qing Shen is Assistant Professor, Department of UrbanStudies and Planning, Massachusetts Institute ofTechnology, Cambridge, Massachusetts.
Rosalyn Simon, Ph.D., is Senior Director, Customer Ad-vocacy, Amtrak, National Railroad Passenger Cor-poration in Washington, D.C.
Terrence A. Taylor is Administrative Assistant III at theMiami-Dade Metropolitan Planning Organization inMiami.
Howard Turner, is a graduate student in Civil and Sur-veying Engineering, Florida Agricultural and Me-chanical University in Tallahassee.
Joel Volinski is Deputy Director for Transit of the Centerfor Urban Transportation Research at the Univer-sity of South Florida in Tampa.
Francis Wambalaba, Ph.D., is Senior Planner of the Tri-Metropolitan Transportation District of Oregon andAdjucnt Assistant Professor, Black Studies Depart-ment, Portland State University in Portland, Oregon.
Franklin E. White is Symposium Co-chairperson and anIndependent Consultant in Los Angeles, California.
Rudolph Wilson, Ph.D., is Department Head of PoliticalScience and Economics at Norfolk State Universityin Virginia.
Charles Wright, Ph.D., P.E., is Director of the NationalUrban Transit Institute and Professor of Engineer-ing at Florida Agricultural and Mechanical Univer-sity in Tallahassee.

22 ❐ PROCEEDINGS OF SYMPOSIUM IV ON AFRICAN-AMERICAN MOBILITY ISSUES
23TRANSPORTATION ISSUES IN WELFARE-TO-WORK PROGRAMS ❐
Transportation Issues in Welfare-to-Work ProgramsTransportation Issues in Welfare-to-Work Programs
Lois A. BellU. S. Department of Health and Human Services
Overview
Title I of the Personal Responsibility and Work Opportunity Reconciliation Act (PRWORA) of 1996
(P.L. 104-193) creates the Temporary Assis-tance for Needy Families (TANF) programwhich transforms welfare into a system thatrequires work in exchange for time-limitedassistance. The law specifically eliminatesany individual entitlement to or guaranteeof assistance and replaces the Aid to Fami-lies with Dependant Children, Job Oppor-tunities and Basic Skills Training and Emer-gency Assistance programs with a singleblock grant to States under Title IV of theSocial Security Act.
Now more than ever before, the Statesand Federal governments will have to worktogether as partners in order to meet themany requirements and outcome measuresunder TANF. In addition, time is of anessence since the clock is ticking for familiesto meet the work requirement. Moreimportantly, the clock is ticking on families'lifetime limit to receive assistance.
BackgroundOn August 22, 1996, H.R. 3734,
PRWORA was enacted. Even though Stateshave a great deal of flexibility in the designof their TANF programs, they continue tohave many requirements to meet.
Under TANF, States are required to as-sess the skills of recipients and help themprepare for and find work. States may cre-ate community service jobs, or provide in-come subsidies or hiring incentives for po-tential employers. In addition, they mustassure that adult recipients work after receiv-ing assistance for 24 months or less, with fewexceptions. Also, States cannot allow fami-
lies, unless exempt, who have received as-sistance for five cumulative years (or less atState option) to be eligible for assistancefunded with Federal TANF funds.
States also must meet specific outcomemeasures. For example, 25 percent of allfamilies must be engaged in work activitiesin fiscal year (FY) 1997, rising by five per-cent each fiscal year until the requirementreaches 50 percent in FY 2002. Seventy- fivepercent of two-parent families must be work-ing or engaged in job preparation activitiesin fiscal years 1997-98, and 90 percent there-after. To count in the all-families rate, indi-viduals must be working or engaged in jobpreparation activities for at least 20 hours perweek the first year,increasing to 30 hours perweek by FY 2000. In two-parent families, atleast one individual must work 35 hours perweek.
In order to achieve these outcomes,States must help increasing numbers of cli-ents prepare for, find, and maintain jobs.Inevitably, this means working with someclients who are difficult to place. Many lackbasic skills that employers require. Othershave skills, but face significant challenges ingetting and keeping jobs, such as lack oftransportation and violence at home.
Welfare-to-Work Transportation:The Critical Link
Research and project experience haveshown that the availability of transportationis a critical element to the successful transi-tion from dependence on welfare to indepen-dent employment. I intend to highlight whatwe currently know about this element of wel-fare reform, highlight some projects cur-rently underway designed to alleviate theproblem, and make some recommendationsfor transit and human services agencies.
24 ❐ PROCEEDINGS OF SYMPOSIUM IV ON AFRICAN-AMERICAN MOBILITY ISSUES
What We Know The Manpower Demonstration Re-
search Corporation reported,depending onthe specific characteristics of the subsample,between one-fourth and one-third of thosesurveyed experienced the lack of transpor-tation as a significant barrier to consistentparticipation in the JOBS program (the workcomponent of the AFDC program).
During regional HHS/DOT meetings inlate 1995 and 1996, state human services of-ficials repeatedly indicated transportationwould play a major role in their ability tomeet the proposed welfare reform partici-pation rates.
The Federal Transit Administration,USDOT reports only 6.5 percent of welfarerecipients own private automobiles. Thespatial displacement of jobs and welfarerecipients leaves jobseekers at odds withpublic transportation systems which focuson express buses and trains into the city inthe morning and out in the evening on atraditional workday schedule.
A recent study in Cleveland, Ohio, re-vealed that over half of the entry level-jobsinvolved nontraditional work hours, orworking at more than one job site, and 80percent of the new jobs were in the suburbs.
What is currently being done
HHS is working with a number of otherfederal agencies and national organizationsto develop creative ways to get welfare re-cipients to and from work and child care.The Joint DHHS/DOT Coordinating Coun-cil on Human Services Transportation hasformed a task force on welfare reformtransportation which will reach to other fed-eral departments and agencies to promote acollaborative strategy.
HHS is advising FTA on the JOBLINKSproject, which has 16 demonstrations of in-novative approaches to linking low-
income individuals and employment loca-tions. We are also serving as technical advi-sors on the Bridges to Work project, a HUD/DOT/private partnership demonstrationthat seeks to address transportation needsin a comprehensive, supportive servicesstrategy to transition welfare recipients to in-dependence.
RecommendationsThere are four essential ingredients to
successfully overcome the transportationbarrier to welfare-to-work strategies: col-laboration, planning, coordination, and fi-nancing.
❐ Collaboration: It is imperative thatall the necessary parties come togetherto pool and allocate resources to address theproblem rather than undertake separatestrategies. The local transit authority, hu-man services agencies, community groups,economic development agencies, and em-ployers must work together to forge solu-tions.
❐ Planning: The collaboration mustestablish a mechanism to coordinate trans-portation and welfare-to-work program de-sign planning.
❐ Coordination: The collaborationmust design an implementation plan: whois responsible for what, and who is to pro-vide what service and when. There shouldalso be a monitoring mechanism to ensurethat the plan is operating as envisioned andis achieving the desired results. Thereshould also be a means to modify the plan ifmonitoring information indicates thatchanges should be made.
❐ Financing: The transformation oflow income individuals from welfare towork is the shared responsibility of trans-portation agencies, human service, employ-ment service, job training programs, eco-nomic development agencies, and the pri-vate sector. Therefore, all sectors must sharein the financing of the effort.
The FederalTransit
Administration,USDOT, reports
only 6.5 percent ofwelfare recipients
own privateautomobiles.
25VAN SERVICE ACCESS IN DETROIT FOR LOW-INCOME WOMEN NEEDING PRENATAL CARE ❐
Van Service Access in Detroit for Low-Income Women NeedingVan Service Access in Detroit for Low-Income Women NeedingPrenatal CarePrenatal Care
Talia M. McCrayUniversity of Michigan
Introduction
Given that there are many reasonswhy low-income pregnantwomen do not begin or keep
their prenatal care appointments, the trans-portation factor is often minimized. Prena-tal care plays a major role in preventing low-birth weight and other adverse pregnancyoutcomes (Leveno, et al., 1985; Greenberg,1983; Sokol, et al., 1980). Several studies haveidentified transportation as a common bar-rier to receiving adequate prenatal care(Kalmus and Fennelly, 1990; Lia-Hoagberg,et al., 1990; Ny, et al., 1993; Poland, et al.,1987). These studies found that low-incomewomen did not have access to a private ve-hicle and had to rely on others or publictransportation for their appointments. Inmany cases, not having access to a vehicledeterred their desire to begin or continue pre-natal care. Public transportation created aproblem because of the cost of transporta-tion, unreliable bus schedules, long travel-ing times to move from a woman’s home toa health care provider’s office, poor weather,and dangerous conditions at bus stops. Inaddition, if a woman had childcare problems,she was also very likely to have transporta-tion problems (Lia-Hoagberg, et al.). Eventhough transportation was identified as abarrier to receiving prenatal care, the stud-ies did not include this factor in their analy-ses. The question then becomes to what de-gree is this a problem, and if a specializedform of transportation is provided, will agreater number of low-income women re-ceive prenatal care.
To provide physical access, the HealthyBaby Service (HBS) was started in 1988 toaid in the reduction of infant mortality in lowincome communities by lessening the barrierof transportation to and from health care fa-
cilities. This free door-to-door service is pro-vided to low income women within the Cityof Detroit and Wayne County for the pur-pose of prenatal care, well-baby care, visitsto neonatal intensive care, and participationin health and nutrition programs. In 1996,the HBS provided 18,000 one-way rides toclinics and hospitals in the City of Detroitand Wayne County (Lindsey, 1997). Theservice runs its operation out of the HermanKiefer Clinic in Detroit, Michigan, and is fi-nancially supported by the Detroit andWayne County Health Departments,Healthy Start Initiative, United Way Com-munity Service, and Medicaid revenue. Anunusual characteristic of the HBS is thatenroute, the drivers counsel the women infamily planning, childrearing, nutrition, andother health-related issues. All drivers mustcomplete a six-week course on social servicecounseling. Many of the drivers and dis-patchers are women or individuals who canidentify with the economical hardships of theclients, as many of them were once on wel-fare.
The overall purpose of the research is tounderstand the complexity of barriers thatexist for low-income women needing prena-tal care, and to evaluate the service provi-sion by the HBS in order to be able to sug-gest ways for improvement. Informationand knowledge gathered will be used for ap-plications elsewhere. Focus groups, throughthe unique voice of the clients, served as theprimary evaluation tool of the HBS, and as apreliminary stage in generating a surveyquestionnaire.
BackgroundPreliminary analysis was performed us-
ing logistic regression to support the argu-ment that a high percentage of women liv-
26 ❐ PROCEEDINGS OF SYMPOSIUM IV ON AFRICAN-AMERICAN MOBILITY ISSUES
ing in the City of Detroit do not have accessto a private vehicle. The data were extractedfrom the 1990 Census of Population andHousing Public Use Microdata Area(PUMA) files. PUMA data files are samplesof the individual household records fromaggregates of census tracts with a total popu-lation of at least 100,000. These computer-accessible files contain records of 5% samplesof the housing units in the United States andthe persons living in them. Informationavailable are characteristics of each housingunit and the people in it. All identifying in-formation has been removed to protect theconfidentiality of the respondents (PUMShome page). Overall, households in the Cityof Detroit had a family income between $0.00and $345,499.00, with a mean family incomeof $27,577.98. Households headed by singlefemales consistently had a lower degree ofaccess to vehicles and lower family incomethan those households headed by marriedcouples. The logistic regression equation es-timated the probability a woman would haveaccess to a vehicle versus not having accessbased on age, family income, and educationfor women between the ages of 16 and 45years. The following equation was devel-oped to estimate the probability of havingaccess to a vehicle:
π (x)/[1 - π (x)] =exp (-2.753 + 133*ed + (8.25E-)*faminc+0.0221*age)
where:ed is education level (1 [no school]
through 17 [doctorate degree]), faminc isfamily income ($), and age is age measuredin years.
All of the variables in the equation werefound to be significant (p=0.00 approxi-mately) given an alpha = 0.05 level of sig-nificance. Out of the 5,177 records, 520 casewere misclassified giving a 90 percent accu-racy in predicting accessibility of a vehicle.As expected, the results showed the great ef-fect that education and income play on one’sability to have access to a vehicle. Thosewomen who did not make it to the 12th gradewere found to be denied access to a vehicle.Those who had at least a high school diploma
or GED had access to a vehicle. A correla-tion existed between education and familyincome. The more education a woman had,the greater her family income was. Thiswork set the stage for addressing transpor-tation barriers for low-income women need-ing prenatal care.
Having established that a high percent-age of women living in the City of Detroithad no access to a private vehicle, the de-gree of other ecological and attitudinal fac-tors that assist or prevent women in connect-ing with medical services were investigated.Ecological refers to environmental factors ofthe space and time context of the women’sdaily lives. The focus for this research is ona woman’s physical space: the condition ofone’s community, housing, health care facil-ity, environment around public mass trans-portation, and the distance from one’s hometo clinics or hospitals. Time is used as anecological variable to refer to a point in timeor a period of time. The time it takes to travelfrom one’s home to a health care facility ofchoice, and the time spent waiting in a re-ception room to see a health care provideraffects a woman’s ability to receive adequateprenatal care. The above ecological conceptswere taken from theory developed by AmosHawley who defined human ecology as “thestudy of the relation of organisms to theirenvironment.” (1986). Attitudinal factorswere added to reflect how a woman’s per-ception of prenatal care, her attitude towardsher pregnancy, her interpersonal relation-ships, her personal health practices, and herhistory of problems with federal systems af-fect the outcome of her pregnancy.
MethodologyThe sample used in the study consisted
of 20 low-income women in the City of De-troit between the ages of 18 and 46 who areclients of the HBS. Eleven were AfricanAmerican, two were white, and seven wereHispanic.
Three focus groups were held during atwo-week period in March 1997 at the officeof HBS, located at the Herman Kiefer clinicin Detroit, Michigan. The focus group par-ticipants were identified by the head dis-
The focus for thisresearch is on a
woman’s physicalspace: the
condition of one’scommunity,
housing, healthcare facility,
environmentaround public
masstransportation,
and the distancefrom one’s home
to clinics orhospitals.
27VAN SERVICE ACCESS IN DETROIT FOR LOW-INCOME WOMEN NEEDING PRENATAL CARE ❐
patcher of HBS and were paid a stipend of$20.00 for a two hour session. Recognizingthe difficulty in finding affordable child care,mothers were encouraged to bring their chil-dren. A total of twenty women participated,even though thirty women were invited. Todetermine the makeup of the groups, threestrata were defined geographically whereclusters of clients lived in the City of Detroit.The three areas defined were central, north-east, and south.
All sessions were taped to insure accu-racy of reporting, and an assistant was usedto take notes during the sessions. Transcrip-tions of the tapes were verified by the re-searcher and the assistant.
Focus groups are a valuable qualitativemethod that can serve a variety of purposes.They can be used as the basis for a completestudy, or as a supplement to another primarymethod, or as a combination of group andindividual interviews (Morgan, 1997). Ques-tions to the groups were presented in a struc-tured format. The following questions wereused to guide the discussions.
❐ Who have you relied on mostly forsupport during your pregnancy?
❐ What do you see prenatal care do-ing for you? What is prenatal care?
❐ Where do you go for doctor’s care?❐ Why did you choose your particu-
lar hospital or clinic?❐ How are you treated by the nurses
and doctors?❐ Have you ever tried using public
transportation or a taxi to get to your doctor’sappointment?
❐ What do you do with your childrenwhile at the doctor’s office?
❐ Are you working and/or going toschool?
❐ Do you participate in any supportprograms for pregnant women?
❐ What means of transportation doyou use to get to the grocery store or church?
❐ What recommendations would youmake to the HBS?
A spatial analysis was used to investi-gate where clients lived with respect towhere they received prenatal care at healthcare facilities in the City of Detroit. Furtheranalysis was done by locating Detroit De-
partment of Transportation (DDOT) busroutes that serviced the identified facilities.Only those routes that were direct routeswithin a quarter of a mile from the hospitalsand clinics were used for analysis. All spa-tial analyses were performed using ARC/INFO version 7.0.3 and ARCVIEW version4.0.
Results and DiscussionTwenty women participated in the fo-
cus groups. Six African American womenand two White women formed the centralarea focus group. Five African Americanwomen formed the northeast area focusgroup, and seven Hispanic women (all fromMexico) formed the south area focus group.Being that the Hispanic women spoke littleto no English, a Spanish translator was used.Ninety percent of the women were unem-ployed and 79 percent reported having noaccess to a vehicle. All of the women hadsome form of medical insurance, except fortwo. The majority of those covered wereunder Medicaid. Eighty five percent of thewomen were multiparous, with all of themhaving children under the age of six.
Many ecological factors were identifiedthat affect a low income woman’s access toadequate prenatal care. Ecological factorsconsidered to be both barriers and promot-ers of health were identified. It was alsofound that a woman’s attitude towards her-self greatly affected her perception of the im-portance of receiving prenatal care.
After reviewing transcripts, data wereorganized using the technique of contentanalysis under six major headings: HealthCare System, Individual, Social Networks(personal relations), Child Care, CommunityEnvironment (structure), and Transporta-tion.
Transportation modes were modeledin a like fashion to show the degree to whicheach issue was a barrier or promoter to pre-natal care. It was found that some of thebarriers would always remain barriers, andothers if addressed deliberately could be-come promoters of health. For the purposeof this paper, only the transportation modelwill be addressed directly. The ecological
Ninety percent ofthe women wereunemployed and79 percentreported havingno access to avehicle.
28 ❐ PROCEEDINGS OF SYMPOSIUM IV ON AFRICAN-AMERICAN MOBILITY ISSUES
factor of bus stop environments in low in-come communities from the community en-vironment model will be used to express thefear women felt when waiting for publictransportation. To demonstrate travel pat-terns the Health Care System ecological fac-tor will illustrate reasons why women chosecertain hospitals and clinics over others.
The majority of participants reported be-ing within walking distance to bus stops.However, the environment around the busstops was considered to be dangerous.
TM: “Is it safe to take the bus?”M1: “No it’s not! Not at all! I live off
the west side. Grand River is one of the worstbus stops that you can be at. You will getrobbed! My sister-in-law, they robbed herfor a dollar at the Grand River bus stop. It’sthe Plymouth, River, Greenfield [busroutes].”
M2: “Well yeah, I’d have to say I’ve beenrobbed off of Greenfield.”
M1: “I know. Plymouth, Greenfield isone of the worst routes. Plymouth,Greenfield, and Grand River are the worst,and I live by all three of them!”
M3: “And Finkel [bus stop]. My mothergot robbed, and they didn’t even want any-thing. They just wanted to assault her. Theyhit her with poles. She gave them the purse,but they didn’t take it. It was cold.”
The general consensus was that if theservices of the HBS did not exist and publictransportation was the only means to get toa prenatal appointment, they would just notgo. Hispanic women had not experiencedthe same fear that African American womenhad concerning crime at bus stops. The His-panic women reported they did not take thebus because of the language barrier.
M4: “I don’t really know about the bus,where it’s going. I have a language barrier,and don’t speak English. So if I have a ques-tion, how do I ask the bus driver? Whereare you going to stop if you don’t even knowwhere to stop.”
Five of the six areas were identified byparticipants as being barriers to prenatalcare. The category, Other [transportation]Modes Used, was considered a promoter ofhealth. This category included walking andgetting a ride to a prenatal appointment from
a neighbor, friend, spouse, or boyfriend. Themajority of the Hispanic women chose towalk during clement weather to their pre-natal appointments because of the closeproximity of the CHASS clinic that servesthe Hispanic community, although in someinstances close meant up to 15 blocks. Themajority of the nurses and staff are bilingual.
Other major areas of concern for thosewho took public transportation were the costof transportation; the unreliability of thescheduling of DDOT buses; the attitude ofother DDOT riders; and the shortage of di-rect bus routes to hospitals and clinics fromtheir communities. Many had stories to tellof being humiliated and insulted by otherriders on the bus. They felt vulnerable be-cause they were single parents, had morethan one small child to transport, and wereoften weighted down with baby strollers.Under these circumstances a trip that re-quired waiting to transfer from one bus toanother was not tolerable.
M5: “Somebody will have a smart re-mark. I ain’t going to say it out loud, likeyou got all them babies. . .”Very seldom didthe bus driver or riders offer to help themothers.
M6: “They see you standing with ba-bies. They won’t let you sit down. Highschool kids on the bus, they don’t give uptheir seats.”
M7: “Sometimes you didn’t have anymoney to get there, or just didn’t want thehassle of catching two buses, or walking thatlong walk, or waiting for the bus.”
Figure 2 shows the travel patterns of thefocus group participants to health care fa-cilities.
From the figure, one can see that manyof the women travelled to facilities that werelocated far from their homes. Several of theparticipants reported being treated poorlyby physicians and nurses. Often doctors didnot take the time to answer questions thewomen had concerning their pregnancies.For some who had complications, theyblamed the doctors for their poor birth out-comes. For these reasons women oftenchanged doctors from pregnancy to preg-nancy. If they found a health care provideracross town that they felt comfortable with,
The generalconsensus was
that if the servicesof the HBS did not
exist and publictransportation wasthe only means to
get to a prenatalappointment, theywould just not go
29VAN SERVICE ACCESS IN DETROIT FOR LOW-INCOME WOMEN NEEDING PRENATAL CARE ❐
they went to that location. The Hispanicwomen reported some of the same ill treat-ment experienced by nurses.
M8: “The nurses sometime get an atti-tude. The ones that are bilingual get an atti-tude because they have to do something ex-tra other than their work, like translating.Sometimes they say in Spanish that theydon’t speak Spanish.”
The Hispanic women were confined tothe CHASS clinic because of the languagebarrier. They did not have the freedom thatthe women in the other focus groups had tochange facilities. The HBS supports awoman’s decision to choose her health careprovider by providing transportation to anumber of facilities in the city. Figure 2shows the major hospitals and clinics that
they service. All health care facilities withinthe city are accessible through the HBS. Al-though, accessibility to the facilities of lesserdemand are limited to certain days.
Depicted in Figure 3 is a map showingall direct public bus routes located within aquarter of a mile of major health care facili-ties serviced by the HBS in relation to wheretheir clients live.
Many clusters exist where there is obvi-ously no access to a direct route servicing afacility. On first glance one might think thatenough routes exist that provide access to agreat number of clients, but Figure 3 sup-ports the fact that the majority of those cli-ents living next to major routes must still takeat least two buses to reach their chosen healthcare facility. Four main bus routes in figure
Figure 2. Travel Patterns of Focus Group Participants to Hospitals and Clinics in Detroit
30 ❐ PROCEEDINGS OF SYMPOSIUM IV ON AFRICAN-AMERICAN MOBILITY ISSUES
3, Crosstown (route 14), Oakland (route 36),Woodrow Wilson (route 52), and Woodward(route 53) were identified as those directroutes that fell within a quarter of a mile ofHutzel Hospital, University Health Center,and Children’s Hospital. Six of the twentywomen received prenatal care at one of thesefacilities. All of them reside outside of thequarter mile buffers around the routes; andtherefore, would not be able to walk. If theychose to take public transportation, theywould be required to take at least two buses.The map shows that one focus group clientwho receives care at Mercy Hospital lives di-rectly on the Crosstown (route 14) line. An-other client, who receives care at Henry FordHospital, lives just outside of the quarter mile
buffer of Woodrow Wilson (route 52) whichis a direct route to the facility.
The uniqueness of the advocacy roleplayed by the drivers had a positive influ-ence on the clients in helping them keep theirappointments and improving their healthpractices. Their support and friendship en-couraged several of the women to consis-tently keep their prenatal appointments.Many of the clients consider the drivers theirfriends.
M9: “You know they always encourageyou to keep your appointments, or do thebest thing even a lot of things that weren’teven their concern. They tell you like areyou eating right? How many glasses of milkdid you drink today? When they seen mewith pop, [they said] are you suppose to have
Figure 3. All DDOT Bus Routes to Health Facilities Serviced by HBS
31VAN SERVICE ACCESS IN DETROIT FOR LOW-INCOME WOMEN NEEDING PRENATAL CARE ❐
that pop? They always passing out litera-ture. Like I said, they were more than justdrivers. They were like technicians or di-rectors or whatever. You know, whateverthey doing, they doing it well.”
M10: “I call them [drivers] on Christmasand right before New Years. I just like themall. All of them are very sweet.”
Several support programs for low-in-come mothers of small children use the vanservices of the HBS to transport women totheir programs. One of these, WIC (Women,Infants, and Children) is a food and nutri-tion program that is funded by the UnitedStates Department of Agriculture. One ofthe goals of the program is to encouragemore women to breast feed. The programseeks to correct or prevent malnutrition inlow income pregnant women, those who justrecently had a baby, and children up to fiveyears of age. Another program serviced bythe HBS is the Skillman Parenting Program.This program exists to strengthen and sup-port families through offering classes ondeveloping coping skills to deal with theday-to-day changes of life. By transportingwomen to programs that teach parentingskills and support improvement of healthand nutrition practices, the HBS addressesthe attitudinal factors that affect the healthof the mother and her children. In this waythe HBS not only addresses the transporta-tion needs of its clients, but also some as-pects of their quality of life. They are seek-ing to improve the overall physical and men-tal health of the mother and child.
The focus group participants made sev-eral recommendations to the HBS to improvetheir services. The Hispanic women raisedthe issue of not being able to communicatewith the drivers because none of them speakSpanish. Therefore, they supported the hir-ing of a bilingual driver. Several of thewomen complained about the extensiveamount of time spent on vans picking upother riders. They felt that some of the dis-patchers were not efficient in coordinatingpickups within the same area.
M11: “Bernard paces himself where hepicks up all the same people in the same area.The other lady gets on there and she sendsya to Ypsilanti; then way over on the east
side; then way over on the north side; thenway over on the south side. That’s whypeople end up late! When Bernard gets onthere he says, ‘okay. . . this, this, this.’ It’sdone right!”
Bernard is the head dispatcher who hasbeen with the service since its inception in1988. He knows the street network ex-tremely well and serves as the “intelligentrouting system”. The HBS is very much inneed of automating their operation wherereservations, scheduling, and routing couldbe tied together. Presently, they are usingTeletrax with the aid of paper maps to as-sign the routes. If a dispatcher does notknow the street network well, the route as-signment made may not be an efficient one.Other complaints were made concerning thepromptness of pickups. The women felt thatthis was due partially to the time spent inwaiting for riders who after much time of-ten became “no-shows”.
M12: “I’ve never been to an appointmenton time, and I’ve been here two years. Butthey’ll pick you up 45 minutes to an hourbefore [your] appointment!”
M13: (In defense of HBS) “They get tothe house; they [client] not ready. They wait-ing forever. So that’s why you don’t be ontime for your appointments. You can go toBetty’s house, and she’s sitting up there, andshe’s peeking out the window with her housecoat on. Hold on [she says]. She goes in thereto get dressed, then you go to Mary’s house.Yeah, that happens all the time.”
Despite these problems, the womenagreed that the service was very muchneeded and should be expanded to operateon the weekends. The HBS only operatesMonday through Friday from 8:00 a.m. un-til 5:00 p.m. The women felt that the HBSneeded to increase its capacity to handlemore riders; because many of them hadfriends who were missing prenatal care ap-pointments due to transportation problems.For the majority of the women, the HBS wastheir only means of transportation to prena-tal and well baby care appointments andsupport service programs.
By transportingwomen toprograms thatteach parentingskills and supportimprovement ofhealth andnutrition practices,the HBS addressesthe attitudinalfactors that affectthe health of themother and herchildren.
32 ❐ PROCEEDINGS OF SYMPOSIUM IV ON AFRICAN-AMERICAN MOBILITY ISSUES
ConclusionThe HBS is an excellent example of a cre-
ative transportation service that addressesthe overall well being of the individual. Theyare affecting in a positive way the quality oflife for individuals who live in distressed ar-eas. There is a great need for transportationplanners and engineers to view transporta-tion differently. Dr. Patricia Waller, direc-tor of the University of Michigan’s Transpor-tation Research Institute states:
“We need to reconsider how we envi-sion the role of transportation in our soci-ety. While historically transportation hasbeen defined as ‘the safe and efficient move-ment of people and goods in our society’, itis far more than that. In America today trans-portation is an essential component of healthcare, education, employment, recreation, cul-ture, maintenance of ties with family andfriends, and all that makes life worthwhile. .. transportation is a necessity.”
In order to give people the means to actfor themselves, transportation specialistsmust review existing public transportationmodes to make sure that communities arenot being isolated from the services that en-rich the quality of life. Combining the roleof driver with that of social service advisoris an example of the extra step needed toclose the gap between transportation serviceand other essential social services. This isvital when addressing the issue of prenatalcare which plays a major role in preventinglow birth weight and other adverse preg-nancy outcomes.
In addition we should create opportu-nities to research and financially supportnew applications of computer and commu-nication technologies that are collectivelylabelled intelligent transportation systems(ITS) that would benefit a greater number ofAmericans despite economic standing. Aservice such as the HBS would benefitgreatly from an intelligent routing system,but is limited by its resources. By financiallysupporting special transportation servicessuch as the HBS, maybe we could all benefitfrom a system that would link health carereservation systems with intelligent sched-uling and routing systems. This, for ex-
ample, could be used to keep track of timespent “waiting” for services, and could leadto increased efficiency on both sides. Achange, such as this, would make life betterfor all of us.
REFERENCES
Greenberg, R. S.1983 The Impact of Prenatal Care in Dif-
ferent Social Groups. American Journalof Obstetrics and Gynecology; 145: 797-801.
Hawley, A. H.1986 Human Ecology, A Theoretical Es-
say. Chicago: University of ChicagoPress.
Kalmuss, Debra and Fennelly, Katherine1990 Barriers to Prenatal Care Among
Low-Income Women in New York City.Family Planning Perspectives; 22: 215-218.
Leveno K. J., et alia1985 Prenatal Care and the Low
Birthweight Infant. Obstetrics and Gy-necology; 66: 599-605.
Lia-Hoagberg, B. et alia1990 Barriers and Motivators to Prenatal
Care among Low-Income Women. So-cial Science and Medicine; 30: 487-495.
Lindsey, Oliver1997 Director Healthy Baby Service. In-
terview. February 18.Morgan, David L.1997 Focus Groups as Qualitative Re-
search, 2nd ed., SAGE Publications.Ng, E., Wilkins, R., and Perras, A.1993 How Far Is It to the Nearest Hospi-
tal? Calculating Distances Using the Sta-tistics Canada Postal Code ConversionFile. Health Reports; 5(2): 179-188.
Poland, M., Ager, J., and Olson ,J.1987 Barriers to Receiving Adequate Pre-
natal Care. American Journal of Obstet-rics and Gynecology; 157(2): 297-303.
PUMS home page. http://www.ciesin.org/datasets/pums/pums-home.html
Sokol, R. et alia1980 Risk, Antepartum Care, and Out-
come: Impact of a Maternity and InfantCare Project”. Obstetrics and Gynecol-ogy; 56: 150-156.
By financiallysupporting special
transportationservices such asthe HBS, maybe
we could allbenefit from a
system that wouldlink health care
reservationsystems with
intelligentscheduling and
routing systems.

33VAN SERVICE ACCESS IN DETROIT FOR LOW-INCOME WOMEN NEEDING PRENATAL CARE ❐
St. Clair, Patricia et alia1989 Social Network Structure and Pre-
natal Care Utilization. Medical Care;27(8): 823-832.
Waller, Patricia1994 IVHS and Social Policy. IVHS Re-
view.

34 ❐ PROCEEDINGS OF SYMPOSIUM IV ON AFRICAN-AMERICAN MOBILITY ISSUES
This page left blank, intentionally.
35DAILY TRAVEL BY PERSONS WITH LOW INCOME ❐
Daily Travel by Persons with Low IncomeDaily Travel by Persons with Low Income
Elaine MurakamiFederal Highway Administration
Jennifer YoungUniversity of Tennessee
The contets of this paper reflect theviews of theauthor and do not necessarily reflect the policyofthe U.S. Department of Transportation.
Summary
Persons in households with low incomes are much less likely to havea vehicle, largely in part because
a greater proportion of their income is spenton shelter and food. Nearly a quarter (24percent) of low-income households do nothave a car, compared to 4 percent of otherhouseholds These low-income householdsoften are without regular telephone servicebecause it is an additional expense. Thus,monthly payments for a car or car insurancewould be very difficult to meet.
When these households have a car, thecar is quite old. The average car is 10 yearsold in low-income households, compared to7.3 years for other households. However, inlow-income households, there is on average,only .7 vehicles per adult, compared to over1 vehicle per adult in other households.
Despite having fewer vehicles, people inlow-income households still make most oftheir trips in private vehicles. These tripsare much more likely to be made in a ve-hicle owned by someone else, like a friendor relative (10 percent for low income, com-pared to 1 percent for other income group).
The biggest difference in travel mode isin the proportion of walking trips. Peoplein low-income households are nearly twiceas likely to walk as people in other incomegroups. For example, for work (and work-related) trips, low-income households report6 percent by walk, compared to 3 percent forother income groups. There is very little dif-ference in the proportion trips using publictransit.
Because so many trips are made bywalking, the space in which people in low-income households travel is more constrictedthan for others. About 60 percent of theirtrips are 3 miles or less, compared to 50 per-cent for other households. For low-income,single parent households, nearly 70 percentof trips are 3 miles or less.
IntroductionTransportation is a critical element for
everyone to accomplish tasks in their dailylives, including getting to work and school,and accessing goods and services. As we fo-cus on moving people from welfare to work,we need to reduce transportation problemsas a hindrance by improving accessibilityand mobility for this group.
As a first step, we need to understandhow people in poverty travel today. Weused the first six months of the 1995 Nation-wide Personal Transportation Survey(NPTS) to provide a picture.
The poverty guidelines and povertydefinitions used by the Bureau of the Cen-sus and Health and Human Services arebased on before-tax cash income. Incomemeasures ignore home ownership and otherassets that can be important sources of con-sumption. The official poverty rate does notaccount for taxes or in-kind transfers suchas food stamps or other government-pro-vided medical insurance, which improve liv-ing conditions without affecting a family’sofficial poverty status1 . For example, a per-son making $10,000 a year who receives nopublic assistance is considered the same asa person making $10,000 a year who receivedfood-stamps and Medicaid benefits. Despitethese definitional problems, we also usedincome as as measure to classify households
36 ❐ PROCEEDINGS OF SYMPOSIUM IV ON AFRICAN-AMERICAN MOBILITY ISSUES
DataThe first 6 months of the 1995 NPTS
dataset includes 19,710 households. Thetables in this paper should be considered pre-liminary, as this is only a working file deliv-ered to DOT for staff review. Although thefile includes weights to bring the sample toa national total, the weights do not adjustfor as many personal and geographic char-acteristics as will the final 1995 NPTS dataset.
The NPTS does not include extensivequestions about income sources or on assets.That is, there is no question specifically onwhether the respondent received welfarepayments, food stamps, etc. Income is askedonly at the household level, not for each per-son, and is grouped in $5000 increments.
Using the 1990 Census Public UseMicrodata Sample (PUMS) and examiningthe household incomes by persons receivingpublic assistance, by household size, we cat-
egorized the 1995 NPTS households as fol-lows:
Table 1. Definition of “Low Income” House-holds for 1995 NPTS 6-month Interim File
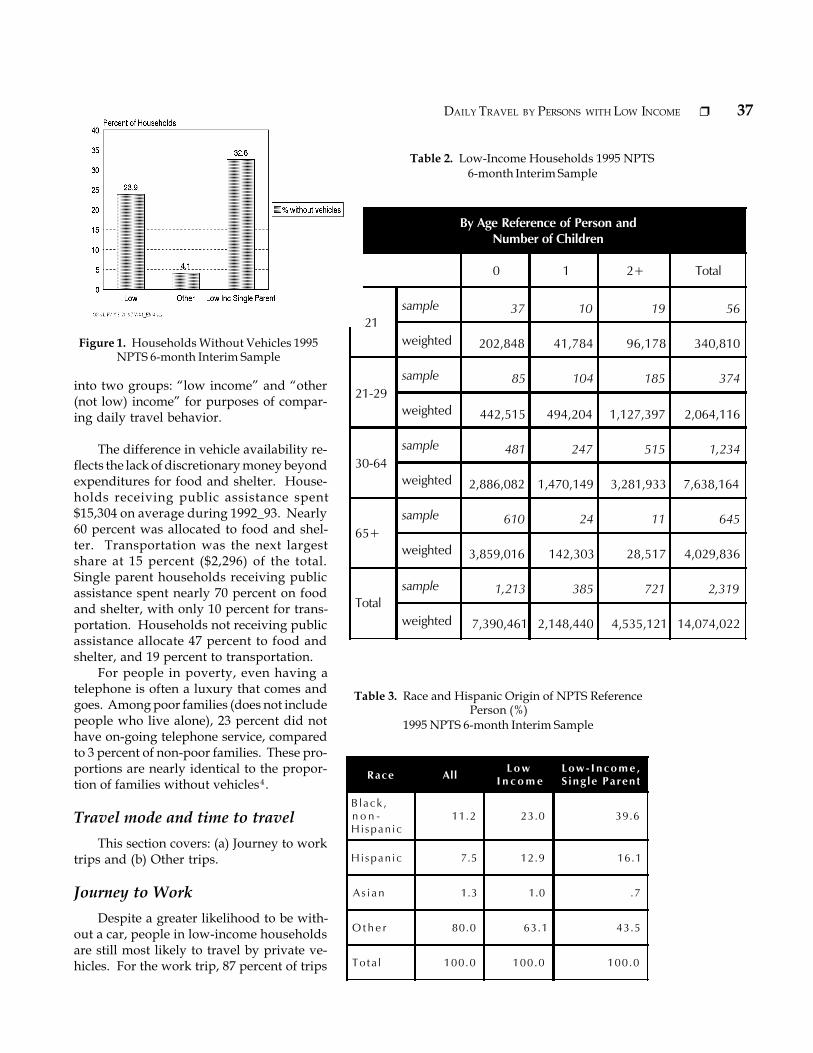
Using this definition, 2,319 householdsin the 1995 NPTS 6_month interim sampleare classified as low income, and 303 house-holds are classified as single parent low in-come households. Thus, any tables in thispaper showing single parent low incomehouseholds are subject to less accuracy thanfor the sample of low income households.The NPTS likely underrepresents single par-ent low income households because it is atelephone survey (2). Although nationwide,only 5 percent of households do not have atelephone, these households are concen-trated amongst the poor and the rural areas.Among families receiving welfare, over 30
percent report not having continuous phoneservice.
The sample includes all ages, and house-holds with and without children (Table 2).About 52 percent of the low income house-holds have no chidren, and 48 percent havechildren. About 27 percent of the sample hasa reference person age 65 and over, with nochildren present. For households headed bysomeone between age 21_29, 79 percent had1 or more children; and for householdsheaded by someone between 30_64, 62 per-cent had 1 or more children.
In the total sample (n = 19,710), AfricanAmerican households account for 11 percent,and Hispanic households account for 7.5 per-cent of the sample. For low income house-holds, the proportion of African Americansis 23 percent, and for Hispanics, 13 percent.For the 303 households in the single parentlow income group, nearly 40 percent are Af-rican American, and 16 percent are Hispanic,for a total for 56 percent in these two groups.Nearly 90 percent are with a female head.(Table 3)
Travel by Persons with LowIncome
In this paper, we will examine three ba-sic characteristics:
❐ Vehicle Availability,❐ Travel Mode and Vehicle Occu-
pancy, and❐ Total trips and miles of travel.
Vehicle AvailabilityProbably, the most critical item that af-
fects the mobility of low income persons isaccess to a car. The 1995 NPTS 6_month in-terim file shows 24 percent of low incomehouseholds did not have a car, compared to4 percent of other households (Figure 1).When a low income household has a car, itis likely to be quite old. The average car is10 years old for low income households,compared to 7.3 years for other households.Not only are the vehicles older, but also,there are fewer vehicles available per adult:.7 vehicle per adult in low income house-holds, compared to over 1 vehicle per adultin other households.
Number ofpersons
(regardless of age)
Household Income(SIPP 1992)
1-2 persons Under $10,000
3-4 persons Under $20,000
5+ persons Under $25,000
\
37DAILY TRAVEL BY PERSONS WITH LOW INCOME ❐
into two groups: “low income” and “other(not low) income” for purposes of compar-ing daily travel behavior.
The difference in vehicle availability re-flects the lack of discretionary money beyondexpenditures for food and shelter. House-holds receiving public assistance spent$15,304 on average during 1992_93. Nearly60 percent was allocated to food and shel-ter. Transportation was the next largestshare at 15 percent ($2,296) of the total.Single parent households receiving publicassistance spent nearly 70 percent on foodand shelter, with only 10 percent for trans-portation. Households not receiving publicassistance allocate 47 percent to food andshelter, and 19 percent to transportation.
For people in poverty, even having atelephone is often a luxury that comes andgoes. Among poor families (does not includepeople who live alone), 23 percent did nothave on-going telephone service, comparedto 3 percent of non-poor families. These pro-portions are nearly identical to the propor-tion of families without vehicles4 .
Travel mode and time to travelThis section covers: (a) Journey to work
trips and (b) Other trips.
Journey to WorkDespite a greater likelihood to be with-
out a car, people in low-income householdsare still most likely to travel by private ve-hicles. For the work trip, 87 percent of trips
By Age Reference of Person andNumber of Children
0 1 2+ Total
<21sample 37 10 19 56
weighted 202,848 41,784 96,178 340,810
21-29sample 85 104 185 374
weighted 442,515 494,204 1,127,397 2,064,116
30-64sample 481 247 515 1,234
weighted 2,886,082 1,470,149 3,281,933 7,638,164
65+sample 610 24 11 645
weighted 3,859,016 142,303 28,517 4,029,836
Totalsample 1,213 385 721 2,319
weighted 7,390,461 2,148,440 4,535,121 14,074,022
Race All L o wI n c o m e
L o w - I n c o m e ,S ing le Parent
B l a c k ,n o n -H i span i c
11.2 23.0 39.6
H i span i c 7.5 12.9 16.1
A s i a n 1.3 1.0 .7
O t h e r 80.0 63.1 43.5
To ta l 100.0 100.0 100.0
Figure 1. Households Without Vehicles 1995NPTS 6-month Interim Sample
Table 3. Race and Hispanic Origin of NPTS ReferencePerson (%)
1995 NPTS 6-month Interim Sample
Table 2. Low-Income Households 1995 NPTS6-month Interim Sample
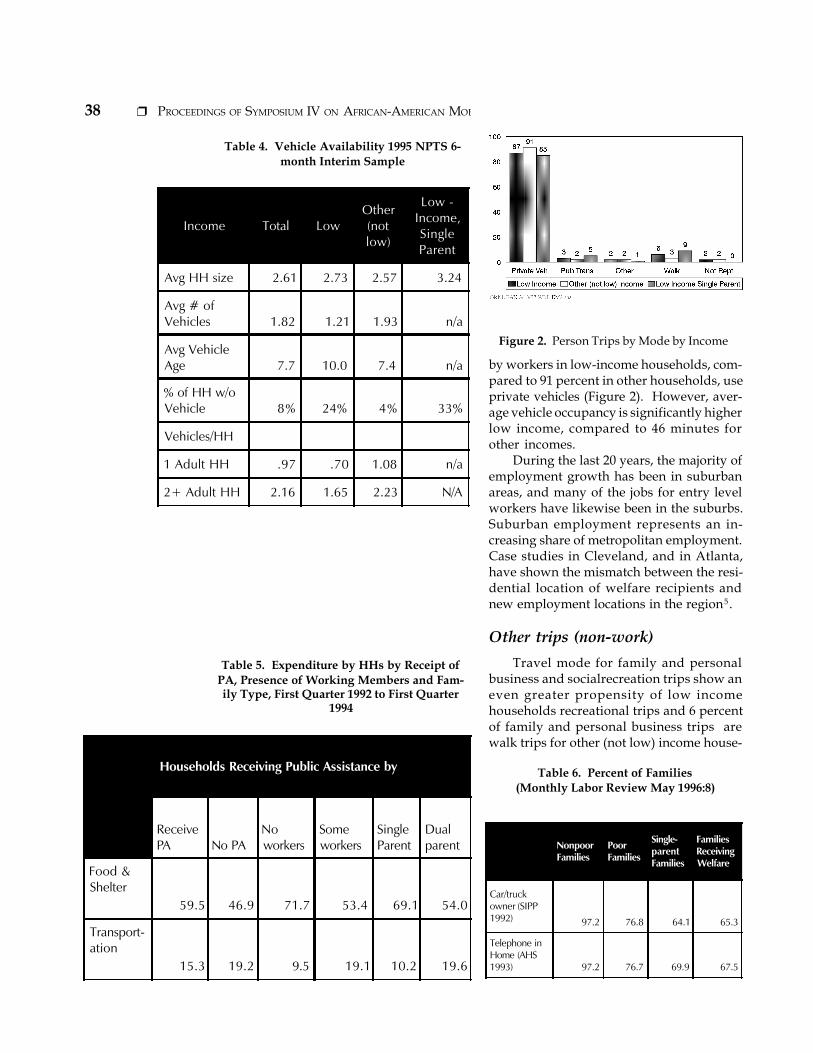
38 ❐ PROCEEDINGS OF SYMPOSIUM IV ON AFRICAN-AMERICAN MOBILITY ISSUES
Income Total LowOther(notlow)
Low -Income,SingleParent
Avg HH size 2.61 2.73 2.57 3.24
Avg # ofVehicles 1.82 1.21 1.93 n/a
Avg VehicleAge 7.7 10.0 7.4 n/a
% of HH w/oVehicle 8% 24% 4% 33%
Vehicles/HH
1 Adult HH .97 .70 1.08 n/a
2+ Adult HH 2.16 1.65 2.23 N/A
Table 4. Vehicle Availability 1995 NPTS 6-month Interim Sample
Households Receiving Public Assistance by
ReceivePA No PA
Noworkers
Someworkers
SingleParent
Dualparent
Food &Shelter
59.5 46.9 71.7 53.4 69.1 54.0
Transport-ation
15.3 19.2 9.5 19.1 10.2 19.6
Table 5. Expenditure by HHs by Receipt ofPA, Presence of Working Members and Fam-ily Type, First Quarter 1992 to First Quarter
1994
Figure 2. Person Trips by Mode by Income
NonpoorFamilies
PoorFamilies
Single-parentFamilies
FamiliesReceivingWelfare
Car/truckowner (SIPP1992) 97.2 76.8 64.1 65.3
Telephone inHome (AHS1993) 97.2 76.7 69.9 67.5
Table 6. Percent of Families(Monthly Labor Review May 1996:8)
by workers in low-income households, com-pared to 91 percent in other households, useprivate vehicles (Figure 2). However, aver-age vehicle occupancy is significantly higherlow income, compared to 46 minutes forother incomes.
During the last 20 years, the majority ofemployment growth has been in suburbanareas, and many of the jobs for entry levelworkers have likewise been in the suburbs.Suburban employment represents an in-creasing share of metropolitan employment.Case studies in Cleveland, and in Atlanta,have shown the mismatch between the resi-dential location of welfare recipients andnew employment locations in the region5 .
Other trips (non-work)Travel mode for family and personal
business and socialrecreation trips show aneven greater propensity of low incomehouseholds recreational trips and 6 percentof family and personal business trips arewalk trips for other (not low) income house-
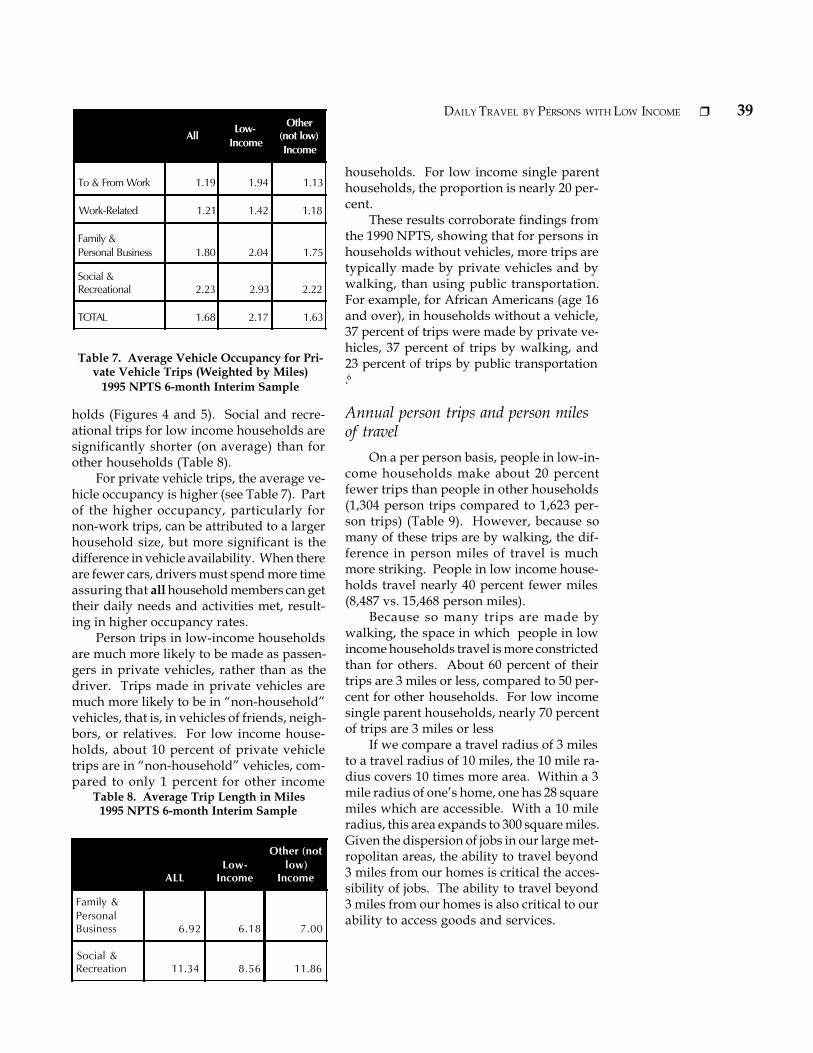
39DAILY TRAVEL BY PERSONS WITH LOW INCOME ❐
All Low-Income
Other(not low)Income
To & From Work 1.19 1.94 1.13
Work-Related 1.21 1.42 1.18
Family &Personal Business 1.80 2.04 1.75
Social &Recreational 2.23 2.93 2.22
TOTAL 1.68 2.17 1.63
Table 7. Average Vehicle Occupancy for Pri-vate Vehicle Trips (Weighted by Miles)
1995 NPTS 6-month Interim Sample
ALLLow-
Income
Other (notlow)
Income
Family &PersonalBusiness 6.92 6.18 7.00
Social &Recreation 11.34 8.56 11.86
Table 8. Average Trip Length in Miles1995 NPTS 6-month Interim Sample
holds (Figures 4 and 5). Social and recre-ational trips for low income households aresignificantly shorter (on average) than forother households (Table 8).
For private vehicle trips, the average ve-hicle occupancy is higher (see Table 7). Partof the higher occupancy, particularly fornon-work trips, can be attributed to a largerhousehold size, but more significant is thedifference in vehicle availability. When thereare fewer cars, drivers must spend more timeassuring that all household members can gettheir daily needs and activities met, result-ing in higher occupancy rates.
Person trips in low-income householdsare much more likely to be made as passen-gers in private vehicles, rather than as thedriver. Trips made in private vehicles aremuch more likely to be in “non-household”vehicles, that is, in vehicles of friends, neigh-bors, or relatives. For low income house-holds, about 10 percent of private vehicletrips are in “non-household” vehicles, com-pared to only 1 percent for other income
households. For low income single parenthouseholds, the proportion is nearly 20 per-cent.
These results corroborate findings fromthe 1990 NPTS, showing that for persons inhouseholds without vehicles, more trips aretypically made by private vehicles and bywalking, than using public transportation.For example, for African Americans (age 16and over), in households without a vehicle,37 percent of trips were made by private ve-hicles, 37 percent of trips by walking, and23 percent of trips by public transportation.6
Annual person trips and person milesof travel
On a per person basis, people in low-in-come households make about 20 percentfewer trips than people in other households(1,304 person trips compared to 1,623 per-son trips) (Table 9). However, because somany of these trips are by walking, the dif-ference in person miles of travel is muchmore striking. People in low income house-holds travel nearly 40 percent fewer miles(8,487 vs. 15,468 person miles).
Because so many trips are made bywalking, the space in which people in lowincome households travel is more constrictedthan for others. About 60 percent of theirtrips are 3 miles or less, compared to 50 per-cent for other households. For low incomesingle parent households, nearly 70 percentof trips are 3 miles or less
If we compare a travel radius of 3 milesto a travel radius of 10 miles, the 10 mile ra-dius covers 10 times more area. Within a 3mile radius of one’s home, one has 28 squaremiles which are accessible. With a 10 mileradius, this area expands to 300 square miles.Given the dispersion of jobs in our large met-ropolitan areas, the ability to travel beyond3 miles from our homes is critical the acces-sibility of jobs. The ability to travel beyond3 miles from our homes is also critical to ourability to access goods and services.
40 ❐ PROCEEDINGS OF SYMPOSIUM IV ON AFRICAN-AMERICAN MOBILITY ISSUES
...efforts to returnjobs to the central
city, to changeland use patterns
to haveemploymentcenters with
densities anddesigns that
support transit,bike and walk
alternatives,should continueto be long term
goals...
ConclusionsThe Nationwide Personal Transporta-
tion Survey (NPTS) can be used to under-stand the travel patterns of low incomehouseholds, and other special groups, suchas households without cars. Access to the1995 dataset will be much easier than withthe 1990 dataset, with access via Internet.
On a short term basis, the quickest wayto improve people’s accessibility to jobs maybe to help them get a car. Having a car pro-vides the range to travel longer distancesand to get to a range of locations that maybe inaccessible by bus. Many entry level jobsmay require work in the evenings, and somejobs may be shift work. There is usuallymuch less opportunity to use transit at thesetimes, even if the jobs may be located in tra-ditional downtown areas.
The NPTS 6-month interim data showthat, with a car, people with low incomesnot only will drive themselves and theirhousehold members, but are also likely toassist friends and neighbors.
While efforts to return jobs to the cen-tral city, to change land use patterns to haveemployment centers with densities and de-signs that support transit, bike and walk al-ternatives, should continue to be long termgoals, these approaches may not solve im-mediate problems of assisting people whonow have a limited time for receiving wel-fare assistance.
REFERENCES
Passero, W.D.1996 Monthly Labor Review, 119(4): 21-
28. Leete, L. And Bania, N.1995 The Impact of Welfare Reform on
Local Labor Markets. Center for UrbanPoverty and Social Change, Case West-ern Reserve Univeristy, Cleveland, Ohio.August .
Lave, C. and Crepeau, R1994 Travel by Households without Ve-
hicles. In 1990 NPTS Travel Mode Spe-cial Reports. FHWA ( FHWA-PL-94-019), Washington, D.C. December .
41IMPLEMENTING EFFECTIVE PUBLIC INVOLVEMENT METHODS TO INCREASE PARTICIPATION IN TRANSPORTATION PLANNING... ❐
Implementing Effective Public Involvement Methods to IncreaseImplementing Effective Public Involvement Methods to IncreaseParticipation by African Americans in Transportation PlanningParticipation by African Americans in Transportation Planning
Patrice Koonce RosemondMiami-Dade Transit Agency
Transportation agencies routinelyplan and develop transportationsystems designed to meet the
needsof the public whom they are mandatedto serve. At one time, transportation plan-ners and operatorsexercised the latitude todesign systems based on industry trends,industry standards and on theirownconcepts of proper transportation plan-ning. Over the past twenty years the publichas expressedincreasing concern about thedecisions made by urban transportationplanners and public officials.Theycontinually seek to influence these de-cisions which have far-reaching impacts onthe quality of life of their communities. Ef-fective public participaion techniques mustbe developed and implemented fromtheperspective of citizens who want to be in-formed from the inception of the project andthroughout the decision making process.
Public participation is the process of in-corporating the needs and values of citizensinto government decision making. Ideally,the goal of public participation is to insurethat decisions which effect the public arebased on a policy balanced by technical ex-pertise and community input. While meth-ods of securing public input may differ, theydo share at least two common elements: thetransportation plan must reflect the commonviews and values of all parties involved andthe commitment to a public involvementprogram using outreach techniques whichare sensitive to the needs of the full range ofcommunity interests.
The following is a discussion of somewidely used citizen participation techniqueswhich can be highly effective in increasing
participation in transportation planning byAfrican Americans.
Working Meetings are called to focus onan agenda of work to be accomplished andare composed of individuals representing allaffected interests. The key to using this tech-nique is to set a specific objective to beachieved and to tailor the agenda and atten-dance to support this objective.
A Forum is an excellent means to air cer-tain issues and to hear different points ofview. It is characterized by open discussionby all affected interests and plays a construc-tive role in bringing out the views and per-ceptions of various interest groups, it alsoexposes everyone to each other’s views. Thisis not a decision making body but the recordof the proceedings provides good documen-tation on the background that contributes tothe final outcomes.
The Public Hearing is a much-used andimportant technique of public participation.It can be an effective public involvement toolwhen used as the method of last resort afterinitially meeting individually and informallywith interest groups. The small group ses-sion is the time to discuss all sides of theproject, and to make every effort at this levelto accommodate the needs and concerns ofcitizens before any formal meeting takesplace.
When the public hearing is not success-ful in accomplishing citizen participationgoals it is generally because the hearing isused as the only method of public input with-out any mitigating techniques. This can alsohappen when too much importance is placedon the potential outcome of the hearing forc-
42 ❐ PROCEEDINGS OF SYMPOSIUM IV ON AFRICAN-AMERICAN MOBILITY ISSUES
ing conflicting parties to use the hearing toconfront rather than listen to each other.
It is the responsibility of urban transpor-tation planners and public officials to initiatea public participation plan early in the pro-cess and reach out to all segments of the com-munity who might be impacted by theproject. When this is accomplished, publicinput becomes a meaningful part of the plan-ning process.
Access to the Process -Stakeholders
One of the greatest criticisms of publicinvolvement techniques is that they lack thesensitivity necessary to relate to minoritygroups, particularly African Americans, whoare most likely to be underserved by publictransportation. The level of mobility of acommunity, easy access to public transit, isclosely related to the economic status of theresidents. It is a strong determinant of howpeople live and has an overriding impact onthe quality of life of that community.
In most cases minority groups, AfricanAmericans included, live in communitiesthat are not always well-served by publictransportation. The net result of this dynamicis that minority communities lack the ben-efits of access to transit for work, school, rec-reation and other trip purposes. Often mi-nority groups, because of their low economicstatus, cannot afford to move into the areaswhich are well-served by public transporta-tion. Despite the fact that minorities are themost needy in terms of transportation de-pendency, the focus of the public involve-ment process is not proportionate to the levelof their transportation needs.
At the same time government agenciesgenerally consider civic leaders, propertyowners’ automobile users and entrepreneursas typical stakeholders in developing publictransportation projects. This profile too of-ten excludes minority groups who should beconsidered the primary stakeholders in de-veloping mass transportation projects anddesigning a public participation plan.
Addressing the PublicAny further discussion of methods of
public involvement must lead to a statementof a means for government entities to gain
the commitment of citizens to participate inplanning and implementing a transportationproject. To address this need, public officialsand urban transportation planners must un-derstand how citizens weigh the potentialgains and losses to them personally of imple-menting a transportation project. Officialsand planners must also be prepared to sup-port this process by presenting a clear andbalanced picture of what is at stake for allinterests with special emphasis on minoritygroups.
Historically, racial, ethnic and religiousminority groups have experienced barriersto participating in the public decision-mak-ing process and are therefore under-repre-sented. Public officials must be constantlyaware that there are substantive differencesbetween interest groups. Their responsibil-ity is to approach minority groups in a man-ner which reflects a sensitivity to their racialextraction, language proficiency, religiousbeliefs and cultural practices.
African Americans, for example, differfrom the traditional description of an inter-est group usually targeted by public out-reach programs in significant ways. They areless likely to be property owners, are moreoften captive users of public transit and theydemonstrate a lower level of participationin agency-sponsored informational eventsrelated to the transportation planning pro-cess.
There are two possible explanations forthe lack of participation on the part of Afri-can Americans. The first explanation is thatthere are individuals who have not been in-formed about the project and therefore lackthe opportunity to assert their views. The sec-ond one is that some civic leaders who areaware of the informational events related toprojects and choose not to participate be-cause they do not believe that their inputwould influence the final plans.
A good faith effort to convey issues inways that are meaningful to different sec-tors of the community must be sensitive tothe prevailing culture and language, bringout the important elements of the project atstake for all citizens and provide them withthe opportunity to participate in the plan-ning process through informational and pub-lic involvement plans.
Despite the factthat minorities arethe most needy in
terms oftransportation
dependency, thefocus of the public
involvementprocess is not
proportionate tothe level of their
transportationneeds.
43IMPLEMENTING EFFECTIVE PUBLIC INVOLVEMENT METHODS TO INCREASE PARTICIPATION IN TRANSPORTATION PLANNING... ❐
\
Form and TechniquesPublic participation techniques, effec-
tively designed and implemented, can helpreach the goal of increasing the participationof minority groups.
One important aspect, when developinga public participation session is the structureof the meeting. This effort should take intoaccount the manner in which the message isdelivered, the venue of the meeting, withwhom initial contact is made within the com-munity and even the size of the meeting.Considering these factors would yield a pro-ductive and inclusive process which can sig-nificantly enhance attendance and participa-tion in meetings by minorities.
For example, using meeting facilitatorswho are bilingual and who are familiar withthe customs of minority groups would beneeded to reach the goal of inclusive publicparticipation. These measures can initiallyadd to the cost and complexity of the out-reach effort but give a greater return in bet-ter communication and increased public par-ticipation.
Conventional public hearings frequentlyresult in open confrontation between groupswith different views on the project. One wayto minimize confrontation and gain the sup-port of conflicting interest groups is to con-duct informal working meetings in advanceof the hearing with key civic leaders. Thistechnique can be refined further by conduct-ing a “Pre-Hearing,” which is a practice ses-sion of the actual hearing with one represen-tative of each interest group participating inthe discussion. The “Pre-Hearing” yieldsan advance view of how issues might ariseat the formal hearing and allows time for anyadjustments which might be necessary.
Understanding the full range of acommunity’s needs would enable an agencyto create more responsive and sometimes in-novative plans for transit expansion and en-hancement. Gaining input from historicallyunderrepresented groups can offer new in-sight into the validity of a project’s oals andoutcomes.
When these principles of public involve-ment outlined above are incorporatedthroughout the process, they can facilitateconstructive communication between citi-zens and public officials. Urban transporta-
tion planners and public officials shouldseize this opportunity to establish a long-term partnership with the public whom theyare mandated to serve. This would enablethem to implement transportation plans thatcan effectively enhance the quality of life.
Public Participation TechniquesListed below are other techniques of
public involvement which can be used inconjunction with themajor participationtechniques.
NewslettersNewsletters are an excellent means of
sustaining interest of citizens throughout adecision making process. This is especiallyimportant when a public participation effortlasts for several months. The newslettershould be targeted at those people who areimpacted by the project or who have ex-pressed interest in the issue. They might in-clude neighbors, leaders of interest groups,elected officials and participants in otherpublic participation activities. Newsletterscan provide information in addition to thatwhich is communicated in mass meeting andthrough the news media.
A well-done newsletter should be visu-ally attractive and written in language whichcan be understood by all the readers. Itshould be objective presenting all sides ofthe issues associated with the public partici-pation effort. To ensure objectivity and toprotect credibility, the wording of the news-letter can be reviewed by a citizen advisorygroup sensitive to any political nuance whichmight arise.
This publication can also serve to docu-ment the fact that the public has been keptfully informed throughout the process andprovide good background information to themedia.
Focus Groups
Some organizations and agencies havebegun to use focus groups as primary meansof gathering public input. They are small dis-cussion groups representing the demograph-ics of the community. Focus groups are led
Gaining inputfrom historicallyunderrepresentedgroups can offernew insight intothe validity of aproject’s oals andoutcomes.
44 ❐ PROCEEDINGS OF SYMPOSIUM IV ON AFRICAN-AMERICAN MOBILITY ISSUES
by a trained moderator who can draw outpeople’s reactions to a plan and providesgood feedback when alternative plans arebeing considered.
Focus groups only assess personal pref-erences subsequently do not have statisticalvalidity. They do provide information whichis useful in the decision making processwhen implemented in conjunction with otherforms of direct participation.
Advisory Groups/TaskforcesNext to public meetings, the participa-
tion technique most often used is the estab-lishment of a citizen’s advisory group. Ad-visory groups are useful in providing citi-zens’ perspectives throughout the decisionmaking process on all aspects of the publicparticipation plan and project development.They can beeffective in reviewing publica-tions before they are released to the mediaand the general public. Community advi-sory committees can also help anticipatepublic reaction to proposals, educate officialsto the continuing concerns of interest groups,and provide for continuous communicationbetween citizens and public officials.
Metro-Dade Transit Agency’sBlack History Tours Program
The Black History Tours Program wasimplemented by Metro-Dade Transit(MDTA) as a means of creating a positiveimage of transit in the community and tohighlight the rich history of African Ameri-cans in Dade County.
MDTA received extensive assistancefrom the Black Archives History and Re-search Foundation of South Florida, Inc., indetermining the most important historicalsites to visit and in developing the script usedby the tour guides. The tours are operatedand narrated by MDTA bus operators se-lected for excellent safety and high perfor-mance ratings. This project was inauguratedFebruary of 1994 with Saturday morningtrips and, because of high demand, was ex-panded to include weekday tours for largegroups, churches, family reunions andschools.
The three-hour tours visit four of the old-est Black communities in Dade County: Co-
conut Grove, Overtown which is histori-cally called “Colored Town”, Liberty City,and Brownsville also know as Brown’s Sub-division. The first two were established inthe late 1890s, the others in the early part ofthis century. The tour is narrated from aprepared script and various landmarks arepointed out by the bus operator while relat-ing their history. At two of the sites, partici-pants have an opportunity to walk throughand view displays of historical significance.
The Black History Tours project has beena successful public relations and marketingeffort for MDTA and has been embraced bythe community at large. Teachers at all gradelevels use the tours to supplement their BlackHistory Month curricula to give youngpeople a sense of history and of community.
REFERENCES
Creighton, James L.1992 Involving Citizens in Community
Decision Making. Washington, DC:Programfor Community Problem Solv-ing.
Federal Highway Administration and Fed-eral Transit Administration
1995 A Guide to Metropolitan Transpor-tation Planning Under ISTEA: How thePieces Fit Together. Washington, DC:U. S. Department of Transportation.
1996 Public Involvement Techniques forTransportation Decision-Making.Washington, DC: U. S. Department ofTransportation.
Federal Transit Administration1996 Building Livable Communities
Through Transportation Washington,DC:U.S. Department of Transportation
1997 Planning, Developing, and Imple-menting Community-Sensitive Transit::the Federal Transit Administration, Liv-able Communities Initiative. Washing-ton, DC: U.S.Department of Transpor-tation.
Institute for Participatory Management andPlanning
1993 Citizen Participation Handbook forPublic Officials and other ProfessionalsServing the Public. Monterrey, CA: TheInstitute.
Communityadvisory
committees canalso help
anticipate publicreaction to
proposals, educateofficials to the
continuingconcerns of
interest groups,and provide for
continuouscommunicationbetween citizens
and publicofficials.

45IMPLEMENTING EFFECTIVE PUBLIC INVOLVEMENT METHODS TO INCREASE PARTICIPATION IN TRANSPORTATION PLANNING... ❐
Office of Environment and Planning1996 Community Impact Assessment.:
A Quick Referemce Guide. Washington,DC: U.S.Department of Transportation,Federal Highway Administration.
National Research Council (U. S.)1972Citizen Participation and Community
Values. Highway Research Record,Highway Research Board, Number 380.
46 ❐ PROCEEDINGS OF SYMPOSIUM IV ON AFRICAN-AMERICAN MOBILITY ISSUES
This page left blank, intentionally.
47THE LOS ANGELES NEIGHBORHOOD INITIATIVE: A MODEL FOR COMMUNITY PARTICIPATION AND EMPOWERMENT ❐
The Los Angeles Neighborhood Initiative (LANI): A Model forThe Los Angeles Neighborhood Initiative (LANI): A Model forCommunity Participation and EmpowermentCommunity Participation and Empowerment
Joyce M. PerkinsMarian Bell
Los Angeles Neighborhood Initiative (LANI)
The Los Angeles Neighborhood Initiative (LANI) is acommunity_driven neighbor-
hood revitalization program that jump-startseconomic revitalization and improves tran-sit access in transit_dependent urban neigh-borhoods by providing:
❐ Seed funding for community-plannedimprovement projects;
❐ Hands-on training in project planningand development, and
❐ Technical assistance in the develop-ment and support of sustainable communityorganizations.
LANI has established a unique commu-nity participation and empowerment pro-cess which can be an effective and versatiletool, applicable to any type of developmentproject, and even to direct service programs.LANI’s current project areas are twelve (12)diverse transit-dependent communities inLos Angeles.
Program HistoryLANI was founded in 1994 to bring back
a sense of identity and ownership to mainstreets and transportation corridors through-out the City. Sponsored by Mayor RichardRiordan, LANI began as a three-year dem-onstration project charged with developingan innovative model for involving commu-nity members in neighborhood revitalizationefforts, with a focus on increasing transpor-tation access and economic revitalization.
The LANI demonstration was fundedlargely by the Federal Transit Administra-tion (FTA) Livable Community Initiative, le-veraged with private and in-kind donations.In the past year, LANI has been recognized
by President Clinton, the U.S. Departmentof Transportation, the Southern CaliforniaAssociation of Governments and others as anational model for community-driven revi-talization.
Due to the success of the demonstrationin the initial eight project areas, and ofLANI’s community participation process,LANI has become a permanent agency, andhas secured initial funding to expand to fournew transit_dependent neighborhoods.
Program NeedIn Los Angeles neighborhoods and na-
tionwide, the walkable main streets whichonce served as centers of community lifehave been degraded by crime, auto conges-tion and physical and economic deteriora-tion. Without vital businesses and publicspaces, and streets conducive to pedestrianactivity, communities have lost their iden-tity and sense of place.
Many well-meaning developments andgovernment efforts intended to addressthese problems have lost their neighborhoodscale and connection to public transit and,more important, have failed to involve com-munity members in decision_making pro-cesses. In addition, previous revitalizationefforts in many neighborhoods have lackedprovisions for sustainability, and their even-tual withdrawal or failure left communitiesdisillusioned about the possibility of neigh-borhood improvement. The result, as LosAngeles learned from the 1992 civil unrest,is that residents often feel disconnected fromtheir own neighborhoods and efforts to im-
48 ❐ PROCEEDINGS OF SYMPOSIUM IV ON AFRICAN-AMERICAN MOBILITY ISSUES
prove them -- and in many cases they aredisconnected.
Community ParticipationBased on the understanding that com-
munities know what they need, but LANIhas created an innovative process for mean-ingfully involving community members inneighborhood revitalization. Each LANIproject area creates and is guided by a Rec-ognized Community Organization (RCO)composed of local residents, business andproperty owners, and representatives fromcommunity organizations.
LANI is designed to create communityownership of their projects, therefore, RCOsparticipate in every aspect of project plan-ning and implementation, from developingprojects to hiring designers and contractors.With their strong ties to the community andtheir detailed knowledge of its strengths andneeds, RCO members are uniquely qualifiedto lead their neighborhood’s revitalization _and more important, to sustain it.
Program Design
Neighborhood SelectionUsing an application process through
the City Council Offices, LANI neighbor-hoods are selected to address areas of great-est need, ensure success, and maximize thebeneficial results of our funds. LANI targetscommunities that have entered into a declinethat would continue but for LANI, yet whichcan be turned around with our resources.LANI serves an ethnically, culturally andeconomically diverse group of communities,all of which meet the following criteria:
❐ Transit-dependent population. In ad-dition, four LANI neighborhoods are directlyadjacent to developing rail stations.
❐ Neighborhood “Main Street” in de-cline: density of small businesses and otherneighborhood services which need an eco-nomic boost.
❐ Some previous planning work in placeto draw from.
❐ Potential partners such as community-based organizations, and other developmentprojects.
❐ An active citizenry which has the po-tential to organize and become an effectiveRCO.
Creation and Training of the RCO❐ Outreach to community “stakehold-
ers” to create RCO which represents the di-versity of each community. In LANI’s origi-nal eight (a) neighborhoods, local City Coun-cil Offices appointed members to seven (7)RCOs, while oneneighborhoods opted tohold community elections for RCO seats.
❐ Once the RCO is assembled, eachmember signs a Letter of Intent committingthemselves to the project. The Letter of In-tent outlines RCO responsibilities, whichinclude development of projects and projectbudgets, oversight of construction projectsand Community Work Plan production, andcommunity outreach.
❐ Training in consensus building, rulesof operation, creating an outreach plan, de-veloping bylaws, etc., equips the RCOs to op-erate as a working and decisionmakingbody.
Community Work PlansWorking with consultants and design
professionals, each RCO develops a Commu-nity Work Plan, which includes the follow-ing:
❐ Description of the neighborhood’s his-tory, physical infrastructure, social institu-tions, service programs, transit services andneeds, other development projects, etc.
❐ Assessment of the community’sstrengths and needs.
❐ Creation of improvement projectswhich reflect the character of each commu-nity and create destinations within it.
❐ Prioritized list of short-term goals forquick, visible improvements.
❐ Achievable long-term goals necessaryto sustain revitalization process.
Streetscape Improvements
LANI focuses on quick, visible, “neigh-borhood-scale” improvements such as pe-destrian lighting, small parks, bus shelters,trees and potted plants, street furniture, fa-
Each LANI projectarea creates and is
guided by aRecognizedCommunity
Organization(RCO) composedof local residents,
business andproperty owners,
andrepresentatives
from communityorganizations.
49THE LOS ANGELES NEIGHBORHOOD INITIATIVE: A MODEL FOR COMMUNITY PARTICIPATION AND EMPOWERMENT ❐
\
cade improvements, etc., that are designedto:
❐ Cement community support and com-mitment with quick, highly-visible projects,such as colorful community banners or trees.
❐ Give an immediate economic boostto area businesses.
❐ Create safe, attractive transit and pe-destrian environments.
❐ Be a catalyst for further public andprivate sector investment.
These type of improvements signal tothe community and to potential public andprivate investors that a successful neighbor-hood revitalization is underway. LANI im-provements also begin to create destinationsin neighborhoods that were previously“passthrough” areas. Most important, theprojects promote community buy_in and ini-tiative, and thus act as a catalyst tocommunity_driven revitalization.
Sustaining RevitalizationLANI helps empower communities to
build the capacity not only to implement im-provement projects, but to sustain revitaliza-tion efforts on their own. As part of LANI’sprogram design, RCOs evolve from commu-nity boards into sustainable legal organiza-tions. In addition to their hands_on experi-ence in planning and development, theRCOs receive technical assistance in the de-velopment and support of sustainable com-munity organizations. These organizations,such as Community Development Corpora-tions and Business Improvement Districts,take responsibility for maintaining LANI im-provements, and once established, will con-tinue to seek funding and implement projectsindependently from LANI.
Sustaining revitalization efforts, andeven maintaining physical improvements,takes commitment and responsibility fromthe entire community. Therefore, RCOs workclosely with their larger community on im-provement projects, soliciting input on ev-erything from what the most important is-sues facing the neighborhood are, to whatcolor to paint a bus shelter. In addition, mostimprovement projects utilize financial sup-port and/or maintenance commitmentsfrom local businesses. When a shopkeeper
helps plant a tree in front of his business andtakes responsibility for watering it, he as-sumes ownership, and therefore will go onestep further _making sure that the tree is notvandalized, and that it is properly and regu-larly trimmed. As this example shows, com-munity involvement in project planning andimplementation creates a grassroots owner-ship that is an invaluable sustainabilitymechanism.
PartnershipA crucial ingredient in LANI’s success
is partnership and support at every level ofgovernment. In addition to LANI’s approxi-mately $6 million in U.S. Department ofTransportation grants, under the sponsor-ship of Mayor Richard Riordan, LANI hasreceived extensive financial and technicalsupport from the City and County of LosAngeles. For example, the Los AngelesCounty Metropolitan Transit Authority(MTA) has provided LANI with office space,other overhead expenses, and technical as-sistance, while the City of Los Angeleswaived approximately $185,000 in permitfees for LANI projects.
Of course, partnership with communitymembers is the most critical component ofthe program. LANI demonstrated its com-mitment to this partnership to communitymembers at the onset of the program, whenLANI not only asked them for their opinion,but put money behind their decisions.
Future PlansLANI has not only shown that commu-
nity-driven projects can be successful, buthas produced a proven process for commu-nity participation that is applicable to anyneighborhood, city, or project. Given thegreat need nationally for community-drivenprojects, LANI is seeking to increase its fund-ing sufficiently to expand its scope of projectsto address other pressing needs that neigh-borhoods have, such as housing, child carefacilities, and other developments and ser-vices.
Los Angeles Mayor Richard Riordan,who founded LANI, said, “My dream forLANI is that it becomes a national model forrevitalizing and sustaining neighborhoods
LANI hopes tocontinue toinfluenceprograms andcities around thecountry toincorporatesubstantivecommunityparticipation intotheir work
50 ❐ PROCEEDINGS OF SYMPOSIUM IV ON AFRICAN-AMERICAN MOBILITY ISSUES
through community empowerment.” In ac-cordance with this ambitious goal, LANIhopes to continue to influence programs andcities around the country to incorporate sub-
stantive community participation into theirwork, and in addition, expects to expand toserve constituencies outside of the City ofLos Angeles.
51A SUMMARY OF THE “HUMAN ENVIRONMENT” REQUIREMENTS OF NEPA: IMPLICATIONS FOR ENVIRONMENTAL JUSTICE ❐
A Summary of the “Human Environment” A Summary of the “Human Environment” Requirements of theRequirements of theNational Environmental Policy Act ::
Implications for Environmental JusticeImplications for Environmental Justice
Cheryl A. CallowayKaren L. Ferguson
Thomas S. Cooley Law School
The following is a summary of a much more de-tailed, and yet to be published article providingguidance to those responsible for preparing or re-viewing NEPA environmental assessments or en-vironmental impact statements regarding “hu-man environment” and environmental justice is-sues. Because this is a summary, citations havebeen eliminated, except where absolutely neces-sary.
Introduction
In recent years, much has been written about whether people of color
are,or have been, disproportionately ex-posed to toxic substances or, disproportion-ately affected by local, state or federal gov-ernmental decisions concerning the siting orexpansion of such things as businesses, high-ways, power plants, or incinerators.
At the federal level, the National Envi-ronmental Policy Act (NEPA) requires thepreparation of one or more types of docu-ments in cases of a “major federal action.”A “major federal action” can include privateprojects that:
•require federal approval,•require federal permits,•require federal financial assistance, or•are subject to federal regulation.It also can include adoption of official
agency policies, rules, regulations, interpre-tations, treaties, or formal plans and con-certed efforts to implement a plan, programor policy. Among other things, NEPA re-
quires a consideration of the “human envi-ronment” -- a concept which is critical to anevaluation of whether people of color are be-ing disproportionately subjected to adversepublic and private environmental decision-making.
What is the relationship betweenNEPA and the concepts ofEnvironmental Justice?
NEPA contains the most comprehensiveand far reaching statements of nationalpolicy regarding environmental issues of anyof the multitude of environmental statutes.The introductory language of NEPA is pro-found and places stringent requirementsboth on the Federal Government and indi-vidual citizens. The most critical of theserequirements are:
1. Each person should enjoy a health-ful environment.
2. Each person has a responsibility tocontribute to the preservation and enhance-ment of the environment.
3. The Federal Government, in coop-eration with State and local governments,and other concerned public and private or-ganizations is to:
a. use all practicable meansand measures, including financialand technical assistance, in a man-ner calculated to foster and promotethe general welfare, and
52 ❐ PROCEEDINGS OF SYMPOSIUM IV ON AFRICAN-AMERICAN MOBILITY ISSUES
b. create and maintain condi-tions under which man and naturecan exist in productive harmony,and fulfill the social, economic, andother requirements of present andfuture generations of Americans.
4. The Federal Government is to:a. assure for all Americans
safe, healthful, productive, and es-thetically and culturally pleasingsurroundings;
b. attain the widest range ofbeneficial uses of the environmentwithout degradation, risk to healthor safety, or other undesirable andunintended consequences;
c. preserve important historic,cultural, and natural aspects of ournational heritage, and maintain,wherever possible, an environmentwhich supports diversity and vari-ety of individual choice;
d. achieve a balance betweenpopulation and resource use whichwill permit high standard of livingand a wide sharing of life’ ameni-ties; and
e. include in every recommen-dation or report on proposals forlegislation and other major Federalactions significantly affecting thequality of the human environment,a detailed statement by the respon-sible official on -
(I) the environmentalimpact of the proposed ac-tion;
(ii) any adverse envi-ronmental effects whichcannot be avoided shouldthe proposal be imple-mented;
(iii) alternatives to theproposed action;
(iv) the relationship be-tween local short-term usesof man’s environment andthe maintenance and en-hancement of long-termproductivity; and
(v) any irreversibleand irretrievable commit-ments of resources which
would be involved in theproposed action should itbe implemented.
These NEPA requirements, when lookedat in conjunction with any definition of en-vironmental justice, lead to some interestingconclusions:
•both recognize the rights of people toenjoy a healthful environment.
•both recognize the responsibility to allpeople to ensure the existence of such an en-vironment.
•both recognize a need to balance com-peting interests, while minimizing harm tothe human environment.
•both require the taking of affirmativeactions by decision-makers to seek out andidentify any harmful effects of official action.
•both recognize a need to lessen or miti-gate any identified harms.
Given this commonality of purpose, the“human environment” considerations ofNEPA must be enhanced to better identifyenvironmental racism/justice possibilities.
The “Human Environment”Requirements of NEPA
The promises of the NEPA policy state-ments in regard to emphasis on “human en-vironment” issues have been lessened sig-nificantly by the Supreme Court’s declara-tion that NEPA’s requirements are “essen-tially procedural.”1 In other words, it maynot matter what decision is ultimately ismade or what actions ultimately are taken,so long as the decision maker had availableand “considered” appropriate information.However, decision makers have an affirma-tive duty under NEPA to seek out and fairlyaddress information relevant to their statu-tory requirements. These “records” will thenbe available for examination to determine ifthere is a pattern or practice of actions whichevince an intent or effect of invidious dis-crimination.
Major Federal ActionSection 102(2)(C) of NEPA requires that
federal agencies prepare an environmentalimpact statement (EIS) for proposed “legis-lation and other major Federal actions sig-
decision makershave an affirmative
duty under NEPAto seek out and
fairly addressinformation
relevant to theirstatutory
requirements
53A SUMMARY OF THE “HUMAN ENVIRONMENT” REQUIREMENTS OF NEPA: IMPLICATIONS FOR ENVIRONMENTAL JUSTICE ❐
nificantly affecting the quality of the humanenvironment.” The EIS must include a de-tailed description of the proposed action, theenvironmental impact and adverse effects ofthis action, alternatives, and the resourceswhich would be irretrievably and irrevers-ibly committed to the proposed action. A“major federal action” can include:
• private projects that require federal ap-proval, permits, or financial assistance or aresubject to federal regulation;
• Adoption of official agency policy,rules, regulations, interpretations, treaties,formal plans, or programs;
• Concerted actions to implement thoseplans, programs, and policies;
• The grant of a license to construct ahigh voltage line;
• The issuance of an interim operatinglicense for a nuclear power plant; and
• The authorization for the abandon-ment of a railroad line.
For certain federal actions, at a mini-mum, an environmental assessment (EA)must be prepared. These actions includethose likely to:
1. Affect properties protected by theHistoric Preservation Act of 1966 or section4(f) lands;
2. Be highly controversial on environ-mental grounds or with respect to availabil-ity of adequate relocation housing;
3. Have significant impact on natural,ecological, cultural, or scenic resources;
4. Cause substantial disruption, for ex-ample, increased traffic congestion;
5. Have significant impact on noiselevels, air or water quality including the con-tamination of a public water system; or
6. Directly or indirectly affect humanbeings by creating a significant impact on theenvironment.
In preparing an EA or EIS, the FederalGovernment is required to consider threetypes of actions:
• “Cumulative actions” -- those “whichwhen viewed with other proposed actionshave cumulatively significant impacts” andmust be considered together in one EIS.
• “Connected actions” -- those that au-tomatically trigger other actions, can’t pro-ceed without another action occurring, ordepend on a larger action for their justifica-
tion. Connected actions cannot be segmentedto escape the need for an EIS, but rather,must be considered together in one EIS.
• “Similar actions”--those which “whenviewed with other reasonably foreseeable orproposed agency actions, have similaritiesthat provide a basis for evaluating their en-vironmental consequences together” in oneEIS.
Once the proposal is determined to be a“major federal action,” NEPA then requiresa determination whether the proposal will“significantly affect” the quality of the hu-man environment. NotwithstandingNEPA’s clear requirement that federal gov-ernment agencies consider human environ-mental issues, including socio-economic is-sues, the Council on Environmental Quality(CEQ) regulations do not require an EISwhen a federal action only causes socio-eco-nomic effects on the human environment.Only when these effects are interrelated withnatural and physical effects, will an EIS berequired to discuss them.
Overview of the NEPA ProcessThe following is a summary of what
agencies must to under NEPA:1. Define the purpose of a project and
describe why there is a need for action.2. If the action is a “major federal ac-
tion,” conduct a preliminary screening to de-termine potential impacts.
3. If the federal action has been catego-rized as not normally requiring an EIS thenno further action is required.
4. If there is no exception, or it is notclear that an EIS is required, then preparean EA which must “provide sufficient evi-dence and analysis for determining whetherto prepare an EIS.” The EA must discussthe need for the proposal, alternatives to theproposed action, the environmental impacts,and provide a listing of the other environ-mental agencies and members of the publicconsulted.
5. If appropriate, issue a “finding of nosignificant impact” (FONSI) briefly describ-ing why the action will not have a signifi-cant effect on the human environment andinclude the EA or a summary of it. Anagency also may issue a mitigated FONSI if
Once the proposalis determined tobe a “majorfederal action,”NEPA thenrequires adeterminationwhether theproposal will“significantlyaffect” the qualityof the humanenvironment.
54 ❐ PROCEEDINGS OF SYMPOSIUM IV ON AFRICAN-AMERICAN MOBILITY ISSUES
measures are incorporated to reduce anypotentially significant effects revealed in theEA to insignificant levels.
6. If there may be significant impactson the human environment, publish a “no-tice of intent” that an EIS will be prepared.
7. If there is more than one federalagency, or if state and local agencies or TribalGovernments also are involved, designateda lead agency.
8. Identify the range of actions, alter-natives, impacts, and significant issues tobe analyzed and considered in the EIS.
9. “Rigorously explore and objectivelyevaluate” a reasonable range of alternativesincluding: no action or avoidance, other rea-sonable course(s) or minimization, mitiga-tion measures, or enhancement activities.
10. Include a brief description of any is-sues found not to be significant and the rea-son for the finding in the statement.
11. Ensure participation from the pub-lic, affected Indian tribes, the applicant, andother agencies.
12. Circulate the draft EIS and acceptpublic comment for forty-five days.
13. Assess, consider, and respond tocomments in the final EIS.
14. Published a notice in the FederalRegister that the EIS has been filed with theEnvironmental Protection Agency (EPA).
15. Make no decision until the later ofninety days after notice of the availability ofthe draft EIS was published or thirty daysafter notice of the final EIS is published.
16. Prepare a supplemental EIS if thereare substantial changes in the proposed ac-tion or there are significant new circum-stances or information that are relevant toenvironmental concerns.
Consideration of EnvironmentalJustice issues
The following is a listing of types of ac-tions agencies should undertake to ensureconsideration of environmental justice is-sues:
1. Identify and characterize potentialcommunities of color early in the preliminaryscreening process.
2. Conduct risk assessments to deter-mine the adverse effects on human health.
3. Review public facilities and deter-mine how the project might affect either theuse or effectiveness of those services.
4. Determine whether the environ-mental impacts fall disproportionately onany population or population subgroup.
5. Determine other avenues of expo-sure, such as from inside the home or otherworkplaces, as well as synergistic exposures.
6. Look for positive impacts.27. Involve the public. Make a “dili-
gent” effort to establish a continuing patternof public involvement beginning at thescreening stage and continuing throughoutthe entire process.
8. Be sure to get public input duringthe development of an EA and the determi-nation of significant of impacts, possible al-ternatives, mitigation measures, or enhance-ments.
9. Don’t use traditional notice methods-- seek ways more likely to reach the com-munity.
10. Involve persons on community ad-visory groups who represent neighborhoodgroups in the affected area.
11. Do not have forums as one-sided at-tempts to persuade a community to acceptthe project, nor merely informational meet-ings, but allow for an open-minded andmeaningful exchange of views, idea, alter-natives, and concerns.
12. Do not make assumptions about the“smartness” of community groups.
13. Put people on your assessmentteams who are skilled in recognizing envi-ronmental justice concerns and in workingwith the public.
14. Share information with communitygroups In addition, regulatory personnel onsuch matters as waste streams, regulatoryprocedures and health risks.
15. Make a particular effort to under-stand the concerns of the community, as wellas the distrust the community may have.
16. Involve the community in the con-duct of needed research.
17. Gear your communications to thepeople of color population. This means thatall notices, information, public hearing docu-ments, findings, EA, draft EIS, EIS, supple-mental EIS may need to be translated into
Make a particulareffort to
understand theconcerns of thecommunity, as
well as the distrustthe community
may have.
55A SUMMARY OF THE “HUMAN ENVIRONMENT” REQUIREMENTS OF NEPA: IMPLICATIONS FOR ENVIRONMENTAL JUSTICE ❐
one or more foreign languages in order tomeet the notice requirements.
18. Identify alternatives if the results ofthe EA/EIS lead to a conclusion that effectson the human environment are significant.
19. Do not make inaction or minimalaction decisions on the basis of the politicalstrength of the community.
20. Be creative in developing mitigationor enhancement alternatives.
INFORMATION SOURCESThere are numerous sources of informa-
tion and other resources available both tothose responsible for the preparation of anEA, EIS or FONSI, as well as those respon-sible for the review of or comment upon,such documents. The following is not a com-prehensive listing of all of the available re-sources. Rather, it is designed to providesome guidance on the types of informationwhich is available and where it might befound. We do not vouch for the accuracy ofany of the information found in or providedby these resources. World Wide Web ad-dresses, regular addresses, and telephoneand facsimile numbers provided herein areaccurate as of March 24, 1997, but are alwayssubject to change.
The Emergency Planning andCommunity Right To Know Act
The Emergency Planning and Commu-nity Right To Know Act requires industry toreport about releases for more than 600 toxicchemicals. On April 22, 1997, SecretaryBrowner signed a final EPA rule increasingby approximately 6,100, the number of in-dustrial facilities required to make such fil-ings. A computerized Toxic Release Inven-tory (TRI) maintained by the EPA which isavailable to the public. TRI data also is avail-able on microfiche, Disk, CD-ROM, Disk and9-track magnetic tape. Information reportedincludes releases to air, land, and water, on-site and off-site transfers of chemicals, sourcereduction, recycling, and waste minimiza-tion efforts. Material Safety Data Sheets(MSDS) are another valuable source of in-formation concerning the identity and loca-tion of hazardous chemicals in the commu-
nity. MSDS also provide valuable informa-tion to public officials for emergency plan-ning and response.
The Right-to-Know Network [http:/www.rtk.net] site contains TRI data, as wellas information on hazardous waste, reportedtoxic spills, Superfund sites, waste-water dis-charge permits, water use by county and allcivil cases filed by the Department of Jus-tice. You also can get lending, housing, andcampaign finance data. It also can bereached via telnet at rtk.net. Communitygroups may be able to get an 800 number.For more information contact Iris Figueroa,RTK net, Unison Institute/OMB Watch, 1742Connecticut Avenue, NW, Washington, DC20009-1171; 202-234-8494; fax 202-234-8584.
Environmental JusticeBibliographic Guide, found in Jim
Schwab, Deeper Shades of Green: The Rise ofBlue Collar and Minority Environmentalism inAmerica, Sierra Club Books, 1994 at 433-440.This is an excellent book discussing the back-ground and history of the environmental jus-tice movement.
E a r t h W I N S [ h t t p : / /www.geocities.com/~earthwins] containsnews and information about worldwide ac-tivism. They also publish a newsletter dedi-cated to helping people resist unsafe min-ing [http://www.geocities ..com/!earthwins/ewd.html#econtent]. NoMiningWINS provides information and discussionabout metallic sulfide mining in the GreatLakes and Mississippi Watersheds. To sub-scribe, send an e-mail to
“[email protected]”Directory of Pro Bono Service Providers
for Environmental Justice. This publicationis available from the American Bar Associa-tion for $18.95 (including shipping and han-dling). For more information see http://w w w . a b a n e t . o r g / m e d i a / d e c 9 6 /probdir.html.
Eco-Justice Network [http://www.igc.apc.org/envjustice/] contains awealth of information and links. They in-clude government resources; African Ameri-can Networking; Toxics, Hazards & Waste;and various articles of interest.
Do not makeinaction orminimal actiondecisions on thebasis of thepolitical strengthof the community.
56 ❐ PROCEEDINGS OF SYMPOSIUM IV ON AFRICAN-AMERICAN MOBILITY ISSUES
The January/February 1997 issue of E/The Environmental Magazine has an articledescribing several environmental justicesites on the web.
Justice-Peace-Environment [http://www.ipt.com/htmlpub/jpi/hotlist.htm] is acollection of links to more than 50 sites on avariety of topics, including environmentaljustice and sustainable policy.
Environmental Protection AgencyEPA web site [http://www.epa.gov]
contains a wealth of information about theagency and its programs.
You can get periodic news releases fromthe EPA describing such items as press op-portunities, enforcement actions, proposedrules or regulations, and pesticide registra-tions via “[email protected]”
EPA has created The Office of Children’sHealth Protection [Dr. Philip Landrigan, Se-nior Advisor to the Administrator forChildren’s Health], the Office of Reinvention[J. Charles Fox, Associate Administrator forthe Office of Reinvention] and The Centerfor Environmental Information and Statis-tics. The Center, which is to provide moreelectronic access to information about localpollution, will not be operational until Janu-ary 1998. This Office of Children’s HealthPrevention is to address an array of complexthreats to children’s health. The Office ofReinvention is to address the reinvention ofEPA as well as innovative compliance pro-grams.
Technology Transfer Network: this is abulletin board provided by EPA which con-tains a wealth of information. It can be ac-cessed at http://ttnwww.rtpnc.epa.gov.
EPA’s Office of Environmental Justicemay be reached at http://es.inel.gov/oeca/oej.html.
Publications“A Financing Guide for Recycling Busi-
ness: Investment Forums, Meetings and Net-works.” This is published by the NationalRecycling Coalition and Kirkworks and pro-vides information on sources of capital, fi-nancing strategies and business planning. It
is available by calling the RCRA/SuperfundHotline at 1-800-424-9346. It is documentnumber EPA-530-R-96-012.
“Beyond Compliance - EnvironmentalInformation: Find it on the Internet!” This isan article which discusses many resources.It can be found at http://www.ercweb.com/BC0996/ENVINFO.HTM
“The NIOSH Pocket Guide to ChemicalHazards” This is a valuable source of infor-mation on hundreds of chemicals found inthe workplace. It can be ordered through anybookstore.
ReportsComparative Study of Hazardous Waste
Characterization in the United States andMexico. This study was conducted by theNational Law Center for Inter-AmericanFree Trade and the Centro Juridico para elComecio Interamericano. The study exam-ines how each country defines hazardouswastes and an overview of the applicable re-quirements for generators, transporters,owners and operators of hazardous wasterelated facilities. The English version is lo-cated at http://www.natlaw.com/pubs/spmxen8.exe. The Spanish version is locateda t h t t p : / w w w . n a t l a w . c o m / p u b s /spmxen7.exe.
“Drinking Water Infrastructure NeedsSurvey: First Report to Congress” issued byEPA in January, 1997 pursuant to a require-ment of the Safe Drinking Water Act. Formore information call the EPA’s Safe Drink-ing Water Hotline at 1-800-426-4791.
“Recycling Contaminated Land: A Com-munity Resource Guide.” This is a 1996document prepared by Kevin Green of theCenter for Neighborhood Technology, 2125W. North Avenue, Chicago, IL 60647.Among other items it discusses identifica-tion of brownfield sites, how to determineif contamination is present on a site, typesof redevelopment, and evaluating thecleanup plans. It is available from CNT or athttp://www.cnt.org/sus_man/b13.htm.
“Special Report on Environmental En-docrine Disruption: An Effects Assessmentand Analysis.” This is an interim report is-sued by EPA in March 1997 which reviewsthe existing scientific research on endocrine
57A SUMMARY OF THE “HUMAN ENVIRONMENT” REQUIREMENTS OF NEPA: IMPLICATIONS FOR ENVIRONMENTAL JUSTICE ❐
disruptors. These are chemical and otherthings which are suspected of disrupting thehormonal or endocrine systems of humansand animals. A hard copy can be obtainedfrom EPA’s Office of Research and Devel-opment at 513-569-7562. It also can be foundat http://www.epa.gov/ORD/whatsnew.htm.
”Ten Tips to Protect Children From Pes-ticide and Lead Poisonings.” This leaflet isproduced by EPA and is available in Englishand Spanish. Multiple copies can be obtainedby calling the National Center for Environ-mental Publications and Information at 513-489-8190 or the Toxic Substances Control ActHotline at 202-544-1404. Single copies can beobtained by calling the Office of PesticidePrograms, Communications Branch at 703-305-5017.
“Environment & Public Health Initia-tives.” This is President Clinton’s Earth Day1995 report describing various initiatives.Contact the Council on Environmental Qual-ity for more information.
“Guidelines for the Development ofWetland Replacement Areas” by the Trans-portation Research Board, National ResearchCouncil. This $65.00, 1996 report providesdetailed information concerning the devel-opment of wetland replacement areas. It maybe obtained from the Transportation Re-search Board, National Research Council,2101 Constitution Avenue, NW, Washing-ton, DC 20418.
HealthHealthE: a discussion mailing list de-
signed to educate the general public aboutpotential environmental threats to physical,emotional, and psychological health andwell-being, development management strat-egies to reduce health risks and work withmedical, scientific, legal, industrial commu-nities and the media to find solutions to en-vironmentally caused health problems.. Tosubscribe, send a message to“[email protected]” In the bodyof the message say “subscribe HealthE YourName”
National Institutes of EnvironmentalHealth Studies [http://www.niehs.nih.gov]- put in description.
General EnvironmentalInformation
Environtext [http://tamora.cs.umass.edu/info/envirotext/welcome.html]. Thisis a searchable library containing environ-mental regulations as well as Indian TribalCodes and Treaties.
List of Regulations and ProceduresImplementing NEPA [http://c e q . e h . d o e . g o v / n e p a / a g e n c y /agencies.htm]
Environmental Impact Analysis DataLinks [http:/water.usgs.gov/public/eap/env_data.html] Provides sources of on-linedata sets, including agricultural; endangeredspecies; energy; hydrologic; meteorologic;pollution prevention; socio-economic; spa-tial; wetlands; state, regional and interna-tional resources. It also contains “environ-mental hotlist pages” with links to other re-sources.
Pesticide Information: The National Pes-ticides Telecommunications Network 1-800-858-7378.
Lead Information: The National Lead In-formation Center 1-800-LEADFYI. (1-800-532-3394).
Superfund Information [http://www.epa.gov/superfund.
Air Quality Resources Federal RegisterIndex [http://homepage.interaccess.com/~scotte/apr/frindex.htm]. This site containsa linked list of all 1994 to the present majorFederal Register notices concerning theClean Air Act Amendments of 1990.
Publications
Ecology Law Quarterly [http:www.law.berkeley.edu/~elq/abstract.html] Containsindices of issues from 1994 to the present,along with short article abstracts.
Other InformationOMB Watch [http://rtk.net or
[email protected]] is a Washington, DCbased, non-profit organization which moni-
58 ❐ PROCEEDINGS OF SYMPOSIUM IV ON AFRICAN-AMERICAN MOBILITY ISSUES
tors executive branch activities affecting non-profit and community groups.
The Center for Neighborhood Technol-ogy Neighborhood Early Warning System[http://www.cnt.org/] integrates propertyinformation from several Chicago agencies.
Don’t overlook law firm web pages - par-ticularly those specializing in environmen-tal law. There are too many to mention, butthey tend to contain many things includingarticles, testimony of EPA and environmen-tal group officials, news about recent casesor regulations, and additional sources of in-formation.
Minority Environmental Lawyers Asso-ciation, Inc. [http://www.concentric.net]says it is a not-for-profit corporation dedi-cated to promoting equity in the practice andapplication of environmental law.
The World Wide Web Virtual Law Li-brary [http:www.law.indiana.edu/law/v-lib/lawindex.html] has all kinds of informa-tion, including law firms, law journals, andlinks to government and state sites.
ENDNOTES
1 Vermont Yankee Nuclear Power Corpv. NRDC, 435 U.S. 519, 558 (1978).
2 Data provided by agencies, for ex-ample, the Toxics Release Inventory,CERCLA Information System, Departmentof Transportation’s chemicals in transit in-formation, and information collected as a re-sult of the Emergency Planning and Right toKnow Act may assist in determining the set-ting in which the new project will be con-structed and if there is a potential for cumu-lative effects.
59LOCATION CHARACTERISTICS OF INNER-CITY NEIGHBORHOODS AND EMPLOYMENT ACCESSIBILITY OF LOW-WAGE WORKERS
❐
Location Characteristics of Inner-City Neighborhoods andLocation Characteristics of Inner-City Neighborhoods andEmployment Accessibility of Low-Wage WorkersEmployment Accessibility of Low-Wage Workers
Qing ShenDepartment of Urban Studies and Planning
Massachusetts Institute of Technology
ACKNOWLEDGMENT
The author wishes to thank Ian Harrington andPaul Reim of the Central Transportation Plan-ning Staff (CTPS) for providing data and assis-tance. Andy Siemers, Gary Yau, and Cliff Leecontributed to the work as research assistants.The project was funded by the School of Archi-tecture and Planning at MIT through a human-ity and social science research grant.
AbstractStudies that examine spatial character-
istics of urban unemployment are oftenbased on some simplistic and problematicmeasures of employment accessibility. Thispaper presents a refined methodologicalframework for measuring accessibility,which enables the researcher to (1) improvethe measurement by accounting for job com-petition among workers commuting by dif-ferent modes and (2) understand the out-come more thoroughly by distinguishing theeffect of location from that of workers’ autoownership. This refined framework is ap-plied to a case study of employment accessi-bility of low-wage workers living in Boston’sinner-city neighborhoods, using primarily1990 Census demographic data and journey-to-work data. The empirical results showclearly that although the central location ofinner-city residence still gives the low-wageworkers some advantage, auto ownership isnonetheless the key determinant. Low-wageworkers living in inner-city neighborhoodson average do not have high employment
accessibility because a large proportion ofthem do not own any motor vehicle and,hence, have limited spatial mobility. Impli-cations of the findings are discussed andqualified in light of the limitation of the re-search.
Introduction
Since the pioneering work by Kain(1968) three decades ago, many urban policy researchers have at-
tempted to understand spatial characteris-tics of unemployment in American metro-politan areas. Most of the studies have fo-cused on the inner-city, where unemploy-ment and related social ills display high lev-els of concentration.1 Some of the studies in-dicate that the problem of unemploymentin the inner-city is at least partially causedby spatial factors, such as employment de-centralization and residential segregation(Ihlanfeldt and Sjoquist, 1989; Kain, 1968).Others suggest that the problem is causedentirely by non-spatial factors, such as ra-cial discrimination and failure of govern-mental policy (Ellwood, 1986; Harrison,1974). Different diagnoses lead to differentprescriptions, which range from plannedsuburbanization of low-wage workers toplanned revitalization of inner-city neigh-borhoods. The debate continues, and willlikely be intensified because substantial re-ductions in the federal and state govern-ments’ welfare budgets for the last few yearshave prompted many policy researchers to
60 ❐ PROCEEDINGS OF SYMPOSIUM IV ON AFRICAN-AMERICAN MOBILITY ISSUES
seek new strategies for addressing urbaneconomic and social problems. One impor-tant example is Porter’s (1995) recent propo-sition to create economic vitality in the in-ner-city based on its competitive advantage,which he argues to be partly attributed to itsstrategic location.
It is not the purpose of this paper to givea comprehensive review of empirical re-search on the relationship between urban un-employment and location, or to join the on-going debate on spatial mismatch hypoth-esis with some new empirical evidence. In-stead, the paper is aimed at improving themeasurement, and consequently the basicunderstanding, of some important aspects oflocation characteristics of urban neighbor-hoods - especially ones located in inner-cit-ies. More specifically, it presents a study thatdevelops a refined methodological frame-work for measuring accessibility and appliesthe framework to a case study of employ-ment accessibility of low-wage workers liv-ing in Boston’s inner-city neighborhoods.Although the objective seems modest, it isactually rather important, because many re-searchers use some location variable - mostoften employment accessibility - to help ex-plain the problem of unemployment with-out first measuring the variable appropri-ately. Proper measurement and understand-ing of variables is undoubtedly the founda-tion for credible empirical analysis of therelationships between the variables.
One of the common, problematic ap-proaches to measuring employment acces-sibility is to simply calculate the ratio of thenumber of blue-collar jobs to the number ofworkers within a certain area defined bysome threshold commuting distance(Leonard, 1985). Obviously, this approachdoes not appropriately capture the spatialinteraction between jobs and workers, theoccupational match between jobs and work-ers, or the job competition among workers.A second common approach is to adopt asimple central city/suburban dichotomy todefine locations (Harrison, 1974). This ap-proach is often problematic because it ig-nores the potentially great variation in em-ployment accessibility among differentneighborhoods within the central city, andthus leaves out information that is highly
valuable for many urban planning andpolicy making purposes. A third commonapproach is to use the average travel time ofworkers - often those who are currently em-ployed and commute by automobile - as theindicator of employment accessibility(Ihlanfeldt and Sjoquist, 1989). The problemof this approach is that it becomes impos-sible to separate the effect of location fromthe effect of auto ownership, or to distinguishbetween accessibility as the cause, and ac-cessibility as the effect, of employment.
The methodological question that will beaddressed in this paper, therefore, is: Howto measure employment accessibility appro-priately - such that the above-mentionedcommon problems can be avoided?
The paper will go much beyond meth-odological discussion. It will address a num-ber of urban planning and policy relatedquestions based on the case study of employ-ment accessibility of low-wage workers liv-ing in Boston’s inner-city neighborhoods,which applied the refined methodologicalframework developed in the first part of theresearch. The first question is: Do inner-cityneighborhoods give the residents any loca-tion advantage? Here location advantage isnarrowly defined as having relatively lowlevel spatial separation between residenceand employment. This narrow definitionserves the purpose of clarifying some impor-tant cause-effect relationships in locationanalysis by distinguishing spatial factorsfrom other factors, such as racial discrimi-nation (Ellwood, 1986).
The next question is: Is there substantialvariation in employment accessibility amonginner-city neighborhoods? To be sure, thereare urban planning and policy questions,including municipal tax base loss and fiscalcrisis, which can be appropriately addressedby highly aggregated analyses that treat cen-tral city as a single spatial entity (Harrison,1974). However, many urban planning andpolicy actions involve location decisions atsuch levels of detail as neighborhoods,blocks, or even parcels. For example, un-derstanding local spatial variation in acces-sibility is obviously important for planningpublic housing and transit service.
The third and final question is: How im-portant is low-wage workers’ spatial mobil-
Do inner-cityneighborhoods
give the residentsany location
advantage? Isthere substantial
variation inemploymentaccessibility
among inner-cityneighborhoods?
How important islow-wage
workers’ spatialmobility,
measured interms of autoownership, in
determining theiremploymentaccessibility?
61LOCATION CHARACTERISTICS OF INNER-CITY NEIGHBORHOODS AND EMPLOYMENT ACCESSIBILITY OF LOW-WAGE WORKERS
❐ity, measured in terms of auto ownership,in determining their employment accessibil-ity? A number of recent urban transporta-tion studies suggest that spatial separationis of decreasing importance because trans-portation has become cheap and ubiquitous,and market forces have adjusted themselveswell in responding to new transportationand communication technologies (Giulianoand Small, 1993; Gordon, Kumar, andRichardson, 1989). But the fact is that a highpercentage of low-income households, espe-cially those living in inner-cities, do not ownany motor vehicle. Therefore, the optimis-tic outlooks may not apply to low-wageworkers, because more and more of themfind themselves constrained by their lack ofspatial mobility in dispersing metropolitaneconomies which make private auto increas-ingly necessary for employment (Kasarda,1989). The discussion on integrating landuse and transportation planning, advocatedmost strongly byCervero (1989), may be es-pecially relevant to planning and policymaking regarding low-wage workers livingin inner-cities.
Research MethodologyThe key methodological component of
this study is to develop an improved mea-sure of employment accessibility and use itas a means of understanding location char-acteristics of inner-city neighborhoods. Atruly useful measure must satisfy two im-portant criteria. One is that it must enablethe researcher to decompose the problem bydetermining the different levels of employ-ment accessibility for workers who belongto different socioeconomic groups, rely ondifferent transportation means, and live indifferent locations. The other important cri-terion is that it must enable the researcher tocompare the different results for differentworkers meaningfully. With an appropri-ately constructed accessibility measure, theresearcher can then apply it to one or morecases to obtain empirical evidence for shed-ding new light onto the debate on locationcharacteristics of inner-city neighborhoods.
MEASUREMENT OF ACCESSIBILITY
HANSEN-TYPE MEASURES AND THEIR
MAJOR LIMITATION
Accessibility denotes the ease withwhich spatially distributed opportunitiesmay be reached from a given location usinga particular transportation system (Morris,Dumble, and Wigan, 1979). It is, therefore,a function of both land use patterns and theperformance of the transportation system.Most existing operational measures of acces-sibility are based on Hansen’s original for-mula (Hansen, 1959). These measures canbe generally expressed as:
Equation (1)
Si = Σj Oj f(Cij)Si = Σj Oj f(Cij)
where Si is accessibility for location i;Oj is number of relevant opportunities
in location j;Ci j Is travel time, distance, or cost for a
trip from i to j;f(Ci j) is the impedance function measur-
ing the spatial separation between i and j;For an urban or regional system with N
locations, i = 1, 2, ..., N, and j = 1, 2, ..., N.
In actual applications, Equation (1) isfurther specified in various ways.2 One typeof variation coincides with different oppor-tunities and transportation means availableto different socioeconomic groups. Re-searchers often find it necessary to measureopportunities and travel impedance in cer-tain restricted ways in order to address theirquestions appropriately. For example, in astudy of the social implications of urban spa-tial structure, the researchers stratified thepopulation into relatively homogeneousgroups - male workers and female workers- and calculated accessibility for each groupseparately (Black and Conroy, 1977). In an-other study, the researchers examined theimportance of spatial mobility by compar-ing accessibility between those who driveand those who ride public transportation(Wachs and Kumagai, 1973). The other typeof variation corresponds to alternative viewsregarding the appropriate measurement ofspatial separation, which originally used apower function adopted from Newton’s Lawof Gravity. Alternative specifications of spa-
...the fact is that ahigh percentage oflow-incomehouseholds,especially thoseliving in inner-cities, do not ownany motorvehicle.s
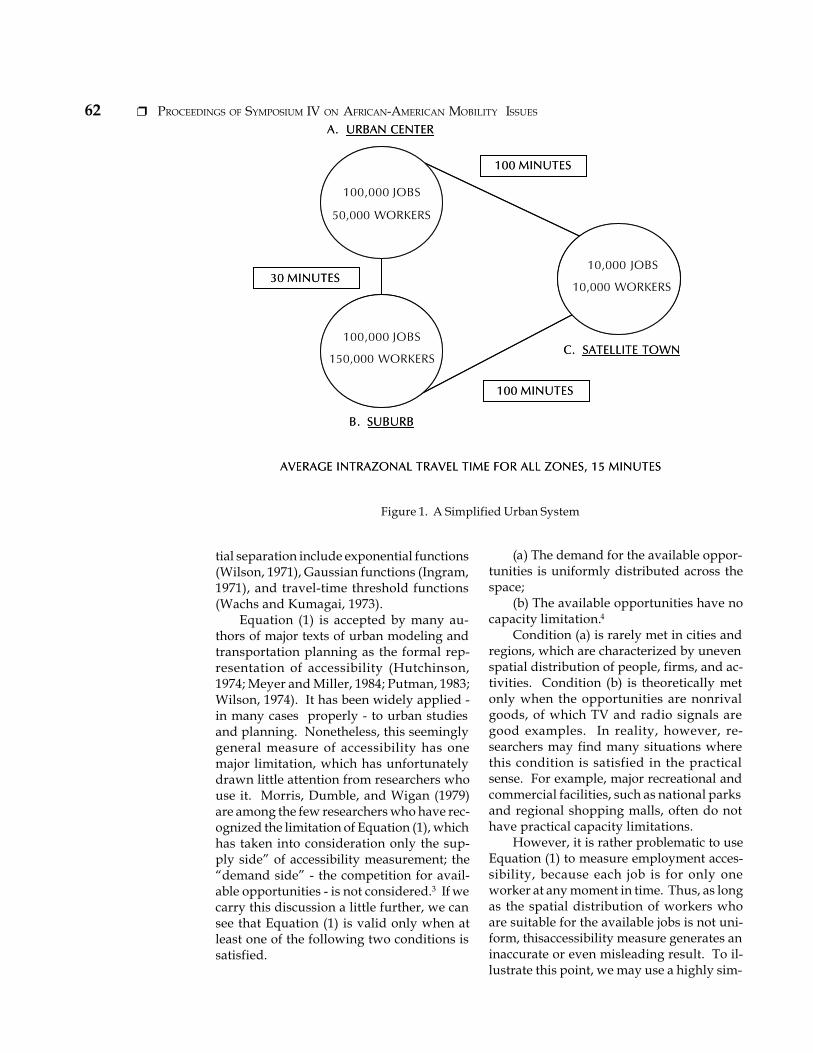
62 ❐ PROCEEDINGS OF SYMPOSIUM IV ON AFRICAN-AMERICAN MOBILITY ISSUES
tial separation include exponential functions(Wilson, 1971), Gaussian functions (Ingram,1971), and travel-time threshold functions(Wachs and Kumagai, 1973).
Equation (1) is accepted by many au-thors of major texts of urban modeling andtransportation planning as the formal rep-resentation of accessibility (Hutchinson,1974; Meyer and Miller, 1984; Putman, 1983;Wilson, 1974). It has been widely applied -in many cases properly - to urban studiesand planning. Nonetheless, this seeminglygeneral measure of accessibility has onemajor limitation, which has unfortunatelydrawn little attention from researchers whouse it. Morris, Dumble, and Wigan (1979)are among the few researchers who have rec-ognized the limitation of Equation (1), whichhas taken into consideration only the sup-ply side” of accessibility measurement; the“demand side” - the competition for avail-able opportunities - is not considered.3 If wecarry this discussion a little further, we cansee that Equation (1) is valid only when atleast one of the following two conditions issatisfied.
(a) The demand for the available oppor-tunities is uniformly distributed across thespace;
(b) The available opportunities have nocapacity limitation.4
Condition (a) is rarely met in cities andregions, which are characterized by unevenspatial distribution of people, firms, and ac-tivities. Condition (b) is theoretically metonly when the opportunities are nonrivalgoods, of which TV and radio signals aregood examples. In reality, however, re-searchers may find many situations wherethis condition is satisfied in the practicalsense. For example, major recreational andcommercial facilities, such as national parksand regional shopping malls, often do nothave practical capacity limitations.
However, it is rather problematic to useEquation (1) to measure employment acces-sibility, because each job is for only oneworker at any moment in time. Thus, as longas the spatial distribution of workers whoare suitable for the available jobs is not uni-form, thisaccessibility measure generates aninaccurate or even misleading result. To il-lustrate this point, we may use a highly sim-
10,000 JOBS
10,000 WORKERS
100,000 JOBS
150,000 WORKERS
100,000 JOBS
50,000 WORKERS
100 MINUTES
100 MINUTES
30 MINUTES
A. URBAN CENTER
B. SUBURB
C. SATELLITE TOWN
AVERAGE INTRAZONAL TRAVEL TIME FOR ALL ZONES, 15 MINUTES
10,000 JOBS
10,000 WORKERS
100,000 JOBS
150,000 WORKERS
100,000 JOBS
50,000 WORKERS
100 MINUTES
100 MINUTES
30 MINUTES
A. URBAN CENTER
B. SUBURB
C. SATELLITE TOWN
AVERAGE INTRAZONAL TRAVEL TIME FOR ALL ZONES, 15 MINUTES
Figure 1. A Simplified Urban System
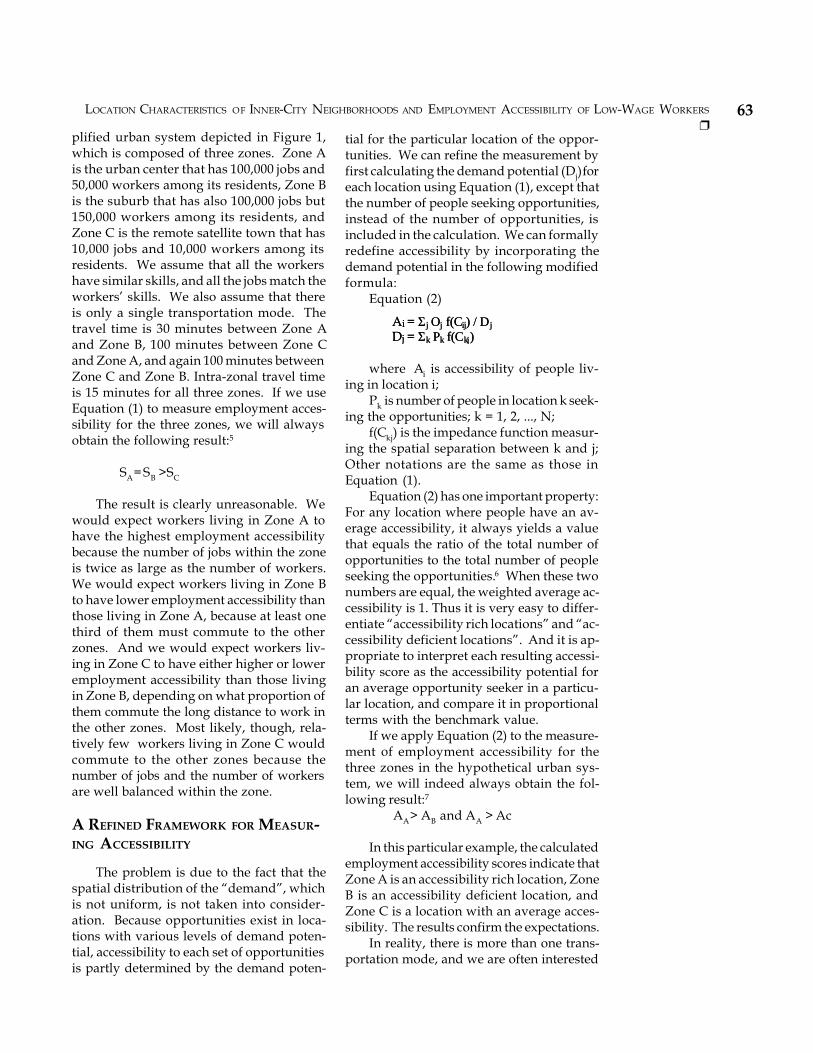
63LOCATION CHARACTERISTICS OF INNER-CITY NEIGHBORHOODS AND EMPLOYMENT ACCESSIBILITY OF LOW-WAGE WORKERS
❐plified urban system depicted in Figure 1,which is composed of three zones. Zone Ais the urban center that has 100,000 jobs and50,000 workers among its residents, Zone Bis the suburb that has also 100,000 jobs but150,000 workers among its residents, andZone C is the remote satellite town that has10,000 jobs and 10,000 workers among itsresidents. We assume that all the workershave similar skills, and all the jobs match theworkers’ skills. We also assume that thereis only a single transportation mode. Thetravel time is 30 minutes between Zone Aand Zone B, 100 minutes between Zone Cand Zone A, and again 100 minutes betweenZone C and Zone B. Intra-zonal travel timeis 15 minutes for all three zones. If we useEquation (1) to measure employment acces-sibility for the three zones, we will alwaysobtain the following result:5
SA= SB >SC
The result is clearly unreasonable. Wewould expect workers living in Zone A tohave the highest employment accessibilitybecause the number of jobs within the zoneis twice as large as the number of workers.We would expect workers living in Zone Bto have lower employment accessibility thanthose living in Zone A, because at least onethird of them must commute to the otherzones. And we would expect workers liv-ing in Zone C to have either higher or loweremployment accessibility than those livingin Zone B, depending on what proportion ofthem commute the long distance to work inthe other zones. Most likely, though, rela-tively few workers living in Zone C wouldcommute to the other zones because thenumber of jobs and the number of workersare well balanced within the zone.
A REFINED FRAMEWORK FOR MEASUR-ING ACCESSIBILITY
The problem is due to the fact that thespatial distribution of the “demand”, whichis not uniform, is not taken into consider-ation. Because opportunities exist in loca-tions with various levels of demand poten-tial, accessibility to each set of opportunitiesis partly determined by the demand poten-
tial for the particular location of the oppor-tunities. We can refine the measurement byfirst calculating the demand potential (Dj) foreach location using Equation (1), except thatthe number of people seeking opportunities,instead of the number of opportunities, isincluded in the calculation. We can formallyredefine accessibility by incorporating thedemand potential in the following modifiedformula:
Equation (2)
Ai = Σj Oj f(Cij) / DjDj = Σk Pk f(Ckj)Ai = Σj Oj f(Cij) / DjDj = Σk Pk f(Ckj)
where Ai is accessibility of people liv-ing in location i;
Pk is number of people in location k seek-ing the opportunities; k = 1, 2, ..., N;
f(Ckj) is the impedance function measur-ing the spatial separation between k and j;Other notations are the same as those inEquation (1).
Equation (2) has one important property:For any location where people have an av-erage accessibility, it always yields a valuethat equals the ratio of the total number ofopportunities to the total number of peopleseeking the opportunities.6 When these twonumbers are equal, the weighted average ac-cessibility is 1. Thus it is very easy to differ-entiate “accessibility rich locations” and “ac-cessibility deficient locations”. And it is ap-propriate to interpret each resulting accessi-bility score as the accessibility potential foran average opportunity seeker in a particu-lar location, and compare it in proportionalterms with the benchmark value.
If we apply Equation (2) to the measure-ment of employment accessibility for thethree zones in the hypothetical urban sys-tem, we will indeed always obtain the fol-lowing result:7
AA> AB and AA > Ac
In this particular example, the calculatedemployment accessibility scores indicate thatZone A is an accessibility rich location, ZoneB is an accessibility deficient location, andZone C is a location with an average acces-sibility. The results confirm the expectations.
In reality, there is more than one trans-portation mode, and we are often interested
64 ❐ PROCEEDINGS OF SYMPOSIUM IV ON AFRICAN-AMERICAN MOBILITY ISSUES
in measuring and comparing accessibility fordifferent groups of people who use differ-ent modes. It is important to understand thateach group is competing with all othergroups, because opportunities are poten-tially accessible by all kinds of transporta-tion means. There are, no matter whichgroup of people we measure accessibility for,the demand potential stays constant for anygiven location. The supply potential, on theother hand, varies according to the spatialmobility of the particular group of people.The further modified accessibility measurecan be expressed as:8
Equation (3)Ai
v = Σ j Oj f(Cijv) / Σm Dj
mAiv = Σ j Oj f(Cij
v) / Σm Djm
where Aiv is accessibility of people liv-
ing in location i and traveling by mode v;Pk
m is number of people living in loca-tion k and traveling by mode in seeking theopportunities;
For an urban or regional system with Mmodes, m = 1, 2, ..., M;
f(Ci jv) and f(Ckj
m) are the impedance func-tions for modes v and m, respectively;
Other notations are the same as those inEquations (1) and (2).
Equation (3) has two important proper-ties. One is that it has the same property thatEquation (2) has, which makes it easy toidentify “accessibility rich locations” and“accessibility deficient locations” based ona predetermined weighted average scoreand to interpret any resulting accessibilityscore by comparing it to the weighted aver-age score. The other important property isthat it allows the researcher to compare ac-cessibility scores directly across differenttransportation modes. This is because theformula incorporates the same overall de-mand potential into the measurements of ac-cessibility for different groups of people trav-eling by different modes.
Finally, a refined general measure of ac-cessibility can be defined by calculating foreach location a weighted score. The propor-tions of people who travel by the differentmodes are used as the weights. The refinedgeneral measure is expressed as:
Equation (4)
AiG = Σv (Piv/ Pi) Ai
v
Aiv = Σj Oj f(Cijv) / ΣmΣkPkm f(Ckj m)AiG = Σv (Pi
v/ Pi) Aiv
Aiv = Σj Oj f(Cijv) / ΣmΣkPkm f(Ckj m)
where AiG is general accessibility for all
groups of people living in location i;Pi
v is number of people in location i trav-eling by mode v in seeking the opportuni-ties;
v = 1, 2, ..., M;Pi is the total number of people in loca-
tion i;Other notations are the same as those in
Equations (1), (2), and (3).We call equation (4) the general measure
of accessibility because each of the previousequations is just a special case of it. Equa-tion (3) is used when the researcher is inter-ested in measuring the spatial variation ofaccessibility for only the group of peopletraveling by one of the alternative transpor-tation modes. Equation (2) is applied whenthere is only a single transportation mode inthe urban system. And finally, equation (1)is appropriate when there is only a singletransportation mode and the demand poten-tial is constant for all locations.9
EMPLOYMENT ACCESSIBILITY MEA-SURES FOR AUTO DRIVERS AND TRAN-SIT RIDERS
When measuring employment accessi-bility, Equations (3) and (4) use the numberof relevant jobs in each location as opportu-nities and the number of relevant workersas opportunity seekers. The urban labormarket is highly segmented. Therefore, it isimportant to match the jobs with the work-ers by applying such criteria as educationbackground, occupation, and wage. In thisresearch occupation and wage are used ascriteria to group jobs and workers.
The great importance of spatial mobil-ity, which is closely related to transportationmodes and strongly correlated with income,must be examined in order to appropriatelyaddress location questions for inner cityneighborhoods. In this research, two distinc-tive groups of workers are identified by ap-plying auto ownership as the criterion. Onegroup, which consists of workers whosehousehold owns at least one motor vehicle,is able to choose transportation means. Forthese workers the performance of transpor-tation system is essentially evaluated on the
The urban labormarket is highly
segmented.Therefore, it is
important tomatch the jobs
with the workersby applying such
criteria aseducation
background,occupation, and
wage.
65LOCATION CHARACTERISTICS OF INNER-CITY NEIGHBORHOODS AND EMPLOYMENT ACCESSIBILITY OF LOW-WAGE WORKERS
❐basis of the spatial mobility associated withautomobiles. Therefore, auto travel imped-ance is used in the measurement of their em-ployment accessibility. The other group ofworkers, which consists of the rest of the la-bor force, are captive transit riders. For thisgroup, transit travel impedance is used inthe measurement of employment accessibil-ity.
Specifically, this research applies the fol-lowing three formulas to the measurementof employment accessibility for workers ofany given occupation or wage group:
Equation (5)
Ai auto = Σj Ej f(Cijauto) / Σk (αk Wk f(Ckj
auto) +(1 - αk) Wk f(Ckjtran))Ai auto = Σj Ej f(Cij
auto) / Σk (αk Wk f(Ckj auto) +
(1 - αk) Wk f(Ckjtran))
Equation (6)Ai auto = Σj Ej f(Cij
train) / Σk (αk Wk f(Ckj auto) +
(1 - αk) Wk f(Ckjtran))
Equation (7)AiG =(αi W i/W i) Ai
auto + ((1 - αi) Wi/W i ) A itran
where Aiauto and Ai
t ran are employmentaccessibility of workers who are auto driv-ers and captive transit riders, respectively,living in location i;
AiG is general employment accessibility
combining Aiauto and A i
tran;Ej is relevant employment opportunities
in location j;Wk and Wi are numbers of relevant
workers in locations k and i, respectively;αk and ai are proportions of households
in locations k and i, respectively, that ownone or more motor vehicles;
f(Ci jauto), f(Ci j
t ran), f(Ckjauto) , and f(Ckj
tran, )are impedance functions for modes andlinks;
Other notations are the same as those inthe previous equations.
THE DATA, COMPUTATION, AND MAP-PING
The Boston Metropolitan Area is usedas the case for the research. The metropoli-tan area covers roughly 1,400 square milesof land and accommodates over 4 millionpeople. Although the study examines em-ployment accessibility for workers belong-ing to different wage and occupation groups
and living in different locations, the mainfocus is on the low-wage workers living ininner-city neighborhoods outside the CBDof Boston.
A considerable range of data is requiredfor the empirical analysis. Thanks to the in-creasingly rich transportation and socioeco-nomic data available at spatially highly dis-aggregated levels, it is now feasible tooperationalize the more sophisticated mea-sures of employment accessibility. The datawere obtained from five sources.
(1) Transportation data were obtainedfrom the Central Transportation PlanningStaff (CTPS), the regional transportationplanning agency. For 1990, the whole met-ropolitan area was represented by 790 traf-fic analysis zone (TAZs). Almost all theTAZs are some geographical aggregation ofCensus block groups. Data made availableby CTPS include:
• Two sets of origin-destination matri-ces for the TAZs, one for peak-hour auto tripsand the other for peak-hour transit trips.These data are required for measuring travelimpedance.
• A set of friction factors for home-basedcommuting trips. These data allow the re-searcher to calibrate the parameter (i.e. theP value) for travel impedance functions. Asimple exponential function, f(Ci j) = exp (-bCi j) is applied to this research. The b valueis 0. 1034, calibrated through a simple regres-sion procedure.10
• A geographic information system(GIS) map coverage (in Arc/Info format) ofthe 790 TAZs.
(2) Most of the demographic and socio-economic data were pulled from the Sum-mary Tape File 3A, which originates fromthe United States Census of 1990 and 1980.The data were initially compiled at the blockgroup level, and were later aggregated tomatch the TAZs. The following data itemsare particular important:
• Workers by residential location, cat-egorized into 9 occupation groups.
• Employed and unemployed workersby residential location.
• Auto ownership.(3) Employment by job location data for
1990 and 1980 were generated originally by
The BostonMetropolitan Areais used as the casefor the research.The metropolitanarea coversroughly 1,400square miles ofland andaccommodatesover 4 millionpeople.
66 ❐ PROCEEDINGS OF SYMPOSIUM IV ON AFRICAN-AMERICAN MOBILITY ISSUES
the United States Census Bureau using Jour-ney-to-Work compilation packages. Theseemployment data are categorized into Stan-dard Occupation Codes and organized into9 groups that match the data of workers byresidential location. The data are reportedat the TAZ level. This data set was actuallyobtained indirectly from CTPS.
(4) A table of conversion between occu-pations and individual workers’ income wasobtained from the State Data Center locatedat University of Massachusetts, Amherst.This conversion table was derived from the1990 Public Use Microdata Sample A (5%),which was compiled by the United StatesCensus Bureau in 1990. This table, which isshown in appendix 1, enables the researcherto classify jobs and workers into I 0 wagegroups and measure employment accessibil-ity for different wage groups separately.
(5) Other data describing various geo-graphical features of the metropolitan areawere obtained from MassGIS, an agency incharge of Massachusetts’ state-wide GIS ef-fort. These data help the researcher under-stand more thoroughly the differencesamong different locations. The followingdata items are especially useful:
• A land use coverage (in Arc/Info for-mat).
• A coverage of administrative bound-aries of cities and towns (in Arc/Info format).
• A coverage of major roads (in Arc/Infoformat).
• Coverages of railroads and subways(in Arc/Info format).
The measurement of employment ac-cessibility, which involves a large amount ofcomputation, was implemented through a Cprogram. An interface was created for thepurpose of specifying transportation mode,income range or occupation, and impedancefunction and parameter values, which are allrequired for the measurement. The result-ing accessibility scores were imported to aGIS package for visual display.11 Supplementanalyses were undertaken using data analy-sis and mapping packages.
Primary Empirical ResultsFor Boston Metropolitan Area, the un-
employment rate reported in the 1990 Cen-
sus was 6.5%. Therefore, the weighted av-erage value of employment accessibility, i.e.the benchmark value, is 0.935. In visual dis-plays of employment accessibility, TAZs thathave an accessibility score higher than theweighted average value are clearly distin-guished from the rest of the TAZs by apply-ing two completely different styles of shad-ing.EMPLOYMENT ACCESSIBILITY OF LOW-WAGE WORKERS
The first set of measurements were forlow-wage workers who earn less than US$10,000 per year. The results are displayedin Figures 2 and 3. The first map shows thespatial variation of employment accessibil-ity for low-wage workers who commute byautomobile, whereas the second map showsthe result for low-wage workers who com-mute by public transit. The most obviousfinding in both maps is that for workers whouse a given transportation means, those liv-ing near the CBD of the metropolitan areastill have relatively higher employment ac-cessibility than those living in the suburbs.Low-wage workers on average will not im-prove their employment accessibility bymoving away from inner-city neighborhoodsto the suburbs, because a large proportionof the inner city neighborhoods are in theTAZs that have clear advantage in accessi-bility.
The second finding, which is the moststriking and most important one, is that morethan half of the TAZs are “accessibility richlocations” for low-wage workers who com-mute by auto, whereas only a very small pro-portion of the TAZs are “accessibility richlocations” for low-wage workers who com-mute by public transit. Indeed, the few TAZswhere transit riders have employment acces-sibility scores higher than the weighted av-erage value are all located in or adjacent tothe CBD. What it means is that althoughcentral location of residence still has advan-tage as far as employment accessibility isconcerned, auto ownership is nonethelessthe key determinant. Indeed, it is most of-ten the case that workers living in the sub-urban areas who commute by auto havehigher employment accessibility than those
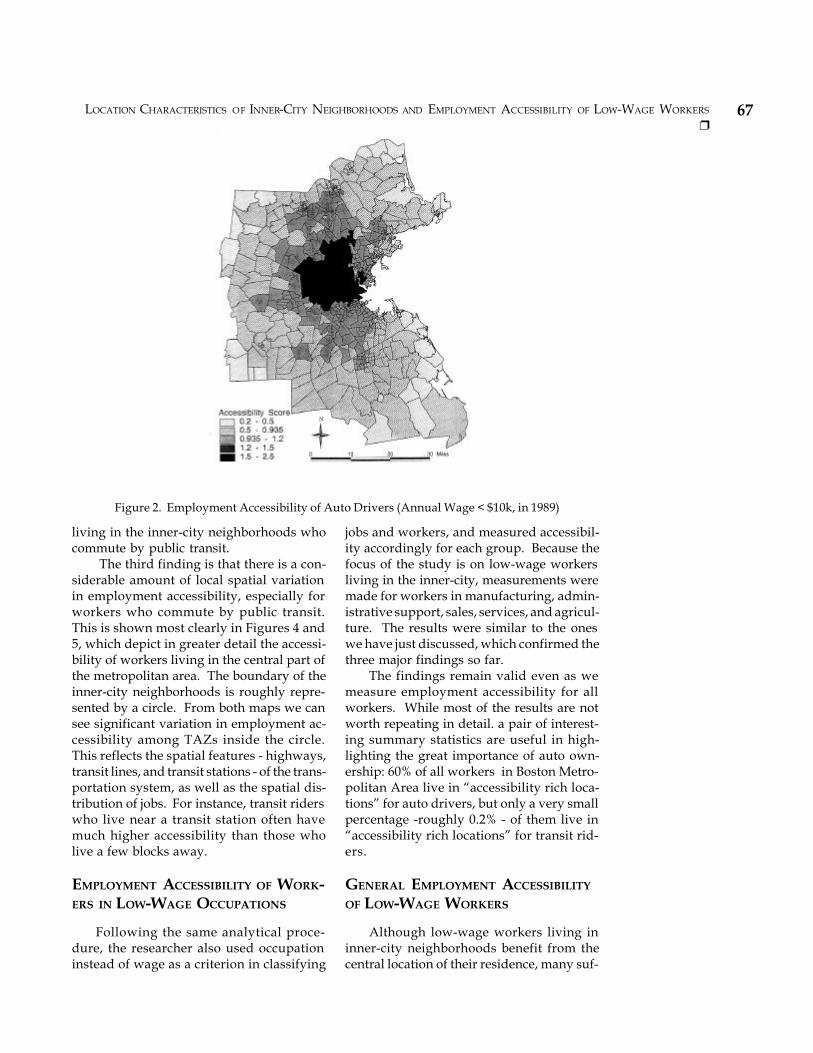
67LOCATION CHARACTERISTICS OF INNER-CITY NEIGHBORHOODS AND EMPLOYMENT ACCESSIBILITY OF LOW-WAGE WORKERS
❐
living in the inner-city neighborhoods whocommute by public transit.
The third finding is that there is a con-siderable amount of local spatial variationin employment accessibility, especially forworkers who commute by public transit.This is shown most clearly in Figures 4 and5, which depict in greater detail the accessi-bility of workers living in the central part ofthe metropolitan area. The boundary of theinner-city neighborhoods is roughly repre-sented by a circle. From both maps we cansee significant variation in employment ac-cessibility among TAZs inside the circle.This reflects the spatial features - highways,transit lines, and transit stations - of the trans-portation system, as well as the spatial dis-tribution of jobs. For instance, transit riderswho live near a transit station often havemuch higher accessibility than those wholive a few blocks away.
EMPLOYMENT ACCESSIBILITY OF WORK-ERS IN LOW-WAGE OCCUPATIONS
Following the same analytical proce-dure, the researcher also used occupationinstead of wage as a criterion in classifying
jobs and workers, and measured accessibil-ity accordingly for each group. Because thefocus of the study is on low-wage workersliving in the inner-city, measurements weremade for workers in manufacturing, admin-istrative support, sales, services, and agricul-ture. The results were similar to the oneswe have just discussed, which confirmed thethree major findings so far.
The findings remain valid even as wemeasure employment accessibility for allworkers. While most of the results are notworth repeating in detail. a pair of interest-ing summary statistics are useful in high-lighting the great importance of auto own-ership: 60% of all workers in Boston Metro-politan Area live in “accessibility rich loca-tions” for auto drivers, but only a very smallpercentage -roughly 0.2% - of them live in“accessibility rich locations” for transit rid-ers.
GENERAL EMPLOYMENT ACCESSIBILITY
OF LOW-WAGE WORKERS
Although low-wage workers living ininner-city neighborhoods benefit from thecentral location of their residence, many suf-
Figure 2. Employment Accessibility of Auto Drivers (Annual Wage < $10k, in 1989)
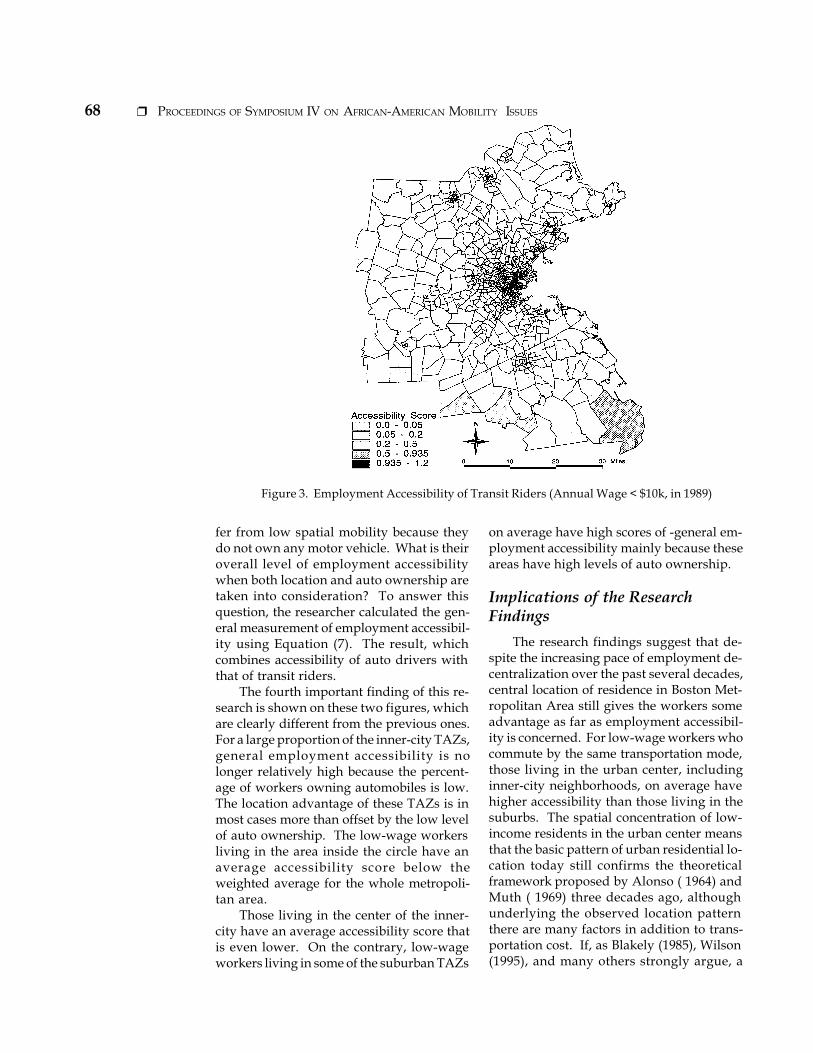
68 ❐ PROCEEDINGS OF SYMPOSIUM IV ON AFRICAN-AMERICAN MOBILITY ISSUES
fer from low spatial mobility because theydo not own any motor vehicle. What is theiroverall level of employment accessibilitywhen both location and auto ownership aretaken into consideration? To answer thisquestion, the researcher calculated the gen-eral measurement of employment accessibil-ity using Equation (7). The result, whichcombines accessibility of auto drivers withthat of transit riders.
The fourth important finding of this re-search is shown on these two figures, whichare clearly different from the previous ones.For a large proportion of the inner-city TAZs,general employment accessibility is nolonger relatively high because the percent-age of workers owning automobiles is low.The location advantage of these TAZs is inmost cases more than offset by the low levelof auto ownership. The low-wage workersliving in the area inside the circle have anaverage accessibility score below theweighted average for the whole metropoli-tan area.
Those living in the center of the inner-city have an average accessibility score thatis even lower. On the contrary, low-wageworkers living in some of the suburban TAZs
on average have high scores of -general em-ployment accessibility mainly because theseareas have high levels of auto ownership.
Implications of the ResearchFindings
The research findings suggest that de-spite the increasing pace of employment de-centralization over the past several decades,central location of residence in Boston Met-ropolitan Area still gives the workers someadvantage as far as employment accessibil-ity is concerned. For low-wage workers whocommute by the same transportation mode,those living in the urban center, includinginner-city neighborhoods, on average havehigher accessibility than those living in thesuburbs. The spatial concentration of low-income residents in the urban center meansthat the basic pattern of urban residential lo-cation today still confirms the theoreticalframework proposed by Alonso ( 1964) andMuth ( 1969) three decades ago, althoughunderlying the observed location patternthere are many factors in addition to trans-portation cost. If, as Blakely (1985), Wilson(1995), and many others strongly argue, a
Figure 3. Employment Accessibility of Transit Riders (Annual Wage < $10k, in 1989)
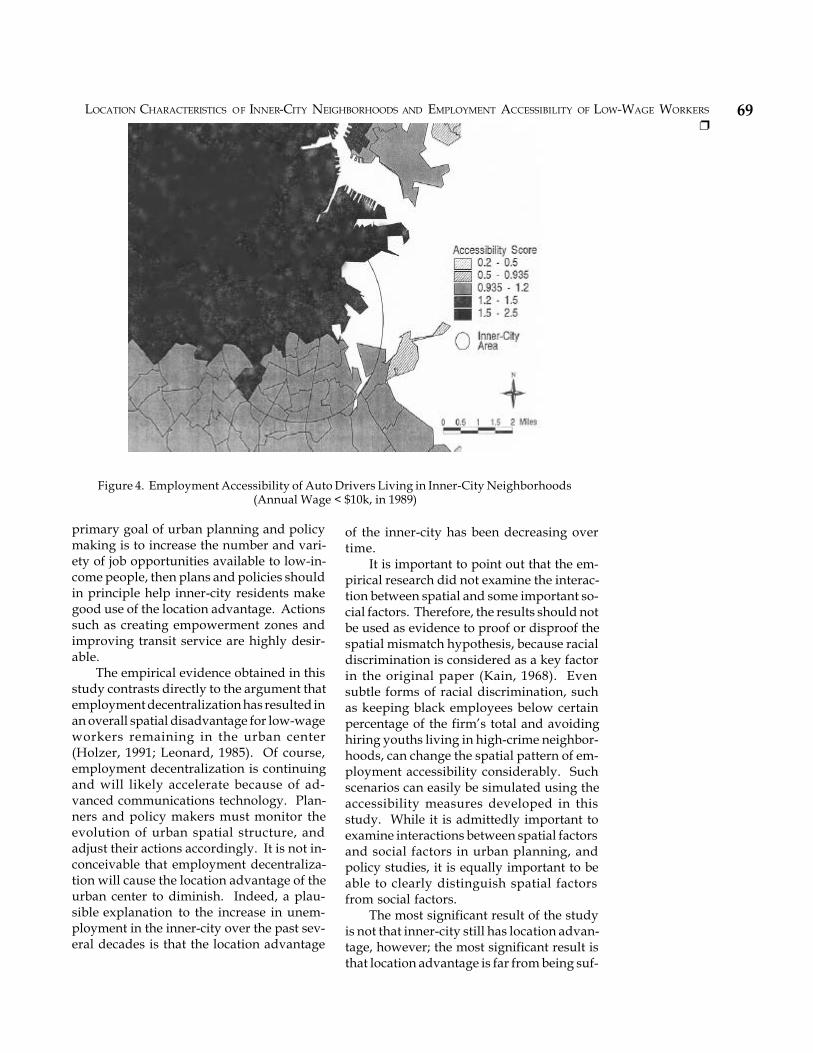
69LOCATION CHARACTERISTICS OF INNER-CITY NEIGHBORHOODS AND EMPLOYMENT ACCESSIBILITY OF LOW-WAGE WORKERS
❐
primary goal of urban planning and policymaking is to increase the number and vari-ety of job opportunities available to low-in-come people, then plans and policies shouldin principle help inner-city residents makegood use of the location advantage. Actionssuch as creating empowerment zones andimproving transit service are highly desir-able.
The empirical evidence obtained in thisstudy contrasts directly to the argument thatemployment decentralization has resulted inan overall spatial disadvantage for low-wageworkers remaining in the urban center(Holzer, 1991; Leonard, 1985). Of course,employment decentralization is continuingand will likely accelerate because of ad-vanced communications technology. Plan-ners and policy makers must monitor theevolution of urban spatial structure, andadjust their actions accordingly. It is not in-conceivable that employment decentraliza-tion will cause the location advantage of theurban center to diminish. Indeed, a plau-sible explanation to the increase in unem-ployment in the inner-city over the past sev-eral decades is that the location advantage
of the inner-city has been decreasing overtime.
It is important to point out that the em-pirical research did not examine the interac-tion between spatial and some important so-cial factors. Therefore, the results should notbe used as evidence to proof or disproof thespatial mismatch hypothesis, because racialdiscrimination is considered as a key factorin the original paper (Kain, 1968). Evensubtle forms of racial discrimination, suchas keeping black employees below certainpercentage of the firm’s total and avoidinghiring youths living in high-crime neighbor-hoods, can change the spatial pattern of em-ployment accessibility considerably. Suchscenarios can easily be simulated using theaccessibility measures developed in thisstudy. While it is admittedly important toexamine interactions between spatial factorsand social factors in urban planning, andpolicy studies, it is equally important to beable to clearly distinguish spatial factorsfrom social factors.
The most significant result of the studyis not that inner-city still has location advan-tage, however; the most significant result isthat location advantage is far from being suf-
Figure 4. Employment Accessibility of Auto Drivers Living in Inner-City Neighborhoods(Annual Wage < $10k, in 1989)
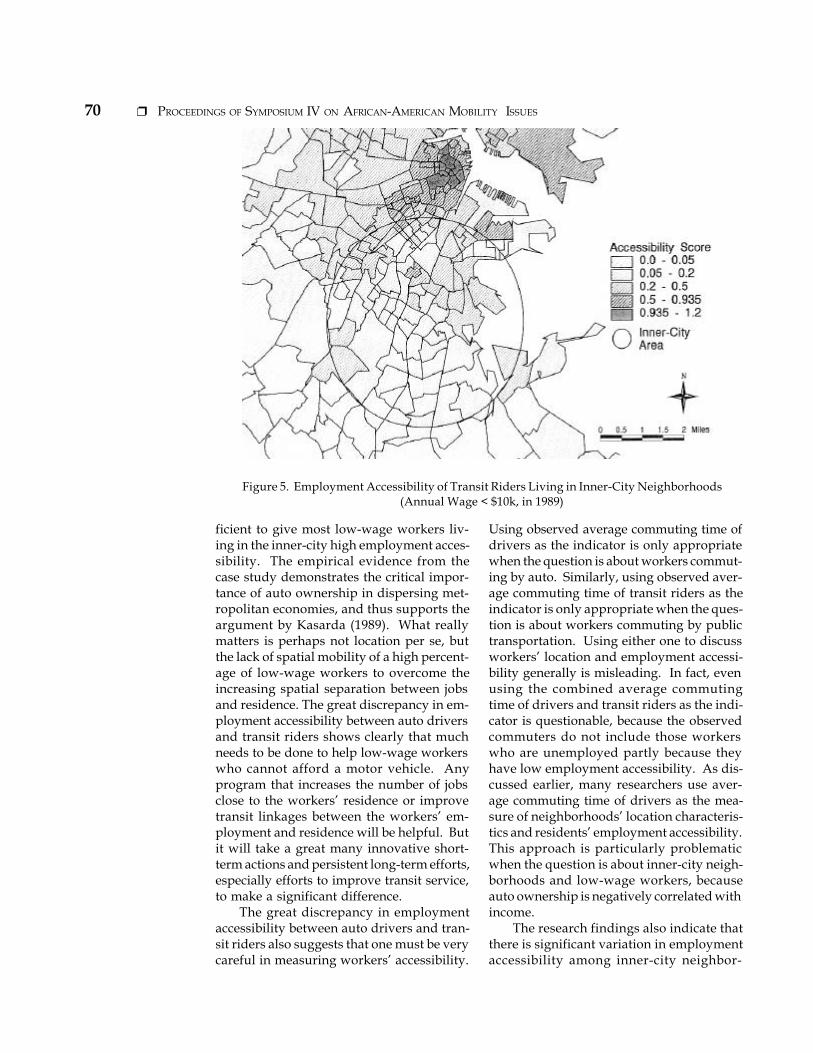
70 ❐ PROCEEDINGS OF SYMPOSIUM IV ON AFRICAN-AMERICAN MOBILITY ISSUES
ficient to give most low-wage workers liv-ing in the inner-city high employment acces-sibility. The empirical evidence from thecase study demonstrates the critical impor-tance of auto ownership in dispersing met-ropolitan economies, and thus supports theargument by Kasarda (1989). What reallymatters is perhaps not location per se, butthe lack of spatial mobility of a high percent-age of low-wage workers to overcome theincreasing spatial separation between jobsand residence. The great discrepancy in em-ployment accessibility between auto driversand transit riders shows clearly that muchneeds to be done to help low-wage workerswho cannot afford a motor vehicle. Anyprogram that increases the number of jobsclose to the workers’ residence or improvetransit linkages between the workers’ em-ployment and residence will be helpful. Butit will take a great many innovative short-term actions and persistent long-term efforts,especially efforts to improve transit service,to make a significant difference.
The great discrepancy in employmentaccessibility between auto drivers and tran-sit riders also suggests that one must be verycareful in measuring workers’ accessibility.
Using observed average commuting time ofdrivers as the indicator is only appropriatewhen the question is about workers commut-ing by auto. Similarly, using observed aver-age commuting time of transit riders as theindicator is only appropriate when the ques-tion is about workers commuting by publictransportation. Using either one to discussworkers’ location and employment accessi-bility generally is misleading. In fact, evenusing the combined average commutingtime of drivers and transit riders as the indi-cator is questionable, because the observedcommuters do not include those workerswho are unemployed partly because theyhave low employment accessibility. As dis-cussed earlier, many researchers use aver-age commuting time of drivers as the mea-sure of neighborhoods’ location characteris-tics and residents’ employment accessibility.This approach is particularly problematicwhen the question is about inner-city neigh-borhoods and low-wage workers, becauseauto ownership is negatively correlated withincome.
The research findings also indicate thatthere is significant variation in employmentaccessibility among inner-city neighbor-
Figure 5. Employment Accessibility of Transit Riders Living in Inner-City Neighborhoods(Annual Wage < $10k, in 1989)
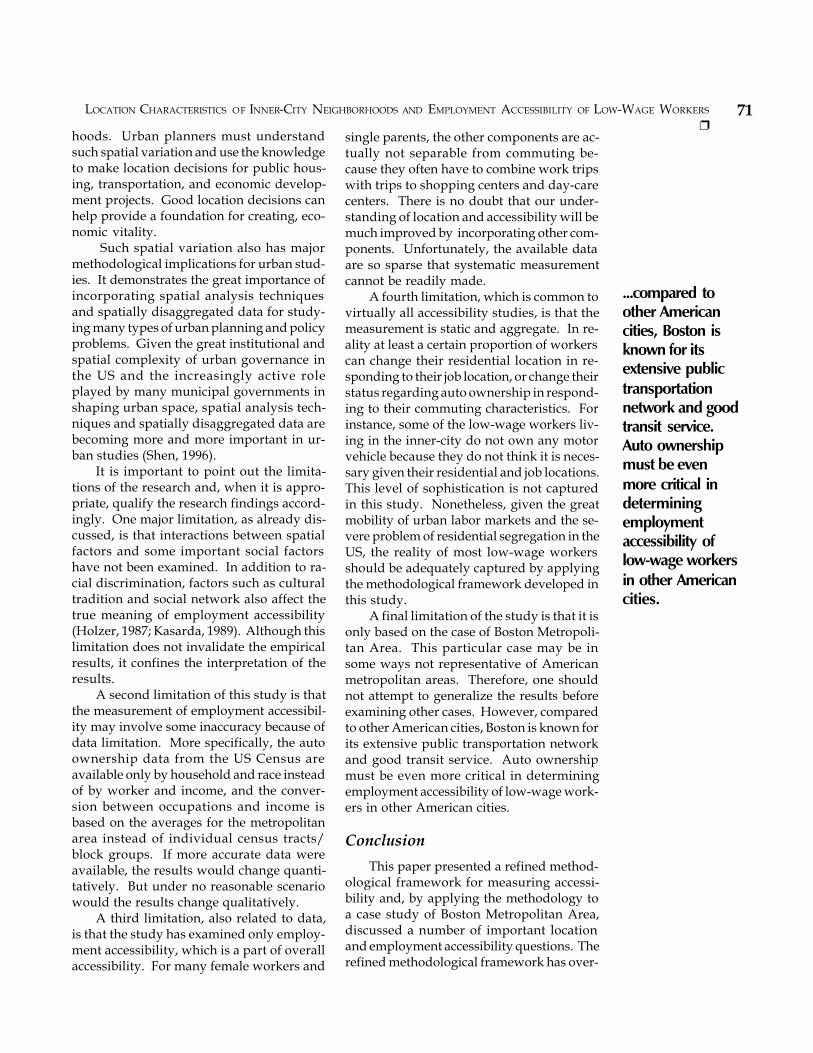
71LOCATION CHARACTERISTICS OF INNER-CITY NEIGHBORHOODS AND EMPLOYMENT ACCESSIBILITY OF LOW-WAGE WORKERS
❐hoods. Urban planners must understandsuch spatial variation and use the knowledgeto make location decisions for public hous-ing, transportation, and economic develop-ment projects. Good location decisions canhelp provide a foundation for creating, eco-nomic vitality.
Such spatial variation also has majormethodological implications for urban stud-ies. It demonstrates the great importance ofincorporating spatial analysis techniquesand spatially disaggregated data for study-ing many types of urban planning and policyproblems. Given the great institutional andspatial complexity of urban governance inthe US and the increasingly active roleplayed by many municipal governments inshaping urban space, spatial analysis tech-niques and spatially disaggregated data arebecoming more and more important in ur-ban studies (Shen, 1996).
It is important to point out the limita-tions of the research and, when it is appro-priate, qualify the research findings accord-ingly. One major limitation, as already dis-cussed, is that interactions between spatialfactors and some important social factorshave not been examined. In addition to ra-cial discrimination, factors such as culturaltradition and social network also affect thetrue meaning of employment accessibility(Holzer, 1987; Kasarda, 1989). Although thislimitation does not invalidate the empiricalresults, it confines the interpretation of theresults.
A second limitation of this study is thatthe measurement of employment accessibil-ity may involve some inaccuracy because ofdata limitation. More specifically, the autoownership data from the US Census areavailable only by household and race insteadof by worker and income, and the conver-sion between occupations and income isbased on the averages for the metropolitanarea instead of individual census tracts/block groups. If more accurate data wereavailable, the results would change quanti-tatively. But under no reasonable scenariowould the results change qualitatively.
A third limitation, also related to data,is that the study has examined only employ-ment accessibility, which is a part of overallaccessibility. For many female workers and
single parents, the other components are ac-tually not separable from commuting be-cause they often have to combine work tripswith trips to shopping centers and day-carecenters. There is no doubt that our under-standing of location and accessibility will bemuch improved by incorporating other com-ponents. Unfortunately, the available dataare so sparse that systematic measurementcannot be readily made.
A fourth limitation, which is common tovirtually all accessibility studies, is that themeasurement is static and aggregate. In re-ality at least a certain proportion of workerscan change their residential location in re-sponding to their job location, or change theirstatus regarding auto ownership in respond-ing to their commuting characteristics. Forinstance, some of the low-wage workers liv-ing in the inner-city do not own any motorvehicle because they do not think it is neces-sary given their residential and job locations.This level of sophistication is not capturedin this study. Nonetheless, given the greatmobility of urban labor markets and the se-vere problem of residential segregation in theUS, the reality of most low-wage workersshould be adequately captured by applyingthe methodological framework developed inthis study.
A final limitation of the study is that it isonly based on the case of Boston Metropoli-tan Area. This particular case may be insome ways not representative of Americanmetropolitan areas. Therefore, one shouldnot attempt to generalize the results beforeexamining other cases. However, comparedto other American cities, Boston is known forits extensive public transportation networkand good transit service. Auto ownershipmust be even more critical in determiningemployment accessibility of low-wage work-ers in other American cities.
ConclusionThis paper presented a refined method-
ological framework for measuring accessi-bility and, by applying the methodology toa case study of Boston Metropolitan Area,discussed a number of important locationand employment accessibility questions. Therefined methodological framework has over-
...compared toother Americancities, Boston isknown for itsextensive publictransportationnetwork and goodtransit service.Auto ownershipmust be evenmore critical indeterminingemploymentaccessibility oflow-wage workersin other Americancities.
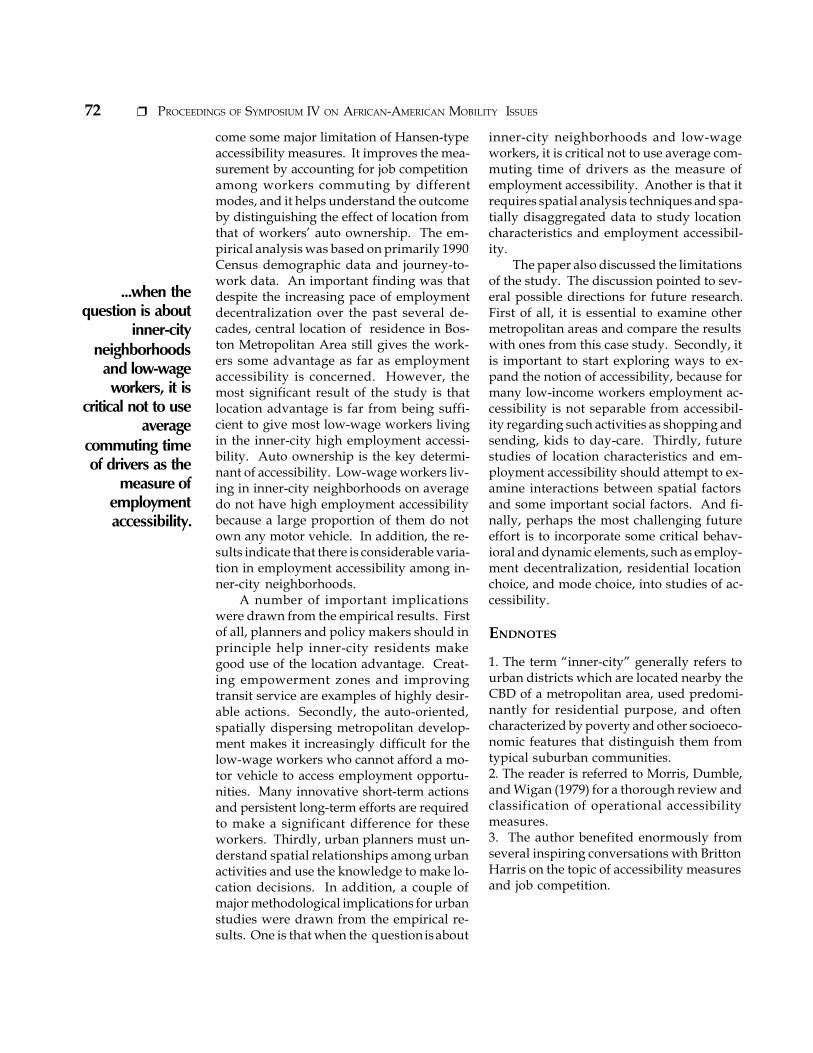
72 ❐ PROCEEDINGS OF SYMPOSIUM IV ON AFRICAN-AMERICAN MOBILITY ISSUES
come some major limitation of Hansen-typeaccessibility measures. It improves the mea-surement by accounting for job competitionamong workers commuting by differentmodes, and it helps understand the outcomeby distinguishing the effect of location fromthat of workers’ auto ownership. The em-pirical analysis was based on primarily 1990Census demographic data and journey-to-work data. An important finding was thatdespite the increasing pace of employmentdecentralization over the past several de-cades, central location of residence in Bos-ton Metropolitan Area still gives the work-ers some advantage as far as employmentaccessibility is concerned. However, themost significant result of the study is thatlocation advantage is far from being suffi-cient to give most low-wage workers livingin the inner-city high employment accessi-bility. Auto ownership is the key determi-nant of accessibility. Low-wage workers liv-ing in inner-city neighborhoods on averagedo not have high employment accessibilitybecause a large proportion of them do notown any motor vehicle. In addition, the re-sults indicate that there is considerable varia-tion in employment accessibility among in-ner-city neighborhoods.
A number of important implicationswere drawn from the empirical results. Firstof all, planners and policy makers should inprinciple help inner-city residents makegood use of the location advantage. Creat-ing empowerment zones and improvingtransit service are examples of highly desir-able actions. Secondly, the auto-oriented,spatially dispersing metropolitan develop-ment makes it increasingly difficult for thelow-wage workers who cannot afford a mo-tor vehicle to access employment opportu-nities. Many innovative short-term actionsand persistent long-term efforts are requiredto make a significant difference for theseworkers. Thirdly, urban planners must un-derstand spatial relationships among urbanactivities and use the knowledge to make lo-cation decisions. In addition, a couple ofmajor methodological implications for urbanstudies were drawn from the empirical re-sults. One is that when the question is about
inner-city neighborhoods and low-wageworkers, it is critical not to use average com-muting time of drivers as the measure ofemployment accessibility. Another is that itrequires spatial analysis techniques and spa-tially disaggregated data to study locationcharacteristics and employment accessibil-ity.
The paper also discussed the limitationsof the study. The discussion pointed to sev-eral possible directions for future research.First of all, it is essential to examine othermetropolitan areas and compare the resultswith ones from this case study. Secondly, itis important to start exploring ways to ex-pand the notion of accessibility, because formany low-income workers employment ac-cessibility is not separable from accessibil-ity regarding such activities as shopping andsending, kids to day-care. Thirdly, futurestudies of location characteristics and em-ployment accessibility should attempt to ex-amine interactions between spatial factorsand some important social factors. And fi-nally, perhaps the most challenging futureeffort is to incorporate some critical behav-ioral and dynamic elements, such as employ-ment decentralization, residential locationchoice, and mode choice, into studies of ac-cessibility.
ENDNOTES
1. The term “inner-city” generally refers tourban districts which are located nearby theCBD of a metropolitan area, used predomi-nantly for residential purpose, and oftencharacterized by poverty and other socioeco-nomic features that distinguish them fromtypical suburban communities.2. The reader is referred to Morris, Dumble,and Wigan (1979) for a thorough review andclassification of operational accessibilitymeasures.3. The author benefited enormously fromseveral inspiring conversations with BrittonHarris on the topic of accessibility measuresand job competition.
...when thequestion is about
inner-cityneighborhoods
and low-wageworkers, it is
critical not to useaverage
commuting timeof drivers as the
measure ofemploymentaccessibility.
73LOCATION CHARACTERISTICS OF INNER-CITY NEIGHBORHOODS AND EMPLOYMENT ACCESSIBILITY OF LOW-WAGE WORKERS
❐4. In this situation, the quantity of accessibleopportunities matters only because largerquantity offers more choices and greatereconomy of scale.5. This result stands as long as the specifica-tion of the impedance function meets theminimum requirement that longer traveltime increases travel impedance.
(a) When a gravity function, f(Ci j) = Ci j-b,
or an exponential function, f(Ci j) exp(-bCi j),is applied, the minimum requirement is b >0.
(b) When a travel-time threshold func-tion, f(Ci j) = 1 for Ci j < Ci j
c and f(Ci j) = 0 other-wise, is applied, the minimum requirementis 0 < Ci j
c < 100.As an example, when the exponential
function is applied, with b =0.1, the follow-ing result is obtained:
SA = 41767SB = 41767SC= 3688
6. In other words, the weighted average ac-cessibility calculated using this formula is al-ways equal to the ratio of the total numberof opportunities in the urban system to thetotal number of people seeking the oppor-tunities. In the case of employment accessi-bility, the weighted average accessibility fora typical US metropolitan area is 0.9 - 0.95,because the unemployment rate is 5% - 10%.7. The same minimum requirement - thatlonger travel time increases travel imped-ance - also applies here. As an illustration,we may once again apply the exponentialfunction, with P = 0. 1, to the measurementof the demand potentials of employment ac-cessibility for the three zones of the simpli-fied urban system. The following result isobtained:
DA= 25 863DB= 57672DC = 3688
If we combine this result with the ear-lier one, we obtain the following accessibil-ity scores for the three zones:
AA= 1.51AB = 0.83AC = 1.00
8. After I developed this accessibility mea-sure by following the reasoning and testingprocedure described in this paper, I discov-ered that Weibull (1976) obtained the same
formula a long time ago by taking an “axi-omatic approach”. However, for some mys-terious reason, Weibull didn’t explore someof the important properties of this refinedaccessibility measure. To my knowledge, noresearcher has applied this formula to mea-sure simultaneously job competition and dif-ferential accessibility across different groupsof workers who rely on different transpor-tation means.9. This constant value of demand potential,however, is taken away from Hansen-typemeasures. This omission does not change theorder of the accessibility scores for the loca-tions, but it does make it more difficult tointerpret the scores because the weighted av-erage is no longer easily predetermined.10. The regression has the natural log of thefriction factors as the dependent variable andtravel time intervals as the independent vari-able.11. I used the software ArcView in this re-search.
REFERENCES
Alonso, W.1964 Location and Land Use. Cambridge:
Harvard University Press.Ben-Akiva, M. and S. Lerman1985 Discrete Choice Analysis: Theory
and Application to Travel Demand.Cambridge: The MIT Press.
Black J. and M. Conroy 1977 Accessibility Measures and the So-
cial Evaluation of Urban Structure. En-vironment and Planning A 9:1013-1031.
Blakely, E. J.1989 Planning Local Economic Develop-
ment: Theory and Practice. NewburyPark, CA: Sage Publications.
Cervero, R.1989 Jobs-Housing Balancing and Re-
gional Mobility. Journal of AmericanPlanning Association 55:136-150.
Ellwood, D. T.1986 The Spatial Mismatch Hypothesis:
Are There Teenage Jobs Missing in theGhetto? In R. B. Freeman and H. J.Holzer, eds., The Black Youth Employ-ment Crisis. Chicago: University of Chi-cago Press.
74 ❐ PROCEEDINGS OF SYMPOSIUM IV ON AFRICAN-AMERICAN MOBILITY ISSUES
Geertman, S. and J. Van Eck. 1995 GIS andModels of Accessibility Potentials: AnApplication in Planning”, InternationalJournal of Geographical InformationSystems, 9:67-80.
Giuliano, G. and K. A. Small1993 Is the Journey to Work Explained by
Urban Structure? Urban Studies,30:1485-1500.
Gordon, P. A. Kumar, and H. Richardson 1989 Congestion, Changing Metropolitan
Structure and City Size in the UnitedStates International Regional ScienceReview 12:45-56.
Hansen, W. G.1959 How Accessibility Shapes Land Use.
Journal of the American Institute of Plan-ners, 25:73-76.
Harrison, B.1974 Urban Economic Development:
Suburbanization, Minority Opportunityand the Condition of the Central City.Washington, D.C.: The Urban Institute.
Holzer, H.1987 Informal Job Search and Black Youth
Unemployment. The American Eco-nomic Review, 77:446-452.
Holzer, H.1991 The Spatial Mismatch Hypothesis:
What Has the Evidence Shown. UrbanStudies 28:105-122.
Hutchinson, B. G.1974 Principles of Urban Transportation Sys-
tems Planning. New York: McGraw-HillBook Company.
Ihlanfeldt, K. R. and D. L. Sjoquist1990 Job Accessibility and Racial Differ-
ences in Youth Employment Rates. TheAmerican Economic Review, 80:267-276.
Ingram, D. R.1971 The Concept of Accessibility: A
Search for an Operational Form. Re-gional Studies, 5:101-107.
Kain, J. F.1968 Housing Segregation, Negro Em-
ployment, and Metropolitan Decentrali-zation. The Quarterly Journal of Eco-nomics 82:175-197.
Kasarda, J.1989 Urban Industrial Transition and the
Underclass. The Annals of the Ameri-can Academy of Political and Social Sci-ence, 26-47.
Leonard, J. S.1985 Space, Time and Unemployment: Los
Angeles 1980. Manuscript, Universityof California, Berkeley.
Meyer, M. D. and E. J. Miller1984 Urban Transportation Planning: A De-
cision-Oriented Approach. New York:McGraw-Hill Book Company.
Morris, J. M., P. L. Dumble, and M. R. Wigan1979 Accessibility Indicators for Transpor-
tation Planning. Transportation Re-search A, 13:91-109.
Muth, R. F.1969 Cities and Housing. Chicago: Uni-
versity of Chicago Press.Porter, M.1995 The Competitive Advantage of the In-
ner City”, Harvard Business Review,May-June, Cambridge, MA: HarvardUniversity Press.
Putman, S.1983 Integrated Urban Models. London:
Pion Limited.Shen, Q.1996 Spatial Impacts of Locally Enacted
Growth Controls: The San Francisco BayRegion in the 1980s. Environment andPlanning B, 23:61-9 1.
Wachs, M. and Kumagai, T. G.1973 Physical Accessibility as a Social In-
dicator. Socio-Economic Planning Sci-ence, 7:437-456.
Weibull, J. W.1976 An Axiomatic Approach to the Mea-
surement of Accessibility. Regional Sci-ence and Urban Economics, 6:357-379.
Wilson, A. G.1974 Urban and Regional Models in Ge-
ography and Planning. London: JohnWiley & Sons.
Wilson, A. G.1971 A Family of Spatial Interaction Mod-
els, and Associated Developments. En-vironment and Planning A, 3:1-32.
Wilson, W. J.1995 Jobless Ghettos. Manuscript, Cen-
ter for the Study of UrbanInequality,University of Chicago.
75LOCATION EFFICIENT MORTGAGE PROJECT: CAPTURING THE BENEFITS OF PUBLIC TRANSPORTATION ❐
Location Efficient Mortgage Project: Capturing the Benefits ofLocation Efficient Mortgage Project: Capturing the Benefits ofPublic TransportationPublic Transportation
Jacky GrimshawCenter for Neighborhood Technology
Background
In 1992, the Chicago Transit Authority (CTA) announced a decision thathas had broad ranging results. At
that time, the CTA announced the casing ofthe Lake Street elevated rapid transit line.The long practice of deferred maintenancehad created such hazardous conditions thatthe line was no longer safe. Minimal rider-ship on the line could not justify the repaircost estimates. This announcement was thecatalyst for the formation of a citizen’s coali-tion composed of many community and city-wide organizations and as well as citizensto oppose this decision.
This newly formed coalition asked theCenter for Neighborhood Technology (CNT)to provide technical assistance in develop-ing an approach to persuade the CTA to re-verse its decision. The outcome was a strat-egy that combined environmental, employ-ment and community development objec-tives. The strategy viewed the line as a valu-able engine for economic revitalization of theLake Street corridor communities. Thesecommunities have been underdevelopedand underpopulated since the riots of the1960s reduced the housing stock and laidacres of these central city lands vacant Theresult was a transit oriented development(TOD) plan brought together a number ofstrategies to increase ridership on the El linethrough programs such as industrial reten-tion, housing intensification, a pedestrian-friendly and safe streetscapes.
The initial proposal was to model tran-sit-oriented development at one of the sitesalong the Lake Street corridor. After com-
munity representatives announced the TODplan, the CTA did indeed reverse its deci-sion and announced a $300 million rehabili-tation of the elevated line. The Lake StreetLine had a new name - the Green Line be-cause of a reconfigured alignment Joining thesouth and west sides. The line runs from thewestern suburb of Oak Park to the southsidecommunities of Englewood and JacksonPark.
The citizen coalition evolved into a JointVenture Partnership that took responsibil-ity for implementing the community’s TODplan. CNT, in its role as a member of the JointPartnership, has continued to provide tech-nical assistance to this community group. Asthe implementation process proceeded, thedevelopment of needed solutions for vari-ous critical elements for a successful TODoccurred.
The Center for Neighborhood Technol-ogy focused on two of these elements: mi-nority entrepreneurship for the TOD areabusinesses and homeownership. The devel-opment of two new programs resulted: Con-nections for Community Ownership and Lo-cation Efficient Mortgages (LEM). The Con-nections Program is a strategy to recruit,train and finance minority entrepreneurs in-terested in establishing businesses in theTOD area. The LEM Program is a strategyto increase the number of families purchas-ing homes in bansitrich communities, toredensify depopulated communities bystimulating new developments, and to in-crease the base of transit riders.
In addition to being tools for redevelop-ing transit communities, these programshave the potential, once implemented, of mo-
76 ❐ PROCEEDINGS OF SYMPOSIUM IV ON AFRICAN-AMERICAN MOBILITY ISSUES
bilizing public support for the transit agency.Most indicators support the conclusion thatChicagoland residents are committed to pre-serving and enhancing existing communitiesand most residents also support a level ofdensity needed to make transit feasible. Thelocation efficiency concept facilitates the re-alization of both these objectives.
What is location efficiency? Whatis it and what does it do?
Some forty years of research by geogra-phers, transportation economics, and urbanplanners culminated in 1994 in a conceptknown variously as “transit-efficient,” ormore recently, “location efficiency”. Locationefficiency can be thought of as access: amulti- purpose concept which incorporatesefficient mobility, and a spatial match be-tween populations and their activities in amanner which minimizes the latent demandfor transportation and its environmental ef-fects and maximizes value capture of invest-ments for metropolitan communities and theregions in which they are located.
Location Efficiency stresses “accessibil-ity” rather than “mobility”. It focuses onwhere people live, work, and shop. It con-siders how and where people travel, howpeople impact their environment, and howwell or poorly, people utilize the publiclyfunded infrastructure.
The local characteristics that define “Lo-cation Efficiency” include:
• household density at the communitylevel
• access to public transportation• access to shopping, services, cultural
amenities, and schools• pedestrian “friendliness” of sidewalks,
bikeways, benches, lighting, plantings.
How are location efficiency andhomeownership related?
Older urban communities developedalong transit lines. Multi-family housing andmixed-use commercial developmentevolved in proximity to pubic transit systemin order to ensure ease of access. At a timewhen private mobility sources were not soubiquitous, employers and retailers relied on
the public system to transport their workersand customers. Residents and workerswould access services and other needs bywalking, biking, or taking a short transit ride.In the late 1990’s, we are “reinventing” com-munities. New communities are once againbeing planned around transit. Previous in-dustrial areas are being redeveloped as resi-dential lofts and mixed work-live spaces.
Studies1 have consistently observed therelationship between land uses and travelbehavior for residents of densely populated,transit and amenity-rich communities. Thetravel behavior is in inverse proportion tothese same conditions: the higher the den-sity, the greater both the transit-and pedes-trian-access, the lower the propensity todrive.
In 1994, a study by John Holtzclaw forthe Natural Resources Defense Council(NRDC) established a strong relationshipbetween community density and transit ac-cess, on the one hand, and automobile useand ownership, on the other. Holtzclaw’sformulas“measured reductions in automo-bile usage and personal transportation coststhat result from different characteristics of aneighborhood.”2 Specifically, he focused onthe factors that tend to make public trans-portation systems attractive to riders, andconverted them into a predictable “avoided-cost savings”. This suggested a compellingmethod for recognizing the cost savings toresidents of dense, transit-rich areas.
Holtzclaw’s study indicated that loca-tion-related savings vary according to thefollowing:
• reliance on public transit resources• vehicles miles traveled (VMT) per year• access and use of local shops, services,
and cultural and recreational amenitiesThe magnitude of savings suggested in
the San Francisco Bay Area, based on theoriginal study, was between $350-$400 perhousehold per month. Current researchdocuments a similar savings in the Chicagoarea.
In 1995, CNT and two other organiza-tions interested in location eminency - NRDCand STPP (Surface Transportation PolicyProject) - obtained funding for a researchproject that would develop a way to shiftpart of that savings to homeownership. The
Studies1 haveconsistently
observed therelationship
between land usesand travel
behavior forresidents of
densely populated,transit and
amenity-richcommunities.
77LOCATION EFFICIENT MORTGAGE PROJECT: CAPTURING THE BENEFITS OF PUBLIC TRANSPORTATION ❐
outcome of the research has been the creationof the Location Efficient Mortgage (LEM).
The LEM proposes that families apply-ing for a LEM be allowed to apply this dis-cretionary income savings to the financingof a home mortgage. Participating lenderswill have the additional benefit of having aborrower with potentially lesser risk than asimilar family in an automobile dependentlocation, assuming that they rely on publictransit.
A focus group of lenders convened inChicago by the Center for NeighborhoodTechnology suggested that this level of sav-ings as a function of “location efficiency,”could amortize as much as an additional$50,000 in mortgage debt Thus LEMs enablefamilies to use a portion of their location-re-lated savings to “stretch” their mortgageapplication’s income/expense by recogniz-ing expense adjustments reflecting the trans-portation efficiencies the family has or plansto have.
What will LEMs accomplish forurban communities?
Making mortgage funds available in lo-cation efficient communities will encouragegreater homeownership by families thatmight otherwise locate in auto dependentcommunities, enable home purchases byfamilies who might not ordinarily qualify,and also stimulate private investment inthese reinvested communities. The incorpo-ration of LEM mortgage lending in the un-derwriting standards of FNMA (or FannieMae) would facilitate more than $300 billionin inner-city mortgages over the next sevenyears. The resulting change in mortgagelending practices would have positive long-term effects on urban disinvested commu-nities and their economies, air quality, landuse and transportation patterns. It wouldalso result in institutionalizing the correctionof historic patterns of discrimination.
Increased homeownership in locationefficient, amenity-rich communities will re-duce vehicle miles traveled because of easieraccess through walking, transit, bicycling, orother alternate transportation modes. Re-duced vehicle miles traveled will also resultin reduced congestion, reduced air pollution,
reduced community noise levels, and re-duced risk of injury or death from automo-bile accidents.
Transportation, land use and commu-nity redevelopment planning can easily in-corporate LEMs. Transportation plannerscan avoid the creation or expansion of road-ways if the public transit system carries moreand more riders. In air quality non-attain-ment areas, LEM offers a voluntary trans-portation control measure (TCM) that re-quires the issuance of no adverse mandates,no inconvenience, no extra cost, nor createsany inequities. The MPOs in two of the mar-ket test cities are considering including LEMsas a TCM. MPOs can also encourage changesin local policies and programs that can en-hance location efficiency. Examples of suchmeasures include:
• Measures which enhance the utilityof local and regional transit systems
• Measures which encourage the devel-opment of moderate density multifamilyhousing near transit systems and pedestrianfriendly shopping areas
• Measures to encourage home owner-ship opportunities in mule family neighbor-hoods near transit and other commercialamenities
• Measures which encourage provisionof transit passes in lieu of parking require-ments in multifamily housing communities
• Measures that encourage neighbor-hood and community-oriented commercialuses near residential neighborhoods
• Measures that provide for greater pe-destrian and bicycle access to services andamenities in the community
• Measures that place local serving ac-tivity centers near transit systems andpedestrianoriented commercial areas.
Creating the LEM Consortium
The Center for Neighborhood Technol-ogy (CNT), the Natural Resources DefenseCouncil (NRDC), and the Surface Transpor-tation Policy Project (STPP) launched a jointeffort, the LEM partnership, to realize thisopportunity. The objective was to translateand to focus Holtzclaw’s initial study into amortgage industry-accepted method for rec-
Transportationplanners can avoidthe creation orexpansion ofroadways if thepublic transitsystem carriesmore and moreriders.
78 ❐ PROCEEDINGS OF SYMPOSIUM IV ON AFRICAN-AMERICAN MOBILITY ISSUES
ognizing and considering the avoided costor cost savings that is available to residentsof densely populated, transit-rich urban ar-eas. Research began on the function oflocational and household characteristics inthree metropolitan areas: Chicago, Los An-geles, and San Francisco.
In November, 1996, the Partnershipcompleted a calibration of Holtzclaw’s for-mulas using preliminary Chicago area datasets. The research confirmed the accuracyand reliability of Holtzclaw’s model and re-fined its ability to delineate location efficientresidential settings throughout the city. Themodel calibration allowed the Partnershipto proceed with designing a market test ofthe LEM product.
The LEM Partnership received fundingfrom the Federal Transit Administration(FTA), the U. S. Department of Energy(DOE), the U. S. Environmental ProtectionAgency (EPA), and the Surdna Foundation.
How does the LEM work?
CURRENT CONFIGURATION OF THE
LOCATION EFFICIENT MORTGAGE
(LEM)
The Location Efficient Mortgage (LEM)is an innovative mortgage product currentlybeing developed for availability in Chicago,San Francisco, and Los Angeles. The targetgroup is moderate income borrowers inter-ested in living in urban areas served by pub-lic transportation systems. It is not presentlyon the market, but plans presently foresee amarket test in late 1997.
The LEM recognizes that when familiesrely on public transit rather than automobilesfor their travel needs they spend less ontransportation. The LEM’s computer soft-ware and mapping system can calculate sucha family’s annual and monthly transporta-tion savings under various situations andconditions. If a borrower chooses a LEM, thecalculation of borrowing capacity includesa portion of this savings as an integrated partof the customary mortgage application pro-cess. This procedure would create significant“stretch” in borrowing capacity.
In order to implement the LEM markettest in Chicago, Los Angeles, and San Fran-
cisco, local lenders will conduct an “Alter-native Underwriting Experiment” underFederal National Mortgage Association(Fannie Mae) guidelines. The process of es-tablishing the configuration of the LEM andits various applications in these markets hasnow begun, but the establishment of firm un-derwriting criteria has not occurred.. It isprobable, however, that the LEM will be verymuch like other mortgage products acceptedon the secondary market by major under-writers. Likely characteristics of the LEM willinclude:
• 30-year fixed rate mortgage for owneroccupied, single or multi-unit homes orcondomnium units;
• Interest rates will be determined bythe prevailing rate at the time of applicationor at closing;
• Ioan-to-value ratio (LTV) of up to 95percent based on appraisal of the property;
• Qualifying housing debt ratio will be34 percent;
• Qualifying total debt ratio will be 38percent;
• Pre-application homeownership coun-seling will be required;
• Post-application counseling and re-porting will be required;
• Key household information reportedannually to LEM Program for research pur-poses only;
• Positive affirmation required of will-ingness to rely on public transit;
• Purchase encouraged or required oflong-term, discounted transit passes for thehousehold;
• Standard verification of employmentand credit history will be required;
• Disclosure of automobile ownershipwill be encouraged or required;
LEM’s key provision, setting it apartfrom other mortgage products, is LEM’s link-age to a quantified value for the relative ad-vantage of a decagon efficient home overother homes that do not have pubic trans-portation accessibility or located in non-densely populated areas locking ready ac-cess to necessities and amenities. Calculationof the LEM value is on an address-specific
79LOCATION EFFICIENT MORTGAGE PROJECT: CAPTURING THE BENEFITS OF PUBLIC TRANSPORTATION ❐
basis, using a geographical information sys-tem developed and operated by the LEMPartnership. The established Location Effi-cient Savings value will be integrated intothe following equation used to calculate thetotal debt ratio:
(Gl + LEV) </= 38% PITI
when Gl = Gross Income before taxesLE= Location Efficient ValuePITI = Principal, Interest, Taxes, and In-
surance
ENDNOTES
1 The Cost of Sprawl 1976; several Articlessuch as "PublicTransit: Realizing its Poten-tial," by Richard Voith. Federal ReserveBank: "Using Residential Patterns and Tran-sit to Decrease Auto Dependence and Costs,"by John Holtzclaw are just a few.2 Holtzclaw, John. Using Residential Pat-terns and Transit to Decease Auto Depen-dence and Costs. San Francisco: Natural Re-sources Defense Council, 1994.

80 ❐ PROCEEDINGS OF SYMPOSIUM IV ON AFRICAN-AMERICAN MOBILITY ISSUES
This page left blank, intentionally.
81PUBLIC EDUCATION IN URBAN CENTERS: ANALYSIS’ TRENDS AND POLICY ISSUES ❐
Public Education in Urban Centers: Analysis’ Trends and PolicyPublic Education in Urban Centers: Analysis’ Trends and PolicyIssuesIssues
Lora G. MayoBaltimore City Public Schools
President Clinton’s Call to Actionfor American Education in the 21stCentury10-Point Plan
1. Set rigorous national standards, with na-tional tests in 4th grade reading & 8th grademath to make sure our children master thebasics.2. Make sure there’s a talented and dedi-cated teacher in every classroom.3. Help every student to read independentlyand well by the end of the 3rd grade.4. Expand Head Start and challenge par-ents to get involved early in their children’slearning.5. Expand school choice and accountabilityin public education.6. Make sure our schools are safe, disciplinedand drug free, and instill basic American val-ues.7. Modernize school buildings and help sup-port school construction.8. Open the doors of college to all who workhard and make the grade, and make the 13thand 14th years of education as universal ashigh school.9. Help adults improve their education andskills by transforming the tangle of federaltraining programs into a simple skilled grant.10. Connect every classroom and library tothe Internet by the year 2000 and help all stu-dents become technologically literate.Source: Department of Education’s HomePage.
Policy Issues - 1 of 3
NATIONAL DEFENSE TRANQUILITY ACT:EQUAL OPPORTUNITY FOR CLOSING THE
GAP, 10 POINTS FOR ACHIEVING
EQUALITY OPPORTUNITY IN URBAN
EDUCATION SOURCE: PRESS RELEASE,RAINBOW PUSH COALITION, 25 FEBRU-ARY 1997
1. Rebuild schools infrastructure to ensurecapability to join in computer age. Both ur-ban and rural schools are crumbling.2. Higher academic standards, sound man-agement and accountability.3. Strong emphasis in home, church, schooland mass media on character education.Ethical standards are critical to growth as anation.4. Greater parental responsibility & involve-ment. (Mobilize 2 million parents & 5000ministers/judges to reclaim our youth).5. Empower Superintendents and Chief Ex-ecutive Officer leadership to achieve thesegoals.6. Mandatory training for teachers, providesalary & benefits to lend itself to more pro-fessionalism, accountability & stability.7. Teach youth skills of survival and suc-cess: For example, to apply economic prin-ciples to make money legally.8. Provide children health care and earlychildhood education programs. Studiesdemonstrate correlation between physicaland mental well-being, Head Start opportu-nities and ability to learn.9. In world where everyone is a neighbor-hood - one button away on the Internet -multi-lingual education is essential.10. Encourage media — primary factor indevelopment of minds and values of chil-dren to show the demeaning stereotypes that
82 ❐ PROCEEDINGS OF SYMPOSIUM IV ON AFRICAN-AMERICAN MOBILITY ISSUES
unfortunately shape the visions of our chil-dren.
Policy Issues - 2 of 3
COUNCIL OF GREAT CITY SCHOOLS
10 of the 35 Most Important Needs ofthe Urban School District (What the SchoolAdministrators, Teachers, Parents Say IsNeeded to Improve Urban Education: Listedin Priority Order)1. Improve academic achievement.2. Obtain adequate financial resources.3. Enhance parental involvement.4. Build public confidence in schools.5. Higher academic standards for studentachievement.6. Professional development for teachersand staff.7. Close achevement gaps between races.8. Reduce dropout rates.9. Provide adequate assessment and testinginstruments.10. Provide instructional technology.Source: Critical Trends in Urban Education:A Poll of America’s Great City School, Feb-ruary 1996.
Policy Issues - 3 of 3
WHAT IS AN URBAN SCHOOL DIS-TRICT?
According to the Council of Great CitySchools (Article IV: Membership, By-Laws),population: 250,0000 or more enrollment inpublic high schools and 35,000 or more in1980 in elementary schools or the predomi-nant Board of Education serving the largesturban city of each state regardless of enroll-ment of the school district. If the Board ofEducation has jurisdiction over areas outsidethe central city, then the populations andenrollments of those areas shall also be in-cluded. (A School District may also eligiblefor membership by vote of Executive Com-mittee of Council of Great City Schools.)
CHARACTERISTICS OF URBAN SCHOOL
Children eligible for Chapter I of the El-ementary and Secondary Education Act.
Children in families qualifying for Tempo-rary Assistance to Needy Families (TANF).Children with limited English proficiency.Children who are racial minorities as classi-fied by Civil Rights statutes
Current Trends 1 of 4
CHARACTERISTICS OF YOUTH IN A
WELL-FUNDED JAIL
Sixty- to-90 percent areARE HIGHSCHOOL DROPOUTS. Eighty-five-to- 92percent ARE FUNCTIONALLY ILLITER-ATE. Eighty percent HAVE TESTED DRUGPOSITIVE. Seventy-five percent HAVE RE-TURNED TO JAIL MORE THAN ONCE.
With a diminishing commitment to pro-vide education and treatment, young peopletend to be recycled through the prison sys-tem at this alarming high rate. They tend toemerge much worse than we they entered.Source: Press Release, Education: NationalDefense Tranquility Act Equal OpportunityFor Closing the Gap, 25 February 1997
Current Trends 2 of 4
URBAN SCHOOL: STUDENT CHARAC-TERISTIC AND SCHOOL EXPERIENCES
Urban children are two times morelikely to be living in poverty than those insuburban location (30 percent comparedwith 13 Percent in 1990), while 22 percent ofrural children were poor in 1990. Urbanschools had larger enrollments, on average,than suburban or rural schools at both theelementary and secondary Cyril. Urbanteachers had fewer resource to them and lesscontrol over their curriculum than teachersin other locations, as did teachers in urbanhigh poverty schools compared with thosein rural high poverty schools. (p.7)
Teacher absenteeism, an indicator ofmorale, was more problem in urban schoolsthan in suburban or rural schools, and inurban high poverty schools compared withrural high poverty schools. (p. 8) Teachersin urban and urban high poverty school hadcomparable levels of experience and salariesas their suburban counterparts, but they hadmore experience and higher salaries than
With adiminishing
commitment toprovide education
and treatment,young people tend
to be recycledthrough the prison
system at thisalarming high
rate.
83PUBLIC EDUCATION IN URBAN CENTERS: ANALYSIS’ TRENDS AND POLICY ISSUES ❐
most their rural counterparts. However, ad-ministrators or urban and urban high pov-erty schools had more difficulty hiring teach-ers than their counterparts in most otherschools. (pp. 7-8) Source: Department ofEducation’s Home Page; Poverty Rates forchildren under 18, by urbanicity; 1980 and1990, p.3
Current Trends 3 of 4
HOW ARE CHILDREN SPENDING THEIR
TIME?
By the age of 15, our youth have spent18,000 hours watching television, listened tomore than 22,000 hours of radio, seen ¼-mil-lion conflicts resolve by murder, spent 11,000hours in school, spent less than 3,000 hoursin church. Source: Press Release, Educa-tion: National Defense Tranquility Act,Equal Opportunity for Closing the Gap, 25February 1997.
Current Trends 4 of 4
POSITIVE IMPACTS ON EDUCATION AND
BALTIMORE CITY’S SUCCESSES
Strong leadership that is empowered;Leadership that is empowered with ad-equate and equal funding and communitysupport. Leadership that is credentialed andexperienced. Leadership that understandspolitical climate. Leadership that under-stands importance of all stakeholders—par-ents, community, business.
Professional development is a must.Administrators, principals, teachers and staffneed continuing training in the areas of de-livery of instruction, computer technology,cultural diversity, laws and ADA training.
Maintain strong curriculum division.What new innovations are available? Knowthe difference in innovation and “guineapig” research. Obtain data from the Researchand Evaluation Office on student achieve-ment, including after the diploma isawarded.
Organized coalitions are very effective.Who are the administrators in the schools?Are you involved in the selection process?When are school board meetings held?
What is the structure of the parent compo-nent of your school district? Who are yourcity, state and federal representatives? Whatare their positions on public education?What is their voting record?
Develop business partnerships for fu-ture employment opportunities and to con-tribute to student’s life experiences. Get ex-pertise. Funding resource. Establishes good-will.
Establish partnerships with communityand services groups, foundations, fraterni-ties, sororities, churches, and communitygroups connected to school.
Keep the lines of communication open.Informed stakeholders become partners ofeducation, not adversaries. Establish stronggovernment relations office in school system.Establish strong public relations office inschool system.
A Few Success Stories fromBaltimore City From the 1994 -1995 Annual Report
Safe School Initiatives: Reduced inci-dents involving firearms by 23 percent.Opened six Achieving Personal Excellence(APEX) centers. Opened citywide ConflictResolution Centers to assist school staff.
Student Achievement: 24 schoolsachieved MSPP performance indices greaterthan 50 and ahead of state goals, despite pov-erty levels of more than 60 percent. Of 155schools administering tests, 97 improved, 39maintained achievement levels, and 36gained 5 or more percentage points (“signifi-cant improvement” according to MSDE).Offered graduates more than $8 million inscholarship funds. Graduates were acceptedat more than 45 colleges. Displayed over 500pieces of students’ artwork at the DazzlingVistas Youth Art Exhibit.
Partnerships: Worked in partnershipwith Greater Baltimore Committee to pro-vide leadership and management trainingfor principals, and assistant principals.Brought immunization compliance to 98.8percent as of June 1996 in collaboration withBaltimore City Health Department.
Special Education: Raised over $15 mil-lion in third party billing for special educa-tion services through Medicaid reimburse-
Keep the lines ofcommunicationopen. Informedstakeholdersbecome partnersof education, notadversaries.

84 ❐ PROCEEDINGS OF SYMPOSIUM IV ON AFRICAN-AMERICAN MOBILITY ISSUES
ments. Designated William S. Baer Schoolas Mobility Opportunities Via EducationDemonstration Center for the East Coast.
Conducted intense training program for spe-cial education personnel using Distancelearning labs in high schools.
85THE CHURCH: AN ALTERNATIVE URBAN TRANSPORTATION AMENITY ❐
The Church: An Alternative Urban Transportation AmenityThe Church: An Alternative Urban Transportation Amenity
Charles A. Wright, Ph.D., P.E.Florida Agricultural and Mechanical University
Objective: To access the ability ofchurches to contribute as an alternative resource for urban
transportation services. Methodology:Evaluate existing transport investment bythe church and commitment to providing al-ternative for members. Existing Capital In-vestment: Examine community-based con-tribution to alternative sources of transpor-tation. Access state-wide church data basesto obtain a list of 200 candidate churches.Determine type of transportation vehiclesthat are available.Candidate Population Re-view: Considered churches with potentialtransport vehicles. Selected pilot list of 200churches.
Survey questions included the numberof transportation vehicle owned and oper-ated by the church;the total passenger capac-ity of transit vehicles; weekly frequency ofuse of transportation vehicles; purpose ofvehicle use; the number of church members.To measure commitment to providing alter-natives, questions included, work; social ser-vices; medical facilities; social, recreational,
sightseeing; errands , appointments, busi-ness, and other as alternative trip purposed.
ResuIts and Analysis of DataThe number of transportation vehicle
owned and operated by the most churcheswas less than two. The total passenger ca-pacity of transit vehicles of most respondentchurches was five to 10. Seventy-three per-cent of respondents stated transportation ve-hicles (weekly) were used one day per week.The purposes included recreation, 66 per-cent; ministry, 88 percent; and conferences,77 percent. Sixty-four percent of respon-dents had more than 500 church members.
Problems or NeedsReasons expressed for not providing
more alternatives to members included, re-pair of vehicles; paperwork; coordination;insurance costs; liability, and the need formore information. To assist churches, Dr.Wright recommends providing financial in-centives to churches for transportation ser-vices.
86 ❐ PROCEEDINGS OF SYMPOSIUM IV ON AFRICAN-AMERICAN MOBILITY ISSUES
This page left blank, intentionally.
87TRAFFIC CALMING AND ITS ROLE IN CREATING LIVABLE INNER-CITY COMMUNITIES ❐
Traffic Calming and Its Role in Creating Livable Inner- CityTraffic Calming and Its Role in Creating Livable Inner- CityCommunitiesCommunities
Ian M. LockwoodCity of West Palm Beach, Florida
Creating livable inner city communities can andneeds to be done. There are many challenges fac-ing inner city communities and many strategiesand initiatives available to meet the challenges.Normally a package of tailored initiatives is de-sirable to suit the needs of a particular commu-nity. However, one of the areas that is typicallyoverlooked in many packages is addressing thestreets in these communities. The purpose of thissubmission is to introduce the concept of trafficcalming and describe how it contributes to theinner city. To do this, the author has selectedand attached several relevant and concise docu-ments. Readers will discover what traffic calm-ing is, what it does, how the City of West PalmBeach uses traffic calming in one of its inner citycommunities, and how it has helped the down-town. What is Traffic Calming?, was preparedfor the 1997 International Conference of the In-stitute of Transportation Engineers. The paperprovides an up-to-date definition of traffic calm-ing and provides a clear interpretation of the defi-nition. Also included is the City TransportationLanguage Policy, adopted in 1996 by the City ofWest Palm Beach to change the way engineers,planners, and the public speak and think aboutstreets and transportation planning. The policywas considered very important to help shift thepriorities away from accommodating cars at allcosts, towards building streets for people. Beforethe policy was adopted, there was a pro-automo-bile bias to the language, and consequently thethought patterns of City staff. The policy helpspeople to consider a broader perspective (social,environmental, and economic.) Traffic CalmingCombined with Other Initiatives, describes whatthe City is doing in one of its inner-city commu-nities with respect to traffic calming and otherprograms. The City is making a large and care-
fully designed investment in the community, andbelieves that it will make a big difference.
What is Traffic Calming?
In September 1996, at the 66th ITE Annual Meeting, there was special meeting to discuss traffic calming. About
40 people from countries around the worldattended. The purpose was to discuss howthe ITE could contribute to, or be involvedwith, traffic calming. During the discussions,it became apparent that people had differ-ent definitions of traffic calming. Progresswas difficult due to the lack of a commondefinition. The decision was to establish asubconunittee to define traffic calming forthe ITE. The intent was to draft a definitionfor the 1997 International ITE Conference inTampa, Florida.
A Sample of Various DefinitionsResearch into the definition of traffic
calming confirmed that a common definitiondid not exist and that the range of definitionswas broad. For example, Tim Pharoah andJohn Russell defined traffic calming as “theattempt to achieve calm, safe and environ-mentally improved conditions on streets.”Dr. Carmen Hass-Klau stated that thePharoah-Russell definition did not go farenough. She felt that in the narrow sense,traffic calming meant “to lower speeds”.Then, in a broader sense, she felt that it mustbe thought of as “an overall transportationpolicy concept” to promote non-automobilemodes of transportation. Her definition in-cluded such things as road pricing, taxation
88 ❐ PROCEEDINGS OF SYMPOSIUM IV ON AFRICAN-AMERICAN MOBILITY ISSUES
changes, and parking restrictions. Her defi-nition was, “the combination of policies in-tended to alleviate the adverse environmen-tal, safety, and severance effects motor ve-hicles continue to impose on both the indi-vidual and society at large.” Another defi-nition of traffic calming developed by a Brit-ish group of engineers and surveyors was,“the application of traffic engineering andother physical measures designed to controltraffic speeds and encourage drivingbehaviour appropriate to the environment.”
The ProblemThe sample of definitions indicates that
traffic calming can mean anything from low-ering motor vehicle speeds to an all-encom-passing transportation policy. Unfortu-nately, many definitions for the same termlead to communication problems; orally orin written legislation and guidelines. Forexample, how is the ITE supposed to developa set of traffic calming guidelines for itsmembership when its membership haswidely varying views about what trafficcalming is? How can a municipality sup-port traffic calming without adopting its owndefinition? To help the public, transporta-tion professionals, municipal staff, and poli-ticians communicate effectively about traf-fic calming, a common understanding of theterm is necessary.
The Draft DefinitionAs developed by the ITE Subcommittee,
the draft definition of traffic calming is “thecombination of mainly physical measuresthat reduce the negative effects of motor ve-hicle use, alter driver behavior, and improveconditions for non-motorized street users.”
Interpretation of the Definition
The research into the definitions of traf-fic calming showed that, with few excep-tions, the definitions were accompanied byinterpretations to ensure a clear understand-ing of the intent. For example, the OntarioTraffic Conference’s definition of trafficcalming was very good, but extremely long.Its length made it very easy to interpret andparts of it were used to help nterpret the draft
ITE definition. The interpretation is not onlyimportant to define what traffic calming is,it also determines what traffic calming is not.That is, if something is not included in theinterpretation, then it is likely not trafficcalming. For further guidance on what traf-fic calming is not, see the section entitled“Related Words and Phrases”.
The definition’s phrase “mainly physi-cal measures” means physical measures anda supportive environment, which includessuch things as policy and legislative supportfor traffic calming and flexibility of existingstandards, guidelines, and practices. A sup-portive environment is as important as thetraffic calming measures themselves becauseit is what allows traffic calming to happen.The phrase “reduce the negative effects ofmotor vehicle use” means changing the de-sign and the role of the street to reduce thenegative social and environmental effects ofmotor vehicles on individuals (speeding, in-trusion, etc.) and on society in general (en-ergy consumption, pollution, urban sprawl,etc). The phrase “alter driver behavior” ad-dresses the self enforcement aspect of trafficcalming; the lowering of speeds, the reduc-tion of aggressive driving, and the increasein respect for non-motorized users of thestreets. The phrase “improve conditions fornonmotorized street users” means to pro-mote walking and cycling, increase safety,create a feeling of safety, improve the aes-thetics, etc.
Traffic calming measures include: ver-tical changes in the street (e.g. speed humps,speed tables, raised intersections); lateralchanges in the street (e.g. chicanes, off-setintersections, lateral shifts); constrictions(e.g. narrowings, pinch points, islands); nar-row pavement widths (e.g. medians, edgetreatments); entrance features; traffic circles;small comer radii; and related streetscaping(e.g. surface textures and colors, landscap-ing, street trees, and furniture). This list ofmeasures is particularly useful because itgives the categories of traffic calming mea-sures, while not limiting the ability to createnew measures within those categories.
Traffic calming goals include: increasingthe quality of life; incorporating the prefer-ences and requirements of the people usingthe area (e.g. working, playing, residing)
To help the public,transportationprofessionals,
municipal staff,and politicianscommunicate
effectively abouttraffic calming, a
commonunderstanding of
the term isnecessary.
89TRAFFIC CALMING AND ITS ROLE IN CREATING LIVABLE INNER-CITY COMMUNITIES ❐
along the street(s), or at the intersection(s);creating safe and attractive streets, helpingreduce the negative effects of motor vehicleson the environment (e.g. pollution, sprawl);and promoting pedestrian, cycle, and tran-sit use. Traffic calming objectives include:achieving slow speeds for motor vehicles; re-ducing collision frequency and severity; in-creasing the safety and the perception ofsafety for nonmotorized users of the street(s);reducing the need for police enforcement; en-hancing the street environment (e.g.streetscaping); encouraging water infiltra-tion into the ground; increasing access forall modes of transportation; and reducingcut-through motor vehicle traffic.
The lists of goals and objectives are veryuseful supplements to the definition. Theyallow people to relate traffic calming to otherpolicies, official plans, master plans, etc. Itis recognized that the goals are rather intan-gible, which is what goals should be. How-ever, the objectives are more tangible. There-fore, using the objectives, people can assesstraffic calming at whatever level they needto, and develop measures of success and fail-ure for their own traffic calming projects andpolicies.
The goals and objectives demonstratethat traffic calming involves much more thanjust motor vehicle issues. It is important thatmunicipalities and communities have achoice of why they should traffic calm. Forexample, in one city, reducing speeding maybe the key objective, while in another it maybe a combination of increasing access to landuses and increasing water infiltration into theground. Another city may be concernedabout urban renewal, crime, and aesthetics.
Despite the great deal of flexibility in-herent with traffic calming, there are someprinciples that apply to all traffic calmingmeasures. Traffic calming must be commu-nity-based and supported. Through design,traffic calming must incorporate a degree ofself-enforcement of motor vehicle speeds.Driver behavior must be directly affected bythe traffic calming measures. Traffic calm-ing must improve the safety of street users,particularly the vulnerable users includingthe children, disabled, elderly, pedestrians,and cyclists. The list of principles can bethought of as a test of minimum criteria to
determine if a candidate street modificationis actually traffic calming; if the principlesare not met, then it is not truly traffic calm-ing.
The definition and its interpretationwere developed to be broad enough to ap-ply to many places and situations, but nar-row enough to have a definite meaning. Itis recognized that different combinations ofgoals and objectives will apply to differentsituations. Different combinations of trafficcalming measures are appropriate depend-ing on the existing and anticipated or desiredmotor vehicle speeds and volumes, the over-all traffic calming plan, and the goals andobjectives for the street(s). Additional fac-tors affecting the choice of traffic calmingmeasures for specific locations include: thelocation type (entrance, internal intersection,rnid-block location), street type (local, col-lector, and arterial), street geometry, adja-cent land uses, mass transit needs, budget,aesthetic considerations, and communitypreferences.
Related Words and PhrasesAs described in the example definitions,
traffic calming has been equated to practi-cally everything from slowing down motorvehicles to changing tax laws. The commondefinition of traffic calming can have two ef-fects on previous definitions. For those whopreviously had a narrow definition of traf-fic calming, the new definition is broader.For those who had a broader definition, theopposite occurs. But, what happens to allthe items that are no longer covered by thecommon definition of traffic calming? Tohelp with these issues, a draft set of defini-tions for related words and phrases was pre-pared.
Traffic calming measures are design el-ements in and or along the street or intersec-tion that conform to the definition of trafficcalming.
Traffic management (or route modifica-tion) is the combination of measures that al-ters the available routes for traffic or trafficflow. Examples include one-way streets,diverters, closures, and turn prohibitions.
Discussion: Traffic management andtraffic calming are frequently confused. Al-
90 ❐ PROCEEDINGS OF SYMPOSIUM IV ON AFRICAN-AMERICAN MOBILITY ISSUES
though traffic management could share thecommon goal of improving quality of life bypreventing cut-through traffic, traffic man-agement is an attempt to change traffic rout-ing or traffic flow on the street network,while traffic calming is an attempt to alterdriver behaviour. The confusion betweentraffic management and traffic calming canlikely be traced back to the 1970s when “traf-fic management plans” were very popular.When traffic calming came along later, manypeople lumped it in with traffic managementas if it were the same thing.
Traffic control devices are signs, signals,and markings, designed to regulate, warn,guide, and provide information. Examplesinclude stops signs, speed limit signs, andtraffic signals.
Discussion: Traffic control devices arefrequently confused with traffic calmingmeasures. Although a traffic control deviceand a traffic calming measure could sharethe common goal of slowing down car driv-ers, the traffic control device is an attemptin communication, while the traffic calmingmeasure is a part of the design of the streetor intersection.
Streetscaping includes planning andplacing distinctive lighting, furniture, art,trees, other landscaping, etc. along streetsand at intersections.
Discussion: Streetscaping can occurquite successfully without traffic calming,but traffic calming is most successful whenit is done in conjunction with streetscapingwhich is why “related streetscaping” wasincluded in the definition of traffic calming.
Traffic calming plans affect one or morestreets and/or intersections and involvestraffic calming measures.
Neighborhood traffic calming plans aretraffic calming plans for whole neighbor-hoods.
Area-wide traffic calming plans are traf-fic calming plans for large areas.
Traffic management plans affect one ormore streets and/or intersections and in-volve traffic management measures.
Neighborhood traffic managementplans are traffic management plans for wholeneighborhoods.
Street plans affect one or more streetsand intersections and involve traffic calm-ing, traffic management, streetscaping, traf-fic control, provisions for non-automobilemodes (sidewalks, contra-flow cycle lanes,etc.), and on-street parking.
Conclusions and RecommendationsNaturally, developing a common defi-
nition of traffic calming and related termswill have repercussions. People who havebeen using unrecommended language willhave some difficultly adjusting in the shortterm. However, if these issues are not ad-dressed soon, then defining clear terminol-ogy will only get more difficult in the futureas traffic calming becomes more popular. Inaddition, clear terminology will help withlegislation, standards, and other communi-cation. It is recommended that the ITE con-tinue to critically examine and revise as nec-essary the language of transportation plan-ning and engineering to ensure that commu-nication is effective.
REFERENCES
County Surveyors Society et. al.1994 Traffic Calming in Practice. Landor
Publishing Ltd., London, England.Hass-Klau, Dr. Carmen1990 The Theory and Practice of Traffic
Calming, Can Britain Learnfrom theGerman Experience? Environmentaland Transport Planning, Brighton, En-gland.
Ontario Traffic Conference Subcommittee onTraffic Calming
91TRAFFIC CALMING AND ITS ROLE IN CREATING LIVABLE INNER-CITY COMMUNITIES ❐ 1995 Traffic Calming, the 21stCentury. Ontario Traffic Conference, Toronto, Canada,
NovemberPharoah, Tim, and John Russell1989 Traffic Calming: Policy and Evaluations in Three European Countries. South Bank
Polytechnic, London, England.
MEMO
To: Department Directors and Division HeadsFrom: Michael J. Wright, City AdministratorSubject: City Transportation Language PolicyDate: November 14, 1996
Please be advised that the City of West Palm Beach has adopted a new transportationlanguage policy. Employees are asked to follow the policy and encourage those who dealwith the City to do the same. The intent of the policy is to remove the biases inherent insome of the current transportation language used at the City. This change is consistent withthe shift in philosophy as the City works towards becoming a sustainable community. Ob-jective language will be used for all correspondences, resolutions, ordinances, plans, lan-guage at meetings, etc. and when updating past work.
Everyone’s cooperation will be greatly appreciated. Please ensure that your employeesare aware of, and use, the objective language. After a few of weeks of practice, using theobjective language will become second nature.
Background: Much of the current transportation language was developed in the 1950’sand 1960’s. This was the golden age of automobiles and accommodating them was a majorpriority in society. Times have changed, especially in urban areas where creating a bal-anced, equitable, and sustainable transportation system is the new priority. The transporta-tion language has not evolved at the same pace as the changing priorities much of it stillcarries a pro-automobile bias. Continued use of biased language is not in keeping with thegoal of addressing transportation issues in an objective way in the City.
Languages Changes: There are several biased words and phrases that have been identi-fied and summarized at the end of this memo. Suggested objective language is also summa-rized. The rationale for the changes is explained below. In summary, the City has to beunbiased, and appear to be unbiased. Objective language will also allow the City to beinclusive of all of the City’s constituents and modes of transportation.
The word improvements is often used when referring to the addition of through lanes,turn lanes, channelization, or other means of increasing motor vehicle capacity and/orspeeds. Though these changes may indeed be improvements from the perspective of motorvehicle users, they would not be considered improvements by other constituents of theCity. For example, a resident may not think that adding more lanes in front of the resident’shouse is an improvement. A parent may not think that a channelized right turn lane is animprovement on their child’s pedestrian route to school. By City staff referring to thesechanges as improvements, it indicates that the City is biased in favor of one group at theexpense of others. Suggested objective language includes being descriptive (e.g. use throughlanes, turn lanes, etc.) or using language such as modifications or changes.
Examples: Biased: The following street improvements are recommended.The intersection improvement will cost $5,000.00.The motor vehicle capacity will be improved.
Objective: The following street modifications are recommended.The right turn channel will cost $5,000.00.The motor vehicle capacity will be changed.
92 ❐ PROCEEDINGS OF SYMPOSIUM IV ON AFRICAN-AMERICAN MOBILITY ISSUES
Like improved and improvement, there are similarly biased words such as enhance, en-hancement, and deteriorate. Suggested objective language is shown in the examples below.
Examples: Biased: The level of service for motor vehicles was enhanced.The level of service for motor vehicles deteriorated .The motor vehicle capacity enhancements will cost $40,000.00.
Objective: The level of service for motor vehicles was changed.The level of service for motor vehicles was decreased.The level of service for motor vehicles was increased.The increases to motor vehicle capacity will cost $40,000.00.
Upgrade is a term that is currently used to describe what happens when a local street isreconstructed as a collector, or when a two-lane street is expanded to four lanes. Upgradeimplies a change for the better. Though this may be the case for one constituent, others maydisagree. Again, using upgrade in this way indicates that the City has a bias that favors onegroup over other groups. Objective language includes expansion, reconstruction, widened, orchanged .
Examples: Biased: Upgrading the street will require a wider right of way.The upgrades will lengthen sight distances.
Objective: Widening the street will require a wider right of way.The changes will lengthen sight distances.
Level of service is a qualitative measure describing the operational conditions of a facil-ity or service from the perspective of a particular set of users (motor vehicle users, cyclists,pedestrians, etc.). If the set of users is not specified, then it is a mystery as to which set isbeing considered. The bias enters the picture when it is assumed that, unless otherwisespecified, level of service implies for motor vehicle users. The objective way to use this termis to add the appropriate modifier after “level of service”.
Examples: Biased: The level of service was “A”.Objective: The level of service for motor vehicle users was “A”.
The level of service for pedestrians was “A”.
If “level of service” were used frequently for the same users in the same document,using the modifier every time would be cumbersome. In these situations, the modifier isonly required at the beginning of the document and periodically after that.
Traffic is often used synonymously with motor vehicle traffic. However, there are sev-eral types of traffic in the City: pedestrian traffic, cycle traffic, and train traffic. To be objec-tive, if you mean motor vehicle traffic, then say motor vehicle traffic. If you mean all thetypes of traffic, then say traffic.
Examples: Biased: The problem is speeding traffic.The traffic queued back for one mile.
Objective: The problem is speeding motor vehicles.The motor vehicles queued back for one mile.
At the City, we frequently discuss the concept of traffic demand, fluctuations in trafficdemand, peak hour traffic demand, etc. Not withstanding the concerns about the wordtraffic, the concept of traffic demand contains a bias. There is really no such thing as de-mand for traffic; traffic is not a commodity that most people desire. Demand is an overlystrong word which implies a sense of urgency which does not necessarily exist at the City,especially considering the shift in priorities as discussed at the beginning of this memo.Objective language would be motor vehicle use or travel demand.
93TRAFFIC CALMING AND ITS ROLE IN CREATING LIVABLE INNER-CITY COMMUNITIES ❐
Examples: Biased: The traffic demand will increase.The traffic demand projections will be complete soon.The peak hour traffic demand is falling.
Objective: Motor vehicle use will increase.Travel demand will increase.The projections of motor vehicle use will be complete soon.The peak hour motor vehicle use is falling.
Promoting alternative modes of transportation is generally considered a good thing atthe City. However, the word alternative begs the question, “Alternative to what?” Theassumption is alternative to automobiles. Alternative also implies that these alternativemodes are nontraditional or nonconventional which is not the case with the pedestrian,cycle, nor transit modes. If we are discussing alternative modes of transportation in theCity, then use direct and objective language such as non-automobile modes of transporta-tion. Alternatively, one can add an appropriate modifier as shown in the last example.
Examples: Biased: Alternative modes of transportation are important to downtown.Objective: Non-automobile modes of transportation are important to the down
town.Non-motorized modes of transportation are important to the downtown.Alternative modes of transportation to the automobile are impor-
tant to the downtown.Accidents are events during which something harmful or unlucky happens unexpect-
edly or by chance. Accident implies no fault. It is well known that the vast majority ofaccidents are preventable and that fault can be assigned. The use of accident also reducesthe degree of responsibility and severity associated with the situation and invokes a inher-ent degree of sympathy for the person responsible. Objective language includes collisionand crash.
Examples: Biased: Motor vehicle accidents kill 200 people every year in the County.He had an accident with a light pole.Here is the accident report.
Objective: Motor vehicle collisions kill 200 people every year in the County.He crashed into a light pole.Here is the collision report.
Protect means shielding from harm. However, when we discuss protecting land for aright of way for a road, the intent is not to shield the land from harm, but to construct a roadover it. Objective words include designate and purchase.
Examples: Biased: We have protected this right of way.Objective: We have purchased this right of way.
We have designated this a right of way.Everyone at the City should strive to make the transportation systems operate as effi-
ciently as possible. However, we must be careful how we use efficient because that word isfrequently confused with the word faster. Typically, efficiency issues are raised when deal-ing with motor vehicles operating at slow speeds. The assumption is that if changes weremade that increase the speeds of the motor vehicles, then efficiency rises. However, thisassumption is highly debatable. For example, high motor vehicle speeds lead to urbansprawl, motor vehicle dependence, and high resource use (land, metal, rubber, etc) whichreduces efficiency. Motor vehicles bum the least fuel at about 30 miles per hour, speedsabove this result in inefficiencies. In urban areas, accelerating and decelerating from stoppedconditions to high speeds results in inefficiencies when compared to slow and steady speeds.The there also are efficiency debates about people’s travel time and other issues as well.
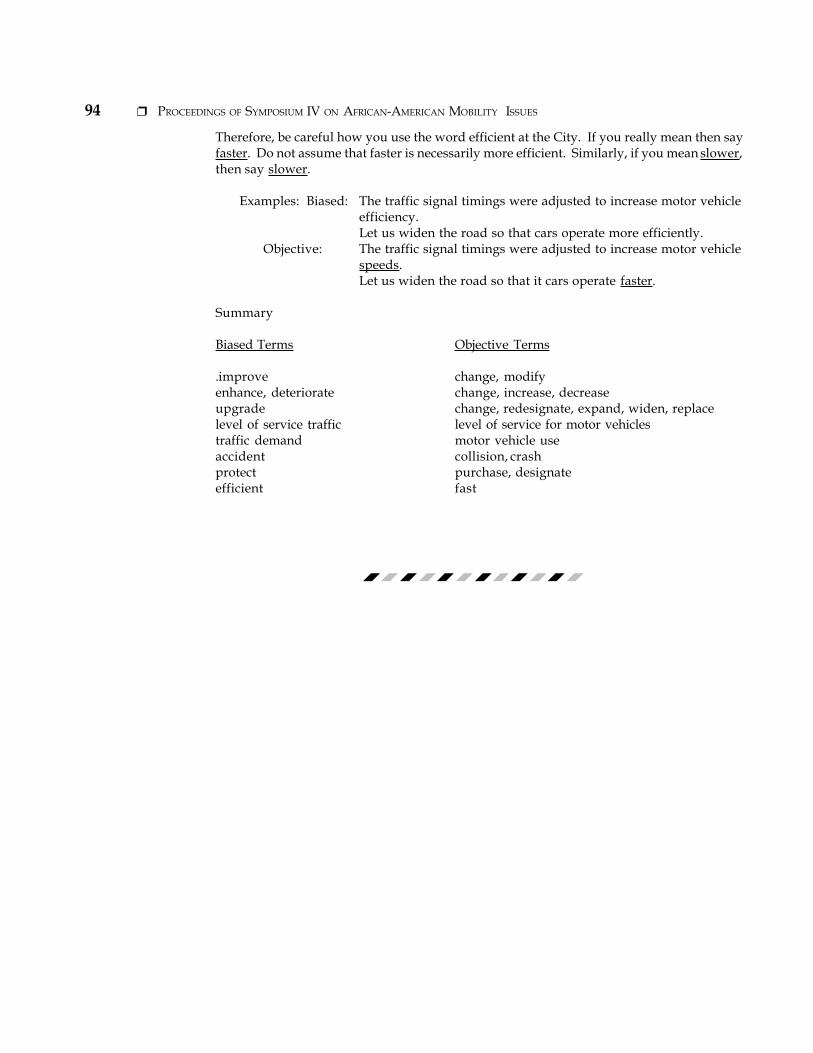
94 ❐ PROCEEDINGS OF SYMPOSIUM IV ON AFRICAN-AMERICAN MOBILITY ISSUES
Therefore, be careful how you use the word efficient at the City. If you really mean then sayfaster. Do not assume that faster is necessarily more efficient. Similarly, if you mean slower,then say slower.
Examples: Biased: The traffic signal timings were adjusted to increase motor vehicleefficiency.Let us widen the road so that cars operate more efficiently.
Objective: The traffic signal timings were adjusted to increase motor vehiclespeeds.Let us widen the road so that it cars operate faster.
Summary
Biased Terms Objective Terms
.improve change, modifyenhance, deteriorate change, increase, decreaseupgrade change, redesignate, expand, widen, replacelevel of service traffic level of service for motor vehiclestraffic demand motor vehicle useaccident collision, crashprotect purchase, designateefficient fast
95TECHNOLOGY, TRANSPORTATION, AND AFRICAN AMERICANS : NO INNOVATIONS IN POLICY DIRECTIVES ❐
Technology, Transportation, and African Americans : NoTechnology, Transportation, and African Americans : NoInnovations in Policy DirectivesInnovations in Policy Directives
Terrence A. Taylor, MPAMiami-Dade Metropolitan Planning Organization
The United States is a segregatednation. It is no accident that thereversal of segregation laws and
the legitimation of the Civil Rights move-ment by corresponding public policyroughly paralleled the suburbanization ofAmerica. Unfortunately for African Ameri-cans , the capital needed to provide an eco-nomic base and to sustain the central city leftalso.
The result was an increase in povertyand unemployment. Without the symbolsof wealth and potential, one is at an extremedisadvantage in a capitalist society. Socialproblems that accompany poverty and un-employment beset those who live away fromthe capital base. As it will be demonstratedwithin this paper, the persons left behindtended to be African Americans more thanany other ethnic group.
The problem is further exacerbated bypublic policy. The explicit, implicit andsometimes de facto public policy has beenthat since African-American communities,especially those located within central cities,have more than their share of social, crimi-nal, and economic ills, it is not unreasonableto visit a few more of these ills upon thosewho must reside in these areas.
The development and implementationof transportation infrastructure are examplesof the public policy problem. It is well docu-mented by Mohl (1993) that transportationinfrastructure has often been designed to thedetriment of those dwelling in the urbancore. By making it feasible to develop addi-tional suburbs along the route, the nation’shighway system allowed financially ableAmericans to establish enclaves further
away from the central city. Instead of creat-ing Africa-American communities, however,it destroyed them.
Highways were constructed in manyplaces so that suburbanites could travel totheir employ in the central city without ac-tually living there. Now transportation plan-ning policies are geared toward making itfeasible for those who wish to bypass the cen-tral city altogether to do so.
The deployment of Intelligent Transpor-tation Systems (ITS), formerly known as In-telligent Vehicle Highway Systems (IVHS),is a technologically-based continuation ofthis policy. While the name changed to in-clude improvements in the transit systemsuch as the Automated Vehicle Locator Sys-tem (AVL), the primary focus is on thingssuch as automated toll collection, variablesmessage signs, and the potential for real-timepricing (Peña 1996).
This investment should alarm African-American communities, scholars and plan-ners. It is a motor vehicle capacity improve-ment, and such improvements have tradi-tionally had adverse effects on African-American communities. Without propersafeguards, ITS will continue this tradition.First, it will maintain the segregation thatbesets the nation’s major metropolitan areas.Second, it will further erode job accessibil-ity for many African Americans and poten-tially worsen the poverty in many commu-nities. Third, African Americans are heavilytransit-dependent and lack the vehicularcapital necessary to participate in ITS.Fourth, African Americans in many com-munities lack the education or even the ac-cess to the education necessary to participate
96 ❐ PROCEEDINGS OF SYMPOSIUM IV ON AFRICAN-AMERICAN MOBILITY ISSUES
in the information age. Finally, AfricanAmericans continue to lack the capital nec-essary to participate in the information age,including ITS.
African Americans and TheirLocations Within Cities
The term “cities”, for the purposes of thispaper, will be used interchangeably with theterm “metropolitan areas.” In either case, itrefers to an entire urbanized area that, alongwith its suburban areas, are economicallyand socially bound together. At the core ofa metropolitan area is the “central city.” Thisis the formally bounded municipal corpora-tion around which the metropolitan areasupposedly revolves. Finally, there is the“inner city.” The inner city is a dense part ofthe metropolitan area, usually in the centercity. The inner city, by definition, is oftenplagued by undesirable social, economic andphysical conditions that occur in that limitedportion of the central city.” (Byrum 1992)
These definitions are important becausethey place the various activities that occurwithin cities in perspective. Types of resi-dence, employment and recreation are im-portant when defining living conditions.Furthermore, the distance one has to travelbetween these activities of everyday life andthe availability of various modes of trans-portation to be used are important to thesocial and economic health of a community.
Most people who live in the central city,especially the inner city do so because theymust. The general trend is that those whocan afford to leave will move away, andthose who cannot afford to do so will remain.Byrum (1992) notes that “racial attitudes andeconomic class are deeply involved in thistendency and metropolitan housing marketsprovide the means for this tendency to be-come residential practice and geography.”
There is, however, more than the mar-ket at work. Historically, the movement ofinner city populations, or lack thereof, wasplanned methodically in many metropolitanareas. (Mohl 1993) The idea was that if thesecommunities could be contained, then theireconomic force could also be contained. Theresult of such policies was that the peoplewho lived in the inner city were “compacted
and quarantined” (Miller 1996) from the de-velopment that benefited the central city.
Of course, it should not be implied fromthis historical discussion that African Ameri-cans do not live in suburbs. Massey andDenton (1993) do note, however, that blackstraditionally have not been able to relocateto the suburbs at the same rates as whites.Minneapolis, Kansas City, Milwaukee, andNew York had suburbanization rates under10 percent as late as 1980. The closest parityin the suburbanization rate is in Los Ange-les, where in 1980 it approached 42 percent.Nevertheless, It was still lower than thewhite suburbanization rate of 57 percent.
Furthermore, Massey and Denton (1993)note that black suburbanization does noteliminate black-white disparities in employ-ment and housing. In many ways, the con-ditions of the suburbs to which they moveoften replicate the problems of the inner cit-ies they fled. They tend to be “old” suburbsthat white populations have already de-serted to move farther away. Likewise, bythe time African Americans move there, theeconomic and capital base needed to sustaina viable community has moved away as well.
In some places, especially in the South,African-American populations have tradi-tionally lived outside the central city. Be-cause of post-slavery economics and segre-gation, they were relegated to live outsidethe city in rural areas. Oddly enough, thepost-integration era often brought about theannexation of many rural areas as southerncities began to grow and expand. Thus, manysouthern blacks became suburbanites withlittle or no effort on their part. (Massey andDenton 1993)
Transportation and ProgressAmerican cities, in their segregated hey-
days, often could not decide what to do withAfrican Americans . They were alwaysviewed as a problem, even if their commu-nities were thriving. Mohl (1993), Miller(1996) and others note that when the com-munity was thriving then it needed to bedestroyed, or at the very least relocated, pre-sumably because the location would be agood place for the majority population’s resi-dence and commerce. If a community was
Most people wholive in the central
city, especially theinner city do so
because theymust. The generaltrend is that thosewho can afford to
leave will moveaway, and those
who cannot affordto do so will
remain.
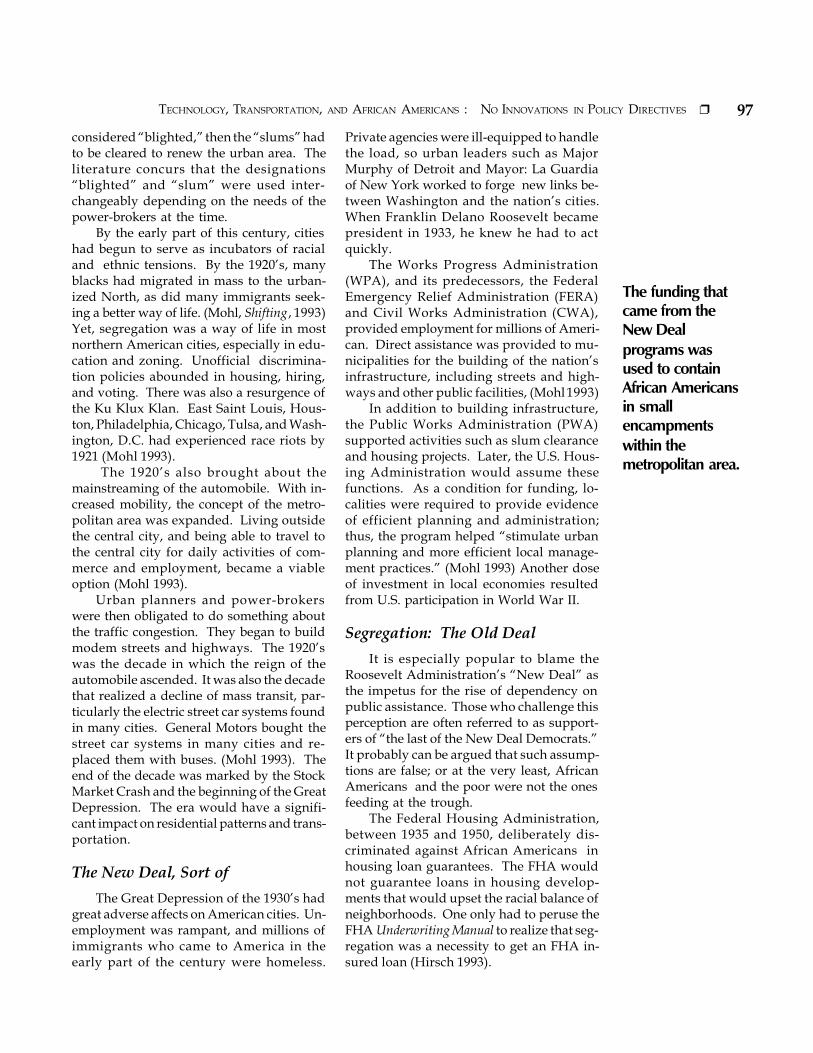
97TECHNOLOGY, TRANSPORTATION, AND AFRICAN AMERICANS : NO INNOVATIONS IN POLICY DIRECTIVES ❐
considered “blighted,” then the “slums” hadto be cleared to renew the urban area. Theliterature concurs that the designations“blighted” and “slum” were used inter-changeably depending on the needs of thepower-brokers at the time.
By the early part of this century, citieshad begun to serve as incubators of racialand ethnic tensions. By the 1920’s, manyblacks had migrated in mass to the urban-ized North, as did many immigrants seek-ing a better way of life. (Mohl, Shifting , 1993)Yet, segregation was a way of life in mostnorthern American cities, especially in edu-cation and zoning. Unofficial discrimina-tion policies abounded in housing, hiring,and voting. There was also a resurgence ofthe Ku Klux Klan. East Saint Louis, Hous-ton, Philadelphia, Chicago, Tulsa, and Wash-ington, D.C. had experienced race riots by1921 (Mohl 1993).
The 1920’s also brought about themainstreaming of the automobile. With in-creased mobility, the concept of the metro-politan area was expanded. Living outsidethe central city, and being able to travel tothe central city for daily activities of com-merce and employment, became a viableoption (Mohl 1993).
Urban planners and power-brokerswere then obligated to do something aboutthe traffic congestion. They began to buildmodem streets and highways. The 1920’swas the decade in which the reign of theautomobile ascended. It was also the decadethat realized a decline of mass transit, par-ticularly the electric street car systems foundin many cities. General Motors bought thestreet car systems in many cities and re-placed them with buses. (Mohl 1993). Theend of the decade was marked by the StockMarket Crash and the beginning of the GreatDepression. The era would have a signifi-cant impact on residential patterns and trans-portation.
The New Deal, Sort ofThe Great Depression of the 1930’s had
great adverse affects on American cities. Un-employment was rampant, and millions ofimmigrants who came to America in theearly part of the century were homeless.
Private agencies were ill-equipped to handlethe load, so urban leaders such as MajorMurphy of Detroit and Mayor: La Guardiaof New York worked to forge new links be-tween Washington and the nation’s cities.When Franklin Delano Roosevelt becamepresident in 1933, he knew he had to actquickly.
The Works Progress Administration(WPA), and its predecessors, the FederalEmergency Relief Administration (FERA)and Civil Works Administration (CWA),provided employment for millions of Ameri-can. Direct assistance was provided to mu-nicipalities for the building of the nation’sinfrastructure, including streets and high-ways and other public facilities, (Mohl 1993)
In addition to building infrastructure,the Public Works Administration (PWA)supported activities such as slum clearanceand housing projects. Later, the U.S. Hous-ing Administration would assume thesefunctions. As a condition for funding, lo-calities were required to provide evidenceof efficient planning and administration;thus, the program helped “stimulate urbanplanning and more efficient local manage-ment practices.” (Mohl 1993) Another doseof investment in local economies resultedfrom U.S. participation in World War II.
Segregation: The Old DealIt is especially popular to blame the
Roosevelt Administration’s “New Deal” asthe impetus for the rise of dependency onpublic assistance. Those who challenge thisperception are often referred to as support-ers of “the last of the New Deal Democrats.”It probably can be argued that such assump-tions are false; or at the very least, AfricanAmericans and the poor were not the onesfeeding at the trough.
The Federal Housing Administration,between 1935 and 1950, deliberately dis-criminated against African Americans inhousing loan guarantees. The FHA wouldnot guarantee loans in housing develop-ments that would upset the racial balance ofneighborhoods. One only had to peruse theFHA Underwriting Manual to realize that seg-regation was a necessity to get an FHA in-sured loan (Hirsch 1993).
The funding thatcame from theNew Dealprograms wasused to containAfrican Americansin smallencampmentswithin themetropolitan area.
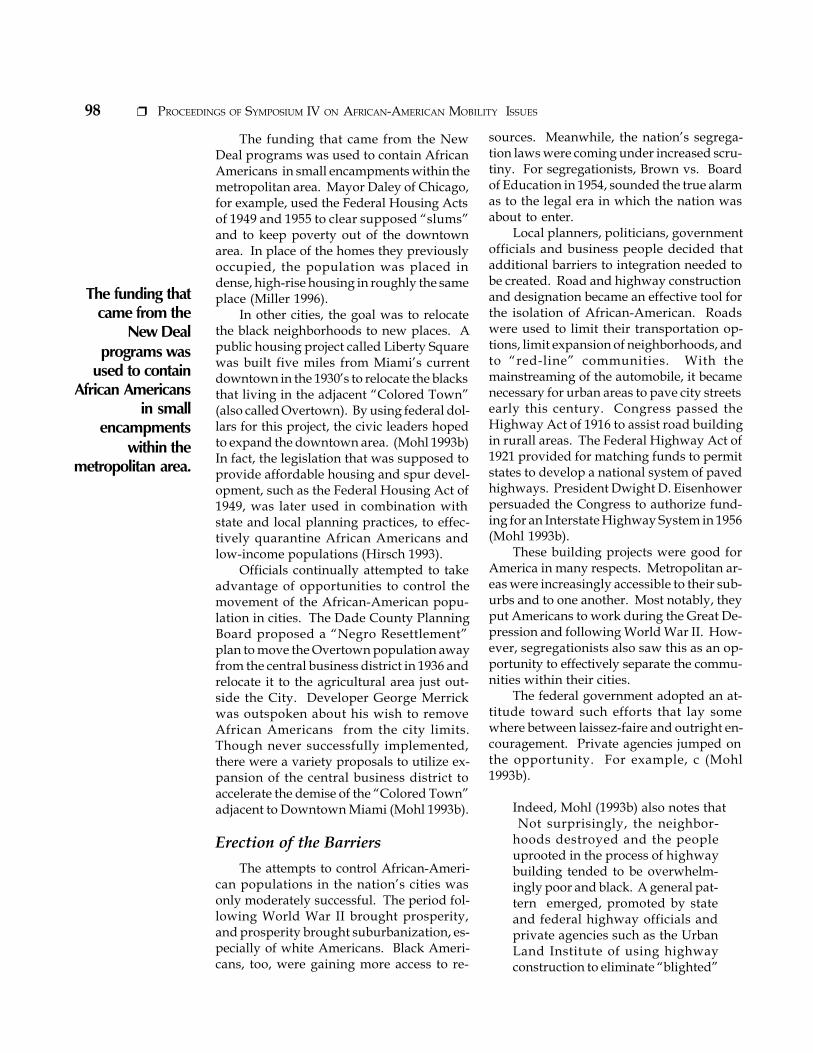
98 ❐ PROCEEDINGS OF SYMPOSIUM IV ON AFRICAN-AMERICAN MOBILITY ISSUES
The funding that came from the NewDeal programs was used to contain AfricanAmericans in small encampments within themetropolitan area. Mayor Daley of Chicago,for example, used the Federal Housing Actsof 1949 and 1955 to clear supposed “slums”and to keep poverty out of the downtownarea. In place of the homes they previouslyoccupied, the population was placed indense, high-rise housing in roughly the sameplace (Miller 1996).
In other cities, the goal was to relocatethe black neighborhoods to new places. Apublic housing project called Liberty Squarewas built five miles from Miami’s currentdowntown in the 1930’s to relocate the blacksthat living in the adjacent “Colored Town”(also called Overtown). By using federal dol-lars for this project, the civic leaders hopedto expand the downtown area. (Mohl 1993b)In fact, the legislation that was supposed toprovide affordable housing and spur devel-opment, such as the Federal Housing Act of1949, was later used in combination withstate and local planning practices, to effec-tively quarantine African Americans andlow-income populations (Hirsch 1993).
Officials continually attempted to takeadvantage of opportunities to control themovement of the African-American popu-lation in cities. The Dade County PlanningBoard proposed a “Negro Resettlement”plan to move the Overtown population awayfrom the central business district in 1936 andrelocate it to the agricultural area just out-side the City. Developer George Merrickwas outspoken about his wish to removeAfrican Americans from the city limits.Though never successfully implemented,there were a variety proposals to utilize ex-pansion of the central business district toaccelerate the demise of the “Colored Town”adjacent to Downtown Miami (Mohl 1993b).
Erection of the BarriersThe attempts to control African-Ameri-
can populations in the nation’s cities wasonly moderately successful. The period fol-lowing World War II brought prosperity,and prosperity brought suburbanization, es-pecially of white Americans. Black Ameri-cans, too, were gaining more access to re-
sources. Meanwhile, the nation’s segrega-tion laws were coming under increased scru-tiny. For segregationists, Brown vs. Boardof Education in 1954, sounded the true alarmas to the legal era in which the nation wasabout to enter.
Local planners, politicians, governmentofficials and business people decided thatadditional barriers to integration needed tobe created. Road and highway constructionand designation became an effective tool forthe isolation of African-American. Roadswere used to limit their transportation op-tions, limit expansion of neighborhoods, andto “red-line” communities. With themainstreaming of the automobile, it becamenecessary for urban areas to pave city streetsearly this century. Congress passed theHighway Act of 1916 to assist road buildingin rurall areas. The Federal Highway Act of1921 provided for matching funds to permitstates to develop a national system of pavedhighways. President Dwight D. Eisenhowerpersuaded the Congress to authorize fund-ing for an Interstate Highway System in 1956(Mohl 1993b).
These building projects were good forAmerica in many respects. Metropolitan ar-eas were increasingly accessible to their sub-urbs and to one another. Most notably, theyput Americans to work during the Great De-pression and following World War II. How-ever, segregationists also saw this as an op-portunity to effectively separate the commu-nities within their cities.
The federal government adopted an at-titude toward such efforts that lay somewhere between laissez-faire and outright en-couragement. Private agencies jumped onthe opportunity. For example, c (Mohl1993b).
Indeed, Mohl (1993b) also notes that Not surprisingly, the neighbor-hoods destroyed and the peopleuprooted in the process of highwaybuilding tended to be overwhelm-ingly poor and black. A general pat-tern emerged, promoted by stateand federal highway officials andprivate agencies such as the UrbanLand Institute of using highwayconstruction to eliminate “blighted”
The funding thatcame from the
New Dealprograms was
used to containAfrican Americans
in smallencampments
within themetropolitan area.
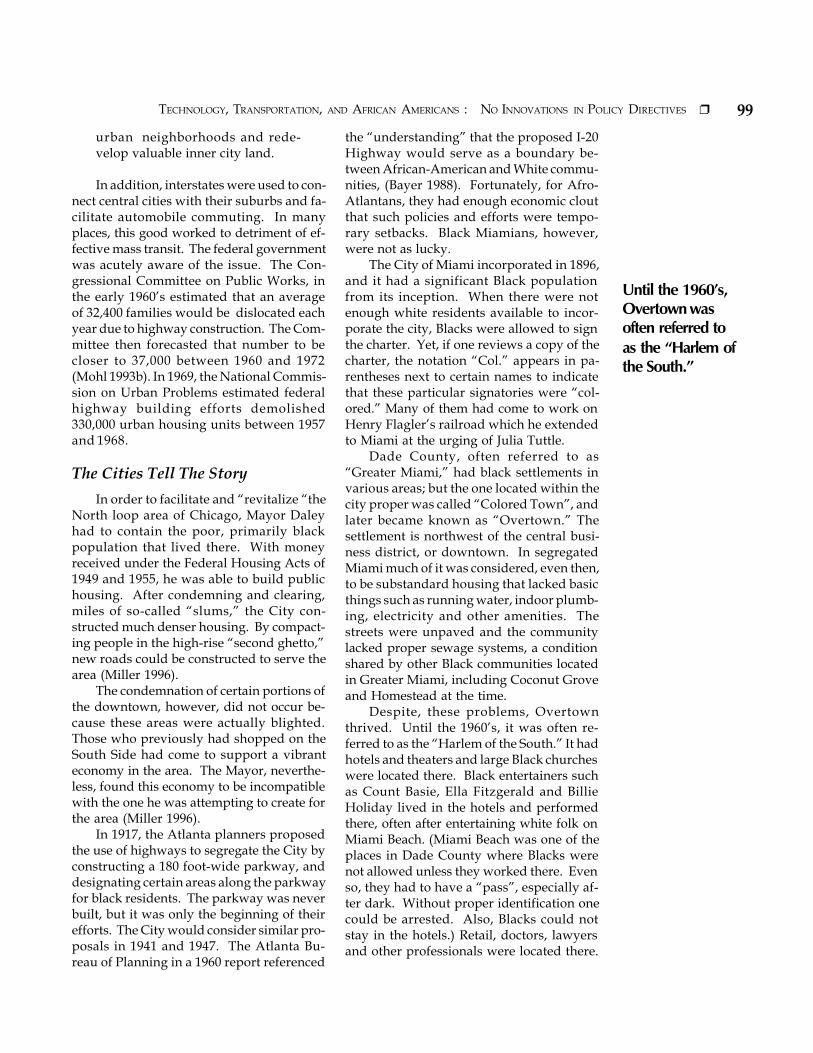
99TECHNOLOGY, TRANSPORTATION, AND AFRICAN AMERICANS : NO INNOVATIONS IN POLICY DIRECTIVES ❐
urban neighborhoods and rede-velop valuable inner city land.
In addition, interstates were used to con-nect central cities with their suburbs and fa-cilitate automobile commuting. In manyplaces, this good worked to detriment of ef-fective mass transit. The federal governmentwas acutely aware of the issue. The Con-gressional Committee on Public Works, inthe early 1960’s estimated that an averageof 32,400 families would be dislocated eachyear due to highway construction. The Com-mittee then forecasted that number to becloser to 37,000 between 1960 and 1972(Mohl 1993b). In 1969, the National Commis-sion on Urban Problems estimated federalhighway building efforts demolished330,000 urban housing units between 1957and 1968.
The Cities Tell The StoryIn order to facilitate and “revitalize “the
North loop area of Chicago, Mayor Daleyhad to contain the poor, primarily blackpopulation that lived there. With moneyreceived under the Federal Housing Acts of1949 and 1955, he was able to build publichousing. After condemning and clearing,miles of so-called “slums,” the City con-structed much denser housing. By compact-ing people in the high-rise “second ghetto,”new roads could be constructed to serve thearea (Miller 1996).
The condemnation of certain portions ofthe downtown, however, did not occur be-cause these areas were actually blighted.Those who previously had shopped on theSouth Side had come to support a vibranteconomy in the area. The Mayor, neverthe-less, found this economy to be incompatiblewith the one he was attempting to create forthe area (Miller 1996).
In 1917, the Atlanta planners proposedthe use of highways to segregate the City byconstructing a 180 foot-wide parkway, anddesignating certain areas along the parkwayfor black residents. The parkway was neverbuilt, but it was only the beginning of theirefforts. The City would consider similar pro-posals in 1941 and 1947. The Atlanta Bu-reau of Planning in a 1960 report referenced
the “understanding” that the proposed I-20Highway would serve as a boundary be-tween African-American and White commu-nities, (Bayer 1988). Fortunately, for Afro-Atlantans, they had enough economic cloutthat such policies and efforts were tempo-rary setbacks. Black Miamians, however,were not as lucky.
The City of Miami incorporated in 1896,and it had a significant Black populationfrom its inception. When there were notenough white residents available to incor-porate the city, Blacks were allowed to signthe charter. Yet, if one reviews a copy of thecharter, the notation “Col.” appears in pa-rentheses next to certain names to indicatethat these particular signatories were “col-ored.” Many of them had come to work onHenry Flagler’s railroad which he extendedto Miami at the urging of Julia Tuttle.
Dade County, often referred to as“Greater Miami,” had black settlements invarious areas; but the one located within thecity proper was called “Colored Town”, andlater became known as “Overtown.” Thesettlement is northwest of the central busi-ness district, or downtown. In segregatedMiami much of it was considered, even then,to be substandard housing that lacked basicthings such as running water, indoor plumb-ing, electricity and other amenities. Thestreets were unpaved and the communitylacked proper sewage systems, a conditionshared by other Black communities locatedin Greater Miami, including Coconut Groveand Homestead at the time.
Despite, these problems, Overtownthrived. Until the 1960’s, it was often re-ferred to as the “Harlem of the South.” It hadhotels and theaters and large Black churcheswere located there. Black entertainers suchas Count Basie, Ella Fitzgerald and BillieHoliday lived in the hotels and performedthere, often after entertaining white folk onMiami Beach. (Miami Beach was one of theplaces in Dade County where Blacks werenot allowed unless they worked there. Evenso, they had to have a “pass”, especially af-ter dark. Without proper identification onecould be arrested. Also, Blacks could notstay in the hotels.) Retail, doctors, lawyersand other professionals were located there.
Until the 1960’s,Overtown wasoften referred toas the “Harlem ofthe South.”
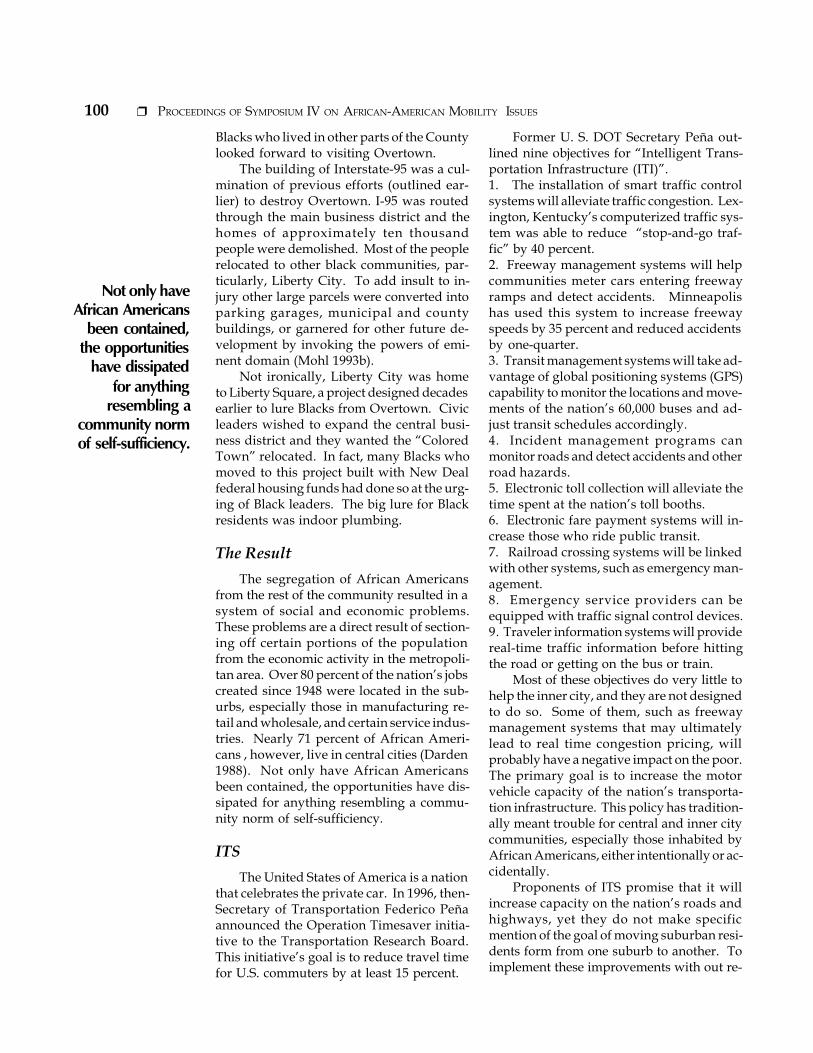
100 ❐ PROCEEDINGS OF SYMPOSIUM IV ON AFRICAN-AMERICAN MOBILITY ISSUES
Blacks who lived in other parts of the Countylooked forward to visiting Overtown.
The building of Interstate-95 was a cul-mination of previous efforts (outlined ear-lier) to destroy Overtown. I-95 was routedthrough the main business district and thehomes of approximately ten thousandpeople were demolished. Most of the peoplerelocated to other black communities, par-ticularly, Liberty City. To add insult to in-jury other large parcels were converted intoparking garages, municipal and countybuildings, or garnered for other future de-velopment by invoking the powers of emi-nent domain (Mohl 1993b).
Not ironically, Liberty City was hometo Liberty Square, a project designed decadesearlier to lure Blacks from Overtown. Civicleaders wished to expand the central busi-ness district and they wanted the “ColoredTown” relocated. In fact, many Blacks whomoved to this project built with New Dealfederal housing funds had done so at the urg-ing of Black leaders. The big lure for Blackresidents was indoor plumbing.
The ResultThe segregation of African Americans
from the rest of the community resulted in asystem of social and economic problems.These problems are a direct result of section-ing off certain portions of the populationfrom the economic activity in the metropoli-tan area. Over 80 percent of the nation’s jobscreated since 1948 were located in the sub-urbs, especially those in manufacturing re-tail and wholesale, and certain service indus-tries. Nearly 71 percent of African Ameri-cans , however, live in central cities (Darden1988). Not only have African Americansbeen contained, the opportunities have dis-sipated for anything resembling a commu-nity norm of self-sufficiency.
ITSThe United States of America is a nation
that celebrates the private car. In 1996, then-Secretary of Transportation Federico Peñaannounced the Operation Timesaver initia-tive to the Transportation Research Board.This initiative’s goal is to reduce travel timefor U.S. commuters by at least 15 percent.
Former U. S. DOT Secretary Peña out-lined nine objectives for “Intelligent Trans-portation Infrastructure (ITI)”.1. The installation of smart traffic controlsystems will alleviate traffic congestion. Lex-ington, Kentucky’s computerized traffic sys-tem was able to reduce “stop-and-go traf-fic” by 40 percent.2. Freeway management systems will helpcommunities meter cars entering freewayramps and detect accidents. Minneapolishas used this system to increase freewayspeeds by 35 percent and reduced accidentsby one-quarter.3. Transit management systems will take ad-vantage of global positioning systems (GPS)capability to monitor the locations and move-ments of the nation’s 60,000 buses and ad-just transit schedules accordingly.4. Incident management programs canmonitor roads and detect accidents and otherroad hazards.5. Electronic toll collection will alleviate thetime spent at the nation’s toll booths.6. Electronic fare payment systems will in-crease those who ride public transit.7. Railroad crossing systems will be linkedwith other systems, such as emergency man-agement.8. Emergency service providers can beequipped with traffic signal control devices.9. Traveler information systems will providereal-time traffic information before hittingthe road or getting on the bus or train.
Most of these objectives do very little tohelp the inner city, and they are not designedto do so. Some of them, such as freewaymanagement systems that may ultimatelylead to real time congestion pricing, willprobably have a negative impact on the poor.The primary goal is to increase the motorvehicle capacity of the nation’s transporta-tion infrastructure. This policy has tradition-ally meant trouble for central and inner citycommunities, especially those inhabited byAfrican Americans, either intentionally or ac-cidentally.
Proponents of ITS promise that it willincrease capacity on the nation’s roads andhighways, yet they do not make specificmention of the goal of moving suburban resi-dents form from one suburb to another. Toimplement these improvements with out re-
Not only haveAfrican Americans
been contained,the opportunities
have dissipatedfor anything
resembling acommunity normof self-sufficiency.
101TECHNOLOGY, TRANSPORTATION, AND AFRICAN AMERICANS : NO INNOVATIONS IN POLICY DIRECTIVES ❐
gard to the need of central cities, particularlyinner cities, may have nearly irreversiblenegative consequences.
Motor Vehicle CapacityImprovement Policy (includingITS): Leaving Populations Behind
The consequences of assisting suburbanresidents’ ability to commute by car fromsuburb to suburb and bypass the central citywill be felt long term. Central cities, espe-cially those with large African-Americanpopulations, suffer from more than theirshare of unemployment. Linking other com-munities together that are the major employ-ment centers and leaving the inner city, ifnot the entire central city behind, can onlyexacerbate the problem.
Secretary Peña made specific note ofMinneapolis’ freeway management system.What he did not mention is that such suc-cesses carry their own burdens. Accordingto the Urban Coalition (1993) more than onethird of the households in the Twin Cities(Minneapolis-Saint Paul) metropolitan areado not own vehicles. They must rely on pub-lic transportation. Even if they can accessthe necessary transportation, one out of ev-ery nine African-American households in thearea does not have a telephone - let alone acomputer - so it is questionable as to whetherthey can access the available real-time infor-mation to effectively make transportationplans.
Spatial distance is an additional trans-portation-related barrier to improving theeconomic problems of the region. Unem-ployment increased dramatically for AfricanAmericans in the Twin Cities whether theylived in the central cities (Minneapolis orSaint Paul) or the suburbs between 1980 and1990. As a result, home ownership declinedfor African Americans by six percent by theclose of the last decade.
For years transportation was a problemin Los Angeles because it is a proliferationof loosely linked neighborhoods spreadacross a large area. It did not have a publictransportation system sufficient enough tomeet the needs of the residents that did nothave vehicles. As a result person whoneeded jobs had limited prospects if they did
not have access to private vehicles. Thisproblem only increased the despair of thosewho lived in neighborhoods such as Watts(Hashe 1990).
Opportunities for the unemployed tolook for work diminish the further away thispopulation resides from available jobs. Wil-son (1996)clearly demonstrates the spatialdistance problem in cities like Chicago.Many unemployed residents are frustratedwhen they spend portions of their limitedresources to travel long distances and spendsignificant sums of money looking for work.
The fact that these citizens are isolatedmeans that they live around and socializewith other unemployed people. They, there-fore, lack the informal networks necessaryto obtain gainful employment. The moneyspent answering classified advertisements ofpotential employers only to be turned downafter traveling to the interview is frustrat-ing. Employers often ill not hire potentialemployees who they believe do not have adependable way to get to work (Wilson1996).
The problem has a significant impact onyouth and their employment in the nation’scities. The differential in youth employmentbetween races, and to a lesser extent betweenthe different economic strata, can be directlyattributed to job access, in combination withother factors. The differential access is es-pecially problematic in cities like Philadel-phia. African American youth have a sig-nificant problem when automobile transpor-tation is not readily available. Also, “becausedifferences in the distance to jobs betweenyouths from low-and high-income familiestend to be small within the same racial group,job access plays only a modest role, at best,in explaining differences in youth unemploy-ment rates at different family income levels”(Ihlanfeldt 1992). In other words, spatial mis-match has an even greater impact if one isboth African-American and among the eco-nomically less fortunate.
Using information obtained from theAmerican Housing Survey, Gabriel andRosenthal (1996) suggest that housing dis-crimination plays a significant role in com-muting distances and times regardless of ageor education level. African-American work-ers with a high school education have 22 per-
African-Americanworkers with ahigh schooleducation have 22percent longercommute timesthan their whitecounterparts. Thistranslates into anaverage of 39additionalcommute hourseach year.
102 ❐ PROCEEDINGS OF SYMPOSIUM IV ON AFRICAN-AMERICAN MOBILITY ISSUES
cent longer commute times than their whitecounterparts. This translates into an aver-age of 39 additional commute hours eachyear.
Beyond CapacityLengthy commute times are more than
a mere inconvenience for African Americans.Gabriel and Rosenthal (1996) observe thatfamilies, as a whole in the United States, tendto relocate if they believe they areundercompensated for their employmentcommutes. African-American families, how-ever, are less likely to move despite continualundercompensation for their commutetimes. Furthermore, lengthy commute timescoupled with housing discrimination, trans-late into even less compensation than theyalready receive.
Consider, for example, a whiteworker and a minority worker withdifferent length commutes, but whowould otherwise earn the samewage and face equivalent localamenities and housing prices. As-sume the minority worker has thelonger commute. Then the minor-ity worker receives a less valuablecompensation package, where com-pensation comprises quality ad-justed housing prices, a basket ofneighborhood amenities, and com-mute times. (Gabriel and Rosenthal1996:63),
Effective transportation systems providealternatives other than increasing motor ve-hicle capacity to move suburban residentsfrom one suburb to another. This is a dis-criminatory goal because relocating is not anoption for many families. In addition, it frus-trates alternative transportation efforts suchas mass transit. Louderback (1997) makesspecial mention of Washington, D.C.’s met-ropolitan area that has a much-heraldedmass transit system designed to facilitate thecommute to and within the District.
The problem with the Washington Met-ropolitan Area Transit Authority (WMATA)is that it competes in an atmosphere of moreand more employers locating in the suburbs.
Therefore, commuters have an increasedneed to move from suburb to suburb, andnot from suburb to city. The Beltway is ex-periencing critical gridlock. The additionalfive million people that are expected to moveto the area by the year 2020 are expected tosettle in Washington’s Virginia and Mary-land suburbs. They will not be served wellby a transit system that distributes itself ra-dially from the nucleus of the central city.
As low skill jobs disappear, neither in-creased road capacity nor efficient mass tran-sit will be of particular concern to AfricanAmericans in the inner-city, many of whomare living in poverty. These low- and un-der-skilled Americans will have been leftbehind by both the transportation and theeconomic system. In short, even if they canbe transported to employers, they do nothave the skills necessary to participate in theInformation Age’s job market. Yet, theyshould not be blamed because it was thetransportation system that in combinationwith other factors, isolated them in the firstplace. In many places, it was designed to doso. Expenditures on ITS pour salt in thewound caused by transportation planningin this country. In addition to helping moreand more people bypass the nation’s centralcities and placing an unfair economic bur-den on the poor, technology is being em-ployed that the persons who are being leftbehind will have little chance of learning.
Carver (1994) documents then disparitybetween those who have access to the tech-nological education necessary to compete inthe Information Age. African Americans andother minorities comprise a significant por-tion of the “information-poor”, thus placingthem at a greater risk of failure. The Na-tional Commission on Excellence inEducation’s 1983 report, A Nation At Risk,sharply criticized the nation’s public schoolsystems for failing to educate “at-risk” stu-dents. As part of the remedy, the Commis-sion recommended that computer compe-tence be added to the three “R’s” - reading,writing, and arithmetic - as a fourth basicskill needed to be globally competitive. Nev-ertheless, African Americans are still tech-nologically behind even though computersare now found in 98 percent of all U.S.schools. However, African-American com-
As low skill jobsdisappear, neither
increased roadcapacity nor
efficient masstransit will be of
particular concernto African
Americans in theinner-city, many ofwhom are living in
poverty.
103TECHNOLOGY, TRANSPORTATION, AND AFRICAN AMERICANS : NO INNOVATIONS IN POLICY DIRECTIVES ❐
puter exposure often centers around reme-dial basic skills instruction or practice pro-grams used to teach basic skills. This situa-tion is particularly true for African-Ameri-can males.
The most telling information about thisdisparity comes from the National Center forEducation Statistics (1995). Using statisticscompiled by the U.S. Census Bureau, theCenter determined that 74.9 percent of whitestudents used computers in 1993; however,only 56.6 percent of Black children and 57.8percent of Hispanic children used them. 69.7percent of all children used computers inschool. Thus African-American and His-panic children were exposed to computersat a rate nearly 18 percent less than theirwhite peers. Even more alarming is the factthat 24.1 percent of all children had comput-ers at home in 1993, with 30.5 percent ofwhites had such an opportunity. Only 8.7percent of all black children and 7.1 percentof Hispanic children had such an opportu-nity. Given such statistics, one must ask whowill be eligible to participate in the globaleconomy, or simply to get the jobs that areavailable in the suburbs.
It is doubtful that the African-Americanpopulation will benefit from ITS because ofisolation, vehicle ownership disparity, anda lack of technological knowledge. The keywill not be to make African Americans moremobile, but to bring them into the informa-tion age. African Americans should insistthat ITS installation in metropolitan areasalso include programs for computer educa-tion of the disadvantaged citizenry. Invest-ments in the capacity of Americans are atleast as important as the capacity of Ameri-can highways.
REFERENCES
Bayor, Ronald H.1988 Roads to Racial Segregation: Atlanta
in the Twentieth Century, Journal of Ur-ban History 15(1), pp. 3 -2 1. November.
Byrum, Oliver1992 Old Problems in New Times: Urban
Strategies for the 1990’s. Chicago: Plan-ners Press.
Carver, Bernard A.
1994 Defining the Context of Early ComputerLearning for African-American Males inUrban Elementary Schools, Journal ofNegro Education, 63(4) pp. 532-538.
Darden, Joseph T.1988 Blacks and Other Racial Minorities:
The Significance of Inequality, preparedas a Working Paper for the Institute ofSocial Science Research, University ofCalifornia at Los Angeles, 4(3).
Gabriel, Stuart A., and Rosenthal, Stuart S.1996 Commutes, Neighborhood Effects,
and Earnings: An Analysis of Racial Dis-crimination and Compensating Differ-entials, Journal of Urban Economics,40(1), pp. 61-83. July.
Hashe, Janis1990A Tale of Two Cities: Los Angeles 2000:
Can the Dream be Realized?, Crisis,98(5). pp. 22-23. May.
Hirsch, Arnold R.1993 With or Without Jim Crow, Black
Residential Segregation in the UnitedStates, In Urban Policy in Twentieth Cen-tury America, Hirsch, Arnold R. andRaymond A. Mohl, eds. NewBrunswick, NJ: Rutgers UniversityPress.
Ihlanfeldt, Keith R.1992 Job Accessibility and the Employ-
ment and School Enrollment of Teenag-ers. Kalamazoo, MI: W.E. Upjohn Insti-tute for Employment Research.
Louderback, Joseph1997 Suburban Shift Stymies D.C. Tran-
sit. Journal of Mass Transit, pp. 44-45.January/February.
Massey, Douglas S. and Nancy A. Denton1993 American Apartheid: Segregation
and the Making of the Underclass. Cam-bridge, MA: Harvard University Press.
Mohl, Raymond A.1993a Race and Space in the Modern City:
Interstate-95 and the Black Communityin Miami. In Urban Policy in TwentiethCentury America. Hirsch, Arnold R. andRaymond A. Mohl, eds. NewBrunswick, NJ: Rutgers UniversityPress.
The key will not beto make AfricanAmericans moremobile, but tobring them intothe informationage.
104 ❐ PROCEEDINGS OF SYMPOSIUM IV ON AFRICAN-AMERICAN MOBILITY ISSUES
1993b Shifting Patterns of Urban Policysince 1900. In Urban Policy in Twenti-eth Century America. Hirsch, ArnoldR. and Raymond A. Mohl, eds. NewBrunswick, NJ: Rutgers UniversityPress.
Miller, Ross1996 Here’s the Deal: The Buying and Sell-
ing of a Great American City. New York:Alfred A Knopf Press.
Peña, Federico F.1996 Intelligent Transportation Infra-
structure: A National Goal. GovernmentFinance Review, pp. 44-45.
Urban Coalition1993 Profiles of Change: Communities of
Color in the Twin Cities Area. SaintPaul, MN: The Coalition.
U.S. Department of Education1995 Student Use of Computers. Indica-
tor of the Month. Washington, D.C. Na-tional Center for Education Statistics.
105BROWARD COUNTY MINIBUS DEMONSTRATION PROJECT ❐
Broward County Minibus Demonstration ProjectBroward County Minibus Demonstration Project
Fabian CevallosBroward County Mass Transit
This paper attempts to serve as a model for theselection of minority transportation providers. Itdescribes how an African American company wasselected as Transportation Provider in BrowardCounty, based on recommendations from a cor-ridor study and a selection committee. This isan innovative way of attracting minority ownedcompanies into doing business with the countyas well as other government transit agencies. Thepaper suggests linking population compositionwith contracting procedures as a means forachieving equality. Court rulings against Dis-advantaged Business Enterprise (DBE) pro-grams, in detriment to minority contractors, arealso addressed. Finally, recommendations aremade on how contracts should be handled to guar-antee equal participation of minority groups. Theexperience obtained from the minibus project willprovide the necessary tools to make intelligentand fair decisions in future negotiations, for thebenefit of minority groups, transit agencies, andthe entire community.
Background
In 1989, Barton-Aschman Associates,Inc., under contract with BrowardCounty, conducted a multimodal
study along the Broward Boulevard Corri-dor. The main purpose of this study was toidentify ways to maximize the corridors’people canying capacity using innovativetransportation alternatives. The recommen-dations included traffic control measures,roadway improvements, and enhanced pub-lic transportation.
Expected results from this project weretwofold: increased transportation servicesto/from Central Business Districts (CBDs),major employment destinations, major at-
tractions, and reverse commute locations;and to compete more efficiently with theprivate automobile.
Based on the consultant’s recommenda-tions, Broward County decided that commu-nity minibuses operating on Broward Bou-levard could be one part of the solution toincreasing traffic congestion along the corri-dor. In addition, this project would providegreater opportunities for public/privatepartnerships and encourage participation oflocal Small Disadvantaged Business Enter-prises (SDBEs). The minibus project would(along with existing line haul service) addlocal circulator transit service through sev-eral predominantly African-Americanneighborhoods within the Broward Boule-vard corridor.
Broward County StatisticsIn order to understand the complex is-
sues revolving around the minibus project,it seems appropriate to present pertinent sta-tistical information about Broward County’spopulation and the users of its transit sys-tem. The population of Broward County, ac-cording to the 1994 estimate of the U.S. Cen-sus Bureau, was 1,382,990. Whites accountfor 81.32percent, African Americans16.73percent, American Indians 0.24percent,and Asians 1.71percent. Hispanics comprise8.64 percent of the total Broward Countypopulation. Thus, the combined populationof these minority groups represent a signifi-cant part (almost 27percent) of the totalpopulation in the county.
In 1992, an onboard passenger surveywas performed by Dr. Jay Mendelof FloridaAtlantic University. This study clearly
106 ❐ PROCEEDINGS OF SYMPOSIUM IV ON AFRICAN-AMERICAN MOBILITY ISSUES
showed that minorities depend on BrowardCounty Transit (BCt) System for Transpor-tation to work school, medical, shopping,and recreation facilities. It may be arguedthat the “propensity” to ride transit has noth-ing to do with race, but with low income lev-els, proximity to transit routes, and no othermeans of transportation. Yet, at this pointin time, the socio-economic status of mostAfrican Americans in Broward County ex-ceed all the above criteria. Nevertheless,minorities, particularly African Americansare, without a doubt, an essential element ofthe transit system.
Equal OpportunityIn 1984, Broward County enacted a
Small Disadvantaged Business Enterprise(SDBE) program which was fully imple-mented in 1985. The main purpose of thisprogram was to enhance the County’s con-tracting efforts with small minority andwomen owned businesses. The initial goalwas set at 15percent for minority- and 5per-cent for women-owned companies.
In 1993, Broward County Ordinance No.93-17 became effective. This ordinance pro-vides specific guidelines to ensure full andequitable participation of SDBEs. It gives thedirector of the Office of Equal Opportunity(OEO) the responsibility of monitoringCounty contracts to ensure that reasonableefforts are made to eliminate or remedy dis-crimination on the basis of race, ethnicity, orgender as well as to encourage and fosterparticipation of SDBEs in the procurementprocess.
The most important remedial measuresare: a set aside program, contract goals forSmall Disadvantaged Business Enterprises,a targeted market program, a bid preferenceprogram, a bid credit program, and an eco-nomic development program.
In order to know if discrimination toSDBEs has occurred, it must be determinedwhether there is a disparity between the per-centage of qualified businesses in the appro-priate market and the actual participation ofthe SDBE.If there are qualified businesses inthe appropriate market, and participation issignificantly smaller than their share of themarket, then it can be determined that SDBEsare being discriminated against.
In September 1993, the Office of EqualOpportunity prepared a Transportation Dis-parity Study for Broward County. Theproject was funded by the Federal TransitAdministration. The purpose of this projectwas to identify disparity and describe exist-ing transportation related industries withinthe market area. Results from this disparitystudy are expected to facilitate the creationand growth of transportation businesses.
Construction, Services, and Transporta-tion were the different categories used in thestudy. The percentage of minority utiliza-tion for fiscal years 1900 through 1993 wasextremely low. Among minority groups, Af-rican American contractors were the leastutilized. African-Americans comprised lessthan one-half percent of the transportationproviders of services and supplies in thearea.
Selection CommitteeThe Broward County Board of County
Commissioners appointed a selection/nego-tiation committee to identify the most quali-fied providers and to negotiate a contract.The selection committee included two mem-bers from the Broward County Board ofCounty Commissioners, the Director of MassTransit (who served as chair), the Directorof Strategic Planning and Growth Manage-ment, and the Director of the Office of EqualOpportunity. Based on the information pro-vided in the Disparity Study, the selectioncommittee decided that the minibus demon-stration project should be “Set Aside” forAfrican-American transportation serviceproviders.
Selection criteria included previous ex-perience, training, maintenance, personnel,and years in business. A Request for Lettersof Interest (RLI) was used to solicit qualifiedproposers and seven responses were re-ceived. Transportation Suppliers, Inc. waschosen as the company to provide this newservice.
The Minibus ProjectOn March 17, 1997, Broward County
Transit (BCt) began a new demand-responseminibus service called the Broward UrbanShuttle or BUS. This is a very innovative,
The mainpurpose of this
program was toenhance the
County’scontracting efforts
with smallminority and
women ownedbusinesses.
107BROWARD COUNTY MINIBUS DEMONSTRATION PROJECT ❐
first-of-its-kind demonstration project. It isthe first time Broward County has contractedan African-American Transportation serviceprovider and the first time that demand-re-sponse service has been provided in a spe-cific geographic area. The BUS service areaincorporates origins and destinations wheretransportation improvements are needed byproviding access to family service provid-ers, shopping centers, medical facilities,intermodal connections to a commuter train(Tri-Rail), a Park and Ride facility, and ex-isting BCt fixed routes. Funding for thisproject comes from the Florida Departmentof Transportation (FDOT), using a mix ofCMAQ and Corridor funds for a two-yearperiod.
Besides providing mid-day demand-re-sponse service, the minibus operates undera different name during the morning andevening “rush hours.” At those times, theservice is called the “Western Express.” Itbrings inner city workers to potential job op-portunities in the rapidly growing commu-nities of Weston and Pembroke Pines. Theservice also gives Weston and PembrokePines residents an alternative to the automo-bile and more relaxed way to commute todowntown Fort Lauderdale. Between com-muter runs, the minibus or “Broward UrbanShuttle” operates as an on-demand servicefor trips within the Broward Boulevard cor-ridor.
At the ribbon-cutting ceremony onMarch 17, the minibus service officiallystarted. The general consensus is that theproject was eagerly anticipated and well re-ceived by the community (since it took al-most two years for funding approval). BCtofficials are enthusiastic about the successof this project. The Planning section willcontinue to provide support to this new ser-vice for the benefit of the communitiesserved. The service will be monitored fre-quently to identify any needed areas of im-provement. Initially, the service is free, how-ever changes in hours of operation and faresare expected to occur as users define the ser-vice better and the new ridership base is es-tablished.
ConclusionsThe Broward Boulevard Corridor Study
recommends that traffic control, geometricdesign, and public transportation be im-proved to increase the people carrying ca-pacity along the corridor. Demographicsshow that minorities account for a signifi-cant segment of the population. The FAUonboard survey identified minority groupsas major users of Broward County Transit.Furthermore, the likelihood of AfricanAmericans to ride transit is higher than otherminority ethnic groups.
According to the Transportation Dispar-ity Study, minority transportation providersare still underutilized. Broward County iskeenly aware of past discrimination practiceto minority contractors and is committed tosolving this problem by offering remedial al-ternatives. The Office Equal Opportunity,as authorized by the County Administratorand the Board of County Commissioners,monitors contracts with minority businessesand advises the parties involved if a discrimi-nation case has occurred. In addition, theOEO has goals that must be met as far asSmall Disadvantaged Business Enterprisesare concerned. This helps guaranty equalparticipation of minority groups in the con-tracting process. In an attempt to correct pastinequities, ordinance 93-17 was enacted,opening new doors for minority businesses.
Based on recommendations from theBroward Boulevard Corridor Study and theTransportation Disparity Study, BrowardCounty decided that a community minibuswas a viable alternative to increase mobilitywithin the corridor. It further identified thisproject as a “Set Aside” for African Ameri-cans.
In the long run, the way contracts arehandled with SDBEs will surely change. Infact, recent court decisions against SDBE pro-grams and the possibility of law suits inBroward County, have forced county offi-cials to suspend “set aside” programs. It isargued that these types of programs violatethe Constitution on the basis of race. Ac-cordingly, ordinance 93-17 is expected to berevised and set asides might be eliminated,to the detriment of Small Minority Disadvan-taged Business Enterprises.
In the long run,the way contractsare handled withSDBEs will surelychange.
108 ❐ PROCEEDINGS OF SYMPOSIUM IV ON AFRICAN-AMERICAN MOBILITY ISSUES
RecommendationsDisparity studies are necessary to deter-
mine if discrimination exists and to findways to remedy the problem. They shouldbe included in the selection process andserve as a guideline to ensure that minoritygroups have an equal opportunity to partici-pate in public/private partnerships. Up-dates of the Disparity Study should be doneat least every two years to assess loss/gainin minority utilization. Demographic infor-mation, such as population by ethnic groups,must be included in the Disparity Studies inorder to get a view of the “whole picture.”Additionally, transit ridership by ethnicityshould be included in all Transportation Dis-parity Studies.
Minority groups through special “out-reach” programs need to be informed aboutways they can do business with the county.Workshops should be organized at strategiclocations such as neighborhood associations,churches, social clubs, schools, etc. Easy ac-cess to information pertaining to contract-ing and procurement procedures should bemade available. There is a need to increasethe market share of minorities to the point
where their utilization percentage is at orclose to the percentage of the minority popu-lation.
Under the leadership of the federal gov-ernment, stronger affirmative action mecha-nisms need to be implemented and enforcedto make sure that SDBE goals are reached.Contracts should be monitored frequently toassure proper implementation of the SDBEprogram. Minorities and women should beincluded in all aspects of the contracting pro-cess
The minibus project is just the initial stepto transportation contracting with minority-owned business firms. There is still a longway to go to achieve equality in utilizingtransit providers. We now know what worksand what coos not. BCt with the coopera-tion of the Office of Equal Opportunity willcontinue to monitor and advise the partiesinvolved of any inconsistency in contractingand procurement procedures. The strugglefor equality continues. As a society that val-ues its diversity, we in the transit industrymust lead by example and demonstrate ourcommitment to end discrimination in theway we do business. Our future successdepends on it.
As a society thatvalues its diversity,
we in the transitindustry must lead
by example anddemonstrate ourcommitment to
end discriminationin the way we do
business.
109BROWARD COUNTY MINIBUS DEMONSTRATION PROJECT ❐
First Report from the Field on the Bridges to WorkFirst Report from the Field on the Bridges to WorkDemonstrationDemonstration
Richard PreshaPublic/Private Ventures
In the early 1990s, Public/Private Ventures began to examine the increasein inner-city joblessness and the
growing “suburbanization” of employmentthat had occurred in many major metropoli-tan areas of the United States over the lastthree decades. Our investigation showedthat, in six of the nation’s eight largest met-ropolitan regions, more than two-thirds ofthe jobs created during the 1980s were lo-cated in the suburbs; at the same time, in-ner-city poverty rates had become from twoto five times higher than those in the sub-urbs of those regions.
The results of our examination interestedus particularly because they highlight aproblem we see often in the employment andtraining field: graduates of city-based jobtraining programs doomed to unemploy-ment, regardless of their training, partly be-cause they have no access to the suburbanjob market where “good” entry-level jobsoften abound. Further investigation identi-fied three barriers to this access.
First, the administrative, or information,barrier keeps the inner-city job-seeker fromjobs in the suburbs. City-based job trainingprograms typically have city-wide ratherthan metropolitan-wide jurisdictions, whichmeans that they cannot place program par-ticipants into suburban jobs and often haveno information about suburban job openings.Second, the physical, or transportation, bar-rier, limits access. Even if program gradu-ates obtain suburban jobs, they may be un-able to get “from here to there.” They maynot have reliable automobiles and, for themost part, public transit supports suburb-to-city commuters, not those going the otherway. Finally, the lack of supports like diver-
sity training, counseling and child care lim-its access. Many workers, of course, needsupports regardless of economic status.However, such supports are critical to low-income workers trying to make the transi-tion to self-sufficiency and keep a job thatrequires a relatively lengthy commute to aplace where unfamiliarity, even resistance,may confront them.
In 1993, with the support of a consor-tium of private fenders, the Department ofHousing and Urban Development and theFederal Transit Administration, P/PV beganto plan Bridges to Work, a research demon-stration designed to test the idea that im-proved access to jobs can significantly im-prove outcomes for low-income workers andtheir neighborhoods. The elements of theBridges to Work model are designed to ad-dress each of the three barriers. Bridges’ ele-ments are:1. A metropolitan-wide placement mecha-nism to connect residents of inner-city neigh-borhoods to suburban job openings;2. A targeted commute to allow residents toreach those suburban destinations; and3. Limited support services delivered onlyto mitigate problems created or exacerbatedby the daily commute to new, distant job lo-cations.
In the spring of 1996, five sites—Balti-more, Chicago, Denver, Milwaukee and St.Louis-were selected to implement the modelbased on their demonstrated capacity tobuild, manage and sustain these complexnew collaboratives. These sites began fourfull years of project operations in late 1996.
A key goal of the demonstration is togenerate information for policymakers, theemployment field and the transportation
110 ❐ PROCEEDINGS OF SYMPOSIUM IV ON AFRICAN-AMERICAN MOBILITY ISSUES
field about Bridges’ “mobility’” approach,which focuses on the realities of current met-ropolitan settlement patterns and the de-mands of the labor market. Because Bridgesto Work is a research demonstration with arigorous evaluation design, we expect to beable to provide critical information about thisstrategy’s impact on the lives of participantsand on the capacity of funding streams torespond to the structure and requirementsof this important policy initiative.
Although the pilots have just begun atthe five sites and full-fledged research andoperations will not begin until late spring1997, we have already observed some op-erations lessons and challenges emerge fromthe implementation of what looks like asimple solution to the problem of spatialmismatch. We have begun to document andwish to share some of these issues and chal-lenges because they go to the heart of twobig questions about the Bridges to-Work ap-proach: does it work, and what does it taketo make it work?
What is Bridges to Work?Bridges to Work (BtW), a research dem-
onstration project, will operate for four yearsin Baltimore, Chicago, Denver, Milwaukeeand St. Louis. BtW is administered jointly byPublic/Private Ventures (P/PV), a Philadel-phia-based nonprofit research and programdevelopment organization, and the U.S. De-partment of Housing and Urban Develop-ment (HUD). The initiative connects inner-city residents with suburban employmentopportunities through local partners whowill provide job placement, transportationand support services. The project will assistlower income, innercity residents to becomeself-sufficient and will strengthen regionaleconomies by providing workers for grow-ing suburban businesses.
How did the idea for BtWoriginate?
With foundation funding, P/PV exam-ined the increase in inner-city unemploy-ment and the growing “suburbanization” ofemployment over three decades within 20metropolitan areas. P/PV found a severe
problem of spatial mismatch between poorhouseholds concentrated in large cities andthe increasing number of employers locatedin the surrounding suburbs.
In 1990, inner-city poverty rates werefrom two to five times higher than those inthe suburbs of the Nation’s eight largest met-ropolitan areas. In five of the eight areas,innercity unemployment rates were twicethose of the suburbs.
In six of the eight largest metropolitanareas, more than two-thirds of the jobs cre-ated during the 1980s were located in thesuburbs. In three of these areas (Chicago,Detroit, and Philadelphia) all net growth wasin the suburbs.
Building on this research, and with ad-ditional support from HUD and the U.S. De-partment of Transportation (DOT), PIPV de-veloped BtW as a research demonstration tolink poor but job-ready inner-city residentswith suburban jobs. The BtW program willexamine how unemployed and underem-ployed inner-city residents and suburbanemployers seeking qualified workers maybenefit from this linkage.
What do we expect BtW toachieve?
BtW has four goals that complementother important urban policy strategies.Low-income city residents will gain accessto unsubsidized, private-sector jobs enablingthem to become self sufficient and to importwages back into their city neighborhoods,thus helping to stabilize the neighborhoods.Suburban employers will recruit inner-cityworkers. Regional transportation providerswit! recognize the demand for city-to-sub-urb commutes and be willing to initiate newservice to support this “reverse commuting.”Federal, state and local policymakers willteam the value of designing social policy ata metropolitan-wide scale and incorporatethese lessons into their planning for pro-grams in housing assistance, employmenttraining and placement, transportation, sup-port services, and land use.
Public/PrivateVentures found
a severeproblem of
spatialmismatch
between poorhouseholds
concentrated inlarge cities andthe increasing
number ofemployers
located in thesurrounding
suburbs.
111BROWARD COUNTY MINIBUS DEMONSTRATION PROJECT ❐
What are the components of a BtWprogram?
Each BtW site has a defined geographic“origin” (a lowincome, inner-city neighbor-hood) and “destination” (a job-rich suburb).Job-ready origin residents will receive en-hanced program services provided throughBtW’s three key program elements:• placement in existing, private suburbanjobs through a metropolitan employmentplacement mechanism;• a targeted commute connecting workersto otherwise inaccessible suburban job loca-tions; and• support services, such as counseling andchild care, to ensure that workers can sus-tain newly-made job connections and to miti-gate demands created by the suburban com-mute.
The BtW model also requires each siteto form regional partnerships calledcollaboratives, which typically include a leadcommunity-based organization, transporta-tion provider, nonprofit service providers, ametropolitan planning organization (MPO),and city and suburban government.
How were the BtW project sitesselected?
From its research of the Nation’s 20 larg-est metropolitan areas, P/PV identified 10that demonstrated both significant spatialmismatch and the local capacity to reducethe mismatch. With support from five foun-dations, HUD and DOT, P/PV gave smallplanning grants to these 10 target sites to de-velop local BtW plans. Using standard se-lection criteria, P/PV and HUD chose thefive strongest plans for inclusion in the re-search demonstration project.
What is the demonstrationtimeframe?
BtW’s four-year research and demon-stration phase is scheduled to begin in lateFall with a 3- to month pilot phase. Fullimplementation will begin between Januaryand March 1997 at all sites and will concludein December 2000.
Who funds BtW and how muchdoes it cost?
BtW is funded by private foundations,the Federal government and local resources.Pre-demonstration costs included supportfor: the spatial mismatch studies $300,000provided by The Ford Foundation and theJohn D. & Catherine T. MacArthur Founda-tion and the design of the BtW concept andthe development of 10 BtW site plans--$1,500,000 from the Ford Foundation, TheAnnie E. Casey Foundation, John D. &Catherine T. MacArthur Foundation, ThePew Charitable Trusts and The RockefellerFoundation; HUD; and DOT/FTA. Demon-stration costs include support for: five dem-onstration programs–$11 million over 4years, $8 million from HUD and $3 millionin local matches; and research and develop-ment- -$5.9 million from the Ford Founda-tion, HUD Office of Policy Development andResearch, and the Rockefeller Foundation(with support pending from the MacArthurFoundation).
What methodology will guide theproject research?
The key component of the research planis an experimental design that will allow arigorous evaluation of BtW’s impact on par-ticipants and to document the potential ofregional partnerships and job placementmechanisms.
A competitively selected, independentresearch firm will randomly assign 800 par-ticipants at each of the four BtW sites intotreatment and control groups and will con-duct baseline and followup surveys. Thesefour experimental sites-Baltimore, Denver,Milwaukee, and St. Louis-will each placeand maintain 400 people from the treatmentgroup who will receive BtW enhanced ser-vices and 400 from the control group whowill rely on existing services. Chicago, thesole “scale” BtW site, will attempt to place1,500 workers without random assignmentand will document issues and challenges in-volved in attempting to place as many per-sons as possible using enhanced BtW ser-vices.
Federal, state andlocal policymakerswill team the valueof designing socialpolicy at ametropolitan-widescale andincorporate theselessons into theirplanning forprograms inhousingassistance,employmenttraining andplacement,transportation,support services,and land use.
112 ❐ PROCEEDINGS OF SYMPOSIUM IV ON AFRICAN-AMERICAN MOBILITY ISSUES
Is BtW related to other Federal,State and local job initiatives?
In addition to building on local pro-grams supported under other federal or stateinitiatives, BtW has brought together unprec-edented partnerships among city and sub-urban Service Delivery Areas and Private In-dustry Councils that administer the lobTraining Partnership Act (May), state andlocal human service providers, and regionaltransportation providers. The Baltimore andChicago BtW pro. grams are linked directlyto HUD’s Empowerment Zone initiative, andthe St. Louis program is involved in Enter-prise Community activities. BtW is one ofthree complementary national strategies de-veloped by HUD to offer low-income resi-dents opportunities for independence and
self-sufficiency. The other strategies are:Community Revitalization, the expansion ofjobs and employment in economically dis-tressed areas such as Empowerment Zonesand Enterprise Communities, and Movingto Opportunity (MTO), relocation opportu-nities for poor persons receiving Federalhousing assistance to move into safer com-munities with better schools and jobs.
Other Federal jobs initiatives will play arole in BtW. These include the JTPA One-Stop Service Centers and HUD’s lobsPlusInitiative for public housing residents.
How can I learn more about BtW?For information about Bridges to Work,
contact Beth Palubinsky or Joseph Tierney,the project’s . Co-Directors at P/PV, at(215)557-4400. You may also read about theproject on the Internet at www.epn.org/ppv.
113FUTURE RESEARCH NEEDS AND POLICY IMPLICATIONS ❐
Future Research Needs and Policy ImplicationsFuture Research Needs and Policy Implications
Ronald L. BarnesConference of Minority TransportationOfficials (COMTO) andGreater Cleveland Regional TransitAuthority
Speaking on behalf of COMTO, Barnesencouraged a holistic approach to provid-ing resources. He also expressed concernthat future forums not focus solely on wel-fare reform. Participants were encouragedto invest in young people.
Policy must be broad-based, interna-tional or geopolitical, intermodal, and inno-vative. Intelligent Transportation Systems(ITS) also must be factored into policy. Con-sideration must be given to its impact on Af-rican-Americans. Efforts also should bemade to increase information technologyand access. Barnes challenged participantsto take information from the symposium tocommunities where the information wasneeded.
Alyce Boyd-StewartOffice of the SecretaryU. S. Department of Transportation
Critical issues to be considered in Na-tional Economic Crossroads TransportationEfficiency Act (NEXTEA), now, Transporta-tion Equity Act for the 21st Century (TEA-21), will include equal access and equal de-livery as applies to all citizens and all modes.Also, efforts should be made to improve theunderrepresentation of women indecisionmaking positions.
Questions to be resolved includeNEXTEA’s flexibility in the use of funds; thecontinuation of ISTEA programs; and a bet-ter understanding of the merits of research.
ITS: what can it do to us? ITS is a two-edged sword, stated Boyd-Stewart. Answersneed to be sought from ITS proponents. The
deployment of ITS is a policy issue that mustbe fully considered.
Civil rights have been isolated. Boyd-Steward asked attendees to recognize thatthe struggle continues. There is continuedneed to work toward African-Americanmobility.
Gwendolyn R. CooperFederal Transit AdministrationU. S. Department of Transportation
Cooper stated that there is an increasein African-American involvement in re-search, increasing the professional capacityof transportation research. She encouragedparticipants to become involved in the Tran-sit Cooperative Research Program (TCRP),as researchers or panelists and to submit re-search ideas. Participants also were encour-aged to become involved in the InternationalTransit Program.
Gloria JeffFederal Highway AdministrationU. S. Department of Transportation
In regard to ITS, Jeff stated it is too lateto stop the train. Efforts should be focusedon shaping how ITS is used.
The focus of research needs to be refined.One area was data. Better data is neededregarding race and gender. This will helpprofessionals understand travel patterns. Abetter understanding is needed of where,when, why, who, and how people travel. Abetter understanding is needed of the travelneeds of persons under 16 years of age andover 60 years of age.
The social and cultural impacts of trans-portation actions and decisions also need tobe researched. These actions and decisions
114 ❐ PROCEEDINGS OF SYMPOSIUM IV ON AFRICAN-AMERICAN MOBILITY ISSUES
do have sociocultural effects and can be seenin residential and other location patterns.
There are unanswered research ques-tions with policy implications regarding ve-hicle ownership; longevity and age; house-hold composition; faith-based organizations;and livability of communities. Jeff chal-lenged the research community to changeresearch methodologies, involving thepeople studied in the research as more thansubjects. More work, she thought, wasneeded on public participation models andthe dissemination of “best practices” docu-ments.
Ilene PayneNational Highway InstituteFederal Highway AdministrationU. S. Department of Transportation
An important factor is transportationeducation. The Garrett A. Morgan Programhas been established in U. S. DOT for fund-ing the education needs of one million chil-
dren. More emphasis still is needed on theeducational and employment need of stu-dents. Payne advised attendees to pay moreattention to research being done at majorityinstitutions, evaluating the validity of find-ings and representation of the researchers.She also advised participants to monitor fed-eral funding for research and to monitor theissues researched.
Sharon Ransome-SmithProject ACTION
Smith admonished attendees for thepoor attendance at ADA workshop. Shepointed out that 6.2 million (one in five) Af-rican-Americans have disabilities. The trans-portation needs of persons with disabilitiesis an area that needs much more research.More participation by African-Americancommunity also is needed in the process ofresearch and support for persons with dis-abilities.
115EVALUATION SUMMARY ❐
Evaluation SummaryEvaluation Summary
Number of surveys mailed: 262
Number of surveys received: 36
Response rate: 14 percent
What respondents hoped to gain:
❐ I had hoped to see and mingle withpeople of color who are pursuing a career intransit.
❐ Learn about issues relating to topic.
❐ An idea of what issues are of interest atthe symposium.
❐ I wanted to achieve an improved under-standing that public transit is more thanriding a bus.
❐ New ideas for services in African-Ameri-can communities...also to network.
❐ Learn more about the means of transpor-tation available to minorities.
❐ It was my hope that the symposiumwould highlight key mobility issues facingthe African-American community and iden-tify recommendations.
❐ Knowledge concerning the transporta-tion issues and concerns of minorities andhow to improve conditions under which mi-norities travel every day.
❐ Meet with others of various backgroundswith similar interests to bring attention for
action to transportation needs of AfricanAmericans.
❐ Learn and to share information on strat-egies for labor mobility.
❐ Knowledge about transportation issuesaffecting blacks.
❐ Insight into areas of transportation that Iam unaware of; Educated on transportationissues and how these impact African-Ameri-can community.
❐ Efforts toward improving participationof African Americans, minorities, and disad-vantaged groups in the transit industry.
❐ Better understanding of environmentaljustice requirements.
❐ How transportation and communitiesaffect each other.
❐ I had hoped to meet people from varioustransportation backgrounds.
❐ Specific transportation information re-garding African-American travel demands,needs, and participation in the transporta-tion field.
❐ I hoped to gain a better handle on thetransportation industry and how extensivethe role of African Americans was in trans-portation.
❐ Get useful feedback for my work, learnothers’ work.
❐ Better understanding of ISTEA.
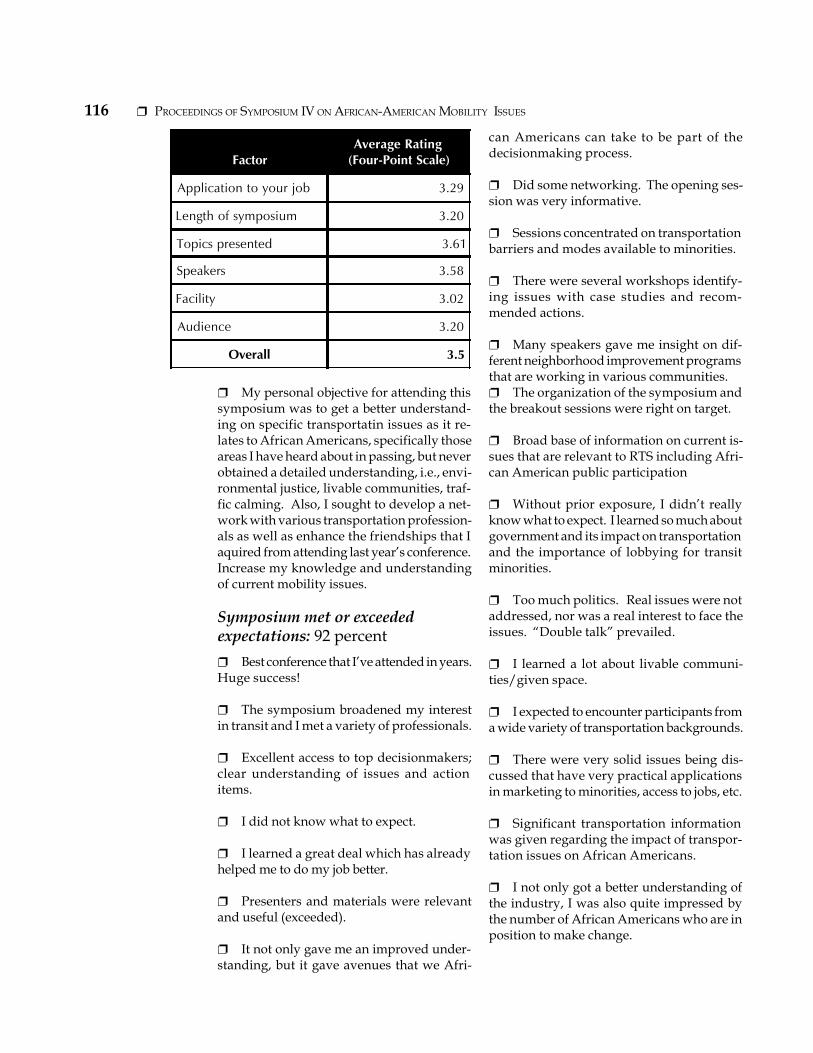
116 ❐ PROCEEDINGS OF SYMPOSIUM IV ON AFRICAN-AMERICAN MOBILITY ISSUES
❐ My personal objective for attending thissymposium was to get a better understand-ing on specific transportatin issues as it re-lates to African Americans, specifically thoseareas I have heard about in passing, but neverobtained a detailed understanding, i.e., envi-ronmental justice, livable communities, traf-fic calming. Also, I sought to develop a net-work with various transportation profession-als as well as enhance the friendships that Iaquired from attending last year’s conference.Increase my knowledge and understandingof current mobility issues.
Symposium met or exceededexpectations: 92 percent❐ Best conference that I’ve attended in years.Huge success!
❐ The symposium broadened my interestin transit and I met a variety of professionals.
❐ Excellent access to top decisionmakers;clear understanding of issues and actionitems.
❐ I did not know what to expect.
❐ I learned a great deal which has alreadyhelped me to do my job better.
❐ Presenters and materials were relevantand useful (exceeded).
❐ It not only gave me an improved under-standing, but it gave avenues that we Afri-
can Americans can take to be part of thedecisionmaking process.
❐ Did some networking. The opening ses-sion was very informative.
❐ Sessions concentrated on transportationbarriers and modes available to minorities.
❐ There were several workshops identify-ing issues with case studies and recom-mended actions.
❐ Many speakers gave me insight on dif-ferent neighborhood improvement programsthat are working in various communities.❐ The organization of the symposium andthe breakout sessions were right on target.
❐ Broad base of information on current is-sues that are relevant to RTS including Afri-can American public participation
❐ Without prior exposure, I didn’t reallyknow what to expect. I learned so much aboutgovernment and its impact on transportationand the importance of lobbying for transitminorities.
❐ Too much politics. Real issues were notaddressed, nor was a real interest to face theissues. “Double talk” prevailed.
❐ I learned a lot about livable communi-ties/given space.
❐ I expected to encounter participants froma wide variety of transportation backgrounds.
❐ There were very solid issues being dis-cussed that have very practical applicationsin marketing to minorities, access to jobs, etc.
❐ Significant transportation informationwas given regarding the impact of transpor-tation issues on African Americans.
❐ I not only got a better understanding ofthe industry, I was also quite impressed bythe number of African Americans who are inposition to make change.
FactorAverage Rating
(Four-Point Scale)
Application to your job 3.29
Length of symposium 3.20
Topics presented 3.61
Speakers 3.58
Facility 3.02
Audience 3.20
Overall 3.5
117EVALUATION SUMMARY ❐
❐ I expected to learn more about what wasgoing on at the federal level and I did.
❐ Gained new ideas for the implementa-tion of our projects and knowledge of pend-ing legislation.
❐ I accomplished my goals and objectivesand look forward to attending and recruiting
others for the 1998 African American Mobil-ity Issues Symposium.
❐ My initial and overall expectations weremet.
❐ I was only there for one pre-conferencesession where I was presenter.❐ It had a variety of workshops covering arange of issues.

118 ❐ PROCEEDINGS OF SYMPOSIUM IV ON AFRICAN-AMERICAN MOBILITY ISSUES
119AFTERWORD ❐
AfterwordAfterword
In March 1994, the Center for UrbanTransportation Research convened its firstsymposium on African-American mobilityissues. Since then, the Center for Urban Trans-portation Research convened a total of foursuch symposia attended by transportationoperators and providers, policymakers, inter-est group representatives, and federal, state,and local transportation officials from theUnited States and the Caribbean. Over thefour-year period, the attendance and othersupport for the symposium grew, steadily,providing evidence of continued interest andneed in this area of research. Federal sup-port for the symposium was provided by theFederal Highway, Federal Transit, and Re-search and Special Projects Administrations.The 1997 symposium featured Mark AlanHughes, Ph. D., as the keynote speaker.
The 1997 symposium and other activi-ties, including the African American Mobil-ity Issues World Wide Website, served as avehicle to distribute the findings of the previ-ous symposia and contributed to the reau-thorization process. In addition, the sympo-sia and other research projects conducted by
CUTR provided the groundwork of a store-house of information on minority travel is-sues. This was somewhat expanded into aclearinghouse in 1997 and served as an in-formation center and database on the litera-ture and other resources related to minoritytravel behavior and needs. As in previousyears, a steering committee including trans-portation and public officials was estab-lished to assist the project team in develop-ing topics, symposium format, and potentialspeakers.
African Americans, transportation pro-fessionals, elected officials and the publichave benefitted from the symposia by the op-portunity afforded to discuss these issues,establish networks, and transfer technology.Other benefits included the opportunity tohear presentations from both the U. S. Depart-ment of Transportation officials and to par-ticipate in workshops and sessions withpeers from throughout the United States andthe Caribbean.
The fourth symposium was the last con-vened to date.