Embed Size (px)
Citation preview
CHAPTER 1
ENVIRONMENTAL SATELLITES
INTRODUCTION
Satellite images, or pictorial representations ofsatellite-sensed information, are some of the mostfrequently used tools in the fields of meteorology andoceanography.
As a Navy or Marine Corps observer, one of yourprimary duties will be to acquire satellite imagery. Youmay also be required to process the imagery to betterdisplay features of interest to the analyst. Later, as youbegin to analyze meteorological and oceanographicsituations, you will use satellite imagery as one of yourmost important sources of information.
In this chapter, we begin with an explanation ofsome of the basic terminology used to describe satelliteorbits and satellite tracking. Next, we introduceenvironmental satellite programs, and then describethe various types of environmental satellites andexplain their purposes. We then discuss some of themost common types of satellite imagery, and acquaintyou with a few basic imagery enhancement techniques.We complete the chapter by taking a brief look at someof the equipment and methods that you will use toacquire and process satellite imagery.
SATELLITE TERMINOLOGY
LEARNING OBJECTIVES: Define basicterminology used in relation to satellite orbitsand satellite tracking.
Before you can effectively acquire and use satelliteimagery, it is important that you become familiar withsome basic satellite terminology.
Environmental satellites orbit the earth at variousaltitudes. Some environmental satellites operate lowerthan 800 kilometers (500 statute miles), while othersoperate as high as 35,800 kilometers (22,300 statutemiles). To stay in orbit, lower altitude satellites mustorbit faster than higher altitude satellites. As a result,satellites in orbit at 800 kilometers complete an orbit ina little over 100 minutes, while satellites in orbit at35,800 kilometers require 24 hours to complete anorbit.
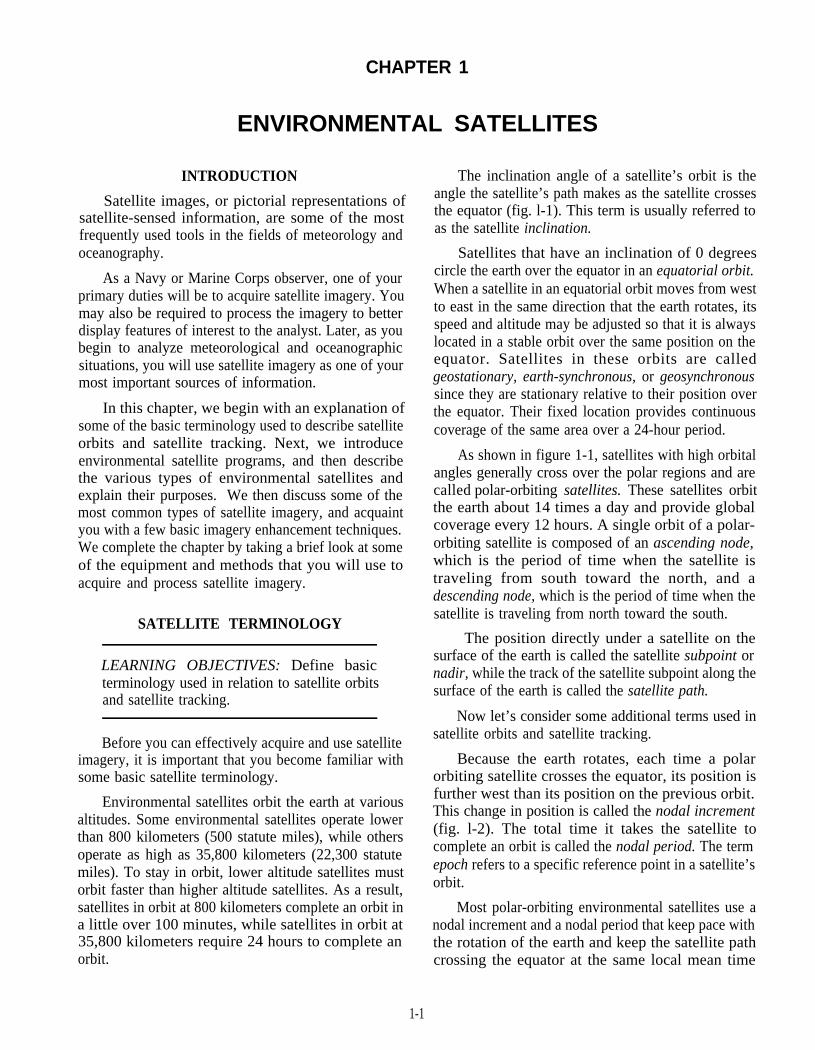
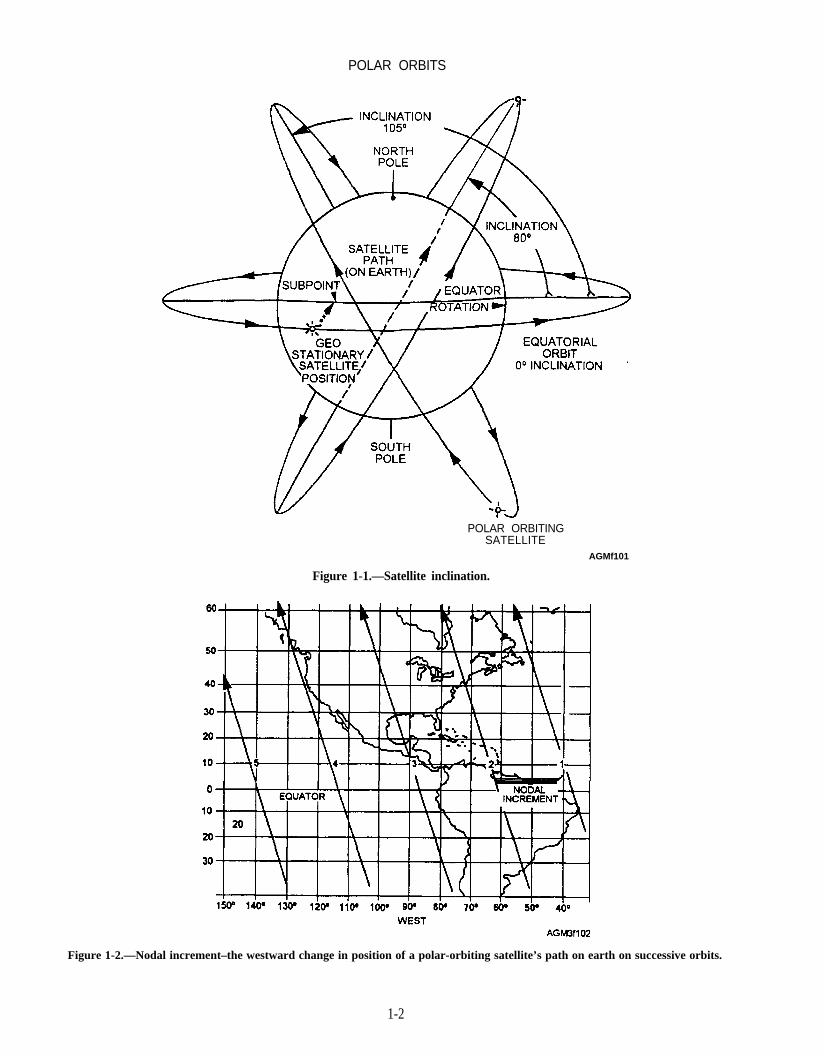
The inclination angle of a satellite’s orbit is theangle the satellite’s path makes as the satellite crossesthe equator (fig. l-1). This term is usually referred toas the satellite inclination.
Satellites that have an inclination of 0 degreescircle the earth over the equator in an equatorial orbit.When a satellite in an equatorial orbit moves from westto east in the same direction that the earth rotates, itsspeed and altitude may be adjusted so that it is alwayslocated in a stable orbit over the same position on theequator. Satellites in these orbits are calledgeostationary, earth-synchronous, or geosynchronoussince they are stationary relative to their position overthe equator. Their fixed location provides continuouscoverage of the same area over a 24-hour period.
As shown in figure 1-1, satellites with high orbitalangles generally cross over the polar regions and arecalled polar-orbiting satellites. These satellites orbitthe earth about 14 times a day and provide globalcoverage every 12 hours. A single orbit of a polar-orbiting satellite is composed of an ascending node,which is the period of time when the satellite istraveling from south toward the north, and adescending node, which is the period of time when thesatellite is traveling from north toward the south.
The position directly under a satellite on thesurface of the earth is called the satellite subpoint ornadir, while the track of the satellite subpoint along thesurface of the earth is called the satellite path.
Now let’s consider some additional terms used insatellite orbits and satellite tracking.
Because the earth rotates, each time a polarorbiting satellite crosses the equator, its position isfurther west than its position on the previous orbit.This change in position is called the nodal increment(fig. l-2). The total time it takes the satellite tocomplete an orbit is called the nodal period. The termepoch refers to a specific reference point in a satellite’sorbit.
Most polar-orbiting environmental satellites use anodal increment and a nodal period that keep pace withthe rotation of the earth and keep the satellite pathcrossing the equator at the same local mean time
1-1
POLAR ORBITS
POLAR ORBITINGSATELLITE
Figure 1-1.—Satellite inclination.
AGMf101
Figure 1-2.—Nodal increment–the westward change in position of a polar-orbiting satellite’s path on earth on successive orbits.
1-2
(LMT) during each orbit. These types of orbits arecalled sun-synchronous orbits—they are synchronizedwith the movement of the sun across the earth’s surface.For instance, an orbit may be calculated so that thesatellite path crosses the equator on the descending node2 hours after sunrise on each orbit.
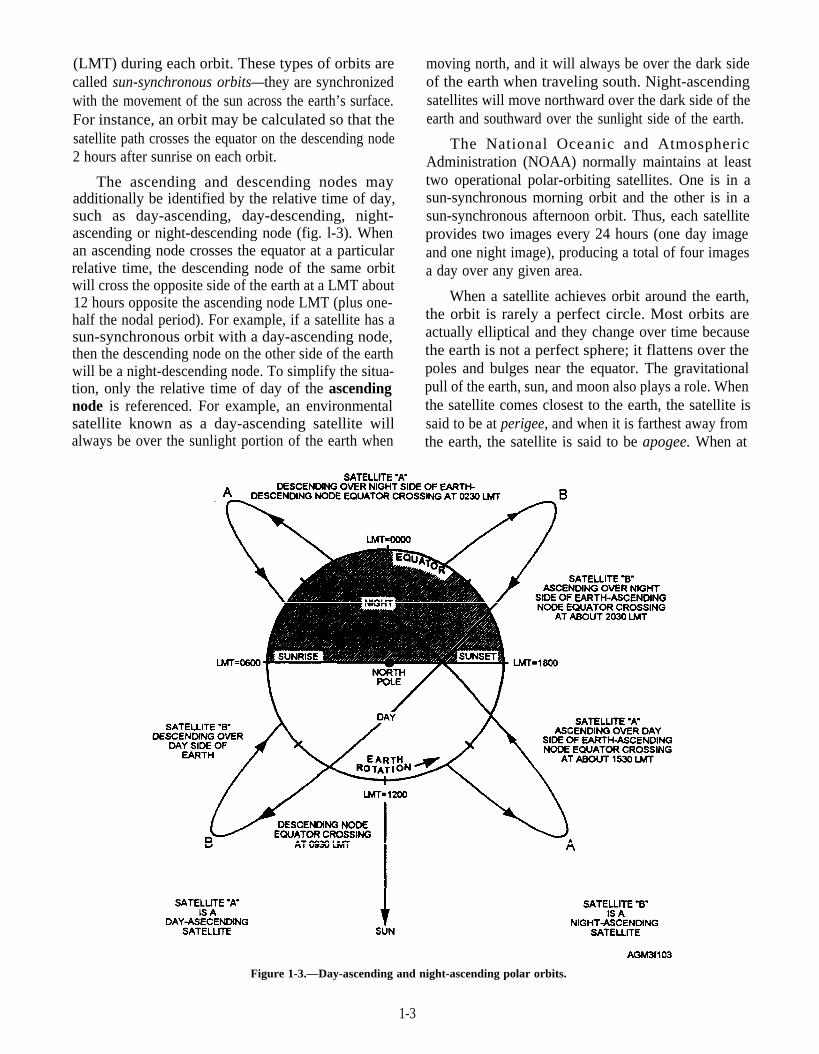
The ascending and descending nodes mayadditionally be identified by the relative time of day,such as day-ascending, day-descending, night-ascending or night-descending node (fig. l-3). Whenan ascending node crosses the equator at a particularrelative time, the descending node of the same orbitwill cross the opposite side of the earth at a LMT about12 hours opposite the ascending node LMT (plus one-half the nodal period). For example, if a satellite has asun-synchronous orbit with a day-ascending node,then the descending node on the other side of the earthwill be a night-descending node. To simplify the situa-tion, only the relative time of day of the ascendingnode is referenced. For example, an environmentalsatellite known as a day-ascending satellite willalways be over the sunlight portion of the earth when
moving north, and it will always be over the dark sideof the earth when traveling south. Night-ascendingsatellites will move northward over the dark side of theearth and southward over the sunlight side of the earth.
The National Oceanic and AtmosphericAdministration (NOAA) normally maintains at leasttwo operational polar-orbiting satellites. One is in asun-synchronous morning orbit and the other is in asun-synchronous afternoon orbit. Thus, each satelliteprovides two images every 24 hours (one day imageand one night image), producing a total of four imagesa day over any given area.
When a satellite achieves orbit around the earth,the orbit is rarely a perfect circle. Most orbits areactually elliptical and they change over time becausethe earth is not a perfect sphere; it flattens over thepoles and bulges near the equator. The gravitationalpull of the earth, sun, and moon also plays a role. Whenthe satellite comes closest to the earth, the satellite issaid to be at perigee, and when it is farthest away fromthe earth, the satellite is said to be apogee. When at
Figure 1-3.—Day-ascending and night-ascending polar orbits.
1-3
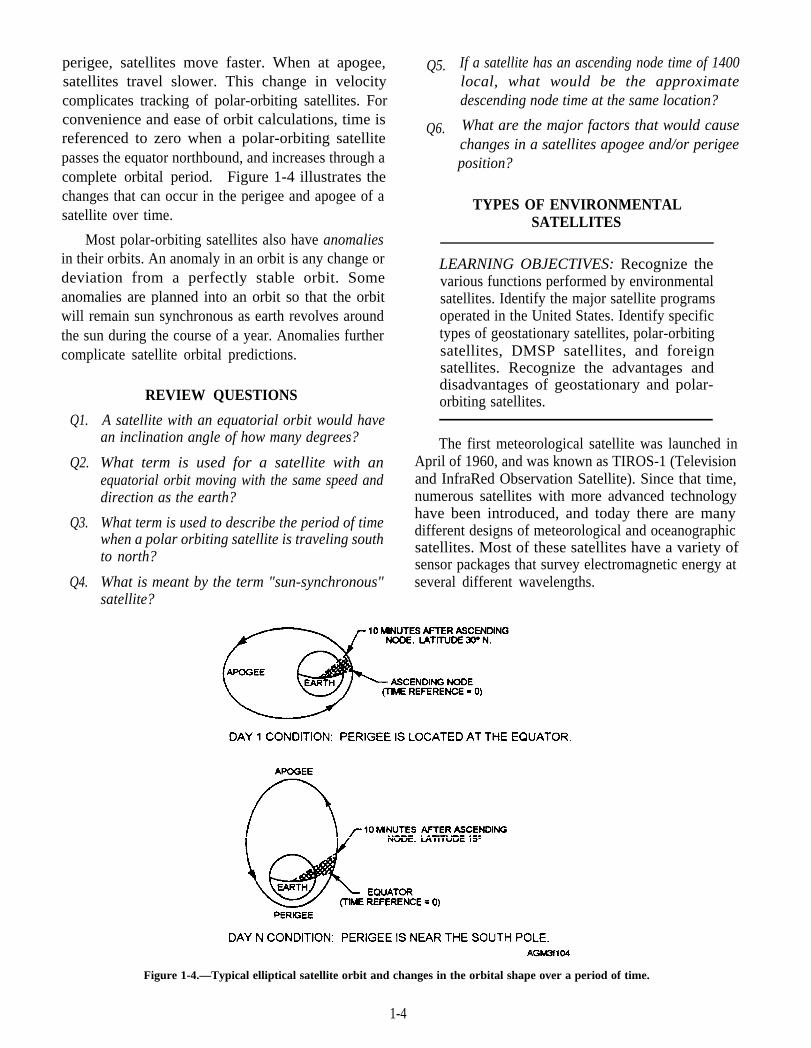
perigee, satellites move faster. When at apogee,satellites travel slower. This change in velocitycomplicates tracking of polar-orbiting satellites. Forconvenience and ease of orbit calculations, time isreferenced to zero when a polar-orbiting satellitepasses the equator northbound, and increases through acomplete orbital period. Figure 1-4 illustrates thechanges that can occur in the perigee and apogee of asatellite over time.
Most polar-orbiting satellites also have anomaliesin their orbits. An anomaly in an orbit is any change ordeviation from a perfectly stable orbit. Someanomalies are planned into an orbit so that the orbitwill remain sun synchronous as earth revolves aroundthe sun during the course of a year. Anomalies furthercomplicate satellite orbital predictions.
REVIEW QUESTIONS
Q1. A satellite with an equatorial orbit would havean inclination angle of how many degrees?
Q2. What term is used for a satellite with anequatorial orbit moving with the same speed anddirection as the earth?
Q3. What term is used to describe the period of timewhen a polar orbiting satellite is traveling southto north?
Q4. What is meant by the term "sun-synchronous"satellite?
Q5.
Q6.
If a satellite has an ascending node time of 1400local, what would be the approximatedescending node time at the same location?
What are the major factors that would causechanges in a satellites apogee and/or perigeeposition?
TYPES OF ENVIRONMENTALSATELLITES
LEARNING OBJECTIVES: Recognize thevarious functions performed by environmentalsatellites. Identify the major satellite programsoperated in the United States. Identify specifictypes of geostationary satellites, polar-orbitingsatellites, DMSP satellites, and foreignsatellites. Recognize the advantages anddisadvantages of geostationary and polar-orbiting satellites.
The first meteorological satellite was launched inApril of 1960, and was known as TIROS-1 (Televisionand InfraRed Observation Satellite). Since that time,numerous satellites with more advanced technologyhave been introduced, and today there are manydifferent designs of meteorological and oceanographicsatellites. Most of these satellites have a variety ofsensor packages that survey electromagnetic energy atseveral different wavelengths.
Figure 1-4.—Typical elliptical satellite orbit and changes in the orbital shape over a period of time.
1-4
Besides collecting imagery, most environmentalsatellites perform additional functions. Somesatellites contain communications packages designedto receive and relay signals between earth stations andother satellites and to collect and relay observationreports from automatic observation sites or buoys.Some satellites carry search and rescue (SAR) beaconlocators. More advanced satellites carry sophisticatedinstruments known as "atmospheric sounders." Thesesystems use infrared and microwave energy to providevertical temperature and moisture profiles of earth’satmosphere from the surface up to 30 miles. They alsoevaluate atmospheric stability. In addition, satellitescan be used to measure a variety of otherenvironmental parameters, such as sea surfacetemperature, wave height, snow/ice cover, low-levelwind speed and direction, and ozone distribution.Although these functions are very important tometeorology and oceanography, you will not normallybe involved in this type of data collection or dataprocessing. In this module, we discuss only thedifferences in satellites that are important to you inacquiring satellite imagery.
In the United States, both the U.S. Department ofCommerce and the U.S. Department of Defenseoperate meteorological satellite programs. TheNational Oceanic and Atmospheric Administration(NOAA), a division under the Department ofCommerce, operates its satellite programs through the
National Environmental Satellite, Data, andInformation Service (NESDIS). Their primarymeteorological satelli te programs are theGeostationary Operational Environmental Satellite(GOES), and the Advanced Television InfraRedObservation Satellite-NOAA (ATN) polar-orbiter(also called a TIROS-N or NOAA satellite). Bothsystems are energized with solar power while in orbit.The Department of Defense oversees the DefenseMeteorological Satellite Program, usually referred toas the DMSP.
GEOSTATIONARY SATELLITES
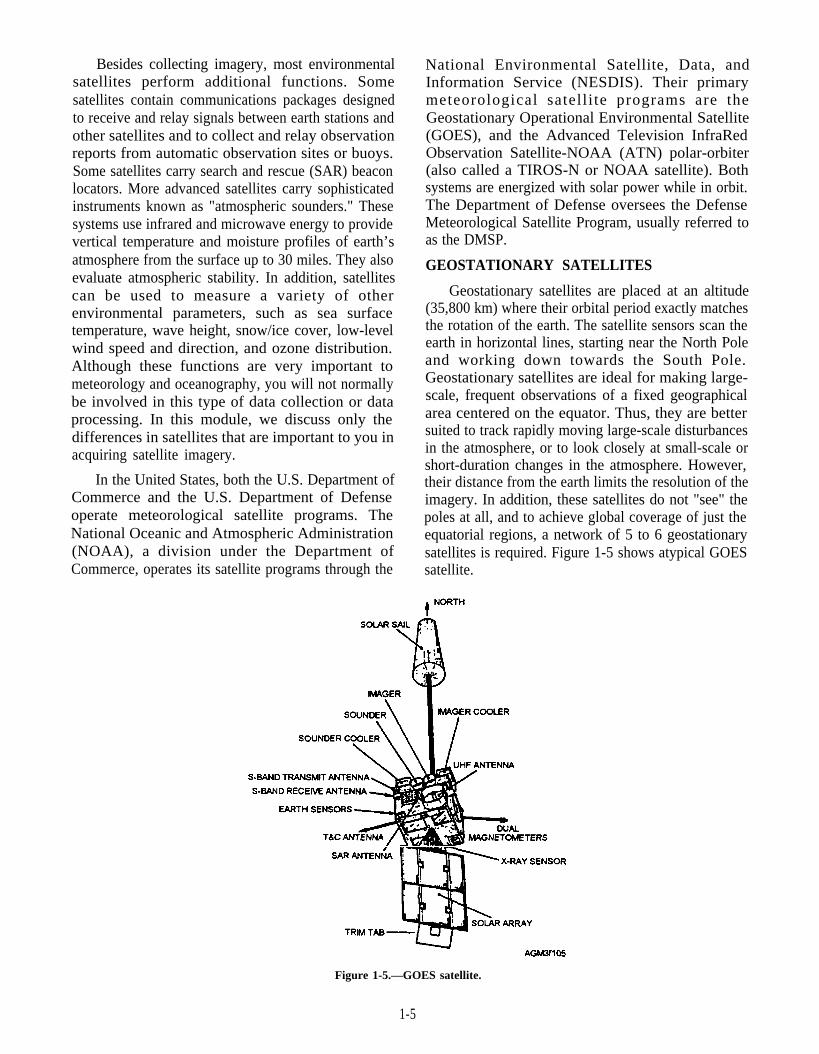
Geostationary satellites are placed at an altitude(35,800 km) where their orbital period exactly matchesthe rotation of the earth. The satellite sensors scan theearth in horizontal lines, starting near the North Poleand working down towards the South Pole.Geostationary satellites are ideal for making large-scale, frequent observations of a fixed geographicalarea centered on the equator. Thus, they are bettersuited to track rapidly moving large-scale disturbancesin the atmosphere, or to look closely at small-scale orshort-duration changes in the atmosphere. However,their distance from the earth limits the resolution of theimagery. In addition, these satellites do not "see" thepoles at all, and to achieve global coverage of just theequatorial regions, a network of 5 to 6 geostationarysatellites is required. Figure 1-5 shows atypical GOESsatellite.
Figure 1-5.—GOES satellite.
1-5
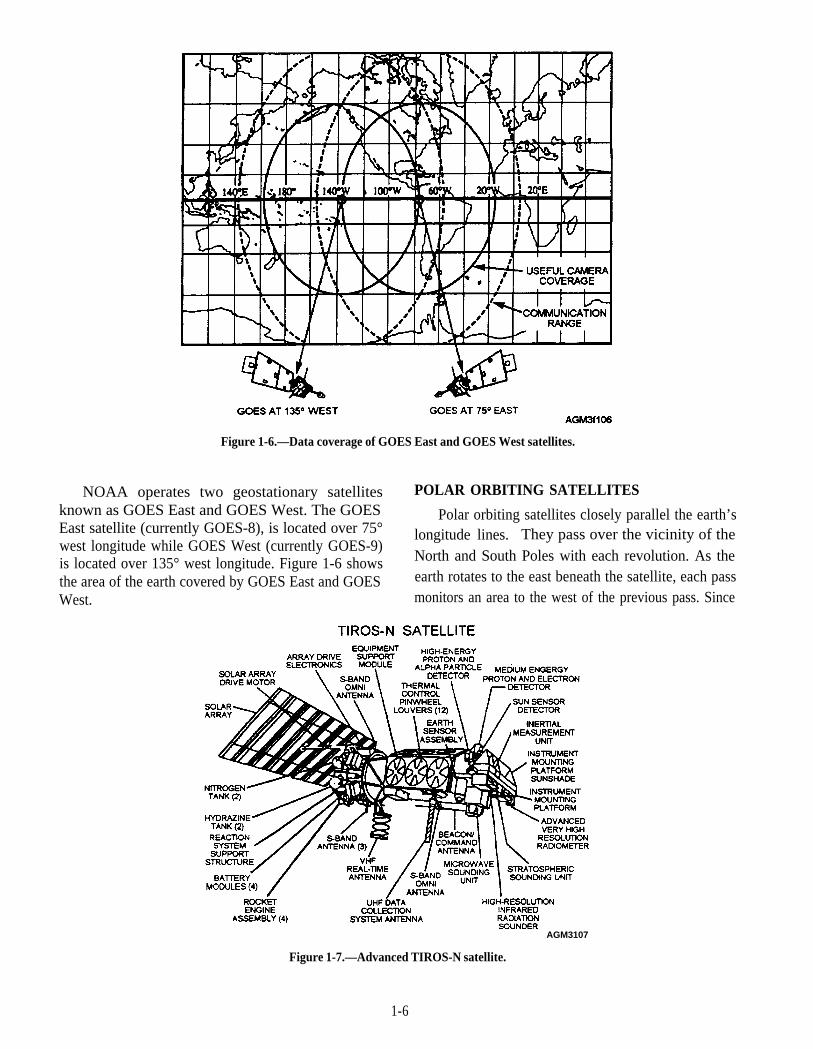
Figure 1-6.—Data coverage of GOES East and GOES West satellites.
NOAA operates two geostationary satellites POLAR ORBITING SATELLITESknown as GOES East and GOES West. The GOESEast satellite (currently GOES-8), is located over 75°west longitude while GOES West (currently GOES-9)is located over 135° west longitude. Figure 1-6 showsthe area of the earth covered by GOES East and GOESWest.
Polar orbiting satellites closely parallel the earth’slongitude lines. They pass over the vicinity of theNorth and South Poles with each revolution. As theearth rotates to the east beneath the satellite, each passmonitors an area to the west of the previous pass. Since
AGM3107
Figure 1-7.—Advanced TIROS-N satellite.
1-6
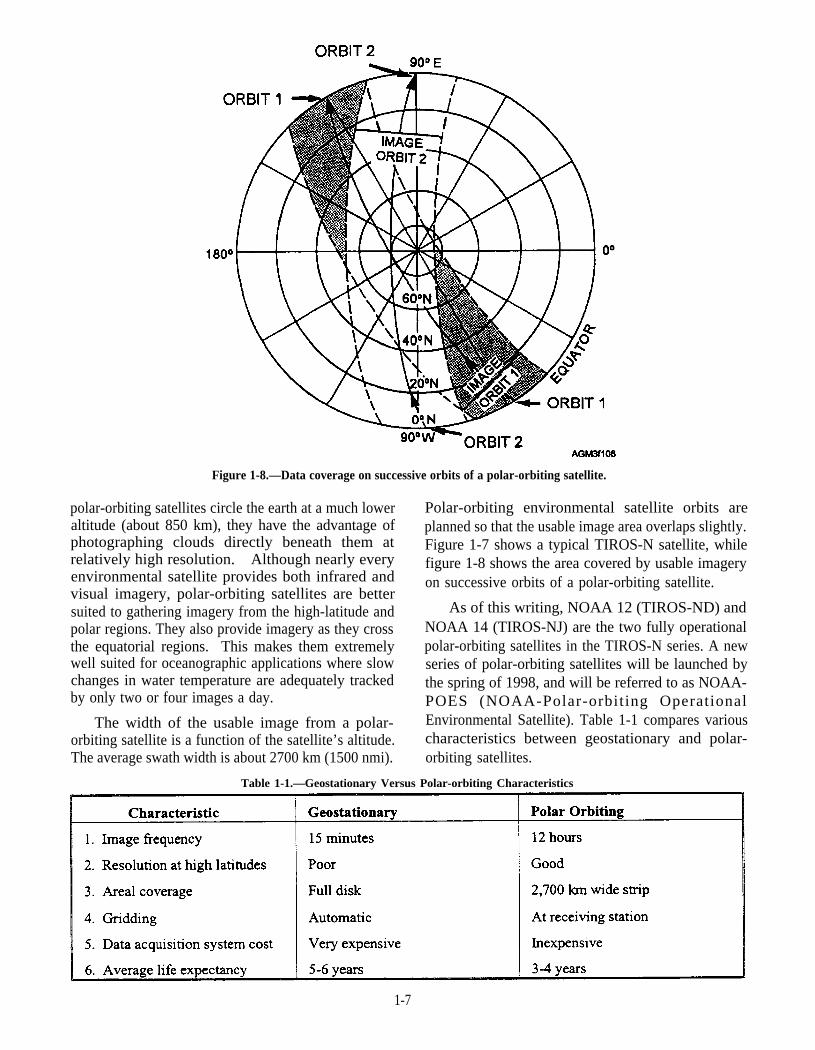
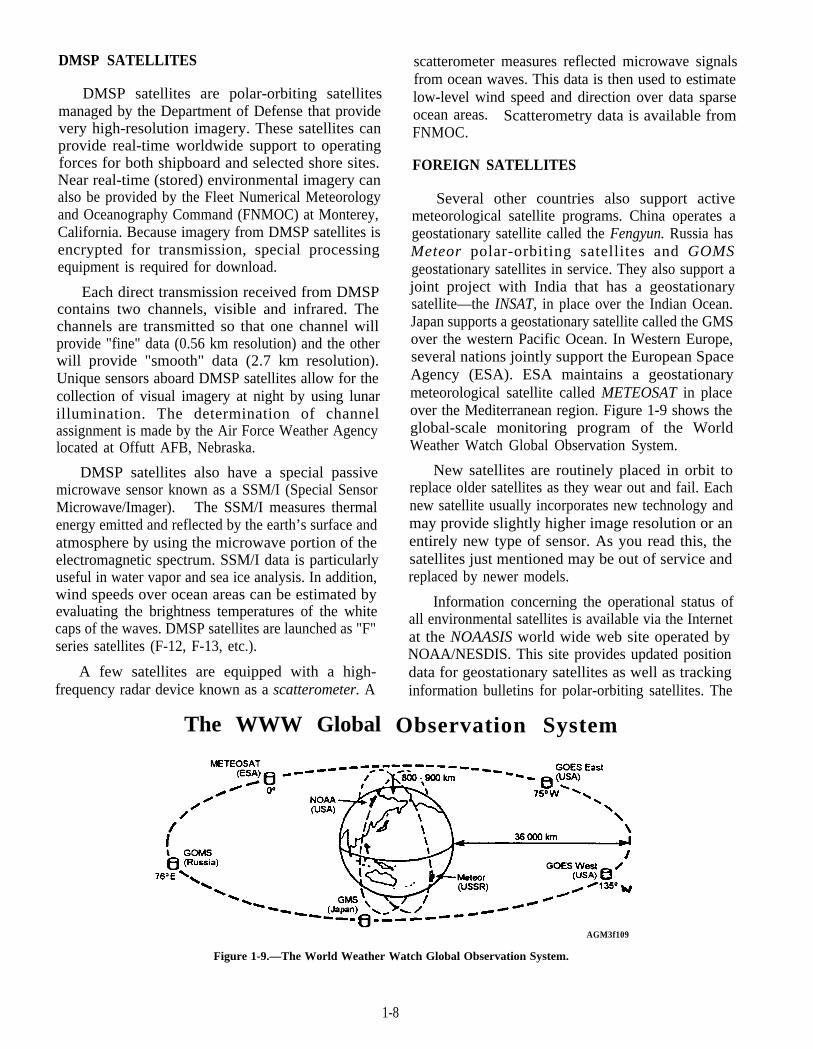
Figure 1-8.—Data coverage on successive orbits of a polar-orbiting satellite.
polar-orbiting satellites circle the earth at a much loweraltitude (about 850 km), they have the advantage ofphotographing clouds directly beneath them atrelatively high resolution. Although nearly everyenvironmental satellite provides both infrared andvisual imagery, polar-orbiting satellites are bettersuited to gathering imagery from the high-latitude andpolar regions. They also provide imagery as they crossthe equatorial regions. This makes them extremelywell suited for oceanographic applications where slowchanges in water temperature are adequately trackedby only two or four images a day.
The width of the usable image from a polar-orbiting satellite is a function of the satellite’s altitude.The average swath width is about 2700 km (1500 nmi).
Polar-orbiting environmental satellite orbits areplanned so that the usable image area overlaps slightly.Figure 1-7 shows a typical TIROS-N satellite, whilefigure 1-8 shows the area covered by usable imageryon successive orbits of a polar-orbiting satellite.
As of this writing, NOAA 12 (TIROS-ND) andNOAA 14 (TIROS-NJ) are the two fully operationalpolar-orbiting satellites in the TIROS-N series. A newseries of polar-orbiting satellites will be launched bythe spring of 1998, and will be referred to as NOAA-POES (NOAA-Polar-orbiting OperationalEnvironmental Satellite). Table 1-1 compares variouscharacteristics between geostationary and polar-orbiting satellites.
Table 1-1.—Geostationary Versus Polar-orbiting Characteristics
1-7
DMSP SATELLITES
DMSP satellites are polar-orbiting satellitesmanaged by the Department of Defense that providevery high-resolution imagery. These satellites canprovide real-time worldwide support to operatingforces for both shipboard and selected shore sites.Near real-time (stored) environmental imagery canalso be provided by the Fleet Numerical Meteorologyand Oceanography Command (FNMOC) at Monterey,California. Because imagery from DMSP satellites isencrypted for transmission, special processingequipment is required for download.
Each direct transmission received from DMSPcontains two channels, visible and infrared. Thechannels are transmitted so that one channel willprovide "fine" data (0.56 km resolution) and the otherwill provide "smooth" data (2.7 km resolution).Unique sensors aboard DMSP satellites allow for thecollection of visual imagery at night by using lunarillumination. The determination of channelassignment is made by the Air Force Weather Agencylocated at Offutt AFB, Nebraska.
DMSP satellites also have a special passivemicrowave sensor known as a SSM/I (Special SensorMicrowave/Imager). The SSM/I measures thermalenergy emitted and reflected by the earth’s surface andatmosphere by using the microwave portion of theelectromagnetic spectrum. SSM/I data is particularlyuseful in water vapor and sea ice analysis. In addition,wind speeds over ocean areas can be estimated byevaluating the brightness temperatures of the whitecaps of the waves. DMSP satellites are launched as "F"series satellites (F-12, F-13, etc.).
A few satellites are equipped with a high-frequency radar device known as a scatterometer. A
The WWW Global Observation System
scatterometer measures reflected microwave signalsfrom ocean waves. This data is then used to estimatelow-level wind speed and direction over data sparseocean areas. Scatterometry data is available fromFNMOC.
FOREIGN SATELLITES
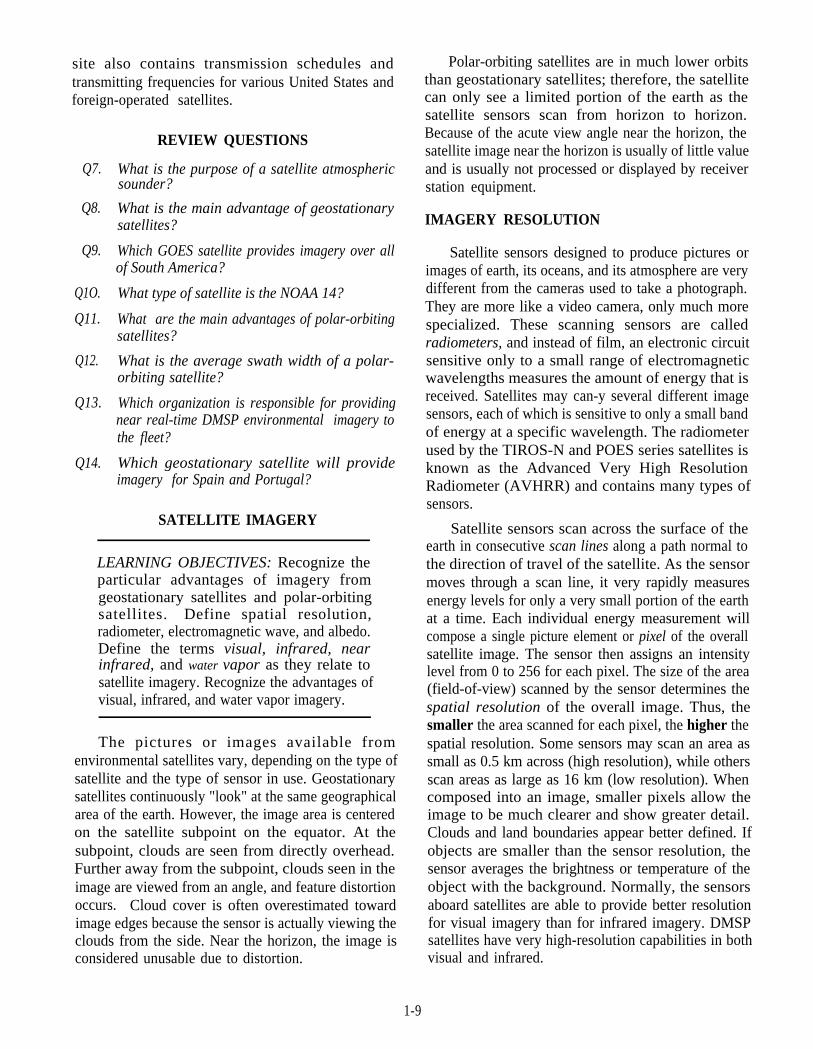
Several other countries also support activemeteorological satellite programs. China operates ageostationary satellite called the Fengyun. Russia hasMeteor polar-orbiting satellites and GOMSgeostationary satellites in service. They also support ajoint project with India that has a geostationarysatellite—the INSAT, in place over the Indian Ocean.Japan supports a geostationary satellite called the GMSover the western Pacific Ocean. In Western Europe,several nations jointly support the European SpaceAgency (ESA). ESA maintains a geostationarymeteorological satellite called METEOSAT in placeover the Mediterranean region. Figure 1-9 shows theglobal-scale monitoring program of the WorldWeather Watch Global Observation System.
New satellites are routinely placed in orbit toreplace older satellites as they wear out and fail. Eachnew satellite usually incorporates new technology andmay provide slightly higher image resolution or anentirely new type of sensor. As you read this, thesatellites just mentioned may be out of service andreplaced by newer models.
Information concerning the operational status ofall environmental satellites is available via the Internetat the NOAASIS world wide web site operated byNOAA/NESDIS. This site provides updated positiondata for geostationary satellites as well as trackinginformation bulletins for polar-orbiting satellites. The
AGM3f109
Figure 1-9.—The World Weather Watch Global Observation System.
1-8
site also contains transmission schedules andtransmitting frequencies for various United States andforeign-operated satellites.
REVIEW QUESTIONS
Q7. What is the purpose of a satellite atmosphericsounder?
Q8. What is the main advantage of geostationarysatellites?
Q9. Which GOES satellite provides imagery over allof South America?
Q1O. What type of satellite is the NOAA 14?
Q11. What are the main advantages of polar-orbitingsatellites?
Q12. What is the average swath width of a polar-orbiting satellite?
Q13. Which organization is responsible for providingnear real-time DMSP environmental imagery tothe fleet?
Q14. Which geostationary satellite will provideimagery for Spain and Portugal?
SATELLITE IMAGERY
LEARNING OBJECTIVES: Recognize theparticular advantages of imagery fromgeostationary satellites and polar-orbitingsatellites. Define spatial resolution,radiometer, electromagnetic wave, and albedo.Define the terms visual, infrared, nearinfrared, and water vapor as they relate tosatellite imagery. Recognize the advantages ofvisual, infrared, and water vapor imagery.
The pictures or images available fromenvironmental satellites vary, depending on the type ofsatellite and the type of sensor in use. Geostationarysatellites continuously "look" at the same geographicalarea of the earth. However, the image area is centeredon the satellite subpoint on the equator. At thesubpoint, clouds are seen from directly overhead.Further away from the subpoint, clouds seen in theimage are viewed from an angle, and feature distortionoccurs. Cloud cover is often overestimated towardimage edges because the sensor is actually viewing theclouds from the side. Near the horizon, the image isconsidered unusable due to distortion.
Polar-orbiting satellites are in much lower orbitsthan geostationary satellites; therefore, the satellitecan only see a limited portion of the earth as thesatellite sensors scan from horizon to horizon.Because of the acute view angle near the horizon, thesatellite image near the horizon is usually of little valueand is usually not processed or displayed by receiverstation equipment.
IMAGERY RESOLUTION
Satellite sensors designed to produce pictures orimages of earth, its oceans, and its atmosphere are verydifferent from the cameras used to take a photograph.They are more like a video camera, only much morespecialized. These scanning sensors are calledradiometers, and instead of film, an electronic circuitsensitive only to a small range of electromagneticwavelengths measures the amount of energy that isreceived. Satellites may can-y several different imagesensors, each of which is sensitive to only a small bandof energy at a specific wavelength. The radiometerused by the TIROS-N and POES series satellites isknown as the Advanced Very High ResolutionRadiometer (AVHRR) and contains many types ofsensors.
Satellite sensors scan across the surface of theearth in consecutive scan lines along a path normal tothe direction of travel of the satellite. As the sensormoves through a scan line, it very rapidly measuresenergy levels for only a very small portion of the earthat a time. Each individual energy measurement willcompose a single picture element or pixel of the overallsatellite image. The sensor then assigns an intensitylevel from 0 to 256 for each pixel. The size of the area(field-of-view) scanned by the sensor determines thespatial resolution of the overall image. Thus, thesmaller the area scanned for each pixel, the higher thespatial resolution. Some sensors may scan an area assmall as 0.5 km across (high resolution), while othersscan areas as large as 16 km (low resolution). Whencomposed into an image, smaller pixels allow theimage to be much clearer and show greater detail.Clouds and land boundaries appear better defined. Ifobjects are smaller than the sensor resolution, thesensor averages the brightness or temperature of theobject with the background. Normally, the sensorsaboard satellites are able to provide better resolutionfor visual imagery than for infrared imagery. DMSPsatellites have very high-resolution capabilities in bothvisual and infrared.
1-9
TYPES OF IMAGERY
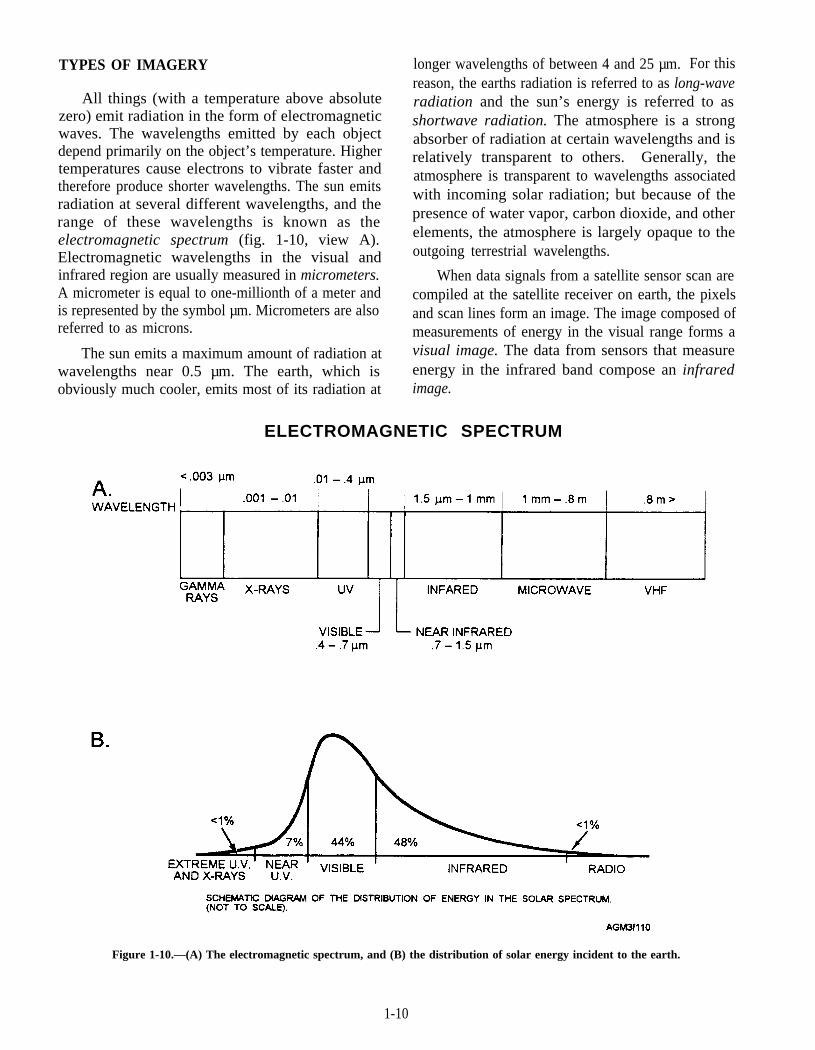
All things (with a temperature above absolutezero) emit radiation in the form of electromagneticwaves. The wavelengths emitted by each objectdepend primarily on the object’s temperature. Highertemperatures cause electrons to vibrate faster andtherefore produce shorter wavelengths. The sun emitsradiation at several different wavelengths, and therange of these wavelengths is known as theelectromagnetic spectrum (fig. 1-10, view A).Electromagnetic wavelengths in the visual andinfrared region are usually measured in micrometers.A micrometer is equal to one-millionth of a meter andis represented by the symbol µm. Micrometers are alsoreferred to as microns.
The sun emits a maximum amount of radiation atwavelengths near 0.5 µm. The earth, which isobviously much cooler, emits most of its radiation at
longer wavelengths of between 4 and 25 µm. For thisreason, the earths radiation is referred to as long-waveradiation and the sun’s energy is referred to asshortwave radiation. The atmosphere is a strongabsorber of radiation at certain wavelengths and isrelatively transparent to others. Generally, theatmosphere is transparent to wavelengths associatedwith incoming solar radiation; but because of thepresence of water vapor, carbon dioxide, and otherelements, the atmosphere is largely opaque to theoutgoing terrestrial wavelengths.
When data signals from a satellite sensor scan arecompiled at the satellite receiver on earth, the pixelsand scan lines form an image. The image composed ofmeasurements of energy in the visual range forms avisual image. The data from sensors that measureenergy in the infrared band compose an infraredimage.
ELECTROMAGNETIC SPECTRUM
Figure 1-10.—(A) The electromagnetic spectrum, and (B) the distribution of solar energy incident to the earth.
1-10
Visual Imagery
The electromagnetic energy that your eyes can see,visible light, ranges from a wavelength of .7 µm for redlight, through the visible spectrum (red, orange,yellow, green, blue, indigo and violet) to .4 µm forviolet light. Figure 1-10, view B, shows thedistribution of the various wavelengths of solar energyincident on the earth’s atmosphere. About 44 percentof the sun’s energy falls on the earth in the form of light.Although some light is absorbed, much of the lightincident on the earth’s atmosphere and surface isreflected back into space.
The reflected light from the earth is measured by asensor aboard the satellite that is sensitive only toelectromagnetic energy in the visual range. The sensormeasures the energy seen in each pixel and assigns it areading from 0 for no energy sensed to 256 for veryhigh energy sensed. Measurements are transmitted tothe earth, and the consecutive pixels and scan lines areprocessed to compose an image.
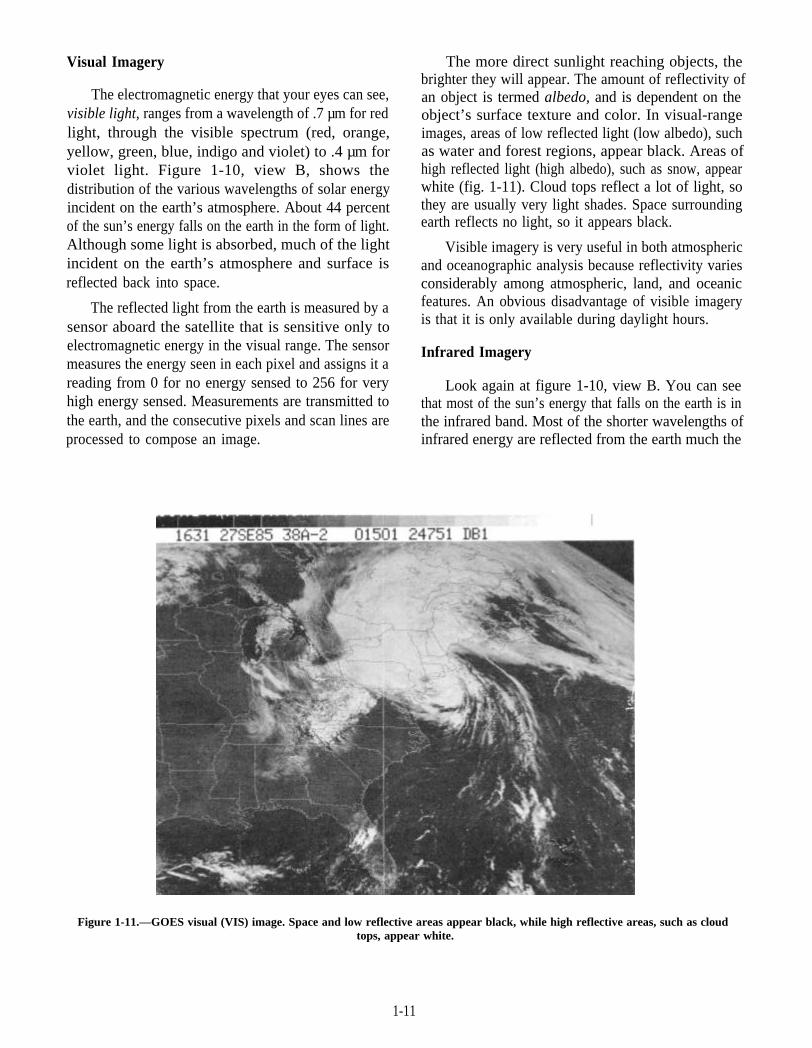
The more direct sunlight reaching objects, thebrighter they will appear. The amount of reflectivity ofan object is termed albedo, and is dependent on theobject’s surface texture and color. In visual-rangeimages, areas of low reflected light (low albedo), suchas water and forest regions, appear black. Areas ofhigh reflected light (high albedo), such as snow, appearwhite (fig. 1-11). Cloud tops reflect a lot of light, sothey are usually very light shades. Space surroundingearth reflects no light, so it appears black.
Visible imagery is very useful in both atmosphericand oceanographic analysis because reflectivity variesconsiderably among atmospheric, land, and oceanicfeatures. An obvious disadvantage of visible imageryis that it is only available during daylight hours.
Infrared Imagery
Look again at figure 1-10, view B. You can seethat most of the sun’s energy that falls on the earth is inthe infrared band. Most of the shorter wavelengths ofinfrared energy are reflected from the earth much the
Figure 1-11.—GOES visual (VIS) image. Space and low reflective areas appear black, while high reflective areas, such as cloudtops, appear white.
1-11
same as visible light (longer wavelength infraredenergy is absorbed). Satellites normally carry sensorsthat measure energy levels in several specific bands ofinfrared wavelengths, and the radiation measured isdirectly related to the temperature of the differentradiating surfaces. Since all surfaces radiate someamount of thermal (heat) energy, a major advantage ofinfrared satellite imagery is that it is available evenwhen the earth is dark. Energy levels are measuredmuch the same way that visual-range energy ismeasured. The individual measurements from eachpixel, when composed into an image of the earth, forman infrared image.
Most infrared satellite imagery is measured atwavelengths of 10.2 µm to 12.8 µm (far infrared).Some satellites are able to augment visual and farinfrared imagery by also measuring near infrared(NIR) wavelengths (.74 µm to 2.0 µm). NIR imagerygenerally shows better land/water contrast and
simplifies low-level feature identification, such asshorelines, snow/ice, and vegetation.
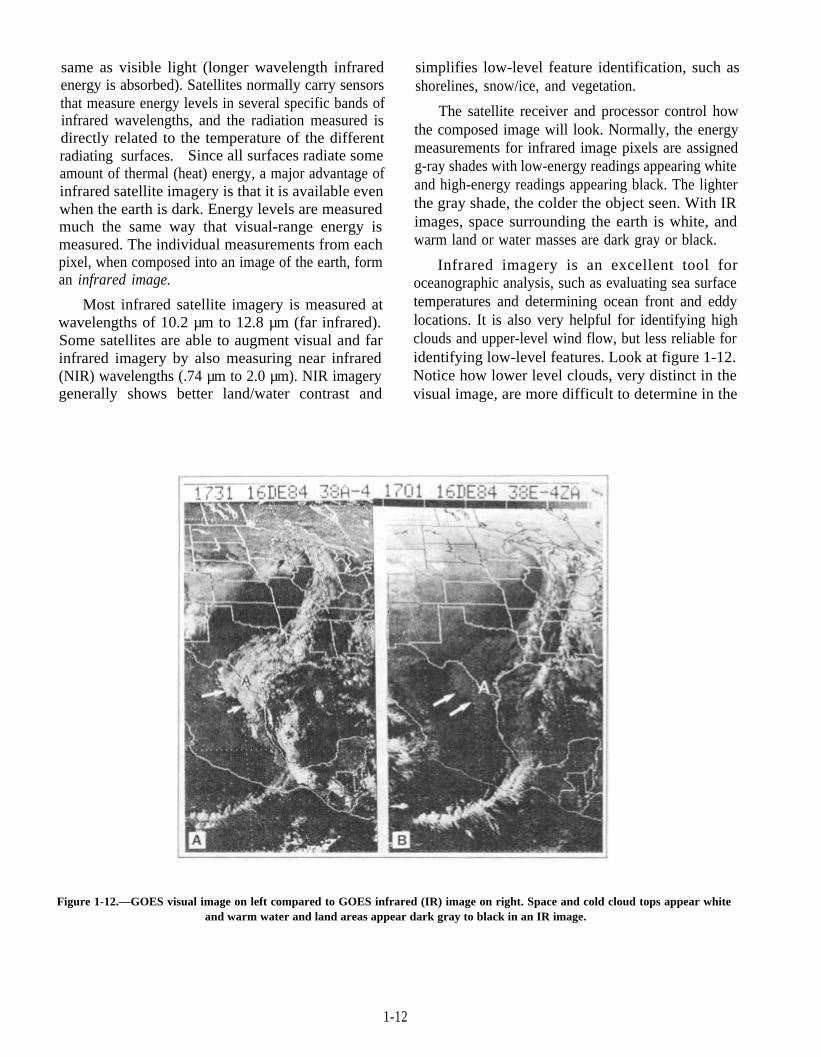
The satellite receiver and processor control howthe composed image will look. Normally, the energymeasurements for infrared image pixels are assignedg-ray shades with low-energy readings appearing whiteand high-energy readings appearing black. The lighterthe gray shade, the colder the object seen. With IRimages, space surrounding the earth is white, andwarm land or water masses are dark gray or black.
Infrared imagery is an excellent tool foroceanographic analysis, such as evaluating sea surfacetemperatures and determining ocean front and eddylocations. It is also very helpful for identifying highclouds and upper-level wind flow, but less reliable foridentifying low-level features. Look at figure 1-12.Notice how lower level clouds, very distinct in thevisual image, are more difficult to determine in the
Figure 1-12.—GOES visual image on left compared to GOES infrared (IR) image on right. Space and cold cloud tops appear whiteand warm water and land areas appear dark gray to black in an IR image.
1-12
infrared image when surface temperatures and cloudtop temperatures are relatively the same.
Water Vapor Imagery
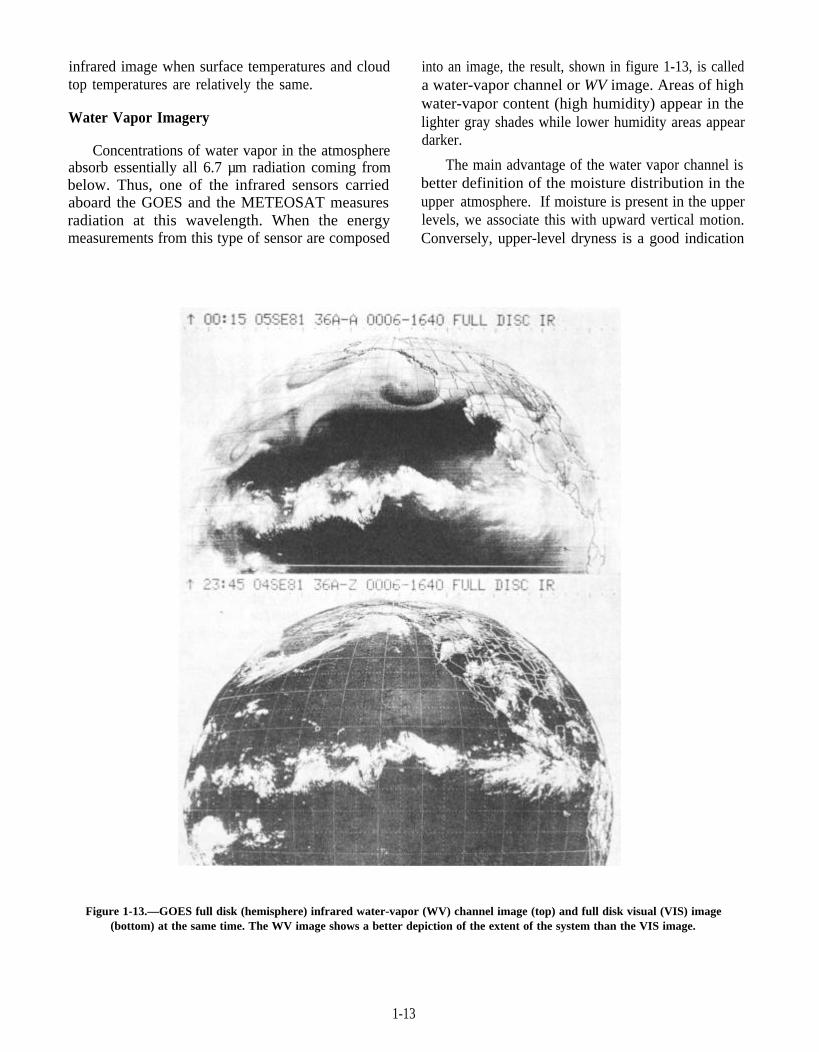
Concentrations of water vapor in the atmosphereabsorb essentially all 6.7 µm radiation coming frombelow. Thus, one of the infrared sensors carriedaboard the GOES and the METEOSAT measuresradiation at this wavelength. When the energymeasurements from this type of sensor are composed
into an image, the result, shown in figure 1-13, is calleda water-vapor channel or WV image. Areas of highwater-vapor content (high humidity) appear in thelighter gray shades while lower humidity areas appeardarker.
The main advantage of the water vapor channel isbetter definition of the moisture distribution in theupper atmosphere. If moisture is present in the upperlevels, we associate this with upward vertical motion.Conversely, upper-level dryness is a good indication
Figure 1-13.—GOES full disk (hemisphere) infrared water-vapor (WV) channel image (top) and full disk visual (VIS) image(bottom) at the same time. The WV image shows a better depiction of the extent of the system than the VIS image.
1-13
of downward vertical motion. Water vapor imagerycan detect these motions without clouds present.Circulation patterns in the upper atmosphere,including the jet stream, are easily identified using WVimagery.
Q15.
Q16.
Q17.
Q18.
Q19.
Q20.
Q21.
Q22.
Q23.
Q24.
REVIEW QUESTIONS
What is the image-scanning sensor of a satellitecalled?
Which sensor would provide higher resolutiondata, one with a spatial resolution of 1 kilometeror one with a spatial resolution of 4 kilometers?
Consider two objects, one cold the other hot.Which object is emitting electromagnetic energyat relatively longer wavelengths?
The majority of the radiation emitted by theearth is known by what term?
In the visible spectrum, what color has thelongest wavelength?
Of the following objects, sand or grass, whichone would have a higher albedo?
What are the major advantages of infraredimagery?
How do relatively cold objects appear on IRimagery?
How do high humidity areas appear on watervapor images?
What are the advantages of water vaporimagery?
IMAGERY ENHANCEMENT
LEARNING OBJECTIVES: Identify varioustypes of user-defined and predefined satelliteenhancement curves. Identify informationcontained in the GOES legend and temperaturescale.
Most satellite data processors have the capabilityto assign colors or various gray shades to specific JRimagery energy readings. When an image is producedby using either color or an alternating gray shade ratherthan the straight black-to-white or white-to-blackshading, the color or gray shade assignment is called anenhancement. An enhanced satellite image allows theuser to see specific details of an image with better
definition. Infrared imagery is often enhanced tobetter define a small range of critical temperatures.
TYPES OF ENHANCEMENT CURVES
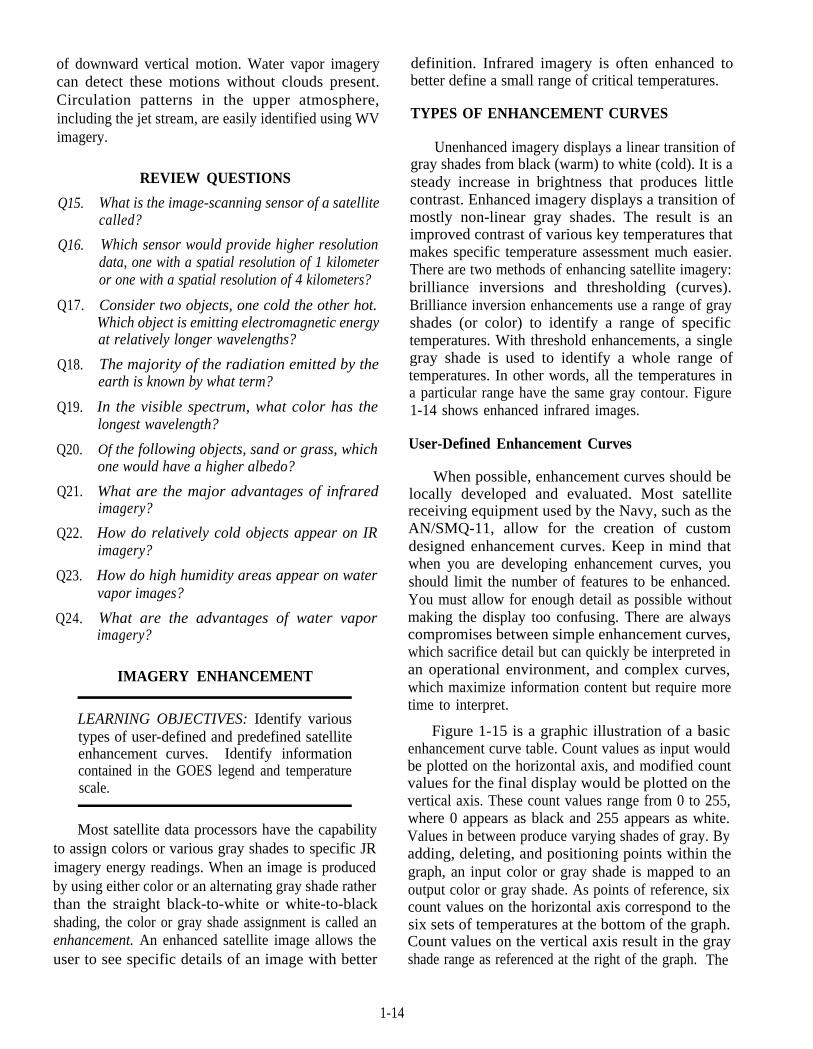
Unenhanced imagery displays a linear transition ofgray shades from black (warm) to white (cold). It is asteady increase in brightness that produces littlecontrast. Enhanced imagery displays a transition ofmostly non-linear gray shades. The result is animproved contrast of various key temperatures thatmakes specific temperature assessment much easier.There are two methods of enhancing satellite imagery:brilliance inversions and thresholding (curves).Brilliance inversion enhancements use a range of grayshades (or color) to identify a range of specifictemperatures. With threshold enhancements, a singlegray shade is used to identify a whole range oftemperatures. In other words, all the temperatures ina particular range have the same gray contour. Figure1-14 shows enhanced infrared images.
User-Defined Enhancement Curves
When possible, enhancement curves should belocally developed and evaluated. Most satellitereceiving equipment used by the Navy, such as theAN/SMQ-11, allow for the creation of customdesigned enhancement curves. Keep in mind thatwhen you are developing enhancement curves, youshould limit the number of features to be enhanced.You must allow for enough detail as possible withoutmaking the display too confusing. There are alwayscompromises between simple enhancement curves,which sacrifice detail but can quickly be interpreted inan operational environment, and complex curves,which maximize information content but require moretime to interpret.
Figure 1-15 is a graphic illustration of a basicenhancement curve table. Count values as input wouldbe plotted on the horizontal axis, and modified countvalues for the final display would be plotted on thevertical axis. These count values range from 0 to 255,where 0 appears as black and 255 appears as white.Values in between produce varying shades of gray. Byadding, deleting, and positioning points within thegraph, an input color or gray shade is mapped to anoutput color or gray shade. As points of reference, sixcount values on the horizontal axis correspond to thesix sets of temperatures at the bottom of the graph.Count values on the vertical axis result in the grayshade range as referenced at the right of the graph. The
1-14
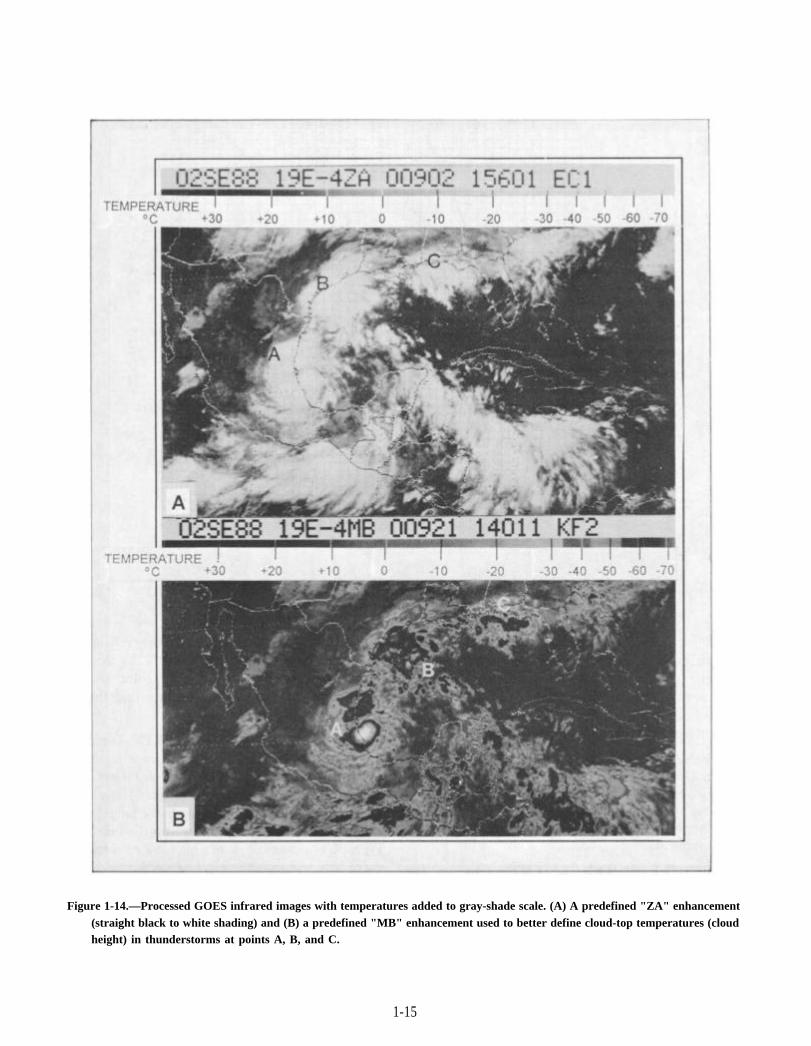
Figure 1-14.—Processed GOES infrared images with temperatures added to gray-shade scale. (A) A predefined "ZA" enhancement(straight black to white shading) and (B) a predefined "MB" enhancement used to better define cloud-top temperatures (cloudheight) in thunderstorms at points A, B, and C.
1-15
COUNT VALUE INPUT
Figure 1-15.—Illustration of a basic enhancement curve table.
solid line (AB) represents a case of no enhancement.As an example, if you acquired an image and thewarmer (darker) end of the spectrum required greaterdefinition, the data could be modified as illustrated bythe segment (AC). In this case, all the gray shades from+56.0°C to 5.8°C would be displayed.
Enhancement curves for high-resolution imageryfrom DMSP and NOAA satellites are usuallydeveloped based upon three basic configurations,depending on desired results. They are the singleenhancement, the high-low enhancement, and the splitenhancement.
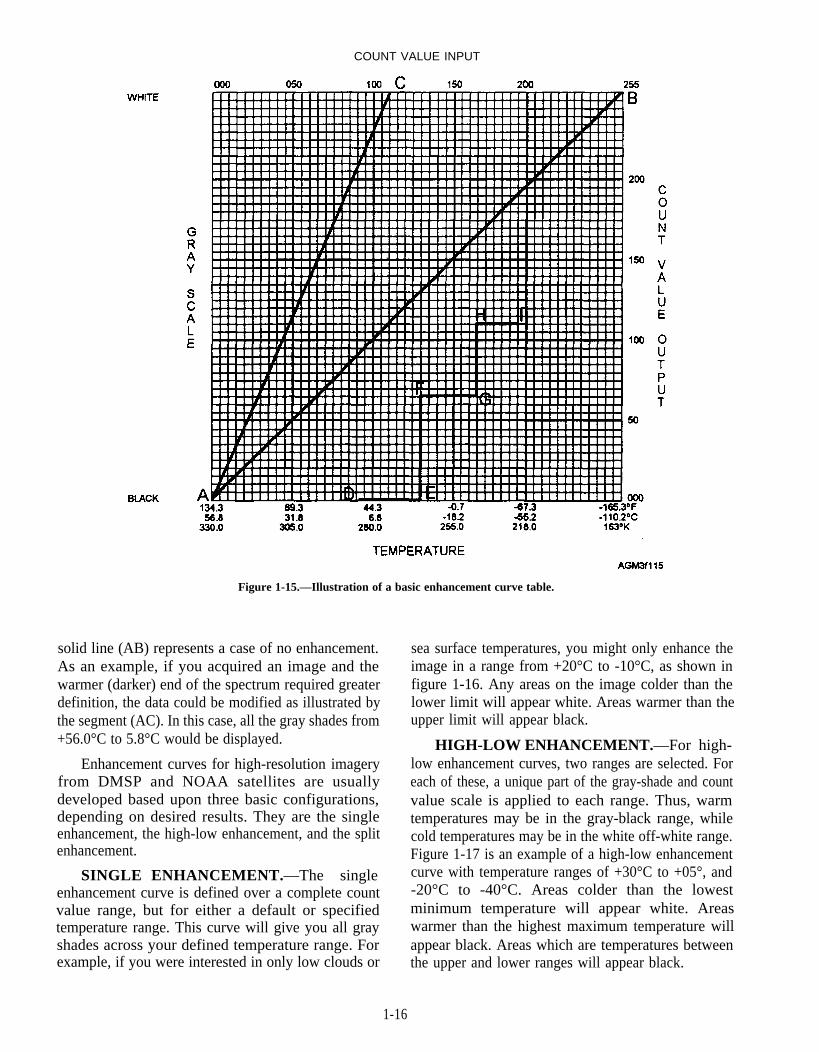
SINGLE ENHANCEMENT.—The singleenhancement curve is defined over a complete countvalue range, but for either a default or specifiedtemperature range. This curve will give you all grayshades across your defined temperature range. Forexample, if you were interested in only low clouds or
sea surface temperatures, you might only enhance theimage in a range from +20°C to -10°C, as shown infigure 1-16. Any areas on the image colder than thelower limit will appear white. Areas warmer than theupper limit will appear black.
HIGH-LOW ENHANCEMENT.—For high-low enhancement curves, two ranges are selected. Foreach of these, a unique part of the gray-shade and countvalue scale is applied to each range. Thus, warmtemperatures may be in the gray-black range, whilecold temperatures may be in the white off-white range.Figure 1-17 is an example of a high-low enhancementcurve with temperature ranges of +30°C to +05°, and-20°C to -40°C. Areas colder than the lowestminimum temperature will appear white. Areaswarmer than the highest maximum temperature willappear black. Areas which are temperatures betweenthe upper and lower ranges will appear black.
1-16
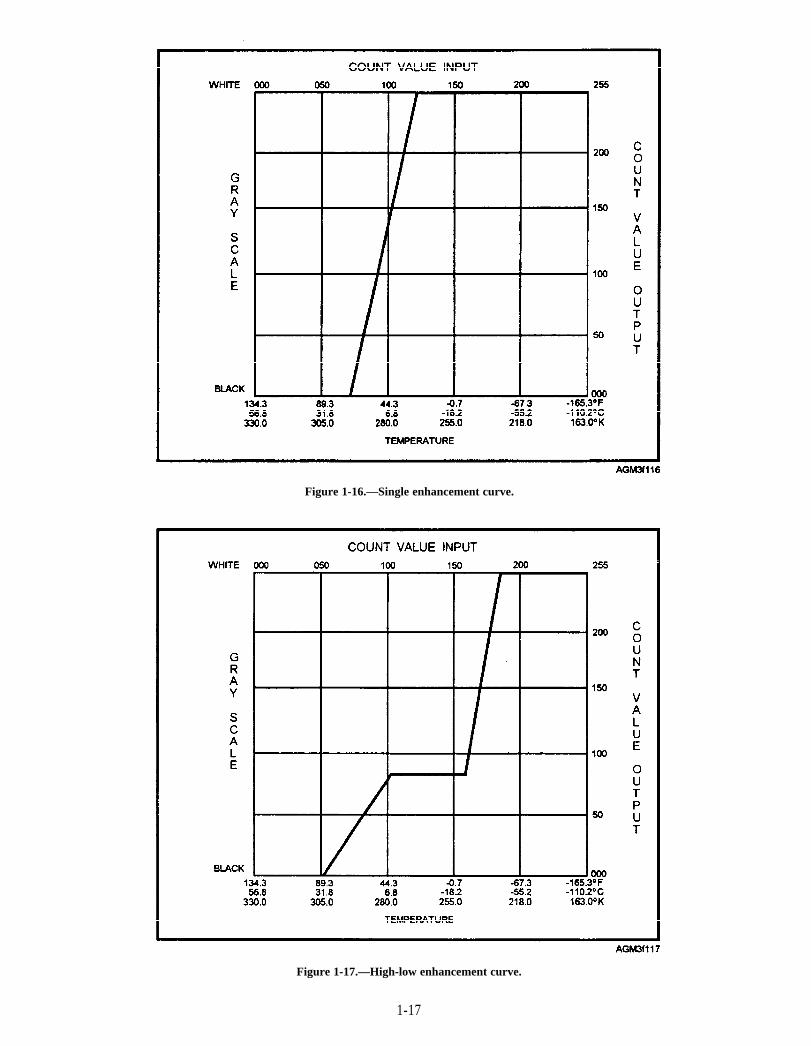
Figure 1-16.—Single enhancement curve.
Figure 1-17.—High-low enhancement curve.
1-17
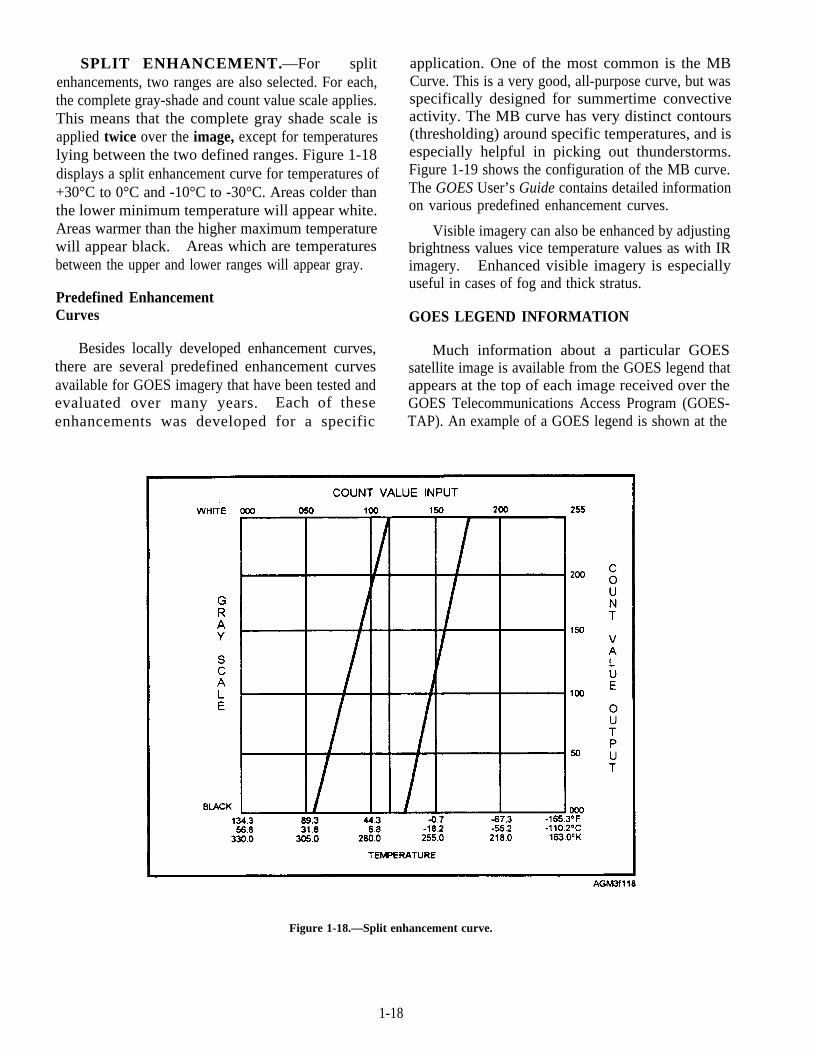
SPLIT ENHANCEMENT.—For splitenhancements, two ranges are also selected. For each,the complete gray-shade and count value scale applies.This means that the complete gray shade scale isapplied twice over the image, except for temperatureslying between the two defined ranges. Figure 1-18displays a split enhancement curve for temperatures of+30°C to 0°C and -10°C to -30°C. Areas colder thanthe lower minimum temperature will appear white.Areas warmer than the higher maximum temperaturewill appear black. Areas which are temperaturesbetween the upper and lower ranges will appear gray.
Predefined EnhancementCurves
application. One of the most common is the MBCurve. This is a very good, all-purpose curve, but wasspecifically designed for summertime convectiveactivity. The MB curve has very distinct contours(thresholding) around specific temperatures, and isespecially helpful in picking out thunderstorms.Figure 1-19 shows the configuration of the MB curve.The GOES User’s Guide contains detailed informationon various predefined enhancement curves.
Visible imagery can also be enhanced by adjustingbrightness values vice temperature values as with IRimagery. Enhanced visible imagery is especiallyuseful in cases of fog and thick stratus.
GOES LEGEND INFORMATION
Besides locally developed enhancement curves, Much information about a particular GOESthere are several predefined enhancement curves satellite image is available from the GOES legend thatavailable for GOES imagery that have been tested and appears at the top of each image received over theevaluated over many years. Each of these GOES Telecommunications Access Program (GOES-enhancements was developed for a specific TAP). An example of a GOES legend is shown at the
Figure 1-18.—Split enhancement curve.
1-18

MB Enhancement
Figure 1-19.—The GOES MB enhancement curve.
1-19
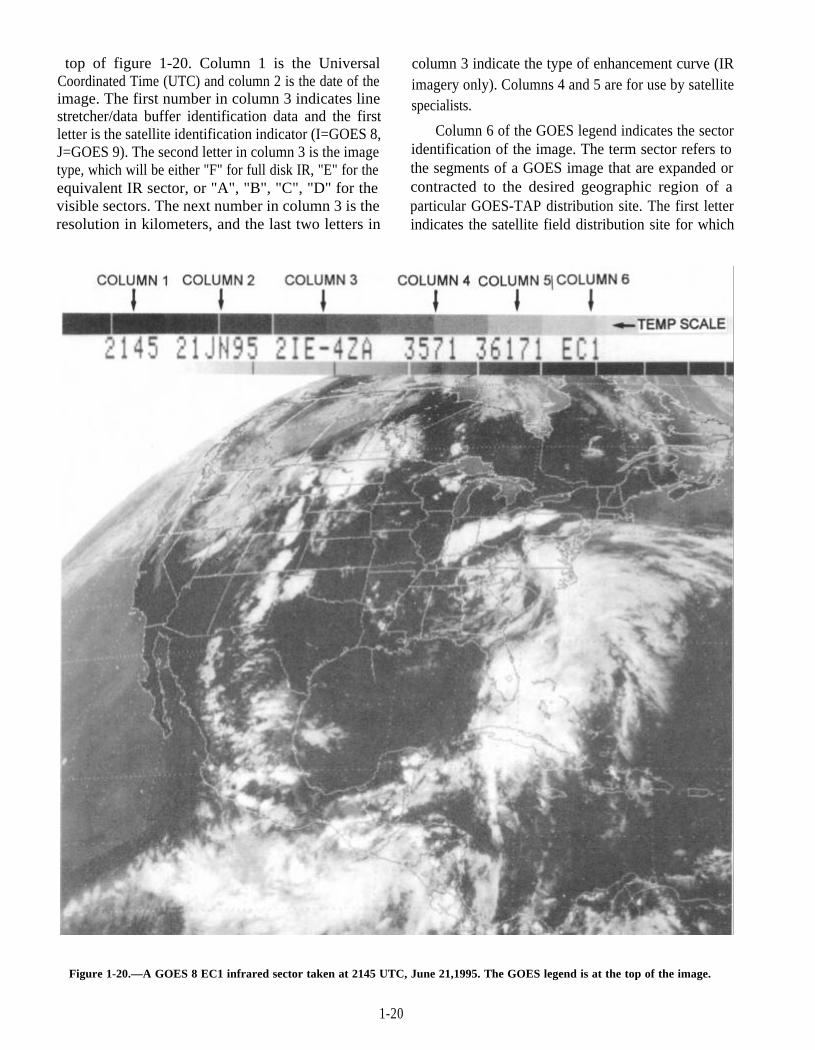
top of figure 1-20. Column 1 is the UniversalCoordinated Time (UTC) and column 2 is the date of theimage. The first number in column 3 indicates linestretcher/data buffer identification data and the firstletter is the satellite identification indicator (I=GOES 8,J=GOES 9). The second letter in column 3 is the imagetype, which will be either "F" for full disk IR, "E" for theequivalent IR sector, or "A", "B", "C", "D" for thevisible sectors. The next number in column 3 is theresolution in kilometers, and the last two letters in
column 3 indicate the type of enhancement curve (IRimagery only). Columns 4 and 5 are for use by satellitespecialists.
Column 6 of the GOES legend indicates the sectoridentification of the image. The term sector refers tothe segments of a GOES image that are expanded orcontracted to the desired geographic region of aparticular GOES-TAP distribution site. The first letterindicates the satellite field distribution site for which
Figure 1-20.—A GOES 8 EC1 infrared sector taken at 2145 UTC, June 21,1995. The GOES legend is at the top of the image.
1-20

the sector was generated, such as "D" for Washington,D.C, or "S" for San Francisco. The next letter indicatesthe sector resolution in kilometers, that is A= 1 km, B =2 km, C = 4 km, and D = 8 km (IR only). The last digitindicates the identification number of the specificsector.
GOES TEMPERATURE SCALE
The temperature scale appears only on IR and WVimagery, and it appears below the legend. Thetemperature scale is divided into 10°C increments witha range from +50°C to -100°C. It has 15 temperatureblocks separated by white or black vertical lines. Thetemperature scale is very useful in cloud and non-cloudidentification.
Q25.
Q26.
Q27.
Q28.
Q29.
REVIEW QUESTIONS
What is the purpose of enhancing satelliteimagery?
What is a major disadvantage of providing toomuch definition to user-defined enhancementcurves?
Which type of user-defined enhancement curveapplies two complete gray-shade and countvalue scales for two separate temperatureranges?
What is indicated in column 6 of the GOESlegend?
The GOES temperature scale is normallydivided into segments of how many degrees?
METHODS OF ACQUIRING IMAGERY
LEARNING OBJECTIVE: Identify the variousmethods used to acquire environmentalsatellite imagery.
There are several ways to receive satelliteimagery: weather facsimile broadcast; Navy Ocean-ographic Data Distribution System (NODDS); GOESTelecommunications Access Program (GOES-TAP);satellite direct-readout service; weather facsimile ser-vice (WEFAX); the Internet; and AUTODIN message.
WEATHER FACSIMILE BROADCAST
Some ships may receive a low quality satelliteimage as part of the U.S. Coast Guard facsimilebroadcast. Transmitted via high-frequency (HF) radio,this broadcast transmits National Weather Service
charts and satellite imagery on a fixed schedule.Schedules and frequencies for facsimile broadcastsoriginating from CONUS stations (San Francisco,New Orleans, Boston, and Kodiak) are available overthe Internet. Several other countries, such as Japan andIndia, also transmit weather charts and satelliteimagery via HF. A listing of all maritime weatherbroadcast frequencies is available in the latest editionof Worldwide Marine Radiofacsimile BroadcastSchedules published by NOAA.
NAVY OCEANOGRAPHIC DATADISTRIBUTION SYSTEM
The Navy Oceanographic Data DistributionSystem (NODDS) is a dial-up data service availablefrom FNMOC. Although originally designed totransmit graphical data fields for portable computersystems, selected satellite imagery is now availablewithin a few hours of sensing. Authorized users mayaccess the system from anywhere in the world viacomputer modem through the U.S. Govemment-owned Internet routing networks or via direct long-distance telephone connection on commercial orDefense Switched Network (DSN) lines. Informationon NODDS satellite imagery is available in the NavyOceanographic Data Distribution System ProductsManual.
All of the satellite data available on NODDS isfrom DMSP satellites. The pictures that actuallyappear on your computer monitor may not be quite asclear as imagery from other sources. The imagery isconsidered near real-time in that it is available to theuser usually within a few hours of sensing. The DMSPsatellites collect imagery, store the information asdigital data aboard the satellite, and then dump theimagery data on command as it comes within range of areceiver site capable of copying high-resolutionimagery. DMSP imagery for specific, high-interestareas around the world may be requested fromFNMOC after some coordination.
GOES TELECOMMUNICATIONS ACCESSPROGRAM (GOES-TAP)
Ashore, Navy and Marine Corps weather stationsreceive satellite imagery primarily from the GOES-TAP service. The GOES-TAP service is operated byNESDIS, and satellite images are provided viadedicated telephone circuits. The circuits are leasedfrom commercial telephone companies and aremaintained by the telephone companies that own them.Routine satellite images are transmitted at 15-minuteintervals. The imagery is normally displayed on a
1-21
computer monitor that has control access to the variouschannels of the GOES-TAP system.
GOES-TAP users may be connected to one ofseveral satellite field distribution facilities or beconnected to another user.
When connected to a distribution hub, the usermay select several different channels of imagery sig-nals. There are several hubs located at various NationalWeather Service (NWS) forecasts offices, such SanFrancisco, Miami, and Kansas City, to name a few.
If the user is not connected directly to a hub, butconnected to another user, this arrangement is appro-priately called a slave connection. The secondary userhas no direct choice of incoming imagery signal andonly receives the data on the channel selected by theprimary user. Several Navy and Marine Corps weatherstations are connected as slaves. Slaved GOES-TAPusers must coordinate with the primary user if adifferent channel of imagery is desired.
Each channel of GOES-TAP is a separatebroadcast of imagery. One channel, for example, maycontain only alternating visual and infrared GOESsatellite images of the full disk (hemisphere) of theearth. Another channel may contain visual and infraredGOES images of only the southeastern United States.A third channel may contain imagery from theEuropean METEOSAT. Yet another channel maycontain high-resolution picture transmission (HRPT)imagery from a NOAA satellite. Enhanced infraredimagery from GOES is also routinely available viaGOES-TAP.
Most GOES-TAP data is processed and analyzedby using a desktop computer with a color videomonitor. The monitor is used to display both theimagery and the control menus. Initial issueequipment was the GOES-TAP Imaging System(GTIS), which used a Unisys 80386 desktop computer.Most of these systems have been replaced by theMeteorology and Oceanography (METOC) IntegratedData Display System (MIDDS). A laser printer may beconnected to either system to provide hard copy printsof the imagery. Although hard copies of selectedimages may be made, hard copy quality is a function ofthe printer or imagery connected to the system. Similarequipment called the Naval Satellite Display System-Enhanced (or NSDS-E) is used a t mostNAVMETOCCOM centers. This system has theadditional capability of copying NOAA polar-orbiterand DMSP imagery. Further changes to GOES-TAPprocessing equipment are very likely in the future.
Almost all satellite imagery processors havelooper capability. The primary application of anylooper system is to store and display a series ofgeostationary satellite images of the same area in asequence that shows the movement of clouds andweather systems. Individual satellite images may alsobe displayed and studied. The various other displayoptions, such as map overlay and enhancement, aremenu-driven for both the GTIS and the MIDDS as isthe channel selection. Instructions for using GTIS arecontained in the User’s Manual provided with eachinstallation.
The MIDDS has a colorized custom enhancementfunction and a few systems have the additional capa-bility of obtaining satellite images via WEFAXbroadcast, HF radio, or Automatic PictureTransmission (APT) receiver. Instructions for obtain-ing satellite information via MIDDS is contained in theMeteorology and Oceanography (METOC) IntegratedData Display System (MIDDS) User’s Guide.
DIRECT-READOUT SERVICE
Direct-readout service is an image-datatransmission designed to be received by user-operatedsatellite receiver stations, such as the AN/SMQ-11satelli te terminal and the Interim MobileOceanography Support System (IMOSS) satellitemodule. The raw satellite signals are converted to animage by the receiver station. Direct-readout service isavailable from all polar-orbiting meteorologicalsatellites. This service is generally not available fromgeostationary satellites, although a few weatheractivities have acquired geostationary direct-readoutsystems from commercial contractors.
One type of direct-readout service that is providedby the NOAA satellites is the Automatic PictureTransmission (APT) service. APT service provides acontinuous transmission of both visual and infraredsatellite imagery. The NOAA satellites transmit a pairof images, one visual and one infrared, over sunlightportions of the earth, and two different infraredchannels over the dark side of the earth. The scan rateis 120 lines per minute at 4-kilometer resolution. Theamount of data received by a station depends on thelocation of the satellite subpoint; the further thesubpoint falls from the station, the smaller the area ofcoverage becomes.
The received APT images are ungridded—nolatitude/longitude lines nor land/water or geographicalboundaries are added to the image (fig. 1-21). APTservice is also available from foreign polar-orbiting
1-22
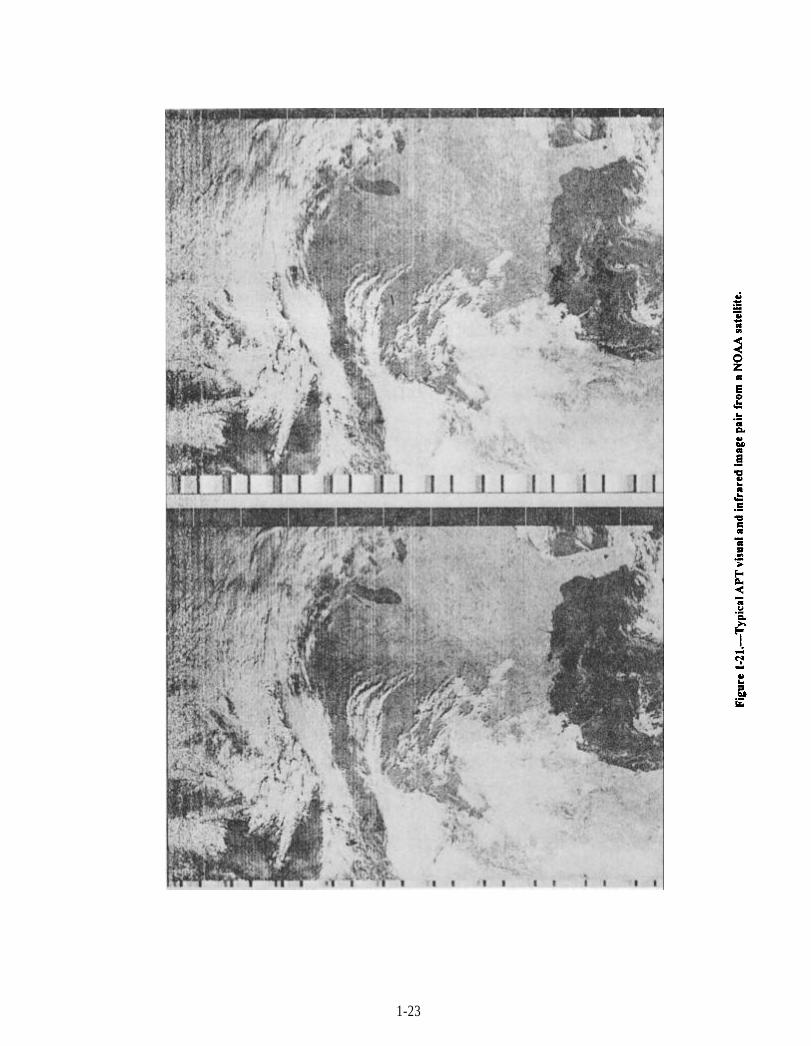
Figure 1-21
1-23
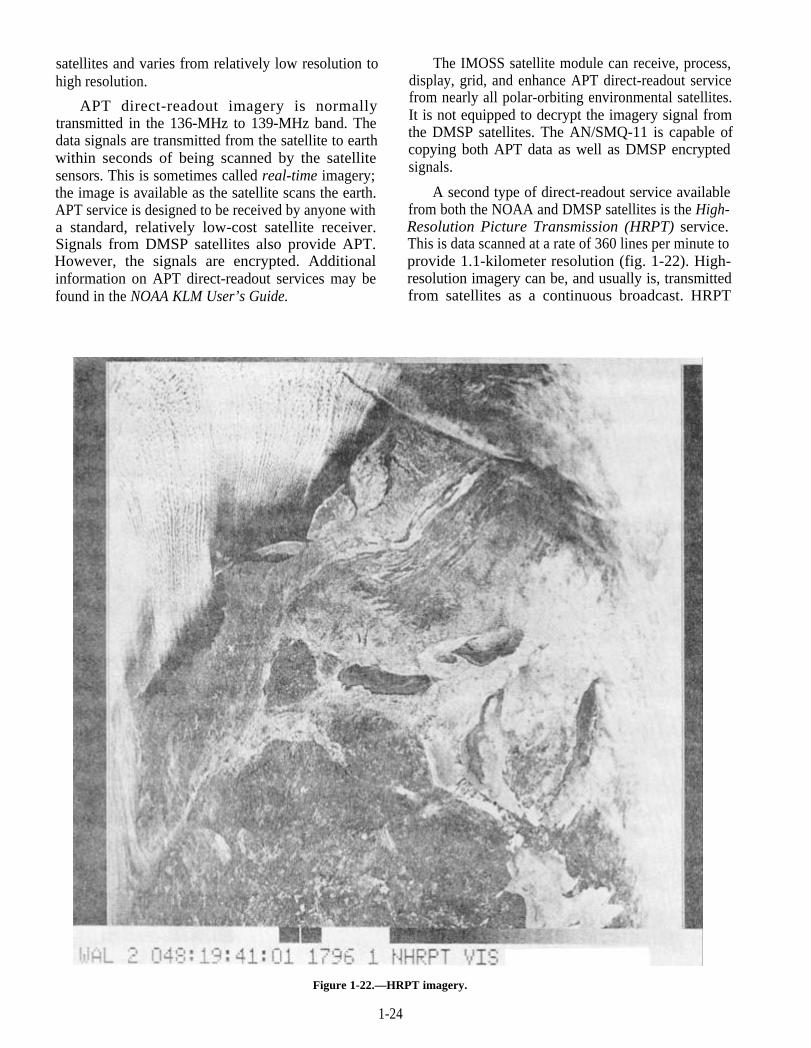
satellites and varies from relatively low resolution tohigh resolution.
APT direct-readout imagery is normallytransmitted in the 136-MHz to 139-MHz band. Thedata signals are transmitted from the satellite to earthwithin seconds of being scanned by the satellitesensors. This is sometimes called real-time imagery;the image is available as the satellite scans the earth.APT service is designed to be received by anyone witha standard, relatively low-cost satellite receiver.Signals from DMSP satellites also provide APT.However, the signals are encrypted. Additionalinformation on APT direct-readout services may befound in the NOAA KLM User’s Guide.
The IMOSS satellite module can receive, process,display, grid, and enhance APT direct-readout servicefrom nearly all polar-orbiting environmental satellites.It is not equipped to decrypt the imagery signal fromthe DMSP satellites. The AN/SMQ-11 is capable ofcopying both APT data as well as DMSP encryptedsignals.
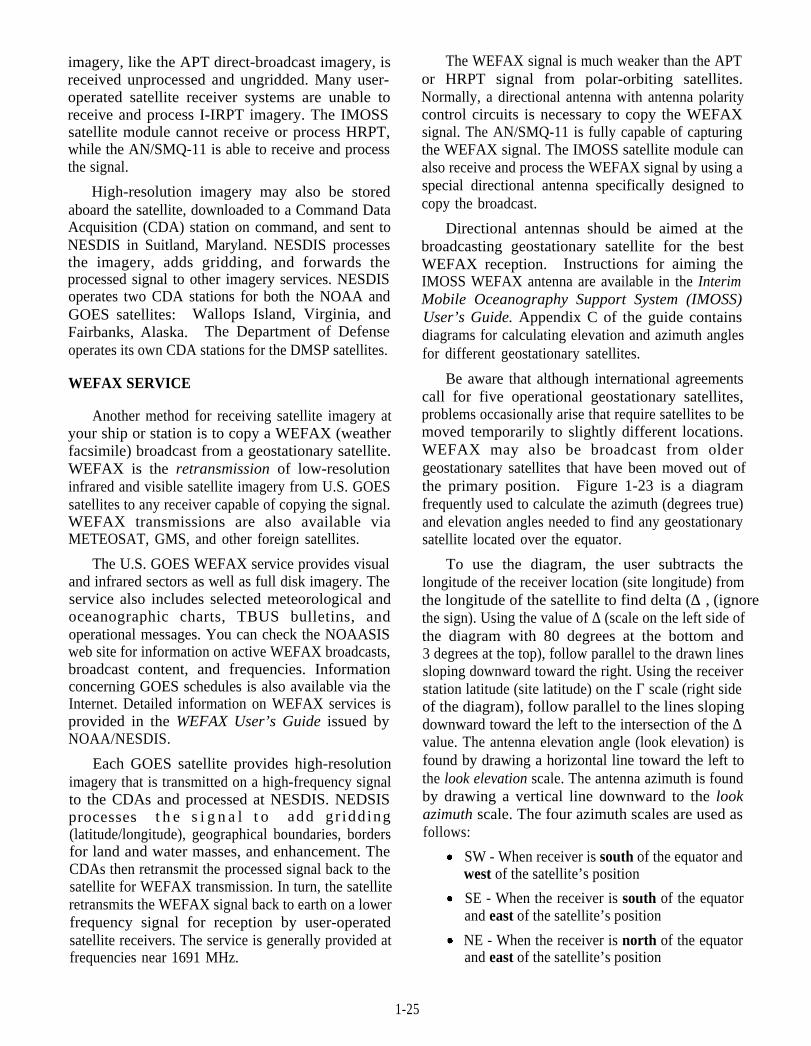
A second type of direct-readout service availablefrom both the NOAA and DMSP satellites is the High-Resolution Picture Transmission (HRPT) service.This is data scanned at a rate of 360 lines per minute toprovide 1.1-kilometer resolution (fig. 1-22). High-resolution imagery can be, and usually is, transmittedfrom satellites as a continuous broadcast. HRPT
Figure 1-22.—HRPT imagery.
1-24
imagery, like the APT direct-broadcast imagery, isreceived unprocessed and ungridded. Many user-operated satellite receiver systems are unable toreceive and process I-IRPT imagery. The IMOSSsatellite module cannot receive or process HRPT,while the AN/SMQ-11 is able to receive and processthe signal.
High-resolution imagery may also be storedaboard the satellite, downloaded to a Command DataAcquisition (CDA) station on command, and sent toNESDIS in Suitland, Maryland. NESDIS processesthe imagery, adds gridding, and forwards theprocessed signal to other imagery services. NESDISoperates two CDA stations for both the NOAA andGOES satellites: Wallops Island, Virginia, andFairbanks, Alaska. The Department of Defenseoperates its own CDA stations for the DMSP satellites.
WEFAX SERVICE
Another method for receiving satellite imagery atyour ship or station is to copy a WEFAX (weatherfacsimile) broadcast from a geostationary satellite.WEFAX is the retransmission of low-resolutioninfrared and visible satellite imagery from U.S. GOESsatellites to any receiver capable of copying the signal.WEFAX transmissions are also available viaMETEOSAT, GMS, and other foreign satellites.
The U.S. GOES WEFAX service provides visualand infrared sectors as well as full disk imagery. Theservice also includes selected meteorological andoceanographic charts, TBUS bulletins, andoperational messages. You can check the NOAASISweb site for information on active WEFAX broadcasts,broadcast content, and frequencies. Informationconcerning GOES schedules is also available via theInternet. Detailed information on WEFAX services isprovided in the WEFAX User’s Guide issued byNOAA/NESDIS.
Each GOES satellite provides high-resolutionimagery that is transmitted on a high-frequency signalto the CDAs and processed at NESDIS. NEDSISprocesses t h e s i g n a l t o add gr idding(latitude/longitude), geographical boundaries, bordersfor land and water masses, and enhancement. TheCDAs then retransmit the processed signal back to thesatellite for WEFAX transmission. In turn, the satelliteretransmits the WEFAX signal back to earth on a lowerfrequency signal for reception by user-operatedsatellite receivers. The service is generally provided atfrequencies near 1691 MHz.
The WEFAX signal is much weaker than the APTor HRPT signal from polar-orbiting satellites.Normally, a directional antenna with antenna polaritycontrol circuits is necessary to copy the WEFAXsignal. The AN/SMQ-11 is fully capable of capturingthe WEFAX signal. The IMOSS satellite module canalso receive and process the WEFAX signal by using aspecial directional antenna specifically designed tocopy the broadcast.
Directional antennas should be aimed at thebroadcasting geostationary satellite for the bestWEFAX reception. Instructions for aiming theIMOSS WEFAX antenna are available in the InterimMobile Oceanography Support System (IMOSS)User’s Guide. Appendix C of the guide containsdiagrams for calculating elevation and azimuth anglesfor different geostationary satellites.
Be aware that although international agreementscall for five operational geostationary satellites,problems occasionally arise that require satellites to bemoved temporarily to slightly different locations.WEFAX may also be broadcast from oldergeostationary satellites that have been moved out ofthe primary position. Figure 1-23 is a diagramfrequently used to calculate the azimuth (degrees true)and elevation angles needed to find any geostationarysatellite located over the equator.
To use the diagram, the user subtracts thelongitude of the receiver location (site longitude) fromthe longitude of the satellite to find delta (∆), (ignorethe sign). Using the value of ∆ (scale on the left side ofthe diagram with 80 degrees at the bottom and3 degrees at the top), follow parallel to the drawn linessloping downward toward the right. Using the receiverstation latitude (site latitude) on the Γ scale (right sideof the diagram), follow parallel to the lines slopingdownward toward the left to the intersection of the ∆value. The antenna elevation angle (look elevation) isfound by drawing a horizontal line toward the left tothe look elevation scale. The antenna azimuth is foundby drawing a vertical line downward to the lookazimuth scale. The four azimuth scales are used asfollows:
SW - When receiver is south of the equator andwest of the satellite’s position
SE - When the receiver is south of the equatorand east of the satellite’s position
NE - When the receiver is north of the equatorand east of the satellite’s position
1-25
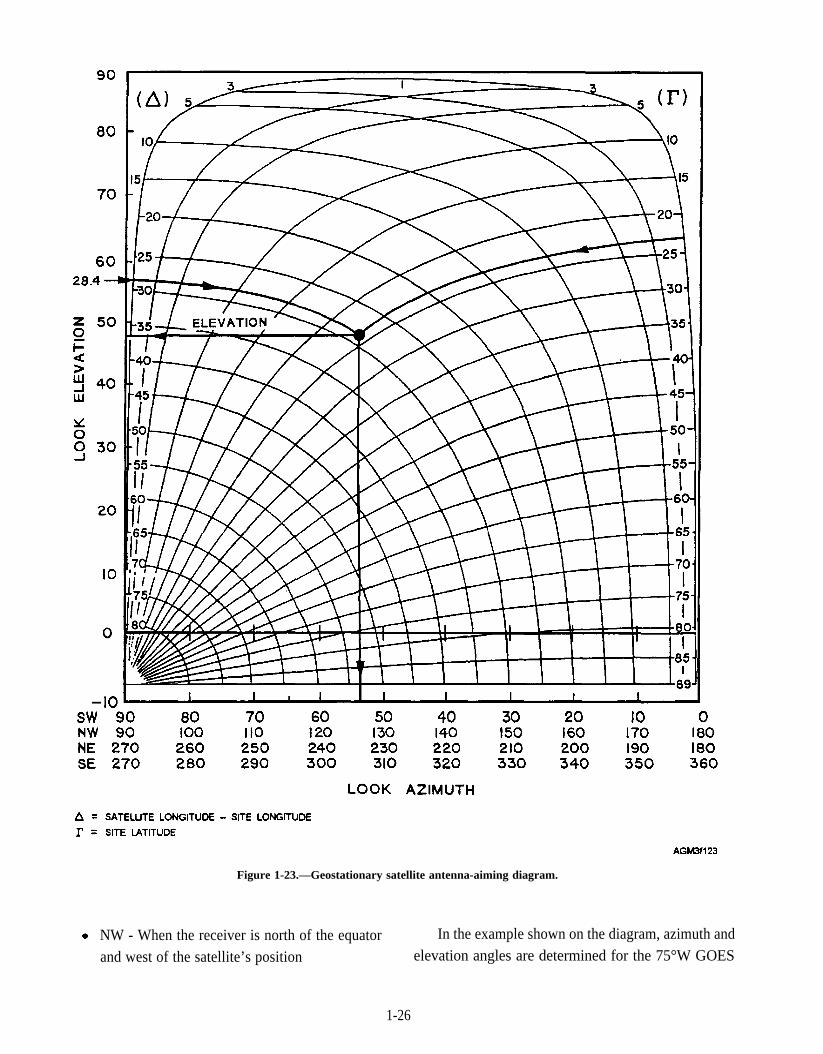
Figure 1-23.—Geostationary satellite antenna-aiming diagram.
NW - When the receiver is north of the equator In the example shown on the diagram, azimuth and
and west of the satellite’s position elevation angles are determined for the 75°W GOES
1-26
from a receiver site at 103.4°W longitude, 23.0°Nlatitude. The ∆ value of 28.4° is the differencebetween 103.4° and 075.0°, ignoring the sign. Theantenna elevation is about 48 degrees, and the azimuthon the NW scale is 126 degrees.
INTERNET
In recent years, the Internet has become a veryefficient method of acquiring satellite imagery. Theworldwide web is the fastest way to acquire a widevariety of real-time satellite imagery. NOAA/NEDSIShas its own website (NOAASIS) along with severalprivate companies and universities. Of particularimportance is that these sites can be reached aboardships equipped with Internet access. FNMOC can alsotransmit satellite imagery over the military Internet(NIPRNET and SIPRNET). This imagery can then beviewed using Joint METOC Viewer (JMV) softwarewith any computer system able to process the data.Details on the JMV and the NIPRNET/SIPRNETrouting networks is covered in later modules. TheNaval Research Laboratory in Monterey, California,has an outstanding Internet homepage that provides atremendous amount of satellite imagery data. Itcontains general information relating to environmentalsatellites and provides guidance packages for new andexperimental satellite products. The website alsoprovides links to various other satellite imagerysources.
AUTODIN MESSAGE
The Automatic Digital Network (AUTODIN) isthe U.S. Navy’s most common method of transmittingmessage traffic between commands. Satellite imagescan also be sent via AUTODIN in greatly compactedform. This method is only used in rare cases, mostoften used by at-sea platforms with little or noenvironmental satellite reception capability and noInternet access. Portions ofreceived images that are ofinterest to a ship can be extracted, compacted, encodedfor transmission, and sent via AUTODIN link to theship from any other command (normally Meteorologyand Oceanography centers). The AUTODIN encodedimages are then available for reprocessing and displayby the ship. Requests for satellite imagery viaAUTODIN are carried out on a case-by-case basis.Requests should be limited to information that isessential to operations, as too much data will slowother AUTODIN message traffic.
Q30.
Q31.
Q32.
Q33.
Q34.
Q35.
Q36.
Q37.
Q38.
REVIEW QUESTIONS
Which U.S. Government agency provides HFbroadcasts of satellite imagery?
What type of satellite imagery is available fromNODDS?
How is satellite imagery acquired by mostshore-based weather stations?
What is the purpose of a satellite looper?
What is the advantage of APT direct-readoutimagery?
How does the resolution between APT andHRPT data compare?
What type of information is available from theWEFAX broadcast?
What is the fastest way to acquire a wide varietyof satellite imagery?
How can units with no environmental satellitereception capability or Internet access stillreceive satellite imagery?
SATELLITE RECEIVER SYSTEMS
LEARNING OBJECTIVES: Identify the twoprimary satellite receiver systems used toacquire direct-readout imagery and WEFAXproducts. Identify the operator’s manuals thatprovide detailed instructions for use of thesystems.
Two satellite receiver systems are routinelyoperated by Navy and Marine Corps weatherobservers. The AN/SMQ-11 system is used at majorshore installations and aboard all aircraft carriers.Navy Mobile Environmental Teams (METS) use theoptional satellite module of the IMOSS to receivesatellite imagery.
AN/SMQ-11 METEOROLOGICALDATA SET
The AN/SMQ-11 satellite receiver station isinstalled aboard most U.S. Navy ships staffed byAerographer’s Mates, at many Naval Meteorology andOceanography Command activities, and in MarineCorps Mobile Meteorological Vans (METVANs).The ANISMQ-11 may receive, process, display, grid,and enhance DMSP imagery and both APT and HRPT
1-27
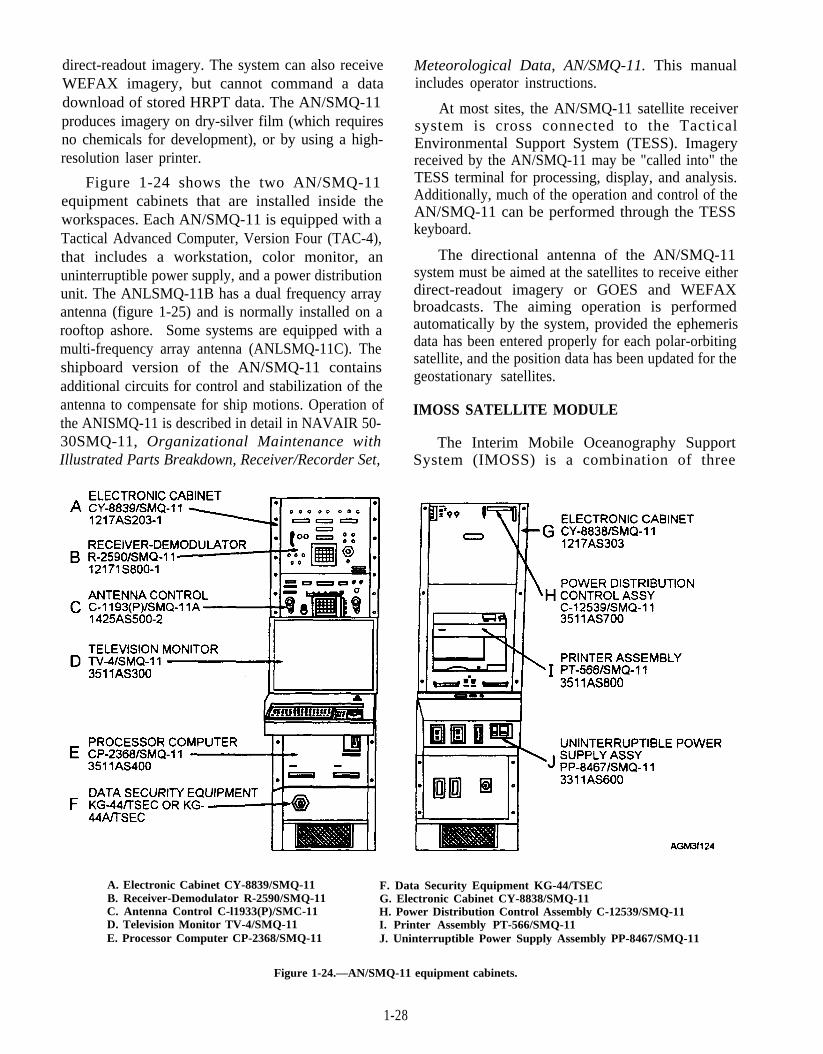
direct-readout imagery. The system can also receiveWEFAX imagery, but cannot command a datadownload of stored HRPT data. The AN/SMQ-11produces imagery on dry-silver film (which requiresno chemicals for development), or by using a high-resolution laser printer.
Figure 1-24 shows the two AN/SMQ-11equipment cabinets that are installed inside theworkspaces. Each AN/SMQ-11 is equipped with aTactical Advanced Computer, Version Four (TAC-4),that includes a workstation, color monitor, anuninterruptible power supply, and a power distributionunit. The ANLSMQ-11B has a dual frequency arrayantenna (figure 1-25) and is normally installed on arooftop ashore. Some systems are equipped with amulti-frequency array antenna (ANLSMQ-11C). Theshipboard version of the AN/SMQ-11 containsadditional circuits for control and stabilization of theantenna to compensate for ship motions. Operation ofthe ANISMQ-11 is described in detail in NAVAIR 50-30SMQ-11, Organizational Maintenance withIllustrated Parts Breakdown, Receiver/Recorder Set,
Meteorological Data, AN/SMQ-11. This manualincludes operator instructions.
At most sites, the AN/SMQ-11 satellite receiversystem is cross connected to the TacticalEnvironmental Support System (TESS). Imageryreceived by the AN/SMQ-11 may be "called into" theTESS terminal for processing, display, and analysis.Additionally, much of the operation and control of theAN/SMQ-11 can be performed through the TESSkeyboard.
The directional antenna of the AN/SMQ-11system must be aimed at the satellites to receive eitherdirect-readout imagery or GOES and WEFAXbroadcasts. The aiming operation is performedautomatically by the system, provided the ephemerisdata has been entered properly for each polar-orbitingsatellite, and the position data has been updated for thegeostationary satellites.
IMOSS SATELLITE MODULE
The Interim Mobile Oceanography SupportSystem (IMOSS) is a combination of three
A. Electronic Cabinet CY-8839/SMQ-11 F. Data Security Equipment KG-44/TSECB. Receiver-Demodulator R-2590/SMQ-11 G. Electronic Cabinet CY-8838/SMQ-11C. Antenna Control C-l1933(P)/SMC-11 H. Power Distribution Control Assembly C-12539/SMQ-11D. Television Monitor TV-4/SMQ-11 I. Printer Assembly PT-566/SMQ-11E. Processor Computer CP-2368/SMQ-11 J. Uninterruptible Power Supply Assembly PP-8467/SMQ-11
Figure 1-24.—AN/SMQ-11 equipment cabinets.
1-28
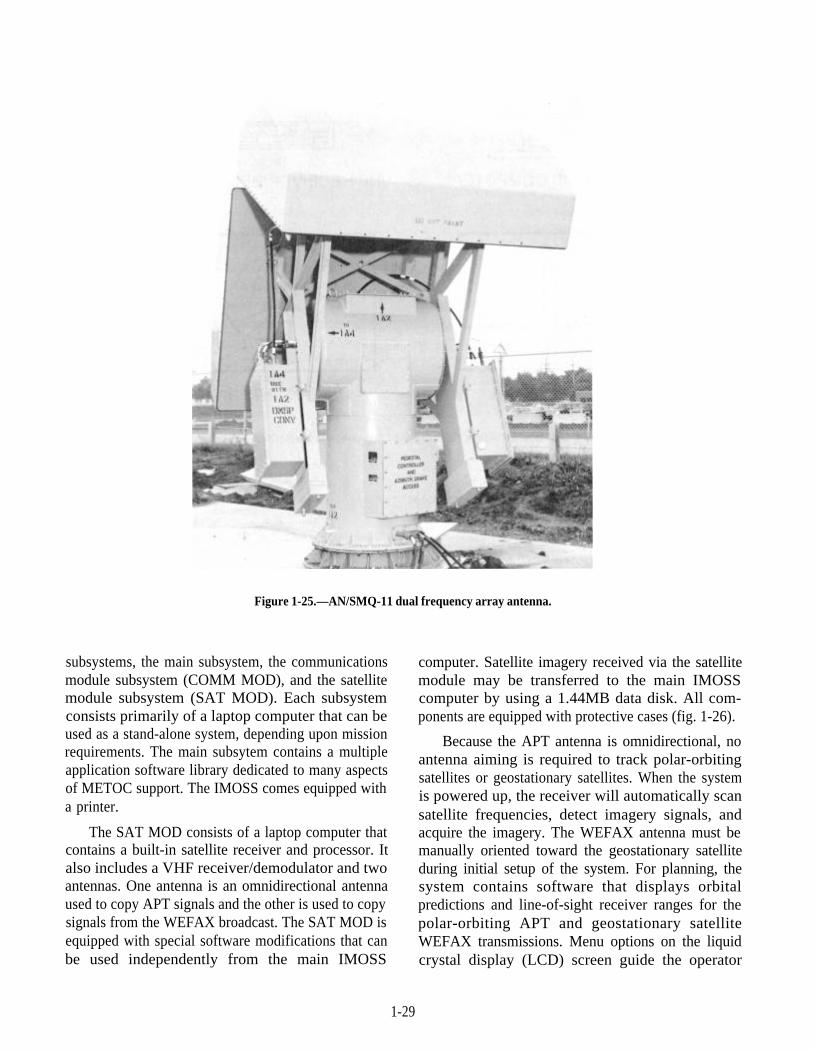
Figure 1-25.—AN/SMQ-11 dual frequency array antenna.
subsystems, the main subsystem, the communicationsmodule subsystem (COMM MOD), and the satellitemodule subsystem (SAT MOD). Each subsystemconsists primarily of a laptop computer that can beused as a stand-alone system, depending upon missionrequirements. The main subsytem contains a multipleapplication software library dedicated to many aspectsof METOC support. The IMOSS comes equipped witha printer.
The SAT MOD consists of a laptop computer thatcontains a built-in satellite receiver and processor. Italso includes a VHF receiver/demodulator and twoantennas. One antenna is an omnidirectional antennaused to copy APT signals and the other is used to copysignals from the WEFAX broadcast. The SAT MOD isequipped with special software modifications that canbe used independently from the main IMOSS
computer. Satellite imagery received via the satellitemodule may be transferred to the main IMOSScomputer by using a 1.44MB data disk. All com-ponents are equipped with protective cases (fig. 1-26).
Because the APT antenna is omnidirectional, noantenna aiming is required to track polar-orbitingsatellites or geostationary satellites. When the systemis powered up, the receiver will automatically scansatellite frequencies, detect imagery signals, andacquire the imagery. The WEFAX antenna must bemanually oriented toward the geostationary satelliteduring initial setup of the system. For planning, thesystem contains software that displays orbitalpredictions and line-of-sight receiver ranges for thepolar-orbiting APT and geostationary satelliteWEFAX transmissions. Menu options on the liquidcrystal display (LCD) screen guide the operator
1-29

Figure 1-26.—Interim Mobile Oceanography Support System (IMOSS) satellite module.
through processing, gridding, and enhancement Q41. Which satellite antenna of the IMOSS satelliteoptions for various APT direct-readout and WEFAX module must be manually oriented towardsimagery. geostationary satellites?
The operator must update satellite ephemeris datafor each polar-orbiting satellite at least once every 2weeks. Selected prediction information from Part IVof the TBUS or NASA-2 line bulletins may bemanually entered via the keyboard or copied directlyfrom a data disk. Orbital-prediction information isavailable via message over the Automated WeatherNetwork (AWN), by standard AUTODIN message, orby using a computer modem connection to varioussources, such as the Internet.
EPHEMERIS INFORMATION
LEARNING OBJECTIVES: Identify thevarious orbital prediction bulletins and explainhow they are obtained. Recognize how datafrom satellite orbital prediction bulletins isused to update user-operated satellite receivers.
Complete information on the operation of theIMOSS satellite module, including antennaorientation procedures, updating ephemeris data,gridding, and display of satellite imagery is containedin the IMOSS user’s guide. The manual is providedwith each module by the Naval Oceanographic Office.
REVIEW QUESTIONS
Q39. Which types of satellite imagery may beacquired by using the AN/SMQ-11?
Q40. Which types of satellite imagery may beacquired by using the IMOSS satellite module?
One of the most critical operations on any of thedirect-readout satellite imagery receiving systems isthe updating of ephemeris data. Ephemeris data isinformation that describes the type, orientation, andshape of a particular satellite’s orbit. Ephemeris data iscritical to satellite tracking as it provides keyinformation that allows you to determine where asatellite will be located at any given moment. Thisinformation is also used to allow the receiver system topredict where polar-orbiting satellites will be at anymoment in relation to the location of the receiver site.More importantly, ephemeris information enablesyour receiver system to earth-locate the image, that is,to establish what area of the earth is depicted in an
1-30

image received from a polar-orbiting satellite. Oncean image has been earth-located, you can then mergeappropriate geographical boundaries and alatitude/longitude grid with the image. Withoutaccurate placement of a grid system, even the clearesthigh-resolution images are nothing more thaninteresting pictures. Environmental applicationsrequire the analyst or forecaster to be able to determinewhere a feature is and how fast it is moving, which is animpossible task without an accurate reference grid.
Since geostationary satellites do not move relativeto the earth, their ephemeris data does not needfrequent updates. However, they are movedperiodically and their positions are updated via specialbulletins as necessary. These bulletins are posted onthe Internet at the NOAASIS web site.
Several software programs are in use in varioussystems to automatically calculate polar-orbitingsatellite orbits and antenna-aiming data. TheAN/SMQ-11 system and the SAT MOD both performthese functions, but rather differently. TESS, whichmay be used to control the AN/SMQ-11, also has aseparate orbital prediction function. Softwareupgrades are in development that will alleviate some ofthese differences.
In this section, we will discuss how to interpretvarious elements of ephemeris information from themost common polar-orbiting satellite predictionbulletins. The exact information required, as well asdata entry methods for each system, are discussed inthe individual operator’s manuals.
Ephemeris data for each polar-orbiting satellite isavailable from several sources. Information for theNOAA satellites is available from the NationalWeather Service telecommunications center as NOAAAPT Predict bulletins and from NASA as Two-LineOrbital Elements bulletins. Orbital information for theDMSP satellites and all foreign-operated, polar-orbiting satellites is available from the Naval SpaceSurveillance Center, Dahlgren, Virginia, as C-ElementOrbital Data and Satellite Equator Crossingsbulletins.
NOAA APT PREDICT BULLETINS (TBUS)
NOAA APT Predict bulletins, because of themessage’s data identifier TBUS, are more commonlyreferred to as TBUS data. These bulletins are routinelyprovided over the WEFAX broadcast and theautomated weather network (AWN). They are also
available on the meteorological/oceanographic datachannel of the fleet multichannel communicationsbroadcast, as well as via AUTODIN message. TBUSdata can also be obtained from the Internet through theNOAASIS website.
The TBUS bulletins are in a special U.S. nationalcode form. The code form is only used for orbitalprediction information for satellites operated by theUnited States. Complete information on this code isavailable in the NOAA KLM User’s Guide. Satellites inthe TBUS bulletin are identified in the message headerby name, such as NOAA 14, and by the U.S. satelliteidentification number, such as 37 for NOAA 12, and 38for NOAA 14. In Part IV of the bulletin, the satellitesare identified by an internationally recognized satellitenumber, such as 1994 089A for NOAA 14.
A separate NOAA APT predict bulletin iscomposed daily for each operational NOAA seriessatellite. TBUS 1 bulletins are used to indicate north tosouth (descending) daylight orbits, and TBUS 2bulletins are used to indicate south to north (ascending)daylight orbits. Each bulletin is composed of six parts:
Part I contains equator-crossing referenceinformation.
Day Part II contains satellite altitude andsubpoint coordinates in 2-minute intervals forreference orbits over the Northern Hemispherein the sunlight portion.
Day Part III contains the altitude and subpointcoordinates for the portion of the reference orbitsover the Southern Hemisphere in the sunlightportion.
Night Part II contains 2-minute coordinates forthe portion of the orbit over the NorthernHemisphere in the dark sector.
Night Part III contains coordinates for theportion of the orbit over the SouthernHemisphere in the dark sector.
Part IV contains high-precision orbitalcalculation elements, transmission frequencies,and remarks.
Parts II and III (day and night) are useful only whensatellite orbits must be manually plotted and will notbediscussed further. TESS requires information fromboth Parts I and IV, while the SAT MOD and AN/SMQ-11 require only information from Part IV.
1-31
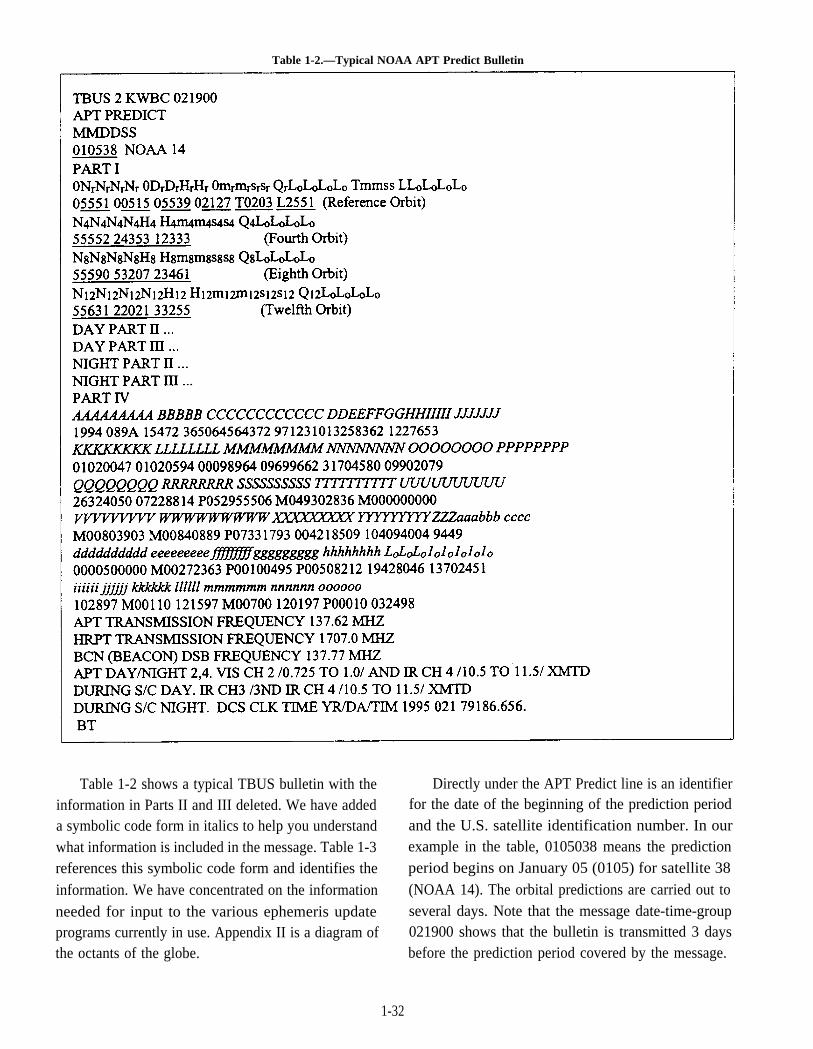
Table 1-2.—Typical NOAA APT Predict Bulletin
information in Parts II and III deleted. We have addeda symbolic code form in italics to help you understandwhat information is included in the message. Table 1-3references this symbolic code form and identifies theinformation. We have concentrated on the informationneeded for input to the various ephemeris updateprograms currently in use. Appendix II is a diagram ofthe octants of the globe.
Table 1-2 shows a typical TBUS bulletin with the Directly under the APT Predict line is an identifierfor the date of the beginning of the prediction periodand the U.S. satellite identification number. In ourexample in the table, 0105038 means the predictionperiod begins on January 05 (0105) for satellite 38(NOAA 14). The orbital predictions are carried out toseveral days. Note that the message date-time-group021900 shows that the bulletin is transmitted 3 daysbefore the prediction period covered by the message.
1-32
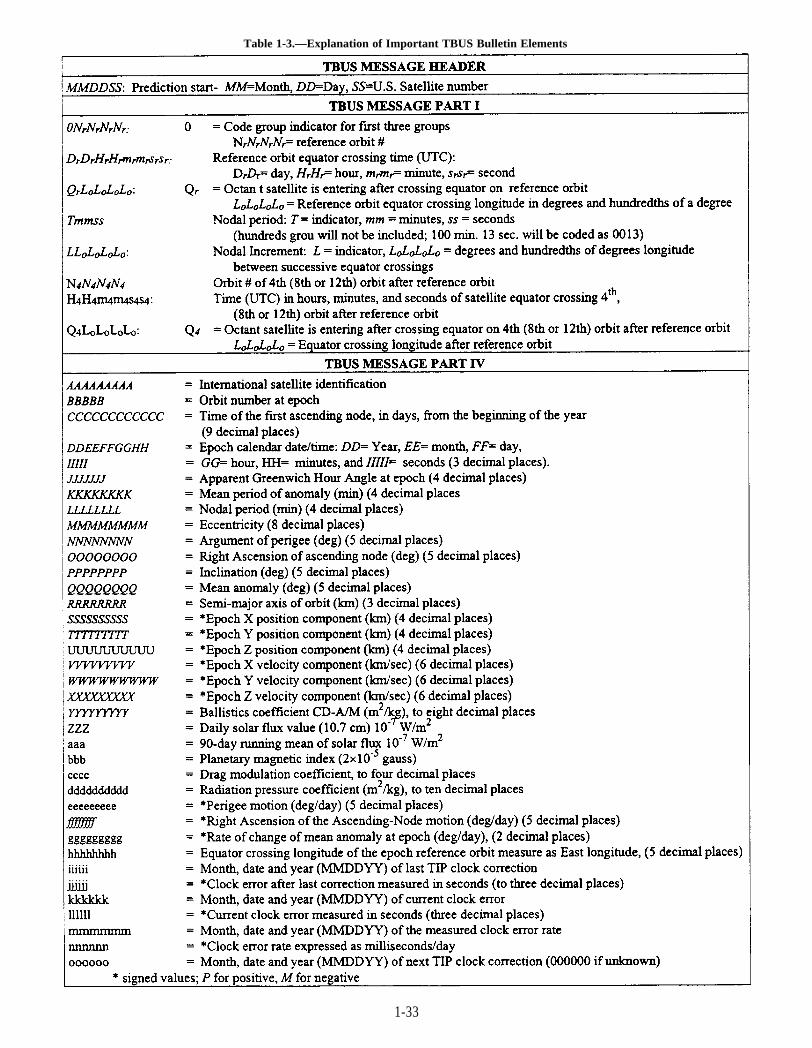
Table 1-3.—Explanation of Important TBUS Bulletin Elements
1-33
In the TBUS bulletin Part IV, all informationnecessary to calculate a satellite’s orbit and variationsin the orbit is provided. This information includes anepoch orbit number, two forms of an epoch date,position and velocity coordinates, the nodal period,and anomaly values used to determine the change inposition of the satellite over any period of time.
SAT MOD Ephemeris Updates
Like the TESS, the SAT MOD may updateephemeris information by reading a TBUS messagefile. If the appropriate TBUS bulletin is not availabledirectly from a disk file, the system may be updatedwith manual entries by using information in the TBUSbulletins. Only certain elements from each TBUSbulletin are required for each satellite in the SATMOD. The resulting ephemeris files need only beupdated every 2 weeks. Instructions for imputingTBUS bulletin data is contained in the IMOSS user’sguide.
TESS Ephemeris Updates
TESS allows satellite ephemeris data files to beupdated manually by entering selected data via thekeyboard. TESS, interfaced with a communicationssystem, may be directed to read a saved TBUS messagefile to automatically update ephemeris information.TESS may only use each particular TBUS bulletinduring a 7-day valid period following the predictiondate; in this case January 05 to January 12. Sincepredict bulletins are sent out daily, TESS may storemore than one file of ephemeris information for eachsatellite, and prediction periods may overlap.
AN/SMQ-11 Ephemeris Updates
The AN/SMQ-11 does not have the capability tointerpret imported TBUS messages to update itsephemeris files. Various parameters from the TBUSbulletin Part IV may be manually entered. The SMQ-11 requires the epoch calendar date-time-group beentered vice the epoch decimal date-time-group.
NASA TWO-LINE DATA
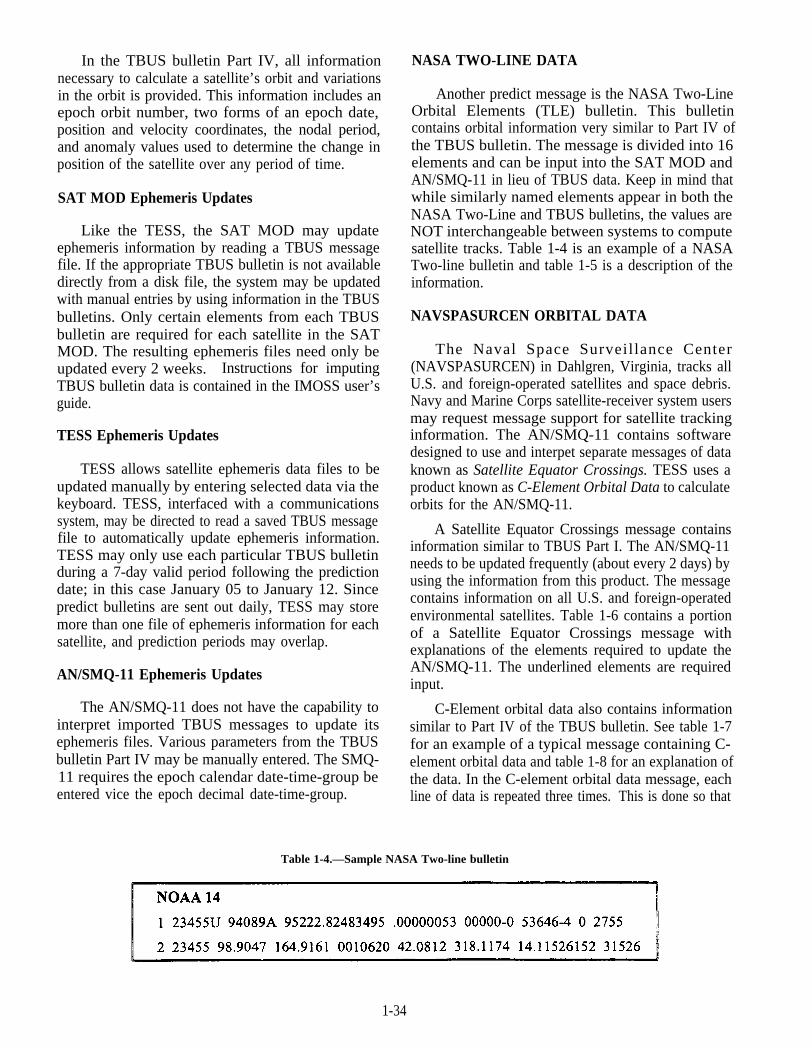
Another predict message is the NASA Two-LineOrbital Elements (TLE) bulletin. This bulletincontains orbital information very similar to Part IV ofthe TBUS bulletin. The message is divided into 16elements and can be input into the SAT MOD andAN/SMQ-11 in lieu of TBUS data. Keep in mind thatwhile similarly named elements appear in both theNASA Two-Line and TBUS bulletins, the values areNOT interchangeable between systems to computesatellite tracks. Table 1-4 is an example of a NASATwo-line bulletin and table 1-5 is a description of theinformation.
NAVSPASURCEN ORBITAL DATA
The Naval Space Surveillance Center(NAVSPASURCEN) in Dahlgren, Virginia, tracks allU.S. and foreign-operated satellites and space debris.Navy and Marine Corps satellite-receiver system usersmay request message support for satellite trackinginformation. The AN/SMQ-11 contains softwaredesigned to use and interpet separate messages of dataknown as Satellite Equator Crossings. TESS uses aproduct known as C-Element Orbital Data to calculateorbits for the AN/SMQ-11.
A Satellite Equator Crossings message containsinformation similar to TBUS Part I. The AN/SMQ-11needs to be updated frequently (about every 2 days) byusing the information from this product. The messagecontains information on all U.S. and foreign-operatedenvironmental satellites. Table 1-6 contains a portionof a Satellite Equator Crossings message withexplanations of the elements required to update theAN/SMQ-11. The underlined elements are requiredinput.
C-Element orbital data also contains informationsimilar to Part IV of the TBUS bulletin. See table 1-7for an example of a typical message containing C-element orbital data and table 1-8 for an explanation ofthe data. In the C-element orbital data message, eachline of data is repeated three times. This is done so that
Table 1-4.—Sample NASA Two-line bulletin
1-34
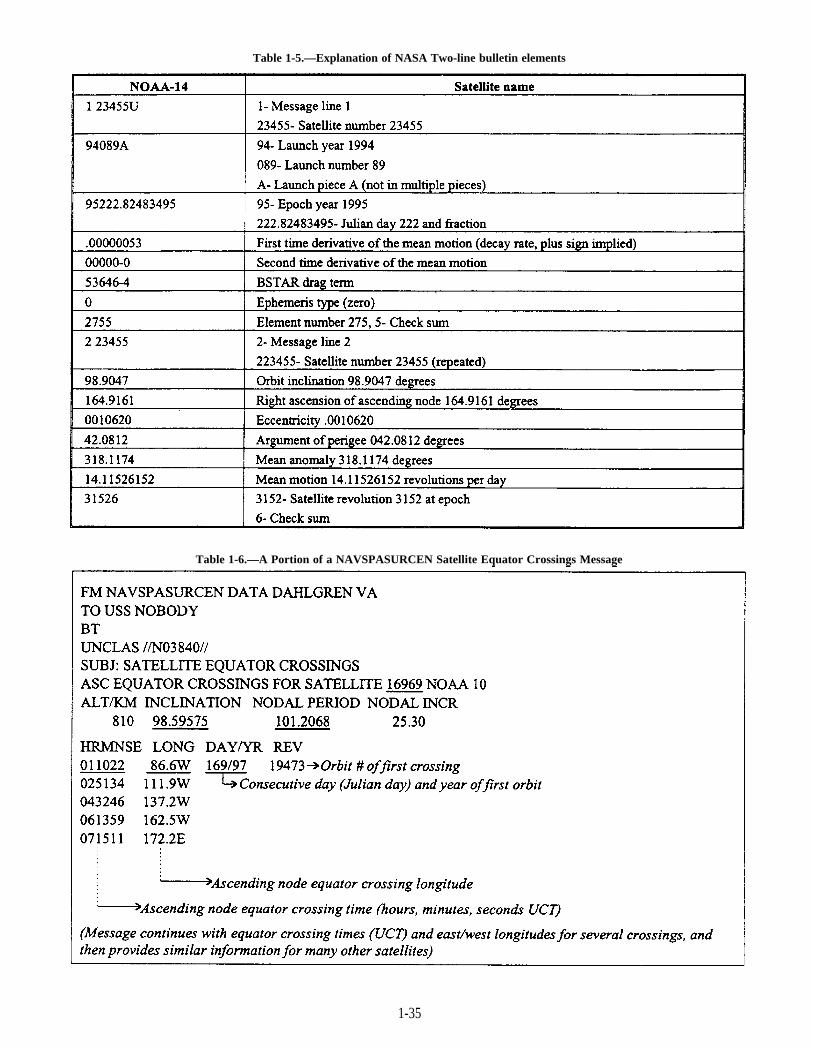
Table 1-5.—Explanation of NASA Two-line bulletin elements
Table 1-6.—A Portion of a NAVSPASURCEN Satellite Equator Crossings Message
1-35
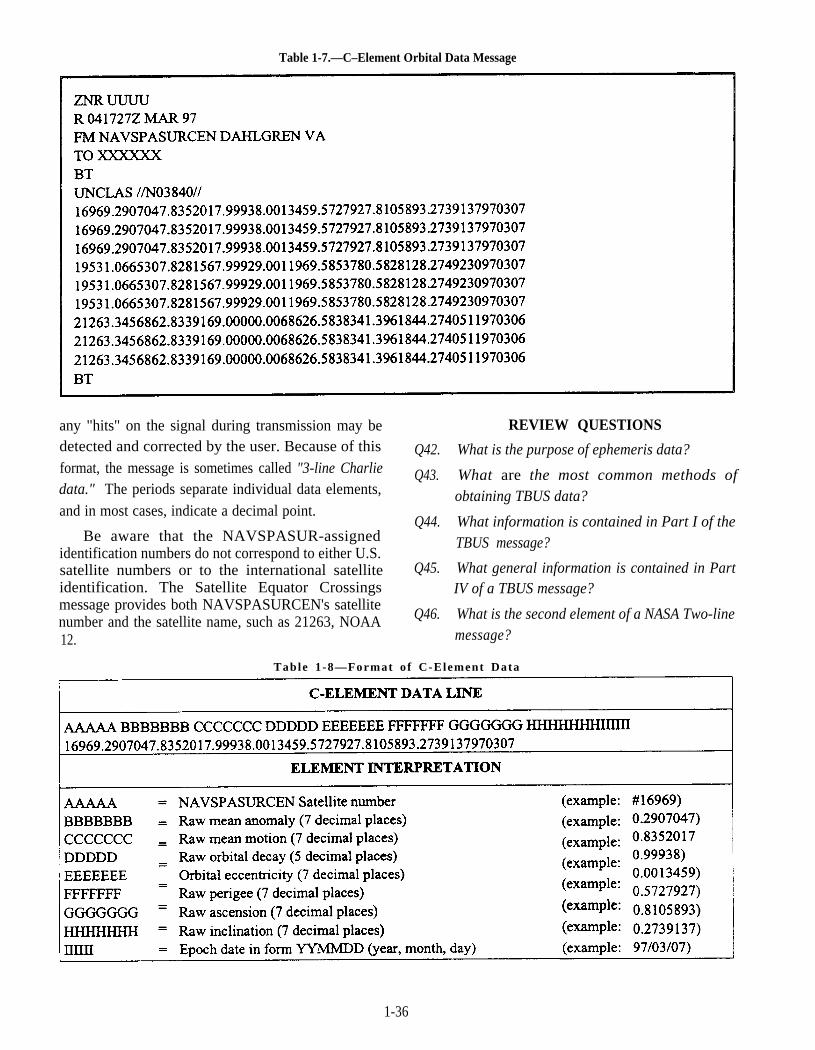
Table 1-7.—C–Element Orbital Data Message
any "hits" on the signal during transmission may be REVIEW QUESTIONSdetected and corrected by the user. Because of this Q42. What is the purpose of ephemeris data?format, the message is sometimes called "3-line Charliedata." The periods separate individual data elements,and in most cases, indicate a decimal point.
Be aware that the NAVSPASUR-assignedidentification numbers do not correspond to either U.S.satellite numbers or to the international satelliteidentification. The Satellite Equator Crossings
Q43. What are the most common methods ofobtaining TBUS data?
message provides both NAVSPASURCEN's satellitenumber and the satellite name, such as 21263, NOAA
Q44. What information is contained in Part I of theTBUS message?
Q45. What general information is contained in PartIV of a TBUS message?
12.
Q46. What is the second element of a NASA Two-linemessage?
Table 1-8—Format of C-Element Data
1-36
Q47. How often should equator-crossings ephemerisdata be updated for the AN/SMQ-11?
Q48. Where does ephemeris data for DMSP satellitesoriginate?
SUMMARY
In this chapter we have discussed the variousapplications of satellite data and some basic terms usedto discuss satellite orbits and satellite imageryacquisition. We have identified several types of
environmental satellites and explained the advantagesand disadvantages of each. We have also discussed theuse of various types of satellite imagery, and alsointroduced you to some basic imagery enhancementtechniques. We described several methods used toacquire satellite imagery, and the basic equipment usedat Navy and Marine Corps shore stations and aboardships to receive imagery. We also discussed some of thebulletins that provide the orbital data required as inputfor satellite receiver-processors.
1-37
ANSWERS TO REVIEW QUESTIONS
A1. Zero degrees (0°).
A2. Geostationary, earth-synchronous, or geosynchronous.
A3. Ascending-node.
A4. The satellite’s orbit is synchronized with the movement of the sun across the earth’ssurface.
A5. 0200 local.
A6. Major changes in a satellite’s apogee and perigee positions are caused by the shape ofthe earth, and the gravitational pull of the earth, sun, and moon.
A7. Atmospheric sounders provide vertical temperature and moisture profiles, andatmospheric stability data.
A8. Geostationary satellites are ideal for making large-scale, frequent observations overa fixed geographical area
A9. GOES East.
A10. Polar-orbiting.
A11. Because of their relatively low-altitude orbits, polar-orbiting satellites provide higherresolution data than geostationary satellites. They also provide imagery for the high-latitude and polar regions.
A12. 2700 km (1500 nmi).
A13. Fleet Numerical Meteorology and Oceanography Center (FNMOC).
A14. METEOSAT
A15. A radiometer.
A16. The sensor with 1 kilometer spatial resolution.
A17. The cold object.
A18. Longwave radiation.
A19. Red.
A20. Sand.
A21. Infrared imagery is available day and night. It is also an excellent tool foroceanographic analysis and is also helpful for identtfiing upper-level features.
A22. White.
A23. Relatively light gray shades.
A24. Water vapor imagery produces better definition of the moisture distribution andcirculation patterns in the upper atmosphere.
A25. An enhanced satellite image provides better definition, which allows the user to viewspecific details.
1-38
A26.
A27.
A28.
A29.
A30.
A31.
A32.
A33.
A34.
A35.
A36.
A37.
A38.
A39.
A40.
A41.
A42.
A43.
A44.
A45.
A46.
A47.
A48.
Too much definition in an enhancement curve may make the the imagery difficult tointerpret.
A split enhancement curve.
Sector identification information.
10°C.
U.S. Coast Guard.
DMSP.
The GOES-TAP system.
A satellite looper stores and displays a series of satellite images over the same area,which, in turn, shows the movement of cloud and weather systems.
APT satellite transmissions provide real-time data and are relatively inexpensive toobtain.
APT is at I-kilometer resolution and HRPT is at 1-kilometer resolution.
Low- and high-resolution imagery meteorological and oceanographic charts, TBUSdata, and operational messages.
The Internet.
AUTODIN message.
DMSP, APT and HRPT (NOAA), and WEFAX.
Both APT (NOAA) and WEFAX
The WEFAX antenna.
Ephemeris data allows satellite receiver systems to predict when and where satelliteswill be at any given moment. It also allows receiver systems to earth-locate satellites,which aids in gridding.
TBUS data can be obtained via AUTODIN message, AWN the fleet multichannelbroadcast, or via the Internet.
Part I of the TBUS message contains equator-crossing reference information.
Part IV of the TBUS message contains high-precision orbital calculation elements,transmission frequencies, and remarks.
The launch year, launch number, and number of launch pieces.
About every 2 days.
Naval Space Surveillance Center, Dalhgren, Virginia
1-39