Embed Size (px)
Citation preview
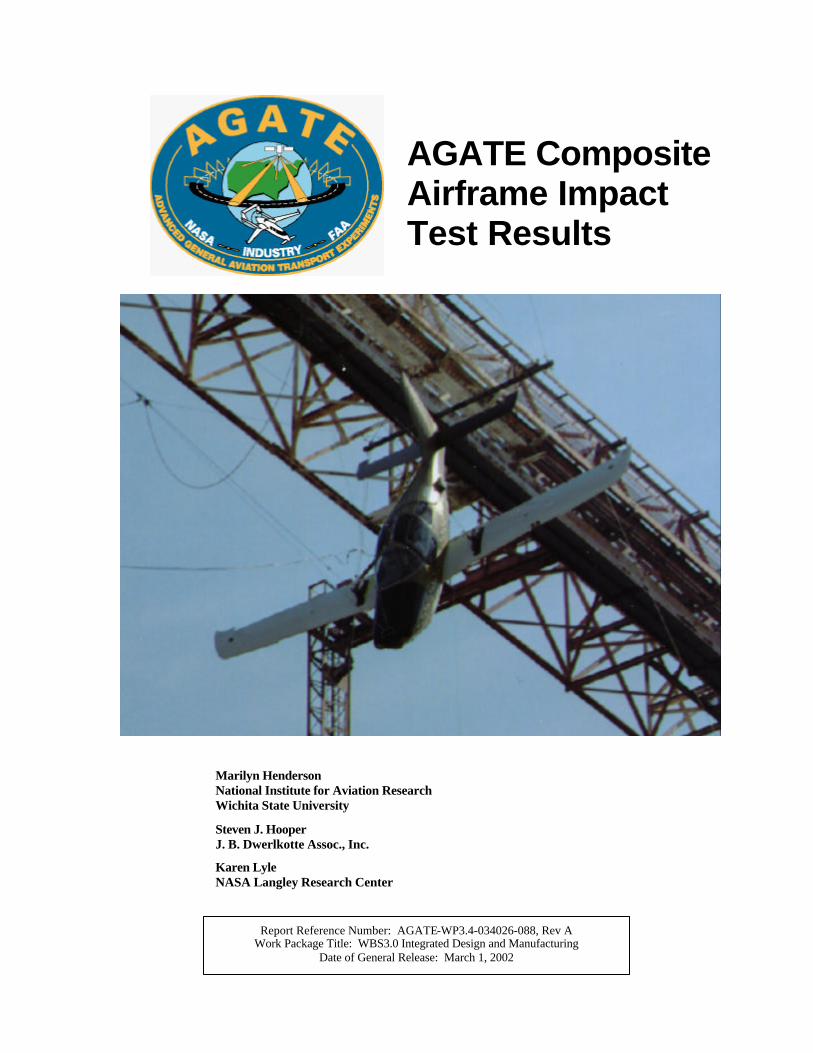
AGATE Composite Airframe Impact Test Results
Marilyn Henderson National Institute for Aviation Research Wichita State University
Steven J. Hooper J. B. Dwerlkotte Assoc., Inc.
Karen Lyle NASA Langley Research Center
Report Reference Number: AGATE-WP3.4-034026-088, Rev A Work Package Title: WBS3.0 Integrated Design and Manufacturing
Date of General Release: March 1, 2002
AGATE Composite Airframe Impact Test Results
AGATE-WP3.4-034026-088, Rev A i October 31, 2001
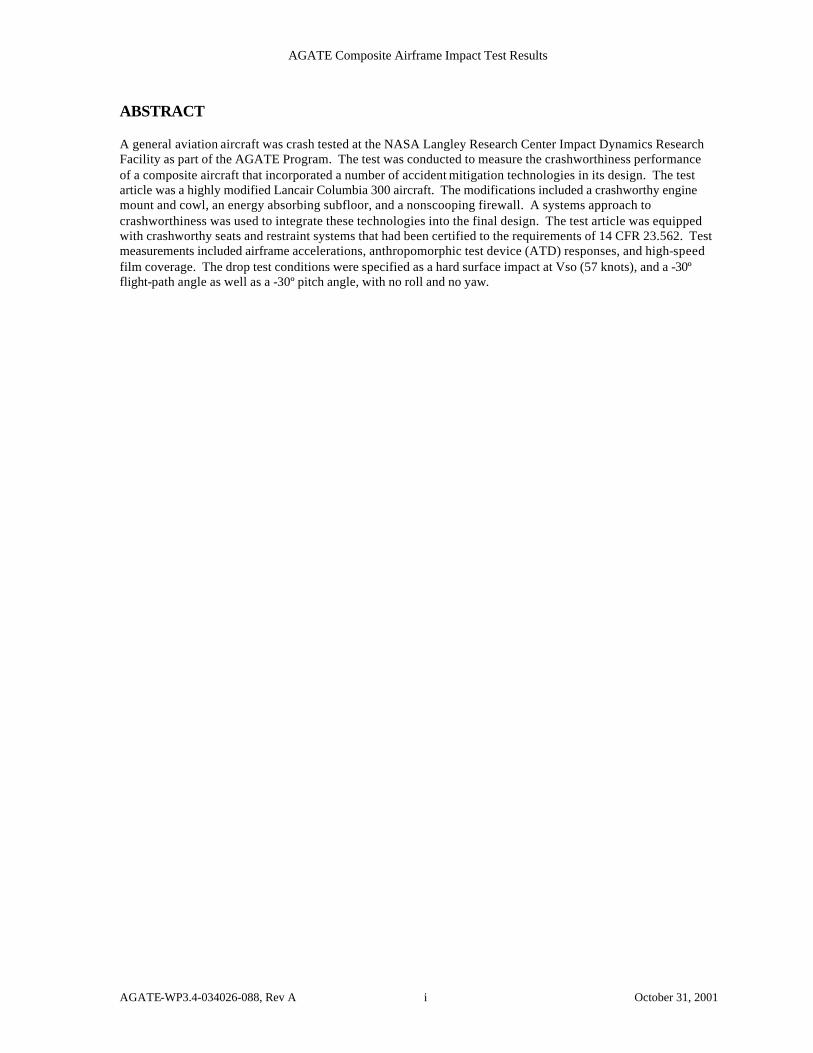
ABSTRACT A general aviation aircraft was crash tested at the NASA Langley Research Center Impact Dynamics Research Facility as part of the AGATE Program. The test was conducted to measure the crashworthiness performance of a composite aircraft that incorporated a number of accident mitigation technologies in its design. The test article was a highly modified Lancair Columbia 300 aircraft. The modifications included a crashworthy engine mount and cowl, an energy absorbing subfloor, and a nonscooping firewall. A systems approach to crashworthiness was used to integrate these technologies into the final design. The test article was equipped with crashworthy seats and restraint systems that had been certified to the requirements of 14 CFR 23.562. Test measurements included airframe accelerations, anthropomorphic test device (ATD) responses, and high-speed film coverage. The drop test conditions were specified as a hard surface impact at Vso (57 knots), and a -30º flight-path angle as well as a -30º pitch angle, with no roll and no yaw.
AGATE Composite Airframe Impact Test Results
AGATE-WP3.4-034026-088, Rev A ii October 31, 2001
TABLE OF CONTENTS
ABSTRACT............................................................................................................................................................................i
1. INTRODUCTION........................................................................................................................................................1
2. TEST DESCRIPTION ................................................................................................................................................2 2.1 TEST FACILITY............................................................................................................................................................... 2 2.2 TEST ARTICLE................................................................................................................................................................ 4 2.3 INSTRUMENTATION....................................................................................................................................................... 7 2.4 ANTHROPOMORPHIC TEST DUMMIES (ATD’S)....................................................................................................... 17 2.5 DATA ACQUISITION.................................................................................................................................................... 18 2.6 PHOTOGRAPHIC COVERAGE....................................................................................................................................... 19
2.6.1 Still Photography................................................................................................................................................19 2.6.2 Motion Pictures...................................................................................................................................................19
3. RESULTS AND DISCUSSION ..............................................................................................................................20 3.1 IMPACT CONDITIONS................................................................................................................................................... 20 3.2 DROP TEST PHOTOGRAPHS........................................................................................................................................ 21 3.3 VISUAL ASSESSMENT OF STRUCTURAL DAMAGE .................................................................................................. 26 3.4 TEST DATA................................................................................................................................................................... 34
3.4.1 Motion Tracking..................................................................................................................................................34 3.4.2 Data Channels.....................................................................................................................................................40
4. ACKNOWLEDGEMENTS .....................................................................................................................................56
5. SUMMARY AND CONCLUSIONS .....................................................................................................................56
6. REFERENCES ............................................................................................................................................................57
APPENDIX A – MASS PROPERTIES OF THE DROP TEST ARTICLE.....................................................A.1
AGATE Composite Airframe Impact Test Results
FIGURES
AGATE-WP3.4-034026-088, Rev A iii October 31, 2001
Fig. 1 – Diagram of Impact Dynamics Research Facility................................................................................................. 3 Fig. 2 – Lancair Aircraft ......................................................................................................................................................... 4 Fig. 3 – Lancair Aircraft Three-View Drawing.................................................................................................................. 4 Fig. 4 – Drop Test Article ...................................................................................................................................................... 6 Fig. 5 – Drop Test Art icle ...................................................................................................................................................... 6 Fig. 6 – Fuselage Side View ................................................................................................................................................ 10 Fig. 7 – Fuselage Isometric View....................................................................................................................................... 10 Fig. 8 – Seat and Restraint System Installations .............................................................................................................. 11 Fig. 9 – Lower Left Accelerometer Installations.............................................................................................................. 11 Fig. 10 – Upper Left Accelerometer Installations............................................................................................................ 12 Fig. 11 – Pilot’s Aft Outboard Seat Track Accelerometer Installation ........................................................................ 12 Fig. 12 – Pilot’s Forward Inboard Seat Track Accelerometer Installation .................................................................. 12 Fig. 13 – Pilot’s Forward Outboard Seat Track Accelerometer Installation ............................................................... 13 Fig. 14 – Forward Engine Accelerometer Installations................................................................................................... 13 Fig. 15 – Fuselage Left -Hand Sidewall Accelerometer Installations ........................................................................... 13 Fig. 16 – Rear Engine Accelerometer Installations ......................................................................................................... 14 Fig. 17 – Right-hand Sidewall Accelerometer Locations............................................................................................... 14 Fig. 18 – CoPilot Aft Seat Track Accelerometer Installation ........................................................................................ 14 Fig. 19 – CoPilot Forward Inboard Seat Track Accelerometer Installations............................................................... 15 Fig. 20 – CoPilot Forward Outboard Seat Track Accelerometer Installations............................................................ 15 Fig. 21 – Tail Cone Accelerometer Installations.............................................................................................................. 15 Fig. 22 – Forward Fuselage Accelerometer Installations................................................................................................ 16 Fig. 23 – Forward Fuselage Accelerometer Installations................................................................................................ 16 Fig. 24 – Forward Fuselage Accelerometer Installations................................................................................................ 16 Fig. 25 – Hybrid II ATD....................................................................................................................................................... 17 Fig. 26 – Onboard Instrumentation (Pyrotechnics communication equipment) ......................................................... 18 Fig. 27 – Onboard Instrumentation (Aircraft baggage compartment containing data acquisition and pyrotechnics
equipment).................................................................................................................................................................... 18 Fig. 28 – Camera Locations................................................................................................................................................. 19 Fig. 29 – Photo Sequence from Drop Test Video (Closer View) .................................................................................. 21 Fig. 30 – Photo Sequence from Drop Test Video (Wider Angle) ................................................................................. 22 Fig. 31 – Series of Photos from One Side Showing Drop Test Site in Detail ............................................................. 23 Fig. 32 – Wide Angle View of Drop Test Site from Above........................................................................................... 23 Fig. 33 – Series of Photos from Above Showing Drop Test Site in Detail (1) ........................................................... 24 Fig. 34 – Series of Photos from Above Showing Drop Test Site in Detail (2) ........................................................... 24 Fig. 35 – Photo from Above Showing Drop Test Site in Detail, with Dimensions.................................................... 25 Fig. 36 – Photo – Fuselage (From Front)........................................................................................................................... 27 Fig. 37 – Photo – Fuselage (From Rear)............................................................................................................................ 27 Fig. 38 – Photo – Fuselage (Wrinkle under Windshield) ............................................................................................... 28 Fig. 39 – Photo – Fuselage (From Side) ............................................................................................................................ 28 Fig. 40 – Photo - Tail ............................................................................................................................................................ 29 Fig. 41 – Photo - Cowl .......................................................................................................................................................... 29 Fig. 42 – Photo – Firewall.................................................................................................................................................... 30 Fig. 43 – Photo – Engine/Engine Mount ........................................................................................................................... 30 Fig. 44 – Photo – ATD’s ...................................................................................................................................................... 31 Fig. 45 – Photo – ATD’s ...................................................................................................................................................... 31 Fig. 46 – Photo – Pilot Seat.................................................................................................................................................. 32 Fig. 47 – Photo – CoPilot Seat ............................................................................................................................................ 32 Fig. 48 – Photo – Left Rear Seat ......................................................................................................................................... 33 Fig. 49 – Photo – Right Rear Seat....................................................................................................................................... 33 Fig. 50 – Photograph with Motion Tracking Results....................................................................................................... 34 Fig. 51 – Positions of Tracking Points ............................................................................................................................... 35
AGATE Composite Airframe Impact Test Results
FIGURES (continued)
AGATE-WP3.4-034026-088, Rev A iv October 31, 2001
Fig. 52 – Relative Angles of Tracking Points................................................................................................................... 36 Fig. 53 – Horizontal Velocities of Tracking Points ......................................................................................................... 37 Fig. 54 – Vertical Velocities of Tracking Points.............................................................................................................. 38 Fig. 55 – Resultant Velocities of Tracking Points ........................................................................................................... 38 Fig. 56 – Engine Forward (x) – Channel 22...................................................................................................................... 41 Fig. 57 – Engine Forward (z) – Channel 23...................................................................................................................... 41 Fig. 58 – Rear Engine (x) – Channel 28 ............................................................................................................................ 41 Fig. 59 – Rear Engine (z) – Channel 29............................................................................................................................. 41 Fig. 60 – Lower Engine Mount (Left, x) – Channel 7..................................................................................................... 42 Fig. 61 – Lower Engine Mount (Left, z) – Channel 8..................................................................................................... 42 Fig. 62 – Lower Engine Mount (Right, x) – Channel 39................................................................................................ 42 Fig. 63 – Lower Engine Mount (Right, z) – Channel 40 ................................................................................................ 42 Fig. 64 – Upper Engine Mount (Left, x) – Channel 15................................................................................................... 43 Fig. 65 – Upper Engine Mount (Left, z) – Channel 16 ................................................................................................... 43 Fig. 66 – Upper Engine Mount (Right, x) – Channel 47................................................................................................. 43 Fig. 67 – Upper Engine Mount (Right, z) – Channel 48 ................................................................................................. 43 Fig. 68 – Sidewall 1 (Left, x) – Channel 24...................................................................................................................... 44 Fig. 69 – Sidewall 1 (Left, z) – Channel 25 ...................................................................................................................... 44 Fig. 70 – Sidewall 2 (Left, x) – Channel 26...................................................................................................................... 44 Fig. 71 – Sidewa ll 2 (Left, z) – Channel 27 ...................................................................................................................... 44 Fig. 72 – Sidewall 1 (Right, x) – Channel 56 ................................................................................................................... 45 Fig. 73 – Sidewall 1 (Right, z) – Channel 57.................................................................................................................... 45 Fig. 74 – Sidewall 2 (Right, x) – Channel 58 ................................................................................................................... 45 Fig. 75 – Sidewall 2 (Right, z) – Channel 59.................................................................................................................... 45 Fig. 76 – Pilot Seat Track (Aft, IB, z) – Channel 17 ....................................................................................................... 46 Fig. 77 – Pilot Seat Track (Aft, OB, z) – Channel 18...................................................................................................... 46 Fig. 78 – Pilot Seat Track (Fwd, IB, x) – Channel 19..................................................................................................... 46 Fig. 79 – Pilot Seat Track (Fwd, OB, z) – Channel 20.................................................................................................... 46 Fig. 80 – Pilot Seat Track (Fwd, IB, z) – Channel 21 ..................................................................................................... 47 Fig. 81 – CoPilot Seat Track (Aft, IB, z) – Channel 49.................................................................................................. 47 Fig. 82 – CoPilot Seat Track (Aft, OB, z) – Channel 50 ................................................................................................ 47 Fig. 83 – CoPilot Seat Track (Fwd, IB, x) – Channel 51 ................................................................................................ 48 Fig. 84 – CoPilot Seat Track (Fwd, OB, z) – Channel 52 .............................................................................................. 48 Fig. 85 – CoPilot Seat Track (Fwd, IB, z) – Channel 53................................................................................................ 48 Fig. 86 – Tail Cone (y) – Channel 54 ................................................................................................................................. 49 Fig. 87 – Tail Cone (z) – Channel 55................................................................................................................................. 49 Fig. 88 – Lumbar Load (Pilot) – Channel 5 ...................................................................................................................... 50 Fig. 89 – Upper Torso Restraint (Pilot) – Channel 6....................................................................................................... 50 Fig. 90 – Pelvis (Pilot, z ) – Channel 1 .............................................................................................................................. 50 Fig. 91 – Head (Pilot, x) – Channel 2................................................................................................................................. 50 Fig. 92 – Head (Pilot, y) – Channel 3................................................................................................................................. 51 Fig. 93 – Head (Pilot, z) – Channel 4 ................................................................................................................................. 51 Fig. 94 – Lumbar Load (CoPilot) – Channel 37............................................................................................................... 51 Fig. 95 – Upper Torso Restraint (CoPilot) – Channel 38 ............................................................................................... 51 Fig. 96 – Pelvis (CoPilot, z ) – Channel 33....................................................................................................................... 52 Fig. 97 – Head (CoPilot, x) – Channel 34 ......................................................................................................................... 52 Fig. 98 – Head (CoPilot, y) – Channel 35 ......................................................................................................................... 52 Fig. 99 – Head (CoPilot, z) – Channel 36.......................................................................................................................... 52 Fig. 100 – Lumbar Load (Left Pax) – Channel 13........................................................................................................... 53 Fig. 101 – Upper Torso Restraint (Left Pax) – Channel 14............................................................................................ 53 Fig. 102 – Pelvis (Left Pax, z ) – Channel 9 ..................................................................................................................... 53 Fig. 103 – Head (Left Pax, x) – Channel 10 ..................................................................................................................... 53
AGATE Composite Airframe Impact Test Results
FIGURES (continued)
AGATE-WP3.4-034026-088, Rev A v October 31, 2001
Fig. 104 – Head (Left Pax, y) – Channel 11 ..................................................................................................................... 54 Fig. 105 – Head (Left Pax, z) – Channel 12...................................................................................................................... 54 Fig. 106 – Lumbar Load (Right Pax) – Channel 45......................................................................................................... 54 Fig. 107 – Upper Torso Restraint (Right Pax) – Channel 46......................................................................................... 54 Fig. 108 – Pelvis (Right Pax, z ) – Channel 41................................................................................................................. 55 Fig. 109 – Head (Right Pax, x) – Channel 42................................................................................................................... 55 Fig. 110 – Head (Right Pax, y) – Channel 43................................................................................................................... 55 Fig. 111 – Head (Right Pax, z) – Channel 44 ................................................................................................................... 55 TABLES Table 1 – Instrumentation Information ................................................................................................................................ 8 Table 2 – Impact Conditions................................................................................................................................................ 20 Table A.1 – Omitted Items of Mass..................................................................................................................................A.1 Table A.2 – Test Article Weight and Balance Data.......................................................................................................A.3
AGATE Composite Airframe Impact Test Results
AGATE-WP3.4-034026-088, Rev A 1 October 31, 2001
1. INTRODUCTION The AGATE Advanced Crashworthiness Group (ACG), a subset of the Integrated Design and Manufacturing Work Package, was formed to conduct research leading to significant improvements in the crashworthiness performance of general aviation aircraft. The AGATE Advanced Crashworthiness Group members included: Simula Technologies, Inc., The Lancair Company; Mod Works, Inc.; the FAA; Wichita State University (NIAR); NASA Langley Research Center; the USAF, Raytheon Aircraft, Stoddard-Hamilton Aircraft Company, and Cessna Aircraft Company. The crashworthiness initiative was, in part, a response to the General Aviation Task Force Report [1] conclusion that crashworthiness is a “technical discipline open for design improvement.” The report continued with the observation that, “This is especially true for composite aircraft, where little is known about the energy-absorbing characteristics of various design approaches …” Over the course of the AGATE program, the group’s understanding of their research goal evolved from that of just improving the safety of the vehicle to the broader goal of improving both safety and the public’s perception of general aviation safety.
DeHaven was one of the first to consider the crashworthiness problem during a vehicle design. He described it as a special form of a packaging problem [2], since the goals are much the same. One needs to protect the contents of the container from damage or injury during impact loading. The most notable difference between these problems is that the contents of a vehicle are people rather than goods and this obviously makes vehicle design a much more complicated problem than less critical package designs. The fundamentals of crashworthiness design are reflected in the acronym CREEP, which stands for
• Container • Restraint • Environment • Energy management • Post-crash factors
The first of these, Container, reflects the need to maintain a survivable volume throughout the crash event. The second, Restraints, identifies the need to restrain the occupants within the vehicle without imposing injurious loads. Environment represents the need to prevent the occupants from injuring themselves by striking objects within their flail envelopes. Energy management refers to the need to mitigate occupant loads and accelerations to noninjurious levels. This issue involves the entire structure in the load path between the points of the vehicle that contact the ground and the occupants. Finally, Post-crash factors, reflects the need to address threats such as those posed by post-crash fires or water hazards. An important point to consider, when addressing post-crash hazards, is to provide for rapid egress from the vehicle after the accident.
The ACG recognized that the small size of the AGATE general aviation aircraft, compared to transport class aircraft, increases the relative difficulty in providing crashworthiness performance for the these vehicles. Consequently, they adopted a systems approach to crashworthiness design in order to exploit the significant interactions that exist between the airframe, seats, restraints, and occupants.
The AGATE systems approach to crashworthiness, or Path B as it was known for much of the program, built on the results reported by Terry [3,4]. Terry conducted four full-scale drop tests of general aviation aircraft, two onto a hard surface and two into soft soil. The results acquired during Terry’s last two drop tests demonstrate the fact that general aviation aircraft can be designed to provide occupant protection during severe impacts into soft soil and onto a hard surface. A careful review of these results reveals the fact that the magnitude of the velocity vector remains nearly constant during the impacts onto a hard surface. The effect, in these events, is the rotation of the velocity vector to a direction that is parallel to the impact surface.
Terry’s soft soil results provide useful insights as well. These are most evident in the behavior of the test article in the second soft soil test where the airframe rode up and out of the crater after the initial impact. This is a very significant improvement over the earlier soft soil impact tests of GA aircraft [5,6] where the airframe motion was essentially arrested at the point of impact.
AGATE Composite Airframe Impact Test Results
AGATE-WP3.4-034026-088, Rev A 2 October 31, 2001
These observations support the hypothesis that energy management is a more effective crashworthy design strategy for GA aircraft than energy absorption. The term energy management points to the exploitation of the impulse-momentum equation in the design process. Recalling this equation,
1221
)( VmVmdttFtt −=∫
it is seen that the greater the time interval t2 – t1, the lower the average deceleration force associated with the velocity change V2 – V1. Thus designs that make use of this notion, feature technologies suggested by Terry, such as ramped lower firewalls and load-limiting engine mounts.
Alternatively, attempts to mitigate the impact forces strictly through an application of an energy absorbing mechanism generally require more space than is available in a typical GA design. This is easily verified by calculating the stroking distance required to absorb all of the energy at a constant load level selected to be just below some injury threshold. The result, for typical GA crash conditions generally requires several feet of crush distance, which is simply more space than can be accommodated in this class of aircraft.
The AGATE effort extended the Terry results by evaluating the efficacy of the systems approach to crashworthiness design. The systems approach to crashworthiness represents a conceptual design philosophy wherein one attempts to maximize the synergism between the various elements of the design. In this particular case, the system components include the engine mount and crashworthy cowl; the forward fuselage design, including the ramped firewall; an energy absorbing subfloor; energy absorbing seats; and an advanced restraint system. It is noted that the seats and restraint systems were standard Lancair Columbia 300 hardware certified to the requirements of 14 CFR 23.562. At maturity, each of the system components would be integrated into the overall system using advanced computer aided engineering software. For this project, finite element models were used to guide the design, as described in Ref. 7, without the benefit of validating the simulation capability for each of the individual components. The AGATE effort also established the groundwork for FAA certification to an enhanced level of safety for an airframe designed with this method. Data acquired during this full-scale dynamic test is presented so that it can be used to validate the results predicted by the computer models that were used to design and analyze the test article.
TEST DESCRIPTION
The conditions for this drop test were defined as an impact onto a concrete surface at Vso (57 knots), at a -30º flight-path angle and a -30º pitch angle, with no roll and no yaw. Additional details of the test are described in the test plan [8]. Data collected during the test included airframe accelerations, anthropomorphic test device (ATD) responses, and high-speed film coverage. These data were collected to evaluate the airframe structural response, seat performance, restraint performance, and potential for occupant injury. These data were used to evaluate the crashworthiness of the AGATE airplane (airframe, seats, restraints, interior) as well as to evaluate the Systems Approach to Crashworthy design. Particular attention was paid to the performance of the engine mount and subfloor, as well as to the transient response of the airframe to the severe impulsive loads associated with the crash conditions.
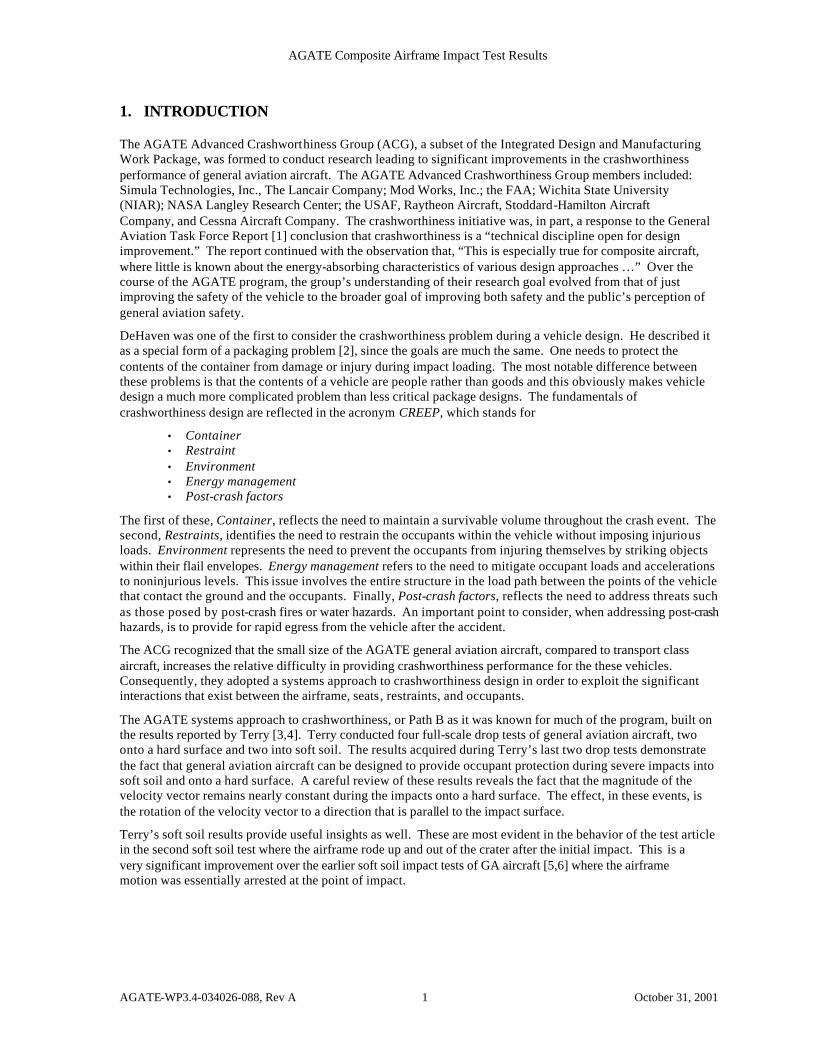
2. TEST DESCRIPTION 2.1 Test Facility The drop test was performed at the NASA Impact Dynamics Research Facility (IDRF) at Langley Research Center in Hampton, VA (Fig. 1). This facility has been developed to crash test full-scale aircraft up to 15, 000 lb. under free flight conditions. The facility is 240 feet high, 400 feet long, and 265 feet wide at the base. An 8-inch-thick reinforced concrete impact surface is centered under the facility gantry and is approximately 396 feet long and 29 feet wide. The movable backboard is used for photographic clarity and camera referencing.
AGATE Composite Airframe Impact Test Results
AGATE-WP3.4-034026-088, Rev A 3 October 31, 2001
Fig. 1 – Diagram of Impact Dynamics Research Facility
For a test at the IDRF, the test vehicle is suspended from two swing cables, pulled back, and released to allow the test vehicle to swing into the impact surface. Free flight conditions are established when the swing cables are pyrotechnically separated from the vehicle just prior to the impact. Knowing the attitude, cable forces, and flight path velocity desired for the test, calculations are made to determine the necessary swing and pull-back cable size and lengths, and the release height of the test vehicle. Flight paths up to –60º and aircraft velocities along the flight paths up to about 88.6 ft/s (60.4 mph or 52.5 knots) have been obtained with a combination of swing-cable lengths and release heights. Higher flight path velocities have been achieved in a few tests by using rocket augmentation. Test parameters at the IDRF are controllable with flight-path angles accurate within 8 percent, aircraft velocity accurate within 6 percent, pitch angles accurate to 4.25º, and roll and yaw angles acceptable under wind velocities up to 14.76 ft/s (approx. 10 mph). The test described in this document required a higher velocity (57 knots) than prior gravity-only tests. NASA IDRF personnel achieved this velocity without augmentation.
AGATE Composite Airframe Impact Test Results
AGATE-WP3.4-034026-088, Rev A 4 October 31, 2001
2.2 Test Article
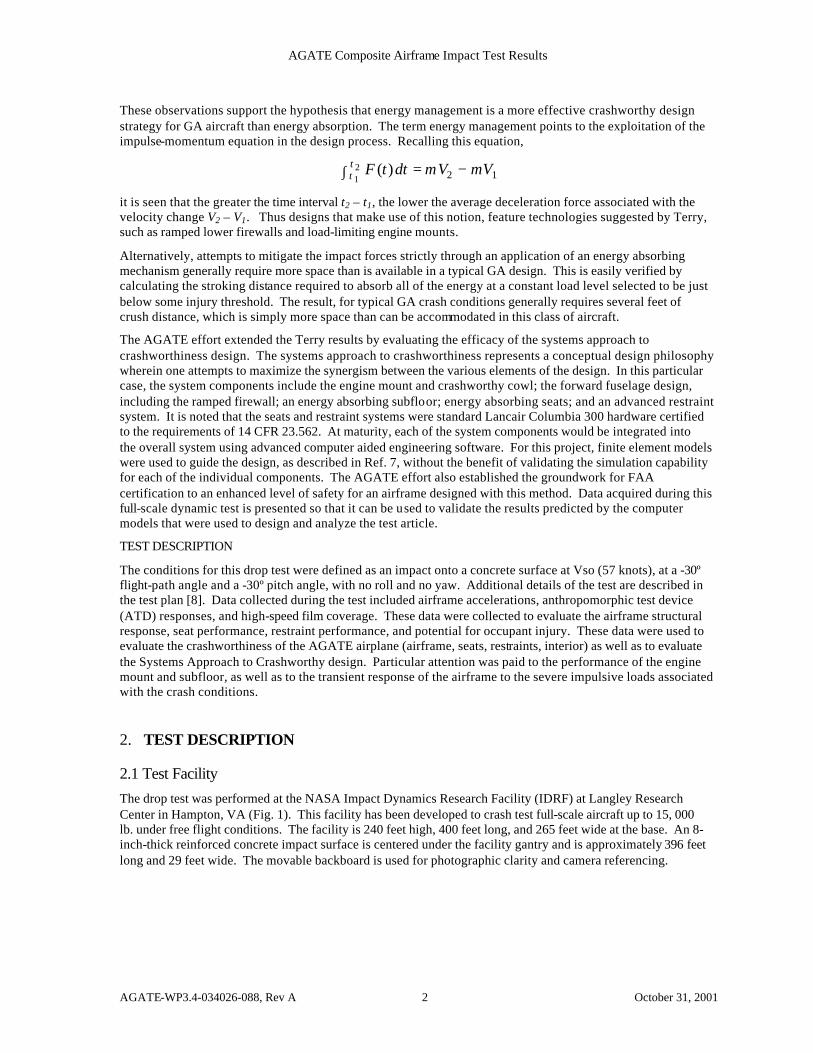
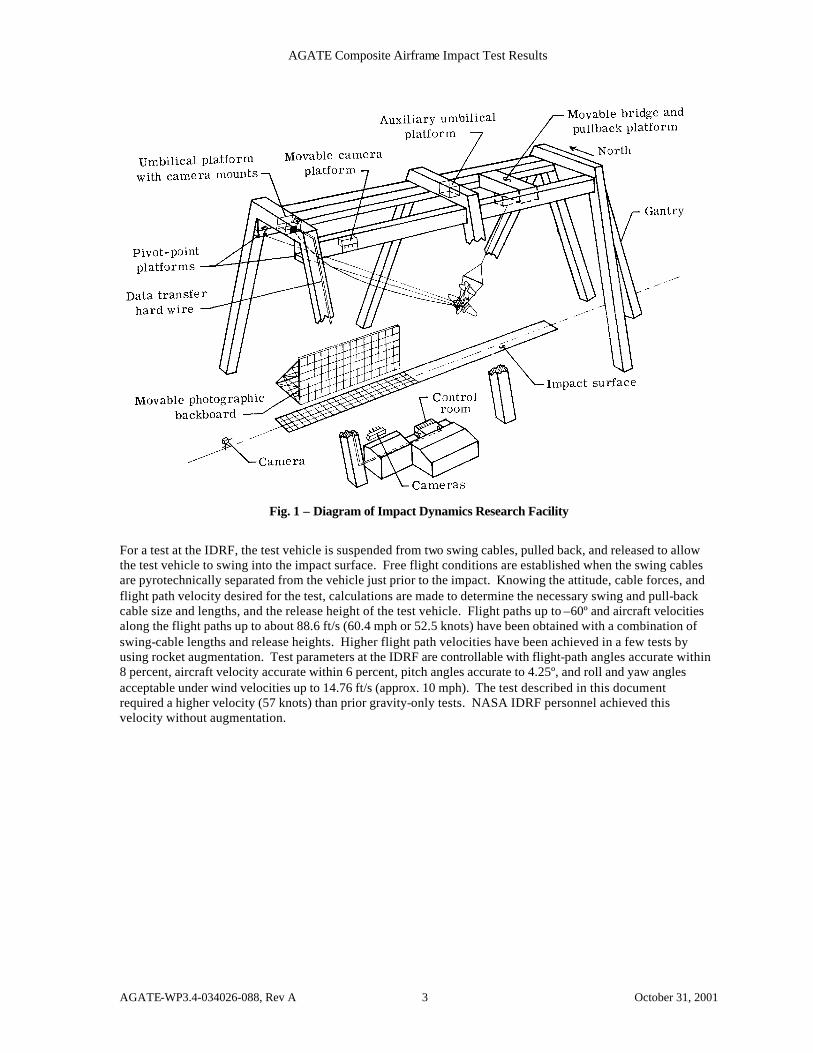
The test article was a low wing, four place, all composite, fixed gear airplane (Figs. 2 & 3) supplied by Lancair, an AGATE ACG member. The baseline test specimen was built to production drawings and was conformed and documented by the ACG prior to the test. This baseline test article was modified, as described in Ref. 7 in order to demonstrate a number of AGATE crashworthiness technologies. These features are briefly summarized below.
Fig. 2 – Lancair Aircraft
WL 0
0
WL 0
FS 0
BL 0
35.8 F T.
13.7 FT.
4 .17 F T.25 .2 FT .
9.0 F T.
Fig. 3 – Lancair Aircraft Three-View Drawing
AGATE Composite Airframe Impact Test Results
AGATE-WP3.4-034026-088, Rev A 5 October 31, 2001
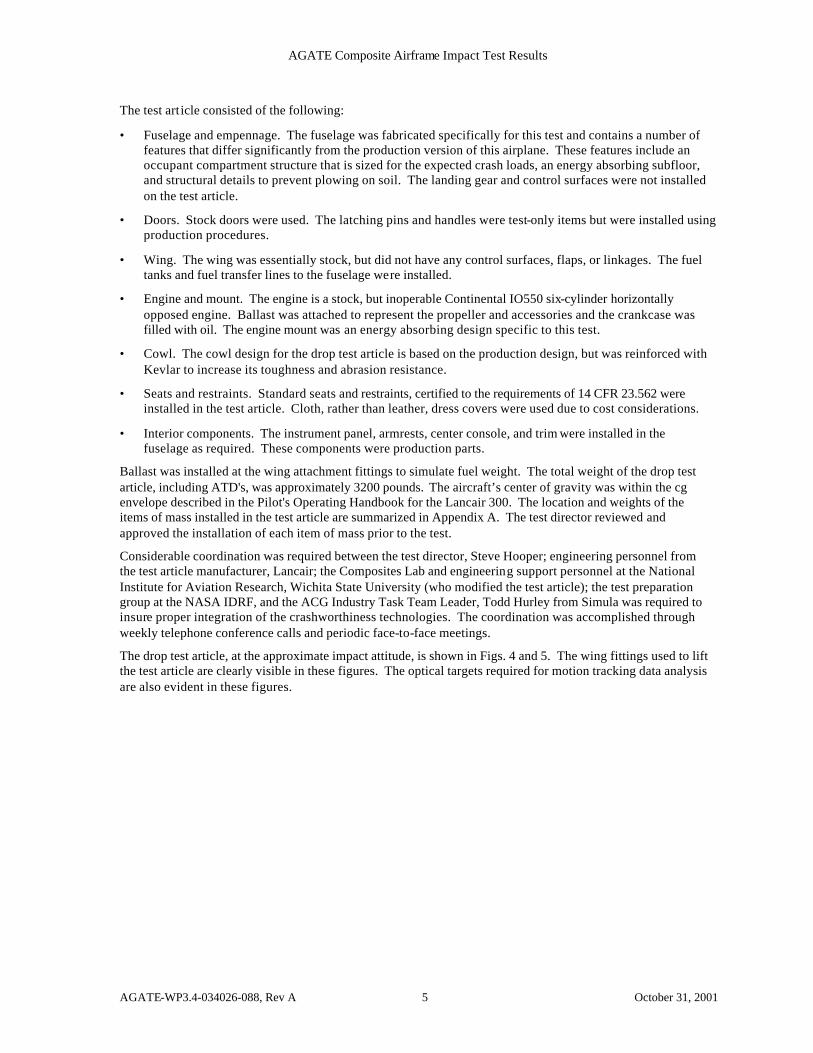
The test art icle consisted of the following:
• Fuselage and empennage. The fuselage was fabricated specifically for this test and contains a number of features that differ significantly from the production version of this airplane. These features include an occupant compartment structure that is sized for the expected crash loads, an energy absorbing subfloor, and structural details to prevent plowing on soil. The landing gear and control surfaces were not installed on the test article.
• Doors. Stock doors were used. The latching pins and handles were test-only items but were installed using production procedures.
• Wing. The wing was essentially stock, but did not have any control surfaces, flaps, or linkages. The fuel tanks and fuel transfer lines to the fuselage were installed.
• Engine and mount. The engine is a stock, but inoperable Continental IO550 six-cylinder horizontally opposed engine. Ballast was attached to represent the propeller and accessories and the crankcase was filled with oil. The engine mount was an energy absorbing design specific to this test.
• Cowl. The cowl design for the drop test article is based on the production design, but was reinforced with Kevlar to increase its toughness and abrasion resistance.
• Seats and restraints. Standard seats and restraints, certified to the requirements of 14 CFR 23.562 were installed in the test article. Cloth, rather than leather, dress covers were used due to cost considerations.
• Interior components. The instrument panel, armrests, center console, and trim were installed in the fuselage as required. These components were production parts.
Ballast was installed at the wing attachment fittings to simulate fuel weight. The total weight of the drop test article, including ATD's, was approximately 3200 pounds. The aircraft’s center of gravity was within the cg envelope described in the Pilot's Operating Handbook for the Lancair 300. The location and weights of the items of mass installed in the test article are summarized in Appendix A. The test director reviewed and approved the installation of each item of mass prior to the test.
Considerable coordination was required between the test director, Steve Hooper; engineering personnel from the test article manufacturer, Lancair; the Composites Lab and engineering support personnel at the National Institute for Aviation Research, Wichita State University (who modified the test article); the test preparation group at the NASA IDRF, and the ACG Industry Task Team Leader, Todd Hurley from Simula was required to insure proper integration of the crashworthiness technologies. The coordination was accomplished through weekly telephone conference calls and periodic face-to-face meetings.
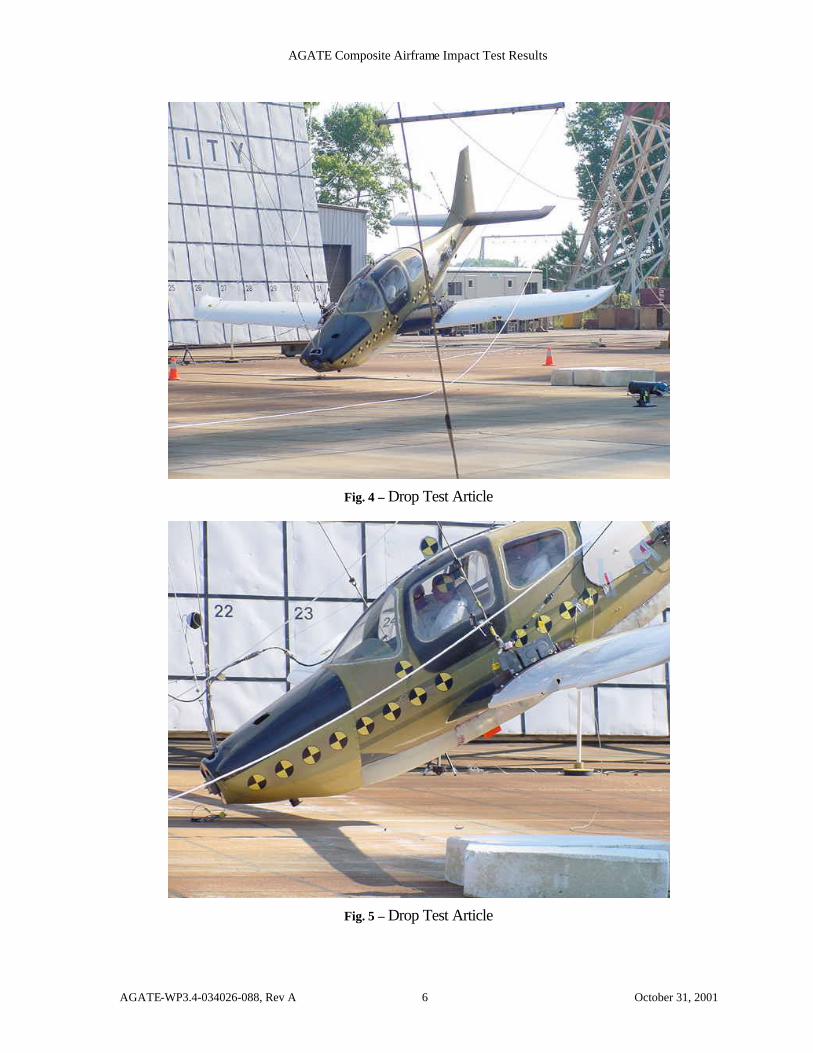
The drop test article, at the approximate impact attitude, is shown in Figs. 4 and 5. The wing fittings used to lift the test article are clearly visible in these figures. The optical targets required for motion tracking data analysis are also evident in these figures.
AGATE Composite Airframe Impact Test Results
AGATE-WP3.4-034026-088, Rev A 6 October 31, 2001
Fig. 4 – Drop Test Article
Fig. 5 – Drop Test Article
AGATE Composite Airframe Impact Test Results
AGATE-WP3.4-034026-088, Rev A 7 October 31, 2001
2.3 Instrumentation
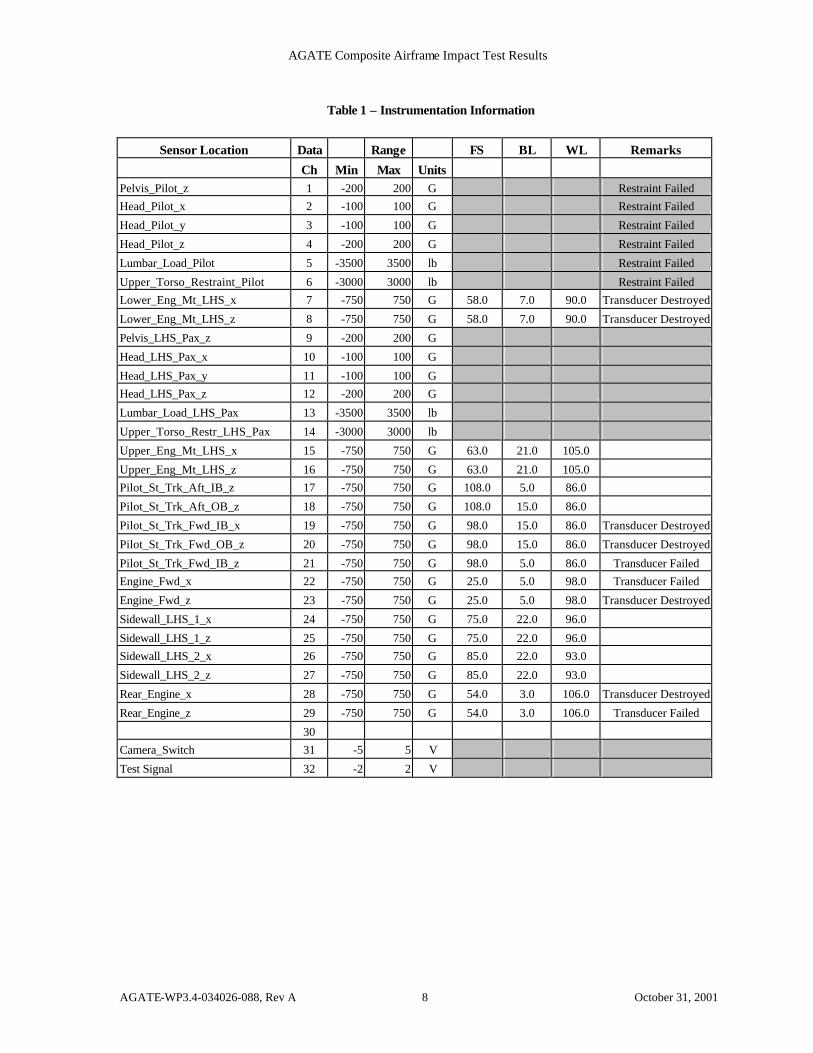
The instrumentation can be classified as three types of transducers, which were used to measure the performance of the airframe, seats and restraints, and occupants. The transducers were calibrated by a certified lab before and after the test. The calibration includes not only the sensitivity and offset, but also a resistive shunt calibration. The data acquisition system is capable of utilizing the resistive shunt calibration information to “verify” that the transducers and associated wiring are correctly installed. The resistive shunt calibration is performed several times during the installation of the transducers to evaluate and document stability. In addition, impedance checks are performed. The impedance values are compared with the values provided by the transducer manufacturer. A final impedance check of the transducers was performed just prior to the test as a final check.
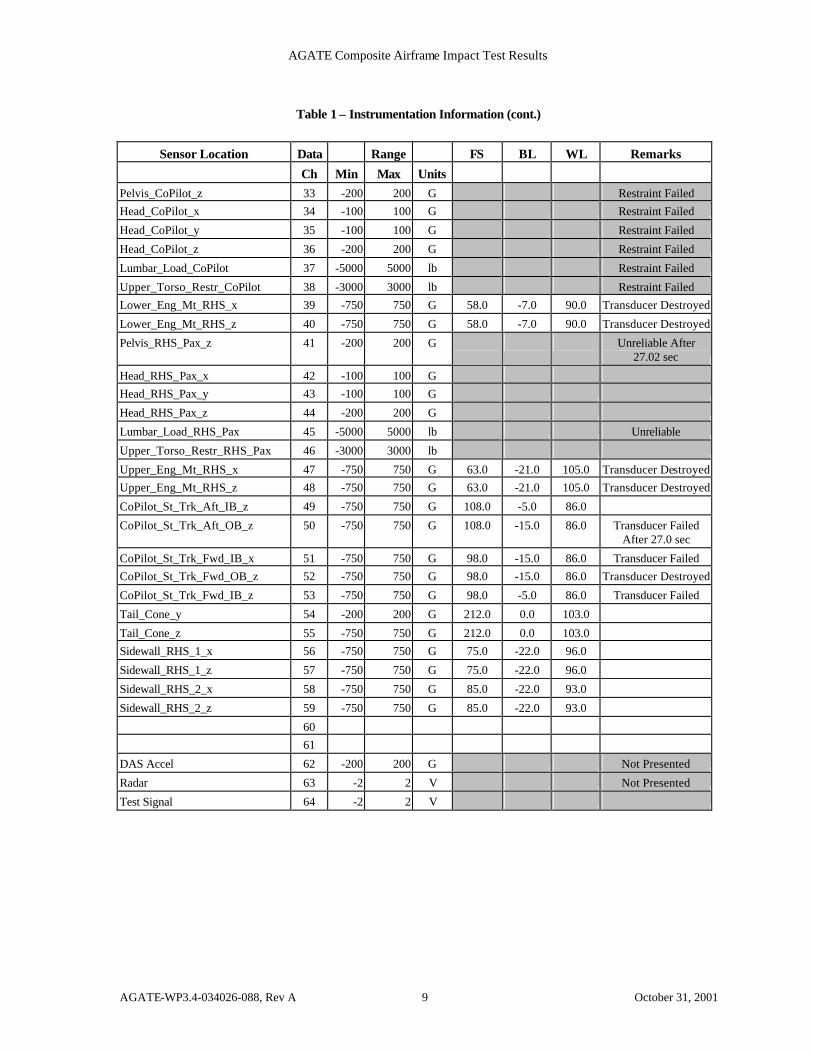
The location, number, and type of instrumentation are presented in Table 1 of this report. In addition, the Remarks column contains additional information about the reliability of the measured data. Some of the transducers were destroyed during the test, while for other channels, the transducer was not damaged, but the signal was interrupted by structural failures. A few other channels appear to have acceptable data up to a certain point in time. This has also been noted.
AGATE Composite Airframe Impact Test Results
AGATE-WP3.4-034026-088, Rev A 8 October 31, 2001
Table 1 – Instrumentation Information
Sensor Location Data Range FS BL WL Remarks Ch Min Max Units
Pelvis_Pilot_z 1 -200 200 G Restraint Failed Head_Pilot_x 2 -100 100 G Restraint Failed
Head_Pilot_y 3 -100 100 G Restraint Failed
Head_Pilot_z 4 -200 200 G Restraint Failed
Lumbar_Load_Pilot 5 -3500 3500 lb Restraint Failed
Upper_Torso_Restraint_Pilot 6 -3000 3000 lb Restraint Failed Lower_Eng_Mt_LHS_x 7 -750 750 G 58.0 7.0 90.0 Transducer Destroyed
Lower_Eng_Mt_LHS_z 8 -750 750 G 58.0 7.0 90.0 Transducer Destroyed
Pelvis_LHS_Pax_z 9 -200 200 G
Head_LHS_Pax_x 10 -100 100 G
Head_LHS_Pax_y 11 -100 100 G Head_LHS_Pax_z 12 -200 200 G
Lumbar_Load_LHS_Pax 13 -3500 3500 lb
Upper_Torso_Restr_LHS_Pax 14 -3000 3000 lb
Upper_Eng_Mt_LHS_x 15 -750 750 G 63.0 21.0 105.0
Upper_Eng_Mt_LHS_z 16 -750 750 G 63.0 21.0 105.0 Pilot_St_Trk_Aft_IB_z 17 -750 750 G 108.0 5.0 86.0
Pilot_St_Trk_Aft_OB_z 18 -750 750 G 108.0 15.0 86.0
Pilot_St_Trk_Fwd_IB_x 19 -750 750 G 98.0 15.0 86.0 Transducer Destroyed
Pilot_St_Trk_Fwd_OB_z 20 -750 750 G 98.0 15.0 86.0 Transducer Destroyed
Pilot_St_Trk_Fwd_IB_z 21 -750 750 G 98.0 5.0 86.0 Transducer Failed Engine_Fwd_x 22 -750 750 G 25.0 5.0 98.0 Transducer Failed
Engine_Fwd_z 23 -750 750 G 25.0 5.0 98.0 Transducer Destroyed
Sidewall_LHS_1_x 24 -750 750 G 75.0 22.0 96.0
Sidewall_LHS_1_z 25 -750 750 G 75.0 22.0 96.0 Sidewall_LHS_2_x 26 -750 750 G 85.0 22.0 93.0
Sidewall_LHS_2_z 27 -750 750 G 85.0 22.0 93.0
Rear_Engine_x 28 -750 750 G 54.0 3.0 106.0 Transducer Destroyed
Rear_Engine_z 29 -750 750 G 54.0 3.0 106.0 Transducer Failed
30 Camera_Switch 31 -5 5 V
Test Signal 32 -2 2 V
AGATE Composite Airframe Impact Test Results
AGATE-WP3.4-034026-088, Rev A 9 October 31, 2001
Table 1 – Instrumentation Information (cont.)
Sensor Location Data Range FS BL WL Remarks
Ch Min Max Units Pelvis_CoPilot_z 33 -200 200 G Restraint Failed Head_CoPilot_x 34 -100 100 G Restraint Failed
Head_CoPilot_y 35 -100 100 G Restraint Failed
Head_CoPilot_z 36 -200 200 G Restraint Failed
Lumbar_Load_CoPilot 37 -5000 5000 lb Restraint Failed
Upper_Torso_Restr_CoPilot 38 -3000 3000 lb Restraint Failed Lower_Eng_Mt_RHS_x 39 -750 750 G 58.0 -7.0 90.0 Transducer Destroyed
Lower_Eng_Mt_RHS_z 40 -750 750 G 58.0 -7.0 90.0 Transducer Destroyed
Pelvis_RHS_Pax_z 41 -200 200 G Unreliable After 27.02 sec
Head_RHS_Pax_x 42 -100 100 G Head_RHS_Pax_y 43 -100 100 G
Head_RHS_Pax_z 44 -200 200 G
Lumbar_Load_RHS_Pax 45 -5000 5000 lb Unreliable
Upper_Torso_Restr_RHS_Pax 46 -3000 3000 lb
Upper_Eng_Mt_RHS_x 47 -750 750 G 63.0 -21.0 105.0 Transducer Destroyed Upper_Eng_Mt_RHS_z 48 -750 750 G 63.0 -21.0 105.0 Transducer Destroyed
CoPilot_St_Trk_Aft_IB_z 49 -750 750 G 108.0 -5.0 86.0
CoPilot_St_Trk_Aft_OB_z 50 -750 750 G 108.0 -15.0 86.0 Transducer Failed After 27.0 sec
CoPilot_St_Trk_Fwd_IB_x 51 -750 750 G 98.0 -15.0 86.0 Transducer Failed CoPilot_St_Trk_Fwd_OB_z 52 -750 750 G 98.0 -15.0 86.0 Transducer Destroyed
CoPilot_St_Trk_Fwd_IB_z 53 -750 750 G 98.0 -5.0 86.0 Transducer Failed
Tail_Cone_y 54 -200 200 G 212.0 0.0 103.0
Tail_Cone_z 55 -750 750 G 212.0 0.0 103.0 Sidewall_RHS_1_x 56 -750 750 G 75.0 -22.0 96.0
Sidewall_RHS_1_z 57 -750 750 G 75.0 -22.0 96.0
Sidewall_RHS_2_x 58 -750 750 G 85.0 -22.0 93.0
Sidewall_RHS_2_z 59 -750 750 G 85.0 -22.0 93.0
60 61
DAS Accel 62 -200 200 G Not Presented
Radar 63 -2 2 V Not Presented
Test Signal 64 -2 2 V
AGATE Composite Airframe Impact Test Results
AGATE-WP3.4-034026-088, Rev A 10 October 31, 2001
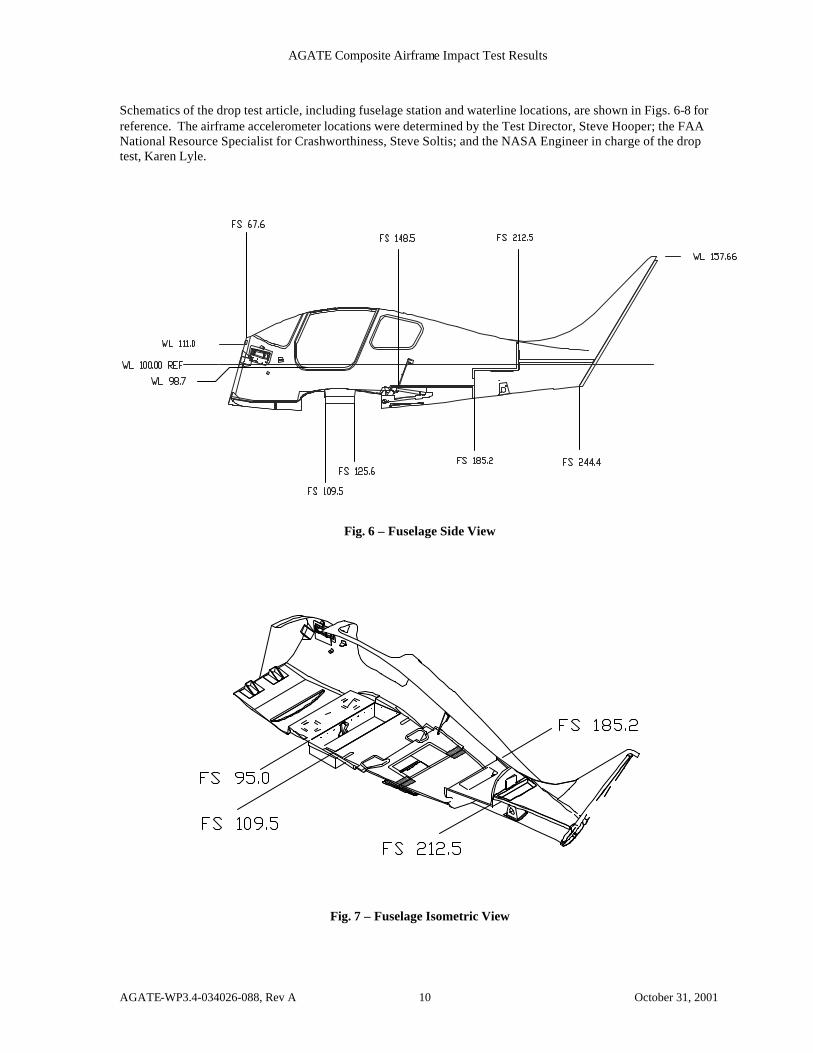
Schematics of the drop test article, including fuselage station and waterline locations, are shown in Figs. 6-8 for reference. The airframe accelerometer locations were determined by the Test Director, Steve Hooper; the FAA National Resource Specialist for Crashworthiness, Steve Soltis; and the NASA Engineer in charge of the drop test, Karen Lyle.
Fig. 6 – Fuselage Side View
Fig. 7 – Fuselage Isometric View
AGATE Composite Airframe Impact Test Results
AGATE-WP3.4-034026-088, Rev A 11 October 31, 2001
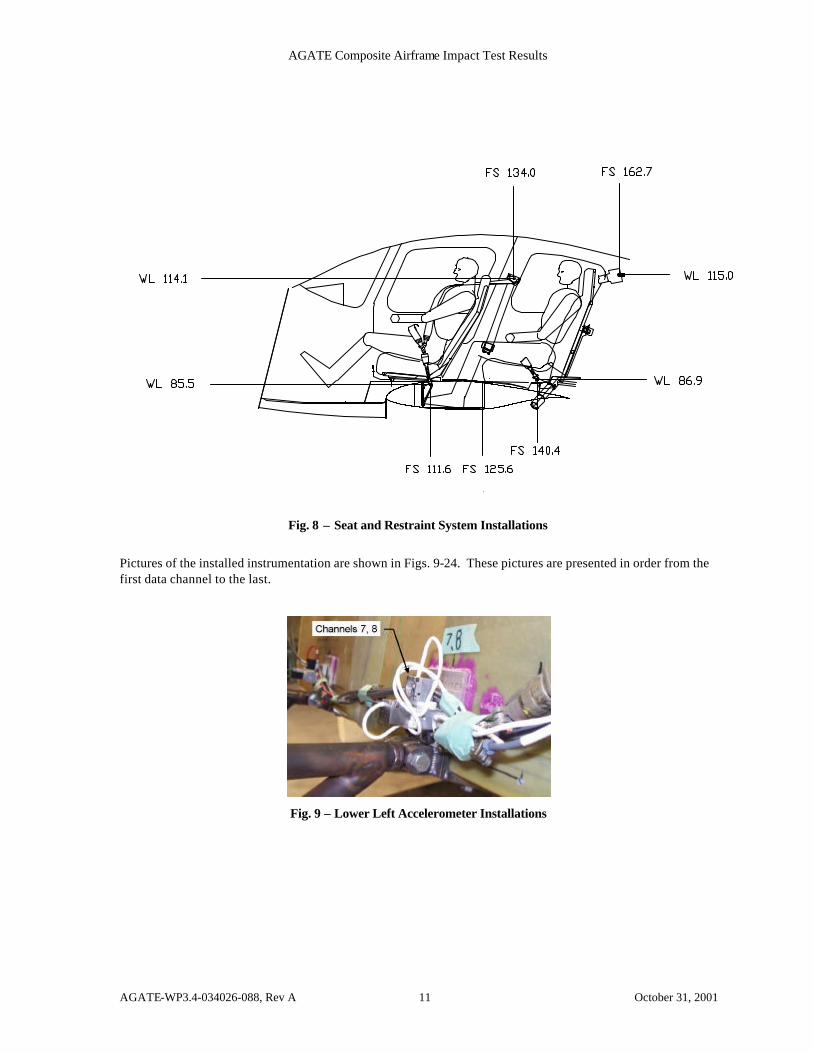
Fig. 8 – Seat and Restraint System Installations
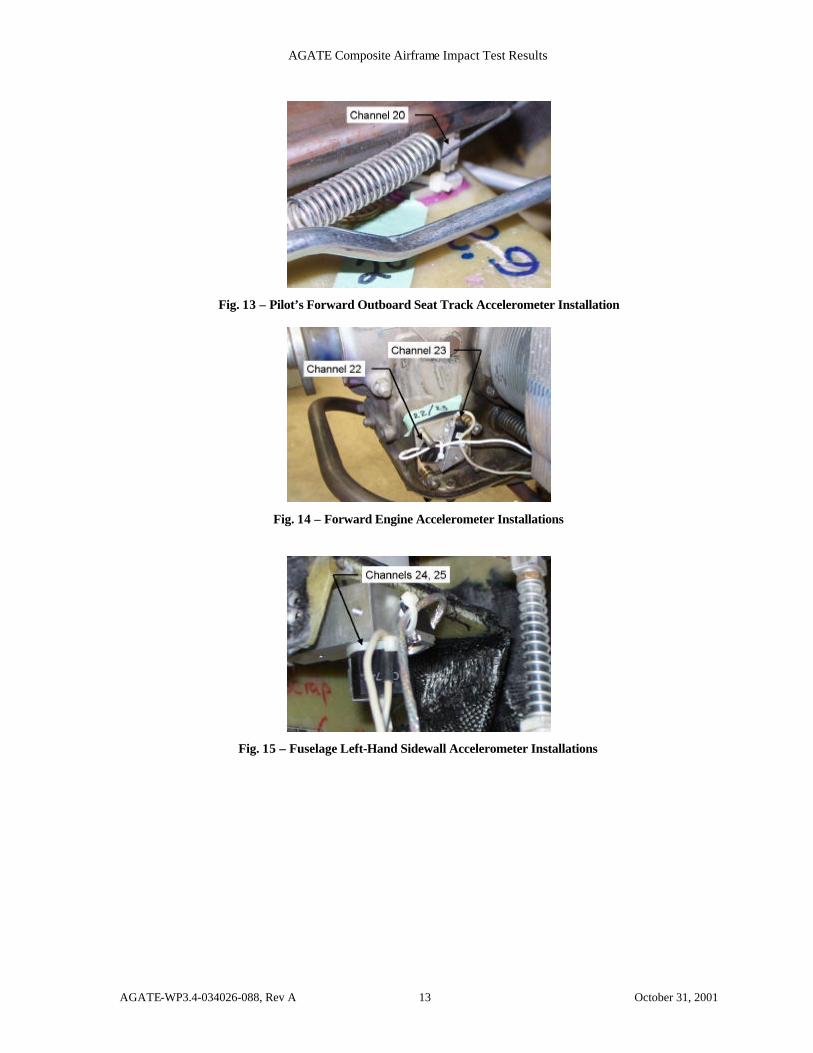
Pictures of the installed instrumentation are shown in Figs. 9-24. These pictures are presented in order from the first data channel to the last.
Fig. 9 – Lower Left Accelerometer Installations
AGATE Composite Airframe Impact Test Results
AGATE-WP3.4-034026-088, Rev A 12 October 31, 2001
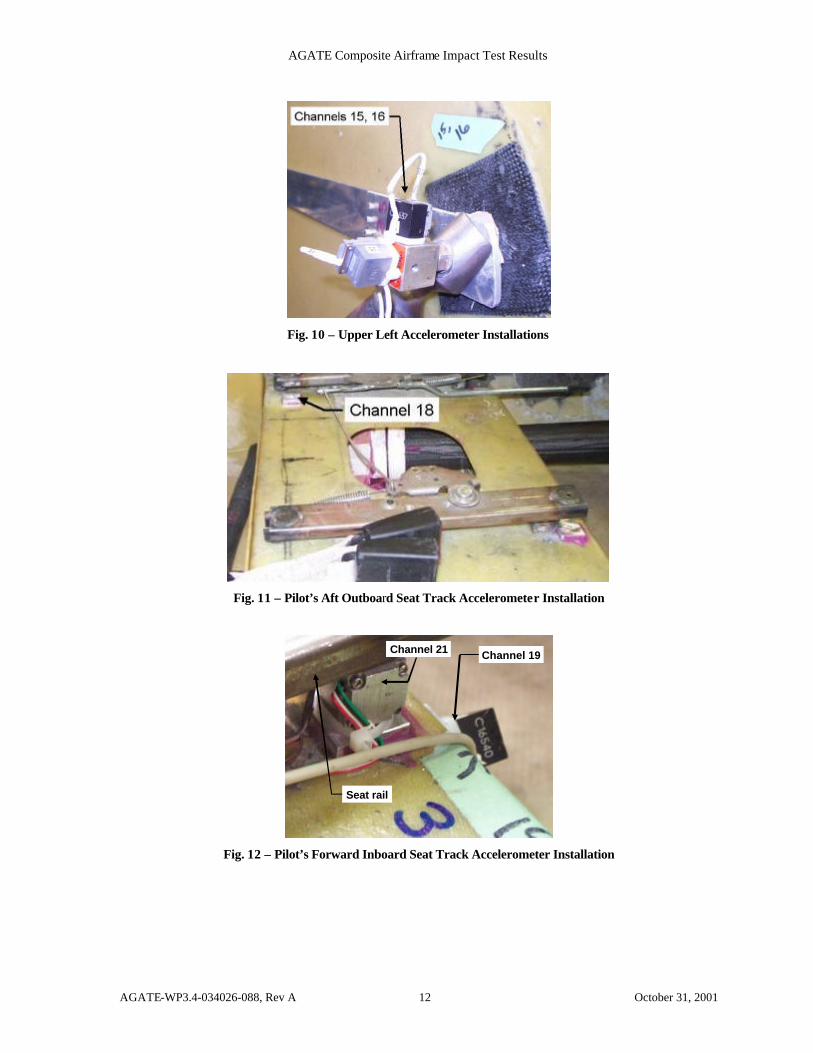
Fig. 10 – Upper Left Accelerometer Installations
Fig. 11 – Pilot’s Aft Outboard Seat Track Accelerometer Installation
Channel 19Channel 21
Seat rail
Fig. 12 – Pilot’s Forward Inboard Seat Track Accelerometer Installation
AGATE Composite Airframe Impact Test Results
AGATE-WP3.4-034026-088, Rev A 13 October 31, 2001
Fig. 13 – Pilot’s Forward Outboard Seat Track Accelerometer Installation
Fig. 14 – Forward Engine Accelerometer Installations
Fig. 15 – Fuselage Left-Hand Sidewall Accelerometer Installations
AGATE Composite Airframe Impact Test Results
AGATE-WP3.4-034026-088, Rev A 14 October 31, 2001
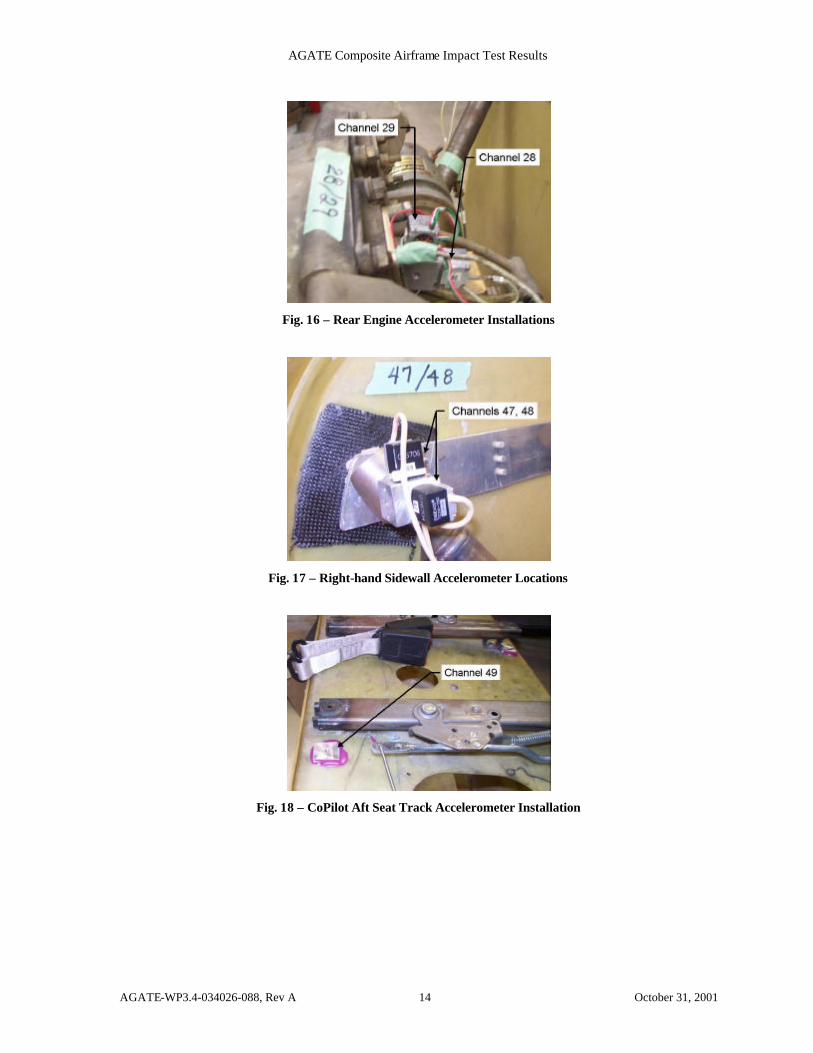
Fig. 16 – Rear Engine Accelerometer Installations
Fig. 17 – Right-hand Sidewall Accelerometer Locations
Fig. 18 – CoPilot Aft Seat Track Accelerometer Installation
AGATE Composite Airframe Impact Test Results
AGATE-WP3.4-034026-088, Rev A 15 October 31, 2001
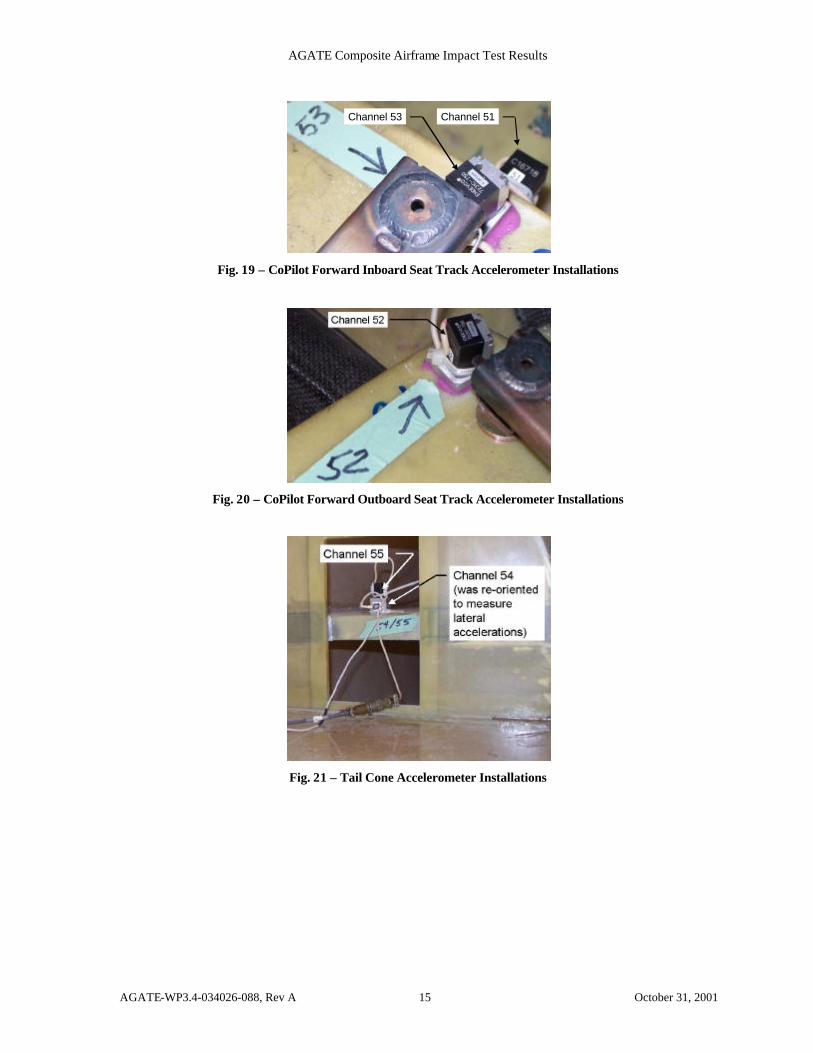
Channel 51Channel 53
Fig. 19 – CoPilot Forward Inboard Seat Track Accelerometer Installations
Fig. 20 – CoPilot Forward Outboard Seat Track Accelerometer Installations
Fig. 21 – Tail Cone Accelerometer Installations
AGATE Composite Airframe Impact Test Results
AGATE-WP3.4-034026-088, Rev A 16 October 31, 2001
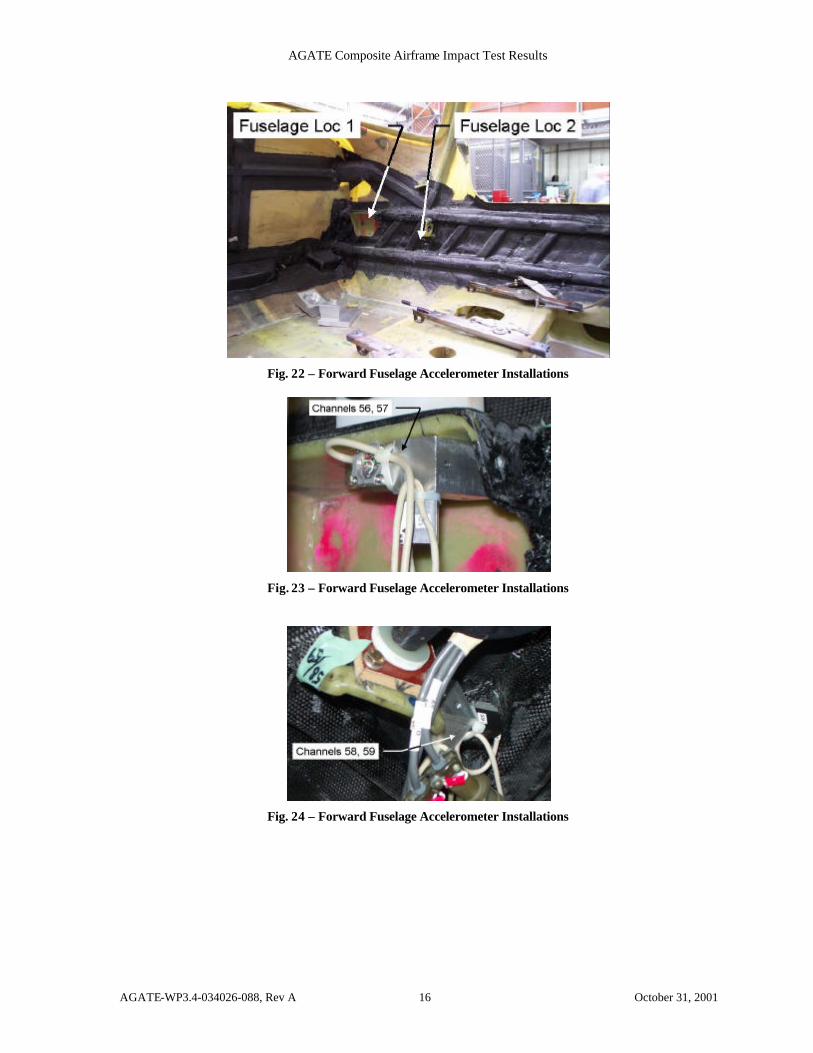
Fig. 22 – Forward Fuselage Accelerometer Installations
Fig. 23 – Forward Fuselage Accelerometer Installations
Fig. 24 – Forward Fuselage Accelerometer Installations
AGATE Composite Airframe Impact Test Results
AGATE-WP3.4-034026-088, Rev A 17 October 31, 2001
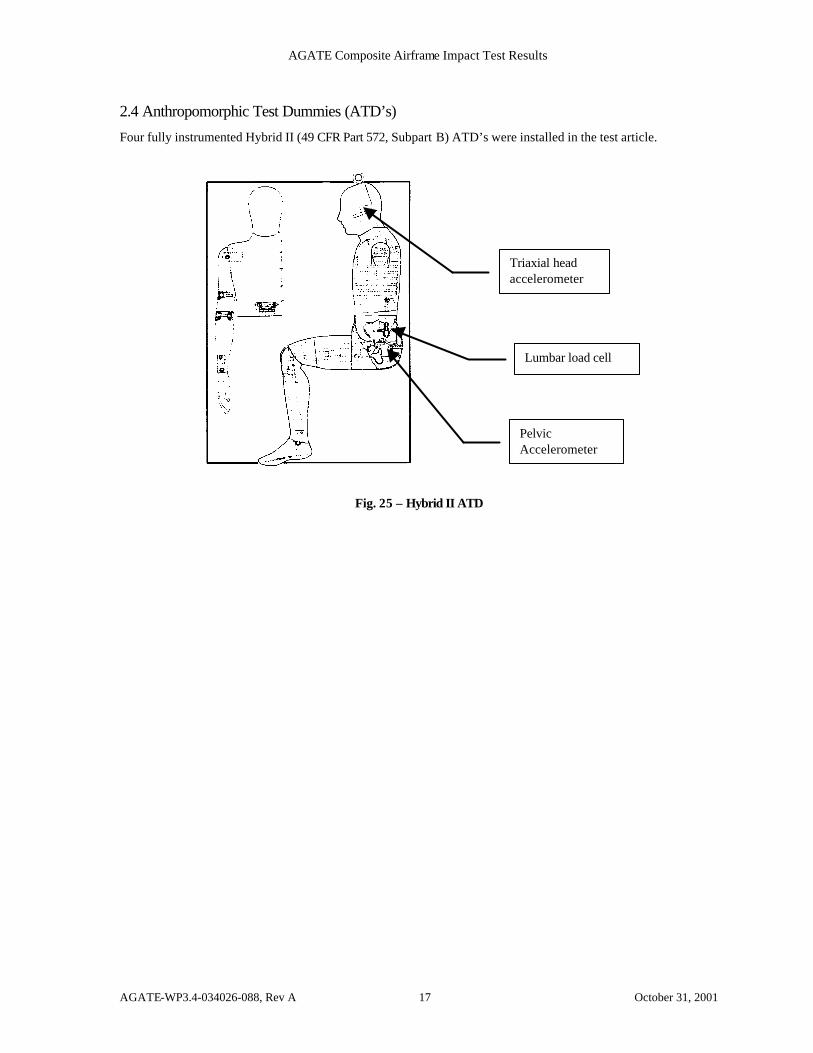
2.4 Anthropomorphic Test Dummies (ATD’s)
Four fully instrumented Hybrid II (49 CFR Part 572, Subpart B) ATD’s were installed in the test article.
Fig. 25 – Hybrid II ATD
Lumbar load cell
Triaxial head accelerometer
Pelvic Accelerometer
AGATE Composite Airframe Impact Test Results
AGATE-WP3.4-034026-088, Rev A 18 October 31, 2001
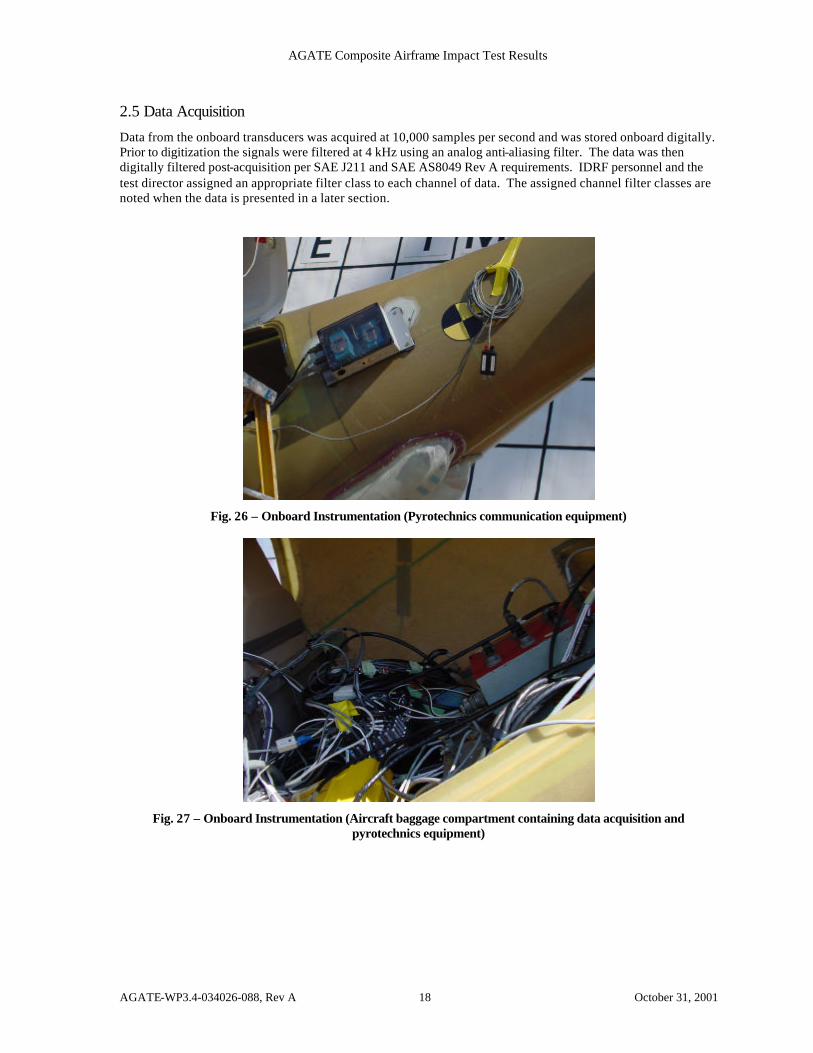
2.5 Data Acquisition
Data from the onboard transducers was acquired at 10,000 samples per second and was stored onboard digitally. Prior to digitization the signals were filtered at 4 kHz using an analog anti-aliasing filter. The data was then digitally filtered post-acquisition per SAE J211 and SAE AS8049 Rev A requirements. IDRF personnel and the test director assigned an appropriate filter class to each channel of data. The assigned channel filter classes are noted when the data is presented in a later section.
Fig. 26 – Onboard Instrumentation (Pyrotechnics communication equipment)
Fig. 27 – Onboard Instrumentation (Aircraft baggage compartment containing data acquisition and pyrotechnics equipment)
AGATE Composite Airframe Impact Test Results
AGATE-WP3.4-034026-088, Rev A 19 October 31, 2001
2.6 Photographic Coverage
The test was documented with both still and high-speed film photography. NASA Langley personnel were responsible for the photo documentation.
2.6.1 Still Photography
NASA photographers were responsible for documentation photographs. Pretest photos were taken to document the instrumentation installed in the test article, the onboard experiments, the test setup, and the impact area. Posttest photos were taken of the test specimen with overall and close-up views of damaged areas, the onboard experiments, and the impact area.
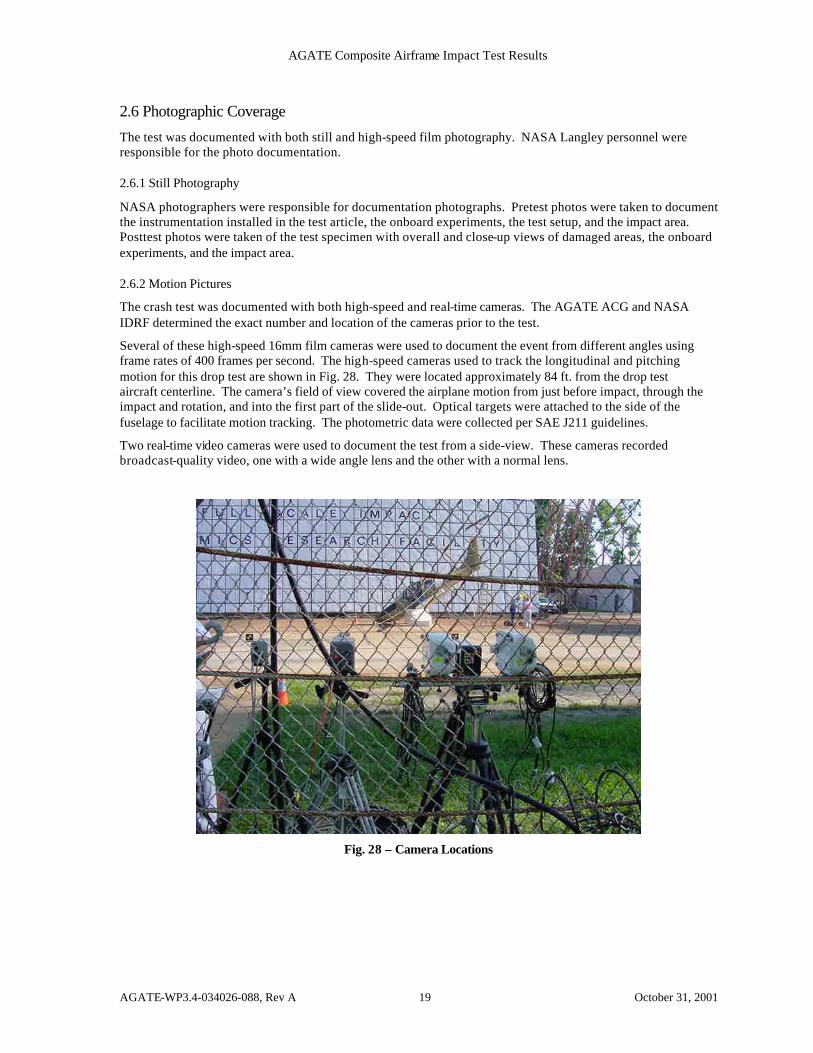
2.6.2 Motion Pictures
The crash test was documented with both high-speed and real-time cameras. The AGATE ACG and NASA IDRF determined the exact number and location of the cameras prior to the test.
Several of these high-speed 16mm film cameras were used to document the event from different angles using frame rates of 400 frames per second. The high-speed cameras used to track the longitudinal and pitching motion for this drop test are shown in Fig. 28. They were located approximately 84 ft. from the drop test aircraft centerline. The camera’s field of view covered the airplane motion from just before impact, through the impact and rotation, and into the first part of the slide-out. Optical targets were attached to the side of the fuselage to facilitate motion tracking. The photometric data were collected per SAE J211 guidelines.
Two real-time video cameras were used to document the test from a side-view. These cameras recorded broadcast-quality video, one with a wide angle lens and the other with a normal lens.
Fig. 28 – Camera Locations
AGATE Composite Airframe Impact Test Results
AGATE-WP3.4-034026-088, Rev A 20 October 31, 2001
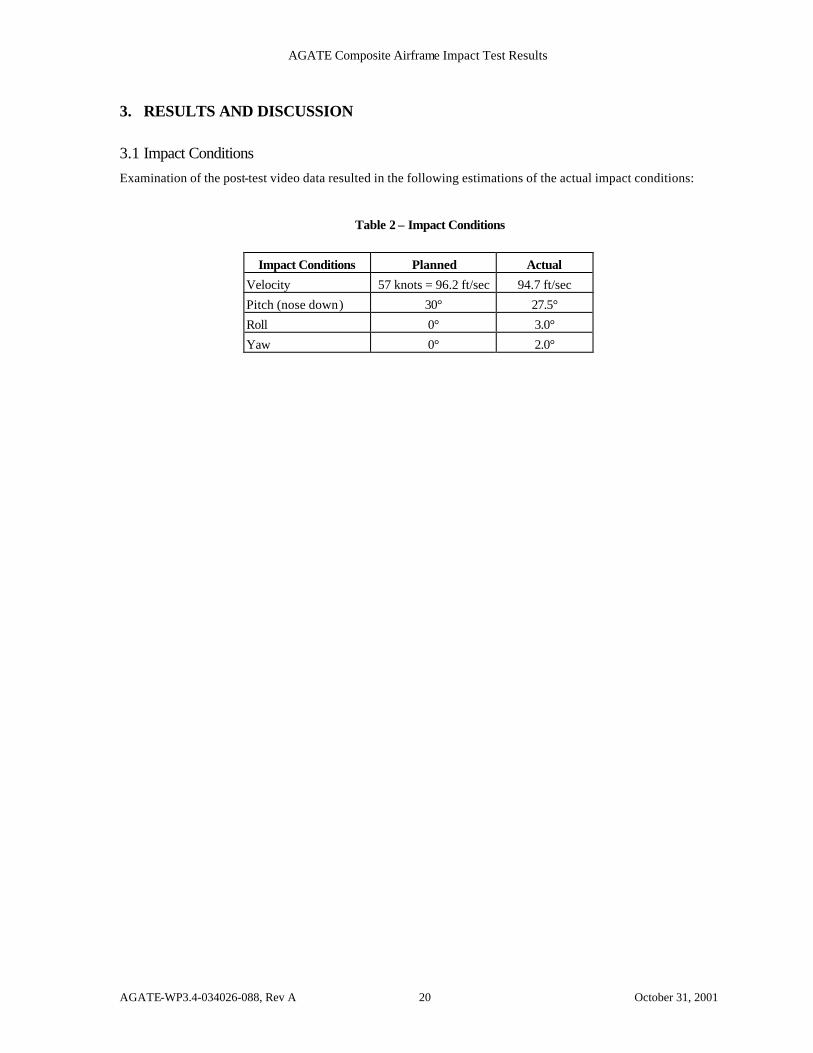
3. RESULTS AND DISCUSSION
3.1 Impact Conditions Examination of the post-test video data resulted in the following estimations of the actual impact conditions:
Table 2 – Impact Conditions
Impact Conditions Planned Actual
Velocity 57 knots = 96.2 ft/sec 94.7 ft/sec
Pitch (nose down) 30° 27.5°
Roll 0° 3.0°
Yaw 0° 2.0°
AGATE Composite Airframe Impact Test Results
AGATE-WP3.4-034026-088, Rev A 21 October 31, 2001
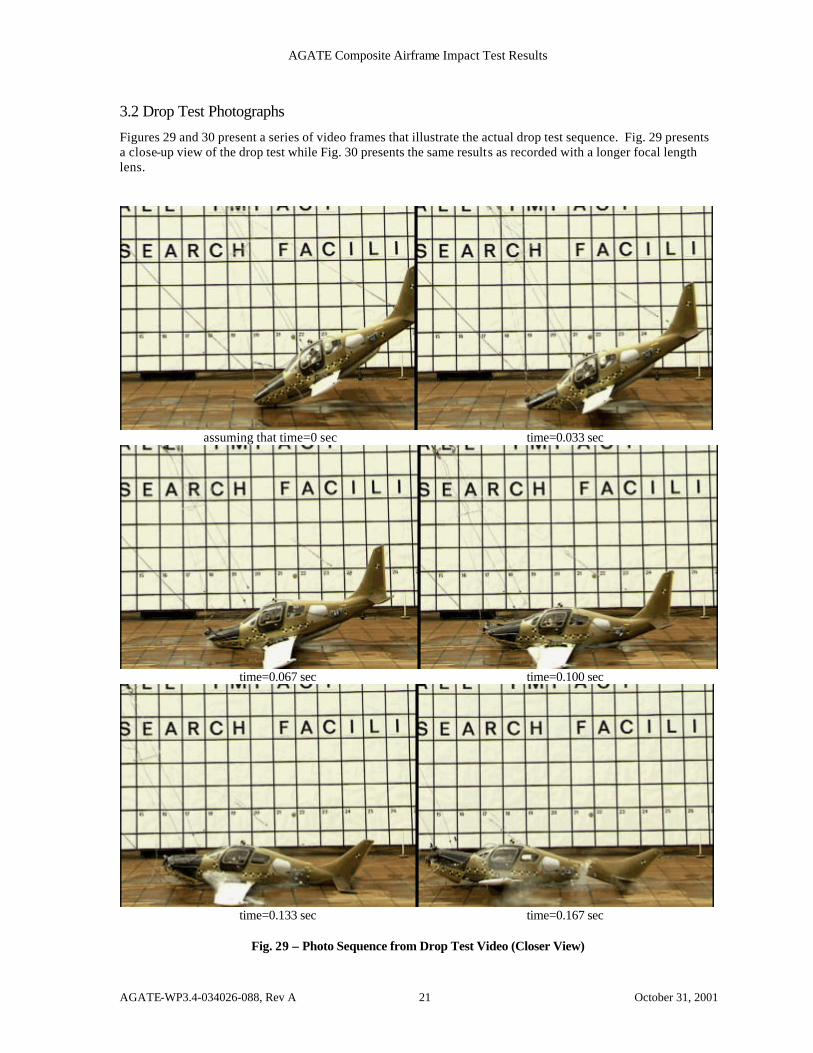
3.2 Drop Test Photographs
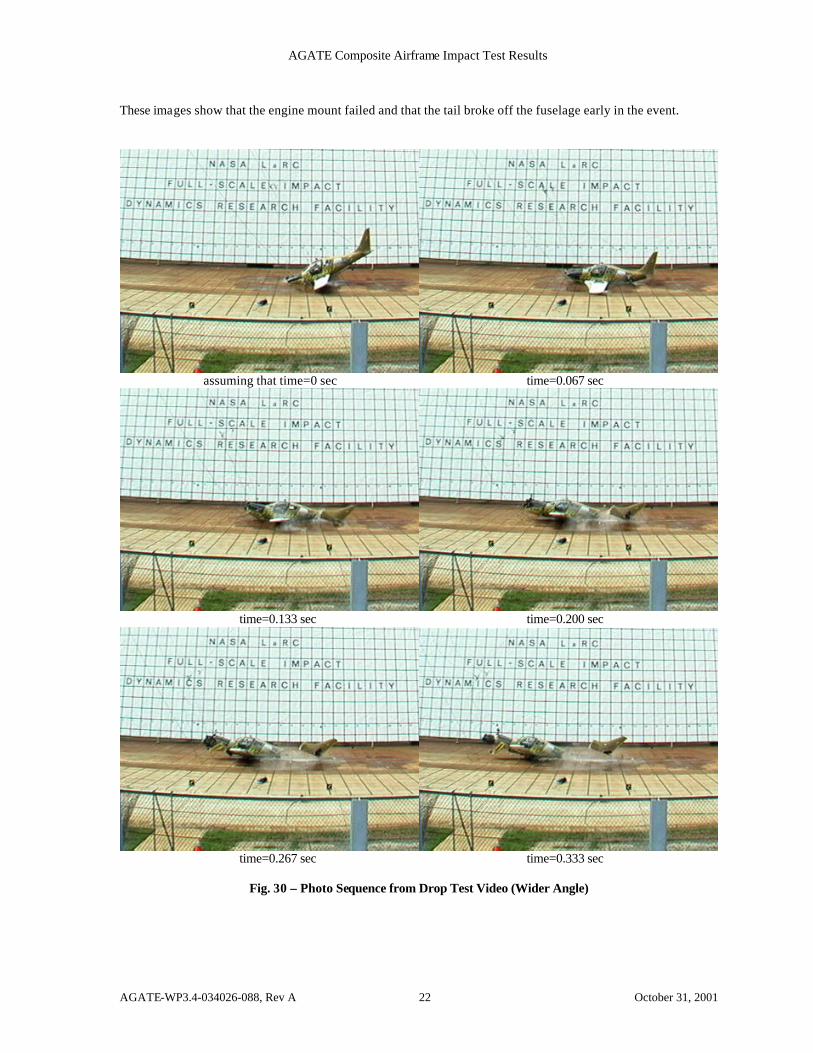
Figures 29 and 30 present a series of video frames that illustrate the actual drop test sequence. Fig. 29 presents a close-up view of the drop test while Fig. 30 presents the same results as recorded with a longer focal length lens.
assuming that time=0 sec time=0.033 sec
time=0.067 sec time=0.100 sec
time=0.133 sec time=0.167 sec
Fig. 29 – Photo Sequence from Drop Test Video (Closer View)
AGATE Composite Airframe Impact Test Results
AGATE-WP3.4-034026-088, Rev A 22 October 31, 2001
These images show that the engine mount failed and that the tail broke off the fuselage early in the event.
assuming that time=0 sec time=0.067 sec
time=0.133 sec time=0.200 sec
time=0.267 sec time=0.333 sec
Fig. 30 – Photo Sequence from Drop Test Video (Wider Angle)
AGATE Composite Airframe Impact Test Results
AGATE-WP3.4-034026-088, Rev A 23 October 31, 2001
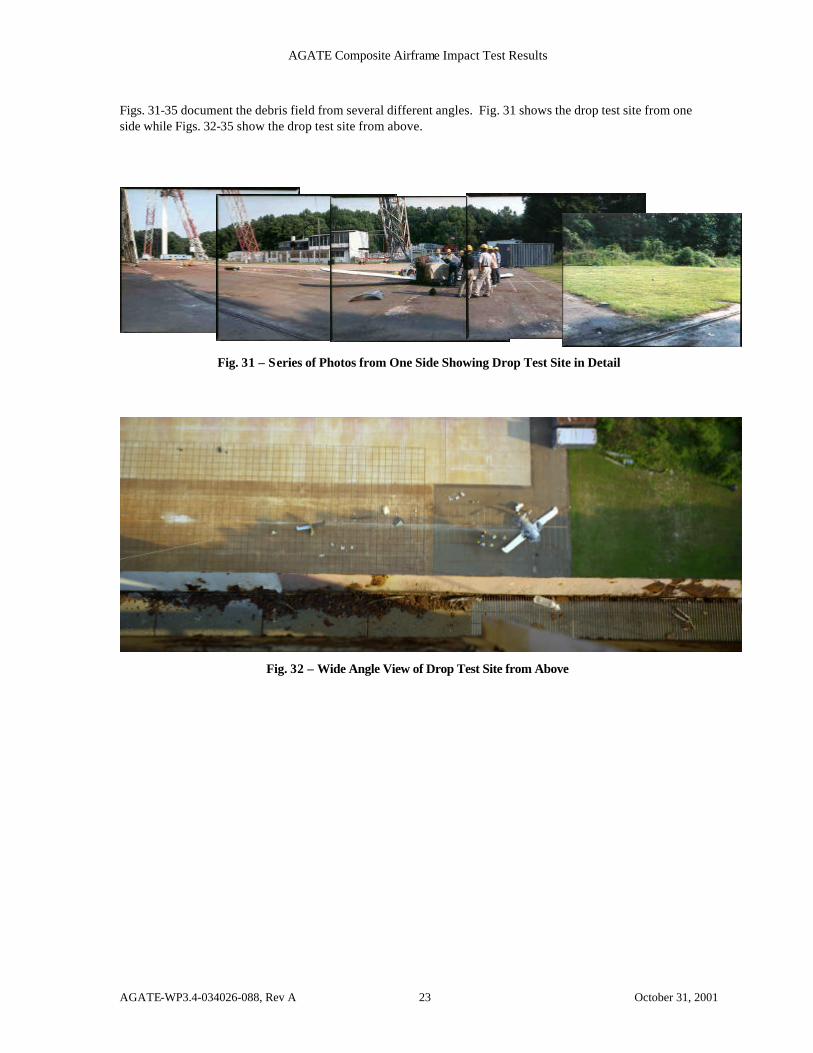
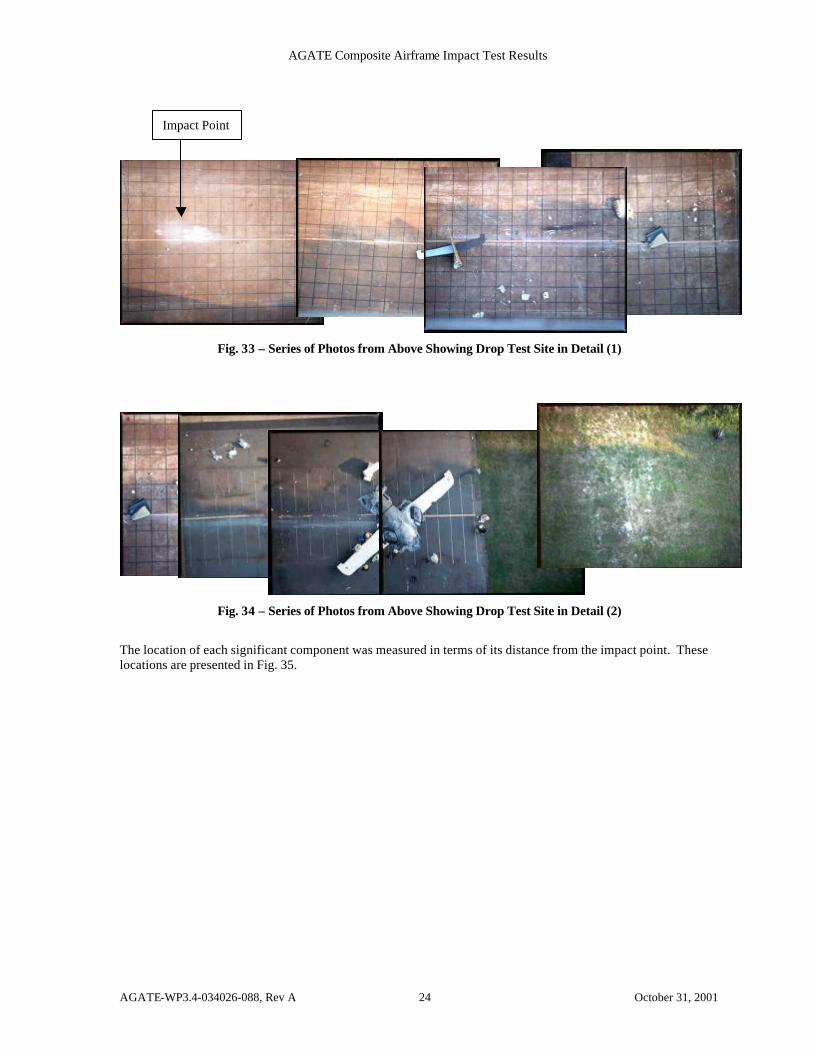
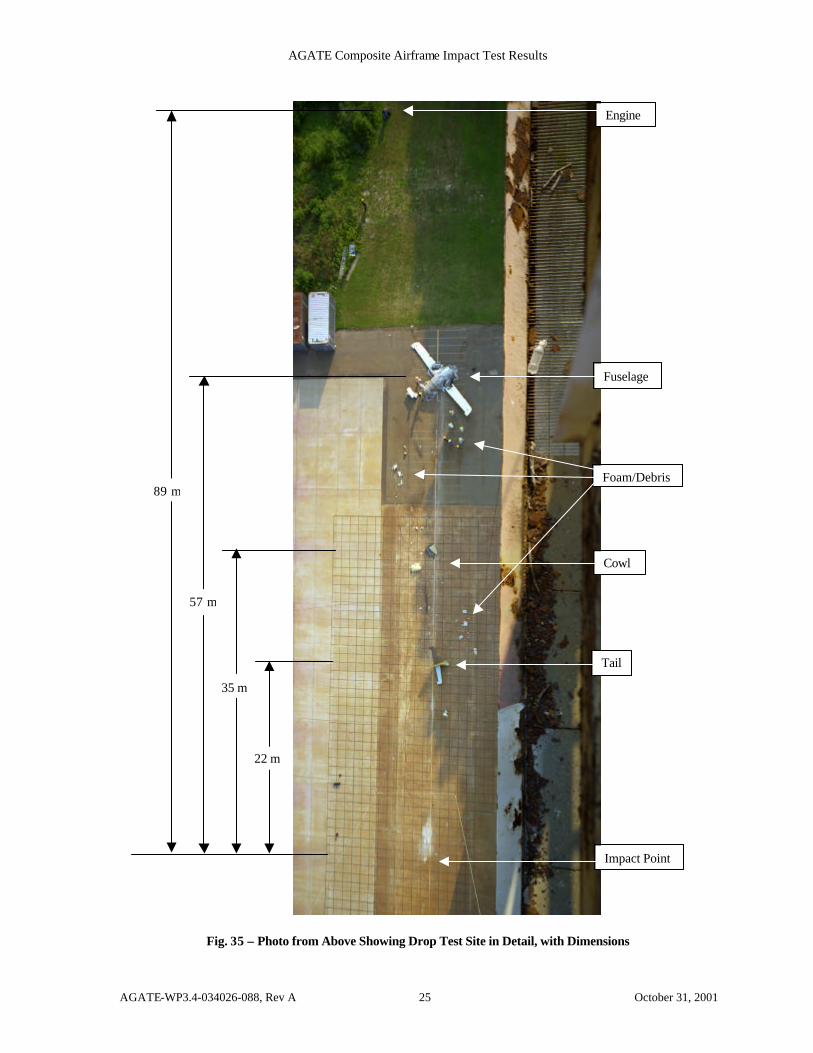
Figs. 31-35 document the debris field from several different angles. Fig. 31 shows the drop test site from one side while Figs. 32-35 show the drop test site from above.
Fig. 31 – Series of Photos from One Side Showing Drop Test Site in Detail
Fig. 32 – Wide Angle View of Drop Test Site from Above
AGATE Composite Airframe Impact Test Results
AGATE-WP3.4-034026-088, Rev A 24 October 31, 2001
Fig. 33 – Series of Photos from Above Showing Drop Test Site in Detail (1)
Fig. 34 – Series of Photos from Above Showing Drop Test Site in Detail (2)
The location of each significant component was measured in terms of its distance from the impact point. These locations are presented in Fig. 35.
Impact Point
AGATE Composite Airframe Impact Test Results
AGATE-WP3.4-034026-088, Rev A 25 October 31, 2001
Engine
Foam/Debris
Fuselage
Cowl
Tail
Impact Point
22 m
89 m
57 m
35 m
Fig. 35 – Photo from Above Showing Drop Test Site in Detail, with Dimensions
AGATE Composite Airframe Impact Test Results
AGATE-WP3.4-034026-088, Rev A 26 October 31, 2001
3.3 Visual Assessment of Structural Damage
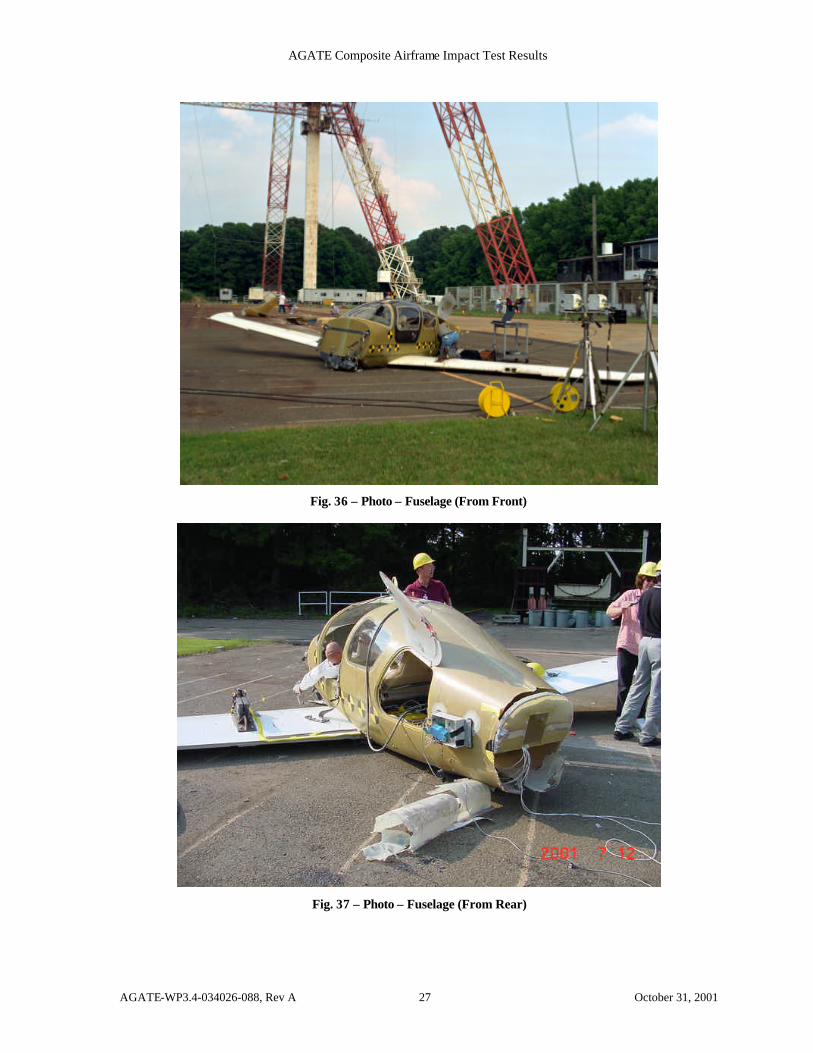
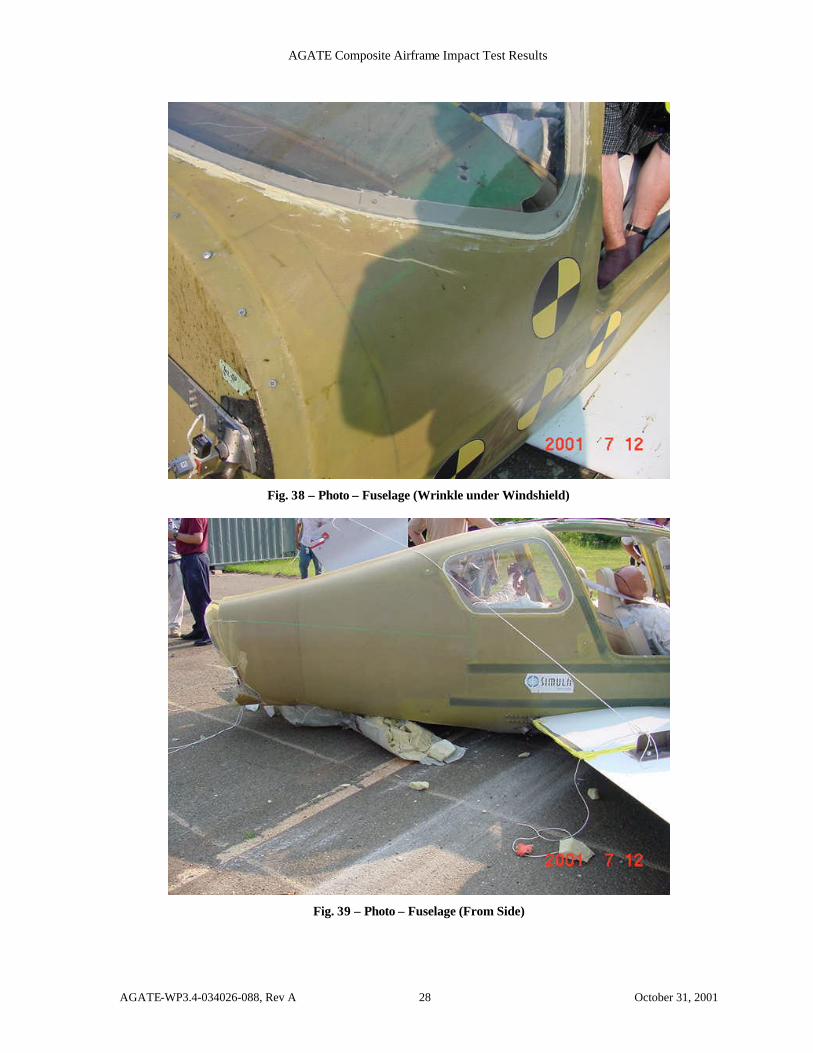
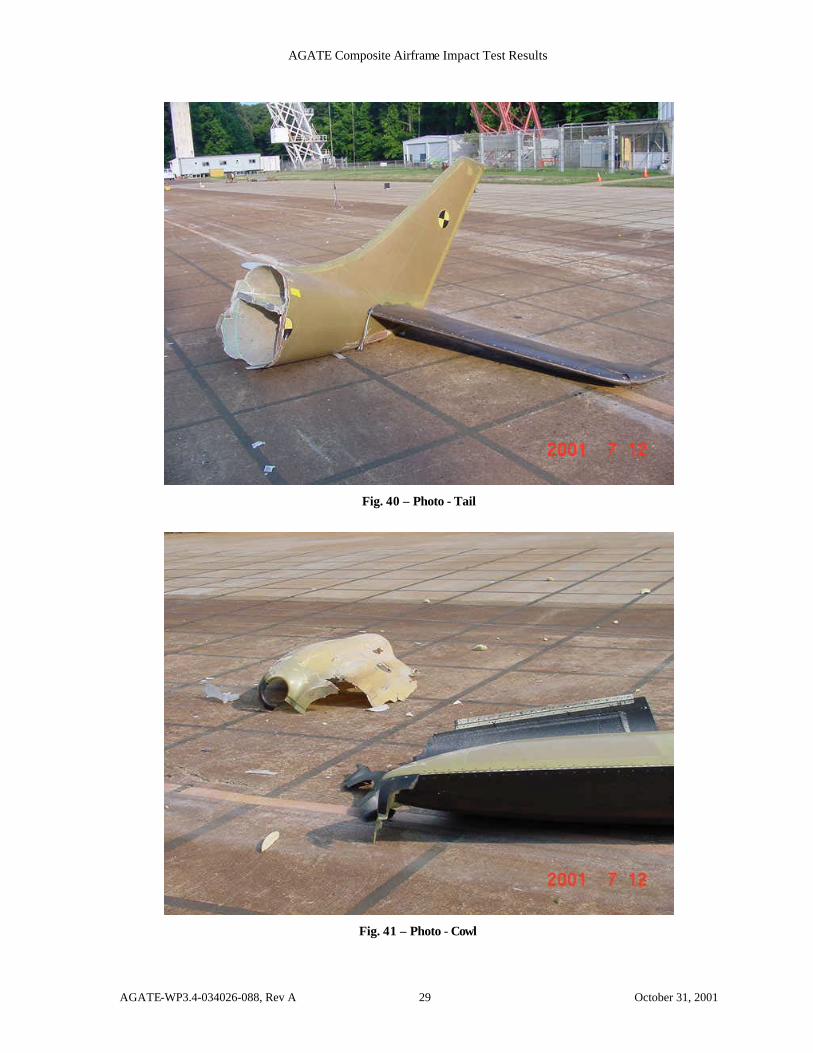
The condition of the fuselage is documented in Figs. 36-39 from a number of different angles. It is noted that the cabin of the aircraft remained intact and did not suffer a great deal of damage above the cabin floor level. The most notable damage was a minor face sheet wrinkle under the windshield shown in Fig. 38. This is the only portion of the fuselage above the lower longeron that sustained any damage. The empennage is shown in Fig. 40. It separated from the fuselage at a fuselage station containing a number of discontinuities. The core thickness changes at this location. A shelf terminates and fuselage frame is located at this location. This fracture in no way posed any risk to the occupants. Furthermore, it no doubt occurred as a result of a bending moment that greatly exceeds the ultimate load associated with the production aircraft’s flight and maneuver loads.
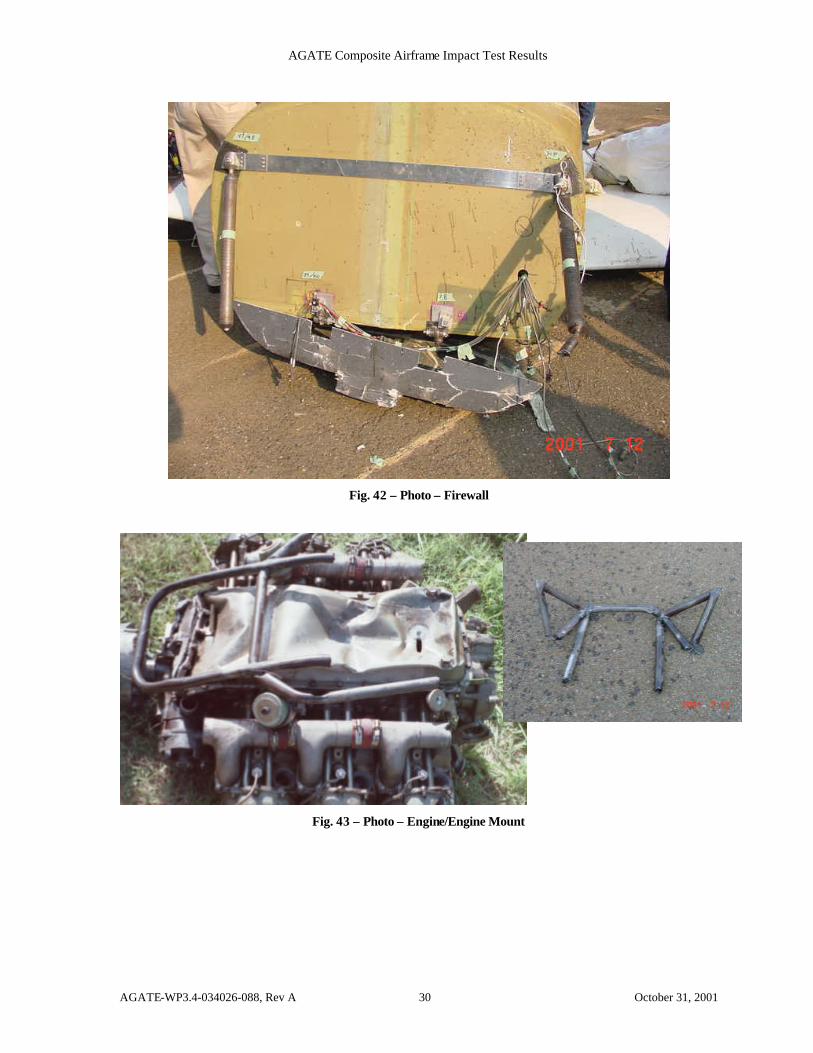
The cowl is shown in Fig. 41. The cowl failed as a consequence of the engine impact following the failure of the engine mount. It ultimately ended up in two pieces that were shed during the slide out. The firewall is shown in Figs. 42 and 43. These figures document a portion of the engine mount failure. Fig. 42 shows the load-limiting devices, which didn’t function as intended due to the structural failure of the joints of the load-limiting devices.
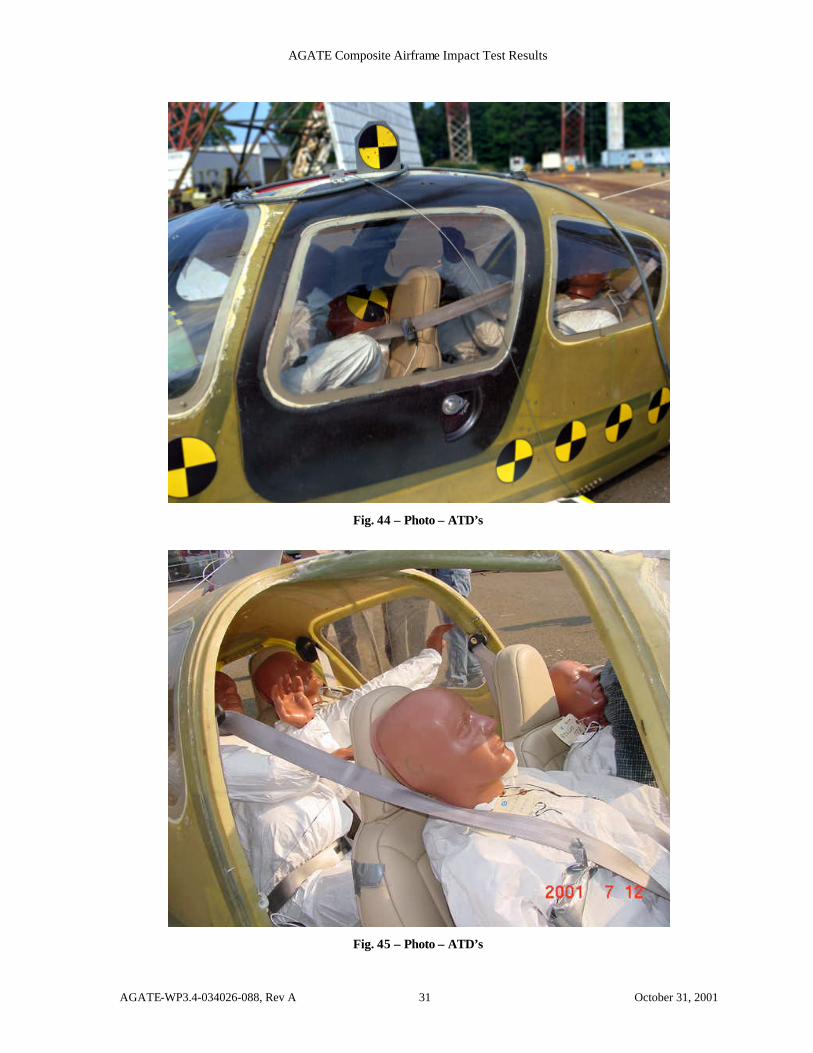
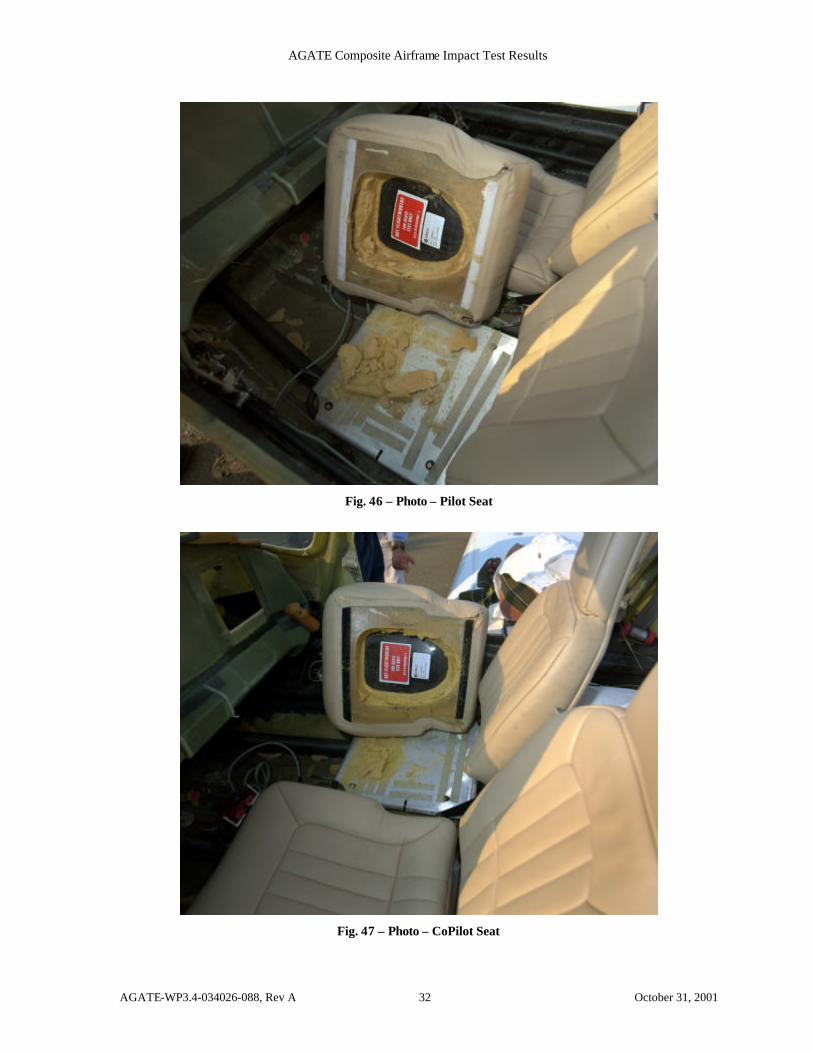
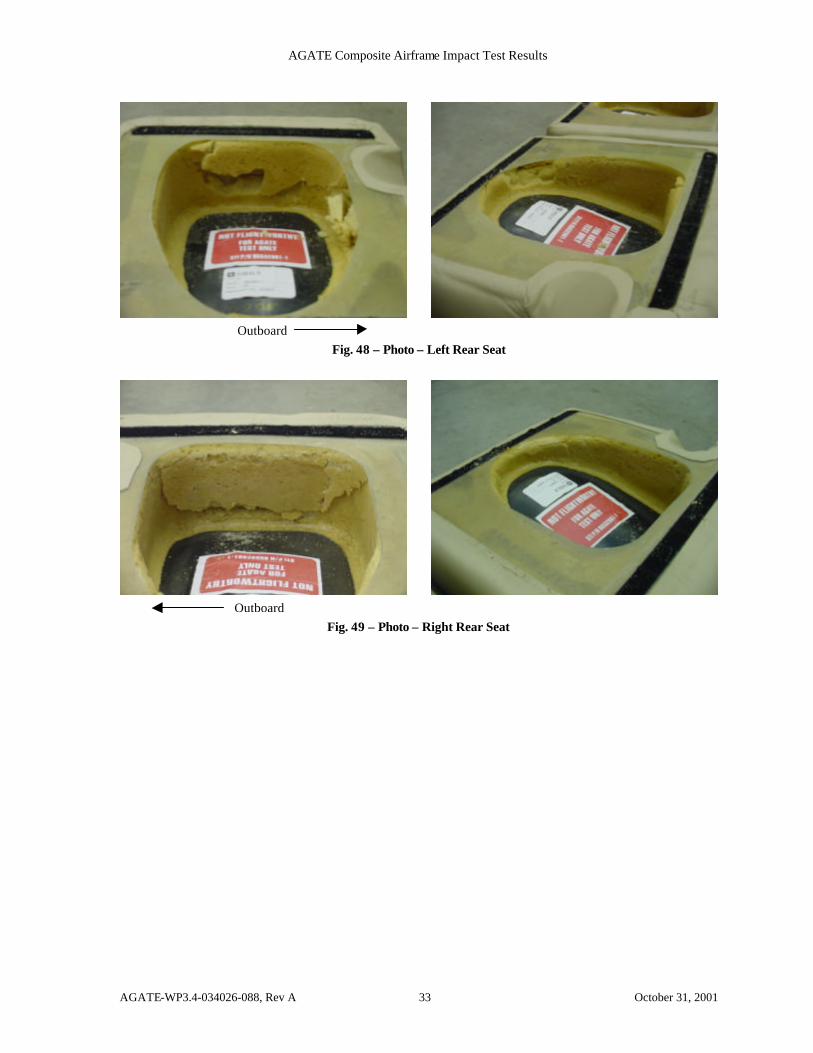
The post-test condition of the interior is documented in Figs. 44-49. The final resting position of the ATD’s is documented in Figs. 44 and 45; the post-test seat condition is documented in Figs. 46-49. The seat damage is particularly interesting in view of the favorable lumbar loads presented later in the report.
AGATE Composite Airframe Impact Test Results
AGATE-WP3.4-034026-088, Rev A 27 October 31, 2001
Fig. 36 – Photo – Fuselage (From Front)
Fig. 37 – Photo – Fuselage (From Rear)
AGATE Composite Airframe Impact Test Results
AGATE-WP3.4-034026-088, Rev A 28 October 31, 2001
Fig. 38 – Photo – Fuselage (Wrinkle under Windshield)
Fig. 39 – Photo – Fuselage (From Side)
AGATE Composite Airframe Impact Test Results
AGATE-WP3.4-034026-088, Rev A 29 October 31, 2001
Fig. 40 – Photo - Tail
Fig. 41 – Photo - Cowl
AGATE Composite Airframe Impact Test Results
AGATE-WP3.4-034026-088, Rev A 30 October 31, 2001
Fig. 42 – Photo – Firewall
Fig. 43 – Photo – Engine/Engine Mount
AGATE Composite Airframe Impact Test Results
AGATE-WP3.4-034026-088, Rev A 31 October 31, 2001
Fig. 44 – Photo – ATD’s
Fig. 45 – Photo – ATD’s
AGATE Composite Airframe Impact Test Results
AGATE-WP3.4-034026-088, Rev A 32 October 31, 2001
Fig. 46 – Photo – Pilot Seat
Fig. 47 – Photo – CoPilot Seat
AGATE Composite Airframe Impact Test Results
AGATE-WP3.4-034026-088, Rev A 33 October 31, 2001
Fig. 48 – Photo – Left Rear Seat
Fig. 49 – Photo – Right Rear Seat
Outboard
Outboard
AGATE Composite Airframe Impact Test Results
AGATE-WP3.4-034026-088, Rev A 34 October 31, 2001
3.4 Test Data
3.4.1 Motion Tracking
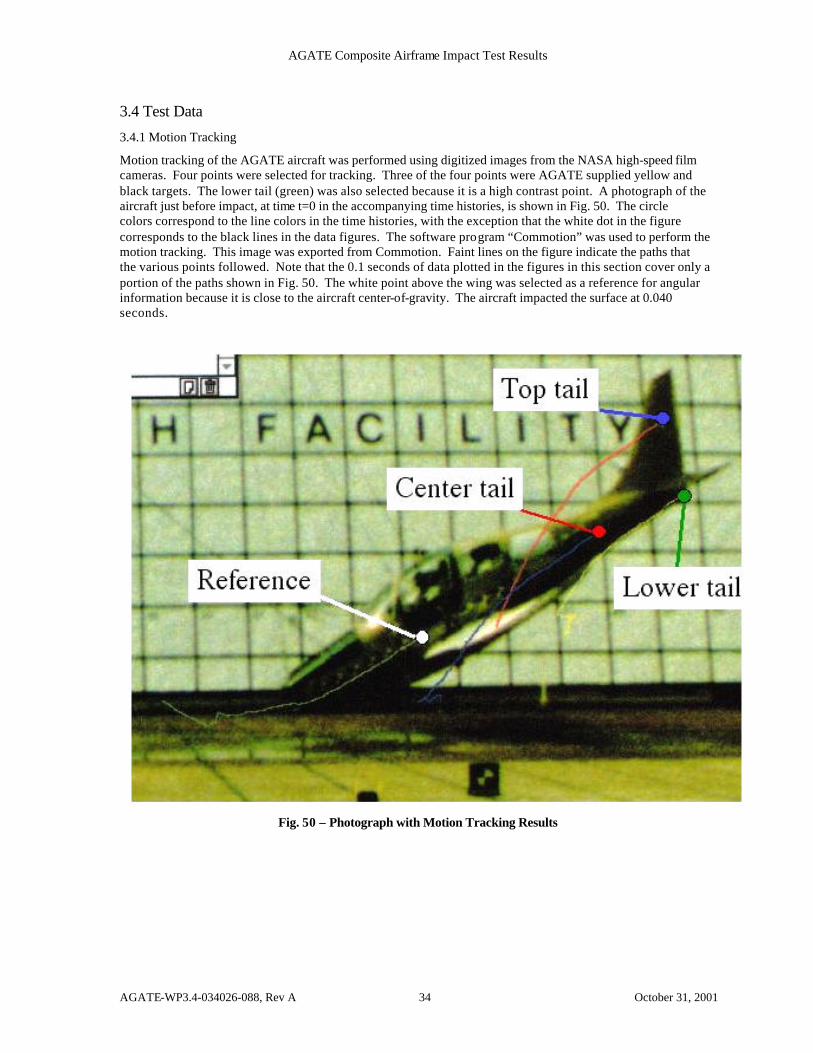
Motion tracking of the AGATE aircraft was performed using digitized images from the NASA high-speed film cameras. Four points were selected for tracking. Three of the four points were AGATE supplied yellow and black targets. The lower tail (green) was also selected because it is a high contrast point. A photograph of the aircraft just before impact, at time t=0 in the accompanying time histories, is shown in Fig. 50. The circle colors correspond to the line colors in the time histories, with the exception that the white dot in the figure corresponds to the black lines in the data figures. The software program “Commotion” was used to perform the motion tracking. This image was exported from Commotion. Faint lines on the figure indicate the paths that the various points followed. Note that the 0.1 seconds of data plotted in the figures in this section cover only a portion of the paths shown in Fig. 50. The white point above the wing was selected as a reference for angular information because it is close to the aircraft center-of-gravity. The aircraft impacted the surface at 0.040 seconds.
Fig. 50 – Photograph with Motion Tracking Results
AGATE Composite Airframe Impact Test Results
AGATE-WP3.4-034026-088, Rev A 35 October 31, 2001
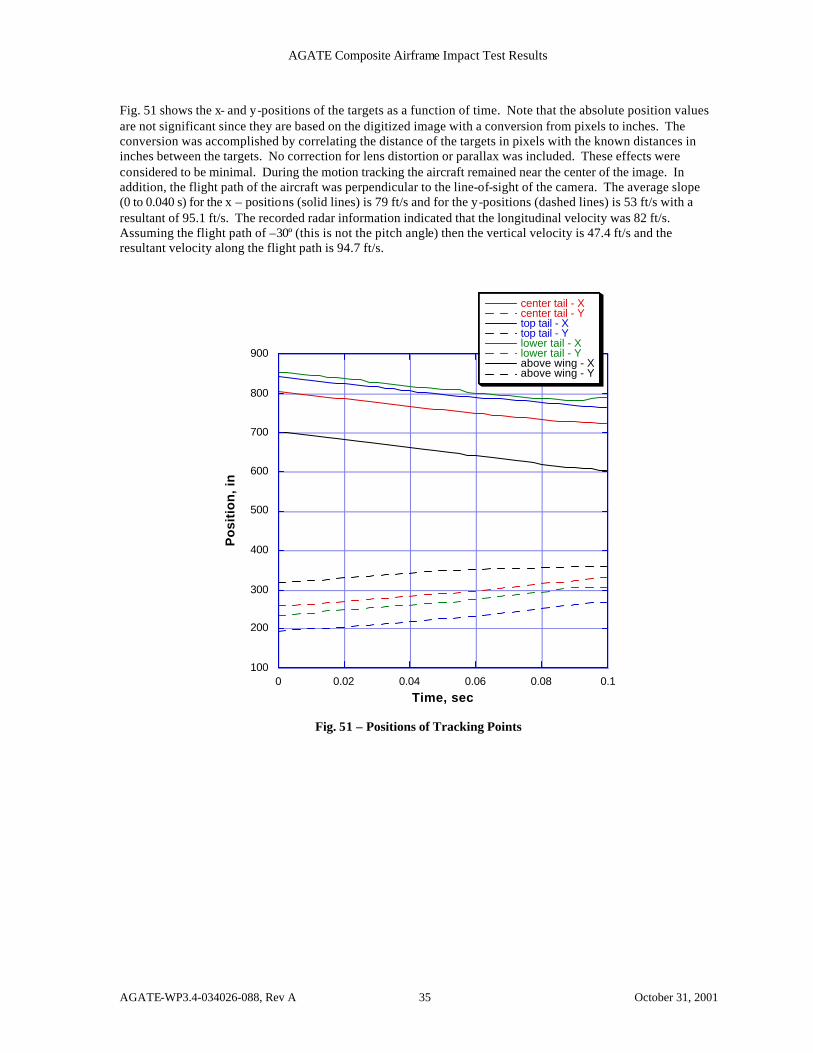
Fig. 51 shows the x- and y-positions of the targets as a function of time. Note that the absolute position values are not significant since they are based on the digitized image with a conversion from pixels to inches. The conversion was accomplished by correlating the distance of the targets in pixels with the known distances in inches between the targets. No correction for lens distortion or parallax was included. These effects were considered to be minimal. During the motion tracking the aircraft remained near the center of the image. In addition, the flight path of the aircraft was perpendicular to the line-of-sight of the camera. The average slope (0 to 0.040 s) for the x – positions (solid lines) is 79 ft/s and for the y-positions (dashed lines) is 53 ft/s with a resultant of 95.1 ft/s. The recorded radar information indicated that the longitudinal velocity was 82 ft/s. Assuming the flight path of –30º (this is not the pitch angle) then the vertical velocity is 47.4 ft/s and the resultant velocity along the flight path is 94.7 ft/s.
100
200
300
400
500
600
700
800
900
0 0.02 0.04 0.06 0.08 0.1
center tail - Xcenter tail - Ytop tail - Xtop tail - Ylower tail - Xlower tail - Yabove wing - Xabove wing - Y
Po
siti
on
, in
Time, sec
Fig. 51 – Positions of Tracking Points
AGATE Composite Airframe Impact Test Results
AGATE-WP3.4-034026-088, Rev A 36 October 31, 2001
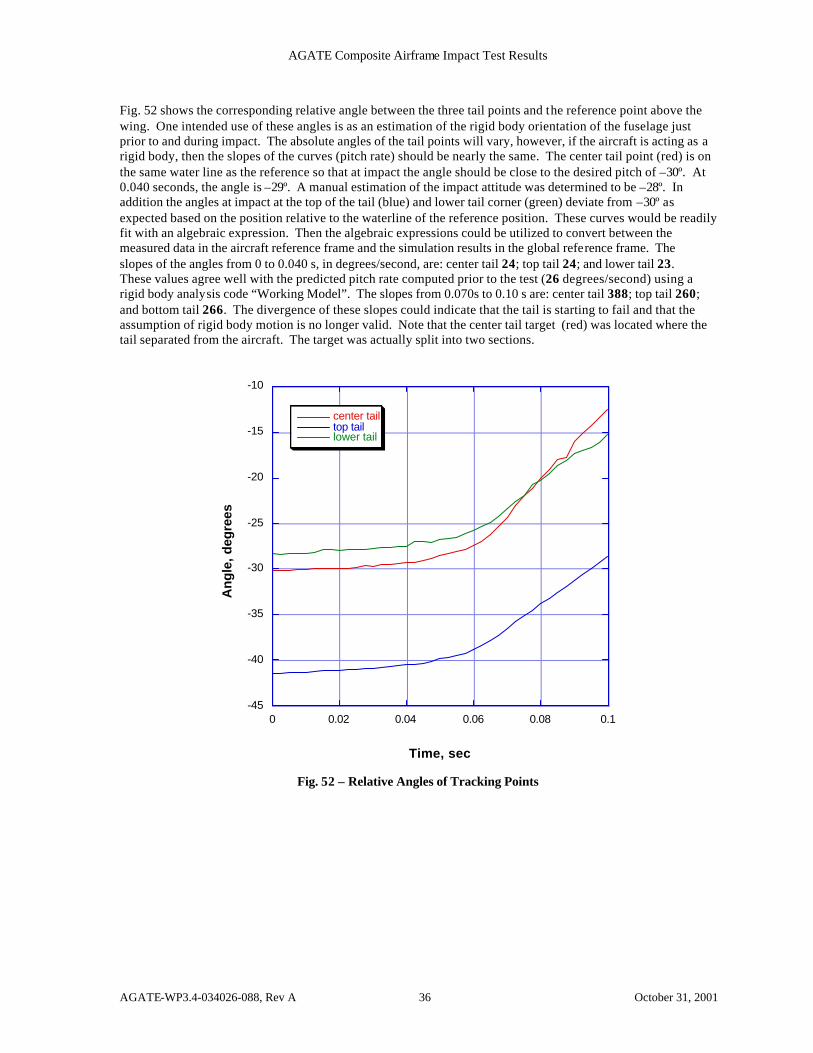
Fig. 52 shows the corresponding relative angle between the three tail points and the reference point above the wing. One intended use of these angles is as an estimation of the rigid body orientation of the fuselage just prior to and during impact. The absolute angles of the tail points will vary, however, if the aircraft is acting as a rigid body, then the slopes of the curves (pitch rate) should be nearly the same. The center tail point (red) is on the same water line as the reference so that at impact the angle should be close to the desired pitch of –30º. At 0.040 seconds, the angle is –29º. A manual estimation of the impact attitude was determined to be –28º. In addition the angles at impact at the top of the tail (blue) and lower tail corner (green) deviate from –30º as expected based on the position relative to the waterline of the reference position. These curves would be readily fit with an algebraic expression. Then the algebraic expressions could be utilized to convert between the measured data in the aircraft reference frame and the simulation results in the global reference frame. The slopes of the angles from 0 to 0.040 s, in degrees/second, are: center tail 24; top tail 24; and lower tail 23. These values agree well with the predicted pitch rate computed prior to the test (26 degrees/second) using a rigid body analysis code “Working Model”. The slopes from 0.070s to 0.10 s are: center tail 388; top tail 260; and bottom tail 266. The divergence of these slopes could indicate that the tail is starting to fail and that the assumption of rigid body motion is no longer valid. Note that the center tail target (red) was located where the tail separated from the aircraft. The target was actually split into two sections.
-45
-40
-35
-30
-25
-20
-15
-10
0 0.02 0.04 0.06 0.08 0.1
center tailtop taillower tail
An
gle
, deg
rees
Time, sec
Fig. 52 – Relative Angles of Tracking Points
AGATE Composite Airframe Impact Test Results
AGATE-WP3.4-034026-088, Rev A 37 October 31, 2001
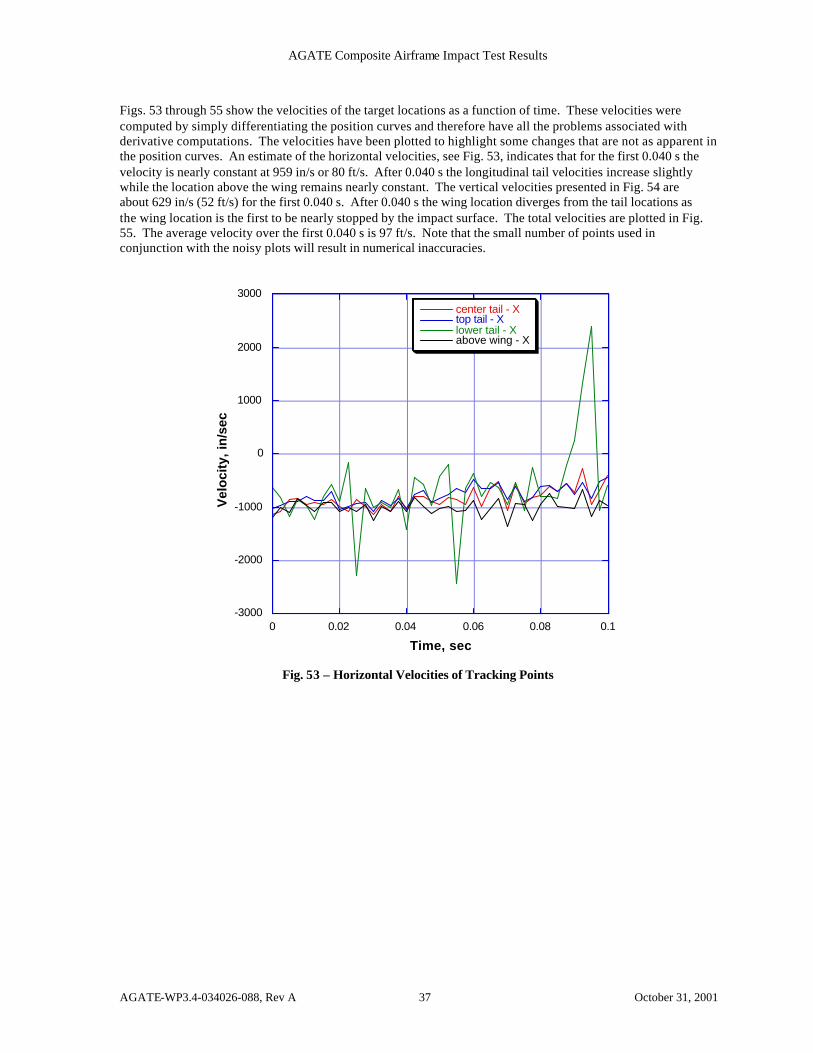
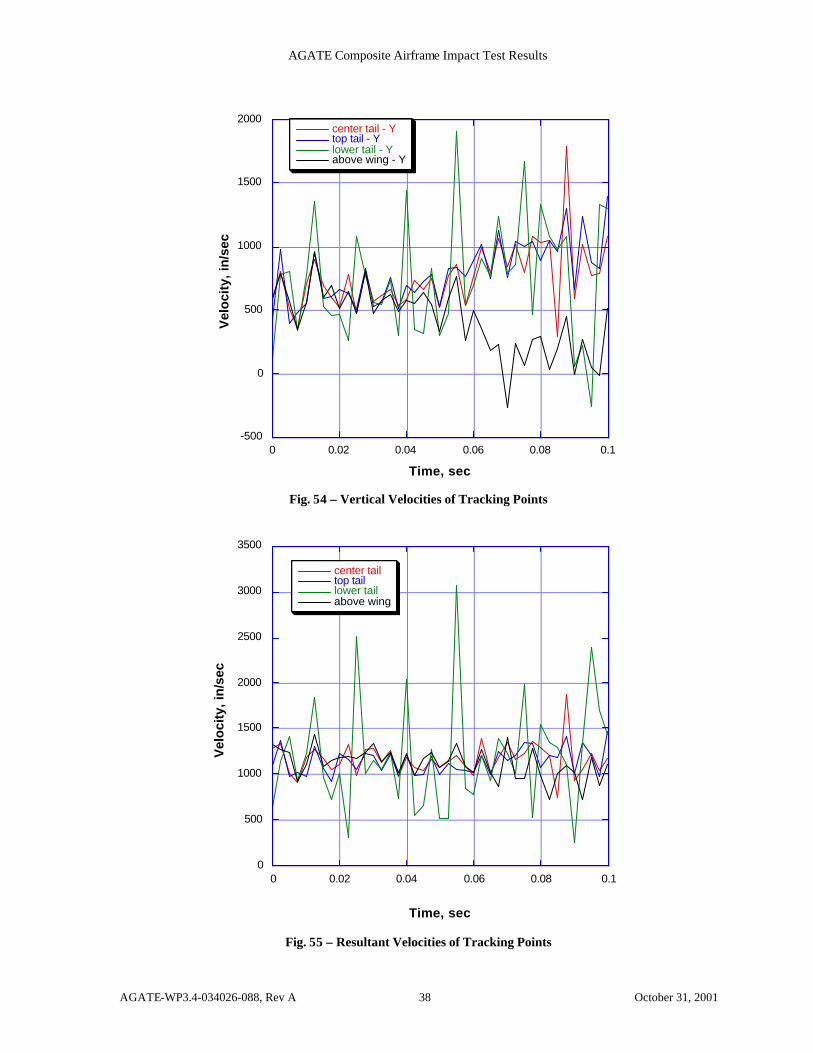
Figs. 53 through 55 show the velocities of the target locations as a function of time. These velocities were computed by simply differentiating the position curves and therefore have all the problems associated with derivative computations. The velocities have been plotted to highlight some changes that are not as apparent in the position curves. An estimate of the horizontal velocities, see Fig. 53, indicates that for the first 0.040 s the velocity is nearly constant at 959 in/s or 80 ft/s. After 0.040 s the longitudinal tail velocities increase slightly while the location above the wing remains nearly constant. The vertical velocities presented in Fig. 54 are about 629 in/s (52 ft/s) for the first 0.040 s. After 0.040 s the wing location diverges from the tail locations as the wing location is the first to be nearly stopped by the impact surface. The total velocities are plotted in Fig. 55. The average velocity over the first 0.040 s is 97 ft/s. Note that the small number of points used in conjunction with the noisy plots will result in numerical inaccuracies.
-3000
-2000
-1000
0
1000
2000
3000
0 0.02 0.04 0.06 0.08 0.1
center tail - Xtop tail - Xlower tail - Xabove wing - X
Vel
oci
ty, i
n/s
ec
Time, sec
Fig. 53 – Horizontal Velocities of Tracking Points
AGATE Composite Airframe Impact Test Results
AGATE-WP3.4-034026-088, Rev A 38 October 31, 2001
-500
0
500
1000
1500
2000
0 0.02 0.04 0.06 0.08 0.1
center tail - Ytop tail - Ylower tail - Yabove wing - Y
Vel
oci
ty, i
n/s
ec
Time, sec
Fig. 54 – Vertical Velocities of Tracking Points
0
500
1000
1500
2000
2500
3000
3500
0 0.02 0.04 0.06 0.08 0.1
center tailtop taillower tailabove wing
Vel
oci
ty, i
n/s
ec
Time, sec
Fig. 55 – Resultant Velocities of Tracking Points

AGATE Composite Airframe Impact Test Results
AGATE-WP3.4-034026-088, Rev A 39 October 31, 2001
This analysis highlights an initial approach for using digitized photographic information to describe the global motion of an aircraft just prior to and during impact. The values derived from the motion tracking data agree with results from other methods. The use of advanced computer software and hardware systems to quantify the global motion of aircraft impacts can significantly enhance the data reduction and analysis correlation processes.
AGATE Composite Airframe Impact Test Results
AGATE-WP3.4-034026-088, Rev A 40 October 31, 2001
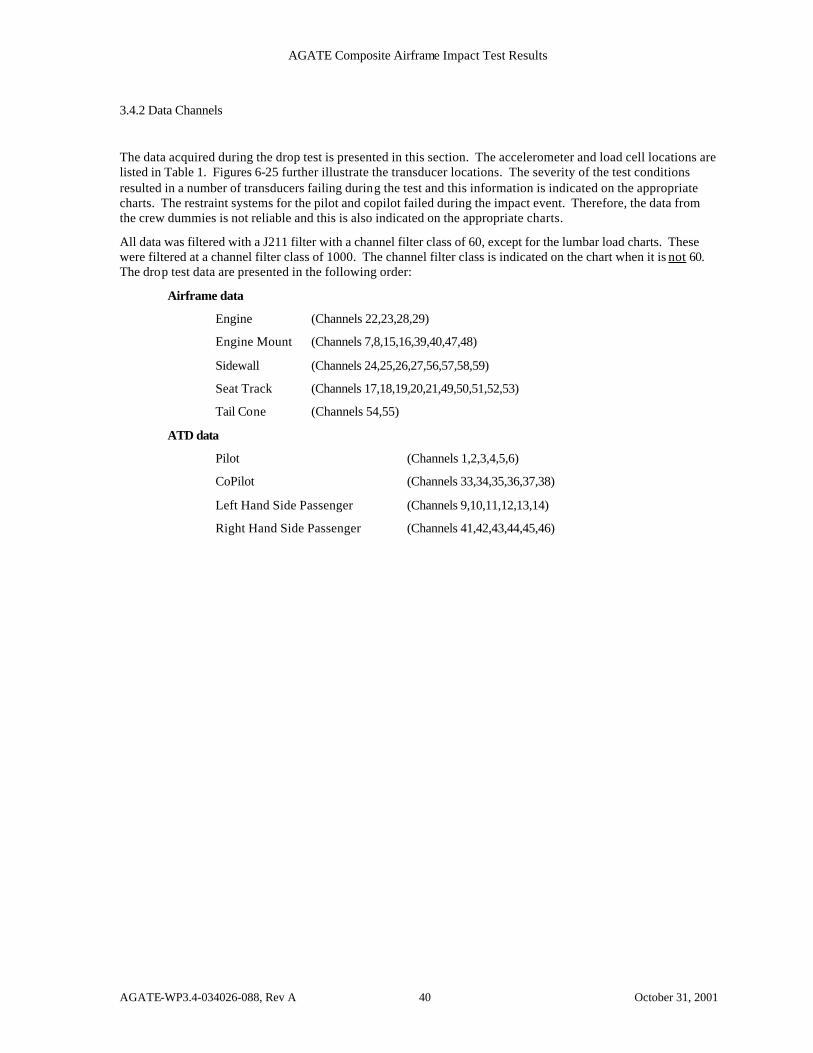
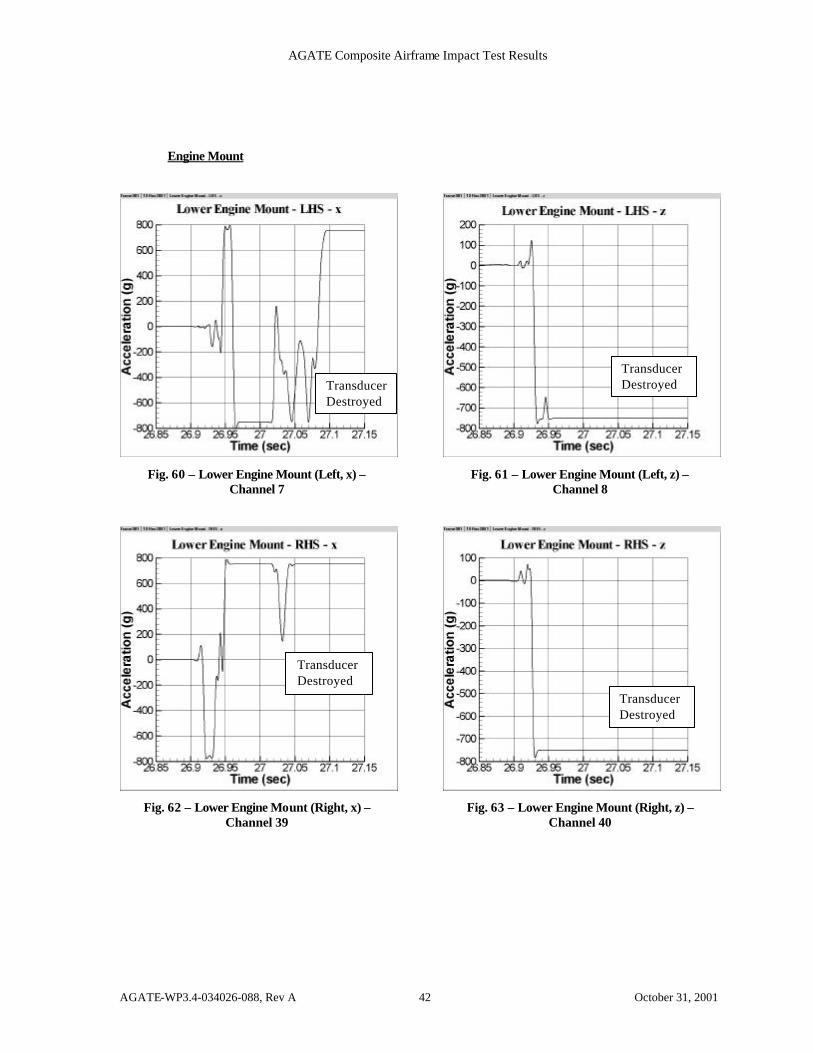
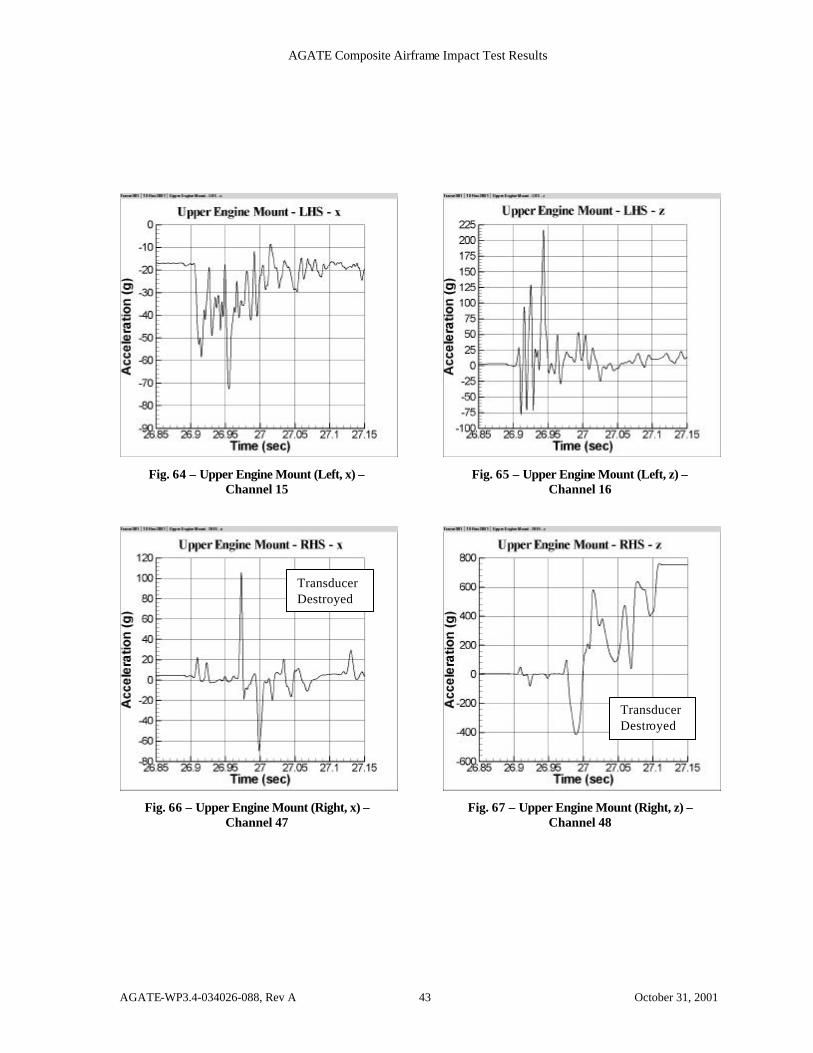
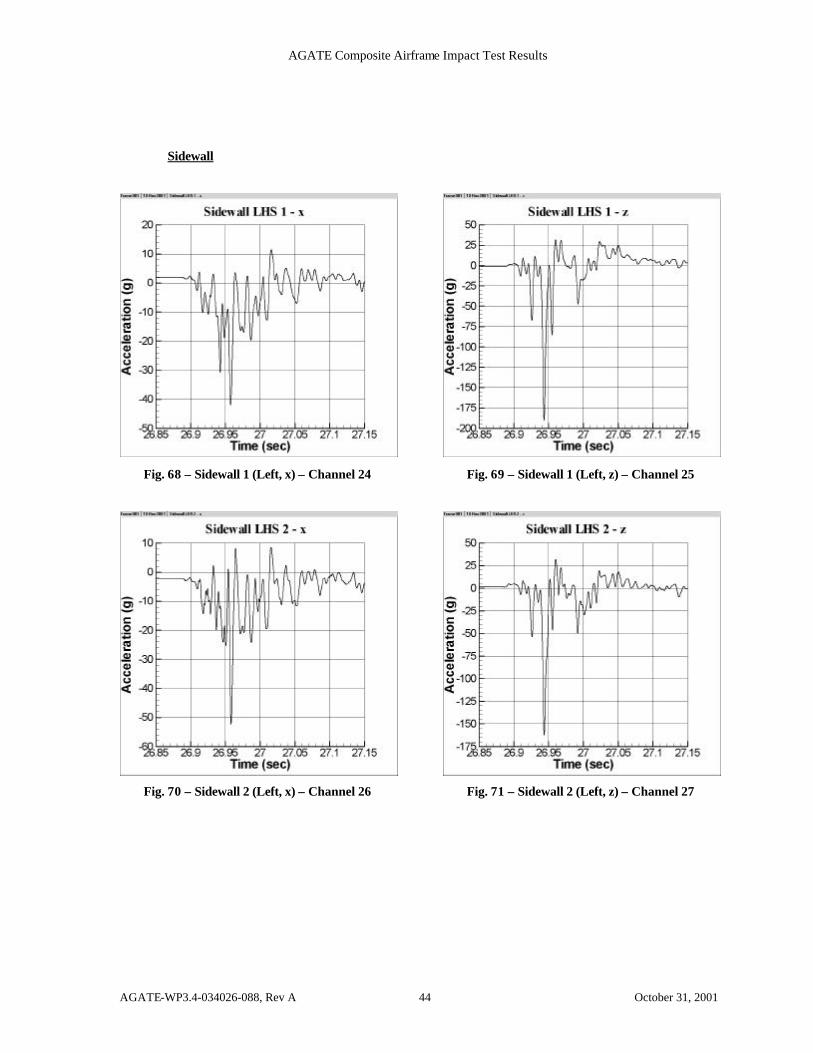
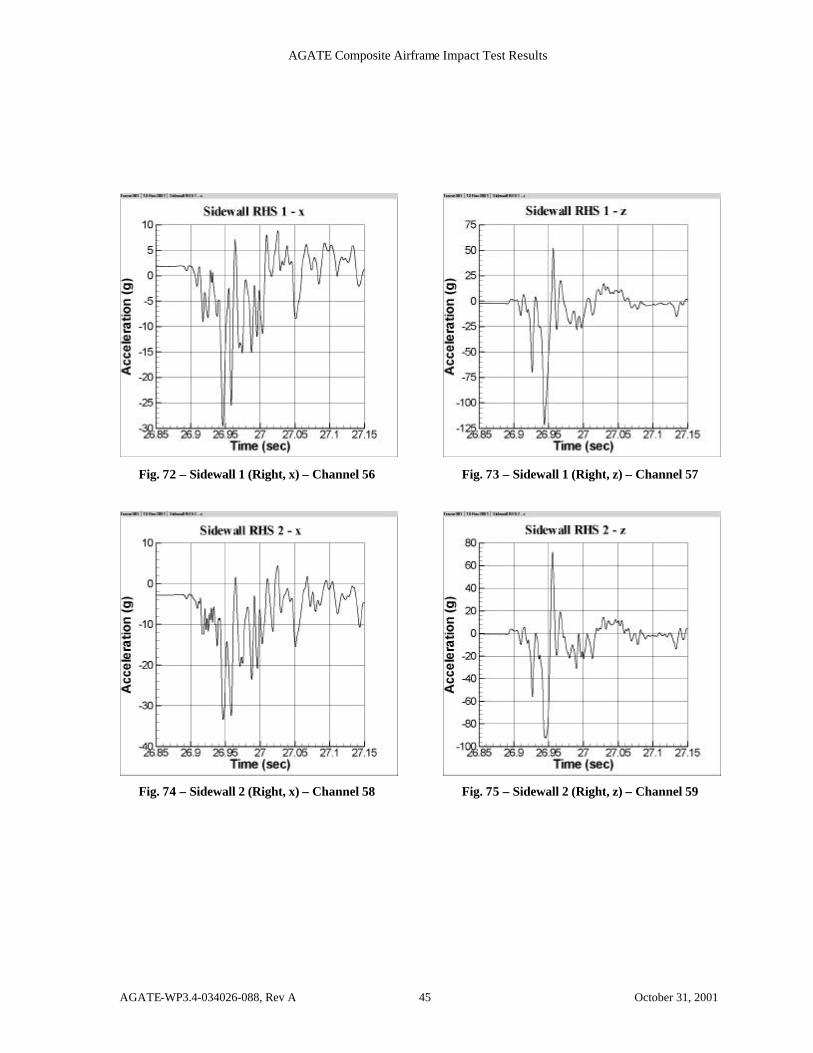
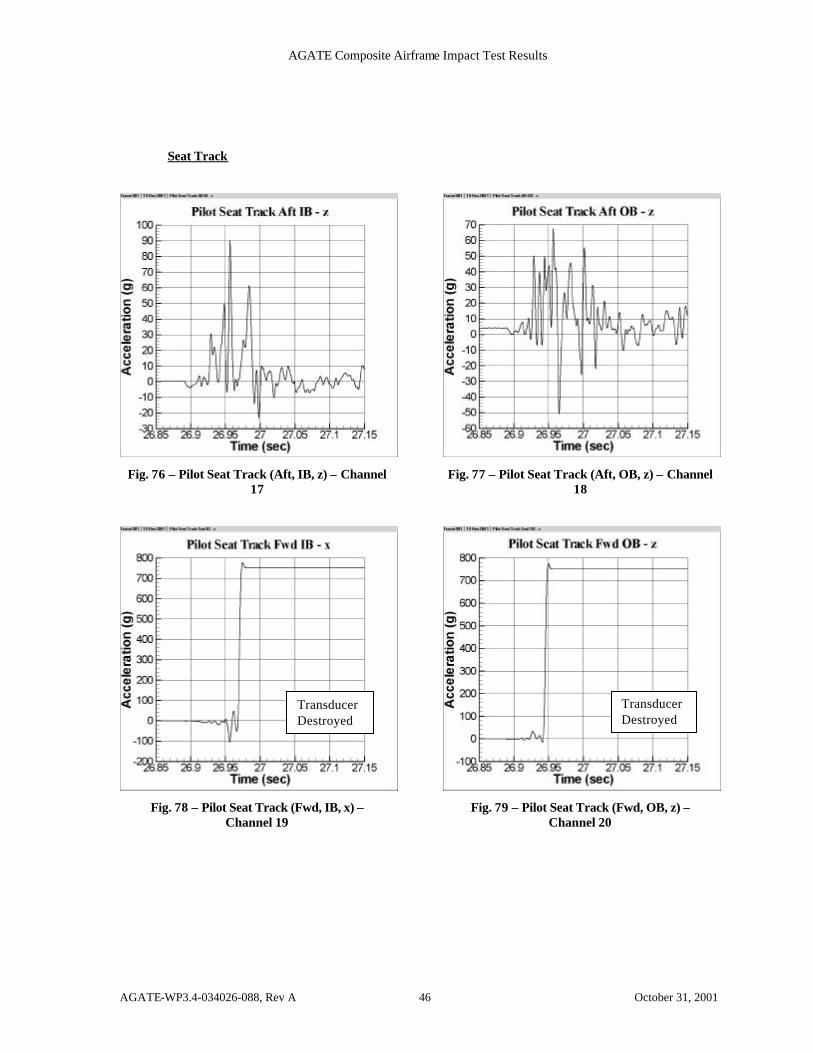
3.4.2 Data Channels
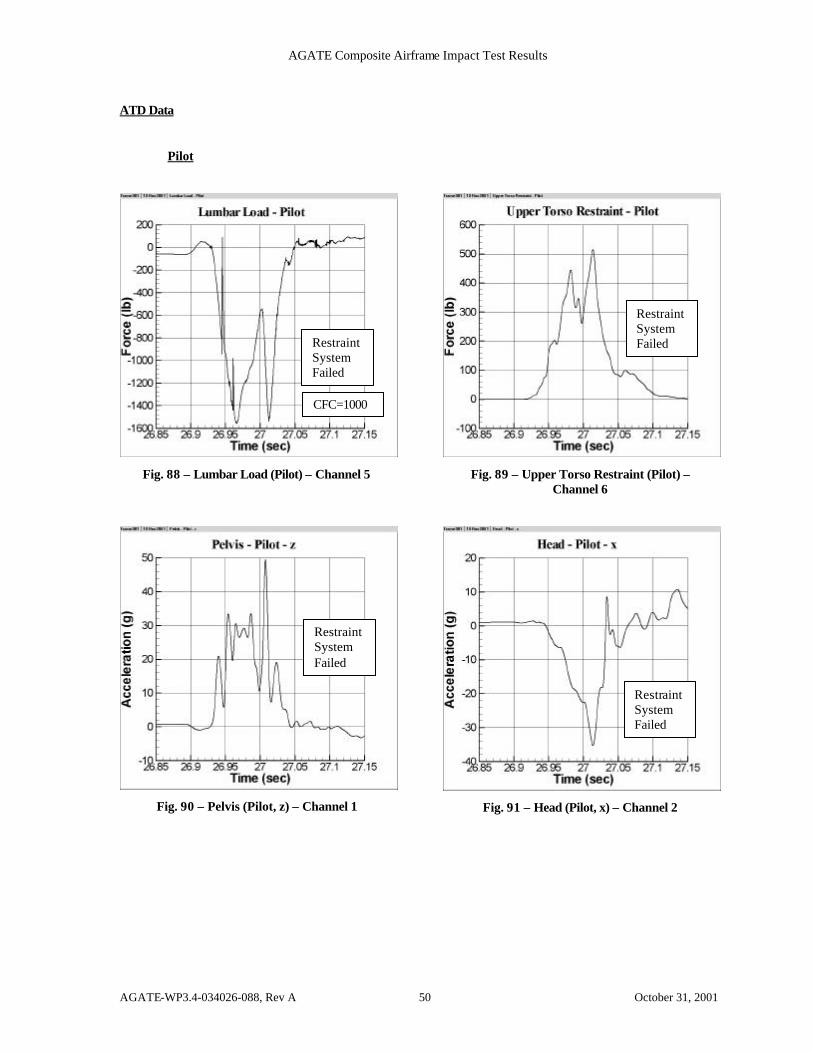
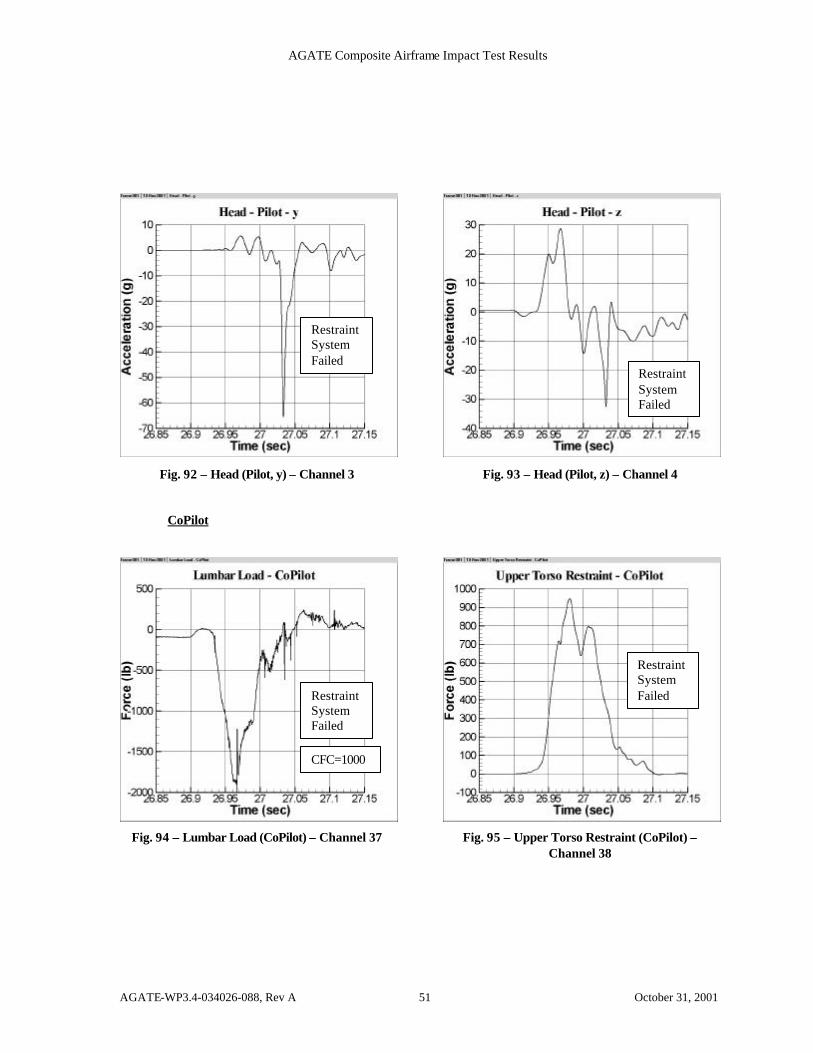
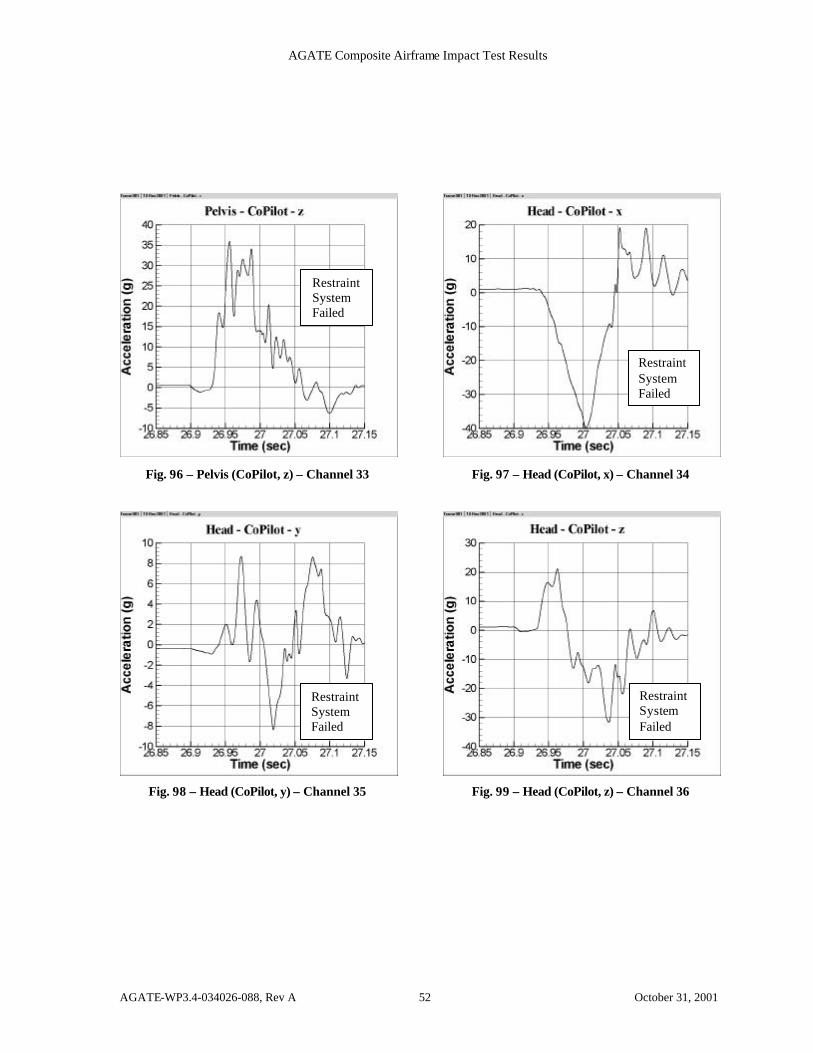
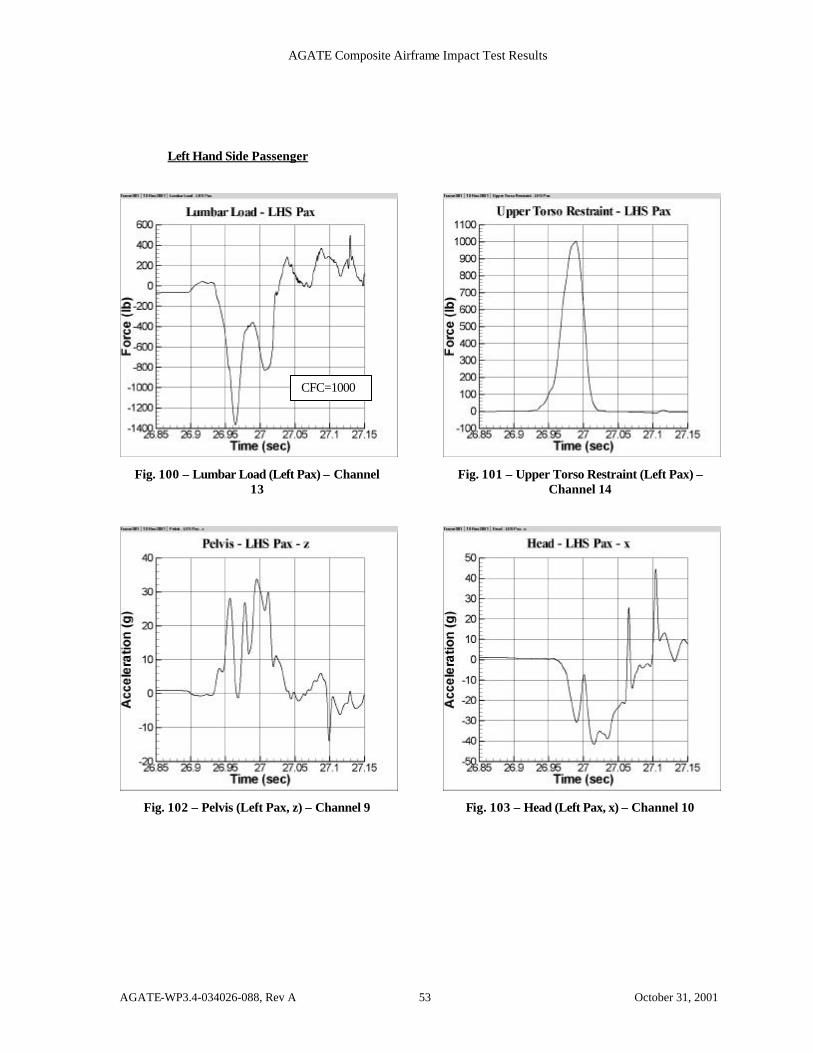
The data acquired during the drop test is presented in this section. The accelerometer and load cell locations are listed in Table 1. Figures 6-25 further illustrate the transducer locations. The severity of the test conditions resulted in a number of transducers failing during the test and this information is indicated on the appropriate charts. The restraint systems for the pilot and copilot failed during the impact event. Therefore, the data from the crew dummies is not reliable and this is also indicated on the appropriate charts.
All data was filtered with a J211 filter with a channel filter class of 60, except for the lumbar load charts. These were filtered at a channel filter class of 1000. The channel filter class is indicated on the chart when it is not 60. The drop test data are presented in the following order:
Airframe data
Engine (Channels 22,23,28,29)
Engine Mount (Channels 7,8,15,16,39,40,47,48)
Sidewall (Channels 24,25,26,27,56,57,58,59)
Seat Track (Channels 17,18,19,20,21,49,50,51,52,53)
Tail Cone (Channels 54,55)
ATD data
Pilot (Channels 1,2,3,4,5,6)
CoPilot (Channels 33,34,35,36,37,38)
Left Hand Side Passenger (Channels 9,10,11,12,13,14)
Right Hand Side Passenger (Channels 41,42,43,44,45,46)
AGATE Composite Airframe Impact Test Results
AGATE-WP3.4-034026-088, Rev A 41 October 31, 2001
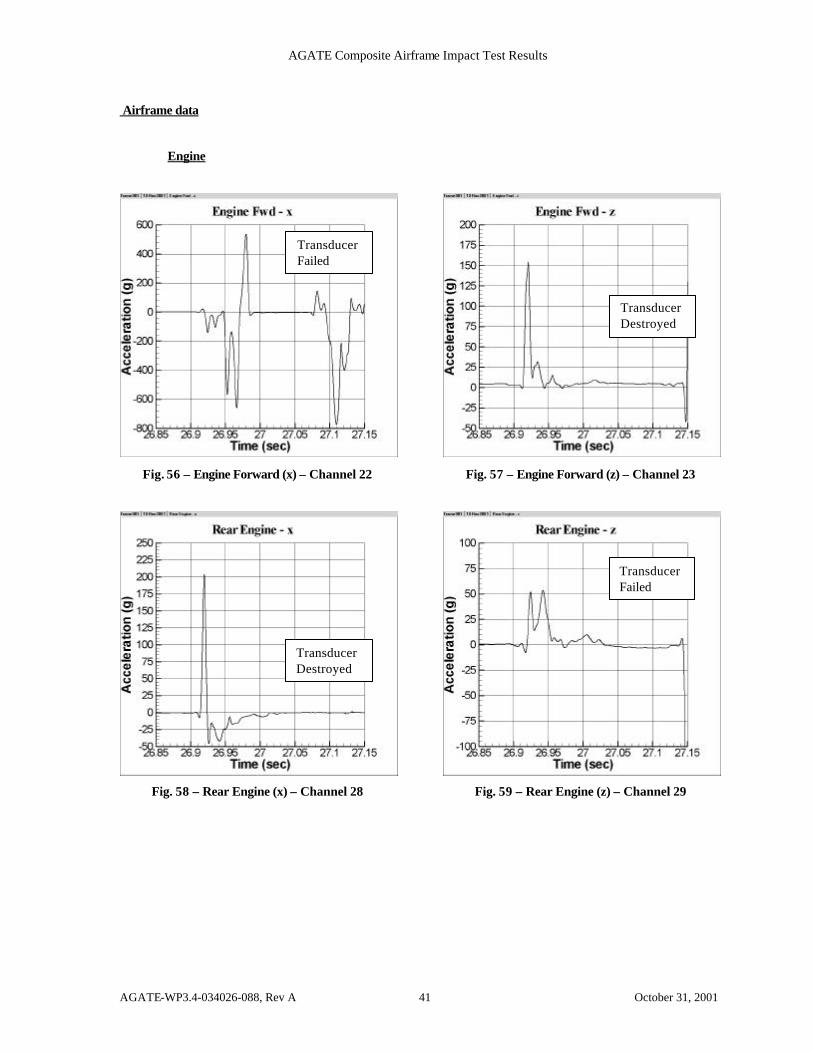
Airframe data Engine
Fig. 56 – Engine Forward (x) – Channel 22
Fig. 57 – Engine Forward (z) – Channel 23
Fig. 58 – Rear Engine (x) – Channel 28
Fig. 59 – Rear Engine (z) – Channel 29
Transducer Destroyed
Transducer Failed
Transducer Failed
Transducer Destroyed
AGATE Composite Airframe Impact Test Results
AGATE-WP3.4-034026-088, Rev A 42 October 31, 2001
Engine Mount
Fig. 60 – Lower Engine Mount (Left, x) – Channel 7
Fig. 61 – Lower Engine Mount (Left, z) – Channel 8
Fig. 62 – Lower Engine Mount (Right, x) – Channel 39
Fig. 63 – Lower Engine Mount (Right, z) – Channel 40
Transducer Destroyed
Transducer Destroyed
Transducer Destroyed
Transducer Destroyed
AGATE Composite Airframe Impact Test Results
AGATE-WP3.4-034026-088, Rev A 43 October 31, 2001
Fig. 64 – Upper Engine Mount (Left, x) – Channel 15
Fig. 65 – Upper Engine Mount (Left, z) – Channel 16
Fig. 66 – Upper Engine Mount (Right, x) – Channel 47
Fig. 67 – Upper Engine Mount (Right, z) – Channel 48
Transducer Destroyed
Transducer Destroyed
AGATE Composite Airframe Impact Test Results
AGATE-WP3.4-034026-088, Rev A 44 October 31, 2001
Sidewall
Fig. 68 – Sidewall 1 (Left, x) – Channel 24
Fig. 69 – Sidewall 1 (Left, z) – Channel 25
Fig. 70 – Sidewall 2 (Left, x) – Channel 26
Fig. 71 – Sidewall 2 (Left, z) – Channel 27
AGATE Composite Airframe Impact Test Results
AGATE-WP3.4-034026-088, Rev A 45 October 31, 2001
Fig. 72 – Sidewall 1 (Right, x) – Channel 56
Fig. 73 – Sidewall 1 (Right, z) – Channel 57
Fig. 74 – Sidewall 2 (Right, x) – Channel 58
Fig. 75 – Sidewall 2 (Right, z) – Channel 59
AGATE Composite Airframe Impact Test Results
AGATE-WP3.4-034026-088, Rev A 46 October 31, 2001
Seat Track
Fig. 76 – Pilot Seat Track (Aft, IB, z) – Channel 17
Fig. 77 – Pilot Seat Track (Aft, OB, z) – Channel 18
Fig. 78 – Pilot Seat Track (Fwd, IB, x) – Channel 19
Fig. 79 – Pilot Seat Track (Fwd, OB, z) – Channel 20
Transducer Destroyed
Transducer Destroyed
AGATE Composite Airframe Impact Test Results
AGATE-WP3.4-034026-088, Rev A 47 October 31, 2001
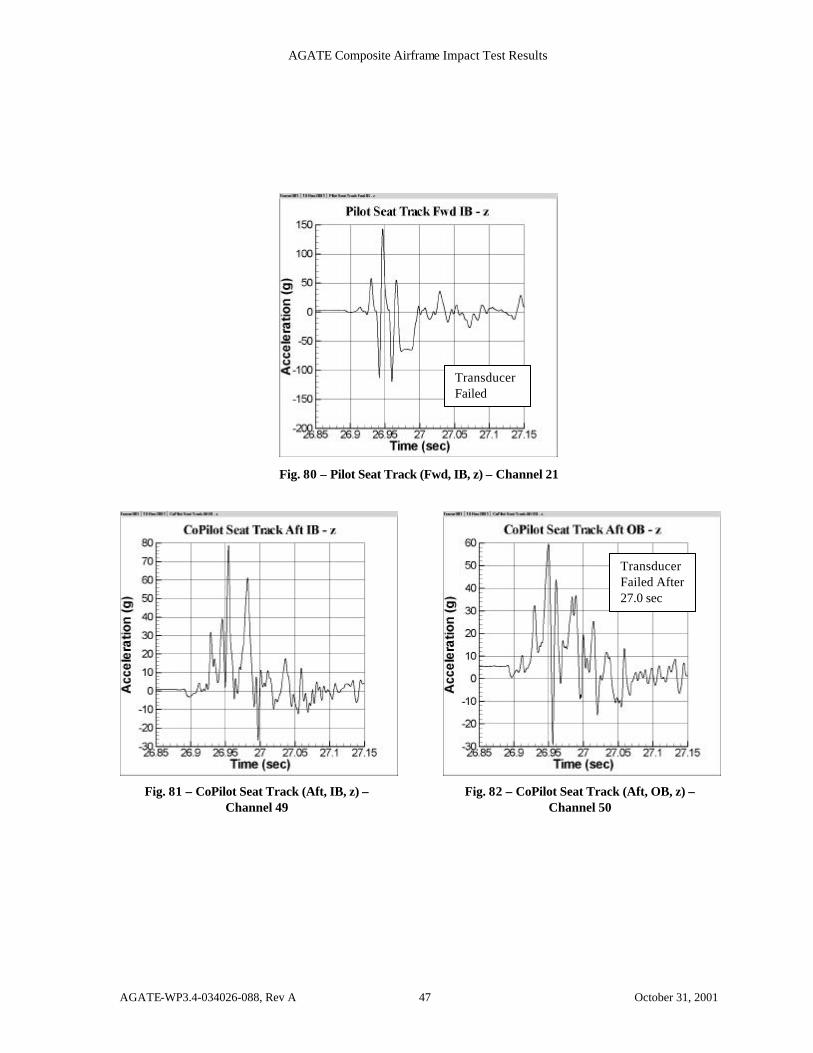
Fig. 80 – Pilot Seat Track (Fwd, IB, z) – Channel 21
Fig. 81 – CoPilot Seat Track (Aft, IB, z) – Channel 49
Fig. 82 – CoPilot Seat Track (Aft, OB, z) – Channel 50
Transducer Failed
Transducer Failed After 27.0 sec
AGATE Composite Airframe Impact Test Results
AGATE-WP3.4-034026-088, Rev A 48 October 31, 2001
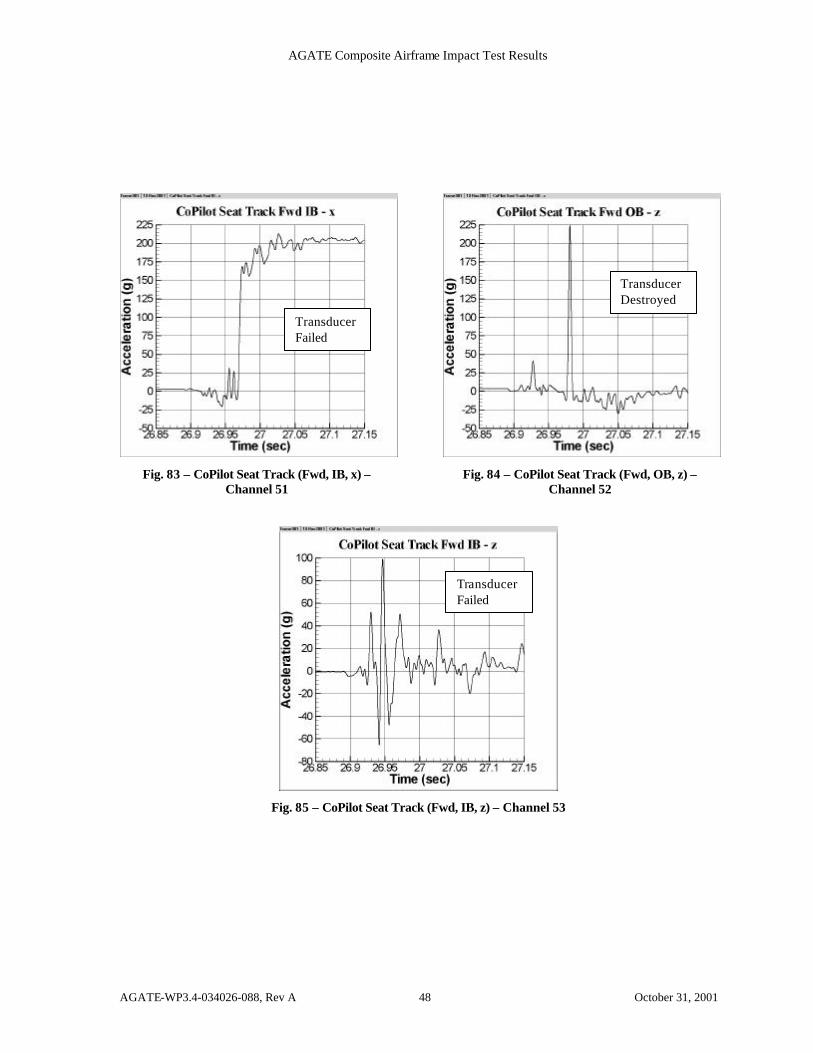
Fig. 83 – CoPilot Seat Track (Fwd, IB, x) – Channel 51
Fig. 84 – CoPilot Seat Track (Fwd, OB, z) – Channel 52
Fig. 85 – CoPilot Seat Track (Fwd, IB, z) – Channel 53
Transducer Destroyed
Transducer Failed
Transducer Failed
AGATE Composite Airframe Impact Test Results
AGATE-WP3.4-034026-088, Rev A 49 October 31, 2001
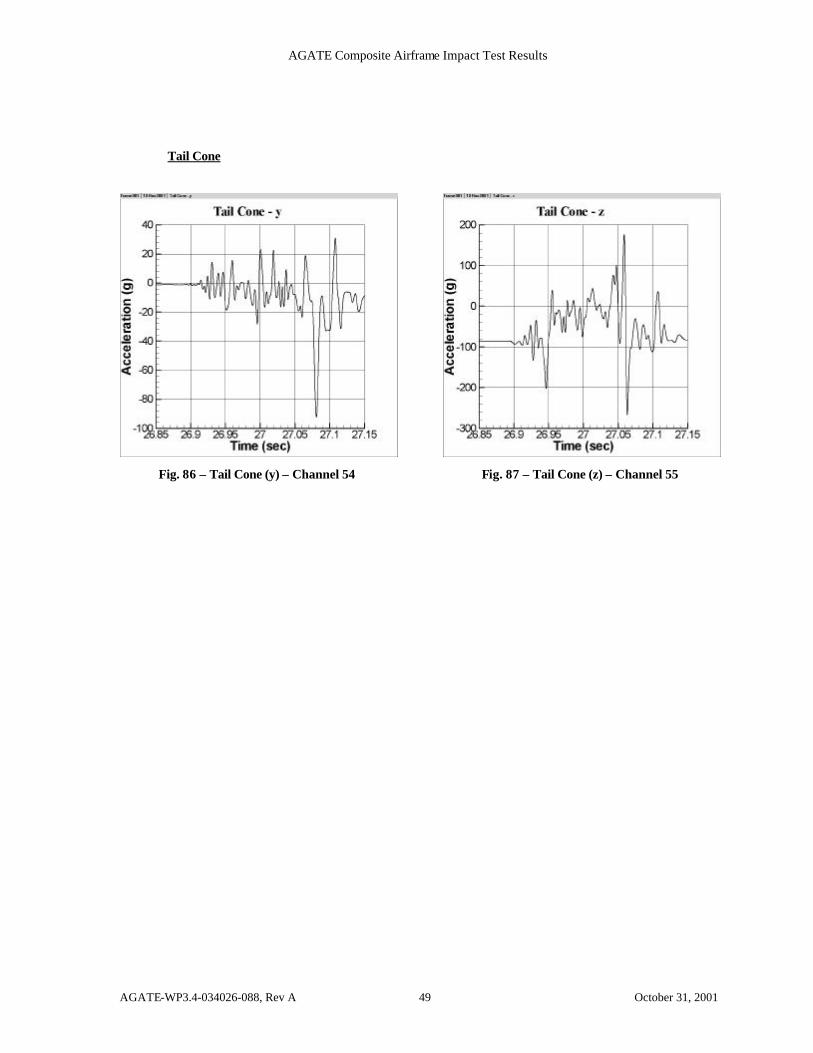
Tail Cone
Fig. 86 – Tail Cone (y) – Channel 54
Fig. 87 – Tail Cone (z) – Channel 55
AGATE Composite Airframe Impact Test Results
AGATE-WP3.4-034026-088, Rev A 50 October 31, 2001
ATD Data
Pilot
Fig. 88 – Lumbar Load (Pilot) – Channel 5
Fig. 89 – Upper Torso Restraint (Pilot) – Channel 6
Fig. 90 – Pelvis (Pilot, z) – Channel 1
Fig. 91 – Head (Pilot, x) – Channel 2
CFC=1000
Restraint System Failed
Restraint System Failed
Restraint System Failed
Restraint System Failed
AGATE Composite Airframe Impact Test Results
AGATE-WP3.4-034026-088, Rev A 51 October 31, 2001
Fig. 92 – Head (Pilot, y) – Channel 3
Fig. 93 – Head (Pilot, z) – Channel 4
CoPilot
Fig. 94 – Lumbar Load (CoPilot) – Channel 37
Fig. 95 – Upper Torso Restraint (CoPilot) – Channel 38
CFC=1000
Restraint System Failed
Restraint System Failed
Restraint System Failed
Restraint System Failed
AGATE Composite Airframe Impact Test Results
AGATE-WP3.4-034026-088, Rev A 52 October 31, 2001
Fig. 96 – Pelvis (CoPilot, z) – Channel 33
Fig. 97 – Head (CoPilot, x) – Channel 34
Fig. 98 – Head (CoPilot, y) – Channel 35
Fig. 99 – Head (CoPilot, z) – Channel 36
Restraint System Failed
Restraint System Failed
Restraint System Failed
Restraint System Failed
AGATE Composite Airframe Impact Test Results
AGATE-WP3.4-034026-088, Rev A 53 October 31, 2001
Left Hand Side Passenger
Fig. 100 – Lumbar Load (Left Pax) – Channel 13
Fig. 101 – Upper Torso Restraint (Left Pax) – Channel 14
Fig. 102 – Pelvis (Left Pax, z) – Channel 9
Fig. 103 – Head (Left Pax, x) – Channel 10
CFC=1000
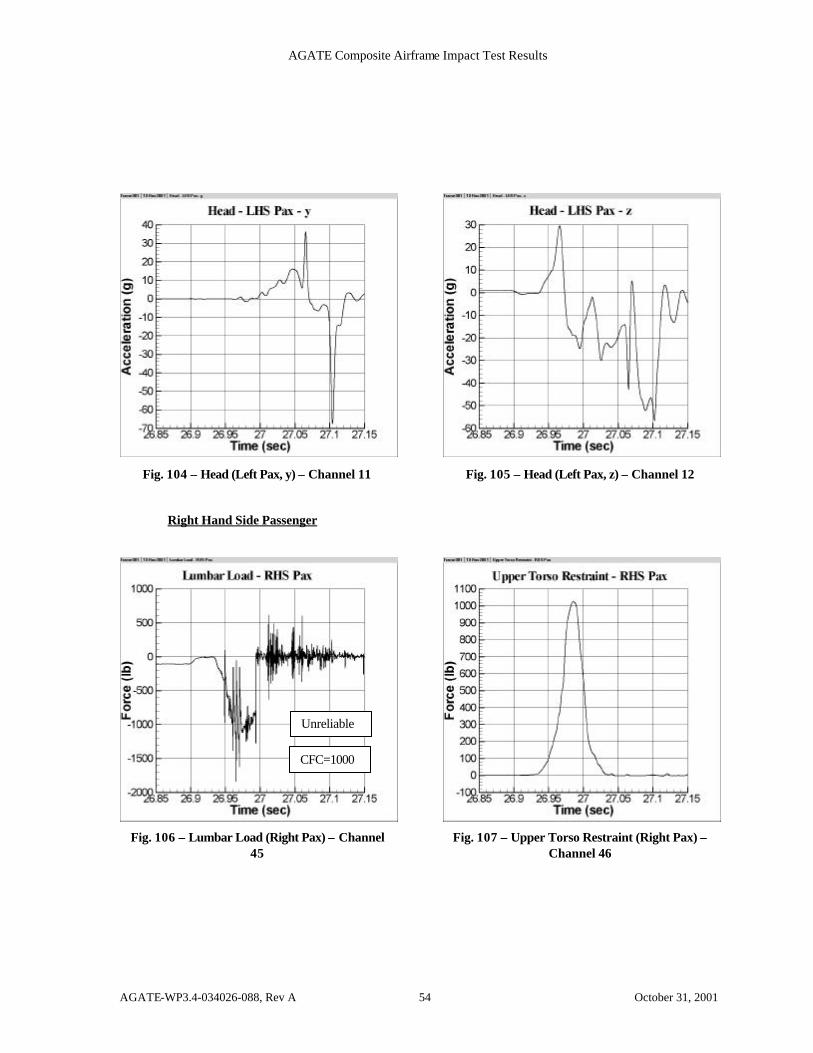
AGATE Composite Airframe Impact Test Results
AGATE-WP3.4-034026-088, Rev A 54 October 31, 2001
Fig. 104 – Head (Left Pax, y) – Channel 11
Fig. 105 – Head (Left Pax, z) – Channel 12
Right Hand Side Passenger
Fig. 106 – Lumbar Load (Right Pax) – Channel 45
Fig. 107 – Upper Torso Restraint (Right Pax) – Channel 46
CFC=1000
Unreliable
AGATE Composite Airframe Impact Test Results
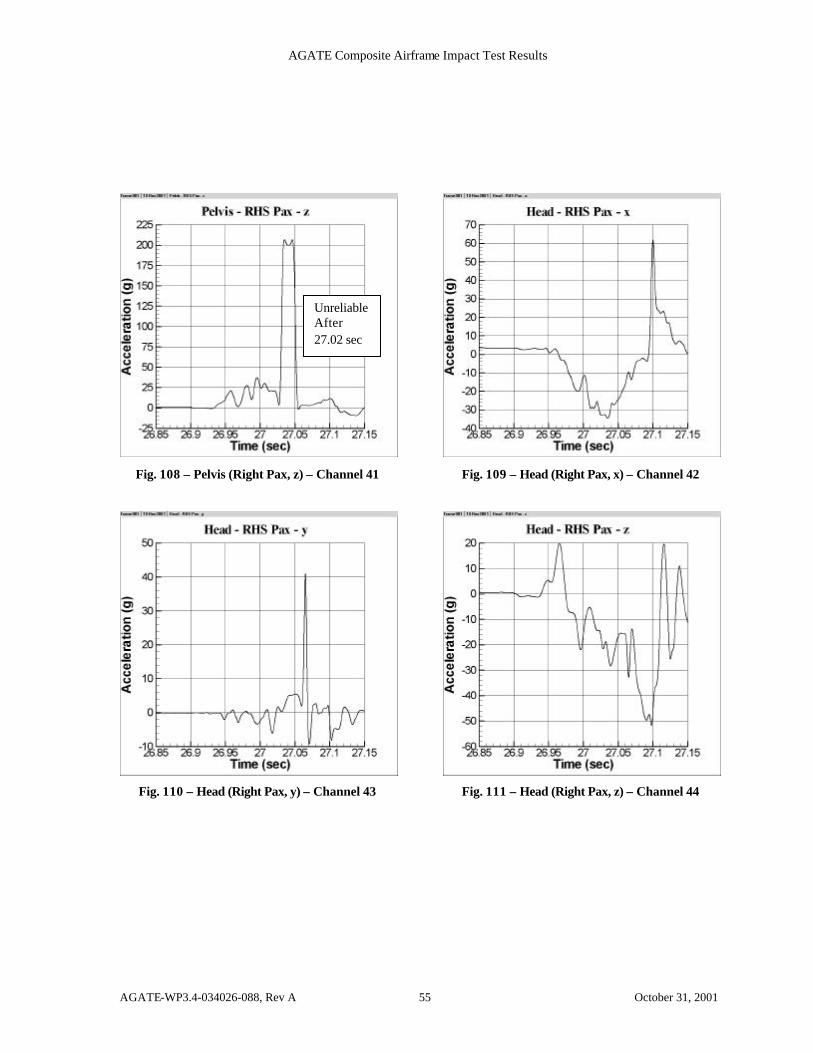
AGATE-WP3.4-034026-088, Rev A 55 October 31, 2001
Fig. 108 – Pelvis (Right Pax, z) – Channel 41
Fig. 109 – Head (Right Pax, x) – Channel 42
Fig. 110 – Head (Right Pax, y) – Channel 43
Fig. 111 – Head (Right Pax, z) – Channel 44
Unreliable After 27.02 sec
AGATE Composite Airframe Impact Test Results
AGATE-WP3.4-034026-088, Rev A 56 October 31, 2001
4. ACKNOWLEDGEMENTS The NASA AvSP and NASA AGATE programs supported this research project. The AGATE program was financially supported by a number of industry members through a Joint Sponsored Research Agreement. In this regard, the contributions of Lancair, Simula, the FAA, and the Advanced Composites Laboratory at Wichita State University’s National Institute for Aviation Research are especially noteworthy. The contributions of Luann Schweitzer (Lancair), Steve Soltis (FAA Crashworthiness NRS), Rick DeWeese (FAA CAMI), Bill Shipman (Photosonics), and Nelson Seabolt (NASA IDRF Technician) were all invaluable in completing this project.
5. SUMMARY AND CONCLUSIONS
A composite general aviation airframe was crash tested at the NASA Langley Research Center Impact Dynamics Research Facility to demonstrate the efficacy of employing a systems approach to crashworthy design for general aviation aircraft. The impact conditions of this test represented a much higher velocity change and possessed more than five times the impact energy compared to the current FAA requirements for dynamically certified seats and restraint systems. The demonstration was successful since a survivable cabin volume was retained and occupants survived the test.
The structural design methodology developed during this research represents an additional 50-G crash load condition, not currently required by the FAA, which can be largely addressed using traditional airframe design techniques. The improvements in crashworthiness performance were achieved without significant cost or weight penalties.
The crashworthy technologies employed in this design included an energy absorbing engine mount, a reinforced cowl, a non-scooping ramp at the bottom of the firewall, a reinforced fuselage, and an energy absorbing subfloor. The results of this and other tests demonstrate that energy management through application of the impulse/momentum equation might be a better strategy than energy absorption for general aviation designs that possess only limited space in which to locate energy absorbing technologies.
It is particularly notable that seat/restraint systems designed to the requirements of 14 CFR 23.562 performed well in the drop test by successfully mitigating a sequence of two-to-three successive impulses. The secondary structural bonds used to join structural reinforcements to the forward fuselage performed well during this test without being reinforced by mechanical fasteners. This performance is largely attributed to the knowledge, skill, and attention to detail provided by the personnel who fabricated these modifications. However, the fact that the airframe strength was adequate for the hard-surface impact does not show that this design is adequate or that the 50-G loads are representative of those developed during a severe soft-soil impact. Additional testing is required to establish this.
AGATE Composite Airframe Impact Test Results
AGATE-WP3.4-034026-088, Rev A 57 October 31, 2001
6. REFERENCES
1. Anon. General Aviation Task Force Report, Prepared for the National Aeronautics and Space Administration, Washington, DC, 1993.
2. DeHaven, H., “Accident Survival – Airplane and Passenger Car,” SAE 520016, Society of Automotive Engineers, Inc., Warrendale, Pennsylvania, January 1952.
3. Terry, J. E., Hooper, S. J., and Nicholson, M., Design and Test of an Improved Crashworthiness Small Composite Airframe - Phase II Report, NASA SBIR Contract NAS1-20427, Terry Engineering, Andover, Kansas, October 1997.
4. Terry, J.E., "Design and Test of an Improved Crashworthiness Small Composite Airplane," SAE Paper 2000-01-1673, Presented at the SAE General Aviation Technology Conference and Exposition, May 9-11, 2000, Wichita, KS.
5. Castle, Claude B. and Alfar-Bou, Emilio, “Crash Tests of Three Identical Low-Wing Single-Engine Airplanes,” NASA Technical Paper 2190, 1983.
6. Vaughan, Victor L. Jr. and Hayduk, Robert J., “Crash Tests of Four Identical High-Wing Single-Engine Airplanes,” NASA Technical Paper 1699, 1980.
7. Hooper, S.J., Henderson, M.J., and Seneviratne, W.P, “Design and Construction of a Crashworthy Composite Airframe,” National Institute for Aviation Research - Wichita State University, AGATE-WP3.4-034026-089, Wichita, KS 67260, August 9, 2001.
8. Hooper, S.J., Hurley, T.R., and DeWeese, R.L., “Test Plan - Impact Test of a General Aviation Composite Airframe,” National Institute for Aviation Research - Wichita State University, Simula Technologies, Inc., and the FAA Civil Aeromedical Institute, AGATE-WP3.4-034026-080, Wichita, KS 67260, March, 2001.
AGATE Composite Airframe Impact Test Results
AGATE-WP3.4-034026-088, Rev A A.1 October 31, 2001
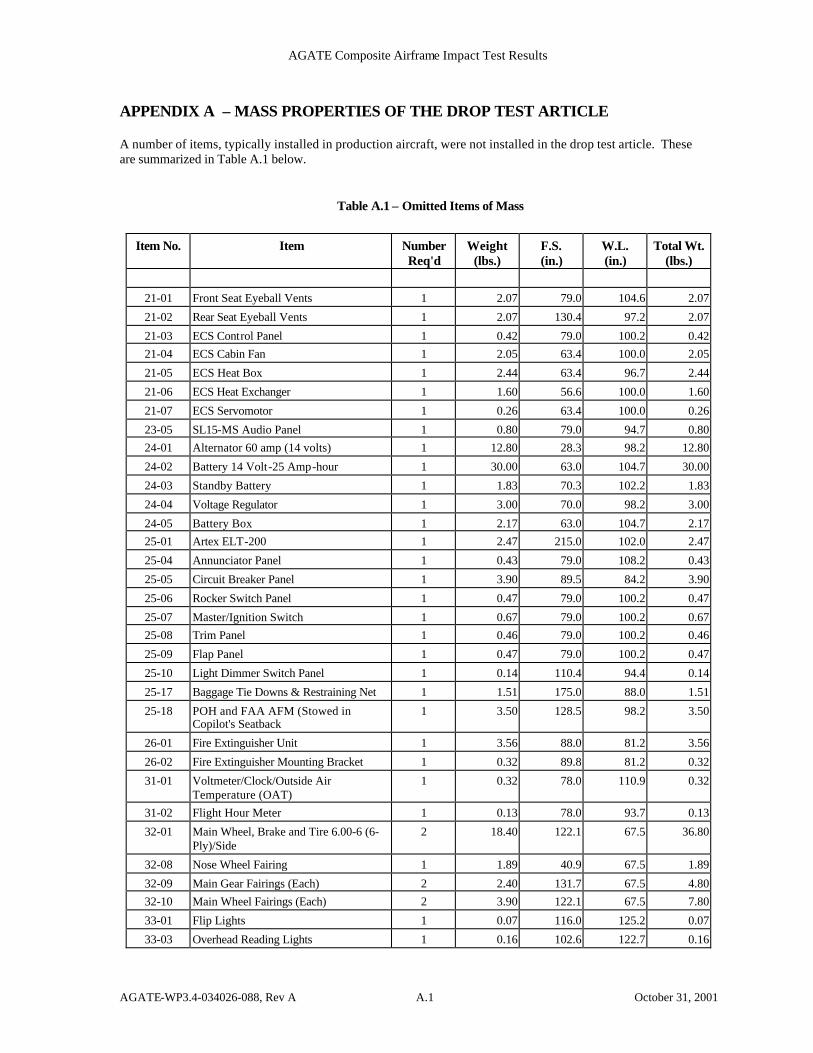
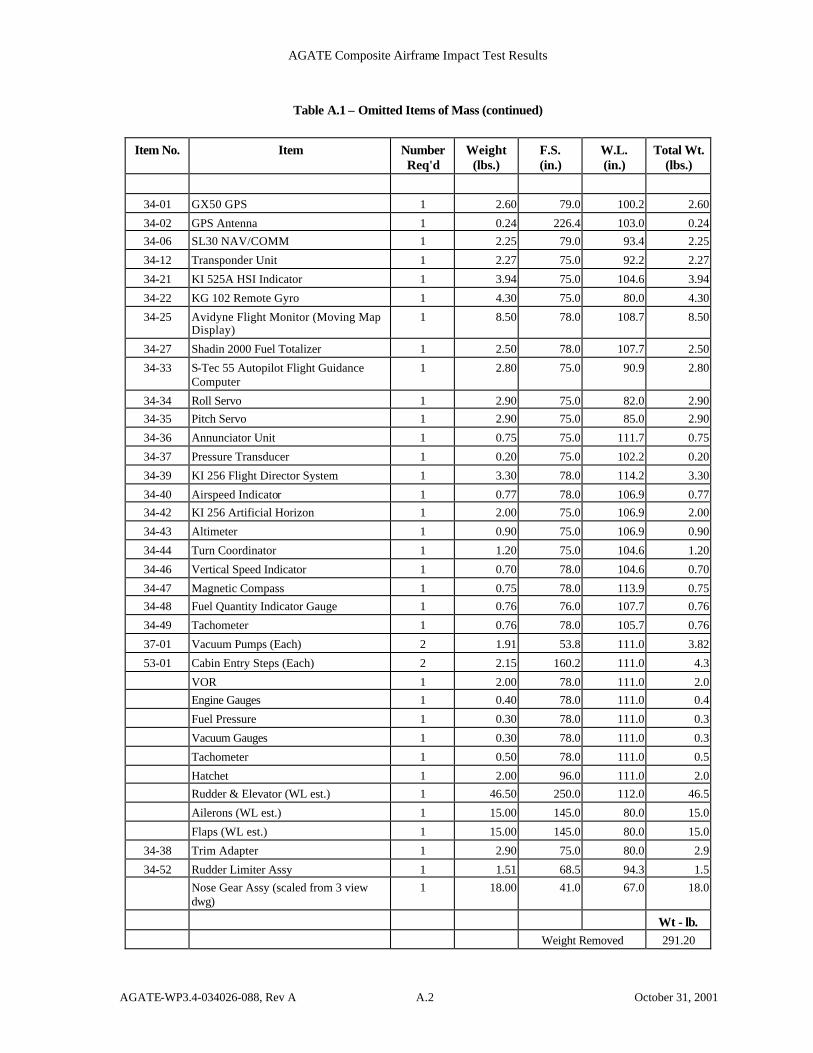
APPENDIX A – MASS PROPERTIES OF THE DROP TEST ARTICLE A number of items, typically installed in production aircraft, were not installed in the drop test article. These are summarized in Table A.1 below.
Table A.1 – Omitted Items of Mass
Item No. Item Number Req'd
Weight (lbs.)
F.S. (in.)
W.L. (in.)
Total Wt. (lbs.)
21-01 Front Seat Eyeball Vents 1 2.07 79.0 104.6 2.07
21-02 Rear Seat Eyeball Vents 1 2.07 130.4 97.2 2.07
21-03 ECS Control Panel 1 0.42 79.0 100.2 0.42 21-04 ECS Cabin Fan 1 2.05 63.4 100.0 2.05
21-05 ECS Heat Box 1 2.44 63.4 96.7 2.44
21-06 ECS Heat Exchanger 1 1.60 56.6 100.0 1.60
21-07 ECS Servomotor 1 0.26 63.4 100.0 0.26
23-05 SL15-MS Audio Panel 1 0.80 79.0 94.7 0.80 24-01 Alternator 60 amp (14 volts) 1 12.80 28.3 98.2 12.80
24-02 Battery 14 Volt-25 Amp-hour 1 30.00 63.0 104.7 30.00
24-03 Standby Battery 1 1.83 70.3 102.2 1.83
24-04 Voltage Regulator 1 3.00 70.0 98.2 3.00
24-05 Battery Box 1 2.17 63.0 104.7 2.17 25-01 Artex ELT-200 1 2.47 215.0 102.0 2.47
25-04 Annunciator Panel 1 0.43 79.0 108.2 0.43
25-05 Circuit Breaker Panel 1 3.90 89.5 84.2 3.90
25-06 Rocker Switch Panel 1 0.47 79.0 100.2 0.47
25-07 Master/Ignition Switch 1 0.67 79.0 100.2 0.67 25-08 Trim Panel 1 0.46 79.0 100.2 0.46
25-09 Flap Panel 1 0.47 79.0 100.2 0.47
25-10 Light Dimmer Switch Panel 1 0.14 110.4 94.4 0.14
25-17 Baggage Tie Downs & Restraining Net 1 1.51 175.0 88.0 1.51
25-18 POH and FAA AFM (Stowed in Copilot's Seatback
1 3.50 128.5 98.2 3.50
26-01 Fire Extinguisher Unit 1 3.56 88.0 81.2 3.56
26-02 Fire Extinguisher Mounting Bracket 1 0.32 89.8 81.2 0.32
31-01 Voltmeter/Clock/Outside Air Temperature (OAT)
1 0.32 78.0 110.9 0.32
31-02 Flight Hour Meter 1 0.13 78.0 93.7 0.13
32-01 Main Wheel, Brake and Tire 6.00-6 (6-Ply)/Side
2 18.40 122.1 67.5 36.80
32-08 Nose Wheel Fairing 1 1.89 40.9 67.5 1.89
32-09 Main Gear Fairings (Each) 2 2.40 131.7 67.5 4.80 32-10 Main Wheel Fairings (Each) 2 3.90 122.1 67.5 7.80
33-01 Flip Lights 1 0.07 116.0 125.2 0.07
33-03 Overhead Reading Lights 1 0.16 102.6 122.7 0.16
AGATE Composite Airframe Impact Test Results
AGATE-WP3.4-034026-088, Rev A A.2 October 31, 2001
Table A.1 – Omitted Items of Mass (continued)
Item No. Item Number Req'd
Weight (lbs.)
F.S. (in.)
W.L. (in.)
Total Wt. (lbs.)
34-01 GX50 GPS 1 2.60 79.0 100.2 2.60
34-02 GPS Antenna 1 0.24 226.4 103.0 0.24 34-06 SL30 NAV/COMM 1 2.25 79.0 93.4 2.25
34-12 Transponder Unit 1 2.27 75.0 92.2 2.27
34-21 KI 525A HSI Indicator 1 3.94 75.0 104.6 3.94
34-22 KG 102 Remote Gyro 1 4.30 75.0 80.0 4.30
34-25 Avidyne Flight Monitor (Moving Map Display)
1 8.50 78.0 108.7 8.50
34-27 Shadin 2000 Fuel Totalizer 1 2.50 78.0 107.7 2.50
34-33 S-Tec 55 Autopilot Flight Guidance Computer
1 2.80 75.0 90.9 2.80
34-34 Roll Servo 1 2.90 75.0 82.0 2.90 34-35 Pitch Servo 1 2.90 75.0 85.0 2.90
34-36 Annunciator Unit 1 0.75 75.0 111.7 0.75
34-37 Pressure Transducer 1 0.20 75.0 102.2 0.20
34-39 KI 256 Flight Director System 1 3.30 78.0 114.2 3.30
34-40 Airspeed Indicator 1 0.77 78.0 106.9 0.77 34-42 KI 256 Artificial Horizon 1 2.00 75.0 106.9 2.00
34-43 Altimeter 1 0.90 75.0 106.9 0.90
34-44 Turn Coordinator 1 1.20 75.0 104.6 1.20
34-46 Vertical Speed Indicator 1 0.70 78.0 104.6 0.70
34-47 Magnetic Compass 1 0.75 78.0 113.9 0.75 34-48 Fuel Quantity Indicator Gauge 1 0.76 76.0 107.7 0.76
34-49 Tachometer 1 0.76 78.0 105.7 0.76
37-01 Vacuum Pumps (Each) 2 1.91 53.8 111.0 3.82
53-01 Cabin Entry Steps (Each) 2 2.15 160.2 111.0 4.3
VOR 1 2.00 78.0 111.0 2.0 Engine Gauges 1 0.40 78.0 111.0 0.4
Fuel Pressure 1 0.30 78.0 111.0 0.3
Vacuum Gauges 1 0.30 78.0 111.0 0.3
Tachometer 1 0.50 78.0 111.0 0.5
Hatchet 1 2.00 96.0 111.0 2.0 Rudder & Elevator (WL est.) 1 46.50 250.0 112.0 46.5
Ailerons (WL est.) 1 15.00 145.0 80.0 15.0
Flaps (WL est.) 1 15.00 145.0 80.0 15.0
34-38 Trim Adapter 1 2.90 75.0 80.0 2.9
34-52 Rudder Limiter Assy 1 1.51 68.5 94.3 1.5 Nose Gear Assy (scaled from 3 view
dwg) 1 18.00 41.0 67.0 18.0
Wt - lb. Weight Removed 291.20
AGATE Composite Airframe Impact Test Results
AGATE-WP3.4-034026-088, Rev A A.3 October 31, 2001
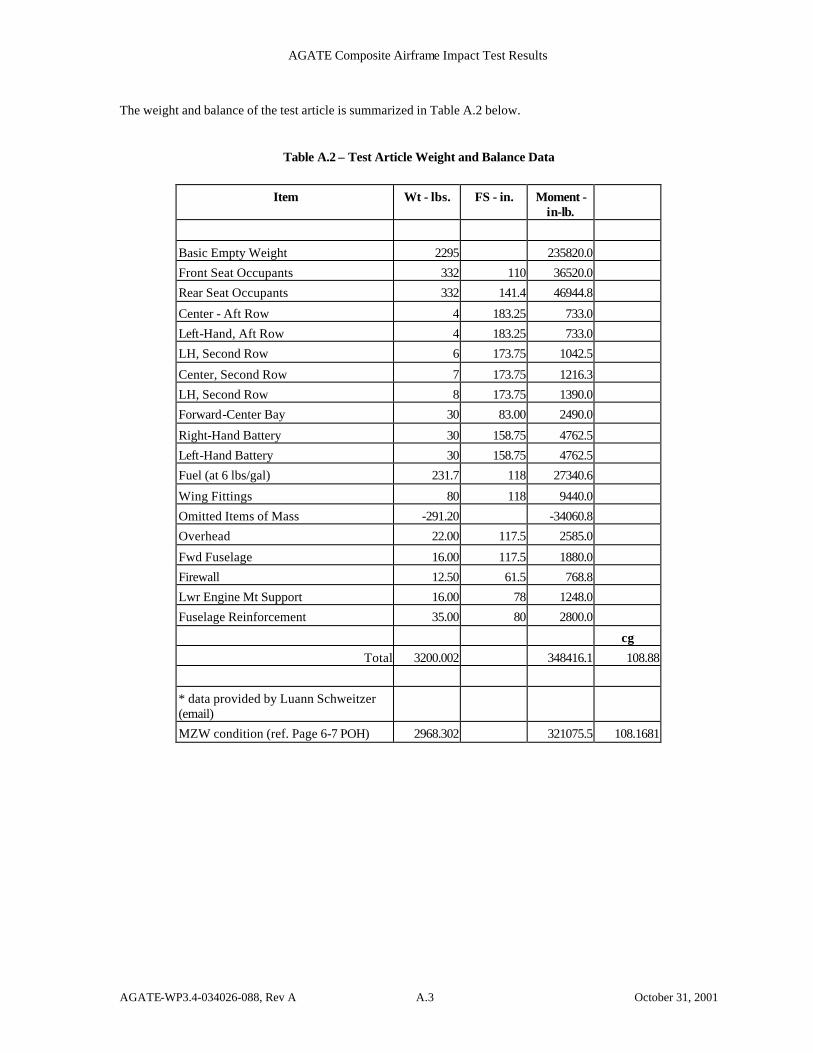
The weight and balance of the test article is summarized in Table A.2 below.
Table A.2 – Test Article Weight and Balance Data
Item Wt - lbs. FS - in. Moment - in-lb.
Basic Empty Weight 2295 235820.0
Front Seat Occupants 332 110 36520.0
Rear Seat Occupants 332 141.4 46944.8
Center - Aft Row 4 183.25 733.0
Left-Hand, Aft Row 4 183.25 733.0
LH, Second Row 6 173.75 1042.5
Center, Second Row 7 173.75 1216.3
LH, Second Row 8 173.75 1390.0
Forward-Center Bay 30 83.00 2490.0
Right-Hand Battery 30 158.75 4762.5
Left-Hand Battery 30 158.75 4762.5
Fuel (at 6 lbs/gal) 231.7 118 27340.6
Wing Fittings 80 118 9440.0
Omitted Items of Mass -291.20 -34060.8
Overhead 22.00 117.5 2585.0
Fwd Fuselage 16.00 117.5 1880.0
Firewall 12.50 61.5 768.8
Lwr Engine Mt Support 16.00 78 1248.0
Fuselage Reinforcement 35.00 80 2800.0
cg
Total 3200.002 348416.1 108.88
* data provided by Luann Schweitzer (email)
MZW condition (ref. Page 6-7 POH) 2968.302 321075.5 108.1681