Embed Size (px)
Citation preview
SCRS/2006/110 Col. Vol. Sci. Pap. ICCAT, 60(2): 443-456 (2007)
443
AGE AND GROWTH OF SOUTH ATLANTIC ALBACORE – A REVISION AFTER
THE REVELATION OF OTOLITH DAILY RING COUNTS
Liang-Kang Lee1, Shean-Ya Yeh2
SUMMARY
Growth equation is essential if a proper assessment on that stock is intended. Our previous study in 1993 has provided a growth equation, based on the assumptions that a ring is formed per year and the first opaque band is the mark of the first year of age, for the South Atlantic albacore resource by using vertebra and 1st dorsal spine as its age characters. However, it was not clear whether the first opaque ring represented one year old until recently when some small albacore (40-44cm) otoliths were obtained with its daily ring counts performed (Lu et al. 2006) , the results thus obtained revealed that the assumption of first opaque ring mark on vertebra implied the 1st year of age is not correct. For this reason, the data of our previous study were re-analyzed for providing a better growth equation for South Atlantic albacore resource. The revised parameters thus obtained for von Bertalanffy’s growth equation to be L∞=147.5 cm; k=0.126 per year; and t0 =-1.89 year.
RÉSUMÉ
Il est indispensable d’utiliser une équation de croissance pour réaliser une évaluation adéquate du stock. Notre étude précédente, menée en 1993, a fourni une équation de croissance qui se basait sur le postulat qu’un anneau est formé par an et que la première bande opaque est la marque de la première année de l’âge pour le germon de l’Atlantique sud, en utilisant les vertèbres et la 1ère épine dorsale comme caractères de l’âge. Il n’était toutefois pas clair si le premier anneau opaque représentait l’âge 1. Des otolithes de petits germons (40-44 cm) ont récemment été obtenus et on a procédé au comptage quotidien des anneaux (Lu et al. 2006). Les résultats obtenus ont alors révélé que le postulat selon lequel la marque du premier anneau opaque sur la vertèbre impliquait l’âge 1 n’était pas correct. C’est pourquoi, les données de notre étude précédente ont été ré-analysées afin de donner une meilleure équation de croissance pour le germon de l’Atlantique sud. Les paramètres révisés ainsi obtenus pour l’équation de croissance de von Bertalanffy étaient les suivants : L∞=147,5 cm; k=0,126 par an et t0 =-1,89 an.
RESUMEN
La ecuación de crecimiento resulta esencial si se pretende realizar una evaluación adecuada de un stock. Nuestro estudio anterior en 1993 proporcionó una ecuación de crecimiento asumiendo que se forma un anillo por año y que la primera banda opaca es la marca del primer año de edad para el recurso de atún blanco del Atlántico sur, utilizando la vértebra y primera espina dorsal como sus características de la edad. Sin embargo hasta hace poco, no estuvo claro si el primer anillo opaco representaba el año, ya que cuando se obtuvieron otolitos de pequeños atunes blancos (40-44 cm) y se realizaron los recuentos de sus anillos diarios (Lu et al. 2006), los resultados obtenidos de este modo revelaron que el supuesto de que una primera marca de anillo opaca en la vértebra correspondía al primer año de edad no era correcto. Por esta razón, se volvieron a analizar los datos del estudio anterior para obtener una ecuación de crecimiento mejor para el recurso de atún blanco del Atlántico sur. Los parámetros revisados obtenidos para la ecuación de crecimiento de von Bertalanffy fueron L∞=147,5 cm; k=0,126 por año; y t0 =-1,89 año.
KEYWORDS
Spine, otolith, growth parameters
1Department of Fisheries Production and Management, National Kaohsiung Marine University, Kaohsiung, 811 Taiwan. 2Institute of Oceanography, National Taiwan University, Taipei, 106 Taiwan; [email protected]
444
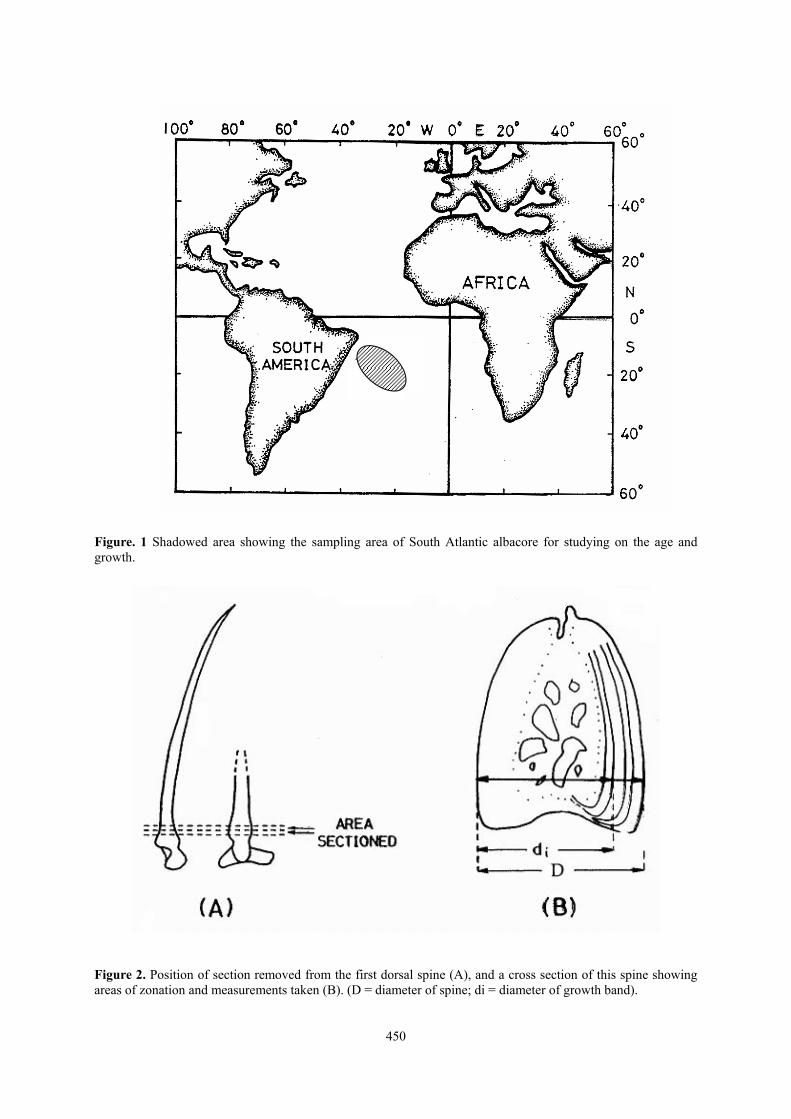
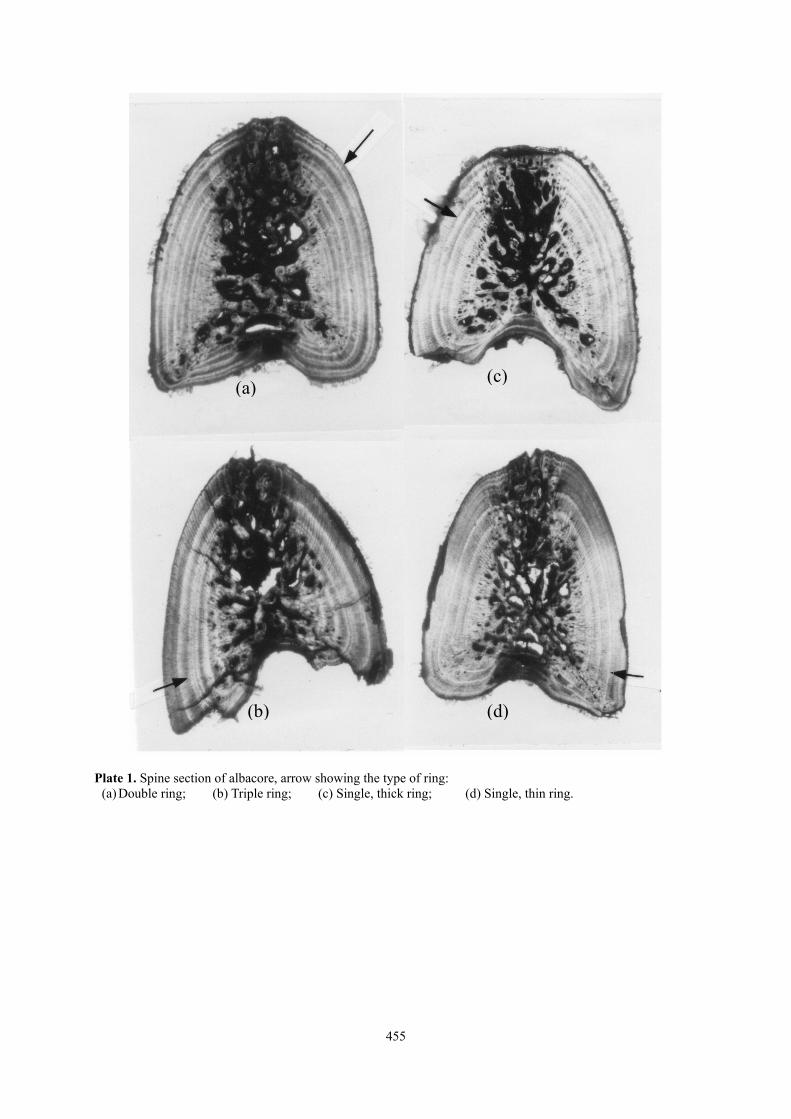
1. Introduction Age characters of 344 spines (the 1st dorsal spine) and 125 caudal vertebrae (the 38th vertebra), which were removed from 344 South Atlantic albacore individuals, were sampled by five Taiwanese longliners fished in the South Atlantic from October 1990 to March 1991 (Table 1 and Figure 1). Recognition of rings on vertebra is based on the criteria of those rings appeared as ridges on the centrum surface (Partlo 1955; Otsu and Uchida 1958) and assumed the first opaque band is the mark of the first year of age; whereas on spine cross section (Plate 1) is based on a double-ring mark, a triple-ring mark, a single thick ring mark or a single thin ring mark criteria (Gonzalez-Garces and Farina-Perez 1983; Ortiz de Zarate et al. 1996; Santiago and Arrizabalaga 2005). The diameter of a spine (D) is measured as the horizontal distance between two outer margins above the posterior notch where the least curvature of banding occurred (Compean-Jimenez and Bard 1983), as shown in Figure 2. The i-th ring-radius (Ri) of a spine is then determined by the diameter of the i-th growth band (di) minus the radius of the spine (D/2). Since the central portion of a spine shall be vascularized when fish gets older, the earlier rings within this portion of the spine will thus inevitably become obscured. Consequently, the radius of the first readable growth band, R1, can be interpreted not only as a size indicator of central vascularized area but also as an indicator to estimate the number of obscured rings in that area. It is reasonable to believe that (1) the number of rings formed by the two age characters of the same fish should be the same and (2) the difference in number of ring counts between the two age characters should equal the number of rings disappeared in the vascularized area of the spine cross section. Assumed that there exists a functional relationship between radius of vascularized core and number of obscured ring counts, a total of 125 southern albacore individuals (both the spine and the vertebra characters were concurrently removed from the same fish) were sampled in this study for elucidating this relation. Functional relationship thus obtained will then be used to estimate the number of obscured rings in the vascularized portion of a spine. Number of rings disappeared in a vascularized core of a spine can thus be estimated by using known data as (1) the number of readable ring counts (Sno) and the radius of the first readable growth band (R1=d1–D/2) obtained from the spine, and (2) the number of ring counts from vertebra (Vno). A linear relationship is thus proposed for this purpose as follows:
DC = Vno – Sno = a + b * R1 …………………………..(1)
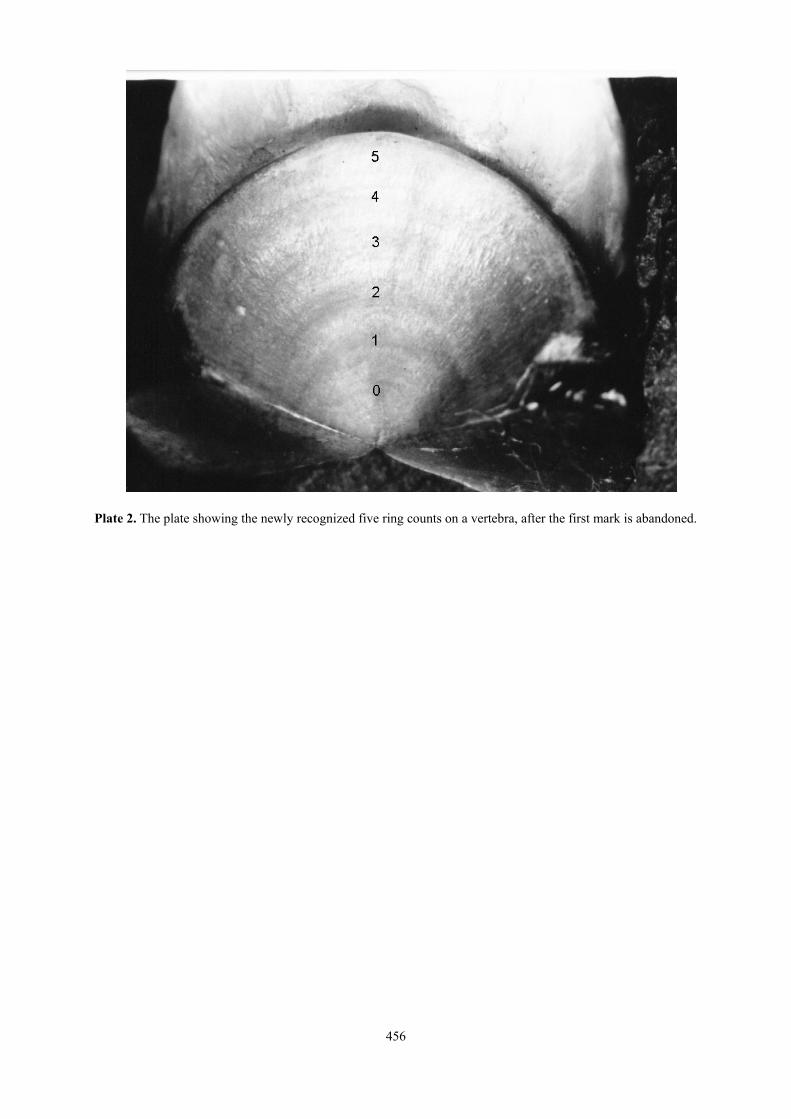
where DC : number of rings disappeared in vascularized core of the spine; Vno : number of rings counted from vertebra of the fish; Sno : number of rings counted from spine of the fish; R1 : radius (in 0.1 mm) of the 1st readable growth band in spine; and a, b: two constants can be obtained by using regression technique. Assumed that the relationship obtained from these 125 specimens holds for the whole population of South Atlantic albacore, the total 344 spines character justified ring counts will then be used for estimating von Bertalanffy’s growth parameters for South Atlantic albacore. 2. A revision on ring counts of vertebra Although Lee and Yeh (1993) had provided a growth equation for southern albacore stock, it was not until recently when Lu et al. (2006) compared the morphology of otolith and spine characters drawn from the same fish of small size (40-44cm fork length) and found the first ring count in spine appeared to be the otolith’s daily ring counts of 200~250 days. This result strongly indicated that the first opaque ring mark on vertebra implied the 1st year of age assumption (Lee and Yeh 1993) is not correct. Under the revelation of this result, the used-to-be viewed as 1st band (a vague opaque image and the closest to the focus) is re-examined and carefully marked as pseudo 1st ring when re-counting and re-measuring were made on vertebrae rings (Plate 2).
445
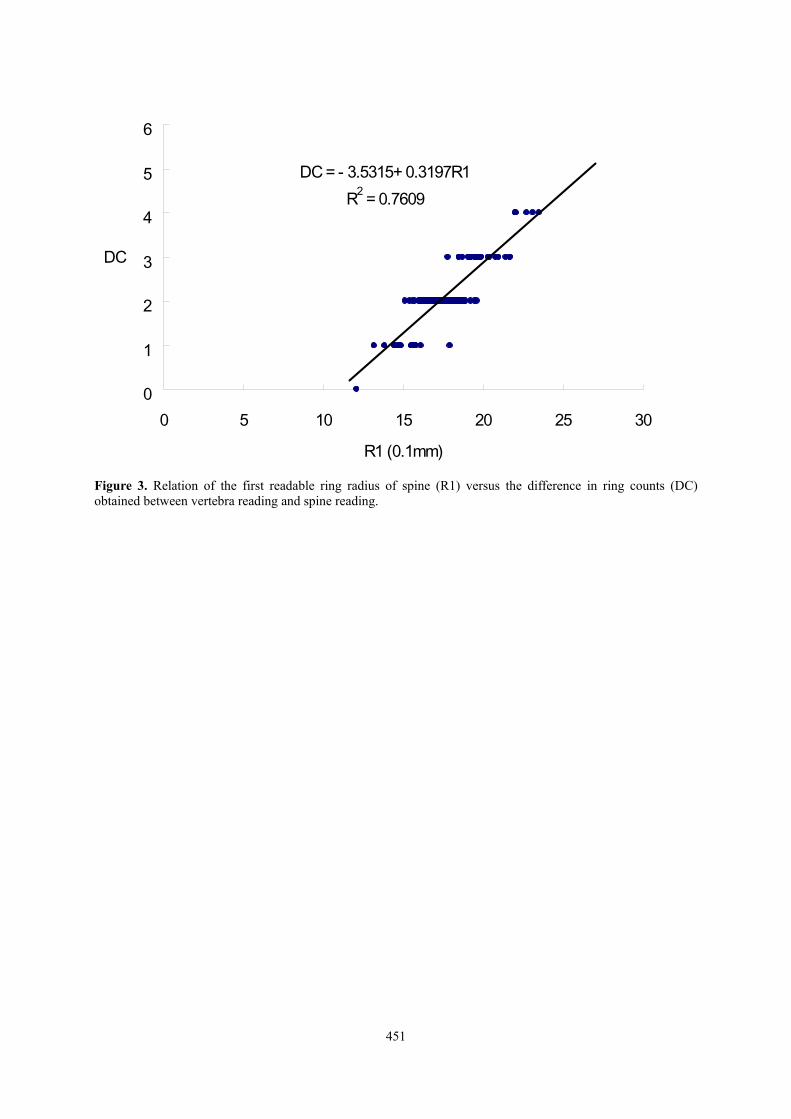
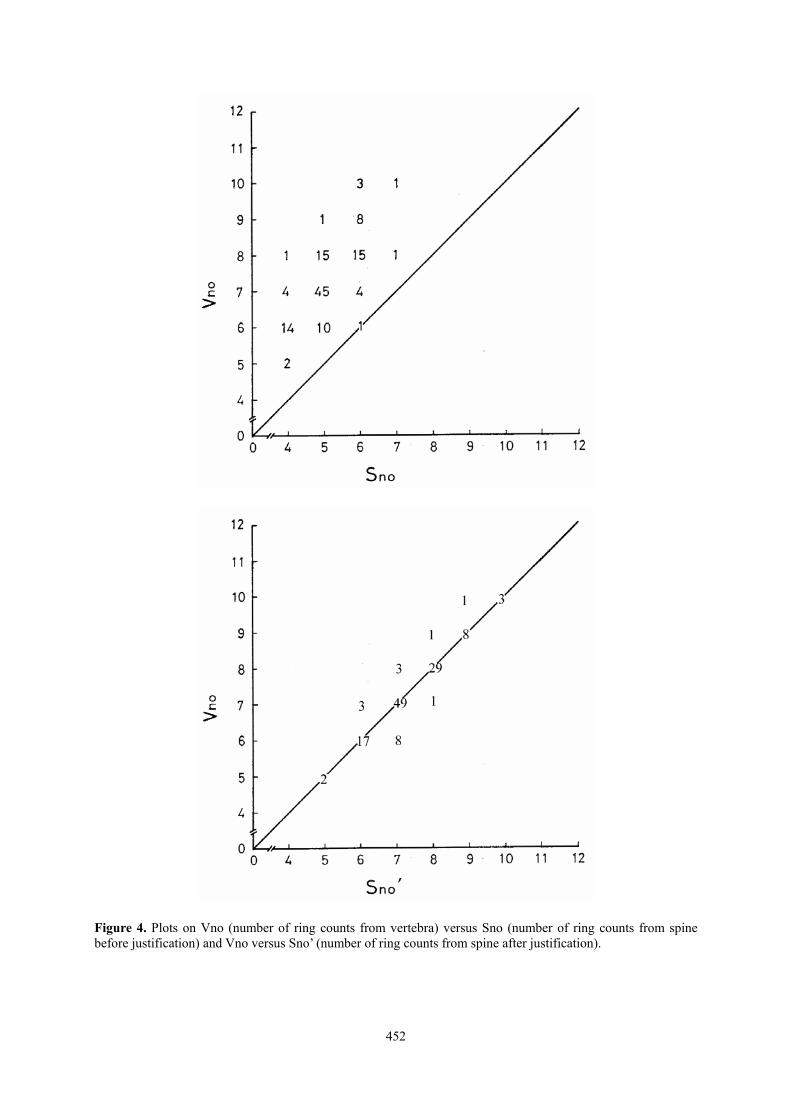
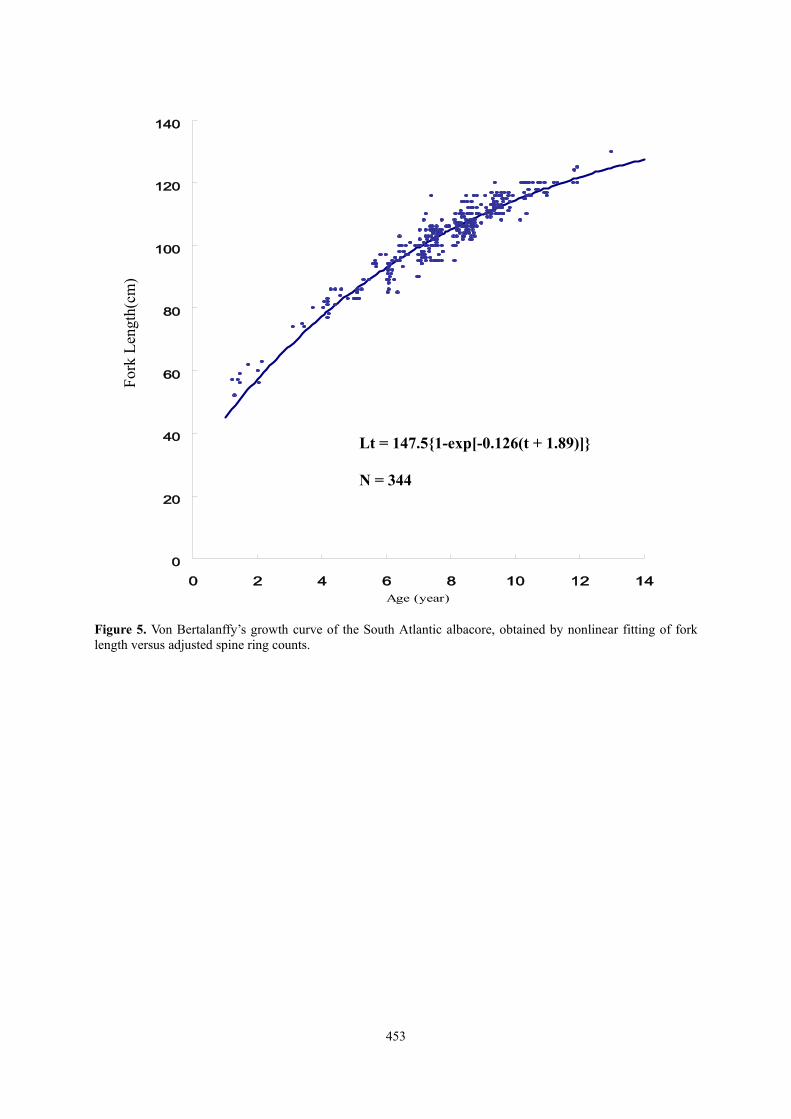
3. Re-justification on obscured ring counts in a spine age character The constants a and b in equation (1), based on the revised ring counts data set from vertebrae character, thus obtained are shown in Fig.3 and the followings: DC = - 3.5315 + 0.3197 * R1 The coefficient of determination (r-square) of the fitting equals 0.77, which is highly significant. Consequently, justified (with obscured ring counts added) number of ring counts of a spine, Sno’, can be expressed as: Sno’= Sno + DC = Sno + (- 3.5315 + 0.3197 * R1) Plots of (1) Vno versus Sno (before justification) and (2) Vno versus Sno’ (after justification) are shown in Figure 4. The agreement between Vno and Sno’ is 86.4 % for identical ring counts and 13.6 % for a ±1 ring count. 4. Revised growth parameters In addition to the justified ring counts from a spine cross section, a fractional part of marginal increment will also added to the ring counts for a better indicating its age versus corresponding fork length. Von Bertalanffy’s growth parameters thus obtained by using non-linear regression techniques (SAS package) are as follows: L∞ = 147.5 cm; k = 0.126 per year; and t0 = - 1.89 year. A plot of the equation is also shown in Figure 5.
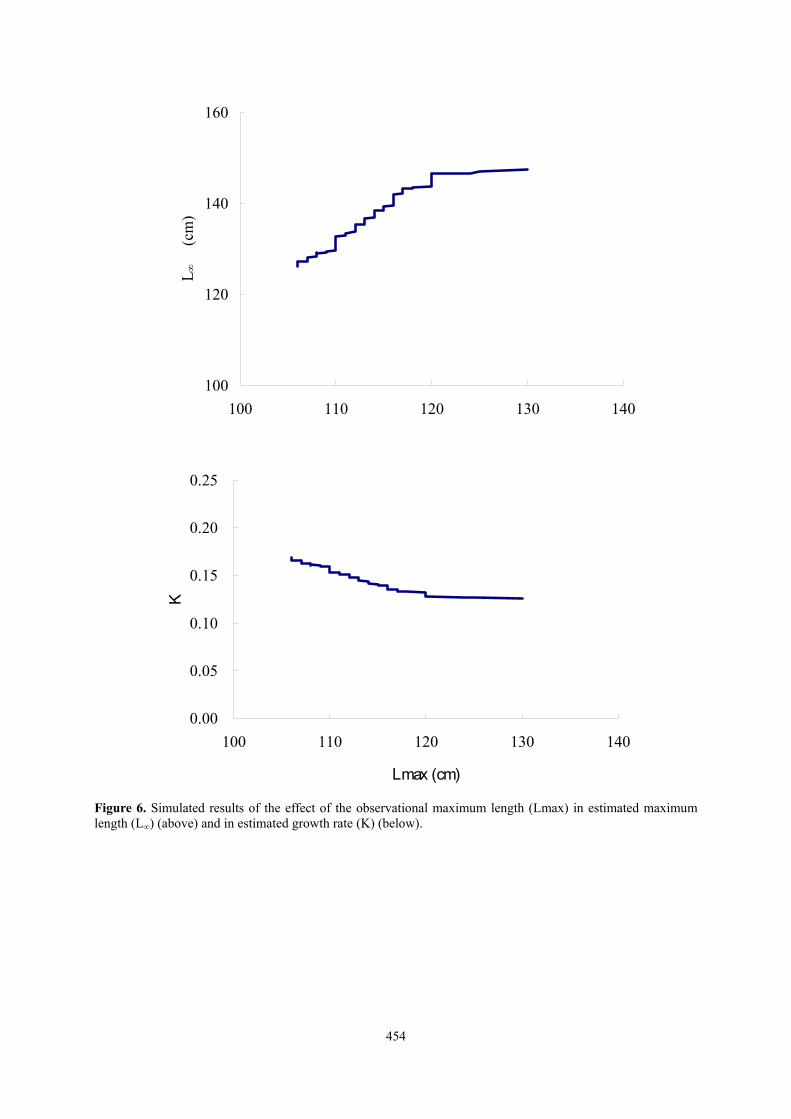
5. Effects of sequentially eliminating sample’s size maximum on L∞ and K In order to investigate the effect of size range of a character (such as fork length) in a sample versus the obtained von Bertalanffy’s growth parameters (such as L∞ and K), the observed maximum fork length (Lmax) in the sample is intentionally eliminated starting from the biggest one and then repeatedly to estimate von Bertalanffy’s growth parameters by the same searching algorithm. The results thus obtained are shown in Figure 6. It is noticed that L∞ tends to decrease and K, on the contrary, tends to increase when large sized fish or Lmax in a sample is sequentially eliminated. 6. Discussion Lu et al. (2006) indicated that the 1st opaque mark on spine of small sized fish might have formed at 200-250 days after birth. This revelation formed a basis for the revision of this study. Incidentally, Santiago and Arrizabalaga (2005) suggested that the first band visible in a spine character is formed during the first migration to wintering areas. Whether the mechanism of formation the first visible mark on an age character has also due to wintering migration of albacore in the South Atlantic is a very interesting topic for further investigation. Main differences obtained in this revision versus the old study (Lee & Yeh 1993) are (1) the mean size of age 1 fish in the present study is 45.02 cm versus 30.75 cm in the old ones; and (2) to value is 1.2 years’ smaller than the previous ones (Table 2). Von Bertallanffy’s growth parameters of Atlantic albacore resources obtained by six studies are shown in Table 2 and Table 3. Evidently, these parameters can be grouped into two general categories, i.e., L∞ ranged from 122 to 125 cm and K ranged from 0.21 to 0.23 y -1 (Bard 1981; Santiago and Arrizabalaga 2005), and L∞ ranged from 140 to 148 cm and K ranged from 0.12 to 0.15 y –1 two categories.
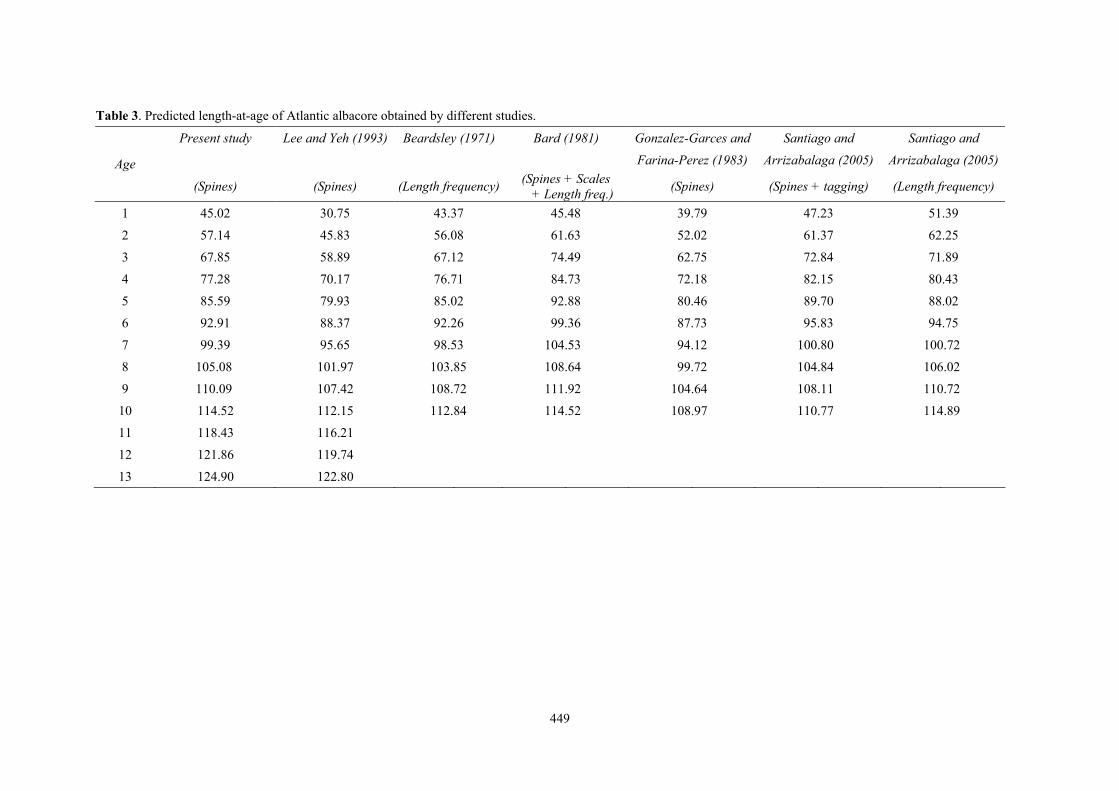
As shown in Figure 6, effects of sample’s maximum length on its growth parameters estimation appeared prominent. When smaller sized fish were used in estimating growth parameters, the odds is tending to under-estimate L∞ value and to over-estimate K value. The maximum fork length sampled in this study is in the range of 126 - 130 cm, the problems of under and over estimation on growth parameters believed to be minimal. Notably, the mean fork length at age 1 estimated by this study is 45.02 cm, which is not significant discrepancy as compared to most studies revealed in North Atlantic (Table 3).
446
References ANON. 1996. Report of the final meeting of the ICCAT albacore research program. Sukarrieta, Vizcaya, Spain,
June 1 to 8, 1994. ICCAT Col. Vol. Sci. Pap. 43: 1-140. BARD, F. X. 1981. Le thon germon Thunnus alalunga (Bonaterre 1788) de l’Ocean Atlantique. De la
dynamique des populations a la strategie demographique. Thèse de Doctorat d’Etat ès Sciences Naturelles. University Pierre et Marie Curie. París. 336 pp.
BEARDSLEY, G. L. 1971. Contribution to the population dynamics of Atlantic albacore with comments on
potential yields. Fishery Bulletin U. S., 69: 845-857. COMPEAN-JIMENEZ, G. and F. X. Bard. 1983. Growth increments on dorsal spines of eastern Atlantic bluefin
tuna, Thunnus thynnus, and their possible relation to migration pattern. U.S. Dep. Commer., NOAA Tech. Rep. NMFS 8: 77-86.
GONZALEZ-GARCES, A. and A. C. Farina-Perez. 1983. Determining age of young albacore, Thunnus alalunga,
using dorsal spines. U.S. Dep. Comer., NOAA Tech. Rep. NMFS 8: 117-122. LEE, L. K. and S. Y. Yeh. 1993. Studies on the age and growth of South Atlantic albacore (Thunnus alalunga)
specimens collected from Taiwanese longliners. ICCAT Col. Vol. Sci. Pap. XL(2): 354-360. LU, C. P., V. Ortiz de Zárate and S. Y. Yeh. 2006. Morphology of rings on otolith and spine characters from
North Atlantic albacore of 40-44 cm fork length. ICCAT/SCRS/06/109.
ORTIZ DE ZÁRATE, V., P. Megalofonou, G. De Metrio and C. Rodríguez-Cabello. 1996. Preliminary age validation results from tagged-recaptured fluorochrome label albacore in North East Atlantic. ICCAT Col. Vol. Sci. Pap. 43: 331-338.
OTSU, T. and R. N. Uchida. 1958. Study of age determination by hard parts of albacore from central North
Pacific and Hawaiian waters. Fish Bull. 150: 353-363. PARTLO, J. M. 1955. Distribution, age and growth of eastern Pacific albacore (Thunnus alalunga). J. Fish. Res.
Bd. Can. 12(1): 35-60. SANTIAGO, J. and H. Arrizabalaga. 2005. An integrated growth study for North Atlantic albacore (Thunnus
alalunga Bonn. 1788). ICES Journal of Marine Science, 62: 740-749.
447
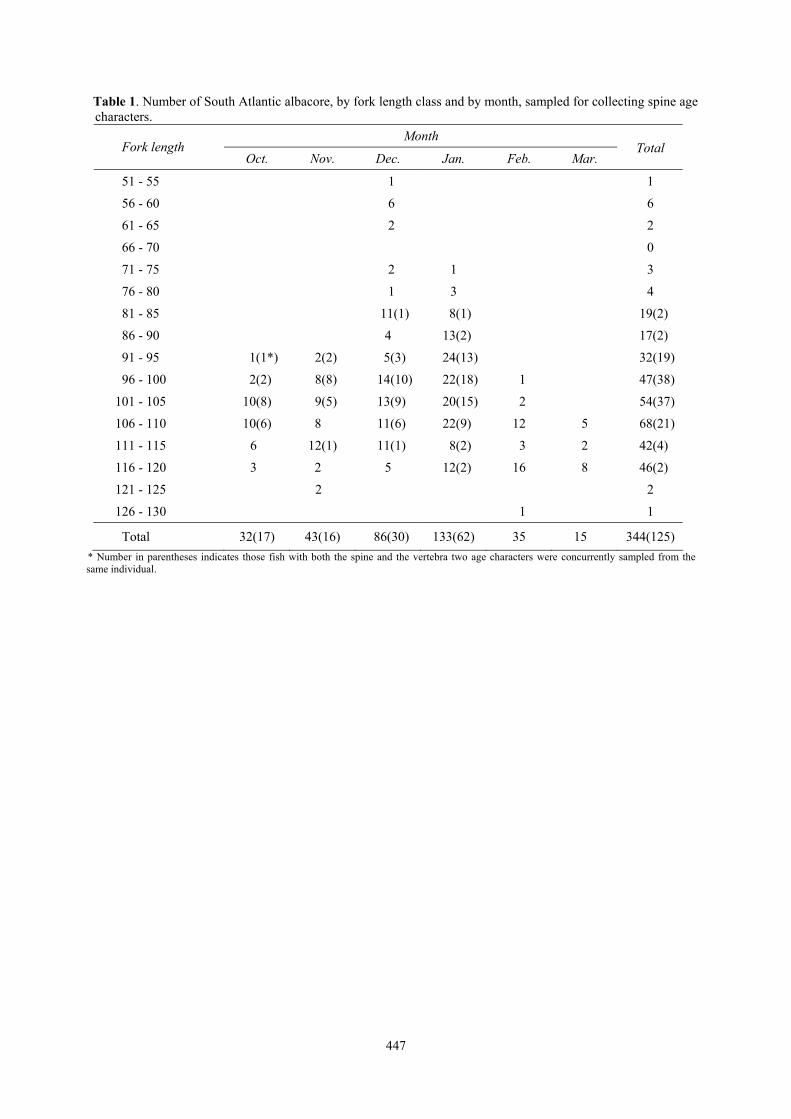
Table 1. Number of South Atlantic albacore, by fork length class and by month, sampled for collecting spine age characters.
Month Fork length
Oct. Nov. Dec. Jan. Feb. Mar.
Total
51 - 55 1 1
56 - 60 6 6
61 - 65 2 2
66 - 70 0
71 - 75 2 1 3
76 - 80 1 3 4
81 - 85 11(1) 8(1) 19(2)
86 - 90 4 13(2) 17(2)
91 - 95 1(1*) 2(2) 5(3) 24(13) 32(19)
96 - 100 2(2) 8(8) 14(10) 22(18) 1 47(38)
101 - 105 10(8) 9(5) 13(9) 20(15) 2 54(37)
106 - 110 10(6) 8 11(6) 22(9) 12 5 68(21)
111 - 115 6 12(1) 11(1) 8(2) 3 2 42(4)
116 - 120 3 2 5 12(2) 16 8 46(2)
121 - 125 2 2
126 - 130 1 1
Total 32(17) 43(16) 86(30) 133(62) 35 15 344(125) * Number in parentheses indicates those fish with both the spine and the vertebra two age characters were concurrently sampled from the
same individual.
448
Table 2. Von Bertalanffy’s growth parameters for Atlantic albacore obtained by different studies.
Region Authors Method L∞ (cm) K (y -1) t0 (y)
North Atlantic Beardsley (1971) Length frequency 140 0.141 -1.63
Ocean Bard (1981) Spines + Scales + Length freq. 124.74 0.23 -0.9892
Gonzalez-Garces and Farina-Perez (1983) Spines 140.08 0.129 -1.57
Santiago and Arrizabalaga (2005) Spines + tagging 122.198 0.209 -1.338
Santiago and Arrizabalaga (2005) Length frequency 147.7 0.12 0.000
South Atlantic Lee and Yeh (1993) Spines 142.28 0.1454 -0.674
Ocean Present study Spines 147.5 0.126 -1.89
449
Table 3. Predicted length-at-age of Atlantic albacore obtained by different studies.
Present study Lee and Yeh (1993) Beardsley (1971) Bard (1981) Gonzalez-Garces and Santiago and Santiago and
Farina-Perez (1983) Arrizabalaga (2005) Arrizabalaga (2005) Age
(Spines) (Spines) (Length frequency) (Spines + Scales + Length freq.) (Spines) (Spines + tagging) (Length frequency)
1 45.02 30.75 43.37 45.48 39.79 47.23 51.39
2 57.14 45.83 56.08 61.63 52.02 61.37 62.25
3 67.85 58.89 67.12 74.49 62.75 72.84 71.89
4 77.28 70.17 76.71 84.73 72.18 82.15 80.43
5 85.59 79.93 85.02 92.88 80.46 89.70 88.02
6 92.91 88.37 92.26 99.36 87.73 95.83 94.75
7 99.39 95.65 98.53 104.53 94.12 100.80 100.72
8 105.08 101.97 103.85 108.64 99.72 104.84 106.02
9 110.09 107.42 108.72 111.92 104.64 108.11 110.72
10 114.52 112.15 112.84 114.52 108.97 110.77 114.89
11 118.43 116.21
12 121.86 119.74
13 124.90 122.80
450
Figure. 1 Shadowed area showing the sampling area of South Atlantic albacore for studying on the age and growth.
Figure 2. Position of section removed from the first dorsal spine (A), and a cross section of this spine showing areas of zonation and measurements taken (B). (D = diameter of spine; di = diameter of growth band).
451
DC = - 3.5315+ 0.3197R1R2 = 0.7609
0
1
2
3
4
5
6
0 5 10 15 20 25 30
R1 (0.1mm)
DC
Figure 3. Relation of the first readable ring radius of spine (R1) versus the difference in ring counts (DC) obtained between vertebra reading and spine reading.
452
Figure 4. Plots on Vno (number of ring counts from vertebra) versus Sno (number of ring counts from spine before justification) and Vno versus Sno’ (number of ring counts from spine after justification).
453
Figure 5. Von Bertalanffy’s growth curve of the South Atlantic albacore, obtained by nonlinear fitting of fork length versus adjusted spine ring counts.
0
20
40
60
80
100
120
140
0 2 4 6 8 10 12 14Age (year)
Fork
Len
gth
(cm
)
Lt = 147.5{1-exp[-0.126(t + 1.89)]} N = 344
Fork
Len
gth(
cm)
454
100
120
140
160
100 110 120 130 140
L ∞
(cm
)
0.00
0.05
0.10
0.15
0.20
0.25
100 110 120 130 140
Lmax (cm)
K
Figure 6. Simulated results of the effect of the observational maximum length (Lmax) in estimated maximum length (L∞) (above) and in estimated growth rate (K) (below).
455
Plate 1. Spine section of albacore, arrow showing the type of ring:
(a) Double ring; (b) Triple ring; (c) Single, thick ring; (d) Single, thin ring.
(a)
(b)
(c)
(d)
456
Plate 2. The plate showing the newly recognized five ring counts on a vertebra, after the first mark is abandoned.