Embed Size (px)
Citation preview
APPLIED PSYCHOLOGY: A N INTERNATIONAL REVIEW, 1995.44 (4), 345-373
Age Differences in Three Components of Employee Well-being
Kamal Birdi and Peter Warr University of ShefieId, UK
Andrew Oswald London School of Economics, UK
On se heurte a des opinions et des rksultats contradictoires pour ce qui est de la relation entre I’ige et le bien-&tre professionnel qui, ici, a i t6 decom- pose en trois grandes composantes: la satisfaction globale, le stress, et la saturation. Ce modtle a ett mis B I’epreuve sur des salaries de neuf pays differents. On a constate I’existence d’une courbe en U pour la satisfaction au travail et en U inverse pour le stress. Par contre, la saturation decline sjmplernent lintairement avec I’avancee en Pge. Des analyses hierarchiques de regression multiple ont perrnis d’explorer les facteurs susceptibles de rendre compte de trois courbes liees a I’lge. La liaison entre I’Pge et la satisfaction est entitrement expliquee par des differences dans le travail et des facteurs personnels, comme I’est egalement la liaison curvilineaire entre ]’age et le stress. Toutefois, les niveaux de saturation ne sont pas vraiment concernes par les quatorze variables examinees. Compares au pouvoir explicatif des variables pour chacune des cornposantes du bien-etre, les modtles des liaisons varient d’une facon prkdictible. On insiste sur la necessitk d’adopter une approche differenciee du bien-Stre professionnel, en faisant par exemple appel aux trois composantes retenues ici.
There are conflicting opinions and findings about the relationship between employee age and occupational well-being. Viewing well-being in terms of three main components (overall job satisfaction, job stress, and job boredom), predictions are tested in a study of employees in nine different countries. I t is found that a U-shaped pattern exists for job satisfaction and (inverted) for job stress; however, job boredom merely declines linearly with increasing age. Applying hierarchical multiple regression analyses in order to examine factors accounting for the three age patterns, the positive association between age and job satisfaction is shown to be fully explained by differences in job and personal factors, as is the curvilinear association between age and job stress. However, age differences in job boredom are not substantially affected by the 14 control variables examined here. In comparisons between the
Requests for reprints should be sent to Kamal Birdi, Institute of Work Psychology,
The authors would like lo thank the Economic and Social Research Council’s Data University of Sheffield, Sheffield S10 2TN, UK.
Archive based at the University of Essex for providing the ISSP data.
0 1995 International Association of Applied Psychology
346 BIRDI, WARR, OSWALD
explanatory power of different variables for each component of well-being, patterns of associations are found to vary in a predicted manner. The need to take a differentiated view of occupational well-being is emphasised, for example in terms of the three components examined here.
I NTRODUCTI ON
On the basis of a review of published research, Herzberg. Mausner, Peter- son, and Capwell (1957, pp.5-6) suggested that “in general, morale is high among young workers. I t tends to go down during the first few years of employment. The low point is reached when workers are in their middle and late twenties, or early thirties. After this period, job morale climbs steadily with age”. I t was suggested that this U-shaped pattern was due to the fact that recent entrants to the labour market feel positively about their novel situation and their transition to adulthood; however, repetition of uninteresting activities and a perception of decreasing opportunity were thought to lead to a reduction in morale during the next few years. I t was suggested that in due course a person comes to terms with his or her occupational role (perhaps having moved out of relatively unattractive positions), so that an increase in job satisfaction is observed across later years.
However, after their examination of this area, Doering, Rhodes, and Schuster (1983) reached a different conclusion. They stated (1983, p.45): “While earlier studies reported a U-shaped relationship, post-Herzberg et al. studies have reported a linear increasing relationship between age and both overall and facet satisfaction”. This appears now to be the generally held view; job satisfaction is thought to increase linearly with age, with no U-shape as proposed by Herzberg and colleagues. (See also Glenn, Taylor, & Weaver, 1977; Janson & Martin, 1982; Kalleberg & Loscocco, 1983; O’Brien & Dowling, 1981; Wright & Hamilton, 1978.) The magnitude of the significant increase with age is not great (with correlations tending to fall between +0.07 and +0.15). but i t is consistently found. The overall goal of this paper is to examine these conflicting interpretations, with special attention to the age-pattern in respect of three main aspects of occupational well-being. Three predictions will be tested.
Prediction One: A U-shaped Relationship in Three Components of Well-being
The non-linear account provided by Herzberg et al. (1957) is a persuasive one, and it has recently been supported in two studies of British employees. In research into other aspects of job-related well-being (not satisfaction itself), Warr (1992) reported a statistically significant U-shaped pattern, with elevated well-being at the youngest ages, lower satisfaction in the
EMPLOYEE WELL-BEING 347
middle range, and a cross-sectional increase up to retirement age. This pattern was also observed by Clark, Oswald, and Warr (in press) in an examination of overall job satisfaction, satisfaction with pay, and satis- faction with the work itself.
The concept of “morale” as examined by Herzberg and colleagues is unfashionable nowadays, but aspects of it may be specified in terms of job-related affective well-being. This construct has several overlapping components, which are known to be affected differentially by particular job and other factors (e.g. Warr, 1987). The dominant focus in research examining age has been on a single aspect of well-being (namely job satis- faction), and it is important now to examine the association with age of other aspects of well-being.
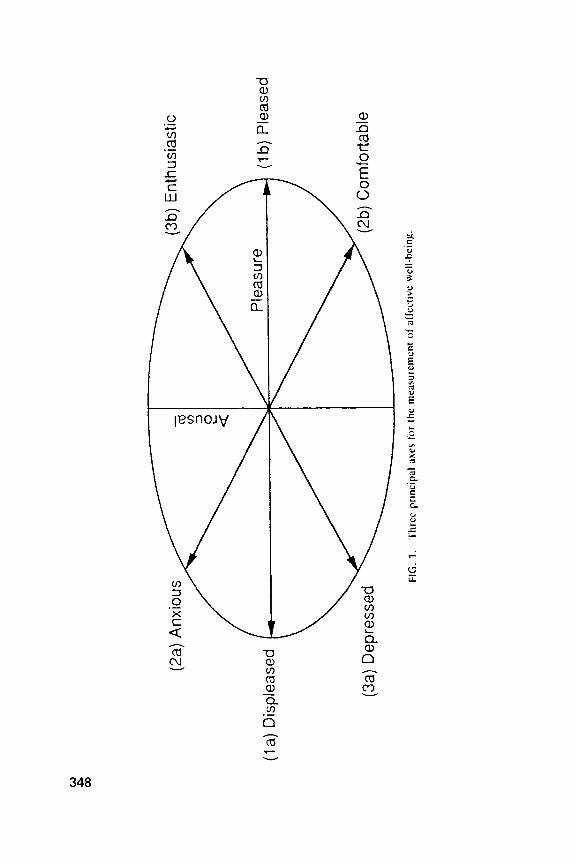
As illustrated in Fig. 1, all forms of affect may be construed within a theoretical framework comprising the two dimensions of pleasure and arousal (Warr, 1987, 1990a, 1994). For instance, feelings of pleasure- displeasure in relation to one’s paid employment (which are typically measured as overall job satisfaction) may be described as being of either high or low pleasure but also of medium arousal; those can be located along the horizontal axis of Fig. 1. A second aspect of occupational well- being which has been much investigated (e.g. Kahn & Byosiere, 1992) is job-related stress. Feelings of stress may be viewed in terms of low pleasure in conjunction with high arousal; 2a in Fig. 1. And boredom (e.g. Fisher, 1993) can be represented as low pleasure in conjunction with low arousal; 3a in Fig. 1.
Support for such a configuration of those three aspects of well-being was found in the study carried out by Russell (1980) on his circumplex model of affect. Analyses of adjective-ratings consistently placed “satis- faction” at the pleasurable end of the horizontal axis and “boredom” in the quadrant representing low arousal and displeasure. Although the term “stress” was not included in the sample of adjectives, “distress” was present in the quadrant of high arousal and low pleasure, together with other terms such as “tense”. Feelings of job satisfaction, job stress, and job boredom thus fall on three principal axes of well-being.
Despite the fact that overall job satisfaction is broader in scope (deriving from the job “overall”) than the more specific feelings of job stress or boredom, past research has tended to view the three constructs in an overlapping manner; a matching of individual needs, wants, and abilities with the nature of the job is held to be beneficial for each of the outcomes (e.g. Decker & Borgen, 1993; Fisher, 1993). As indicated in Fig. 1, each component of well-being is primarily a function of a person’s feelings of pleasure-displeasure, and in empirical investigations the three components are significantly intercorrelated: high job satisfaction is associated with low stress and low boredom. We therefore predict that a U-shaped pattern in
348
EMPLOYEE WELL-BEING 349
relation to age will be observed in each case. For job stress and job bore- dom, this pattern is expected to be inverted, with greatest stress or boredom at the middle ages.
Such a U-shape requires that young workers have high well-being relative to those aged between about 25 and 30. Why should that be the case? One possibility is that young workers have lower expectations than the more established employees. With limited experience of other posi- tions, young people may have a lower standard of comparison against which to view their own job, so that their reported feelings are more positive than will be the case in later years in the same objective circum- stances. For example a study by Mottaz (1987) examined work values in relation to age and showed that the age-group from 16-20 years in the upper level of occupations rated both intrinsic and extrinsic values as less important than the 21-30 age-group. People who think these features are of lower importance are expected to be less disappointed if the features are perceived to be absent. In a similar manner, Mabey (1986) has emphasised the role of expectations in influencing satisfaction with work.
Second, the feelings of newly-employed young people about their job will depend on aspects of their local labour market as well as on the characteristics of their work itself. In times when youth unemployment is high, those young people who have been successful in obtaining employ- ment are likely to feel particularly pleased about their relatively favoured position. During the past decade, the level of youth unemployment in most developed countries has been high, so that comparative judgements of this kind are likely to have increased the job satisfaction and related scores of recent entrants to the workforce. In other circumstances, when job oppor- tunities are plentiful, standards of comparison are likely to be raised by the consideration of alternative possible jobs, with accompanying reduc- tions in well-being in one’s present role.
Third, younger workers entering the job market tend to have fewer non-job pressures in terms of raising a family. However, as they reach the age where these financial and time demands increase, there may be a raised valuation of job features such as income or free time; if job conditions stay the same then dissatisfaction may arise. Furthermore, as children grow up and become more independent, the pressures on older workers tend to decrease, lowering valuation of some characteristics and hence increasing satisfaction in later life (e.g. Kalleberg & Loscocco, 1983). Such a pattern of well-being has also been observed among men who are unemployed: distress is less marked among the youngest and oldest unemployed groups (e.g. Warr, Banks, & Jackson, 1988).
There are thus three reasons to expect a negative association between age and employee well-being in the first decade or so of employment. In addition to hypothesised intra-individual changes associated with work-role
350 BIRDI, WARR, OSWALD
transitions (emphasised by Herzherg et al., 1957). young people are likely to make particularly favourable judgements about their position in difficult labour market conditions, and they come under increasing non-job demands after a few years in the labour force.
Prediction Two: Accounting for the Positive Associati on
What about the (cross-sectional) increase in employee well-being that is observed at subsequent ages? Two main forms of possible explanation have been examined. First, it is likely that with increasing age many people move into jobs that have more desirable characteristics; greater job-related well-being at older ages may thus arise from better conditions of work (e.g. Janson & Martin, 1982: Kalleberg & Loscocco, 1983; Wright & Hamilton, 1978). Those are regularly found to be influential, but even after their control a significant age difference in job-related well-being is typically retained (Glenn et al., 1977; Kalleberg & Loscocco, 1983; Warr, 1992). Previous research has therefore suggested that the positive age-gradient in occupational well-being across the later years cannot be completely accounted for in terms of movement into more attractive jobs.
Second, it may be that older and younger workers differ in their occu- pational values, such that older people have specific work orientations which make more acceptable the job characteristics that are less desirable to younger ones. For example, Wright and Hamilton (1978) and Kalleberg and Loscocco (1983) (in secondary analyses of the same data) found that the rated importance of many job features is stable across ages, but that income and promotion opportunities were of less concern to older em- ployees. As a result of that difference in work values at different ages, jobs with relatively low pay or poor opportunities for promotion are expected to be evaluated more positively by older individuals.
Several investigators have examined whether differences in measured work values can account for the observed increase in job satisfaction with age. As with job characteristics, differences in values have been found to account statistically for some of the age-pattern, although not as much as for job characteristics. However, the independent effect of age on job \atisfaction is typically retained after the introduction into multivariate analyses of controls for different values (e.g. Clark et al., in press).
A variant of this possibility is seen in models of person+nvironment fit (e.g. Dawis & Lofquist, 1984), which suggest that individuals move into positions that are most consistent with their needs and skills. This inter- pretation has been examined in studies of age and satisfaction by statist- ically controlling for differences in principal job attributes, as well as values. These investigations suggest that, in conjunction with individual attributes, information about job characteristics and work orientations can
EMPLOYEE WELL-BEING 351
explain much, but typically not all, of the positive association between age and occupational well-being (e.g. Kalleberg & Loscocco, 1983; Warr, 1992). The second prediction is therefore that differences in job charac- teristics and work orientations will account for some but not all of the observed age-pattern. The three components of well-being all appear likely to be affected by these explanatory variables (though not necessarily in the same way; see Prediction Three), and we expect a partial, rather than complete, effect of the control variables in each case.
Prediction Three: Different Contributors to Different Components of Well-being
Within a general concern for the explanation of age effects in terms of job changes with age and altered work orientations with age (Prediction Two), we expect those two sets of potential contributors to have different impacts for the three different aspects of well-being.
Work orientations are here examined in terms of a person’s overall employment commitment and, more specifically, in terms of values assessed using the personal importance of nine job characteristics. In the former respect, older workers tend to exhibit more commitment to their jobs than younger ones (e.g. Warr, 1994). On the basis of earlier studies, it is expected that employment commitment will be positively associated with job satisfaction and negatively with job boredom. Those associations with well-being are likely to contribute significantly to the age pattern observed in those aspects of well-being. However, job stress appears likely to derive more from demands in the work setting than from individuals’ work orientation, so that employment commitment is not expected to contribute to that particular age effect.
Previous research has typically grouped specific work values into two sets: those focusing on the extrinsic rewards from a job (e.g. from job security or promotion opportunity) and those focusing on intrinsic rewards derived directly from the work experience itself, such as in task autonomy (e.g. de Vaus & McAllister, 1991; Hurlbert, 1991; Weinberg & Tittle, 1987). Differential predictions are made here in respect of those two sets of values.
Prediction Two (see earlier section) is that differences in work values will account for part of the association between age and occupational well- being. However, the nature of that contribution from employees’ values is expected to vary according to which well-being component is examined. First, for the broad construct of overall job satisfaction it is expected that intrinsic and extrinsic values will be equally important. Second, the impact of either set of values is likely to be limited in the case of job stress: that is expected to be more influenced by job features such as work hours and job security, factors that have been found to be linked with that aspect of
352 BIRDI, WARR, OSWALD
well-being (Arnold, Robertson, & Cooper, 1991). Third, for job boredom we expect intrinsic values to be important, in that a failure to satisfy intrinsic values is particularly likely to generate negative feelings of that kind.
What about possible differences between the contribution of job rewards to the age effects for the three aspects of job well-being? As in the case of work values, the broad construct of overall job satisfaction is expected to be influenced by both intrinsic and extrinsic rewards. However, job stress appears more responsive to extrinsic demands, such as number of hours worked and role responsibilities. Third, job boredom is more a question of the lack of intrinsic rewards, in that lack of meaning or fulfil- ment gained from the work itself will engender feelings of boredom; the nature of the task itself is usually seen to be a major influence on boredom (e.g. Fisher, 1993).
In Prediction Three, we thus expect a differential contribution of job features and work orientations to the age pattern in the three forms of well-being examined here. In the case of overall job satisfaction, significant independent effects are expected from employment commitment, intrinsic values, extrinsic values, intrinsic rewards, and extrinsic rewards. For job stress, extrinsic job features are thought likely to be important. And for job boredom the contributions of employment commitment, intrinsic values, and intrinsic rewards are expected to be significant.
The Research Approach
Respondents in survey research in this area can be of two kinds. Within a single organisation it is possible to devise investigations that examine a specific group of employees. However, that kind of study usually involves only a small sample, and results are inevitably affected by the local con- ditions within a particular setting. On the other hand, it is possible to analyse data from national surveys of working people. In that case, there are clear advantages in terms of the size and comprehensiveness of a sample. However, as data of that kind are usually only available in previ- ously conducted surveys, initial research goals may often be different from a current concern. As a result, the measurement procedures employed can sometimes be less than ideal for the current research question.
A primary requirement in this field is for information about a large number of people. That is particularly important in terms of a sub-sample of young employees, because the significance of a possible U-shape (Pre- diction One) will depend substantially on the number of young respondents in the study. A large sample is also required for the multivariate statistical analyses needed to examine Predictions Two and Three. (Indeed, most of the studies cited in this section were based on secondary analyses of national surveys rather than on data gathered in a single organisation.)
EMPLOYEE WELL-BEING 353
We have therefore drawn on a major data-set which was acquired pre- viously. This permits detailed examination of key issues, and has major strengths in relation to the present objectives. Information was obtained about the three aspects of well-being identified earlier; and job charac- teristics and job values were measured in directly comparable terms. In addition, previous studies have drawn samples from single organisations or countries, whereas the present investigation is of a multi-national sample, allowing broad generalisations to be made. However, as with all secondary analyses of previously gathered data, this paper cannot escape completely from the methodological setting established by designers of the original research.
As a summary, we expect a curvilinear and positive association of age with affective well-being at work in our multi-national sample. In these data, well-being is represented by measures of overall job satisfaction, feelings of work stress, and job boredom; it is hypothesised that for each of these outcomes older and younger workers will be affectively better off than those in the middle (Prediction One). Further to this, we seek to explain the age-related variance through a combination of job charac- teristics and individual work orientation measures, controlling for demo- graphic factors. Although some age-related variance should be accounted for, we expect that there will be a significant amount remaining unex- plained (Prediction Two). In accounting for age patterns in respect of the three outcomes, we expect that overall job satisfaction will be affected by the widest range of factors, job stress more by extrinsic job features, and job boredom more by intrinsic values and rewards (Prediction Three).
METHOD
The data used in this paper are drawn from the International Social Survey Programme (ISSP), which is an ongoing series of cross-national collabor- ative studies, initiated in 1984. The programme brings together national projects, and co-ordinates research goals by adding a cross-national per- spective to the individual studies. This paper utilises the 1989 Work Orientations self-completion questionnaire, given out as part of each country’s national survey (see also Curtice, 1993). The countries included in the present analysis are Austria ( N = 694), Great Britain ( N = 487), the Republic of Ireland ( N = 319), Italy ( N = 347), the Netherlands ( N = 503), Northern Ireland ( N = 228), Norway ( N = 740), the United States of America ( N = 582), and West Germany ( N = 456). Although also surveyed, Hungary and Israel were not included here due to consider- able missing data for the variables investigated.
Individuals were selected from the overall sample on the basis of their employment status. The large majority of respondents in paid work were
354 BIRDI, WARR, OSWALD
full-time employees, and we examined that group alone in order to reduce artefactual variations across the sample. For instance, the proportion of respondents in part-time work varied substantially across the countries studied (from 5% in Austria to 26% in Norway), and part-timers differed in other ways from the full-time sample (e.g. more often being women, more often being at the extremes of the age-range, and less often having supervisory responsibilities). Furthermore, part-time work is often under- taken for reasons that are different from those underlying full-time employ- ment, such as supplementing the principal source of family income or providing funds for concurrent education. Similarly, self-employed respondents (12% of the overall sample) were excluded from this study, because their frequency also varied across countries, gender, and super- visory responsibilities. Members of the sample ( N = 4356) were thus aged between 18 and 64 and in full-time employment.
Although samples of this size are commonplace in economic and sociological research, applied psychological investigations usually involve a smaller number of individuals. Statistical significance is conventionally set as P < 0.05 in the former disciplines, but that is sometimes considered by psychologists to be too low a threshold for large-sample investigations. The more conservative P < 0.01 level is therefore adopted here.
Measures of Job-related Well-being
Overall Job Satisfaction. Respondents were asked “How satisfied are you in your main job?”, and replies were made on 7-point scale from Completely Satisfied to Completely Dissatisfied. Responses were scored from 7 to 1 respectively.
Feelings of Job Srress. Respondents were asked “How often do you find work stressful?”, with replies on a 5-point scale from Always to Never, scored from S to 1 respectively.
Feelings of Job Boredom. Respondents were asked “How often are you bored at work?“, with replies on a 5-point scale of Always to Never, scored from 5 to 1 respectively.
Measures of Demographic Variables
An employee’s age was recorded in years. In view of the interest in possibly curvilinear associations with age. values of age-squared were also com- puted. Age and age-squared are typically highly intercorrelated, and it is desirable to take steps to reduce multicollinearity between those two vari- ables. High multicollinearity can give rise to unstable regression coefficients, so that slight changes in age may inappropriately produce large
EMPLOYEE WELL-BEING 355
changes in the regression coefficients. Excessively high intercorrelation can be reduced without any loss or change in information by centring age on its mean (i.e. by replacing age by its deviation from the sample mean) and by squaring this value rather than age itself (e.g. Cohen & Cohen, 1983, p.238). After centring, the correlation between age and its square was here reduced from 0.99 to 0.24. In examinations of age-squared within specific sub-samples of men or women, centring was carried out on the basis of the relevant sub-sample mean.
Information was also gathered about respondents’ gender (1 = male, 2 = female), marital status (1 = not married, 2 = married), and years of education (10 years or less, 11 or 12 years, and 13 years or more, coded as 1, 2, or 3 respectively).
Measures of Job Characteristics Respondents were asked to indicate whether they supervised others (1 = no, 2 = yes) and the number of their weekly working hours. In addi- tion, actual income (specified in a band appropriate for each country) was standardised relative to the mean and standard deviation within that country. This allowed income data to be analysed across all countries.
Job Rewards. Respondents were asked to indicate how strongly their job demonstrated each of the following features: job security, high income, opportunities for advancement, leisure time, independent work, a job that allows someone to help people, a job that is useful to society, and flexible working hours. Responses were made on a 5-point scale and scored so that Strongly Disagree was coded 1 and Strongly Agree was coded 5 .
Two multi-item scales were created, to measure separately intrinsic rewards (independent work, helping people, and being useful to society) and extrinsic rewards (job security, high income, opportunity for advance- ment, leisure time, and flexible working hours); alpha coefficients of internal consistency were found to be 0.63 and 0.52 respectively. This grouping was based on two considerations. First, an examination of categorisation procedures in previous studies (e.g. Borg, 1990; de Vaus & McAllister, 1991; Kalleberg & Loscocco, 1983) led to a preliminary class- ification of the items. Second, a principal components factor analysis requiring a two-factor solution produced a result that strongly supported that conceptual grouping.
Poor Work Conditions. This was assessed by a 3-item scale (alpha = 0.72), asking whether individuals worked in dangerous, unhealthy, or physically unpleasant conditions. Answers were on a 5-point scale from Never to Always, coded 1 to 5 respectively.
356 BIRDI, WARR, OSWALD
Work Relationships. A scale was created from two items used to assess relations at the respondent’s work-place: between management and employees, and between colleagues (alpha = 0.61). Responses were made on a 5-point scale from Very Bad to Very Good (1 and 5 respectively).
Measures of Work Orientations
Respondents were asked to what extent they agreed that work is a person’s most important activity. Responses were on a 5-point scale from Strongly Disagree to Strongly Agree ( 1 and 5 respectively).
Employment Commitment.
Work Values. Parallel to the job characteristics listed earlier, respond- ents were asked “how important do you personally think are these features in a job”: job security, high income, opportunities for advancement, leisure time, independent work, a job that allows someone to help people, a job that is useful to society, and flexible working hours. Responses were on a 5-point scale from Not Important At All to Very Important, coded from I to 5 respectively.
Multi-item scales of intrinsic and an extrinsic values were created from the same groupings as for the job rewards scales (alpha = 0.61 and 0.51 respectively). The principal components analysis carried out on these items produced a two-factor solution that was virtually identical to the job- rewards groupings except that flexible working hours loaded on to the intrinsic scale. Consulting past literature (e.g. Weinberg & Tittle, 1987) and to preserve the parallel with the job rewards scales, i t was decided to place this item in the extrinsic scale. Note that the scales of both extrinsic rewards (earlier) and extrinsic values (this paragraph) have relatively low internal reliability; this is probably due to the very diverse nature of char- acteristics that are extrinsic to a job.
RESULTS As expected from their conceptual overlap and their common loading on the major dimension of pleasure-displeasure, overall job satisfaction and feelings of boredom at work were found to be significantly intercorrelated were less (-0.36). However, feelings of job-related stress were less associ- ated with the other aspects of well-being: rs = -0.13 and 0.04 with satis- faction and boredom respectively.
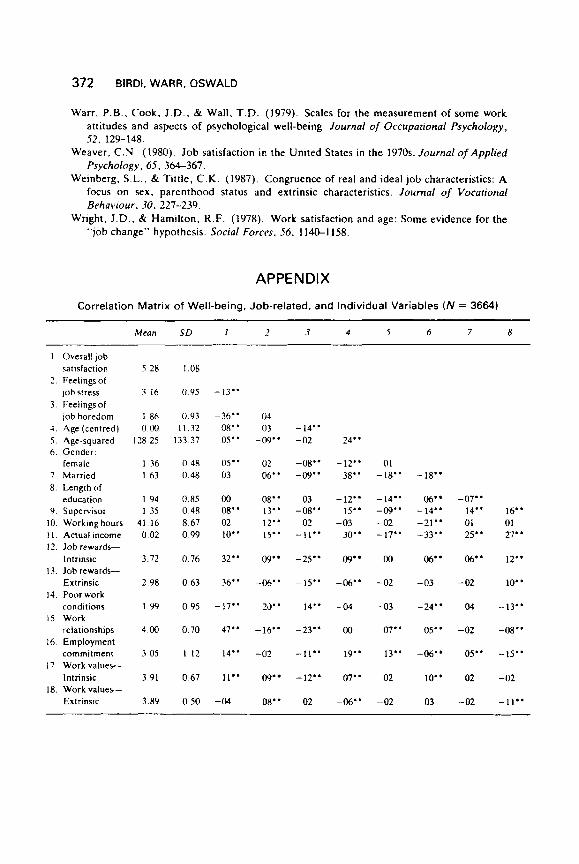
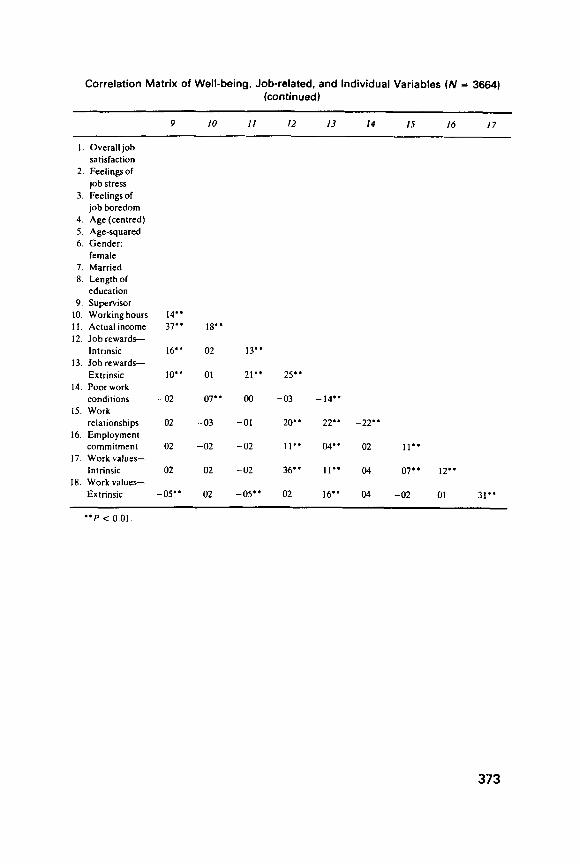
A full correlation matrix is presented as an Appendix. That is based on list-wise deletion, to ensure that all coefficients derive from an identical set of respondents. I t can be seen that overall job satisfaction is significantly associated with almost all of the measured job features, as well as age and gender: in addition, there is a significant correlation with employment
EMPLOYEE WELL-BEING 357
commitment and intrinsic work values but not with extrinsic values. Feel- ings of job stress and job boredom are also significantly predicted from job and individual variables, with boredom being associated with job rewards and work values in a manner similar to satisfaction (but naturally in an inverse direction). Job stress is related to all job characteristics and both work-value measures. Certain variables predict both high and low well- being on the component examined. For example, higher actual income and being a supervisor are correlated with higher job satisfaction but also with greater job stress; this pattern replicates the one found with multi-item measures (Warr, 1990a).
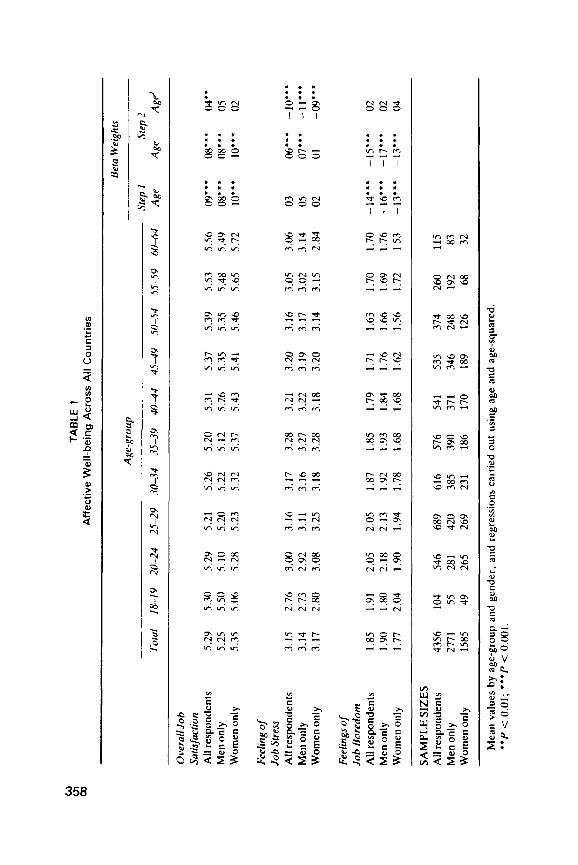
Prediction One: A U-shaped Relationship in Three Components of Well-being The age-distribution of the three components of occupational well-being is summarised in Table 1, for all respondents (full-time employees; see earlier text) and separately for men and women. In respect of overall job satisfaction, the age-group values to the left of the table indicate a high score among the youngest group (5.30), and a decline before satisfaction increases up to 5.56 in the oldest age-group. This is the U-shape suggested by Henberg and colleagues.
To the right of the table is information derived from a two-step re- gression analysis, in which age was entered first and age-squared second (after centring, as described earlier), to assess the significance of the linear and non-linear components respectively. (A positive beta weight for age- squared indicates a curve with a minimum, and a negative beta weight indicates a curve with a maximum.) It can be seen that for all respondents overall job satisfaction is significantly associated with age (step one), and that addition of age-squared (step two) generates a significant beta weight for the non-linear component in that relationship.
There is also a marked (inverted) U-shape in feelings of job-related stress. The mean value of stress is lowest among 18-19 year-olds, it increases up to the mid-30s, and then declines. The bivariate correlation with age is smaller than in the case of overall job satisfaction, failing to reach the P < 0.01 criterion adopted here. However, the significant beta weight for step two confirms that the inverted-U is statistically significant. The third component of well-being, job boredom, shows no significant curvilinearity, merely declining (cross-sectionally) with age ( r = -0.14 for all respondents).
Separate analyses have been carried out for men and for women, and those are also summarised in Table 1. Overall job satisfaction was found to increase cross-sectionally with age for both male and female employees, but no significant curvilinearity is present when the samples are examined separately (although the youngest men have particularly high satisfaction,
TABL
E 1
Aff
ecti
ve W
ell-
bein
g A
cros
s A
ll C
ou
ntr
ies
Beta
Wei
ghts
A
ge-g
roup
Sr
ep I
Step
2
Tota
l 18
-19
20-2
4 25
-29
30-3
4 3s
-39
40-4
4 4.
549
.50-
54
55-5
9 6044
Age
A
ge
Agd
Ove
rall
Job
Sat
isfa
ctio
n A
ll re
spon
dent
s M
en o
nly
Wom
en o
nly
Feel
ing of
Job
Stre
ss
All
resp
onde
nls
Men
onl
y W
omen
onl
y
Feel
ings
of
Job
Bor
edom
A
ll re
spon
dent
s M
en o
nly
Wom
en o
nly
5.29
5.
20
5.29
5.
21
5.26
5.
20
5.31
5.
37
5.39
5.
53
5.56
5.
25
S.50
5.
10
5.20
5.
22
5.12
5.
26
5.35
5.
35
5.48
5.
49
5.35
5.
06
S.28
5.
23
5.32
5.
37
5.43
5.
41
5.46
5.
65
5.72
3.15
2.
76
3.00
3.
16
3.17
3.
28
3.21
3.
20
3.16
3.0
.5 3.
06
3.14
2.
73
2.92
3.
11
3.16
3.
27
3.22
3.
19
3.17
3.
02
3.14
3.
17
2.80
3.
08
3.25
3.
18
3.28
3.
18
3.20
3.
14
3.1s
2.
84
1.85
1.
91
2.05
2.
05
1.87
1.
85
1.79
1.
71
1.63
1.
70
1.70
1.
YO
1.80
2.
18
2.13
1.
92
1.93
1.
84
1.76
1.
66
1.69
1.
76
1.77
2.
04
I.%)
1.94
1.
78
1.68
1.
68
1.62
1.
56
1.72
15
3
ov"' 08**
* 10
"'
03
05
02
-14"
' -1
6"'
- 13
."
08""
08
'*'
10"'
06"'
07"'
01
-15"
' -1
7*.*
-1
3.''
04"
05
02
02
02
04
SAM
PLE
SIZ
ES
All
resp
onde
nts
4356
10
4 54
6 68
9 61
6 57
6 54
1 53
5 37
4 26
0 11.
5 M
en o
nly
2771
55
28
1 42
0 38
5 39
0 37
1 34
6 24
8 19
2 83
W
omen
onl
y 15
85
49
265
269
231
186
170
189
126
68
32
~
Mea
n va
lues
by
age-
grou
p an
d ge
nder
, and
reg
ress
ions
car
ried
out
usin
g ag
e an
d ag
e-sq
uare
d.
**P
< 0
.01;
"'f
< 0.
001.
EMPLOYEE WELL-BEING 359
as predicted). In feelings of job stress, curvilinearity is present for both men and women. Finally, separate analyses replicated the overall pattern of a linear decrease in feelings of job-related boredom for both men and women, with young women reporting the greatest boredom.
Prediction One (a U-shaped relationship between age and each form of occupational well-being) is thus confirmed for overall satisfaction (for the full sample) and (inverted, as predicted) for feelings of stress (in all analyses). However, no curvilinear association was observed in feelings of job boredom; young employees (especially women) did not report the low boredom that is required for such a pattern. In terms of linear correlation, older employees report greater overall satisfaction and less job-related boredom, but the bivariate linear association between age and feelings of stress is almost zero.
The application of differential calculus permits estimation of the minimum or maximum value in a curvilinear relationship (e.g. Cohen & Cohen, 1983, p.233). For overall job satisfaction the minimum level was reached at age 26, and job-related stress was found to be at its maximum at age 40.
Prediction Two: Accounting for the Positive Association
What about factors that may account for these relationships between age and well-being? It is predicted that differences in job characteristics and in work values will account for much of the observed association.
A preliminary examination was carried out in terms of bivariate cor- relations as shown in the Appendix. There is some evidence that older workers are in more rewarding jobs in that older respondents received higher income (variable 11) and reported their jobs to be more attractive in terms of intrinsic rewards (variable 12); however a negative relationship was seen with extrinsic rewards (variable 13). Older people also have greater employment commitment (variable 16); they place greater emphasis on intrinsic work values (variable 17), but are less concerned about extrinsic values (variable 18).
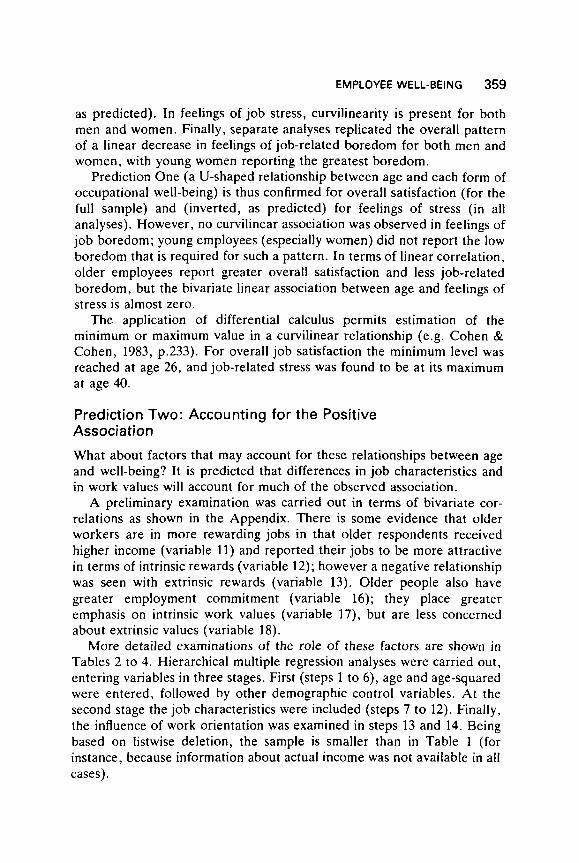
More detailed examinations of the role of these factors are shown in Tables 2 to 4. Hierarchical multiple regression analyses were carried out, entering variables in three stages. First (steps 1 to 6), age and age-squared were entered, followed by other demographic control variables. At the second stage the job characteristics were included (steps 7 to 12). Finally, the influence of work orientation was examined in steps 13 and 14. Being based on listwise deletion, the sample is smaller than in Table 1 (for instance, because information about actual income was not available in all cases).
TAB
LE 2
H
iera
rchi
cal
Mul
tipl
e R
egre
ssio
n: O
vera
ll J
ob
Sat
isfa
ctio
n W
cn 0
7
I'red
icio
r I
L
.f 4
5 6
7 8
9 10
I1
12
13
14
I. A
ge
2. A
ge-s
quar
ed
3. G
ende
r: fe
mal
e 4.
Mar
ried
5.
Cou
ntry
du
mm
ies
6. L
engt
hof
educ
atio
n 7.
Sup
ervi
sor
8. W
orki
ng h
ours
9.
Act
ual i
ncom
e 10
. Job
rew
ards
In
trin
sic
Extr
insi
c 1 I
. Po
or w
ork
cond
ition
s 12
. W
ork
rela
tions
13
. Em
ploy
men
t co
mm
itmen
t 14
. W
ork
valu
es
Intr
insi
c Ex
trin
sic
ox**
* 07
*"
ox**
* 07
'"
07'"
OX
***
(Mi**
06''
03
03
03
03
03
04
04
02
03
03
03
( )3
06* *
06
' *
06*'
* 08.'.
08"'
ofj*
**
Yes
Y
es
Yes
Y
es
02
00
01
02
10"'
10.'.
02
06'
11"'
02
Yes
06"
04
08"'
01
Yes
- 07
' 03
01
n?
24"'
31
**'
05"
05"
04
02
05"
05"
01
02
Yes
Y
es
-0Y"'
-06*"
03
02
02
01
07
05"
24.''
18'**
29
'**
22."
03
03
02
02
06'
06"'
02
02
Yes
Y
es
-05"
-0
5"
02
02
01
01
05.'
05"
18'*
* 18
"' 22
." 23
"'
07"'
08
**'
00
- 08
'
R2
0.01
0.
01
0.01
0.
01
0.02
0.
02
0.04
0.
04
0.04
0.
22
0.23
0.
34
0.35
0.
36
Sign
ifica
nce o
f in
crem
ent
t0.001
n.s.
<0
.001
n.
s.
4.0
01
n.
s.
<0.0
01
n.s.
t0.001
<0.0
01
<0.0
01 t0.001
<0.0
01
<0.0
01
Hie
rarc
hica
l m
ultip
le r
egre
ssio
n of
over
all j
ob s
atis
fact
ion
on i
ndiv
idua
l an
d w
ork-
rela
ted
vari
able
s: b
eta
wei
ghts
at e
ach
stag
e (N
= 3
664)
. **
P < 0
.01;
***
P <
0.0
01; n
.s.,
non-
sign
ific
ant.
Yes
= C
ount
ries
ent
ered
as
dum
my
vari
able
s; s
igni
fica
nt d
iffe
renc
es re
mai
n fo
r ev
ery
step
.
EMPLOYEE WELL-BEING 361
Table 2 sets out the findings for overall job satisfaction. It can be seen from the top row that age makes an independent contribution to satisfac- tion across most steps. However, contrary to the finding from the full sample in Table 1, age-squared is insignificant in this sub-set of respondents both at its point of entry into the analysis and in most of the subsequent steps. Steps 3 to 6 reveal that women are more satisfied and that country differences are present. It is clear from columns 7 to 12 that much variance in overall job satisfaction (32%) is accounted for by characteristics of a person's job, such as intrinsic and extrinsic rewards. Furthermore, the significant contributions of supervision and actual income are taken over by these additional features when they are entered in later steps.
Significant contributions are made in columns 13 and 14 by a person's employment commitment and by a low value placed on extrinsic features of a job. However, after all other factors have been taken into account, in column 14, age is no longer significantly associated with job satisfaction; older employees are overall more satisfied with their jobs, but that differ- ence can be seen to arise from differences in features of themselves or their jobs. This pattern across the columns of Table 2 implies that the initial bivariate association may be attributed to age-related differences in some of the significant factors in column 14. Principal among those are the positive job characteristics of intrinsic rewards and income, as well as employment commitment and extrinsic values; all these factors alter significantly with increasing age in a manner that would have a positive outcome for well-being (see the Appendix).
A significant amount of age-related variance in overall job satisfaction can thus be explained by older workers having higher incomes and gaining more intrinsic rewards from their jobs, as well as demonstrating greater employment commitment and lower extrinsic work values. Prediction Two (some influence from these factors, but a failure to explain all of the age effect) is thus not supported in respect of this component of well-being, in that the explanatory effect of the additional variables was complete rather than partial.
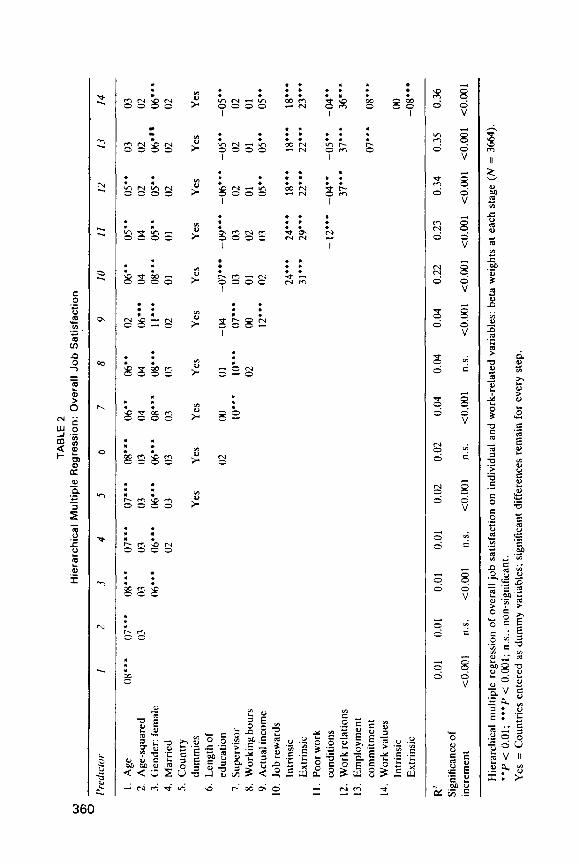
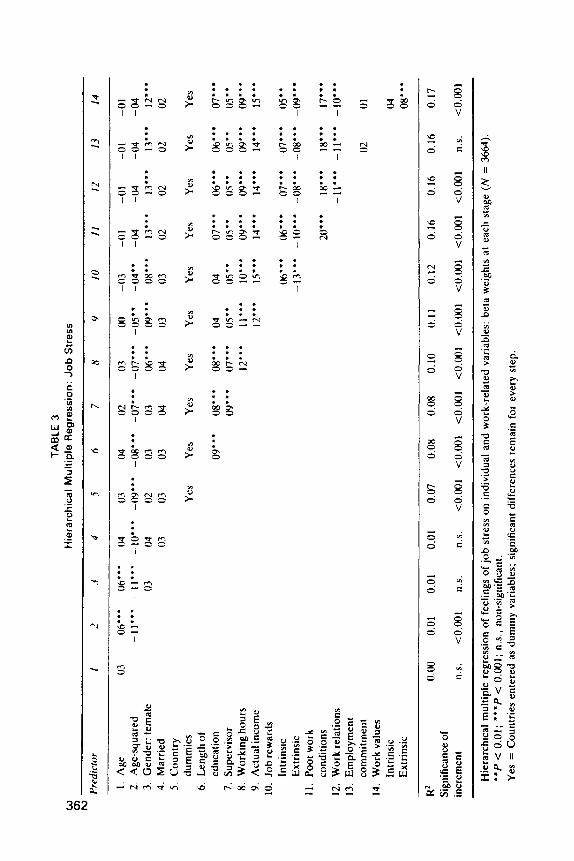
The same hierarchical multiple regression analysis is presented in Table 3 for feelings of job stress. It can be seen that the curvilinear component (represented by age-squared) remains significant until the entry of the job characteristics, specifically poor working conditions in column 11. More than in the case of job satisfaction, the main contributors to feelings of job stress are increased demands in a job (for instance, a high number of working hours, poor working conditions, and poor management-employee relations); see also the bivariate correlations in the Appendix. Feelings of job stress are also reported more by women, and employees with more education, supervisory responsibility, and higher income, despite controls for other factors. Again, examining the factors with which age-squared is significantly correlated (controlling for age), it can be seen that education,
* . . . * . t . . .
6%;313 * . . . . * . . . .
8 8 3 s . * . . . . . . . .
g z g z . . . t . . . t . . 6 g k "
. * . . * t . . " " 3 " . c -
. . . . * . . . x ) $ - -,-N
* . * . * * . * * 8 % "
* . * .
5 %
k-
. * .
k k I
. . * . . . 63"
I . . * . * * 6 8
I
* . . . g 2
5 >. - I
* . . . I
* . t . . * 2 2
I . . . . . t
z = I . . . . . *
502 I
3
z 8 8
N 3
s" 0 V
y! C
G
s"
0 V
0 V - 8 0 V
z s s Lz
s"
0 V - 0 V
0 V
6 V
c V
v. t i
v! E
G 0 V v:
C
362
EMPLOYEE WELL-BEING 363
supervision, income, and work relationships demonstrate a significant age- related effect. It is probably these factors that account for the inverted- U-shape for stressful work-feelings. Workers in their middle ages are more educated, more likely to supervise, more likely to earn a high income, and experience worse work relationships, all factors associated with greater work stress. These findings are not consistent with Prediction Two, in that the curvilinear age effect for job stress is completely explained by the additional variables describing the job characteristics.
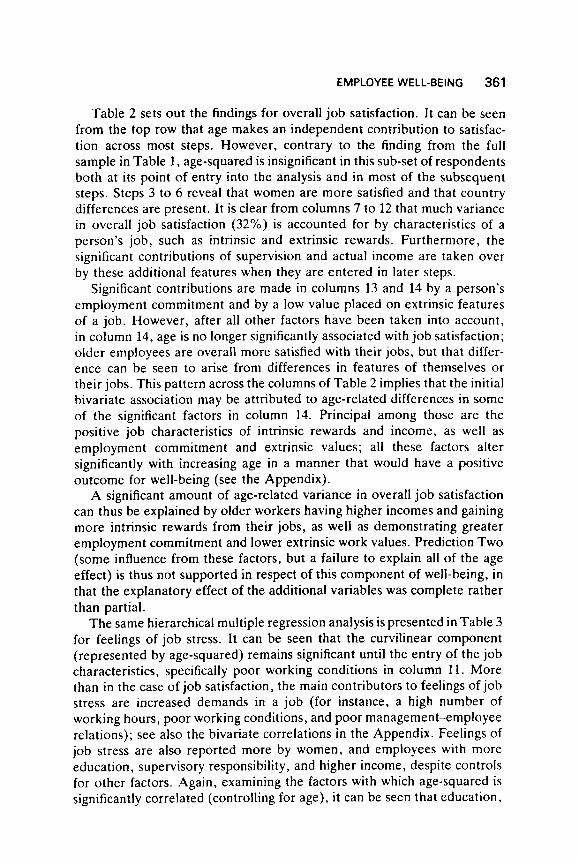
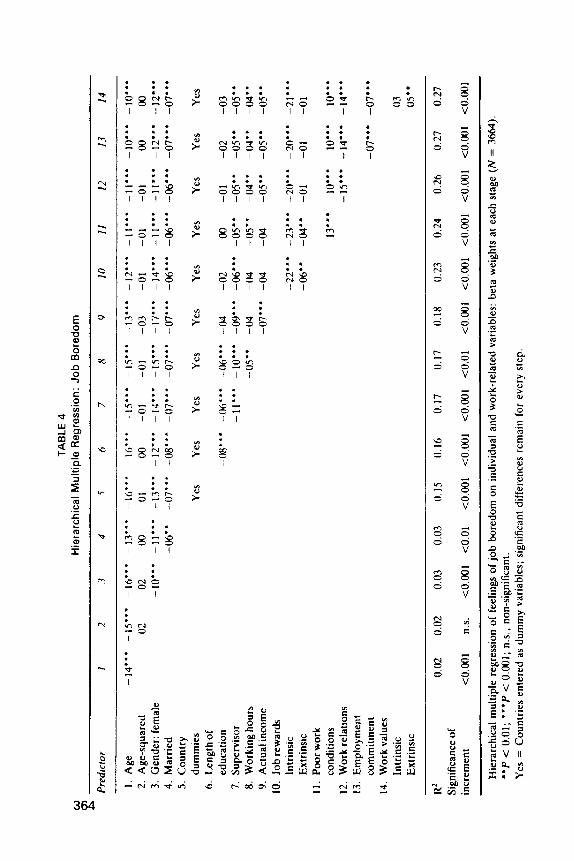
The multiple regressions in Table 4, for feelings of job-related boredom, indicate that the linear age effect is retained despite inclusion of the 14 other variables. Although several of those are individually important (for instance, lack of intrinsic job rewards and poor work relations are both predictive of higher boredom), the significant beta-weight for age in column 14 of Table 4 indicates that other factors remain to be identified which might account for the association between age and feelings of boredom at work. Indeed, the beta weight in the first row is only reduced by about a quarter after inclusion of the potentially explanatory factors (-0.14 and -0.10 in columns 1 and 14 respectively).
In overview, Prediction Two was that the 14 variables would reduce but not remove bivariate age effects. For job boredom that was found to be the case, but for job satisfaction and job stress the additional factors had a larger impact, rendering the age effect non-significant.
Prediction Three: Different Contributors to Different Components of Well-being The study’s third hypothesis concerned the differential importance of the several explanatory variables in relation to the three aspects of well-being examined here. For the broad construct of job satisfaction, significant inde- pendent effects were expected from employment commitment, intrinsic values, extrinsic values, intrinsic rewards, and extrinsic rewards. Inde- pendent contributions were found in column 14 of Table 2 from variables 10, 11, 12, 13, and 14, confirming the prediction in all respects except for intrinsic work values.
A different pattern was expected for job stress, emphasising the import- ance of extrinsic job features. That too was confirmed, in respect of long working hours, low extrinsic rewards, poor working conditions, and poor work relations. Third, as predicted, low intrinsic rewards and low employ- ment commitment made significant independent contributions in column 14 of Table 4 (for job boredom), but the coefficient for intrinsic values was not significant.
In summary, Prediction Three was supported; the pattern of contrib- utors to an age effect varies between different components of well-being in the manner that was expected. However, the present measure of intrinsic values was less important than appears in conceptual terms to be warranted.
TAB
LE 4
H
iera
rchi
cal
Mul
tiple
Reg
ress
ion:
Job
Bor
edom
0
cn P
Pred
icto
r I
2 .3
4 .5
6 7
8 9
10
I1
12
I 3
14
1. A
ge
2. A
ge-s
quar
ed
3. G
ende
r: fe
mal
e 4.
Mar
ried
5.
Cou
ntry
du
mm
ies
6. L
engt
hof
educ
atio
n 7.
Sup
ervi
sor
8. W
orki
ng h
ours
Y.
Act
ual i
ncom
e 10
. Job
rew
ards
In
trin
sic
Extr
insi
c 11
. Po
orw
ork
cond
ition
s 12
. W
ork
rela
tions
13
. Em
ploy
men
t co
mm
itmen
t 14
. Wor
k va
lues
In
trin
sic
Extr
insi
c
Yes
Y
es
Yes
Y
es
Yes
Y
es
Yes
Y
es
Yes
Y
es
03
05'
R2
0.02
0.
02
0.03
0.
03
0.15
0.
16
0.17
0.
17
0.18
0.
23
0.24
0.
26
0.27
0.
27
Sign
ifica
nce o
f in
crem
ent
<0.0
01
n.s.
<0
.001
<0
.01
<0.0
01
<0.0
01
<0.0
01
4.0
1
<0.0
01
<0.0
01
<0.0
01
<0.0
01
<0.0
01
<0.0
01
Hie
rarc
hica
l mul
tiple
reg
ress
ion
of fe
elin
gs of j
ob b
ored
om o
n in
divi
dual
and
wor
k-re
late
d va
riab
les:
bet
a w
eigh
ts a
t ea
ch s
tage
(N
= 3
664)
**
P <
0.0
1; *
**P
< 0
.001
; n.s
., no
n-si
gnif
ican
t. Y
es =
Cou
ntri
es e
nter
ed a
s du
mm
y va
riab
les;
sig
nific
ant d
iffe
renc
es re
mai
n fo
r ev
ery
step
.
EMPLOYEE WELL-BEING 365
DISCUSSION
Prediction One: A U-shaped Relationship in Three Components of Well-being
This paper goes beyond others in the field by investigating age patterns in three aspects of occupational well-being. Within the framework set out in Fig. 1, it was predicted that in each case well-being and age would be curvilinearly associated, despite current accounts in the literature of a merely linear relationship. However, a curvilinear pattern was found in only two cases: overall job satisfaction (a U-shape in Table 1, but not for the reduced sample in Table 2) and feelings of job-related stress (an inverted U). In the third case, feelings of job-related boredom showed merely a significant (cross-sectional) decline with age, despite a correlation of -0.36 with overall job satisfaction.
The U-shaped relationships for overall satisfaction and (inverted) for job stress are counter to current expectations based on studies carried out in the 1960s and 1970s; the conventional account of age differences in well-being (a continuous increase from very low levels at young ages; e.g. Doering et al., 1983) is not universally valid. In the full sample (Table l ) , overall job satisfaction declined (cross-sectionally) from a relatively high level in the youngest group to a minimum at age 26 and increased steadily thereafter; satisfaction in the youngest group was particularly high for male employees. This U-shape in job satisfaction has also recently been demon- strated by Clark et al. (in press), but it was not present here after list-wise deletion reduced the size of the sample (Table 2).
There is now a need for additional information about factors that might affect the age-satisfaction relationship at younger ages. For instance, in cases where young employees move through career stages into progress- ively more attractive jobs, a positive rather than negative association of job satisfaction with age in the lower range would be expected. But when school-leavers move into jobs that they come to discover provide few rewards and no opportunity for advancement, satisfaction associated with initial novelty is likely gradually to decline, leading to a negative association with age across the lower years of the kind envisaged by Herzberg and colleagues (1957).
Different age-patterns may be found for young men and young women (see Table 1, and Clark et al., in press), and attention to this possibility in future research is desirable. Discrepancies between different studies in the direction of the age-gradient up to about 30 years may also arise from variations in the comparability of sample composition across the years in different studies; the exclusion of students from the lower bands of the present sample of full-time employees may, for example, have increased the difference in well-being between 18-19 year-olds and 25-29 year-olds.
366 BIRDI, WARR, OSWALD
The curvilinear age-pattern also occurs for feelings of job stress. For the sample as a whole, and for men and women separately, a significant inverted U is found. That replicates the findings of Warr (1992) for job- related anxiety and Warr et al. (1988) for distress among unemployed men. However, this pattern was not found for job boredom, which merely declined with age. Age and occupational well-being are thus associated in a different manner depending on the facet of well-being that is under investigation.
The young employees in this study tended to report frequent feelings of job boredom, despite their relatively high satisfaction. Why should this be so? I t is possible that the jobs occupied full-time by 18-19 year-olds in this sample are objectively more boring than are jobs at older ages, for two reasons. One is a differential sample composition at different ages, as outlined earlier. The youngcst group in Table 1 necessarily excludes college and university students, who might later be expected to undertake more interesting activities than less-educated young people.
Second, it may be the case that the work initially available to young people is inherently more boring than that at older ages. Jobs available for poorly educated entrants to the labour-market are likely to lack stimu- lating features, and a principal cause of boredom is quantitative and qual- itative underload (Fisher, 1993).
I t is important to distinguish job boredom from overall job satisfaction. The latter surnrnarises feelings about all aspects of a job, including inter- personal and financial features and possible satisfaction about being employed rather than unemployed. However, feelings of boredom derive primarily from t h e intrinsic content of a person’s work, irrespective of the wider influences on overall satisfaction. In these terms, the relatively high overall satisfaction of young employees in this sample is not inconsistent with their lower well-being in terms of greater job boredom.
Prediction Two: Accounting for the Positive Association
The hierarchical multiple regression analyses in Tables 2, 3 , and 4 examined whether the observed age-effects could be accounted for by 14 other variables. In the light of findings from previous investigations (e.g. Clark et al., in press; Kalleberg & Loscocco, 1983; Warr, 1992), i t was expected that these additional variables would partially account for the observed age effects but that those would remain significant.
It was found that age-differences in overall job satisfaction were attribut- able to variations in job characteristics, length of education (negatively loaded), gender, employment commitment, and extrinsic work values (negatively loaded); after inclusion of all those, the bera weight for age in
EMPLOYEE WELL-BEING 367
Table 2 was non-significant. It is not clear why the control variables were more influential in the present case than in previous studies, but the finding may arise from the fact that the present indicators of job characteristics and work values were particularly wide-ranging and that they systematically covered the same aspects of work.
Prediction Two was not confirmed for job stress, where the inverted-U pattern became non-significant after the entry of job characteristics (Table 3). However, in the case of job boredom (Table 4), the additional factors examined here had little impact on the age effect. Some other variables must underlie the strong (cross-sectional) decline in this aspect of well-being with age. These might be other job characteristics, associated with variety, task identity or work underload. Another possibility is in terms of age differences in personality. Extroverted people tend to experi- ence more feelings of boredom than do introverted individuals (Fisher, 1993). Given that older people tend to be less extroverted than younger ones (Eysenck, 1987), the observed lower job boredom at older ages might be in part attributable to stable personality characteristics which vary across the age-span.
Looking at occupational well-being more generally, what factors, in addition to those examined here, might account for the age patterns? One potentially important general factor is in terms of modified standards for comparison. It is likely that older workers tend to lower their standards for comparison after they have experienced a range of job situations and seen that jobs in general can have many unattractive features (the “grinding down” hypothesis of Wright & Hamilton, 1978). Such reduced comparison standards would generate more positive work attitudes in general, as the perceived gap between actual and ideal work becomes smaller, so that aspirations of many kinds are reduced. If older people come to seek less from any possible job, then comparative assessments of their own position relative to other possibilities will give rise to more positive feelings about their own job. Clark and Oswald (1993) have provided evidence that this comparative process operates in relation to a person’s income. However, it is extremely difficult to study such comparisons in respect of other job characteristics, which are less open to objective measurement.
Another possible explanation of the positive age gradient in occupa- tional well-being after medium ages is in terms of cohort differences; perhaps the members of older generations in a study have always been more satisfied with their jobs. In order to examine that possibility directly, it is desirable to compare individuals or surveys over a period of years. Such comparisons are not possible in conventional cross-sectional invest- igations, but in sequential comparisons the evidence for cohort differences in job satisfaction is not strong (Glenn & Weaver, 1985; Janson & Martin, 1982).
368 BIRDI, WARR, OSWALD
Prediction Three: Different Contributors to Different Components of Well-being
A third issue investigated here was the relative contribution of different variables in relation to the age effects for each aspect of well-being. As predicted, a differential pattern was observed, with age-related job satis- faction being associated with the widest range of job and personal features, contributions to job stress being particularly in terms of extrinsic demands, and job boredom being linked to employment commitment and intrinsic job rewards.
Further investigations into this issue should examine variables that might have special relevance to feelings of job stress. The R-squared value in Table 3 after inclusion of all the current predictors is only 0.17. This comparcs with 0.36 for overall job satisfaction in Table 2, which is itself very similar to the final R-squared of 0.34 obtained for job satisfaction by Kalleberg and Loscocco (1983). Feelings of stress are known to be strongly predicted by levels of job demand and role overload (e.g. Warr, 1990b), and the inclusion of more explicit measures of those job features is likely to increase the R-squared value for that aspect of well-being.
Other Issues
This study has contributed to knowledge in this area in several ways. For example, curvilinearity has been demonstrated for overall job satisfaction and job stress, with positive and zero linear age effects respectively. On the other hand, the negative association of job boredom with age has been shown to be merely linear. Job characteristics and work values have been confirmed as significant influences on the age distribution of job satis- faction, job characteristics were found to be important for job stress, but age differences in job boredom were less affected by the current set of control variables. The findings underline the importance of examining separately the correlates of different aspects of well-being. Not only do age-patterns vary between components of well-being, but the job and per- sonal contributors to those patterns also depend on which component is being examined.
Additional job characteristics, such as variety or underload, may be more important to boredom than are some of the job factors examined here. This draws attention to a limitation of the present study. Using data gathered in an earlier survey, we have necessarily been restricted to the measures and samples selected by the original investigators. As outlined in the Introduction. research in this field has gained a great deal by the use of previous surveys, but such an approach has some inherent limita- tions. For example. the investigation used single-item measures of well- being. This procedure has been widely adopted in survey investigations,
EMPLOYEE WELL-BEING 369
in order to reduce the load on respondents, but questions might be raised about measurement reliability and validity. Our view is that, although multi-item scales are in principle more desirable, the evidence in support of single-item measures is by now extremely strong.
Single-item indicators of overall job satisfaction have been used extens- ively in many countries over many years, and findings have been shown to be extremely stable and reproducible (e.g. Scarpello & Campbell, 1983; Weaver, 1980). Considerable validity evidence is available, of three kinds. First, research has shown that single-item measures of affect are signific- antly associated with multi-item indicators of the same construct. For example, Warr, Cook, and Wall (1979) reported a correlation of 0.70 with a 15-item scale of overall job satisfaction, and this pattern has also been found in studies by Judge, Boudreau, and Bretz (1994), Larson, Diener, and Ammons (1985), and Scarpello and Campbell (1983).
Second, interrelationships between different one-item measures of well- being are regularly consistent with theoretical expectations. For instance, in the present study the one-item measures of job satisfaction and job boredom are more strongly intercorrelated with each other than with job stress, as expected and found in respect of multi-item measures (Warr, 1990b). Third, associations with job and other factors are found to be similar in studies using multi-item and single-item measures (e.g. Scarpello & Campbell, 1983). Many illustrations of expected relationships observed with single-item measures of well-being can be found in the Appendix. For example, relevant job characteristics are significantly associated with each of the components of well-being. In addition, supervisors in this sample report both higher and lower job well-being, depending on the axis of measurement (more satisfaction but also more stress); this differentiated pattern is consistent with theoretical expectations and is also found for multi-item indicators (Warr, 1990a), We therefore conclude that the measures of well-being used here are acceptable in the circumstances of a large-scale survey investigation.
Finally, the meaning of chronological age needs to be unpacked further in future research. Age differences in occupational well-being are of course not caused by chronological age itself. A person’s age serves as an indicator for physiological, psychological, and social factors. For example, different life-stages are reflected in family and parental status, and in the phases of a person’s employment (e.g. Morrow & McElroy, 1987). Those have been examined empirically in this investigation, through the inclusion of vari- ables considered to be of potential explanatory importance.
Recognising that chronological age itself has no explanatory value, research has been of two kinds. The most common approach (adopted here) is to examine age as a continuous variable which might be shown to be important through other factors such as those described earlier. A
370 BIRDI, WARR, OSWALD
second perspective is in terms of differences in individuals' life-stage or career-stage. For example, Kacmar and Ferris (1989) have proposed that career-stage models that suggest a U-shape may be more concerned with extrinsic forms of job satisfaction. whereas those models indicating a linear form may relate better to intrinsic satisfaction. Their rationale is that most sources of extrinsic satisfaction are controlled by the organisation, whereas intrinsic sources are controlled more by the individual and hence are more stable over time.
A related pattern was obsened here. It was proposed that stressful feelings may be seen largely as an affective reaction to extrinsic com- ponents, and the age-stress relationship was indeed U-shaped. Boredom was considered to be more influenced by intrinsic factors, and that aspect of well-being did indeed show a linear relationship. Finally, both intrinsic and extrinsic components were thought to have an impact on job satis- faction, perhaps explaining the positive, curvilinear, relationship with age.
Vondracek, Lerner, and Schulenberg (1986) have also adopted a life- stage approach, in terms of developmental contextualism, which views indi- vidual development and contextual features as mutually interdependent. In these terms it is appropriate to examine age differences through specific normative and non-normative events across a person's life-span. Develop- ments in that type of approach would clearly be valuable in complementing the present analyses in terms of age as a continuous variable.
Manuscript received February 1994 Revised manuscript received December 1994
REFERENCES Arnold, J.. Robertson, 1.T.. & Cooper, C.L. (1991). Work psychology. London: Pitman
Publishing. Borg, I . (1990). Multiple facetisations of work values. Applied Psychology: A n Inrernalional
Review. 39, 401412. Clark, A.E.. & Oswald, A.J. (1993). Satisfaction and comparison income. Centre for
Economic Performance, London School of Economics: Working Paper No. 367. Clark, A.E.. Oswald, A.J. , & Warr, P.B. (1995). Is job satisfaction U-shaped in age?
Journal of Occupational and Organizational Psychology, in press. Cohen. J . . & Cohen. P . (1983). Applied multiple regressionlcorrelation analysis for the
behavioral sciences (2nd Edn.). Hillsdale, NJ: Lawrence Erlbaum Associates Inc. Curtice, J . (1993). Satisfying work-if you can get it. In R. Jowell, L. Brook, L. Dowds, &
D. Ahrendt (Eds.), Inrernarional social alritudes and the tenth BSA reporr. London: Dartmouth Publishing.
Dawis, R.V. & Lofquist, L.H. (1984). A psychological theory of work adjustment. Minneapolis: University of Minnesota Press.
Decker, P.J., & Borgen, F.H. (1993). Dimensions of work appraisal: Stress, strain, coping, job satisfaction, and negative affectivity. Journal of Counselling Psychology, 40,470478.
de Vaus, D . , & McAllister, 1. (1991). Gender and work orientation: Values and satisfaction in Western Europe. Work and Occupations, 18, 72-93.
EMPLOYEE WELL-BEING 371
Doering, M., Rhodes, S.R., & Schuster, M. (1983). The aging worker. Beverly Hills, CA:
Eysenck, H.J. (1987). Personality and aging: An exploratory analysis. Journal of Social
Fisher, C.D. (1993). Boredom at work: A neglected concept. Human Relations, 46,395-417. Glenn, N.D., Taylor, P.A., & Weaver, C.D. (1977). Age and job satisfaction among males
and females: A multivariate, multisurvey study. Journal of Applied Psychology, 62,
Glenn, N.D., & Weaver, C.N. (1985). Age, cohort, and reported job satisfaction in t h e United States. In Z.S. Blau (Ed.), Current perspecrives on aging and rhe life-cycle (pp.89-109). Greenwich, CT: JAI Press.
Herzberg, F.I., Mausdner, B., Peterson, R.O., & Capwell, D.R. (1957). Job attitudes: Review of research and opinion. Pittsburgh: Psychological Service of Pittsburgh.
Hurlbert, J.S. (1991). Social networks, social circles and job satisfaction. Work and Occupa- tions, 18, 415430.
Janson, P., & Martin, J.K. (1982). Job satisfaction and age: A test of two views. Social Forces, 60, 1089-1102.
Judge, T.A., Boudreau, J.W., & Bretz, R.D. (1994). Job and life attitudes of male executives. Journal of Applied Psychology, 79, 767-782.
Kacmar, K.M., & Fems, G.R. (1989). Theoretical and methodological considerations in the age-job satisfaction relationship. Journal of Applied Psychology, 74, 201-207.
Kahn, R.L., & Byosierc,P. (1992). Stressinorganizations. 1nM.D. Dunnette&L.M. Hough (Eds.), Handbook of industrial and organizationalpsychology, Vol. 3 (pp.571450). Palo Alto, CA: Consulting Psychologists Press.
Kalleberg, A.L., & Loscocco, K.A. (1983). Aging, values and rewards: Explaining age differences in job satisfaction. American Sociological Review, 48, 78-90.
Larson, R.L., Diener, E., & Emmons, R.A. (1985). An evaluation of subjective well-being measures. Social Indicators Research, 17, 1-18.
Mabey, C. (1986). Graduates info industry. Hampshire, UK: Gower. Morrow, P.C., & McElroy, J.C. (1987). Work commitment and job satisfaction over three
Mottaz, C.J. (1987). Age and work satisfaction. Work and Occupations, 14, 387-409. O’Brien, G.E., & Dowling, P. (1981). Age and job satisfaction. Australian Psychologist, 16,
Russell, J.A. (1980). A circumplex model of affect. Journalof Personality and Social Psycho-
Scarpello, V., & Campbell, J.P. (1983). Job satisfaction: Are the parts all there? Personnel
Vondracek, F.W., Lerner, R.M., & Schulenberg, J.E. (1986). Career development: A life-
Warr, P.B. (1987). Work, unemployment, and mental health. Oxford: Oxford University
Warr, P.B. (1990a). The measurement of well-being and other aspects of mental health.
Warr, P.B. (1990b). Decision latitude, job demands, and employee well-being. Work and
Warr, P.B. (1992). Age and occupational well-being. Psychology and Aging, 7, 3745 . Warr, P.B. (1994). A conceptual framework for the study of work and mental health. Work
Warr, P.B., Banks, M.H., & Jackson, P.R. (1988). Unemployment and mental health:
Sage.
Behavior and Personality, 3 , 11-21.
189-1 93.
career stages. Journal of Vocational Behavior, 30, 330-346.
49-61.
logy, 39, 1161-1178.
Psychology, 36, 577400.
span developmental approach. Hillsdale, NJ: Lawrence Erlbaum Associates Inc.
Press.
Journal of Occupational Psychology, 63, 19S210.
Stress, 4, 285-294.
and Stress, 8. 84-97.
Some British studies. Journal of Social Issues, 44, 47-68.
372 BIRDI, WARR, OSWALD
Warr. P.B.. Cook, J .D. . & Wall, T.D. (1979). Scales for the measurement of some work attitudes and aspects of psychological well-being. Journal of Occupational f'sychology,
Weaver, C .N. (1980). Job satisfaction in the United States in the 1970s. Journal of Applied Psychology, 65, 364-367.
Weinberg, S.L., & Tittle, C.K. (1987). Congruence of real and ideal job characteristics: A focus on sex. parenthood status and extrinsic characteristics. Journal of Vocational Behaviour. 30. 227-239.
Wright. J.D.. & Hamilton, R.F. (1978). Work satisfaction and age: Some evidence for the "job change" hypothesis. Social Forca, 56, 1140-1 158.
52, 129-148.
APPE NDlX
Correlation Matrix of Well-being, Job-related, a n d Individual Variables ( N = 3664)
Mean SD I 1 3 4 5 6 7 8
I 0Verdl)ob satisfaction
2. Feelingsof johstress
3. Feelings of job horedom
4 . Age (centred) 5 . Age-squared 6. Gender:
female 7 Married 8. Lengthof
education Y Supervisor
10. Working hours I I . Actual income 12. Job rewards-
Intrinsic 13. Job reward+
Extrinsic 14. Poor work
conditions 15 Work
relationships 16. Employment
commitment I7 Work values-
lntnnsic 18. Work values-
Extrinsic
5 28
? 16
1 86 0 0 0
128 25
I 36 1 63
1 94 I 35
41 16 0 02
3 72
2 98
199
400
3 05
3 91
3 89
1 0 8
0 95 -13"
0 9 3 -36" I I 32 08" 33 37 05"
0 4 8 05" 0 48 03
0 85 00 0 48 08" 8 67 02 099 10"
0 76 32"
0 63 36"
0 95 -17"
0 70 47"
I I2 14"
0 6 7 11''
050 -04
04 03
-09"
02 06"
08" 13" 12" 1 5 "
09'
-06'.
2,)"
-14"
-02
(N'
08"
- 14" - 02
-08" -09"
03 -06"
02 -11"
-25"
-15"
14"
-23"
-11"
- 12"
02
24' *
-12" 01 38" -18"
-12" -14" 15" -09"
-03 -02 30" -17"
09' 00
-06" -02
-04 -03
00 07"
19" 13"
07" 02
-06" - 02
- 18"
06' -14" -21" -33"
06'.
- 03
-24"
0.5'.
-06'
10"
03
-07" 14" 01 25"
06"
- 02
04
- 02
05"
02
- 02
16" 01 27"
12"
10"
-13"
-08"
-15"
- 02
-11"
Correlation Matrix of Well-being, Job-related, and Individual Variables (N = 3664) (continued)
9 10 I 1 I2 13 14 IS 16 17
I . Overall job satisfaction
2. Feelings of job stress
3. Feelings of job boredom
4 . Age (centred) 5. Age-squared 6. Gender:
female 7. Married 8. Lengthof
education 9. Supervisor
10. Working hours 14" 1 I . Actual income 37" 18" 12. Job rewards-
13. Job rewards-
14. Poorwork
15. Work
16. Employment
17. Work values-
18. Work values-
Intrinsic 16" 02 13"
Extrinsic 10" 01 219. 2s-
conditions -02 07.' 00 -03 -14.'
relationships 02 -03 -01 20" 22.. -22"
commitment 02 -02 -02 11'. 04" 02 11"
Intrinsic 02 02 -02 %** 11'. 04 07" 12"
Extrinsic -05" 02 -05" 02 16" 04 -02 01 31"
" P < 0.01.
373