Embed Size (px)
Citation preview
. .
EconomicLives ofExistingNuclear
Plants 3
A11 power plants, nuclear and non-nuclear, will eventuallybe retired. Each nuclear plant’s economic performance(i.e., the cost of producing electricity while meetingNuclear Regulatory Commission (NRC) and other
safety requirements) plays a prominent role in plant lifedecisions. The cost and availability of alternative resources isalso critical. Both the economic performance of nuclear plantsand the cost of alternatives are debated, changing, and highlydiverse. For this reason, economic life decisions are likely to bedetermined over time, as individual conditions change based ona host of separate decisions by utilities, State utility commis-sions, and Federal regulators. The cost of managing aging, whilepotentially large for some plants, is only one aspect of economiclife decisions.
This chapter examines economic issues related to nuclearpower plants. The discussion centers on the following:■ the changing context of the electric utility industry as it
relates to nuclear plant life decisions,■ institutions involved and their roles in evaluating the
economic lives for existing nuclear plants,■ the economic performance of existing nuclear plants, and■ some factors affecting future nuclear plant cost and perform-
ance.
THE CHANGING ELECTRIC UTILITY CONTEXTThe electric utility industry is evolving rapidly. Pressures for
change started two decades ago with widely fluctuating fuelprices, plummeting demand growth, hefty increases in theconstruction costs of large power plants, and increased attentionto the environmental impacts of electricity generation. Morerecently, supply competition and utility energy efficiency effortshave increased markedly. These changes have reduced some of
I 73
74 I Aging Nuclear Power Plants: Managing Plant Life and Decommissioning
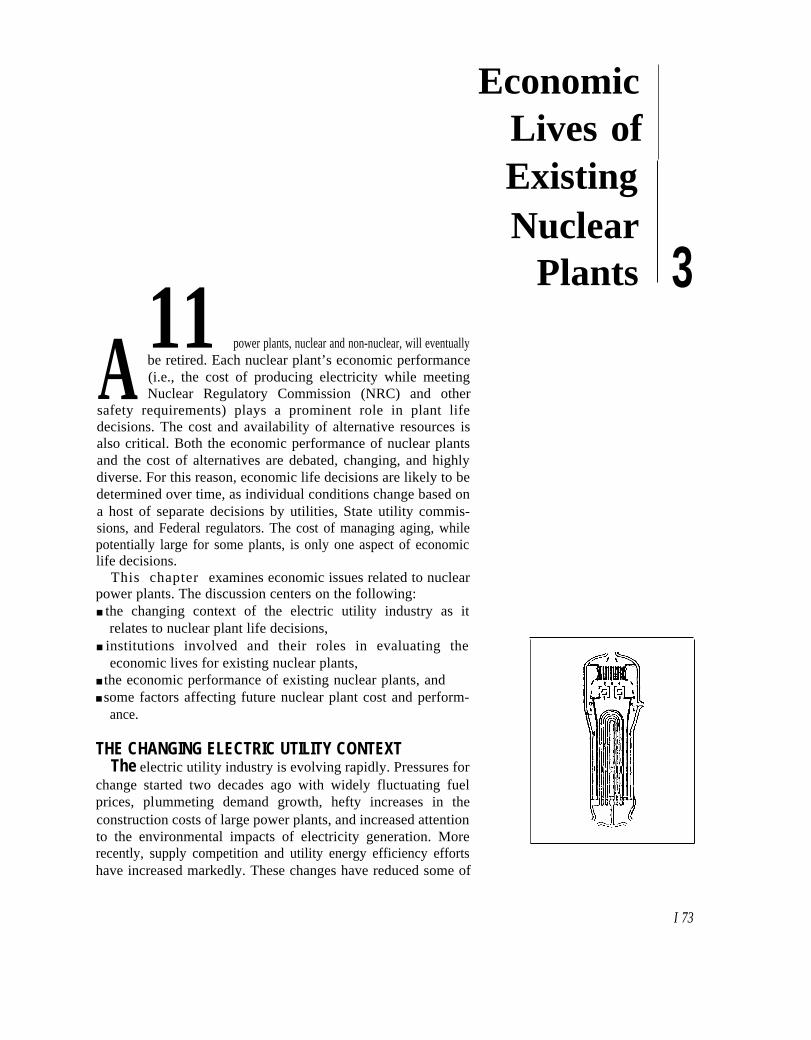
Figure 3-l—Electric Regions
Western Systems Mid-Continent AreaCoordinating Council Power Pool (MAPP)(WSCC)/ /
in the Contiguous United States
Mld-AmericaInterconnectedNetwork (MAIN)
<— Northeast Power
Coordinating Coun(NPCC)
Mid-Atlantic Area Council (M
Reliability Council(SERC)
(ERCOT)- \ J+\ .
Southwest Power ‘-”Pool (SPP)
SOURCE: U.S. Congress, Office of Technology Assessment, E/ecttic Power Wheeling and Dealing:Competition, OTA-409 (Washington, DC: U.S. Government Printing O!fice, May 1989), p. 159.
Twhnologid Considerations for Increasing
the costs of replacement power, placing addi-tional economic pressures on existing nuclear andnon-nuclear plants. Increasingly, utilities andtheir economic regulators are engaging in elabo-rate economic analyses and planning effortsknown as integrated resource planning (IRP) orleast-cost planning (LCP). The growing use ofIRP both addresses and contributes to the chang-ing utility context, as discussed later.
In addition to change, electric market condi-tions across the Nation are diverse. The electricpower industry nationwide is subdivided by thenine regions of the North American ElectricReliability Council (NERC) (see figure 3-l), each
comprised of many individual, but intercon-nected, utilities that often form separate powerpools.1 The U.S. electric power industry is adiverse and complex arrangement of investor-andconsumer-owned utilities, government agencies,and independent power producers. Regional dif-ferences in generation reserve margins, fuel mix,and load growth reflect differing patterns ofpopulation, climate, economic activities, and thehistory of utility policy and regulation. Oneoverall indicator of these differences is the rangeof regional values for replacement power, whichvary widely across the country (see figure 3-2).2
[cil
AAC)
‘ U.S. Congress, (3ft3ce of ‘lkchnology Assessmen4 Electric Power Wheeling and Dealing: Technological Considerations for IncreasedCompetition, OTA-E409 (Washington DC: U.S. Government Printing Office, May 1989), ch. 6.
Z J.C. Mm Kuiken et al., Replacement Energy Costs for Nuclear Elecrriciry-Generating Units, NUREG/CR-4012 (Washington DC: U.S.Nuclear Regulatory Commission October 1992).
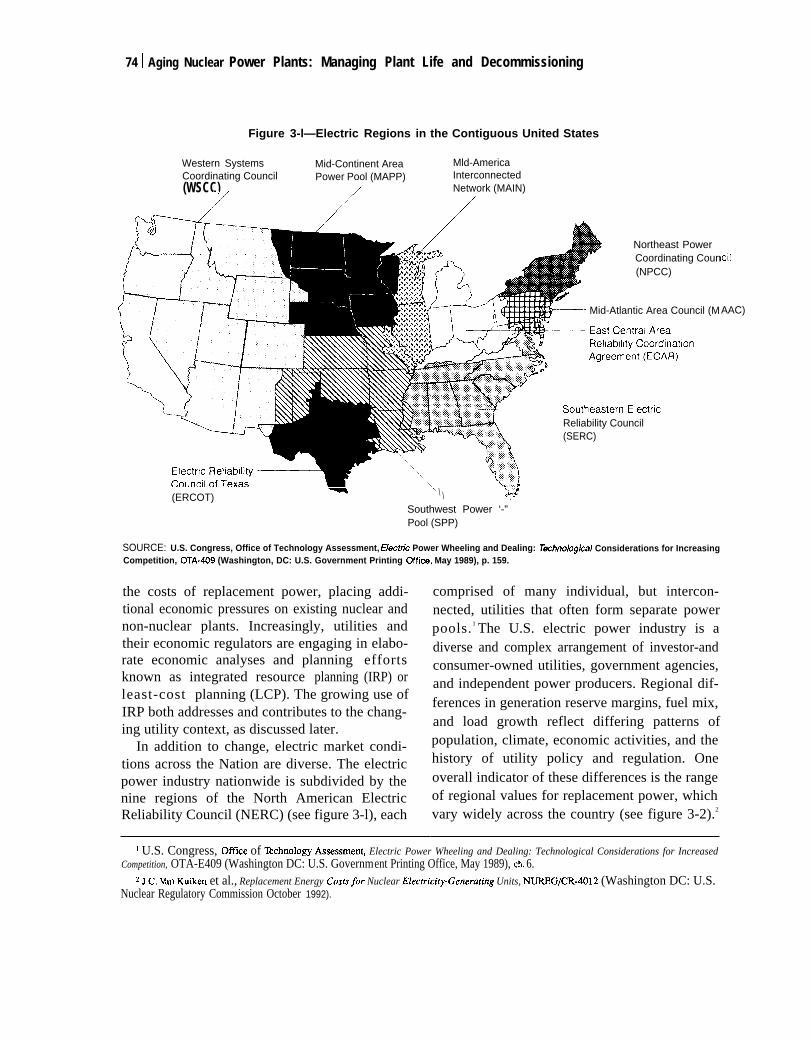
Figure 3-2—Diversity in Replacement EnergyCosts for Nuclear Power Within and
Among Regions, 1992
Chapter 3-Economic Lives of Existing Nuclear Plants 175
_ Plant with lowest replacement ~energy costs in region
~ Plant with highest replace-ment energy costs in region
r-l
ECAR ERCOT MAAC MAIN MAPP NPCC SERC SPP WSCC
NOTE: These are estimated replacement energy costs for short-termnuclear plant outages for 1992.
SOURCE: J.C. Van Kuiken et al., Flep/acernent Energy Costs forNuclear Electricity Generating Units, NUREG CR-4012 (Washington,DC: U.S. Nuclear Regulatory Commission, October 1992), pp. 79-190.
These diverse factors can contribute to differingprospects for existing nuclear plants.
As shown in figure 3-3, the use of nuclearpower differs greatly among U.S. regions. Forexample, in 1991, nuclear power supplied about77 percent of the electricity in the CommonwealthEdison Co. (CECO) subregion of the NERCMid-American Interconnected Network.3 By con-trast, there are no operating nuclear power plantsin the Rocky Mountain Power Area subregion ofthe NERC Western System Coordinating Council.
~ Electricity Demand and Capacity MarginsSlack electricity demand and surplus generat-
ing capacity have been among the factors noted in
Figure 3-3—U.S. Regional ElectricitySupplies by Fuel, 1991
~ Other _ Hydro
D Oil/gas ~ Coal
m Nuclear
ECAR ERCOT MAAC MAIN MAPP NPCC SERC SPP WSCC
SOURCE: North American Electric Reliability Council, .EIecfrkity Sup-ply and Demand 1992-2001 (Princeton, NJ: NERC, June 1992), pp.44-60.
some nuclear power plant early retirement analy-ses. For example, owners of the retired YankeeRowe plant noted that a regional recession turneda capacity constrained situation into one of excesscapacity, reducing the need for the plant. Simi-larly, Niagara Mohawk’s 1992 analysis of theNine Mile Point Unit 1 plant indicated for the firsttime that early retirement might be economic, inlarge part due to a substantially higher forecast ofthe amount of non-utility generation available.4
However, that forecast is uncertain and based ona now-repealed State law that provided a strongeconomic incentive to non-utility generators. Inthe case of the New York Power Authority’s(NYPA) Fitzpatrick plant, NYPA’s chairmannoted that a planned non-utility generator wasuneconomical and unnecessary, but if developed,
J North American Electric Reliability Council, E/ectriciry Supp/y & Demand 1992-2001 (Princetom NJ: June 1992), pp. 44,46.A Niagara MohawlG ‘‘Economic Analysis of Continued Operation of the Nine MiJe Point Unit 1 Nuclear Statio%’ Nov. 20, 1992; and R.R.
Zuercher, “Nine MiIe Point-1 May Be Next to Fatl to Unfavorable Nuclear Economics,” Nucleortics Week, vol. 33, No. 49, Dec. 3, 1992, pp.1, 14-15.
76 I Aging Nuclear Power Plants: Managing Plant Life and Decommissioning
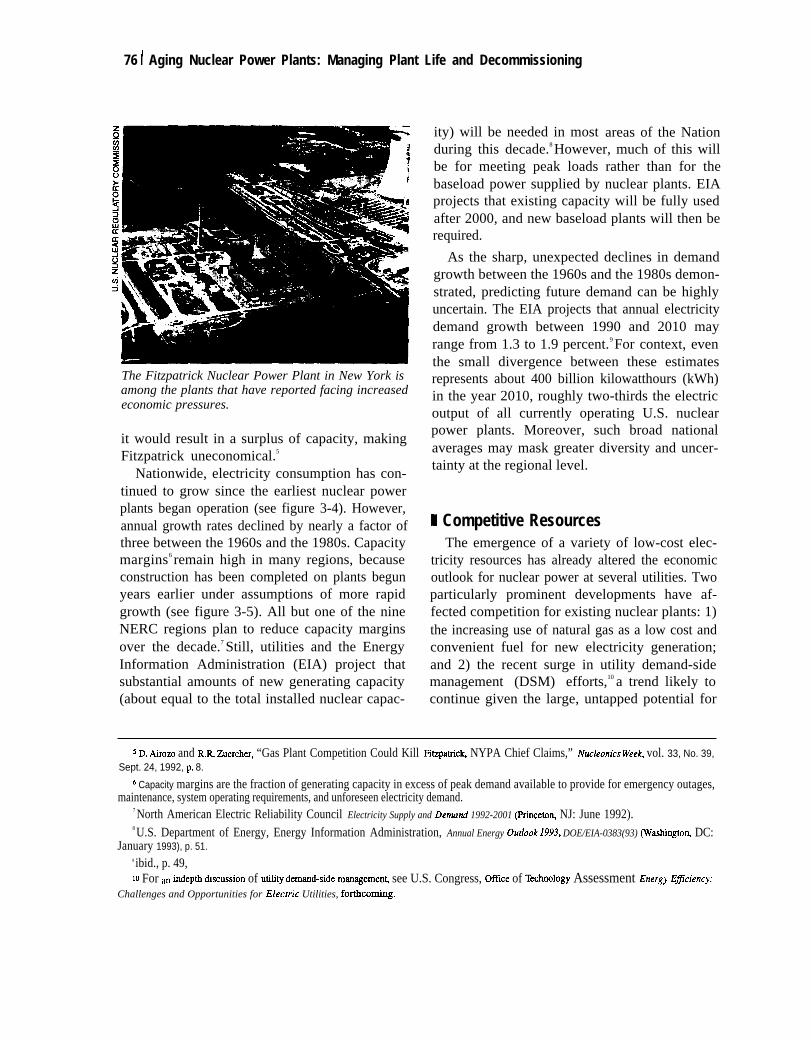
The Fitzpatrick Nuclear Power Plant in New York isamong the plants that have reported facing increasedeconomic pressures.
it would result in a surplus of capacity, makingFitzpatrick uneconomical.5
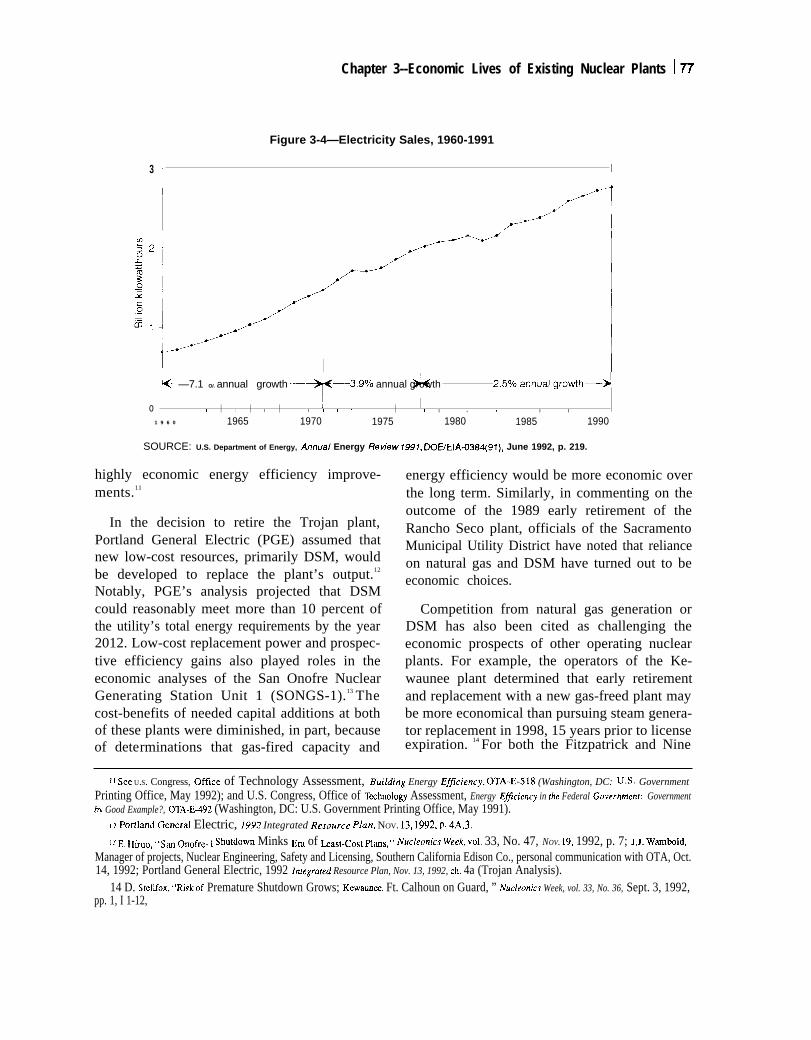
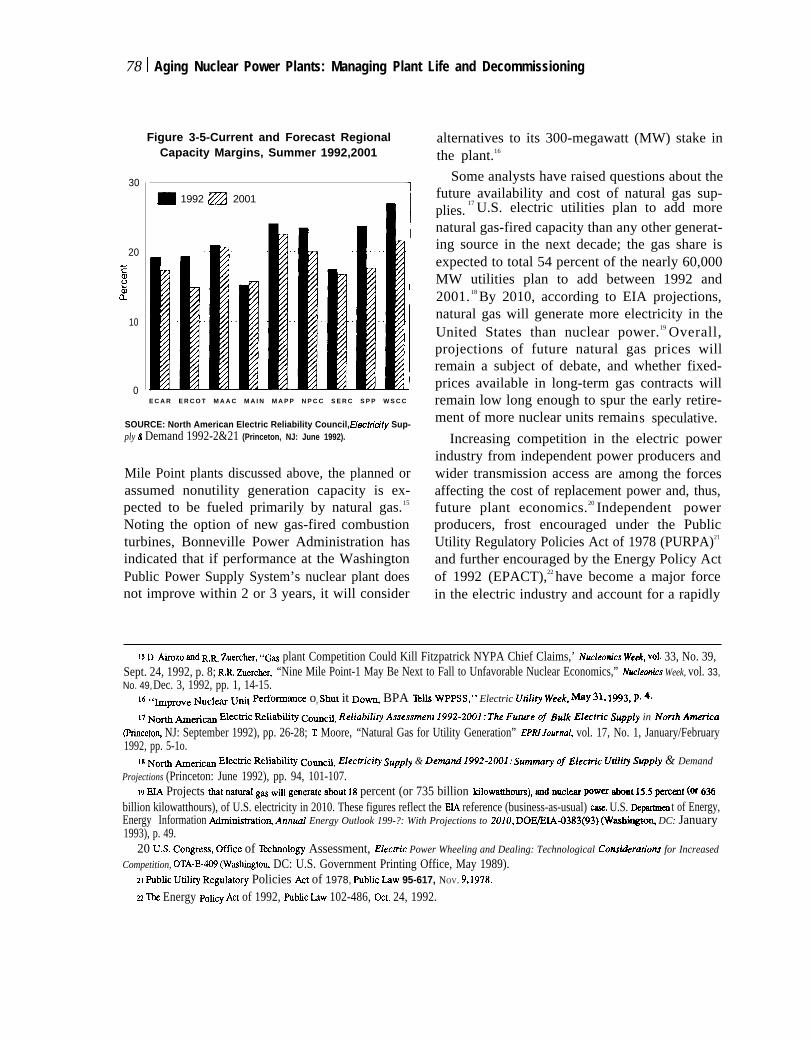
Nationwide, electricity consumption has con-tinued to grow since the earliest nuclear powerplants began operation (see figure 3-4). However,annual growth rates declined by nearly a factor ofthree between the 1960s and the 1980s. Capacitymargins6 remain high in many regions, becauseconstruction has been completed on plants begunyears earlier under assumptions of more rapidgrowth (see figure 3-5). All but one of the nineNERC regions plan to reduce capacity marginsover the decade.7 Still, utilities and the EnergyInformation Administration (EIA) project thatsubstantial amounts of new generating capacity(about equal to the total installed nuclear capac-
ity) will be needed in most areas of the Nationduring this decade.8 However, much of this willbe for meeting peak loads rather than for thebaseload power supplied by nuclear plants. EIAprojects that existing capacity will be fully usedafter 2000, and new baseload plants will then berequired.
As the sharp, unexpected declines in demandgrowth between the 1960s and the 1980s demon-strated, predicting future demand can be highlyuncertain. The EIA projects that annual electricitydemand growth between 1990 and 2010 mayrange from 1.3 to 1.9 percent.9 For context, eventhe small divergence between these estimatesrepresents about 400 billion kilowatthours (kWh)in the year 2010, roughly two-thirds the electricoutput of all currently operating U.S. nuclearpower plants. Moreover, such broad nationalaverages may mask greater diversity and uncer-tainty at the regional level.
B Competitive ResourcesThe emergence of a variety of low-cost elec-
tricity resources has already altered the economicoutlook for nuclear power at several utilities. Twoparticularly prominent developments have af-fected competition for existing nuclear plants: 1)the increasing use of natural gas as a low cost andconvenient fuel for new electricity generation;and 2) the recent surge in utility demand-sidemanagement (DSM) efforts,10 a trend likely tocontinue given the large, untapped potential for
SD. Airozo and R.R. Zuercher, “Gas Plant Competition Could Kill Fitzpatrick NYPA Chief Claims,” Nucleonics ~eek, vol. 33, No. 39,Sept. 24, 1992, p. 8.
s Capacity margins are the fraction of generating capacity in excess of peak demand available to provide for emergency outages,maintenance, system operating requirements, and unforeseen electricity demand.
7 North American Electric Reliability Council Electricity Supply and Demund 1992-2001 (Princetou NJ: June 1992).8 U.S. Department of Energy, Energy Information Administration, Annual Energy Out/ook 1993, DOE/EIA-0383(93) (WashingtorL DC:
January 1993), p. 51.9 ibid., p. 49,10 For ~ ~dep~ &scussion of UUlity demmd-side management see U.S. Congress, Office of lkchnology Assessment 10m8Y Efickncy:
Challenges and Opportunities for Elecm”c Utilities, forthmming.
Chapter 3--Economic Lives of Existing Nuclear Plants 177
Figure 3-4—Electricity Sales, 1960-1991
3
I
I
/1
Y. —7.1 O/. annual growth+ ~ 2’0’Oann”a’grOMh-J
3.9Y0 annual growth
o ) I I 1 I r I I I 1 1 ! 1 1 1 1 I 1 ) I 1 , I ! 1 ) I I
1 9 6 0 1965 1970 1975 1980 1985 1990
SOURCE: U.S. Department of Energy, Annual Energy Review 7991, DOHEIA-0384(91), June 1992, p. 219.
highly economic energy efficiency improve-ments.11
In the decision to retire the Trojan plant,Portland General Electric (PGE) assumed thatnew low-cost resources, primarily DSM, wouldbe developed to replace the plant’s output.12
Notably, PGE’s analysis projected that DSMcould reasonably meet more than 10 percent ofthe utility’s total energy requirements by the year2012. Low-cost replacement power and prospec-tive efficiency gains also played roles in theeconomic analyses of the San Onofre NuclearGenerating Station Unit 1 (SONGS-1).13 Thecost-benefits of needed capital additions at bothof these plants were diminished, in part, becauseof determinations that gas-fired capacity and
energy efficiency would be more economic overthe long term. Similarly, in commenting on theoutcome of the 1989 early retirement of theRancho Seco plant, officials of the SacramentoMunicipal Utility District have noted that relianceon natural gas and DSM have turned out to beeconomic choices.
Competition from natural gas generation orDSM has also been cited as challenging theeconomic prospects of other operating nuclearplants. For example, the operators of the Ke-waunee plant determined that early retirementand replacement with a new gas-freed plant maybe more economical than pursuing steam genera-tor replacement in 1998, 15 years prior to licenseexpiration. 14 For both the Fitzpatrick and Nine
11 See U.S. Congress, Office of Technology Assessment, Building Energy Eficiency, OTA-E-518 (Washington, DC: U.S. GovernmentPrinting Office, May 1992); and U.S. Congress, Office of lkchnology Assessment, Energy Eficiency in the Federal Government: Governmentby Good Example?, OTA-E-492 (Washington, DC: U.S. Government Printing Office, May 1991).
[Z portland Gener~ Electric, 1992 Integrated Re.rource Plan, NOV. 12, 1992, p. 4A.3.
IS E Hfio, ~ $Sm onofre- 1 Shutdom Minks Era of ~ast.cost plans,” Nuc/eonics Weejq VO1. 33, No. 47, NOV. 19, 1992, p. 7; J.J. Wambld,Manager of projects, Nuclear Engineering, Safety and Licensing, Southern California Edison Co., personal communication with OTA, Oct.14, 1992; Portland General Electric, 1992 lntegrafed Resource Plan, Nov. 13, 1992, ch. 4a (Trojan Analysis).
14 D. Stellfox, “Riskof Premature Shutdown Grows; Kewaunee, Ft. Calhoun on Guard, ” Nucleonics Week, vol. 33, No. 36, Sept. 3, 1992,pp. 1, I 1-12,
78 I Aging Nuclear Power Plants: Managing Plant Life and Decommissioning
30
20
Eg
2
10
0
Figure 3-5-Current and Forecast RegionalCapacity Margins, Summer 1992,2001
_ 1992 ~ 2001
E C A R E R C O T M A A C M A I N M A P P N P C C S E R C S P P W S C C
SOURCE: North American Electric Reliability Council, Hectriuty Sup-ply & Demand 1992-2&21 (Princeton, NJ: June 1992).
Mile Point plants discussed above, the planned orassumed nonutility generation capacity is ex-pected to be fueled primarily by natural gas.15
Noting the option of new gas-fired combustionturbines, Bonneville Power Administration hasindicated that if performance at the WashingtonPublic Power Supply System’s nuclear plant doesnot improve within 2 or 3 years, it will consider
alternatives to its 300-megawatt (MW) stake inthe plant.16
Some analysts have raised questions about thefuture availability and cost of natural gas sup-plies.
17 U.S. electric utilities plan to add morenatural gas-fired capacity than any other generat-ing source in the next decade; the gas share isexpected to total 54 percent of the nearly 60,000MW utilities plan to add between 1992 and2001. 18 By 2010, according to EIA projections,natural gas will generate more electricity in theUnited States than nuclear power.19 Overall,projections of future natural gas prices willremain a subject of debate, and whether fixed-prices available in long-term gas contracts willremain low long enough to spur the early retire-ment of more nuclear units remains speculative.
Increasing competition in the electric powerindustry from independent power producers andwider transmission access are among the forcesaffecting the cost of replacement power and, thus,future plant economics.20 Independent powerproducers, frost encouraged under the PublicUtility Regulatory Policies Act of 1978 (PURPA)21
and further encouraged by the Energy Policy Actof 1992 (EPACT),22 have become a major forcein the electric industry and account for a rapidly
15 D. ~ozo ad R.R. Zuercher, “Gas plant Competition Could Kill Fitzpatrick NYPA Chief Claims,’ Nucleonics Wed, VO1. 33, No. 39,Sept. 24, 1992, p. 8; R.R. Zuercher, “Nine Mile Point-1 May Be Next to Fall to Unfavorable Nuclear Economics,” Nwleonics Week, vol. 33,No. 49, Dec. 3, 1992, pp. 1, 14-15.
lb ~thprove NUCIW Ufit pefiomace or Shut it DOW BPA ‘lklls WPPSS,” Electric utility Week, MY 31) l~3J P“ 4“17 NO* ~~m El~~c Refiabili~ co~cil, Relia&li~ Assess~nt 1$)$)2-2001”: The Fufure of Bulk JHeefric supply in No~h Am”ca
(Princetoq NJ: September 1992), pp. 26-28; T Moore, “Natural Gas for Utility Generation” EPRIJournal, vol. 17, No. 1, January/February1992, pp. 5-1o.
16 NOW ~~ca Elec~c Reliabfiity Council, Elec.~ici~ Supply & De~nd ]$)gz-z~l: Sm)))q of Electric utility Supply & Demand
Projections (Princeton: June 1992), pp. 94, 101-107.19 EM Projects tit na~~ gm w gen~te about 18 percent (or 735 billion kilowatthours), ~d nUCletU pow= but 15.5 pem~t (or 636
billion kilowatthours), of U.S. electricity in 2010. These figures reflect the EIA reference (business-as-usual) case. U.S. Departmen t of Energy,Energy Information AdministratioRAnnual Energy Outlook 199-?: With Projections to 20)0, DOQEIA-0383(93) (Washington+ DC: January1993), p. 49.
20 U.S. CoWess, Offlce of I&bnOIO~ Assessment, Electric Power Wheeling and Dealing: Technological Con.rideran”ons for Increased
Competition, OTA-E-409 (Washingto~ DC: U.S. Government Printing Office, May 1989).21 pubfic u~i~ Re@atoq Policies Act of 1978, F%blic Law 95-617, NOV. g, 1%’8.
22 me Energy policy &,t of 1992, Public hW 102-486, Gd. 24, 1992.
. ——
Chapter 3-Economic Lives of Existing Nuclear Plants 179
growing share of new generation. Many States,utilities, and the Federal Energy RegulatoryCommission (FERC) have sought to promotecompetitive bidding and independent power pro-duction.
H Addressing Environmental ConcernsAs with many industrial activities, electricity
generation can cause major environmental im-pacts. Increasing attention to the environmentalimpacts of both fossil fuel combustion andnuclear generation creates a source of substantialuncertainty in future electricity markets. Withrespect to nuclear plant economics, two differenttypes of environmental impacts are relevant:
1. the environmental benefits of reducing fos-sil fuel use, and
2. the environmental costs imposed by nuclearpower plants.23
Utility IRP often includes scenarios investigatingthe impacts of such prospective environmentalcosts. In general, estimating and applying theeconomic costs associated with different types ofenvironmental impacts is highly complex, re-mains a subject of substantial debate, but is arapidly evolving field.24
Two major environmental concerns related tofossil fuel combustion may improve the relativeeconomic attractiveness of existing nuclearplants: global climate change and acid deposi-
tion. 25 All fossil fuel power plants produce carbondioxide (CO2), a gas that many experts believemay contribute to severe global climate change ifnot controlled in coming decades.26 U.S. CO2
emissions represent about 20 percent of totalannual global emissions, with electric utilitiesresponsible for about one-third of this amount. Ina recent report, OTA estimated that under presentconditions the annual carbon emissions from U.S.electrical utilities to the Nation’s total couldincrease to as much as 45 percent by 2015.27
Predicting what future efforts will be taken toaddress CO2 emissions remains speculative. How-ever, efforts to control these emissions could haveprofound impacts. For example, consider a hypo-thetical $100 per ton carbon tax, which oneCongressional Budget Office study estimatedcould potentially reduce CO2 emissions betweenzero and 25 percent from current levels over a10-year period .28 Such a tax alone would translateinto approximately $0.03/kWh for coal-firedelectric generation, more than the average opera-tional costs at existing nuclear power plants. Theprospective cost of controlling CO2 emissions isincreasingly being considered in IRP. The result-ing impacts can determine the economic attrac-tiveness of a plant. For example, in its analyses ofearly retirement for the Trojan nuclear plant, PGEexamined CO2 tax scenarios of $0, $10, and $40per ton.29 While the analyses showed that a highCO2 tax would make continued operation the
23 The NRC’S env~omen~ assessment of the ]icense renewal rule discussed the costs of continued nuclear plant operation. U.S. NuclemRegulatory Commissio~ Environmental Assessment for Final Rule on Nuclear Power Plant License Renewal, NUREG-1398, October 1991.
B see, ~-.g., Pace u~versiv Center for Env~nrnental hgal Studies, Environmental COStS of Elec~ici~ (New Yor~ ~: Oceana
Publications, 1990).25 Oher resomces, such as renewab]e energy and energy efficiency measures, do not produce COZ emissions ~d would d50 have relatively
improved economics. Natural gas and petroleum-fired generation produce about half the COZ per unit of electricity as does coal and could beaffected as well. The dominant role of coal, which supplies 55 percent of the Nation’s electricity, makes it likely that aggressive action to controlCOZ emissions would affect all aspects of the electricity market.
26 See, genera~y, J.B. smith and D. Th@c (eds.), OffIce of policY~ pl arming and EvaluatiorL U.S. Environmental Protection Agency, ThePotential Effects Of Global Climate Change On The United States, EPA-230-05-89-050 (Washington DC: December 1989).
27 U,S. Conue,s, office of Tec~oloa Assessment, c~anging by Degrees: steps to Reduce G~eenfioUse Gases, OTA-O-482 (Washingto~DC: U.S. Government Printing Office, February 1991), pp. 3, 25.
28 U,S. Con9eS5, Con9es5io~ Budget C)fflce, Carbon Charges as a Response to GIobul wa~ing: The Effects of Toing Fossil Fuels
(Washington, DC: U.S. Government Printing Office, August 1990).29 A ~ of $4,0 pfl ton of C02 1S ~UiVFdent tO a &LX of $147 per ton ‘f c
80 I Aging Nuclear Power Plants: Managing Plant Life and Decommissioning
most economic option, PGE viewed that future ashaving a low probability of occurrence.30
Fossil-fired power plants are also responsiblefor sulfur dioxide (SO2) and nitrogen oxide (NOx)emissions leading to acid deposition. SO2 emis-sions and acid rain have serious, but generallylocal or regional, effects: surface water acidifica-tion, fish losses, forest damage and decline,materials and cultural impacts, reduced visibility,and both direct and indirect human health ef-fects.31 Of the estimated 23 million tons of SO2
emitted in the United States in 1987, overtwo-thirds stemmed from electric utilities.32
Electric utilities are also responsible for aboutone-third of the 18.6 million tons of NOX emittedannually in the United States.33 The NOX controlsand SO2 emission ceilings and emissiontrading provisions of the Clean Air Act Amend-ments of 1990 (CAAA)34 may have large but stillunclear economic impacts on some existing coalplants. 35
In contrast to the environmental challenges offossil fuel combustion involving large volumes ofSO2, CO2, NOX, and coal ash, unique environ-mental challenges of nuclear plants involve rela-tively small volumes of materials with sometimeshigh levels of radioactivity. Although most of thevolume of radioactive waste from nuclear plantscontains very low levels of radioactivity, han-dling, managing, and disposing all radioactive
waste from nuclear plants can be difficult andcostly. One potential environmental cost of nu-clear plants that has been raised in IRP, inaddition to waste disposal, is the low probability,but high consequence, risk of a nuclear plantaccident. For example, as part of its IRP, PGEestimated the expected environmental costs asso-ciated with nuclear plant accidents to be betweenzero and about one-half cent per kWh.36 Thisestimate assumed that the maximum amount ofpotential damage is no more than $35 billion,several times more than the approximately $7billion liability limit set by the Price AndersonAct.37 For conservatism, PGE assumed the risk tobe 1/1000 per reactor year of operation. Othershave estimated both higher and lower expectedenvironmental costs. For example, a Pace Univer-sity Center for Environmental Legal Studiesreport estimated a cost of about 2.3 cents/kWh38,while one study for Yankee Atomic Electric Co.estimated a cost nearly three orders of magnitudeless. 39
There are other environmental impacts withless sweeping national implications that mayhave important impacts on plant economics. Allnuclear and fossil steam power plants can raisethe temperature of the local cooling water used,producing thermal plumes and altering oxygendemands, both of which can affect aquatic lifenear power facilities. For example, one analysis
so portland Gener~ Electric, 1992 Inregrared Resource Plan, NOV. 13, 1992, p. 4A.3.
31 National kid pr~ipi~tion Assessment Program, 1990 Integrated Assessment Report (Washingto~ DC: November 1991).
32 Ibid., p. 198.33 Based on an esti~te for 1985. National Acid Precipitation Assessment Program, 1989 Annual Report of the National Acid Precipitation
Assessment Program (Washington, DC: June 1990), p. F-43,34 cl~ Afi ~t ~en~ents of 1990, ~blic ~~ 101.549, Nov. 15, 1990, Tide IV,
35 U,S. Dep~ent of Ener~, Energy ~omation A-sEatio& Annul Outlook for u.S. Electric Power ]99]: Projections Through
2010, DOE/EIA-0474(91) (Washingto~ DC: July 1991), p. 25.36 III additiou other external nuclear environmental costs associated with waste diSpOSzd, mutke OpemtiOnS, and fiel mining and
processing were estimated to total about 0.15 cents/kWh. Portland General Electric, 1992 Zwegrated Resource Plan, Nov. 13, 1992,app. 7.
3742 uSC 2208 et. seq.
38 pace u~versi~ Center for Environmental Izgal Studies, Environmental COStS of Elecm”city, 1990.39 EneIgYReSWChGIOUP, ~C., ‘‘Environmental Externalities and Yankee Nuclear Power StatiorL’ November 1991, as reported in Portland
General Electric, 1992 Integrated Resource Plan Nov. 13, 1992, app. 7.
Chapter 3-Economic Lives of Existing Nuclear Plants 181
of the impact on the marine environment fromoperation of SONGS-1 estimated an economicloss of about $6 million annually.40 Coal plantsproduce vast volumes of ash, which is often lacedwith heavy metals and radionuclides. Hydro-power, the major renewable source of electricalenergy currently used in the United States, canalso have major impacts, mainly by flooding largeareas and causing perturbations in stream flows,fish migrations, water temperatures, and oxygenlevels.
INSTITUTIONAL ISSUES IN NUCLEAR PLANTECONOMIC LIFE DECISIONS
The objectives in nuclear plant life decisionsstem from broader electric power system objec-tives, including the following:
assuring adequate supplies to meet demand;minimizing the costs of electricity (including,increasingly, environmental costs);equitably treating both electricity consumersand plant owners in the recovery of costs; andincreasingly, responding to intensifying marketforces in the electric power industry.
Responsibility for the economic performance ofexisting nuclear power plants lies with the utili-ties owning and operating them.41 So, too, doesthe ultimate responsibility for economic deci-sions regarding nuclear power plant lives.
Industrywide groups such as the Nuclear Man-agement and Resources Council (NUMARC), theInstitute of Nuclear Power Operations (INPO),the Electric Power Research Institute (EPRI), andthe Edison Electric Institute (EEI) address issuesrelated to plant economies as well. For example,INPO, NUMARC, EEI, and EPRI are participat-ing in an “Industrywide Initiative’ to improvenuclear plant economic performance.4 2
NUMARC’s principal role is to identify andeliminate unnecessary or inefficient NRC regula-tory activities leading to unnecessary costs .43 EEIis helping utilities address economic regulatoryissues, including application of IRP. EPRI’sprincipal role is to assist utilities with theapplication of proven technology to reduce costsand achieve benefits in plant reliability, produc-tivity and thermal efficiency. In addition, EPRI iscontinuing its two decade research effort todevelop more economic technologies for safeoperation and maintenance (O&M) of existingnuclear power plants.44
All but about 8 of the 107 operating nuclearplants in the United States are primarily owned byinvestor-owned utilities and fall under FERC orState economic regulation.
45 For these plants,
economic decisions are typically made by theplant owners in conjunction with the respective
40 c~lfomla public uti~ties Commissio% Division of Ratepayer Advocates (CPUC DRA), ‘Report on the Cost-Effectiveness of ContinuedOperation of the San Onofre Nuclear Generating Station Unit No. l,” Investigation 89-07-004, Sept. 25, 1991. According to CPUC DRA staff,revised cost estimates of marine damage indicate that the cost is higher, on the order of $15 million annually. Robert Kinosim CPUC Divisionof Ratepayer Advocates, letter to the Office of THmology Assessment, Feb. 8, 1993.
41 NWIY IMlfof tie 108 oprating nucleti power plants are jointly owned by hvo or more utilities. The remainder are solely owned. In tot~,over 130 utilities have some share of existing plants. R.S. Wood, U.S. Nuclear Regulatory Commissio@ Owners of Nuclear Pow’er Plants,NUREG-0327, Rev. 5 (Washington, DC: July 1991). For those, economic decisions are shared by the owners.
42 { ‘EEI TO Help Nuclear Move Ahead in Changing power Marketplace, ’ Nucleonics Week, vol. 34, No. 25, June 24, 1993, pp. 1,12-13.43 Nuc]e~ -gement and ResoUces Council, Review of Operations and Maintenance Costs in the Nuclear IndustV, NUMARC 92-03
(Washington DC: December 1992), pp 54-56.44 see, ~.g,, Grove En@Wfig, kc,, ~n8.Te~ Capital planning Con~iderin8 Nuclear Plant Life-cycle Management, EPRI T’R- 101162
(Pato Alto, CA: Electric Power Research Institute, September 1992).45 Five of tie Natlon>s 108 operat~g DUCIW power plants are pubficly owed (e.g., by apubfic power authority or llllld Cooperative). ThKX
others are owned by the Iknnessee Wiley Authority (TVA), and are not subject to FERC or State economic regulation. TVA also has twopreviously operating units with full power licenses under review (Browns Ferry 1 and 3), Many public power utilities also share joint ownershipof existing nuclear plants operated by investor-owned utiiities.
82 I Aging Nuclear Power Plants: Managing Plant Life and Decommissioning
economic regulatory bodies.46 While economicregulatory activities vary greatly by State, manyStates play a strong role in promoting and applyingeconomic analyses to utility investment andretirement decisions. For example, many Statesrequire their respective utilities to perform IRP.
The public also has a role in the regulatoryactivities related to plant economics. For exam-ple, the definition of IRP in the Energy Policy Actof 1992 (EPACT) specifically requires includingpublic participation and comment in developmentof the plan.47 The public may also raise economicissues in NRC licensing actions. For example,following the request of Pacific Gas and ElectricCo. (PG&E) to extend the license expiration datesfor the Diablo Canyon nuclear plants by recaptur-ing the plants’ construction periods (see ch. 2),one public interest group and the State of Califor-nia received NRC approval to intervene in thecase. 48 The opposition was not related to plant
safety, but rather to a concern that extendedoperation would increase electricity rates andharm the State’s economy.
B Integrated Resource Planning andNuclear Plant Economic Analyses
Nearly all States that regulate nuclear utilitiesrequire IRP already and all will eventuallyconsider its use, as required by EPACT.49 EPACTalso requires the Tennessee Valley Authority toperform LCP in making resource decisions.While IRP is not necessarily directed at examin-
ing nuclear plant life decisions, it can and hasbeen. For example, PGE’s decision to retire theTrojan nuclear power plant was examined andsupported in PGE’s 1992 Integrated ResourcePlan, a planning exercise required by the OregonPublic Utilities Commission.50 Also, the NewYork Public Service Commission has requiredregulated utilities in the State to examine theeconomics of continued nuclear plant operation.51
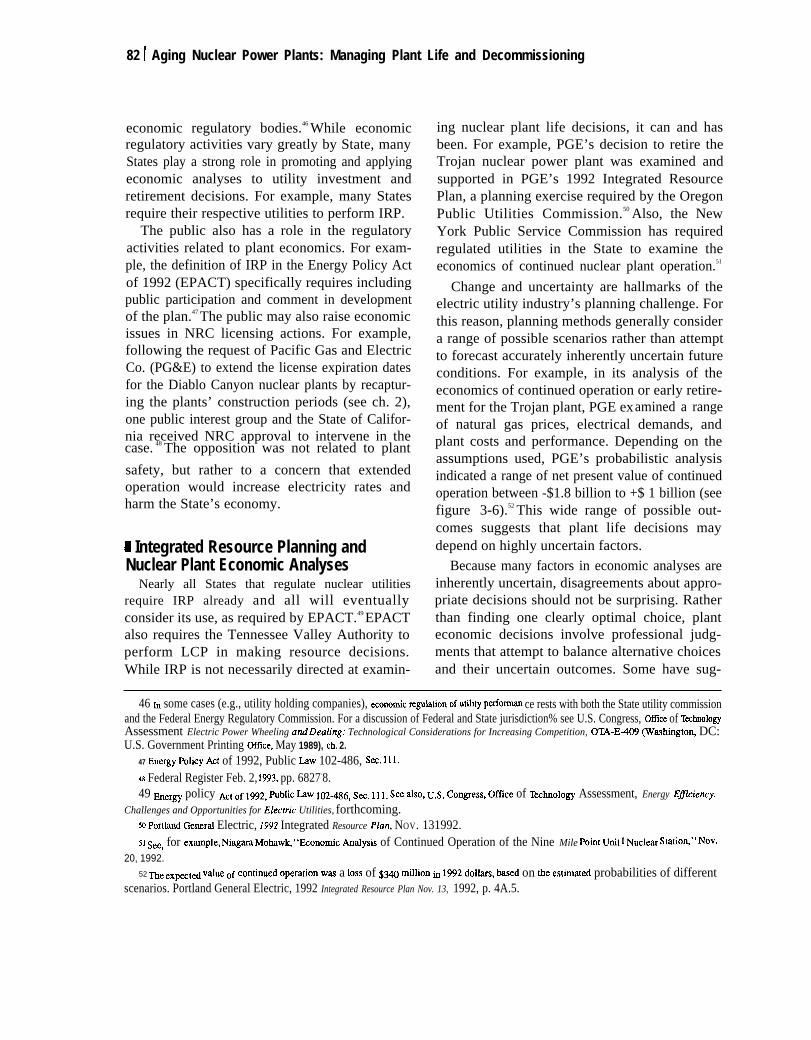
Change and uncertainty are hallmarks of theelectric utility industry’s planning challenge. Forthis reason, planning methods generally considera range of possible scenarios rather than attemptto forecast accurately inherently uncertain futureconditions. For example, in its analysis of theeconomics of continued operation or early retire-ment for the Trojan plant, PGE examined a rangeof natural gas prices, electrical demands, andplant costs and performance. Depending on theassumptions used, PGE’s probabilistic analysisindicated a range of net present value of continuedoperation between -$1.8 billion to +$ 1 billion (seefigure 3-6).52 This wide range of possible out-comes suggests that plant life decisions maydepend on highly uncertain factors.
Because many factors in economic analyses areinherently uncertain, disagreements about appro-priate decisions should not be surprising. Ratherthan finding one clearly optimal choice, planteconomic decisions involve professional judg-ments that attempt to balance alternative choicesand their uncertain outcomes. Some have sug-
46 ~ some cases (e.g., utility holding companies), wonomic ~WhtiOn of lltiity p~o~ ce rests with both the State utility commissionand the Federal Energy Regulatory Commission. For a discussion of Federal and State jurisdiction% see U.S. Congress, Offke of ‘lkchnologyAssessment Electric Power Wheeling andDealing: Technological Considerations for Increasing Competition, OIA-E=W9 (Washingto% DC:U.S. Government Printing Offlce, May 1989), ch. 2.
47 Energy policy Act of 1992, Public bW 102-486, Sm. 111.48 Federal Register Feb. 2, 1993, pp. 6827-8.49 fierm policy ~t of 1~, ~blic ~w 102.486, Sec. 111, See ~so, U.S. Cowess, ~ce of ‘l&hnology Assessment, Energy Eflciency:
Challenges and Opportunities for Elecm”c Utilities, forthcoming.m pofil~d Gener~ Electric, 1992 Integrated Resource Plan, NOV. 131992.51 see, for Cxmple, N&g~ Mo~w~ “Economic Analysis of Continued Operation of the Nine Mile point Utit 1 Nuclew S@OQ” Nov.
20, 1992.52 me expwt~ v~ue of confiued operation was a 1oss of $~ ~fion in 1992 doll~s, ~sed on the estiated probabilities of different
scenarios. Portland General Electric, 1992 Integrated Resource Plan Nov. 13, 1992, p. 4A.5.
—
Chapter 3-Economic Lives of Existing Nuclear Plants! 83
Figure 3-6-Trojan Plant Economic Analysis Results
0.14
0.12
0.10
c 0.08amS 0.06cL
0.04
0.02
0-2000 -1500 -1000 -500 0 500 1000 1500
Replacement costs less Trojan costs ($million)
SOURCE: Portland General Electric, 1992 Integrated Resource Plan, Nov. 13, 1992.
gested that certain past State regulatory activitiesleading to plant retirement reflected an antinu-clear bias rather than solid economic analysis. Forexample, commenting on IRP, one industryleader argued that “the process is subject toabuse, and extremely sensitive to bias, and thatthe economic analyses for SONGS-1 and Trojanplants were manipulated to retire these plants.53
Though any planning process involving thecomplex and uncertain factors found in the utilityindustry is subject to manipulation, past eco-nomic decisions provide no compelling evidenceof regulatory bias. In the Trojan case, for exam-ple, the utility itself determined that early retire-ment was the best option. In the SONGS-1 case,the owning utility argued that continued opera-tion would be economic, but declined to pursue aproposal to place the risks and rewards of plantcosts and performance on the utility.
1 Treatment of Unrecovered Capital in EarlyRetirement
There is limited precedence in the economicregulation of the electric industry to guide the
financial treatment of capital invested, but not yetrecovered in rates, following the early retirementof a plant. Similarly, there is little precedent forthe treatment of shortfalls in decommissioningfunds resulting from early retirement. This is truefor FERC as well as State regulation. For exam-ple, the only precedence for treatment of costs forthe retired Yankee Rowe plant were two 1988decisions for plant abandonment. However, thosewere plants canceled during construction, notabandoned operating plants .54 Of the six recentearly retirement decisions, unrecovered capitaland decommissioning costs ranged from a fewhundred million dollars for most to over $4 billionfor one. Allowing a utility to recover its capitalcosts in an early retirement is consistent with thetraditional regulatory approach in which theprudence of the plant investment is determinedwhen the plant becomes operational. However, inthose retirement cases where plant performancewas poorer and costs were substantially higherthan originally anticipated, State PUCs mayconsider whether the utility performed adequately
53 phi~lp Ba~e, “N@e~ power in 1992: A Year-End Review, ‘‘ remarks to The Energy Daily’s Annual Utility Conference, Dec. 10, 1992.M “FERC Okays Yankee Rate Hike But Eyes ‘Prudence’ of Shutdo~” Nucleonics Week, vol. 33, No. 37, Aug. 6, 1992, pp. 4-5.
84 I Aging Nuclear Power Plants: Managing Plant Life and Decommissioning
during the operating life of the plant and whethersome cost disallowances are warranted.
Anticipated regulatory treatment of decommis-sioning and historical plant costs can weigh in theeconomic attractiveness to a utility of early
retirement. As with the application of IRP, somehave argued that State regulators’ treatment ofcapital recovery in early retirement decisions forthe SONGS-1 and Trojan plants were intended to‘‘encourage their acquiescence.” 55 S O N G S - 1was retired in 1993 after 26 years of operationunder an agreement between the California PublicUtilities Commission (CPUC) Division of RatepayerAdvocates (DRA) and the owners of the unit(Southern California Edison (SCE) and SanDiego Gas and Electric Co.). The agreementprovided the utilities full recovery of the remain-ing $460 million in capital costs over an acceler-ated 4-year period rather than the remaining 15years in the licensed life. In addition, about $29million that had been excluded from the utilities’rate bases pending further review was returned tothe utilities.56 The utilities’ rates of return on the$460 million during the 4-year recovery, how-ever, was reduced from 12 percent to 8 percent.
Not all commissions have allowed recovery ofhistorical capital costs in early retirement deci-sions. Public Service of Colorado’s (PSCO) FortSt. Vrain (FSV) plant is a case in point. The unitwas built with about $1 billion in joint funding
from PSCO, the Atomic Energy Commission, andGeneral Atomics Technologies. After beginningcommercial operation in 1979, the unique high-temperature gas reactor experienced major opera-tional difficulties, including problems with thecontrol rod drive assemblies and the steamgenerator ring headers, low plant availability(about 15 percent), and prohibitive fuel costs.57 In1986, PSCO, the Colorado Public Utilities Com-mission, the Colorado Office of the ConsumerCounsel, and other parties agreed to removeFSV’s $600 million remaining capital costs fromthe utility’s rate base. 58 However , the plantcontinued to operate under a performance incen-tive rate, giving PSCO both the risks of poorperformance and the rewards of good perform-ance. With FSV’s economic problems continu-ing, PSC retired the plant in 1989.59
I Other Economic Regulatory IncentivesMany States have established direct economic
incentives for plant performance. As of 1989,about 70 nuclear plants operated under some type
of explicit economic incentive program.60 Theseincentives typically use specific formulas tomeasure management efficiency and plant per-formance and relate those to financial rewards orpenalties. Most incentive programs use capacityfactors (CFS)61 as the primary measure of per-formance, although other measures are also found,
55 P. Bayne, “Nuclear Power in 1992: A Year-End Review,” remarks to The Energy Daily’s Annual Utility Conference, Dec. 10, 1992.56 c~o~a pI-JC, Decision 92-08-036, Aug. 11, 1992, p. 3.5T Pubtic SeNice Compmy of Colortio, Proposed Deco~issioning Plan for the Fort St. Vrain Nuclear Generating Station, NOV. 5, 1990,
pp. 1.1-1 to 1.1-2.58 Um=overd ~api~ ~os~ ~~l~ded o~~ com~ction cos~ of $2~ ~ion ad later capiti ti&tions of ~ ti~on. OTA SW
conversations with Colorado Public Utility Commission staff, Aug. 25, and Sept. 24, 1992.w ~ pmlc~ti, due t. FSV’s ~que m- (i.e., tie only commercial gas reactor), the fuel costs were subst~tid. The cost of fuel ~ 1989
would have been approximately 2.8 cents per kw’h. At the same time, PSC could generate coal-fued power for 2.7 cents per kw’b and couldpurchase power for only 2.2 cents per kWh. Donald Warembourg, Site Mauager, Fort St. Vrain Nuclear Station+ Public Service Company ofColorado, personal communication, Sept. 23, 1992.
60 R-L. - p. Hen&ickson ~d J. o~o~ Incentive Regulation of Nuclear power plants by State Public Utility Com”ssions,
NUREG/CR-5509 (Washington+ DC: U.S. Nuclear Regulatory Commission, December 1989). NRC tracks State economic incentive programsto evaluate their potential impact on safety.
61 Capaciy fXtor is a m=sm of a pl~t’s wtud p~duction of electricity as a percentage of maximum possible production and is definedas the ratio of the electricity produced to the rated capacity of the facility.
Chapter 3-Economic Lives of Existing Nuclear Plants 85
such as the heat rate (the plant’s thermal effi-ciency), NRC’s Systematic Assessment of Licen-see Performance (SALP) scores, and NRC per-formance indicators. Incentives for improvingplant operating cost are not limited to nuclearpower plants. For example, incentive based ratemak-ing has been included in decisions for non-nuclearactivities Columbus Southern Power in Ohio.62
Incentive programs have generally involvedrelatively small dollar values relative to totalplant costs. Many of the incentive programs hadawarded no penalties or rewards during theseveral-year period reviewed in one NRC re-port. 63 The largest penalty reported was a 2-year
cumulative $32-million penalty for Public Serv-ice Electric and Gas (PSE&G) resulting from anextended forced outage at the two Peach Bottomunits, of which PSE&G owns 42 percent.64 I ncomparison, during that 2-year period, PSE&G’sshare of O&M costs for the two plants was farlarger, over $200 million.65
In contrast, PG&E’s Diablo Canyon Units 1and 2 have a performance-based rate designed toplace the risks and rewards for plant performanceon the utility rather than on the ratepayers.66 Theunconventional rate established by the CPUC in1988 allows PG&E to receive payments based onactual plant output rather than on plant construc-tion and operational costs. Since the rate wasestablished, the plants have performed far morereliably than had been assumed in the CPUC’s
and PG&E’s analyses. Average CFs, at about 83percent, have surpassed the assumed 58 percent,and payments to PG&E between 1989 and 1991were about $4.1 billion, or about 40-percenthigher than the $2.9 billion originally antici-pated.67 The performance-based rate approachresults in plant economic life decisions beingmade more independently by PG&E and less inconjunction with the CPUC.
The performance-based approach has beensuggested for other nuclear plants but not adoptedto date. For example, as an alternative to SONGS-1 early retirement, the DRA proposed establish-ing a performance-based ratemaking treatment offuture costs.68 Noting that SCE did not pursue theproposal, the CPUC found that it “would benovel and complex, might create perverse incen-tives, and would require much time to workout. ‘ ’69 Similarly, in 1989 Consumers Power Co.proposed selling its Palisades plant to a newentity, the Palisades Generating Co. (PGC), to beowned by Consumers Power, the Bechtel PowerCorp., and a Westinghouse Electric Corp. subsid-iary.70 Prior to 1989, the Palisades plant perform-
ance had been well below the industry average,with problematic steam generators (SGs) leadingto a lifetime CF of 48 percent. PGC would havesold its power to Consumers Power under along-term purchase contract and accepted therisks and rewards of plant cost and performance.However, FERC and the State of Michigan
62 ~~ofio puc t. Consider [ncentive Ratemaking for 06’cM Activities, ” Electric Utility Week, Sept. 21, 1992, pp. 16-17.63 R L Mart~ p. Hen fic~on and ]. ()]som Incenfi”ve Reg~~afi”on of N~c~ear Pou)er Piant$ by State public Utility CO?n??ti.SSiOnS,. .
NUREG/CR-5509 (Washington DC: U.S. Nuclear Regulatory Cornmissiom December 1989).64 us Nu~lefl ReWlatoV Cotission, owners of N~~lear power plants, NuR,EG-0327; Rev. 5. (Wmhingto~ DC: July 1991), p. 6.
65 IJ..S. Dep~ent of Energy, Energy hIfOmMtion ~‘ “ tratioq An Analysis of Nuclear Plant Operating Costs: A 1991 Update,DOE/EIA-0547 (Washington, DC: May 1991), p. 59.
M Callfomla public Utifities (20rnmissioq Decision 88-12-083, at 282.67 TowNd Utlllv Rate No~izatio~ “petition of Toward Utility ~te No~~ation for Mo&cation of Decision 88-12 -083,’ Sept. 17,
1992, pp. 7-11.
68 c~ifomla Rbhc Utlfities Commission Division of R@3payer AdVOCiMCS, ‘‘Report on the Cost-Effectiveness of Continued Operation ofthe SONGS Unit No. l,” Investigation 89-074X)4, Sept. 25, 1991, pp. 45-52.
69 c~fo~a ~blic Utihties Commission Decision 92-08-036, Aug. 11, 1992, p. 23.
70 Feder~ )iner= Re@atoV Commission “~ti~ D~ision on Applications for Approv~ of a power purchase Agreement and tie sale
of Certain Transmission Facilities, ” 59 FERC 63,023, June 17, 1992.
86 I Aging Nuclear Power Plants: Managing Plant Life and Decommissioning
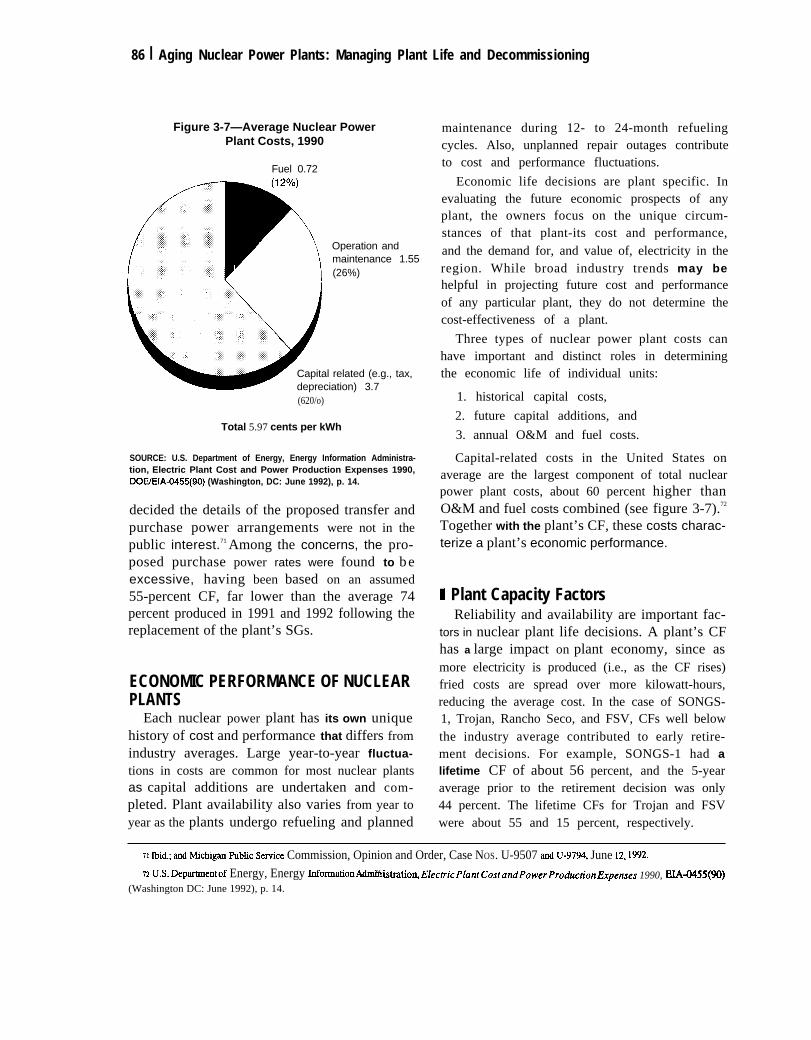
Figure 3-7—Average Nuclear PowerPlant Costs, 1990
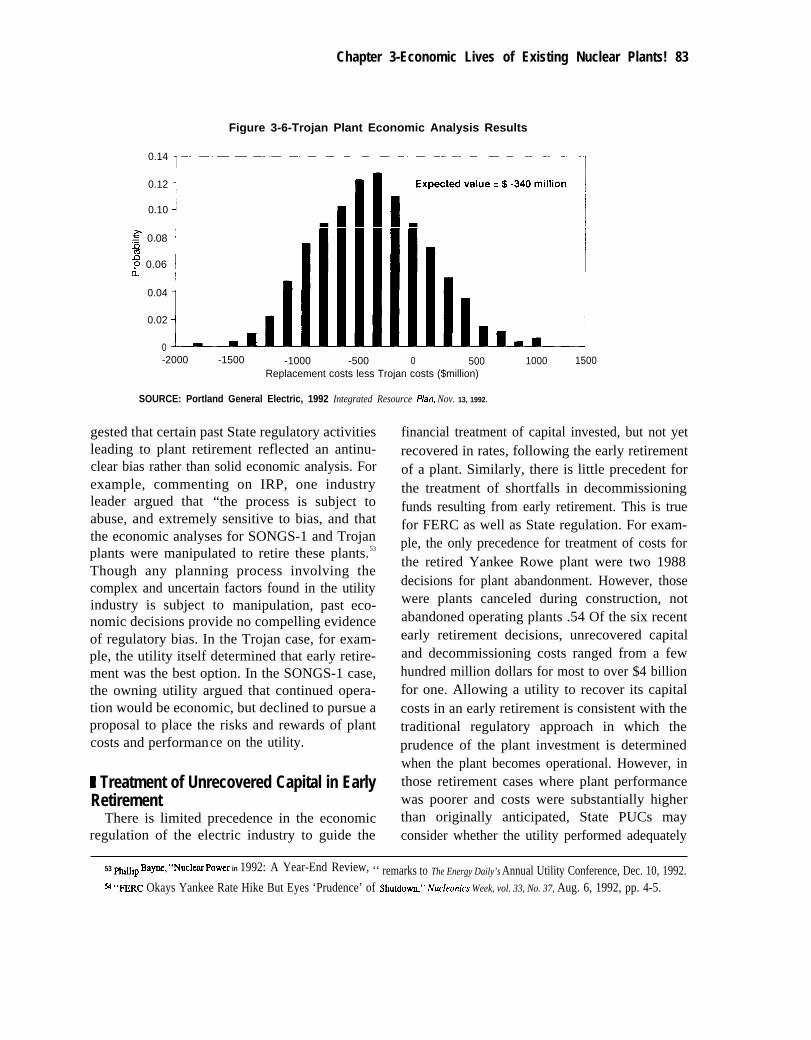
Fuel 0.72
r
\Operation and
r maintenance 1.55T
(26%)
Capital related (e.g., tax,depreciation) 3.7(620/o)
Total 5.97 cents per kWh
SOURCE: U.S. Department of Energy, Energy Information Administra-tion, Electric Plant Cost and Power Production Expenses 1990,DOWEIA-0455(90) (Washington, DC: June 1992), p. 14.
decided the details of the proposed transfer andpurchase power arrangements were not in thepublic interest.71 Among the concerns, the pro-posed purchase power rates were found to beexcessive, having been based on an assumed55-percent CF, far lower than the average 74percent produced in 1991 and 1992 following thereplacement of the plant’s SGs.
ECONOMIC PERFORMANCE OF NUCLEARPLANTS
Each nuclear power plant has its own uniquehistory of cost and performance that differs fromindustry averages. Large year-to-year fluctua-tions in costs are common for most nuclear plantsas capital additions are undertaken and com-pleted. Plant availability also varies from year toyear as the plants undergo refueling and planned
maintenance during 12- to 24-month refuelingcycles. Also, unplanned repair outages contributeto cost and performance fluctuations.
Economic life decisions are plant specific. Inevaluating the future economic prospects of anyplant, the owners focus on the unique circum-stances of that plant-its cost and performance,and the demand for, and value of, electricity in theregion. While broad industry trends may behelpful in projecting future cost and performanceof any particular plant, they do not determine thecost-effectiveness of a plant.
Three types of nuclear power plant costs canhave important and distinct roles in determiningthe economic life of individual units:
1. historical capital costs,
2. future capital additions, and
3. annual O&M and fuel costs.
Capital-related costs in the United States onaverage are the largest component of total nuclearpower plant costs, about 60 percent higher thanO&M and fuel costs combined (see figure 3-7).72
Together with the plant’s CF, these costs charac-terize a plant’s economic performance.
# Plant Capacity FactorsReliability and availability are important fac-
tors in nuclear plant life decisions. A plant’s CFhas a large impact on plant economy, since asmore electricity is produced (i.e., as the CF rises)fried costs are spread over more kilowatt-hours,reducing the average cost. In the case of SONGS-1, Trojan, Rancho Seco, and FSV, CFs well belowthe industry average contributed to early retire-ment decisions. For example, SONGS-1 had alifetime CF of about 56 percent, and the 5-yearaverage prior to the retirement decision was only44 percent. The lifetime CFs for Trojan and FSVwere about 55 and 15 percent, respectively.
71 ~id.; ad ~c~gm ~bfic Semim Commission, Opinion and Order, Case NOS. U-9507 ad U-9794, June 12, 199272 U,S, Dep~entof Energy, Energy ~ormationAchmm“ "stratioWElectricPlantCostandPowerProductionExpe~es 1990, EIA-0455(90)
(Washington DC: June 1992), p. 14.
Chapter 3--Economic Lives of Existing Nuclear Plants 187
Future CFs at any plant are uncertain and thussubject to disagreement in economic analyses.For example, based on its analyses of other plantsand effects of planned and completed mainte-nance activities, SCE suggested that reasonableCF scenarios for SONGS-1 ranged from 60 to 80percent. In contrast, the DRA considered a rangeof 44 to 70 percent more likely based on itsassessment of other plants and prospects.73 Simi-larly PGE considered CFs ranging from O percentto over 80 percent in its analyses of Trojan, withan expected value of about 60 to 64 percent,depending on the replacement of SGs.
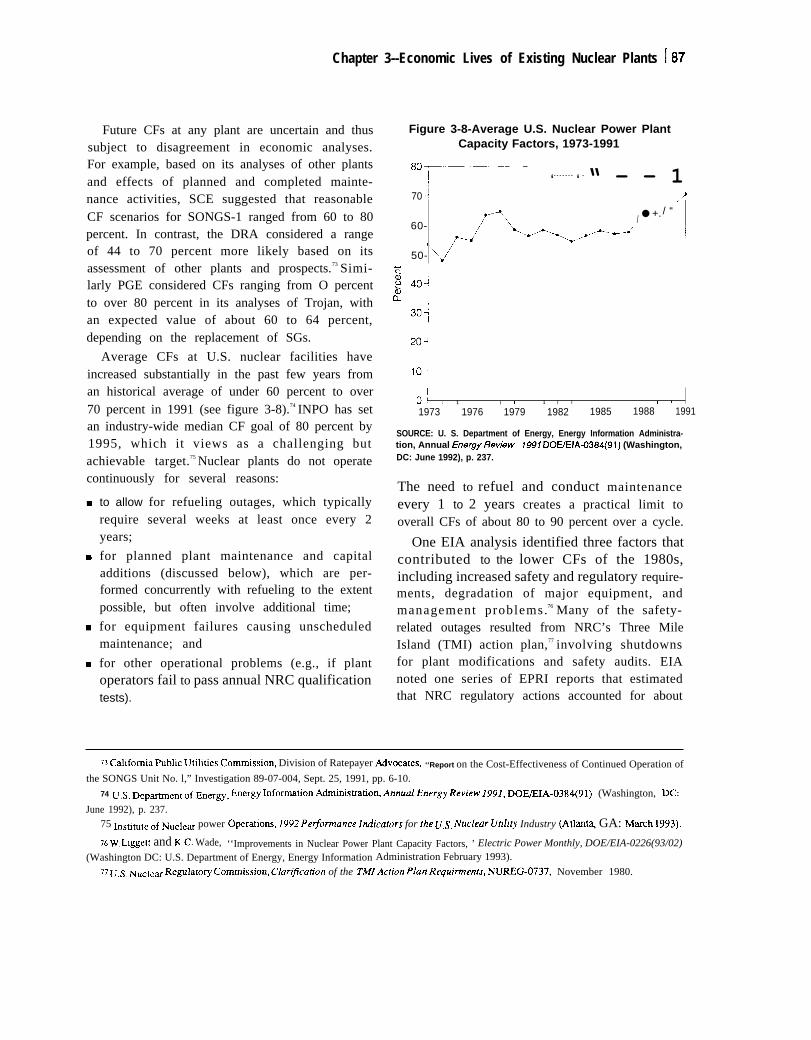
Average CFs at U.S. nuclear facilities haveincreased substantially in the past few years froman historical average of under 60 percent to over70 percent in 1991 (see figure 3-8).74 INPO has setan industry-wide median CF goal of 80 percent by1995, which it views as a challenging butachievable target.75 Nuclear plants do not operatecontinuously for several reasons:
to allow for refueling outages, which typicallyrequire several weeks at least once every 2years;
for planned plant maintenance and capitaladditions (discussed below), which are per-formed concurrently with refueling to the extentpossible, but often involve additional time;
for equipment failures causing unscheduledmaintenance; and
for other operational problems (e.g., if plantoperators fail to pass annual NRC qualificationtests).
Figure 3-8-Average U.S. Nuclear Power PlantCapacity Factors, 1973-1991
‘“~- ‘- - - - - - - ‘ - “ - - 1I
70 1
● +. / “60-
/J ‘]
(50-
20+ I
01 1 1 1 ) I 1 I 1 I I 1 I I I ,, I
1973 1976 1979 1982 1985 1988 1991
SOURCE: U. S. Department of Energy, Energy Information Administra-tion, Annual Energy Review 1991 DOWEIA-0384(91) (Washington,DC: June 1992), p. 237.
The need to refuel and conduct maintenanceevery 1 to 2 years creates a practical limit tooverall CFs of about 80 to 90 percent over a cycle.
One EIA analysis identified three factors thatcontributed to the lower CFs of the 1980s,including increased safety and regulatory require-ments, degradation of major equipment, andmanagement problems.76 Many of the safety-related outages resulted from NRC’s Three MileIsland (TMI) action plan,77 involving shutdownsfor plant modifications and safety audits. EIAnoted one series of EPRI reports that estimatedthat NRC regulatory actions accounted for about
73 c~lfomla public utilities Cornmissio% Division of Ratepayer AdVOCateS, ‘‘Report on the Cost-Effectiveness of Continued Operation ofthe SONGS Unit No. l,” Investigation 89-07-004, Sept. 25, 1991, pp. 6-10.
74 U.S. Dcp~ent of EnerH, EnerH ~omtion Adminis@atio~ Annual Energy Review 199], DOE/EIA-03gLl(91) (Washington, ~:
June 1992), p. 237.75 ~Stitute of Nuclem power OPeratlom, 1992 pe~ormance ]ndicatorf for the us, Nuclear utili~ Industry (Ati~t~ GA: M~h 1993).
76 W. I-.iggett and K.C. Wade, ‘‘Improvements in Nuclear Power Plant Capacity Factors, ’ Electric Power Monthly, DOE/EIA-0226(93/02)(Washington DC: U.S. Department of Energy, Energy Information Administration February 1993).
77 us, Nuclea Rewla[ov commi~~ion, clarl~cation of the TM[Ac{i~n plan Requi~ents, WG-0737, November 1980.
88 I Aging Nuclear Power Plants: Managing Plant Life and Decommissioning
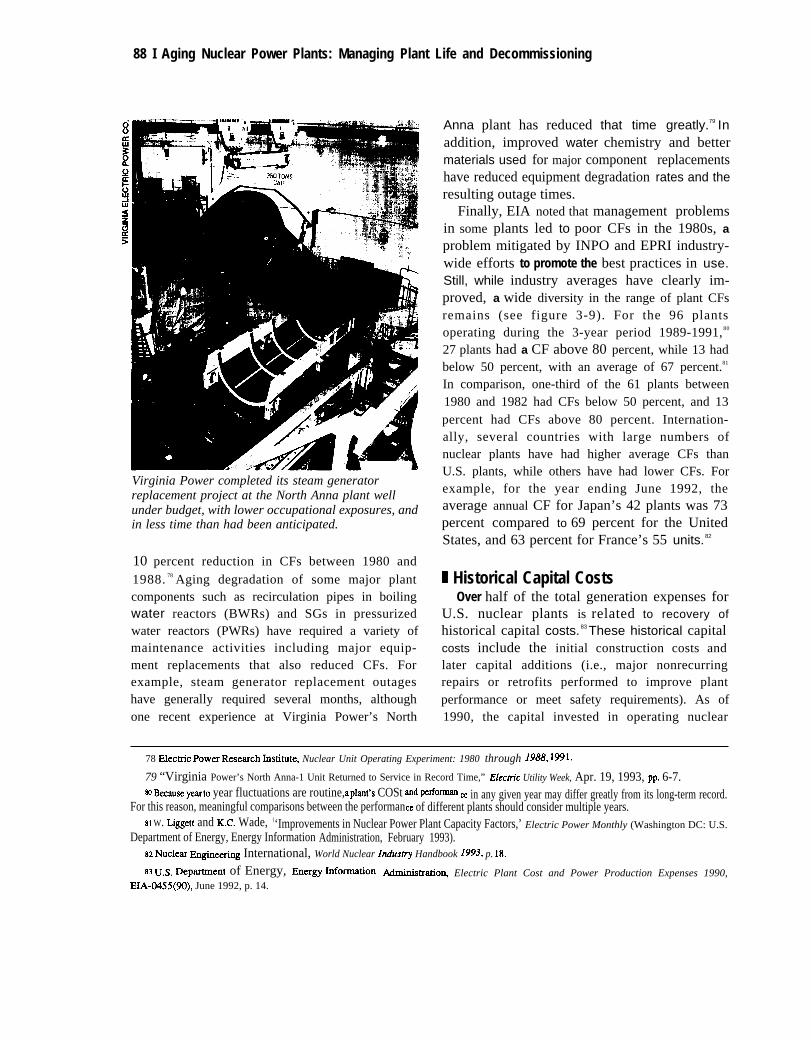
Virginia Power completed its steam generatorreplacement project at the North Anna plant wellunder budget, with lower occupational exposures, andin less time than had been anticipated.
10 percent reduction in CFs between 1980 and1988. 78 Aging degradation of some major plantcomponents such as recirculation pipes in boilingwater reactors (BWRs) and SGs in pressurizedwater reactors (PWRs) have required a variety ofmaintenance activities including major equip-ment replacements that also reduced CFs. Forexample, steam generator replacement outageshave generally required several months, althoughone recent experience at Virginia Power’s North
Anna plant has reduced that time greatly.79 Inaddition, improved water chemistry and bettermaterials used for major component replacementshave reduced equipment degradation rates and theresulting outage times.
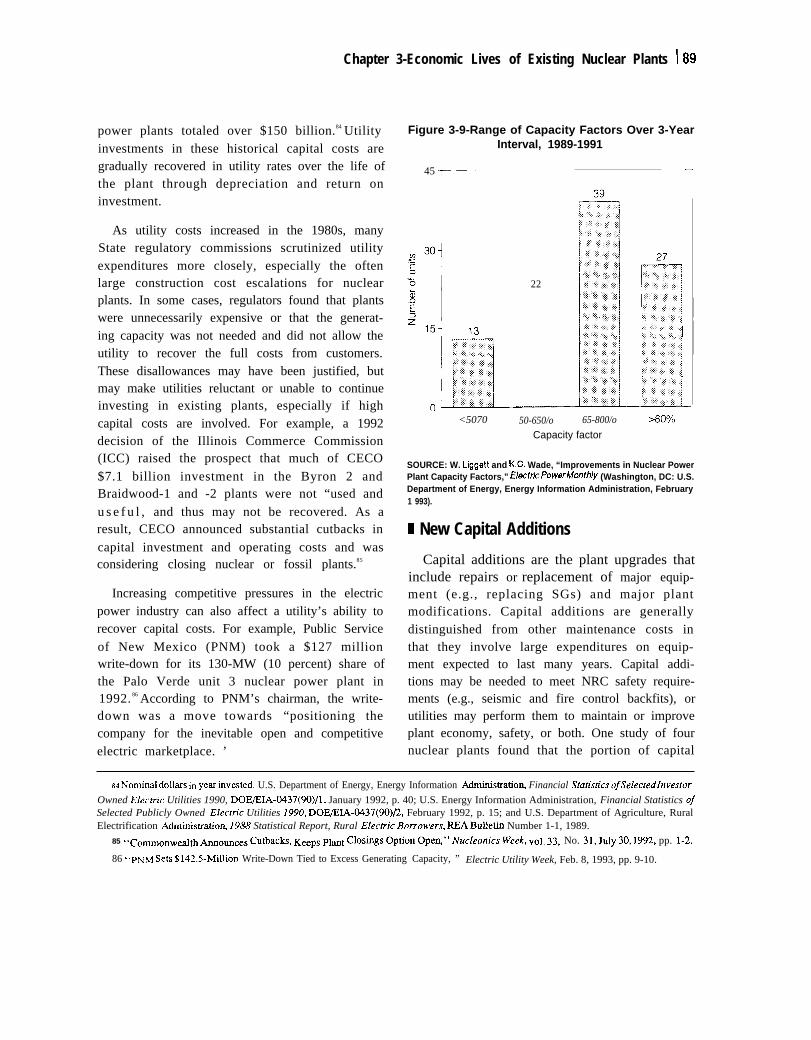
Finally, EIA noted that management problemsin some plants led to poor CFs in the 1980s, aproblem mitigated by INPO and EPRI industry-wide efforts to promote the best practices in use.Still, while industry averages have clearly im-proved, a wide diversity in the range of plant CFsremains (see figure 3-9). For the 96 plantsoperating during the 3-year period 1989-1991, 80
27 plants had a CF above 80 percent, while 13 hadbelow 50 percent, with an average of 67 percent.81
In comparison, one-third of the 61 plants between1980 and 1982 had CFs below 50 percent, and 13percent had CFs above 80 percent. Internation-ally, several countries with large numbers ofnuclear plants have had higher average CFs thanU.S. plants, while others have had lower CFs. Forexample, for the year ending June 1992, theaverage annual CF for Japan’s 42 plants was 73percent compared to 69 percent for the UnitedStates, and 63 percent for France’s 55 units. 82
1 Historical Capital CostsOver half of the total generation expenses for
U.S. nuclear plants is related to recovery ofhistorical capital costs. 83 These historical capitalcosts include the initial construction costs andlater capital additions (i.e., major nonrecurringrepairs or retrofits performed to improve plantperformance or meet safety requirements). As of1990, the capital invested in operating nuclear
78 Elec~c poWm Resewch ~stitute, Nuclear Unit Operating Experiment: 1980 through 1988, 1991.
79 “Virginia Power’s North Anna-1 Unit Returned to Service in Record Time,” Elecm”c Utility Week, Apr. 19, 1993, pp. 6-7.so Becau~ ye~to year fluctuations are routine, aphmt’s COSt md prfo~ ce in any given year may differ greatly from its long-term record.
For this reason, meaningful comparisons between the performance of different plants should consider multiple years.61 W. Liggett and K.C, Wade, {‘Improvements in Nuclear Power Plant Capacity Factors,’ Electric Power Monthly (Washington DC: U.S.
Department of Energy, Energy Information Administration, February 1993).62 Nucle~ ~gin=ring International, World Nuclear Industry Handbook 1993, p. 18.
83 U.S. Dep~ent of Energy, lher~ Mormation Administratio~ Electric Plant Cost and Power Production Expenses 1990,EIA-0455(90), June 1992, p. 14.
Chapter 3-Economic Lives of Existing Nuclear Plants 189
power plants totaled over $150 billion.84 Utilityinvestments in these historical capital costs aregradually recovered in utility rates over the life ofthe plant through depreciation and return oninvestment.
As utility costs increased in the 1980s, manyState regulatory commissions scrutinized utilityexpenditures more closely, especially the oftenlarge construction cost escalations for nuclearplants. In some cases, regulators found that plantswere unnecessarily expensive or that the generat-ing capacity was not needed and did not allow theutility to recover the full costs from customers.These disallowances may have been justified, butmay make utilities reluctant or unable to continueinvesting in existing plants, especially if highcapital costs are involved. For example, a 1992decision of the Illinois Commerce Commission(ICC) raised the prospect that much of CECO$7.1 billion investment in the Byron 2 andBraidwood-1 and -2 plants were not “used andu s e f u l , and thus may not be recovered. As aresult, CECO announced substantial cutbacks incapital investment and operating costs and wasconsidering closing nuclear or fossil plants.85
Increasing competitive pressures in the electricpower industry can also affect a utility’s ability torecover capital costs. For example, Public Serviceof New Mexico (PNM) took a $127 millionwrite-down for its 130-MW (10 percent) share ofthe Palo Verde unit 3 nuclear power plant in1992. 86 According to PNM’s chairman, the write-down was a move towards “positioning thecompany for the inevitable open and competitiveelectric marketplace. ’
Figure 3-9-Range of Capacity Factors Over 3-YearInterval, 1989-1991
45 “r—–- ‘-
22
—— —
<5070 50-650/o 65-800/o Moo/o
Capacity factor
SOURCE: W. Liggett and K.C. Wade, “Improvements in Nuclear PowerPlant Capacity Factors,” E/*tfiPowerMonfh/y (Washington, DC: U.S.Department of Energy, Energy Information Administration, February1 993).
1 New Capital Additions
Capital additions are the plant upgrades thatinclude repairs or replacement of major equip-ment (e.g., replacing SGs) and major plantmodifications. Capital additions are generallydistinguished from other maintenance costs inthat they involve large expenditures on equip-ment expected to last many years. Capital addi-tions may be needed to meet NRC safety require-ments (e.g., seismic and fire control backfits), orutilities may perform them to maintain or improveplant economy, safety, or both. One study of fournuclear plants found that the portion of capital
84 NofimI doll~s in year ~vesled. U.S. Department of Energy, Energy Information Adrninistratiou Financial Stafi”sfi”cs ofseiectedhve$tor
Owned E/ecm”c Utilities 1990, DOE/EL4-0437(90)/l, January 1992, p. 40; U.S. Energy Information Administration, Financial Statistics ofSelected Publicly Owned Electric Utilities 1990, DOE/EIA-0437(90)L2, February 1992, p. 15; and U.S. Department of Agriculture, RuralElectrification Adrninistratiom 1988 Statistical Report, Rural Electiic %rron’ers, REA Bulkti Number 1-1, 1989.
85 fccomo~w~]~ ~owces ~tb~C~, K~ps P]ant C]ostigs Option Ope@” Nucleonics week, VO1. 33, No. 31, July so, 1992, pp. 1-2.
86 CLPNM sew $lA2.s-Million Write-Down Tied to Excess Generating Capacity, ” Electric Utility Week, Feb. 8, 1993, pp. 9-10.
90 I Aging Nuclear Power Plants: Managing PIant Life and Decommissioning
Figure 3-10—Average Annual Nuclear Power Plant Capital Additions Costs 1974-1989(1991 dollars per kilowatt of capacity)
70 T —I
60-
~ 50-~$ 40-
1: s. 1
.FJ
~ 20-
4
l o -
0 1 1 1 r 1 1 1 I 1 1 [ 1 I I1974 1975 1976 1977 1978 1979 1980 1981 1982 1983 1984 1985 1986 1987 1988 1989
SOURCE: Office of Technology Assessment, adapted from U.S. DOE, Energy Information Administration, An Ana/ysisof Nuclear Power P/ant Qerating Costs.’ A 1991 Update, DOEHA-0547 (Washington, DC: May 1991).
additions costs attributable to NRC safety regula-tions varied between 34 percent and 65 percent.87
The large, one-time costs involved and thepotential for long outages may make capitaladdition decisions de facto plant life decisionpoints. For example, the economic analysis lead-ing to the SONGS-1 early retirement decision wasinitiated because of the large capital additionsrequest filed by the plant’s owner.88 Similarly, theneed to replace the SGs at a cost of up to $200million weighed heavily in PGE’s decision toretire the Trojan nuclear plant, along with theavailability of lower cost electricity options.89
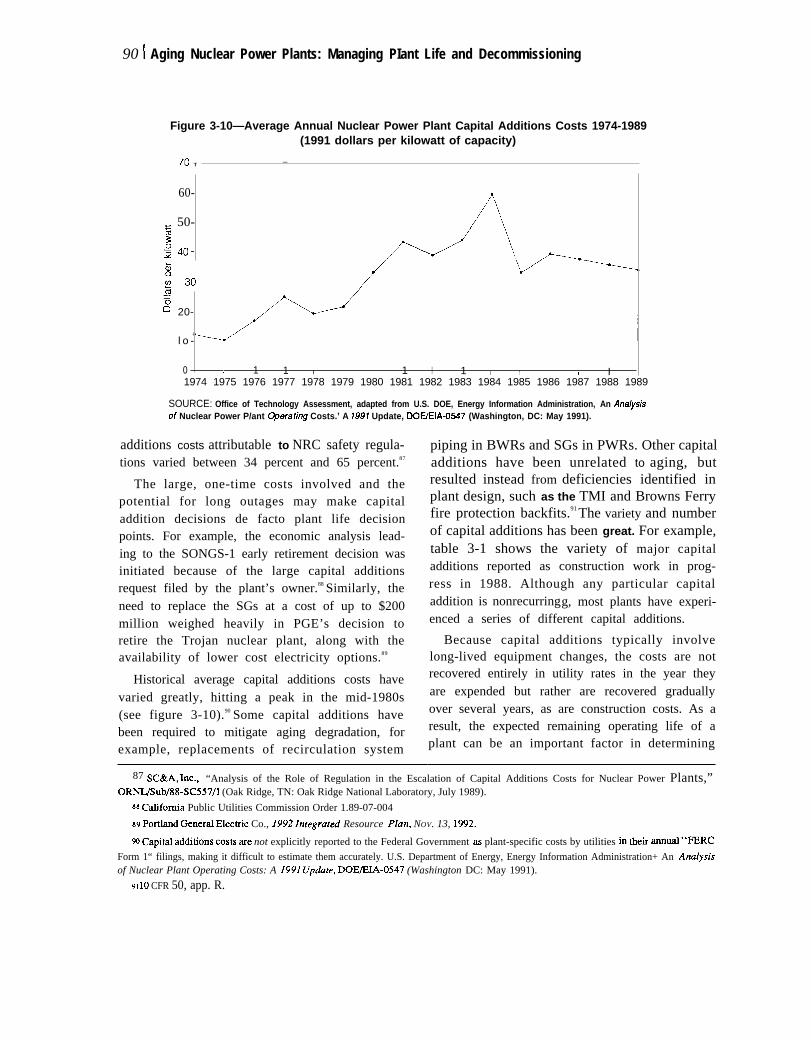
Historical average capital additions costs havevaried greatly, hitting a peak in the mid-1980s(see figure 3-10).90 Some capital additions havebeen required to mitigate aging degradation, forexample, replacements of recirculation system
piping in BWRs and SGs in PWRs. Other capitaladditions have been unrelated to aging, butresulted instead from deficiencies identified inplant design, such as the TMI and Browns Ferryfire protection backfits.91 The variety and numberof capital additions has been great. For example,table 3-1 shows the variety of major capitaladditions reported as construction work in prog-ress in 1988. Although any particular capitaladdition is nonrecurringg, most plants have experi-enced a series of different capital additions.
Because capital additions typically involvelong-lived equipment changes, the costs are notrecovered entirely in utility rates in the year theyare expended but rather are recovered graduallyover several years, as are construction costs. As aresult, the expected remaining operating life of aplant can be an important factor in determining
87 ~C&A, ~c., “Analysis of the Role of Regulation in the Escalation of Capital Additions Costs for Nuclear Power Plants,”ORNL/Sub/88-SC557/l (Oak Ridge, TN: Oak Ridge National Laboratory, July 1989).
88 Cwornia Public Utilities Commission Order 1.89-07-004
69 port~d Gener~ Electric Co., 1992 lntegrured Resource P/an, NOV. 13, 1992.
w capital additions COStS are not explicitly reported to the Federal Government as plant-specific costs by utilities iKI their ~ud “FERC
Form 1“ filings, making it difficult to estimate them accurately. U.S. Department of Energy, Energy Information Administration+ An Ana/ysisof Nuclear Plant Operating Costs: A 1991 Uphte, DOE/EIA-0547 (Washington DC: May 1991).
91 10 CFR 50, app. R.
Chapter 3--Economic Lives of Existing Nuclear Plants 191
Table 3-l—Capital Additions in Progress in 1988
Total constructionwork in progress
Number of expendituresCategory utilities ($millions)
Steam generators. . . . . . . .Low-level waste. . . . . . . . .Fire protection. . . . . . . . . .Turbine, generators. . . . . .Water chemistry. . . . . . . . .Control room. . . . . . . . . . . .Core cooling. . . . . . . . . . . .Simulators. . . . . . . . . . . . . .Spent fuel storage. . . . . . .Piping, tubing. ... , . . . ., .Emergency systems. . . . . .Reg Guide 1.97. . . . . . . . .Control rod drive. . . . . . . . .20 other categories. . . . . .
913141318161419141313
48
109929079514339383635262621
197
SOURCE: American Nuclear Society, Supplement to the “Dollar FactsAbout the U.S. Operating Nuclear Power Planf Markef”, Study No. 9,Section 1, 1990.
the economic attractiveness of a capital addition.For plants requiring major capital additions butapproaching the end of their operating license,resolution of license renewal requirements cantherefore play an important role in capital plan-ning.
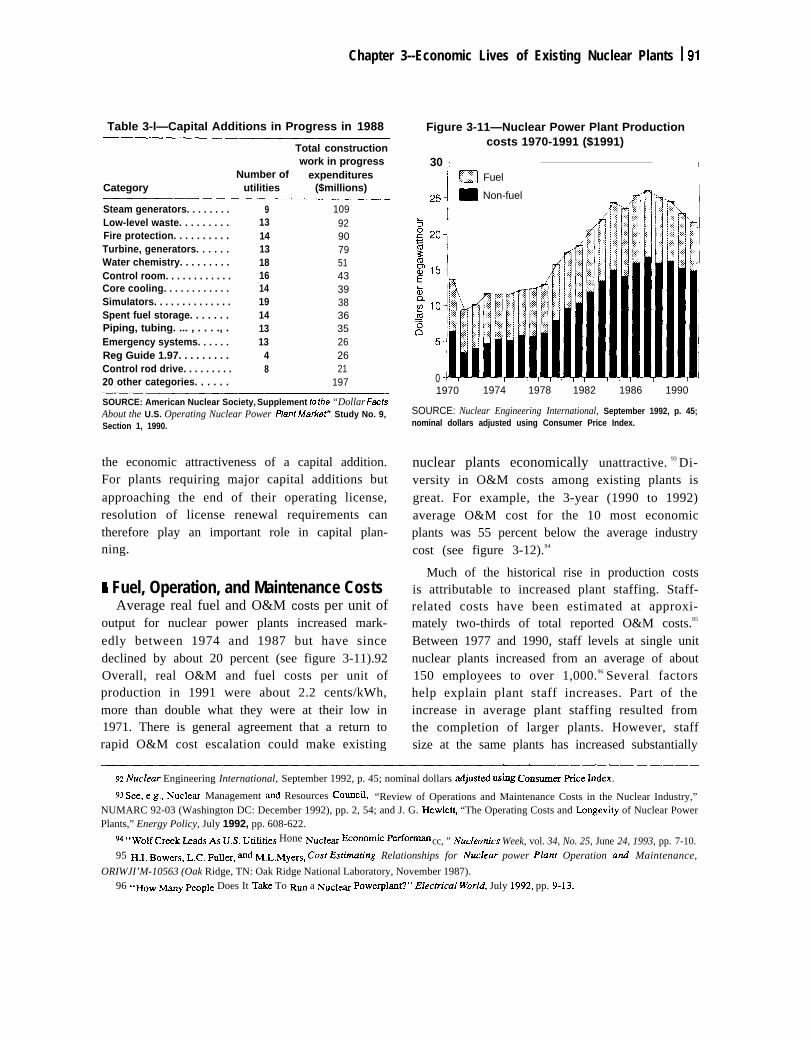
1 Fuel, Operation, and Maintenance CostsAverage real fuel and O&M costs per unit of
output for nuclear power plants increased mark-edly between 1974 and 1987 but have sincedeclined by about 20 percent (see figure 3-11).92Overall, real O&M and fuel costs per unit ofproduction in 1991 were about 2.2 cents/kWh,more than double what they were at their low in1971. There is general agreement that a return torapid O&M cost escalation could make existing
Figure 3-11—Nuclear Power Plant Productioncosts 1970-1991 ($1991)
30 ~ —7
0
1 D Fuel
‘4_ Non-fuel
I4
1970 1974 1978 1982 1986 1990
SOURCE: Nuclear Engineering International, September 1992, p. 45;nominal dollars adjusted using Consumer Price Index.
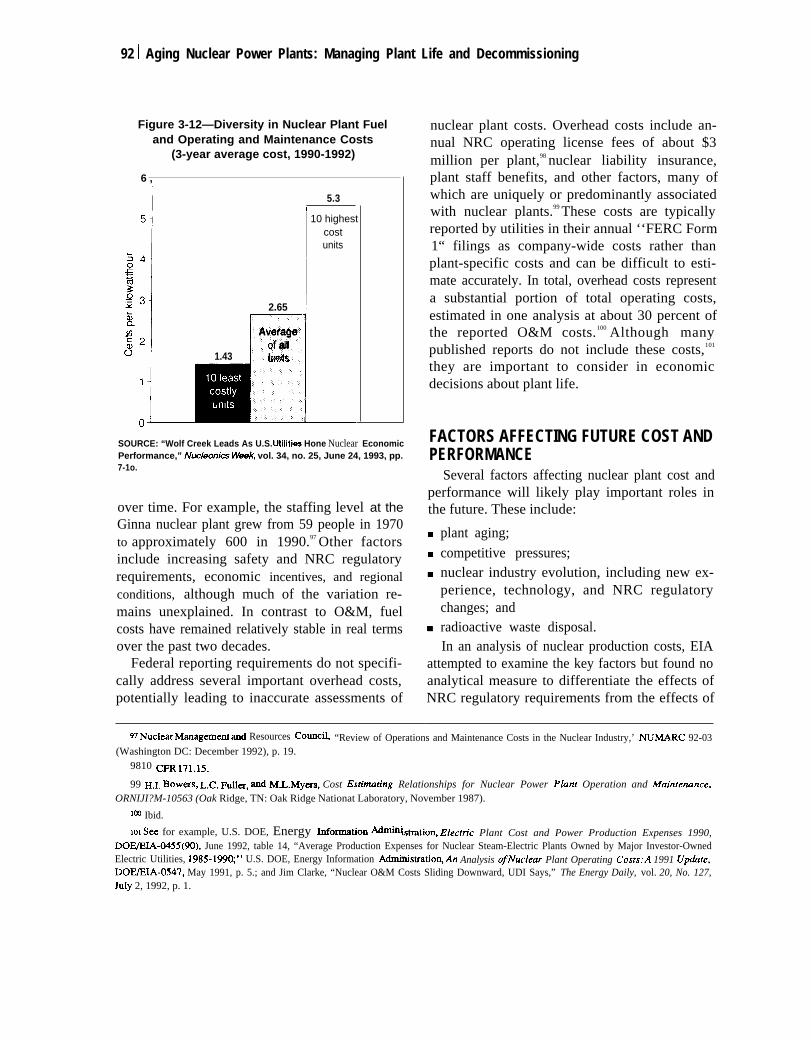
nuclear plants economically unattractive. 93 Di-versity in O&M costs among existing plants isgreat. For example, the 3-year (1990 to 1992)average O&M cost for the 10 most economicplants was 55 percent below the average industrycost (see figure 3-12).94
Much of the historical rise in production costsis attributable to increased plant staffing. Staff-related costs have been estimated at approxi-mately two-thirds of total reported O&M costs.95
Between 1977 and 1990, staff levels at single unitnuclear plants increased from an average of about150 employees to over 1,000.96 Several factorshelp explain plant staff increases. Part of theincrease in average plant staffing resulted fromthe completion of larger plants. However, staffsize at the same plants has increased substantially
92 NucIear Engineering International, September 1992, p. 45; nominal dollars tijusted using Consumer price ~dex.
93 See, e,g., NuClem Management ~d Resources COUCfl, “Review of Operations and Maintenance Costs in the Nuclear Industry,”NUMARC 92-03 (Washington DC: December 1992), pp. 2, 54; and J. G. HewletJ “The Operating Costs and Ixmgevity of Nuclear PowerPlants,” Energy Policy, July 1992, pp. 608-622.
94 *fWo~Cr@k ~ad~ As US. uti~tie~ Hone Nuc]~ ~onofic perfo~ cc, ” Nuc!eonics Week, vol. 34, No. 25, June 24, 1993, pp. 7-10.95 HI. Bowa5, L.C. Fu~~, ~d M.L.Myers, Cost Esti~ring Relationships for Nuclear power plant Operation and Maintenance,
ORIWJI’M-10563 (Oak Ridge, TN: Oak Ridge National Laboratory, November 1987).96 ‘tHow -y people Does It T&e To R~ a Nucl~ powerpl~t?” E/ectn.ca/ World, July 1992, pp. 9-1s.
92 I Aging Nuclear Power Plants: Managing Plant Life and Decommissioning
Figure 3-12—Diversity in Nuclear Plant Fueland Operating and Maintenance Costs
(3-year average cost, 1990-1992)
6 ,
2.65
r
Averageof ail
1.43 I Ink
5.3I
10 highestcostunits
SOURCE: “Wolf Creek Leads As U.S. Utilitiea Hone Nuclear EconomicPerformance,” Nocleonics Week vol. 34, no. 25, June 24, 1993, pp.7-1o.
over time. For example, the staffing level at theGinna nuclear plant grew from 59 people in 1970to approximately 600 in 1990.97 Other factorsinclude increasing safety and NRC regulatoryrequirements, economic incentives, and regionalconditions, although much of the variation re-mains unexplained. In contrast to O&M, fuelcosts have remained relatively stable in real termsover the past two decades.
Federal reporting requirements do not specifi-cally address several important overhead costs,potentially leading to inaccurate assessments of
nuclear plant costs. Overhead costs include an-nual NRC operating license fees of about $3million per plant,98 nuclear liability insurance,plant staff benefits, and other factors, many ofwhich are uniquely or predominantly associatedwith nuclear plants.99 These costs are typicallyreported by utilities in their annual ‘‘FERC Form1“ filings as company-wide costs rather thanplant-specific costs and can be difficult to esti-mate accurately. In total, overhead costs representa substantial portion of total operating costs,estimated in one analysis at about 30 percent ofthe reported O&M costs.100 Although manypublished reports do not include these costs,101
they are important to consider in economicdecisions about plant life.
FACTORS AFFECTING FUTURE COST ANDPERFORMANCE
Several factors affecting nuclear plant cost andperformance will likely play important roles inthe future. These include:
plant aging;
competitive pressures;nuclear industry evolution, including new ex-perience, technology, and NRC regulatorychanges; andradioactive waste disposal.In an analysis of nuclear production costs, EIA
attempted to examine the key factors but found noanalytical measure to differentiate the effects ofNRC regulatory requirements from the effects of
97 Nuc]e~M~agemen~~d Resources coulIcil, “Review of Operations and Maintenance Costs in the Nuclear Industry,’ NUMARC 92-03(Washington DC: December 1992), p. 19.
9810 cm 171.15+
99 H.I. BOWWS, L.C. Fuller, ~d M.L.Myers, Cost Estiman”ng Relationships for Nuclear Power Plant Operation and MainteMnce,ORNIJI?M-10563 (Oak Ridge, TN: Oak Ridge Nationat Laboratory, November 1987).
‘m Ibid.
101 See for example, U.S. DOE, Energy rQfO-tiOn ~‘ ‘stratio% Electn”c Plant Cost and Power Production Expenses 1990,DOE/EIA-0455(90), June 1992, table 14, “Average Production Expenses for Nuclear Steam-Electric Plants Owned by Major Investor-OwnedElectric Utilities, 1985-1990;” U.S. DOE, Energy Information A&mm“ “stratio%An Analysis ofNuclear Plant Operating Costs:A 1991 Upalzte,DOE/EL4-0547, May 1991, p. 5.; and Jim Clarke, “Nuclear O&M Costs Sliding Downward, UDI Says,” The Energy Daily, vol. 20, No. 127,hdy 2, 1992, p. 1.
Chapter 3-Economic Lives of Existing Nuclear Plants 193
new technology and information.102 Further, theanalysis lacked information to distinguish be-tween safety-related activities that a utility wouldhave and have not undertaken on its own absentNRC requirements. Similarly, no method wasfound to distinguish between plant aging (whichshould increase costs) and utility experience(which could either increase or decrease costs).Some general attributes of the factors affectingcost and performance are noted below.
1 Effects of Age on Cost and PerformancePlant maintenance to address aging degrada-
tion involves a variety of monitoring, evaluation,repair, and replacement activities. Some of theseactivities involve major capital additions, whichmay be very costly and could prove to be plant lifedecision points. Utilities are increasingly devel-oping life-cycle management approaches to coor-dinate long-term capital planning and mitigateaging degradation for major systems, structures,and components (SSCs).103 Although expensive,some aging management activities may actuallylead to improved economic performance. Forexample, addressing aging involves improvingmaintenance programs generally, allowing forpreventive or reliability centered maintenancerather than corrective maintenance. The result ofapplying a preventive maintenance program canbe both lower costs and improved availability.104
Plant experience may improve performance withage as well. This factor, however, is difficult to
distinguish from other age-related effects onoperational and capital additions costs.
Given the lack of experience with large nuclearplants beyond the middle of their 40 year licensedlives, available evidence to predict accurately thelong term effects of aging on economic perform-ance is limited but continues to evolve.105 As of1992, only 21 plants were 20 years or older. Thoseplants are smaller than the younger units, with anaverage capacity of 616 MW compared to 974MW.106 The evolving experience and research is
particularly important for those relatively few,but often major, SSCs intended to last the life ofa plant (e.g., the reactor pressure vessel, thecontainment structure).
EIA’s analysis of operational costs for existingplants (which, for the study period, had attainedan average age of only 13 years) suggests thatover the frost third of a plant’s assumed designlife, the beneficial effects of increasing experi-ence outweighed aging degradation effects, andcosts decline with increasing age.107 However,capital additions costs appeared to increase withage for BWR plants.
The costs of addressing aging degradation haveplayed a role in each of the three early retirementdecisions announced in 1992. For the SONGS-1and Trojan plants, steam generator deteriorationwere primary aging issues, while the costs toresolve a pressure vessel embrittlement issuecontributed to Yankee Rowe’s closure.
la u.S. Depfient of Energy, fier~ ~ormation ~“ “stratio~ An Analysis of Nuclear Plant Operating Costs: A 1991 Update,DOE/EIA-0547 (Washington, DC: May 1991).
103 see, e.g., Grove En@&ring, IIIC., ~ng.Te~ Capita[planning Considering Nuclear Plant L~e-Cycle Ma~~ernent, Ep~ T’R-101 162
(Palo Alto, CA: Electric Power Research Institute, September 1992); and Stone and Webster Engineering Corp. and Baltimore Gas and ElectricCo., Service (Saft) Water System Life-Cycle Management Evaluation, EPRI TR-102204 (Palo Alto, CA: Electric Power Research Institute,April 1993).
104 Nofiem stite~ poww Co~p~y,BWR PllotPluntLl~e~re~lon Sfw attheMontice~[o Pl~nt:Inren”rnPhase 2, EPRl NP-5836M (PdoAlto, CA: Electric Power Research Institute, October 1988).
105 J.G. Hewle~, ‘‘ne operating Costs and Longevity of Nuclear power PLuIts,’ Energy Policy, July 1992, pp. 608-622.106 us. D~p~ent of EnmU,Nuc~earReactor5 Built, BeingB~”ft) or planned: 1991, ~E/OS~.82~R55 ~~ti~o~ ~: July 1W2),
pp. ix-xiv.
107 T-J,s. Dep~ent of Energy, Ener~ ~Ormation ~‘ “stratio% An Analysis of Nuclear Plant Operating Costs: A 1991 Update,DOE/EIA-0547 (Washington, DC: May 1991), p. 9.
94 I Aging Nuclear Power Plants: Managing Plant Life and Decommissioning
I Competitive and Regulatory Pressures forImproved Cost and Performance
The past years’ early retirements and increasedattention to the prospect of retirements at otherplants have heightened the awareness that poorplant economic performance may have seriousconsequences. Increasing State regulatory atten-tion to plant life issues as part of IRP efforts andintensifying competition in the electric powermarket may be powerful motivators for improv-ing nuclear plant costs and performance. Oneindication of growing industry attention is thedevelopment of the Industrywide Initiative notedearlier to improve plant economic performance.The resulting rate of adoption of new cost- andperformance-improving measures, and the over-all effect on nuclear plant competitiveness, re-mains to be seen.
Recent efforts by several utilities to reducenuclear plant staffing, a primary component ofplant O&M, provide an example of a growingeffort to control costs.108 Since 1992, severalutilities have announced efforts to reduce nuclear-related personnel. For example, PhiladelphiaElectric Co., operator of four nuclear plants(Peach Bottom units 2 and 3 and Limerick units1 and 2) announced plans to reduce 635 of 3,400nuclear operations positions by 1995 for anexpected savings of about $35 million to $38million annually.109 Similarly, Niagara Mohawkhas announced its consideration of cost cuttingmoves to reduce its 2,000-person nuclear divisionstaff by 20 percent as part of an effort to reduceO&M costs in order to keep operating.110 TheWashington Public Power Supply System also
announced plans to reduce its nuclear plant workforce of 1,400 by 300.111
The industry continues to develop new technol-ogies with the prospect of improving nuclearplant economic performance. Among them are avariety of maintenance approaches includingadvanced decontamination techniques, reducingworker exposures and thus labor costs (see box3-A); remote surveillance and robotics that allowmonitoring and repair of equipment in previouslyinaccessible or expensive to work in areas;predictive maintenance practices that allow forbetter planning of maintenance activities (see ch.2).
The experience of Virginia Power in replacingthe SGs at its North Anna-1 plant is one exampleof how increased experience may aid in control-ling costs. That effort took a far shorter time thanplanned and typically found in previous SGreplacement projects (51 days rather than theplanned 150 days); cost substantially less ($130million rather than the $185 million planned); andresulted in far lower occupational exposures (240person-rem rather than the 480 predicted).112
Virginia Power noted that the much better thanexpected effort resulted from previous experiencewith Surry 1 and 2, careful advance planning,attention to detail, and support from the projectengineer, Bechtel Corp. Not all major projectsmay be so fortunate, however. For example,steam generator replacement for Millstone unit 2,completed in January 1993 and projected to cost$190 million, took 228 days, 93 more thanplanned.
10s Utility cost control efforts are not resrncted to nuclear plants. Many utilities are reducing non-nuclear Staffii, as well, m pm of tie~efforts to meet growing electric industry competition. See, e.g., “Redeployment to Cut PSE&G Jobs by 500-4% of Total-by Early ‘94,”Electric Utility Week, Apr. 19, 1993, p. 3; and “PG&E to Freeze Rates Through 1994, Cut Industrial Rates $lOf)-MilliorL” Electn”c UtilityWeek, Apr. 19, 1993, p. 17.
lw Electric utili~ Week, NOV. 30, 1992, p. 6; and Nucleonics Week, Apr. 22, 1993, p. 4-5.
110 ‘{N&fo~s Cost.titfig Res~ts in 1,400 Lost Jobs,” Elecm”c Utility Week, Feb. 8, 1993.
1 I 1 Harriet King, “Northwest Nuclear Plant’s New Strategy,” New York Times, June 9, 1993, p. D-3.112 “V~@a powti sets World R~Ord for Steam Generator Replacement” Nucleonics Week, Apr. 15, 1993, pp. 1,11-12.
—— —-—
Chapter 3-Economic Lives of Existing Nuclear Plants! 95
Box 3-A—Chemical Decontamination
In performing analyses to determine cost-effective occupational radiation exposure reductions, the industrytypically uses a value of $10,000 per man-rem.1 Chemical decontamination techniques represent an increasinglycommon method to reduce occupational radiation exposures and, thereby, operational costs at existingcommercial nuclear power plants.2 Decontamination-such as manual scrubbing or washing with chemicalagents-removes radiologically contaminated materials created in the pressure vessel that have dispersed andsettled throughout a steam supply system by the circulation of cooling water.
Experience with chemical decontamination at operating reactors has increased substantially in the lastdecade, particularly with the development of softer (i.e., less extreme pH ranges), more dilute solutions that causeless wear (e.g., corrosion, pitting, intergranular attack) on plant materials and systems.3 Early experience withconcentrated chemical decontaminants produced high levels of decontamination. However, because of theattendant problems of corrosion damage and waste disposal, concentrated processes will probably not be appliedto operating reactors again. A variety of dilute chemical decontaminants can achieve comparable decontamina-tion, but application times vary, which is a more important consideration for operating reactors than retired ones,because of the relatively higher costs for extended down times.
Most applications have been on boiling water reactors (BWRs), particularly as part of pipe maintenanceefforts. For BWR applications, 66 to 75 percent of the contaminant radioactivity and corrosion products have beenremoved in the first chelating step.4 Although greater levels of decontamination are possible with multiplewashings, waste volumes increase with each washing step and, with some recirculating processes, the potentialfor recontamination increases.
Opportunities exist to make chemical decontamination potentially more effective. Although at least 60commercial nuclear plant systems at more than 20 reactors have been chemically decontaminated using dilutesolutions, no plant has attempted decontamination of the entire reactor coolant system. Consolidated Edison (ConEd) has proposed demonstrating a full system decontamination (FSD) at its Indian Point unit 2 plant.5 Con Edestimates that FSD can reduce radiation fields by a factor of at least five, saving 3,500 man-rems (with an estimatedvalue of $35 million) over the nearly 20 years remaining in the life of the plant.6
I Consolidated Edison, “Abstract: National Demonstration of Full RCS Chemical Deoontamination,” 1992.
2 J.F. Remark, Applied Radiological Control, Inc,, A BevjewofP/atiW@nfam/natjon Methods: 7988 U@8fe,EPRI NP-6169 (Palo Alto, CA: Electric Power Research institute, January 1989), p. 2-9.
3 C.J, Wood and C.N. !3paiaris, Soumebook for Chernka/ Decontamination of WclearPowerPlants, EPRINP-6433 (Palo Alto, CA: Electric Power Research Institute, August 1989), pp. 1-1,1-4,2-1.
A J.F. Remark, Applied Radiological Control, Inc., A ~evjewOfP/atiDe~~ta~i~afiO~ hfethod: 1988 L!@afe,EPRI NP-6169 (Palo Alto, CA: Electric Power Research Institute, January 1989), pp. 2-1 to2-3, 2-8 to2-9; C.J. Wbodand C.N. Spalaris, Source600k for Chemical Decontamination ot/Vuclear Power P/ar?ts, EPRI NP-6433 (Palo Alto,CA: Electric Power Research Institute, August 1989), p. 2-8.
5 J.B. MaSon et al., FLI// Reactor Coo/ant syStem Chemical Decontamination at Consolidated Edjson /ndianPojnt-2 Plant, Pacific Nuclear Services, November 1991.
6 Consolidated Edison, “Abstract: National Demonstration of Full RCS Chemical Decontamination,” 1992.
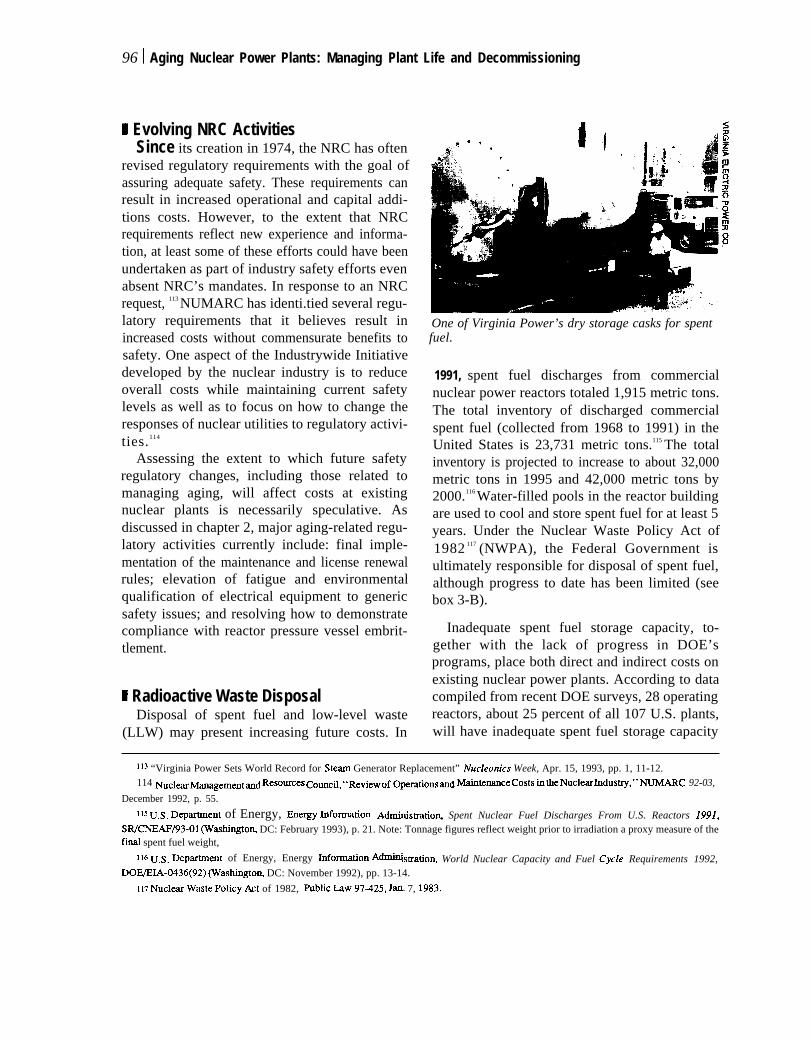
96 I Aging Nuclear Power Plants: Managing Plant Life and Decommissioning
9 Evolving NRC ActivitiesSince its creation in 1974, the NRC has often
revised regulatory requirements with the goal ofassuring adequate safety. These requirements canresult in increased operational and capital addi-tions costs. However, to the extent that NRCrequirements reflect new experience and informa-tion, at least some of these efforts could have beenundertaken as part of industry safety efforts evenabsent NRC’s mandates. In response to an NRCrequest, 113 NUMARC has identi.tied several regu-latory requirements that it believes result inincreased costs without commensurate benefits tosafety. One aspect of the Industrywide Initiativedeveloped by the nuclear industry is to reduceoverall costs while maintaining current safetylevels as well as to focus on how to change theresponses of nuclear utilities to regulatory activi-ties.114
Assessing the extent to which future safetyregulatory changes, including those related tomanaging aging, will affect costs at existingnuclear plants is necessarily speculative. Asdiscussed in chapter 2, major aging-related regu-latory activities currently include: final imple-mentation of the maintenance and license renewalrules; elevation of fatigue and environmentalqualification of electrical equipment to genericsafety issues; and resolving how to demonstratecompliance with reactor pressure vessel embrit-tlement.
1 Radioactive Waste DisposalDisposal of spent fuel and low-level waste
(LLW) may present increasing future costs. In
One of Virginia Power’s dry storage casks for spentfuel.
1991, spent fuel discharges from commercialnuclear power reactors totaled 1,915 metric tons.The total inventory of discharged commercialspent fuel (collected from 1968 to 1991) in theUnited States is 23,731 metric tons.115 The totalinventory is projected to increase to about 32,000metric tons in 1995 and 42,000 metric tons by2000.116 Water-filled pools in the reactor buildingare used to cool and store spent fuel for at least 5years. Under the Nuclear Waste Policy Act of1982 117 (NWPA), the Federal Government isultimately responsible for disposal of spent fuel,although progress to date has been limited (seebox 3-B).
Inadequate spent fuel storage capacity, to-gether with the lack of progress in DOE’sprograms, place both direct and indirect costs onexisting nuclear power plants. According to datacompiled from recent DOE surveys, 28 operatingreactors, about 25 percent of all 107 U.S. plants,will have inadequate spent fuel storage capacity
1]3 “Virginia Power Sets World Record for Steam Generator Replacement” Nucleonics Week, Apr. 15, 1993, pp. 1, 11-12.114 NuclwMmgementmd Reso~es co~cfl, 1‘Reviewof Operationsmd wte~cecosts ktheNucleuhdus~,” NUMARC 92-03,
December 1992, p. 55.
115 U.S. Dep~ent of Energy, fiergy ~orrnation Administratio~ Spent Nuclear Fuel Discharges From U.S. Reactors 1991,SR/CNEAF/93-01 (W%shingtom DC: February 1993), p. 21. Note: Tonnage figures reflect weight prior to irradiation a proxy measure of thef~ spent fuel weight,
116 u.S. Deptient of Energy, Energy hformation ~“ “stratioq World Nuclear Capacity and Fuel Cycle Requirements 1992,DOE/EIA-tM36(92) (Washingto4 DC: November 1992), pp. 13-14.
117 Nucl~ Waste policy Act of 1982, Pllblic bW 97425, Jm. 7, 1983.
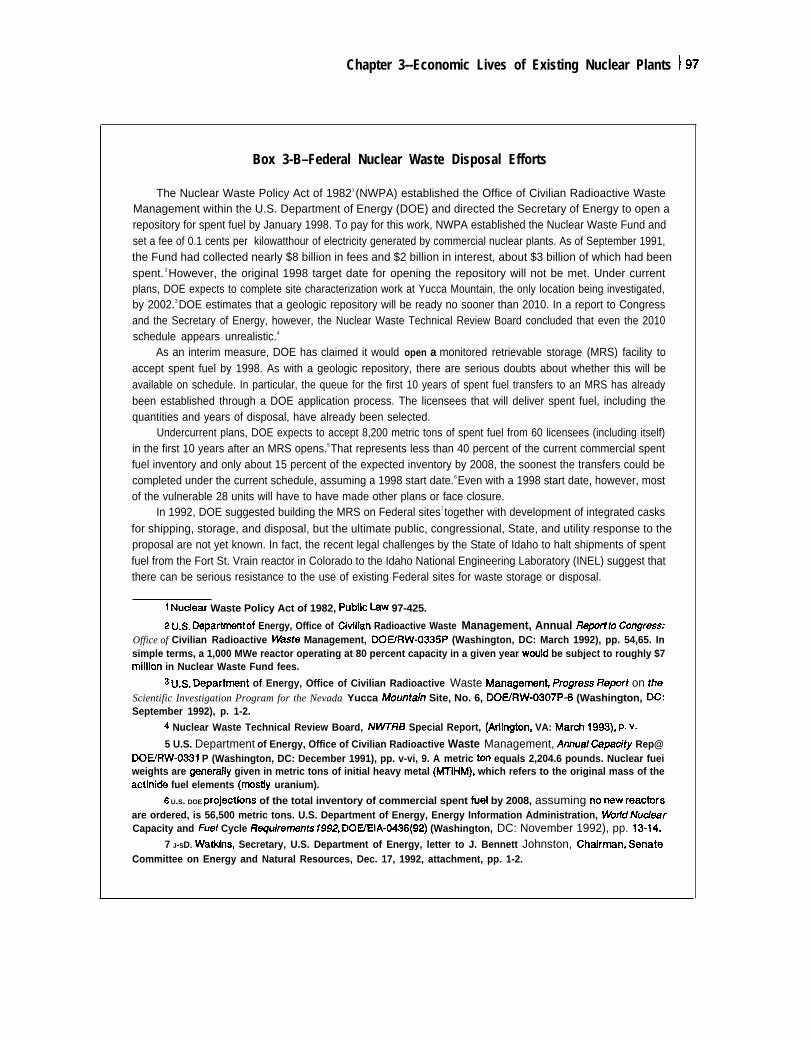
Chapter 3--Economic Lives of Existing Nuclear Plants 197
Box 3-B–Federal Nuclear Waste Disposal Efforts
The Nuclear Waste Policy Act of 19821 (NWPA) established the Office of Civilian Radioactive WasteManagement within the U.S. Department of Energy (DOE) and directed the Secretary of Energy to open arepository for spent fuel by January 1998. To pay for this work, NWPA established the Nuclear Waste Fund andset a fee of 0.1 cents per kilowatthour of electricity generated by commercial nuclear plants. As of September 1991,the Fund had collected nearly $8 billion in fees and $2 billion in interest, about $3 billion of which had beenspent. 2 However, the original 1998 target date for opening the repository will not be met. Under currentplans, DOE expects to complete site characterization work at Yucca Mountain, the only location being investigated,by 2002.3 DOE estimates that a geologic repository will be ready no sooner than 2010. In a report to Congressand the Secretary of Energy, however, the Nuclear Waste Technical Review Board concluded that even the 2010schedule appears unrealistic.4
As an interim measure, DOE has claimed it would open a monitored retrievable storage (MRS) facility toaccept spent fuel by 1998. As with a geologic repository, there are serious doubts about whether this will beavailable on schedule. In particular, the queue for the first 10 years of spent fuel transfers to an MRS has alreadybeen established through a DOE application process. The licensees that will deliver spent fuel, including thequantities and years of disposal, have already been selected.
Undercurrent plans, DOE expects to accept 8,200 metric tons of spent fuel from 60 licensees (including itself)in the first 10 years after an MRS opens.5 That represents less than 40 percent of the current commercial spentfuel inventory and only about 15 percent of the expected inventory by 2008, the soonest the transfers could becompleted under the current schedule, assuming a 1998 start date.6 Even with a 1998 start date, however, mostof the vulnerable 28 units will have to have made other plans or face closure.
In 1992, DOE suggested building the MRS on Federal sites7 together with development of integrated casksfor shipping, storage, and disposal, but the ultimate public, congressional, State, and utility response to theproposal are not yet known. In fact, the recent legal challenges by the State of Idaho to halt shipments of spentfuel from the Fort St. Vrain reactor in Colorado to the Idaho National Engineering Laboratory (INEL) suggest thatthere can be serious resistance to the use of existing Federal sites for waste storage or disposal.
1 Nuciear Waste Policy Act of 1982, Public bw 97-425.
z U.S. I)epartmentof Energy, Office of Civiiian Radioactive Waste Management, Annual t?eportto @n9~esS.’Office of Civilian Radioactive I&We Management, DOE/RW-0335P (Washington, DC: March 1992), pp. 54,65. Insimple terms, a 1,000 MWe reactor operating at 80 percent capacity in a given year wouid be subject to roughly $7miilion in Nuclear Waste Fund fees.
3 U.S. Department of Energy, Office of Civilian Radioactive Waste Managemmt, Pfogfess ~ePOrt on theScientific Investigation Program for the Nevada Yucca Mountaih Site, No. 6, DOWRW-0307P-6 (Washington, DC:September 1992), p. 1-2.
4 Nuclear Waste Technical Review Board, /VWT/?B Special Report, (Adk@On, VA: Mar* Igw), P. v.5 U.S. Department of Energy, Office of Civilian Radioactive Waste Management, Annual capacity Rep@
DOE/RW-0331 P (Washington, DC: December 1991), pp. v-vi, 9. A metric ton equals 2,204.6 pounds. Nuclear fueiweights are generaiiy given in metric tons of initial heavy metal (MTIHM), which refers to the original mass of theactinide fuel elements (rnostiy uranium).
6 U.S. DOE prc@ticms of the total inventory of commercial spent fuei by 2008, assuming no ww reactorsare ordered, is 56,500 metric tons. U.S. Department of Energy, Energy Information Administration, WxldNuc/earCapacity and Fuel Cycle Requkements 1992, DO13EIA-0436(92) (Washington, DC: November 1992), pp. 13-14.
7 J-SD. Watkins, Secretary, U.S. Department of Energy, letter to J. Bennett Johnston, Chdrman, SenateCommittee on Energy and Natural Resources, Dec. 17, 1992, attachment, pp. 1-2.
98 I Aging Nuclear Power Plants: Managing Plant Life and Decommissioning
Table 3-2—Plants Projected to Require AdditionalSpent Fuel Storage Capacity by the Year 2000
Design Loss ofcapability operability
Facility (State) (MW) (Year)
Palisades (Ml). . . . . . . . . . .Prairie Island 1 (MN), . . . .Prairie island 2 (MN). . . . .Calvert Cliffs 2 (MD). . . . . .Limerick 2 (PA). ... , . . . . .Nine Mile Point 1 (NY). . . .Point Beach 1 (WI). . . . . . .Point Beach 2 (WI). . . . . . .Calvert Cliffs 1 (MD). . . . . .Peach Bottom 2 (PA). . . . .Waterford 3 (LA). . . . . . . . .Arkansas Nuclear 1 (AR). .Big Rock Point (Ml). . . . . .Dresden 2 (IL). . . . . . . . . . .Duane Arnold (1A). . . . . . . .Ginna (NY). . . . . . . . . . . . .North Anna 1 (VA)... . . . .North Anna 2 (VA)... . . . .Peach Bottom 3 (PA). . . . .Robinson 2 (SC).. . . . . . . .Washington Nuclear 2(WA).Arkansas Nuclear 2 (AR). .Brunswick 1 (NC). . . . . . . .Brunswick 2 (NC).. . . . . . .Dresden 3 (IL). . . . . . . . . . .Maine Yankee (ME). . . . . .Millstone 2 (CT).. . . . . . . .Oyster Creek (NJ). . . . . . . .
755507503825
1,055605495495825
1,0511,075
83667
772515470911908
1,035683
1,100858767754773870863610
19931995”1995”1996*19961996199619961997”19981998199919991999199919991999199919991 999’19992000200020002000200020002000
NOTE: Units marked with an asterisk (’) have constructed or an-nounced plans to construct ISFSIS to increase their onsite spent fuelstorage capacity. The projected closure years shown above, therefore,may no longer apply to some or all of these units.SOURCE: U.S. Department of Energy, Energy Information Administra-tion, Spent Nuclear Fuel Discharges from U.S. Reactors 1991,SR/CNEAF/93-01 (Washington, DC: February 1993), pp. 14-19.
under current plans by the end of the year 2000(table 3-2).118 Although measures such as rerack-ing of spent fuel assemblies can extend the
capacity of fuel pools somewhat, the number ofutilities that will have to construct independentspent fuel storage installations (ISFSIs) in orderto continue operating is virtually certain toincrease. Dry storage facilities have been or areplanned to be constructed at several plants-boththose still operating and those undergoing orplanning decommissioning.
The direct costs of adding spent fuel storagecapacity represent a small but not negligiblepercentage of other plant operational costs. Forexample, the Baltimore Gas and Electric Co.,operator of the two Calvert Cliffs plants, hasconstructed an ISFSI for $24 million, with annualoperational costs of about $1.5 million. Theannualized cost represents less than 2 percent ofCalvert Cliffs operating costs.
Some States have been reluctant to allow ISFSIsiting, effectively representing a large indirectcost. In the extreme, lack of spent fuel storagethreatens several operating plants with prematureclosure in the next several years. For example,Minnesota’s Northern States Power operates thetwin Prairie Island plants, which have operatinglicenses expiring in 2011 and 2013, but currentstorage capacity is sufficient only through 1995.Out of concern that a requested dry storagefacility would become a de facto permanentrepository, however, the Minnesota Public Serv-ice Commission limited the utility to constructinga facility that added only 7 more years of storagecapacity. 119 A state court decision further re-
stricted ISFSI use, ruling that the State legislaturemust approve any plans to store the fuel more than8 years.120 In Wisconsin, similar concerns are at
118 U.S. Department of Energy, Energy ~orrnation Administration Spent Nuclear Fuel Discharges from U.S. Reactors 1991,SR/CNEAF/93-01 (Washington, DC: February 1993), table 4, pp. 14-19.
119 I $NspG~~ Repfieve Fro~_esoQ PSC,’ The Energy Daily, vol. 20, No. 124, J~e 29, 1992, p. 1. See also 57 FederaIRegister343 19
(Aug. 4, 1992).
Im M~esoQ law prohibits IX rrnanent fuel storage within the State. ‘‘Court Decision on Prsrie Island Fuels Argument for Moving Waste, ’Nucleonics Week, vol. 34, No. 25, June 24, 1993, p. 17.
. . —.
Chapter 3-Economic Lives of Existing Nuclear Plants 199
issue in the decision to continue operation orretire the Point Beach unit 2 nuclear plant.121
At present, the DOE is planning to construct asingle national monitored retrievable storage(MRS) facility to store commercial spent fueluntil a repository is available. Until that happens,however, an increasing number of de factoMRSs—in the form of dry cask storage installa-tions built at reactor sites—will be necessary,both for many plants to continue operating after2000 and for decommissioning to occur.
Beyond development of a repository, sometreatment methods such as transmutation and
reprocessing for spent fuel are under developmenthere and abroad but face major technical, eco-nomic, or political obstacles.122
LLW disposal costs have increased rapidly inthe past and may continue to do so. However,LLW disposal costs during plant operation cur-rently represent a fraction of 1 percent of theoperational costs of nuclear plants. Even with themuch higher disposal costs anticipated under theinterstate compacts, LLW costs would averageabout 1 percent of operational costs. However, asdiscussed in chapter 4, there remain unmetchallenges in developing LLW disposal facilities.
121 me Point ll~ch unit 2 decision also involves consideration of a major capital expense, replacemeflt of the ph@’S Steam genemtOrS.Nucleonics Week, vol. 34, No. 25, June 24, 1993, p. 17.
122 For more ~o~tion on these ~d other sPnt fiel ~ea~ent options, see M. Holt ~d J.E. Mieke, Civilian Radioactive Waste
Management: ?’echnical and Policy Issues, 91-867 ENR (Washington DC: Congressional Research Service, Dec. 10, 1991); D. Gibson, “CanAlchemy Solve the Nuclear Waste Problem?’ The Bulletin of Atomic Scientists, vol. 47, No. 6, July 1991, pp. 12-17; C. Ne~ RockwellInternational, International Programs Related to the Transmutation of Transuranics, EPRI NP-7265 (Palo Alto, CA: Electric Power ResearchInstitute, April 1991); and M. Odell, “Vitrification-World Review,” Nuclear Engineering International, vol. 37, No. 455, June 1992, pp.51-53.