Embed Size (px)
Citation preview
AgriBank: Serving Those Who Serve Rural America in These Volatile Times
Twenty First
Annual
Aldrich C.
Bloomquist
Lectureship
An address by Bill York CEO of AgCountry Farm Credit Services
7:00 a.m., Wednesday, March 27, 2013 Dakota Hall, Holiday Inn, Fargo, ND
2
This lectureship series
is sponsored by the
Quentin N. Burdick
Center for Cooperatives
with funding from the
Aldrich C. Bloomquist
Endowment,
established through
a contribution from
American Crystal Co.,
Moorhead, Minnesota
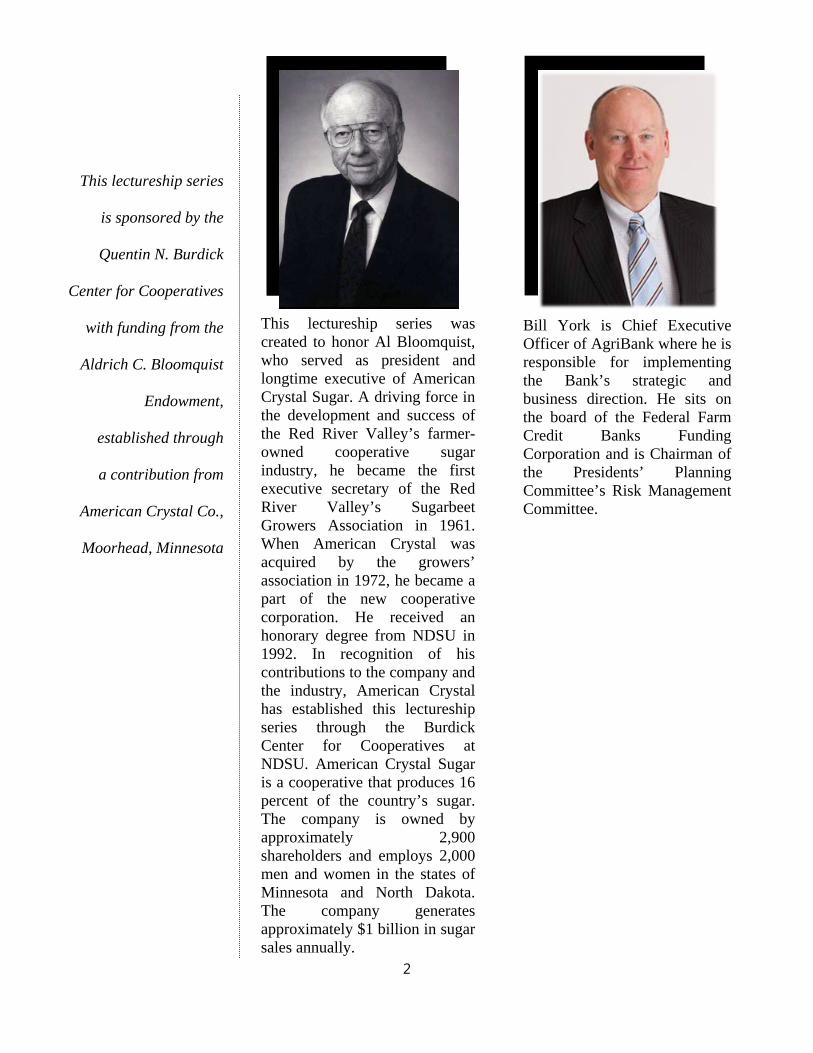
This lectureship series was created to honor Al Bloomquist, who served as president and longtime executive of American Crystal Sugar. A driving force in the development and success of the Red River Valley’s farmer-owned cooperative sugar industry, he became the first executive secretary of the Red River Valley’s Sugarbeet Growers Association in 1961. When American Crystal was acquired by the growers’ association in 1972, he became a part of the new cooperative corporation. He received an honorary degree from NDSU in 1992. In recognition of his contributions to the company and the industry, American Crystal has established this lectureship series through the Burdick Center for Cooperatives at NDSU. American Crystal Sugar is a cooperative that produces 16 percent of the country’s sugar. The company is owned by approximately 2,900 shareholders and employs 2,000 men and women in the states of Minnesota and North Dakota. The company generates approximately $1 billion in sugar sales annually.
Bill York is Chief Executive Officer of AgriBank where he is responsible for implementing the Bank’s strategic and business direction. He sits on the board of the Federal Farm Credit Banks Funding Corporation and is Chairman of the Presidents’ Planning Committee’s Risk Management Committee.
3
AgriBank: Serving Those Who Serve Rural America in These Volatile Times
Thank you for those kind remarks. This morning, I do want to introduce
a couple of colleagues that I have here. You may know Bob Bale who is the CEO of AgCountry Farm Credit Services. He is certainly an important partner of ours and quite frankly, one of my owners so I want to make sure I take care of Bob. I also want to recognize Dr. David Bullock who is here helping me out with the slides. He’s our senior economist and certainly very critical as AgriBank looks at our challenges and risks as we move forward.
The theme of my conversation this morning is, “serving those who serve rural America in volatile times.” Serving those who serve rural America is an important part of our charge at AgriBank. As I talk about the evolution and the structure of the Farm Credit system, you’ll understand why AgriBank, as an entity, is really facilitating service from our local associations. And certainly volatile times describe agriculture; they’re are good times for most, but volatility certainly describes what we’re all about in agriculture, as you well know. I will start by talking about some of the dynamics of agriculture. I’ll talk about the role of the Farm credit system. And I’ll talk a little bit about what we see as our opportunities and challenges as we move forward.
I was born and raised on a dairy farm in southern Wisconsin. As almost by definition that meant I lived with cooperatives from the time of birth. We borrowed from the local Production Credit Association and Federal Land Bank Association. We marketed our milk through the Associated Milk Producers. We bought our feed at the local co-op. Co-op was a part of the business. And for a farm boy growing up in Wisconsin, co-op was assumed to be the norm for business operation and governance. And I think all cooperatives can be proud of the history that they have demonstrated and how they have competed very successfully and evolved as business has evolved.
Twenty First
Annual
Aldrich C. Bloomquist
Lectureship
Bill York
March 27, 2013
4
As was mentioned, I did start my career in the Farm Credit system. I spent 15 years in the Farm Credit system. By looking at me, you know that that early part of my career was in the 1980s; probably one of the toughest times for rural America in my lifetime. And a lot of what I think about and a lot of how I have evolved, and how I view risk and how I view opportunity is framed by what happened to the 1980s. Certainly as I have discussions broadly now, I probably have asked more about the 1980s in the last couple years with farmland values and what’s different and what’s not than I have been for quite some time. After leaving Farm Credit, I did go to Case, then New Holland, then to CNH. I spent 12 years in those organizations. I initially started out as the first president of the New Holland Credit Company with the objective of building the infrastructure in North America
and expanding that as agriculture and production was expanding globally. From there, I was involved in setting up finance operations like Banco CNH in Brazil, finance companies in Australia and Argentina, and setting up a pan-European finance organization. So I had a great opportunity to be involved in financing across the globe during an exciting time in agriculture.
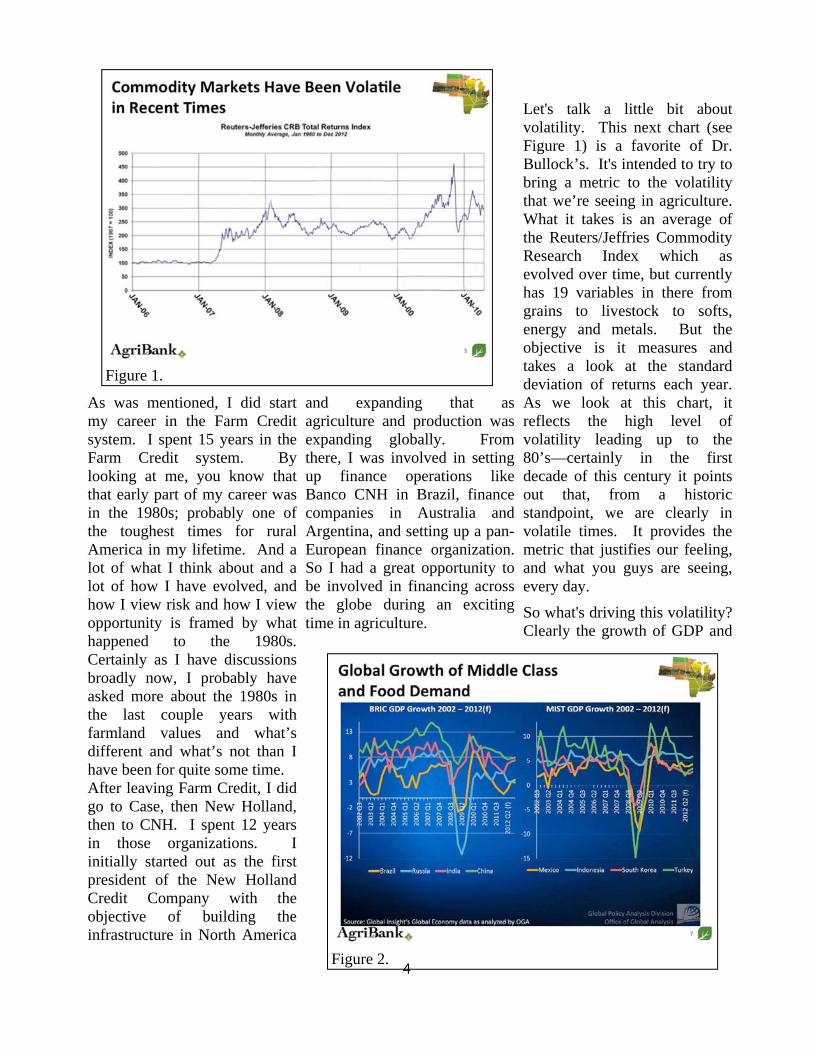
Let's talk a little bit about volatility. This next chart (see Figure 1) is a favorite of Dr. Bullock’s. It's intended to try to bring a metric to the volatility that we’re seeing in agriculture. What it takes is an average of the Reuters/Jeffries Commodity Research Index which as evolved over time, but currently has 19 variables in there from grains to livestock to softs, energy and metals. But the objective is it measures and takes a look at the standard deviation of returns each year. As we look at this chart, it reflects the high level of volatility leading up to the 80’s—certainly in the first decade of this century it points out that, from a historic standpoint, we are clearly in volatile times. It provides the metric that justifies our feeling, and what you guys are seeing, every day.
So what's driving this volatility? Clearly the growth of GDP and
Figure 1.
Figure 2.
5
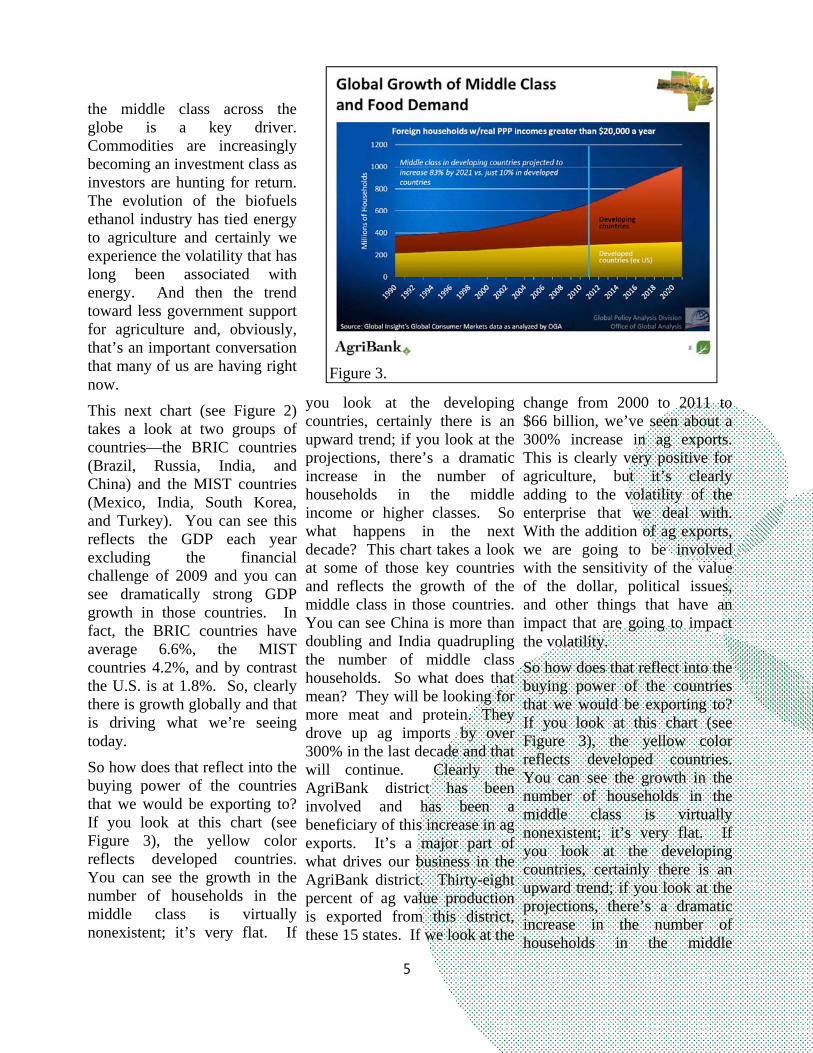
the middle class across the globe is a key driver. Commodities are increasingly becoming an investment class as investors are hunting for return. The evolution of the biofuels ethanol industry has tied energy to agriculture and certainly we experience the volatility that has long been associated with energy. And then the trend toward less government support for agriculture and, obviously, that’s an important conversation that many of us are having right now.
This next chart (see Figure 2) takes a look at two groups of countries—the BRIC countries (Brazil, Russia, India, and China) and the MIST countries (Mexico, India, South Korea, and Turkey). You can see this reflects the GDP each year excluding the financial challenge of 2009 and you can see dramatically strong GDP growth in those countries. In fact, the BRIC countries have average 6.6%, the MIST countries 4.2%, and by contrast the U.S. is at 1.8%. So, clearly there is growth globally and that is driving what we’re seeing today.
So how does that reflect into the buying power of the countries that we would be exporting to? If you look at this chart (see Figure 3), the yellow color reflects developed countries. You can see the growth in the number of households in the middle class is virtually nonexistent; it’s very flat. If
you look at the developing countries, certainly there is an upward trend; if you look at the projections, there’s a dramatic increase in the number of households in the middle income or higher classes. So what happens in the next decade? This chart takes a look at some of those key countries and reflects the growth of the middle class in those countries. You can see China is more than doubling and India quadrupling the number of middle class households. So what does that mean? They will be looking for more meat and protein. They drove up ag imports by over 300% in the last decade and that will continue. Clearly the AgriBank district has been involved and has been a beneficiary of this increase in ag exports. It’s a major part of what drives our business in the AgriBank district. Thirty-eight percent of ag value production is exported from this district, these 15 states. If we look at the
change from 2000 to 2011 to $66 billion, we’ve seen about a 300% increase in ag exports. This is clearly very positive for agriculture, but it’s clearly adding to the volatility of the enterprise that we deal with. With the addition of ag exports, we are going to be involved with the sensitivity of the value of the dollar, political issues, and other things that have an impact that are going to impact the volatility.
So how does that reflect into the buying power of the countries that we would be exporting to? If you look at this chart (see Figure 3), the yellow color reflects developed countries. You can see the growth in the number of households in the middle class is virtually nonexistent; it’s very flat. If you look at the developing countries, certainly there is an upward trend; if you look at the projections, there’s a dramatic increase in the number of households in the middle
Figure 3.
6
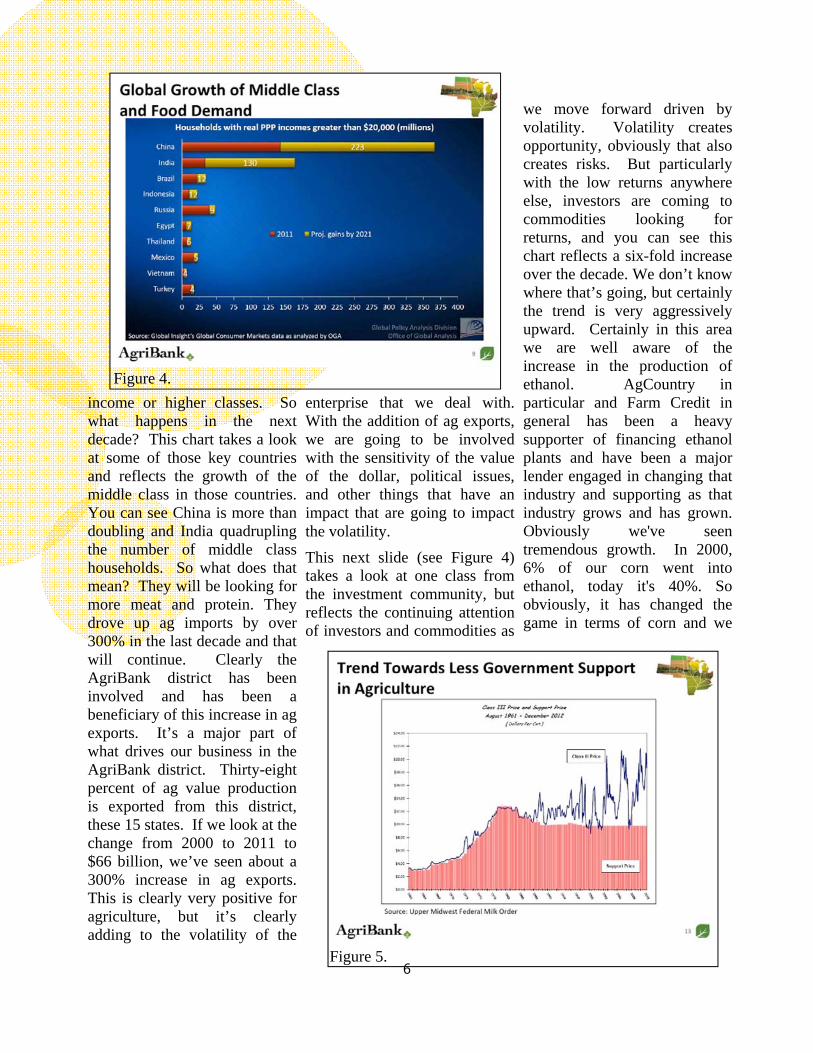
income or higher classes. So what happens in the next decade? This chart takes a look at some of those key countries and reflects the growth of the middle class in those countries. You can see China is more than doubling and India quadrupling the number of middle class households. So what does that mean? They will be looking for more meat and protein. They drove up ag imports by over 300% in the last decade and that will continue. Clearly the AgriBank district has been involved and has been a beneficiary of this increase in ag exports. It’s a major part of what drives our business in the AgriBank district. Thirty-eight percent of ag value production is exported from this district, these 15 states. If we look at the change from 2000 to 2011 to $66 billion, we’ve seen about a 300% increase in ag exports. This is clearly very positive for agriculture, but it’s clearly adding to the volatility of the
enterprise that we deal with. With the addition of ag exports, we are going to be involved with the sensitivity of the value of the dollar, political issues, and other things that have an impact that are going to impact the volatility.
This next slide (see Figure 4) takes a look at one class from the investment community, but reflects the continuing attention of investors and commodities as
we move forward driven by volatility. Volatility creates opportunity, obviously that also creates risks. But particularly with the low returns anywhere else, investors are coming to commodities looking for returns, and you can see this chart reflects a six-fold increase over the decade. We don’t know where that’s going, but certainly the trend is very aggressively upward. Certainly in this area we are well aware of the increase in the production of ethanol. AgCountry in particular and Farm Credit in general has been a heavy supporter of financing ethanol plants and have been a major lender engaged in changing that industry and supporting as that industry grows and has grown. Obviously we've seen tremendous growth. In 2000, 6% of our corn went into ethanol, today it's 40%. So obviously, it has changed the game in terms of corn and we
Figure 4.
Figure 5.
7
are now at a challenging phase. The E-10 blend wall is here. We’re seeing stabilization, even declining gasoline demand. So the question is what happens to ethanol as we move forward? Obviously you’re aware of some of the political push-back to ethanol, so that adds another component of risk to an already volatile ag economy. With the advent of ethanol, we've obviously increased the linkage between energy and ag production. We've kind of borrowed some more volatility from the energy industry. So once again adding to that uncertainty, adding to that risk.
Less government support for farming. Since the 1990s, the government has tried to move away from a price support to an income support system generally. And as price supports shrink compared to the market price, you start to see de-linkage of market prices and you see volatility, and, certainly, this is an example (see Figure 5) from dairy, an industry I'm very familiar with, and as we got to the point that you saw a separation, obviously you brought additional volatility to pricing. Add that the growing export market, which had been very strong since the mid point of the last decade; add some additional buyers like Mexico and the Far East, and you see a lot of volatility in pricing. And obviously that something, as a lender, we’re very, very concerned about.
Of course with volatility there’s greater opportunity and greater risk. As a lender to ag and rural America were obviously very concerned about that. We’re very focused, and we understand that it’s our mission, to be able to support production and marketing and processing in an environment that is more volatile, more risky. We need to plan our business around being prepared to provide credit through all the cycles that we may run into.
As we look at AgriBank in particular within the Farm Credit system, we are a central bank that’s focused on funding for the local associations. We provide critical asset and liability management for the district. If we step back and take a look at the challenges of the 1980s and analyze what really happened and drove some of the problems of the 1980s, one of the key drivers or maybe the driver was asset liability management not being able to
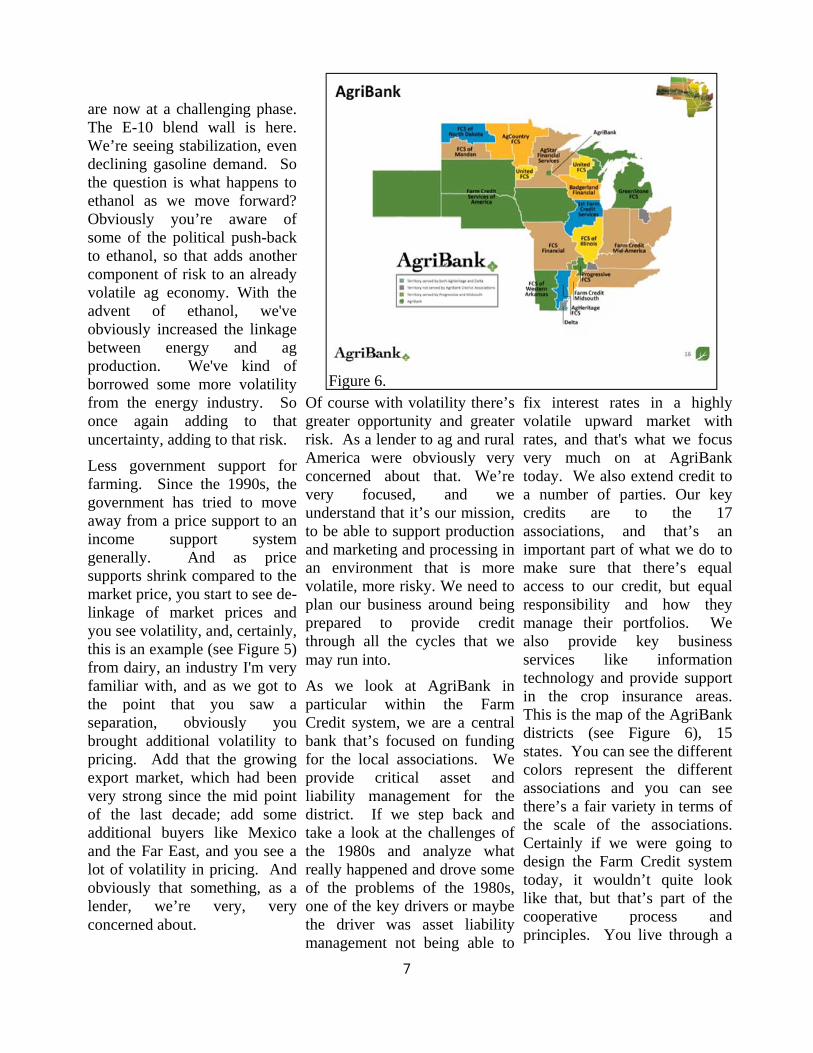
fix interest rates in a highly volatile upward market with rates, and that's what we focus very much on at AgriBank today. We also extend credit to a number of parties. Our key credits are to the 17 associations, and that’s an important part of what we do to make sure that there’s equal access to our credit, but equal responsibility and how they manage their portfolios. We also provide key business services like information technology and provide support in the crop insurance areas. This is the map of the AgriBank districts (see Figure 6), 15 states. You can see the different colors represent the different associations and you can see there’s a fair variety in terms of the scale of the associations. Certainly if we were going to design the Farm Credit system today, it wouldn’t quite look like that, but that’s part of the cooperative process and principles. You live through a
Figure 6.
8
series of decisions that were made by your predecessors and most of them have been very, very good. Some of them you may kind of question in retrospect, but that’s how we got to this structure. I would say that we do have 17 highly-rated, very viable owners and we’re very appreciative of that and very appreciative of their partnership.
The next chart (see Figure 7) reflects our 17 owners, our 17 associations, and reflects the asset size of those associations. You can see that we’ve got some very large associations, approaching $20 billion each; and we’ve got one very small one. On average we have, by far, the largest associations in the Farm Credit system, averaging about $5 billion a piece. As we manage these large associations, obviously that adds additional components of risk in that nobody would be very comfortable if we saw adverse credits in a $20 billion
organization. We certainly don’t expect to see that, but we’re certainly managing so we don’t get there, and I must say that the leadership of these organizations is very, very strong. I’ll talk a little bit in a minute about the banks in the system. Actually, two associations are bigger than one of the banks in the system and nearly the size of the second largest bank in the system. So
we do have significant scale within the AgriBank district.
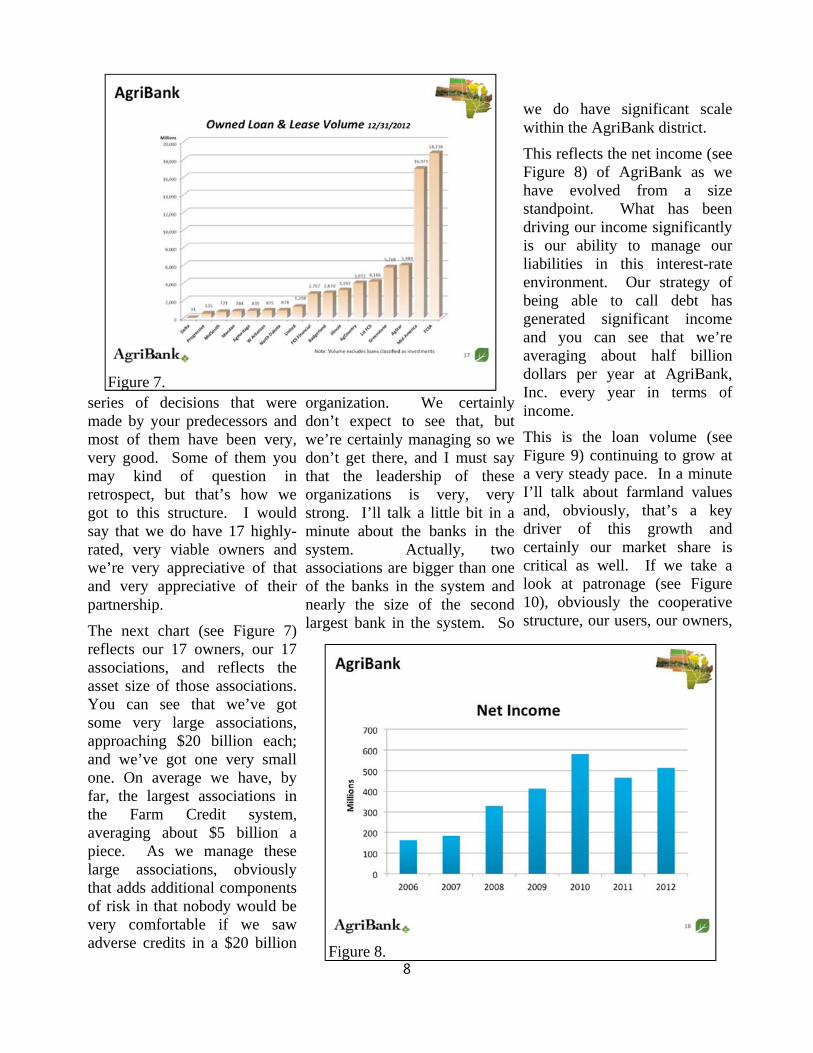
This reflects the net income (see Figure 8) of AgriBank as we have evolved from a size standpoint. What has been driving our income significantly is our ability to manage our liabilities in this interest-rate environment. Our strategy of being able to call debt has generated significant income and you can see that we’re averaging about half billion dollars per year at AgriBank, Inc. every year in terms of income.
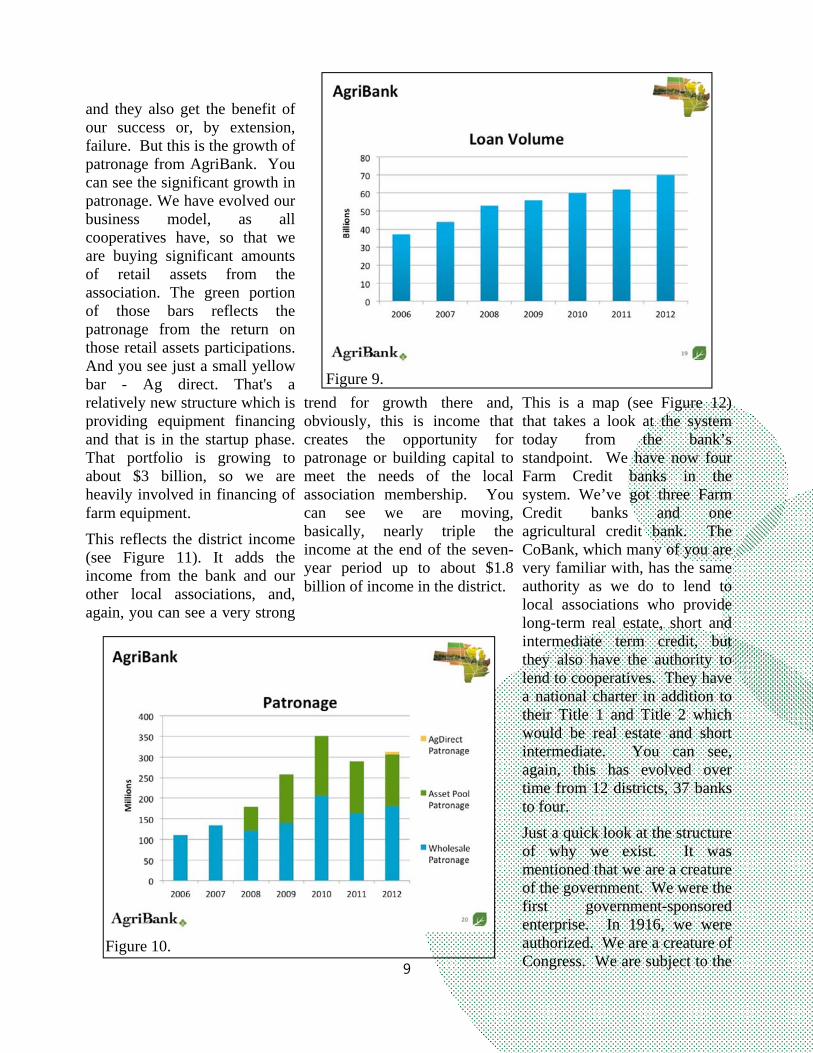
This is the loan volume (see Figure 9) continuing to grow at a very steady pace. In a minute I’ll talk about farmland values and, obviously, that’s a key driver of this growth and certainly our market share is critical as well. If we take a look at patronage (see Figure 10), obviously the cooperative structure, our users, our owners,
Figure 7.
Figure 8.
9
and they also get the benefit of our success or, by extension, failure. But this is the growth of patronage from AgriBank. You can see the significant growth in patronage. We have evolved our business model, as all cooperatives have, so that we are buying significant amounts of retail assets from the association. The green portion of those bars reflects the patronage from the return on those retail assets participations. And you see just a small yellow bar - Ag direct. That's a relatively new structure which is providing equipment financing and that is in the startup phase. That portfolio is growing to about $3 billion, so we are heavily involved in financing of farm equipment.
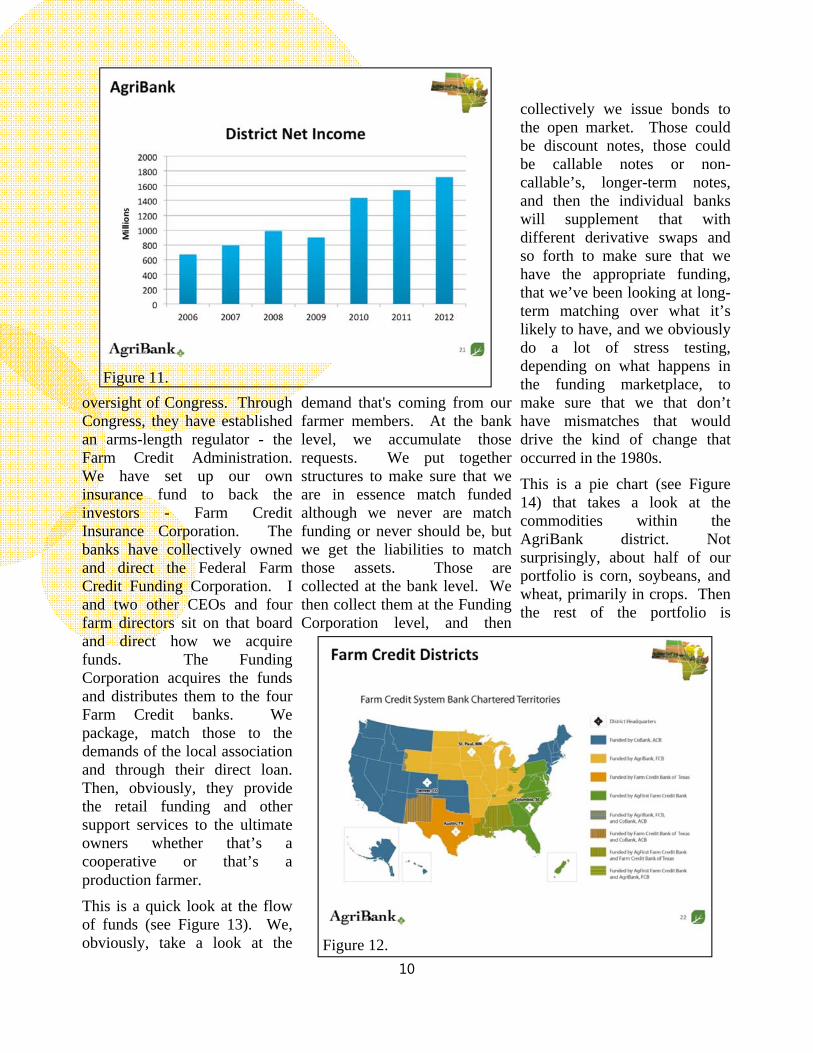
This reflects the district income (see Figure 11). It adds the income from the bank and our other local associations, and, again, you can see a very strong
trend for growth there and, obviously, this is income that creates the opportunity for patronage or building capital to meet the needs of the local association membership. You can see we are moving, basically, nearly triple the income at the end of the seven-year period up to about $1.8 billion of income in the district.
This is a map (see Figure 12) that takes a look at the system today from the bank’s standpoint. We have now four Farm Credit banks in the system. We’ve got three Farm Credit banks and one agricultural credit bank. The CoBank, which many of you are very familiar with, has the same authority as we do to lend to local associations who provide long-term real estate, short and intermediate term credit, but they also have the authority to lend to cooperatives. They have a national charter in addition to their Title 1 and Title 2 which would be real estate and short intermediate. You can see, again, this has evolved over time from 12 districts, 37 banks to four.
Just a quick look at the structure of why we exist. It was mentioned that we are a creature of the government. We were the first government-sponsored enterprise. In 1916, we were authorized. We are a creature of Congress. We are subject to the
Figure 9.
Figure 10.
10
oversight of Congress. Through Congress, they have established an arms-length regulator - the Farm Credit Administration. We have set up our own insurance fund to back the investors - Farm Credit Insurance Corporation. The banks have collectively owned and direct the Federal Farm Credit Funding Corporation. I and two other CEOs and four farm directors sit on that board and direct how we acquire funds. The Funding Corporation acquires the funds and distributes them to the four Farm Credit banks. We package, match those to the demands of the local association and through their direct loan. Then, obviously, they provide the retail funding and other support services to the ultimate owners whether that’s a cooperative or that’s a production farmer.
This is a quick look at the flow of funds (see Figure 13). We, obviously, take a look at the
demand that's coming from our farmer members. At the bank level, we accumulate those requests. We put together structures to make sure that we are in essence match funded although we never are match funding or never should be, but we get the liabilities to match those assets. Those are collected at the bank level. We then collect them at the Funding Corporation level, and then
collectively we issue bonds to the open market. Those could be discount notes, those could be callable notes or non-callable’s, longer-term notes, and then the individual banks will supplement that with different derivative swaps and so forth to make sure that we have the appropriate funding, that we’ve been looking at long-term matching over what it’s likely to have, and we obviously do a lot of stress testing, depending on what happens in the funding marketplace, to make sure that we that don’t have mismatches that would drive the kind of change that occurred in the 1980s.
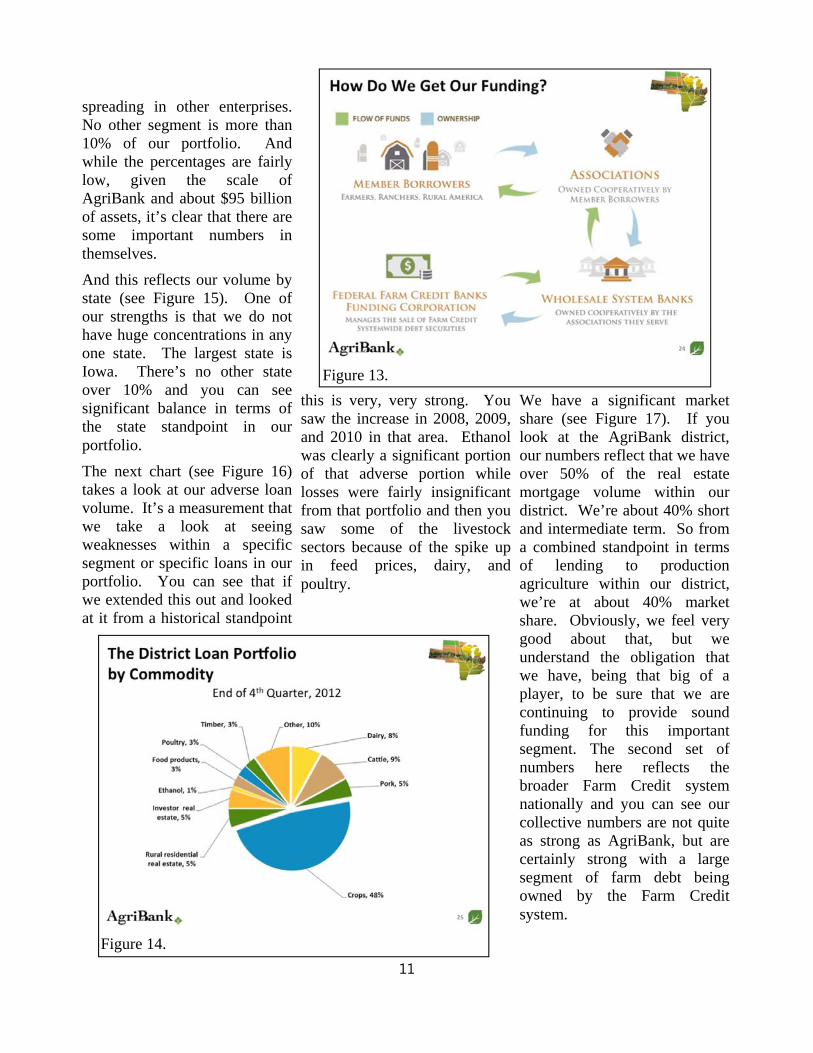
This is a pie chart (see Figure 14) that takes a look at the commodities within the AgriBank district. Not surprisingly, about half of our portfolio is corn, soybeans, and wheat, primarily in crops. Then the rest of the portfolio is
Figure 12.
Figure 11.
11
spreading in other enterprises. No other segment is more than 10% of our portfolio. And while the percentages are fairly low, given the scale of AgriBank and about $95 billion of assets, it’s clear that there are some important numbers in themselves.
And this reflects our volume by state (see Figure 15). One of our strengths is that we do not have huge concentrations in any one state. The largest state is Iowa. There’s no other state over 10% and you can see significant balance in terms of the state standpoint in our portfolio.
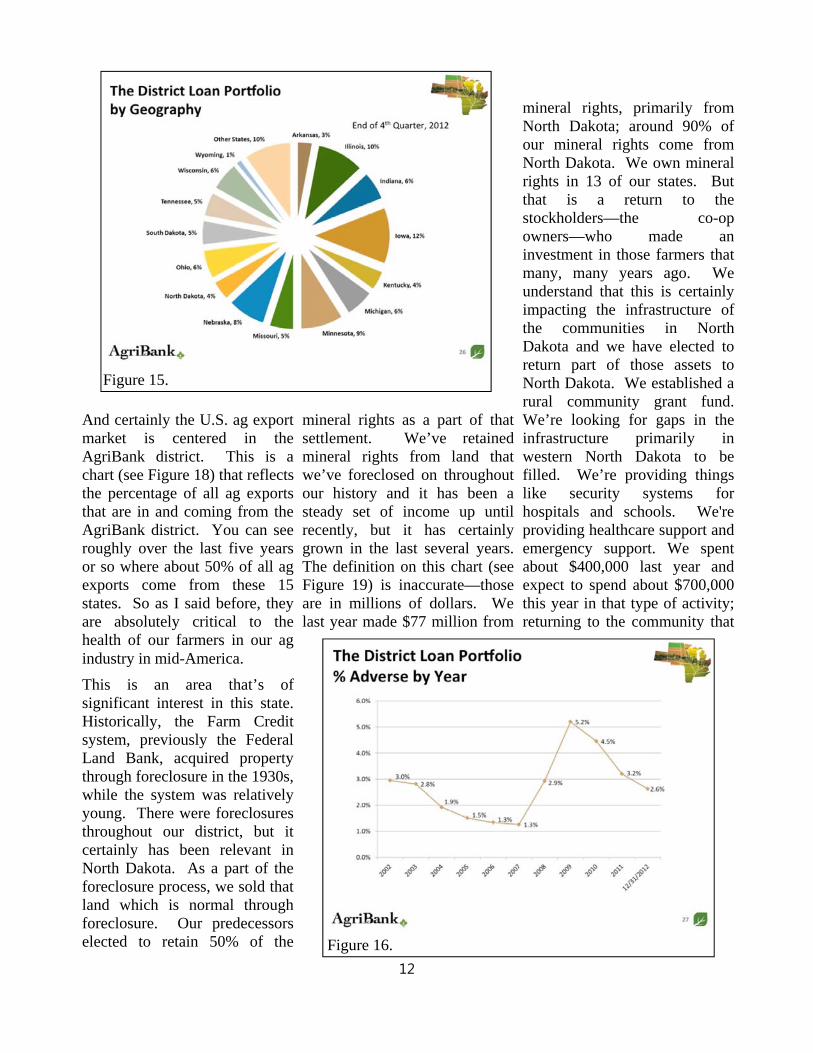
The next chart (see Figure 16) takes a look at our adverse loan volume. It’s a measurement that we take a look at seeing weaknesses within a specific segment or specific loans in our portfolio. You can see that if we extended this out and looked at it from a historical standpoint
this is very, very strong. You saw the increase in 2008, 2009, and 2010 in that area. Ethanol was clearly a significant portion of that adverse portion while losses were fairly insignificant from that portfolio and then you saw some of the livestock sectors because of the spike up in feed prices, dairy, and poultry.
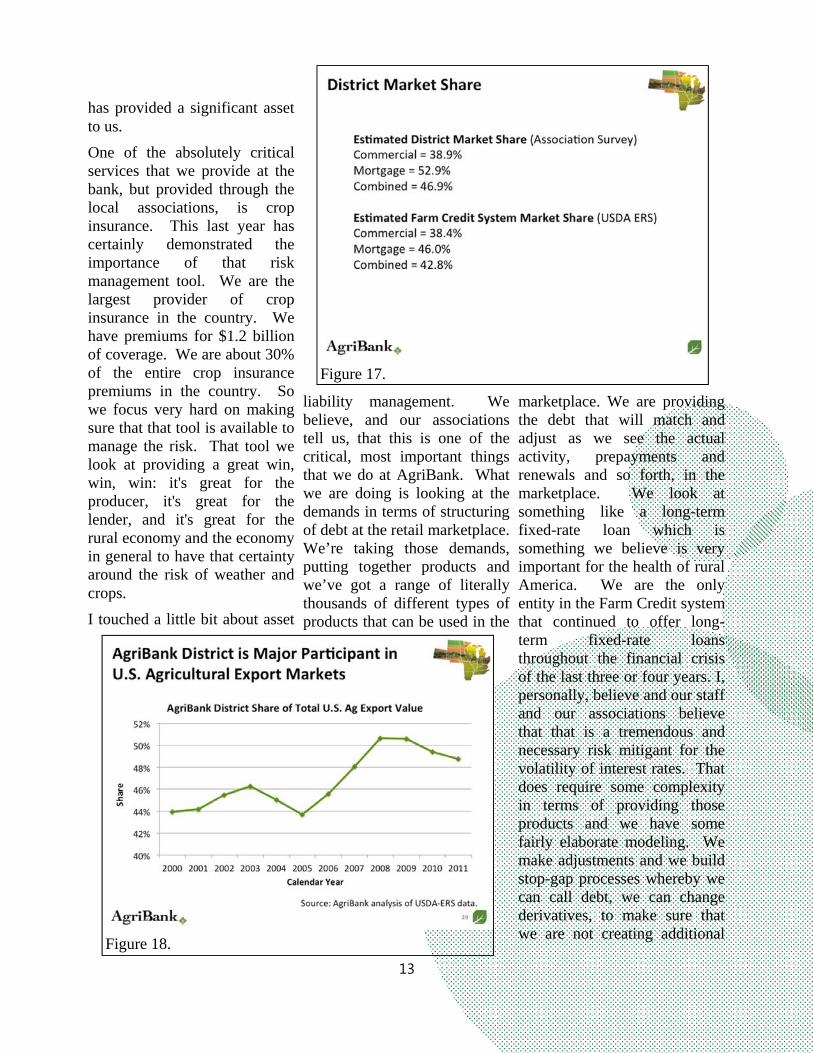
We have a significant market share (see Figure 17). If you look at the AgriBank district, our numbers reflect that we have over 50% of the real estate mortgage volume within our district. We’re about 40% short and intermediate term. So from a combined standpoint in terms of lending to production agriculture within our district, we’re at about 40% market share. Obviously, we feel very good about that, but we understand the obligation that we have, being that big of a player, to be sure that we are continuing to provide sound funding for this important segment. The second set of numbers here reflects the broader Farm Credit system nationally and you can see our collective numbers are not quite as strong as AgriBank, but are certainly strong with a large segment of farm debt being owned by the Farm Credit system.
Figure 13.
Figure 14.
12
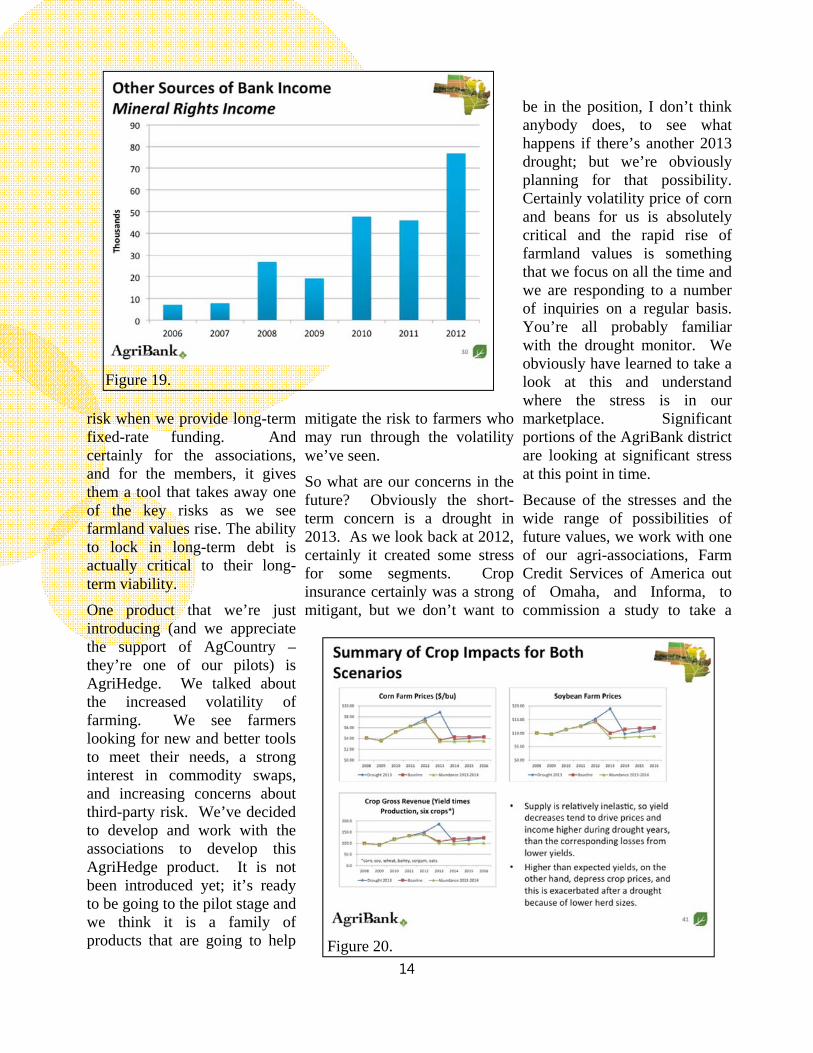
And certainly the U.S. ag export market is centered in the AgriBank district. This is a chart (see Figure 18) that reflects the percentage of all ag exports that are in and coming from the AgriBank district. You can see roughly over the last five years or so where about 50% of all ag exports come from these 15 states. So as I said before, they are absolutely critical to the health of our farmers in our ag industry in mid-America.
This is an area that’s of significant interest in this state. Historically, the Farm Credit system, previously the Federal Land Bank, acquired property through foreclosure in the 1930s, while the system was relatively young. There were foreclosures throughout our district, but it certainly has been relevant in North Dakota. As a part of the foreclosure process, we sold that land which is normal through foreclosure. Our predecessors elected to retain 50% of the
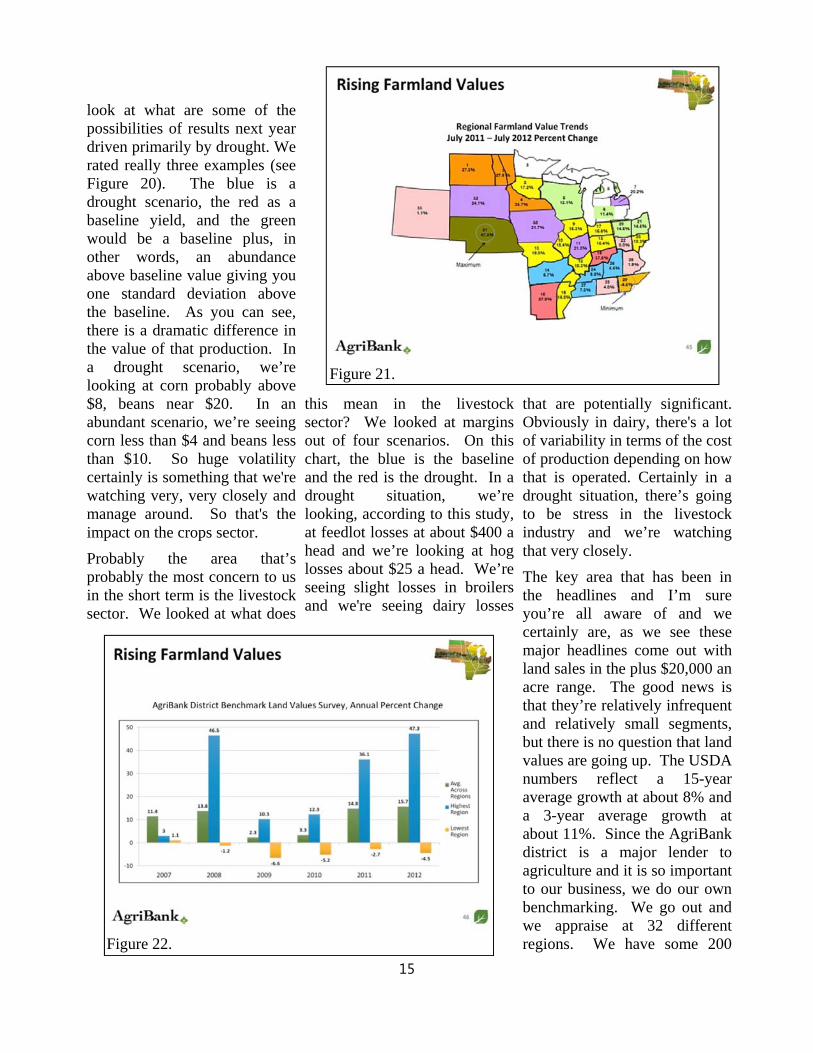
mineral rights as a part of that settlement. We’ve retained mineral rights from land that we’ve foreclosed on throughout our history and it has been a steady set of income up until recently, but it has certainly grown in the last several years. The definition on this chart (see Figure 19) is inaccurate—those are in millions of dollars. We last year made $77 million from
mineral rights, primarily from North Dakota; around 90% of our mineral rights come from North Dakota. We own mineral rights in 13 of our states. But that is a return to the stockholders—the co-op owners—who made an investment in those farmers that many, many years ago. We understand that this is certainly impacting the infrastructure of the communities in North Dakota and we have elected to return part of those assets to North Dakota. We established a rural community grant fund. We’re looking for gaps in the infrastructure primarily in western North Dakota to be filled. We’re providing things like security systems for hospitals and schools. We're providing healthcare support and emergency support. We spent about $400,000 last year and expect to spend about $700,000 this year in that type of activity; returning to the community that
Figure 15.
Figure 16.
13
has provided a significant asset to us.
One of the absolutely critical services that we provide at the bank, but provided through the local associations, is crop insurance. This last year has certainly demonstrated the importance of that risk management tool. We are the largest provider of crop insurance in the country. We have premiums for $1.2 billion of coverage. We are about 30% of the entire crop insurance premiums in the country. So we focus very hard on making sure that that tool is available to manage the risk. That tool we look at providing a great win, win, win: it's great for the producer, it's great for the lender, and it's great for the rural economy and the economy in general to have that certainty around the risk of weather and crops.
I touched a little bit about asset
liability management. We believe, and our associations tell us, that this is one of the critical, most important things that we do at AgriBank. What we are doing is looking at the demands in terms of structuring of debt at the retail marketplace. We’re taking those demands, putting together products and we’ve got a range of literally thousands of different types of products that can be used in the
marketplace. We are providing the debt that will match and adjust as we see the actual activity, prepayments and renewals and so forth, in the marketplace. We look at something like a long-term fixed-rate loan which is something we believe is very important for the health of rural America. We are the only entity in the Farm Credit system that continued to offer long-term fixed-rate loans throughout the financial crisis of the last three or four years. I, personally, believe and our staff and our associations believe that that is a tremendous and necessary risk mitigant for the volatility of interest rates. That does require some complexity in terms of providing those products and we have some fairly elaborate modeling. We make adjustments and we build stop-gap processes whereby we can call debt, we can change derivatives, to make sure that we are not creating additional
Figure 17.
Figure 18.
14
risk when we provide long-term fixed-rate funding. And certainly for the associations, and for the members, it gives them a tool that takes away one of the key risks as we see farmland values rise. The ability to lock in long-term debt is actually critical to their long-term viability.
One product that we’re just introducing (and we appreciate the support of AgCountry –they’re one of our pilots) is AgriHedge. We talked about the increased volatility of farming. We see farmers looking for new and better tools to meet their needs, a strong interest in commodity swaps, and increasing concerns about third-party risk. We’ve decided to develop and work with the associations to develop this AgriHedge product. It is not been introduced yet; it’s ready to be going to the pilot stage and we think it is a family of products that are going to help
mitigate the risk to farmers who may run through the volatility we’ve seen.
So what are our concerns in the future? Obviously the short-term concern is a drought in 2013. As we look back at 2012, certainly it created some stress for some segments. Crop insurance certainly was a strong mitigant, but we don’t want to
be in the position, I don’t think anybody does, to see what happens if there’s another 2013 drought; but we’re obviously planning for that possibility. Certainly volatility price of corn and beans for us is absolutely critical and the rapid rise of farmland values is something that we focus on all the time and we are responding to a number of inquiries on a regular basis. You’re all probably familiar with the drought monitor. We obviously have learned to take a look at this and understand where the stress is in our marketplace. Significant portions of the AgriBank district are looking at significant stress at this point in time.
Because of the stresses and the wide range of possibilities of future values, we work with one of our agri-associations, Farm Credit Services of America out of Omaha, and Informa, to commission a study to take a
Figure 19.
Figure 20.
15
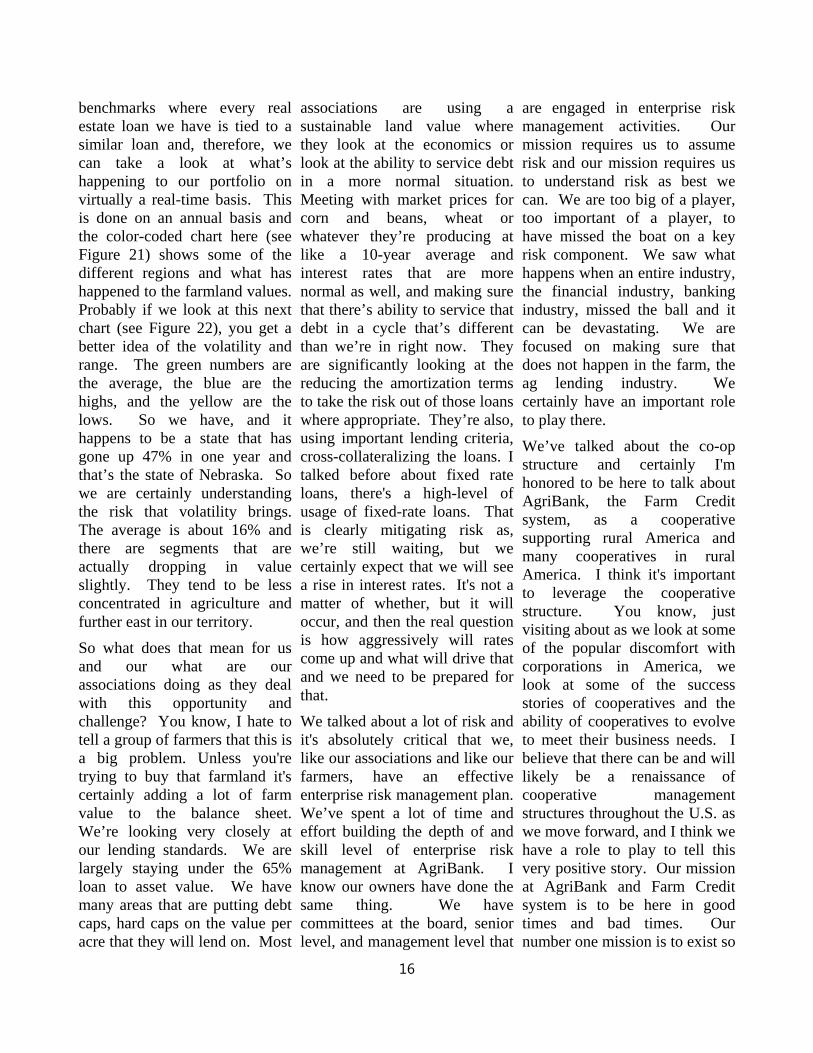
look at what are some of the possibilities of results next year driven primarily by drought. We rated really three examples (see Figure 20). The blue is a drought scenario, the red as a baseline yield, and the green would be a baseline plus, in other words, an abundance above baseline value giving you one standard deviation above the baseline. As you can see, there is a dramatic difference in the value of that production. In a drought scenario, we’re looking at corn probably above $8, beans near $20. In an abundant scenario, we’re seeing corn less than $4 and beans less than $10. So huge volatility certainly is something that we're watching very, very closely and manage around. So that's the impact on the crops sector.
Probably the area that’s probably the most concern to us in the short term is the livestock sector. We looked at what does
this mean in the livestock sector? We looked at margins out of four scenarios. On this chart, the blue is the baseline and the red is the drought. In a drought situation, we’re looking, according to this study, at feedlot losses at about $400 a head and we’re looking at hog losses about $25 a head. We’re seeing slight losses in broilers and we're seeing dairy losses
that are potentially significant. Obviously in dairy, there's a lot of variability in terms of the cost of production depending on how that is operated. Certainly in a drought situation, there’s going to be stress in the livestock industry and we’re watching that very closely.
The key area that has been in the headlines and I’m sure you’re all aware of and we certainly are, as we see these major headlines come out with land sales in the plus $20,000 an acre range. The good news is that they’re relatively infrequent and relatively small segments, but there is no question that land values are going up. The USDA numbers reflect a 15-year average growth at about 8% and a 3-year average growth at about 11%. Since the AgriBank district is a major lender to agriculture and it is so important to our business, we do our own benchmarking. We go out and we appraise at 32 different regions. We have some 200
Figure 21.
Figure 22.
16
benchmarks where every real estate loan we have is tied to a similar loan and, therefore, we can take a look at what’s happening to our portfolio on virtually a real-time basis. This is done on an annual basis and the color-coded chart here (see Figure 21) shows some of the different regions and what has happened to the farmland values. Probably if we look at this next chart (see Figure 22), you get a better idea of the volatility and range. The green numbers are the average, the blue are the highs, and the yellow are the lows. So we have, and it happens to be a state that has gone up 47% in one year and that’s the state of Nebraska. So we are certainly understanding the risk that volatility brings. The average is about 16% and there are segments that are actually dropping in value slightly. They tend to be less concentrated in agriculture and further east in our territory.
So what does that mean for us and our what are our associations doing as they deal with this opportunity and challenge? You know, I hate to tell a group of farmers that this is a big problem. Unless you're trying to buy that farmland it's certainly adding a lot of farm value to the balance sheet. We’re looking very closely at our lending standards. We are largely staying under the 65% loan to asset value. We have many areas that are putting debt caps, hard caps on the value per acre that they will lend on. Most
associations are using a sustainable land value where they look at the economics or look at the ability to service debt in a more normal situation. Meeting with market prices for corn and beans, wheat or whatever they’re producing at like a 10-year average and interest rates that are more normal as well, and making sure that there’s ability to service that debt in a cycle that’s different than we’re in right now. They are significantly looking at the reducing the amortization terms to take the risk out of those loans where appropriate. They’re also, using important lending criteria, cross-collateralizing the loans. I talked before about fixed rate loans, there's a high-level of usage of fixed-rate loans. That is clearly mitigating risk as, we’re still waiting, but we certainly expect that we will see a rise in interest rates. It's not a matter of whether, but it will occur, and then the real question is how aggressively will rates come up and what will drive that and we need to be prepared for that.
We talked about a lot of risk and it's absolutely critical that we, like our associations and like our farmers, have an effective enterprise risk management plan. We’ve spent a lot of time and effort building the depth of and skill level of enterprise risk management at AgriBank. I know our owners have done the same thing. We have committees at the board, senior level, and management level that
are engaged in enterprise risk management activities. Our mission requires us to assume risk and our mission requires us to understand risk as best we can. We are too big of a player, too important of a player, to have missed the boat on a key risk component. We saw what happens when an entire industry, the financial industry, banking industry, missed the ball and it can be devastating. We are focused on making sure that does not happen in the farm, the ag lending industry. We certainly have an important role to play there.
We’ve talked about the co-op structure and certainly I'm honored to be here to talk about AgriBank, the Farm Credit system, as a cooperative supporting rural America and many cooperatives in rural America. I think it's important to leverage the cooperative structure. You know, just visiting about as we look at some of the popular discomfort with corporations in America, we look at some of the success stories of cooperatives and the ability of cooperatives to evolve to meet their business needs. I believe that there can be and will likely be a renaissance of cooperative management structures throughout the U.S. as we move forward, and I think we have a role to play to tell this very positive story. Our mission at AgriBank and Farm Credit system is to be here in good times and bad times. Our number one mission is to exist so
17
as to provide funding through the down-cycle. That’s our focus and that’s what’s driving much of what we do today. We have this distinct advantage of we don’t report to shareholders who are looking for dividends or quarterly returns. We’re looking for long-term benefit of our shareholders. They understand that and that gives us the opportunity to make some important long-term decisions and, I believe hopefully, that we’ll be supportive for agriculture in rural America as we move forward. We want to take the balanced and appropriate view for agriculture. Agriculture is our only business. By charter, we cannot do anything else other than support agriculture in rural America. We want to make sure we do that well and that’s very important to us. As we look at the cooperative structure, not only do we provide loans, but we provide appropriate returns to the risk of capital of our owners and through patronage
or through other value adds, we are returning that to our owners and I think that’s an important function that cooperatives have and I’d like to think that we’re doing that pretty effectively.
Farm Credit will continue to provide funding for the increased volatility in the ag marketplace. We understand that there is a growing demand that is going to require more creativity, more discipline in funding for all of agriculture whatever segment that may be. We have seen substantial growth at AgriBank, we expect that growth will continue, and we see great opportunity in broader, global marketplace. We want to make sure that we are a key player supporting our farmers, our associations as they address these challenges going forward. Not only agriculture and rural America, America and globally we need to do this well or we will have significant problems globally and we understand that.
So what’s our map for success?
Clearly, the cooperative structure. Clearly association partnerships. We work closely with our associations and listen to what their needs are and try to meet their demands as they listen to their customers and meet their demands going forward. And we focus on the broad mission of serving rural America to make sure that infrastructure is there to do the important job that we collectively have to do.
With that, I appreciate your attention. Hopefully, you found it useful.