Embed Size (px)
Citation preview
Canadian InternationalDevelopment Agency
Project Implemented byInternational Finance Corporation
Project Financed by
Sida Swedish International Development Cooperation Agency
Canadian InternationalDevelopment Agency
Project Implemented byInternational Finance Corporation
Project Financed by
Sida Swedish International Development Cooperation Agency
Agribusiness Development Project in Ukraine
Report on Farming and Agribusiness
in Ukraine
Analysis of the Results of a Sociological Survey on the Development of Ukraine’s Agricultural Sector
Edited by Oleksandr Kobzev
Kyiv 2002
AUTHORS OF SECTIONS
GOAL, OBJECTIVES, AND METHODOLOGY OF THE SURVEY—Oksana Bandurovych, Chief Manager of Taylor Nelson Sofres Ukraine FARMING OPERATIONS—Oleksandr Kobzev, Project Economic-analyst MARKETING AGRICULTURAL PRODUCE—Andrii Andriushko, Agribusiness and Marketing Specialist, Oleksandr Kobzev AGRICULTURAL LENDING AND INSURANCE IN UKRAINE—Victoria Yakubovych, Project Rural Finance Specialist MANAGEMENT AND LEGAL ASPECTS OF FARMING OPERATIONS—Oleksandr Polivodsky, Project Lawyer SOCIAL ASPECTS OF THE AGRICULTURAL SECTOR AND RURAL DEVELOPMENT—Oleksandr Kobzev
TABLE OF CONTENT: INTRODUCTION ………………………………………………………………………………. 4 EXECUTIVE SUMMARY……………………………………………….……………………... 5 Characteristics of Farming Production …………………………………………………………… 5 Marketing Agricultural Produce…………………………………………………………………... 5 Agricultural Financing and Insurance Conditions………………………………………………… 6 Managerial and Legal Aspects of Farming Operations…………………………………………… 6 Social Aspects of the Agricultural Sector and Rural Area Development ………………………… 7 GOAL, OBJECTIVES, AND METHODOLOGY OF THE SURVEY ……………………… 8 FARMING OPERATIONS …………………………………………………………………….. 9 Organisational Forms of Farms and Years of Experience in Agribusiness ……………………… 9 Sizes of Surveyed Farms and Specialists on Staff ……………………………………………….. 9 Specialisation and Main Crop Performance Indicators…………………………………………… 11 Equipment and Inputs……………………………………………………………………………... 12 Agronomy and Environmentally Friendly Farming………………………………………………. 14 Production Problems, Knowledge and Skills of Farmers…………………………………………. 16 MARKETING AGRICULTURAL PRODUCE ………………………………………………. 17 Main Problems in Marketing Agricultural Produce ………………………………………………. 17 Distribution Channels and Sales Markets ………………………………………………………… 18 Sources of Marketing Information and Need for Skills and Expertise …………………………… 20 AGRICULTURAL LENDING AND INSURANCE IN UKRAINE …………………………. 23 Main Sources of Funding………………………………………………………………………….. 23 Size and Usage of Credits…………………………………………………………………………. 24 Loan Repayment and Collateral Requirements ………………………………………………….. 27 Major Obstacles to Increasing Loan Amounts …………………………………………………… 29 Insurance………………………………………………………………………………………….. 30 Farmers’ Needs for Skills and Expertise …………………………………………………………. 31 MANAGEMENT AND LEGAL ASPECTS OF FARMING OPERATIONS …..…………… 33 Regulation of Landownership Relations…………………………………………………………… 34 Land and Asset Leasing at Farming Enterprises ………………………………………………….. 34 SOCIAL ASPECTS OF THE AGRICULTURAL SECTOR AND RURAL DEVELOPMENT ………………………………………………………………. 38 Social and Demographic Profile of Farmers ……………………………………………………… 38 Living Standards and Public Activities of Farmers……………………………………………….. 39 ANNEXES…………………………………………………………………………………………. 42
4
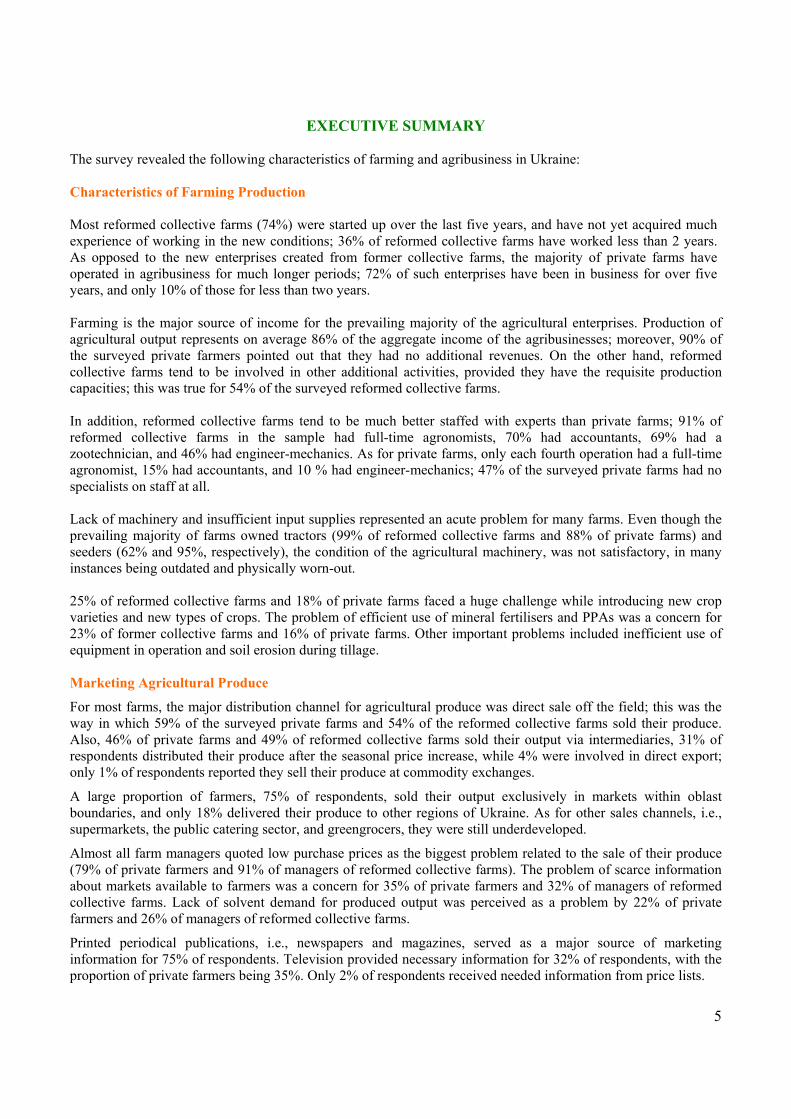
INTRODUCTION Ukraine has considerable potential for the development of farming. Fertile soils, large areas of arable lands, and favourable climatic conditions provide the necessary natural prerequisites, making the country a leader in crop and livestock production. Moreover, Ukraine’s good geographical location—including relative proximity to important markets, including former USSR and Middle East countries—allows it to export agricultural commodities in considerable volumes. However, over the last decade, agribusiness in Ukraine has been declining steadily, with overall agricultural output falling by more than half. Only over the last two years has the situation reversed, and some growth of output been observed. One of the reasons for these difficulties is the lack of unbiased and timely information on the state of affairs in Ukraine’s agricultural sector, which could help the government to draft and pursue effective policy measures. To address this gap, a survey of current conditions in the farming and agribusiness sector in Ukraine was undertaken by the International Finance Corporation’s Agribusiness Development Project in Ukraine. It was perhaps the first comprehensive study in the last few years, allowing a review of a whole variety of issues related to the development of agriculture in Ukraine. These issues included the production, financing, and legal aspects of farming operations. The present analytical report presents the findings of the survey. It is important to note that in addition to the survey findings, this report presents commentaries by the Project’s specialists on a number of specific issues. As to report structure, the goal, objectives, and methodology of the survey are discussed in the first section of the report; issues of production activity, including work experience and sizes of the surveyed farms, as well as their core activity, technical and assets base, and agronomics and environmentally friendly farming, are discussed in the section “Farming Operations”; the section titled “Marketing Agricultural Produce” offers readers an in-depth look at how farm output is sold, especially distribution channels and different sales markets. The survey placed particular emphasis on researching conditions in agricultural financing and insurance. The findings of the survey as regards major sources of financing, uses of loans and volumes of issued credits, loan repayment rates, and features of agricultural insurance are presented in the section “Agricultural Lending and Insurance in Ukraine”. The section “Management and Legal Aspects of Farming Operations” analyses the specifics of regulation of land relations and issues of land and property leasing by farming enterprises. In addition to studying the production and organisational aspects of farm operations, the survey also examined social issues of rural development and identified non-production-related problems faced by farmers. These issues are set forth in the final section of the report. In summary, this analytical report, based on the results of a comprehensive national survey organised by the International Finance Corporation’s Agribusiness Development Project in Ukraine, offers an analysis of current farming conditions, both in terms of separate types of farming operations and in terms of type of farm—namely, private farms versus former collective farms. In addition, the report describes regional variations in the analysed aspects of farming across the five surveyed oblasts of Ukraine.
5
EXECUTIVE SUMMARY
The survey revealed the following characteristics of farming and agribusiness in Ukraine: Characteristics of Farming Production Most reformed collective farms (74%) were started up over the last five years, and have not yet acquired much experience of working in the new conditions; 36% of reformed collective farms have worked less than 2 years. As opposed to the new enterprises created from former collective farms, the majority of private farms have operated in agribusiness for much longer periods; 72% of such enterprises have been in business for over five years, and only 10% of those for less than two years. Farming is the major source of income for the prevailing majority of the agricultural enterprises. Production of agricultural output represents on average 86% of the aggregate income of the agribusinesses; moreover, 90% of the surveyed private farmers pointed out that they had no additional revenues. On the other hand, reformed collective farms tend to be involved in other additional activities, provided they have the requisite production capacities; this was true for 54% of the surveyed reformed collective farms. In addition, reformed collective farms tend to be much better staffed with experts than private farms; 91% of reformed collective farms in the sample had full-time agronomists, 70% had accountants, 69% had a zootechnician, and 46% had engineer-mechanics. As for private farms, only each fourth operation had a full-time agronomist, 15% had accountants, and 10 % had engineer-mechanics; 47% of the surveyed private farms had no specialists on staff at all. Lack of machinery and insufficient input supplies represented an acute problem for many farms. Even though the prevailing majority of farms owned tractors (99% of reformed collective farms and 88% of private farms) and seeders (62% and 95%, respectively), the condition of the agricultural machinery, was not satisfactory, in many instances being outdated and physically worn-out. 25% of reformed collective farms and 18% of private farms faced a huge challenge while introducing new crop varieties and new types of crops. The problem of efficient use of mineral fertilisers and PPAs was a concern for 23% of former collective farms and 16% of private farms. Other important problems included inefficient use of equipment in operation and soil erosion during tillage. Marketing Agricultural Produce
For most farms, the major distribution channel for agricultural produce was direct sale off the field; this was the way in which 59% of the surveyed private farms and 54% of the reformed collective farms sold their produce. Also, 46% of private farms and 49% of reformed collective farms sold their output via intermediaries, 31% of respondents distributed their produce after the seasonal price increase, while 4% were involved in direct export; only 1% of respondents reported they sell their produce at commodity exchanges.
A large proportion of farmers, 75% of respondents, sold their output exclusively in markets within oblast boundaries, and only 18% delivered their produce to other regions of Ukraine. As for other sales channels, i.e., supermarkets, the public catering sector, and greengrocers, they were still underdeveloped.
Almost all farm managers quoted low purchase prices as the biggest problem related to the sale of their produce (79% of private farmers and 91% of managers of reformed collective farms). The problem of scarce information about markets available to farmers was a concern for 35% of private farmers and 32% of managers of reformed collective farms. Lack of solvent demand for produced output was perceived as a problem by 22% of private farmers and 26% of managers of reformed collective farms.
Printed periodical publications, i.e., newspapers and magazines, served as a major source of marketing information for 75% of respondents. Television provided necessary information for 32% of respondents, with the proportion of private farmers being 35%. Only 2% of respondents received needed information from price lists.
6
Agricultural Financing and Insurance Conditions For the prevailing majority of farms taking part in the survey, their own savings constituted the principal source of funding (reported by 92% of respondents). Loans extended by commercial banks with partial rebate of interest ranked second (19%), while the third common source of funding was loans from individuals (9%). In addition to savings, reformed collective farms relied mostly on commercial bank loans with partial rebate of interest. As for private farmers, the second most important source of funding for them was loans from individuals. Managers of the surveyed farms reported that they use loans mostly to purchase fuel and lubricants (77% of respondents), PPAs (48% of respondents), and seeds (36% of respondents), and for other purposes connected to their day-to-day operations. Meanwhile, only 13% reported that they spent the obtained loans on technological upgrading, and 6% said they used the money to expand their operations. As reported by 45% of the farmers that received loans in 2001, most often the loans were worth 50,000 hryvnias or less. Moreover, it is important to note that the average size of loans extended to private farms was smaller than the loans made available to reformed collective farms; the average size of loans was less than 50,000 hryvnias for 77% of the private farms that used credit. Items most commonly used as collateral included primary production assets, prevalently agricultural machinery, future harvests, and livestock; these assets were offered by, respectively, 55%, 48%, and 30% of the respondents that received loans in 2001. Agricultural output and personal property served as collateral in, respectively, 11% and 6% of instances where loans were received. High interest rates and the lack of collateral were cited by respondents most frequently as the two major impediments to obtaining loans (32% and 27%, respectively). A significant percentage of the surveyed farms believed that a considerable obstacle to obtaining a credit was lack of information on lending institutions and their requirements of borrowers (17% of respondents), as well as the lack of insurance coverage (11%). The vast majority of farm managers taking part in the survey had never insured their operations or assets; but farms that used the services of commercial banks had a greater tendency to insure their operations and assets. The prevailing majority of the surveyed managers (two-thirds of respondents) insured their operations only against natural perils and adverse weather effects (66%) and fire (23%). Managerial and Legal Aspects of Farming Operations Almost half of the surveyed farm managers (46% overall throughout all oblasts) indicated that they had never had problems with settling landownership relations, while only 0.3% of respondents referred to weaknesses of land legislation as an obstacle to effective operations. In spite of this, 24% noted that they had encountered difficulties with obtaining land titles in exchange for their land share certificates. Private farmers were more likely to face obstacles thrown up by the management of collective farm’s legal successors or by local government officials, and also problems related to the demarcation of land plots in the field; this was reported by 28%, 24%, and 27% of private farm managers, respectively). As opposed to private farmers, managers of reformed collective farms were less likely to have problems dealing with landownership relations. The range of problems they were concerned about was much narrower. Reformed collective farm managers tended to be more anxious about renting land and having land plots demarcated in the field; this was reported by 22% and 15% of this category of respondents, respectively. 39% of the surveyed farms owned land plots, the average size of which was 104.3 hectares (ranging from 0.6 hectares to 1812 ha). 71% of respondents reported they have arable land in permanent use, with an average area of such land plots being 228 hectares on average. The portion of respondents having land plots in temporary use is 42%, with the average size of such land plots being 783.6 hectares.
7
Nearly half of the respondents (49%) having land in temporary use had land lease agreements signed with owners of land share certificates; almost one-third (31%) had lease contracts with landowners holding State Acts (land titles); every fifth surveyed farmer legalised their right of temporary usage via agreements for rental of privately owned land plots; and the right of temporary usage was not properly legalised only by 5% of the sample. Social Aspects of the Agricultural Sector and Rural Area Development Over half of the respondents were people in aged between 36 and 55, with the portion of this age group among the managers of start-up farms being larger, equalling 81%. Among private farm managers, there were twice as many people aged between 26 and 36. However, the percentage of managers of pension age (56 years and older) at such enterprises was also two times higher—23%, against 11% at reformed collective farms. The surveyed farm managers had a high level of education. The majority of respondents (53%) had a completed or incomplete post-secondary education, and 29% had a secondary vocational education. A large share of respondents (62% of the sample) majored in agriculture, with nine out of ten managers of reformed collective farms holding agricultural specialist diplomas. The proportion of private farmers having a relevant education was slightly smaller, equalling only 52%. The aggregate household income of managers of reformed collective farms was higher than that of private farm managers. The average aggregate household income for private farm managers was 339 hryvnias, while that of managers of reformed collective farms was 395 hryvnias. Over half of the respondents (55%) perceive their income as being medium-level, while over one-third of them thought it was low; 10% believed their income was high. A considerable portion of respondents were members of NGOs, e.g., farmers’ associations. Of note, twice as many private farmers were members of such organisations than managers of reformed collective farms—46% versus 23%.
8
GOAL, OBJECTIVES, AND METHODOLOGY OF THE SURVEY The overall goal of the survey was to study farming conditions and the development of agribusiness in Ukraine. Fieldwork and primary data processing were performed by the international company Taylor Nelson Sofres Ukraine, commissioned by the International Finance Corporation’s Agribusiness Development Project.
The survey intended to achieve the following objectives:
• Study the social, demographic, and professional profiles of private farmers and managers of reformed collective farms;
• Identify the specifics of production and technological processes run by the farming enterprises; • Learn about financial conditions and major sources of financing used by farming enterprises; • Research the characteristics of agricultural produce marketing; • Study the main features of rural development; • Identify major obstacles to the development prospects of private agribusiness; • See how landownership relations and the institution of private ownership over land were evolving.
The survey was undertaken among a sample of private farms and reformed collective farms throughout Ukraine. This selection was made on purpose, because it allowed to analyse the particularities of the development situation at reformed collective farms, and to obtain data compatible with the national statistics.
The survey was conducted by means of one-on-one interviews with respondents, either the managers or deputy managers of the farming enterprises, at their jobs or in their homes. The average duration of the interviews was 45 minutes. A semi-structured questionnaire, which included both closed and open questions, was used for the survey.
The overall sample consisted of 400 respondents, of which 293 were managers of private farms and 107 were managers of reformed collective farms. The proportion of private farms to reformed collective farms in the sample was determined by the actual ratio of these types of farms in the general population. The sample error for Ukraine as a whole was +/- 4.9%.
The survey covered all regions of Ukraine—North, South, East, West and Centre. In each of these regions, one oblast was selected that, on the one hand, was representative of the particular region, and on the other hand—represented the biggest interest for the study. The said criteria were also decisive when raions of the oblast were picked. Thus, the survey was conducted in Kherson, Poltava, Zhytomyr, Ivano-Frankivsk, and Donetsk oblasts. The number of respondents in each oblast and in the raions of the particular oblasts was determined based on their respective proportions in the general population. The sample was formed as partially convex, with the booster in Kherson oblast, as this oblast is where the Project takes a particular interest.
Respondents were chosen on the basis of an agricultural business directory provided by the State Statistics Committee of Ukraine. Fieldwork was performed in the period between December 20, 2001 and January 19, 2002. Overall, 46 surveyors were involved in the survey. There were 86 interview refusals and/or impossible contacts, with only 10 being actual refusals, however. The great majority of impossible contacts was a result of address mistakes in the directories provided by the State Statistics Committee, or because respondents were unavailable or enterprises had shut down. The level of responses was 82%. Keeping in mind that typical levels of mass polls range between 50% and 60%, the level of responses in this survey may be considered rather high. Data input, coding of open questions, and cleaning of the data mass took place between January 15 and 24, 2002. Three company employees were involved in this work, as was the Project manager. After the data input, each tenth questionnaire (i.e., 40 questionnaires, or 6,200 items) was checked for possible operator errors. The rate of detected mistakes was 0.05%, and all mistakes were corrected during the data processing.
9
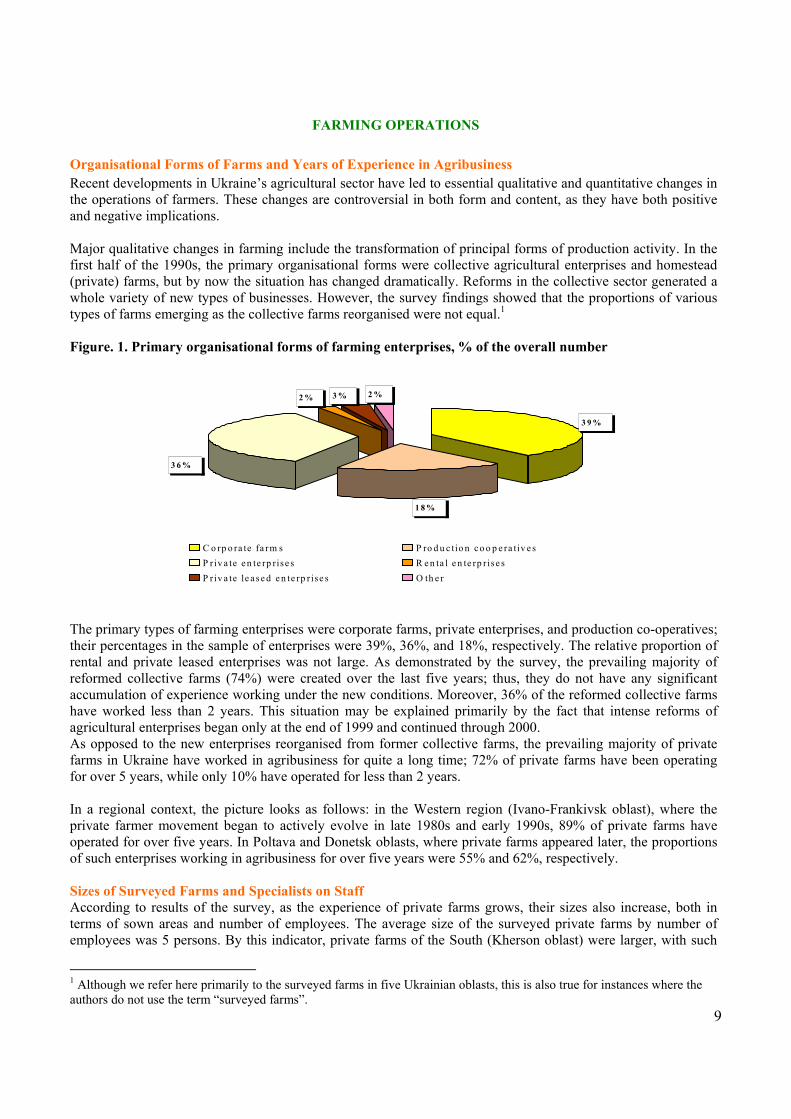
FARMING OPERATIONS Organisational Forms of Farms and Years of Experience in Agribusiness Recent developments in Ukraine’s agricultural sector have led to essential qualitative and quantitative changes in the operations of farmers. These changes are controversial in both form and content, as they have both positive and negative implications. Major qualitative changes in farming include the transformation of principal forms of production activity. In the first half of the 1990s, the primary organisational forms were collective agricultural enterprises and homestead (private) farms, but by now the situation has changed dramatically. Reforms in the collective sector generated a whole variety of new types of businesses. However, the survey findings showed that the proportions of various types of farms emerging as the collective farms reorganised were not equal.1 Figure. 1. Primary organisational forms of farming enterprises, % of the overall number
The primary types of farming enterprises were corporate farms, private enterprises, and production co-operatives; their percentages in the sample of enterprises were 39%, 36%, and 18%, respectively. The relative proportion of rental and private leased enterprises was not large. As demonstrated by the survey, the prevailing majority of reformed collective farms (74%) were created over the last five years; thus, they do not have any significant accumulation of experience working under the new conditions. Moreover, 36% of the reformed collective farms have worked less than 2 years. This situation may be explained primarily by the fact that intense reforms of agricultural enterprises began only at the end of 1999 and continued through 2000. As opposed to the new enterprises reorganised from former collective farms, the prevailing majority of private farms in Ukraine have worked in agribusiness for quite a long time; 72% of private farms have been operating for over 5 years, while only 10% have operated for less than 2 years. In a regional context, the picture looks as follows: in the Western region (Ivano-Frankivsk oblast), where the private farmer movement began to actively evolve in late 1980s and early 1990s, 89% of private farms have operated for over five years. In Poltava and Donetsk oblasts, where private farms appeared later, the proportions of such enterprises working in agribusiness for over five years were 55% and 62%, respectively. Sizes of Surveyed Farms and Specialists on Staff According to results of the survey, as the experience of private farms grows, their sizes also increase, both in terms of sown areas and number of employees. The average size of the surveyed private farms by number of employees was 5 persons. By this indicator, private farms of the South (Kherson oblast) were larger, with such
1 Although we refer here primarily to the surveyed farms in five Ukrainian oblasts, this is also true for instances where the authors do not use the term “surveyed farms”.
3 9 %
1 8 %
3 6 %
2 % 3 % 2 %
C o rp o ra te fa rm s P ro d u c tio n c o o p e ra tiv e sP riv a te e n te rp rise s R e n ta l e n te rp r ise sP r iv a te le a se d e n te rp r ise s O th e r
10
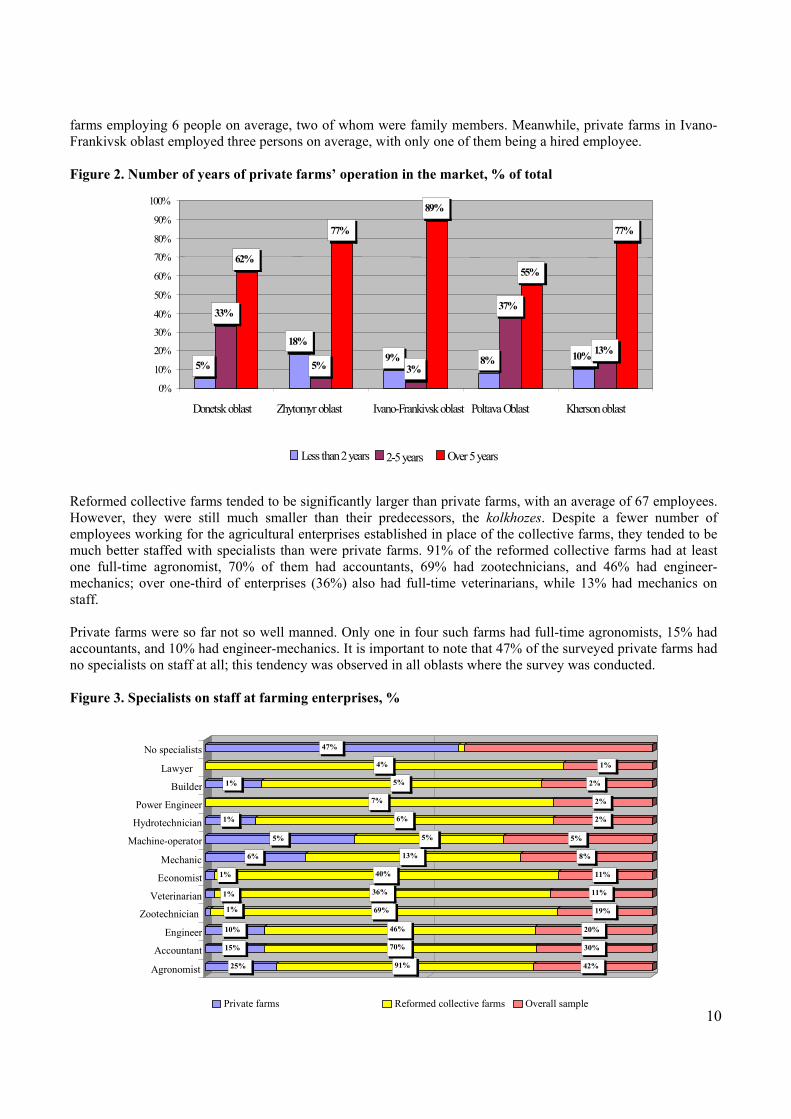
farms employing 6 people on average, two of whom were family members. Meanwhile, private farms in Ivano-Frankivsk oblast employed three persons on average, with only one of them being a hired employee. Figure 2. Number of years of private farms’ operation in the market, % of total Reformed collective farms tended to be significantly larger than private farms, with an average of 67 employees. However, they were still much smaller than their predecessors, the kolkhozes. Despite a fewer number of employees working for the agricultural enterprises established in place of the collective farms, they tended to be much better staffed with specialists than were private farms. 91% of the reformed collective farms had at least one full-time agronomist, 70% of them had accountants, 69% had zootechnicians, and 46% had engineer-mechanics; over one-third of enterprises (36%) also had full-time veterinarians, while 13% had mechanics on staff. Private farms were so far not so well manned. Only one in four such farms had full-time agronomists, 15% had accountants, and 10% had engineer-mechanics. It is important to note that 47% of the surveyed private farms had no specialists on staff at all; this tendency was observed in all oblasts where the survey was conducted. Figure 3. Specialists on staff at farming enterprises, %
5% 18%
9% 8% 10%
33%
5% 3%
37%
13%
62% 77%
89%
55%
77%
0% 10% 20% 30% 40% 50% 60% 70% 80% 90%
100%
Donetsk oblast Zhytomyr oblast Ivano-Frankivsk oblast Poltava Oblast Kherson oblast
Less than 2 years 2-5 years Over 5 years
25% 91% 42%
15% 70% 30%
10% 46% 20%
1% 69% 19%
1% 36% 11%
1% 40% 11%
6% 13% 8%
5% 5% 5%
1% 6% 2%
7% 2%
1% 5% 2%
4% 1%
47%
Agronomist
Accountant
Engineer
Zootechnician
Veterinarian
Economist
Mechanic
Machine-operator
Hydrotechnician
Power Engineer
Builder
Lawyer
No specialists
Private farms Reformed collective farms Overall sample
11
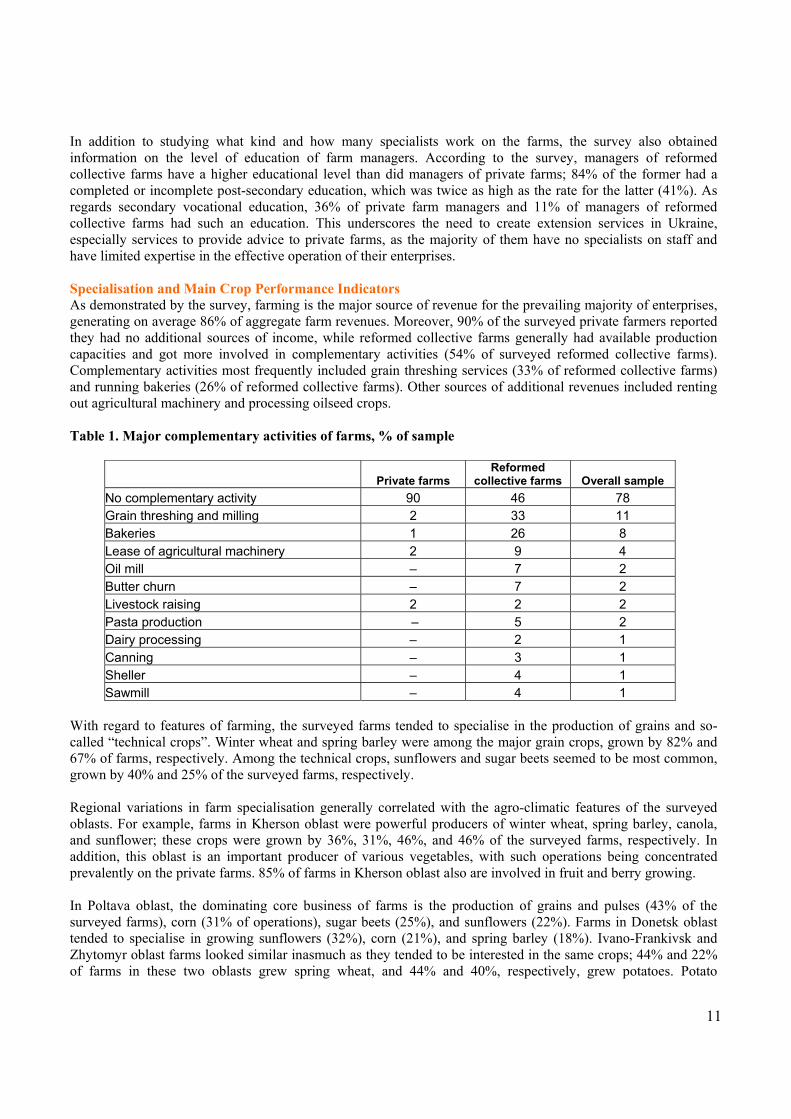
In addition to studying what kind and how many specialists work on the farms, the survey also obtained information on the level of education of farm managers. According to the survey, managers of reformed collective farms have a higher educational level than did managers of private farms; 84% of the former had a completed or incomplete post-secondary education, which was twice as high as the rate for the latter (41%). As regards secondary vocational education, 36% of private farm managers and 11% of managers of reformed collective farms had such an education. This underscores the need to create extension services in Ukraine, especially services to provide advice to private farms, as the majority of them have no specialists on staff and have limited expertise in the effective operation of their enterprises. Specialisation and Main Crop Performance Indicators As demonstrated by the survey, farming is the major source of revenue for the prevailing majority of enterprises, generating on average 86% of aggregate farm revenues. Moreover, 90% of the surveyed private farmers reported they had no additional sources of income, while reformed collective farms generally had available production capacities and got more involved in complementary activities (54% of surveyed reformed collective farms). Complementary activities most frequently included grain threshing services (33% of reformed collective farms) and running bakeries (26% of reformed collective farms). Other sources of additional revenues included renting out agricultural machinery and processing oilseed crops. Table 1. Major complementary activities of farms, % of sample
Private farms Reformed
collective farms Overall sample No complementary activity 90 46 78 Grain threshing and milling 2 33 11 Bakeries 1 26 8 Lease of agricultural machinery 2 9 4 Oil mill – 7 2 Butter churn – 7 2 Livestock raising 2 2 2 Pasta production – 5 2 Dairy processing – 2 1 Canning – 3 1 Sheller – 4 1 Sawmill – 4 1
With regard to features of farming, the surveyed farms tended to specialise in the production of grains and so-called “technical crops”. Winter wheat and spring barley were among the major grain crops, grown by 82% and 67% of farms, respectively. Among the technical crops, sunflowers and sugar beets seemed to be most common, grown by 40% and 25% of the surveyed farms, respectively. Regional variations in farm specialisation generally correlated with the agro-climatic features of the surveyed oblasts. For example, farms in Kherson oblast were powerful producers of winter wheat, spring barley, canola, and sunflower; these crops were grown by 36%, 31%, 46%, and 46% of the surveyed farms, respectively. In addition, this oblast is an important producer of various vegetables, with such operations being concentrated prevalently on the private farms. 85% of farms in Kherson oblast also are involved in fruit and berry growing. In Poltava oblast, the dominating core business of farms is the production of grains and pulses (43% of the surveyed farms), corn (31% of operations), sugar beets (25%), and sunflowers (22%). Farms in Donetsk oblast tended to specialise in growing sunflowers (32%), corn (21%), and spring barley (18%). Ivano-Frankivsk and Zhytomyr oblast farms looked similar inasmuch as they tended to be interested in the same crops; 44% and 22% of farms in these two oblasts grew spring wheat, and 44% and 40%, respectively, grew potatoes. Potato
12
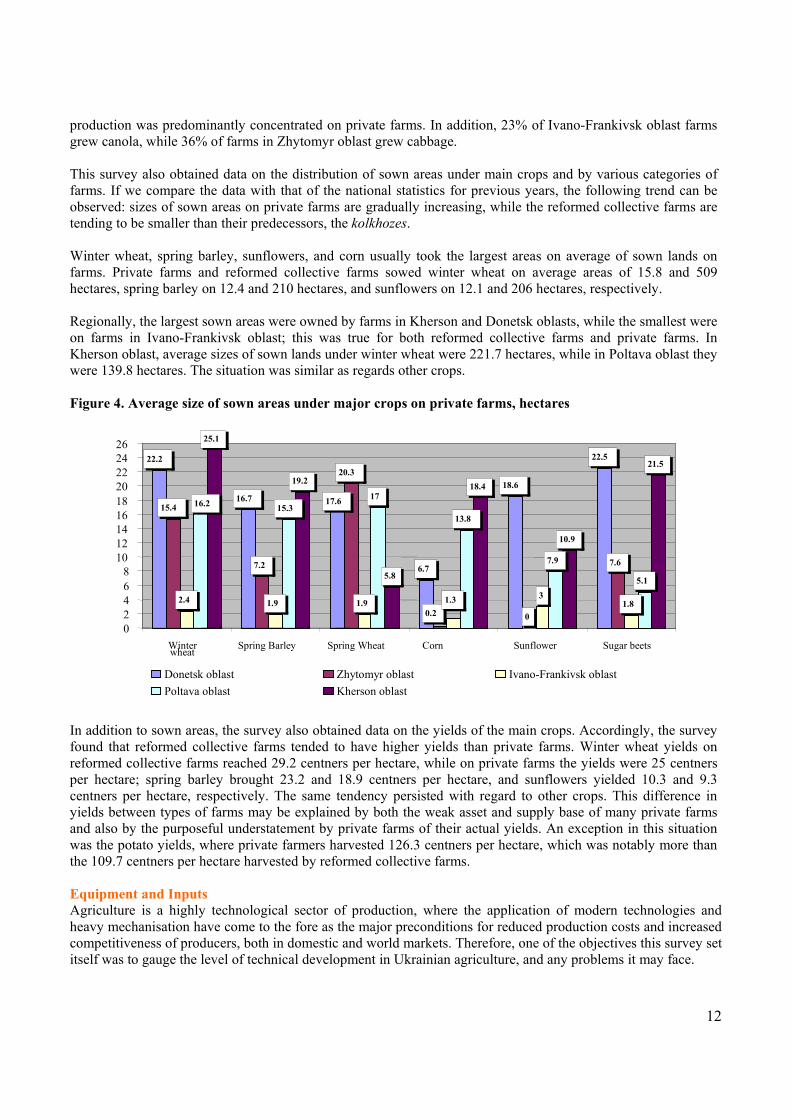
production was predominantly concentrated on private farms. In addition, 23% of Ivano-Frankivsk oblast farms grew canola, while 36% of farms in Zhytomyr oblast grew cabbage. This survey also obtained data on the distribution of sown areas under main crops and by various categories of farms. If we compare the data with that of the national statistics for previous years, the following trend can be observed: sizes of sown areas on private farms are gradually increasing, while the reformed collective farms are tending to be smaller than their predecessors, the kolkhozes. Winter wheat, spring barley, sunflowers, and corn usually took the largest areas on average of sown lands on farms. Private farms and reformed collective farms sowed winter wheat on average areas of 15.8 and 509 hectares, spring barley on 12.4 and 210 hectares, and sunflowers on 12.1 and 206 hectares, respectively. Regionally, the largest sown areas were owned by farms in Kherson and Donetsk oblasts, while the smallest were on farms in Ivano-Frankivsk oblast; this was true for both reformed collective farms and private farms. In Kherson oblast, average sizes of sown lands under winter wheat were 221.7 hectares, while in Poltava oblast they were 139.8 hectares. The situation was similar as regards other crops. Figure 4. Average size of sown areas under major crops on private farms, hectares
In addition to sown areas, the survey also obtained data on the yields of the main crops. Accordingly, the survey found that reformed collective farms tended to have higher yields than private farms. Winter wheat yields on reformed collective farms reached 29.2 centners per hectare, while on private farms the yields were 25 centners per hectare; spring barley brought 23.2 and 18.9 centners per hectare, and sunflowers yielded 10.3 and 9.3 centners per hectare, respectively. The same tendency persisted with regard to other crops. This difference in yields between types of farms may be explained by both the weak asset and supply base of many private farms and also by the purposeful understatement by private farms of their actual yields. An exception in this situation was the potato yields, where private farmers harvested 126.3 centners per hectare, which was notably more than the 109.7 centners per hectare harvested by reformed collective farms. Equipment and Inputs Agriculture is a highly technological sector of production, where the application of modern technologies and heavy mechanisation have come to the fore as the major preconditions for reduced production costs and increased competitiveness of producers, both in domestic and world markets. Therefore, one of the objectives this survey set itself was to gauge the level of technical development in Ukrainian agriculture, and any problems it may face.
22.2
16.7
6.7
18.6
22.5
15.4
7.2
20.3
0
7.6
2.4 1.9 1.93
1.8
15.3 17
13.8
7.9
5.1
25.1
19.2
5.8
18.4
10.9
21.5
17.6
0.21.3
16.2
0 2 4 6 8
10 12 14 16 18 20 22 24 26
Winter wheat Spring Barley Spring Wheat Corn Sunflower Sugar beets
Donetsk oblast Zhytomyr oblast Ivano-Frankivsk oblast Poltava oblast Kherson oblast
13
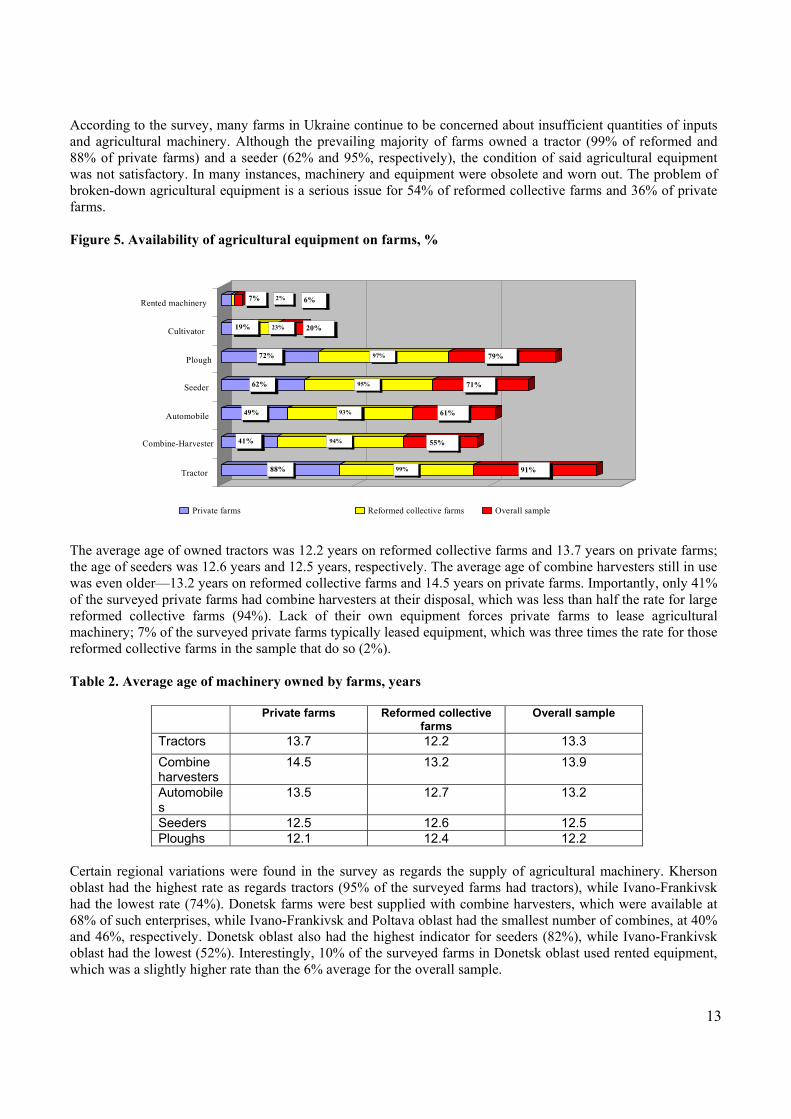
According to the survey, many farms in Ukraine continue to be concerned about insufficient quantities of inputs and agricultural machinery. Although the prevailing majority of farms owned a tractor (99% of reformed and 88% of private farms) and a seeder (62% and 95%, respectively), the condition of said agricultural equipment was not satisfactory. In many instances, machinery and equipment were obsolete and worn out. The problem of broken-down agricultural equipment is a serious issue for 54% of reformed collective farms and 36% of private farms. Figure 5. Availability of agricultural equipment on farms, % The average age of owned tractors was 12.2 years on reformed collective farms and 13.7 years on private farms; the age of seeders was 12.6 years and 12.5 years, respectively. The average age of combine harvesters still in use was even older—13.2 years on reformed collective farms and 14.5 years on private farms. Importantly, only 41% of the surveyed private farms had combine harvesters at their disposal, which was less than half the rate for large reformed collective farms (94%). Lack of their own equipment forces private farms to lease agricultural machinery; 7% of the surveyed private farms typically leased equipment, which was three times the rate for those reformed collective farms in the sample that do so (2%). Table 2. Average age of machinery owned by farms, years
Private farms Reformed collective farms
Overall sample
Tractors 13.7 12.2 13.3 Combine harvesters
14.5 13.2 13.9
Automobiles
13.5 12.7 13.2
Seeders 12.5 12.6 12.5 Ploughs 12.1 12.4 12.2
Certain regional variations were found in the survey as regards the supply of agricultural machinery. Kherson oblast had the highest rate as regards tractors (95% of the surveyed farms had tractors), while Ivano-Frankivsk had the lowest rate (74%). Donetsk farms were best supplied with combine harvesters, which were available at 68% of such enterprises, while Ivano-Frankivsk and Poltava oblast had the smallest number of combines, at 40% and 46%, respectively. Donetsk oblast also had the highest indicator for seeders (82%), while Ivano-Frankivsk oblast had the lowest (52%). Interestingly, 10% of the surveyed farms in Donetsk oblast used rented equipment, which was a slightly higher rate than the 6% average for the overall sample.
88% 99% 91%
41% 94% 55%
49% 93% 61%
62% 95% 71%
72% 97% 79%
19% 23% 20%
7% 2% 6%
Tractor
Combine-Harvester
Automobile
Seeder
Plough
Cultivator
Rented machinery
Private farms Reformed collective farms Overall sample
14
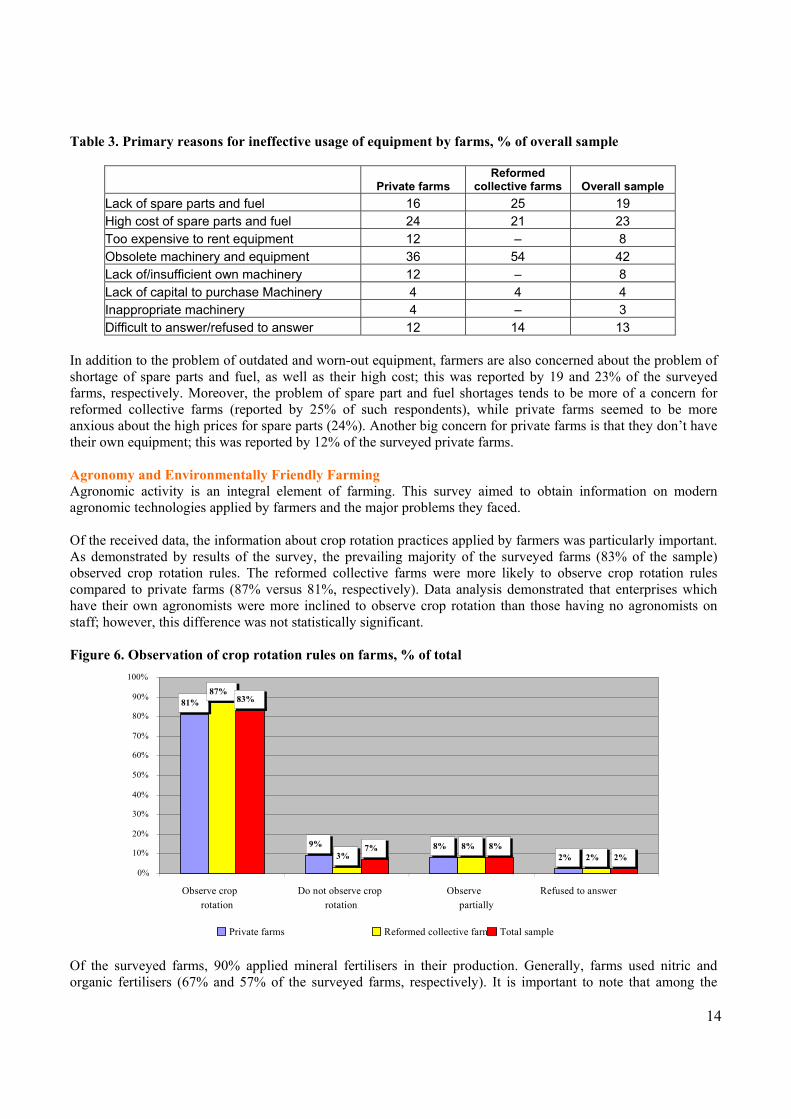
Table 3. Primary reasons for ineffective usage of equipment by farms, % of overall sample
Private farms Reformed
collective farms Overall sample Lack of spare parts and fuel 16 25 19 High cost of spare parts and fuel 24 21 23 Too expensive to rent equipment 12 – 8 Obsolete machinery and equipment 36 54 42 Lack of/insufficient own machinery 12 – 8 Lack of capital to purchase Machinery 4 4 4 Inappropriate machinery 4 – 3 Difficult to answer/refused to answer 12 14 13
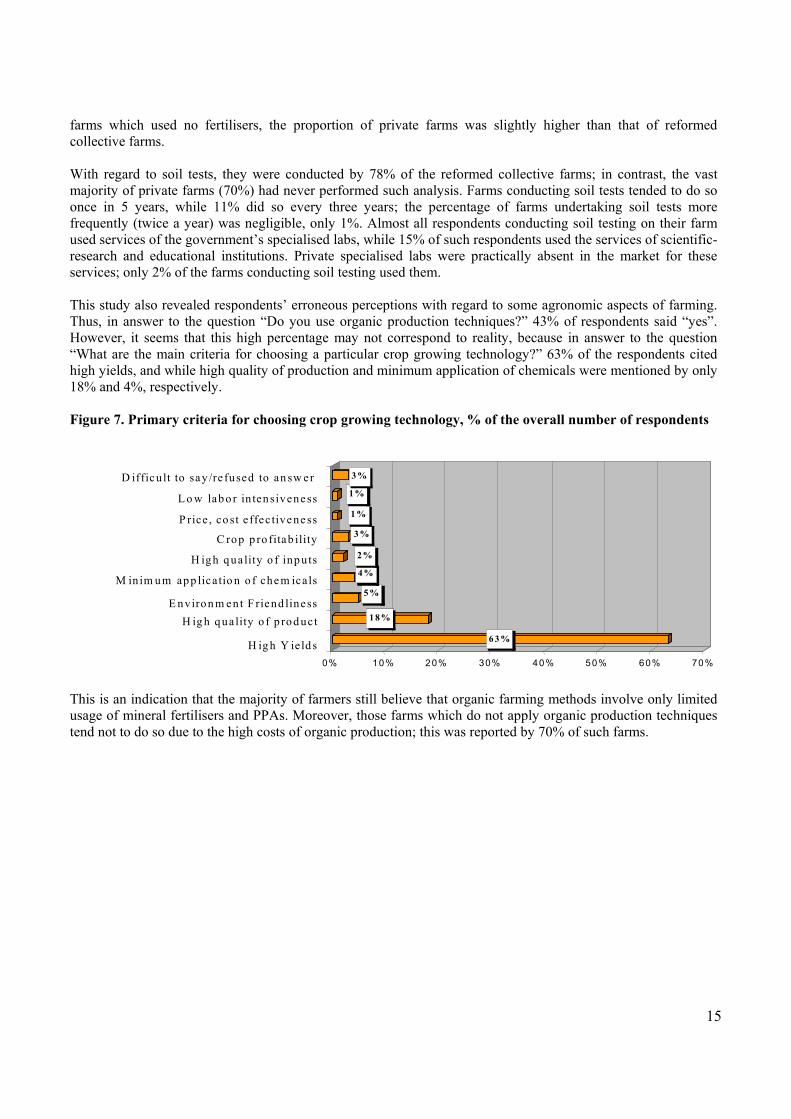
In addition to the problem of outdated and worn-out equipment, farmers are also concerned about the problem of shortage of spare parts and fuel, as well as their high cost; this was reported by 19 and 23% of the surveyed farms, respectively. Moreover, the problem of spare part and fuel shortages tends to be more of a concern for reformed collective farms (reported by 25% of such respondents), while private farms seemed to be more anxious about the high prices for spare parts (24%). Another big concern for private farms is that they don’t have their own equipment; this was reported by 12% of the surveyed private farms. Agronomy and Environmentally Friendly Farming Agronomic activity is an integral element of farming. This survey aimed to obtain information on modern agronomic technologies applied by farmers and the major problems they faced. Of the received data, the information about crop rotation practices applied by farmers was particularly important. As demonstrated by results of the survey, the prevailing majority of the surveyed farms (83% of the sample) observed crop rotation rules. The reformed collective farms were more likely to observe crop rotation rules compared to private farms (87% versus 81%, respectively). Data analysis demonstrated that enterprises which have their own agronomists were more inclined to observe crop rotation than those having no agronomists on staff; however, this difference was not statistically significant. Figure 6. Observation of crop rotation rules on farms, % of total Of the surveyed farms, 90% applied mineral fertilisers in their production. Generally, farms used nitric and organic fertilisers (67% and 57% of the surveyed farms, respectively). It is important to note that among the
81%
9% 8%2%
87%
3%8%
2%
83%
7% 8%2%
0% 10% 20% 30% 40% 50% 60% 70% 80% 90%
100%
Observe croprotation
Do not observe croprotation
Observe partially
Refused to answer
Private farms Reformed collective farms Total sample
15
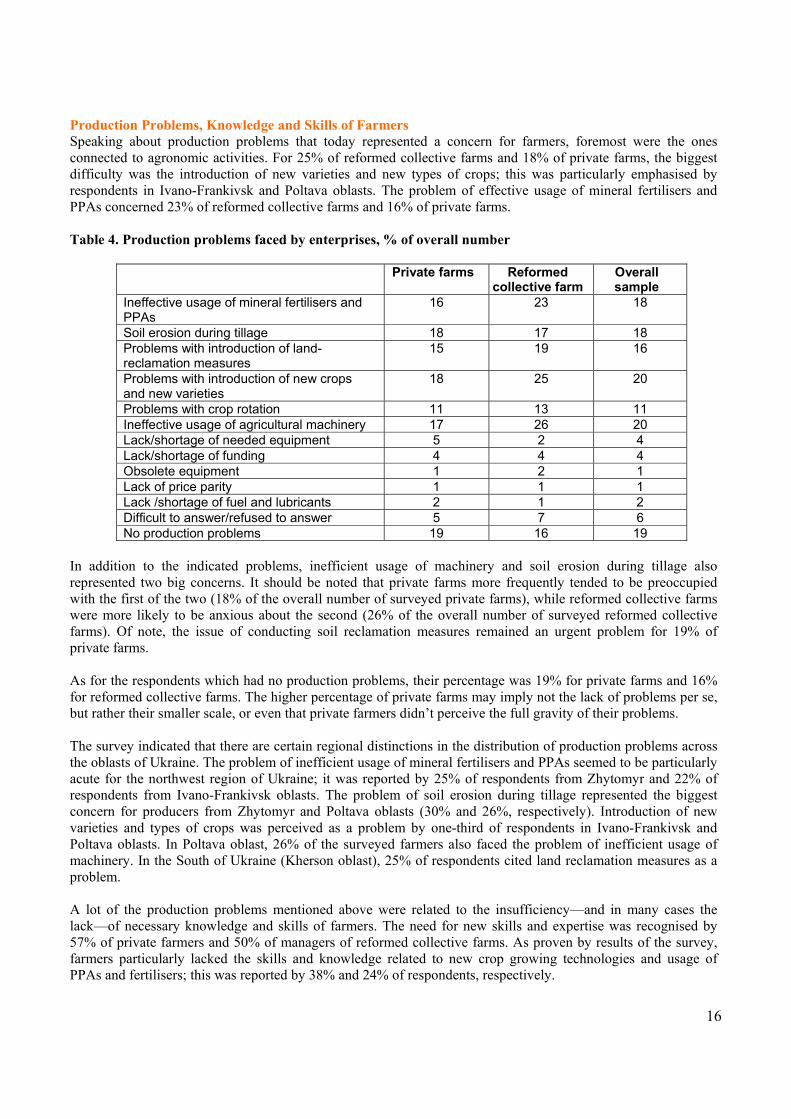
farms which used no fertilisers, the proportion of private farms was slightly higher than that of reformed collective farms. With regard to soil tests, they were conducted by 78% of the reformed collective farms; in contrast, the vast majority of private farms (70%) had never performed such analysis. Farms conducting soil tests tended to do so once in 5 years, while 11% did so every three years; the percentage of farms undertaking soil tests more frequently (twice a year) was negligible, only 1%. Almost all respondents conducting soil testing on their farm used services of the government’s specialised labs, while 15% of such respondents used the services of scientific-research and educational institutions. Private specialised labs were practically absent in the market for these services; only 2% of the farms conducting soil testing used them. This study also revealed respondents’ erroneous perceptions with regard to some agronomic aspects of farming. Thus, in answer to the question “Do you use organic production techniques?” 43% of respondents said “yes”. However, it seems that this high percentage may not correspond to reality, because in answer to the question “What are the main criteria for choosing a particular crop growing technology?” 63% of the respondents cited high yields, and while high quality of production and minimum application of chemicals were mentioned by only 18% and 4%, respectively. Figure 7. Primary criteria for choosing crop growing technology, % of the overall number of respondents
This is an indication that the majority of farmers still believe that organic farming methods involve only limited usage of mineral fertilisers and PPAs. Moreover, those farms which do not apply organic production techniques tend not to do so due to the high costs of organic production; this was reported by 70% of such farms.
6 3 %
1 8%
5 %
4 %
2%
3 %
1 %
1%
3 %
0% 10% 20% 30% 40% 50% 60% 70%
H ig h Y ie ld s
H ig h q ua lity o f p ro d uctE nviro n m ent F riend liness
M inim u m ap p lica tio n o f che m icals
H ig h q ua lity o f inp uts
C ro p p ro fitab ility
P rice , co st e ffec tivene ss
L o w lab o r in ten sivene ss
D ifficu lt to say /re fused to an sw er
16
Production Problems, Knowledge and Skills of Farmers Speaking about production problems that today represented a concern for farmers, foremost were the ones connected to agronomic activities. For 25% of reformed collective farms and 18% of private farms, the biggest difficulty was the introduction of new varieties and new types of crops; this was particularly emphasised by respondents in Ivano-Frankivsk and Poltava oblasts. The problem of effective usage of mineral fertilisers and PPAs concerned 23% of reformed collective farms and 16% of private farms. Table 4. Production problems faced by enterprises, % of overall number
Private farms Reformed collective farm
Overall sample
Ineffective usage of mineral fertilisers and PPAs
16 23 18
Soil erosion during tillage 18 17 18 Problems with introduction of land-reclamation measures
15 19 16
Problems with introduction of new crops and new varieties
18 25 20
Problems with crop rotation 11 13 11 Ineffective usage of agricultural machinery 17 26 20 Lack/shortage of needed equipment 5 2 4 Lack/shortage of funding 4 4 4 Obsolete equipment 1 2 1 Lack of price parity 1 1 1 Lack /shortage of fuel and lubricants 2 1 2 Difficult to answer/refused to answer 5 7 6 No production problems 19 16 19
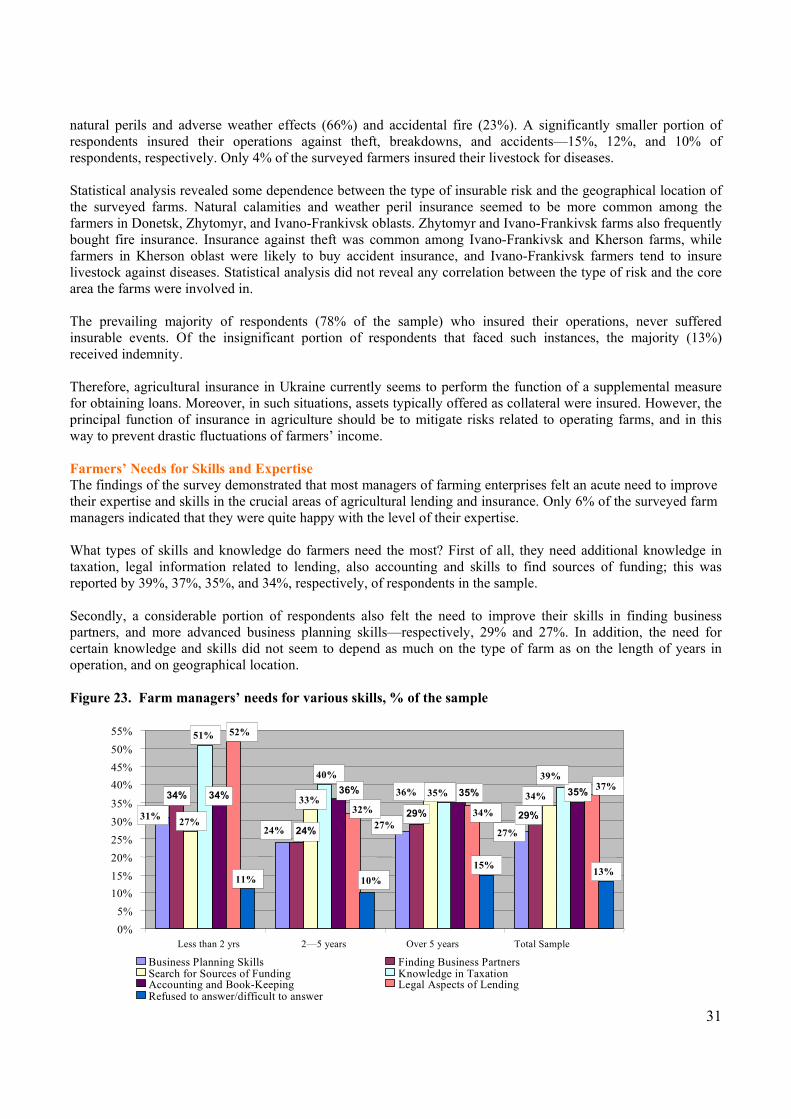
In addition to the indicated problems, inefficient usage of machinery and soil erosion during tillage also represented two big concerns. It should be noted that private farms more frequently tended to be preoccupied with the first of the two (18% of the overall number of surveyed private farms), while reformed collective farms were more likely to be anxious about the second (26% of the overall number of surveyed reformed collective farms). Of note, the issue of conducting soil reclamation measures remained an urgent problem for 19% of private farms. As for the respondents which had no production problems, their percentage was 19% for private farms and 16% for reformed collective farms. The higher percentage of private farms may imply not the lack of problems per se, but rather their smaller scale, or even that private farmers didn’t perceive the full gravity of their problems. The survey indicated that there are certain regional distinctions in the distribution of production problems across the oblasts of Ukraine. The problem of inefficient usage of mineral fertilisers and PPAs seemed to be particularly acute for the northwest region of Ukraine; it was reported by 25% of respondents from Zhytomyr and 22% of respondents from Ivano-Frankivsk oblasts. The problem of soil erosion during tillage represented the biggest concern for producers from Zhytomyr and Poltava oblasts (30% and 26%, respectively). Introduction of new varieties and types of crops was perceived as a problem by one-third of respondents in Ivano-Frankivsk and Poltava oblasts. In Poltava oblast, 26% of the surveyed farmers also faced the problem of inefficient usage of machinery. In the South of Ukraine (Kherson oblast), 25% of respondents cited land reclamation measures as a problem. A lot of the production problems mentioned above were related to the insufficiency—and in many cases the lack—of necessary knowledge and skills of farmers. The need for new skills and expertise was recognised by 57% of private farmers and 50% of managers of reformed collective farms. As proven by results of the survey, farmers particularly lacked the skills and knowledge related to new crop growing technologies and usage of PPAs and fertilisers; this was reported by 38% and 24% of respondents, respectively.
17
MARKETING AGRICULTURAL PRODUCE The economic effectiveness of farming depends to a large extent on the effective organisation of product sales channels, effective pricing policies, and the skills to keep up with market trends. In their operations, farmers have to make numerous decisions on the effective organisation of production processes, as well as management decisions, with most important being those connected to the sale of output. Therefore, this survey aimed to study the marketing of agricultural produce and particularly, learn about the distribution channels and sales markets used by Ukrainian farmers for their output; what are the problems facing producers in the process of sales; and what their needs are for new knowledge and skills.
Main Problems in Marketing Agricultural Produce
Over many previous years (up to the early 1990s), the issue of agricultural product sales or marketing was not a particular concern for many farmers of Ukraine. One explanation is that volumes of production, purchases of produce, and pricing were dictated centrally by the government. Under present conditions, however, the situation has changed radically, forcing farmers to make huge efforts to solve their own problems regarding sales.
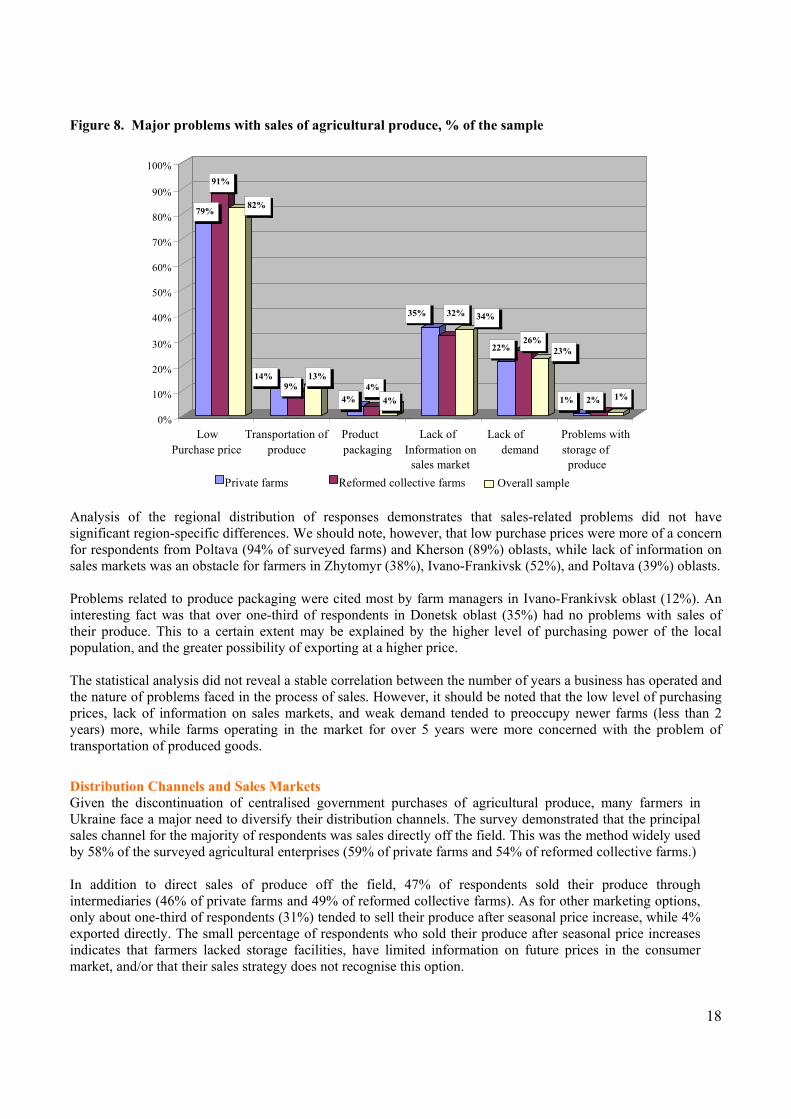
The survey demonstrated that Ukrainian farmers encountered numerous problems related to distribution and sales. It should be noted that these problems were of both an objective and subjective nature, the latter being more the result of insufficient marketing skills and expertise. According to the survey results, low purchasing prices for produce were the major problem encountered by most farm managers (82% of respondents); this problem was cited as the worst by 79% of the surveyed private farms and 91% of the former collective farms. These results may indicate that farmers still lack the proper skills in finding the most effective marketing channels and sales markets to obtain acceptable prices for their produce. Of course, the price needs to be affordable for consumers, and at the same time needs to cover production and marketing costs. The problem of low purchasing prices was particularly serious for managers of former collective farms, the complaining portion of which was higher than that of respondent private farmers. Additional explanations for the existence of such problems may be found in the low quality of produced goods, and the failure to meet the requirements of processing enterprises.
The second serious problem was the farmers’ general lack of information on sales markets; this problem was cited by 35% of private farmers and 32% of managers of reformed collective farms. The problem of weak demand for produced goods was a concern for 22% of private farmers and 26% of managers of reformed collective farms. However, this problem was more related to the organisational aspect of produce sales within the farms. The majority of farmers were ignorant of the real demand for and supply of their produced goods; moreover, they neither studied potential markets, nor applied effective market promotion strategies.
Among the other problems encountered by farmers with regard to sales was the transportation of their produce. Of note, this problem was more acute for private farmers than for managers of reformed collective farms (14% against 9%).
18
Figure 8. Major problems with sales of agricultural produce, % of the sample
Analysis of the regional distribution of responses demonstrates that sales-related problems did not have significant region-specific differences. We should note, however, that low purchase prices were more of a concern for respondents from Poltava (94% of surveyed farms) and Kherson (89%) oblasts, while lack of information on sales markets was an obstacle for farmers in Zhytomyr (38%), Ivano-Frankivsk (52%), and Poltava (39%) oblasts. Problems related to produce packaging were cited most by farm managers in Ivano-Frankivsk oblast (12%). An interesting fact was that over one-third of respondents in Donetsk oblast (35%) had no problems with sales of their produce. This to a certain extent may be explained by the higher level of purchasing power of the local population, and the greater possibility of exporting at a higher price. The statistical analysis did not reveal a stable correlation between the number of years a business has operated and the nature of problems faced in the process of sales. However, it should be noted that the low level of purchasing prices, lack of information on sales markets, and weak demand tended to preoccupy newer farms (less than 2 years) more, while farms operating in the market for over 5 years were more concerned with the problem of transportation of produced goods.
Distribution Channels and Sales Markets Given the discontinuation of centralised government purchases of agricultural produce, many farmers in Ukraine face a major need to diversify their distribution channels. The survey demonstrated that the principal sales channel for the majority of respondents was sales directly off the field. This was the method widely used by 58% of the surveyed agricultural enterprises (59% of private farms and 54% of reformed collective farms.) In addition to direct sales of produce off the field, 47% of respondents sold their produce through intermediaries (46% of private farms and 49% of reformed collective farms). As for other marketing options, only about one-third of respondents (31%) tended to sell their produce after seasonal price increase, while 4% exported directly. The small percentage of respondents who sold their produce after seasonal price increases indicates that farmers lacked storage facilities, have limited information on future prices in the consumer market, and/or that their sales strategy does not recognise this option.
79%
91%
82%
14%9%
13%
4%4%
4%
35% 32% 34%
22%26%
23%
1% 2% 1%
0%
10%
20%
30%
40%
50%
60%
70%
80%
90%
100%
LowPurchase price
Transportation ofproduce
Productpackaging
Lack ofInformation on
sales market
Lack ofdemand
Problems withstorage ofproduce
Private farms Reformed collective farms Overall sample
19
It is important to say that reformed collective farms tended to have more diverse distribution channels than private farms. This is explained primarily by their larger production volumes and better-developed sales markets. We should also note that only 1% of respondents reported that they sold their produce via commodity exchanges; this is a signal of the low effectiveness of the exchange market in Ukraine.
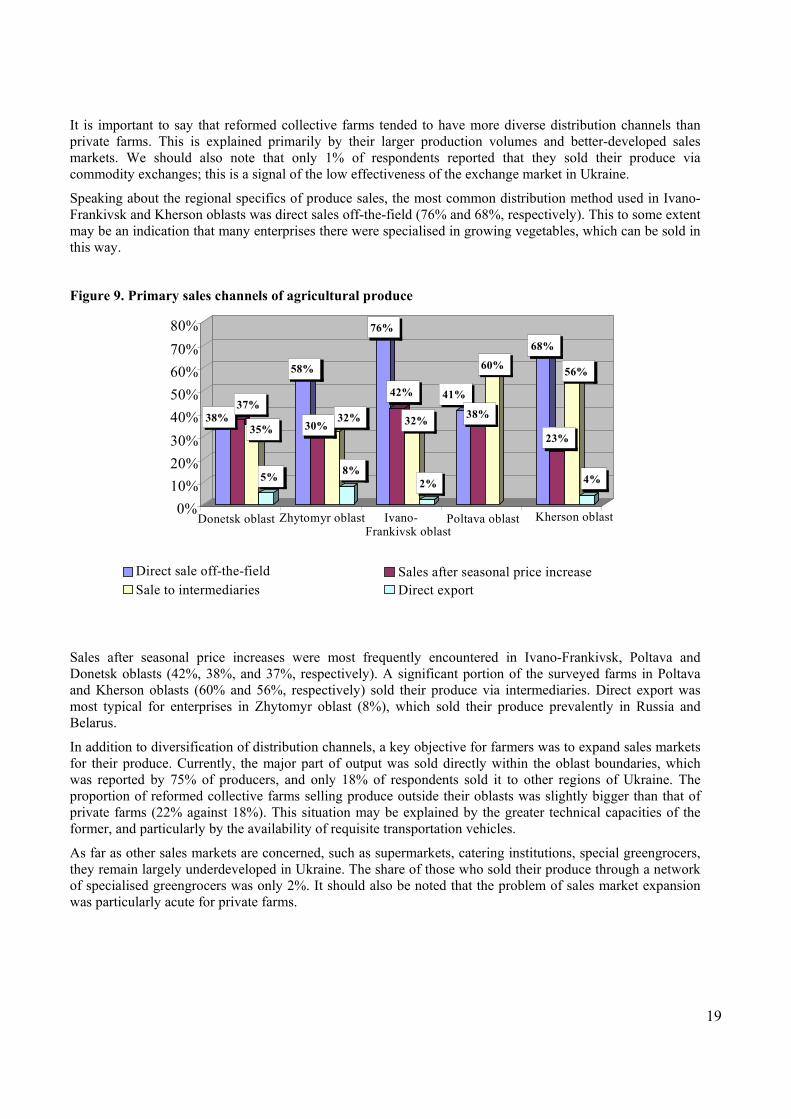
Speaking about the regional specifics of produce sales, the most common distribution method used in Ivano-Frankivsk and Kherson oblasts was direct sales off-the-field (76% and 68%, respectively). This to some extent may be an indication that many enterprises there were specialised in growing vegetables, which can be sold in this way.
Figure 9. Primary sales channels of agricultural produce
Sales after seasonal price increases were most frequently encountered in Ivano-Frankivsk, Poltava and Donetsk oblasts (42%, 38%, and 37%, respectively). A significant portion of the surveyed farms in Poltava and Kherson oblasts (60% and 56%, respectively) sold their produce via intermediaries. Direct export was most typical for enterprises in Zhytomyr oblast (8%), which sold their produce prevalently in Russia and Belarus.
In addition to diversification of distribution channels, a key objective for farmers was to expand sales markets for their produce. Currently, the major part of output was sold directly within the oblast boundaries, which was reported by 75% of producers, and only 18% of respondents sold it to other regions of Ukraine. The proportion of reformed collective farms selling produce outside their oblasts was slightly bigger than that of private farms (22% against 18%). This situation may be explained by the greater technical capacities of the former, and particularly by the availability of requisite transportation vehicles.
As far as other sales markets are concerned, such as supermarkets, catering institutions, special greengrocers, they remain largely underdeveloped in Ukraine. The share of those who sold their produce through a network of specialised greengrocers was only 2%. It should also be noted that the problem of sales market expansion was particularly acute for private farms.
38%37%
35%
5%
58%
30%32%
8%
76%
42%
32%
2%
41%
38%
60%
68%
23%
56%
4%
0%10%20%30%40%50%60%70%80%
Donetsk oblast Zhytomyr oblast Ivano-Frankivsk oblast
Poltava oblast Kherson oblast
Direct sale off-the-field Sales after seasonal price increaseSale to intermediaries Direct export
20
Table 5. Primary sales markets for agricultural produce, % of total number of responses
Donetsk oblast Zhytomyr oblast
Ivano-Frankivsk oblast Poltava oblast Kherson oblast
Local farmer’s markets (within oblast) 75% 80% 92% 83% 75%
Distant farmer’s markets (within Ukraine) 3% 8% 14% 10% 34% Supermarkets – – – – 1%
Catering establishments – 12% 10% – – Specialised greengrocers – 2% 12% – 1%
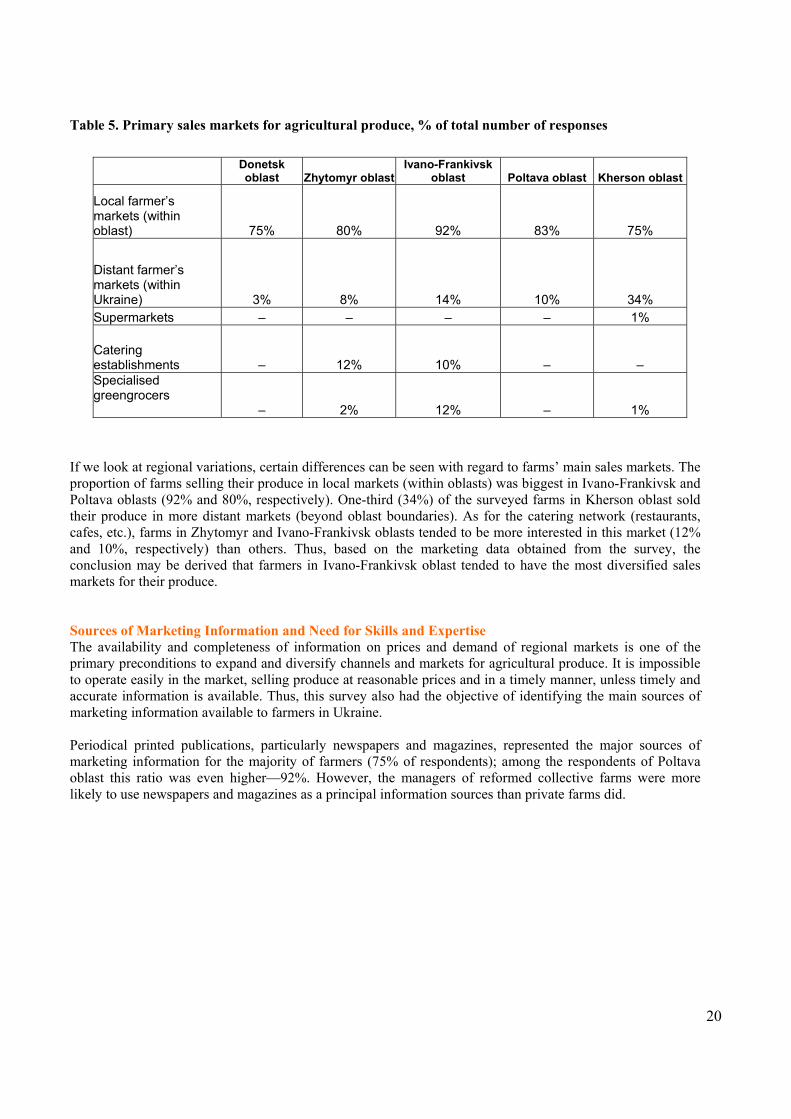
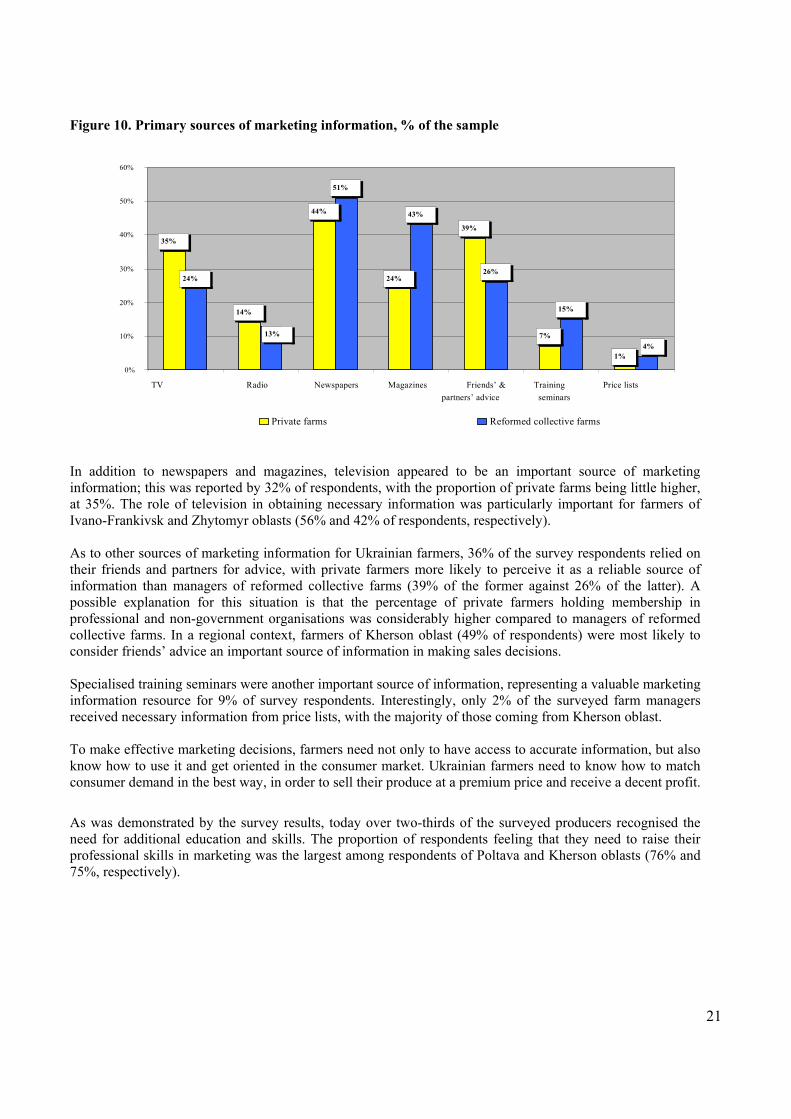
If we look at regional variations, certain differences can be seen with regard to farms’ main sales markets. The proportion of farms selling their produce in local markets (within oblasts) was biggest in Ivano-Frankivsk and Poltava oblasts (92% and 80%, respectively). One-third (34%) of the surveyed farms in Kherson oblast sold their produce in more distant markets (beyond oblast boundaries). As for the catering network (restaurants, cafes, etc.), farms in Zhytomyr and Ivano-Frankivsk oblasts tended to be more interested in this market (12% and 10%, respectively) than others. Thus, based on the marketing data obtained from the survey, the conclusion may be derived that farmers in Ivano-Frankivsk oblast tended to have the most diversified sales markets for their produce. Sources of Marketing Information and Need for Skills and Expertise The availability and completeness of information on prices and demand of regional markets is one of the primary preconditions to expand and diversify channels and markets for agricultural produce. It is impossible to operate easily in the market, selling produce at reasonable prices and in a timely manner, unless timely and accurate information is available. Thus, this survey also had the objective of identifying the main sources of marketing information available to farmers in Ukraine. Periodical printed publications, particularly newspapers and magazines, represented the major sources of marketing information for the majority of farmers (75% of respondents); among the respondents of Poltava oblast this ratio was even higher—92%. However, the managers of reformed collective farms were more likely to use newspapers and magazines as a principal information sources than private farms did.
21
Figure 10. Primary sources of marketing information, % of the sample
In addition to newspapers and magazines, television appeared to be an important source of marketing information; this was reported by 32% of respondents, with the proportion of private farms being little higher, at 35%. The role of television in obtaining necessary information was particularly important for farmers of Ivano-Frankivsk and Zhytomyr oblasts (56% and 42% of respondents, respectively). As to other sources of marketing information for Ukrainian farmers, 36% of the survey respondents relied on their friends and partners for advice, with private farmers more likely to perceive it as a reliable source of information than managers of reformed collective farms (39% of the former against 26% of the latter). A possible explanation for this situation is that the percentage of private farmers holding membership in professional and non-government organisations was considerably higher compared to managers of reformed collective farms. In a regional context, farmers of Kherson oblast (49% of respondents) were most likely to consider friends’ advice an important source of information in making sales decisions. Specialised training seminars were another important source of information, representing a valuable marketing information resource for 9% of survey respondents. Interestingly, only 2% of the surveyed farm managers received necessary information from price lists, with the majority of those coming from Kherson oblast. To make effective marketing decisions, farmers need not only to have access to accurate information, but also know how to use it and get oriented in the consumer market. Ukrainian farmers need to know how to match consumer demand in the best way, in order to sell their produce at a premium price and receive a decent profit.
As was demonstrated by the survey results, today over two-thirds of the surveyed producers recognised the need for additional education and skills. The proportion of respondents feeling that they need to raise their professional skills in marketing was the largest among respondents of Poltava and Kherson oblasts (76% and 75%, respectively).
35%
14%
44%
24%
39%
7%
1%
24%
51%
43%
26%
15%
13%
4%
0%
10%
20%
30%
40%
50%
60%
TV Radio Newspapers Magazines Friends’ &partners’ advice
Trainingseminars
Price lists
Private farms Reformed collective farms
22
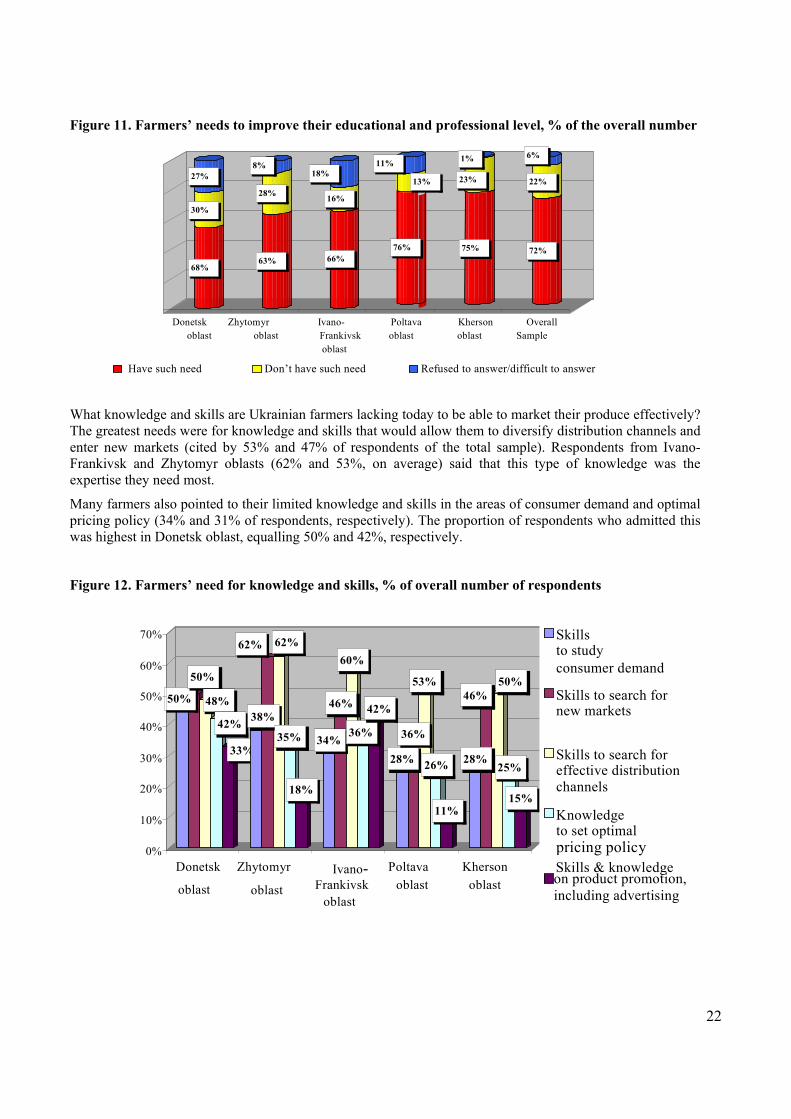
Figure 11. Farmers’ needs to improve their educational and professional level, % of the overall number
What knowledge and skills are Ukrainian farmers lacking today to be able to market their produce effectively? The greatest needs were for knowledge and skills that would allow them to diversify distribution channels and enter new markets (cited by 53% and 47% of respondents of the total sample). Respondents from Ivano-Frankivsk and Zhytomyr oblasts (62% and 53%, on average) said that this type of knowledge was the expertise they need most.
Many farmers also pointed to their limited knowledge and skills in the areas of consumer demand and optimal pricing policy (34% and 31% of respondents, respectively). The proportion of respondents who admitted this was highest in Donetsk oblast, equalling 50% and 42%, respectively.
Figure 12. Farmers’ need for knowledge and skills, % of overall number of respondents
50% 50%
48% 42%
33%
38%
62% 62%
35%
18%
34%
46%
60%
36%
42%
28%
36%
53%
26%
11%
28%
46%50%
25%
15%
0%
10%
20%
30%
40%
50%
60%
70%
Donetsk
oblast
Zhytomyr
oblast Ivano-
Frankivsk oblast
Poltava oblast
Kherson oblast
Skills to study consumer demand
Skills to search for new markets
Skills to search foreffective distributionchannels
Knowledge to set optimal pricing policy Skills & knowledge on product promotion,including advertising
68%
30%
27%
63%
28%
8%
66%
16%
18%
76%
13%
11%
75%
23%
1%
72%
22%
6%
Donetsk oblast
Zhytomyr oblast
Ivano-Frankivskoblast
Poltavaoblast
Khersonoblast
OverallSample
Have such need Don’t have such need Refused to answer/difficult to answer
23
AGRICULTURAL LENDING AND INSURANCE IN UKRAINE
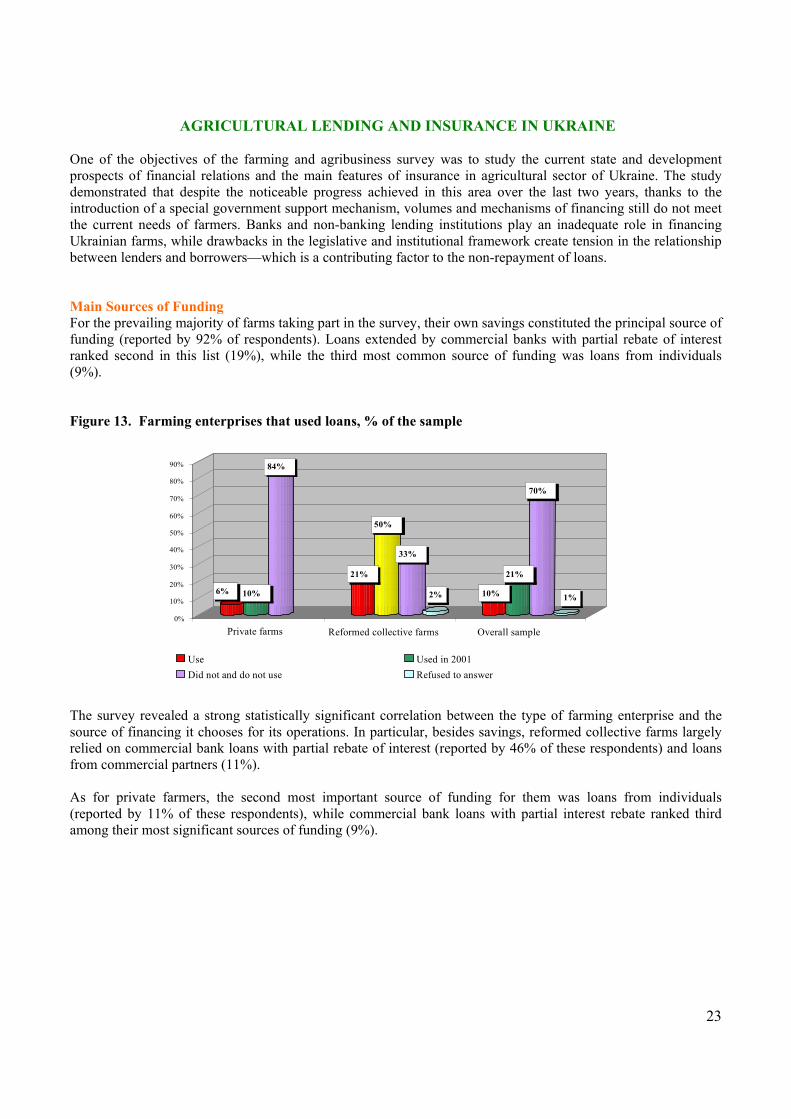
One of the objectives of the farming and agribusiness survey was to study the current state and development prospects of financial relations and the main features of insurance in agricultural sector of Ukraine. The study demonstrated that despite the noticeable progress achieved in this area over the last two years, thanks to the introduction of a special government support mechanism, volumes and mechanisms of financing still do not meet the current needs of farmers. Banks and non-banking lending institutions play an inadequate role in financing Ukrainian farms, while drawbacks in the legislative and institutional framework create tension in the relationship between lenders and borrowers—which is a contributing factor to the non-repayment of loans. Main Sources of Funding For the prevailing majority of farms taking part in the survey, their own savings constituted the principal source of funding (reported by 92% of respondents). Loans extended by commercial banks with partial rebate of interest ranked second in this list (19%), while the third most common source of funding was loans from individuals (9%). Figure 13. Farming enterprises that used loans, % of the sample The survey revealed a strong statistically significant correlation between the type of farming enterprise and the source of financing it chooses for its operations. In particular, besides savings, reformed collective farms largely relied on commercial bank loans with partial rebate of interest (reported by 46% of these respondents) and loans from commercial partners (11%). As for private farmers, the second most important source of funding for them was loans from individuals (reported by 11% of these respondents), while commercial bank loans with partial interest rebate ranked third among their most significant sources of funding (9%).
6% 10%
84%
21%
50%
33%
2% 10%
21%
70%
1%
0%
10%
20%
30%
40%
50%
60%
70%
80%
90%
Private farms Reformed collective farms Overall sample
Use Used in 2001Did not and do not use Refused to answer
24
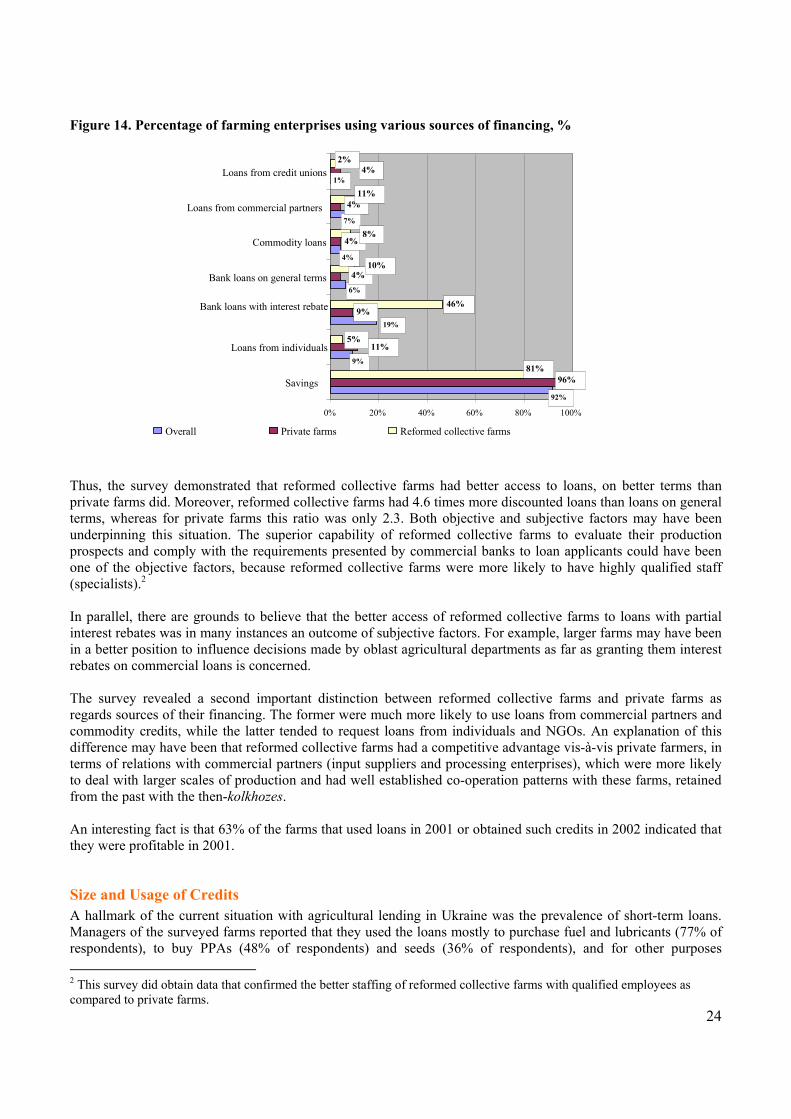
Figure 14. Percentage of farming enterprises using various sources of financing, %
Thus, the survey demonstrated that reformed collective farms had better access to loans, on better terms than private farms did. Moreover, reformed collective farms had 4.6 times more discounted loans than loans on general terms, whereas for private farms this ratio was only 2.3. Both objective and subjective factors may have been underpinning this situation. The superior capability of reformed collective farms to evaluate their production prospects and comply with the requirements presented by commercial banks to loan applicants could have been one of the objective factors, because reformed collective farms were more likely to have highly qualified staff (specialists).2 In parallel, there are grounds to believe that the better access of reformed collective farms to loans with partial interest rebates was in many instances an outcome of subjective factors. For example, larger farms may have been in a better position to influence decisions made by oblast agricultural departments as far as granting them interest rebates on commercial loans is concerned. The survey revealed a second important distinction between reformed collective farms and private farms as regards sources of their financing. The former were much more likely to use loans from commercial partners and commodity credits, while the latter tended to request loans from individuals and NGOs. An explanation of this difference may have been that reformed collective farms had a competitive advantage vis-à-vis private farmers, in terms of relations with commercial partners (input suppliers and processing enterprises), which were more likely to deal with larger scales of production and had well established co-operation patterns with these farms, retained from the past with the then-kolkhozes. An interesting fact is that 63% of the farms that used loans in 2001 or obtained such credits in 2002 indicated that they were profitable in 2001.
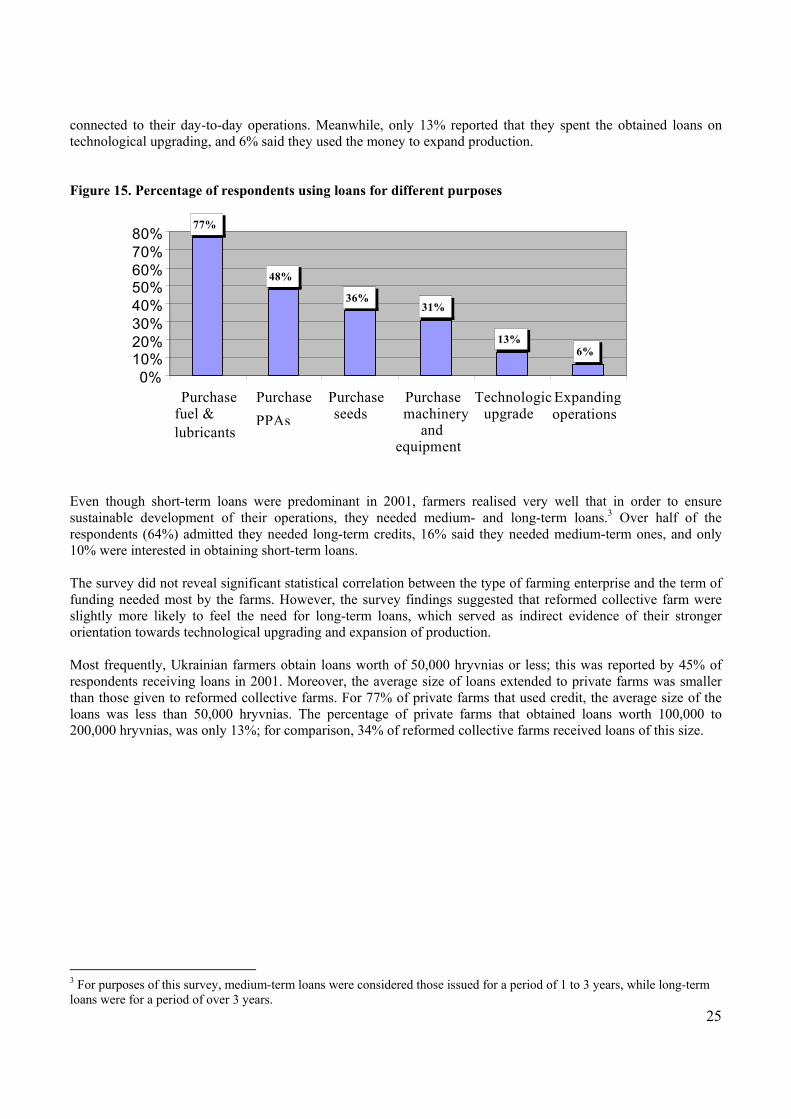
Size and Usage of Credits A hallmark of the current situation with agricultural lending in Ukraine was the prevalence of short-term loans. Managers of the surveyed farms reported that they used the loans mostly to purchase fuel and lubricants (77% of respondents), to buy PPAs (48% of respondents) and seeds (36% of respondents), and for other purposes 2 This survey did obtain data that confirmed the better staffing of reformed collective farms with qualified employees as compared to private farms.
9%
4%
5%
46%
7%
9%
6%
92%
19%
1%
4%
96%
4%
4%
11%
4%
2%
81%
11%
10%
8%
0% 20% 40% 60% 80% 100%
Savings
Loans from individuals
Bank loans with interest rebate
Bank loans on general terms
Commodity loans
Loans from commercial partners
Loans from credit unions
Overall Private farms Reformed collective farms
25
connected to their day-to-day operations. Meanwhile, only 13% reported that they spent the obtained loans on technological upgrading, and 6% said they used the money to expand production. Figure 15. Percentage of respondents using loans for different purposes Even though short-term loans were predominant in 2001, farmers realised very well that in order to ensure sustainable development of their operations, they needed medium- and long-term loans.3 Over half of the respondents (64%) admitted they needed long-term credits, 16% said they needed medium-term ones, and only 10% were interested in obtaining short-term loans. The survey did not reveal significant statistical correlation between the type of farming enterprise and the term of funding needed most by the farms. However, the survey findings suggested that reformed collective farm were slightly more likely to feel the need for long-term loans, which served as indirect evidence of their stronger orientation towards technological upgrading and expansion of production. Most frequently, Ukrainian farmers obtain loans worth of 50,000 hryvnias or less; this was reported by 45% of respondents receiving loans in 2001. Moreover, the average size of loans extended to private farms was smaller than those given to reformed collective farms. For 77% of private farms that used credit, the average size of the loans was less than 50,000 hryvnias. The percentage of private farms that obtained loans worth 100,000 to 200,000 hryvnias, was only 13%; for comparison, 34% of reformed collective farms received loans of this size.
3 For purposes of this survey, medium-term loans were considered those issued for a period of 1 to 3 years, while long-term loans were for a period of over 3 years.
77%
48%
36%31%
13%6%
0%10%20%30%40%50%60%70%80%
Purchasefuel &lubricants
PurchasePPAs
Purchaseseeds
Purchasemachinery
andequipment
Technologicupgrade
Expandingoperations
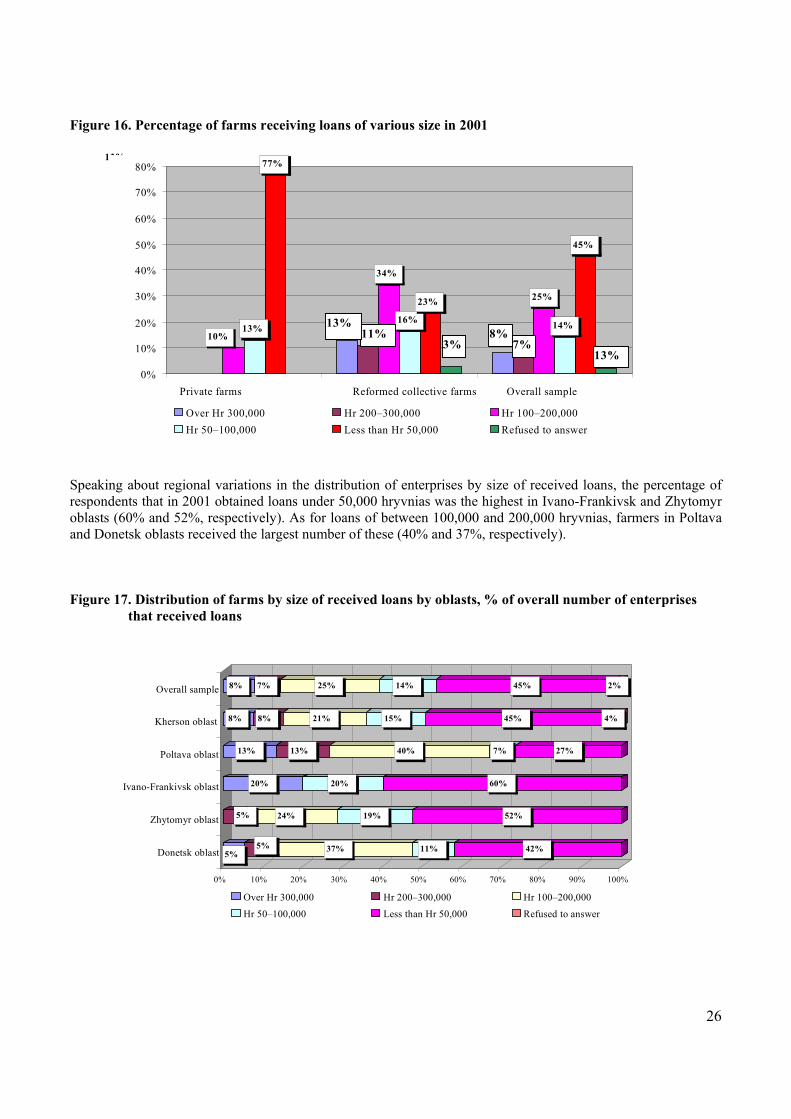
26
Figure 16. Percentage of farms receiving loans of various size in 2001 Speaking about regional variations in the distribution of enterprises by size of received loans, the percentage of respondents that in 2001 obtained loans under 50,000 hryvnias was the highest in Ivano-Frankivsk and Zhytomyr oblasts (60% and 52%, respectively). As for loans of between 100,000 and 200,000 hryvnias, farmers in Poltava and Donetsk oblasts received the largest number of these (40% and 37%, respectively). Figure 17. Distribution of farms by size of received loans by oblasts, % of overall number of enterprises
that received loans
13%
34%
25%
13% 16% 14%
77%
23%
45%
10%
0%
10%
20%
30%
40%
50%
60%
70%
80%
Private farms Reformed collective farms Overall sample Over Hr 300,000 Hr 200–300,000 Hr 100–200,000 Hr 50–100,000 Less than Hr 50,000 Refused to answer
13% 7%
8%3%
11% 13%
5%5% 37% 11% 42%
5% 24% 19% 52%
20% 20% 60%
13% 13% 40% 7% 27%
8% 8% 21% 15% 45% 4%
8% 7% 25% 14% 45% 2%
0% 10% 20% 30% 40% 50% 60% 70% 80% 90% 100%
Donetsk oblast
Zhytomyr oblast
Ivano-Frankivsk oblast
Poltava oblast
Kherson oblast
Overall sample
Over Hr 300,000 Hr 200–300,000 Hr 100–200,000 Hr 50–100,000 Less than Hr 50,000 Refused to answer
27
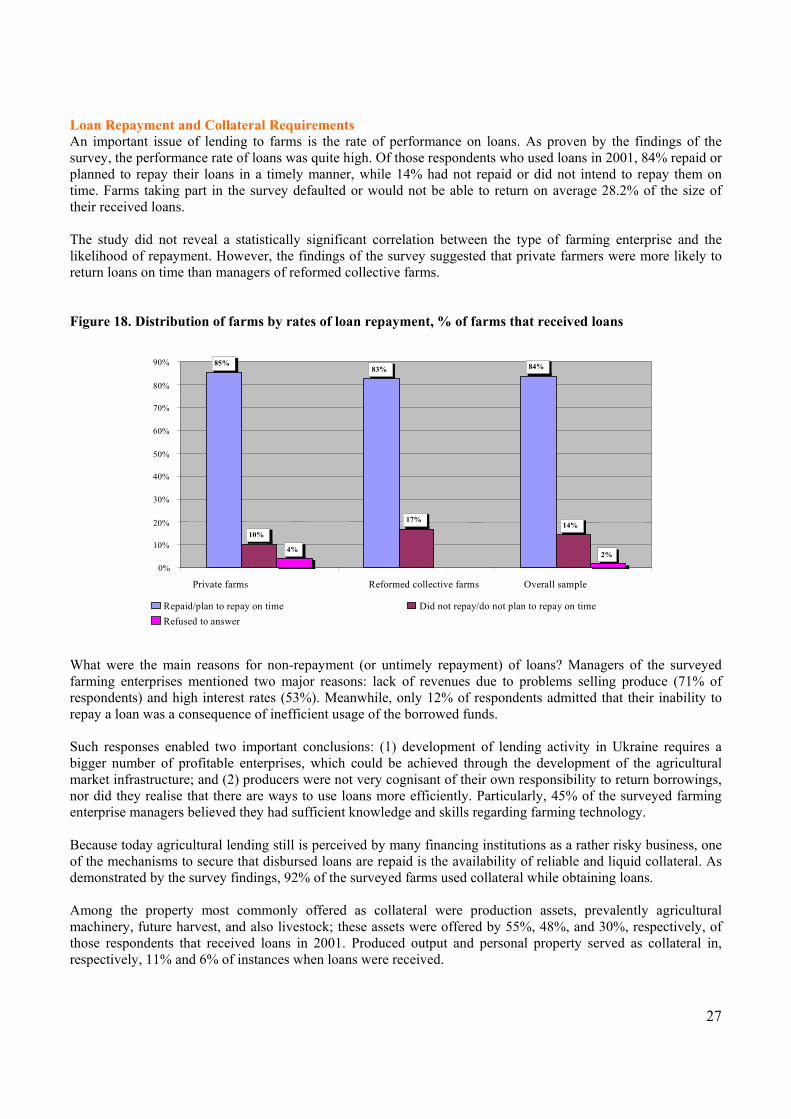
Loan Repayment and Collateral Requirements An important issue of lending to farms is the rate of performance on loans. As proven by the findings of the survey, the performance rate of loans was quite high. Of those respondents who used loans in 2001, 84% repaid or planned to repay their loans in a timely manner, while 14% had not repaid or did not intend to repay them on time. Farms taking part in the survey defaulted or would not be able to return on average 28.2% of the size of their received loans. The study did not reveal a statistically significant correlation between the type of farming enterprise and the likelihood of repayment. However, the findings of the survey suggested that private farmers were more likely to return loans on time than managers of reformed collective farms. Figure 18. Distribution of farms by rates of loan repayment, % of farms that received loans What were the main reasons for non-repayment (or untimely repayment) of loans? Managers of the surveyed farming enterprises mentioned two major reasons: lack of revenues due to problems selling produce (71% of respondents) and high interest rates (53%). Meanwhile, only 12% of respondents admitted that their inability to repay a loan was a consequence of inefficient usage of the borrowed funds. Such responses enabled two important conclusions: (1) development of lending activity in Ukraine requires a bigger number of profitable enterprises, which could be achieved through the development of the agricultural market infrastructure; and (2) producers were not very cognisant of their own responsibility to return borrowings, nor did they realise that there are ways to use loans more efficiently. Particularly, 45% of the surveyed farming enterprise managers believed they had sufficient knowledge and skills regarding farming technology. Because today agricultural lending still is perceived by many financing institutions as a rather risky business, one of the mechanisms to secure that disbursed loans are repaid is the availability of reliable and liquid collateral. As demonstrated by the survey findings, 92% of the surveyed farms used collateral while obtaining loans. Among the property most commonly offered as collateral were production assets, prevalently agricultural machinery, future harvest, and also livestock; these assets were offered by 55%, 48%, and 30%, respectively, of those respondents that received loans in 2001. Produced output and personal property served as collateral in, respectively, 11% and 6% of instances when loans were received.
85%83% 84%
10%
17%14%
4%2%
0%
10%
20%
30%
40%
50%
60%
70%
80%
90%
Private farms Reformed collective farms Overall sample
Repaid/plan to repay on time Did not repay/do not plan to repay on timeRefused to answer
28
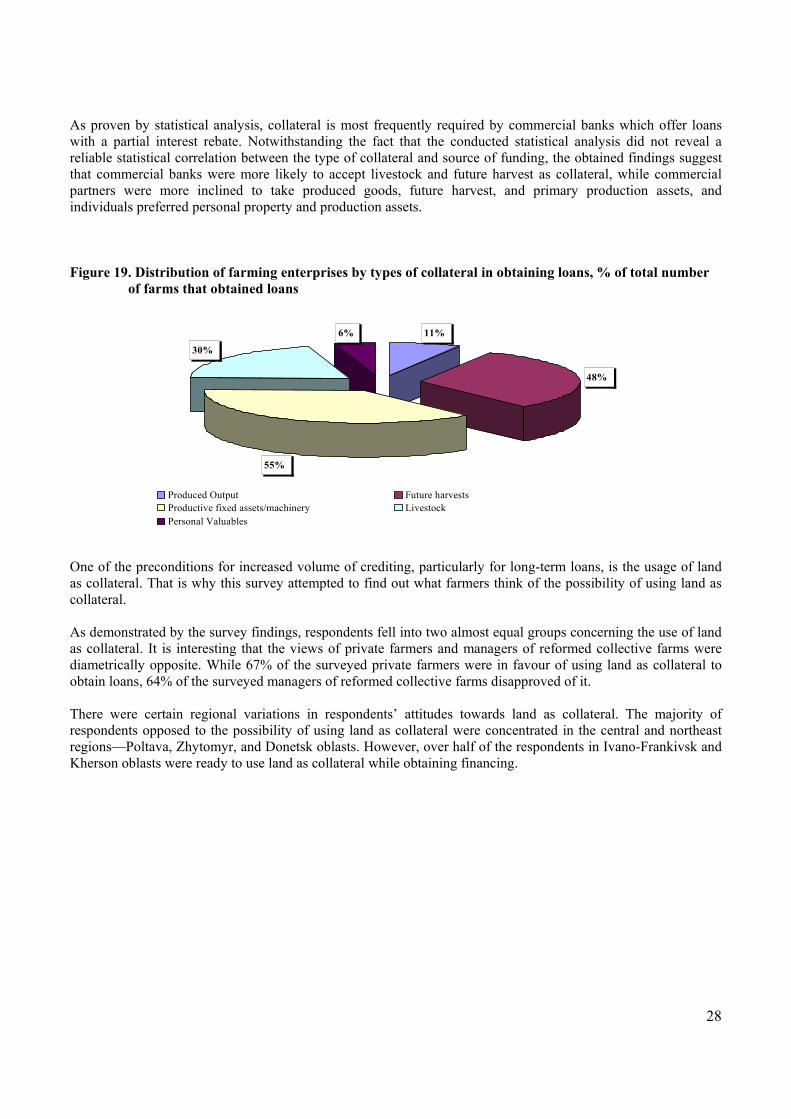
As proven by statistical analysis, collateral is most frequently required by commercial banks which offer loans with a partial interest rebate. Notwithstanding the fact that the conducted statistical analysis did not reveal a reliable statistical correlation between the type of collateral and source of funding, the obtained findings suggest that commercial banks were more likely to accept livestock and future harvest as collateral, while commercial partners were more inclined to take produced goods, future harvest, and primary production assets, and individuals preferred personal property and production assets. Figure 19. Distribution of farming enterprises by types of collateral in obtaining loans, % of total number
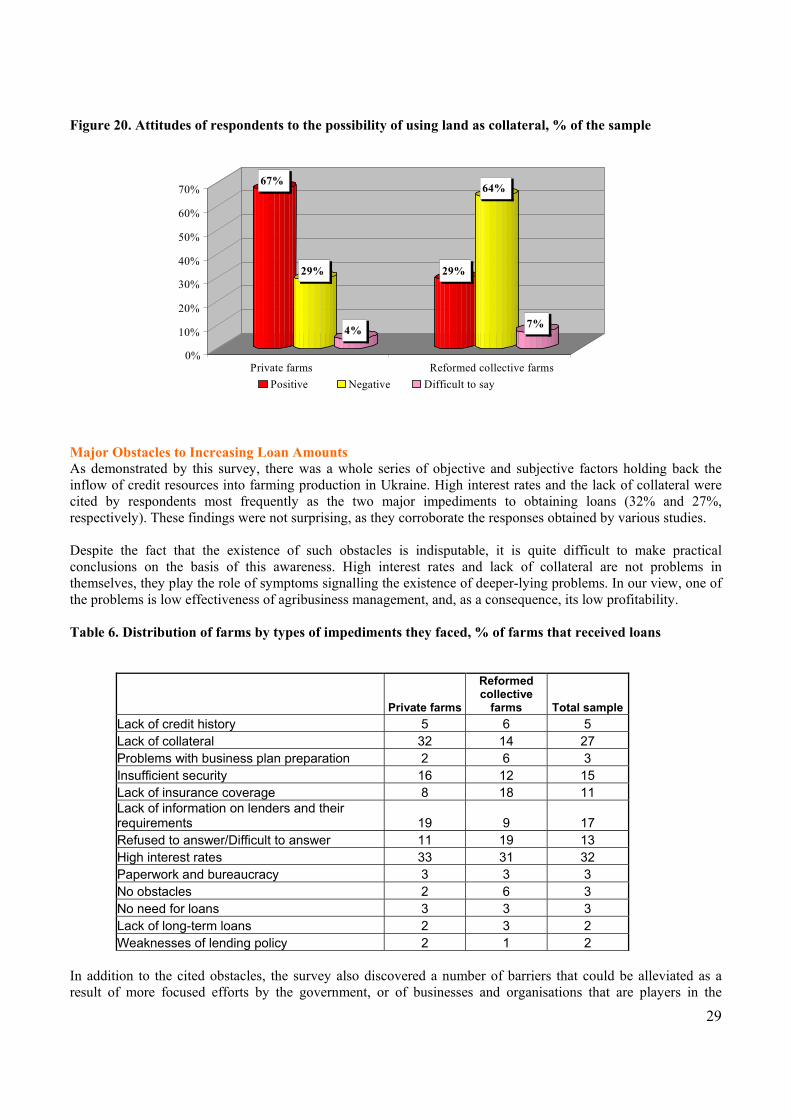
of farms that obtained loans One of the preconditions for increased volume of crediting, particularly for long-term loans, is the usage of land as collateral. That is why this survey attempted to find out what farmers think of the possibility of using land as collateral. As demonstrated by the survey findings, respondents fell into two almost equal groups concerning the use of land as collateral. It is interesting that the views of private farmers and managers of reformed collective farms were diametrically opposite. While 67% of the surveyed private farmers were in favour of using land as collateral to obtain loans, 64% of the surveyed managers of reformed collective farms disapproved of it. There were certain regional variations in respondents’ attitudes towards land as collateral. The majority of respondents opposed to the possibility of using land as collateral were concentrated in the central and northeast regions—Poltava, Zhytomyr, and Donetsk oblasts. However, over half of the respondents in Ivano-Frankivsk and Kherson oblasts were ready to use land as collateral while obtaining financing.
11%
48%
55%
30% 6%
Produced Output Future harvestsProductive fixed assets/machinery LivestockPersonal Valuables
29
Figure 20. Attitudes of respondents to the possibility of using land as collateral, % of the sample
Major Obstacles to Increasing Loan Amounts As demonstrated by this survey, there was a whole series of objective and subjective factors holding back the inflow of credit resources into farming production in Ukraine. High interest rates and the lack of collateral were cited by respondents most frequently as the two major impediments to obtaining loans (32% and 27%, respectively). These findings were not surprising, as they corroborate the responses obtained by various studies. Despite the fact that the existence of such obstacles is indisputable, it is quite difficult to make practical conclusions on the basis of this awareness. High interest rates and lack of collateral are not problems in themselves, they play the role of symptoms signalling the existence of deeper-lying problems. In our view, one of the problems is low effectiveness of agribusiness management, and, as a consequence, its low profitability. Table 6. Distribution of farms by types of impediments they faced, % of farms that received loans
Private farms
Reformed collective
farms Total sample Lack of credit history 5 6 5 Lack of collateral 32 14 27 Problems with business plan preparation 2 6 3 Insufficient security 16 12 15 Lack of insurance coverage 8 18 11 Lack of information on lenders and their requirements 19 9 17 Refused to answer/Difficult to answer 11 19 13 High interest rates 33 31 32 Paperwork and bureaucracy 3 3 3 No obstacles 2 6 3 No need for loans 3 3 3 Lack of long-term loans 2 3 2 Weaknesses of lending policy 2 1 2
In addition to the cited obstacles, the survey also discovered a number of barriers that could be alleviated as a result of more focused efforts by the government, or of businesses and organisations that are players in the
67%
29%
4%
29%
64%
7%
0%
10%
20%
30%
40%
50%
60%
70%
Private farms Reformed collective farmsPositive Negative Difficult to say
30
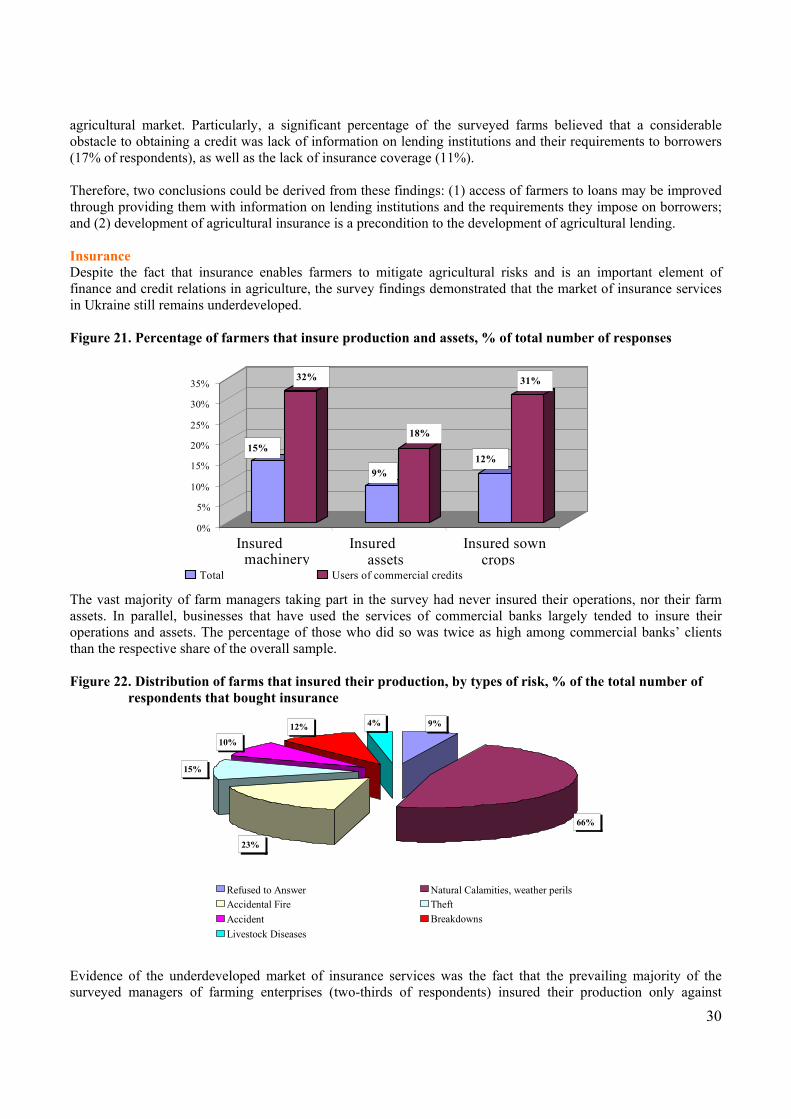
agricultural market. Particularly, a significant percentage of the surveyed farms believed that a considerable obstacle to obtaining a credit was lack of information on lending institutions and their requirements to borrowers (17% of respondents), as well as the lack of insurance coverage (11%). Therefore, two conclusions could be derived from these findings: (1) access of farmers to loans may be improved through providing them with information on lending institutions and the requirements they impose on borrowers; and (2) development of agricultural insurance is a precondition to the development of agricultural lending. Insurance Despite the fact that insurance enables farmers to mitigate agricultural risks and is an important element of finance and credit relations in agriculture, the survey findings demonstrated that the market of insurance services in Ukraine still remains underdeveloped. Figure 21. Percentage of farmers that insure production and assets, % of total number of responses The vast majority of farm managers taking part in the survey had never insured their operations, nor their farm assets. In parallel, businesses that have used the services of commercial banks largely tended to insure their operations and assets. The percentage of those who did so was twice as high among commercial banks’ clients than the respective share of the overall sample. Figure 22. Distribution of farms that insured their production, by types of risk, % of the total number of
respondents that bought insurance Evidence of the underdeveloped market of insurance services was the fact that the prevailing majority of the surveyed managers of farming enterprises (two-thirds of respondents) insured their production only against
9%
66% 23%
15%
10%
12% 4%
Refused to Answer Natural Calamities, weather perils Accidental Fire TheftAccident BreakdownsLivestock Diseases
15%
32%
9%
18%
12%
31%
0%
5%
10%
15%
20%
25%
30%
35%
Insuredmachinery
Insuredassets
Insured sowncrops
Total Users of commercial credits
31
natural perils and adverse weather effects (66%) and accidental fire (23%). A significantly smaller portion of respondents insured their operations against theft, breakdowns, and accidents—15%, 12%, and 10% of respondents, respectively. Only 4% of the surveyed farmers insured their livestock for diseases. Statistical analysis revealed some dependence between the type of insurable risk and the geographical location of the surveyed farms. Natural calamities and weather peril insurance seemed to be more common among the farmers in Donetsk, Zhytomyr, and Ivano-Frankivsk oblasts. Zhytomyr and Ivano-Frankivsk farms also frequently bought fire insurance. Insurance against theft was common among Ivano-Frankivsk and Kherson farms, while farmers in Kherson oblast were likely to buy accident insurance, and Ivano-Frankivsk farmers tend to insure livestock against diseases. Statistical analysis did not reveal any correlation between the type of risk and the core area the farms were involved in. The prevailing majority of respondents (78% of the sample) who insured their operations, never suffered insurable events. Of the insignificant portion of respondents that faced such instances, the majority (13%) received indemnity. Therefore, agricultural insurance in Ukraine currently seems to perform the function of a supplemental measure for obtaining loans. Moreover, in such situations, assets typically offered as collateral were insured. However, the principal function of insurance in agriculture should be to mitigate risks related to operating farms, and in this way to prevent drastic fluctuations of farmers’ income. Farmers’ Needs for Skills and Expertise The findings of the survey demonstrated that most managers of farming enterprises felt an acute need to improve their expertise and skills in the crucial areas of agricultural lending and insurance. Only 6% of the surveyed farm managers indicated that they were quite happy with the level of their expertise. What types of skills and knowledge do farmers need the most? First of all, they need additional knowledge in taxation, legal information related to lending, also accounting and skills to find sources of funding; this was reported by 39%, 37%, 35%, and 34%, respectively, of respondents in the sample. Secondly, a considerable portion of respondents also felt the need to improve their skills in finding business partners, and more advanced business planning skills—respectively, 29% and 27%. In addition, the need for certain knowledge and skills did not seem to depend as much on the type of farm as on the length of years in operation, and on geographical location. Figure 23. Farm managers’ needs for various skills, % of the sample
34% 29%
27% 33%
51%
34% 35%
11% 15% 13%
27%27%24%
31% 29%24%
34%36%39%
35%
40%
35%36% 37%
34%32%
52%
10%
0% 5%
10% 15% 20% 25% 30% 35% 40% 45% 50% 55%
Less than 2 yrs 2—5 years Over 5 years Total Sample Business Planning Skills Finding Business PartnersSearch for Sources of Funding Knowledge in TaxationAccounting and Book-Keeping Legal Aspects of LendingRefused to answer/difficult to answer
32
Managers of farms with less than two years of experience working in the agricultural sector need more skills and knowledge than managers of farms that had been operating for over five years. Managers of new enterprises were particularly in need of knowledge on the legal aspects of lending and taxation issues—52% and 51%, respectively. Managers of older businesses (2 to 5 years) were more likely to need more knowledge on taxation (40%) and accounting (37%). Table 7. Regional distribution of needs for knowledge, % of the total number of respondents in need of
these skills
Donetsk oblast Zhytomyr oblast
Ivano-Frankivsk oblast Poltava oblast
Kherson oblast
Business planning skills 45 38 34 11 21 Search for business partners 33 37 30 28 23 Finding sources of funding 38 30 58 18 33 Taxation 43 47 28 35 40 Accounting 35 33 22 38 38 Legal aspects of lending 37 38 30 35 39
As for regional variations in the need for new knowledge and skills on financing, respondents in Donetsk and Kherson oblasts seem to have the biggest need for such expertise (98% and 96%, respectively). Moreover, while business planning skills and searching for business partners and taxation were more likely to be needed by farmers in Donetsk and Zhytomyr oblasts, the problem of finding sources of funding was particularly acute for respondents in Ivano-Frankivsk oblast. The vast majority of respondents (over 76%) believed that in order to improve their knowledge on lending they might benefit from participation in seminars, workshops, and obtaining special printed information; respondents from Zhytomyr and Poltava oblasts, and partially from Ivano-Frankivsk oblast, appeared to be most interested in such events. Slightly less enthusiastic about training sessions were respondents in Donetsk and Kherson oblasts. This was equally true for managers of both private farms and reformed collective farms.
33
MANAGEMENT AND LEGAL ASPECTS OF FARMING OPERATIONS In their day-to-day operations, farmers have to handle not only production-related issues but also numerous organisational and legal issues. Among the purposes of this survey was to determine what legal and organisational problems farmers had, and how serious they were. For the purposes of this study, Ukrainian farming enterprises were split into two categories: private farms and enterprises founded on the basis of former collective farms. From the standpoint of legislation and practical operations, this distribution of enterprises was not ideal. However, the purpose of such distribution was to gauge the progress of development of SMEs in the form of private farming businesses. It is also important to note that private farming in Ukraine, to a larger extent than other forms of small and medium-scale production, reflects market orientation and trends in the development of rural SMEs. Both the findings of this survey and existing production practices clearly demonstrated the lack of a clear system of organisational and legal forms of rural enterprises. Today, one can’t tell distinctly the difference between a private farm, a private enterprise, a private leased enterprise, an individual (private) subsidiary farm, or a farm run by a private entrepreneur, small limited-liability company, etc. Regulation of Landownership Relations On the list of problems faced by farmers today, the ones related to regulation of landownership certainly took top position. Therefore, this aspect was in the focus of this survey. Interestingly, the findings may be considered controversial to a certain extent. Nearly half of the respondents (46% throughout the oblasts) reported that they had never encountered problems related to landownership, while only 0.3% of respondents cited imperfections in land legislation as an obstacle to effective operations of their enterprise. However, 24% did note that they had had difficulties with obtaining of land titles in exchange for their land share certificates. It is also important to remember that this survey was conducted among farm managers for whom this problem was of primary importance, in view of the concentration of land plots for use. There were also certain distinctions in the perception of problems connected to landownership regulation between private farms and reformed collective farms. Private farmers were more likely to face obstacles posed by the managers of collective farms’ legal successors or by state administration officials, as well as related to the demarcation of land plots in the field (reported by 28%, 24%, and 27% of private farm managers, respectively). Private farmers were also concerned with the lack of free land resources in their region. Coupled with the other problems mentioned above, this may be a considerable restricting factor holding back private farms’ growth. Managers of reformed collective farms were less likely to have problems with landownership relations. The range of problems they were concerned about was much narrower. Managers of reformed collective farms tended to be more anxious about rental of land and having land plots demarcated in the field; this was reported by 22% and 15% of respondents, respectively.
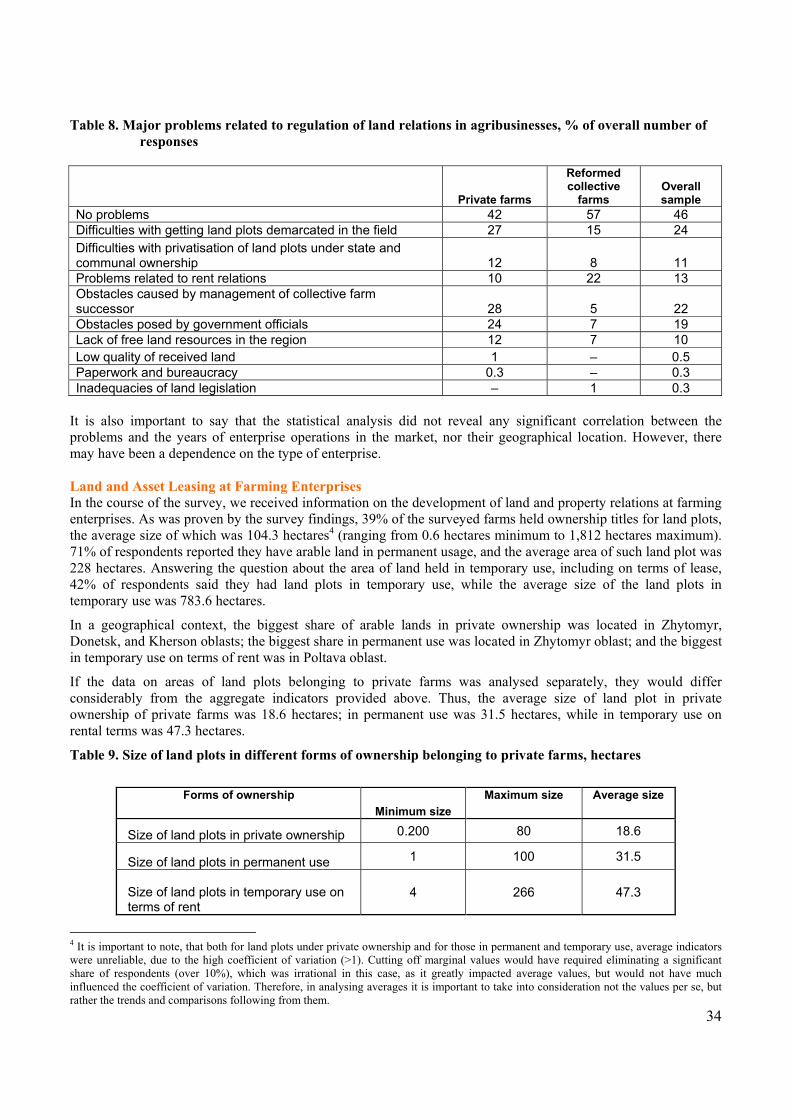
34
Table 8. Major problems related to regulation of land relations in agribusinesses, % of overall number of responses
Private farms
Reformed collective
farms Overall sample
No problems 42 57 46 Difficulties with getting land plots demarcated in the field 27 15 24 Difficulties with privatisation of land plots under state and communal ownership 12 8 11 Problems related to rent relations 10 22 13 Obstacles caused by management of collective farm successor 28 5 22 Obstacles posed by government officials 24 7 19 Lack of free land resources in the region 12 7 10 Low quality of received land 1 – 0.5 Paperwork and bureaucracy 0.3 – 0.3 Inadequacies of land legislation – 1 0.3
It is also important to say that the statistical analysis did not reveal any significant correlation between the problems and the years of enterprise operations in the market, nor their geographical location. However, there may have been a dependence on the type of enterprise. Land and Asset Leasing at Farming Enterprises In the course of the survey, we received information on the development of land and property relations at farming enterprises. As was proven by the survey findings, 39% of the surveyed farms held ownership titles for land plots, the average size of which was 104.3 hectares4 (ranging from 0.6 hectares minimum to 1,812 hectares maximum). 71% of respondents reported they have arable land in permanent usage, and the average area of such land plot was 228 hectares. Answering the question about the area of land held in temporary use, including on terms of lease, 42% of respondents said they had land plots in temporary use, while the average size of the land plots in temporary use was 783.6 hectares.
In a geographical context, the biggest share of arable lands in private ownership was located in Zhytomyr, Donetsk, and Kherson oblasts; the biggest share in permanent use was located in Zhytomyr oblast; and the biggest in temporary use on terms of rent was in Poltava oblast.
If the data on areas of land plots belonging to private farms was analysed separately, they would differ considerably from the aggregate indicators provided above. Thus, the average size of land plot in private ownership of private farms was 18.6 hectares; in permanent use was 31.5 hectares, while in temporary use on rental terms was 47.3 hectares.
Table 9. Size of land plots in different forms of ownership belonging to private farms, hectares
Forms of ownership
Minimum size Maximum size Average size
Size of land plots in private ownership 0.200 80 18.6
Size of land plots in permanent use 1 100 31.5
Size of land plots in temporary use on terms of rent
4 266 47.3
4 It is important to note, that both for land plots under private ownership and for those in permanent and temporary use, average indicators were unreliable, due to the high coefficient of variation (>1). Cutting off marginal values would have required eliminating a significant share of respondents (over 10%), which was irrational in this case, as it greatly impacted average values, but would not have much influenced the coefficient of variation. Therefore, in analysing averages it is important to take into consideration not the values per se, but rather the trends and comparisons following from them.
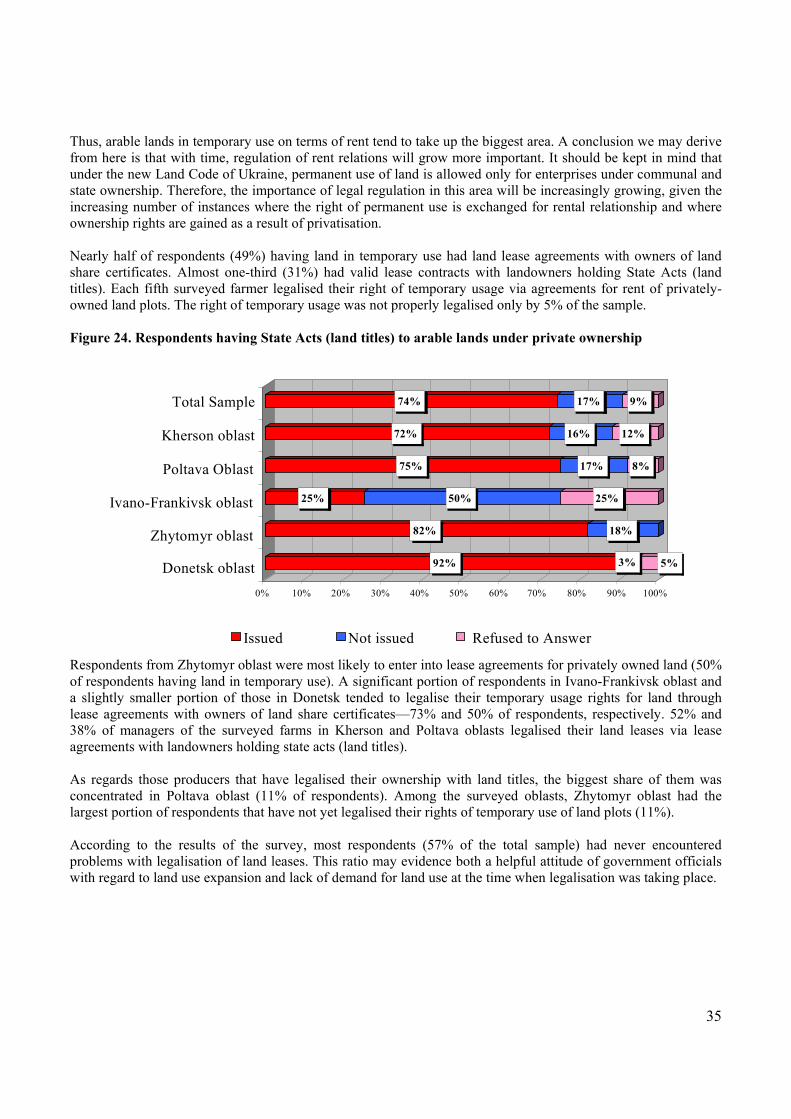
35
Thus, arable lands in temporary use on terms of rent tend to take up the biggest area. A conclusion we may derive from here is that with time, regulation of rent relations will grow more important. It should be kept in mind that under the new Land Code of Ukraine, permanent use of land is allowed only for enterprises under communal and state ownership. Therefore, the importance of legal regulation in this area will be increasingly growing, given the increasing number of instances where the right of permanent use is exchanged for rental relationship and where ownership rights are gained as a result of privatisation. Nearly half of respondents (49%) having land in temporary use had land lease agreements with owners of land share certificates. Almost one-third (31%) had valid lease contracts with landowners holding State Acts (land titles). Each fifth surveyed farmer legalised their right of temporary usage via agreements for rent of privately-owned land plots. The right of temporary usage was not properly legalised only by 5% of the sample. Figure 24. Respondents having State Acts (land titles) to arable lands under private ownership Respondents from Zhytomyr oblast were most likely to enter into lease agreements for privately owned land (50% of respondents having land in temporary use). A significant portion of respondents in Ivano-Frankivsk oblast and a slightly smaller portion of those in Donetsk tended to legalise their temporary usage rights for land through lease agreements with owners of land share certificates—73% and 50% of respondents, respectively. 52% and 38% of managers of the surveyed farms in Kherson and Poltava oblasts legalised their land leases via lease agreements with landowners holding state acts (land titles). As regards those producers that have legalised their ownership with land titles, the biggest share of them was concentrated in Poltava oblast (11% of respondents). Among the surveyed oblasts, Zhytomyr oblast had the largest portion of respondents that have not yet legalised their rights of temporary use of land plots (11%). According to the results of the survey, most respondents (57% of the total sample) had never encountered problems with legalisation of land leases. This ratio may evidence both a helpful attitude of government officials with regard to land use expansion and lack of demand for land use at the time when legalisation was taking place.
92% 3% 5%
82% 18%
25% 50% 25%
75% 17% 8%
72% 16% 12%
74% 17% 9%
0% 10% 20% 30% 40% 50% 60% 70% 80% 90% 100%
Donetsk oblast
Zhytomyr oblast
Ivano-Frankivsk oblast
Poltava Oblast
Kherson oblast
Total Sample
Issued Not issued Refused to Answer
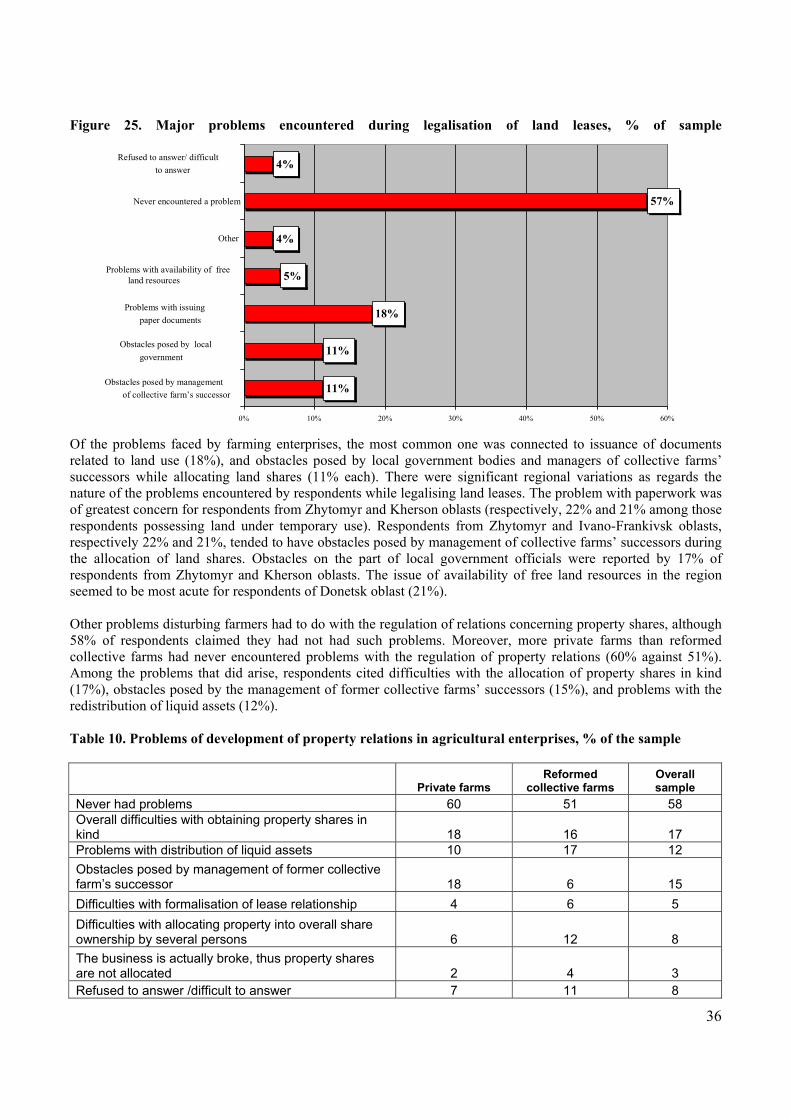
36
Figure 25. Major problems encountered during legalisation of land leases, % of sample
Of the problems faced by farming enterprises, the most common one was connected to issuance of documents related to land use (18%), and obstacles posed by local government bodies and managers of collective farms’ successors while allocating land shares (11% each). There were significant regional variations as regards the nature of the problems encountered by respondents while legalising land leases. The problem with paperwork was of greatest concern for respondents from Zhytomyr and Kherson oblasts (respectively, 22% and 21% among those respondents possessing land under temporary use). Respondents from Zhytomyr and Ivano-Frankivsk oblasts, respectively 22% and 21%, tended to have obstacles posed by management of collective farms’ successors during the allocation of land shares. Obstacles on the part of local government officials were reported by 17% of respondents from Zhytomyr and Kherson oblasts. The issue of availability of free land resources in the region seemed to be most acute for respondents of Donetsk oblast (21%). Other problems disturbing farmers had to do with the regulation of relations concerning property shares, although 58% of respondents claimed they had not had such problems. Moreover, more private farms than reformed collective farms had never encountered problems with the regulation of property relations (60% against 51%). Among the problems that did arise, respondents cited difficulties with the allocation of property shares in kind (17%), obstacles posed by the management of former collective farms’ successors (15%), and problems with the redistribution of liquid assets (12%). Table 10. Problems of development of property relations in agricultural enterprises, % of the sample
Private farms Reformed
collective farms Overall sample
Never had problems 60 51 58 Overall difficulties with obtaining property shares in kind 18 16 17 Problems with distribution of liquid assets 10 17 12 Obstacles posed by management of former collective farm’s successor 18 6 15 Difficulties with formalisation of lease relationship 4 6 5 Difficulties with allocating property into overall share ownership by several persons 6 12 8 The business is actually broke, thus property shares are not allocated 2 4 3 Refused to answer /difficult to answer 7 11 8
11%
18%
5%
4%
57%
4%
11%
0% 10% 20% 30% 40% 50% 60%
Obstacles posed by management of collective farm’s successor
Obstacles posed by local government
Problems with issuing paper documents
Problems with availability of free land resources
Other
Never encountered a problem
Refused to answer/ difficult to answer
37
Analysis of problems with regard to the development of property relations in the surveyed oblasts demonstrated that respondents from Poltava, Ivano-Frankivsk, and Donetsk oblasts (respectively, 24%, 18%, and 18%) frequently reported difficulties with obtaining property shares in kind. Problems with the distribution of liquid assets were typical for property relations in Poltava (16%), Zhytomyr (15%), and Ivano-Frankivsk (14%) oblasts. Enterprises in Ivano-Frankivsk and Zhytomyr oblasts (24% and 17%, respectively) were most likely to face obstacles posed by the management of former collective farms’ successors. Finally, the problem of legalising property into common share ownership by several persons was mentioned by 18% of respondents in Ivano-Frankivsk oblast.
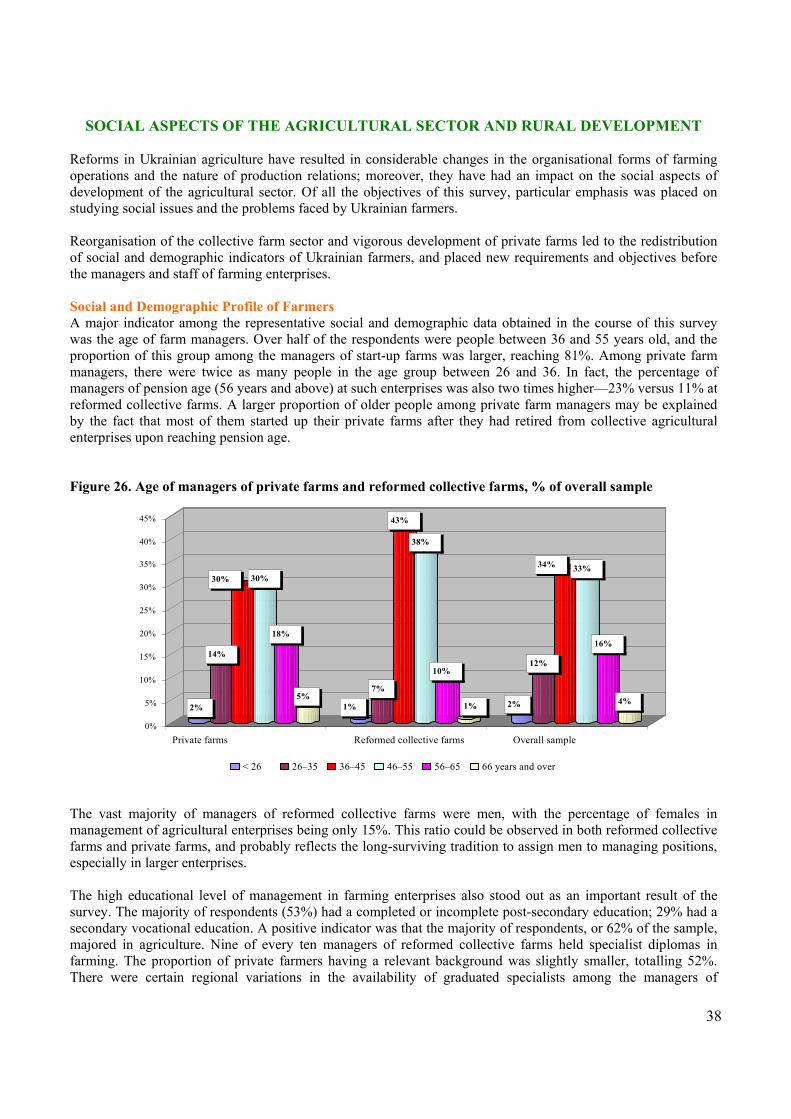
38
SOCIAL ASPECTS OF THE AGRICULTURAL SECTOR AND RURAL DEVELOPMENT
Reforms in Ukrainian agriculture have resulted in considerable changes in the organisational forms of farming operations and the nature of production relations; moreover, they have had an impact on the social aspects of development of the agricultural sector. Of all the objectives of this survey, particular emphasis was placed on studying social issues and the problems faced by Ukrainian farmers. Reorganisation of the collective farm sector and vigorous development of private farms led to the redistribution of social and demographic indicators of Ukrainian farmers, and placed new requirements and objectives before the managers and staff of farming enterprises. Social and Demographic Profile of Farmers A major indicator among the representative social and demographic data obtained in the course of this survey was the age of farm managers. Over half of the respondents were people between 36 and 55 years old, and the proportion of this group among the managers of start-up farms was larger, reaching 81%. Among private farm managers, there were twice as many people in the age group between 26 and 36. In fact, the percentage of managers of pension age (56 years and above) at such enterprises was also two times higher—23% versus 11% at reformed collective farms. A larger proportion of older people among private farm managers may be explained by the fact that most of them started up their private farms after they had retired from collective agricultural enterprises upon reaching pension age. Figure 26. Age of managers of private farms and reformed collective farms, % of overall sample The vast majority of managers of reformed collective farms were men, with the percentage of females in management of agricultural enterprises being only 15%. This ratio could be observed in both reformed collective farms and private farms, and probably reflects the long-surviving tradition to assign men to managing positions, especially in larger enterprises. The high educational level of management in farming enterprises also stood out as an important result of the survey. The majority of respondents (53%) had a completed or incomplete post-secondary education; 29% had a secondary vocational education. A positive indicator was that the majority of respondents, or 62% of the sample, majored in agriculture. Nine of every ten managers of reformed collective farms held specialist diplomas in farming. The proportion of private farmers having a relevant background was slightly smaller, totalling 52%. There were certain regional variations in the availability of graduated specialists among the managers of
2%
14%
30% 30%
18%
5%1%
7%
43%
38%
10%
1% 2%
12%
34% 33%
16%
4%
0%
5%
10%
15%
20%
25%
30%
35%
40%
45%
Private farms Reformed collective farms Overall sample
< 26 26–35 36–45 46–55 56–65 66 years and over
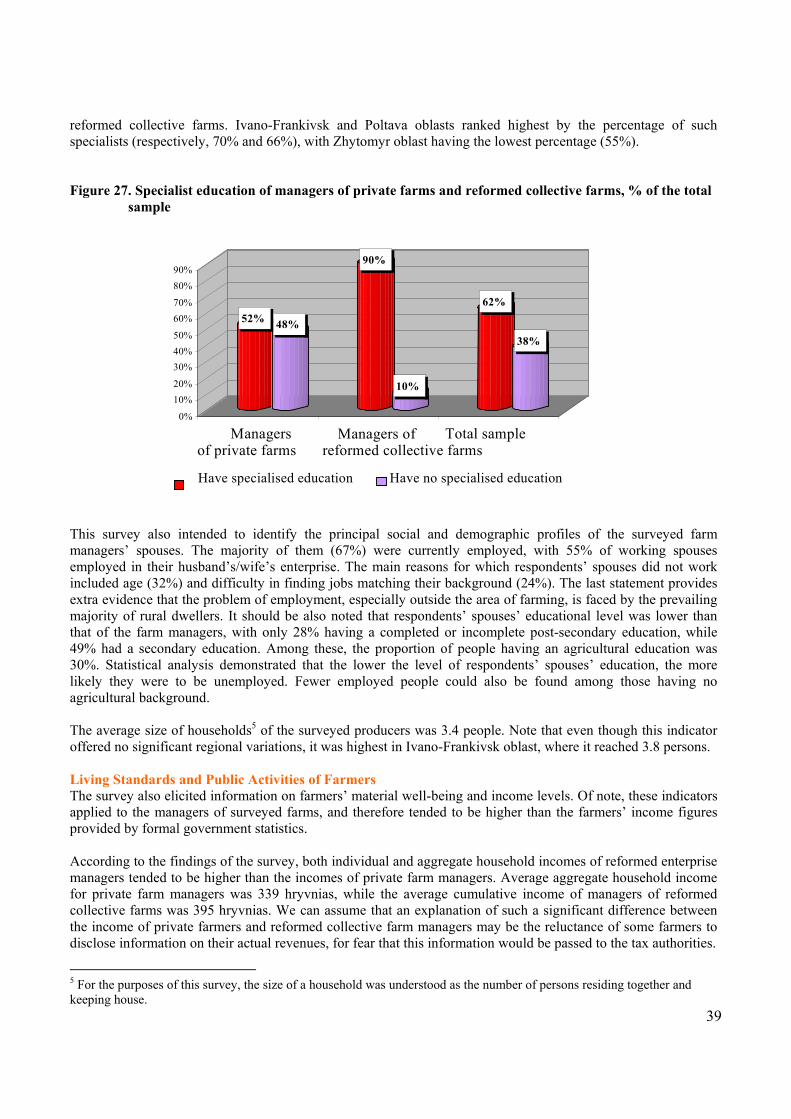
39
reformed collective farms. Ivano-Frankivsk and Poltava oblasts ranked highest by the percentage of such specialists (respectively, 70% and 66%), with Zhytomyr oblast having the lowest percentage (55%). Figure 27. Specialist education of managers of private farms and reformed collective farms, % of the total
sample
This survey also intended to identify the principal social and demographic profiles of the surveyed farm managers’ spouses. The majority of them (67%) were currently employed, with 55% of working spouses employed in their husband’s/wife’s enterprise. The main reasons for which respondents’ spouses did not work included age (32%) and difficulty in finding jobs matching their background (24%). The last statement provides extra evidence that the problem of employment, especially outside the area of farming, is faced by the prevailing majority of rural dwellers. It should be also noted that respondents’ spouses’ educational level was lower than that of the farm managers, with only 28% having a completed or incomplete post-secondary education, while 49% had a secondary education. Among these, the proportion of people having an agricultural education was 30%. Statistical analysis demonstrated that the lower the level of respondents’ spouses’ education, the more likely they were to be unemployed. Fewer employed people could also be found among those having no agricultural background. The average size of households5 of the surveyed producers was 3.4 people. Note that even though this indicator offered no significant regional variations, it was highest in Ivano-Frankivsk oblast, where it reached 3.8 persons. Living Standards and Public Activities of Farmers The survey also elicited information on farmers’ material well-being and income levels. Of note, these indicators applied to the managers of surveyed farms, and therefore tended to be higher than the farmers’ income figures provided by formal government statistics. According to the findings of the survey, both individual and aggregate household incomes of reformed enterprise managers tended to be higher than the incomes of private farm managers. Average aggregate household income for private farm managers was 339 hryvnias, while the average cumulative income of managers of reformed collective farms was 395 hryvnias. We can assume that an explanation of such a significant difference between the income of private farmers and reformed collective farm managers may be the reluctance of some farmers to disclose information on their actual revenues, for fear that this information would be passed to the tax authorities.
5 For the purposes of this survey, the size of a household was understood as the number of persons residing together and keeping house.
52% 48%
90%
10%
62%
38%
0%
10%20%
30%40%50%
60%70%
80%90%
Managersof private farms
Managers ofreformed collective farms
Total sample
Have specialised education Have no specialised education
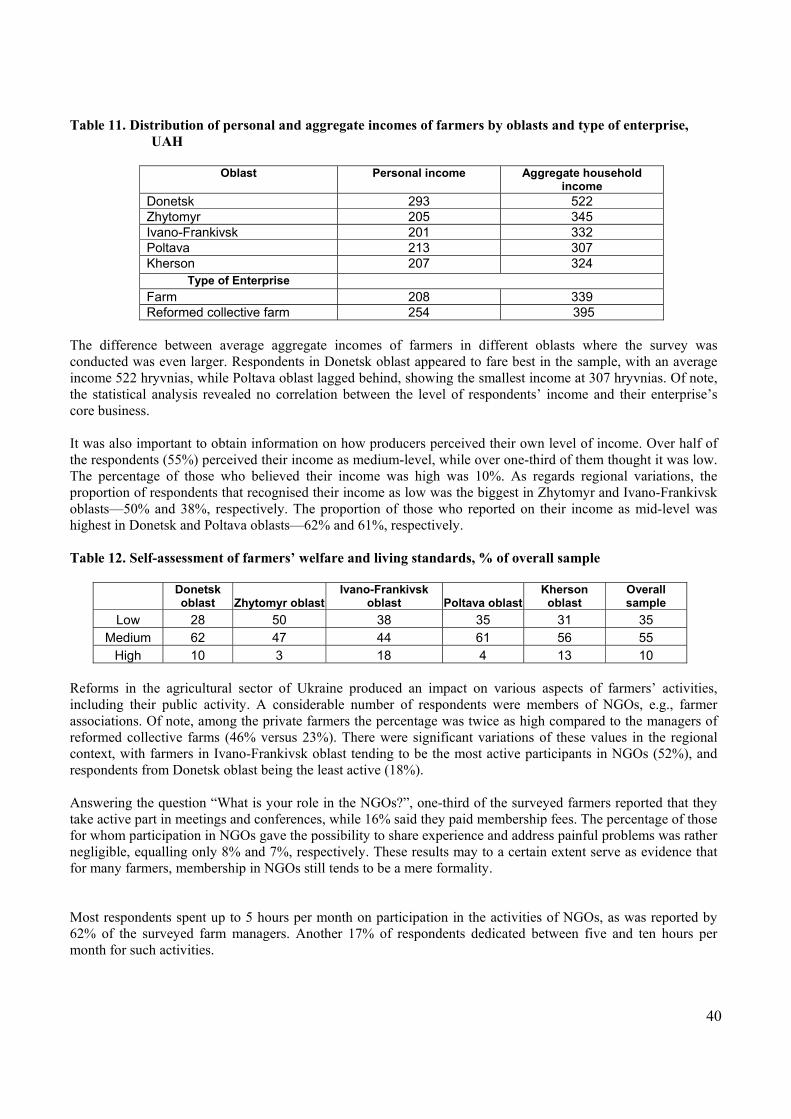
40
Table 11. Distribution of personal and aggregate incomes of farmers by oblasts and type of enterprise, UAH
Oblast Personal income Aggregate household
income Donetsk 293 522 Zhytomyr 205 345 Ivano-Frankivsk 201 332 Poltava 213 307 Kherson 207 324
Type of Enterprise Farm 208 339 Reformed collective farm 254 395
The difference between average aggregate incomes of farmers in different oblasts where the survey was conducted was even larger. Respondents in Donetsk oblast appeared to fare best in the sample, with an average income 522 hryvnias, while Poltava oblast lagged behind, showing the smallest income at 307 hryvnias. Of note, the statistical analysis revealed no correlation between the level of respondents’ income and their enterprise’s core business. It was also important to obtain information on how producers perceived their own level of income. Over half of the respondents (55%) perceived their income as medium-level, while over one-third of them thought it was low. The percentage of those who believed their income was high was 10%. As regards regional variations, the proportion of respondents that recognised their income as low was the biggest in Zhytomyr and Ivano-Frankivsk oblasts—50% and 38%, respectively. The proportion of those who reported on their income as mid-level was highest in Donetsk and Poltava oblasts—62% and 61%, respectively. Table 12. Self-assessment of farmers’ welfare and living standards, % of overall sample
Donetsk oblast Zhytomyr oblast
Ivano-Frankivsk oblast Poltava oblast
Kherson oblast
Overall sample
Low 28 50 38 35 31 35 Medium 62 47 44 61 56 55
High 10 3 18 4 13 10 Reforms in the agricultural sector of Ukraine produced an impact on various aspects of farmers’ activities, including their public activity. A considerable number of respondents were members of NGOs, e.g., farmer associations. Of note, among the private farmers the percentage was twice as high compared to the managers of reformed collective farms (46% versus 23%). There were significant variations of these values in the regional context, with farmers in Ivano-Frankivsk oblast tending to be the most active participants in NGOs (52%), and respondents from Donetsk oblast being the least active (18%). Answering the question “What is your role in the NGOs?”, one-third of the surveyed farmers reported that they take active part in meetings and conferences, while 16% said they paid membership fees. The percentage of those for whom participation in NGOs gave the possibility to share experience and address painful problems was rather negligible, equalling only 8% and 7%, respectively. These results may to a certain extent serve as evidence that for many farmers, membership in NGOs still tends to be a mere formality. Most respondents spent up to 5 hours per month on participation in the activities of NGOs, as was reported by 62% of the surveyed farm managers. Another 17% of respondents dedicated between five and ten hours per month for such activities.
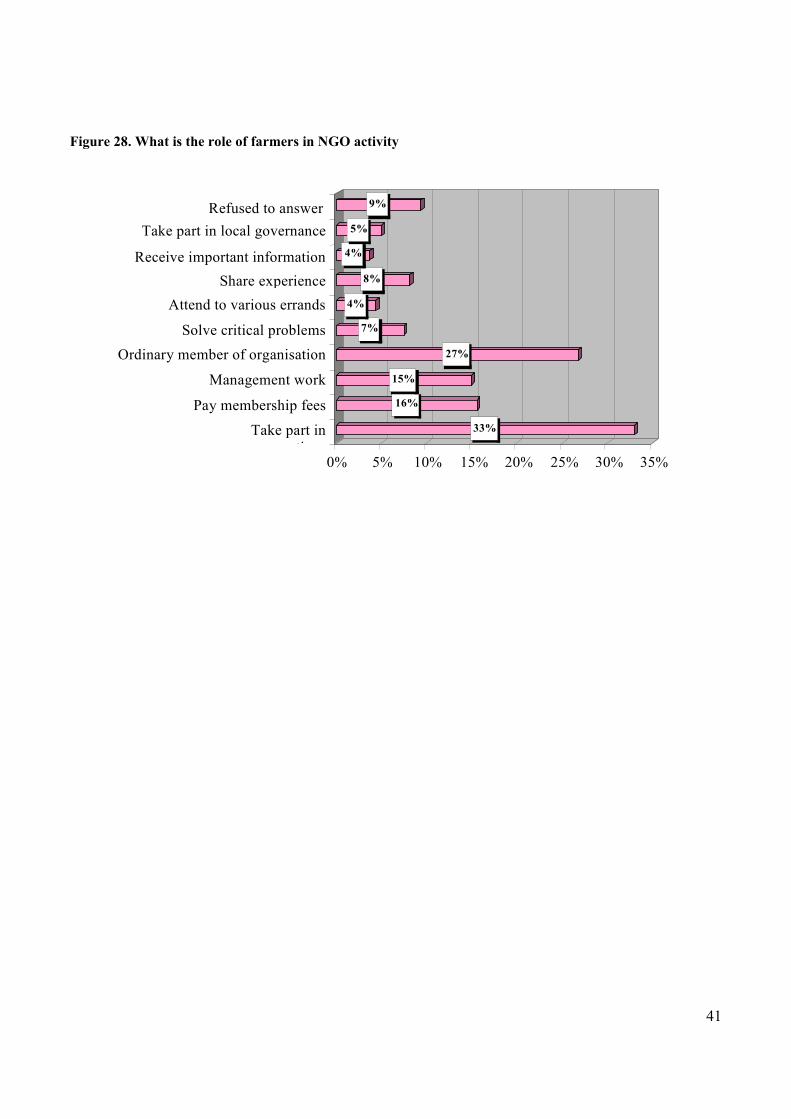
41
Figure 28. What is the role of farmers in NGO activity
33%
16%
15%
27%
7%
4%
8%
4%
5%
9%
0% 5% 10% 15% 20% 25% 30% 35%
Take part inti
Pay membership fees
Management work
Ordinary member of organisationSolve critical problems
Attend to various errandsShare experience
Receive important information
Take part in local governanceRefused to answer
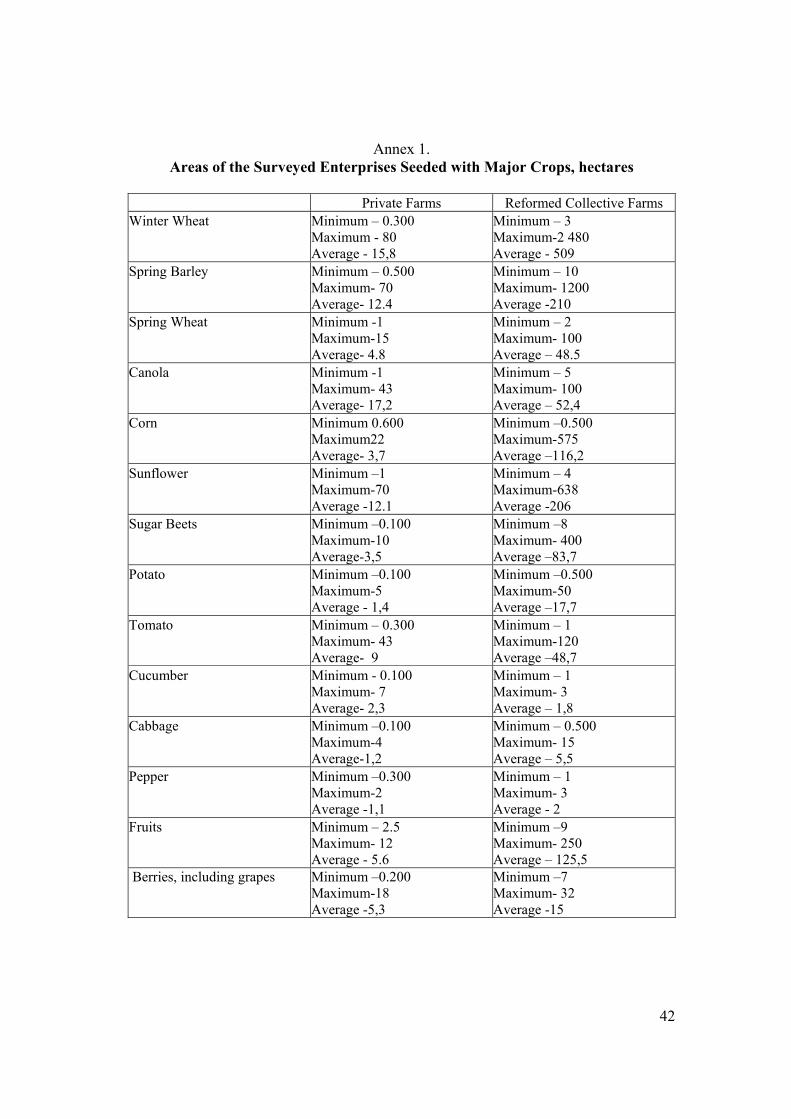
42
Annex 1. Areas of the Surveyed Enterprises Seeded with Major Crops, hectares
Private Farms Reformed Collective Farms
Winter Wheat Minimum – 0.300 Maximum - 80 Average - 15,8
Minimum – 3 Maximum-2 480 Average - 509
Spring Barley Minimum – 0.500 Maximum- 70 Average- 12.4
Minimum – 10 Maximum- 1200 Average -210
Spring Wheat Minimum -1 Maximum-15 Average- 4.8
Minimum – 2 Maximum- 100 Average – 48.5
Canola Minimum -1 Maximum- 43 Average- 17,2
Minimum – 5 Maximum- 100 Average – 52,4
Corn Minimum 0.600 Maximum22 Average- 3,7
Minimum –0.500 Maximum-575 Average –116,2
Sunflower Minimum –1 Maximum-70 Average -12.1
Minimum – 4 Maximum-638 Average -206
Sugar Beets Minimum –0.100 Maximum-10 Average-3,5
Minimum –8 Maximum- 400 Average –83,7
Potato Minimum –0.100 Maximum-5 Average - 1,4
Minimum –0.500 Maximum-50 Average –17,7
Tomato Minimum – 0.300 Maximum- 43 Average- 9
Minimum – 1 Maximum-120 Average –48,7
Cucumber Minimum - 0.100 Maximum- 7 Average- 2,3
Minimum – 1 Maximum- 3 Average – 1,8
Cabbage Minimum –0.100 Maximum-4 Average-1,2
Minimum – 0.500 Maximum- 15 Average – 5,5
Pepper Minimum –0.300 Maximum-2 Average -1,1
Minimum – 1 Maximum- 3 Average - 2
Fruits Minimum – 2.5 Maximum- 12 Average - 5.6
Minimum –9 Maximum- 250 Average – 125,5
Berries, including grapes
Minimum –0.200 Maximum-18 Average -5,3
Minimum –7 Maximum- 32 Average -15
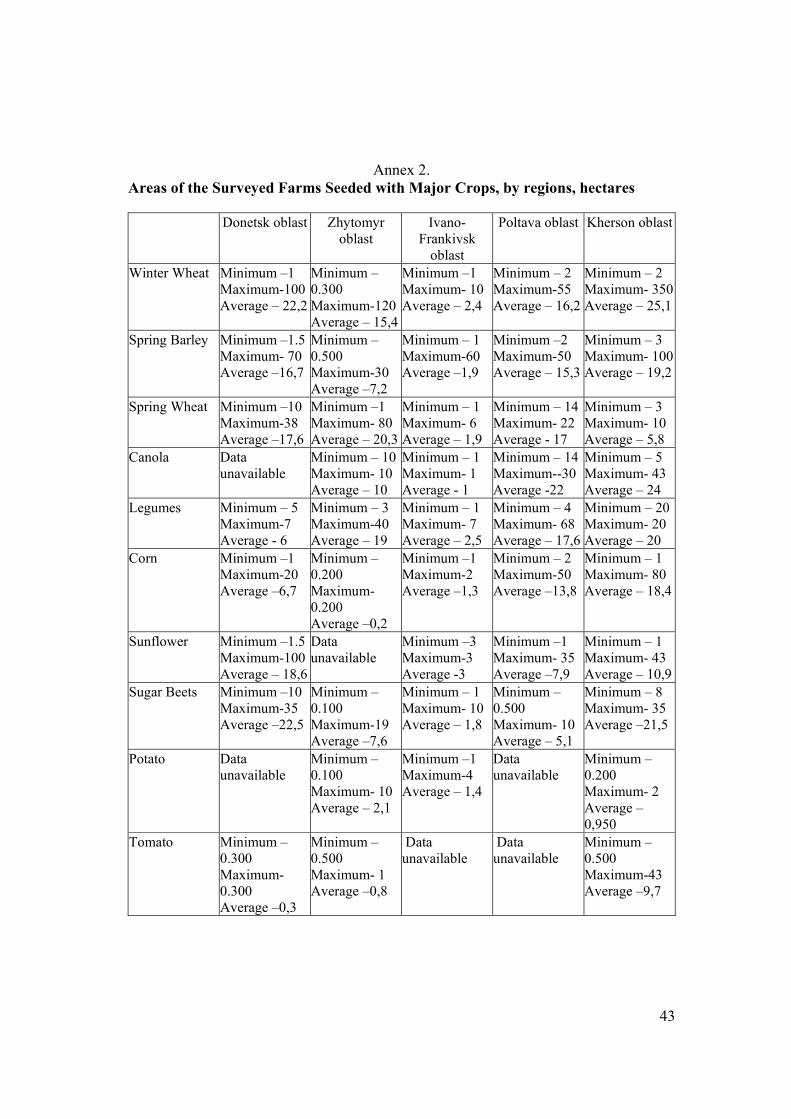
43
Annex 2.
Areas of the Surveyed Farms Seeded with Major Crops, by regions, hectares
Donetsk oblast Zhytomyr oblast
Ivano-Frankivsk
oblast
Poltava oblast Kherson oblast
Winter Wheat Minimum –1 Maximum-100 Average – 22,2
Minimum –0.300 Maximum-120Average – 15,4
Minimum –1 Maximum- 10 Average – 2,4
Minimum – 2 Maximum-55 Average – 16,2
Minimum – 2 Maximum- 350Average – 25,1
Spring Barley Minimum –1.5 Maximum- 70 Average –16,7
Minimum – 0.500 Maximum-30 Average –7,2
Minimum – 1 Maximum-60 Average –1,9
Minimum –2 Maximum-50 Average – 15,3
Minimum – 3 Maximum- 100Average – 19,2
Spring Wheat Minimum –10 Maximum-38 Average –17,6
Minimum –1 Maximum- 80 Average – 20,3
Minimum – 1 Maximum- 6 Average – 1,9
Minimum – 14 Maximum- 22 Average - 17
Minimum – 3 Maximum- 10 Average – 5,8
Canola Data unavailable
Minimum – 10 Maximum- 10 Average – 10
Minimum – 1 Maximum- 1 Average - 1
Minimum – 14 Maximum--30 Average -22
Minimum – 5 Maximum- 43 Average – 24
Legumes Minimum – 5 Maximum-7 Average - 6
Minimum – 3 Maximum-40 Average – 19
Minimum – 1 Maximum- 7 Average – 2,5
Minimum – 4 Maximum- 68 Average – 17,6
Minimum – 20Maximum- 20 Average – 20
Corn Minimum –1 Maximum-20 Average –6,7
Minimum –0.200 Maximum- 0.200 Average –0,2
Minimum –1 Maximum-2 Average –1,3
Minimum – 2 Maximum-50 Average –13,8
Minimum – 1 Maximum- 80 Average – 18,4
Sunflower Minimum –1.5 Maximum-100 Average – 18,6
Data unavailable
Minimum –3 Maximum-3 Average -3
Minimum –1 Maximum- 35 Average –7,9
Minimum – 1 Maximum- 43 Average – 10,9
Sugar Beets Minimum –10 Maximum-35 Average –22,5
Minimum – 0.100 Maximum-19 Average –7,6
Minimum – 1 Maximum- 10 Average – 1,8
Minimum – 0.500 Maximum- 10 Average – 5,1
Minimum – 8 Maximum- 35 Average –21,5
Potato Data unavailable
Minimum – 0.100 Maximum- 10 Average – 2,1
Minimum –1 Maximum-4 Average – 1,4
Data unavailable
Minimum –0.200 Maximum- 2 Average – 0,950
Tomato Minimum –0.300 Maximum-0.300 Average –0,3
Minimum –0.500 Maximum- 1 Average –0,8
Data unavailable
Data unavailable
Minimum –0.500 Maximum-43 Average –9,7
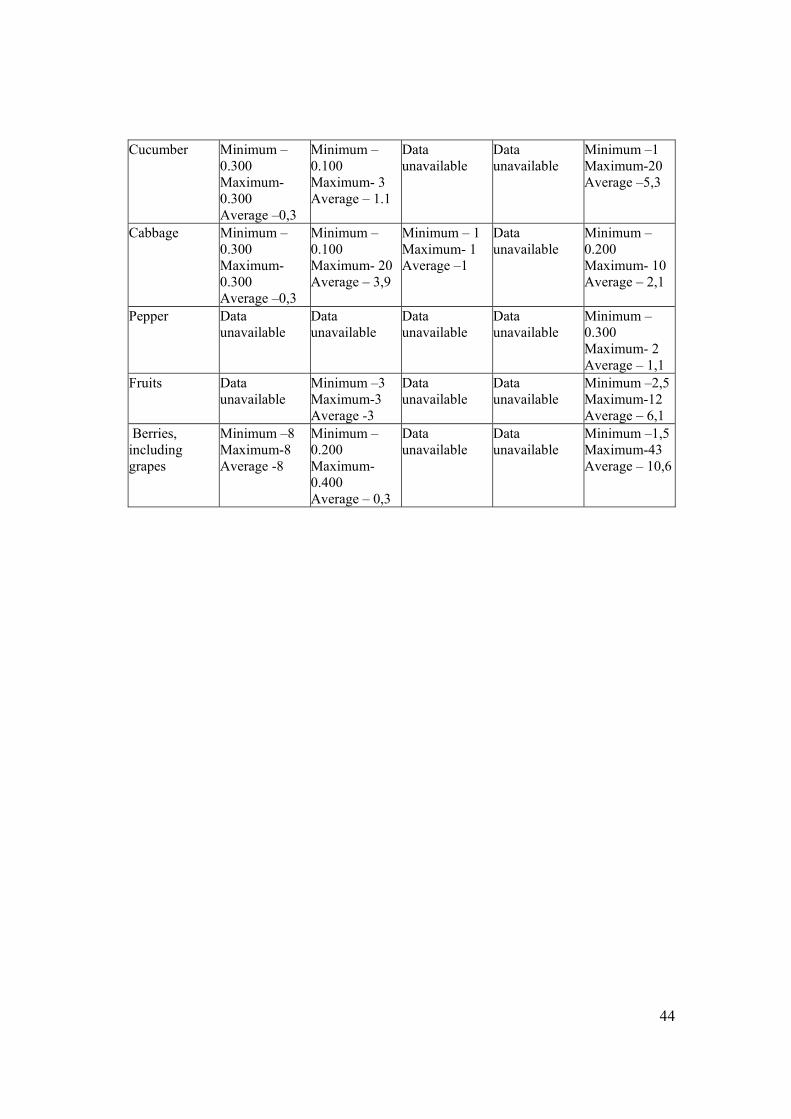
44
Cucumber Minimum –0.300 Maximum-0.300 Average –0,3
Minimum –0.100 Maximum- 3 Average – 1.1
Data unavailable
Data unavailable
Minimum –1 Maximum-20 Average –5,3
Cabbage Minimum –0.300 Maximum-0.300 Average –0,3
Minimum – 0.100 Maximum- 20 Average – 3,9
Minimum – 1 Maximum- 1 Average –1
Data unavailable
Minimum – 0.200 Maximum- 10 Average – 2,1
Pepper Data unavailable
Data unavailable
Data unavailable
Data unavailable
Minimum –0.300 Maximum- 2 Average – 1,1
Fruits Data unavailable
Minimum –3 Maximum-3 Average -3
Data unavailable
Data unavailable
Minimum –2,5Maximum-12 Average – 6,1
Berries, including grapes
Minimum –8 Maximum-8 Average -8
Minimum –0.200 Maximum- 0.400 Average – 0,3
Data unavailable
Data unavailable
Minimum –1,5Maximum-43 Average – 10,6
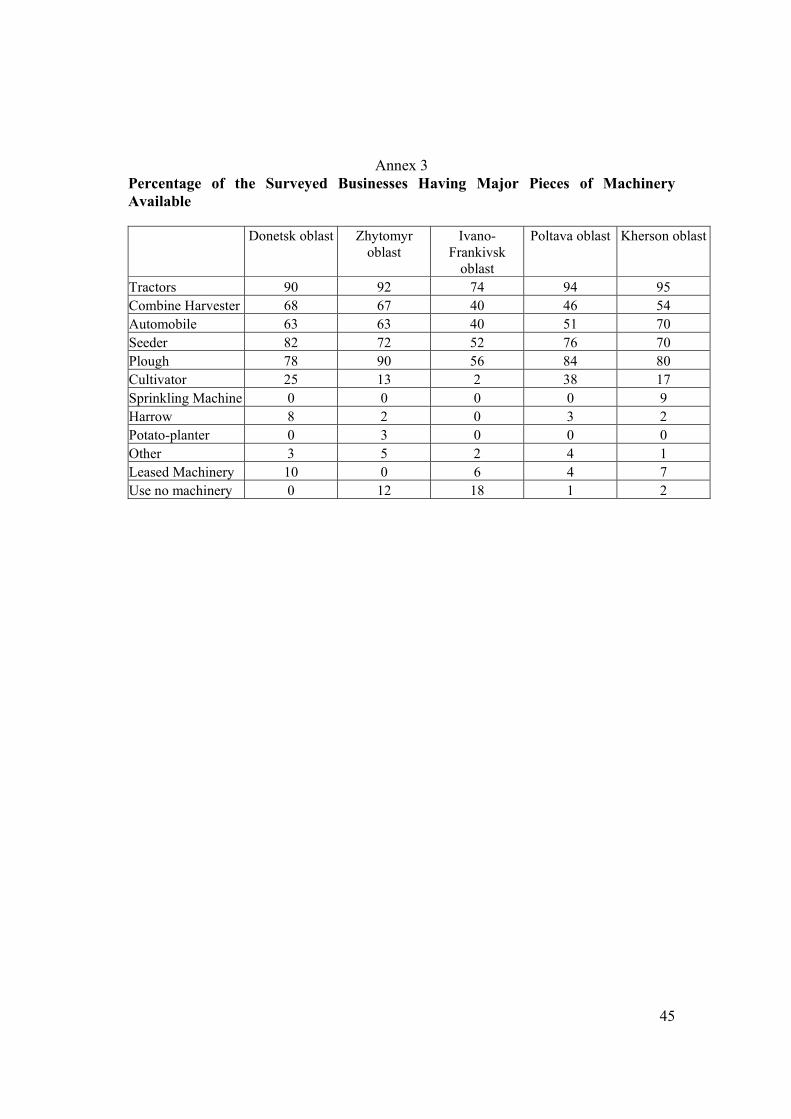
45
Annex 3
Percentage of the Surveyed Businesses Having Major Pieces of Machinery Available
Donetsk oblast Zhytomyr oblast
Ivano-Frankivsk
oblast
Poltava oblast Kherson oblast
Tractors 90 92 74 94 95 Combine Harvester 68 67 40 46 54 Automobile 63 63 40 51 70 Seeder 82 72 52 76 70 Plough 78 90 56 84 80 Cultivator 25 13 2 38 17 Sprinkling Machine 0 0 0 0 9 Harrow 8 2 0 3 2 Potato-planter 0 3 0 0 0 Other 3 5 2 4 1 Leased Machinery 10 0 6 4 7 Use no machinery 0 12 18 1 2
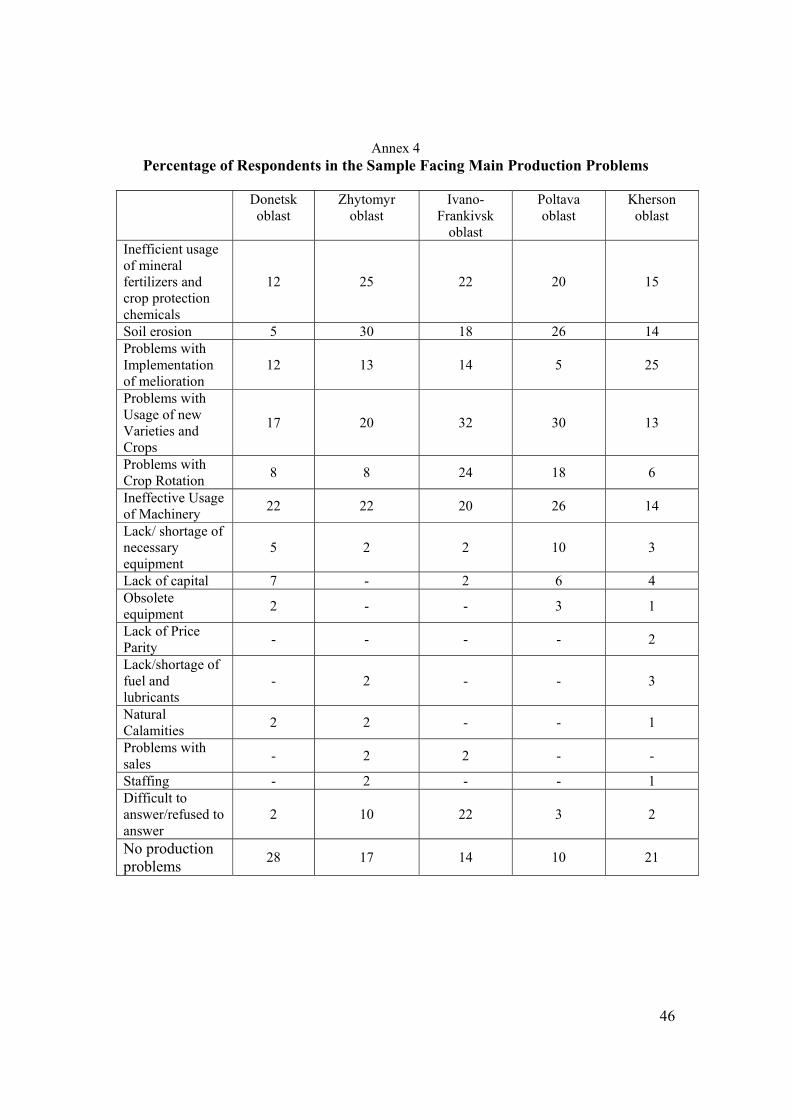
46
Annex 4 Percentage of Respondents in the Sample Facing Main Production Problems
Donetsk
oblast Zhytomyr
oblast Ivano-
Frankivsk oblast
Poltava oblast
Kherson oblast
Inefficient usage of mineral fertilizers and crop protection chemicals
12 25 22 20 15
Soil erosion 5 30 18 26 14 Problems with Implementation of melioration
12 13 14 5 25
Problems with Usage of new Varieties and Crops
17 20 32 30 13
Problems with Crop Rotation 8 8 24 18 6
Ineffective Usage of Machinery 22 22 20 26 14
Lack/ shortage of necessary equipment
5 2 2 10 3
Lack of capital 7 - 2 6 4 Obsolete equipment 2 - - 3 1
Lack of Price Parity - - - - 2
Lack/shortage of fuel and lubricants
- 2 - - 3
Natural Calamities 2 2 - - 1
Problems with sales - 2 2 - -
Staffing - 2 - - 1 Difficult to answer/refused to answer
2 10 22 3 2
No production problems 28 17 14 10 21
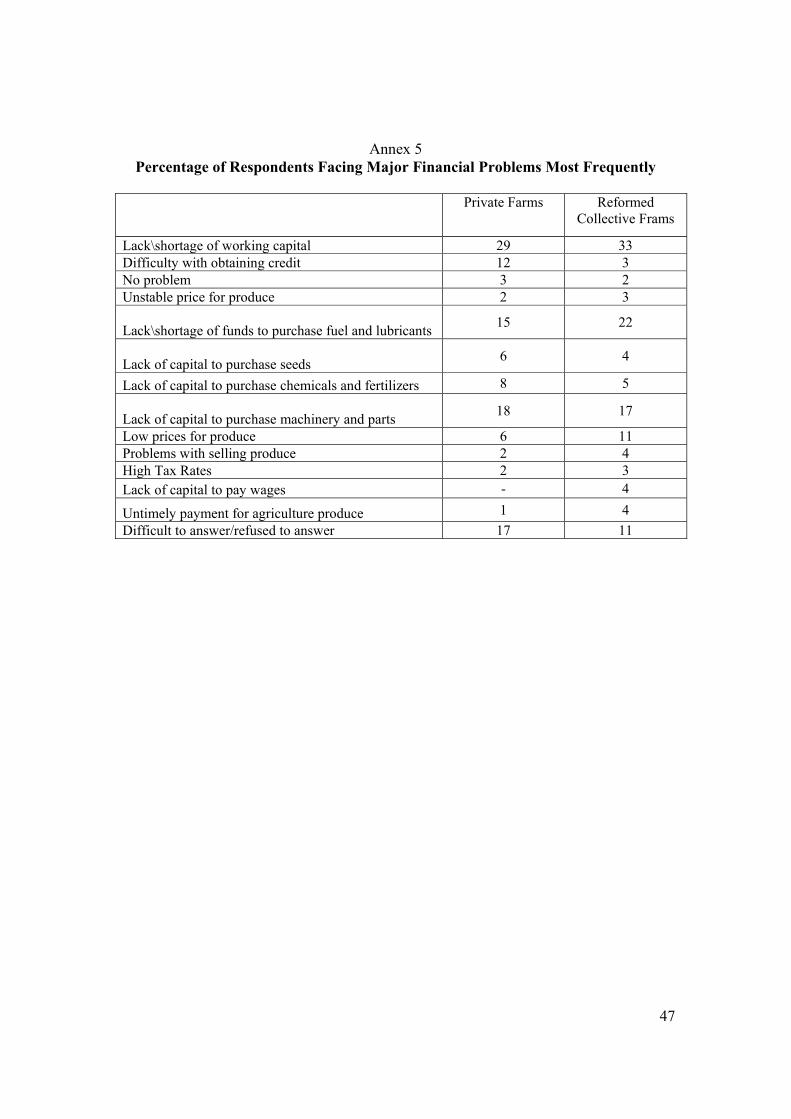
47
Annex 5 Percentage of Respondents Facing Major Financial Problems Most Frequently
Private Farms Reformed Collective Frams
Lack\shortage of working capital 29 33 Difficulty with obtaining credit 12 3 No problem 3 2 Unstable price for produce 2 3
Lack\shortage of funds to purchase fuel and lubricants 15 22
Lack of capital to purchase seeds 6 4
Lack of capital to purchase chemicals and fertilizers 8 5
Lack of capital to purchase machinery and parts 18 17
Low prices for produce 6 11 Problems with selling produce 2 4 High Tax Rates 2 3 Lack of capital to pay wages - 4
Untimely payment for agriculture produce 1 4 Difficult to answer/refused to answer 17 11
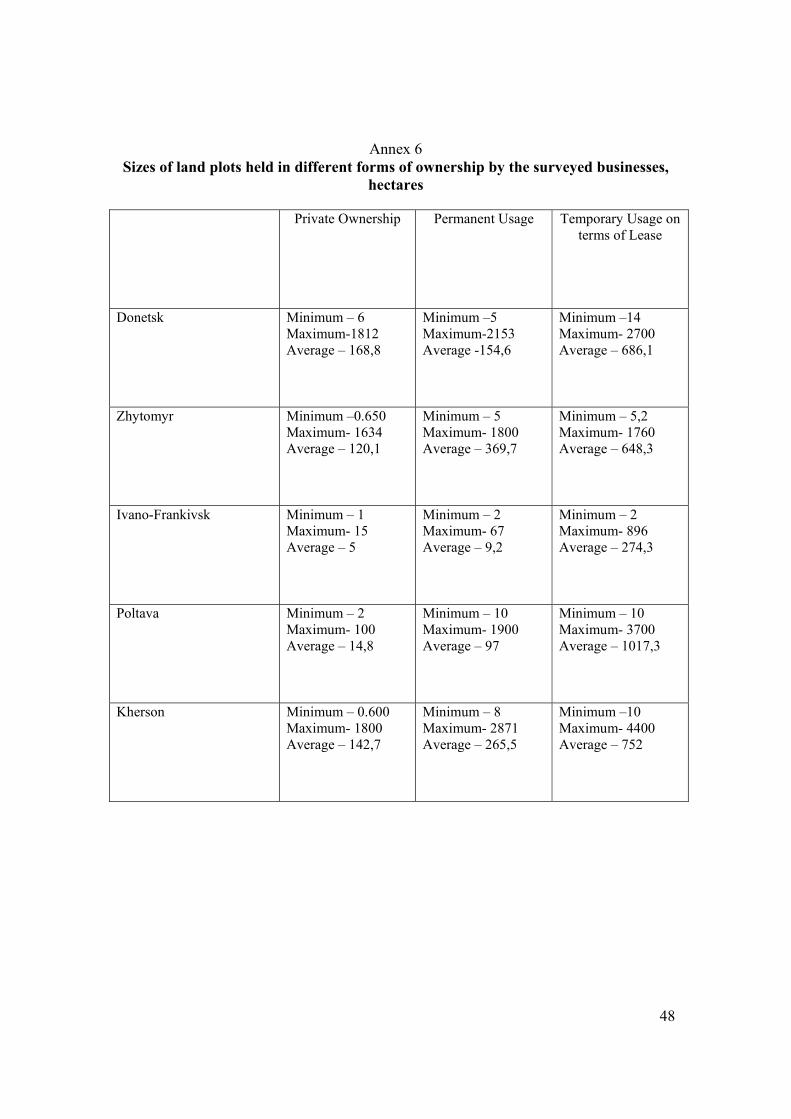
48
Annex 6 Sizes of land plots held in different forms of ownership by the surveyed businesses,
hectares Private Ownership Permanent Usage Temporary Usage on
terms of Lease
Donetsk Minimum – 6 Maximum-1812 Average – 168,8
Minimum –5 Maximum-2153 Average -154,6
Minimum –14 Maximum- 2700 Average – 686,1
Zhytomyr Minimum –0.650 Maximum- 1634 Average – 120,1
Minimum – 5 Maximum- 1800 Average – 369,7
Minimum – 5,2 Maximum- 1760 Average – 648,3
Ivano-Frankivsk Minimum – 1 Maximum- 15 Average – 5
Minimum – 2 Maximum- 67 Average – 9,2
Minimum – 2 Maximum- 896 Average – 274,3
Poltava Minimum – 2 Maximum- 100 Average – 14,8
Minimum – 10 Maximum- 1900 Average – 97
Minimum – 10 Maximum- 3700 Average – 1017,3
Kherson Minimum – 0.600 Maximum- 1800 Average – 142,7
Minimum – 8 Maximum- 2871 Average – 265,5
Minimum –10 Maximum- 4400 Average – 752