Embed Size (px)
Citation preview
Rural Economy
Agricultural Statistics 2016
Economic Development
Tourism Sport and Culture
Economic Development Tourism Sport and Culture Agricultural Statistics for 2016
CONTENTS
Foreword helliphelliphelliphelliphelliphelliphelliphelliphelliphelliphelliphelliphelliphelliphelliphelliphelliphelliphelliphelliphelliphelliphellip 4
Section
Agricultural Structure helliphelliphelliphelliphelliphelliphelliphelliphelliphelliphelliphelliphelliphelliphelliphelliphelliphelliphellip 5 Miscellaneous data helliphelliphelliphelliphelliphelliphelliphelliphelliphelliphelliphelliphelliphelliphelliphelliphellip 5 Agricultural land areas helliphelliphelliphelliphelliphelliphelliphelliphelliphelliphelliphelliphelliphelliphellip 6 Number of holdings helliphelliphelliphelliphelliphelliphelliphelliphelliphelliphelliphelliphelliphelliphelliphelliphellip 6 Number of businesses claiming Single Area Payment (SAP) amp Quality Milk Payment (QMP)helliphelliphelliphelliphelliphelliphelliphelliphelliphelliphelliphellip 7 Single Area Paymenthelliphelliphelliphelliphelliphelliphelliphelliphelliphelliphelliphelliphelliphelliphelliphelliphellip 8 Compliance 8Farm labour helliphelliphelliphelliphelliphelliphelliphelliphelliphelliphelliphelliphelliphelliphelliphelliphelliphelliphelliphellip 9 Exports ( value)helliphelliphelliphelliphelliphelliphelliphelliphelliphelliphelliphelliphelliphelliphelliphelliphelliphelliphellip10 Vegetable exports helliphelliphelliphelliphelliphelliphelliphelliphelliphelliphelliphelliphelliphelliphelliphelliphelliphellip 10 Flower exports helliphelliphelliphelliphelliphelliphelliphelliphelliphelliphelliphelliphelliphelliphellip 12Bulb and mail order plug plants exports 13
Outdoor Crops helliphelliphelliphelliphelliphelliphelliphelliphelliphelliphelliphelliphelliphelliphelliphelliphelliphelliphelliphelliphelliphellip 13 Potatoes helliphelliphelliphelliphelliphelliphelliphelliphelliphelliphelliphelliphelliphelliphelliphelliphelliphelliphelliphelliphelliphellip 14 Outdoor fruit and vegetables helliphelliphelliphelliphelliphelliphelliphelliphelliphelliphelliphelliphelliphellip14 Outdoor flower cropshelliphelliphelliphelliphelliphelliphelliphelliphelliphelliphelliphelliphelliphelliphelliphelliphellip 16
Protected Crops helliphelliphelliphelliphelliphelliphelliphelliphelliphelliphelliphelliphelliphelliphelliphelliphelliphelliphelliphelliphelliphellip 17 Glasshouse areas helliphelliphelliphelliphelliphelliphelliphelliphelliphelliphelliphelliphelliphelliphelliphelliphelliphellip 18 Glasshouse cropping helliphelliphelliphelliphelliphelliphelliphelliphelliphelliphelliphelliphelliphelliphelliphelliphellip19 Polythene tunnel areas helliphelliphelliphelliphelliphelliphelliphelliphelliphelliphelliphelliphelliphelliphellip 19 Polythene tunnel cropping helliphelliphelliphelliphelliphelliphelliphelliphelliphelliphelliphelliphelliphelliphellip 20
Livestock helliphelliphelliphelliphelliphelliphelliphelliphelliphelliphelliphelliphelliphelliphelliphelliphelliphelliphelliphelliphelliphellip helliphelliphellip21 Cattle including the dairy industry helliphelliphelliphelliphelliphelliphelliphelliphelliphelliphellip 22 Herd numbers and size 24 Other Livestock helliphelliphelliphelliphelliphelliphelliphelliphelliphelliphelliphelliphelliphelliphelliphelliphellip 25 Equines helliphelliphelliphelliphelliphelliphelliphelliphelliphelliphelliphelliphelliphelliphelliphelliphelliphelliphelliphelliphelliphelliphellip25
2
Tables
1 Agricultural structure helliphelliphelliphelliphelliphelliphelliphelliphelliphelliphelliphelliphelliphelliphelliphelliphellip 5 2 Miscellaneous data helliphelliphelliphelliphelliphelliphelliphelliphelliphelliphelliphelliphelliphelliphelliphelliphelliphellip 5 3 Number of holdings claiming SAP and QMPhelliphelliphelliphelliphellip 7 4 Total crop exports (value and quantity)helliphelliphelliphellip10 5 Vegetable exports (value and quantity)helliphelliphelliphelliphelliphelliphelliphelliphellip10 6 Flower exports 12 7 Bulb and mail order plug plantshelliphelliphelliphelliphelliphelliphelliphelliphelliphelliphelliphellip12 8 Outdoor fruit and vegetable crops (area)helliphelliphelliphelliphelliphelliphelliphellip 15 9 Outdoor flower crops (area)helliphelliphelliphelliphelliphelliphelliphelliphelliphelliphelliphelliphelliphellip16 10Glasshouse areas helliphelliphelliphelliphelliphelliphelliphelliphelliphelliphelliphelliphelliphelliphelliphelliphelliphellip18 11Glasshouse cropping (area)helliphelliphelliphelliphelliphelliphelliphelliphelliphelliphelliphelliphelliphellip19 12Polythene tunnel areas helliphelliphelliphelliphelliphelliphelliphelliphelliphelliphelliphelliphelliphelliphelliphellip19 13Polythene tunnel cropping (area)helliphelliphelliphelliphelliphelliphelliphelliphelliphelliphelliphellip20 14Cattle numbers helliphelliphelliphelliphelliphelliphelliphelliphelliphelliphelliphelliphelliphelliphelliphelliphelliphelliphellip24 15Herd numbers and size helliphelliphelliphelliphelliphelliphelliphelliphelliphelliphelliphelliphelliphelliphelliphellip24 16Other livestock helliphelliphelliphelliphelliphelliphelliphelliphelliphelliphelliphelliphelliphelliphelliphelliphelliphelliphelliphellip25 17Equine animals 25 18Grass areashelliphelliphelliphelliphelliphelliphelliphelliphelliphelliphelliphelliphelliphelliphelliphelliphelliphelliphelliphelliphellip26 19Cereal areas helliphelliphelliphelliphelliphelliphelliphelliphelliphelliphelliphelliphelliphelliphelliphelliphelliphelliphelliphelliphellip29
Figures
1 Agricultural land areashelliphelliphelliphelliphelliphelliphelliphelliphelliphelliphelliphelliphelliphelliphelliphelliphellip6 2 Number of smaller holdingshelliphelliphelliphelliphelliphelliphelliphelliphelliphelliphelliphelliphellip6 3 Number of larger holdingshelliphelliphelliphelliphelliphelliphelliphelliphelliphelliphelliphelliphelliphelliphellip7 4 SAP claimants and areashelliphelliphelliphelliphelliphelliphelliphelliphelliphelliphelliphelliphelliphelliphelliphellip8 5 Farm labourhelliphelliphelliphelliphelliphelliphelliphelliphelliphelliphelliphelliphelliphelliphelliphelliphelliphelliphelliphelliphelliphellip9 6 Jersey Royal potato exportshelliphelliphelliphelliphelliphelliphelliphelliphelliphelliphelliphelliphelliphelliphellip11 7 Jersey Royal potatoes ndash areahelliphelliphelliphelliphelliphelliphelliphelliphelliphelliphelliphelliphelliphellip14 8 Glasshouse areashelliphelliphelliphelliphelliphelliphelliphelliphelliphelliphelliphelliphelliphelliphelliphelliphelliphelliphellip16 9 Grassland areashelliphelliphelliphelliphelliphelliphelliphelliphelliphelliphelliphelliphelliphelliphelliphelliphelliphelliphelliphellip26 10Hay production areashelliphelliphelliphelliphelliphelliphelliphelliphelliphelliphelliphelliphelliphelliphelliphelliphellip27 11Silage production areashelliphelliphelliphelliphelliphelliphelliphelliphelliphelliphelliphelliphelliphelliphelliphellip27 12Haylage ndash areas of 1st 2nd and 3rd cutshelliphelliphelliphelliphelliphelliphelliphelliphelliphellip28 13Forage crops areashelliphelliphelliphelliphelliphelliphelliphelliphelliphelliphelliphelliphelliphelliphelliphelliphelliphellip28 14Cereal crops areashelliphelliphelliphelliphelliphelliphelliphelliphelliphelliphelliphelliphelliphelliphelliphelliphelliphelliphellip29
3
AGRICULTURAL STATISTICS FOR 2016
Foreword
It is with pleasure that the Department of Economic Development Tourism Sport and Culture publishes the 2016 Agricultural Statistics The publication is late in the year as much work has gone into placing the system on-line and streamlining the amount and type of information gathered It is anticipated that publication from 2017 onwards will be less onerous for all involved and be achieved earlier each year We have also altered the presentation of the report somewhat expressing the data trends and figures more graphically and over longer ten year terms so long term trends can be seen more easily
The report highlights some interesting facts The exported tonnage of Jersey Royal potatoes has remained stable over the period but the gross return per tonne of the crop (not index-linked) has increased by pound250 per tonne (33) from 2006 to 2016 The number of permanent full-time employees has decreased by 195 and the number of part-time employees has decreased by 33 indicating a welcome increase to productivity in the sector Organic production remains at levels similar or slightly lower than in 2012 despite continued demand this is a trend we might improve Daffodil production and export remains viable and stable whilst also serving as a good rotation crop to moderate potato cyst nematode populations
In the dairy industry total cattle numbers in Jersey increased slightly through local beef production whilst the number in milk has fallen for a second year This ongoing reduction is due to a number of factors including a reduction in the number of dairy farms in Jersey increasing milk production per cow driven by the import of international genetics in 2008 and the milk licencing scheme managing the output of individual dairy farms to bring it in line with market demand
I hope that the new online survey methods prove simpler to respondents and the data gathered continues to provide useful information to those that view it
Senator Lyndon Farnham
Minister for Economic Development Tourism Sport and Culture
4
AGRICULTURAL STATISTICS 2016
This document summarises selected information collected from the agricultural returns completed in October 2016 by those who occupy or manage agricultural land of more than one vergeacutee
Further revision of the data gathered in 2016 has seen the removal of large gardens woodland areas scrubland etc which can rightly be regarded as not being agricultural
Agricultural Structure
Table 1 Agricultural Structure
Area of Jersey = 64612 vergeacutees 2012 2013 2014 2015 2016
Area owned and farmed Area rented and farmed
9034 27970
8536 26893
7120 27204
7298 26263
6381 26932
Total 37004 35429 34324 33561 33313 Land Percentage of land in agriculture 573 548 531 519 498 of agricultural land owned by occupier 244 241 207 217 192 of agricultural land rented by occupier 756 759 793 783 808
Number of holdings by size
1 - 10 vergeacutees 268 256 213 211 217 Above 10 lt 25 vergeacutees 121 130 106 104 96 Above 25 lt 50 vergeacutees 56 55 40 47 44 Above 50 lt 75 vergeacutees 22 22 22 20 17 Above 75 lt 100 vergeacutees 7 7 7 9 6 Above 100 lt 250 vergeacutees 28 27 25 22 21 Above 250 lt 500 vergeacutees 13 13 13 12 12 Above 500 lt 1000 vergeacutees 9 7 6 6 6 Above 1000 vergeacutees 5 6 7 6 6
Total 529 523 439 437 425 NB A holding does not always constitute a working farm but also represents a company or individual owning an area of land classified as agricultural and to which certain conditions apply
Table 2 MISCELLANEOUS DATA
Area of Jersey = 64612 vergeacutees 2012 2013 2014 2015 2016
Average size of holding (vergeacutees) 70 68 78 77 78
Area irrigated (vergeacutees) 1613 1978 1911 1911 1877
5
Agricultural land
Since 2006 the farmed area of Jersey has remained at approximately 35000 vergeacutees but the area farmed by individual landowners has decreased from 10000 vergeacutees to 6000 vergeacutees (Figure 1)
Figure 1 Land area owned or rented by occupier ndash 2006 to 2016
The number of holdings occupying 25 vergeacutees or less has significantly decreased This pattern is also seen with holdings occupying 26 to 75 vergeacutees but the decreases are not as significant (Figure 2)
375 347 332
307 286
270 268 256
213 211 217
166 148
127 134 125 120 121 130 106 104 96
69 61 62 59 62 65 56 55 40 47 4425 21 25 25 27 24 22 22 22 20 170
50
100
150
200
250
300
350
400
2006 2007 2008 2009 2010 2011 2012 2013 2014 2015 2016
Num
ber o
f hol
ding
s
0 - 10 v 10 to 25 v 25 to 50 v 50 to 75 v
Figure 2 Number of smaller holdings (less than 75 vergeacutees in area) ndash 2006 to
6
2016
The total number of individual holdings occupying more than 75 vergeacutees has decreased from 64 in 2006 to 39 in 2016 (Figure 3)
8 7 8 8
57 7 7 7
9
6
23 25 24 24
26 24
28 27 25
22 21 19
16 18
15 16 17
13 13 13 12 12 10
7 8
11
6 7 9
7 6 6 64 3 3 3
5 5 5 6 7 6 6
0
5
10
15
20
25
30
2006 2007 2008 2009 2010 2011 2012 2013 2014 2015 2016
Num
ber o
f hol
ding
s
75 to 100 v 100 to 250 v 250 to 500 v 500 - 1000 v more than 1000 v
Figure 3 Number of larger holdings (more than 75 vergeacutees in area) ndash 2006 to 2016
Number of businesses claiming Single Area Payment (SAP) and Quality Milk Payment (QMP)
A better understanding of the level of commercial agricultural activity can be gauged by examining the number of businesses in each size band that claim the SAP and QMP
Table 3 Number of holdings claiming SAP and QMP
Size (vergeacutees) Total Holdings SAP amp QMP Claims
1 - 10 10 - 25 25 - 50 50 - 75 75 - 100 100 - 250 250 - 500 500 - 1000 gt1000
217 96 44 17 6
21 12 6 6
0 8
11 7 2
17 12 6 6
Total 425 69 (16)
Total agricultural area (vg) 33313 Area of SAP amp QMP claims (vg) 26380 Area subject to SAP amp QMP 79
Agricultural statistics are as at 1st October whereas the SAP areas are based on a calendar year
7
Single Area Payment (SAP)
The land eligible for the SAP in 2016 included all land used for commercial agriculture including livestock grazing fields in a recognised arable rotation and fields used by commercial livery stables provided the land user was either a bona fide agriculturalist or recognised as a smallholder
The SAP was paid to the person responsible for the agricultural management of the land in most cases this was the legal tenant
Compliance
Receipt of the SAP and QMP was conditional on the applicantsrsquo compliance with basic levels of Good Agricultural and Environmental Practices (eg The Water Code Animal Welfare Codes etc) and the provision of basic financial data
Figure 4 SAP claimants and land area used
8
Farm Labour
Farm labour ndash Number of employees during peak season months
In the 10 years since 2006 the number of permanent full-time employees has decreased by 195 and the number of part-time employees has decreased by 33 Seasonal employment figures have remained stable with annual variations
Figure 5 Farm labour ndash 10 year averages of staff numbers during peak season months
9
Exports The total gross return of all export crops are presented in Table 5 Total exports by crop type from 2012 to 2016 are presented in Table 6 (vegetables) Table 7 (flowers) and Table 8 (bulbs and mail order plug plants) Exports of Jersey Royal potatoes for the period 2006 to 2016 are presented in Figure 6
Table 4 Total value of all export crops (pound) 2012 to 2016 2012 2013 2014 2015 2016
Total value of all crops (pound) pound53300353 pound42078565 pound44172510 pound39106958 pound42322137
Table 5 Vegetable exports
2012 2013 2014 2015 2016
Tonnes Value (pound) Tonnes Value (pound) Tonnes Value (pound) Tonnes Value (pound) Tonnes Value (pound)
Beans 5 8410 14 13322 16 21055 14 15356 5 5306
Cauliflower 22 38878 20 34498 17 28262 13 19246 2 16276
Courgettes 569 489308 436 393728 566 515860 421 361485 510 457095
Potatoes 28588 27008402 28417 27545279 31393 28996678 29693 27554627 29609 29900088
Protected Cropping 192 174815 119 231907 141 316830 86 198724 135 260427
Others 905 1162108 848 1029142 1335 1169448 938 1052367 587 833103
Total vegetables 30281 28881921 29854 29247876 33468 31048133 31165 29201805 30848 31472295
10
Figure 6 Jersey Royal potato exports 2006 to 2016
The exported tonnage of Jersey Royal potatoes has remained stable over the period but the gross return (not index-linked) per tonne of the crop has increased by pound250 per tonne (33) from 2006 to 2016
11
Table 6 Flower Exports
2012 2013 2014 2015 2016
Flowers Packs Value (pound) Packs Value (pound) Packs Value (pound) Packs Value (pound) Packs Value (pound)
Narcissus Flowers 44542 632072 69947 971565 76782 1022262 90378 1225192 72473 1028235
Others NR NR NR NR NR NR 1399 28615 829 6465
Sub-total flowers 46308 676256 71662 1004727 76782 1022262 91777 1253807 73302 1034700
Table 7 Bulb and mail order plug plants
2012 2013 2014 2015 2016
Narcissus Bulbs (t) Tonnes Value (pound) Tonnes Value (pound) Tonnes Value (pound) Tonnes Value (pound) Tonnes Value (pound)
Sub total bulbs 470 328163 384 286383 426 267164 456 299346 379 220297
Mail Order (Plug Plants etc) NR 23414013 NR 11539579 NR 11834951 NR 8352000 NR 8560145
Total flowers and bulbs 24418432 12830689 13124377 9905153 9815142
12
Outdoor Crops
13
Jersey Royal Potatoes
The areas under Jersey Royal potato cultivation for the period 2006 to 2016 are presented in Figure 7 The total area peaked in 2011 (18048 Vg) and increased over the whole period by nearly 17 Areas covered by floating plastic mulch (polythene) have remained steady at approximately 50 of the total area
Figure 7 Total area of land used for Jersey Royal cultivation including areas under polythene 2006 to 2016
Fruit and vegetables (including maincrop potatoes but not including Jersey Royal potatoes)
The areas of land used for fruit and vegetable cultivation are presented in Table 9 Only minor changes have occurred in areas used for most crop types Of note
The area of top fruit has increased yearly because of a rise in cider apple production
Parsley production decreased by 82 No outdoor tomatoes were grown in 2016
14
Table 8 Outdoor Fruit and Vegetable Crops (Vergeacutees) 2012 to 2016
2012 2013 2014 2015 2016
Beans 14 9 4 12 5
Brussels Sprouts 44 47 48 27 32
Cabbage 397 403 512 319 360
Calabrese Spring Planted Autumn Planted
103 39
112 24
94 68
268 26
149 11
Carrots 110 122 129 87 131
Cauliflowers Summer and Autumn (maturing before 3112) Winter (maturing after 3112)
62
93
60
90
56
65
34
45
50
45
Courgettes 256 245 212 232 231
Leeks 188 129 142 211 113
Lettuce 80 78 76 59 111
Onions 25 29 44 68 82
Parsley 26 7 3 7 4
Soft and cane fruit (other) 48 50 34 34 25
Strawberries 34 33 25 20 20
Tomatoes 03 5 1 9 0
Top Fruit 192 199 236 275 302
Main crop Potatoes 627 1604 763 495 794
Other 386 350 425 438 548
Total Outdoor FruitVegetables 2096 1992 2174 2171 3013
Total Outdoor FruitVegetables (including Jersey Royal potatoes)
20766 20033 19834 18733 18847
Crops grown to a recognised organic standard (Included in total above)
447 466 374 421 427
15
Outdoor flower crops
The areas used for outdoor flower production are presented in Table 10 The sector is dominated by Narcissi first year plantings have decreased by 45 but 2 year plus plantings have increased by 86 The total area under Narcissi has remained relatively static over the period As in previous years other flower crops comprised just 4 of the total during 2016
Table 9 Outdoor Flower Crops (Vergeacutees)
Narcissi 2012 2013 2014 2015 2016
First Year Second Year Over 2 Years
545 315 90
352 421 107
255 409 200
392 244 197
298 373 195
Total 950 880 864 833 866
Other 55 32 40 35 39
Total Outdoor Flowers 1005 912 904 868 905
16
Protected Crops
17
Glasshouse Areas
Areas under glass for the period 2012 to 2016 are presented in Table 12 A visual representation for the period 2006 to 2016 is presented in Figure 9
Since 2012 the total area under glass has decreased by 27 In 2016 over 88 of glass was over 15 years old this figure is expected to rise over subsequent years
Table 10 GLASSHOUSE AREAS (m2)
2012 2013 2014 2015 2016 m2 m2 m2 m2 m2
Glasshouses under 5 years Glasshouses 5 - 10 years Glasshouses 10-15 years Glasshouses over 15 years
7022 14510 51869 217655
6088 1234 38681 229803
5800 12 26019 193639
5800 12 20131 199527
0 5812 16131 189914
Total area of glasshouses 291056 275806 225470 225470 211857 Of which Area heated Area not cropped in last 12 months
90515 41875
117056 40887
50687 24150
33247 21468
68563 30878
not cropped of production area 144 148 107 95 145 Excludes garden centres parks amp gardens and derelictrezoned glasshouse sites
Figure 8 Glasshouse areas 2006 to 2016
18
A breakdown of areas of crops and crop types is presented in Table 13 Tomato production has decreased by 23 since 2012 but the most significant change has been the reduction in ornamental plant production which has decreased by nearly 60 during the same period largely because of the abolishment of low value consignment relief
Table 11 Glasshouse cropping
2012 2013 2014 2015 2016 Glasshouse m2 m2 m2 m2 m2
Tomatoes Planted before 1st February Planted after 1st February
18929 9566
21713 8673
17765 8506
15482 2089
14803 7049
Total tomatoes 28495 30386 26271 17571 21852
Beans Cucumber Peppers Potatoes Planted before 1st November
Planted after 1st November Strawberries Others
1865 9049
12361 87382 15505 12051 35719
1864 10578 11383 69223 10180 6579
12846
1626 8147
15594 63331 18114 5130
11659
3636 10651 13524 55696 23022 4853
28069
2476 10689 15114 51646 20577 4853
27199
Total fruit and vegetables 173932 122653 123601 139451 132554
Sub-Total (Fruit vegetables amp tomatoes) 202427 153039 149872 157022 154406
Ornamentals Bedding Plants Pot Plants Others
97844 856
6645
42214 456
21232
66033 NR
7900
45640 NR
11910
38660 NR
4190
Sub-Total (Ornamentals) 105345 63902 73933 57550 42850
Total (Glasshouse production) 307772 216941 223805 214572 197256 Includes double cropping
Protected cropping ndash polythene tunnels The area under polythene tunnels has decreased by nearly 20 since 2012 (Table 14) This decrease has been reflected in both single- and multi-span tunnels Areas under polythene tunnels that are not cropped have remained static during the period
Table 12 Polythene Tunnel Areas (m2) 2012 2013 2014 2015 2016
m2 m2 m2 m2 m2
Area of Multi Span Area of Single Span
109088 64686
104578 59112
94145 54777
97281 53945
88275 51235
Total area of polythene tunnels 173774 163690 148922 151226 139510
Of which Area heated Area not cropped in last 12 months
33859 19484
34114 17603
22254 19857
21654 17263
46575 16796
of production area not cropped 11 11 13 11 12
19
Table 13 Polythene Tunnel Cropping (m2) 2012 2013 2014 2015 2016
m2 m2 m2 m2 m2
Vegetables and fruit Beans 3468 3626 2686 1086 435 Celery 332 480 280 NR NR Courgette 210 130 210 290 100 Cucumber 990 1020 140 150 90 Lettuce 1980 3116 800 560 1120 Sweet Peppers 19801 21801 17498 23666 14630 Potatoes 120061 104318 104384 106908 96097 Strawberries 4771 4771 4771 3571 3371 Tomatoes 2576 3204 1515 570 1880 Others 38277 27432 27280 21125 35350
Sub-Total (Fruit and Vegetables) 192466 169898 159564 157926 153073
Ornamentals Anemones 40 320 320 NR NR Bedding Plants 11046 11305 3818 3904 5041 Freesias 352 352 312 312 312 Gypsophila NR NR NR NR NR Iris NR NR 312 312 312 Lilies 2712 5105 312 312 312 Narcissi 6545 7056 12278 12278 9888 Nursery Stock 8301 10031 914 4672 2672 Pot Plants 920 960 435 410 400 Others 1426 1086 312 1076 4266
Sub-Total (Ornamentals) 31342 36215 19013 23276 23203
Total (Polythene tunnel production) 223808 206113 178577 181202 176276
Polythene Tunnel Cropping
Of note
The areas used for the production of beans courgettes sweet peppers narcissi and nursery stock decreased from 2015
Significant increases since 2015 in the production of lettuce tomatoes and bedding plants
20
Livestock
21
Cattle (including the dairy industry)
Total cattle numbers are presented in Table 15 In 2016 total cattle numbers in Jersey increased by 61 animals to 4939 a rise of 125 The number of cows and heifers in milk held on dairy farms however has fallen for a second year in succession down from 2807 to 2731 a fall year on year of 27 This ongoing decline a fall of 77 since 2014 in cows and heifers in milk is due to a number of factors including
bull The decline in the number of dairy farms in Jersey bull Increasing milk production per cow driven by the import of international
genetics in 2008 bull The milk licencing scheme operated by Jersey Dairy managing the output of
individual dairy farms to bring it in line with market demand
In line with the drop in the total cows and heifers in milk in Jersey the average size of the 21 dairy herds (unchanged since 2015) has also seen a small decline from 134 cows per herd in 2015 to 130 cows in 2016 a drop of 3 year on year
Since 2010 when the first offspring of international bulls entered the Island dairy herds the average yield per cow has risen from 4342 litres per cow per year to 5093 litres per cow per year in 2016 up by 173 over 6 years (approximately 3 per annum) This increase is expected to continue with several herds now averaging over 6000 litres per cow per year In line with expectations the average milk yield per cow in 2016 rose from 4940 litres per cow in 2015 (153 litres per cow or 31) This continuing rise in milk output per cow can be attributed to the relaxation on the import into Jersey of international Jersey bull semen in 2008 which enabled dairy farmers to improve the milking ability of their herds by using world-class genetics In 2008 it was estimated that it would take 10 years to see the full benefits of combining the conformation and longevity of the Jersey Island breed with the best economic and milking traits of the world Jersey population thereafter the rise in milk output efficiency on Jersey dairy farms will align with the global Jersey cattle population
In 2016 there were 2 herds holding less than 20 cows 8 herds holding between 20 ndash 99 cows 1 herd holding between 100 ndash 149 cows 2 herds holding between 150 ndash 199 cows and 8 herds holding over 200 cows this distribution is similar to 2015 The 10 commercial dairy herds holding less than 100 cows in Jersey held a total of 514 cows or 188 of the Island herd (average herd size 51 cows) The 11 herds with over 100 cows held 2217 cows or 812 of the Island herd (average herd size 202 cows) These statistics illustrate how the industry is divided between the smaller traditional units and the larger more commercial dairy farms
Milk production on dairy farms supplying Jersey Dairy has risen year on year from 13886000 litres in the milk year ending 31st March 2016 to 13909000 in the milk year ending 31st March 2017 - a rise of 03 between the two accounting periods In October 2016 the number of milk producers supplying Jersey Dairy remained at 20 (the same as in 2015) including one organic producer In addition there was one independent dairy farmer processing milk for sale to retail outlets and direct to the public through their own farm shop
The gross sales value of the milk delivered to Jersey Dairy increased from pound13732000 (9890 ppl) in the year to March 2016 to pound13977000 (1005 ppl) in the
22
year to March 2017 a rise of 43000 litres or 03 This small rise illustrates the effect of the current over production in world milk supplies and stiff competition in export markets Jersey Dairy has despite the above adverse factors managed to maintain and grow its value added export which now generates approximately 25 of its annual revenues This impressive performance has meant that Jersey Dairy has been able to release another 1000000 litres of milk licence (milk quota) allowing dairy farmers to increase future milk production and generate improved farm efficiency
The average farm gate milk price paid to milk producers by Jersey Dairy has fallen from 464ppl in the year to March 2016 to 462ppl in the year to March 2017 down 02ppl or 04 The above fall in the milk price paid to dairy farmers reflects Jersey Dairyrsquos lsquoshared risk policyrsquo where newly released milk licences (allowing dairy farms to increase milk output) are paid at a reduced price per litre whilst Jersey Dairyrsquos product sales are grown to fully utilise the new milk supply
The total number of heifer replacements being reared by dairy herds in Jersey in 2016 amounted to 1767 animals compared to 1659 in 2015 This is the first time in 4 years that there has been an increase up 65 year on year Heifers being reared as replacements over the age of 12 months have increased from 871 in 2015 to 956 in 2016 (98) Heifer replacements under 12 months of age have also increased but only by 25 animals (32) The number of replacements being reared would normally be in line with the annual culling rate from the milking herds usually averaging between 20 ndash 25 per annum The number being reared in 2016 is therefore above expectations and possibly reflects the current development of an export trade for high quality in calf heifers to the UK
The number of head of cattle (including dairy cattle) milk volumes sold to Jersey Milk and milk gross value and milk product sales for the period 2012 to 2016 are presented in Table 15
Numbers of cows in milk and heifers in the Islandrsquos dairy herds have remained fairly constant with a very slight contraction from 2015
The numbers of bulls and beef animals of different ages has not changed significantly during the last 5 years
The volume of milk sold to Jersey Dairy in 2016 has slightly risen by 23000 litres above the 2015 level the gross value of milk and milk products has however increased by a much more significant amount up by pound245000 This translates to an increase in gross value per litre of milk received by Jersey Dairy from pound099 per litre in 2015 to pound101 per litre in 2016
23
Cattle (including the dairy industry) Table 15
Table 14 Cattle (Numbers)
2012 2013 2014 2015 2016 Total cows and heifers in milk 2931 2917 2946 2807 2731 Heifers over 24 months Heifers 12 to 24 months Heifers under 12 months Bulls over 24 months Bulls under 24 months Beef animals over 12 months Beef animals under 12 months Other
235 769 796
26 36
139 170
50
255 811 744
23 35
211 152
47
244 752 767
12 42
153 149
49
176 697 786
13 52
119 181
47
191 765 811
13 36
164 164 64
Total 5152 5195 5114 4878 4939 Milk sold to Jersey Milk (Litres) Gross value of milk amp milk product sales (pound)
12613000 11919000
13374000 12699000
14005000 14014000
13886000 13732000
13909000 13977000
Table 15 Herd Numbers and Size ndash Registered producers
Classification of Herd (cows and heifers in milk) 2012 2013 2014 2015 2016
Herds Cows Herds Cows Herds Cows Herds Cows Herds Cows 1-19 5 48 4 39 4 45 2 20 2 23 20-49 1 48 1 45 1 38 3 96 3 109 50-69 1 53 3 174 3 176 2 124 1 56 70-99 6 482 4 335 3 245 3 278 4 326 100-149 3 348 3 359 4 480 1 140 1 124 150-199 2 362 2 378 3 581 2 387 2 372 200-299 7 1590 7 1587 6 1381 8 1762 8 1721
Total milking animals Herds and animals 25 2931 24 2917 24 2946 21 2807 21 2731 Average number cows and heifers per herd 117 122 123 134 130
24
Table 16 Other Livestock
2012 2013 2014 2015 2016 Pigs Sows for Breeding 73 45 52 54 52 Boars in Service 7 6 7 8 6 Other Pigs 372 426 312 370 360
Total Pigs 452 477 371 432 418
Poultry Fowls from 1 day old to the point of laying 496 641 876 365 435 No of laying hens 5418 25800 25423 27431 25041 Broilers (for killing up to 10 weeks of age) 5 83 NR NR NR Other Chickens 570 552 1051 950 748 Other Table Fowl (ducks geese turkeys) 823 851 1388 628 639
Total Poultry 27312 27927 28738 29374 26863
Sheep 1042 1135 1253 1015 871
Goats 20 21 32 37 40
Table 17 Equine Animals
2012 2013 2014 2015 2016 Equine Horses at Livery Horses Owned Donkeys Owned
315 537
24
345 541
22
291 492
23
317 450
25
328 435
25
Total Equines 876 908 806 792 788
25
Table 18 Grass Areas 2012 to 2016 (vg)
2012 2013 2014 2015 2016 Grass (at 1st October) Total area of grassland 19004 19280 19723 19614 19391 Of which grown to a recognised organic standard
Area cut for hay
997 850 640 470 227
1st Cut 1178 1033 960 922 858 2nd Cut 221 212 189 275 198 3rd Cut
Area cut for silage
40 10 10 10 52
1st Cut 3275 2217 2336 2339 2287 2nd Cut 1836 1657 2349 2080 2056 3rd Cut
Haylage
588 569 467 525 534
1st Cut 647 563 635 717 894 2nd Cut 63 100 218 428 483 3rd Cut 66 11 11 54 224
Forage Maize 1891 1790 1916 2089 1986 Other Stock Feed Crops 316 423 275 306 265 Green ManureCover Crops 5483 3980 3789 3818 4114
0
5000
10000
15000
20000
25000
2006 2007 2008 2009 2010 2011 2012 2013 2014 2015 2016
Verg
ees
Axis Title
Total area of grassland Of which grown to a recognised organic standard
Figure 9 Total grassland areas 2006 to 2016 (vg)
26
0
200
400
600
800
1000
1200
1400
1600
1800
2000
2006 2007 2008 2009 2010 2011 2012 2013 2014 2015 2016
Verg
ees
1st Cut 2nd Cut 3rd Cut
Figure 10 Areas of hay production 2006 to 2016 (vg)
0
500
1000
1500
2000
2500
3000
3500
4000
4500
2006 2007 2008 2009 2010 2011 2012 2013 2014 2015 2016
Verg
ees
1st Cut 2nd Cut 3rd Cut
Figure 11 Areas of silage production 2006 to 2016 (vg)
27
0
100
200
300
400
500
600
700
800
900
1000
2006 2007 2008 2009 2010 2011 2012 2013 2014 2015 2016
Verg
ees
1st Cut 2nd Cut 3rd Cut
Figure 12 Haylage production 2006 to 2016
0
500
1000
1500
2000
2500
2006 2007 2008 2009 2010 2011 2012 2013 2014 2015 2016
Verg
ees
Forage Maize Other Stock Feed Crops
Figure 13 Areas under forage crops 2006 to 2016
28
Table 19 Cereal Areas (vg)
2012 2013 2014 2015 2016
Barley (harvested for grain) Oats (harvested for grain) Wheat (harvested for grain) Cereals grown for straw only
1021 12
260 477
498 9
116 440
705 231
99 427
450 13 59
402
373 15
113 252
Total cereals 1770 1063 1462 924 753
0
200
400
600
800
1000
1200
2006 2007 2008 2009 2010 2011 2012 2013 2014 2015 2016
Verg
ees
Barley (harvested for grain) Oats (harvested for grain)
Wheat (harvested for grain) Cereals grown for straw only
Figure 14 Areas under cereals 2006 to 2016
29
30
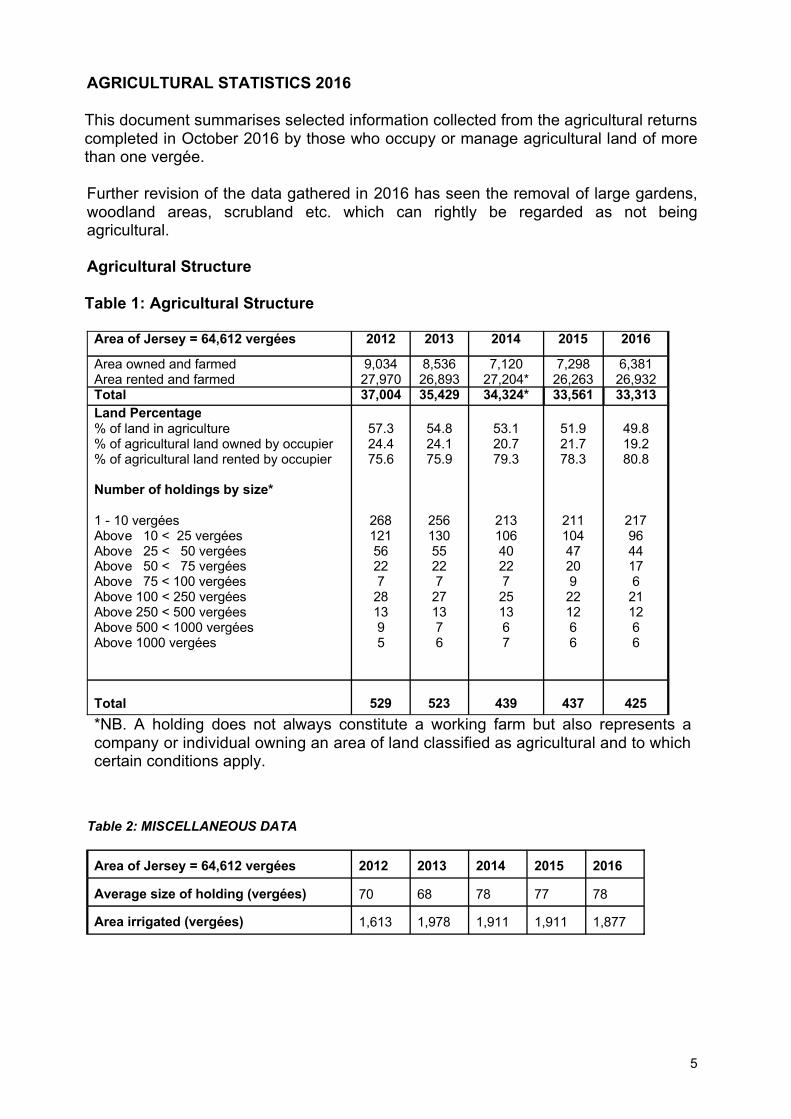
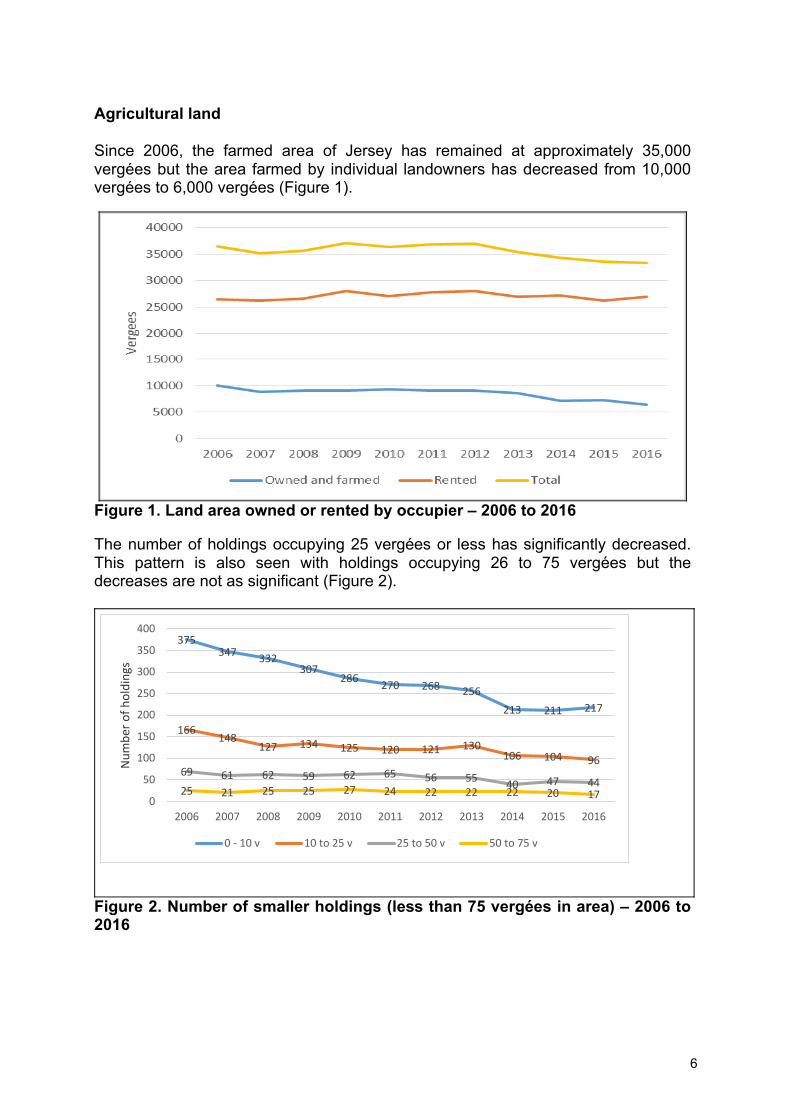
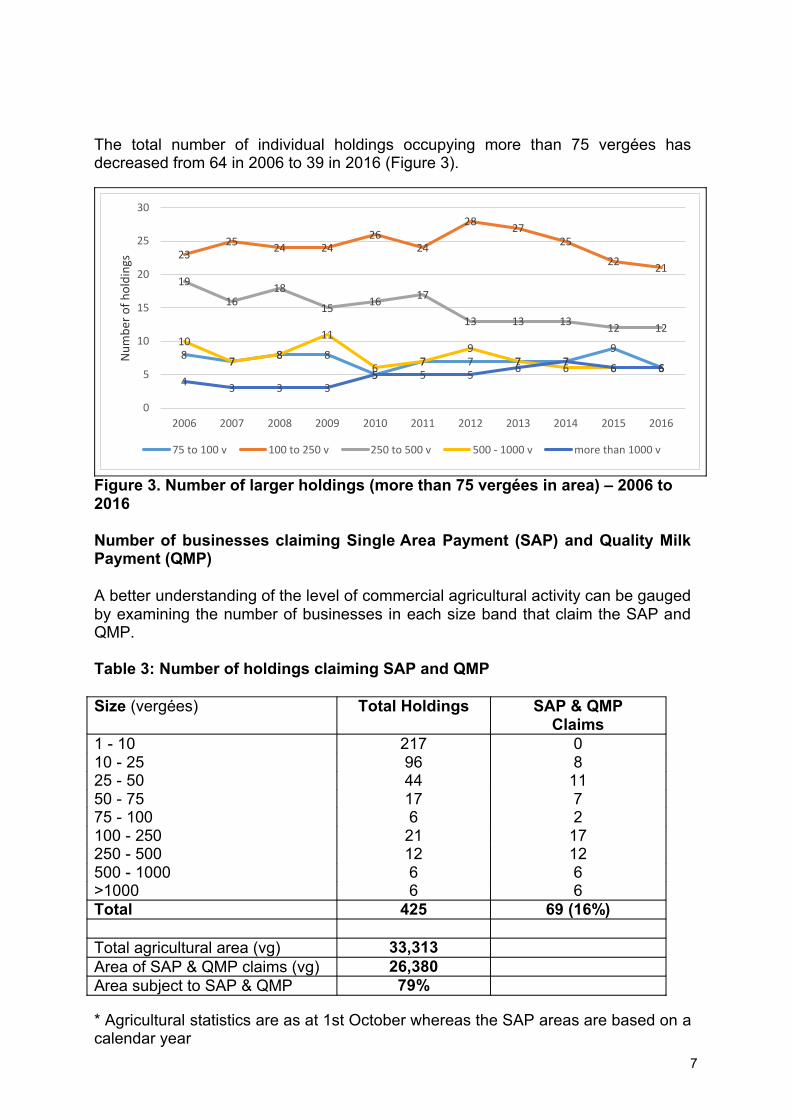
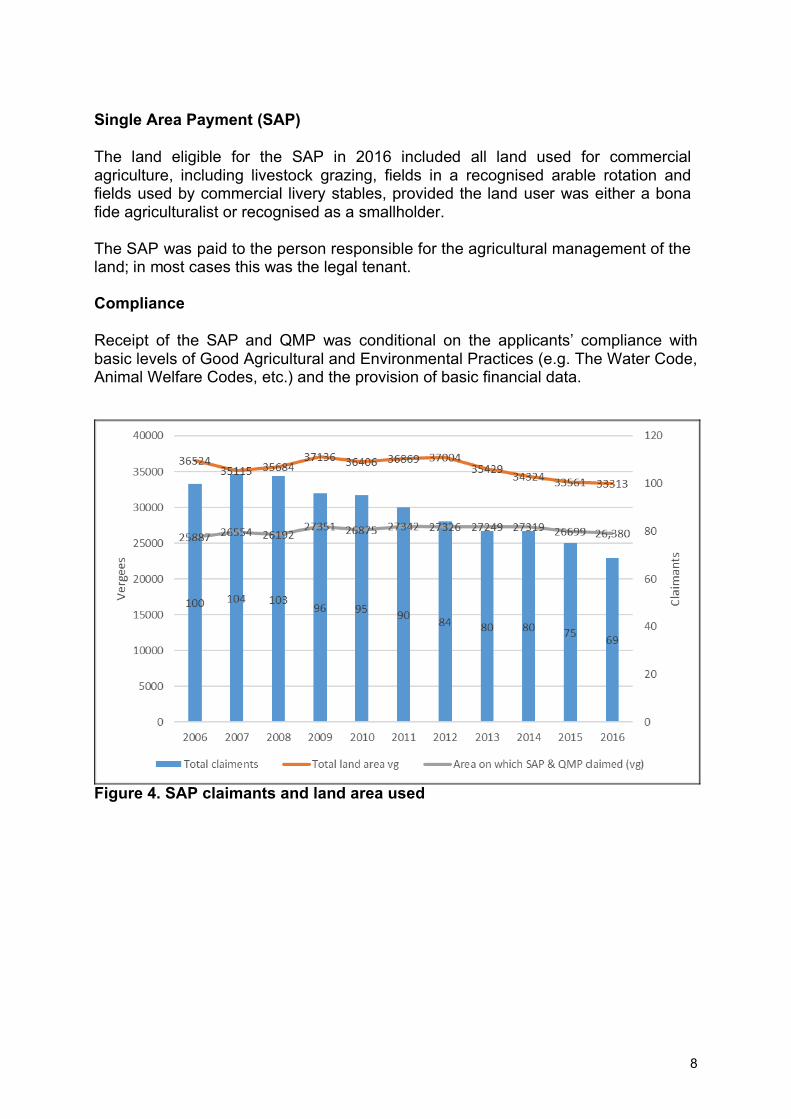
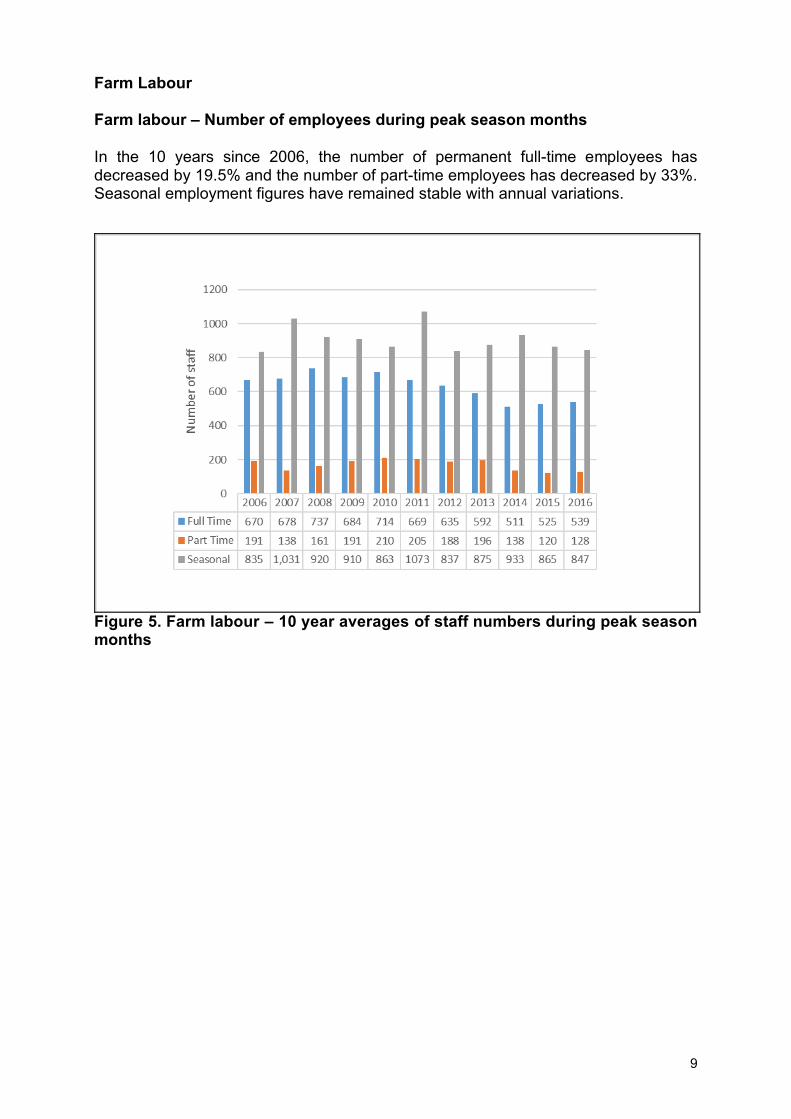
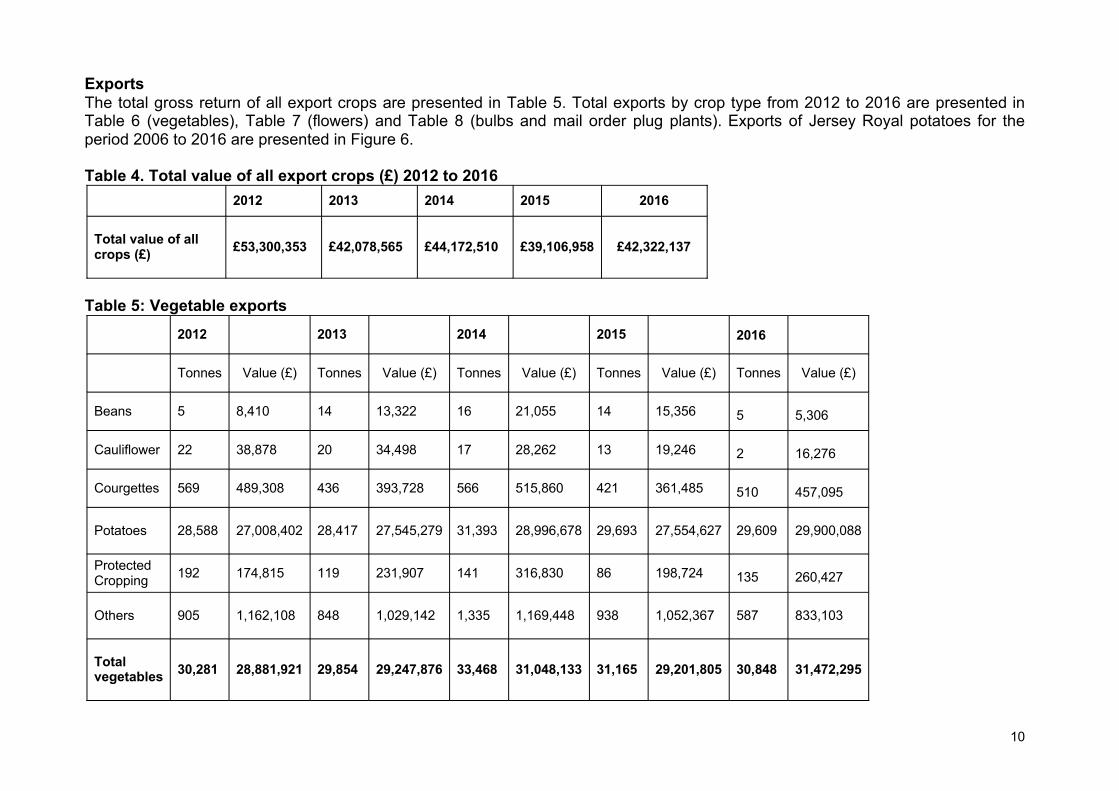
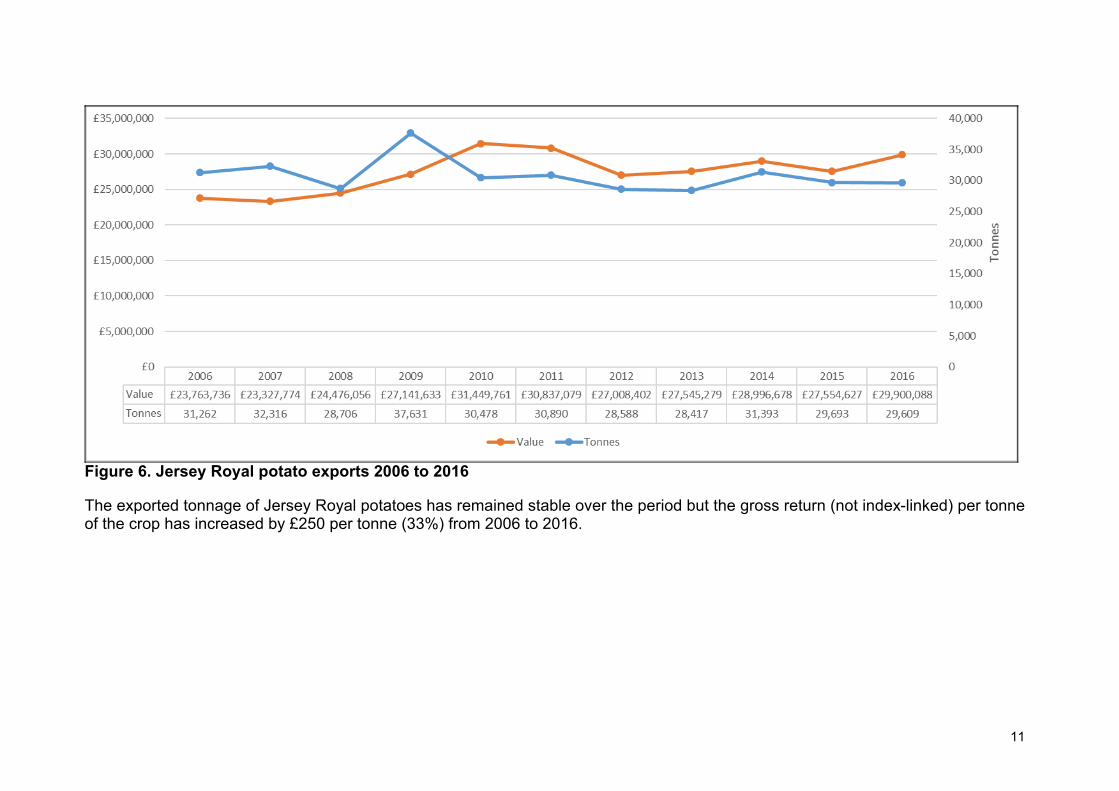
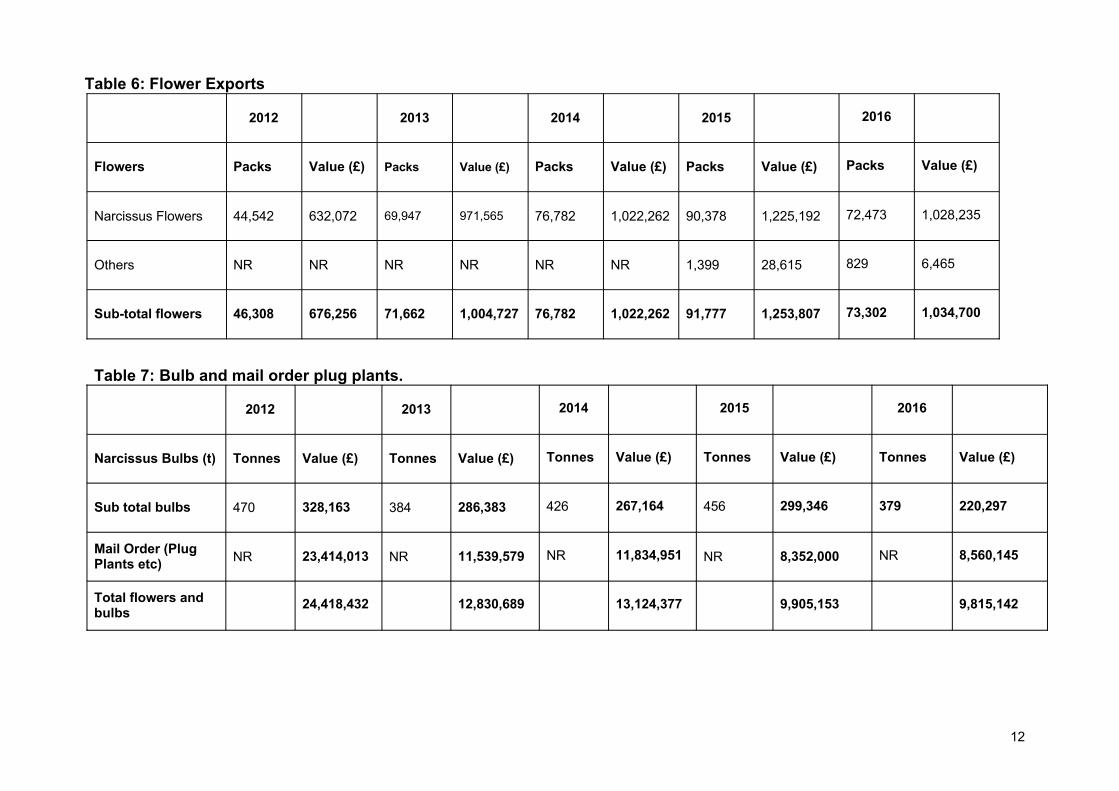
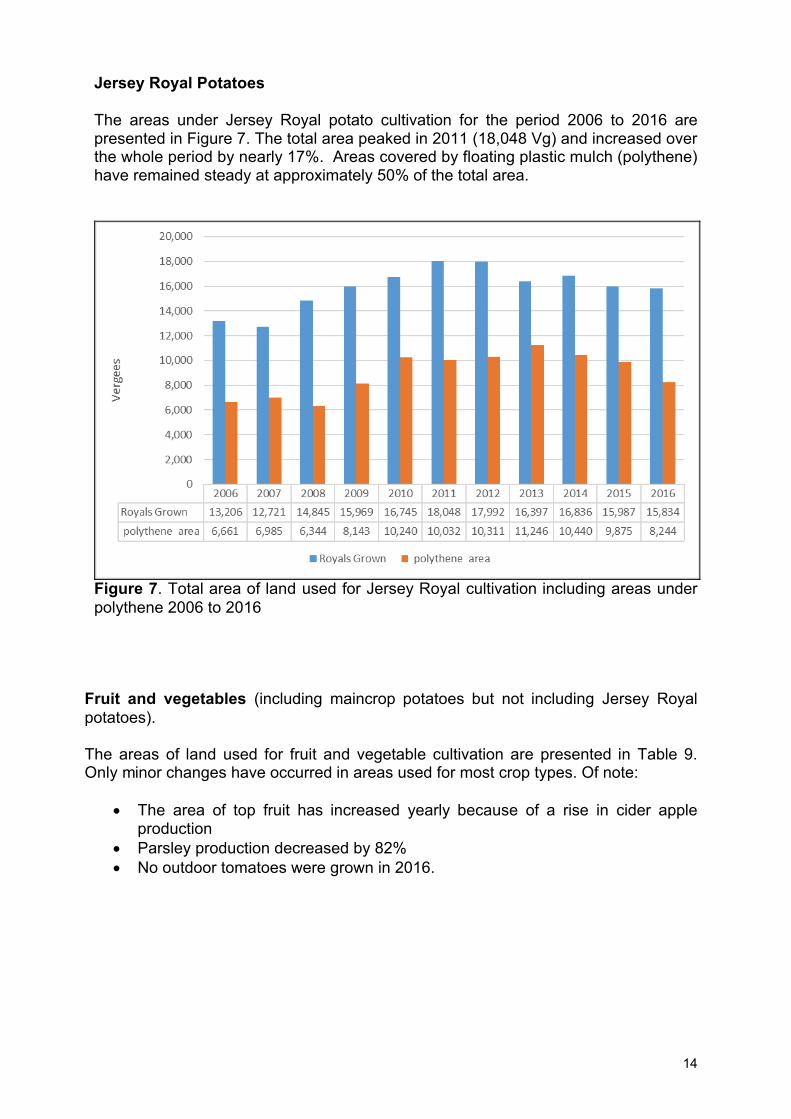
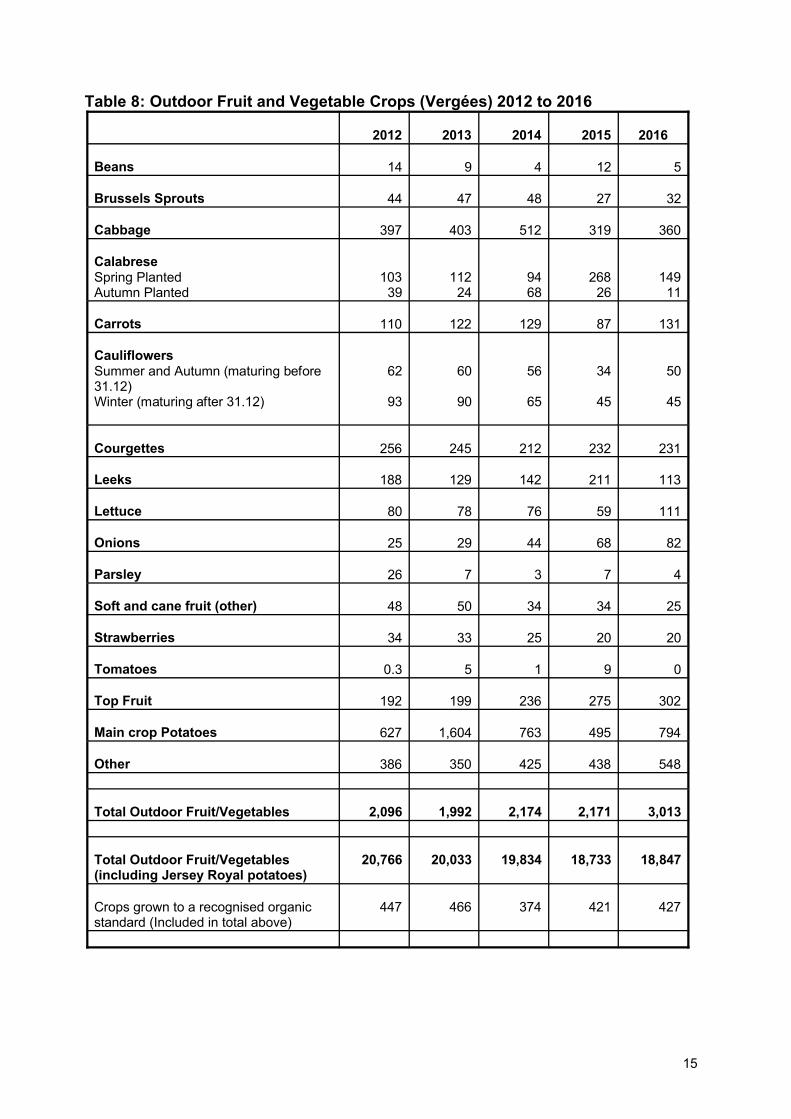
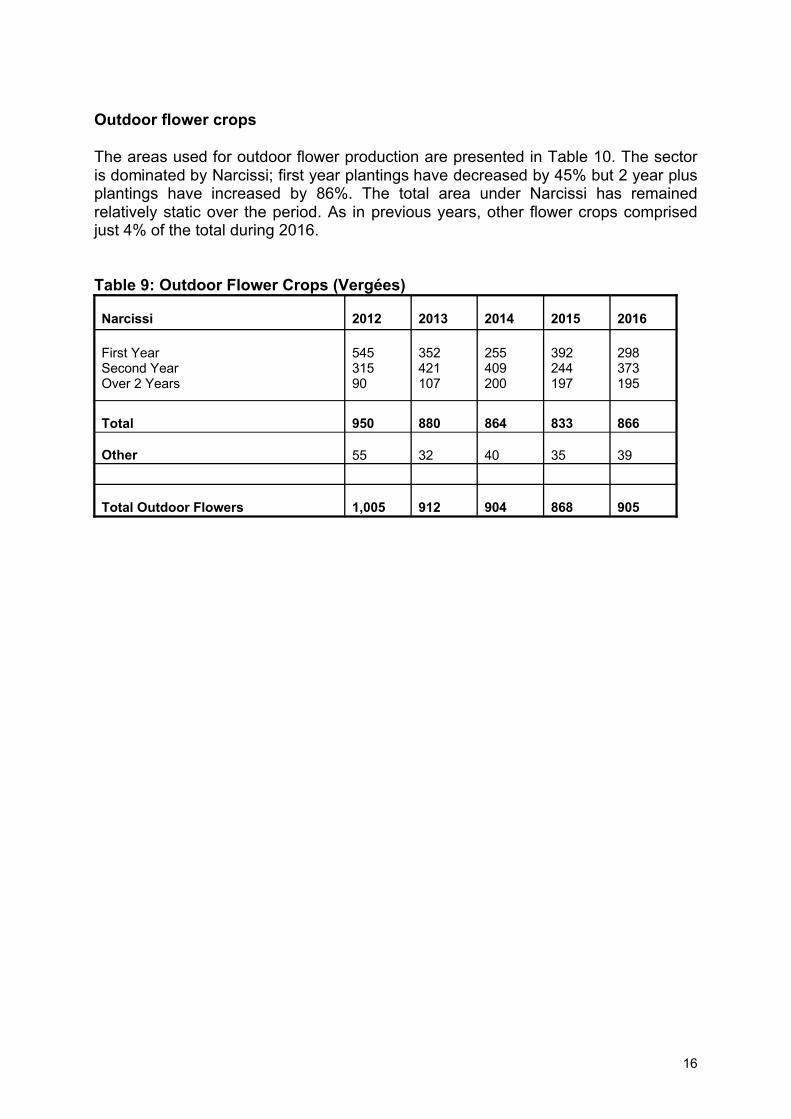
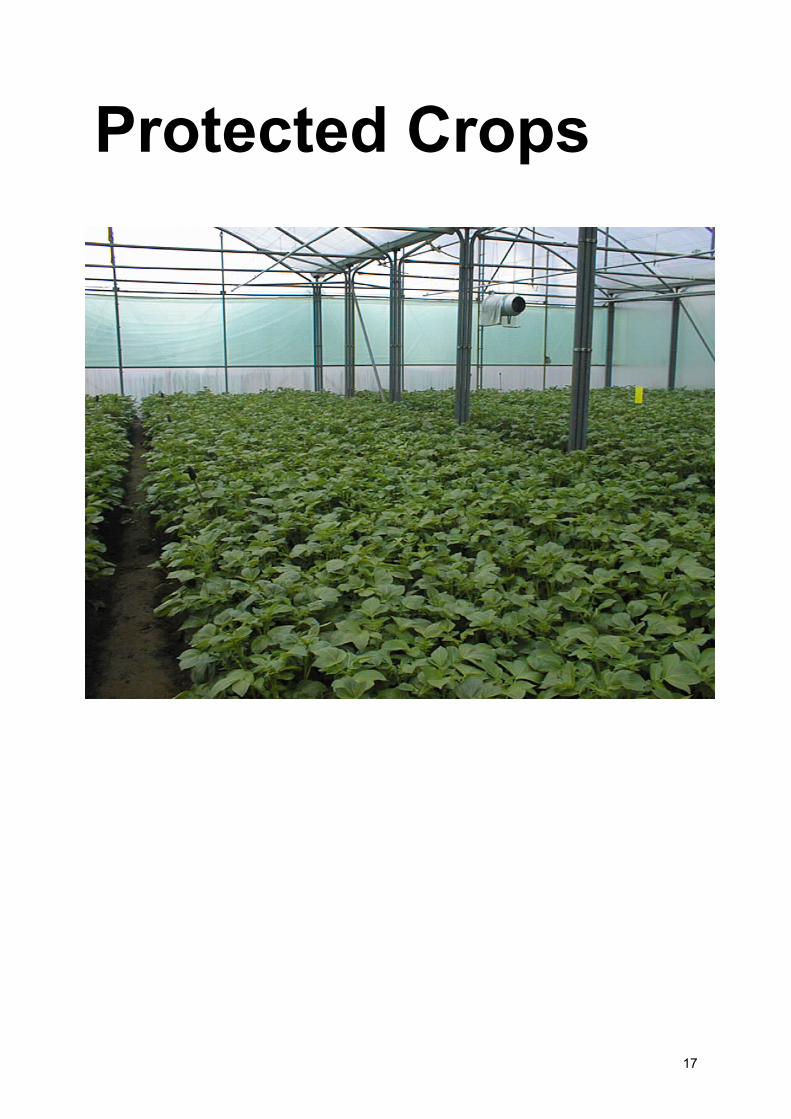
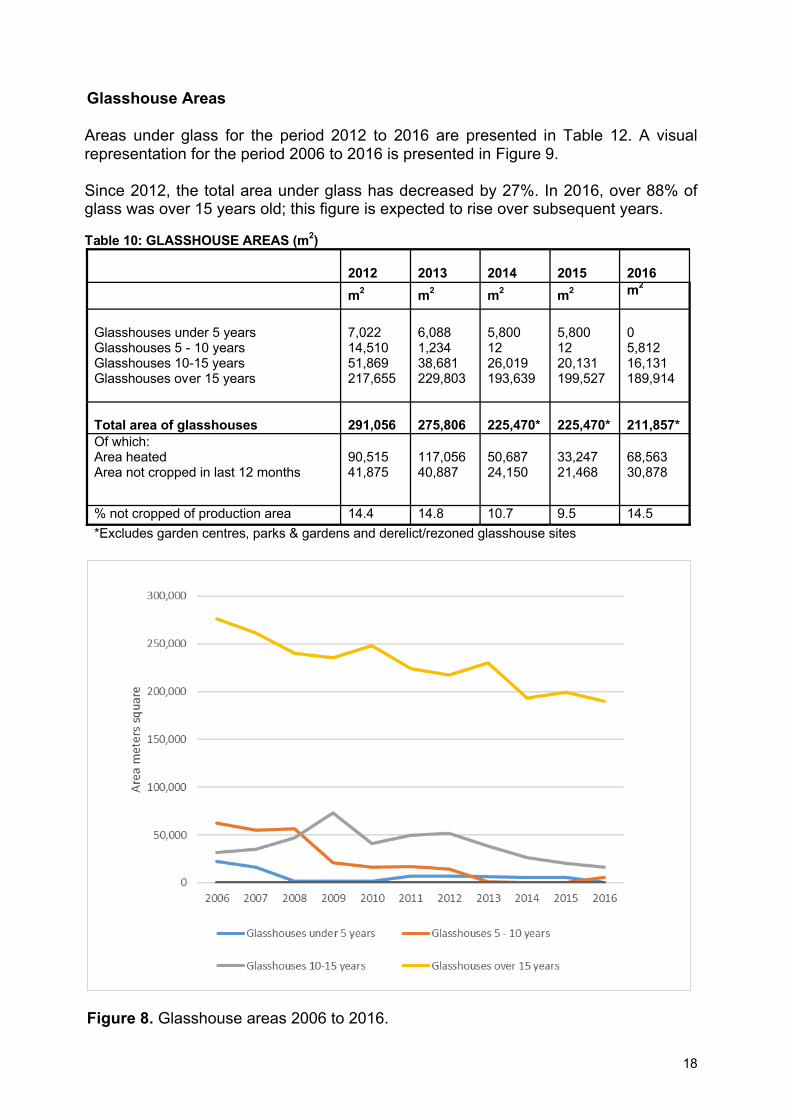
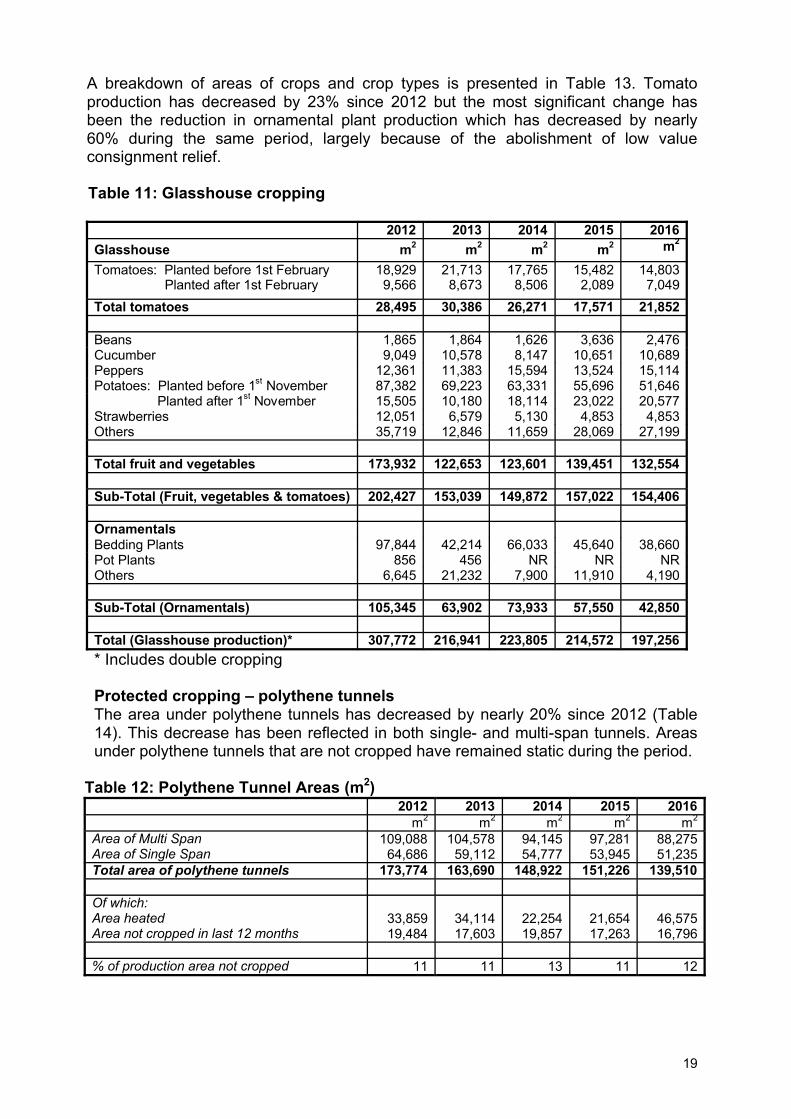
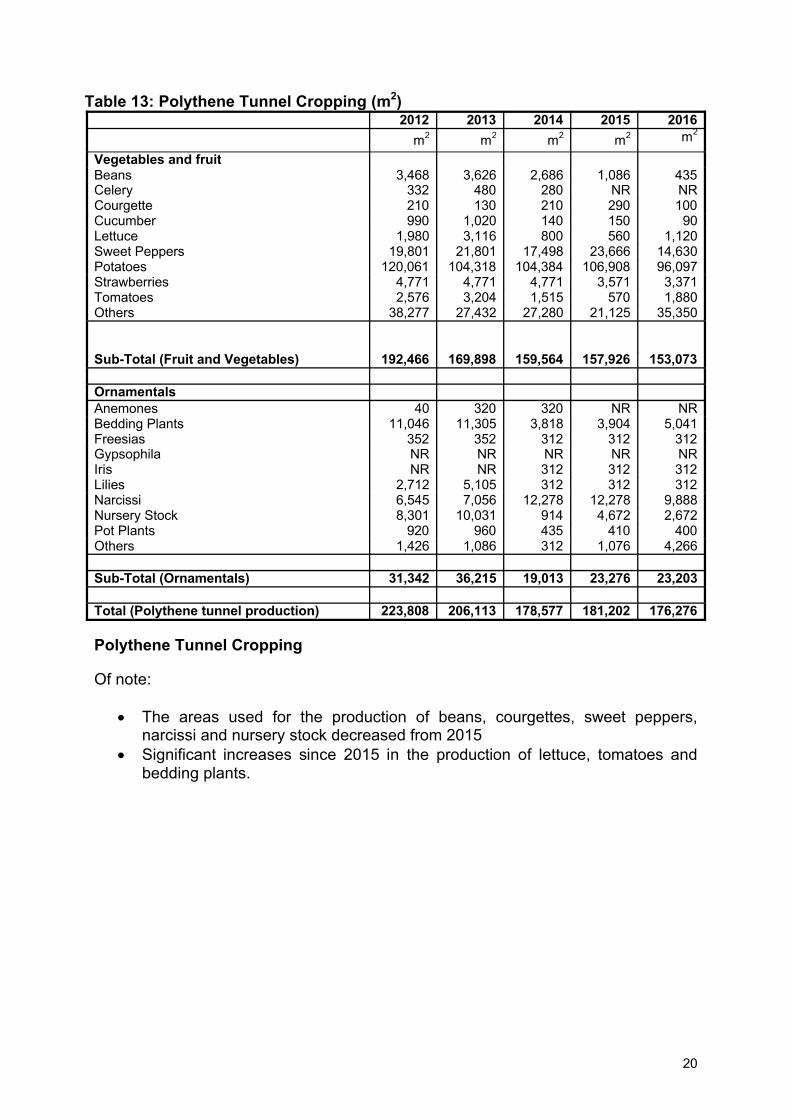
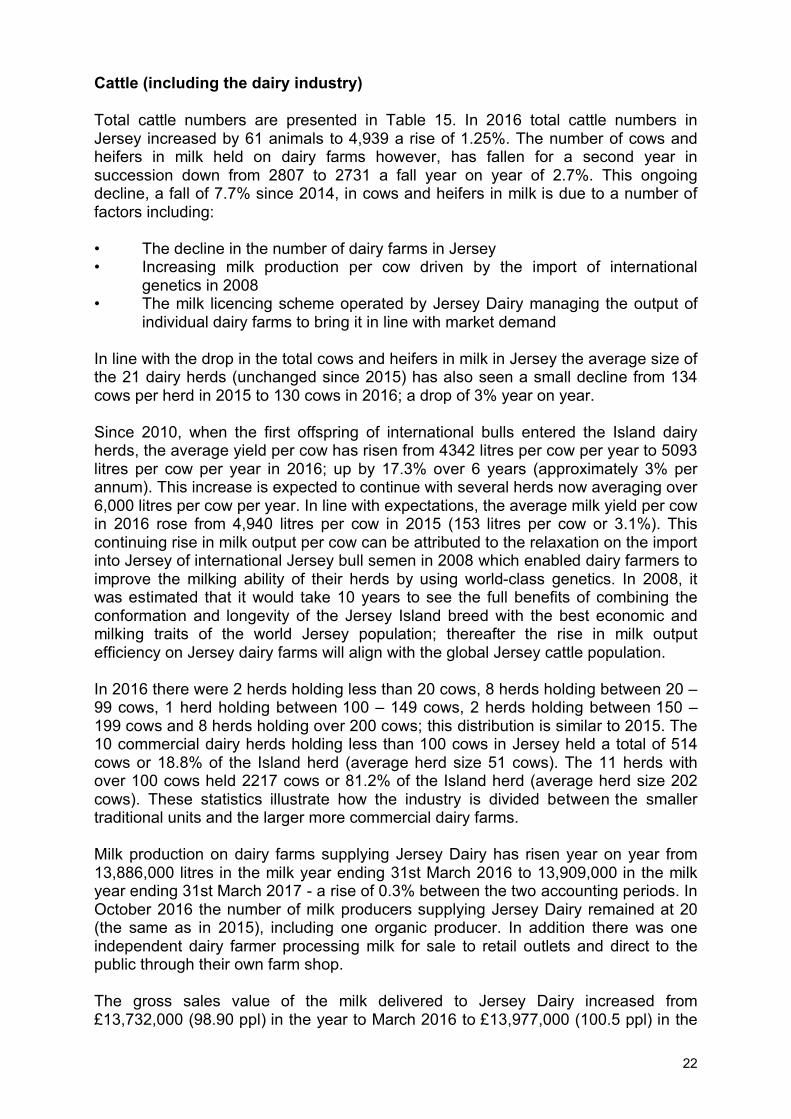
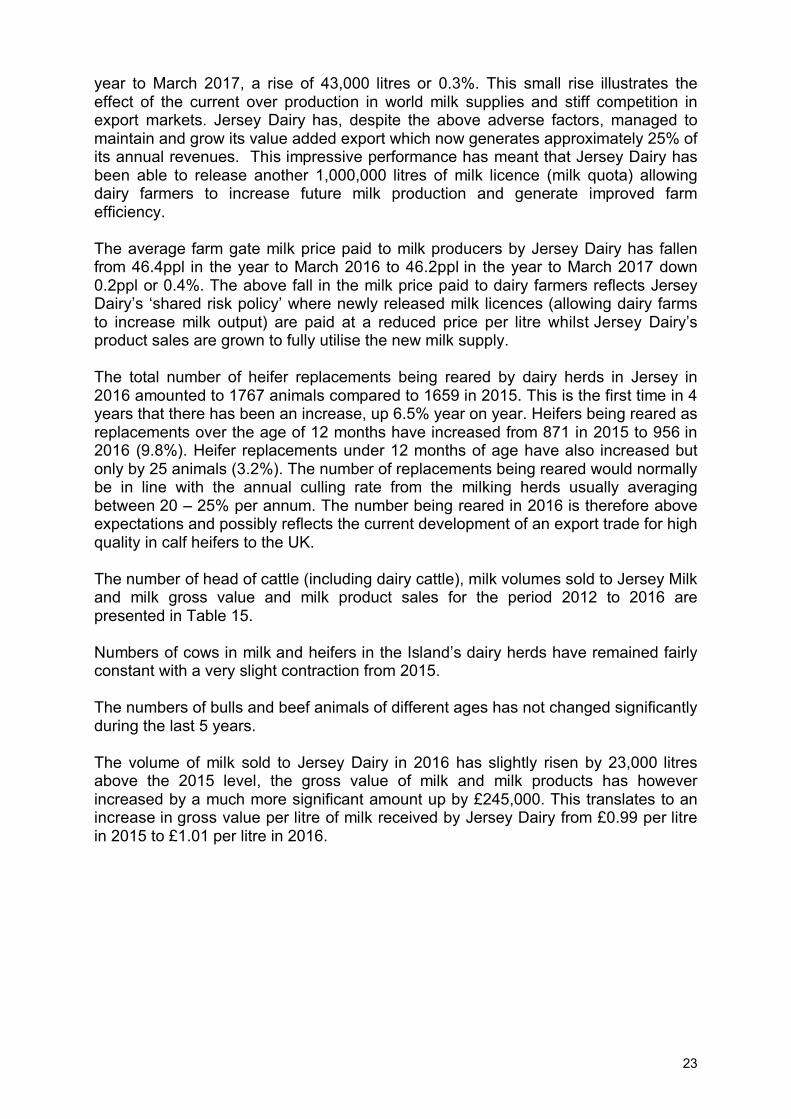
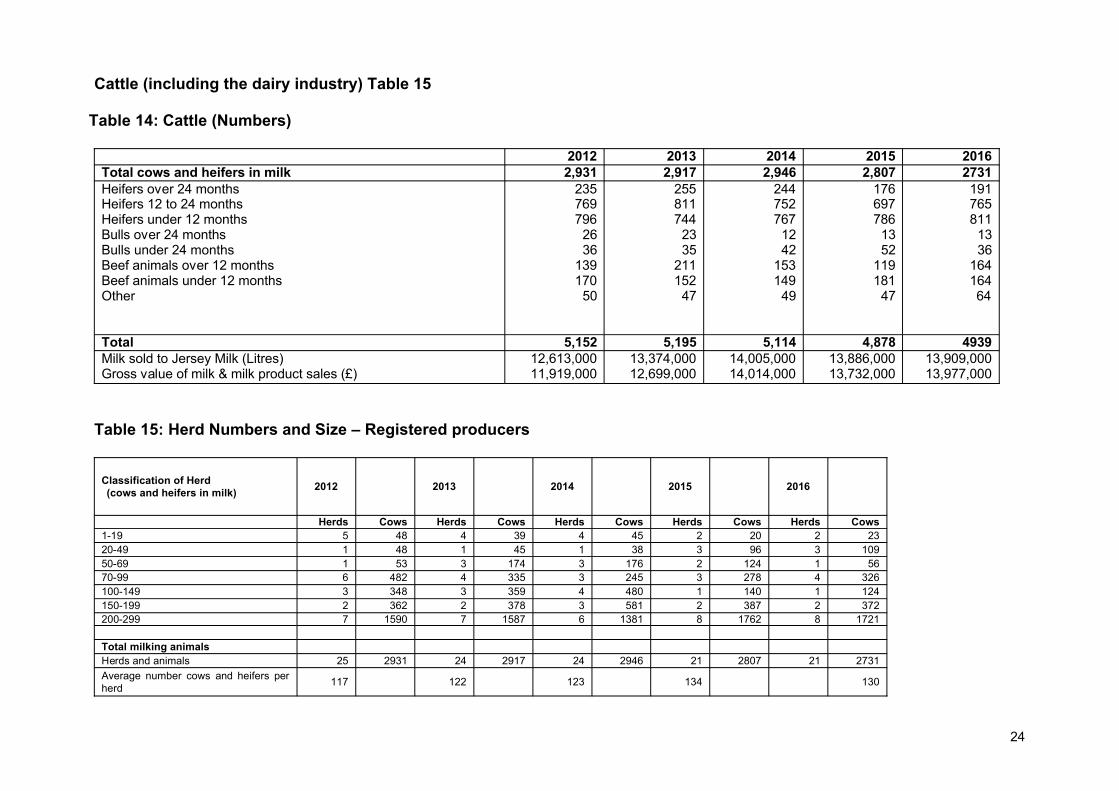
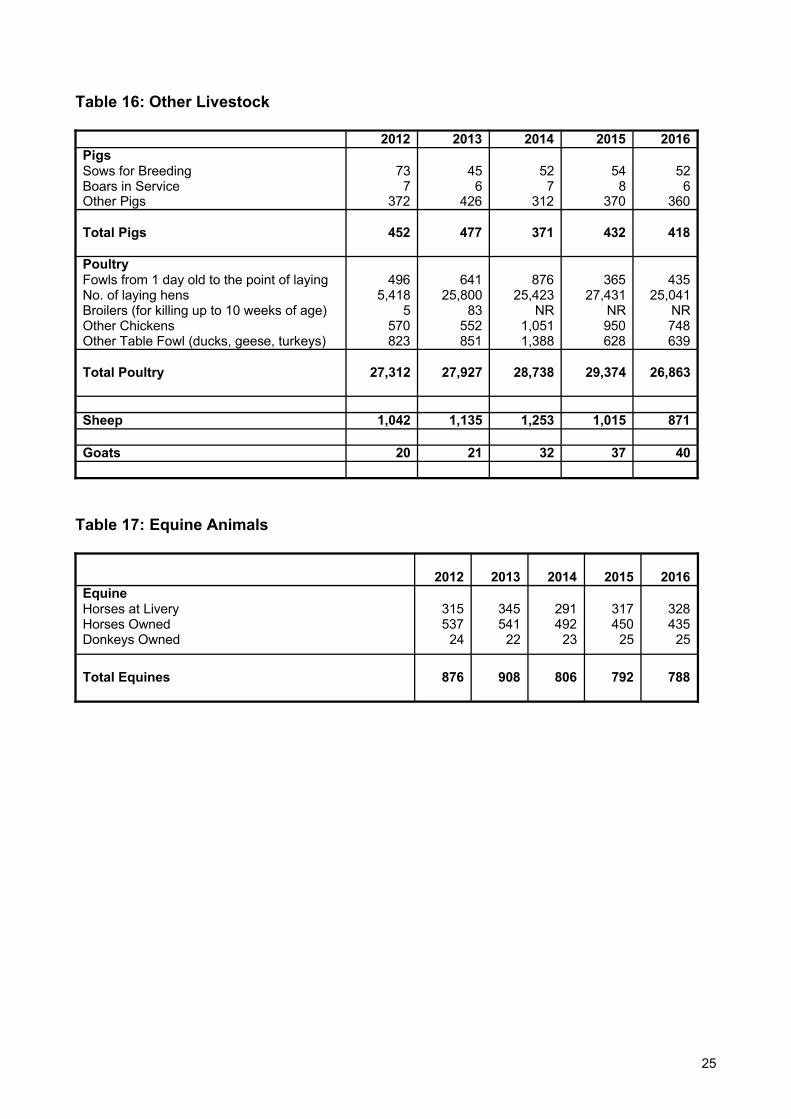
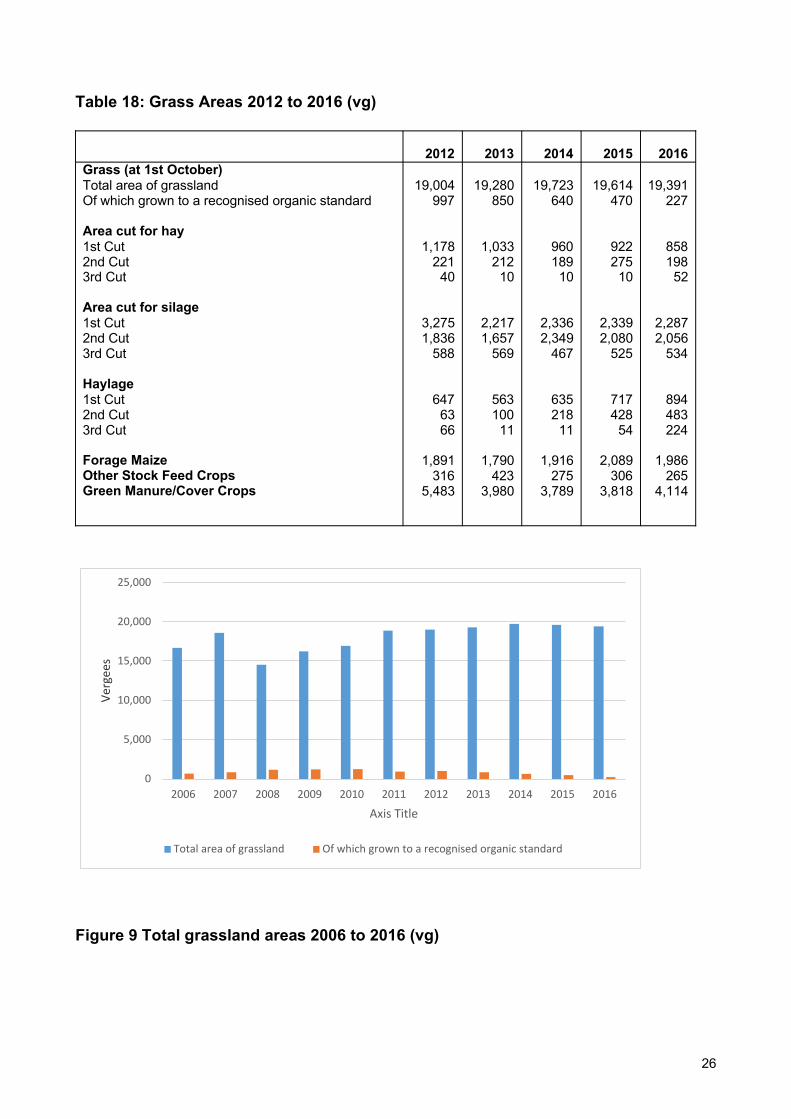
0
200
400
600
800
1000
1200
1400
1600
1800
2000
2006 2007 2008 2009 2010 2011 2012 2013 2014 2015 2016
Verg
ees
1st Cut 2nd Cut 3rd Cut
Figure 10 Areas of hay production 2006 to 2016 (vg)
0
500
1000
1500
2000
2500
3000
3500
4000
4500
2006 2007 2008 2009 2010 2011 2012 2013 2014 2015 2016
Verg
ees
1st Cut 2nd Cut 3rd Cut
Figure 11 Areas of silage production 2006 to 2016 (vg)
27
0
100
200
300
400
500
600
700
800
900
1000
2006 2007 2008 2009 2010 2011 2012 2013 2014 2015 2016
Verg
ees
1st Cut 2nd Cut 3rd Cut
Figure 12 Haylage production 2006 to 2016
0
500
1000
1500
2000
2500
2006 2007 2008 2009 2010 2011 2012 2013 2014 2015 2016
Verg
ees
Forage Maize Other Stock Feed Crops
Figure 13 Areas under forage crops 2006 to 2016
28
Table 19 Cereal Areas (vg)
2012 2013 2014 2015 2016
Barley (harvested for grain) Oats (harvested for grain) Wheat (harvested for grain) Cereals grown for straw only
1021 12
260 477
498 9
116 440
705 231
99 427
450 13 59
402
373 15
113 252
Total cereals 1770 1063 1462 924 753
0
200
400
600
800
1000
1200
2006 2007 2008 2009 2010 2011 2012 2013 2014 2015 2016
Verg
ees
Barley (harvested for grain) Oats (harvested for grain)
Wheat (harvested for grain) Cereals grown for straw only
Figure 14 Areas under cereals 2006 to 2016
29
30
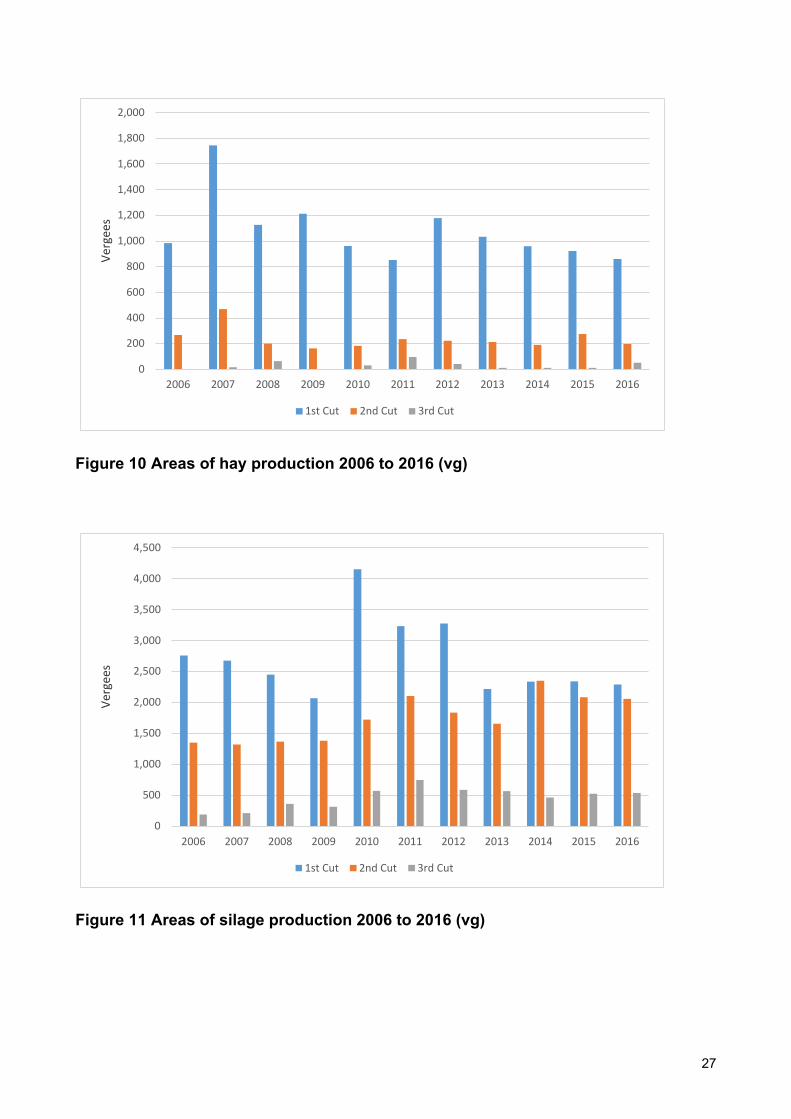
0
100
200
300
400
500
600
700
800
900
1000
2006 2007 2008 2009 2010 2011 2012 2013 2014 2015 2016
Verg
ees
1st Cut 2nd Cut 3rd Cut
Figure 12 Haylage production 2006 to 2016
0
500
1000
1500
2000
2500
2006 2007 2008 2009 2010 2011 2012 2013 2014 2015 2016
Verg
ees
Forage Maize Other Stock Feed Crops
Figure 13 Areas under forage crops 2006 to 2016
28
Table 19 Cereal Areas (vg)
2012 2013 2014 2015 2016
Barley (harvested for grain) Oats (harvested for grain) Wheat (harvested for grain) Cereals grown for straw only
1021 12
260 477
498 9
116 440
705 231
99 427
450 13 59
402
373 15
113 252
Total cereals 1770 1063 1462 924 753
0
200
400
600
800
1000
1200
2006 2007 2008 2009 2010 2011 2012 2013 2014 2015 2016
Verg
ees
Barley (harvested for grain) Oats (harvested for grain)
Wheat (harvested for grain) Cereals grown for straw only
Figure 14 Areas under cereals 2006 to 2016
29
30
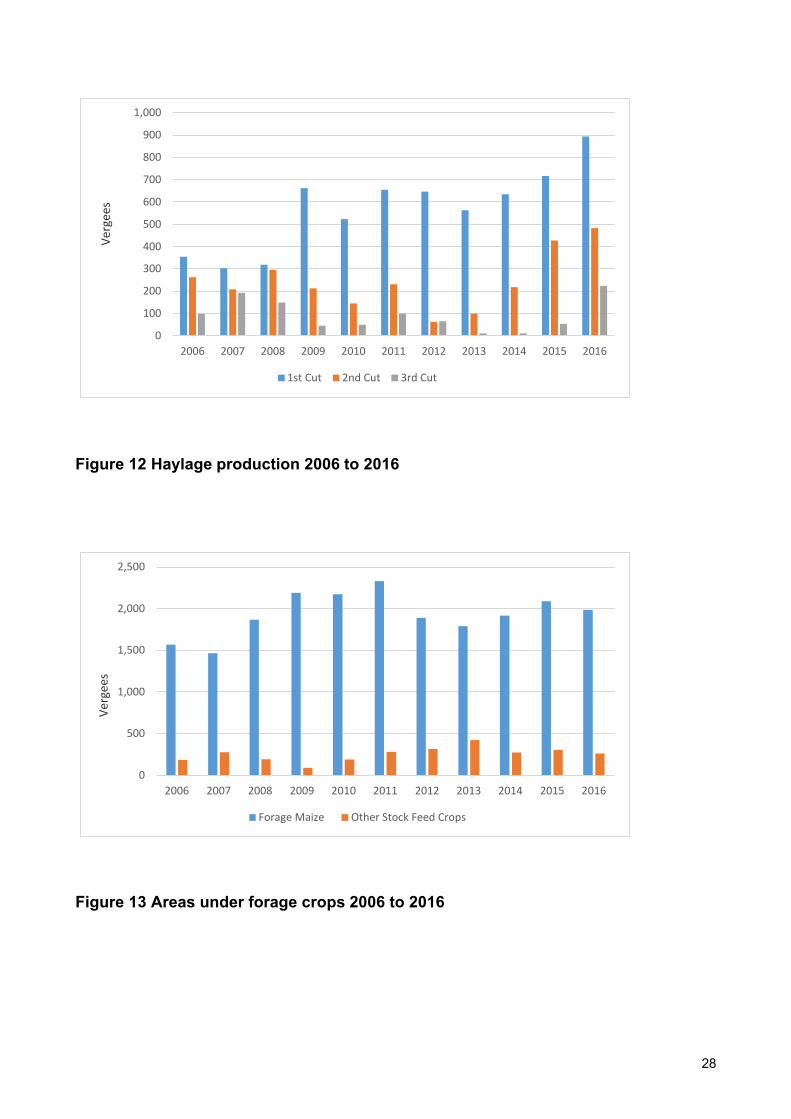
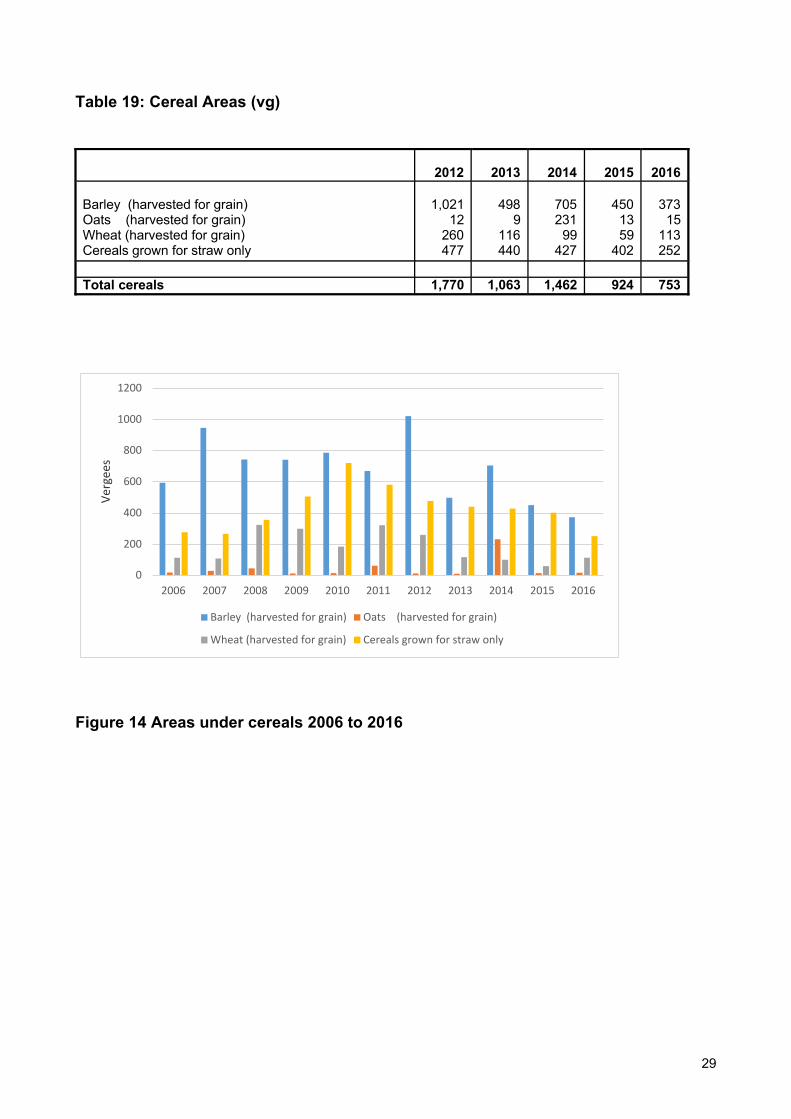
30