Embed Size (px)
Citation preview
1
Agricultural Structure and the Rise of the Nazi Party Reconsidered
Paul W. Thurner1, André Klima2, Helmut Küchenhoff2
1 Department of Political Science, Ludwig-Maximilians-Universität Munich, Germany 2 Department of Statistics, Ludwig-Maximilians-Universitat Munich, Germany
Corresponding Author Paul W. Thurner
Department of Political Science Chair for Empirical Political Research and Policy Analysis
Ludwig-Maximilians-Universität Munich, Germany Oettingenstr. 67, 80538 München
Tel.: + 49 (0) 89 / 2180 9081 Fax: +49 (0) 89 / 2180 9092
Email: [email protected]
Key Words: Nazi Vote, Economic Voting, Peasantry, Rural Classes, GAM
2
Abstract
A recent analysis of the electoral success of the German Nazi party challenges the view that it
was a “Catch-All Party of Protest” that attracted voters equally from all societal strata. We
follow this incentive-based, economic voting perspective that accentuates the asymmetric
electoral attractiveness of the NSDAP. More specifically, we propose to refocus the debate on
the agricultural origins of this party. For the first time, we use a country-wide data set
including the original categories of so-called parcel peasants (0-2 hectare), small-sized (2-5
hectare) and medium-sized farmers (5-20 hectare). This fine-grained classification was
introduced and behaviorally confirmed by the Statistical Office of the Weimar Republic at
that time. However, a multitude of studies subjected the original farm sizes to different
recombinations, e.g. to 0-20 hectare, thereby disregarding the socio-economic rationale
underlying the basic classes. Using generalized additive models (GAM), we are able to
identify a clear distinct impact of the proportion of agrarian middle class (5-20 hectare) on
the Nazi vote – which theoretically unjustified recombinations of farm sizes do not have.
3
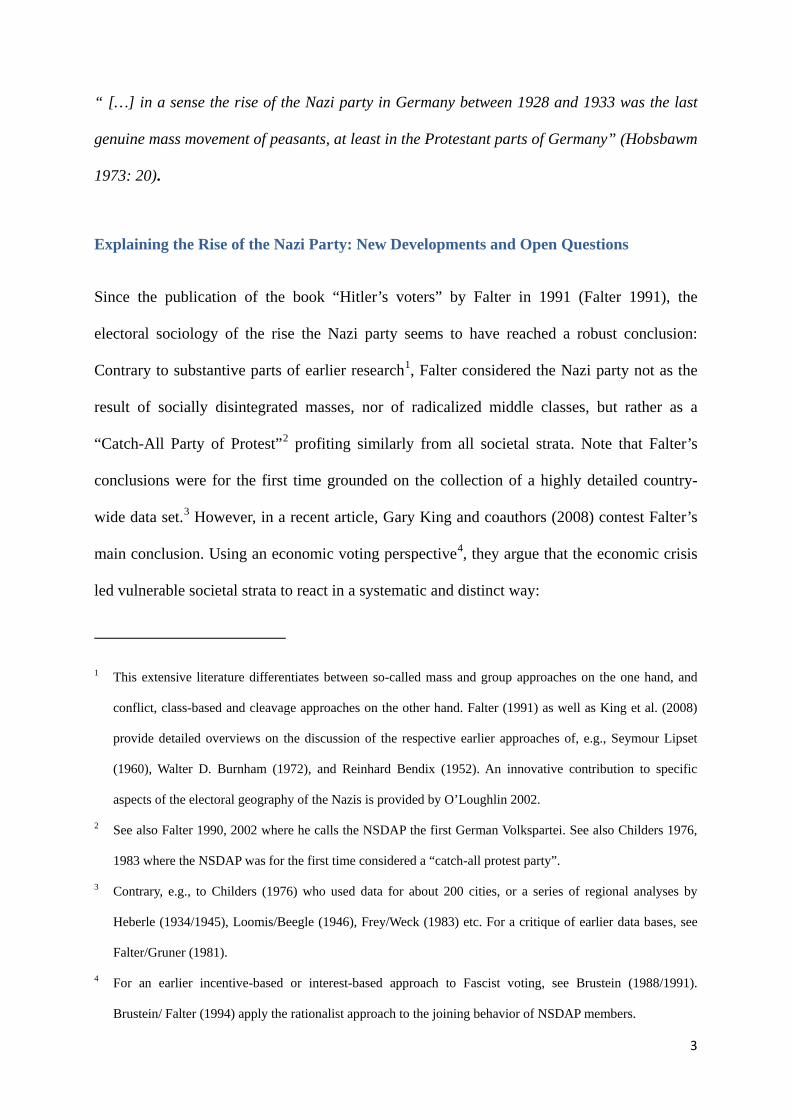
“ […] in a sense the rise of the Nazi party in Germany between 1928 and 1933 was the last
genuine mass movement of peasants, at least in the Protestant parts of Germany” (Hobsbawm
1973: 20).
Explaining the Rise of the Nazi Party: New Developments and Open Questions
Since the publication of the book “Hitler’s voters” by Falter in 1991 (Falter 1991), the
electoral sociology of the rise the Nazi party seems to have reached a robust conclusion:
Contrary to substantive parts of earlier research1, Falter considered the Nazi party not as the
result of socially disintegrated masses, nor of radicalized middle classes, but rather as a
“Catch-All Party of Protest”2 profiting similarly from all societal strata. Note that Falter’s
conclusions were for the first time grounded on the collection of a highly detailed country-
wide data set.3 However, in a recent article, Gary King and coauthors (2008) contest Falter’s
main conclusion. Using an economic voting perspective4, they argue that the economic crisis
led vulnerable societal strata to react in a systematic and distinct way:
1 This extensive literature differentiates between so-called mass and group approaches on the one hand, and
conflict, class-based and cleavage approaches on the other hand. Falter (1991) as well as King et al. (2008)
provide detailed overviews on the discussion of the respective earlier approaches of, e.g., Seymour Lipset
(1960), Walter D. Burnham (1972), and Reinhard Bendix (1952). An innovative contribution to specific
aspects of the electoral geography of the Nazis is provided by O’Loughlin 2002.
2 See also Falter 1990, 2002 where he calls the NSDAP the first German Volkspartei. See also Childers 1976,
1983 where the NSDAP was for the first time considered a “catch-all protest party”.
3 Contrary, e.g., to Childers (1976) who used data for about 200 cities, or a series of regional analyses by
Heberle (1934/1945), Loomis/Beegle (1946), Frey/Weck (1983) etc. For a critique of earlier data bases, see
Falter/Gruner (1981).
4 For an earlier incentive-based or interest-based approach to Fascist voting, see Brustein (1988/1991).
Brustein/ Falter (1994) apply the rationalist approach to the joining behavior of NSDAP members.
4
“The interesting question is which groups voted for the Nazis differently than the average. In
answering this question, we focus on incentives in voting for the Nazis.” (King et al. 2008:
957)
Their “incentives-based retrospective voting” (ibd: 952) approach delineates a so-called
“working poor” segment which they consider especially susceptible to vote for the Nazi party.
In their view, this working poor segment is behaviorally distinct from the segment of those
directly and immediately hit by the economic crisis, like laborers and the unemployed. The
“natural” political supply parties for the latter segments continued to be the Social Democratic
Party and the Communist Party. However, those for which the economic crisis was tangible in
a rather intermediate and imminent way esteemed the NSDAP as a promising new political
option.5 King et al. (2008) subsume self-employed, shopkeepers, independent artisans,
professionals, domestic employees and family members, lawyers, and small farmers etc.
under the category “working poor.” The authors also provide economic incentives for the
religious affiliation-induced voting patterns – hitherto unanimously acknowledged as the
dominant explanatory variable.6 More generally, they suggest applying sophisticated
statistical analyses for the testing of still open research questions with regard to the Nazi
phenomenon. Using a new variant of ecological inference,7 they estimate the actual shares of
different groups voting for the NSDAP. In order to detect these groups’ voting behavior, they
5 “In contrast, we find that those who were hurt most by the depression and wound up supporting the Nazis
were those at little risk of being unemployed.” (King et al 2008: 951).
6 The authors argue that “Nazi agricultural policy did not appeal to peasant workers in Catholic precincts; and
domestic workers in Catholic regions benefited from government programs (while the self-employed did
not). In addition, the self-employed would not be as heavily influenced by the Catholic Church because the
benefits from Nazi policy in favor of small business were just too tempting” (King et al. 2008: 965).
7 Where individual choices are inferred from aggregate data, see e.g. King et al. (1999).
5
divide the German Reich into six homogenous regions along different shares of
unemployment and religious affiliation. Based on this design, the results fully corroborate the
“working poor” thesis and, thus contribute essentially to our understanding of the asymmetric
nature of the swing towards the Nazis.
In the following, we propose to focus on one segment that has been surprisingly neglected by
scientists, despite the consensus that the NSDAP became a “rural party” by the end of the
1920s, i.e. on the peasants:
“An urban-to-rural realignment in the Nazi vote occurred between 1928 and 1933. Some
districts realigned as early as 1928. About half had done so with the elections of 1930, and all
but one did so with the election of 1933” (Waldman 1973: 140)
Waldman also stresses the idea that there was an interaction between confessional affiliation
and rural segments “…that religion intervened between strain and the political reaction to it,
that is that Protestants reacted differently to strain than did Catholics.” (1973: 94).
Whereas King et al. conceive of small farmers as part of their “working poor” segment
(2008: 961), their measurement is rather indirect because it relies exclusively upon the broad
category “self-employed” – which includes non-agrarian self-employed as well as self-
employed owners of very small, medium-sized and somewhat larger farms.8
The size of farms constitutes the fundamental factor of rural stratification (see Loomis/Beegle
1946). After the abolishment of feudal corporations in Europe, the size of farms determines
the social and economic status of peasants. Thus, the statistical classification of farm sizes
8 “[…] i.e., independent artisans, shopkeepers, small farmers, and a smaller group of industrial employers that
we cannot separate out [...]”, see King et al. (2008): 969.
6
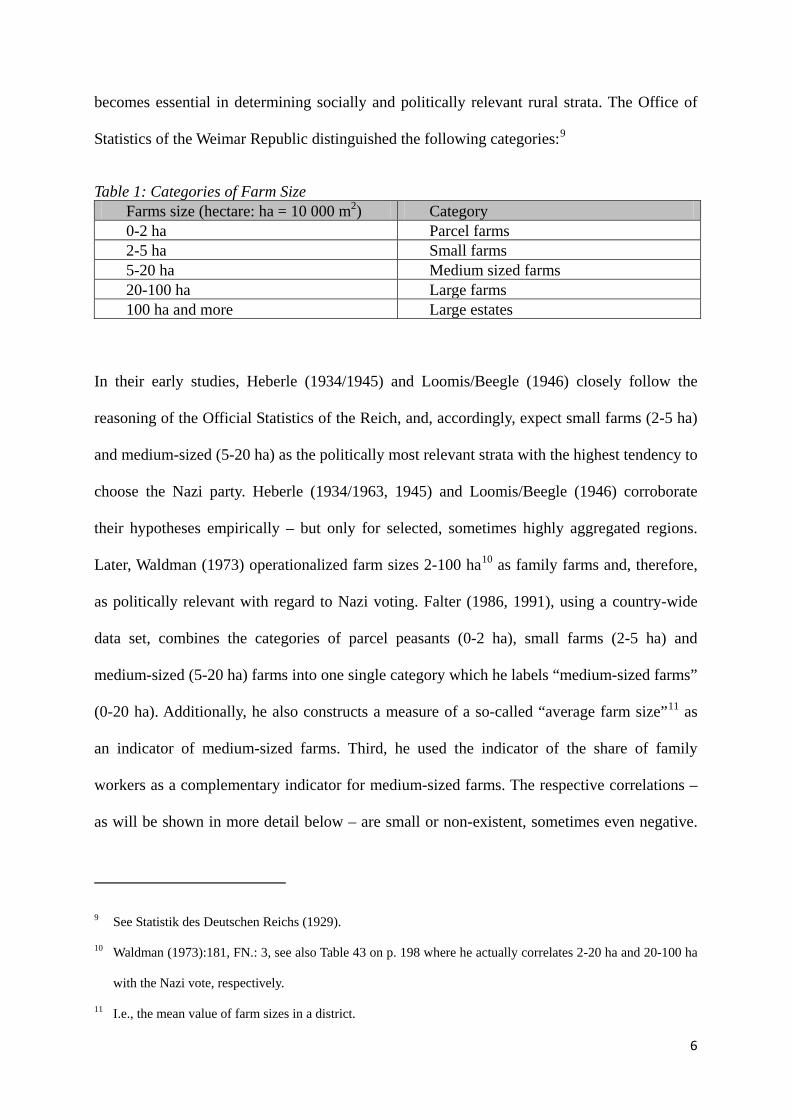
becomes essential in determining socially and politically relevant rural strata. The Office of
Statistics of the Weimar Republic distinguished the following categories:9
Table 1: Categories of Farm Size Farms size (hectare: ha = 10 000 m2) Category 0-2 ha Parcel farms 2-5 ha Small farms 5-20 ha Medium sized farms 20-100 ha Large farms 100 ha and more Large estates
In their early studies, Heberle (1934/1945) and Loomis/Beegle (1946) closely follow the
reasoning of the Official Statistics of the Reich, and, accordingly, expect small farms (2-5 ha)
and medium-sized (5-20 ha) as the politically most relevant strata with the highest tendency to
choose the Nazi party. Heberle (1934/1963, 1945) and Loomis/Beegle (1946) corroborate
their hypotheses empirically – but only for selected, sometimes highly aggregated regions.
Later, Waldman (1973) operationalized farm sizes 2-100 ha10 as family farms and, therefore,
as politically relevant with regard to Nazi voting. Falter (1986, 1991), using a country-wide
data set, combines the categories of parcel peasants (0-2 ha), small farms (2-5 ha) and
medium-sized (5-20 ha) farms into one single category which he labels “medium-sized farms”
(0-20 ha). Additionally, he also constructs a measure of a so-called “average farm size”11 as
an indicator of medium-sized farms. Third, he used the indicator of the share of family
workers as a complementary indicator for medium-sized farms. The respective correlations –
as will be shown in more detail below – are small or non-existent, sometimes even negative.
9 See Statistik des Deutschen Reichs (1929).
10 Waldman (1973):181, FN.: 3, see also Table 43 on p. 198 where he actually correlates 2-20 ha and 20-100 ha
with the Nazi vote, respectively.
11 I.e., the mean value of farm sizes in a district.
7
In sum, Falter’s (1986, 1991) results on the (non-)impact of farm sizes, are in our view still
inconclusive – theoretically as well as methodically.
Thus, there remains a surprising and obvious puzzle: Was the rural Nazi vote, at least since
the 1930s, a phenomenon of radicalized agrarian middle classes – as argued by Geiger (1932),
Heberle (1934/1963, 1945), Loomis/Beegle (1946), Lipset (1960), and Linz (1976)? Or
should the rural vote also be conceived of as a ‘catch-all party of protest’ phenomenon – i.e.,
the Nazis attracted from all of the agrarian societal strata more or less equally? Based on the
“ruralization argument” (Waldman 1973), on the “incentive-based” reasoning of Linz (1976),
Brustein (1988, 1991) and King et al. (2008), as well as using a completely new data set, we
consider it necessary to reopen the discussion on the genuine agricultural social origins of the
spread of the Nazi party. This is the first country-wide study using the original classification
of parcel peasants (0-2 ha), small-sized (2-5 ha) and medium-sized farmers (5-20 ha) from the
Weimar Republic– i.e.: as introduced by the Office of Statistics of the Weimar Republic, and
as used by the classic regional study by Heberle (1934/1963, 1945).
In the following, we provide, first, a short overview on the literature on the agricultural crisis
in the Weimar Republic. Then, we briefly review the quantitative literature on the relation
between agricultural structure and the Nazi vote. Based on rural sociology and the macro-
sociological literature on peasant dissent and social revolution, we derive four hypotheses on
the rural basis of the Nazis and its interaction with the confessional affiliation of districts.
Hypotheses are tested for the first time by using the fine-grained original classification of the
Official Statistics. Next, we introduce data and present a new statistical approach to the study
of the Nazi party, so-called generalized additive models. Finally, we discuss our empirical
results, which indicate a clear middle class basis of the rural Nazi vote since the 1932
elections.
8
Agricultural Crisis and Political Interest Representation of Peasants in the Weimar
Republic
The importance of the peasantry for the rise of the Nazis was recognized very early (Heberle
1934/1963, 1945, Friedrich 1937, Loomis/Beegle 1946). As a consequence, the literature on
the specific rural impact is extensive. There are numerous publications on the agricultural
policy and on agrarian interest groups in the Weimar Republic by, e.g. Beyer (1965), Gies
(1967), Gessner (1977), Schumacher (1978), Flemming (1978) and Osmond (1993).
Seen from the perspective of economic history12, the political role of the agricultural sector in
the Weimar Republic has been surprisingly disproportionate – as compared to its contribution
to economic production, namely approx. 16 % of domestic net product in the years 1925-1929
(James 1986: 242). In 1925, approx. 30% of the workforce still constituted this sector – which
sheds light on its low productivity as compared to the industrial sector. Within this sector, the
social stratification of the peasantry was highly differentiated.13 In sum, more than 2 million
peasants earned their living from their agricultural business. Only 1 % (N =23 000) of the
landowners had very large land estates (larger than 100 ha). Large peasants owning land
consisting of 50-100 ha and so-called full farmers owning 20-50 ha land estates represented
13 % (ca. N=262 000). Middle peasants owning estates consisting of 5-25 ha represented
18 % of the owners, small owners with 2-5 ha represented 17.5 %. More than 3 million so-
called parcel peasants owned 0-2 ha. Whereas large estate owners, large peasants and full
peasants were able to earn their living from their properties, land owning was not the
12 See Statistik des Deutschen Reichs (1929): table 20. Very useful historical overviews are provided, e.g., by
James (1986), Wehler (2008): 331-342.
13 For the following, see the social history-oriented resume by Wehler (2008): 331ff, see also Geiger (1932):
30-34.
9
exclusive source of livelihood for parcel peasants. They had to rely on an additional
occupation, e.g. serving as a land laborer, which was perceived as degrading in the rural status
hierarchy. Owners with mid-sized farms constituted a distinctive social sphere – they were the
aspiration group for small peasants as well as themselves driven by an intense aspiration to
advance to the level of large peasant ownership.
The slow adjustment of German farmers to more rational and modern production regimes – in
order to keep pace with decreasing world market prices for agricultural products – was due to
protective tariff interventions set in the 1890s of the German Empire (Kaiserreich). Restrictive
tariff policies reflected the political power of very large land owners in Eastern Germany
specialized in grains. Additionally, German peasants were not able to profit from the
hyperinflation in the early twenties (see James 1986). World market prices for wheat began to
decline in 1925. In 1926/27, a global crisis of agriculture compelled German farmers to take
up loans in order to compensate for price reduction and price controls as well as for the
increase of taxes. From 1928 to 1932, German governments followed a highly protective tariff
policy in order to secure wheat prices – agrarian protectionism became the “sacrosanct
custom” (Wehler 2008: 314). However, these interventions had no identical repercussions on
the peasantry – due to its highly heterogeneous social and economic structure, namely with
regard to farm sizes as well as with regard to product specialization (grains versus cattle).
Protective tariff measures were beneficial mainly for large owners in Eastern Germany
producing wheat.
This heterogeneity of peasant’s economic interests impeded a country-wide interest
representation by mainstream parties. E.g., the Bavarian part of the Catholic Center Party
10
(Zentrumspartei14) was confronted with a niche party since 1893,15 the Bavarian Peasants
Alliance (Bayerischer Bauernbund) representing mostly small and medium-sized peasants.
Also founded in 1893 was the Alliance of German Peasants (Bund der Landwirte) consisting
mostly of Northern and Eastern small, medium and large peasants, and only very marginally
of large estates. Nevertheless, large proprietors of large estates took the leadership of this
interest group, and fostered its adherence to the conservative party (Deutschnationale
Volkspartei, DNVP). Inherent organizational tensions between small and medium-sized
farmers on the one hand, and large farmers on the other hand, broke out during the
aggravation of the agrarian crisis by the end of the 1920s. Small and medium-sized peasant
movements spread, and formed particular peasant parties, like the Christian-National Peasant
Association (Christlich-nationale Bauernverein, CNBV) or the peasant movements in
Schleswig-Holstein. The latter one became famous as a terroristic movement attracting
attention due to violent events and even bomb attacks. In retrospect, most of these anti-
establishment peasant parties proved to be “flash parties” (Rose/Mackie, 1988) or
“intermediate hosts” – they mainly attracted the Protestant peasant clientele of the
conservative and liberal parties in the 1928 election and even, despite to already lower degree,
in the 1930 election – but their electorate was then nearly fully absorbed by the NSDAP in the
1932-1933 elections. Peasant parties in Catholic regions, like in Bavaria the Bayerische
Bauernbund, experienced a similar decline but to a less extensive degree.
14 In 1918, the Bavarian People’s party (Bayerische Volkspartei) was founded, and became an autonomous,
regional party of Catholicism.
15 For the concept of mainstream and niche parties, see Meguid (2008). Meguid provides an interesting
perspective on how the performance of new niche parties is a function of the competitive strategies of
established mainstream parties. See also Hug (2001).
11
Thus, heterogeneity of economic interests and the differential failure of political interest
organization by interest groups as well as by parties led to the different levels of absorption of
peasant voters by the NSDAP in Catholic and Protestant regions, respectively.16 Differences
of Nazi voting in districts with different shares of religious denomination are mainly due to
differences of the performance of established mainstream parties in dealing, first, with peasant
discontent and, second, with respective challenging niche parties. In order to lure peasant
voters in the 1928 election, Hitler modified a position of the NSDAP program by attenuating
point 17 which postulated the expropriation of land. Evidently, this position clearly frightened
any self-employed peasant. In March 1930, the NSDAP promoted a first anti-crisis crash
program for German agriculture. In July 1930, Hitler endowed Walter Darré with extensive
organizational competencies for creating an aggressive campaign directed toward the
agricultural sector.
In sum, the interplay between an exogenous shock (the global agrarian crisis), long-term
structures of agriculture in Germany (rural stratification), and short-term decisions by agrarian
elites, led to the disastrous failure of the system of agricultural interest mediation. Whereas
very large and large farmers continued to adhere to the liberal, conservative and Catholic
parties, respectively, economically-threatened small and medium sized farmers seemed to
have been much more susceptible to Nazi propaganda, and therefore became electorally
volatile. In the following, we will discuss how quantitative electoral studies dealt with this
topic and what results they have produced so far.
16 Despite highlighting the differential performance of interest representation by Protestant parties due to
heterogeneity of interests, our argument is in line with Burnham’s (1972) political confessionalism argument
and Shively’s (1972) conclusion on within-bloc voting along established cleavage lines.
12
Agricultural Structure and the Rise of the NSDAP: Main Quantitative Results
There are surprisingly few quantitative analyses of the electoral success of the Nazi party
focusing on agrarian aspects – as compared to determinants like confessional affiliation and
unemployment. Originally, Falter considered the agricultural aspect of the Nazi movement as
one of the most important open research questions (see Falter 1980: 187). One reason was that
previous research studies, like the one by Childers (1976), especially investigated the urban
origin of the Nazi voters. Secondly, the early studies by Heberle (1934/1963, 1946) and
Loomis/Beegle (1946) were considered too regionally focused and therefore not
representative (see Falter 1980: 187). However, only one regional in-depth study of Franconia
by Falter finally investigated the agricultural bases of the NSDAP in a more detailed way
(Falter 1986). A final summary of the country-wide relationship between rural stratification
and the Nazi vote is provided in Falter’s book (1991: 256-266)
In the following, we shortly review the respective methodical approaches and the most
important results of these studies. Heberle’s study “Rural Population and National Socialism”
was already finalized in 1934. The sociological investigation of interest representation in
Schleswig-Holstein from 1918 to 1932 is now a classic study in electoral research. The
starting point was the early and rapid breakthrough of the NSDAP in Schleswig-Holstein
since 1930. Before that time, Bavaria and especially Franconia exhibited the highest NSDAP
shares. For the contemporary observer, it seemed obvious that the success was due to a
radicalized peasantry. Inspired by the approach of electoral geography and using the method
of an internal comparison across different agricultural regions in Schleswig-Holstein, Heberle
tries to identify the specific agro-economic incentives of the peasants in voting for the
NSDAP. Specific soil conditions, modes of production and social stratification are conceived
as crucial determinants of voting behavior in this view (see Heberle 1963: 41). Based on these
considerations, he derives, inter alia, the hypothesis that the landslide from liberal parties
13
towards the Nazis was faster in crisis-prone regions with relatively less diversified production
modes and less wealthy peasants (see Heberle 1963: 99). Heberle proposes a series of highly-
differentiated hypotheses, which are tested on the basis of 30 rural districts and using rank
correlation. The main result is that regions characterized by small- and medium sized farms
exhibit higher electoral shares for the NSDAP:
“More specifically, it may be said that the classes particularly susceptible for Nazism were
neither the rural nobility and big farmers nor the rural proletariat, but rather the small farm
proprietors, very much the rural equivalent of the lower middle class or petty bourgeoisie
(Kleinbuergertum) which formed the backbone of the NSDAP in the cities.” (Heberle 1945:
112)
And:
“It appears that the Nazis in 1932 had really succeeded the former liberal parties […] as the
preferred party among the small farmers (2-20 ha).” (ibd: 114)
Most important for our objective is the fact that Heberle already discusses in detail which
farm sizes (Heberle 1963: 114) should be considered politically relevant with regard to the
Nazi landslide. He proposes combining the official categories of “small and medium-sized”
farms 2-20 ha, “large peasant farms” from 20-100 ha and “large agricultural enterprises” with
estates of more than 100 ha, as well as very small farms of 2 ha. Note that these categories
closely follow the predefined categories of the Official Statistics, which he considered a
useful, sociologically oriented categorization capturing the agrarian middle classes17.
Loomis/Beegle (1946) extend their analyses to the regions Hanover and Bavaria in order to
vary the confessional context. Like Heberle, they are interested in the analysis of the
17 See also the discussion of these categories by the sociologist Geiger (1932): 30-34.
14
“economic and social structure and the situation of the rural population” (Loomis/Beegle
1946: 729). They come to identical conclusions as Heberle (1934/1963): “Elements of Nazism
became entrenched among those rural middle-class controlled areas whose residents were
suffering most acutely from economic insecurity and anxiety accompanying loss of social
solidarity” (Loomis/Beegle 1946: 725). Like Heberle, they interpret their result as an
indication that the rural middle class affected by economic insecurity was the segment most
likely to vote for the Nazis. A correlation analysis of the July 1932 election demonstrates that
areas characterized by family-sized farms supported the NSDAP to higher degrees. NSDAP
shares correlate highly in all three regions with percentages of farm sizes of the category 2-20
ha, although to a lesser degree in Bavaria. In the case of Schleswig und Hanover, high
correlations are also visible with large farm shares of size 20-100 ha.
In his article “The rise of the NSDAP in Franconia in the elections 1924-1933”, Falter (1986)
extensively investigates the relationship between agrarian structure and the Nazi vote in
Franconia – a region with extremely high vote shares for the NSDAP already in 1920s.
Because some authors considered Franconia a typical case, whereas others declared it a
deviating case, Falter aims to make a systematic comparison of the main explanatory
variables in the Reich as a whole and in Franconia. For Franconia, as for the Reich, Falter
argues that the relation between the size of the agricultural sector and the Nazi shares
correlates18 in Protestant regions since the 1932 elections – contrary to the results of Heberle
(and later Waldman) according to which the rural breakthrough occurred already in 1930.
Even more surprising is the fact that no relationship between mid-sized farms and the Nazi
vote shows up. This may be due to the operationalization of mid-sized farms: Contrary to
18 Using Pearson correlation coefficients and shares of employed persons in the agricultural sector: for
Franconia: all correlations are less than 0.2, for the Reich: correlations in 1932 are 0.21 and 0.22 respectively,
and 0.43 in 1933.
15
Heberle, Loomis and Beegle, Falter combines the following farm sizes: 0-20 ha, 20-50 ha, 50-
100 ha. Relying on a 0-20 ha combination of categories (see table 7 on p. 333), he detects
rather small correlations in Franconia from 1924 to 1930 (.39, .39, .29, .30), turning into
negative correlations in 1932 and 1933 – which runs completely counter to expectations. For
the Reich, all respective correlations are below .20 – in the article as well as in the book (see
1991: 259).19 Partial correlation coefficients for the 0-20 ha category (controlling for shares of
Protestants) turn out to be even highly negative for the 1932 and 1933 election in the article
(1986: 333). Nevertheless, Falter concludes in the article that the hypothesis of the middle
class character of the NSDAP on the countryside can be corroborated – at least since the July
1932 election (Falter 1986: 335). This conclusion is mainly based on the result for the share of
family workers as an indicator of family-based farms (see tables 7a and 7b, p. 333-334). Note,
that in his book, Falter (1991) withdraws his earlier conclusions of the 1986 article by
accentuating the weak correlation between family workers and NSDAP shares.20 Only in
Protestant districts does the share of family workers seem to correlate with Nazi success (see
Falter 1991: 261). In sum, Falter concludes that there was no impact of farm sizes in the
country-wide study (1991: 265). Note also that this far-reaching conclusion is again explicitly
based on the variable “average farm size” (1991: 265). Overall, the country-wide testing of
the different categories of farm sizes (0-20 ha, 20-50 ha. 50-100 ha, and >100 ha) does not
indicate substantial correlations. Remember, however, that Geiger (1932) as well as Heberle
(1934,1945, 1963) provide extensive discussions on why the political mentality of members
of the category 0-2ha – so-called parcel peasants – is completely different from the one of
small and middle-sized holders:
19 Additionally, Falter correlates a variable “average farm size in a district” with the NSDAP vote. Due to
problems of interpreting this variable, we do not report results.
20 See Falter (1991): 258, see also table 7.12 on p. 259 with correlations lower or equal .15.
16
“Farm sizes between 0.5 and 2 ha, are, at least on the country-side, held by day laborers and
laborers for estates. Their income is mainly based on wages, whereas the usage of small
pieces of land is part of this. Farms of this size occur mainly in districts with large estates.
Thus, farm sizes of 0.5 to 2 ha and more than 100 ha are complementary.” (Heberle 1963:
115, translation by the authors)
Falter does not provide an explicit justification for the recombination of farm sizes 0-20 ha.
As a consequence, the relevance of the agrarian middle class for the success of the Nazis is
still an open question. In order to place the discussion into a broader comparative context, we
refer to respective macro-sociological literature on agricultural structure and peasant
movements in the following.
Agricultural Structure and Peasant Political Action: Macro-Sociological Insights
Which social and political conditions made German peasants susceptible to voting for the
Nazis, or more generally for Fascist movements? In many macro-sociological approaches, the
peasantry is attributed a crucial role in the process of modernization, of democratization, of
political crises, and of revolutions (see Moore 1966, Huntington 1968, Taylor 1988, Skocpol
1979). Authors like Hobsbawm (1973), Moore (1966), and Linz (1976) consider the role of
the German peasantry as crucial for the understanding of the take-over of the Nazis and the
abolishment of democracy.
According to Barrington Moore (1966), democratic systems develop only when traditional
peasant production regimes of self-sufficiency become modernized, and the bourgeoisie does
not build alliances with the proprietors of large estates. These coalitions are directed against
the interests of small and middle peasants, and they undermine the emergence of self-
sustaining, not state-centered agricultural markets. The configuration for the road to fascism
in Germany, Italy and Japan entails a coalition of the weak bourgeoisie with the landed upper
17
class.21 It is crucially the landed upper class that impedes the development of working classes
as well as middle classes and their political organization. Authors like Stinchcombe (1961)
and Paige (1975) accentuate the grievances and dependency of smallholder tenants and assess
this stratum as the most susceptible for political rebellions. Contrary, Wolf (1969), Jenkins
(1982) and Taylor (1988) hypothesize that the more rapid and the more encompassing the
process of the commercialization of agrarian products, the higher the probability that peasants
revolt against these processes. They argue that it is especially market-involved peasants with
mid-sized farms, much less than indigent small tenants. According to Wolf (1969), it’s the
“middle peasantry” which is the “tactically mobile peasantry.” The author explains this fact by
the discrepancy between a continuing traditional way of life and, at the same time, the
increasing involvement in and dependence on the market. This discrepancy is most painful for
the middle peasantry.
There are several insightful overviews of the extensive literature on rural stratification and
peasant political behavior (see Linz 1976, Skocpol 1979, Jenkins 1982, Lichbach 1994). They
focus on the economic and social conditions of conventional and unconventional peasant
political behavior, i.e. on the behaviorally relevant incentives of different rural strata. A
continuous debate relates to the question of whether deprivation and class relations lead to
quasi-spontaneous self-organization, or whether mobilization by organizational entrepreneurs
(see Migdal 1974, Popkin 1979, Jenkins 1982, Lichbach 1994) causally precedes peasants’
movements. Meanwhile, it seems to be acknowledged that the organization of peasant
behavior is a necessary intermediate factor in order to overcome collective action problems
(see Lichbach 1994).
21 See Landmann (2008): 115, 117 et passim, for an overview.
18
For his comparative endeavor in assessing the relevance of rural social stratification to voting
behavior, Linz (1976: 368-369) builds on the fundamental, complex typology of Sorokin et al.
(1930: 360-370). Sorokin proposed the following criteria: a) property versus tenancy versus
hired laborers, b) the size of farms, c) the (non-)market orientation of the farms (self-
sufficient consumption versus profit-making), d) family work or inclusion of hired labor, and
d) the value of the soil and investments.22 According to Linz, the rural stratum most
susceptible to fascism are so-called “proprietors of farmer-capitalist agricultural enterprises”
(Linz 1976: 375). They are highly market-oriented and therefore politically sensitive to
economic crises and government policies. As long as they rely on non-family hired workforce,
they are also hostile to socialist and communist parties. Contrary to consumptive or
subsistence peasants, they have no loyalties to traditional parties: “The political alternatives
likely to appeal to these strata are: various centrist and undefined forces; all kinds of
liberalism at the end of the century; conservative-nationalistic, anticlerical-conservative,
peasant ideologies of various kinds; nontraditional ‘democratic’ conservative
authoritarianism; Bonapartism, Boulangism, and the like; and finally, in the thirties, fascism.”
(Linz 1976: 376).23 This aligns with Heberle’s assessment that the transition from liberal
parties to the NSDAP was due to “increasing economic insecurity rather than actual suffering
22 Sorokin et al. combine these criteria in order to propose a differentiated hierarchy of agrarian social
stratification. Linz (1976) builds extensively on this typology and tests its usefulness for the understanding of
rural voting behavior in Europe. He distinguishes mainly “proprietors of large, latifundium-type agricultural
enterprises” (p. 370), “proprietors of smaller capitalist agricultural enterprises” (p. 373), “managers or tenants
of large capitalist enterprises” (p. 375), “proprietors of farmer-capitalist agricultural enterprises” (p. 375),
“proprietors of peasant consumptive enterprises” (the subsistence farmer) (p. 383), small “tenants” (p. 402),
and “farm laborers” (p. 412).
23 For a similar argument see Lipsets (1950) work on the development of a mass socialist movement in
Saskatchewan.
19
from agricultural depression.” (Heberle 1946: 104). As the traditional “supply parties”, i.e.
conservative as well as bourgeois parties, were more and more dominated by industrial
bourgeoisie and large land owners, the insecure proto-capitalist peasants became politically
volatile.24
The crucial phase in the transition to modernity begins when peasants are confronted with the
challenges of the commercialization of their products. In his comparative analysis of agrarian
movements in Europe 1850-1940, Urwin (1980) demonstrates in detail the “interconnection
between agrarian structure, socio-economic change and political activity” (Urwin 1980: 12).
The causes for the numerous agrarian movements in this period are rooted in the rapid
acceleration of industrialization suddenly questioning the status of agriculture as the primary
mode of production. The peasantry was confronted with the implications of transnational
trade flows as well as with the consequences of urbanization and democratization. Thus, it
was forced to defend its influence on the political market. However, the foundation and
especially: the institutionalization of peasant parties has been rather the exception.25 This
implies that peasants have been forced to seek alternative voice and exit options.
The pressure put on the peasantry by the expansiveness of the international agrarian market
manifests itself in tariff policies leading to a sharp antagonism between cities and the
countryside. The overall decline of the agricultural sector accelerated after 1918 and induced a
new era of peasant mobilization: “In most of Western European countries, the most significant
rural break-through since the beginning of mass politics occurred in the late 1920s and early
1930s: Norway and Sweden are by no means exceptional in this respect. The most dramatic
instances of a sharp upsurge occurred in Germany” (Urwin 1980: 129, see also Osmond
24 In his analysis of Rexism in Belgium, Brustein (1988) corroborates these insights.
25 See Mackie/Rose (1988), and the ex-post-predictions by Lipset/Rokkan (1967).
20
1982). The causes have been the modernization of agriculture and of the food economy, the
creation and restructuring of national and international agrarian markets as well as the
contradiction between expanding industrial sector and agricultural sector. As countries in
Latin America became producers for the world market, a profound change of the existing
agro-economic and social structure occurred which culminated in a world agrarian crisis.26
European fascism was one of its beneficiaries (see Urwin 1980: 81, see also Osmond 1982).
Urwin refers to the success of the Nazis in Bavaria, Hessie, to Rexism in Belgium (see also
Brustein 1988) and the Quisling in Norway as well as to diverse agro-fascist movements in
Eastern Europe (Urwin 1980: 182). The anti-system potential of peasants was always
unleashed “...whenever the agrarian parties failed to react to the current economic programs
of the peasantry” (Urwin 1980: 182).
Hypotheses
This short overview on the role of the peasantry, and especially of specific strata within the
highly diversified agricultural status hierarchy refers to macrosociological debates. Some of
these studies derive their conclusions from developing countries (e.g. Migdal 1974, Paige
1975, Wolf 1969, Popkin 1979 ). However, they detect general social incentives that can be
now tested for our case. First, there is a still unresolved debate as to whether parcel peasants
(small tenants) and farm laborers (e.g, Stinchcombe 1961 Paige 1975), or instead medium-
sized farms (e.g. Wolf 1969, Jenkins 1982, Taylor 1988) are more susceptible to discontent
and anti-system movements. More specifically, with regard to the electoral success of the
Nazis, the question remains whether they were heavily supported by mid-sized farms (Heberle
1934/1963, 1946, Loomis/Beegle 1946, Linz 1976), or whether parcel peasants and farm
26 For the relevance of external developments to internal unrest, see Skocpol (1979).
21
laborers supported the Nazis to the same degree as mid-sized farms (as implied by Falter
1986, 1991), and whether there was no separate impact of different rural strata at all (Falter
1991). Therefore, the following hypotheses can be formulated:
Hypothesis 1 (Heberle 1934/1963, 1946, Loomis/Beegle 1946, Linz 1976 etc.)
The higher the share of mid-sized peasants (5-20 ha), the higher the vote shares of the
NSDAP.
Hypothesis 2: (Heberle 1934/1963, 1946, Loomis/Beegle 1946, Linz 1976 etc.)
The higher the share of parcel peasants (0-2 ha), the lower the vote shares of the NSDAP.
Hypothesis 3a (Falter 1986, 1991):
The relationship between the share of parcel peasants (0-2 ha), small-sized peasants (2-5 ha),
mid-sized peasants (5-20 ha) and the vote shares of the NSDAP is identical.
Hypothesis 3b (Falter 1986, 1991):
There is no relation between the composite stratum (0-20 ha) with the electoral results of the
NSDAP.
In line with the conclusions of Heberle (1934), Geiger (1932), Loomis/Beegle (1946) and
Linz (1976), we expect mid-size farmers (5-20 ha) to have been especially vulnerable to the
campaign of the NSDAP. Due to its specific structural economic position, this stratum was
generally more politically instable as it had no long-term loyalties towards mainstream parties
in the established German cleavage structure. Contrary, the organizational entrepreneurs for
farm laborers and parcel peasants were the established Social-Democratic Party (SPD), and
the Communist Party (KPD). The political representation of the proprietors of farmer-
capitalist agricultural enterprises until the agricultural crisis was mainly organized by the
Protestant Conservative Party (DNVP), and the Catholic Parties (Center Party, Bavarian
People’s Party, Bavarian Peasants’ Alliance). Inspired by mass theories, Waldman (1973)
22
argued that Protestant voters in general and Protestant peasants were socially disintegrated,
and therefore concluded: “…that religion intervened between strain and the political reaction
to it, that is that Protestants reacted differently to strain than did Catholics.” (Waldman 1973:
94). As a consequence, he expects a “continuum of Nazi voters” (1973: 123), and specified
this hypothesis as an additional interaction term between the share of Protestants and the share
of workforce in the agricultural sector. We would like to adjust this hypothesis to our
incentive-based approach: In the case of the Protestant party, Conservative Party (DNVP),
there was an inherent conflict of interest because this party was predominantly led by elites of
the large Eastern Protestant estates. The secession of the small Protestant agrarian Christlich-
Nationale Bauern- und Landvolkpartei (CNBV) in 1928 actually did not overcome the
domination by these elites. These organizational efforts to unify the Protestant small- and
medium-sized peasants failed, and the party proved to be a flash party, which was completely
absorbed in the 1932 elections by the NSDAP. In the Catholic peasant camp, there were also
efforts in 1928 to expand the Bavarian Peasants Association to the Reich by founding the
German Peasants Party. However, this attempt failed from the beginning. As the original
Catholic “supply” parties were mainly directed by elites traditionally oriented towards small
and mid-sized farm tenants, we expect the flows of mid-sized peasants towards the Nazi party
to be smaller in the Catholic rural districts of the Reich. Thus, economic heterogeneity along
confessional lines played indeed a central role (see King et al. 2008). However, in our view,
the main causal reason for the interactive effect of Protestantism and agriculture (see
Waldman 1973, Falter 1991) is the organizational failure of the agricultural interest mediation
of small and mid-sized farms in the case of Protestant-affiliated parties. Bringing our
hypotheses on rural segments and the organizational efforts of political elites together, we
reformulate the Waldman (1973) conjecture as follows:
23
Hypothesis 4 (Waldman 1973):
There is an interaction effect between the share of mid-sized peasants (5-20 ha) and the share
of Protestants: The positive association between the share of mid-sized peasants and vote
shares of the NSDAP increases with the share of Protestants.
Data and Operationalization
In the following, we use election data for eight elections (1924-1933) in the Weimar Republic
as provided by Falter.27 This data set also includes extensive socio-demographic variables,
mainly based on census data for the years 1925 and 1933.28 In addition to the already
available number of employees in the agricultural sector in 1925 and 1933, we had to collect
ourselves information with regard to rural stratification. Borrowing from the census data from
1925,29 we put together data for the respective workforce of different farm sizes. We
maintained the original categories of parcel farmers (0-2 ha), small farmers (2-5 ha), middle
farmers (5-20 ha), large farmers (20- 100 ha), and large estate farmers with more than 100 ha.
In order to provide results as comparable as possible with Falter (1986, 1991), we also control
for shares of Protestants, the degree of urbanization and the share of unemployed. With regard
to socio-demographic data, we rely mainly on the 1925 census. For the unemployment rate,
we use the 1933 census for the last group of elections (1932-1933). To account for potential
existing spatial effects, a regional indicator variable is used. This variable divides the Weimar
Republic into 23 regions, primarily the provinces of Prussia and the smaller federal states,
while some of the smallest German states are considered one region. A detailed list of the
variables and regions is part of the appendix.
27 Source Gesis, ZA8013.
28 For a detailed overview see: Hanisch (1989).
29 Statistik des Deutschen Reichs (1929).
24
The share of the NSDAP vote is our dependent variable. Percentages are based on the number
of those being entitled to vote. In order to visualize the electoral geography of the Nazis (see
O’Loughlin et al. 1994, O’Loughlin 2002) and the spatial distribution of our key variable –
the spread of mid-sized farms – we created a digital map of the Weimar Republic including all
our districts.30
Like King et al. (2008) and Falter (1991), we apply the following models at the district level
(Kreise). Changes of the boundaries of districts over time, i.e. the complete or partial fusion of
two districts, necessitated the merging of some of the districts. For the analysis, information
for 849 districts will be available. Thus, a comparison with the results of Falter is possible.31
Naturally, we fitted models for every individual election in the period 1924 to 1933. However,
we also performed the analysis for four election groups, consisting of the two elections in
1924, the election in 1928, the election in 1930, and the last three elections in the period from
1932-1933, respectively. As groups of elections exhibit practically identical results,32 we
present only results for these groups of elections in this article.
Statistical Model
Contrary to the objectives of King et al. (2008), i.e. applying advanced techniques of
ecological inference, and of O’Loughlin (2002), i.e. applying advanced exploratory tools of
spatial data analysis to the Nazi phenomenon, we are following two different methodical
strategies:
30 Based on a map in: Statistik des Deutschen Reichs (1929).
31 Contrary, King et al. base their analysis on 681 districts, see King et al. (2008: 967).
32 See results in the online appendix – figure 23.
25
1. We will provide the first critical test of whether districts characterized by mid-sized
farms (5-20 ha) have been prone to Nazi propaganda to a higher degree than districts
characterized by other farm sizes. As the only country-wide test by Falter (1986, 1991)
used a “composite” variable (0-20 ha), we are the first to separate the impact of
different rural strata on the Nazi vote.
2. We will apply for the first time advanced generalized additive models (GAM) to the
ecological analysis of the Nazi vote.
In this article, we do not intended to perform any ecological inference, i.e. to draw direct
conclusions from the aggregate level to the individual level. Thus, the estimated effects will
only show whether and how the shares of mid-sized peasants in the districts covary with the
electoral outcome of the NSDAP.
For the analysis of the interesting relationship, a generalized additive model (GAM) will be
used.33 This statistical approach has the advantage that no restrictive prior assumptions with
regard to the relationship between the covariables and the response have to be made. The
relationship is calculated as a smooth function with the exact form defined by the data. We
used this nonparametric approach34, which allows us a flexible estimation of smooth functions
s() for all metric covariables. For the estimation, we use penalized splines.35 Due to the large
33 GAMs were originally proposed by Hastie and Tibshrani (1986). Meanwhile, this technique is implemented
in widely used statistical software solutions - see Wood (2006), Belitz et al. (2009). The number of social
science applications is increasing, see Beck and Jackman (1998). A useful recent overview is provided by
Andersen (2009), Keele (2008).
34 For introduction to nonparametric regression see Fox (2000a/2000b), Keele (2008), chapter 7 of Fahrmeir,
Kneib and Lang (2007).
35 For detailed explanations, see Eilers and Marx (1996) and Ruppert, Wand and Carroll (2003).
26
number of covariables, a restrictive number of knots is used36. Models were fitted by applying
the empirical Bayesian approach implemented in BayesX37. This approach uses the mixed
model representation of generalized additive models.38 From this family of models, we used
the general additive logistic regression model adjusted for overdispersion. For the comparison
of models we use the generalized cross validation score (GCV).39 For each of the four
election groups or the considered elections, one model was fitted. They are of the following
form:
(1)
πi is the proportion of NSDAP voters in district i. β0 is the global intercept. If the election
group consists of more than one election, additional election parameter(s) βelect are added to
the model formula. The spatial part consisting of the regional indicator variable is represented
by βr,i. Smooth functions are estimated for all metric control variables. Terms in squared
brackets are not included in all models. The main model consists of the percentage of
Protestants, the share of parcel peasants (0-2 ha), the share of small peasants (2-5 ha), the
share of middle peasants (5-20 ha) and the share of large farmers (20-100 ha), percentages of
workers, workers in industry and handcraft, and the urbanization level. The 1933
unemployment rate is exclusively considered in the models of election group 1932-1933.
36 Five knots were chosen. Thus, an acceptable data-to-degree-of-freedom ratio higher than 1 to 10 can be
preserved.
37 Belitz et al.(2009).
38 Fahrmeir, Kneib and Lang (2004).
39 Craven and Wahba (1979).
27
As the relationship (sB5-20ha(xB5-20ha)) turned out to be nearly linear, additional models with
linear middle farmer components (βB5-20ha) for the elections 1930-1933 are also provided. The
test of hypothesis 4 requires a different approach: To estimate the possible changing effect of
the middle farmer percentage depending on the percentage of Protestants, a varying
coefficients (βB5-20ha (xProt)) approach (Hastie/Tibshirani 1993) is chosen. Again, a smooth
functional relationship between the βB5-20ha and the percentage of Protestants is specified, and
given the estimated function for each xProt, a separate βB5-20ha can be extracted from the model.
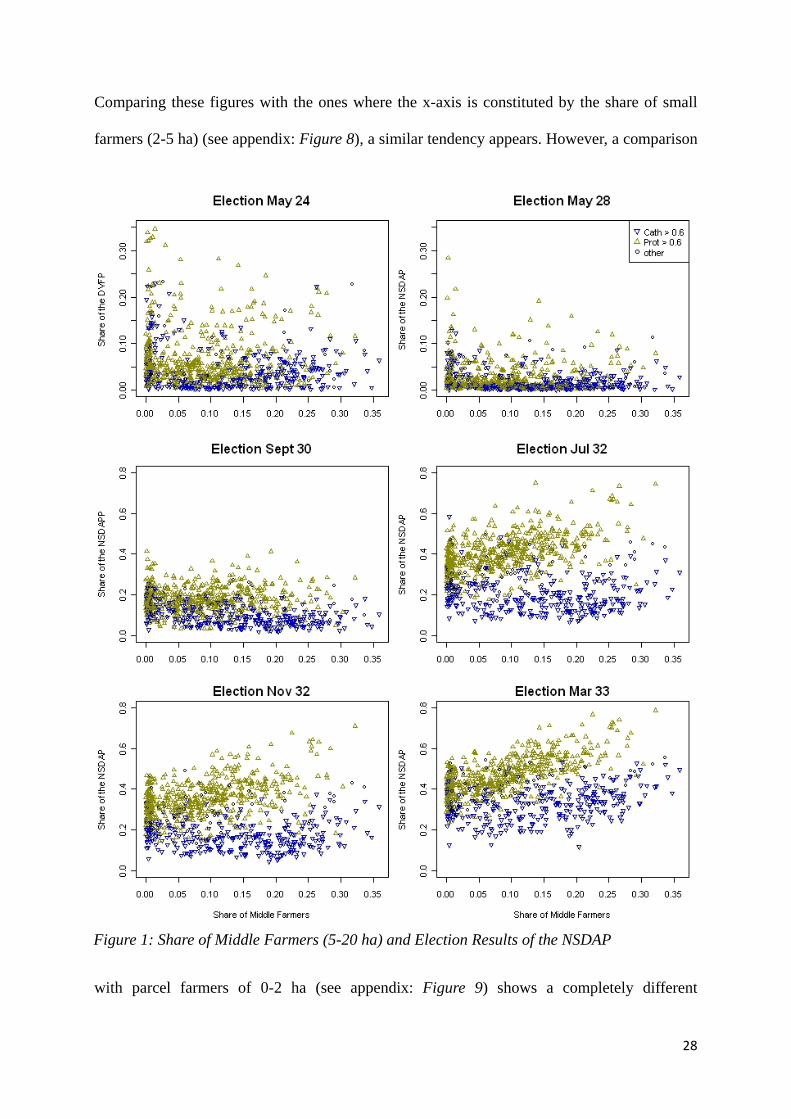
Descriptive Analysis
In order to get a first impression whether there is any covariation between our main variables,
i.e. between the share of farmers with mid-sized farms (5-20 ha), and the shares of the
NSDAP in the respective elections, Figure 1 shows the respective scatterplots. There is no
detectable pattern in the period from 1924 to 1930. In the 1924 and 1928 election, it seems
instead that the NSDAP gets higher vote shares in districts with low percentages of mid-sized
farms. This is the period when the Nazis had their strongholds in the cities instead. In the
September 1930 election, this pattern turns into a clear non-relation, indicating that the urban-
to-rural realignment (Waldman 1973) is clearly under way, but in no way yet complete. Note
however, the different scaling of the y-axis, which is due to the enormous growth of this party
already in this election. The expected relation becomes visible for the first time in the July
1932 elections. In order to explore whether there is indeed an interaction effect between high
shares Protestants and (these) rural segments (Waldman 1973), we colored cases according to
their dominant confessional affiliation. Actually, it turns out that the two groups already start
to separate in the 1930 election. This tendency steadily sharpens until the final 1933 election.
A nearly monotonically increasing functional form of the Catholic cloud, however, becomes
obvious only in this last election.
28
Comparing these figures with the ones where the x-axis is constituted by the share of small
farmers (2-5 ha) (see appendix: Figure 8), a similar tendency appears. However, a comparison
with parcel farmers of 0-2 ha (see appendix: Figure 9) shows a completely different
Figure 1: Share of Middle Farmers (5-20 ha) and Election Results of the NSDAP
29
development. This may be a first indication that a combination of 0-20 ha is not appropriate
due to behaviorally different populations.
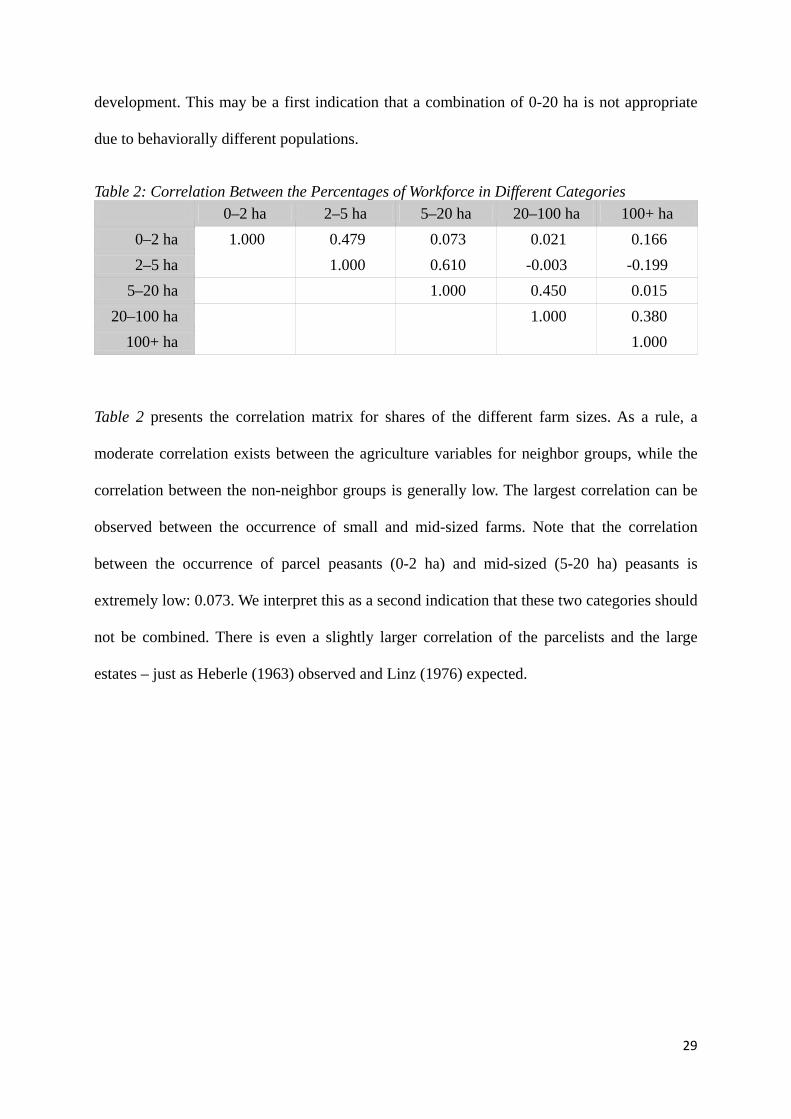
Table 2: Correlation Between the Percentages of Workforce in Different Categories 0–2 ha 2–5 ha 5–20 ha 20–100 ha 100+ ha
0–2 ha 1.000 0.479 0.073 0.021 0.166 2–5 ha 1.000 0.610 -0.003 -0.199
5–20 ha 1.000 0.450 0.015 20–100 ha 1.000 0.380
100+ ha 1.000
Table 2 presents the correlation matrix for shares of the different farm sizes. As a rule, a
moderate correlation exists between the agriculture variables for neighbor groups, while the
correlation between the non-neighbor groups is generally low. The largest correlation can be
observed between the occurrence of small and mid-sized farms. Note that the correlation
between the occurrence of parcel peasants (0-2 ha) and mid-sized (5-20 ha) peasants is
extremely low: 0.073. We interpret this as a second indication that these two categories should
not be combined. There is even a slightly larger correlation of the parcelists and the large
estates – just as Heberle (1963) observed and Linz (1976) expected.
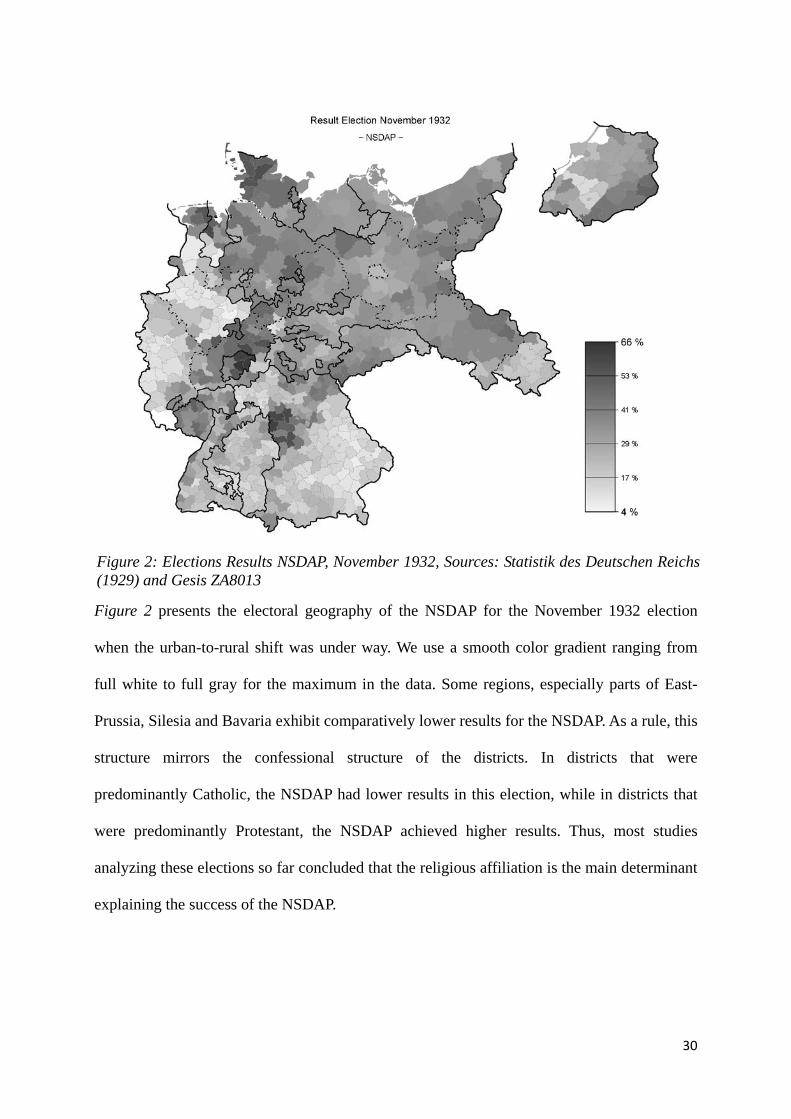
30
Figure 2 presents the electoral geography of the NSDAP for the November 1932 election
when the urban-to-rural shift was under way. We use a smooth color gradient ranging from
full white to full gray for the maximum in the data. Some regions, especially parts of East-
Prussia, Silesia and Bavaria exhibit comparatively lower results for the NSDAP. As a rule, this
structure mirrors the confessional structure of the districts. In districts that were
predominantly Catholic, the NSDAP had lower results in this election, while in districts that
were predominantly Protestant, the NSDAP achieved higher results. Thus, most studies
analyzing these elections so far concluded that the religious affiliation is the main determinant
explaining the success of the NSDAP.
Figure 2: Elections Results NSDAP, November 1932, Sources: Statistik des Deutschen Reichs (1929) and Gesis ZA8013
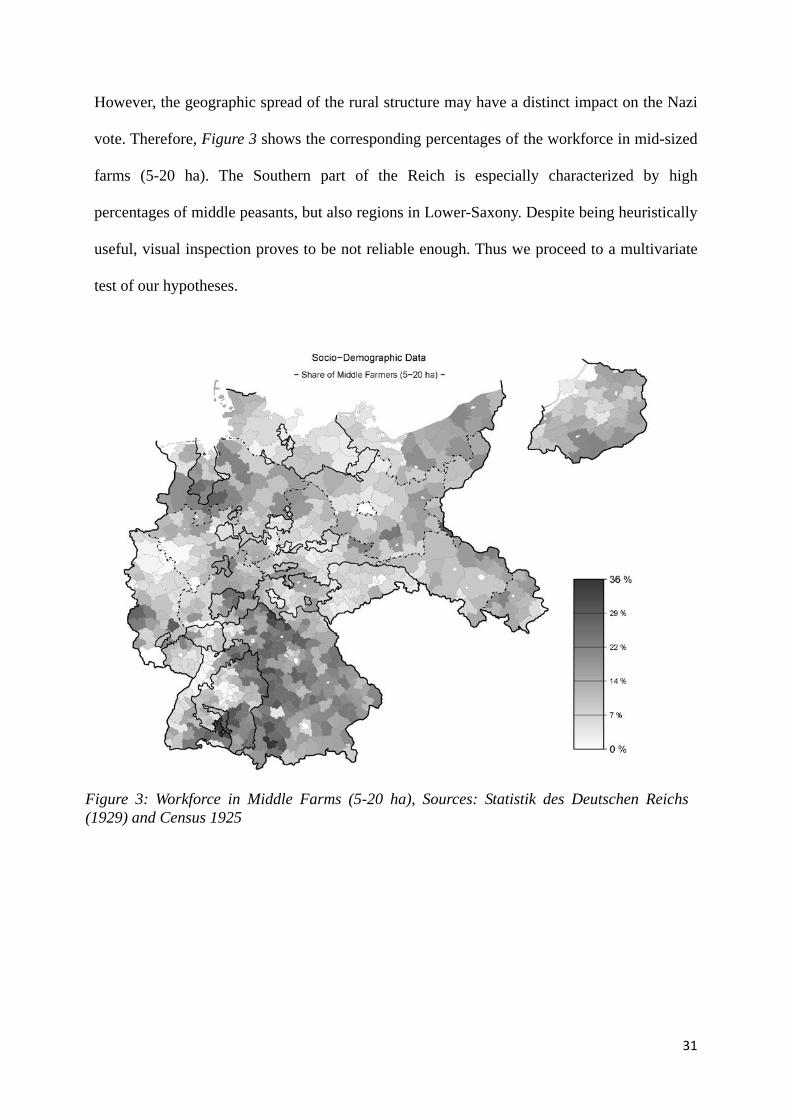
31
However, the geographic spread of the rural structure may have a distinct impact on the Nazi
vote. Therefore, Figure 3 shows the corresponding percentages of the workforce in mid-sized
farms (5-20 ha). The Southern part of the Reich is especially characterized by high
percentages of middle peasants, but also regions in Lower-Saxony. Despite being heuristically
useful, visual inspection proves to be not reliable enough. Thus we proceed to a multivariate
test of our hypotheses.
Figure 3: Workforce in Middle Farms (5-20 ha), Sources: Statistik des Deutschen Reichs (1929) and Census 1925
32
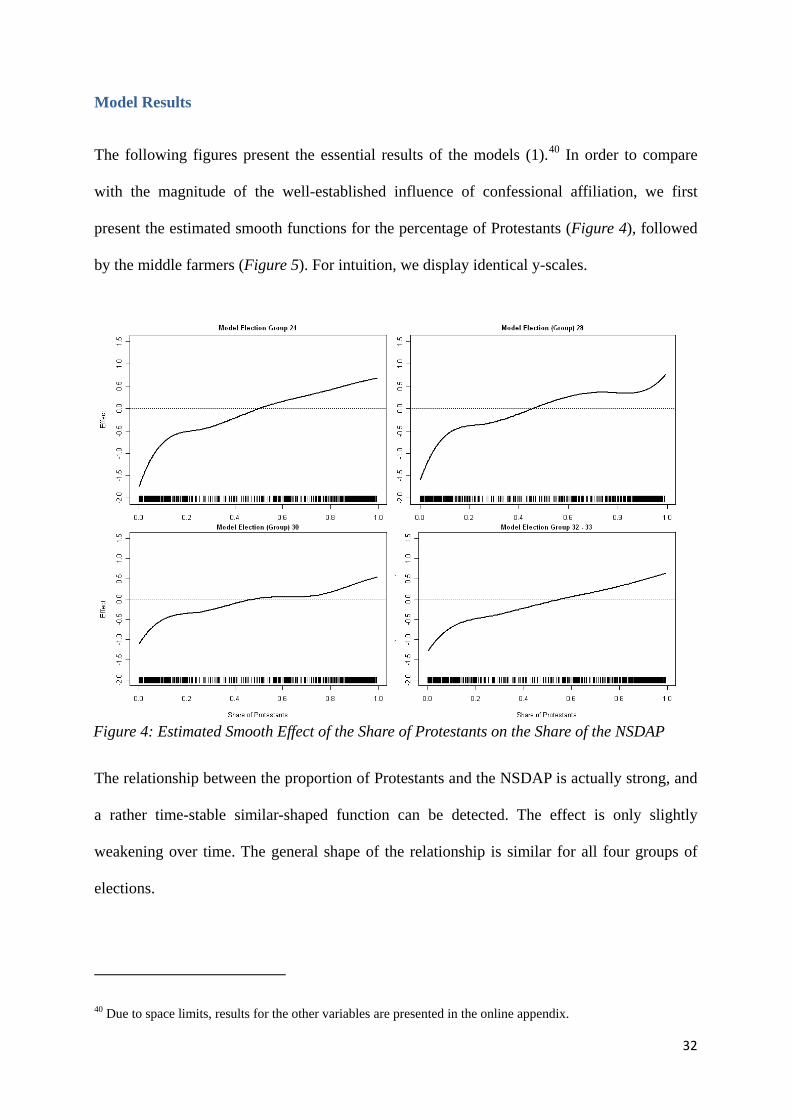
Model Results
The following figures present the essential results of the models (1).40 In order to compare
with the magnitude of the well-established influence of confessional affiliation, we first
present the estimated smooth functions for the percentage of Protestants (Figure 4), followed
by the middle farmers (Figure 5). For intuition, we display identical y-scales.
The relationship between the proportion of Protestants and the NSDAP is actually strong, and
a rather time-stable similar-shaped function can be detected. The effect is only slightly
weakening over time. The general shape of the relationship is similar for all four groups of
elections.
40 Due to space limits, results for the other variables are presented in the online appendix.
Figure 4: Estimated Smooth Effect of the Share of Protestants on the Share of the NSDAP
33
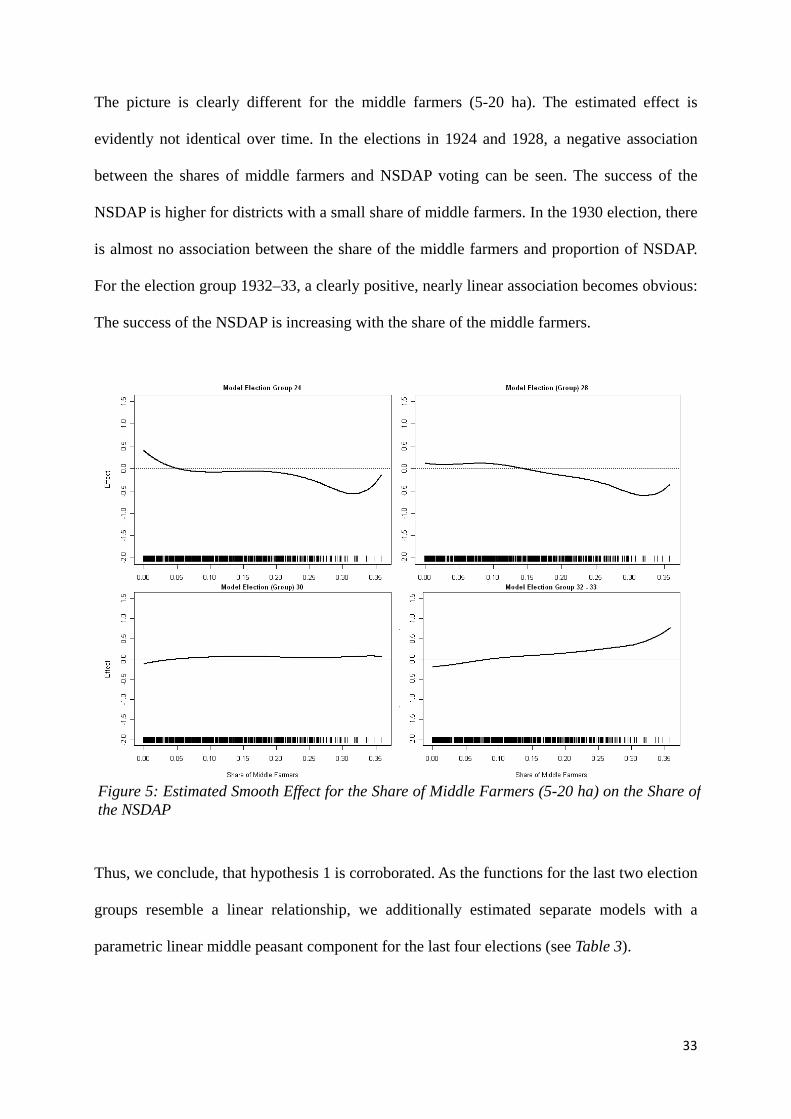
The picture is clearly different for the middle farmers (5-20 ha). The estimated effect is
evidently not identical over time. In the elections in 1924 and 1928, a negative association
between the shares of middle farmers and NSDAP voting can be seen. The success of the
NSDAP is higher for districts with a small share of middle farmers. In the 1930 election, there
is almost no association between the share of the middle farmers and proportion of NSDAP.
For the election group 1932–33, a clearly positive, nearly linear association becomes obvious:
The success of the NSDAP is increasing with the share of the middle farmers.
Thus, we conclude, that hypothesis 1 is corroborated. As the functions for the last two election
groups resemble a linear relationship, we additionally estimated separate models with a
parametric linear middle peasant component for the last four elections (see Table 3).
Figure 5: Estimated Smooth Effect for the Share of Middle Farmers (5-20 ha) on the Share of the NSDAP

34
Table 3: Estimated Parameters for Middle Peasant Shares (Excerpt of the Full Models) Election Point estimate 95 % - Credibility Interval Sept 1930 0.258 -0.747 1.264 July 1932 1.544 0.819 2.268 Nov 1932 1.817 1.015 2.620 Mar 1933 1.696 1.024 2.369
The estimation provides an unambigous positive coefficient, where the size changes from
September 1930 to July 1932 by a factor of approximately 6. We consider two fictional
districts, which only differ in their middle farmer share to elucidate the estimated effect. We
assume that district 1 has 0% and the district 2 has 30% middle farmers. Using the coefficient
of June 1932, i.e. the value of 1.544, the odds for the NSDAP shares are 1.59 times higher for
district 2. If district 1 would have a NSDAP share of 20%, we expect a share of 28 in district
2. In sum, we conclude that hypothesis 1 is corroborated - non-parametrically as well as
parametrically.
What about hypotheses 2 and 3a? According to our estimation results (see appendix, Figure
11 and Figure 12), neither small farmers (2-5 ha) nor parcel peasants (0-2 ha) exhibit the same
relationship as the middle farmers. Whereas for the small farmers a similar negative
relationship can be identified for the 1924 and 1928 election, no relationship can be detected
for the last two election groups 1930 and 1932-1933. Instead, the estimated function for the
parcel farmers even reveals a small positive relationship for the first three election groups.
However, there is no effect for the election group 1932-1933. Therefore, we conclude, that
hypotheses 2 and 3a have to be refuted.
35
The Experimentum Crucis: Is Combining Farm Sizes 0-20 ha Appropriate?
In the so far sole country-wide study which investigates the hypothesis of a middle peasant
impact, Falter (1986, 1991) combined – without theoretical justification – the categories of the
Official Statistics of the German Reich for parcel peasants (0-2 ha), small peasants (2-5 ha)
and middle peasants (5-20 ha). We already presented several findings that indirectly
contradicted this research strategy and, thus, question the far-reaching conclusion according to
which there was no middle-stratum-related voting behavior on the countryside. A conclusion
that actually constituted a revision of the important results of Heberle (1934/1963, 1946),
Loomis/Beegle (1946) and many other scientists. In order to show that the combination of
these categories was inappropriate, we specify exactly this composite variable (0-20 ha) with
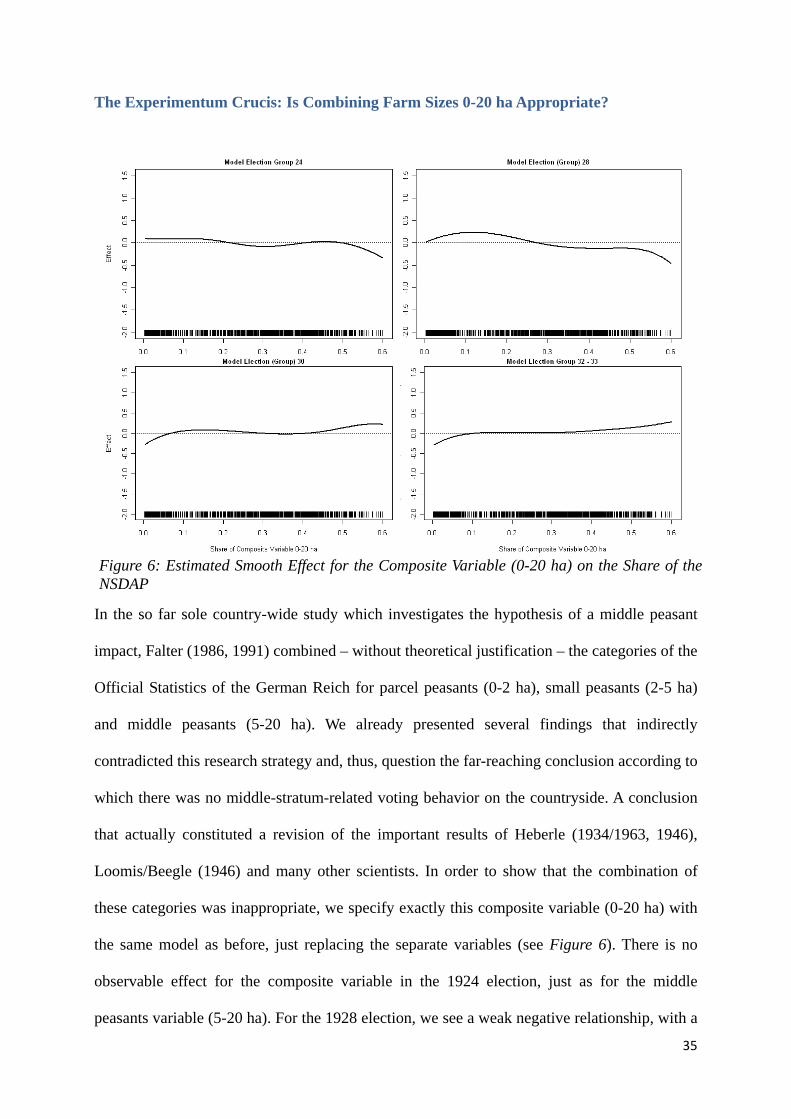
the same model as before, just replacing the separate variables (see Figure 6). There is no
observable effect for the composite variable in the 1924 election, just as for the middle
peasants variable (5-20 ha). For the 1928 election, we see a weak negative relationship, with a
Figure 6: Estimated Smooth Effect for the Composite Variable (0-20 ha) on the Share of the NSDAP
36
local maximum at 12-14 percent. For the 1930 election, the estimated function is a flat line.
Most importantly, for the elections 1932-33, only a minor positive effect is visible, mainly for
percentages of the composite variable mid-sized farmers higher than 50 percent. A
comparison of the strength of the estimated effect shows that the combined consideration
reduces a clear positive effect to a non-effect. We conclude, therefore, that hypothesis 3b
cannot be refuted. In conjunction with our results for hypotheses 1, 2 and 3a, we deduce that
the measurement of middle peasants via a composite variable (0-20 ha) is inappropriate.
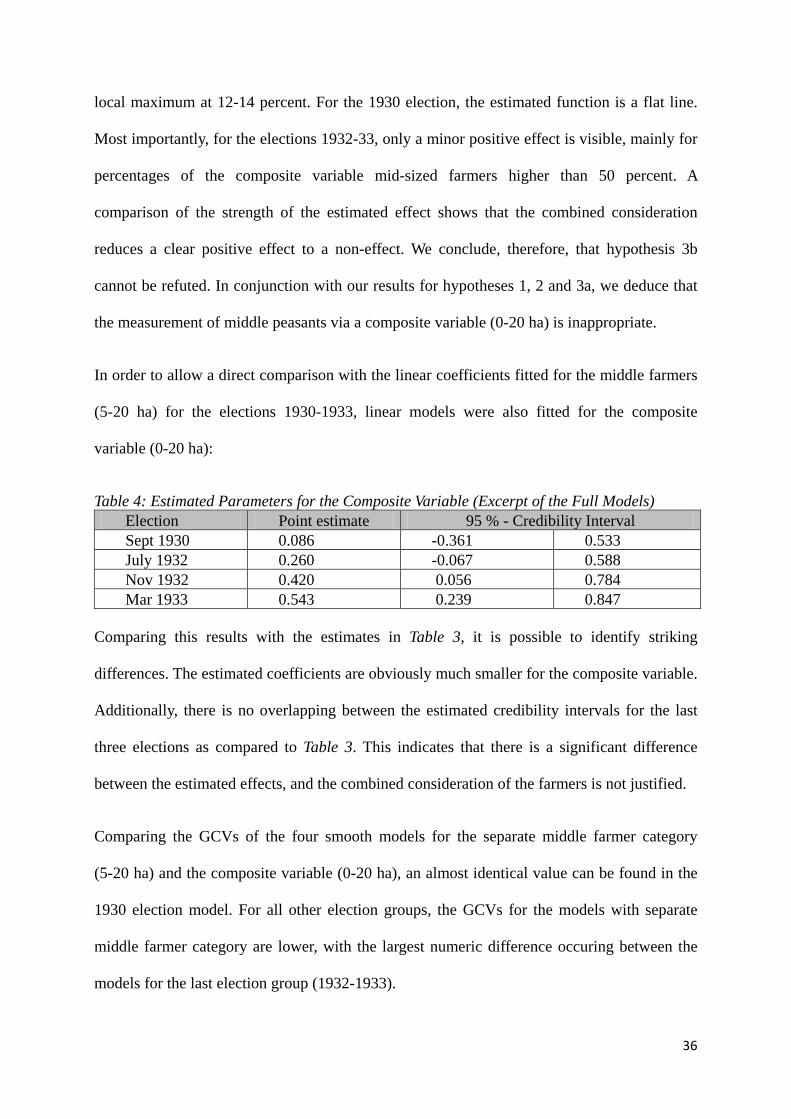
In order to allow a direct comparison with the linear coefficients fitted for the middle farmers
(5-20 ha) for the elections 1930-1933, linear models were also fitted for the composite
variable (0-20 ha):
Table 4: Estimated Parameters for the Composite Variable (Excerpt of the Full Models) Election Point estimate 95 % - Credibility Interval Sept 1930 0.086 -0.361 0.533 July 1932 0.260 -0.067 0.588 Nov 1932 0.420 0.056 0.784 Mar 1933 0.543 0.239 0.847
Comparing this results with the estimates in Table 3, it is possible to identify striking
differences. The estimated coefficients are obviously much smaller for the composite variable.
Additionally, there is no overlapping between the estimated credibility intervals for the last
three elections as compared to Table 3. This indicates that there is a significant difference
between the estimated effects, and the combined consideration of the farmers is not justified.
Comparing the GCVs of the four smooth models for the separate middle farmer category
(5-20 ha) and the composite variable (0-20 ha), an almost identical value can be found in the
1930 election model. For all other election groups, the GCVs for the models with separate
middle farmer category are lower, with the largest numeric difference occuring between the
models for the last election group (1932-1933).
37
In addition to the model with separate specification of middle peasants (5-20 ha), we also
examined whether the combination of small and middle farmers into one group (2-20 ha)
changes the result. Note, that this resembles the strategy of Heberle (1934/1963, 1946) and
Loomis/Beegle (1946). We diagnose only minor differences as compared to the exclusive
specification of the middle peasants (5-20). Based on the separate estimation results for the
small farmers (2-5 ha) (see appendix) which shows almost no effect for the elections
1930-1933, we conclude that a separate specification of middle peasants (5-20) is most
appropriate.
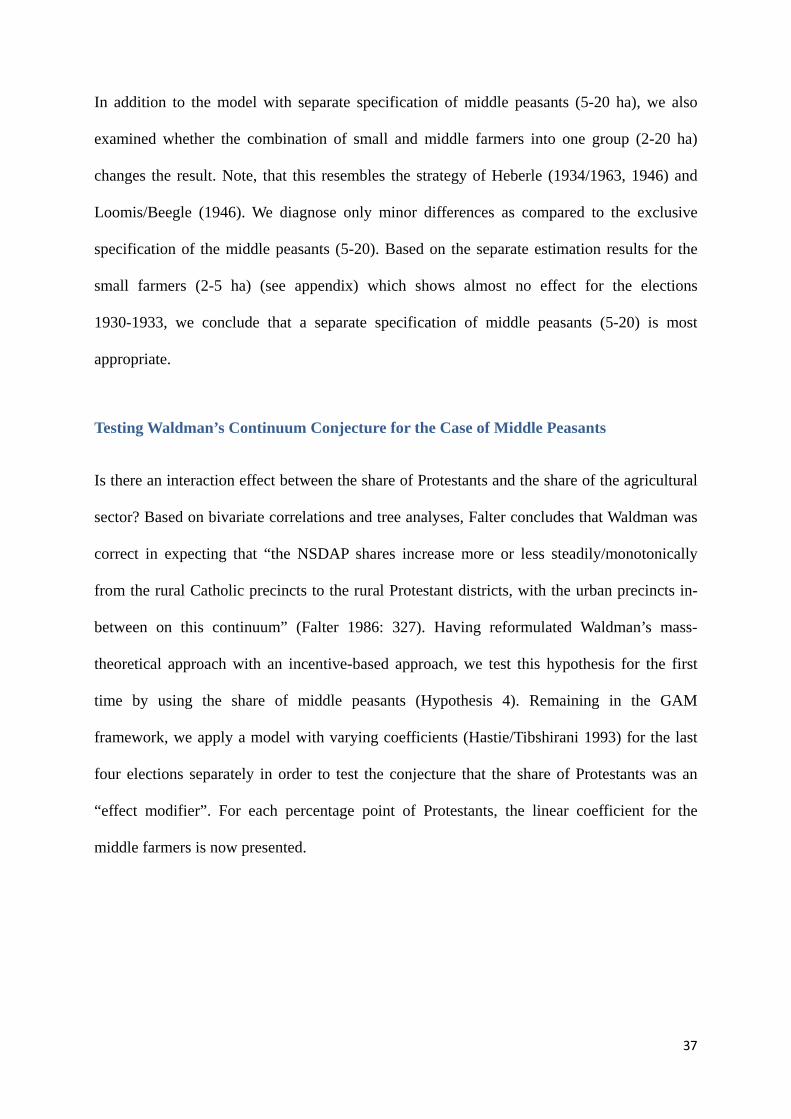
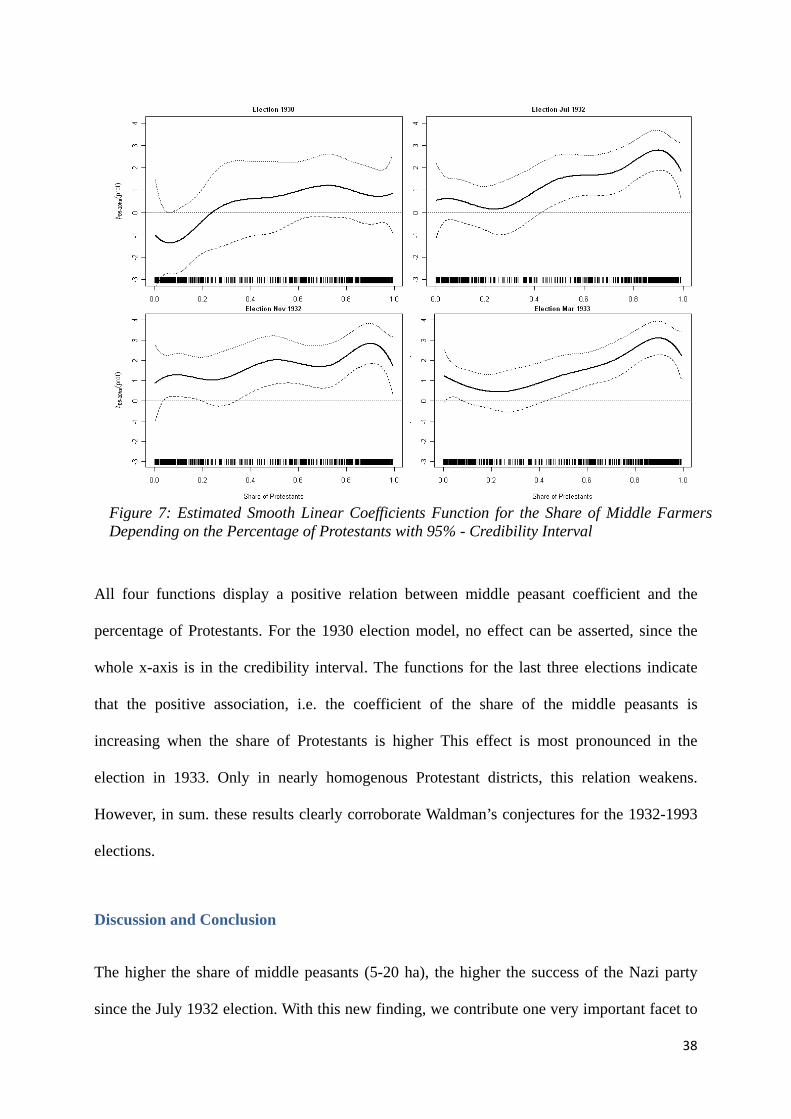
Testing Waldman’s Continuum Conjecture for the Case of Middle Peasants
Is there an interaction effect between the share of Protestants and the share of the agricultural
sector? Based on bivariate correlations and tree analyses, Falter concludes that Waldman was
correct in expecting that “the NSDAP shares increase more or less steadily/monotonically
from the rural Catholic precincts to the rural Protestant districts, with the urban precincts in-
between on this continuum” (Falter 1986: 327). Having reformulated Waldman’s mass-
theoretical approach with an incentive-based approach, we test this hypothesis for the first
time by using the share of middle peasants (Hypothesis 4). Remaining in the GAM
framework, we apply a model with varying coefficients (Hastie/Tibshirani 1993) for the last
four elections separately in order to test the conjecture that the share of Protestants was an
“effect modifier”. For each percentage point of Protestants, the linear coefficient for the
middle farmers is now presented.
38
All four functions display a positive relation between middle peasant coefficient and the
percentage of Protestants. For the 1930 election model, no effect can be asserted, since the
whole x-axis is in the credibility interval. The functions for the last three elections indicate
that the positive association, i.e. the coefficient of the share of the middle peasants is
increasing when the share of Protestants is higher This effect is most pronounced in the
election in 1933. Only in nearly homogenous Protestant districts, this relation weakens.
However, in sum. these results clearly corroborate Waldman’s conjectures for the 1932-1993
elections.
Discussion and Conclusion
The higher the share of middle peasants (5-20 ha), the higher the success of the Nazi party
since the July 1932 election. With this new finding, we contribute one very important facet to
Figure 7: Estimated Smooth Linear Coefficients Function for the Share of Middle Farmers Depending on the Percentage of Protestants with 95% - Credibility Interval
39
the understanding of the electoral success of the NSDAP: The swing towards the NSDAP in
the 1930s had a rural basis, and it was more pronounced in districts with higher proportions of
agrarian middle classes. Surprisingly, this is the first statistical analysis ever to test this
specific relationship for the whole country with district (Kreise) data. We have argued and
finally empirically substantiated with new, original data that the hitherto only existing
(non-)results of Falter (1986, 1991) are inconclusive – due to a non-justified recombination
(0-20 ha) of the original categories of the official statistics. Based on our results, we contest,
just like King et al. (2008), the theoretical perspective that the NSDAP has been a “catch-all-
party of protest” attracting similarly from all social segments. Our results are in line with
previous results for selected regions, e.g. by Heberle (1946, 1963) and Loomis/Beegle (1946):
The rural Nazi vote since at least 1932 had a specific middle class character.
We would like to accentuate again that we followed an ecological regression strategy. Thus,
we have no certainty that middle peasants voting for the NSDAP paved the way to German
dictatorship. We are using aggregate data, i.e. our propositions are restricted to rely on macro-
relationships. Nevertheless, our differentiated incentive-based approach with regard to rural
strata allowed us to reveal a strong statistical relationship between hypothesized segments and
the Nazi vote for the first time. Thus, we make a contribution to the understanding of
disproportional electoral shifts in contexts that are theoretically delineated and operationalized
in a fine-grained way that is unmet thus far.
In order to strengthen the substantial conclusion, we followed a differentiated research design.
First, we tested whether each of the different original categories of farm sizes exhibit a
relationship with the Nazi vote. The result is that only the category of middle farmers (5-20
ha) statistically impacts the share of the NSDAP vote since the July 1932 election. The
proportion of parcel farmers (0-2 ha) did not influence the proportion of NSDAP voting.
Guided by macro-sociological insights as well as by cleavage theory, we expected this non-
40
relation: First, parcel peasants have not been fully involved in the market; second, their
natural supply parties have been the Social-Democratic Party and the Communist Party,
respectively. Therefore, this segment faced different economic voting incentives in the face of
the agrarian crisis. Third, despite identifying a moderate correlation between the occurrence of
small (2-5 ha) and middle (5-20 ha) farmers, our multivariate analysis did not suggest a
combination of these two categories either. Fourth, a combination of these heterogeneous
agrarian segments into one single composite category (0-20 ha) proved to be statistically
uncorrelated – as to be expected by our theoretical arguments. Thus, our results also
corroborate macro-sociological approaches arguing that it was the market-involved small and
middle peasants that were susceptible to mobilization efforts by rightist extremist political
entrepreneurs rather than parcel peasants and farm laborers. Fifth, both visually as well as
multivariately, we contribute for the first time to a systematic test of the Waldman conjecture
according to which there was an interaction between rurality/urbanity and the proportion of
Protestants in the districts. We are able to show that there was indeed such a functional
relationship for the 1932-1933 elections when using the proportion of middle peasants as a
rurality indicator.
Last but not least, we use so-called generalized additive models (GAM) for the first time,
allowing us to identify non-linear relationships. We selected this statistical strategy because
we consider it an important step for uncovering spatial and social peculiarities with regard to
the ecological voting. Next steps will be to use this information more systematically for
improving ecological inference techniques.
41
References
Andersen, Robert, 2009. “Nonparametric Methods for Modeling Nonlinearity in Regression
Analysis” Annual Review of Sociology. 35:67-85.
Beck, Nathaniel and Simon Jackman. 1998. “Beyond Linearity by Default: Generalized
Additive Models” American Journal of Political Science. 42:596–627.
Belitz, Christiane, Andreas Brezger, Thomas Kneib, and Stefan Lang. 2009. BayesX. Software
for Bayesian Inference in Structured Additive Regression Models. Version 2.0.1.
Methodology Manual, Munich, Germany.
Bendix, Reinhard. 1952. “Social Stratification and Political Power” The American Political
Science Review. 46:357–375.
Beyer, Hans. 1965. “Die Agrarkrise und das Ende der Weimarer Republik” Zeitschrift für
Agrargeschichte und Agrarsoziologie. 13:62–92.
Brustein, William. 1988. “The Political Geography of Belgian Fascism: The Case of Rexism”
American Sociological Review. 53:69–80.
------. 1991. “The “Red Menace” and the Rise of Italian Fascism” American Sociological
Review. 56:652–664.
Brustein, William and Jürgen W. Falter. 1994. “The Sociology of Nazism: An Interest-Based
Account” Rationality and Society. 6:369–399.
Burnham, Walter D. 1972. “Political Immunization and Political Confessionalism: The United
States and Weimar Germany” The Journal of Interdisciplinary History. 3:1–30.
42
Childers, Thomas. 1976. “The Social Bases of the National Socialist Vote” Journal of
Contemporary History. 11:17–42.
------. 1983. The Nazi voter. The Social Foundations of Fascism in Germany, 1919 - 1933,
Chapel Hill, NC: University of North Carolina Press.
Craven, Peter and Grace Wahba. 1979. “Smoothing Noisy Data with Spline Functions”
Numerische Mathematik. 31:377-403.
Eilers, Paul H. C. and Brian D. Marx. 1996. “Flexible Smoothing with B-splines and
Penalties” Statistical Science. 11:89–102.
Fahrmeir, Ludwig, Thomas Kneib, and Stefan Lang. 2004. “Penalized Structured Additive
Regression for Space-Time Data: A Bayesian perspective” Statistica Sinica. 14:715–745.
------. 2007. Regression: Modelle, Methoden und Anwendungen, Berlin, Germany: Springer.
Falter, Jürgen W. 1980: “Wählerbewegungen zur NSDAP 1924-1933. Methodische Probleme
– Abgesicherte Erkenntnisse – Offene Fragen” Pp. 152-202 in Wählerbewegungen in der
Europäischen Geschichte, edited by O. Büsch. Berlin: Colloquium Verlag.
------.1981. “Radicalization of the Middle Classes or Mobilization of the Unpolitical?: The
Theories of Seymour M. Lipset and Reinhard Bendix on the Electoral Support of the
NSDAP in the Light of Recent Research” Social Science Information. 20:389–430.
------. 1986. “Der Aufstieg der NSDAP in Franken bei den Reichstagswahlen 1924-1933. Ein
Vergleich mit dem Reich unter besonderer Berücksichtigung landwirtschaftlicher
Einflußfaktoren” German Studies Review. 9:319–359.
43
------. 1990. “The First German Volkspartei: The Social Foundations of the NSDAP” Pp. 53–
81 in Elections, parties and political traditions. Social foundations of German parties
and party systems 1867 - 1987, edited by K. Rohe. Munich, Germany: Berg.
------. 1991. Hitlers Wähler, Munich, Germany: Beck.
------. 2002. “The First German Volkspartei. The Social Foundations of the NSDAP” Pp. 53–
81 in Elections, parties and political traditions. Social foundations of German parties
and party systems 1867 - 1987, edited by K. Rohe. Munich, Germany: Berg.
Falter, Jürgen W. and Wolf D. Gruner. 1981. “Minor and Major Flaws of a Widely Used Data
Set: The ICPSR” German Weimar Republik Data 1919-1933" under Scrutiny" Historical
Social Research. 20:4–26.
Falter, Jürgen W. and Reinhard Zintl. 1988. “The Economic Crisis of the 1930s and the Nazi
Vote” The Journal of Interdisciplinary History. 19:55–85.
Flemming, Helmut. 1978. Landwirtschaftliche Interessen und Demokratie: Ländliche
Gesellschaft, Agrarverbände und Staat 1890 – 1925, Bonn, Germany: Verlag Neue
Gesellschaft.
Fox, John. 2000a. Nonparametric Simple Regression: Smoothing Scatterplots, Thousand
Oaks, CA: Sage.
------. 2000b. Multiple and Generalized Nonparametric Regression, Thousand Oaks, CA:
Sage.
Frey, Bruno S. and Hannelore Weck. 1983. “A Statistical Study of the Effect of the Great
Depression on Elections: The Weimar Republic, 1930-1933” Political Behavior. 5:403–
420.
44
Friedrich, Carl J. 1937. “The Agricultural Basis of Emotional Nationalism” Public Opinion
Quarterly. 1:50–61.
Geiger, Theodor. 1932. Die Soziale Schichtung des Deutschen Volkes. Soziographischer
Versuch auf Statistischer Grundlage, Stuttgart, Germany: Verlag Ferdinand Enke.
Gessner, Dieter. 1977. Agrardepression und Präsidialregierungen in Deutschland 1930 bis
1933: Probleme des Agrarprotektionismus am Ende der Weimarer Republik, Düsseldorf,
Germany: Droste.
Gies, Horst. 1967. “NSDAP und Landwirtschaftliche Organisationen in der Endphase der
Weimarer Republik” Vierteljahreshefte für Zeitgeschichte. 15:341–376.
Hanisch, Dirk. 1989. “Inhalt und Struktur der Datenbank “Wahl- und Sozialdaten der Kreise
und Gemeinden des Deutschen Reiches von 1920 bis 1933”” Historical Social Research.
14:39–67.
Hastie, Trevor and Robert Tibshirani. 1986. “Generalized Additive Models” Statistical
Science. 1:297-318.
------. 1993. “Varying-coefficient Models” Journal of the Royal Statistical Society. Series B.
55:757-796.
Heberle, Rudolf. 1945. From Democracy to Nazism. A Regional Case Study on Political
Parties in Germany, Baton Rouge, LA: Louisiana State University Press.
------. [1934] 1963. Landbevölkerung und Nationalsozialismus. Eine Soziologische
Untersuchung der Politischen Willensbildung in Schleswig-Holstein 1918 bis 1932,
Stuttgart, Germany: Deutsche Verlags-Anstalt.
Hobsbawm, Eric J. 1973. "Peasants and Politics" Journal of Peasant Studies. 1:3–22.
45
Hug, Simon. 2001. Altering party systems. Strategic Behavior and the Emergence of new
Political Parties in Western Democracies, Ann Arbor, MI: The University of Michigan
Press.
Huntington, Samuel P. 1968. Political Order in Changing Societies New Haven, CT: Yale
University Press.
James, Harold. 1986. The German Slump: Politics and Economics, 1924–1936, Oxford, UK:
Clarendon Press.
Jenkins, J. C. 1982. “Why do Peasants Rebel? Structural and Historical Theories of Modern
Peasant Rebellions” American Journal of Sociology. 88:487–514.
Keele, Luke. 2008. Semiparametric Regression for the Social Sciences, Chichester, UK:
Wiley.
King, Gary, Ori Rosen and Martin A. Tanner. 1999. “Binomial-Beta Hierarchical Models for
Ecological Inference” Sociological Methods and Research. 28:61–90.
King, Gary, Ori Rosen, Martin A. Tanner and Alexander F. Wagner. 2008. “Ordinary
Economic Voting Behavior in the Extraordinary Election of Adolf Hitler” The Journal of
Economic History. 68:951-996.
Landman, Todd. 2008. Issues and Methods in Comparative Politics. An Introduction,
London, UK: Routledge.
Lichbach, Mark I. 1994. “What Makes Rational Peasants Revolutionary? Dilemma, Paradox,
and Irony in Peasant Collective Action” World Politics. 46:383–418.
Linz, Juan. 1976. “Patterns of Land Tenure, Division of Labor, and Voting Behavior in
Europe“ Comparative Politics. 8: 365-430.
46
Lipset, Seymour D. 1950. Agrarian Socialism: The Cooperative Commonwealth Federation
in Saskatchewan. A Study in Political Sociology, Berkeley, CA: University of California
Press.
------. 1960. Political Man: the Social Bases of Politics, Garden City, NY: Doubleday.
Lipset, Seymour D. and Stein Rokkan. 1967. Party Systems and Voter Alignments: Cross
National Perspectives, New York: Free Press.
Loomis, Charles P. and J. A. Beegle. 1946. “The Spread of German Nazism in Rural Areas”
American Sociological Review. 11:724–734.
Meguid, Bonnie M. 2008. Party Competition Between Unequals. Strategies and Electoral
Fortunes in Western Europe, Cambridge, UK: Cambridge University Press.
Migdal, Joel S. 1974. Peasants, Politics and Revolution. Pressures toward Political and
Social Change in the Third World, Princeton, NJ: Princeton University Press.
Moore, Barrington. 1966. Social Origins of Dictatorship and Democracy: Lord and Peasant
in the Making of the Modern World, Boston, MA: Beacon Press.
O'Loughlin, John. 2002. “The Electoral Geography of Weimar Germany: Exploratory Spatial
Data Analyses (ESDA) of Protestant Support for the Nazi Party” Political Analysis.
10:217–243.
O'Loughlin, John, Colin Flint, and Luc Anselin. 1994. “The Geography of the Nazi Vote:
Context, Confession, and Class in the Reichstag Election of 1930” Annals of the
Association of American Geographers. 84:351–380.
Osmond, Jonathan. 1982. “Peasant Farming in South and West Germany during War and
Inflation 1914 to 1924: Stability or Stagnation?” Pp. 289–307, in Die deutsche Inflation.
47
Eine Zwischenbilanz (The German inflation reconsidered), edited by G. D. Feldman and
G. Merkin. Berlin, Germany; New York: de Gruyter.
------. 1993. Rural Protest in the Weimar Republic: The Free Peasantry in the Rhineland and
Bavaria, New York: St. Martin's Press.
Paige, Jeffery M. 1975. Agrarian Revolution, New York: Free Press.
Popkin, Samuel L. 1979. The Rational Peasant: The Political Economy of Rural Society in
Vietnam, Berkeley, CA: University of California Press.
Rose, Richard and Thomas T. Mackie. 1988. “Do Parties Persist or Fail? The Big Trade-off
Facing Organizations” Pp. 533–558, in When parties fail. Emerging alternative
organizations, edited by K. Lawson. Princeton, NJ: Princeton University Press.
Ruppert, David, Matt P. Wand, and Raymond J. Carroll. 2003. Semiparametric Regression,
Cambridge, UK: Cambridge University Press.
Schumacher, Martin. 1978. Land und Politik. Eine Untersuchung über Politische Parteien
und Agrarische Interessen 1914 - 1923. Vol. 65, Düsseldorf, Germany: Droste.
Shively, W. P. 1972. “Party Identification, Party Choice, and Voting Stability: The Weimar
Case” The American Political Science Review. 66:1203–1225.
Skocpol, Theda. 1979. States and Social Revolutions, Cambridge, UK: Cambridge University
Press.
Sorokin, Pitirim A., Carle C. Zimmerman, and Charles J. Galpin, editors. 1930-1932. A
Systematic Source Book in Rural Sociology, Minneapolis, MN: University of Minnesota
Press.
48
Statistik des Deutschen Reichs. 1929. Volks-, Berufs- und Betriebszahlung vom 16. Juni 1925:
Landwirtschaftliche Betriebszahlung. Die Hauptergebnisse in den Kleineren
Verwaltungsbezirken der Länder des Deutschen Reichs. Band 412 I, Berlin, Germany.
Stinchcombe, Arthur L. 1961. “Agricultural Enterprise and Rural Class Relations” American
Journal of Sociology. 67:165–176.
Taylor, Michael E. 1988. Rationality and Revolution, Cambridge, UK: Cambridge University
Press.
Urwin, Derek W. 1980. From Ploughshare To Ballotbox. The Politics of Agrarian Defence in
Europe, Oslo, Norway: Universitetsforlaget.
Waldman, Loren K. 1973. Models of mass movements. The Case of the Nazis, Chicago, IL:
Ph.D. dissertation, University of Chicago, Chicago, IL.
Wehler, Hans-Ulrich. 2008. Deutsche Gesellschaftsgeschichte. Vom Beginn des Ersten
Weltkrieges bis zur Gründung der beiden deutschen Staaten 1914-1949. Vol. 4, Munich,
Germany: Beck.
Wolf, Eric R. 1969. Peasant Wars of the Twentieth Century, New York: Harper & Row.
Wood, Simon N. 2006. Generalized Additive Models. An Introduction with R. Texts in
statistical science Vol. 67, Boca Raton: Chapman & Hall/CRC.
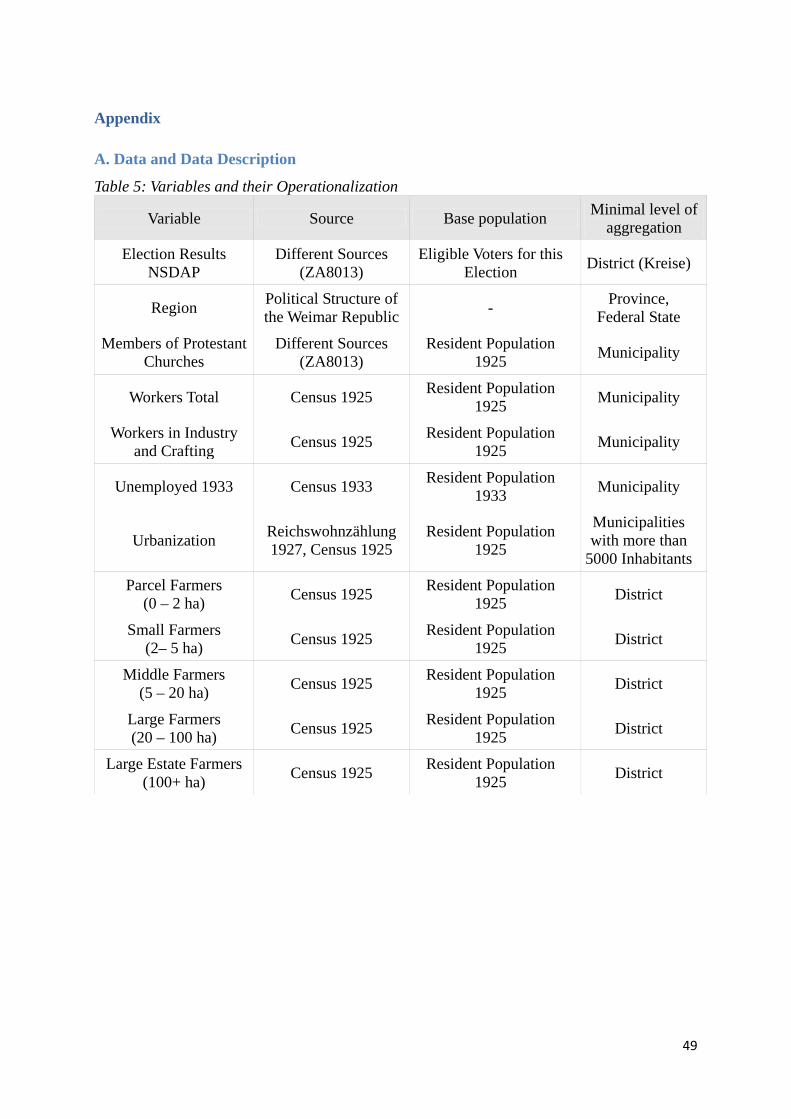
49
Appendix
A. Data and Data Description
Table 5: Variables and their Operationalization
Variable Source Base population Minimal level of aggregation
Election Results NSDAP
Different Sources (ZA8013)
Eligible Voters for this Election District (Kreise)
Region Political Structure of the Weimar Republic - Province,
Federal State
Members of Protestant Churches
Different Sources (ZA8013)
Resident Population 1925 Municipality
Workers Total Census 1925 Resident Population 1925 Municipality
Workers in Industry and Crafting Census 1925 Resident Population
1925 Municipality
Unemployed 1933 Census 1933 Resident Population 1933 Municipality
Urbanization Reichswohnzählung 1927, Census 1925
Resident Population 1925
Municipalities with more than
5000 Inhabitants
Parcel Farmers (0 – 2 ha) Census 1925 Resident Population
1925 District
Small Farmers (2– 5 ha) Census 1925 Resident Population
1925 District
Middle Farmers (5 – 20 ha) Census 1925 Resident Population
1925 District
Large Farmers (20 – 100 ha) Census 1925 Resident Population
1925 District
Large Estate Farmers (100+ ha) Census 1925 Resident Population
1925 District
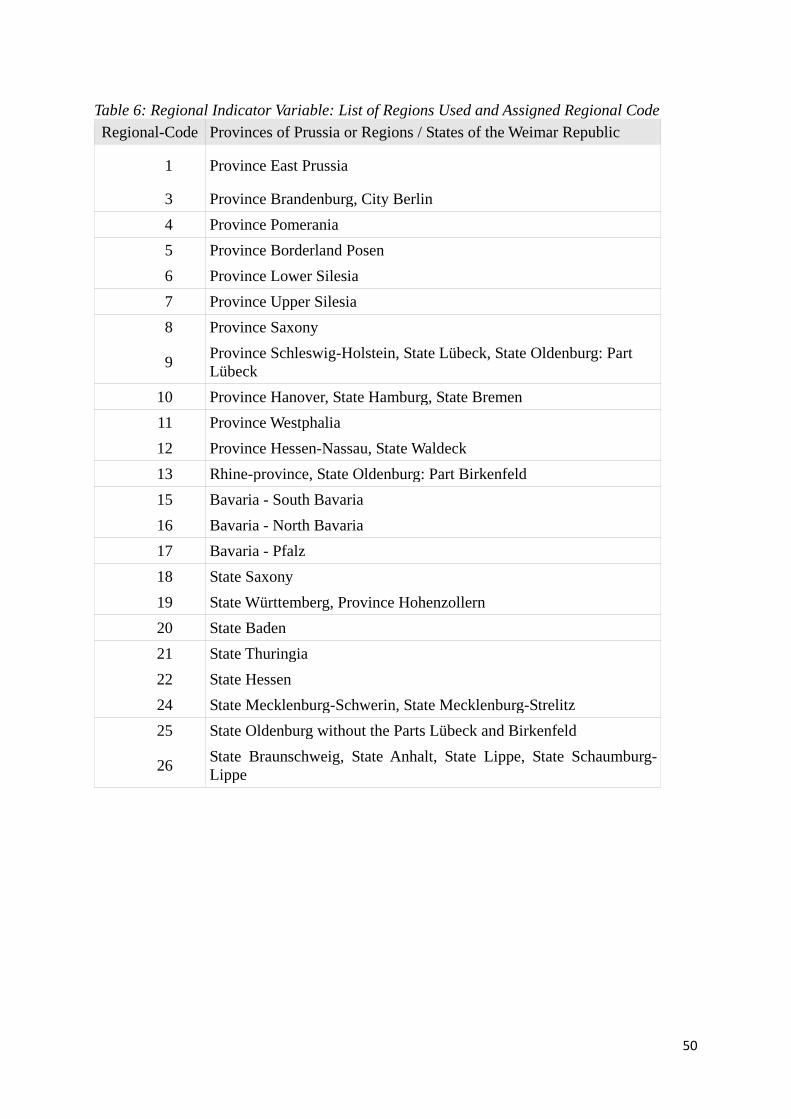
50
Table 6: Regional Indicator Variable: List of Regions Used and Assigned Regional Code Regional-Code Provinces of Prussia or Regions / States of the Weimar Republic
1 Province East Prussia
3 Province Brandenburg, City Berlin 4 Province Pomerania 5 Province Borderland Posen 6 Province Lower Silesia 7 Province Upper Silesia 8 Province Saxony
9 Province Schleswig-Holstein, State Lübeck, State Oldenburg: Part Lübeck
10 Province Hanover, State Hamburg, State Bremen 11 Province Westphalia 12 Province Hessen-Nassau, State Waldeck 13 Rhine-province, State Oldenburg: Part Birkenfeld 15 Bavaria - South Bavaria 16 Bavaria - North Bavaria 17 Bavaria - Pfalz 18 State Saxony 19 State Württemberg, Province Hohenzollern 20 State Baden 21 State Thuringia 22 State Hessen 24 State Mecklenburg-Schwerin, State Mecklenburg-Strelitz 25 State Oldenburg without the Parts Lübeck and Birkenfeld
26 State Braunschweig, State Anhalt, State Lippe, State Schaumburg-Lippe
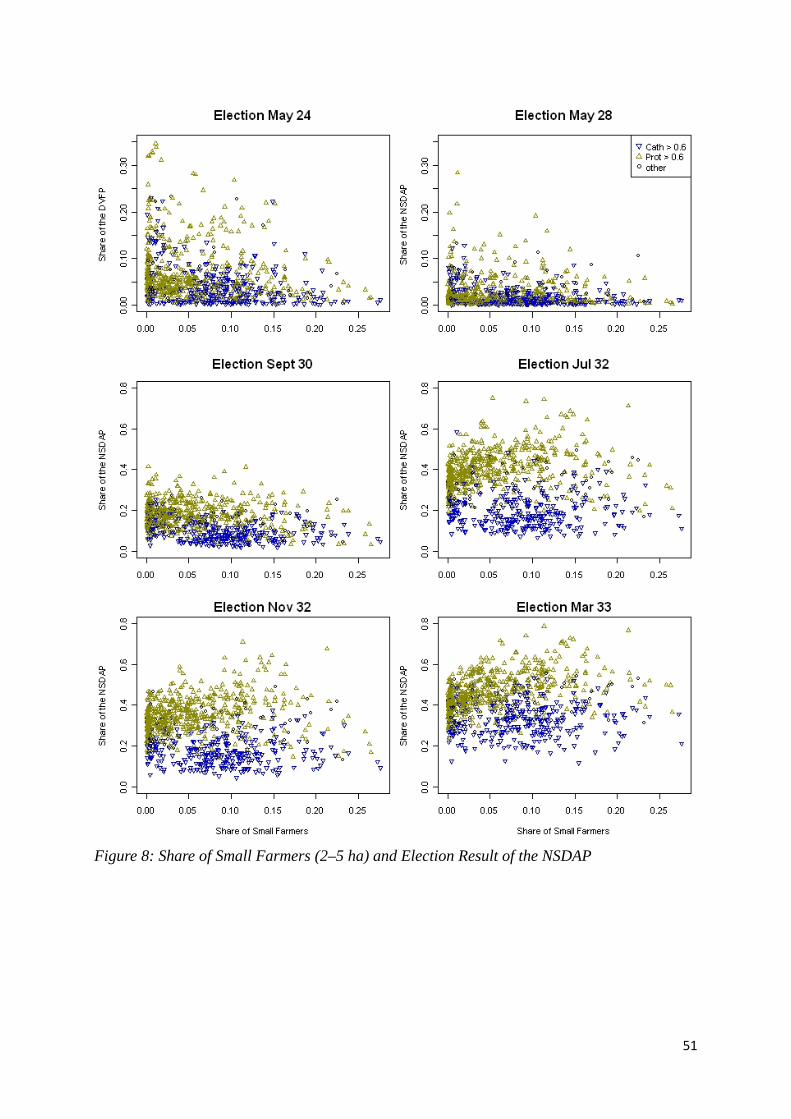
51
Figure 8: Share of Small Farmers (2–5 ha) and Election Result of the NSDAP
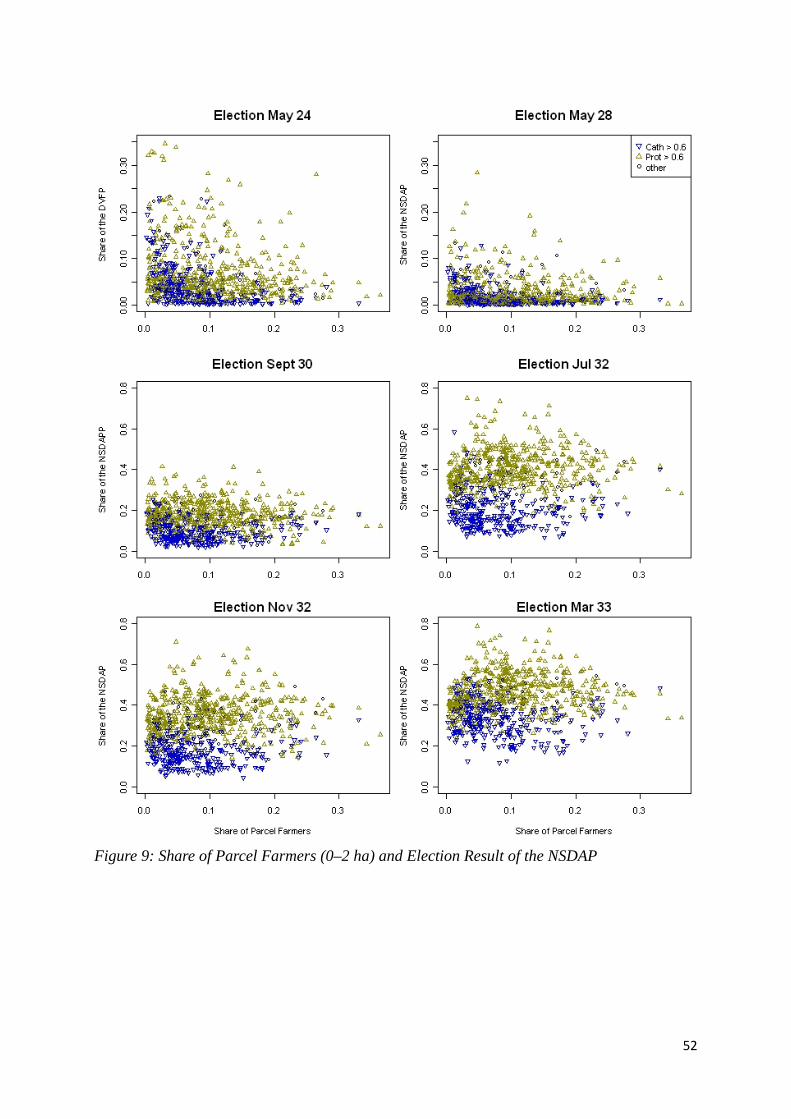
52
Figure 9: Share of Parcel Farmers (0–2 ha) and Election Result of the NSDAP
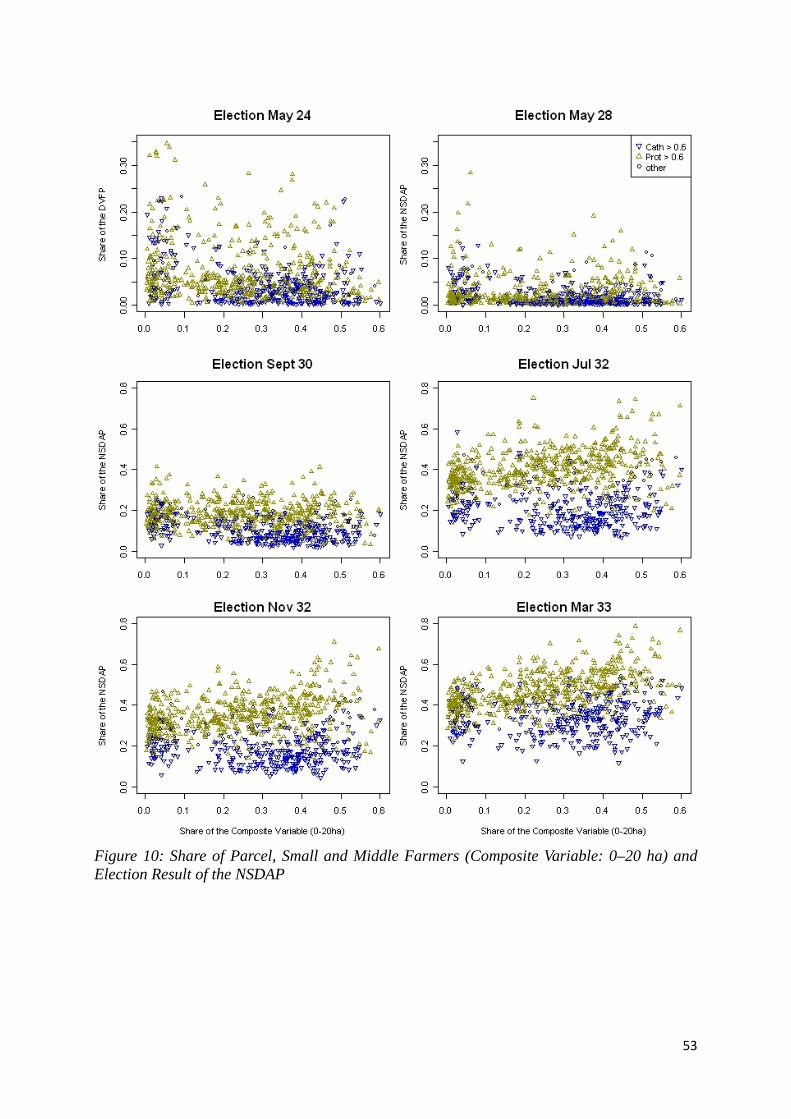
53
Figure 10: Share of Parcel, Small and Middle Farmers (Composite Variable: 0–20 ha) and Election Result of the NSDAP
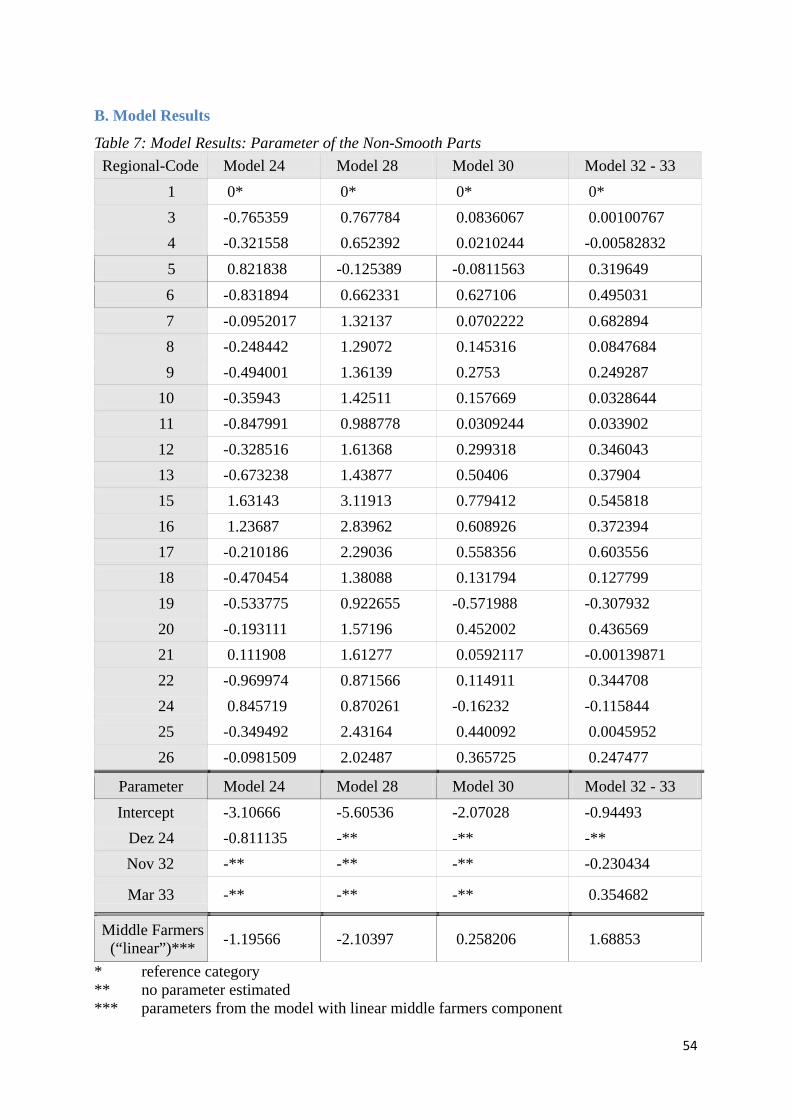
54
B. Model Results
Table 7: Model Results: Parameter of the Non-Smooth Parts Regional-Code Model 24 Model 28 Model 30 Model 32 - 33
1 0* 0* 0* 0* 3 -0.765359 0.767784 0.0836067 0.00100767 4 -0.321558 0.652392 0.0210244 -0.00582832 5 0.821838 -0.125389 -0.0811563 0.319649 6 -0.831894 0.662331 0.627106 0.495031 7 -0.0952017 1.32137 0.0702222 0.682894 8 -0.248442 1.29072 0.145316 0.0847684 9 -0.494001 1.36139 0.2753 0.249287
10 -0.35943 1.42511 0.157669 0.0328644 11 -0.847991 0.988778 0.0309244 0.033902 12 -0.328516 1.61368 0.299318 0.346043 13 -0.673238 1.43877 0.50406 0.37904 15 1.63143 3.11913 0.779412 0.545818 16 1.23687 2.83962 0.608926 0.372394 17 -0.210186 2.29036 0.558356 0.603556 18 -0.470454 1.38088 0.131794 0.127799 19 -0.533775 0.922655 -0.571988 -0.307932 20 -0.193111 1.57196 0.452002 0.436569 21 0.111908 1.61277 0.0592117 -0.00139871 22 -0.969974 0.871566 0.114911 0.344708 24 0.845719 0.870261 -0.16232 -0.115844 25 -0.349492 2.43164 0.440092 0.0045952 26 -0.0981509 2.02487 0.365725 0.247477
Parameter Model 24 Model 28 Model 30 Model 32 - 33 Intercept -3.10666 -5.60536 -2.07028 -0.94493
Dez 24 -0.811135 -** -** -** Nov 32 -** -** -** -0.230434
Mar 33 -** -** -** 0.354682
Middle Farmers (“linear”)*** -1.19566 -2.10397 0.258206 1.68853
* reference category ** no parameter estimated *** parameters from the model with linear middle farmers component
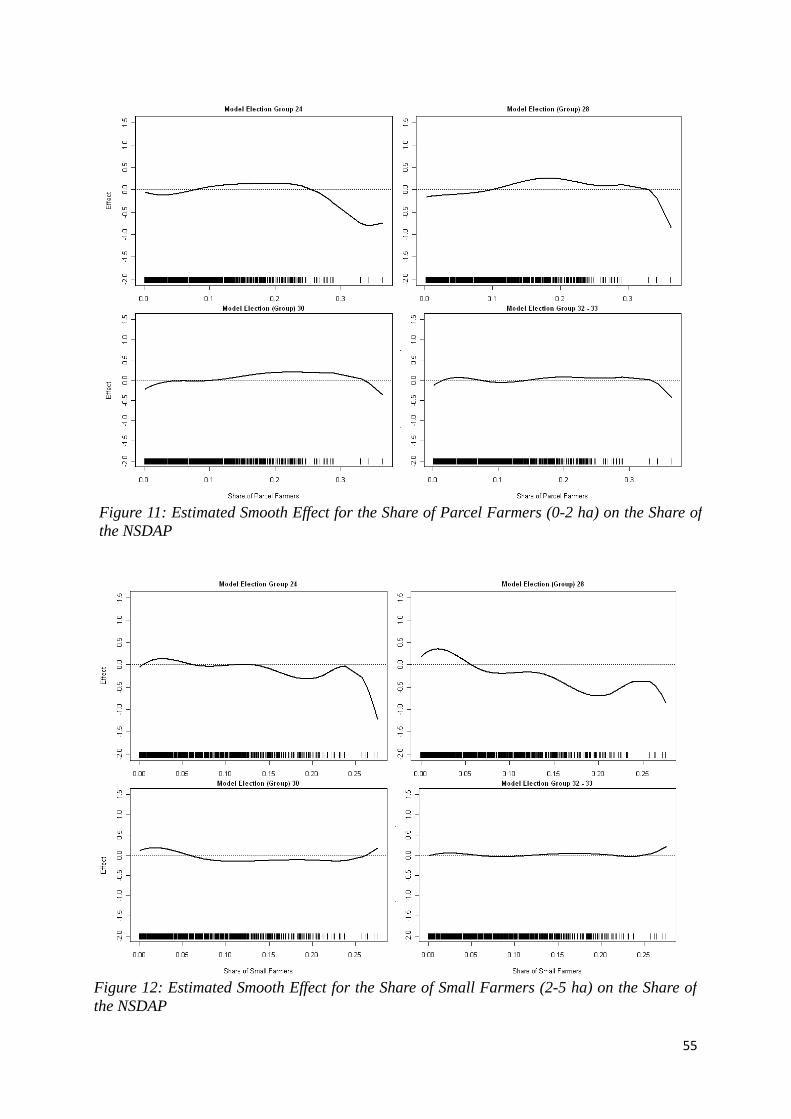
55
Figure 11: Estimated Smooth Effect for the Share of Parcel Farmers (0-2 ha) on the Share of the NSDAP
Figure 12: Estimated Smooth Effect for the Share of Small Farmers (2-5 ha) on the Share of the NSDAP
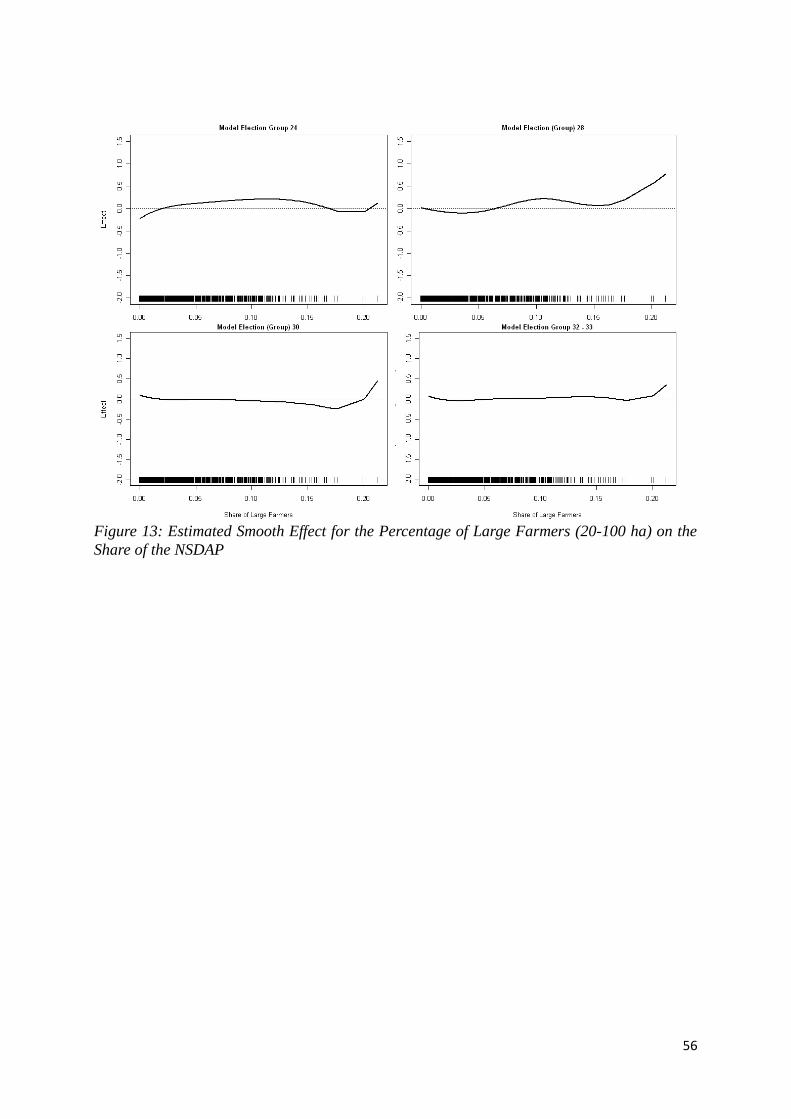
56
Figure 13: Estimated Smooth Effect for the Percentage of Large Farmers (20-100 ha) on the Share of the NSDAP
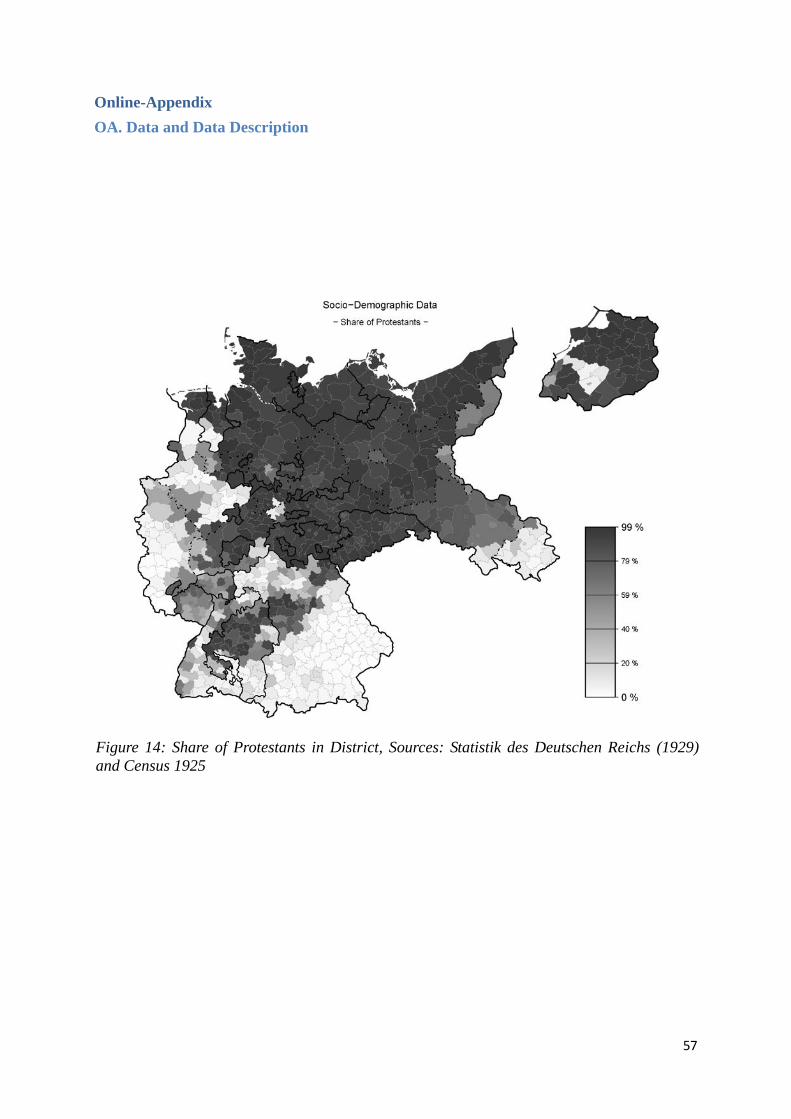
57
Online-Appendix OA. Data and Data Description
Figure 14: Share of Protestants in District, Sources: Statistik des Deutschen Reichs (1929) and Census 1925
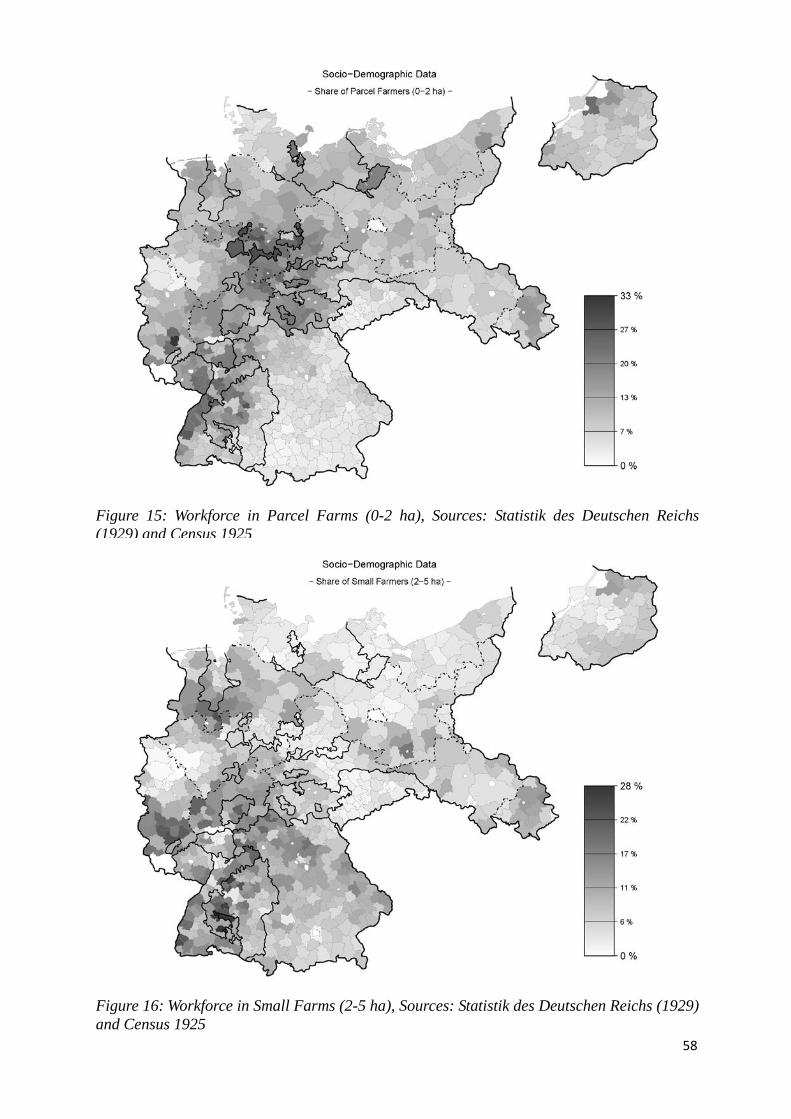
58
Figure 15: Workforce in Parcel Farms (0-2 ha), Sources: Statistik des Deutschen Reichs (1929) and Census 1925
Figure 16: Workforce in Small Farms (2-5 ha), Sources: Statistik des Deutschen Reichs (1929) and Census 1925
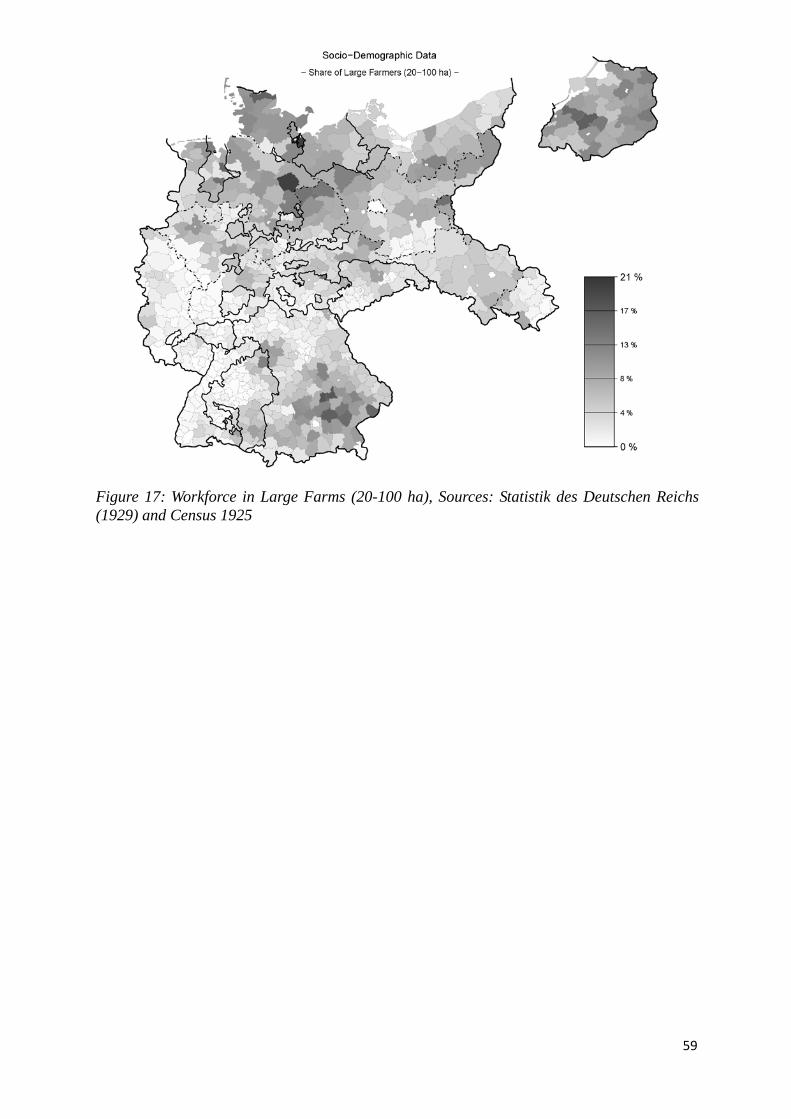
59
Figure 17: Workforce in Large Farms (20-100 ha), Sources: Statistik des Deutschen Reichs (1929) and Census 1925
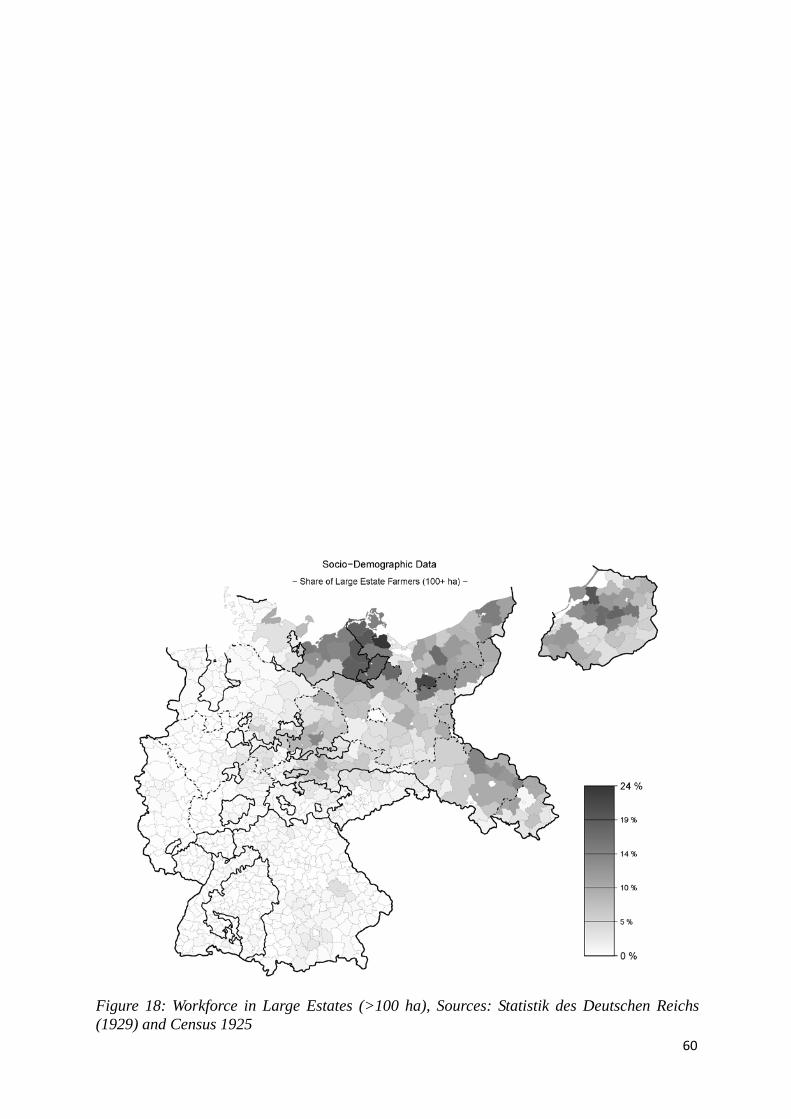
60
Figure 18: Workforce in Large Estates (>100 ha), Sources: Statistik des Deutschen Reichs (1929) and Census 1925
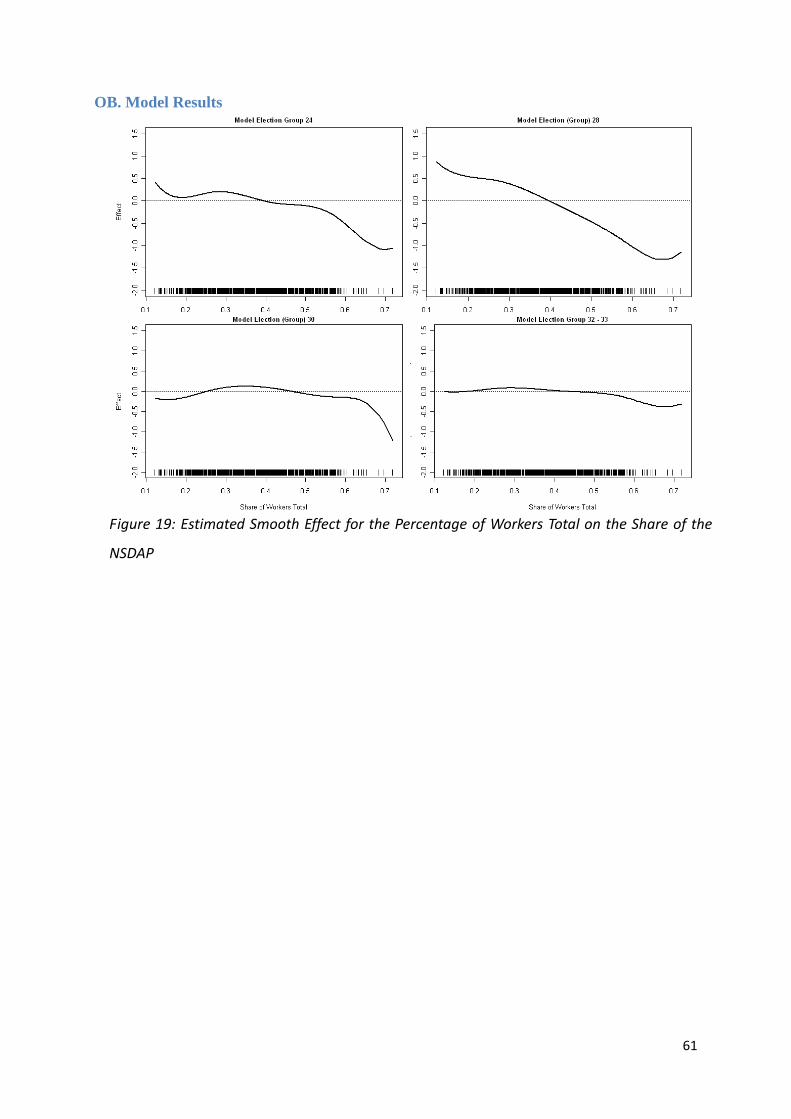
61
OB. Model Results
Figure 19: Estimated Smooth Effect for the Percentage of Workers Total on the Share of the
NSDAP
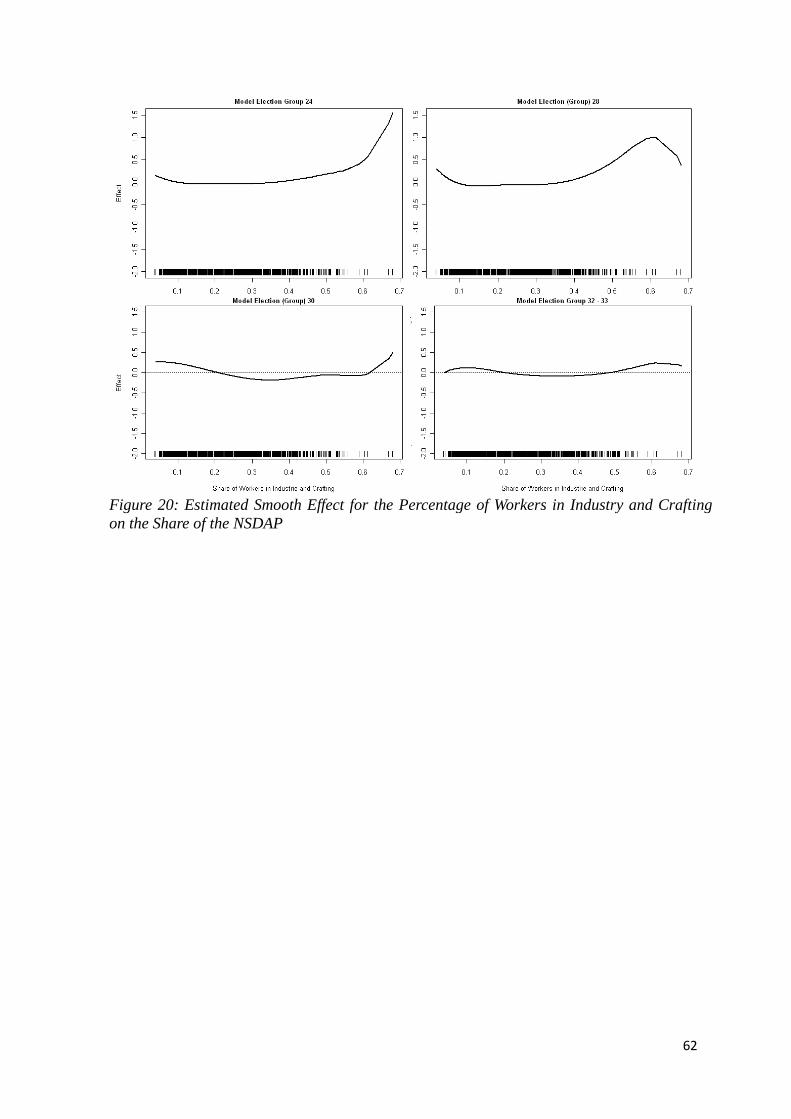
62
Figure 20: Estimated Smooth Effect for the Percentage of Workers in Industry and Crafting on the Share of the NSDAP
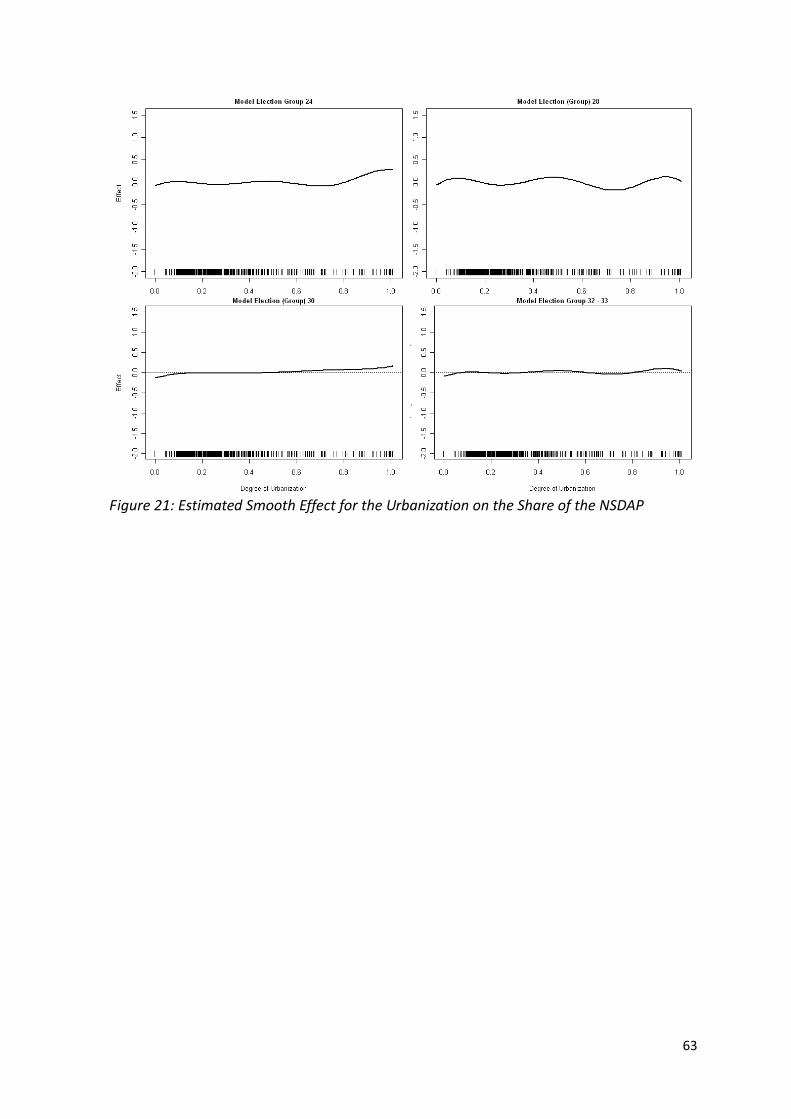
63
Figure 21: Estimated Smooth Effect for the Urbanization on the Share of the NSDAP
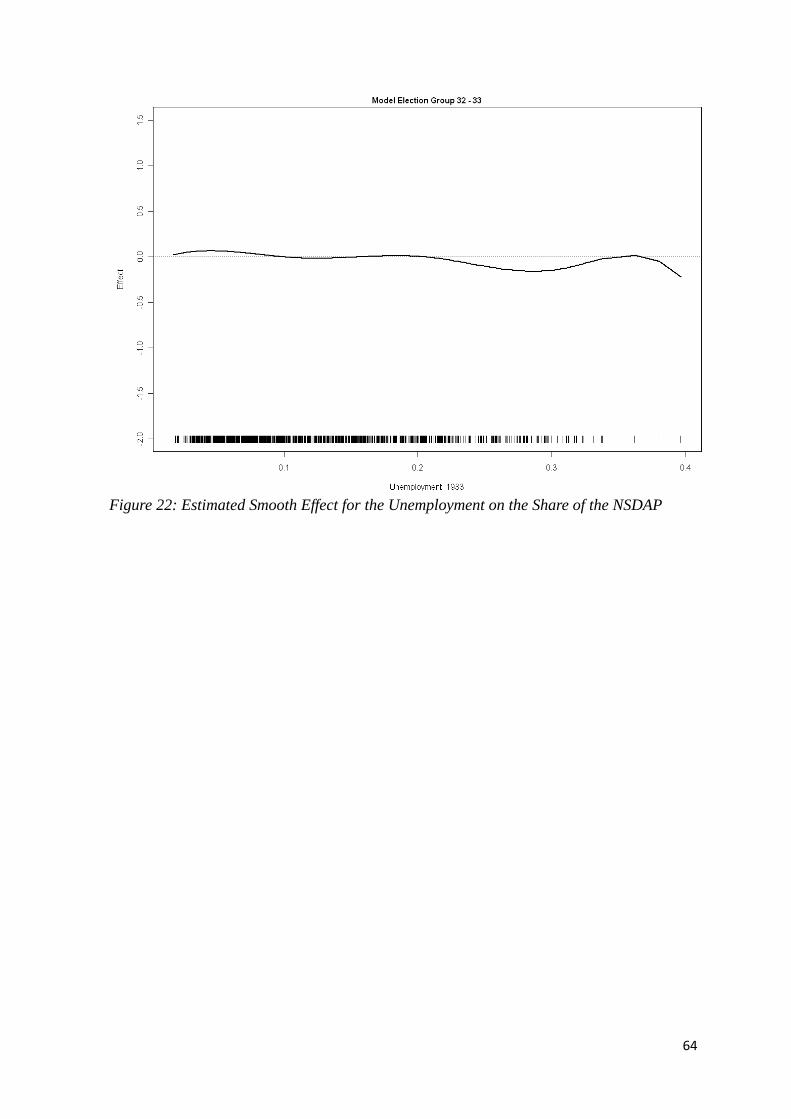
64
Figure 22: Estimated Smooth Effect for the Unemployment on the Share of the NSDAP
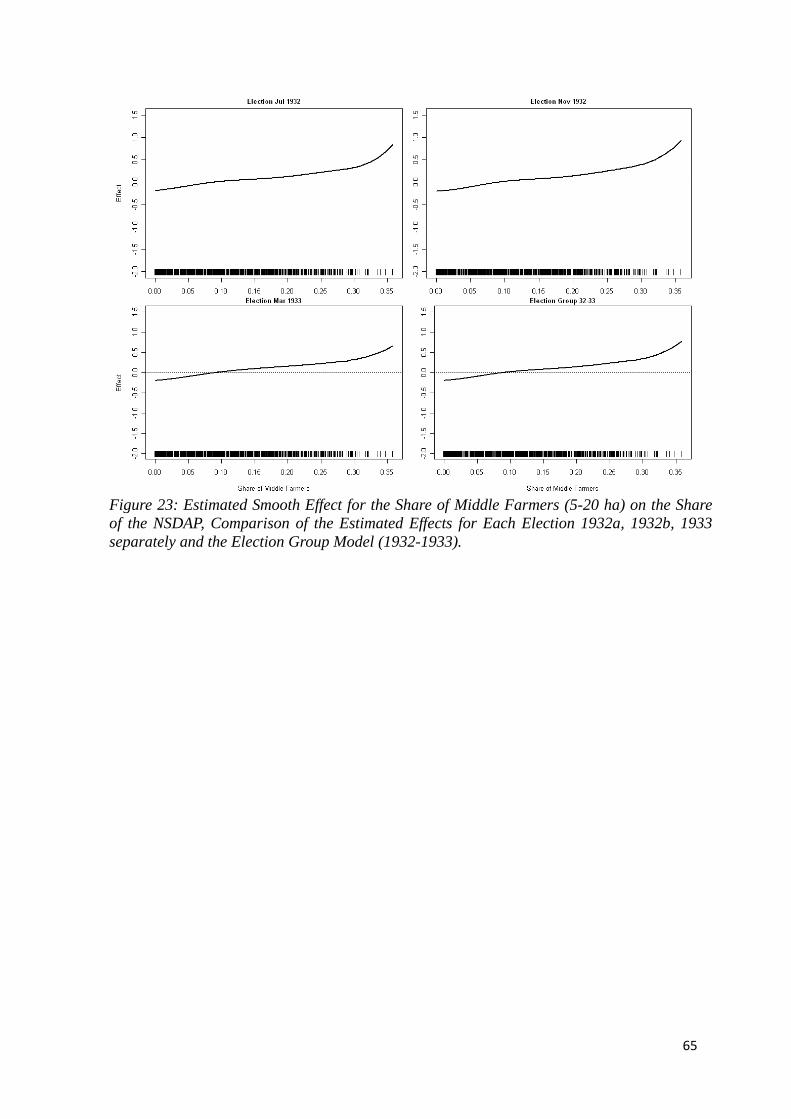
65
Figure 23: Estimated Smooth Effect for the Share of Middle Farmers (5-20 ha) on the Share of the NSDAP, Comparison of the Estimated Effects for Each Election 1932a, 1932b, 1933 separately and the Election Group Model (1932-1933).