Embed Size (px)
DESCRIPTION
Agriculture sector in India contributes 16% of GDP & 10% of export earnings. Agricultural Development in India has led to exports of agricultural products worth US$ 22 Billion by 2014. More statistics here.
Citation preview
1 1
Agriculture
For updated information, please visit www.ibef.org
AUGUST
2012
2 2
Contents
Advantage India
Market overview and trends
Growth drivers
Success stories: Green Revolution, Rallis India
Opportunities
Useful information
For updated information, please visit www.ibef.org
Agriculture AUGUST
2012
3 3
Agriculture
For updated information, please visit www.ibef.org ADVANTAGE INDIA
Advantage India
AUGUST
2012
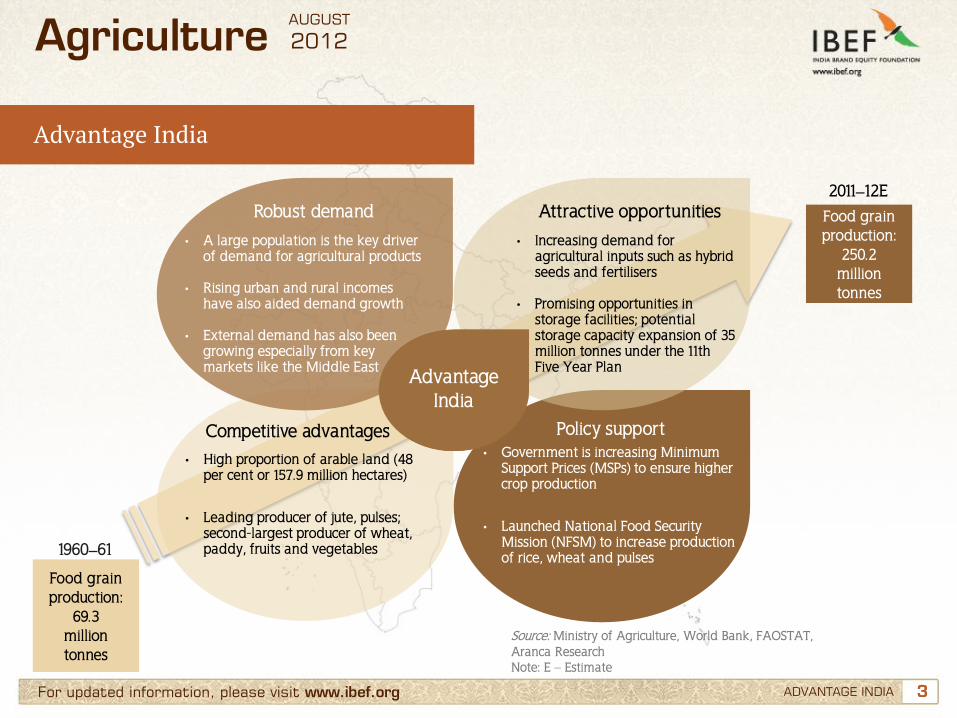
Advantage India
• A large population is the key driver of demand for agricultural products
• Rising urban and rural incomes have also aided demand growth
• External demand has also been growing especially from key markets like the Middle East
• Increasing demand for agricultural inputs such as hybrid seeds and fertilisers
• Promising opportunities in
storage facilities; potential storage capacity expansion of 35 million tonnes under the 11th Five Year Plan
• High proportion of arable land (48 per cent or 157.9 million hectares)
• Leading producer of jute, pulses; second-largest producer of wheat, paddy, fruits and vegetables
• Government is increasing Minimum Support Prices (MSPs) to ensure higher crop production
• Launched National Food Security Mission (NFSM) to increase production of rice, wheat and pulses
Food grain production:
250.2 million tonnes
2011–12E
Food grain production:
69.3 million tonnes
1960–61
Source: Ministry of Agriculture, World Bank, FAOSTAT, Aranca Research Note: E – Estimate
Robust demand Attractive opportunities
Competitive advantages Policy support
4 4
Contents
Advantage India
Market overview and trends
Growth drivers
Success stories: Green Revolution, Rallis India
Opportunities
Useful information
For updated information, please visit www.ibef.org
Agriculture AUGUST
2012
5 5
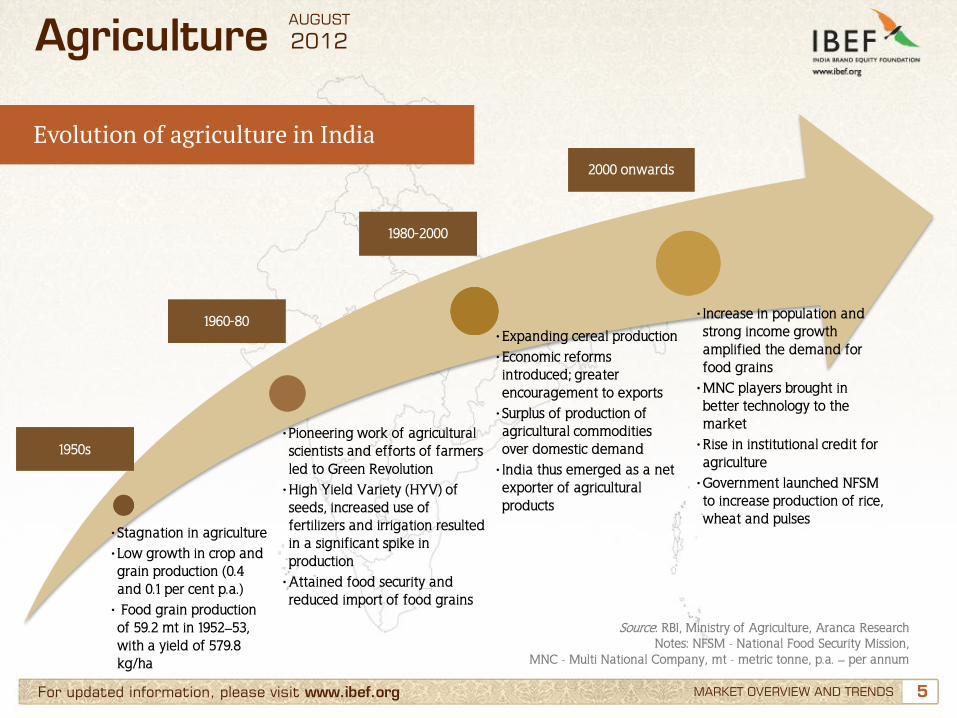
• Stagnation in agriculture • Low growth in crop and grain production (0.4 and 0.1 per cent p.a.)
• Food grain production of 59.2 mt in 1952–53, with a yield of 579.8 kg/ha
• Pioneering work of agricultural scientists and efforts of farmers led to Green Revolution
• High Yield Variety (HYV) of seeds, increased use of fertilizers and irrigation resulted in a significant spike in production
• Attained food security and reduced import of food grains
• Expanding cereal production • Economic reforms introduced; greater encouragement to exports
• Surplus of production of agricultural commodities over domestic demand
• India thus emerged as a net exporter of agricultural products
• Increase in population and strong income growth amplified the demand for food grains
• MNC players brought in better technology to the market
• Rise in institutional credit for agriculture
• Government launched NFSM to increase production of rice, wheat and pulses
For updated information, please visit www.ibef.org MARKET OVERVIEW AND TRENDS
Evolution of agriculture in India
Source: RBI, Ministry of Agriculture, Aranca Research Notes: NFSM - National Food Security Mission,
MNC - Multi National Company, mt - metric tonne, p.a. – per annum
Agriculture
1950s
1960-80
1980-2000
2000 onwards
AUGUST
2012
6 6 For updated information, please visit www.ibef.org
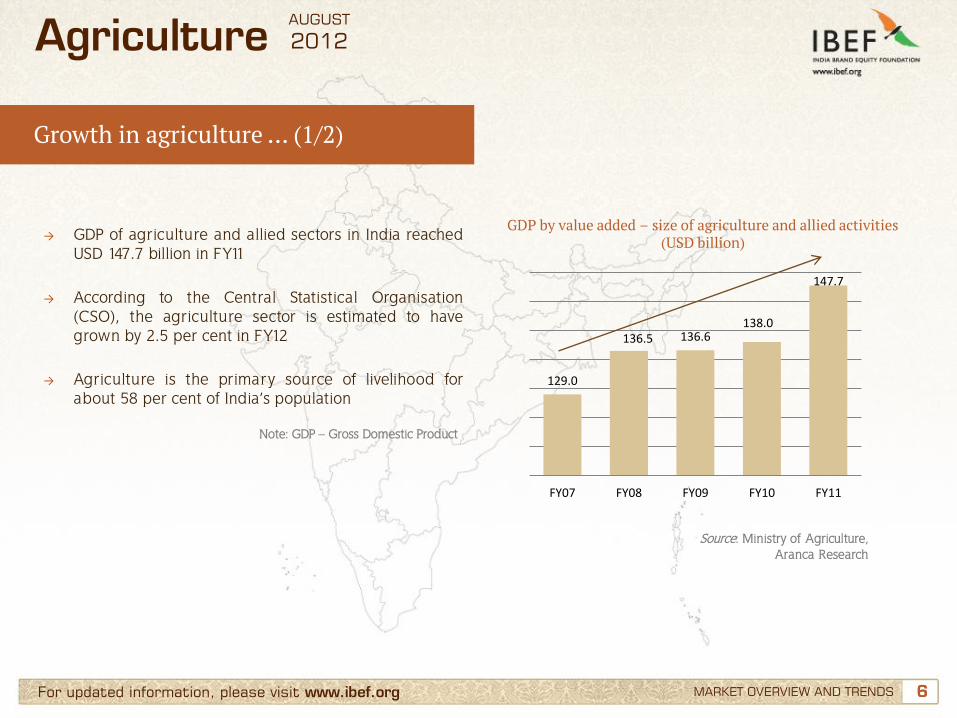
Growth in agriculture … (1/2)
→ GDP of agriculture and allied sectors in India reached USD 147.7 billion in FY11
→ According to the Central Statistical Organisation (CSO), the agriculture sector is estimated to have grown by 2.5 per cent in FY12
→ Agriculture is the primary source of livelihood for
about 58 per cent of India’s population
GDP by value added – size of agriculture and allied activities (USD billion)
Source: Ministry of Agriculture, Aranca Research
Note: GDP – Gross Domestic Product
MARKET OVERVIEW AND TRENDS
Agriculture
129.0
136.5 136.6 138.0
147.7
FY07 FY08 FY09 FY10 FY11
AUGUST
2012
7 7 For updated information, please visit www.ibef.org
Growth in agriculture … (2/2)
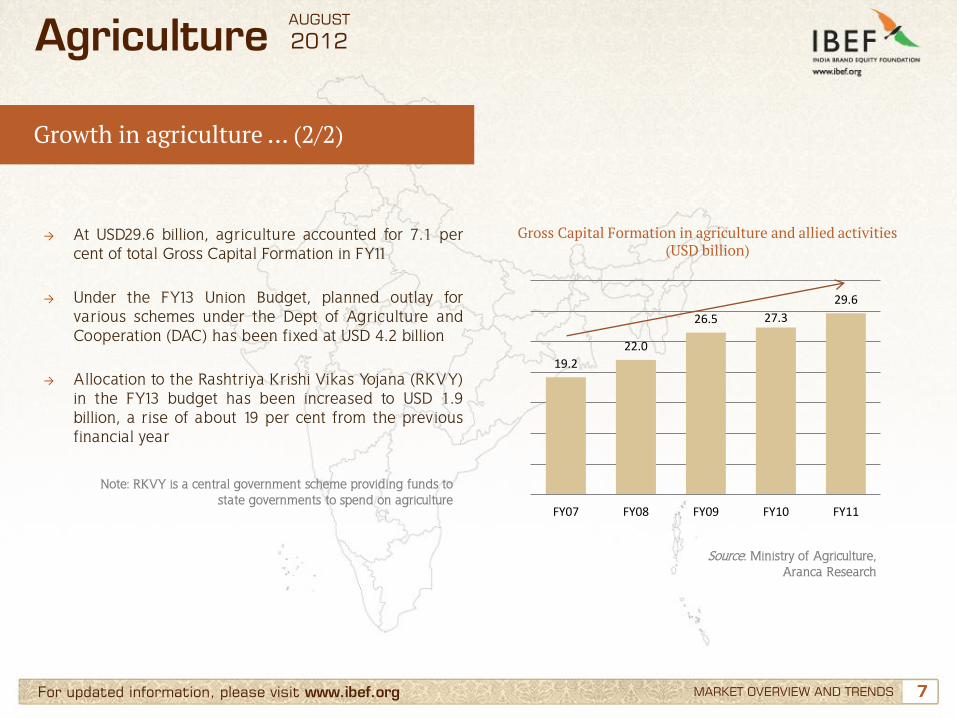
→ At USD29.6 billion, agriculture accounted for 7.1 per cent of total Gross Capital Formation in FY11
→ Under the FY13 Union Budget, planned outlay for various schemes under the Dept of Agriculture and Cooperation (DAC) has been fixed at USD 4.2 billion
→ Allocation to the Rashtriya Krishi Vikas Yojana (RKVY) in the FY13 budget has been increased to USD 1.9 billion, a rise of about 19 per cent from the previous financial year
Gross Capital Formation in agriculture and allied activities (USD billion)
Source: Ministry of Agriculture, Aranca Research
MARKET OVERVIEW AND TRENDS
Agriculture
19.2
22.0
26.5 27.3
29.6
FY07 FY08 FY09 FY10 FY11
Note: RKVY is a central government scheme providing funds to state governments to spend on agriculture
AUGUST
2012
8 8 For updated information, please visit www.ibef.org
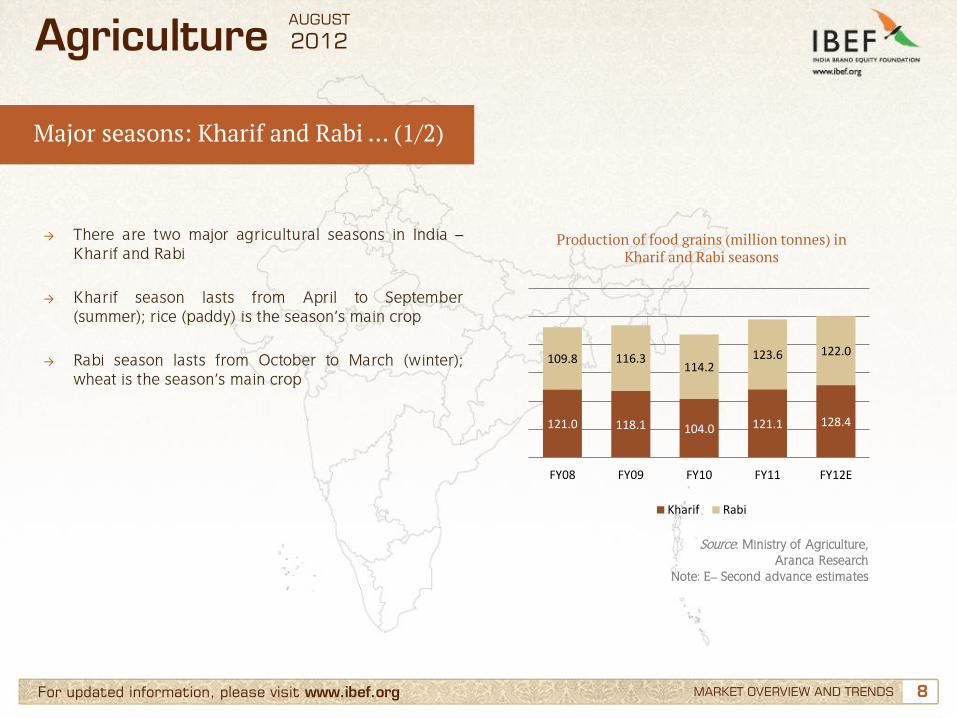
Major seasons: Kharif and Rabi … (1/2)
MARKET OVERVIEW AND TRENDS
Agriculture
→ There are two major agricultural seasons in India – Kharif and Rabi
→ Kharif season lasts from April to September
(summer); rice (paddy) is the season’s main crop → Rabi season lasts from October to March (winter);
wheat is the season’s main crop
Production of food grains (million tonnes) in Kharif and Rabi seasons
Source: Ministry of Agriculture, Aranca Research
Note: E– Second advance estimates
121.0 118.1 104.0 121.1 128.4
109.8 116.3 114.2
123.6 122.0
FY08 FY09 FY10 FY11 FY12E
Kharif Rabi
AUGUST
2012
9 9 For updated information, please visit www.ibef.org
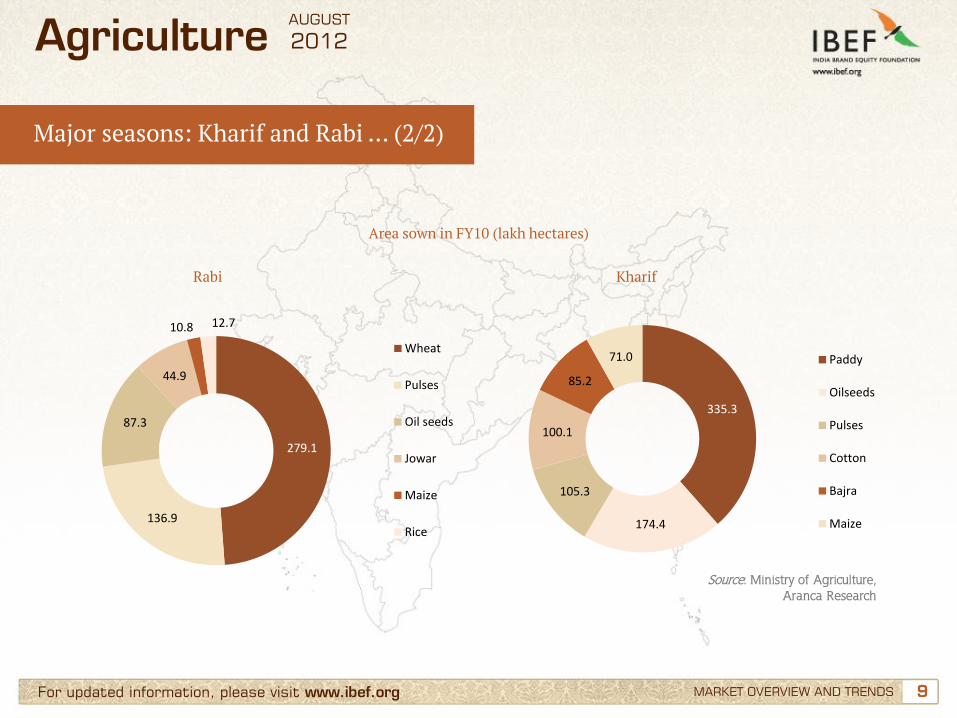
Major seasons: Kharif and Rabi … (2/2)
Area sown in FY10 (lakh hectares)
Source: Ministry of Agriculture, Aranca Research
MARKET OVERVIEW AND TRENDS
Agriculture
Rabi
279.1
136.9
87.3
44.9
10.8 12.7
Wheat
Pulses
Oil seeds
Jowar
Maize
Rice
Kharif
335.3
174.4
105.3
100.1
85.2
71.0 Paddy
Oilseeds
Pulses
Cotton
Bajra
Maize
AUGUST
2012
10 10 For updated information, please visit www.ibef.org
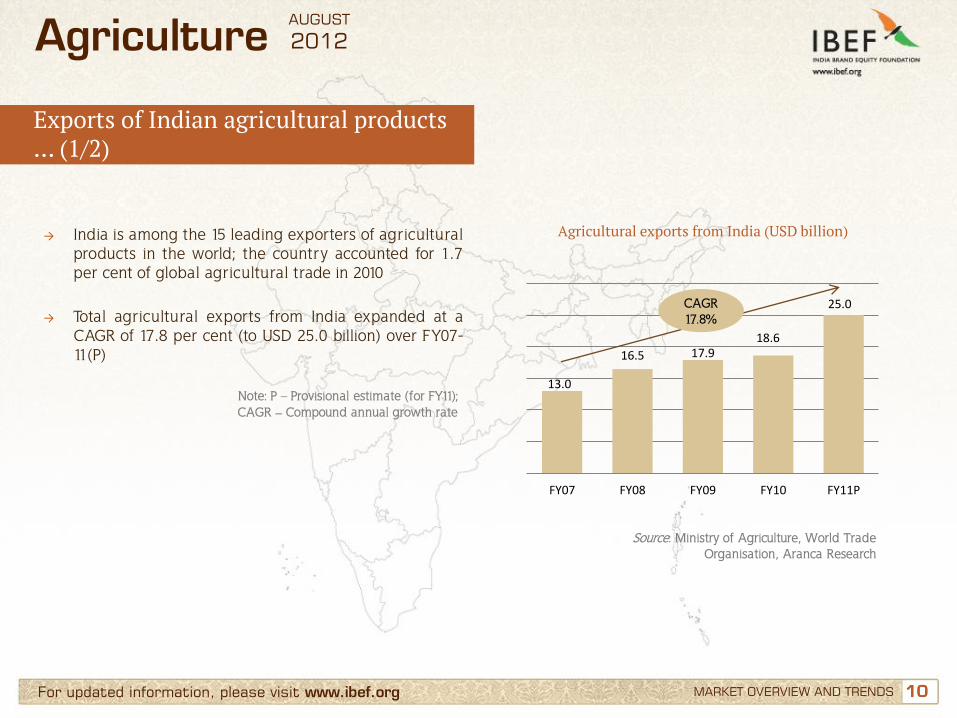
Exports of Indian agricultural products … (1/2)
MARKET OVERVIEW AND TRENDS
Agriculture
→ India is among the 15 leading exporters of agricultural products in the world; the country accounted for 1.7 per cent of global agricultural trade in 2010
→ Total agricultural exports from India expanded at a
CAGR of 17.8 per cent (to USD 25.0 billion) over FY07-11(P)
Agricultural exports from India (USD billion)
Source: Ministry of Agriculture, World Trade Organisation, Aranca Research
Note: P – Provisional estimate (for FY11); CAGR – Compound annual growth rate
13.0
16.5 17.9 18.6
25.0
FY07 FY08 FY09 FY10 FY11P
CAGR 17.8%
AUGUST
2012
11 11 For updated information, please visit www.ibef.org MARKET OVERVIEW AND TRENDS
Agriculture
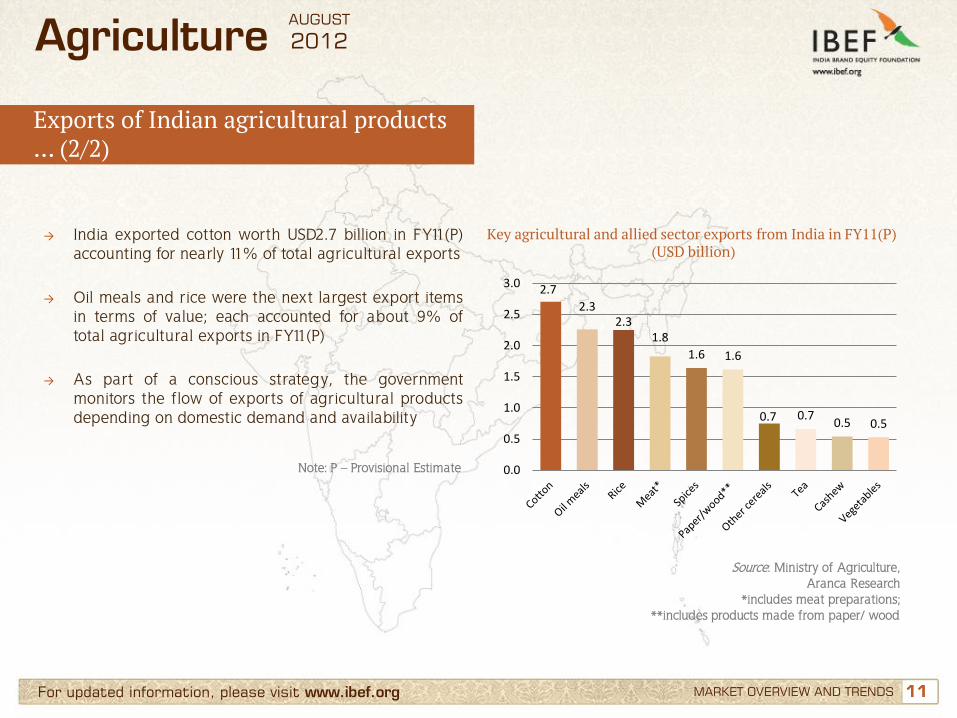
→ India exported cotton worth USD2.7 billion in FY11(P) accounting for nearly 11% of total agricultural exports
→ Oil meals and rice were the next largest export items
in terms of value; each accounted for about 9% of total agricultural exports in FY11(P)
→ As part of a conscious strategy, the government
monitors the flow of exports of agricultural products depending on domestic demand and availability
Key agricultural and allied sector exports from India in FY11(P) (USD billion)
Source: Ministry of Agriculture, Aranca Research
*includes meat preparations; **includes products made from paper/ wood
Exports of Indian agricultural products … (2/2)
Note: P – Provisional Estimate
2.7
2.3 2.3
1.8
1.6 1.6
0.7 0.7 0.5 0.5
0.0
0.5
1.0
1.5
2.0
2.5
3.0
AUGUST
2012
12
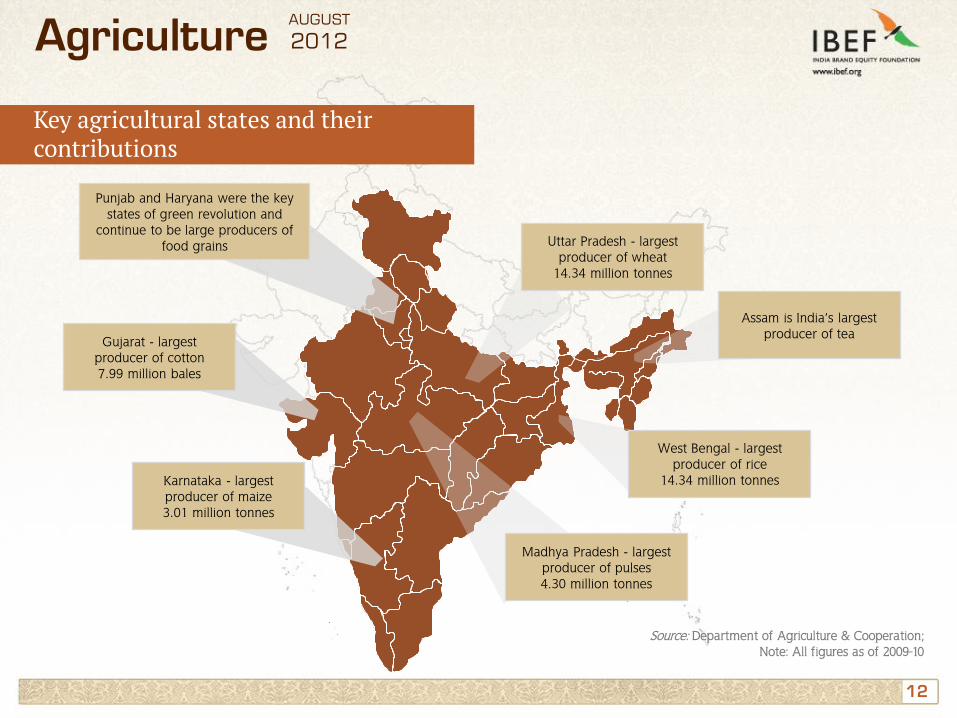
Karnataka - largest producer of maize 3.01 million tonnes
West Bengal - largest producer of rice
14.34 million tonnes
Uttar Pradesh - largest producer of wheat
14.34 million tonnes
Gujarat - largest producer of cotton 7.99 million bales
Madhya Pradesh - largest producer of pulses 4.30 million tonnes
Punjab and Haryana were the key states of green revolution and
continue to be large producers of food grains
Assam is India’s largest producer of tea
Source: Department of Agriculture & Cooperation; Note: All figures as of 2009-10
Agriculture
Key agricultural states and their contributions
AUGUST
2012
13 13
Contents
Advantage India
Market overview and trends
Growth drivers
Success stories: Green Revolution, Rallis India
Opportunities
Useful information
For updated information, please visit www.ibef.org
Agriculture AUGUST
2012
14 14 For updated information, please visit www.ibef.org GROWTH DRIVERS
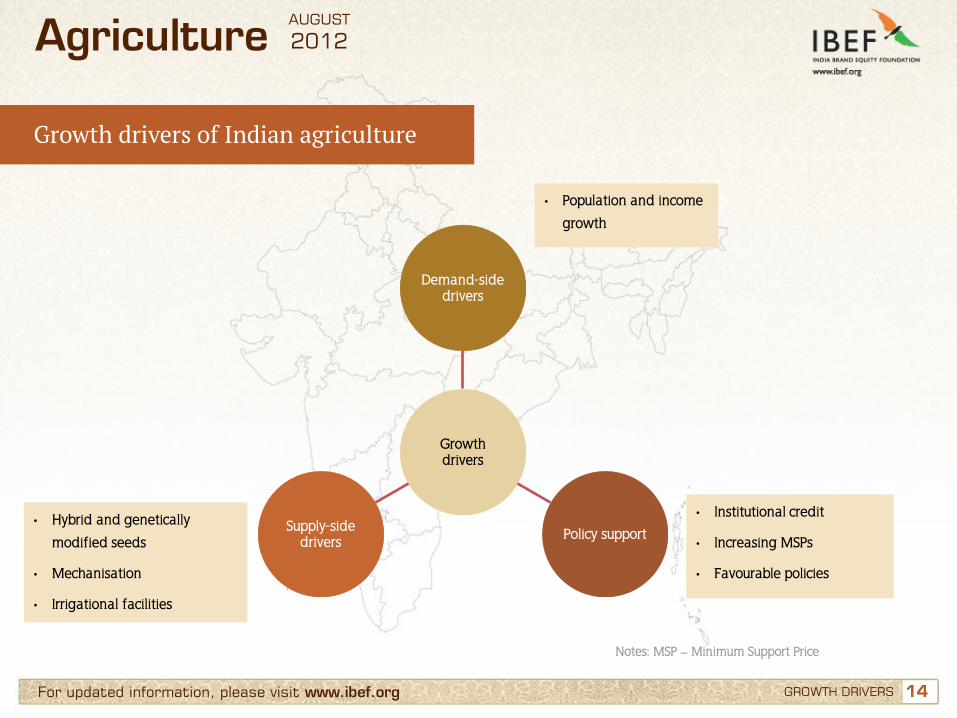
Growth drivers of Indian agriculture
Agriculture
Growth drivers
Demand-side drivers
Policy support Supply-side drivers
• Hybrid and genetically
modified seeds
• Mechanisation
• Irrigational facilities
• Institutional credit
• Increasing MSPs
• Favourable policies
• Population and income
growth
Notes: MSP – Minimum Support Price
AUGUST
2012
15 15 For updated information, please visit www.ibef.org
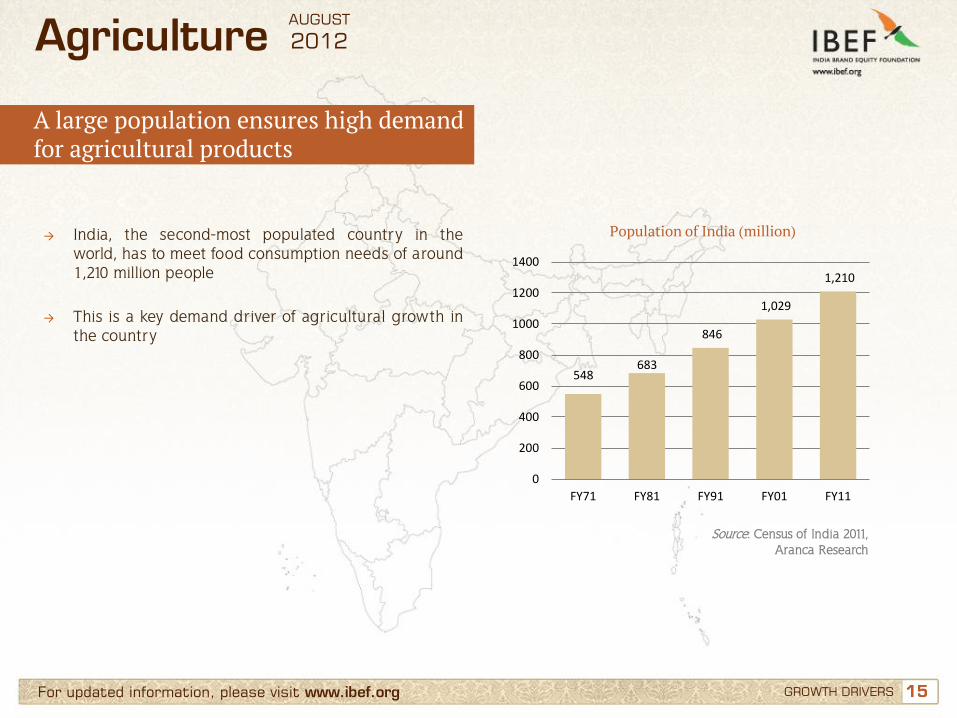
A large population ensures high demand for agricultural products
GROWTH DRIVERS
Agriculture
→ India, the second-most populated country in the world, has to meet food consumption needs of around 1,210 million people
→ This is a key demand driver of agricultural growth in
the country
Population of India (million)
Source: Census of India 2011, Aranca Research
548 683
846
1,029
1,210
0
200
400
600
800
1000
1200
1400
FY71 FY81 FY91 FY01 FY11
AUGUST
2012
16 16 For updated information, please visit www.ibef.org
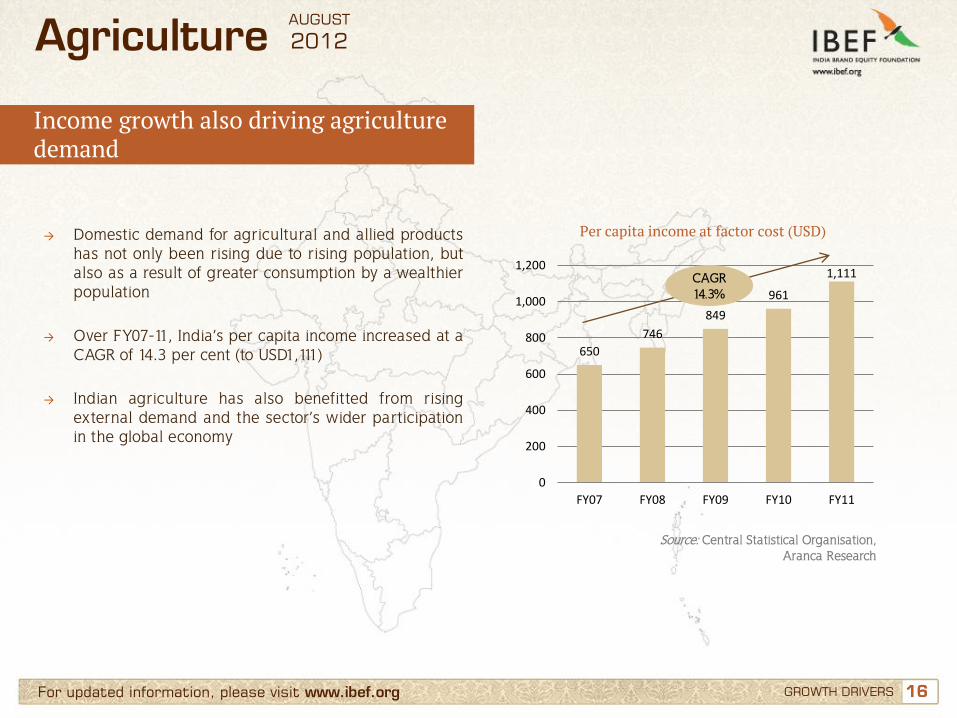
Income growth also driving agriculture demand
GROWTH DRIVERS
Agriculture
→ Domestic demand for agricultural and allied products has not only been rising due to rising population, but also as a result of greater consumption by a wealthier population
→ Over FY07-11, India’s per capita income increased at a CAGR of 14.3 per cent (to USD1,111)
→ Indian agriculture has also benefitted from rising external demand and the sector’s wider participation in the global economy
Per capita income at factor cost (USD)
Source: Central Statistical Organisation, Aranca Research
650
746
849
961
1,111
0
200
400
600
800
1,000
1,200
FY07 FY08 FY09 FY10 FY11
CAGR 14.3%
AUGUST
2012
17 17 For updated information, please visit www.ibef.org
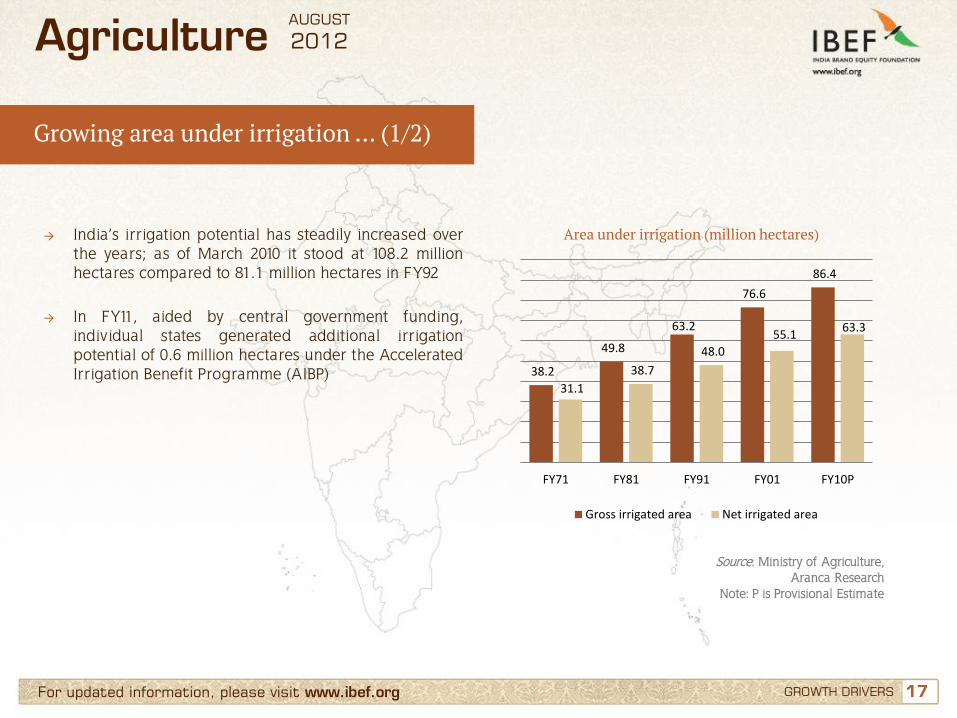
Growing area under irrigation … (1/2)
GROWTH DRIVERS
Agriculture
→ India’s irrigation potential has steadily increased over the years; as of March 2010 it stood at 108.2 million hectares compared to 81.1 million hectares in FY92
→ In FY11, aided by central government funding, individual states generated additional irrigation potential of 0.6 million hectares under the Accelerated Irrigation Benefit Programme (AIBP)
Area under irrigation (million hectares)
Source: Ministry of Agriculture, Aranca Research
Note: P is Provisional Estimate
38.2
49.8
63.2
76.6
86.4
31.1
38.7
48.0
55.1 63.3
FY71 FY81 FY91 FY01 FY10P
Gross irrigated area Net irrigated area
AUGUST
2012
18 18 For updated information, please visit www.ibef.org
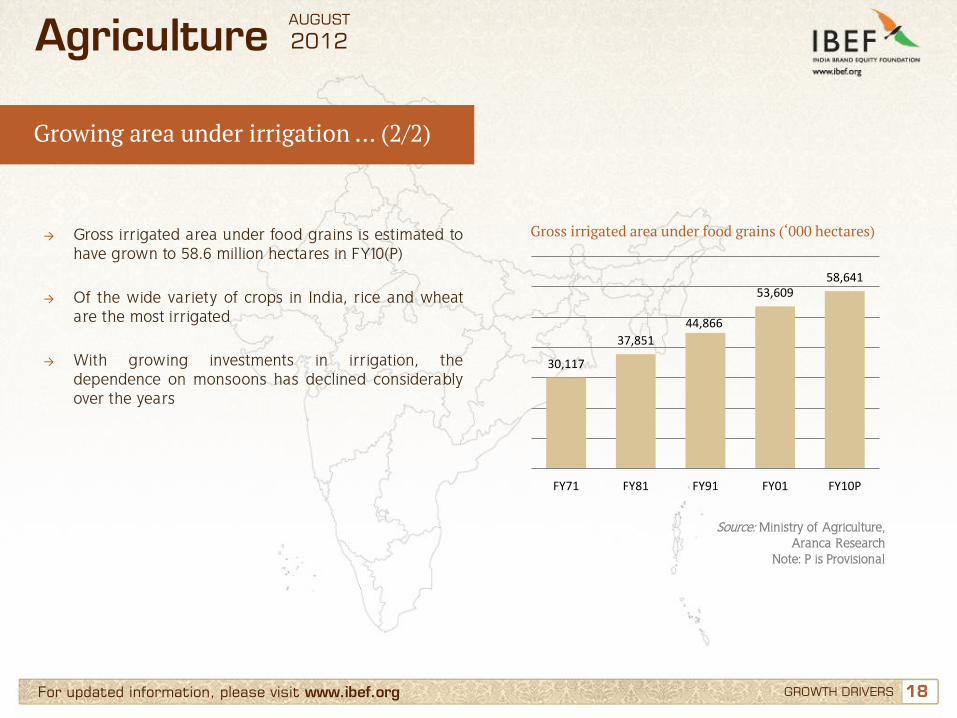
Growing area under irrigation … (2/2)
GROWTH DRIVERS
Agriculture
→ Gross irrigated area under food grains is estimated to have grown to 58.6 million hectares in FY10(P)
→ Of the wide variety of crops in India, rice and wheat
are the most irrigated → With growing investments in irrigation, the
dependence on monsoons has declined considerably over the years
Gross irrigated area under food grains (‘000 hectares)
Source: Ministry of Agriculture, Aranca Research
Note: P is Provisional
30,117
37,851
44,866
53,609 58,641
FY71 FY81 FY91 FY01 FY10P
AUGUST
2012
19 19 For updated information, please visit www.ibef.org
Increasing mechanisation of farming … (1/2)
GROWTH DRIVERS
Agriculture
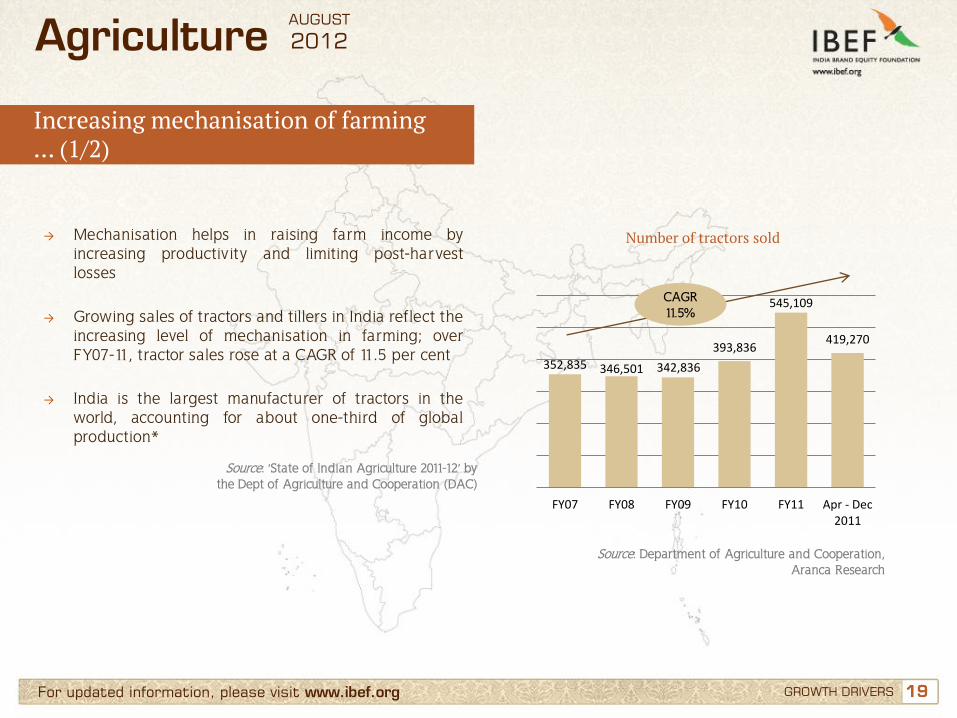
→ Mechanisation helps in raising farm income by increasing productivity and limiting post-harvest losses
→ Growing sales of tractors and tillers in India reflect the
increasing level of mechanisation in farming; over FY07-11, tractor sales rose at a CAGR of 11.5 per cent
→ India is the largest manufacturer of tractors in the
world, accounting for about one-third of global production*
Number of tractors sold
Source: Department of Agriculture and Cooperation, Aranca Research
352,835 346,501 342,836
393,836
545,109
419,270
FY07 FY08 FY09 FY10 FY11 Apr - Dec2011
CAGR 11.5%
Source: ‘State of Indian Agriculture 2011-12’ by the Dept of Agriculture and Cooperation (DAC)
AUGUST
2012
20 20 For updated information, please visit www.ibef.org GROWTH DRIVERS
Agriculture
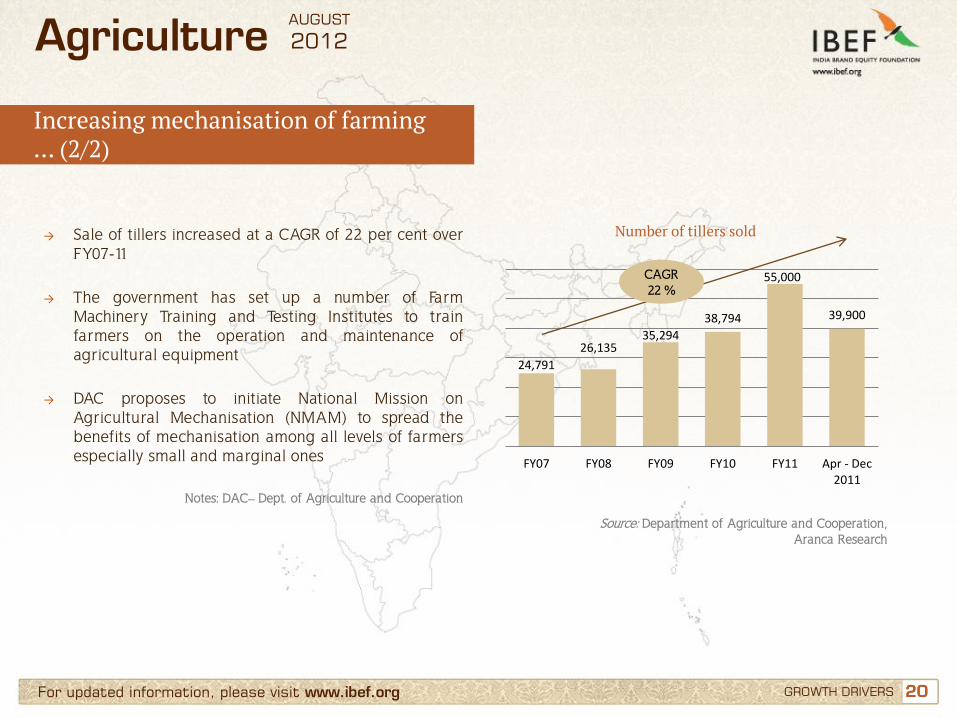
→ Sale of tillers increased at a CAGR of 22 per cent over FY07-11
→ The government has set up a number of Farm
Machinery Training and Testing Institutes to train farmers on the operation and maintenance of agricultural equipment
→ DAC proposes to initiate National Mission on
Agricultural Mechanisation (NMAM) to spread the benefits of mechanisation among all levels of farmers especially small and marginal ones
Number of tillers sold
Source: Department of Agriculture and Cooperation, Aranca Research
Increasing mechanisation of farming … (2/2)
Notes: DAC– Dept. of Agriculture and Cooperation
24,791
26,135 35,294
38,794
55,000
39,900
FY07 FY08 FY09 FY10 FY11 Apr - Dec2011
CAGR 22 %
AUGUST
2012
21 21 For updated information, please visit www.ibef.org
Improved yield and resistance from hybrid seeds … (1/2)
GROWTH DRIVERS
Agriculture
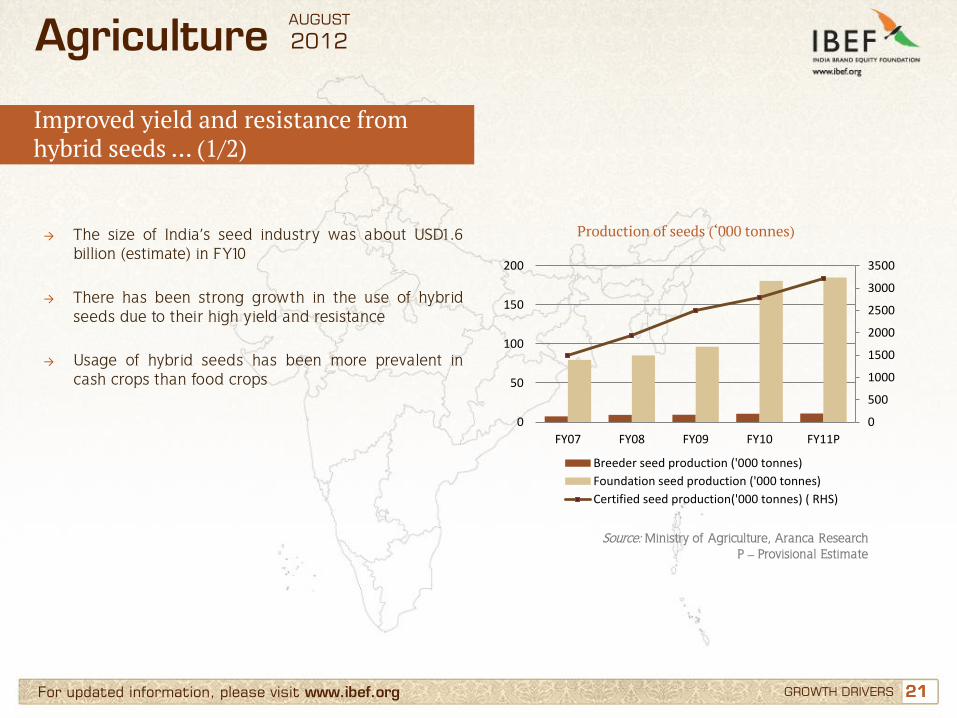
→ The size of India’s seed industry was about USD1.6 billion (estimate) in FY10
→ There has been strong growth in the use of hybrid
seeds due to their high yield and resistance → Usage of hybrid seeds has been more prevalent in
cash crops than food crops
Production of seeds (‘000 tonnes)
Source: Ministry of Agriculture, Aranca Research P – Provisional Estimate
0
500
1000
1500
2000
2500
3000
3500
0
50
100
150
200
FY07 FY08 FY09 FY10 FY11P
Breeder seed production ('000 tonnes)
Foundation seed production ('000 tonnes)
Certified seed production('000 tonnes) ( RHS)
AUGUST
2012
22 22 For updated information, please visit www.ibef.org
Improved yield and resistance from hybrid seeds … (2/2)
GROWTH DRIVERS
Agriculture
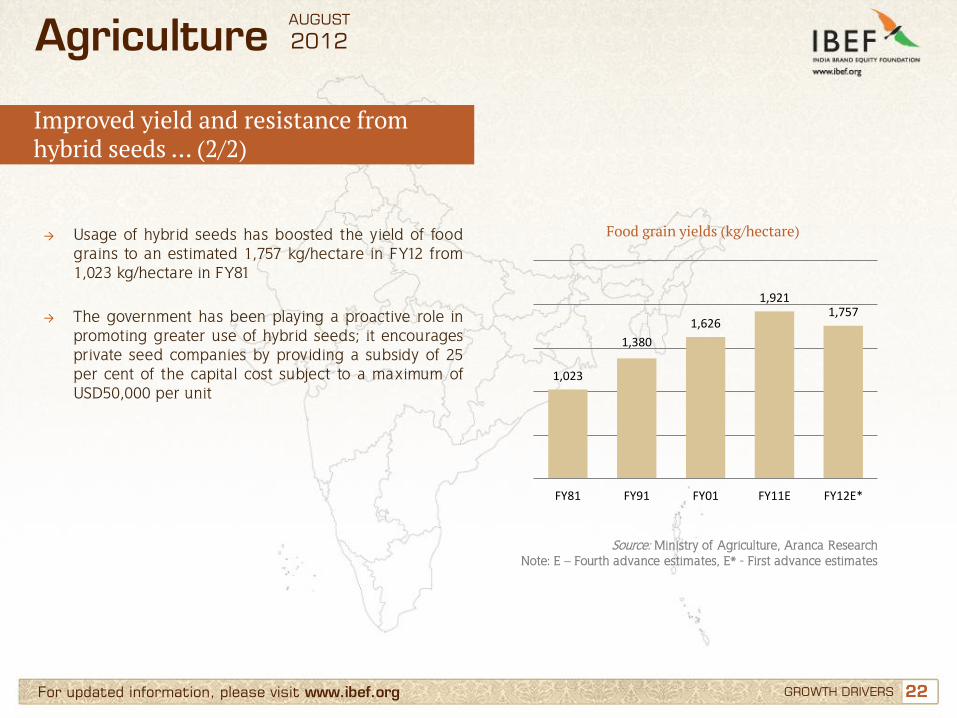
→ Usage of hybrid seeds has boosted the yield of food grains to an estimated 1,757 kg/hectare in FY12 from 1,023 kg/hectare in FY81
→ The government has been playing a proactive role in
promoting greater use of hybrid seeds; it encourages private seed companies by providing a subsidy of 25 per cent of the capital cost subject to a maximum of USD50,000 per unit
Food grain yields (kg/hectare)
Source: Ministry of Agriculture, Aranca Research Note: E – Fourth advance estimates, E* - First advance estimates
1,023
1,380
1,626
1,921 1,757
FY81 FY91 FY01 FY11E FY12E*
AUGUST
2012
23 23 For updated information, please visit www.ibef.org
Institutional credit to agriculture on a rise … (1/2)
GROWTH DRIVERS
Agriculture
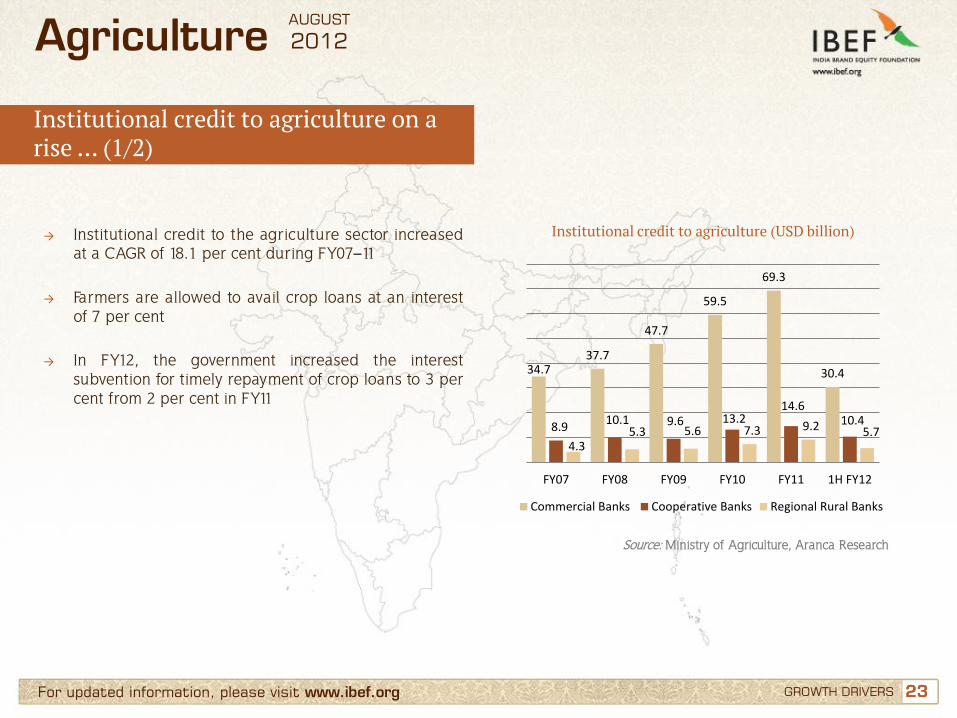
→ Institutional credit to the agriculture sector increased at a CAGR of 18.1 per cent during FY07–11
→ Farmers are allowed to avail crop loans at an interest of 7 per cent
→ In FY12, the government increased the interest subvention for timely repayment of crop loans to 3 per cent from 2 per cent in FY11
Institutional credit to agriculture (USD billion)
Source: Ministry of Agriculture, Aranca Research
34.7 37.7
47.7
59.5
69.3
30.4
8.9 10.1 9.6 13.2
14.6 10.4
4.3 5.3 5.6 7.3 9.2 5.7
FY07 FY08 FY09 FY10 FY11 1H FY12
Commercial Banks Cooperative Banks Regional Rural Banks
AUGUST
2012
24 24 For updated information, please visit www.ibef.org GROWTH DRIVERS
Agriculture
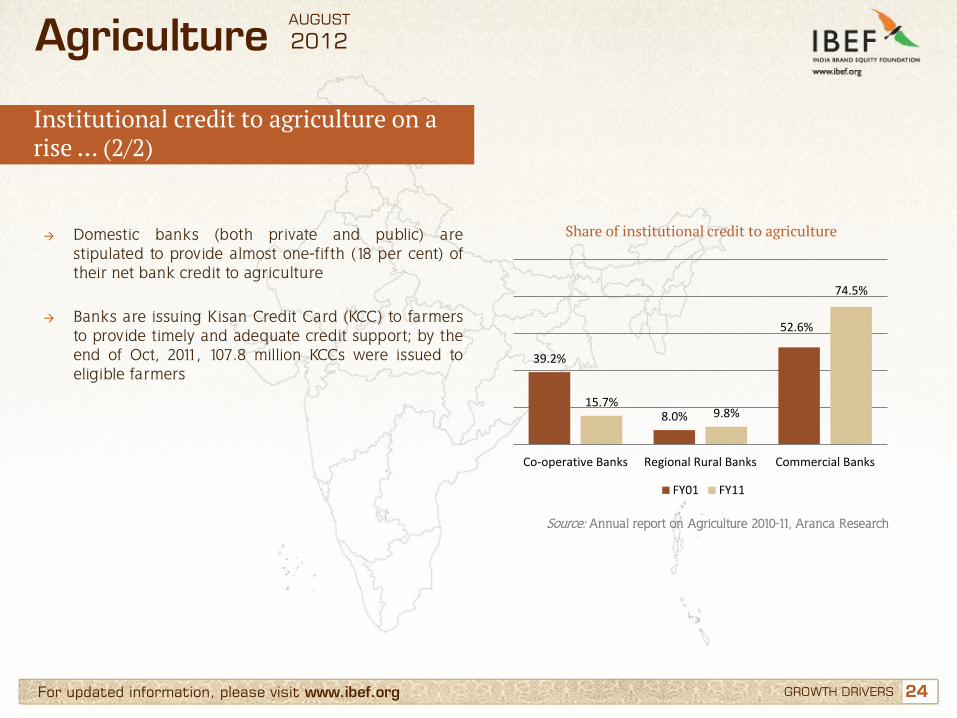
→ Domestic banks (both private and public) are stipulated to provide almost one-fifth (18 per cent) of their net bank credit to agriculture
→ Banks are issuing Kisan Credit Card (KCC) to farmers
to provide timely and adequate credit support; by the end of Oct, 2011, 107.8 million KCCs were issued to eligible farmers
Share of institutional credit to agriculture
Source: Annual report on Agriculture 2010-11, Aranca Research
Institutional credit to agriculture on a rise … (2/2)
39.2%
8.0%
52.6%
15.7% 9.8%
74.5%
Co-operative Banks Regional Rural Banks Commercial Banks
FY01 FY11
AUGUST
2012
25 25 For updated information, please visit www.ibef.org
Rising MSPs incentivise farming … (1/2)
GROWTH DRIVERS
Agriculture
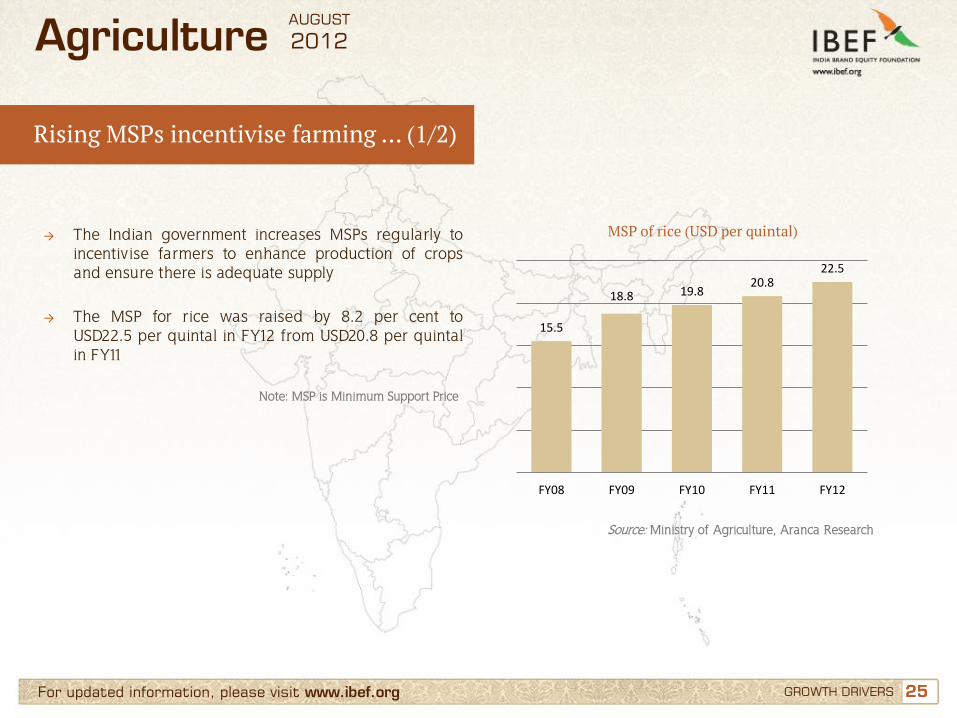
→ The Indian government increases MSPs regularly to incentivise farmers to enhance production of crops and ensure there is adequate supply
→ The MSP for rice was raised by 8.2 per cent to
USD22.5 per quintal in FY12 from USD20.8 per quintal in FY11
MSP of rice (USD per quintal)
Source: Ministry of Agriculture, Aranca Research
Note: MSP is Minimum Support Price
15.5
18.8 19.8 20.8
22.5
FY08 FY09 FY10 FY11 FY12
AUGUST
2012
26 26 For updated information, please visit www.ibef.org
Rising MSPs incentivise farming … (2/2)
GROWTH DRIVERS
Agriculture
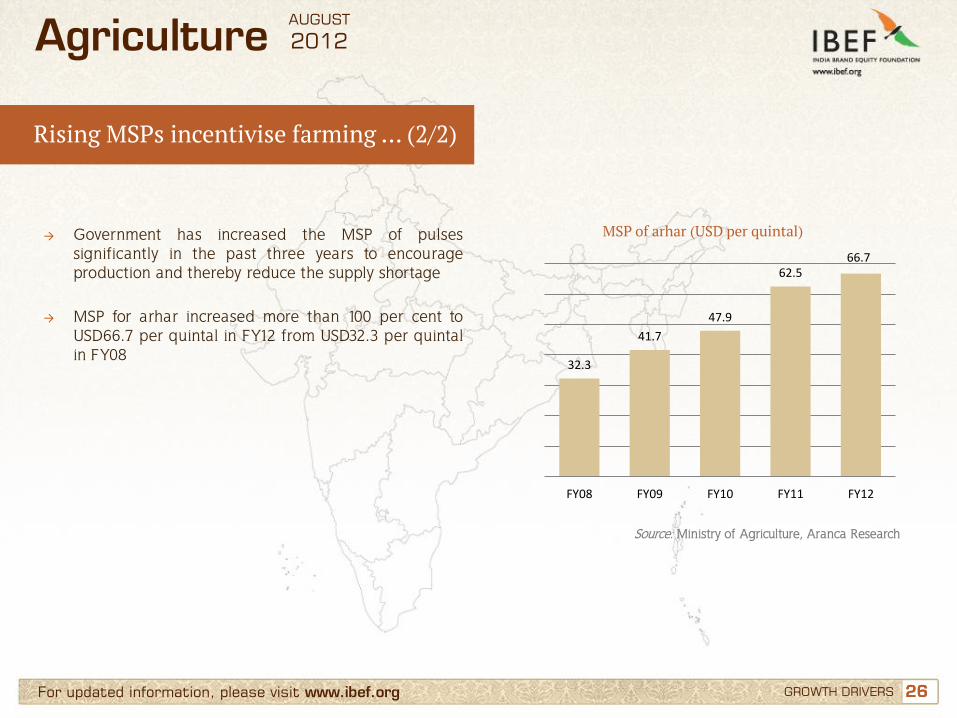
→ Government has increased the MSP of pulses significantly in the past three years to encourage production and thereby reduce the supply shortage
→ MSP for arhar increased more than 100 per cent to
USD66.7 per quintal in FY12 from USD32.3 per quintal in FY08
MSP of arhar (USD per quintal)
Source: Ministry of Agriculture, Aranca Research
32.3
41.7
47.9
62.5 66.7
FY08 FY09 FY10 FY11 FY12
AUGUST
2012
27 27 For updated information, please visit www.ibef.org
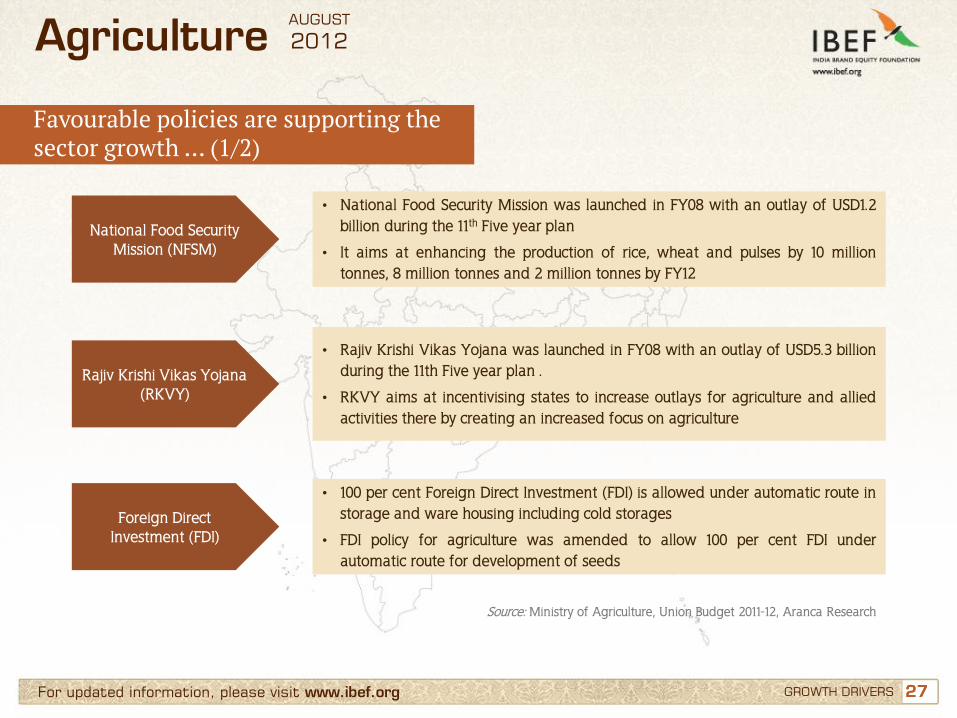
Favourable policies are supporting the sector growth … (1/2)
GROWTH DRIVERS
Agriculture
National Food Security Mission (NFSM)
• National Food Security Mission was launched in FY08 with an outlay of USD1.2 billion during the 11th Five year plan
• It aims at enhancing the production of rice, wheat and pulses by 10 million tonnes, 8 million tonnes and 2 million tonnes by FY12
Rajiv Krishi Vikas Yojana (RKVY)
• Rajiv Krishi Vikas Yojana was launched in FY08 with an outlay of USD5.3 billion during the 11th Five year plan .
• RKVY aims at incentivising states to increase outlays for agriculture and allied activities there by creating an increased focus on agriculture
Foreign Direct Investment (FDI)
• 100 per cent Foreign Direct Investment (FDI) is allowed under automatic route in storage and ware housing including cold storages
• FDI policy for agriculture was amended to allow 100 per cent FDI under automatic route for development of seeds
Source: Ministry of Agriculture, Union Budget 2011-12, Aranca Research
AUGUST
2012
28 28 For updated information, please visit www.ibef.org
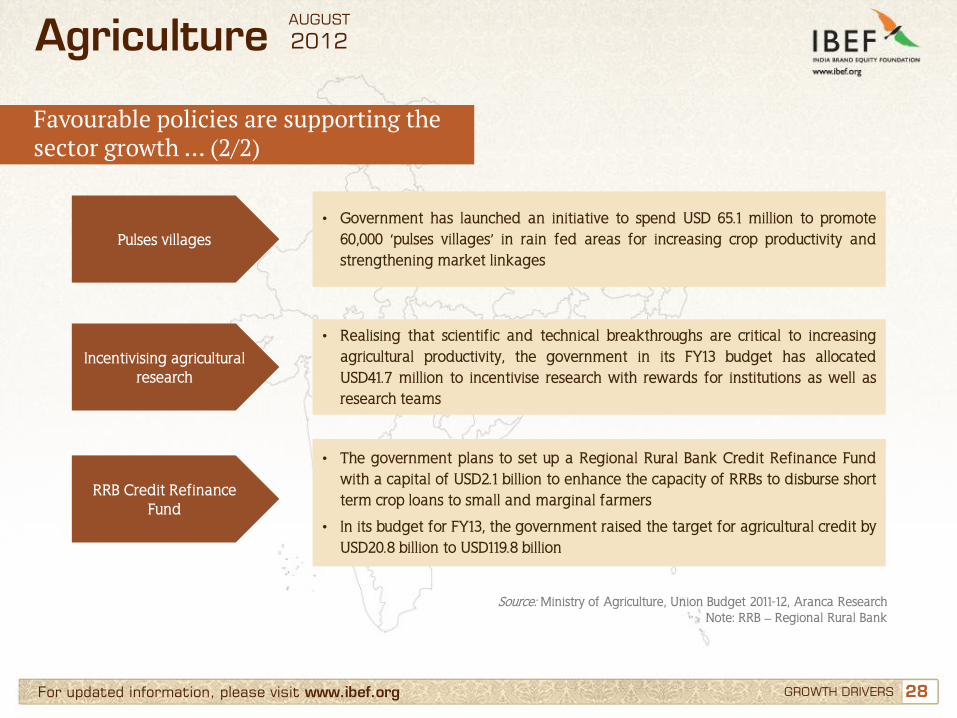
Favourable policies are supporting the sector growth … (2/2)
GROWTH DRIVERS
Agriculture
• Government has launched an initiative to spend USD 65.1 million to promote 60,000 ‘pulses villages’ in rain fed areas for increasing crop productivity and strengthening market linkages
Source: Ministry of Agriculture, Union Budget 2011-12, Aranca Research Note: RRB – Regional Rural Bank
• Realising that scientific and technical breakthroughs are critical to increasing agricultural productivity, the government in its FY13 budget has allocated USD41.7 million to incentivise research with rewards for institutions as well as research teams
Pulses villages
Incentivising agricultural research
• The government plans to set up a Regional Rural Bank Credit Refinance Fund with a capital of USD2.1 billion to enhance the capacity of RRBs to disburse short term crop loans to small and marginal farmers
• In its budget for FY13, the government raised the target for agricultural credit by USD20.8 billion to USD119.8 billion
RRB Credit Refinance Fund
AUGUST
2012
29 29
Contents
Advantage India
Market overview and trends
Growth drivers
Success stories: Green revolution, Rallis India
Opportunities
Useful information
For updated information, please visit www.ibef.org
Agriculture AUGUST
2012
30 30 For updated information, please visit www.ibef.org SUCCESS STORIES: GREEN REVOLUTION, RALLIS INDIA
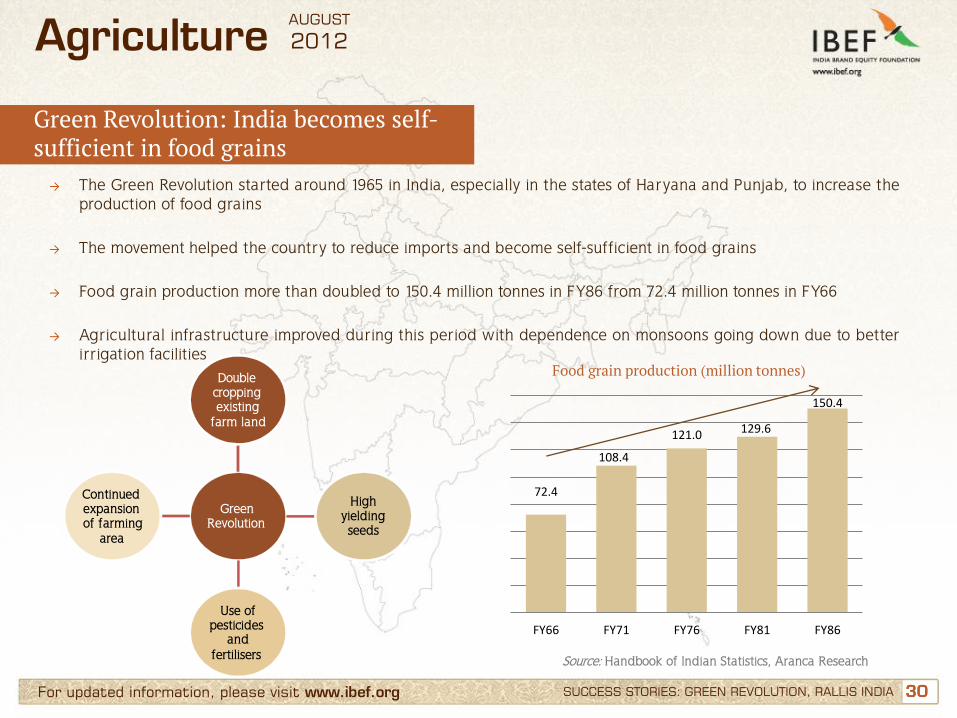
Green Revolution: India becomes self-sufficient in food grains
Agriculture
→ The Green Revolution started around 1965 in India, especially in the states of Haryana and Punjab, to increase the production of food grains
→ The movement helped the country to reduce imports and become self-sufficient in food grains
→ Food grain production more than doubled to 150.4 million tonnes in FY86 from 72.4 million tonnes in FY66 → Agricultural infrastructure improved during this period with dependence on monsoons going down due to better
irrigation facilities
Green Revolution
Double cropping existing
farm land
High yielding seeds
Use of pesticides
and fertilisers
Continued expansion of farming
area
Food grain production (million tonnes)
Source: Handbook of Indian Statistics, Aranca Research
72.4
108.4
121.0 129.6
150.4
FY66 FY71 FY76 FY81 FY86
AUGUST
2012
31 31 For updated information, please visit www.ibef.org
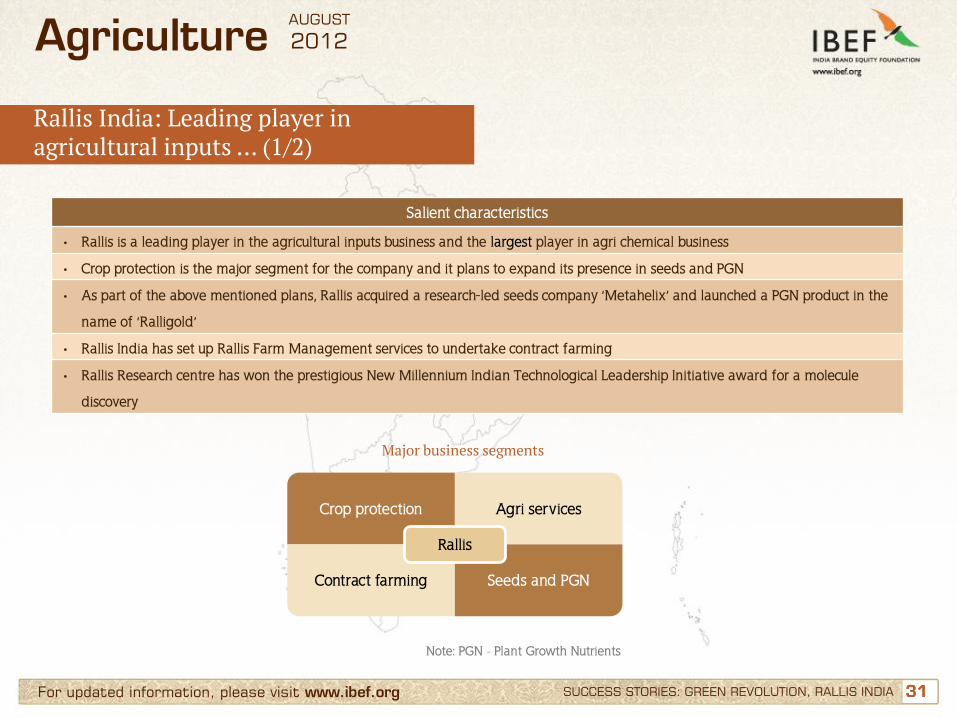
Rallis India: Leading player in agricultural inputs … (1/2)
Agriculture
Note: PGN - Plant Growth Nutrients
Major business segments
Crop protection Agri services
Contract farming Seeds and PGN
Rallis
Salient characteristics
• Rallis is a leading player in the agricultural inputs business and the largest player in agri chemical business
• Crop protection is the major segment for the company and it plans to expand its presence in seeds and PGN
• As part of the above mentioned plans, Rallis acquired a research-led seeds company ‘Metahelix’ and launched a PGN product in the
name of ‘Ralligold’
• Rallis India has set up Rallis Farm Management services to undertake contract farming
• Rallis Research centre has won the prestigious New Millennium Indian Technological Leadership Initiative award for a molecule
discovery
SUCCESS STORIES: GREEN REVOLUTION, RALLIS INDIA
AUGUST
2012
32 32 For updated information, please visit www.ibef.org
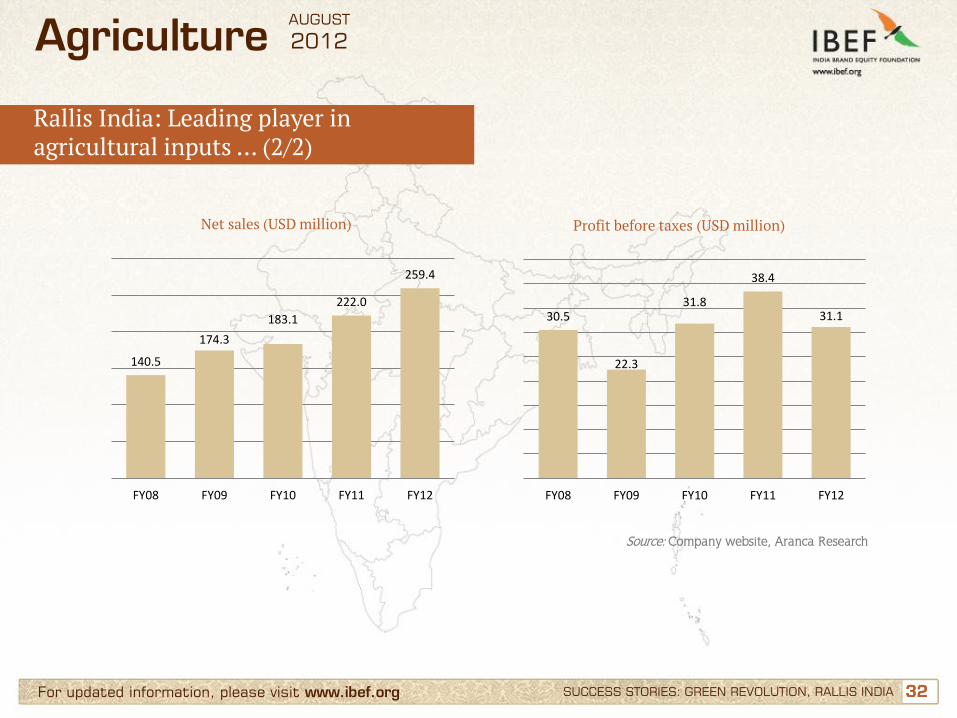
Rallis India: Leading player in agricultural inputs … (2/2)
Agriculture
Net sales (USD million) Profit before taxes (USD million)
Source: Company website, Aranca Research
SUCCESS STORIES: GREEN REVOLUTION, RALLIS INDIA
140.5
174.3
183.1
222.0
259.4
FY08 FY09 FY10 FY11 FY12
30.5
22.3
31.8
38.4
31.1
FY08 FY09 FY10 FY11 FY12
AUGUST
2012
33 33
Contents
Advantage India
Market overview and trends
Growth drivers
Success stories: Green Revolution, Rallis India
Opportunities
Useful information
For updated information, please visit www.ibef.org
Agriculture AUGUST
2012
34 34 For updated information, please visit www.ibef.org OPPORTUNITIES
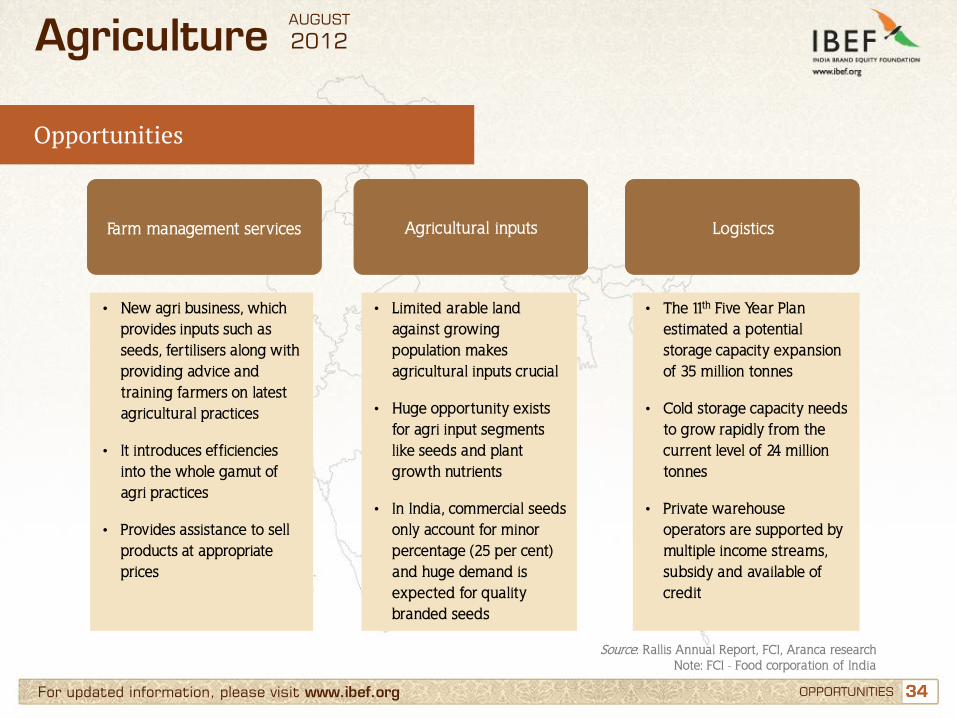
Opportunities
Source: Rallis Annual Report, FCI, Aranca research Note: FCI - Food corporation of India
Agriculture
• New agri business, which provides inputs such as seeds, fertilisers along with providing advice and training farmers on latest agricultural practices
• It introduces efficiencies into the whole gamut of agri practices
• Provides assistance to sell products at appropriate prices
• Limited arable land against growing population makes agricultural inputs crucial
• Huge opportunity exists for agri input segments like seeds and plant growth nutrients
• In India, commercial seeds only account for minor percentage (25 per cent) and huge demand is expected for quality branded seeds
• The 11th Five Year Plan estimated a potential storage capacity expansion of 35 million tonnes
• Cold storage capacity needs to grow rapidly from the current level of 24 million tonnes
• Private warehouse operators are supported by multiple income streams, subsidy and available of credit
Farm management services
Agricultural inputs
Logistics
AUGUST
2012
35
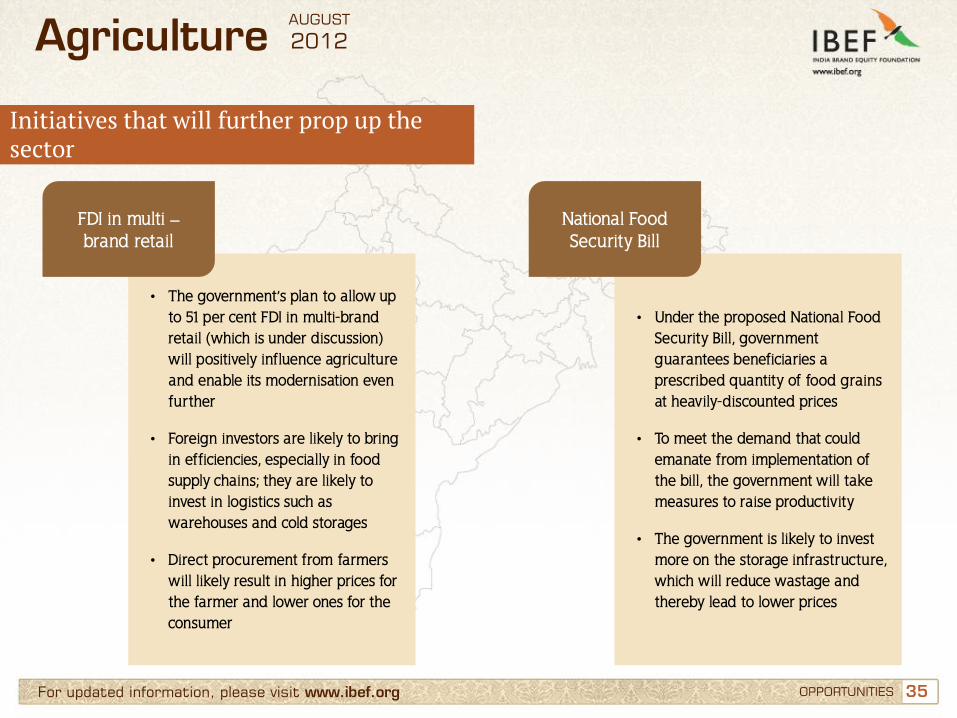
Initiatives that will further prop up the sector
Agriculture
• The government’s plan to allow up to 51 per cent FDI in multi-brand retail (which is under discussion) will positively influence agriculture and enable its modernisation even further
• Foreign investors are likely to bring in efficiencies, especially in food supply chains; they are likely to invest in logistics such as warehouses and cold storages
• Direct procurement from farmers will likely result in higher prices for the farmer and lower ones for the consumer
• Under the proposed National Food Security Bill, government guarantees beneficiaries a prescribed quantity of food grains at heavily-discounted prices
• To meet the demand that could emanate from implementation of the bill, the government will take measures to raise productivity
• The government is likely to invest more on the storage infrastructure, which will reduce wastage and thereby lead to lower prices
FDI in multi – brand retail
National Food Security Bill
For updated information, please visit www.ibef.org OPPORTUNITIES
AUGUST
2012
36 36
Contents
Advantage India
Market overview and trends
Growth drivers
Success stories: Green Revolution, Rallis India
Opportunities
Useful information
For updated information, please visit www.ibef.org
Agriculture AUGUST
2012
37 37 For updated information, please visit www.ibef.org USEFUL INFORMATION
Industry Associations … (1/2)
Autonomous Bodies • National Institute of Agricultural Extension Management
Rajendranagar, Hyderabad–500 030, Andhra Pradesh Phone: 040-24016702 to 706 Fax: 040-24015388
• National Institute of Agricultural Marketing (NIAM) Bambala, Kota Road Jaipur–302033, Rajasthan Phone: 0141-2770027 Fax: 0141-2771938, 2770027
Boards • Central Insecticides Board and Registration Committee Machinary Store Building, N.H.IV Faridabad Phone: 0129 -2413002 • Coconut Development Board Kera Bhavan, SRVHS Road, Kochi Kerala–682011
Phone: 0484-2376265, 2377267, 2376553 Fax: 0484-2377902
Agriculture AUGUST
2012
38 38 For updated information, please visit www.ibef.org
Industry Associations … (2/2)
• National Dairy Development Board (NDDB) PB No 40, Anand–388 001 Phone: 02692-260148/260149/260160 Fax: 02692-260157
• National Horticulture Board (NHB)
Ministry of Agriculture, Government of India 85, Institutional Area, Sector-18 Gurgaon–122015, Haryana
• National Oilseeds and Vegetable Oils Development Board
(NOVOD) 86, Institutional Area, Sector-18 Gurgaon–122015, Haryana
Councils • Indian Council of Agricultural Research (ICAR)
Krishi Bhavan, New Delhi 110 114 Phone: 91-11-25846010
USEFUL INFORMATION
Agriculture AUGUST
2012
39 39 For updated information, please visit www.ibef.org
Glossary
→ AIBP: Accelerated Irrigation Benefit Programme → Breeder seeds : Seeds move from germplasm ( research) stage to breeder stage
→ CAGR: Compound annual growth rate
→ Certified/quality seeds : Foundation seeds are further multiplied to get certified seeds, which are sold to farmers → FMTTI : Farm Machinery Training and Testing Institutes
→ Foundation seeds : Breeder seeds are multiplied as foundation seeds
→ FY: Indian financial year (April to March)– FY12 implies April 2011 to March 2012
→ KCC: Kisan Credit card
→ MSP : Minimum Support Prices
→ NFSM : National Food security mission
→ NMAM: National Mission on Agricultural Mechanisation → PGN : Plant Growth Nutrients
→ RKVY : Rashtriya Krushi Vikas Yojana is a central government scheme providing funds to state governments to spend on
agriculture
→ USD: US Dollar– Conversion rate used: USD 1 = INR 48
→ Wherever applicable, numbers have been rounded off to the nearest whole number
USEFUL INFORMATION
Agriculture AUGUST
2012
40
India Brand Equity Foundation (IBEF) engaged Aranca to prepare this presentation and the same has been prepared by Aranca in consultation with IBEF. All rights reserved. All copyright in this presentation and related works is solely and exclusively owned by IBEF. The same may not be reproduced, wholly or in part in any material form (including photocopying or storing it in any medium by electronic means and whether or not transiently or incidentally to some other use of this presentation), modified or in any manner communicated to any third party except with the written approval of IBEF. This presentation is for information purposes only. While due care has been taken during the compilation of this
presentation to ensure that the information is accurate to the best of Aranca and IBEF’s knowledge and belief, the content is not to be construed in any manner whatsoever as a substitute for professional advice. Aranca and IBEF neither recommend nor endorse any specific products or services that may have been mentioned in this presentation and nor do they assume any liability or responsibility for the outcome of decisions taken as a result of any reliance placed on this presentation. Neither Aranca nor IBEF shall be liable for any direct or indirect damages that may arise due to any act or omission on the part of the user due to any reliance placed or guidance taken from any portion of this presentation.
Disclaimer
For updated information, please visit www.ibef.org DISCLAIMER
Agriculture AUGUST
2012


![Department of Agriculture and Cooperation, Ministry of ......Department of Agriculture and Cooperation, Ministry of Agriculture, Government of India, New Delhi [2] National Agricultural](https://img.pdfslide.net/doc/110x75/5f89066a747baa1cb15eb13b/department-of-agriculture-and-cooperation-ministry-of-department-of-agriculture.jpg)