Embed Size (px)
Citation preview

AHRQ State and Regional Demonstration Project Evaluation:
Kevin B. Johnson, MD, MSAssociate Professor, Biomedical Informatics,
Vanderbilt University Medical CenterNashville, Tennessee
Barbeque, Blues,
Beneficial Technology
Barbeque, Blues,
Beneficial Technology

2
Project Overview
3
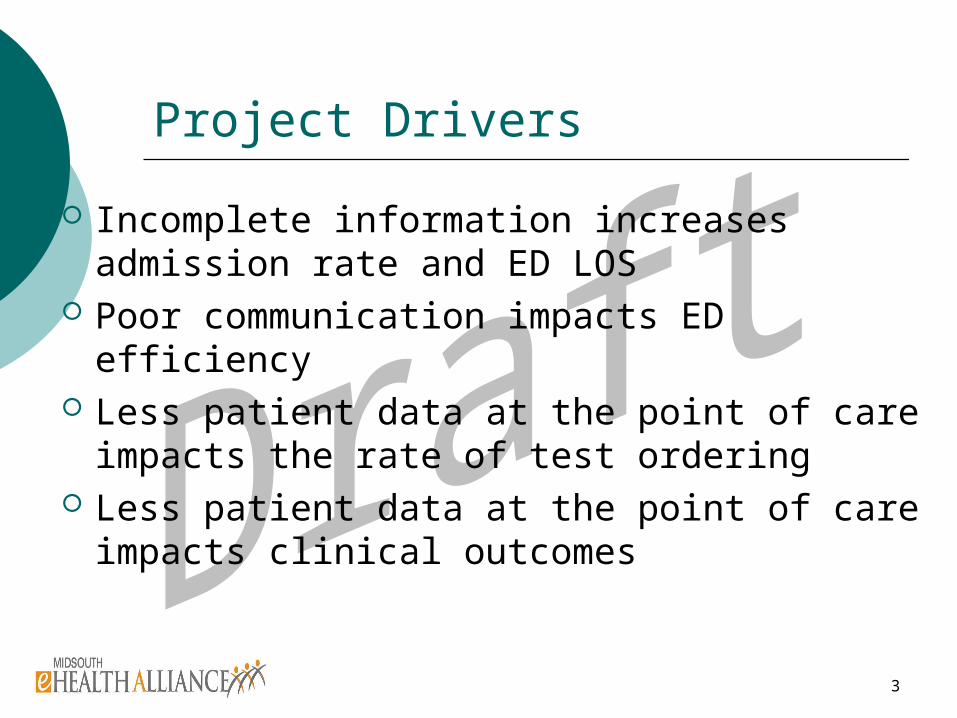
Project Drivers
Incomplete information increases admission rate and ED LOS
Poor communication impacts ED efficiency Less patient data at the point of care
impacts the rate of test ordering Less patient data at the point of care
impacts clinical outcomes
4
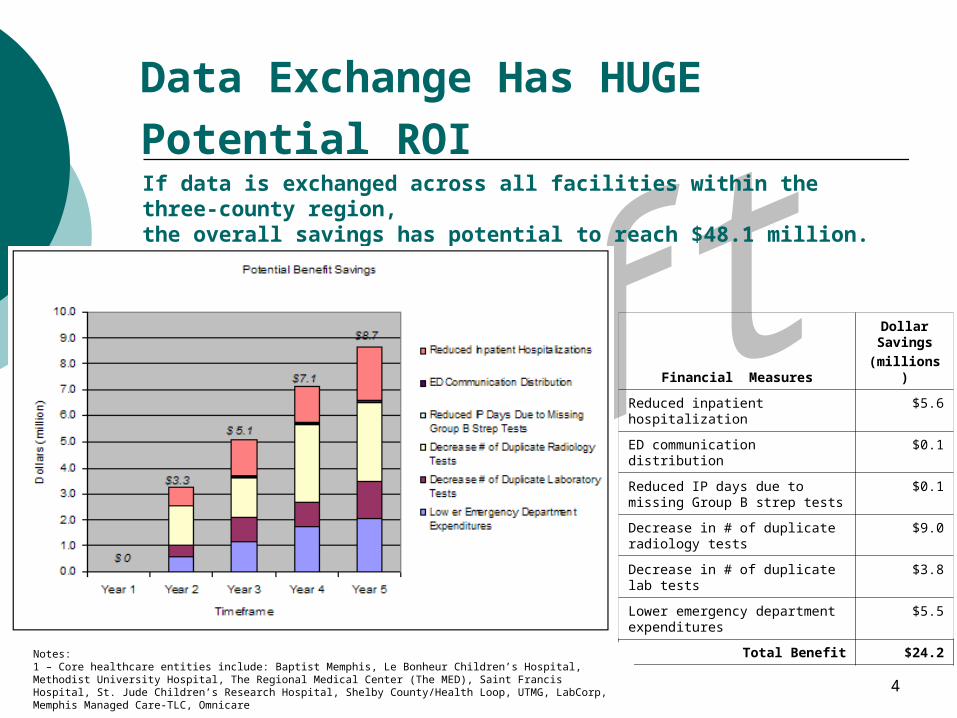
Data Exchange Has HUGE
Potential ROI
Financial Measures
Dollar Savings
(millions)
Reduced inpatient hospitalization
$5.6
ED communication distribution $0.1
Reduced IP days due to missing Group B strep tests
$0.1
Decrease in # of duplicate radiology tests
$9.0
Decrease in # of duplicate lab tests
$3.8
Lower emergency department expenditures
$5.5
Total Benefit $24.2
If data is exchanged across all facilities within the three-county region, the overall savings has potential to reach $48.1 million.
Notes:1 – Core healthcare entities include: Baptist Memphis, Le Bonheur Children’s Hospital, Methodist University Hospital, The Regional Medical Center (The MED), Saint Francis Hospital, St. Jude Children’s Research Hospital, Shelby County/Health Loop, UTMG, LabCorp, Memphis Managed Care-TLC, Omnicare
5
Qualitative Research
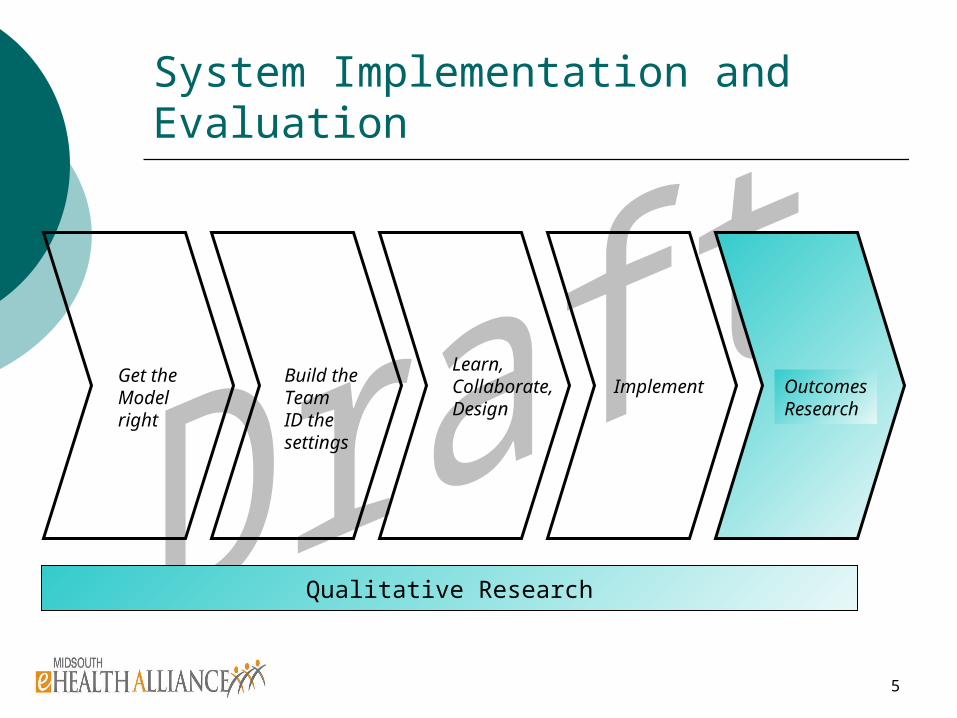
System Implementation and Evaluation
Get the Model right
Build theTeamID the settings
Learn,Collaborate,Design
Implement OutcomesResearch
Qualitative Research
6
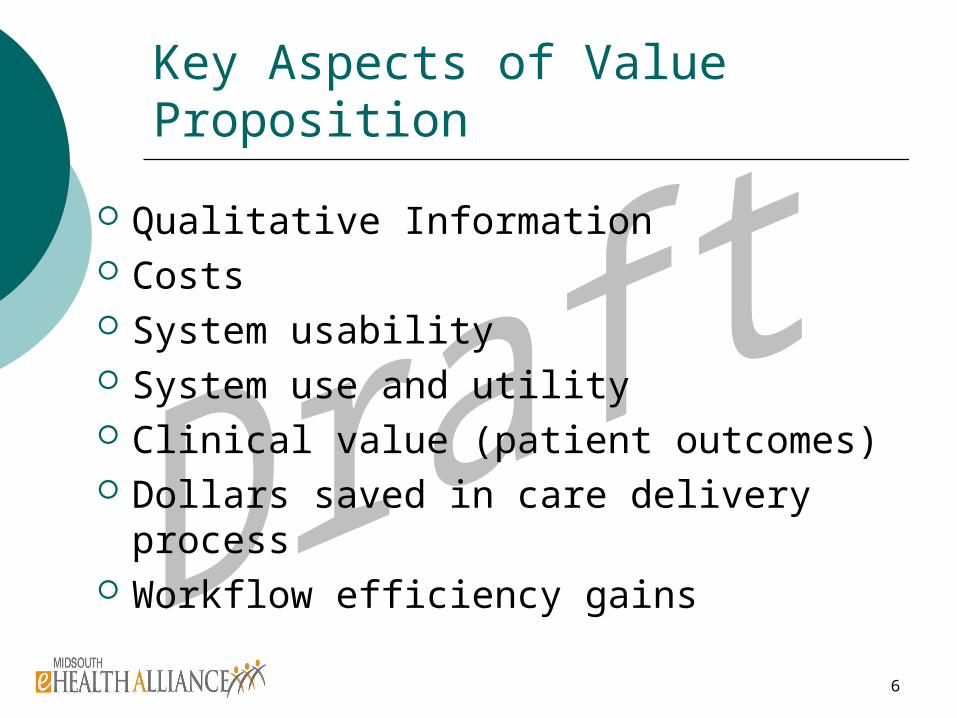
Key Aspects of Value Proposition
Qualitative Information Costs System usability System use and utility Clinical value (patient outcomes) Dollars saved in care delivery process Workflow efficiency gains

7
Qualitative Questions
Usability (focus groups in ED) 1 month and 1 year after go-live
Barriers to implementing infrastructure (cognitive artifacts) Evaluated in year 4
Drivers for adoption (interviews of governing board and ED staff) Evaluated in year 5
8
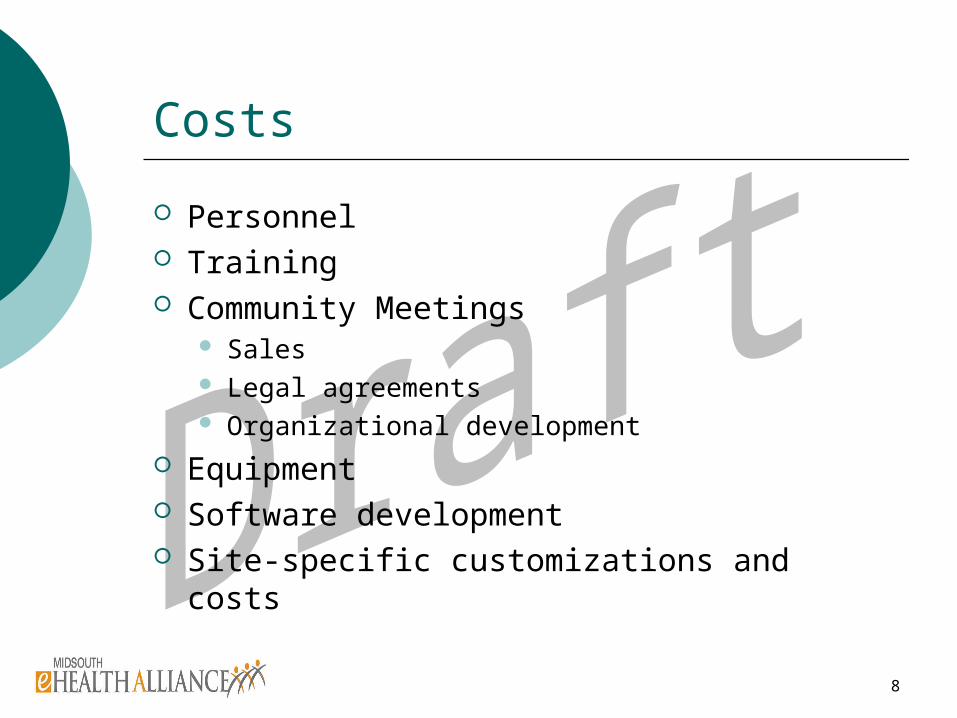
Costs
Personnel Training Community Meetings
Sales Legal agreements Organizational development
Equipment Software development Site-specific customizations and costs
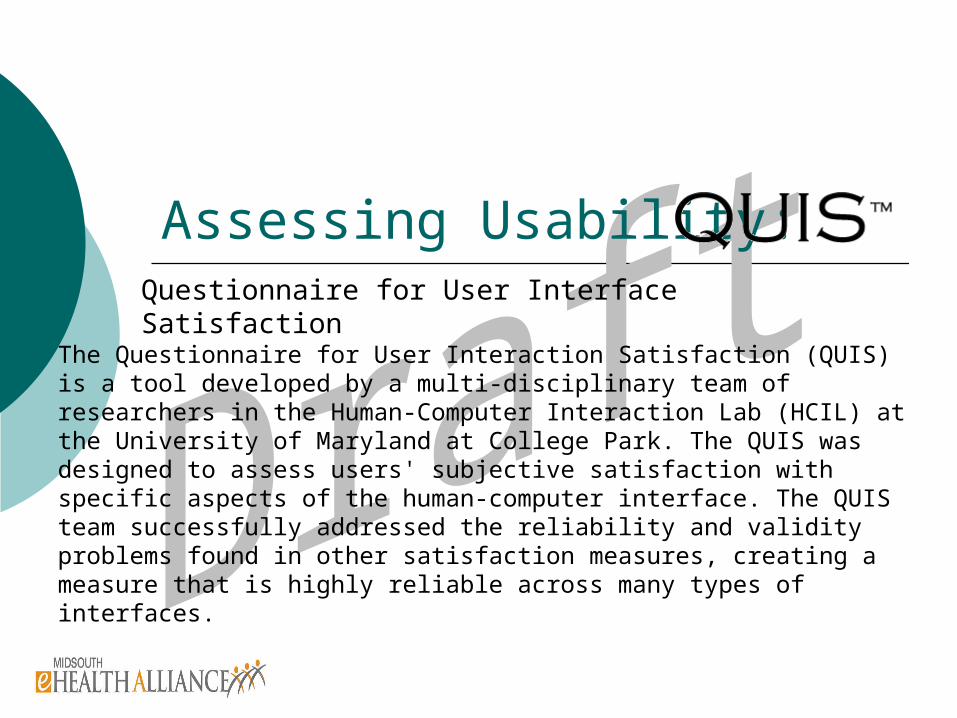
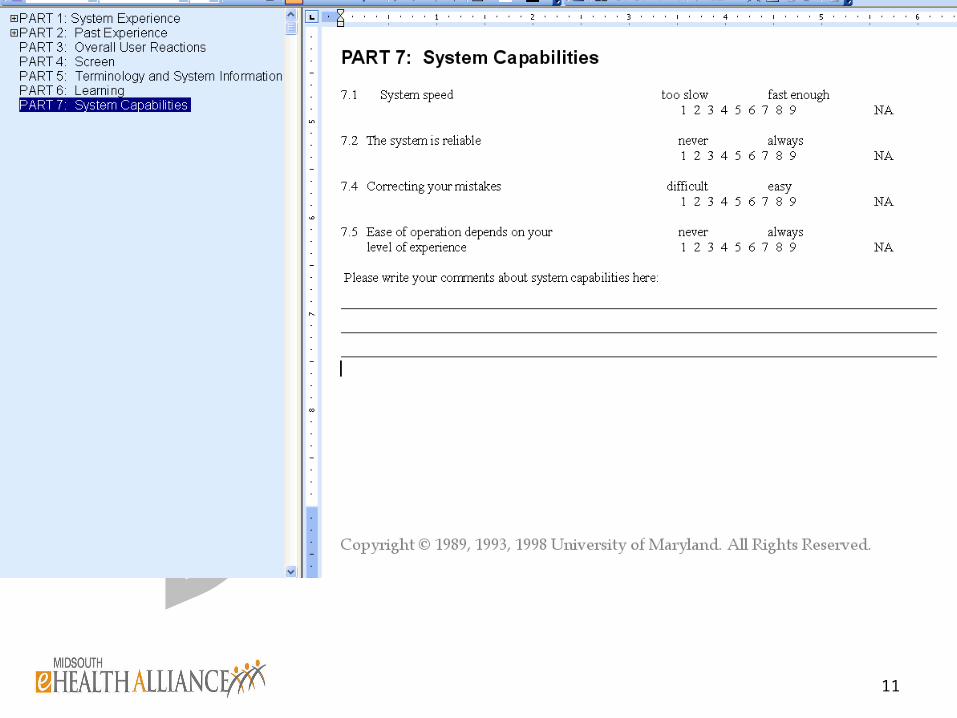
Assessing Usability:Questionnaire for User Interface Satisfaction
The Questionnaire for User Interaction Satisfaction (QUIS) is a tool developed by a multi-disciplinary team of researchers in the Human-Computer Interaction Lab (HCIL) at the University of Maryland at College Park. The QUIS was designed to assess users' subjective satisfaction with specific aspects of the human-computer interface. The QUIS team successfully addressed the reliability and validity problems found in other satisfaction measures, creating a measure that is highly reliable across many types of interfaces.
10
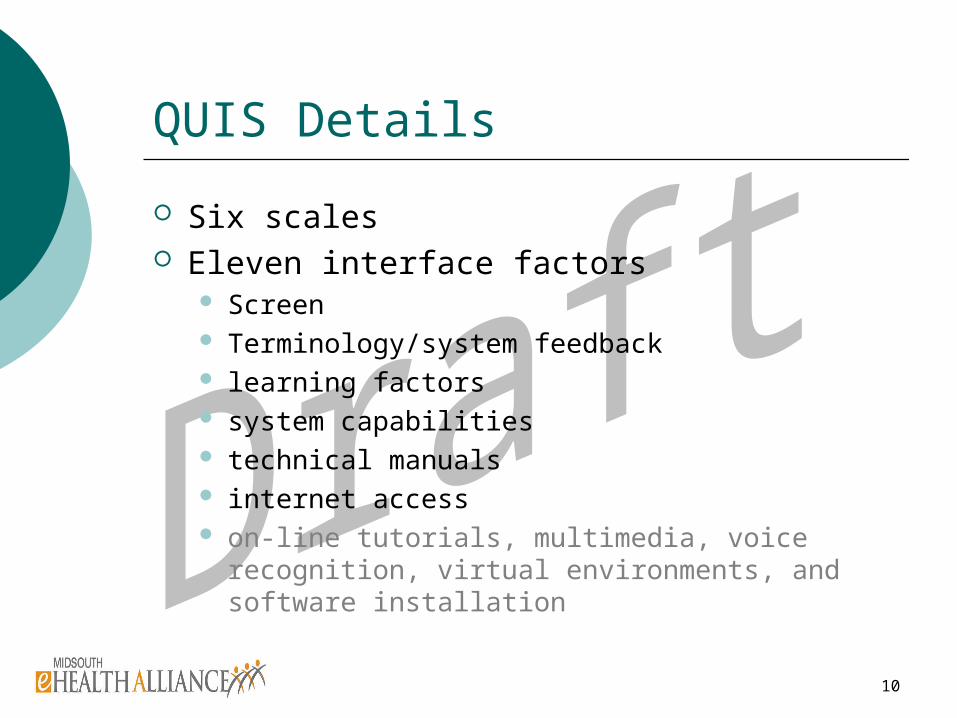
QUIS Details
Six scales Eleven interface factors
Screen Terminology/system feedback learning factors system capabilities technical manuals internet access on-line tutorials, multimedia, voice recognition,
virtual environments, and software installation
11
12
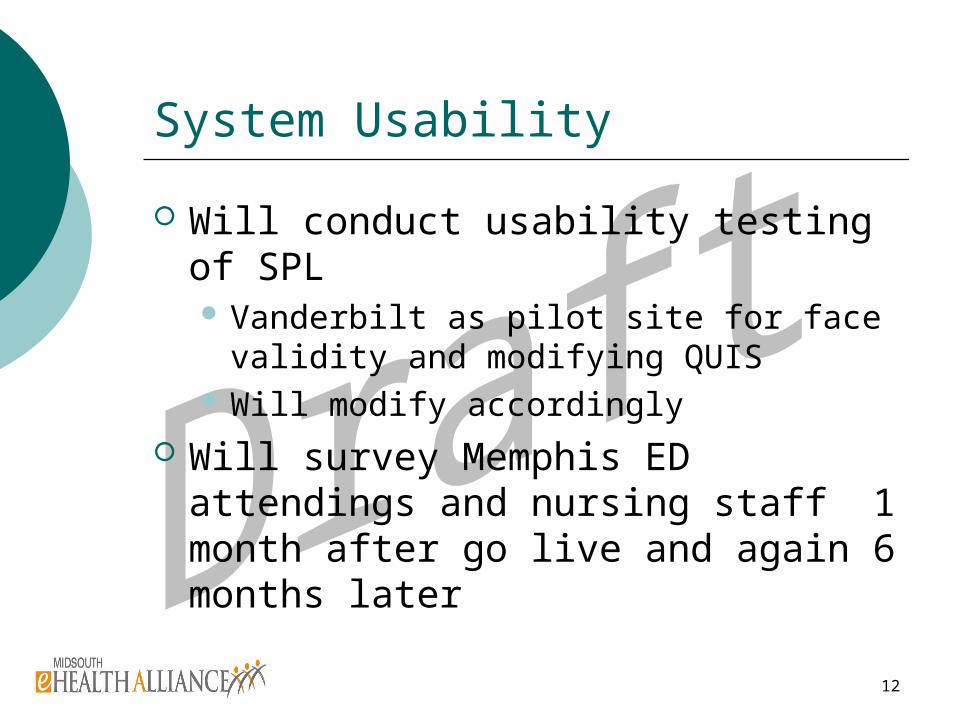
System Usability
Will conduct usability testing of SPL Vanderbilt as pilot site for face validity
and modifying QUIS Will modify accordingly
Will survey Memphis ED attendings and nursing staff 1 month after go live and again 6 months later
13
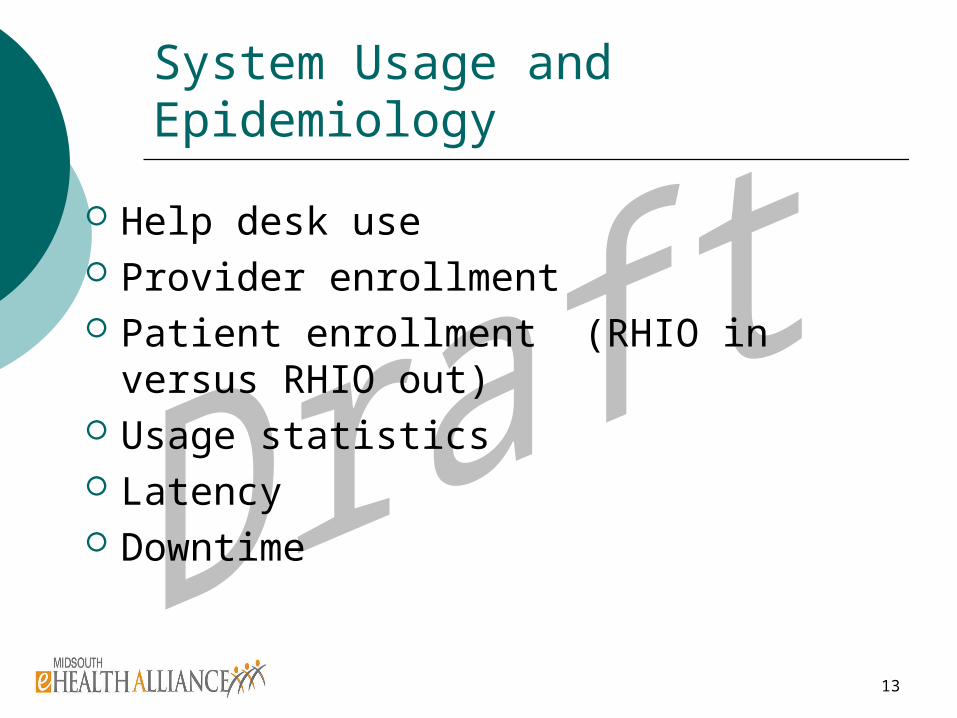
System Usage and Epidemiology
Help desk use Provider enrollment Patient enrollment (RHIO in versus
RHIO out) Usage statistics Latency Downtime
14
Content Quality
Accuracy Missing data Categorization errors
15
Disease-specific Hypotheses
Improved neonatal GBBS management Improved asthma controller med use Improved ACE/ARB use in CHF Improved immunization rates (flu,
s.pneumo) ?Others
16
ED Administrative Outcomes
Reduce inpatient admissions Decreased duplicate testing
(radiology and lab) Decreased ED Expenses
Workflow efficiency Costs per visit
17
Workflow change
Activity-based costing Model construction at Vanderbilt Model validation in Memphis Use model to construct activity
matrices in EDs under study Assess how activity matrices change
pre and 1 year post implementation
18
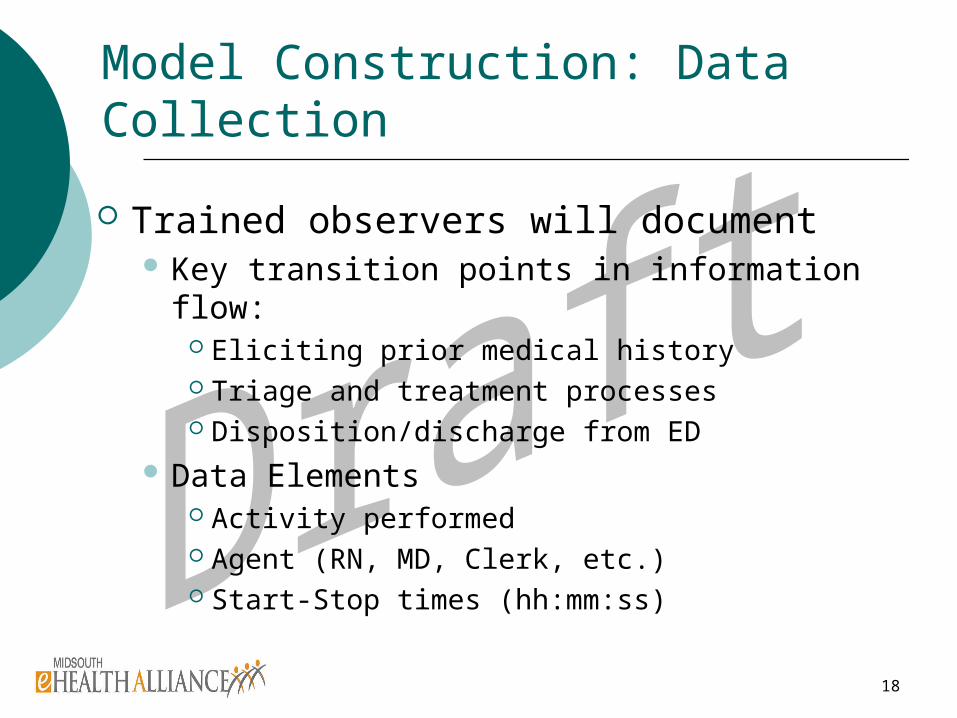
Model Construction: Data Collection
Trained observers will document Key transition points in information flow:
Eliciting prior medical history Triage and treatment processes Disposition/discharge from ED
Data Elements Activity performed Agent (RN, MD, Clerk, etc.) Start-Stop times (hh:mm:ss)
19
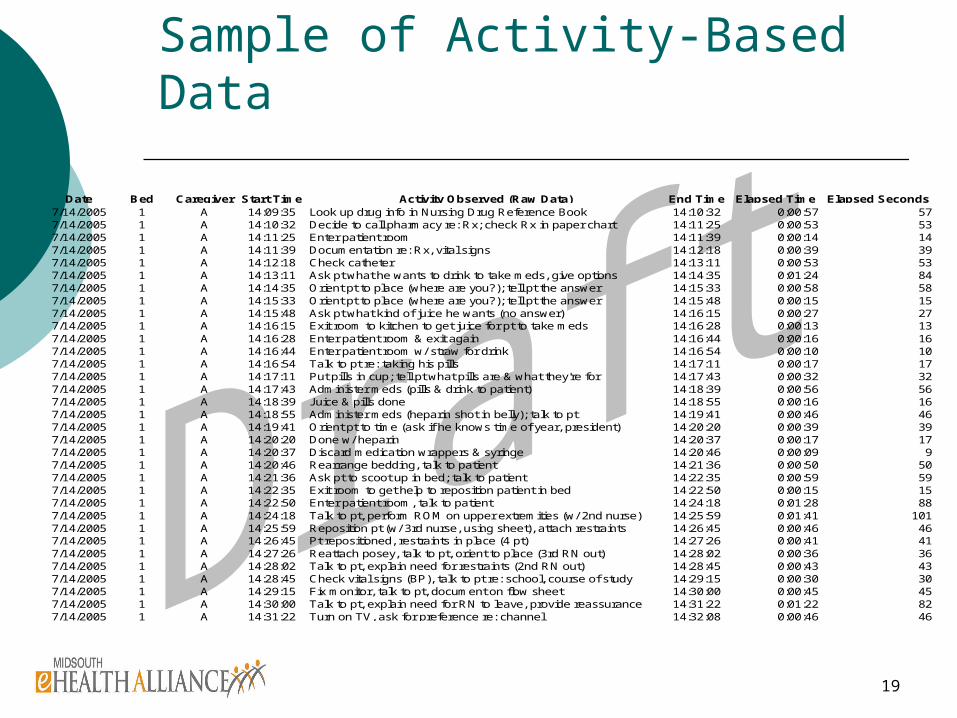
Sample of Activity-Based Data
Date Bed Caregiver Start Time Activity Observed (Raw Data) End Time Elapsed Time Elapsed Seconds7/14/2005 1 A 14:09:35 Look up drug info in Nursing Drug Reference Book 14:10:32 0:00:57 577/14/2005 1 A 14:10:32 Decide to call pharmacy re: Rx; check Rx in paper chart 14:11:25 0:00:53 537/14/2005 1 A 14:11:25 Enter patient room 14:11:39 0:00:14 147/14/2005 1 A 14:11:39 Documentation re: Rx, vital signs 14:12:18 0:00:39 397/14/2005 1 A 14:12:18 Check catheter 14:13:11 0:00:53 537/14/2005 1 A 14:13:11 Ask pt what he wants to drink to take meds, give options 14:14:35 0:01:24 847/14/2005 1 A 14:14:35 Orient pt to place (where are you?); tell pt the answer 14:15:33 0:00:58 587/14/2005 1 A 14:15:33 Orient pt to place (where are you?); tell pt the answer 14:15:48 0:00:15 157/14/2005 1 A 14:15:48 Ask pt what kind of juice he wants (no answer) 14:16:15 0:00:27 277/14/2005 1 A 14:16:15 Exit room to kitchen to get juice for pt to take meds 14:16:28 0:00:13 137/14/2005 1 A 14:16:28 Enter patient room & exit again 14:16:44 0:00:16 167/14/2005 1 A 14:16:44 Enter patient room w/ straw for drink 14:16:54 0:00:10 107/14/2005 1 A 14:16:54 Talk to pt re: taking his pills 14:17:11 0:00:17 177/14/2005 1 A 14:17:11 Put pills in cup; tell pt what pills are & what they're for 14:17:43 0:00:32 327/14/2005 1 A 14:17:43 Administer meds (pills & drink to patient) 14:18:39 0:00:56 567/14/2005 1 A 14:18:39 Juice & pills done 14:18:55 0:00:16 167/14/2005 1 A 14:18:55 Administer meds (heparin shot in belly); talk to pt 14:19:41 0:00:46 467/14/2005 1 A 14:19:41 Orient pt to time (ask if he knows time of year, president) 14:20:20 0:00:39 397/14/2005 1 A 14:20:20 Done w/ heparin 14:20:37 0:00:17 177/14/2005 1 A 14:20:37 Discard medication wrappers & syringe 14:20:46 0:00:09 97/14/2005 1 A 14:20:46 Rearrange bedding, talk to patient 14:21:36 0:00:50 507/14/2005 1 A 14:21:36 Ask pt to scoot up in bed; talk to patient 14:22:35 0:00:59 597/14/2005 1 A 14:22:35 Exit room to get help to reposition patient in bed 14:22:50 0:00:15 157/14/2005 1 A 14:22:50 Enter patient room, talk to patient 14:24:18 0:01:28 887/14/2005 1 A 14:24:18 Talk to pt, perform ROM on upper extremities (w/ 2nd nurse) 14:25:59 0:01:41 1017/14/2005 1 A 14:25:59 Reposition pt (w/ 3rd nurse, using sheet), attach restraints 14:26:45 0:00:46 467/14/2005 1 A 14:26:45 Pt repositioned, restraints in place (4 pt) 14:27:26 0:00:41 417/14/2005 1 A 14:27:26 Reattach posey, talk to pt, orient to place (3rd RN out) 14:28:02 0:00:36 367/14/2005 1 A 14:28:02 Talk to pt, explain need for restraints (2nd RN out) 14:28:45 0:00:43 437/14/2005 1 A 14:28:45 Check vital signs (BP), talk to pt re: school, course of study 14:29:15 0:00:30 307/14/2005 1 A 14:29:15 Fix monitor, talk to pt, document on flow sheet 14:30:00 0:00:45 457/14/2005 1 A 14:30:00 Talk to pt, explain need for RN to leave, provide reassurance 14:31:22 0:01:22 827/14/2005 1 A 14:31:22 Turn on TV, ask for preference re: channel 14:32:08 0:00:46 46
22
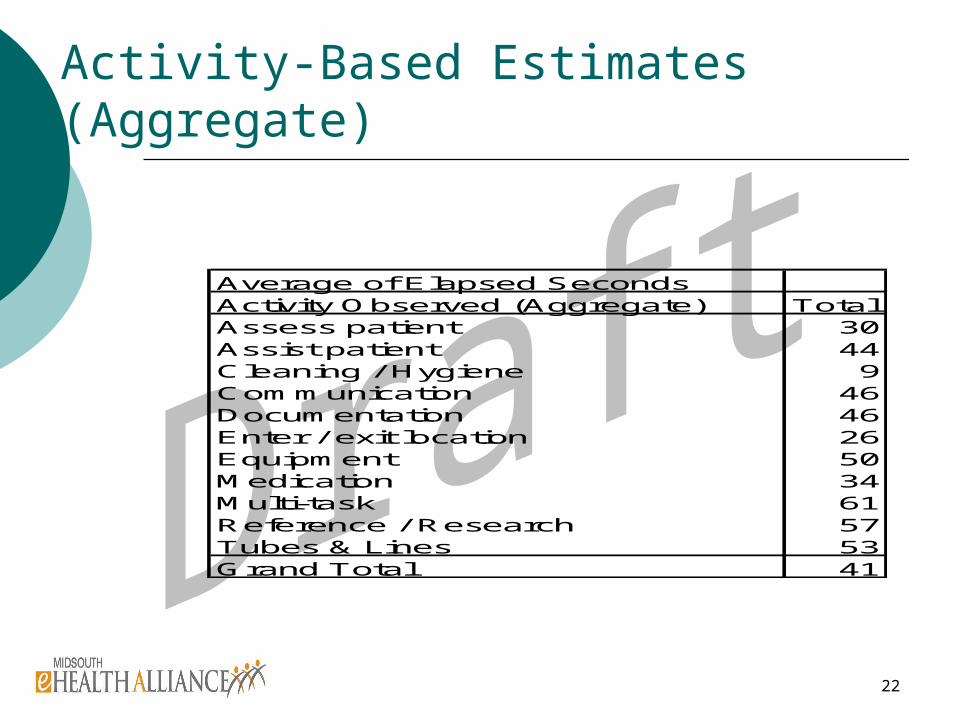
Activity-Based Estimates (Aggregate)
Average of Elapsed SecondsActivity Observed (Aggregate) TotalAssess patient 30Assist patient 44Cleaning / Hygiene 9Communication 46Documentation 46Enter / exit location 26Equipment 50Medication 34Multi-task 61Reference / Research 57Tubes & Lines 53Grand Total 41
27
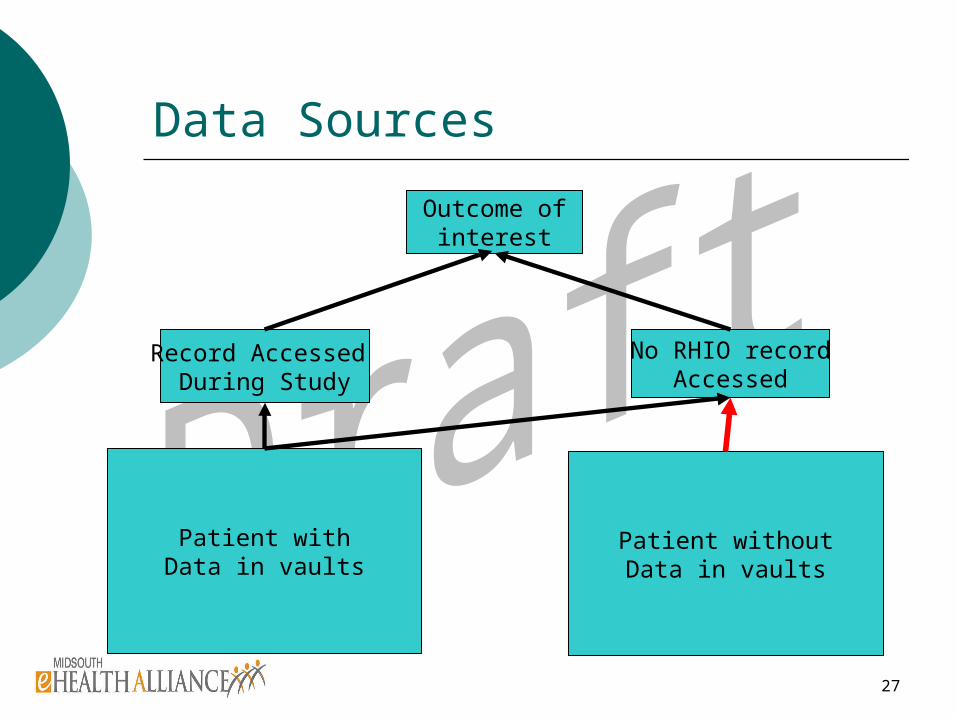
Data Sources
Patient withData in vaults
Patient withoutData in vaults
Record Accessed During Study
No RHIO recordAccessed
Outcome ofinterest
28
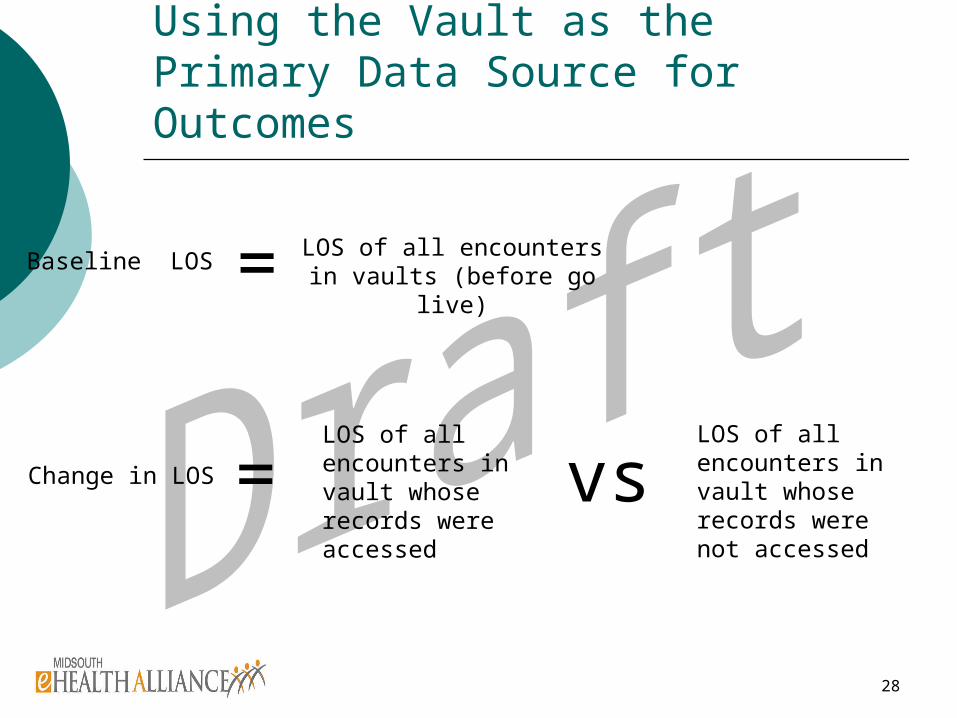
Using the Vault as the Primary Data Source for Outcomes
Change in LOS
LOS of all encounters in vault whose records were not accessed
LOS of all encounters in vault whose records were accessed
= vs
LOS of all encounters in vaults (before go live)
Baseline LOS =
30
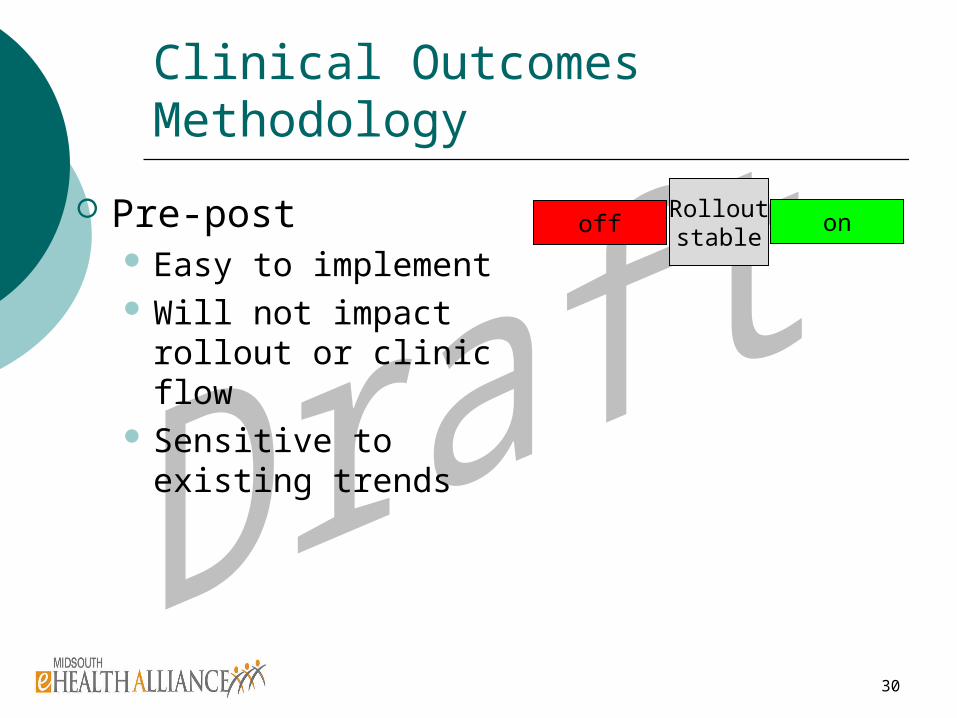
Clinical Outcomes Methodology
Pre-post Easy to implement Will not impact rollout
or clinic flow Sensitive to existing
trends
off onRolloutstable
31
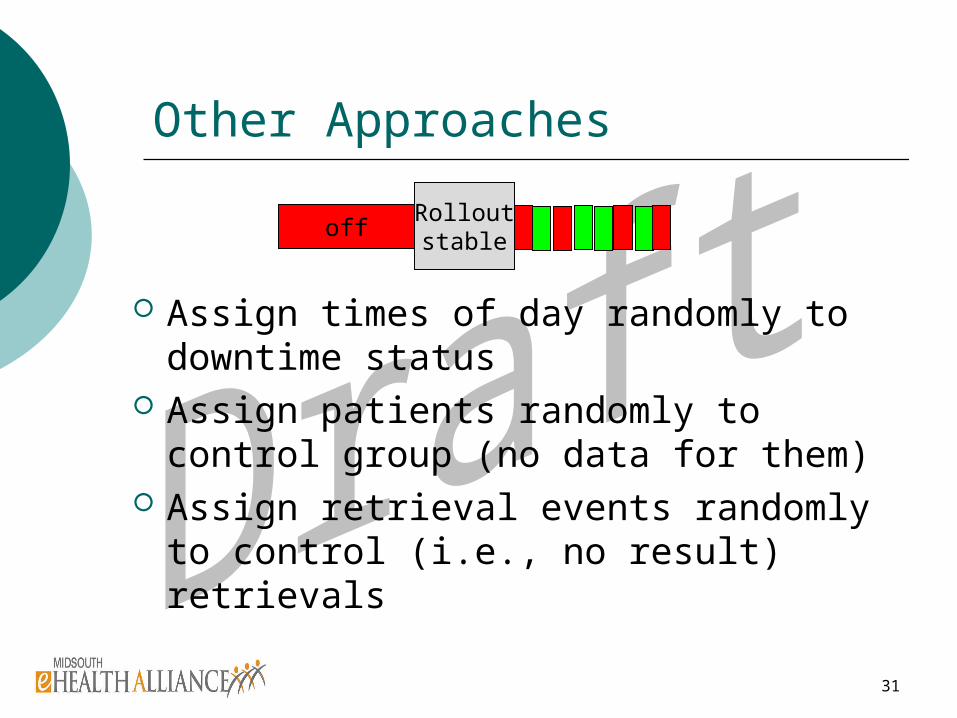
Other Approaches
Assign times of day randomly to downtime status
Assign patients randomly to control group (no data for them)
Assign retrieval events randomly to control (i.e., no result) retrievals
offRolloutstable
32
Covariate Analysis
ED (site) characteristics survey to be completed by ED Administration
Readiness survey to be completed by ED administration and clinical leadership
33
IRB Approach: Five Approvals
Activity-based costing (approved) Usability, readiness and demographic
survey (letters of cooperation) Baseline data for administrative
measures and activity costing System content quality Disease-specific hypotheses

34
Thanks!