Embed Size (px)
Citation preview
Abstract—The present study aimed at investigating the effect
of boundary layer suction and blowing on the aerodynamic performance of the wing/fuselage junction of a tiltrotor. A series of numerical analyses were performed in order to identify the optimal shape and location of the suction/blowing slot and a preliminary cost-benefit analysis was carried out as well by comparing the increased on board installed power required by these systems with the estimated gain in propulsive power.
Index Terms—Boundary-layer, Suction, Blowing, Tiltrotor
I. INTRODUCTION
variety of approaches have been developed for increasing lift/drag ratio of wings by artificial means
based on pneumatic devices, including boundary layer control (BLC) methodologies. These methods make it possible to delay boundary layer separation on the wing suction side and augment maximum lift (i) by removing the low energy fluid from the boundary layer through suction slots or holes and/or (ii) by accelerating the low energy fluid using high energy flow blown into the boundary layer.
In the last two decades, as a result of the continuous efforts spent in CFD calculations and a more diffuse access to adequate computational resources, research in the field of alternative devices has moved in the branch of computational fluid dynamics ([1], [2]), which, in the proper context, could become an affordable, practical, systematic and reliable alternative to experiments.
The present work describes a numerical investigation on the effect of pneumatic devices, in particular boundary layer suction and blowing, on the wing/fuselage junction of the new generation tiltrotor ERICA [3] (Enhanced Rotorcraft Innovative Concept Achievement). The study was focused on identifying the benefits obtained in terms of maximum lift coefficient growth and drag reduction. To this purpose, a parametric study was carried out aimed at identifying the most promising position and shape for the boundary layer
The present research has been funded in the framework of the Joint
Technology Initiatives - Clean Sky under Grant Agreement No. 270609 “CODE-Tilt, Contribution to design optimization of tiltrotor components for drag reduction” [6], [7].
Rita Ponza, Senior Researcher at HIT09 s.r.l. Galleria Storione 8, 35100 Padova, Italy (e-mail: [email protected]).
Nicola Simioni, Researcher at HIT09 s.r.l. Galleria Storione 8, 35100 Padova, Italy (e-mail: [email protected]).
Ernesto Benini, Associate Professor, Department of Industrial Engineering, University of Padova, Italy (e-mail: [email protected]).
suction/blowing slots using different values of the mass flow rate. In addition, a preliminary evaluation of the required power for both kinds of pneumatic devices was carried out.
II. GEOMETRY AND COMPUTATIONAL MESH
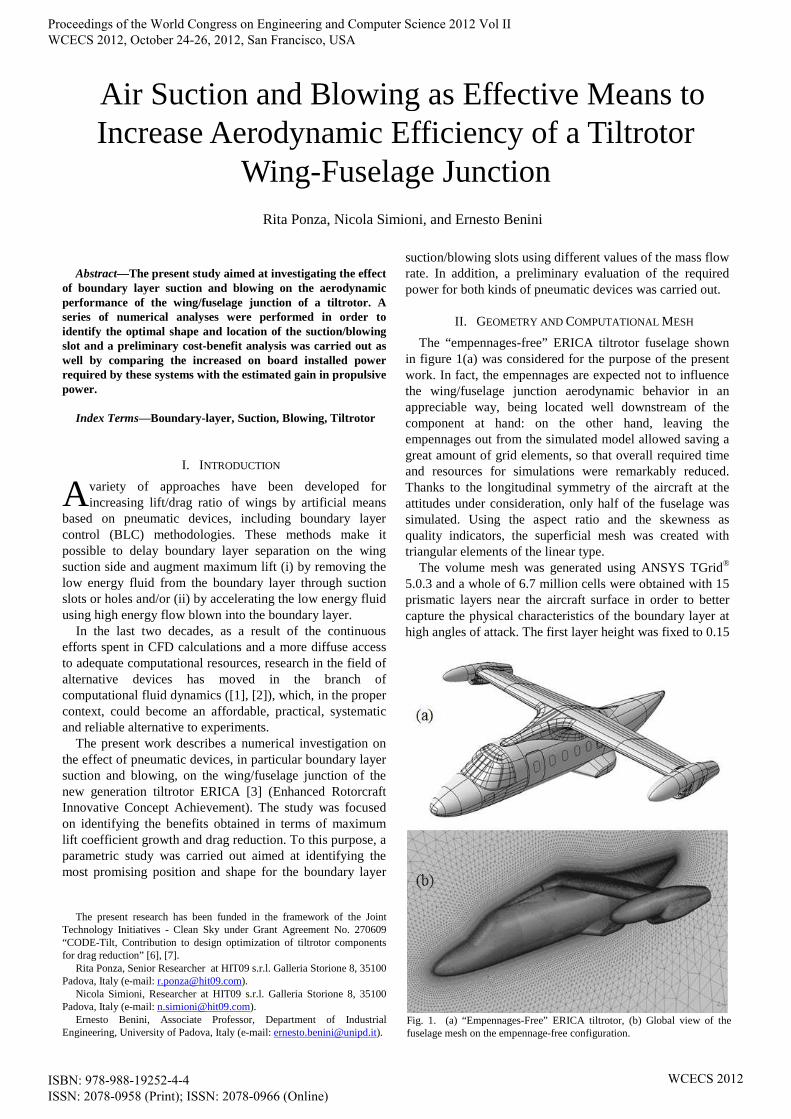
The “empennages-free” ERICA tiltrotor fuselage shown in figure 1(a) was considered for the purpose of the present work. In fact, the empennages are expected not to influence the wing/fuselage junction aerodynamic behavior in an appreciable way, being located well downstream of the component at hand: on the other hand, leaving the empennages out from the simulated model allowed saving a great amount of grid elements, so that overall required time and resources for simulations were remarkably reduced. Thanks to the longitudinal symmetry of the aircraft at the attitudes under consideration, only half of the fuselage was simulated. Using the aspect ratio and the skewness as quality indicators, the superficial mesh was created with triangular elements of the linear type.
The volume mesh was generated using ANSYS TGrid® 5.0.3 and a whole of 6.7 million cells were obtained with 15 prismatic layers near the aircraft surface in order to better capture the physical characteristics of the boundary layer at high angles of attack. The first layer height was fixed to 0.15
Air Suction and Blowing as Effective Means to Increase Aerodynamic Efficiency of a Tiltrotor
Wing-Fuselage Junction Rita Ponza, Nicola Simioni, and Ernesto Benini
A
Fig. 1. (a) “Empennages-Free” ERICA tiltrotor, (b) Global view of the fuselage mesh on the empennage-free configuration.
Proceedings of the World Congress on Engineering and Computer Science 2012 Vol II WCECS 2012, October 24-26, 2012, San Francisco, USA
ISBN: 978-988-19252-4-4 ISSN: 2078-0958 (Print); ISSN: 2078-0966 (Online)
WCECS 2012
mm, setting the growth factor to 1.25. The maximum value of y+ obtained was around 25 with a mean value of 12, which is well suited for the turbulence model used in the simulations, the k-ω SST ([4], [5]). A picture of the surface mesh is given in figure 1(b).
A. Numerical Model Validation
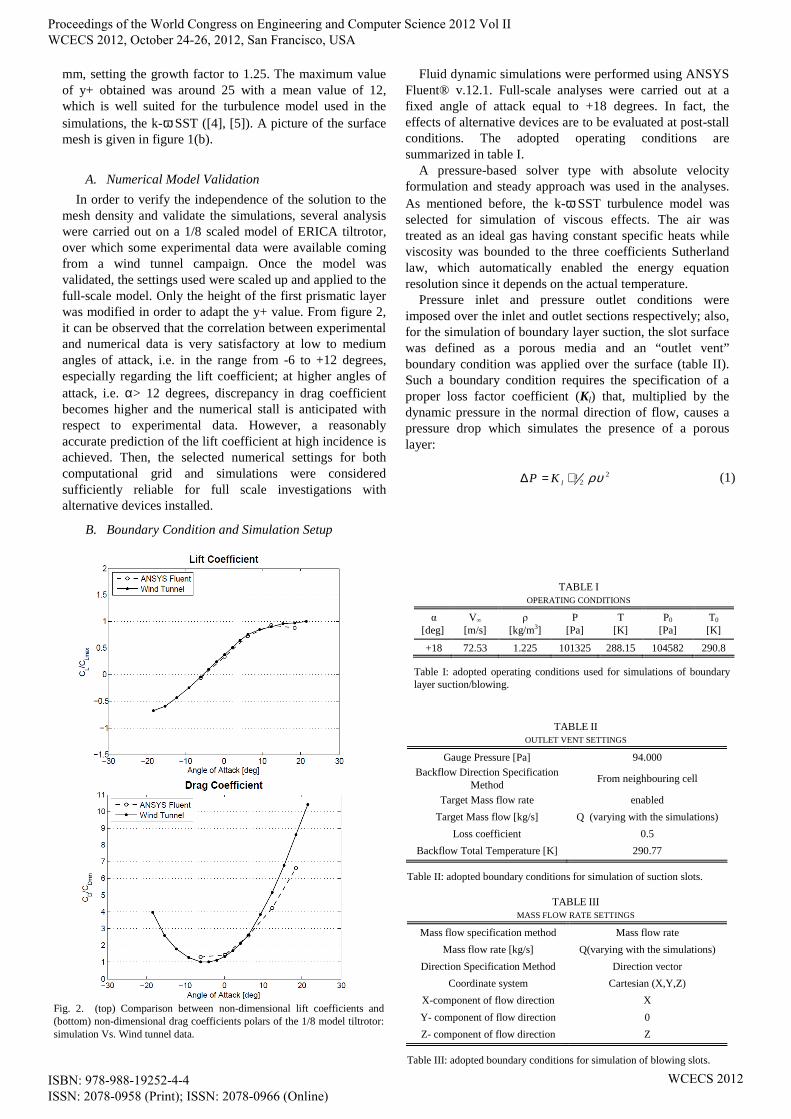
In order to verify the independence of the solution to the mesh density and validate the simulations, several analysis were carried out on a 1/8 scaled model of ERICA tiltrotor, over which some experimental data were available coming from a wind tunnel campaign. Once the model was validated, the settings used were scaled up and applied to the full-scale model. Only the height of the first prismatic layer was modified in order to adapt the y+ value. From figure 2, it can be observed that the correlation between experimental and numerical data is very satisfactory at low to medium angles of attack, i.e. in the range from -6 to +12 degrees, especially regarding the lift coefficient; at higher angles of attack, i.e. α> 12 degrees, discrepancy in drag coefficient becomes higher and the numerical stall is anticipated with respect to experimental data. However, a reasonably accurate prediction of the lift coefficient at high incidence is achieved. Then, the selected numerical settings for both computational grid and simulations were considered sufficiently reliable for full scale investigations with alternative devices installed.
B. Boundary Condition and Simulation Setup
Fluid dynamic simulations were performed using ANSYS Fluent® v.12.1. Full-scale analyses were carried out at a fixed angle of attack equal to +18 degrees. In fact, the effects of alternative devices are to be evaluated at post-stall conditions. The adopted operating conditions are summarized in table I.
A pressure-based solver type with absolute velocity formulation and steady approach was used in the analyses. As mentioned before, the k-ω SST turbulence model was selected for simulation of viscous effects. The air was treated as an ideal gas having constant specific heats while viscosity was bounded to the three coefficients Sutherland law, which automatically enabled the energy equation resolution since it depends on the actual temperature.
Pressure inlet and pressure outlet conditions were imposed over the inlet and outlet sections respectively; also, for the simulation of boundary layer suction, the slot surface was defined as a porous media and an “outlet vent” boundary condition was applied over the surface (table II). Such a boundary condition requires the specification of a proper loss factor coefficient (Kl) that, multiplied by the dynamic pressure in the normal direction of flow, causes a pressure drop which simulates the presence of a porous layer:
21
2lP K ρυ∆ = ⋅
(1)
Fig. 2. (top) Comparison between non-dimensional lift coefficients and (bottom) non-dimensional drag coefficients polars of the 1/8 model tiltrotor: simulation Vs. Wind tunnel data.
TABLE I OPERATING CONDITIONS
α [deg]
V∞
[m/s] ρ
[kg/m3] P
[Pa] T
[K] P0
[Pa] T0
[K]
+18 72.53 1.225 101325 288.15 104582 290.8
Table I: adopted operating conditions used for simulations of boundary layer suction/blowing.
TABLE II OUTLET VENT SETTINGS
Gauge Pressure [Pa] 94.000 Backflow Direction Specification
Method From neighbouring cell
Target Mass flow rate enabled
Target Mass flow [kg/s] Q (varying with the simulations)
Loss coefficient 0.5
Backflow Total Temperature [K] 290.77
Table II: adopted boundary conditions for simulation of suction slots.
TABLE III MASS FLOW RATE SETTINGS
Mass flow specification method Mass flow rate
Mass flow rate [kg/s] Q(varying with the simulations)
Direction Specification Method Direction vector
Coordinate system Cartesian (X,Y,Z)
X-component of flow direction X
Y- component of flow direction 0
Z- component of flow direction Z
Table III: adopted boundary conditions for simulation of blowing slots.
Proceedings of the World Congress on Engineering and Computer Science 2012 Vol II WCECS 2012, October 24-26, 2012, San Francisco, USA
ISBN: 978-988-19252-4-4 ISSN: 2078-0958 (Print); ISSN: 2078-0966 (Online)
WCECS 2012
where υ is the normal velocity to the boundary condition and ρ is the actual density on the suction surface. Kl was fixed at 0.5, although its influence does not affect the results but only the power value required for the suction pump.
The boundary condition used to simulate the blowing through the slot was a mass-flow inlet (table III), which is very similar to a pressure inlet condition, where the mass flow rate can be set as binding parameter rather than the total pressure. Moreover, since the solution significantly depends on the jet incidence with respect to the wing surface, the variation of the flow angle was taken into account as well.
III. RESULTS USING SUCTION
The procedure used for the parametric study of the suction device primarily consisted in identifying its best chordwise location. In fact, suction determines a flow redistribution so as to reduce the pressure gradient along the flow path, thus delaying the stall and increasing the maximum lift. A suction slot of fixed size (1500x100 mm) was simulated and a whole of six chordwise positions located behind the line of flow separation were tested; moreover, three different mass flow rates were applied to each configuration (i.e. 10 kg/s, 5kg/s and 2kg/s). Both the lift coefficient and the efficiency grow when moving the slot downstream until the 90% of the chord, where they reach a maximum. In light of this, in the second stage of the parametric study, the 90% chordwise position was retained, and the slot length was varied from 500 mm up to2750 mm. Also in this case, three different mass flow rates were simulated for each configuration: in order to keep the average speed of the suction flow constant, the mass flow rate values were changed so as to maintain the suction coefficient constant:
(2)
where υ is the average suction speed and V∞ the freestream velocity.
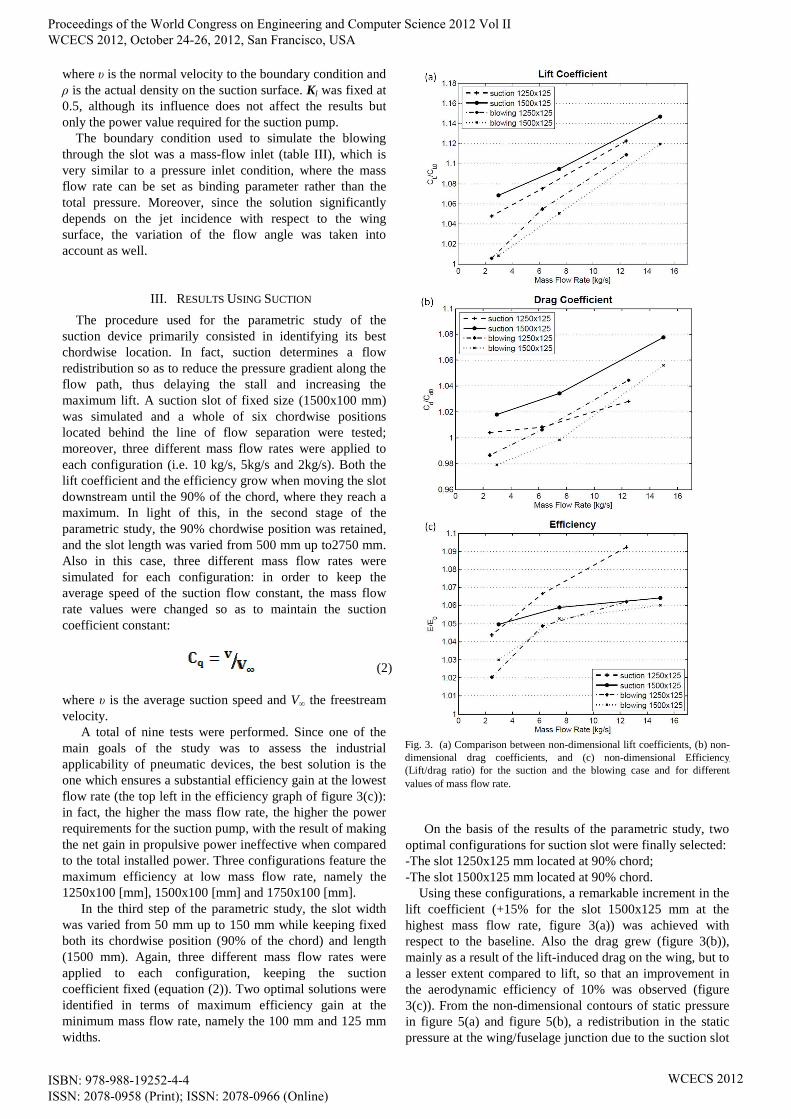
A total of nine tests were performed. Since one of the main goals of the study was to assess the industrial applicability of pneumatic devices, the best solution is the one which ensures a substantial efficiency gain at the lowest flow rate (the top left in the efficiency graph of figure 3(c)): in fact, the higher the mass flow rate, the higher the power requirements for the suction pump, with the result of making the net gain in propulsive power ineffective when compared to the total installed power. Three configurations feature the maximum efficiency at low mass flow rate, namely the 1250x100 [mm], 1500x100 [mm] and 1750x100 [mm].
In the third step of the parametric study, the slot width was varied from 50 mm up to 150 mm while keeping fixed both its chordwise position (90% of the chord) and length (1500 mm). Again, three different mass flow rates were applied to each configuration, keeping the suction coefficient fixed (equation (2)). Two optimal solutions were identified in terms of maximum efficiency gain at the minimum mass flow rate, namely the 100 mm and 125 mm widths.
On the basis of the results of the parametric study, two optimal configurations for suction slot were finally selected: -The slot 1250x125 mm located at 90% chord; -The slot 1500x125 mm located at 90% chord.
Using these configurations, a remarkable increment in the lift coefficient (+15% for the slot 1500x125 mm at the highest mass flow rate, figure 3(a)) was achieved with respect to the baseline. Also the drag grew (figure 3(b)), mainly as a result of the lift-induced drag on the wing, but to a lesser extent compared to lift, so that an improvement in the aerodynamic efficiency of 10% was observed (figure 3(c)). From the non-dimensional contours of static pressure in figure 5(a) and figure 5(b), a redistribution in the static pressure at the wing/fuselage junction due to the suction slot
Fig. 3. (a) Comparison between non-dimensional lift coefficients, (b) non-dimensional drag coefficients, and (c) non-dimensional Efficiency (Lift/drag ratio) for different values of mass flow rate.
Fig. 3. (a) Comparison between non-dimensional lift coefficients, (b) non-dimensional drag coefficients, and (c) non-dimensional Efficiency (Lift/drag ratio) for the suction and the blowing case and for different values of mass flow rate.
Proceedings of the World Congress on Engineering and Computer Science 2012 Vol II WCECS 2012, October 24-26, 2012, San Francisco, USA
ISBN: 978-988-19252-4-4 ISSN: 2078-0958 (Print); ISSN: 2078-0966 (Online)
WCECS 2012
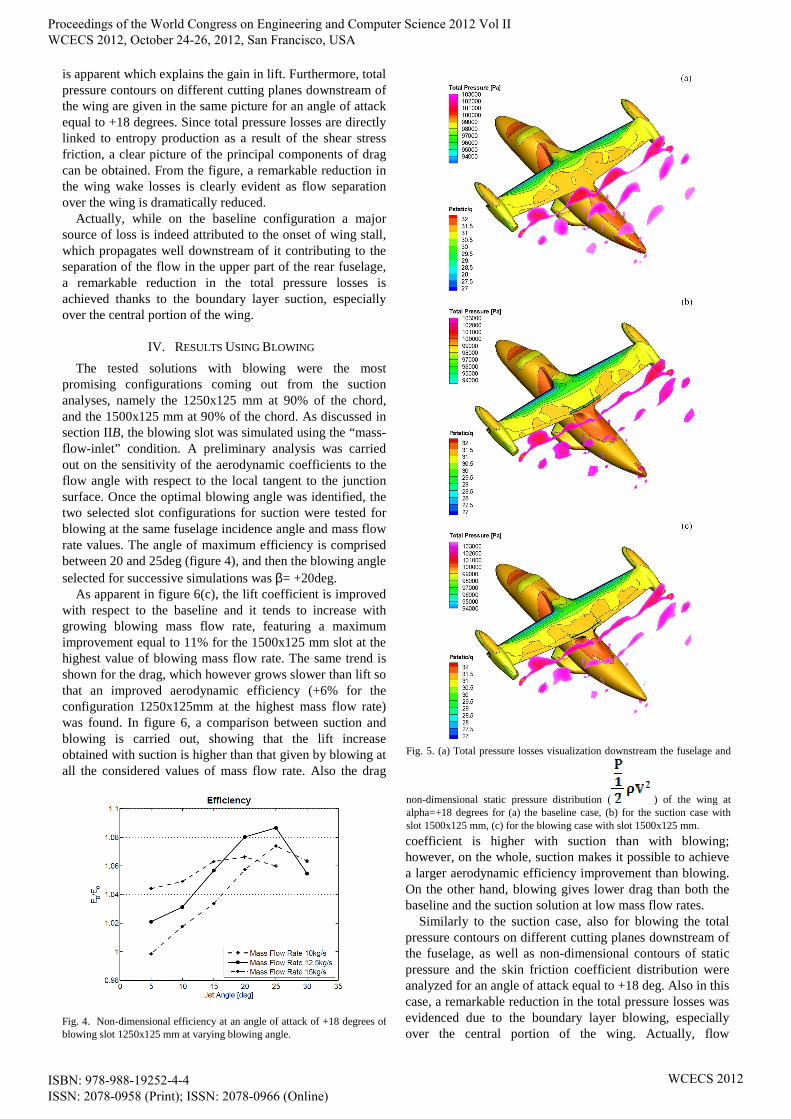
is apparent which explains the gain in lift. Furthermore, total pressure contours on different cutting planes downstream of the wing are given in the same picture for an angle of attack equal to +18 degrees. Since total pressure losses are directly linked to entropy production as a result of the shear stress friction, a clear picture of the principal components of drag can be obtained. From the figure, a remarkable reduction in the wing wake losses is clearly evident as flow separation over the wing is dramatically reduced.
Actually, while on the baseline configuration a major source of loss is indeed attributed to the onset of wing stall, which propagates well downstream of it contributing to the separation of the flow in the upper part of the rear fuselage, a remarkable reduction in the total pressure losses is achieved thanks to the boundary layer suction, especially over the central portion of the wing.
IV. RESULTS USING BLOWING
The tested solutions with blowing were the most promising configurations coming out from the suction analyses, namely the 1250x125 mm at 90% of the chord, and the 1500x125 mm at 90% of the chord. As discussed in section IIB, the blowing slot was simulated using the “mass-flow-inlet” condition. A preliminary analysis was carried out on the sensitivity of the aerodynamic coefficients to the flow angle with respect to the local tangent to the junction surface. Once the optimal blowing angle was identified, the two selected slot configurations for suction were tested for blowing at the same fuselage incidence angle and mass flow rate values. The angle of maximum efficiency is comprised between 20 and 25deg (figure 4), and then the blowing angle selected for successive simulations was β= +20deg.
As apparent in figure 6(c), the lift coefficient is improved with respect to the baseline and it tends to increase with growing blowing mass flow rate, featuring a maximum improvement equal to 11% for the 1500x125 mm slot at the highest value of blowing mass flow rate. The same trend is shown for the drag, which however grows slower than lift so that an improved aerodynamic efficiency (+6% for the configuration 1250x125mm at the highest mass flow rate) was found. In figure 6, a comparison between suction and blowing is carried out, showing that the lift increase obtained with suction is higher than that given by blowing at all the considered values of mass flow rate. Also the drag
coefficient is higher with suction than with blowing; however, on the whole, suction makes it possible to achieve a larger aerodynamic efficiency improvement than blowing. On the other hand, blowing gives lower drag than both the baseline and the suction solution at low mass flow rates.
Similarly to the suction case, also for blowing the total pressure contours on different cutting planes downstream of the fuselage, as well as non-dimensional contours of static pressure and the skin friction coefficient distribution were analyzed for an angle of attack equal to +18 deg. Also in this case, a remarkable reduction in the total pressure losses was evidenced due to the boundary layer blowing, especially over the central portion of the wing. Actually, flow
Fig. 4. Non-dimensional efficiency at an angle of attack of +18 degrees of blowing slot 1250x125 mm at varying blowing angle.
Fig. 5. (a) Total pressure losses visualization downstream the fuselage and
non-dimensional static pressure distribution ( ) of the wing at alpha=+18 degrees for (a) the baseline case, (b) for the suction case with slot 1500x125 mm, (c) for the blowing case with slot 1500x125 mm.
Proceedings of the World Congress on Engineering and Computer Science 2012 Vol II WCECS 2012, October 24-26, 2012, San Francisco, USA
ISBN: 978-988-19252-4-4 ISSN: 2078-0958 (Print); ISSN: 2078-0966 (Online)
WCECS 2012
separation over the wing is reduced using blowing, even though to a lesser extent than with suction.
V. EFFECTS ON TILTROTOR POLARS
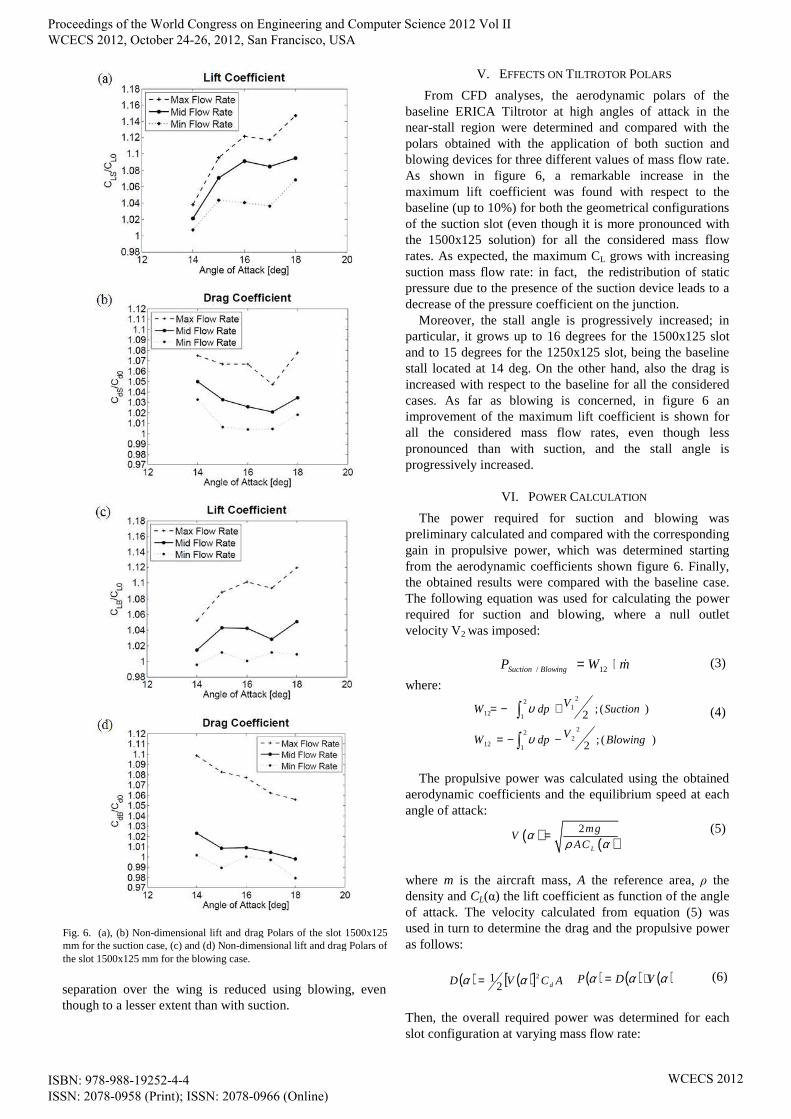
From CFD analyses, the aerodynamic polars of the baseline ERICA Tiltrotor at high angles of attack in the near-stall region were determined and compared with the polars obtained with the application of both suction and blowing devices for three different values of mass flow rate. As shown in figure 6, a remarkable increase in the maximum lift coefficient was found with respect to the baseline (up to 10%) for both the geometrical configurations of the suction slot (even though it is more pronounced with the 1500x125 solution) for all the considered mass flow rates. As expected, the maximum CL grows with increasing suction mass flow rate: in fact, the redistribution of static pressure due to the presence of the suction device leads to a decrease of the pressure coefficient on the junction.
Moreover, the stall angle is progressively increased; in particular, it grows up to 16 degrees for the 1500x125 slot and to 15 degrees for the 1250x125 slot, being the baseline stall located at 14 deg. On the other hand, also the drag is increased with respect to the baseline for all the considered cases. As far as blowing is concerned, in figure 6 an improvement of the maximum lift coefficient is shown for all the considered mass flow rates, even though less pronounced than with suction, and the stall angle is progressively increased.
VI. POWER CALCULATION
The power required for suction and blowing was preliminary calculated and compared with the corresponding gain in propulsive power, which was determined starting from the aerodynamic coefficients shown figure 6. Finally, the obtained results were compared with the baseline case. The following equation was used for calculating the power required for suction and blowing, where a null outlet velocity V2 was imposed:
mWP BlowingSuction &⋅= 12/ (3)
where:
)(;2
)(;22
22
112
21
2
112
BlowingVdpW
SuctionVdpW
−−=
+−=
∫
∫
υ
υ (4)
The propulsive power was calculated using the obtained
aerodynamic coefficients and the equilibrium speed at each angle of attack:
( ) ( )2
L
mgV
ACα
ρ α= (5)
where m is the aircraft mass, A the reference area, ρ the density and CL(α) the lift coefficient as function of the angle of attack. The velocity calculated from equation (5) was used in turn to determine the drag and the propulsive power as follows:
( ) ( )[ ] ACVD d
2
21 αα =
( ) ( ) ( )ααα VDP ⋅= (6)
Then, the overall required power was determined for each slot configuration at varying mass flow rate:
Fig. 6. (a), (b) Non-dimensional lift and drag Polars of the slot 1500x125 mm for the suction case, (c) and (d) Non-dimensional lift and drag Polars of the slot 1500x125 mm for the blowing case.
Proceedings of the World Congress on Engineering and Computer Science 2012 Vol II WCECS 2012, October 24-26, 2012, San Francisco, USA
ISBN: 978-988-19252-4-4 ISSN: 2078-0958 (Print); ISSN: 2078-0966 (Online)
WCECS 2012
blowingsuctionpropulsivetot PPP /+= (7)
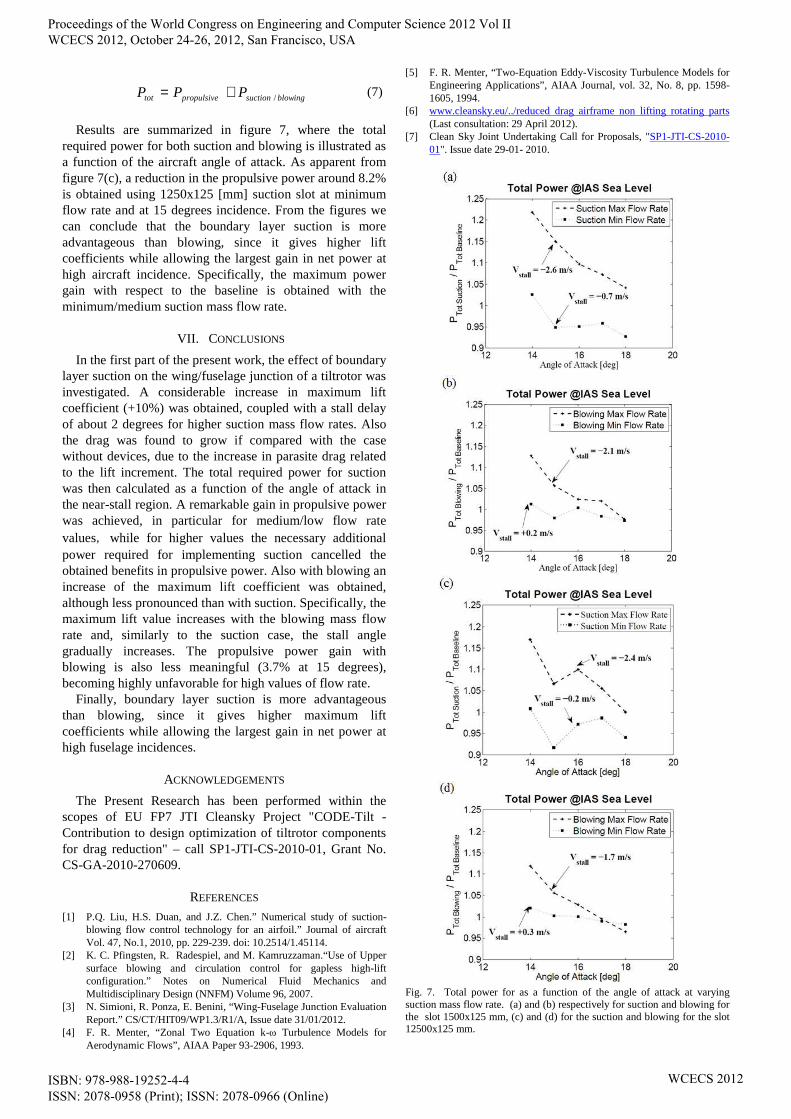
Results are summarized in figure 7, where the total
required power for both suction and blowing is illustrated as a function of the aircraft angle of attack. As apparent from figure 7(c), a reduction in the propulsive power around 8.2% is obtained using 1250x125 [mm] suction slot at minimum flow rate and at 15 degrees incidence. From the figures we can conclude that the boundary layer suction is more advantageous than blowing, since it gives higher lift coefficients while allowing the largest gain in net power at high aircraft incidence. Specifically, the maximum power gain with respect to the baseline is obtained with the minimum/medium suction mass flow rate.
VII. CONCLUSIONS
In the first part of the present work, the effect of boundary layer suction on the wing/fuselage junction of a tiltrotor was investigated. A considerable increase in maximum lift coefficient (+10%) was obtained, coupled with a stall delay of about 2 degrees for higher suction mass flow rates. Also the drag was found to grow if compared with the case without devices, due to the increase in parasite drag related to the lift increment. The total required power for suction was then calculated as a function of the angle of attack in the near-stall region. A remarkable gain in propulsive power was achieved, in particular for medium/low flow rate values, while for higher values the necessary additional power required for implementing suction cancelled the obtained benefits in propulsive power. Also with blowing an increase of the maximum lift coefficient was obtained, although less pronounced than with suction. Specifically, the maximum lift value increases with the blowing mass flow rate and, similarly to the suction case, the stall angle gradually increases. The propulsive power gain with blowing is also less meaningful (3.7% at 15 degrees), becoming highly unfavorable for high values of flow rate.
Finally, boundary layer suction is more advantageous than blowing, since it gives higher maximum lift coefficients while allowing the largest gain in net power at high fuselage incidences.
ACKNOWLEDGEMENTS
The Present Research has been performed within the scopes of EU FP7 JTI Cleansky Project "CODE-Tilt - Contribution to design optimization of tiltrotor components for drag reduction" – call SP1-JTI-CS-2010-01, Grant No. CS-GA-2010-270609.
REFERENCES
[1] P.Q. Liu, H.S. Duan, and J.Z. Chen.” Numerical study of suction-blowing flow control technology for an airfoil.” Journal of aircraft Vol. 47, No.1, 2010, pp. 229-239. doi: 10.2514/1.45114.
[2] K. C. Pfingsten, R. Radespiel, and M. Kamruzzaman.“Use of Upper surface blowing and circulation control for gapless high-lift configuration.” Notes on Numerical Fluid Mechanics and Multidisciplinary Design (NNFM) Volume 96, 2007.
[3] N. Simioni, R. Ponza, E. Benini, “Wing-Fuselage Junction Evaluation Report.” CS/CT/HIT09/WP1.3/R1/A, Issue date 31/01/2012.
[4] F. R. Menter, “Zonal Two Equation k-ω Turbulence Models for Aerodynamic Flows”, AIAA Paper 93-2906, 1993.
[5] F. R. Menter, “Two-Equation Eddy-Viscosity Turbulence Models for Engineering Applications”, AIAA Journal, vol. 32, No. 8, pp. 1598-1605, 1994.
[6] www.cleansky.eu/../reduced drag airframe non lifting rotating parts (Last consultation: 29 April 2012).
[7] Clean Sky Joint Undertaking Call for Proposals, "SP1-JTI-CS-2010-01". Issue date 29-01- 2010.
Fig. 7. Total power for as a function of the angle of attack at varying suction mass flow rate. (a) and (b) respectively for suction and blowing for the slot 1500x125 mm, (c) and (d) for the suction and blowing for the slot 12500x125 mm.
Proceedings of the World Congress on Engineering and Computer Science 2012 Vol II WCECS 2012, October 24-26, 2012, San Francisco, USA
ISBN: 978-988-19252-4-4 ISSN: 2078-0958 (Print); ISSN: 2078-0966 (Online)
WCECS 2012