Embed Size (px)
Citation preview
Alameda County Employees’ Retirement Association BOARD OF RETIREMENT
INVESTMENT COMMITTEE/BOARD MEETING
ACERA MISSION: To provide ACERA members and employers with flexible, cost-effective, participant-oriented
benefits through prudent investment management and superior member services.
Wednesday, June 12, 2019 9:30 a.m.
Should a quorum of the Board attend this meeting, this meeting shall be deemed a joint meeting of the Board and Committee. The order of agenda items is subject to change without notice. Board and Committee agendas and minutes are available online at www.acera.org.
Note regarding public comments: Public comments are limited to four (4) minutes per person in total.
Note regarding accommodations: The Board of Retirement will provide reasonable accommodations for persons with special needs of accessibility who plan to attend Board meetings. Please contact ACERA at (510) 628-3000 to arrange for accommodation.
1 Alternate Retired Member (Votes in the absence of the Elected Retired Member, or, if the Elected Retired Member is present, then votes if both Elected General Members, or the Elected Safety Member and an Elected General Member, are absent. 2 Alternate Safety Member (Votes in the absence of (1) the Elected Safety, (2) either of the two Elected General Members, or (3) both the Retired and Alternate Retired Members).
LOCATION COMMITTEE MEMBERS
ACERA C.G. “BUD” QUIST BOARD ROOM475 14TH STREET, 10TH FLOOROAKLAND, CALIFORNIA 94612-1900MAIN LINE: 510.628.3000FAX: 510.268.9574
ELIZABETH ROGERS, CHAIR ELECTED GENERAL
TARRELL GAMBLE, VICE CHAIR APPOINTED
DALE AMARAL ELECTED SAFETY
OPHELIA BASGAL APPOINTED
KEITH CARSON APPOINTED
JAIME GODFREY APPOINTED
LIZ KOPPENHAVER ELECTED RETIRED
HENRY LEVY TREASURER
GEORGE WOOD ELECTED GENERAL
NANCY REILLY ALTERNATE RETIRED1
DARRYL L. WALKER ALTERNATE SAFETY2
INVESTMENT COMMITTEE/BOARD MEETING NOTICE and AGENDA, Page 2 of 3 – Wednesday, June 12, 2019
Call to Order: 9:30 a.m. Public Input (Time Limit: 4 minutes per speaker) Action Items: Matters for discussion and possible motion by the Committee
1. Discussion of and Possible Motion to Recommend to the Board to Adopt an up to $33 million
Investment in Altas Partners Holdings II as part of ACERA’s Private Equity Portfolio – Buyouts 3
9:30 – 10:15 Andrew Sheiner, Altas Partners Faraz Shooshani, Verus Advisory Inc.
John Ta, ACERA Betty Tse, ACERA
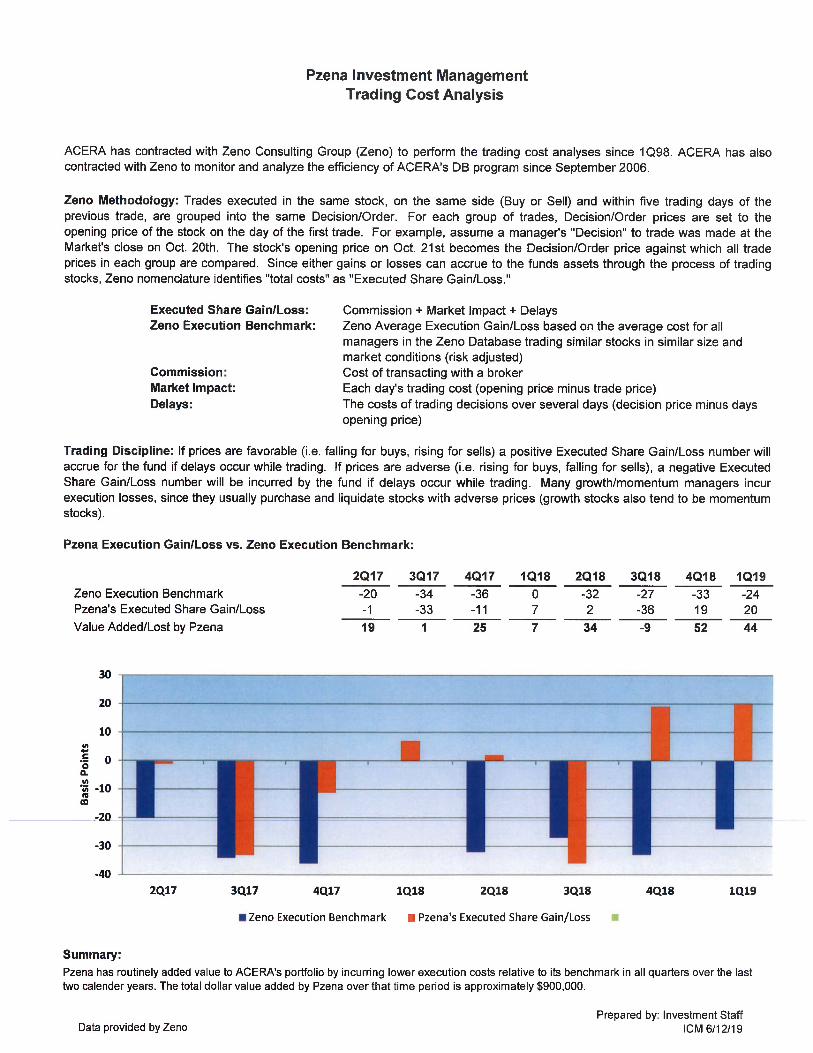
Information Items: These items are not presented for Committee action but consist of status updates and cyclical reports 1. Review of Pzena Investment Management, LLC (Traditional Manager – Large Cap Value)
William Lipsey, Pzena Investment Management, LLC Richard Pzena, Pzena Investment Management, LLC Margaret Jadallah, Verus Advisory Inc. Thomas Taylor, ACERA Betty Tse, ACERA
2. Semiannual Performance Review for the Period Ending March 31, 2019 – Equities and Fixed
Income
Barry Dennis, Verus Advisory Inc. Margaret Jadallah, Verus Advisory Inc. Clint Kuboyama, ACERA Thomas Taylor, ACERA Betty Tse, ACERA
3. Semiannual Performance Review for the Period Ending March 31, 2019 – Absolute Return
Margaret Jadallah, Verus Advisory Inc. Clint Kuboyama, ACERA Betty Tse, ACERA
4. Semiannual Performance Review for the Period Ending December 31, 2018 – Private Equity
Faraz Shooshani, Verus Advisory Inc. Clint Kuboyama, ACERA John Ta, ACERA Betty Tse, ACERA
3 Written materials and investment recommendations from the consultants, fund managers and ACERA Investment Staff relating to this alternative investment are exempt from public disclosure pursuant to CA Gov. Codes § 6254.26 and § 6255.

INVESTMENT COMMITTEE/BOARD MEETING NOTICE and AGENDA, Page 3 of 3 – Wednesday, June 12, 2019
5. Semiannual Performance Review for the Period Ending December 31, 2018 – Real Assets
John Nicolini, Verus Advisory Inc. Clint Kuboyama, ACERA John Ta, ACERA Betty Tse, ACERA
6. Semiannual Performance Review for the Period Ending March 31, 2019 – Real Estate
Avery Robinson, Callan LLC Jonathan Gould, Callan LLC Thomas Taylor, ACERA Betty Tse, ACERA
Adjournment into Closed Session
Govt. Code section 54956.81 – Consider the purchase or sale of a specific pension fund investment, and Govt. Code section 54957.1(d) (4) – Anticipated litigation (1 matter)
Reconvene into Open Session to Report on Action Taken in Closed Session
Trustee Remarks Future Discussion Items
Establishment of Next Meeting Date July 10, 2019 at 9:30 a.m.
S E A T T L E | L O S A N G E L E S | S A N F R A N C I S C O | V E R U S I N V E S T M E N T S . C O M
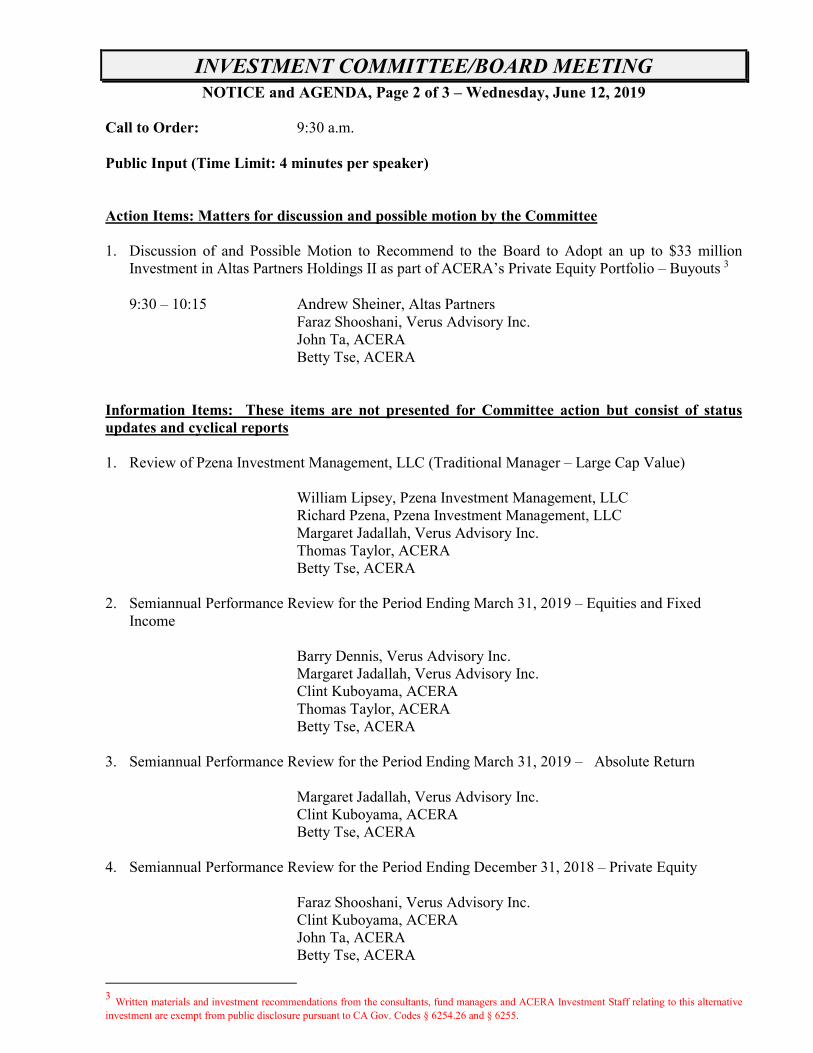
Memorandum
To: Alameda County Employees’ Retirement Association
From: Verus
Date: June 12, 2019
RE: Pzena Investment Management Large Cap Focused Value
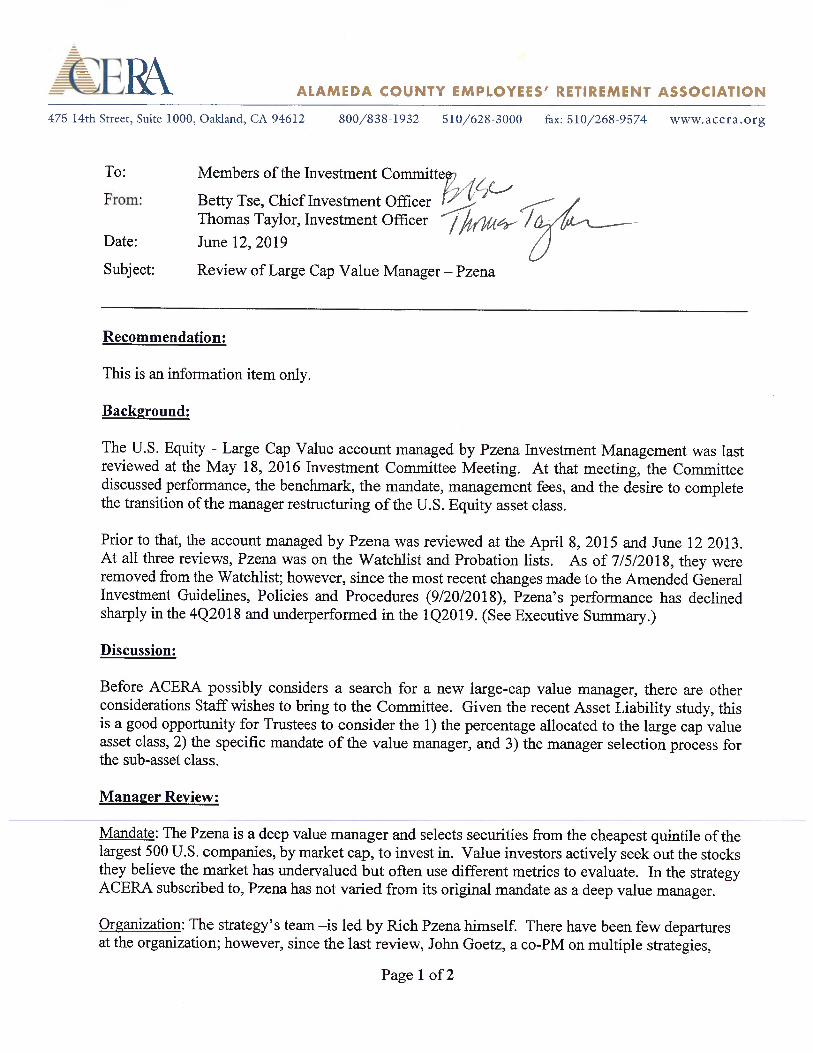
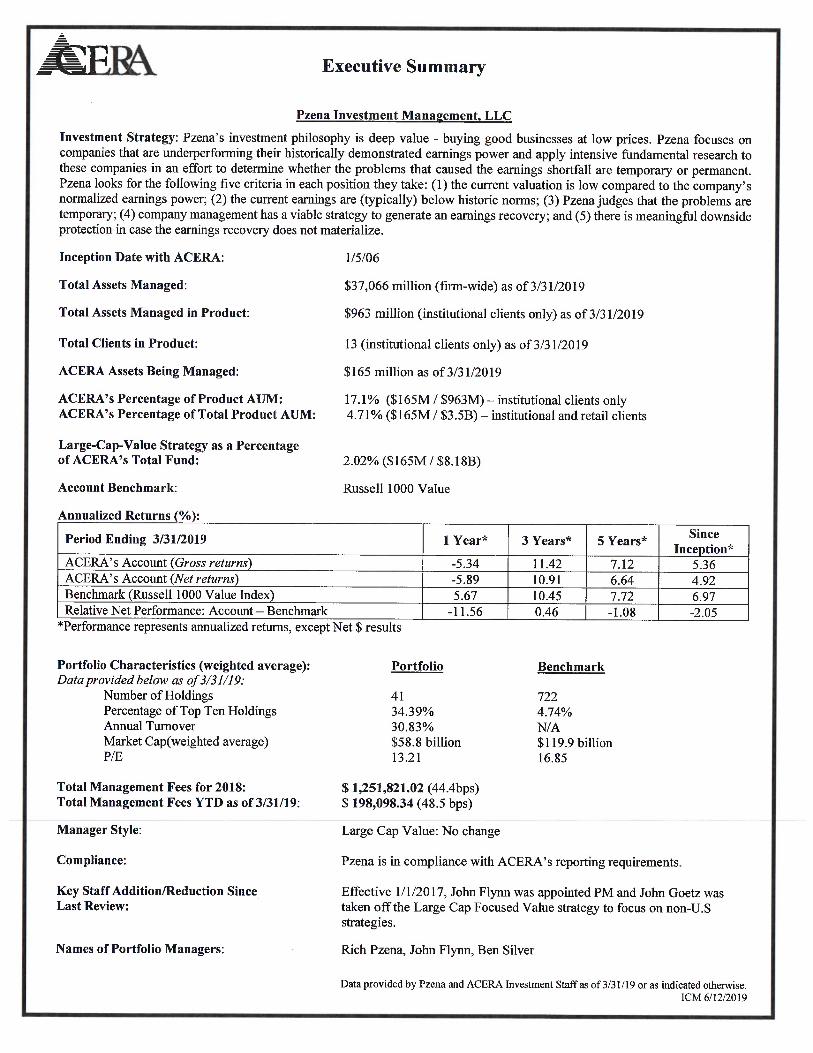
General Information
Firm name: Pzena Investment Management
Strategy name: Large Cap Focused Value
Firm total AUM: $37.1 billion
Strategy total AUM: $1.0 billion
ACERA portfolio value: $148.2 million
Strategy inception with ACERA: January 2006
Benchmark: Russell 1000 Value
Note: Data as of 3/31/19
Organization
Pzena Investment Management, LLC (“Pzena”) was founded in 1995 and is focused on long-term, deep value investing. In October 2007, Pzena conducted an initial public offering of its holding company, Pzena Investment Management, Inc. Today, about 55% of the firm is owned by current employees, while about 26% is publicly held. The remaining 19% is privately held by outside owners, including former employees. Employee ownership is dispersed across 48 partners.
The firm is headquartered in New York, New York with client services offices located in Melbourne, Australia and London, U.K.
Since ACERA’s last review of Pzena in May of 2016, the firm has grown its total assets under management, mainly through its non-U.S. strategies. A stated reason for the growth in non-U.S. assets and, conversely, loss in U.S. assets is the trend to increased allocation to non-U.S. equities in portfolios at the expense of U.S. equities. Moreover, Pzena cited the move to passive and LDI as headwinds to their U.S. equity business, which has resulted in a drop in AUM for the Large Cap Focused Value strategy over the past three years. While not stated by Pzena, it is logical to presume that the strategy’s near-term underperformance has been another reason for asset loss.
2
Investment Professionals
Pzena’s investment team is comprised of 25 investment professionals with fundamental research analysts organized by global industries. Richard Pzena, John Flynn, Ben Silver and Manoj Tandon comprise the portfolio management team for the Large Cap Focused Value strategy. Ben Silver joined the team in 2012, and Manoj Tandon joined the team in 2014 after Antonio (Tony) DeSpirito resigned from the firm. John Flynn replaced John Goetz in 2017 when Goetz stepped down from this strategy (but remains at the firm). All Large Cap Focused Value portfolio management team members have been with Pzena for over a decade and are equity owners.
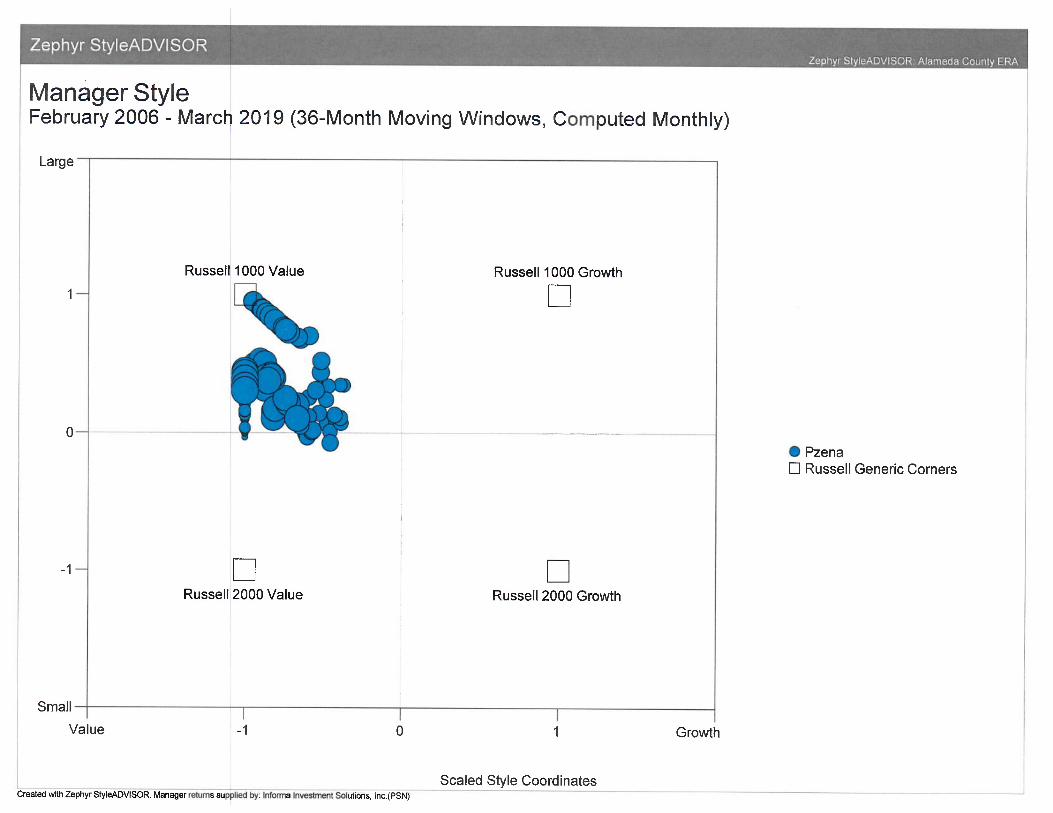
Philosophy & Process
Pzena's Large Cap Focused Value strategy is a concentrated, low-turnover approach to deep value equity investing. Through a bottom-up, fundamental research process, Pzena seeks to buy good businesses that are trading at significantly discounted valuations, focusing exclusively on companies that are underperforming their historical earnings power. Using a proprietary model, the investment team ranks the largest 500 U.S. companies in terms of price relative to normalized earnings, and then focuses their research efforts on the most undervalued quintile of the universe. For this remaining quintile, the investment team seeks to assess whether the causes of under-valuation are temporary or permanent. If a prospective company's under-valuation is viewed as temporary, Pzena will then assess whether they would be able to reasonably forecast the company's normalized earnings power. If Pzena is able to develop a final, fully researched estimate of normalized earnings, the estimate is inserted into the model. If a security continues to rank in the cheapest quintile, it is then eligible to be purchased.
Before a stock can be added to the portfolio, all five of the following criteria must be met:
― Current valuation is low compared to the company's normalized earnings power; ― Current earnings are below historic norms; ― Management has a viable plan to generate earnings recovery; ― The company's business is sound, with sustainable advantages or significant barriers to
entry; ― Significant downside protection in the form of real asset value (in the event that
expected earnings recovery fails to materialize).
Pzena believes that building a portfolio exclusively focused on companies with these characteristics should generate excess returns for long-term investors. Their approach can often result in holdings in controversial names and sectors that the team believes are temporarily mispriced but will revert to their normalized earnings power.
For the Large Cap Focused Value strategy, the portfolio management team has joint decision-making responsibility, with no single person possessing final authority – all must agree for a
3
security to be purchased in the portfolio. The end result is a concentrated, low-turnover portfolio of between 30 and 40 securities.
In terms of risk management, positions are limited to 5% of the portfolio at cost and must be trimmed if they reach 7.5% of the portfolio at market. Weights of individual securities typically range between 1% and 5%. In general, the most undervalued companies receive the largest weightings in the portfolio; however, this is subject to Pzena's judgment regarding the nature of the company's undervaluation. Relative to the Russell 1000 Value Index, the strategy's sector weights are limited to +/- 15% the weight in the index. With regard to sell discipline, Pzena employs the same ranking system that informs its stock purchases. Valuation ranks are continuously monitored and a stock is sold once its valuation reaches the midpoint of its investment universe.
In response to the strategy's significant underperformance during the global financial crisis, Pzena has since sought to avoid companies that carry excessive financial leverage and are in the top quintile of volatility. Stocks that are deemed attractive through their fundamental research analysis but have these attributes tend to have small weights in the portfolio.
Performance
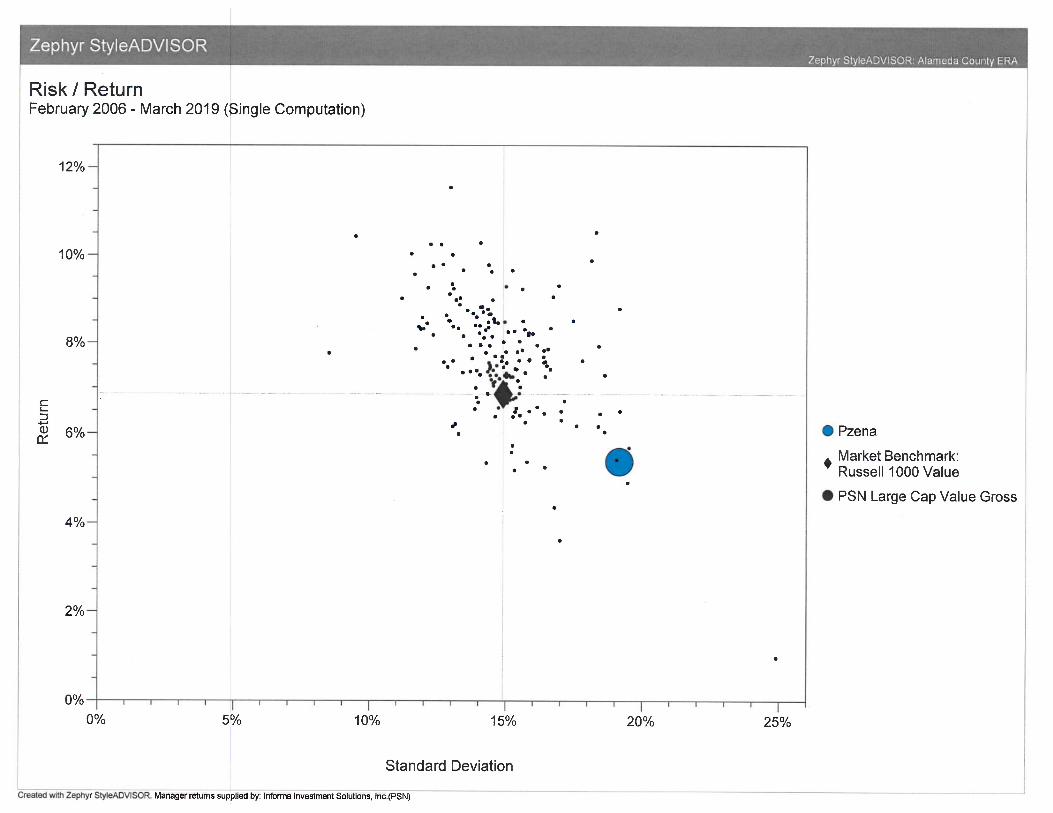
As expected for a concentrated, deep value strategy, Pzena’s tracking error tends to run high, generally around 5-6%, ranking the strategy in the top quartile among its peers. Pzena’s beta and standard deviation are greater than that of the Russell 1000 Value Index.
ACERA portfolio QTD (%) YTD (%) 1 yr (%) 3 yr (%) 5 yr (%) 10 yr (%) Annualized s.i. (1/2006)
Gross performance* 5.83 18.10 -1.88 12.40 8.36 13.90 5.77
Net performance* 5.70 17.80 -2.38 11.87 7.87 13.43 5.33
Russell 1000 Value 3.55 15.90 9.06 10.97 8.27 13.76 7.20
*Returns ended 4/30/19
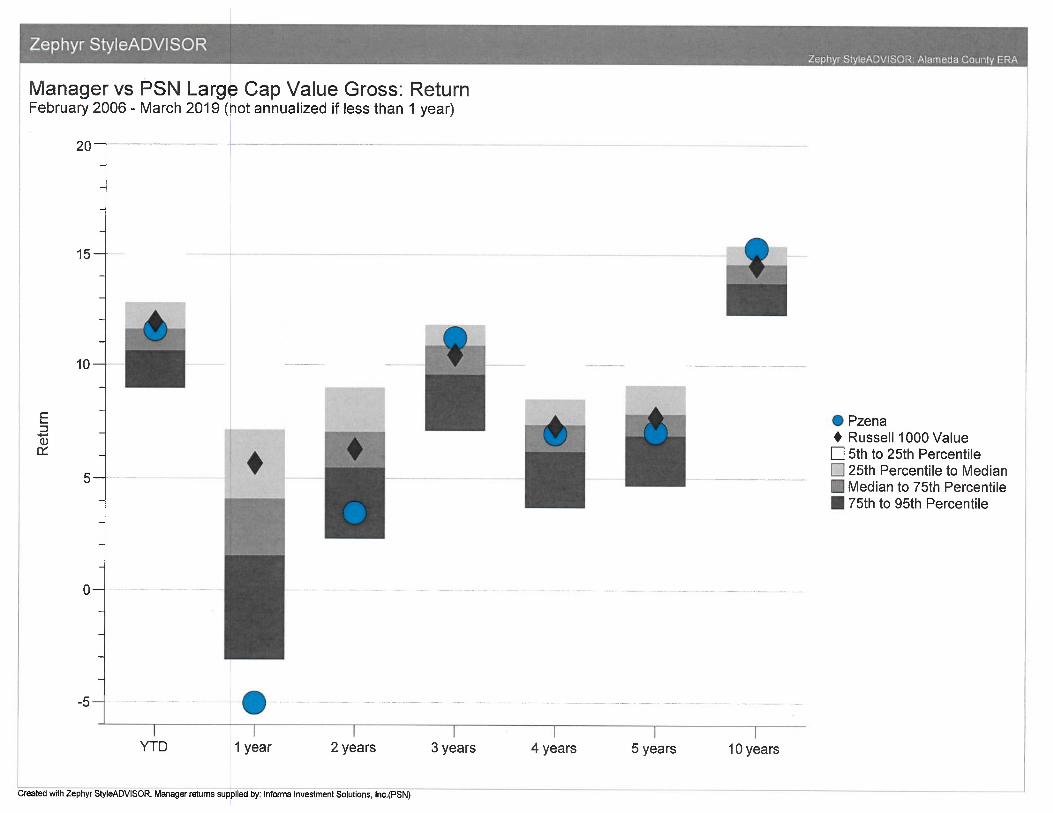
As depicted above, Pzena’s results have been significantly disappointing over the one year and since inception time periods. During calendar year 2018, Pzena’s deep value approach faced extreme headwinds in an environment that rewarded growth over value (ACERA -16.48% vs. -8.27% for the Russell 1000 Value Index). Pzena stuck to its deep value discipline which has resulted in a large position in financials (40% of the portfolio) that the team views as very cheap vs. normalized earnings power. They have added energy services companies (ex. Halliburton) and drug distributors (ex. Cardinal) to the ACERA portfolio that have not yet been rewarded. Pzena has added to some of its positions as valuations have become more attractive (ex. GE) and are closely monitoring others (ex. Mylan). As mentioned above, Pzena’s longer-term results were impaired by significant underperformance during the global financial crisis, in particular because of financial holdings.
4
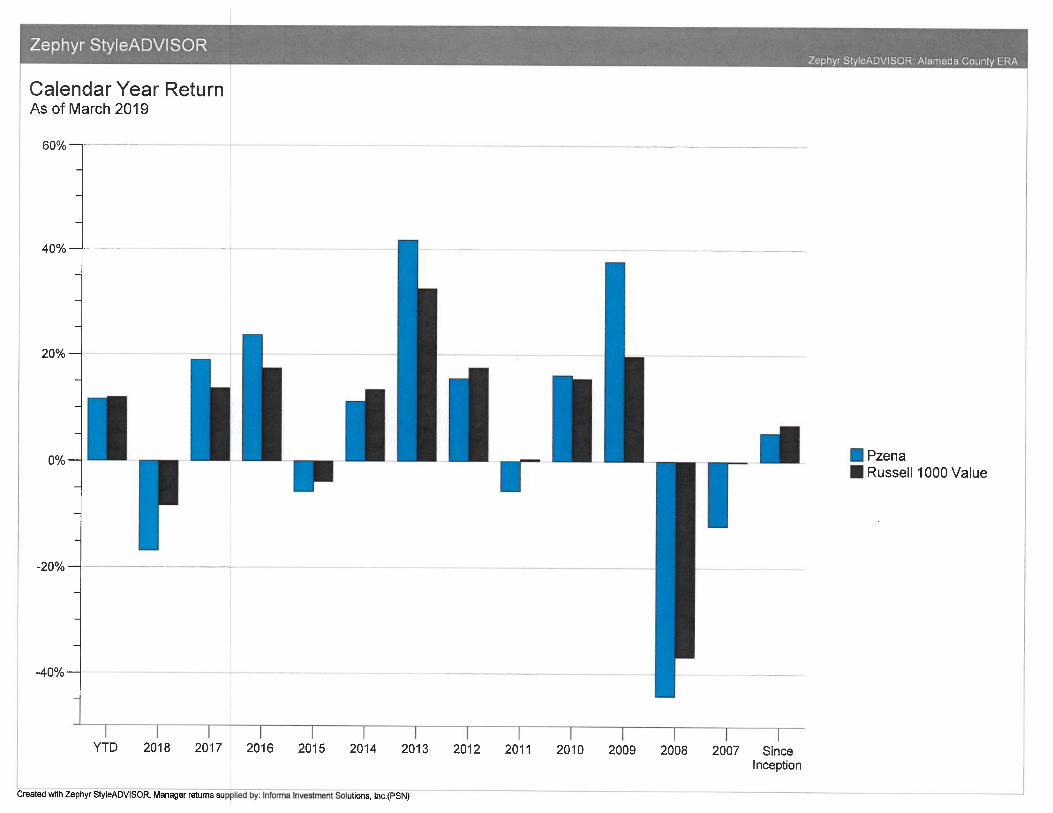
Pzena’s deep value approach results in a lumpy return pattern. During Pzena’s 13-year tenure managing money for ACERA, the portfolio has experienced both noteworthy outperformance (2009, 2013) and underperformance (2008, 2018) compared to the Russell 1000 Value Index. Similarly, the portfolio has ranked in both the top quartile of large cap value peers (2009, 2013, 2016) and bottom quartile (2008, 2011, 2015, 2018).
Summary Assessment
Pzena was placed on Watchlist/Probation status by ACERA for performance and for the departure of portfolio manager Tony DeSpirito. Although Watchlist/Probation status was lifted for the change in personnel, Pzena remained on Watchlist/Probation status for performance. Under ACERA’s new watchlist policy which is more qualitative and holistic than its previous policy, Verus and Staff concluded that Pzena should remain on watch for significant and prolonged underperformance.
Verus concurs that Pzena’s investment approach has experienced stylistic headwinds. However, attribution analysis for the past year shows that stock selection has contributed more to underperformance than have factor or style biases; in other words, under-performing stock investments have accounted for more underperformance than their deep value tilt. Underperformance stemming from allocation, in particular to financials, detracted 224 bps, while stock selection, mainly in consumer discretionary, healthcare and financials, detracted 755 bps. (Note that this is time period dependent and there have been time periods during the ACERA relationship where stock selection has added excess return based on attribution analysis.)
Although assets in the Large Cap Focused Value strategy managed for ACERA have decreased in recent years, Verus acknowledges that this is a tough environment for Large Cap Value and active U.S. equity strategies generally. The firm has grown its total firm assets through its non-U.S. strategies which has resulted in net inflows at the total firm AUM level. Thus, we are not overly concerned about strategy asset loss as it pertains to viability of the firm or maintenance of the product.
Pzena cautions that the Value cycle, which is tied to the economic cycle, was artificially truncated through Fed monetary policy interventions and over-selling based on investor intolerance for periods of underperformance. Pzena also reminds that Value cycles will eventually revert. Verus believes that Pzena’s deep value approach will again be rewarded by the market and should experience a meaningful turnaround at some point. Nevertheless, it is arguable whether Pzena represents traditional Value investing and whether they represent the best option for ACERA.
Verus seeks feedback from the ICM following the Pzena review regarding appropriate next steps, namely whether to a) keep Pzena on watch and continue to monitor, b) accelerate our due diligence and re-underwrite Pzena as an ACERA manager (this would include an onsite visit) or c) revisit large cap value manager options and include Pzena in the analysis. Should Trustees

5
advise further action on Pzena, Verus and Staff will return with next steps in the next 2-3 months. As stated in prior Pzena reviews, this manager requires investors to tolerate above-average tracking error, given its concentrated, deep value approach which may lead to periods of significant underperformance. However, investing with Pzena should also result in greater alpha opportunities in the long run to compensate for additional risk – especially when value is in favor. In summary, Pzena Large Cap Focused Value is not a strategy for investors who would prefer less volatility and tighter tracking error.
Past performance is no guarantee of future results. This document is provided for informational purposes only and is directed to institutional clients and eligible institutional counterparties only and is not intended for retail investors. Nothing herein constitutes investment, legal, accounting or tax investment vehicle or any trading strategy. This document may include or imply estimates, outlooks, projections and other “forward-looking statements.” No assurance can be given that future results described or implied by any forward looking information will be achieved. Investing entails risks, including possible loss of principal. Verus Advisory Inc. and Verus Investors, LLC (“Verus”) file a single form ADV under the United States Investment Advisors Act of 1940, as amended.
11
PREPARED FOR:
June 12, 2019Quarterly Portfolio Review & Outlook
PZENA Investment Management
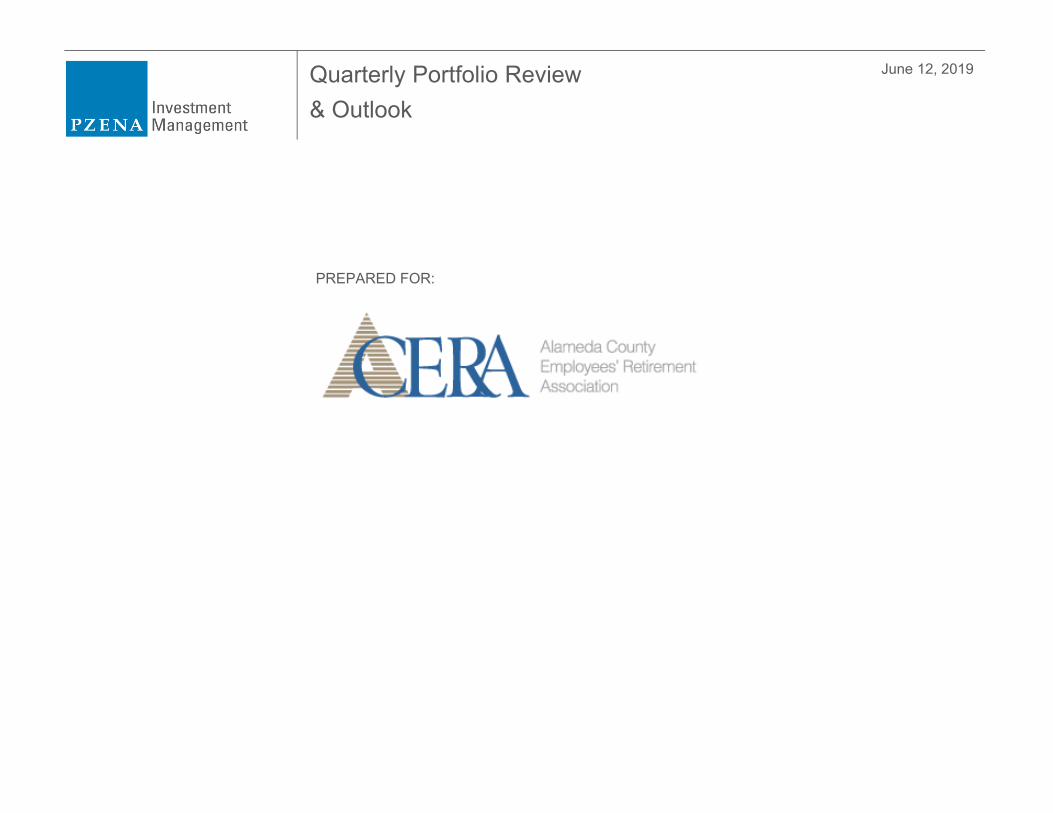
Mandate:
Inception Date:
Portfolios:
Assets Under Management:
Large Cap Focused Value Strategy
1/5/2006
ALAMEDA COUNTY EMPLOYEES
RETIREMENT ASSOCIATION (ACERA)
$ 164.9 million
ACERA’s Relationship with Pzena Investment Management
AUM as of 3/31/2019
| 2
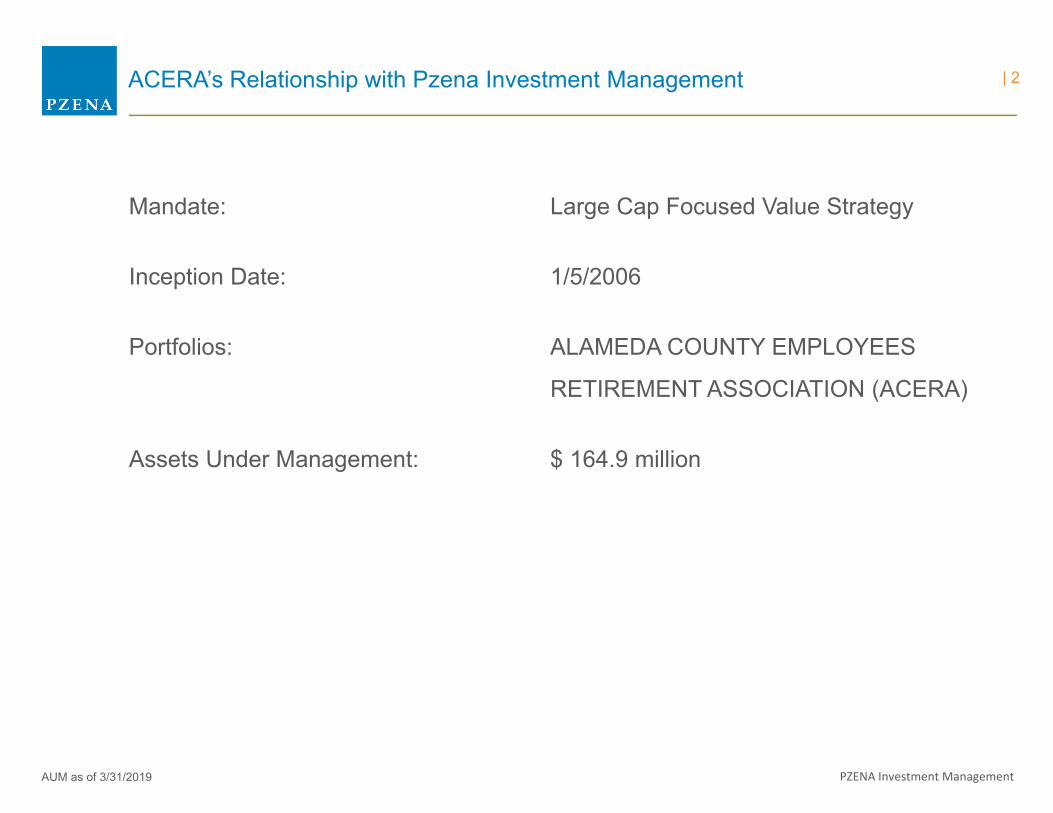
Ten Largest Holdings
% Weight
AMERICAN INTERNATIONAL GROUP 4.1 %
FORD MOTOR COMPANY 3.7 %
HALLIBURTON CO 3.7 %
CITIGROUP INC 3.7 %
GENERAL ELECTRIC CO 3.5 %
CAPITAL ONE FINL CORP 3.4 %
COGNIZANT TECH SOLUTIONS - A 3.2 %
LEAR CORP 3.2 %
HEWLETT PACKARD ENTERPRISE COMPANY 3.1 %
BANK OF AMERICA CORP 3.0 %
Total 34.4 %
Portfolio Changes
Portfolio Value on 12/31/2018 147,980,181
Contributions 33
Distributions 0
Inv Mgmt Fees -211,123
Expenses 0
Income 1,049,651
Appreciation 16,116,720
Change in Accrued Income -6,324
Portfolio Value on 03/29/2019 164,929,139
Portfolio Allocation
% of Current
Allocation Value Total Yield
Cash & Equivalents 3,008,964 1.82 1.91
Equities 161,695,611 98.04 2.61
Accrued Income 224,564 0.14 N/A
Total 164,929,139 100 2.59
Portfolio Performance-Historical Rates of Return
Annualized
Month Quarter Year One Three Five Ten Since
To Date To Date To Date Year Year* Year* Year* Jan 05, 2006
Portfolio (Gross) -1.72 11.60 11.60 -5.34 11.42 7.12 15.25 5.36
Portfolio (Net)¹ -1.72 11.45 11.45 -5.89 10.91 6.64 14.77 4.92
F. R. 1000 VALUE 0.64 11.93 11.93 5.67 10.45 7.72 14.52 6.97
*Annualized Returns
¹ Performance is Net of Fees
Note: Securities with a *** preceding the security name denote an American Depository Receipt or US-traded foreign security.
PZENA INVESTMENT MANAGEMENT, LLC
Period December 31, 2018 - March 29, 2019
ALAMEDA COUNTY EMPLOYEES RETIREMENT ASSOCIATION (ACERA)
Portfolio Summary
Report Currency = US Dollar
Current Strategy:Large Cap Focused Value
Preliminary | 3
PZENA Investment Management
-15%
-10%
-5%
0%
5%
10%
15%
20%
25%
30%
-15% -10% -5% 0% 5% 10% 15% 20% 25% 30%
Pre-GFC Periods (Sep 05 - Oct 07) Periods coinciding with GFC (Nov 07 - Jan 14) Post-GFC Periods (Feb 14 - Mar 19)
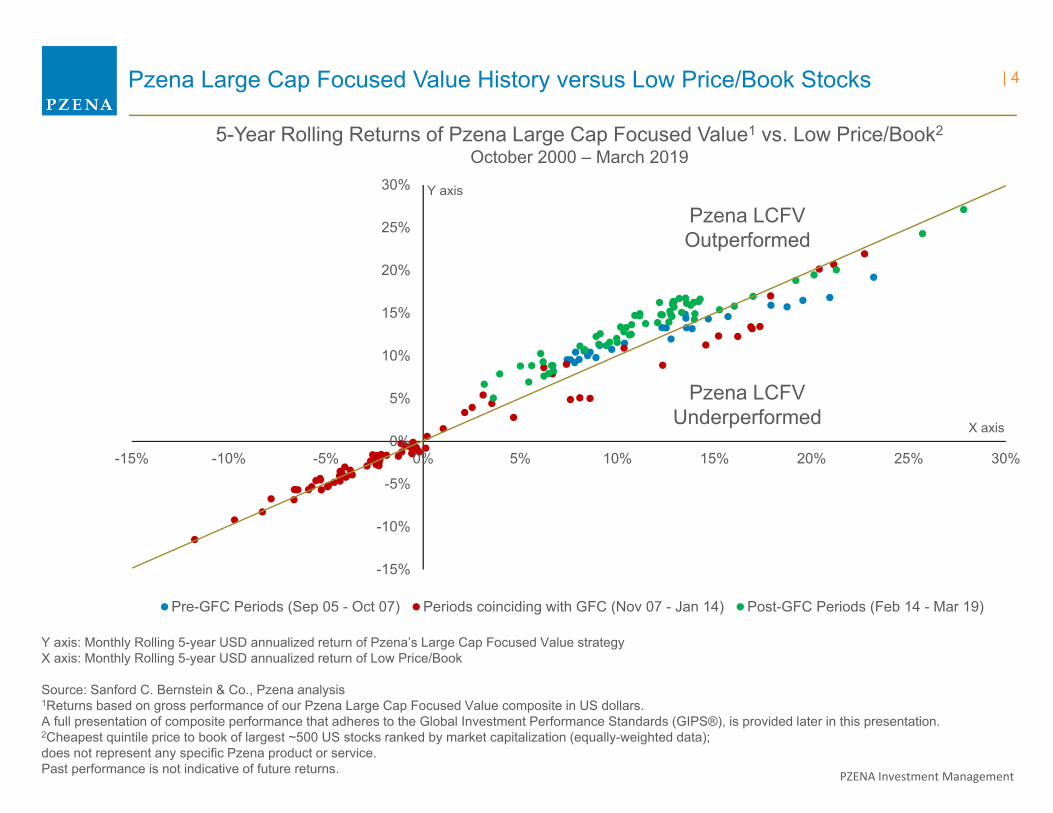
Pzena Large Cap Focused Value History versus Low Price/Book Stocks
Y axis: Monthly Rolling 5-year USD annualized return of Pzena’s Large Cap Focused Value strategyX axis: Monthly Rolling 5-year USD annualized return of Low Price/Book
Source: Sanford C. Bernstein & Co., Pzena analysis1Returns based on gross performance of our Pzena Large Cap Focused Value composite in US dollars.A full presentation of composite performance that adheres to the Global Investment Performance Standards (GIPS®), is provided later in this presentation.2Cheapest quintile price to book of largest ~500 US stocks ranked by market capitalization (equally-weighted data);does not represent any specific Pzena product or service. Past performance is not indicative of future returns.
Pzena LCFV Outperformed
Y axis
Pzena LCFV Underperformed X axis
5-Year Rolling Returns of Pzena Large Cap Focused Value1 vs. Low Price/Book2
October 2000 – March 2019
| 4

PZENA Investment Management
Pzena Long-Term Return Record: Pzena Focused Value
Returns based on gross performance of our Pzena Focused Value composite in US dollars. A full presentation of composite performance that adheres to the Global Investment Performance Standards (GIPS®), is provided later in this presentation.Source: Frank Russell Company, Pzena AnalysisPast performance is not indicative of future returns.
16.5%
-29.7%
13.3%10.2%11.9%
-20.6%
12.1%8.7%
-40%
-30%
-20%
-10%
0%
10%
20%
Inception to Financial Crisis(1996 - 2006)
Financial Crisis(2007-2008)
Post Financial Crisis(2009 - Mar 2019)
Inception to Current(1996 - Mar 2019)
Pzena Focused Value Russell 1000 Value Index
11 Years 2 Years 10.3 Years 23.3 Years
| 5
PZENA Investment Management
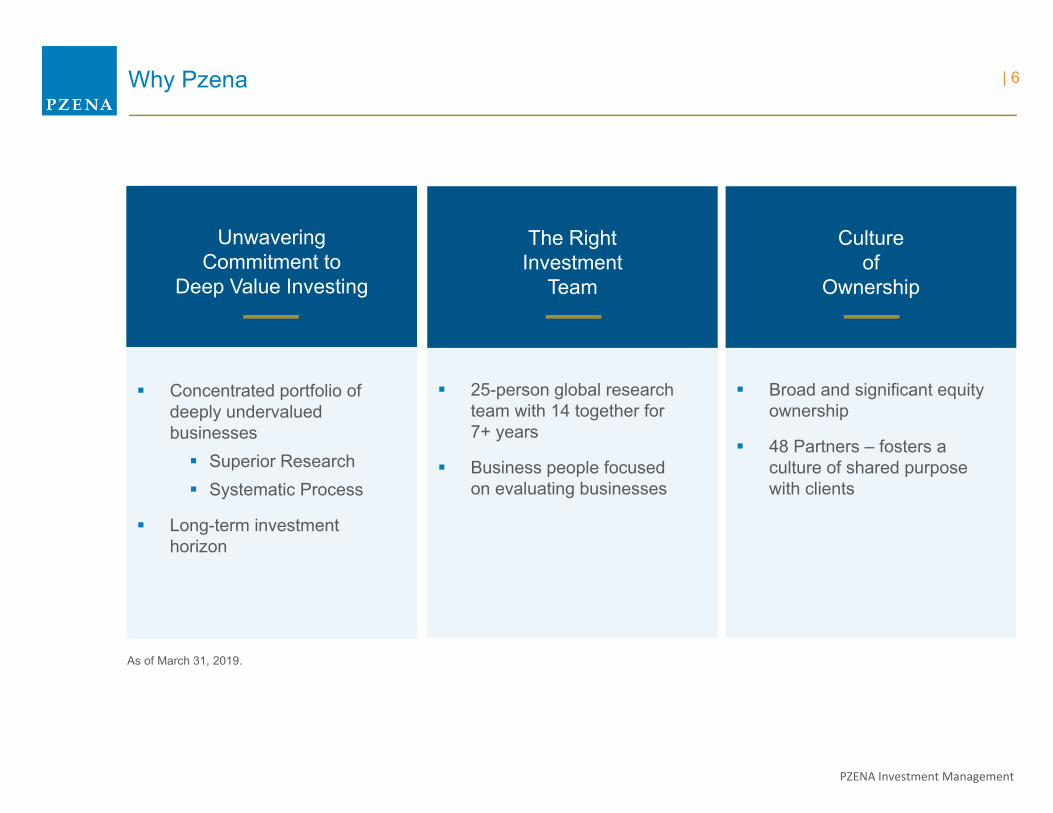
Why Pzena
Unwavering Commitment to
Deep Value Investing
Concentrated portfolio of deeply undervalued businesses Superior Research Systematic Process
Long-term investment horizon
25-person global research team with 14 together for 7+ years
Business people focused on evaluating businesses
Broad and significant equity ownership
48 Partners – fosters a culture of shared purpose with clients
The Right Investment
Team
Culture of
Ownership
As of March 31, 2019.
| 6
PZENA Investment Management
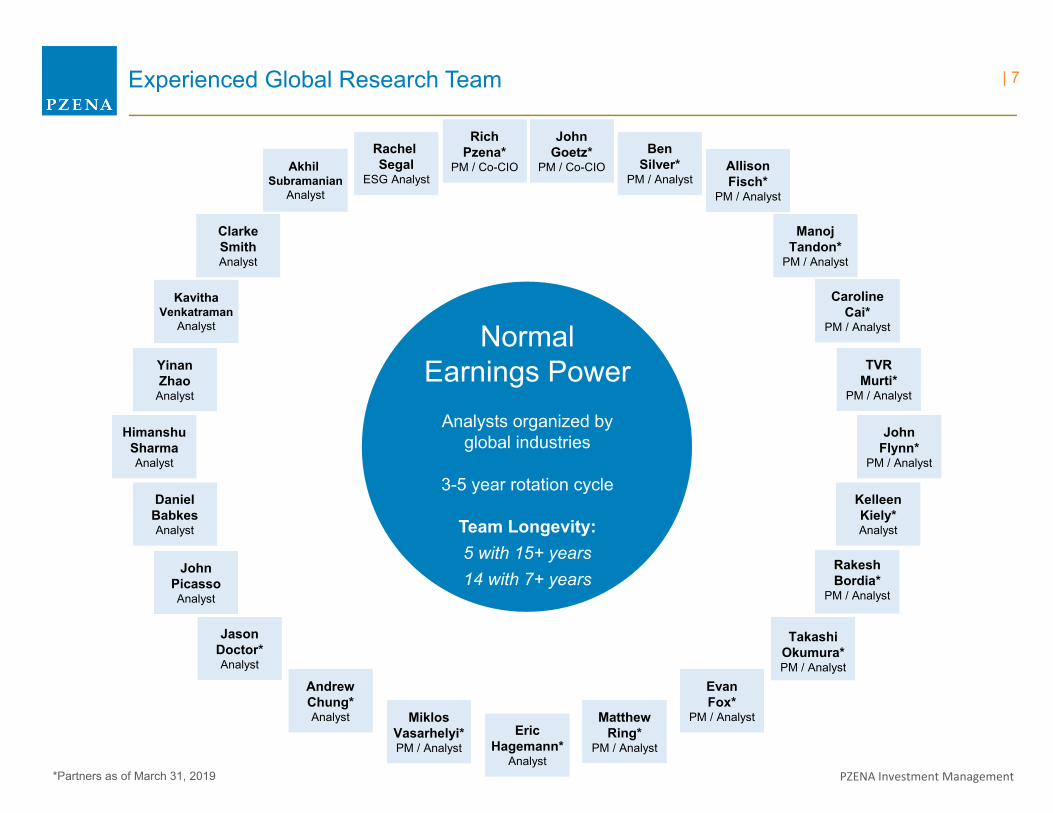
Experienced Global Research Team
*Partners as of March 31, 2019
Akhil Subramanian
Analyst
AllisonFisch*
PM / Analyst
RichPzena*
PM / Co-CIOBen
Silver*PM / Analyst
JohnGoetz*
PM / Co-CIO
ClarkeSmithAnalyst
ManojTandon*
PM / Analyst
CarolineCai*
PM / Analyst
KavithaVenkatraman
Analyst
YinanZhao
Analyst
TVRMurti*
PM / Analyst
HimanshuSharmaAnalyst
JohnFlynn*
PM / Analyst
DanielBabkesAnalyst
KelleenKiely*Analyst
JohnPicassoAnalyst
MiklosVasarhelyi*PM / Analyst
RakeshBordia*
PM / Analyst
JasonDoctor*Analyst
TakashiOkumura*PM / Analyst
EvanFox*
PM / AnalystEric
Hagemann*Analyst
AndrewChung*Analyst Matthew
Ring*PM / Analyst
Analysts organized byglobal industries
3-5 year rotation cycle
Team Longevity:5 with 15+ years14 with 7+ years
NormalEarnings Power
Rachel Segal
ESG Analyst
| 7
PZENA Investment Management
-2
-1
0
1
2
3
4
5
6
1974 1979 1983 1988 1992 1997 2001 2005 2010 2014 2019
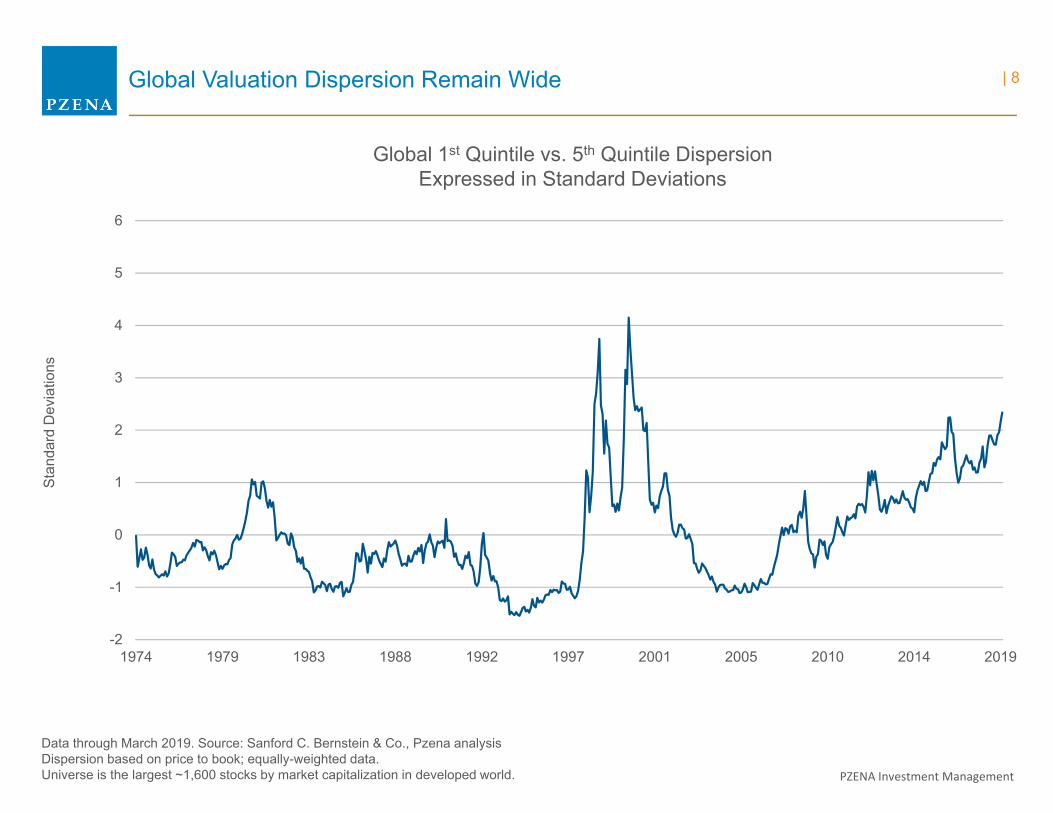
Global Valuation Dispersion Remain Wide
Data through March 2019. Source: Sanford C. Bernstein & Co., Pzena analysisDispersion based on price to book; equally-weighted data.Universe is the largest ~1,600 stocks by market capitalization in developed world.
Stan
dard
Dev
iatio
ns
Global 1st Quintile vs. 5th Quintile DispersionExpressed in Standard Deviations
| 8
PZENA Investment Management
-2
-1
0
1
2
3
4
5
6
1992 1995 1998 2001 2004 2007 2010 2013 2016 2019-2
-1
0
1
2
3
4
5
6
1974 1979 1983 1988 1992 1997 2001 2005 2010 2014 2019
-2
-1
0
1
2
3
4
5
6
1974 1979 1983 1988 1992 1997 2001 2005 2010 2014 2019-2
-1
0
1
2
3
4
5
6
1974 1979 1983 1988 1992 1997 2001 2005 2010 2014 2019
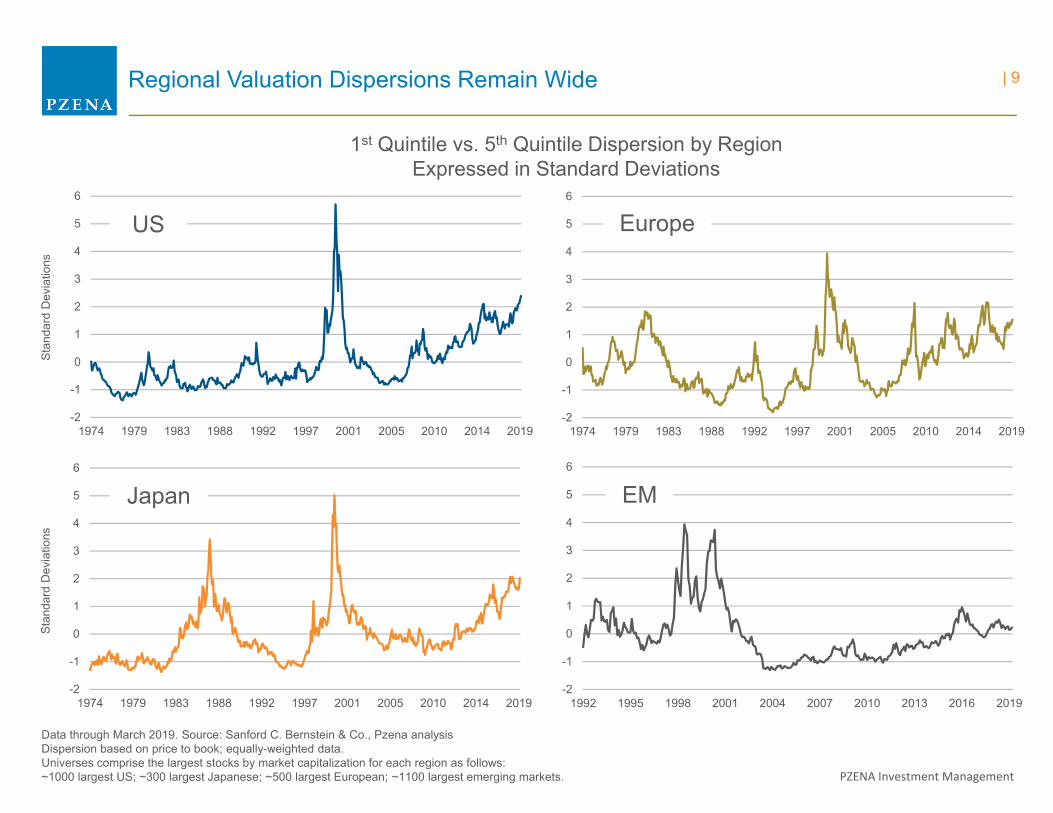
Regional Valuation Dispersions Remain Wide
Data through March 2019. Source: Sanford C. Bernstein & Co., Pzena analysisDispersion based on price to book; equally-weighted data.Universes comprise the largest stocks by market capitalization for each region as follows:~1000 largest US; ~300 largest Japanese; ~500 largest European; ~1100 largest emerging markets.
Stan
dard
Dev
iatio
nsSt
anda
rd D
evia
tions
US Europe
Japan EM
1st Quintile vs. 5th Quintile Dispersion by RegionExpressed in Standard Deviations
| 9
PZENA Investment Management
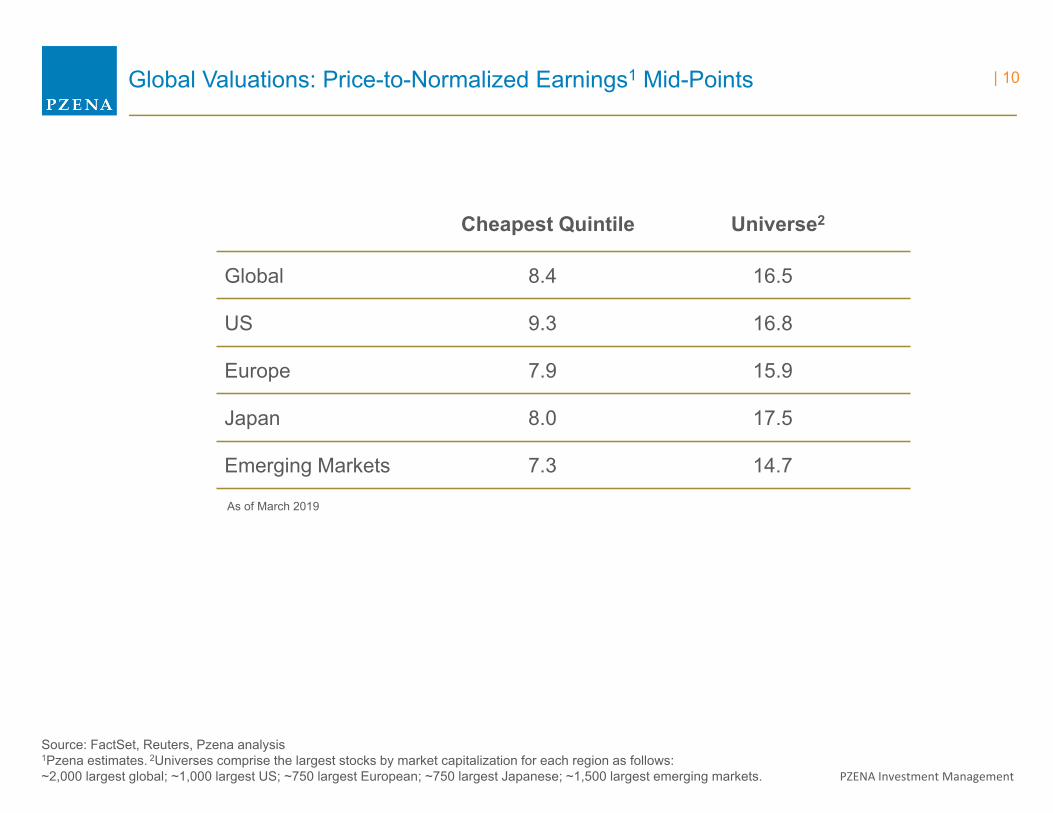
Global Valuations: Price-to-Normalized Earnings1 Mid-Points
Source: FactSet, Reuters, Pzena analysis1Pzena estimates. 2Universes comprise the largest stocks by market capitalization for each region as follows:~2,000 largest global; ~1,000 largest US; ~750 largest European; ~750 largest Japanese; ~1,500 largest emerging markets.
Cheapest Quintile Universe2
Global 8.4 16.5
US 9.3 16.8
Europe 7.9 15.9
Japan 8.0 17.5
Emerging Markets 7.3 14.7
As of March 2019
| 10
PZENA Investment Management
-80%
-60%
-40%
-20%
0%
20%
40%
60%
80%
1980 1985 1990 1995 1999 2004 2009 2014 2019
S&P 500 Overvalued
S&P 500 Undervalued
Normal Range
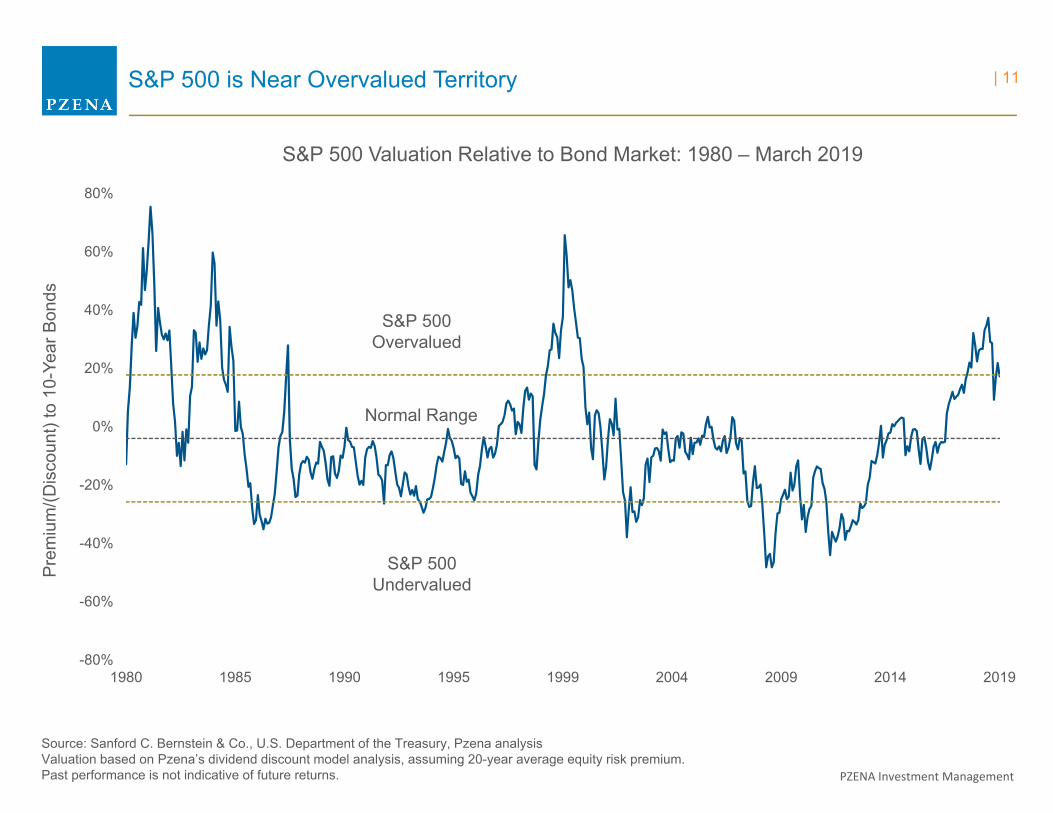
S&P 500 is Near Overvalued Territory
S&P 500 Valuation Relative to Bond Market: 1980 – March 2019
Source: Sanford C. Bernstein & Co., U.S. Department of the Treasury, Pzena analysisValuation based on Pzena’s dividend discount model analysis, assuming 20-year average equity risk premium.Past performance is not indicative of future returns.
Prem
ium
/(Dis
coun
t) to
10-
Year
Bon
ds| 11
PZENA Investment Management
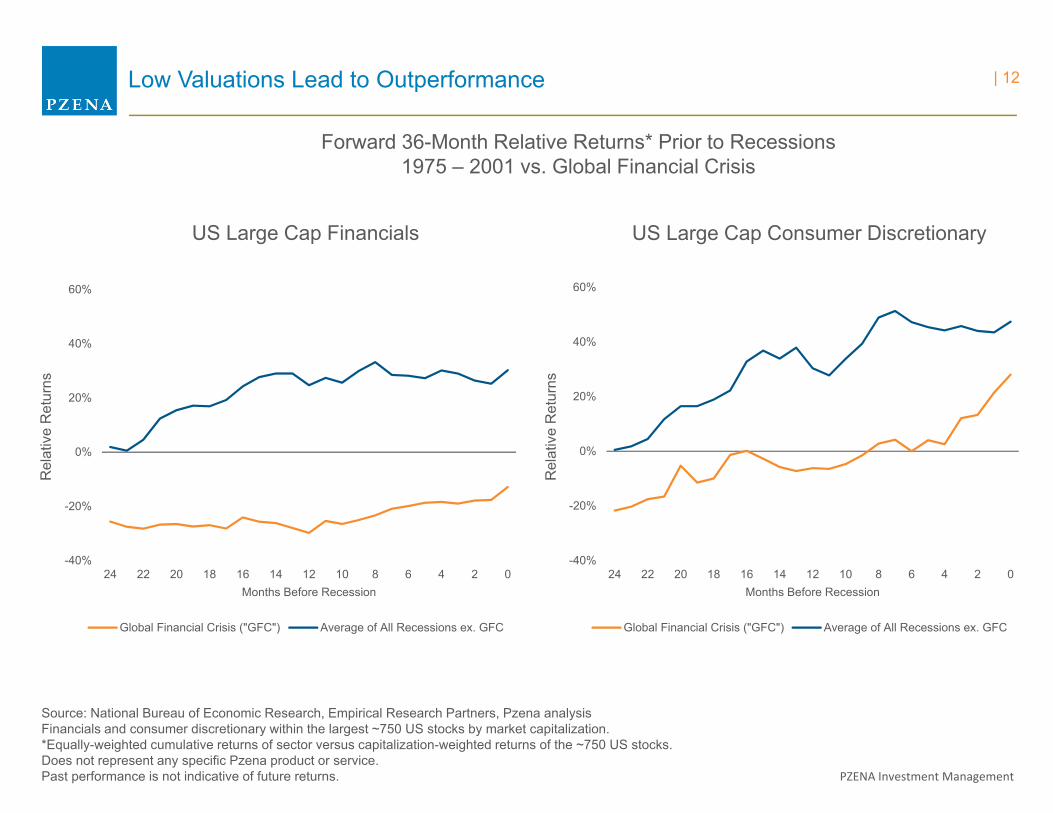
Low Valuations Lead to Outperformance
Source: National Bureau of Economic Research, Empirical Research Partners, Pzena analysisFinancials and consumer discretionary within the largest ~750 US stocks by market capitalization.*Equally-weighted cumulative returns of sector versus capitalization-weighted returns of the ~750 US stocks.Does not represent any specific Pzena product or service.Past performance is not indicative of future returns.
Forward 36-Month Relative Returns* Prior to Recessions1975 – 2001 vs. Global Financial Crisis
US Large Cap Financials US Large Cap Consumer Discretionary
Rel
ativ
e R
etur
ns
Rel
ativ
e R
etur
ns-40%
-20%
0%
20%
40%
60%
24 22 20 18 16 14 12 10 8 6 4 2 0Months Before Recession
Global Financial Crisis ("GFC") Average of All Recessions ex. GFC
-40%
-20%
0%
20%
40%
60%
24 22 20 18 16 14 12 10 8 6 4 2 0Months Before Recession
Global Financial Crisis ("GFC") Average of All Recessions ex. GFC
| 12
PZENA Investment Management
0.4x
0.5x
0.6x
0.7x
0.8x
0.9x
1.0x
1.1x
1974 1978 1982 1986 1990 1994 1998 2002 2006 2010 2014 2018
Recessions
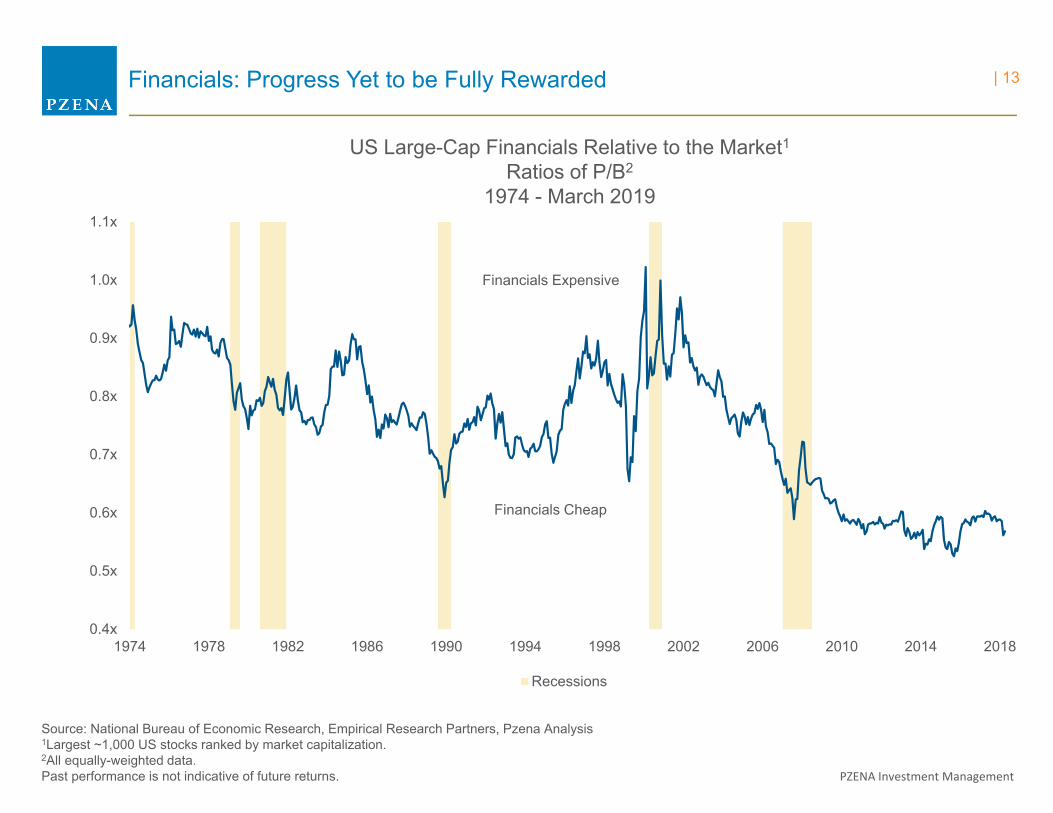
Financials Cheap
Financials Expensive
Financials: Progress Yet to be Fully Rewarded
Source: National Bureau of Economic Research, Empirical Research Partners, Pzena Analysis1Largest ~1,000 US stocks ranked by market capitalization.2All equally-weighted data.Past performance is not indicative of future returns.
US Large-Cap Financials Relative to the Market1Ratios of P/B2
1974 - March 2019
| 13
PZENA Investment Management
-5%
0%
5%
10%
15%
20%
25%
30%
2000 2003 2006 2009 2012 2015 2018
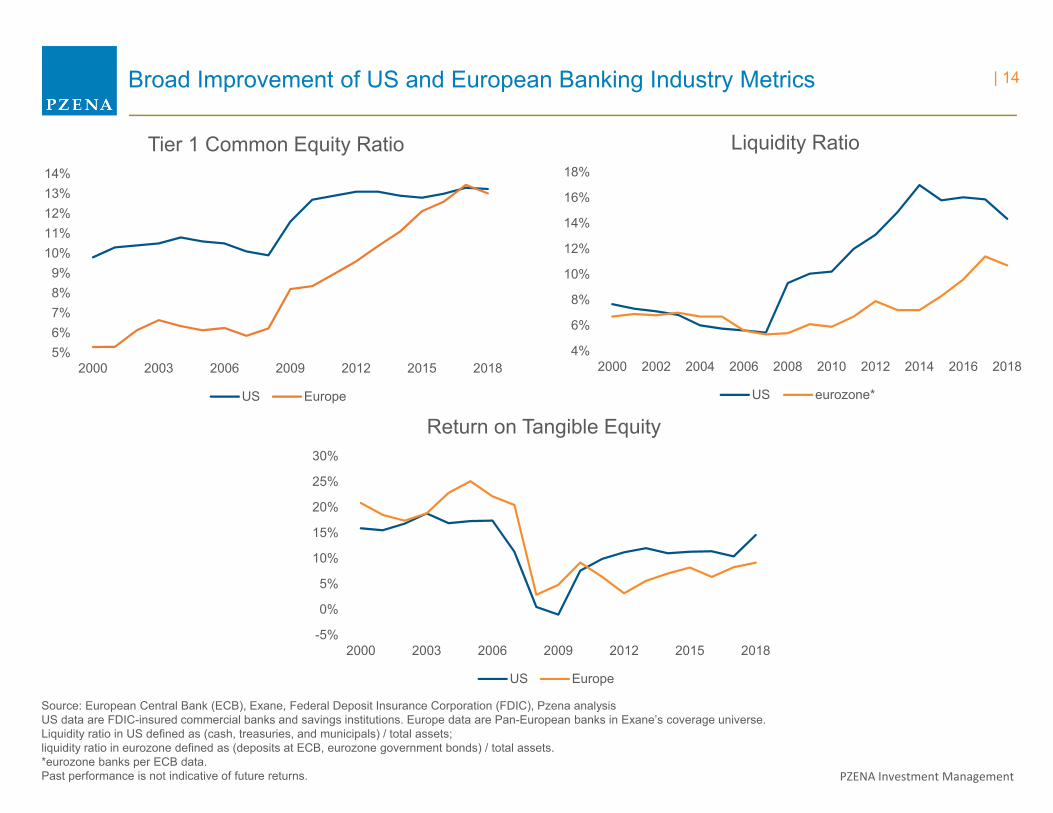
Return on Tangible Equity
US Europe
4%
6%
8%
10%
12%
14%
16%
18%
2000 2002 2004 2006 2008 2010 2012 2014 2016 2018
Liquidity Ratio
US eurozone*
5%6%7%8%9%
10%11%12%13%14%
2000 2003 2006 2009 2012 2015 2018
Tier 1 Common Equity Ratio
US Europe
Broad Improvement of US and European Banking Industry Metrics
Source: European Central Bank (ECB), Exane, Federal Deposit Insurance Corporation (FDIC), Pzena analysisUS data are FDIC-insured commercial banks and savings institutions. Europe data are Pan-European banks in Exane’s coverage universe.Liquidity ratio in US defined as (cash, treasuries, and municipals) / total assets;liquidity ratio in eurozone defined as (deposits at ECB, eurozone government bonds) / total assets.*eurozone banks per ECB data.Past performance is not indicative of future returns.
| 14
PZENA Investment Management
-2.5%
-2.0%
-1.5%
-1.0%
-0.5%
0.0%
0.5%
1.0%
1.5%
2.0%
0
100,000
200,000
300,000
400,000
500,000
600,000
700,000
800,000
900,000
1,000,000
1980
1981
1982
1983
1984
1985
1986
1987
1988
1989
1990
1991
1992
1993
1994
1995
1996
1997
1998
1999
2000
2001
2002
2003
2004
2005
2006
2007
2008
2009
2010
2011
2012
2013
2014
2015
2016
2017
2018
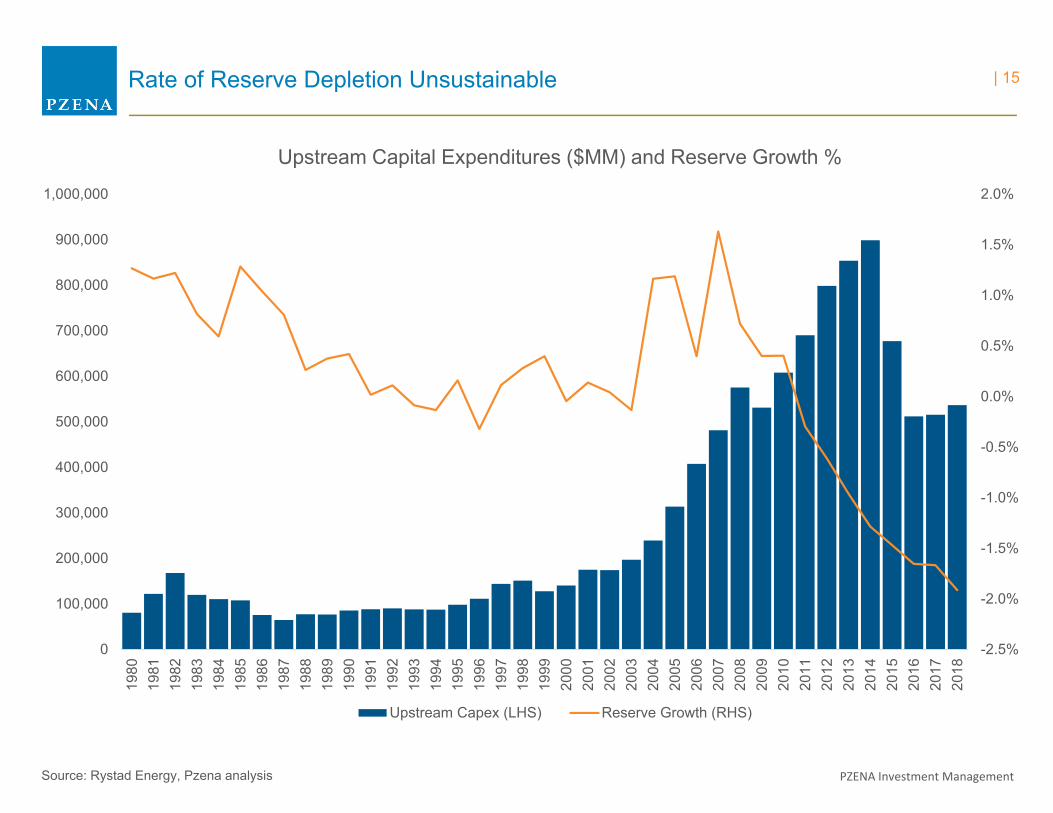
Upstream Capex (LHS) Reserve Growth (RHS)
Rate of Reserve Depletion Unsustainable
Source: Rystad Energy, Pzena analysis
Upstream Capital Expenditures ($MM) and Reserve Growth %
| 15
PZENA Investment Management
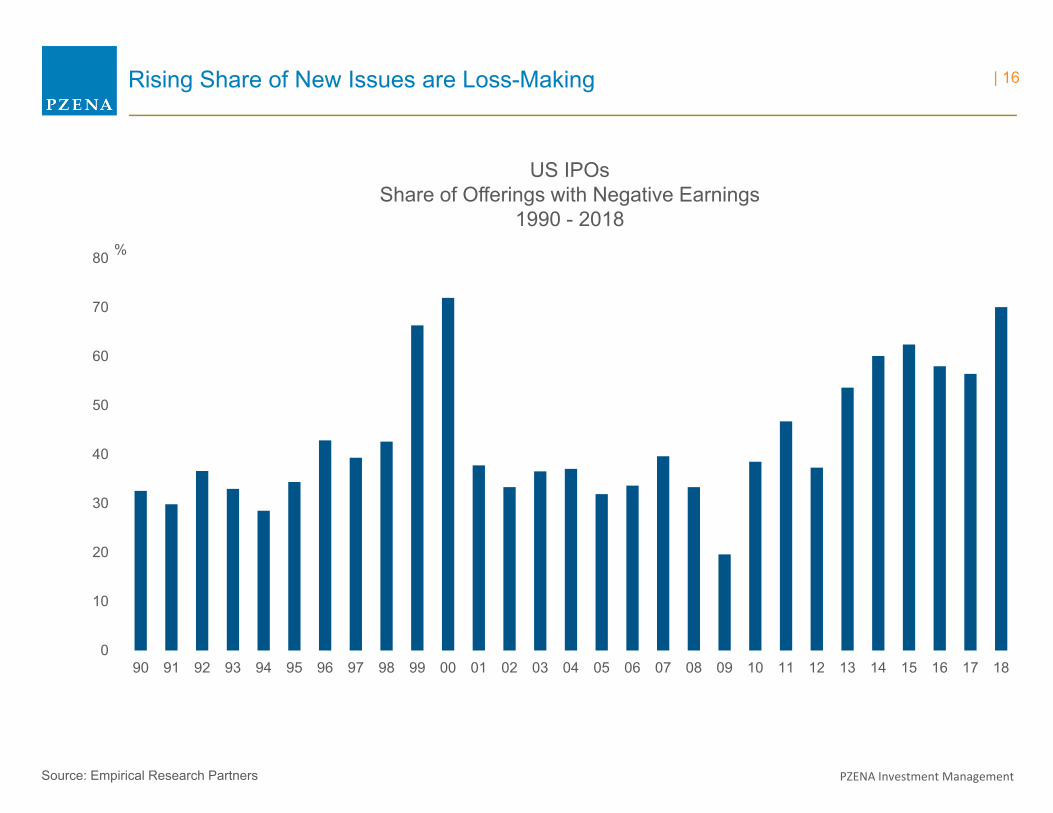
Rising Share of New Issues are Loss-Making
Source: Empirical Research Partners
US IPOsShare of Offerings with Negative Earnings
1990 - 2018
0
10
20
30
40
50
60
70
80
90 91 92 93 94 95 96 97 98 99 00 01 02 03 04 05 06 07 08 09 10 11 12 13 14 15 16 17 18
%
| 16
PZENA Investment Management
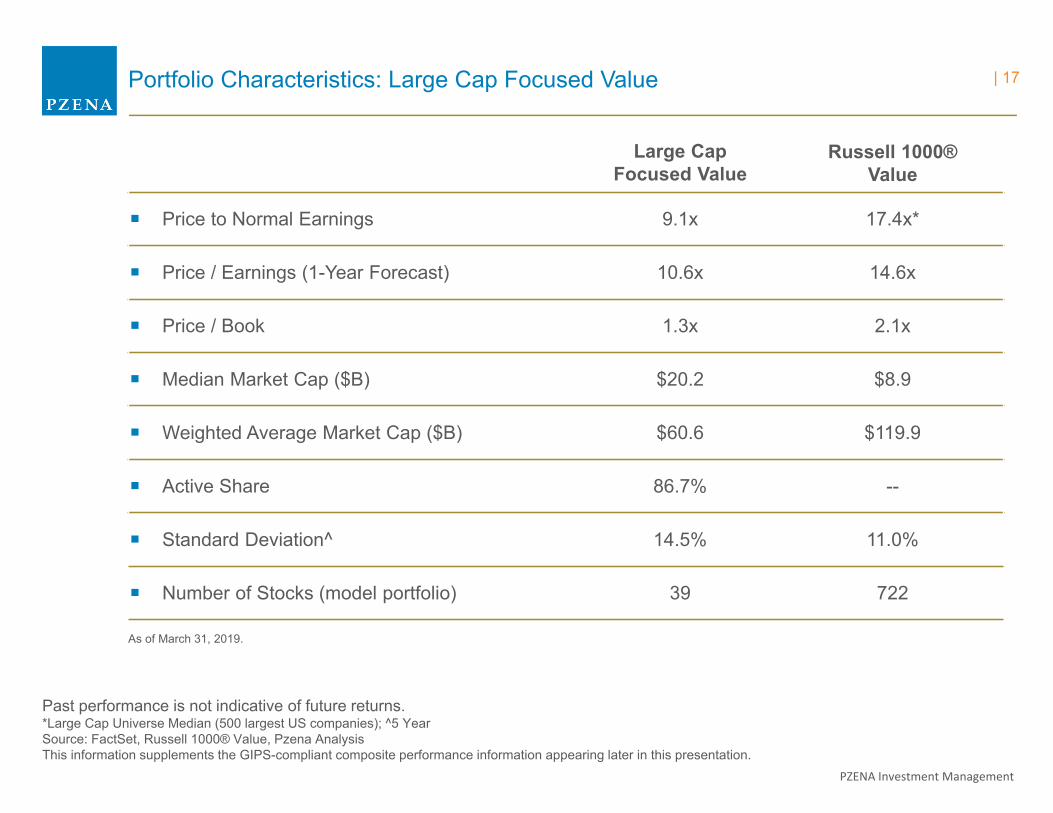
Past performance is not indicative of future returns.*Large Cap Universe Median (500 largest US companies); ^5 YearSource: FactSet, Russell 1000® Value, Pzena AnalysisThis information supplements the GIPS-compliant composite performance information appearing later in this presentation.
Large CapFocused Value
Russell 1000®Value
Price to Normal Earnings 9.1x 17.4x*
Price / Earnings (1-Year Forecast) 10.6x 14.6x
Price / Book 1.3x 2.1x
Median Market Cap ($B) $20.2 $8.9
Weighted Average Market Cap ($B) $60.6 $119.9
Active Share 86.7% --
Standard Deviation^ 14.5% 11.0%
Number of Stocks (model portfolio) 39 722
Portfolio Characteristics: Large Cap Focused Value
As of March 31, 2019.
| 17
PZENA Investment Management
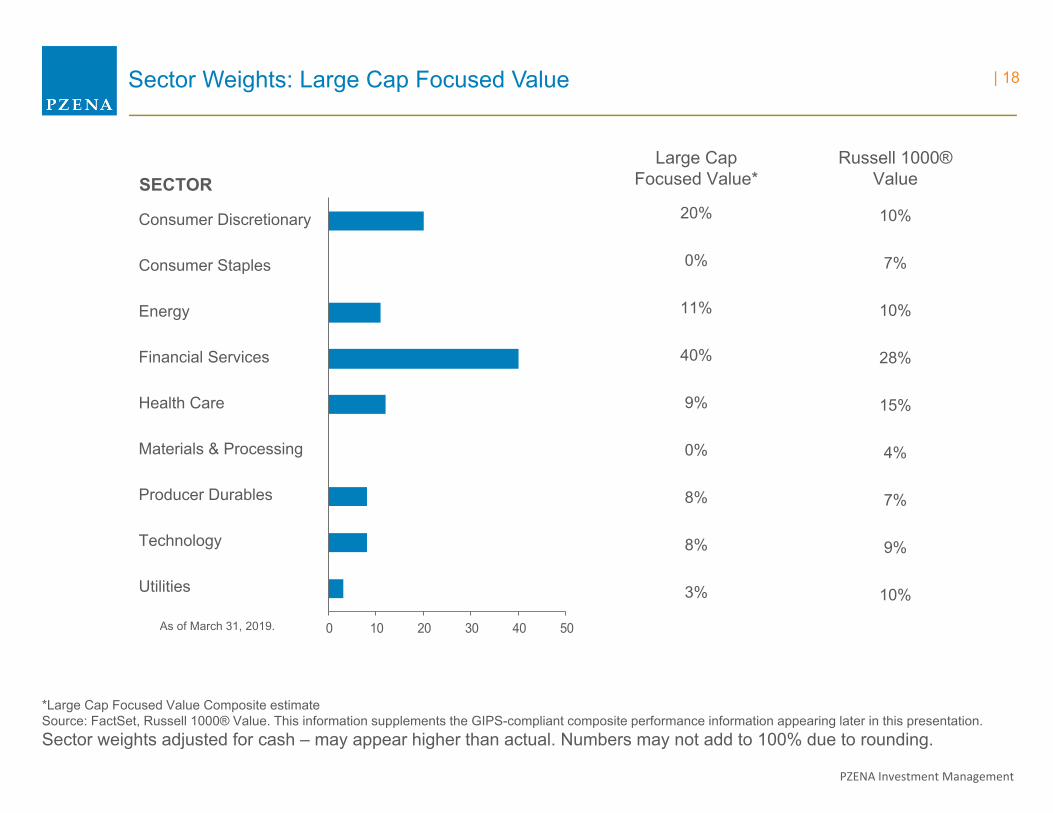
*Large Cap Focused Value Composite estimateSource: FactSet, Russell 1000® Value. This information supplements the GIPS-compliant composite performance information appearing later in this presentation.Sector weights adjusted for cash – may appear higher than actual. Numbers may not add to 100% due to rounding.
Russell 1000®ValueSECTOR
Large CapFocused Value*
Consumer Discretionary
Consumer Staples
Energy
Financial Services
Health Care
Materials & Processing
Producer Durables
Technology
Utilities
20%
0%
11%
40%
9%
0%
8%
8%
3%
0 10 20 30 40 50
Sector Weights: Large Cap Focused Value
As of March 31, 2019.
10%
7%
10%
28%
15%
4%
7%
9%
10%
| 18
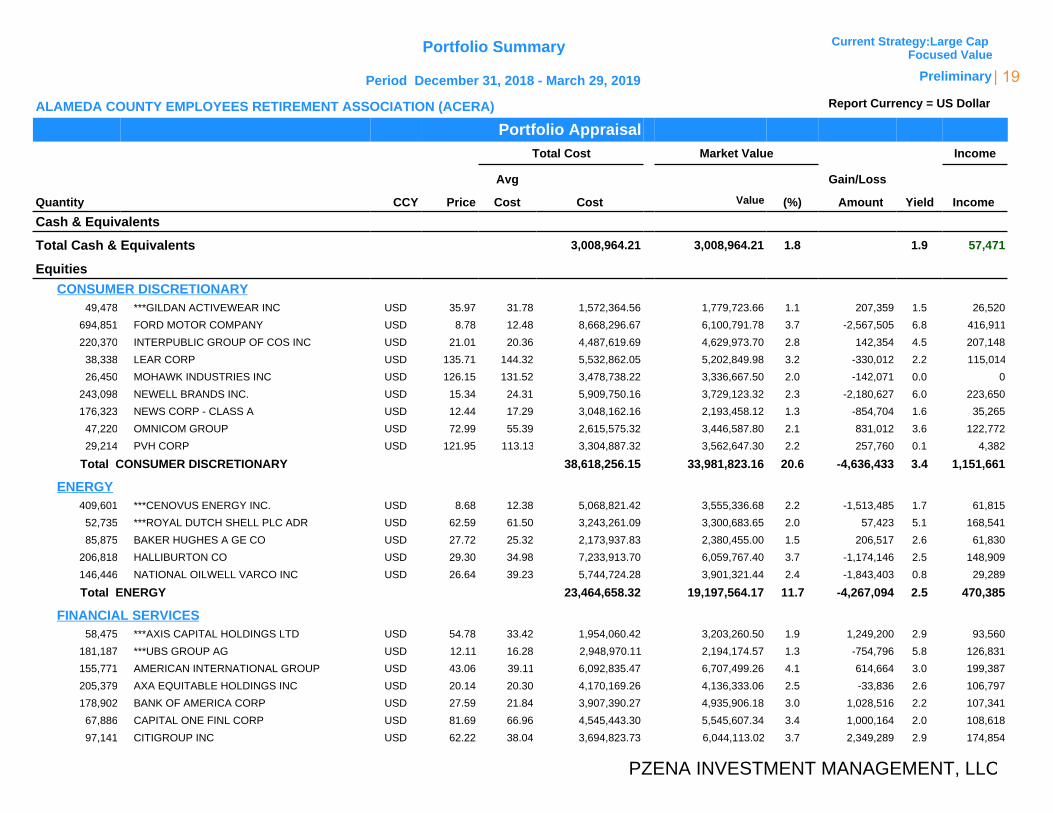
Portfolio AppraisalTotal Cost Market Value Income
Avg Gain/Loss
Quantity CCY Price Cost Cost Value (%) Amount Yield Income
Cash & Equivalents
Total Cash & Equivalents 3,008,964.21 3,008,964.21 1.8 1.9 57,471
Equities
CONSUMER DISCRETIONARY49,478 ***GILDAN ACTIVEWEAR INC USD 35.97 31.78 1,572,364.56 1,779,723.66 1.1 207,359 1.5 26,520
694,851 FORD MOTOR COMPANY USD 8.78 12.48 8,668,296.67 6,100,791.78 3.7 -2,567,505 6.8 416,911
220,370 INTERPUBLIC GROUP OF COS INC USD 21.01 20.36 4,487,619.69 4,629,973.70 2.8 142,354 4.5 207,148
38,338 LEAR CORP USD 135.71 144.32 5,532,862.05 5,202,849.98 3.2 -330,012 2.2 115,014
26,450 MOHAWK INDUSTRIES INC USD 126.15 131.52 3,478,738.22 3,336,667.50 2.0 -142,071 0.0 0
243,098 NEWELL BRANDS INC. USD 15.34 24.31 5,909,750.16 3,729,123.32 2.3 -2,180,627 6.0 223,650
176,323 NEWS CORP - CLASS A USD 12.44 17.29 3,048,162.16 2,193,458.12 1.3 -854,704 1.6 35,265
47,220 OMNICOM GROUP USD 72.99 55.39 2,615,575.32 3,446,587.80 2.1 831,012 3.6 122,772
29,214 PVH CORP USD 121.95 113.13 3,304,887.32 3,562,647.30 2.2 257,760 0.1 4,382
Total CONSUMER DISCRETIONARY 38,618,256.15 33,981,823.16 20.6 -4,636,433 3.4 1,151,661
ENERGY409,601 ***CENOVUS ENERGY INC. USD 8.68 12.38 5,068,821.42 3,555,336.68 2.2 -1,513,485 1.7 61,815
52,735 ***ROYAL DUTCH SHELL PLC ADR USD 62.59 61.50 3,243,261.09 3,300,683.65 2.0 57,423 5.1 168,541
85,875 BAKER HUGHES A GE CO USD 27.72 25.32 2,173,937.83 2,380,455.00 1.5 206,517 2.6 61,830
206,818 HALLIBURTON CO USD 29.30 34.98 7,233,913.70 6,059,767.40 3.7 -1,174,146 2.5 148,909
146,446 NATIONAL OILWELL VARCO INC USD 26.64 39.23 5,744,724.28 3,901,321.44 2.4 -1,843,403 0.8 29,289
Total ENERGY 23,464,658.32 19,197,564.17 11.7 -4,267,094 2.5 470,385
FINANCIAL SERVICES58,475 ***AXIS CAPITAL HOLDINGS LTD USD 54.78 33.42 1,954,060.42 3,203,260.50 1.9 1,249,200 2.9 93,560
181,187 ***UBS GROUP AG USD 12.11 16.28 2,948,970.11 2,194,174.57 1.3 -754,796 5.8 126,831
155,771 AMERICAN INTERNATIONAL GROUP USD 43.06 39.11 6,092,835.47 6,707,499.26 4.1 614,664 3.0 199,387
205,379 AXA EQUITABLE HOLDINGS INC USD 20.14 20.30 4,170,169.26 4,136,333.06 2.5 -33,836 2.6 106,797
178,902 BANK OF AMERICA CORP USD 27.59 21.84 3,907,390.27 4,935,906.18 3.0 1,028,516 2.2 107,341
67,886 CAPITAL ONE FINL CORP USD 81.69 66.96 4,545,443.30 5,545,607.34 3.4 1,000,164 2.0 108,618
97,141 CITIGROUP INC USD 62.22 38.04 3,694,823.73 6,044,113.02 3.7 2,349,289 2.9 174,854
PZENA INVESTMENT MANAGEMENT, LLC
Period December 31, 2018 - March 29, 2019
ALAMEDA COUNTY EMPLOYEES RETIREMENT ASSOCIATION (ACERA)
Portfolio Summary
Report Currency = US Dollar
Current Strategy:Large Cap Focused Value
Preliminary | 19
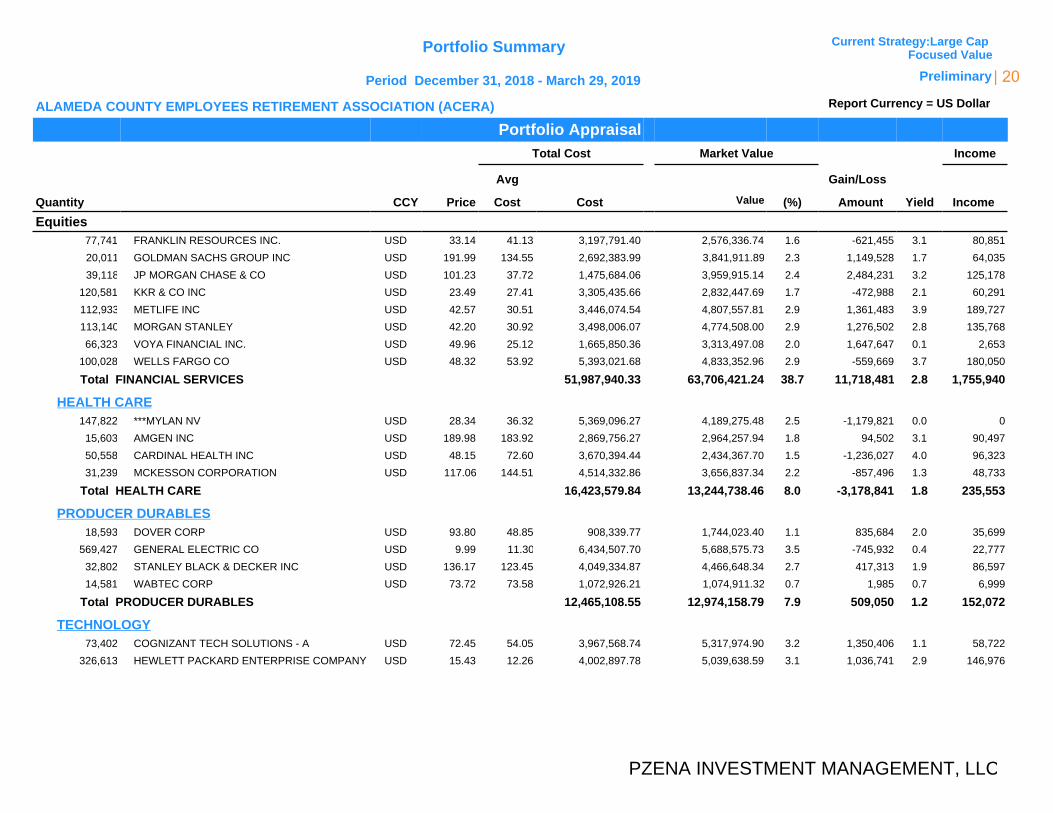
Portfolio AppraisalTotal Cost Market Value Income
Avg Gain/Loss
Quantity CCY Price Cost Cost Value (%) Amount Yield Income
Equities77,741 FRANKLIN RESOURCES INC. USD 33.14 41.13 3,197,791.40 2,576,336.74 1.6 -621,455 3.1 80,851
20,011 GOLDMAN SACHS GROUP INC USD 191.99 134.55 2,692,383.99 3,841,911.89 2.3 1,149,528 1.7 64,035
39,118 JP MORGAN CHASE & CO USD 101.23 37.72 1,475,684.06 3,959,915.14 2.4 2,484,231 3.2 125,178
120,581 KKR & CO INC USD 23.49 27.41 3,305,435.66 2,832,447.69 1.7 -472,988 2.1 60,291
112,933 METLIFE INC USD 42.57 30.51 3,446,074.54 4,807,557.81 2.9 1,361,483 3.9 189,727
113,140 MORGAN STANLEY USD 42.20 30.92 3,498,006.07 4,774,508.00 2.9 1,276,502 2.8 135,768
66,323 VOYA FINANCIAL INC. USD 49.96 25.12 1,665,850.36 3,313,497.08 2.0 1,647,647 0.1 2,653
100,028 WELLS FARGO CO USD 48.32 53.92 5,393,021.68 4,833,352.96 2.9 -559,669 3.7 180,050
Total FINANCIAL SERVICES 51,987,940.33 63,706,421.24 38.7 11,718,481 2.8 1,755,940
HEALTH CARE147,822 ***MYLAN NV USD 28.34 36.32 5,369,096.27 4,189,275.48 2.5 -1,179,821 0.0 0
15,603 AMGEN INC USD 189.98 183.92 2,869,756.27 2,964,257.94 1.8 94,502 3.1 90,497
50,558 CARDINAL HEALTH INC USD 48.15 72.60 3,670,394.44 2,434,367.70 1.5 -1,236,027 4.0 96,323
31,239 MCKESSON CORPORATION USD 117.06 144.51 4,514,332.86 3,656,837.34 2.2 -857,496 1.3 48,733
Total HEALTH CARE 16,423,579.84 13,244,738.46 8.0 -3,178,841 1.8 235,553
PRODUCER DURABLES18,593 DOVER CORP USD 93.80 48.85 908,339.77 1,744,023.40 1.1 835,684 2.0 35,699
569,427 GENERAL ELECTRIC CO USD 9.99 11.30 6,434,507.70 5,688,575.73 3.5 -745,932 0.4 22,777
32,802 STANLEY BLACK & DECKER INC USD 136.17 123.45 4,049,334.87 4,466,648.34 2.7 417,313 1.9 86,597
14,581 WABTEC CORP USD 73.72 73.58 1,072,926.21 1,074,911.32 0.7 1,985 0.7 6,999
Total PRODUCER DURABLES 12,465,108.55 12,974,158.79 7.9 509,050 1.2 152,072
TECHNOLOGY73,402 COGNIZANT TECH SOLUTIONS - A USD 72.45 54.05 3,967,568.74 5,317,974.90 3.2 1,350,406 1.1 58,722
326,613 HEWLETT PACKARD ENTERPRISE COMPANY USD 15.43 12.26 4,002,897.78 5,039,638.59 3.1 1,036,741 2.9 146,976
PZENA INVESTMENT MANAGEMENT, LLC
Period December 31, 2018 - March 29, 2019
ALAMEDA COUNTY EMPLOYEES RETIREMENT ASSOCIATION (ACERA)
Portfolio Summary
Report Currency = US Dollar
Current Strategy:Large Cap Focused Value
Preliminary | 20
Portfolio AppraisalTotal Cost Market Value Income
Avg Gain/Loss
Quantity CCY Price Cost Cost Value (%) Amount Yield Income
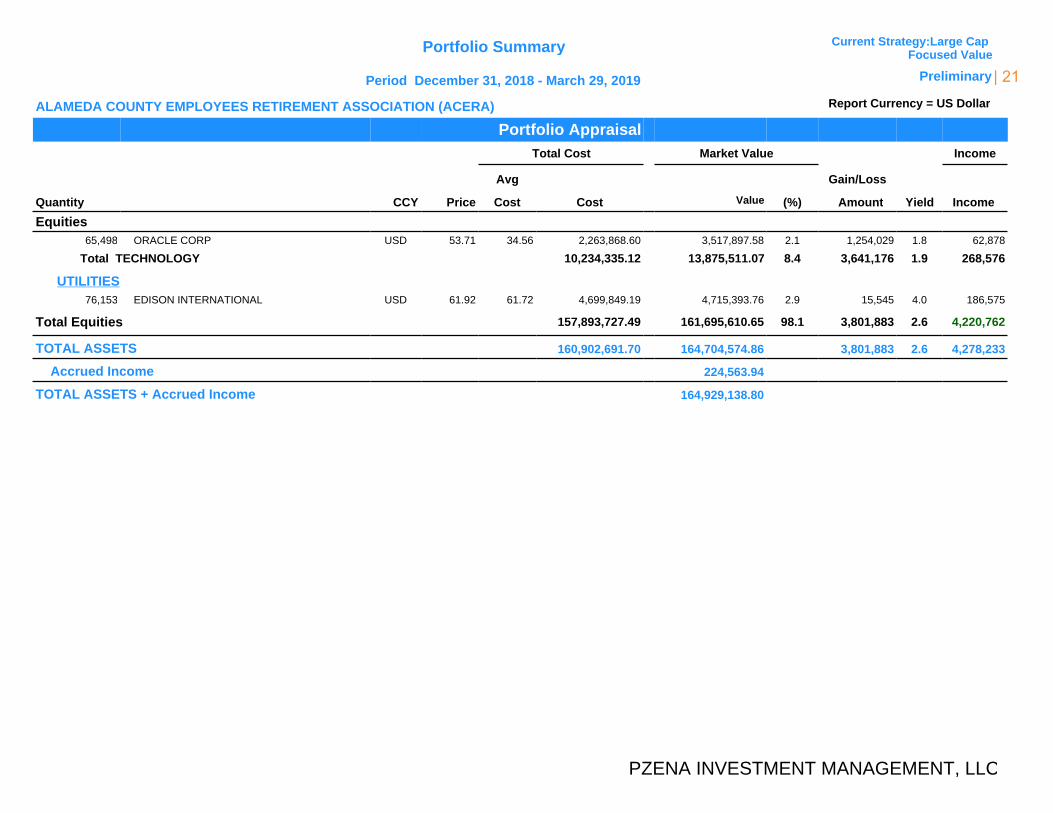
Equities65,498 ORACLE CORP USD 53.71 34.56 2,263,868.60 3,517,897.58 2.1 1,254,029 1.8 62,878
Total TECHNOLOGY 10,234,335.12 13,875,511.07 8.4 3,641,176 1.9 268,576
UTILITIES76,153 EDISON INTERNATIONAL USD 61.92 61.72 4,699,849.19 4,715,393.76 2.9 15,545 4.0 186,575
Total Equities 157,893,727.49 161,695,610.65 98.1 3,801,883 2.6 4,220,762
TOTAL ASSETS 160,902,691.70 164,704,574.86 3,801,883 2.6 4,278,233
Accrued Income 224,563.94
TOTAL ASSETS + Accrued Income 164,929,138.80
PZENA INVESTMENT MANAGEMENT, LLC
Period December 31, 2018 - March 29, 2019
ALAMEDA COUNTY EMPLOYEES RETIREMENT ASSOCIATION (ACERA)
Portfolio Summary
Report Currency = US Dollar
Current Strategy:Large Cap Focused Value
Preliminary | 21
Appendix
| 22
PZENA Investment Management
-10%
-5%
0%
5%
10%
15%
North America Europe Asia/Pacific
2018 Management Target
0
10,000
20,000
30,000
40,000
50,000
60,000
70,000
1999 2001 2003 2005 2007 2009 2011 2013 2015 2017 2019
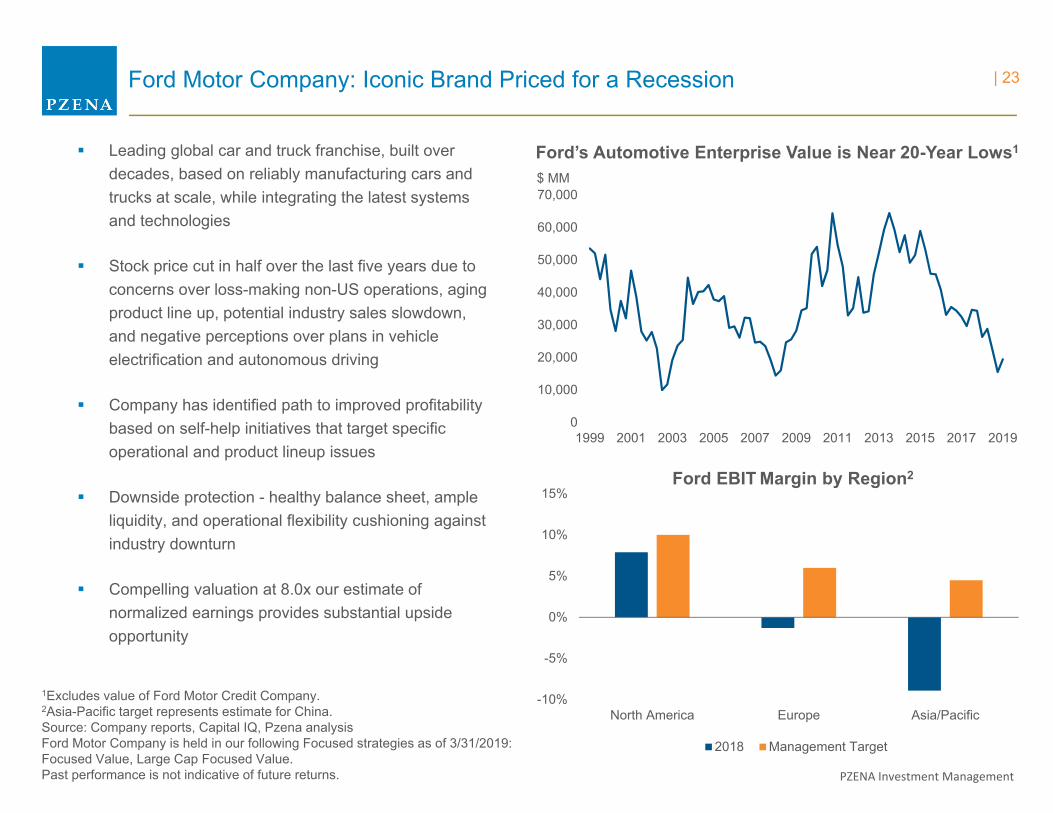
Ford Motor Company: Iconic Brand Priced for a Recession
Leading global car and truck franchise, built over decades, based on reliably manufacturing cars and trucks at scale, while integrating the latest systems and technologies
Stock price cut in half over the last five years due to concerns over loss-making non-US operations, aging product line up, potential industry sales slowdown, and negative perceptions over plans in vehicle electrification and autonomous driving
Company has identified path to improved profitability based on self-help initiatives that target specific operational and product lineup issues
Downside protection - healthy balance sheet, ample liquidity, and operational flexibility cushioning against industry downturn
Compelling valuation at 8.0x our estimate of normalized earnings provides substantial upside opportunity
Ford’s Automotive Enterprise Value is Near 20-Year Lows1
Ford EBIT Margin by Region2
1Excludes value of Ford Motor Credit Company.2Asia-Pacific target represents estimate for China.Source: Company reports, Capital IQ, Pzena analysisFord Motor Company is held in our following Focused strategies as of 3/31/2019:Focused Value, Large Cap Focused Value.Past performance is not indicative of future returns.
$ MM
| 23
PZENA Investment Management
80%
85%
90%
95%
100%
105%
110%
115%
120%
2006 2007 2008 2009 2010 2011 2012 2013 2014 2015 2016 2017
P&C
Insu
ranc
e C
ombi
ned
Rat
io(1
-Und
erw
ritin
g M
argi
n, L
ower
is b
ette
r)
AIG Global P&C Insurance P&C Peers
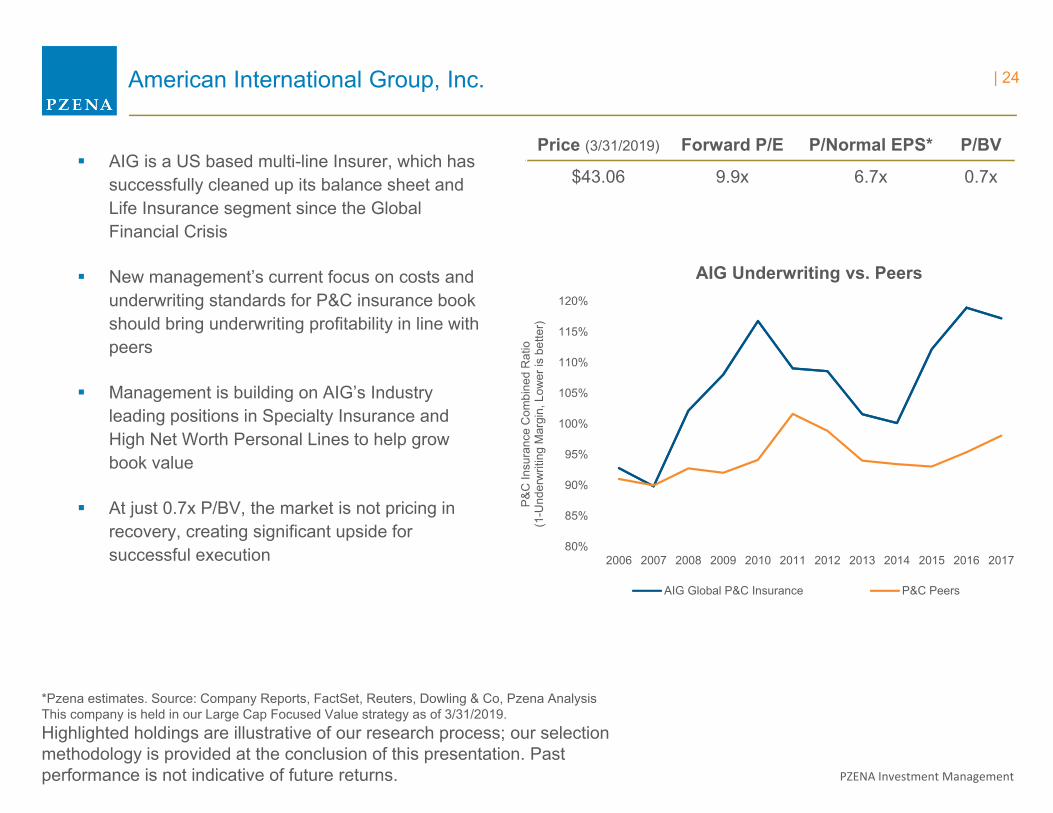
American International Group, Inc.
Price (3/31/2019) Forward P/E P/Normal EPS* P/BV
$43.06 9.9x 6.7x 0.7x AIG is a US based multi-line Insurer, which has
successfully cleaned up its balance sheet and Life Insurance segment since the Global Financial Crisis
New management’s current focus on costs and underwriting standards for P&C insurance book should bring underwriting profitability in line with peers
Management is building on AIG’s Industry leading positions in Specialty Insurance and High Net Worth Personal Lines to help grow book value
At just 0.7x P/BV, the market is not pricing in recovery, creating significant upside for successful execution
AIG Underwriting vs. Peers
*Pzena estimates. Source: Company Reports, FactSet, Reuters, Dowling & Co, Pzena AnalysisThis company is held in our Large Cap Focused Value strategy as of 3/31/2019.Highlighted holdings are illustrative of our research process; our selection methodology is provided at the conclusion of this presentation. Past performance is not indicative of future returns.
| 24
PZENA Investment Management
0
5
10
15
20
25
30
35
1969
1973
1977
1981
1985
1989
1993
1997
2001
2005
2009
2013
2017
Floater Deliveries Floater Retirements
National Oilwell Varco Inc.
Price (3/31/2019) Forward P/E P/Normal EPS* P/BV
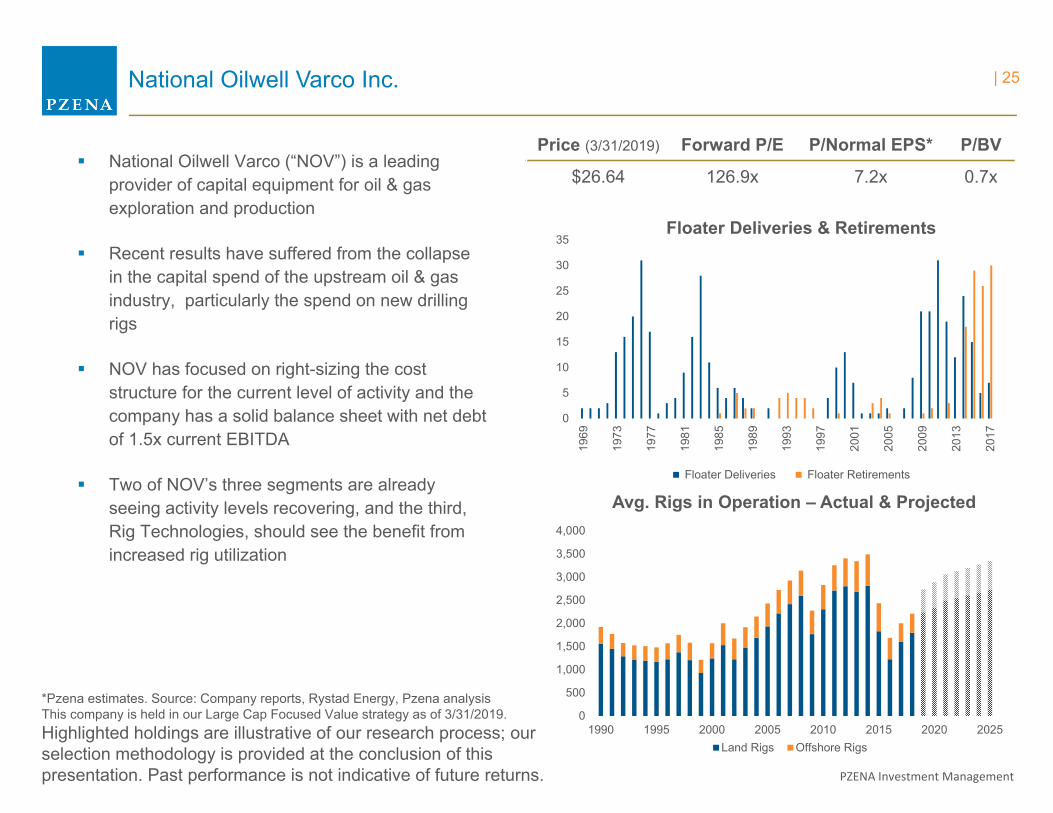
$26.64 126.9x 7.2x 0.7x National Oilwell Varco (“NOV”) is a leading
provider of capital equipment for oil & gas exploration and production
Recent results have suffered from the collapse in the capital spend of the upstream oil & gas industry, particularly the spend on new drilling rigs
NOV has focused on right-sizing the cost structure for the current level of activity and the company has a solid balance sheet with net debt of 1.5x current EBITDA
Two of NOV’s three segments are already seeing activity levels recovering, and the third, Rig Technologies, should see the benefit from increased rig utilization
Floater Deliveries & Retirements
Avg. Rigs in Operation – Actual & Projected
*Pzena estimates. Source: Company reports, Rystad Energy, Pzena analysisThis company is held in our Large Cap Focused Value strategy as of 3/31/2019.Highlighted holdings are illustrative of our research process; our selection methodology is provided at the conclusion of this presentation. Past performance is not indicative of future returns.
0
500
1,000
1,500
2,000
2,500
3,000
3,500
4,000
1990 1995 2000 2005 2010 2015 2020 2025Land Rigs Offshore Rigs
| 25
PZENA Investment Management
McKesson36%
AmerisourceBergen35%
Cardinal Health23%
Other6%
McKesson Corp.
Price (3/31/2019) Forward P/E P/Normal EPS* P/BV
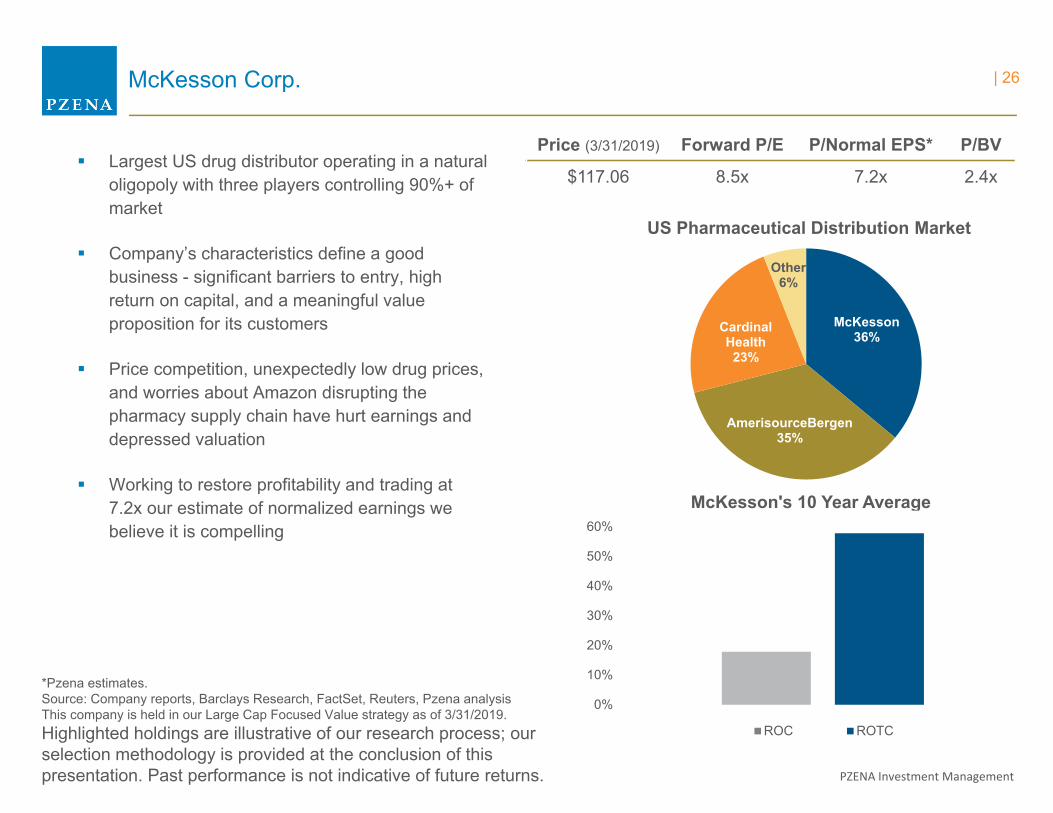
$117.06 8.5x 7.2x 2.4x Largest US drug distributor operating in a natural
oligopoly with three players controlling 90%+ of market
Company’s characteristics define a good business - significant barriers to entry, high return on capital, and a meaningful value proposition for its customers
Price competition, unexpectedly low drug prices, and worries about Amazon disrupting the pharmacy supply chain have hurt earnings and depressed valuation
Working to restore profitability and trading at 7.2x our estimate of normalized earnings we believe it is compelling
US Pharmaceutical Distribution Market
McKesson's 10 Year Average
*Pzena estimates.Source: Company reports, Barclays Research, FactSet, Reuters, Pzena analysisThis company is held in our Large Cap Focused Value strategy as of 3/31/2019.Highlighted holdings are illustrative of our research process; our selection methodology is provided at the conclusion of this presentation. Past performance is not indicative of future returns.
0%
10%
20%
30%
40%
50%
60%
ROC ROTC
| 26
PZENA Investment Management
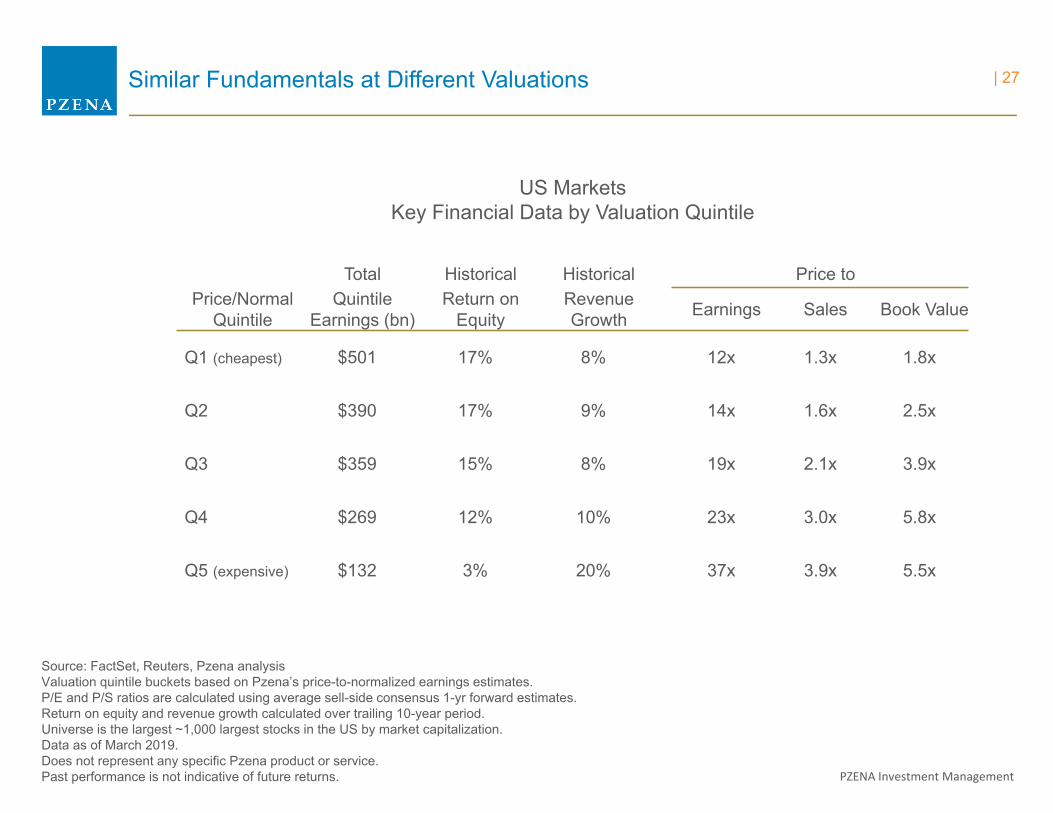
Similar Fundamentals at Different Valuations
Source: FactSet, Reuters, Pzena analysisValuation quintile buckets based on Pzena’s price-to-normalized earnings estimates.P/E and P/S ratios are calculated using average sell-side consensus 1-yr forward estimates.Return on equity and revenue growth calculated over trailing 10-year period.Universe is the largest ~1,000 largest stocks in the US by market capitalization.Data as of March 2019.Does not represent any specific Pzena product or service.Past performance is not indicative of future returns.
Total Historical Historical Price toPrice/Normal
QuintileQuintile
Earnings (bn)Return on
EquityRevenue Growth Earnings Sales Book Value
Q1 (cheapest) $501 17% 8% 12x 1.3x 1.8x
Q2 $390 17% 9% 14x 1.6x 2.5x
Q3 $359 15% 8% 19x 2.1x 3.9x
Q4 $269 12% 10% 23x 3.0x 5.8x
Q5 (expensive) $132 3% 20% 37x 3.9x 5.5x
US MarketsKey Financial Data by Valuation Quintile
| 27
PZENA Investment Management
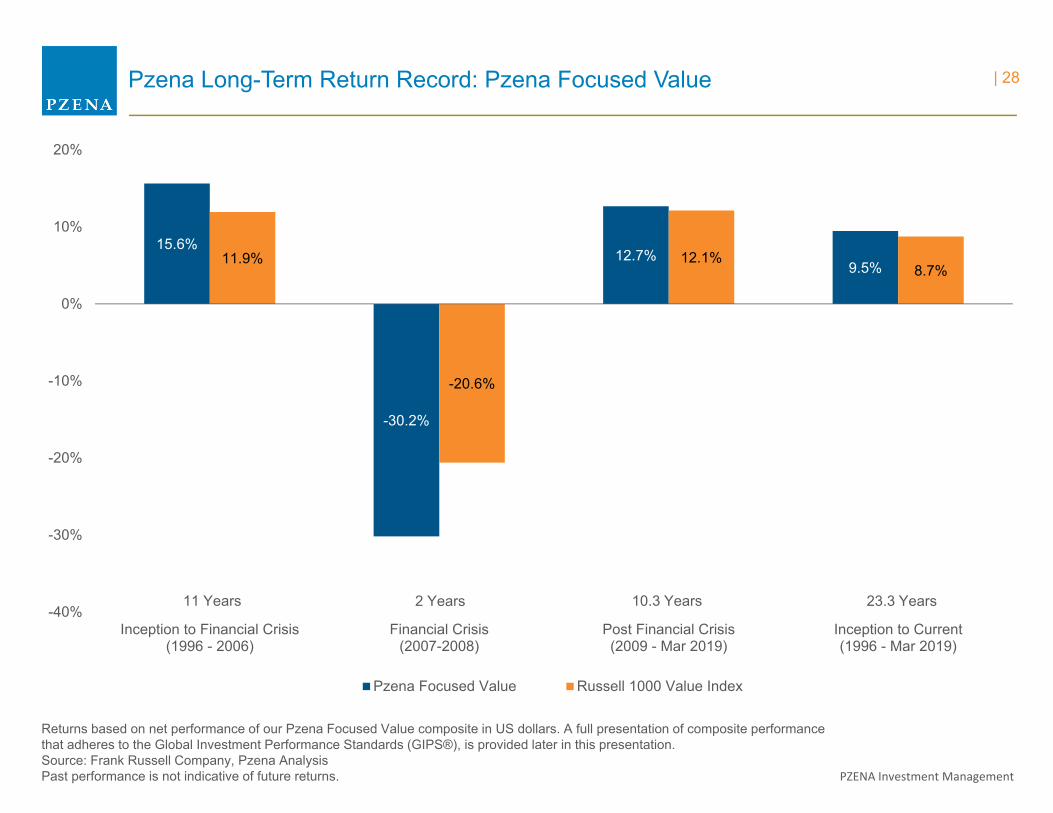
Pzena Long-Term Return Record: Pzena Focused Value
Returns based on net performance of our Pzena Focused Value composite in US dollars. A full presentation of composite performance that adheres to the Global Investment Performance Standards (GIPS®), is provided later in this presentation.Source: Frank Russell Company, Pzena AnalysisPast performance is not indicative of future returns.
15.6%
-30.2%
12.7%9.5%11.9%
-20.6%
12.1%8.7%
-40%
-30%
-20%
-10%
0%
10%
20%
Inception to Financial Crisis(1996 - 2006)
Financial Crisis(2007-2008)
Post Financial Crisis(2009 - Mar 2019)
Inception to Current(1996 - Mar 2019)
Pzena Focused Value Russell 1000 Value Index
11 Years 2 Years 10.3 Years 23.3 Years
| 28
PZENA Investment Management
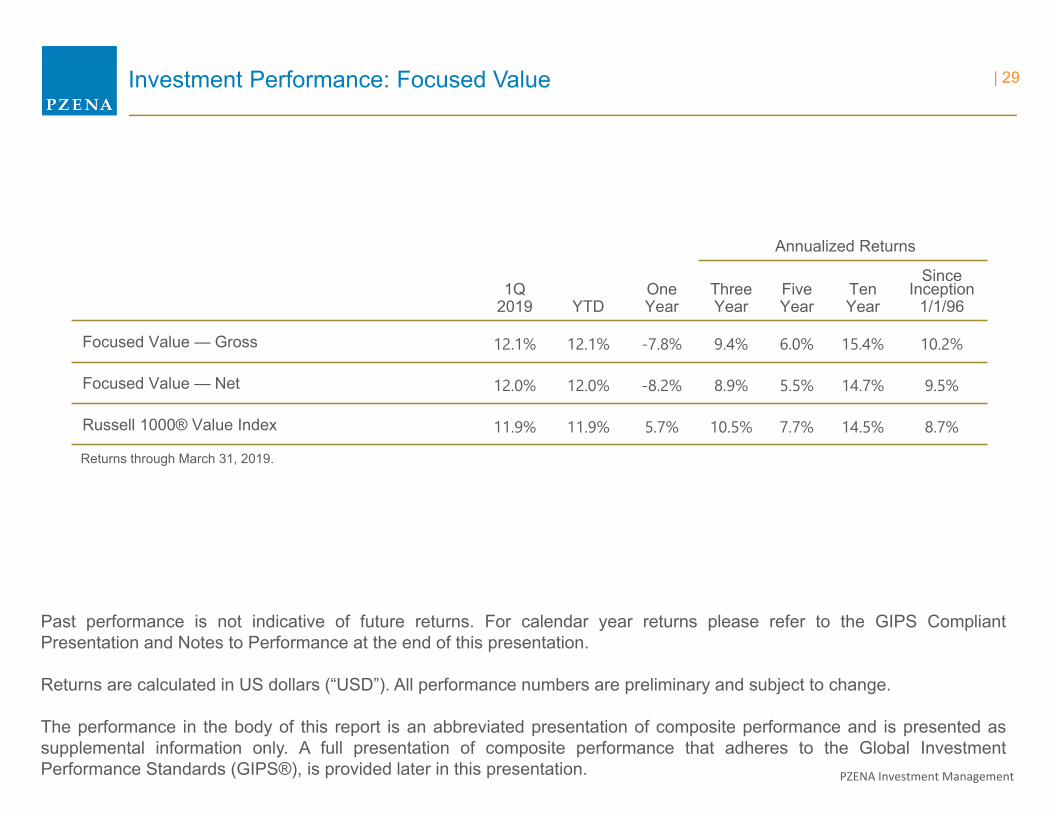
Annualized Returns
1Q2019 YTD
One Year
ThreeYear
FiveYear
TenYear
Since Inception
1/1/96
Focused Value — Gross 12.1% 12.1% -7.8% 9.4% 6.0% 15.4% 10.2%
Focused Value — Net 12.0% 12.0% -8.2% 8.9% 5.5% 14.7% 9.5%
Russell 1000® Value Index 11.9% 11.9% 5.7% 10.5% 7.7% 14.5% 8.7%
Past performance is not indicative of future returns. For calendar year returns please refer to the GIPS CompliantPresentation and Notes to Performance at the end of this presentation.
Returns are calculated in US dollars (“USD”). All performance numbers are preliminary and subject to change.
The performance in the body of this report is an abbreviated presentation of composite performance and is presented assupplemental information only. A full presentation of composite performance that adheres to the Global InvestmentPerformance Standards (GIPS®), is provided later in this presentation.
Investment Performance: Focused Value
Returns through March 31, 2019.
| 29

PZENA Investment Management
-15%
-10%
-5%
0%
5%
10%
15%
20%
25%
30%
-15% -10% -5% 0% 5% 10% 15% 20% 25% 30%
Pre-GFC Periods (Sep 05 - Oct 07) Periods coinciding with GFC (Nov 07 - Jan 14) Post-GFC Periods (Feb 14 - Mar 19)
Pzena Large Cap Focused Value History versus Low Price/Book Stocks
Y axis: Monthly Rolling 5-year USD annualized return of Pzena’s Large Cap Focused Value strategyX axis: Monthly Rolling 5-year USD annualized return of Low Price/Book
Source: Sanford C. Bernstein & Co., Pzena analysis1Returns based on net performance of our Pzena Large Cap Focused Value composite in US dollars.A full presentation of composite performance that adheres to the Global Investment Performance Standards (GIPS®), is provided later in this presentation.2Cheapest quintile price to book of largest ~500 US stocks ranked by market capitalization (equally-weighted data);does not represent any specific Pzena product or service. Past performance is not indicative of future returns.
Pzena LCFV Outperformed
Y axis
Pzena LCFV Underperformed X axis
5-Year Rolling Returns of Pzena Large Cap Focused Value1 vs. Low Price/Book2
October 2000 – March 2019
| 30
PZENA Investment Management
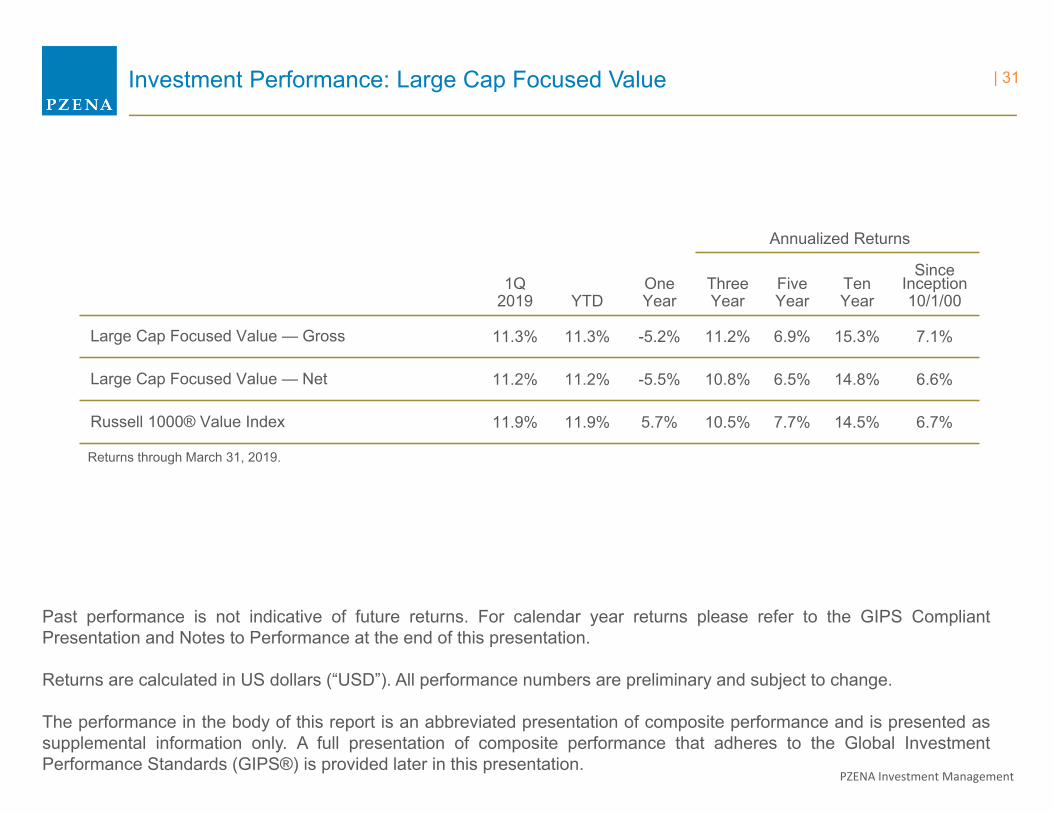
Annualized Returns
1Q2019 YTD
One Year
ThreeYear
FiveYear
TenYear
Since Inception10/1/00
Large Cap Focused Value — Gross 11.3% 11.3% -5.2% 11.2% 6.9% 15.3% 7.1%
Large Cap Focused Value — Net 11.2% 11.2% -5.5% 10.8% 6.5% 14.8% 6.6%
Russell 1000® Value Index 11.9% 11.9% 5.7% 10.5% 7.7% 14.5% 6.7%
Past performance is not indicative of future returns. For calendar year returns please refer to the GIPS CompliantPresentation and Notes to Performance at the end of this presentation.
Returns are calculated in US dollars (“USD”). All performance numbers are preliminary and subject to change.
The performance in the body of this report is an abbreviated presentation of composite performance and is presented assupplemental information only. A full presentation of composite performance that adheres to the Global InvestmentPerformance Standards (GIPS®) is provided later in this presentation.
Investment Performance: Large Cap Focused Value
Returns through March 31, 2019.
| 31
PZENA Investment Management
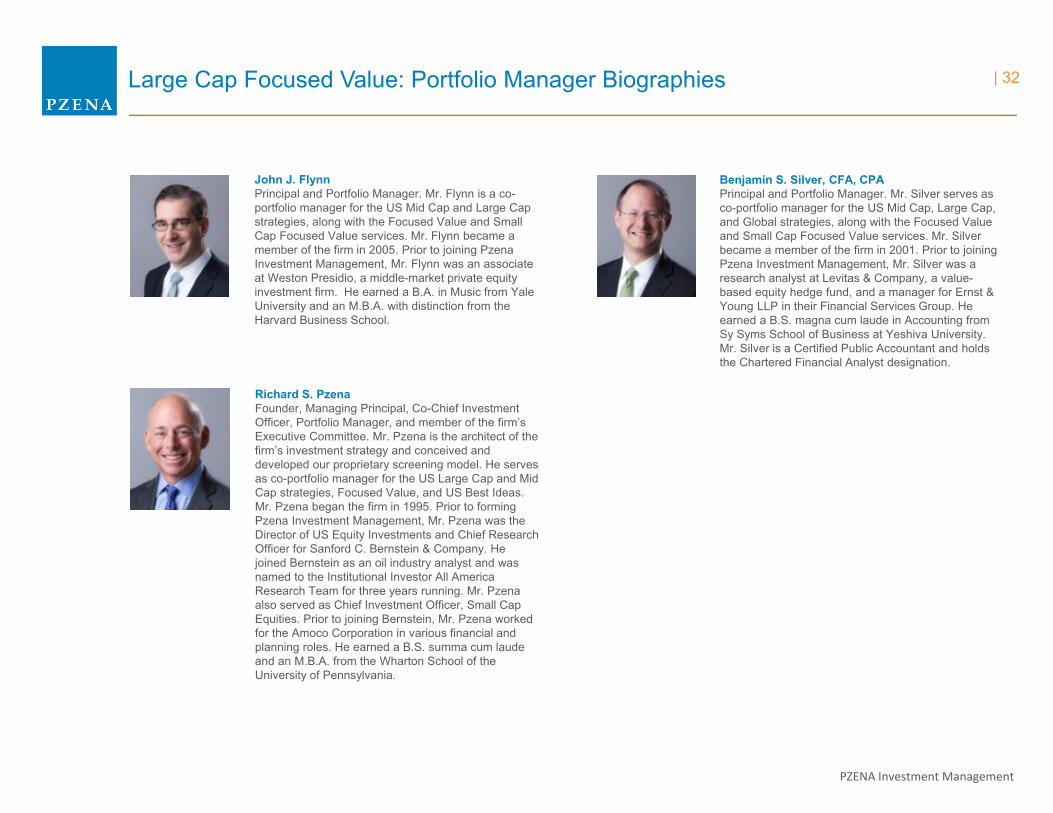
Large Cap Focused Value: Portfolio Manager Biographies
Benjamin S. Silver, CFA, CPAPrincipal and Portfolio Manager. Mr. Silver serves as co-portfolio manager for the US Mid Cap, Large Cap, and Global strategies, along with the Focused Value and Small Cap Focused Value services. Mr. Silver became a member of the firm in 2001. Prior to joining Pzena Investment Management, Mr. Silver was a research analyst at Levitas & Company, a value-based equity hedge fund, and a manager for Ernst & Young LLP in their Financial Services Group. He earned a B.S. magna cum laude in Accounting from Sy Syms School of Business at Yeshiva University. Mr. Silver is a Certified Public Accountant and holds the Chartered Financial Analyst designation.
John J. FlynnPrincipal and Portfolio Manager. Mr. Flynn is a co-portfolio manager for the US Mid Cap and Large Cap strategies, along with the Focused Value and Small Cap Focused Value services. Mr. Flynn became a member of the firm in 2005. Prior to joining Pzena Investment Management, Mr. Flynn was an associate at Weston Presidio, a middle-market private equity investment firm. He earned a B.A. in Music from Yale University and an M.B.A. with distinction from the Harvard Business School.
Richard S. PzenaFounder, Managing Principal, Co-Chief Investment Officer, Portfolio Manager, and member of the firm’s Executive Committee. Mr. Pzena is the architect of the firm’s investment strategy and conceived and developed our proprietary screening model. He serves as co-portfolio manager for the US Large Cap and Mid Cap strategies, Focused Value, and US Best Ideas. Mr. Pzena began the firm in 1995. Prior to forming Pzena Investment Management, Mr. Pzena was the Director of US Equity Investments and Chief Research Officer for Sanford C. Bernstein & Company. He joined Bernstein as an oil industry analyst and was named to the Institutional Investor All America Research Team for three years running. Mr. Pzena also served as Chief Investment Officer, Small Cap Equities. Prior to joining Bernstein, Mr. Pzena worked for the Amoco Corporation in various financial and planning roles. He earned a B.S. summa cum laude and an M.B.A. from the Wharton School of the University of Pennsylvania.
| 32
PZENA Investment Management
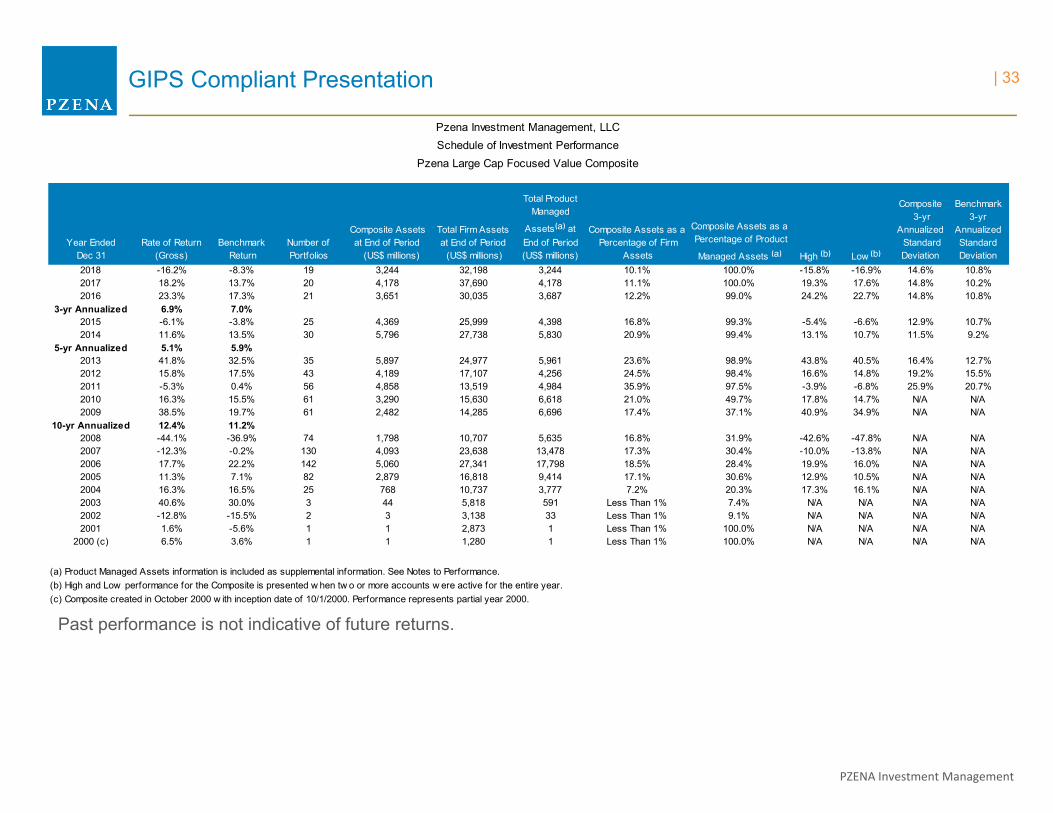
GIPS Compliant Presentation
Past performance is not indicative of future returns.
Year Ended Dec 31
Rate of Return (Gross)
Benchmark Return
Number of Portfolios
Composite Assets at End of Period (US$ millions)
Total Firm Assets at End of Period
(US$ millions)
Total Product Managed
Assets⁽ᵃ⁾ at End of Period (US$ millions)
Composite Assets as a Percentage of Firm
Assets
Composite Assets as a Percentage of Product
Managed Assets ⁽ᵃ⁾ High ⁽ᵇ⁾ Low ⁽ᵇ⁾
Composite 3-yr
Annualized Standard Deviation
Benchmark 3-yr
Annualized Standard Deviation
2018 -16.2% -8.3% 19 3,244 32,198 3,244 10.1% 100.0% -15.8% -16.9% 14.6% 10.8%2017 18.2% 13.7% 20 4,178 37,690 4,178 11.1% 100.0% 19.3% 17.6% 14.8% 10.2%2016 23.3% 17.3% 21 3,651 30,035 3,687 12.2% 99.0% 24.2% 22.7% 14.8% 10.8%
3-yr Annualized 6.9% 7.0%2015 -6.1% -3.8% 25 4,369 25,999 4,398 16.8% 99.3% -5.4% -6.6% 12.9% 10.7%2014 11.6% 13.5% 30 5,796 27,738 5,830 20.9% 99.4% 13.1% 10.7% 11.5% 9.2%
5-yr Annualized 5.1% 5.9%2013 41.8% 32.5% 35 5,897 24,977 5,961 23.6% 98.9% 43.8% 40.5% 16.4% 12.7%2012 15.8% 17.5% 43 4,189 17,107 4,256 24.5% 98.4% 16.6% 14.8% 19.2% 15.5%2011 -5.3% 0.4% 56 4,858 13,519 4,984 35.9% 97.5% -3.9% -6.8% 25.9% 20.7%2010 16.3% 15.5% 61 3,290 15,630 6,618 21.0% 49.7% 17.8% 14.7% N/A N/A2009 38.5% 19.7% 61 2,482 14,285 6,696 17.4% 37.1% 40.9% 34.9% N/A N/A
10-yr Annualized 12.4% 11.2%2008 -44.1% -36.9% 74 1,798 10,707 5,635 16.8% 31.9% -42.6% -47.8% N/A N/A2007 -12.3% -0.2% 130 4,093 23,638 13,478 17.3% 30.4% -10.0% -13.8% N/A N/A2006 17.7% 22.2% 142 5,060 27,341 17,798 18.5% 28.4% 19.9% 16.0% N/A N/A2005 11.3% 7.1% 82 2,879 16,818 9,414 17.1% 30.6% 12.9% 10.5% N/A N/A2004 16.3% 16.5% 25 768 10,737 3,777 7.2% 20.3% 17.3% 16.1% N/A N/A2003 40.6% 30.0% 3 44 5,818 591 Less Than 1% 7.4% N/A N/A N/A N/A2002 -12.8% -15.5% 2 3 3,138 33 Less Than 1% 9.1% N/A N/A N/A N/A2001 1.6% -5.6% 1 1 2,873 1 Less Than 1% 100.0% N/A N/A N/A N/A
2000 (c) 6.5% 3.6% 1 1 1,280 1 Less Than 1% 100.0% N/A N/A N/A N/A
2000
(c) Composite created in October 2000 w ith inception date of 10/1/2000. Performance represents partial year 2000.
Pzena Investment Management, LLCSchedule of Investment Performance
Pzena Large Cap Focused Value Composite
(a) Product Managed Assets information is included as supplemental information. See Notes to Performance.(b) High and Low performance for the Composite is presented w hen tw o or more accounts w ere active for the entire year.
| 33
PZENA Investment Management
Notes to Performance
Pzena Investment Management, LLC (the “Firm”) claims compliance with the Global Investment Performance Standards (“GIPS®”) and has prepared and presented thisreport in compliance with the GIPS standards. Pzena Investment Management, LLC has been independently verified for the periods January 1, 1996 to December 31,2018. Verification assesses whether (1) the firm has complied with all the composite construction requirements of the GIPS standards on a firm-wide basis and (2) thefirm’s policies and procedures are designed to calculate and present performance in compliance with the GIPS standards. The Pzena Large Cap Focused ValueComposite has been examined for the periods October 1, 2000 to December 31, 2018. The verification and performance examination reports are available uponrequest. The Firm commenced operations on January 1, 1996. The Firm is a registered investment adviser that follows a classic value investment approach and is theoperating company of Pzena Investment Management, Inc. Pzena Investment Management, Inc. is a publicly traded company whose shares are listed on the New YorkStock Exchange under the ticker symbol “PZN.”
The Pzena Large Cap Focused Value Composite (the “Composite”) was created in October 2000. The Composite represents returns for clients invested in Pzena LargeCap Focused Value strategy. The verification and performance examination reports are available upon request. Pzena Large Cap Focused Value is a portfoliogenerally consisting of 30-40 stocks generally taken from a universe of the largest 500 U.S.-traded companies at the time of initial purchase. The presentation ofinvestment performance sets forth the time-weighted rates of return (the “Return”) for the Composite. Past performance is not an indication of future results and maydiffer for future time periods.
The Composite includes all fee-paying, non-fee-paying and non wrap fee portfolios since inception date, and mutual fund portfolios since April 2011, that are managedon a fully discretionary basis by the Firm, according to the Pzena Large Cap Focused Value strategy. For the periods ending December 31, 2018, December 31, 2017,December 31. 2016, December 31, 2015, December 31, 2014, December 31, 2013, December 31, 2012, December 31, 2011 and December 31, 2010, 0.04%, 0.04%,0.04%, 0.03%, 0.02%, 0.02%, 0.01%, 0.00%, and 0.00%, respectively, of the Composite assets were represented by non fee-paying accounts. Eligible new portfoliosare added to the Composite at the beginning of the first full month under management. Terminated portfolios are removed from the Composite after the last full monththat the portfolio is under firm management.
The Total Product Managed Assets represents the total value of all accounts invested in the Pzena Large Cap Focused Value strategy managed and traded by the Firm,including accounts with client-imposed restrictions or accounts not fully invested at year-end.
Generally, securities listed on any national securities exchange are valued at the last quoted sale price on the exchange. For securities that have not recently traded, anestimate of current price is used to value the security. Securities which are not listed are valued at the most recent publicly quoted bid price. Securities transactions arerecorded on a trade date basis. Dividend income is recorded as of the ex-dividend date.
The rate of return is calculated on a time-weighted, total return basis and includes all dividends, interest, accrued income and realized and unrealized gains or losses.Returns are calculated in U.S. dollars (“USD”).
Gross rates of return are presented gross of investment management fees and net of the deduction of brokerage commissions and transaction costs. Net rates of returnare presented net of investment management fees and net of the deduction of brokerage commissions and transaction costs. An investor’s actual return will be reducedby investment management fees.
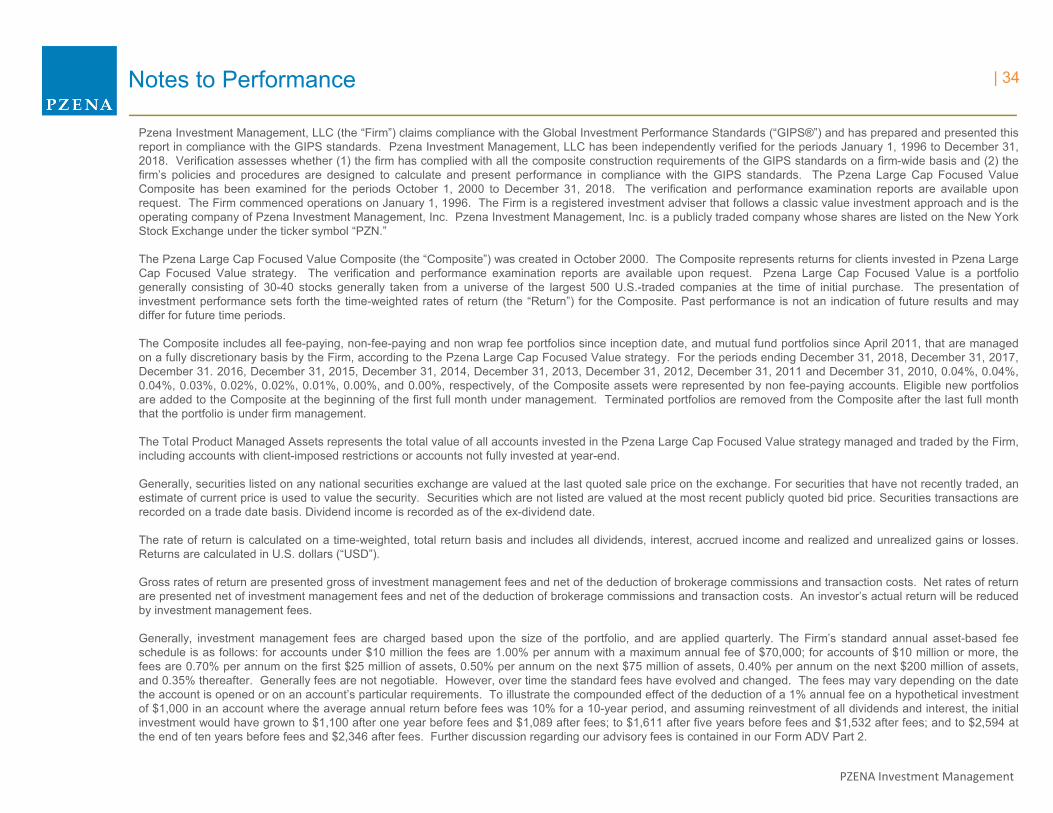
Generally, investment management fees are charged based upon the size of the portfolio, and are applied quarterly. The Firm’s standard annual asset-based feeschedule is as follows: for accounts under $10 million the fees are 1.00% per annum with a maximum annual fee of $70,000; for accounts of $10 million or more, thefees are 0.70% per annum on the first $25 million of assets, 0.50% per annum on the next $75 million of assets, 0.40% per annum on the next $200 million of assets,and 0.35% thereafter. Generally fees are not negotiable. However, over time the standard fees have evolved and changed. The fees may vary depending on the datethe account is opened or on an account’s particular requirements. To illustrate the compounded effect of the deduction of a 1% annual fee on a hypothetical investmentof $1,000 in an account where the average annual return before fees was 10% for a 10-year period, and assuming reinvestment of all dividends and interest, the initialinvestment would have grown to $1,100 after one year before fees and $1,089 after fees; to $1,611 after five years before fees and $1,532 after fees; and to $2,594 atthe end of ten years before fees and $2,346 after fees. Further discussion regarding our advisory fees is contained in our Form ADV Part 2.
| 34
PZENA Investment Management
Notes to Performance
Composite returns are benchmarked to the Russell 1000® Value Index (the “Index”). The benchmark is used for comparative purposes only and generally reflects therisk or investment style of the investments reported on the schedule of investment performance. The Russell 1000® Value Index is an unmanaged index that measuresthe performance of those Russell 1000® companies with lower price-to-book ratios and lower forecasted growth rates. The Index cannot be invested in directly.Investments made by the Firm for the portfolios it manages in the Pzena Large Cap Focused Value Composite may differ from those of the Russell 1000® Value Index.Accordingly, investment results will differ from those of the benchmark.
The standard deviation of comparable performance over time is a measure of volatility. The three-year annualized standard deviation measures the variability of thecomposite and the benchmark returns over the preceding 36-month period. The three-year annualized standard deviation was not required to be reported prior to 2011.The Firm also presents the returns for the highest and lowest yielding portfolios in the Composite. High and Low performance for the Composite is only presented whentwo or more accounts were active for the entire year. Additional information is available upon request regarding policies for valuing portfolios, calculating performance,and preparing compliant presentations, as well as a list of composite descriptions.
Past performance is no guarantee of future results, and the past performance of Pzena Large Cap Focused Value composite should not be considered indicative of thefuture performance of any accounts or commingled funds managed by the Firm. Investment return and principal value of an investment will fluctuate over time.
The Firm is the owner of all other copyrights relating to the material in this report, except as otherwise noted. This report contains proprietary and confidential material ofthe Firm and others. Any unauthorized use, misuse, disclosure, duplication or redistribution of such items or information is strictly prohibited.
| 35
PZENA Investment Management
GIPS Compliant Presentation
Past performance is not indicative of future returns.
Year Ended Dec 31
Rate of Return (Gross)
Benchmark Return
Number of Portfolios
Composite Assets at End of Period (US$ millions)
Total Firm Assets at End of Period
(US$ millions)
Total Product Managed
Assets⁽ᵃ⁾ at End of Period (US$ millions)
Composite Assets as a Percentage of Firm
Assets
Composite Assets as a Percentage of Product
Managed Assets ⁽ᵃ⁾ High ⁽ᵇ⁾ Low ⁽ᵇ⁾
Composite 3-yr
Annualized Standard Deviation
Benchmark 3-yr
Annualized Standard Deviation
2018 -20.1% -8.3% 52 1,768 32,198 1,768 5.5% 100.0% -19.5% -21.5% 15.5% 10.8%2017 17.0% 13.7% 56 2,195 37,690 2,195 5.8% 100.0% 18.8% 15.3% 15.3% 10.2%2016 24.7% 17.3% 58 2,007 30,035 2,009 6.7% 99.9% 26.2% 21.7% 15.5% 10.8%
3-yr Annualized 5.2% 7.0%2015 -5.6% -3.8% 61 1,580 25,999 1,580 6.1% 100.0% -4.4% -6.8% 13.5% 10.7%2014 11.4% 13.5% 61 1,804 27,738 1,804 6.5% 100.0% 12.1% 9.4% 11.9% 9.2%
5-yr Annualized 4.2% 5.9%2013 43.8% 32.5% 62 1,875 24,977 1,918 7.5% 97.8% 45.9% 41.7% 16.4% 12.7%2012 16.9% 17.5% 69 1,468 17,107 1,468 8.6% 100.0% 18.2% 15.5% 19.1% 15.5%2011 -3.7% 0.4% 83 1,571 13,519 1,571 11.6% 100.0% -1.9% -4.9% 25.8% 20.7%2010 16.5% 15.5% 89 1,768 15,630 1,774 11.3% 99.7% 17.9% 14.8% N/A N/A2009 39.1% 19.7% 95 1,331 14,285 1,737 9.3% 76.8% 41.8% 32.9% N/A N/A
10-yr Annualized 12.4% 11.2%2008 -43.7% -36.9% 127 1,297 10,707 1,831 12.1% 70.8% -41.1% -47.8% N/A N/A2007 -12.1% -0.2% 212 4,240 23,638 5,038 17.9% 84.1% -10.0% -17.1% N/A N/A2006 18.2% 22.2% 227 5,090 27,341 5,921 18.6% 86.0% 20.7% 16.2% N/A N/A2005 8.8% 7.1% 235 4,840 16,818 5,314 28.8% 91.1% 12.1% 6.9% N/A N/A2004 19.6% 16.5% 212 4,543 10,737 4,922 42.3% 92.3% 21.8% 17.5% N/A N/A2003 42.9% 30.0% 154 3,440 5,818 3,630 59.1% 94.8% 45.9% 39.2% N/A N/A2002 -6.4% -15.5% 110 2,003 3,138 2,109 63.8% 95.0% -0.9% -12.1% N/A N/A2001 16.3% -5.6% 105 1,965 2,873 2,042 68.4% 96.2% 20.9% 8.9% N/A N/A2000 40.2% 7.0% 74 1,177 1,280 1,202 91.9% 97.9% 51.4% 31.3% N/A N/A1999 -2.1% 7.3% 77 560 653 584 85.7% 95.9% 6.4% -8.3% N/A N/A1998 -0.7% 15.6% 105 542 773 595 70.1% 91.1% 2.7% -7.5% N/A N/A1997 27.0% 35.2% 85 171 471 252 36.2% 67.7% 30.2% 24.8% N/A N/A
1996 (c) 30.1% 21.7% 16 42 154 53 27.5% 80.0% N/A N/A N/A N/A
1996
(c) Composite created in January 1996 w ith inception date of 1/1/1996.
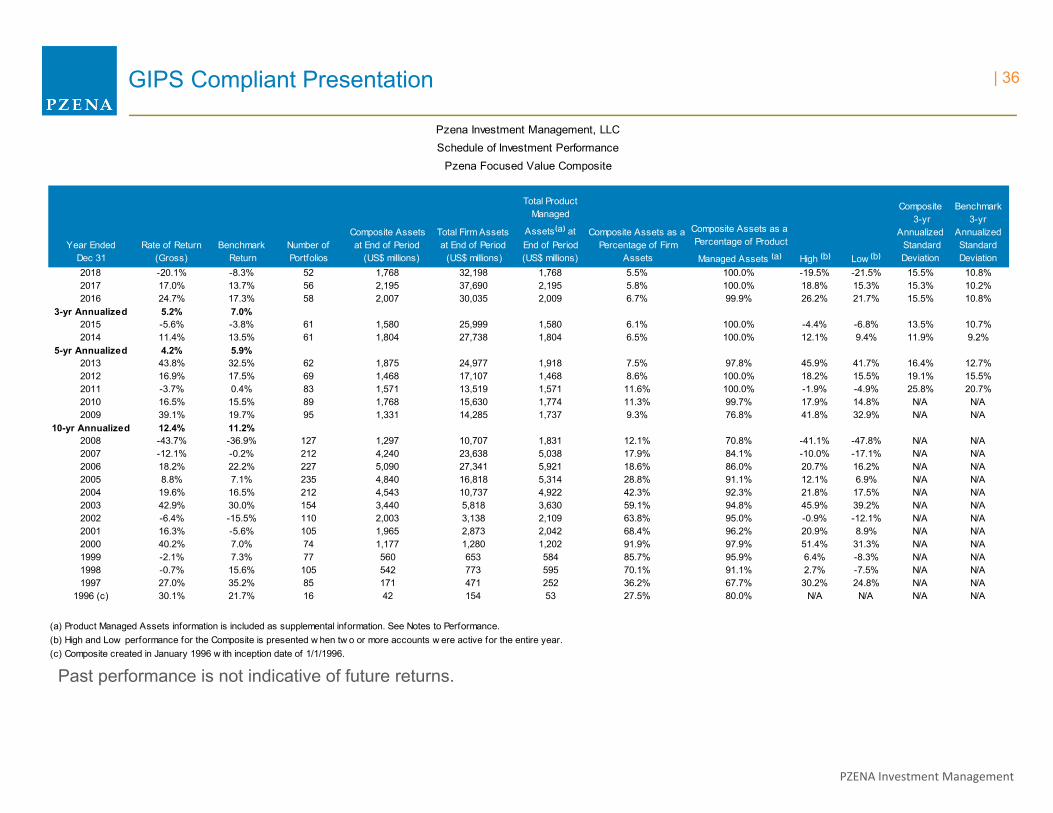
Pzena Investment Management, LLCSchedule of Investment Performance
Pzena Focused Value Composite
(a) Product Managed Assets information is included as supplemental information. See Notes to Performance.(b) High and Low performance for the Composite is presented w hen tw o or more accounts w ere active for the entire year.
| 36
PZENA Investment Management
Notes to Performance
Pzena Investment Management, LLC (the “Firm”) claims compliance with the Global Investment Performance Standards (“GIPS®”) and has prepared and presentedthis report in compliance with the GIPS standards. Pzena Investment Management, LLC has been independently verified for the periods January 1, 1996 to December31, 2018. Verification assesses whether (1) the firm has complied with all the composite construction requirements of the GIPS standards on a firm-wide basis and (2)the firm’s policies and procedures are designed to calculate and present performance in compliance with the GIPS standards. The Pzena Focused Value Compositehas been examined for the periods January 1, 1996 to December 31, 2018. The verification and performance examination reports are available upon request. TheFirm commenced operations on January 1, 1996. The Firm is a registered investment adviser that follows a classic value investment approach and is the operatingcompany of Pzena Investment Management, Inc. Pzena Investment Management, Inc. is a publicly traded company whose shares are listed on the New York StockExchange under the ticker symbol “PZN.”
The Pzena Focused Value Composite (the “Composite”) was created in January 1996. The Composite represents returns for clients invested in Pzena Focused Valuestrategy. Pzena Focused Value is a portfolio generally consisting of 30-40 stocks generally taken from a universe of the largest 1,000 U.S.-traded companies at thetime of initial purchase. The presentation of investment performance sets forth the time-weighted rates of return (the “Return”) for the Composite. Past performance isnot an indication of future results and may differ for future time periods.
The Composite includes all fee-paying, non fee-paying, and non wrap fee portfolios since inception date, and mutual fund portfolios since April 2011, that are managedon a fully discretionary basis by the Firm, according to the Pzena Focused Value strategy. For the periods ending December 31, 2018, December 31, 2017, December31, 2016, December 31, 2015, December 31, 2014, December 31, 2013, December 31, 2012, December 31, 2011 and December 31, 2010, 0.4%, 0.5%, 0.6%, 0.6%,0.7%, 0.6%, 0.4%, 0.3% and 0.0%, respectively, of the Composite assets were represented by non fee-paying accounts. Eligible new portfolios are added to theComposite at the beginning of the first full month under management. Terminated portfolios are removed from the Composite after the last full month that the portfoliois under firm management.
The Total Product Managed Assets represents the total value of all accounts invested in the Pzena Focused Value strategy managed and traded by the Firm, includingaccounts with client-imposed restrictions or accounts not fully invested at year-end.
Generally, securities listed on any national securities exchange are valued at the last quoted sale price on the exchange. For securities that have not recently traded, anestimate of current price is used to value the security. Securities which are not listed are valued at the most recent publicly quoted bid price. Securities transactions arerecorded on a trade date basis. Dividend income is recorded as of the ex-dividend date.
The rate of return is calculated on a time-weighted, total return basis and includes all dividends, interest, accrued income and realized and unrealized gains or losses.Returns are calculated in U.S. dollars (“USD”).
Gross rates of return are presented gross of investment management fees and net of the deduction of brokerage commissions and transaction costs. Net rates ofreturn are presented net of investment management fees and net of the deduction of brokerage commissions and transaction costs. An investor’s actual return will bereduced by investment management fees.
Generally, investment management fees are charged based upon the size of the portfolio, and are applied quarterly. The Firm’s standard annual asset-based feeschedule is as follows: for accounts under $10 million, the fees are 1.5% per annum with a maximum annual fee of $100,000; for accounts of $10 million or more, thefees are 1.0% per annum on the first $10 million, 0.75% per annum on the next $40 million, 0.60% per annum on the next $50 million and 0.50% per annum thereafter.Generally fees are not negotiable. However, over time the standard fees have evolved and changed. The fees may vary depending on the date the account is openedor on an account’s particular requirements. To illustrate the compounded effect of the deduction of a 1% annual fee on a hypothetical investment of $1,000 in anaccount where the average annual return before fees was 10% for a 10-year period, and assuming reinvestment of all dividends and interest, the initial investmentwould have grown to $1,100 after one year before fees and $1,089 after fees; to $1,611 after five years before fees and $1,532 after fees; and to $2,594 at the end often years before fees and $2,346 after fees. Further discussion regarding our advisory fees is contained in our Form ADV Part 2.
| 37
PZENA Investment Management
Notes to Performance
Composite returns are benchmarked to the Russell 1000® Value Index (the “Index”). The benchmark is used for comparative purposes only and generally reflects therisk or investment style of the investments reported on the schedule of investment performance. The Russell 1000® Value Index is an unmanaged index that measuresthe performance of those Russell 1000® companies with lower price-to-book ratios and lower forecasted growth rates. The Index cannot be invested in directly.Investments made by the Firm for the portfolios it manages in the Pzena Focused Value Composite may differ from those of the Russell 1000® Value Index.Accordingly, investment results will differ from those of the benchmark.
The standard deviation of comparable performance over time is a measure of volatility. The three-year annualized standard deviation measures the variability of thecomposite and the benchmark returns over the preceding 36-month period. The three-year annualized standard deviation was not required to be reported prior to 2011.The Firm also presents the returns for the highest and lowest yielding portfolios in the Composite. High and Low performance for the Composite is only presented whentwo or more accounts were active for the entire year. Additional information is available upon request regarding policies for valuing portfolios, calculating performance,and preparing compliant presentations, as well as a list of composite descriptions.
Past performance is no guarantee of future results, and the past performance of Pzena Focused Value composite should not be considered indicative of the futureperformance of any accounts or commingled funds managed by the Firm. Investment return and principal value of an investment will fluctuate over time.
The Firm is the owner of all other copyrights relating to the material in this report, except as otherwise noted. This report contains proprietary and confidential material ofthe Firm and others. Any unauthorized use, misuse, disclosure, duplication or redistribution of such items or information is strictly prohibited.
| 38
PZENA Investment Management
Further Information
These presentation materials are intended for the exclusive purpose of evaluating the investment advisory services of Pzena Investment Management, LLC. Any other use is strictly prohibited.
These presentation materials and any attachments delivered separately herewith may contain non-public or confidential information of Pzena Investment Management, LLC. Accordingly, neither this booklet nor any portion hereof may be reproduced or redistributed without the prior written consent of Pzena Investment Management, LLC. Disclosure of the information presented in this booklet to anyone other than the recipient’s employees, officers, directors, or financial or legal representatives is also prohibited without the prior written consent of Pzena Investment Management, LLC.
This document does not constitute an offer to sell, or a solicitation of an offer to buy, securities or investment advisory services in any jurisdiction where such an offer or solicitation is against the law, or to anyone to whom it is unlawful to make such an offer or solicitation, or if the person making the offer or solicitation is not qualified to do so. The information contained herein is general in nature and does not constitute legal, tax, or investment advice. Prospective investors are encouraged to consult their own professional advisers as to the implications of making an investment in any securities or investment advisory services.
Notable portfolio holdings are discussed for illustrative purposes only. The specific portfolio securities discussed in this presentation were selected for inclusion based on their ability tohelp you better understand our investment process and, where applicable, the investment model for our particular product strategy in which you are invested. They were selected fromsecurities in one or more of our Focused Value strategy composites, as of February 28, 2019, and were not selected based on performance. They do not represent all of the securitiespurchased or sold for our client accounts during any particular period, and it should not be assumed that investments in such securities were or will be profitable.
Holdings vary among client accounts as a result of different product strategies having been selected thereby. Holdings also may vary among client accounts as a result of openingdates, cash flows, tax strategies, etc. There is no assurance that any securities discussed herein remain in client portfolios at the time you receive this presentation booklet or thatsecurities sold have not been repurchased. The S&P 500® is a registered trademark of Standard & Poor’s, a division of S&P Global Inc., which is the owner of all copyrights relating tothis index and the source of the performance statistics of this index that are referred to herein.
Russell® is a trademark of the Frank Russell Company. FTSE Russell is the source and owner of the Russell Index data contained or reflected in this material and all trademarks and copyrights related thereto. The presentation may contain confidential information and unauthorized use, disclosure, copying, dissemination or redistribution is strictly prohibited. This is a presentation of Pzena Investment Management, LLC. FTSE Russell is not responsible for the formatting or configuration of this material or for any inaccuracy in Pzena Investment Management’s presentation thereof.
The Global Industry Classification Standard (“GICS”) was developed by and is the exclusive property and a service mark of MSCI Inc. (“MSCI”) and Standard & Poor’s, a division of S&P Global Inc. (“S&P”) and is licensed for use by Pzena Investment Management, LLC (“PIM”). Neither MSCI, S&P nor any third party involved in making or compiling the GICS or any GICS classifications makes any express or implied warranties or representations with respect to such standard or classification (or the results to be obtained by the use thereof), and all such parties hereby expressly disclaim all warranties of originality, accuracy, completeness, merchantability and fitness for a particular purpose with respect to any of such standard or classification. Without limiting any of the foregoing, in no event shall MSCI, S&P, and of their affiliates or any third party involved in making or compiling the GICS or any GICS classifications have any liability for any direct, indirect, special, punitive, consequential or any other damages (including lost profits) even if notified of the possibility of such damages.
The MSCI information may only be used for internal use, may not be reproduced or redisseminated in any form and may not be used as a basis for or a component of any financial instruments or products or indices. None of the MSCI information is intended to constitute investment advice or a recommendation to make (or refrain from making) any kind of investment decision and may not be relied on as such. Historical data and analysis should not be taken as an indication or guarantee of any future performance analysis, forecast or prediction. The MSCI information is provided on an “as is” basis and the user of this information assumes the entire risk of any use made of this information. MSCI, each of its affiliates and each other person involved in or related to compiling, computing or creating any MSCI information (collectively, the MSCI Parties) expressly disclaims all warranties (including, without limitation, any warranties of originality, accuracy, completeness, timeliness, non-infringement, merchantability and fitness for a particular purpose) with respect to this information. Without limiting any of the foregoing, in no event shall any MSCI party have any liability for any direct, indirect, special, incidental, punitive, consequential (including, without limitation, lost profits) or any other damages.
© Pzena Investment Management, LLC, 2019. All rights reserved.
| 39

PERIOD ENDING: MARCH 31 , 2019Investment Performance Review for
Alameda County Employees’ Retirement Association
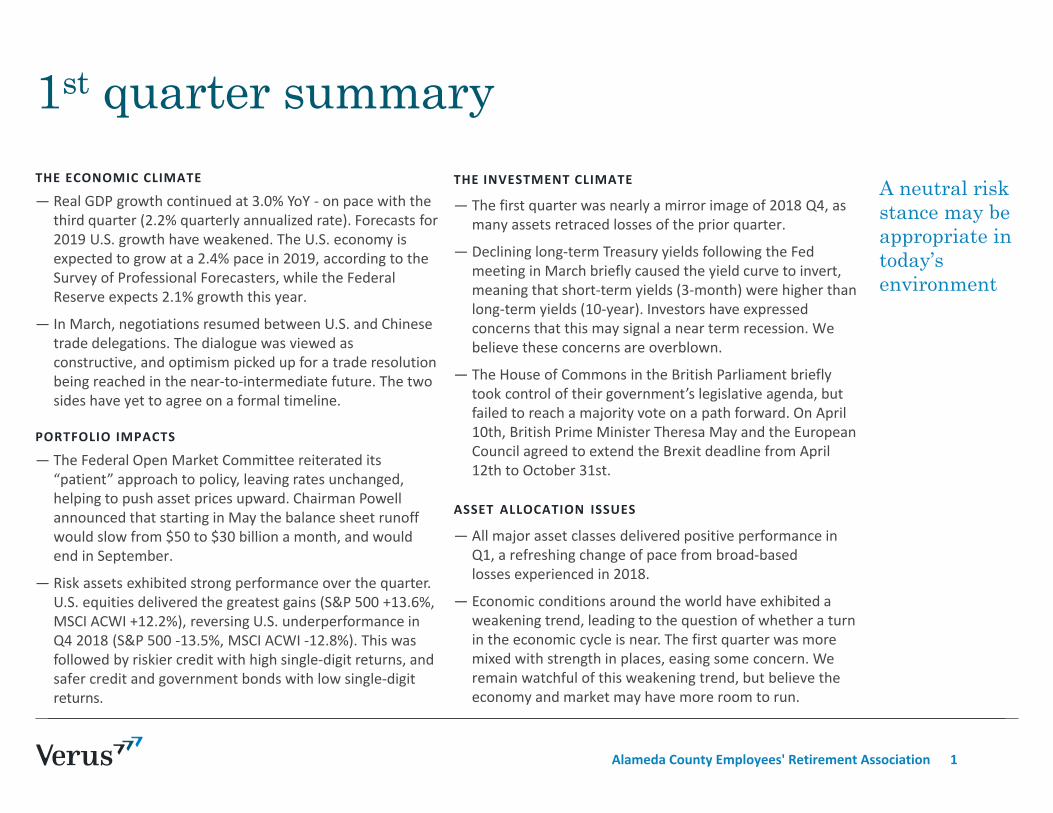
1st quarter summaryTHE ECONOMIC CLIMATE
— Real GDP growth continued at 3.0% YoY ‐ on pace with the third quarter (2.2% quarterly annualized rate). Forecasts for 2019 U.S. growth have weakened. The U.S. economy is expected to grow at a 2.4% pace in 2019, according to the Survey of Professional Forecasters, while the Federal Reserve expects 2.1% growth this year.
— In March, negotiations resumed between U.S. and Chinese trade delegations. The dialogue was viewed as constructive, and optimism picked up for a trade resolution being reached in the near‐to‐intermediate future. The two sides have yet to agree on a formal timeline.
PORTFOLIO IMPACTS
— The Federal Open Market Committee reiterated its “patient” approach to policy, leaving rates unchanged, helping to push asset prices upward. Chairman Powell announced that starting in May the balance sheet runoff would slow from $50 to $30 billion a month, and would end in September.
— Risk assets exhibited strong performance over the quarter. U.S. equities delivered the greatest gains (S&P 500 +13.6%, MSCI ACWI +12.2%), reversing U.S. underperformance in Q4 2018 (S&P 500 ‐13.5%, MSCI ACWI ‐12.8%). This was followed by riskier credit with high single‐digit returns, and safer credit and government bonds with low single‐digit returns.
THE INVESTMENT CLIMATE
— The first quarter was nearly a mirror image of 2018 Q4, as many assets retraced losses of the prior quarter.
— Declining long‐term Treasury yields following the Fed meeting in March briefly caused the yield curve to invert, meaning that short‐term yields (3‐month) were higher than long‐term yields (10‐year). Investors have expressed concerns that this may signal a near term recession. We believe these concerns are overblown.
— The House of Commons in the British Parliament briefly took control of their government’s legislative agenda, but failed to reach a majority vote on a path forward. On April 10th, British Prime Minister Theresa May and the European Council agreed to extend the Brexit deadline from April 12th to October 31st.
ASSET ALLOCATION ISSUES
— All major asset classes delivered positive performance in Q1, a refreshing change of pace from broad‐based losses experienced in 2018.
— Economic conditions around the world have exhibited a weakening trend, leading to the question of whether a turn in the economic cycle is near. The first quarter was more mixed with strength in places, easing some concern. We remain watchful of this weakening trend, but believe the economy and market may have more room to run.
A neutral risk stance may be appropriate in today’s environment
Alameda County Employees' Retirement Association 1
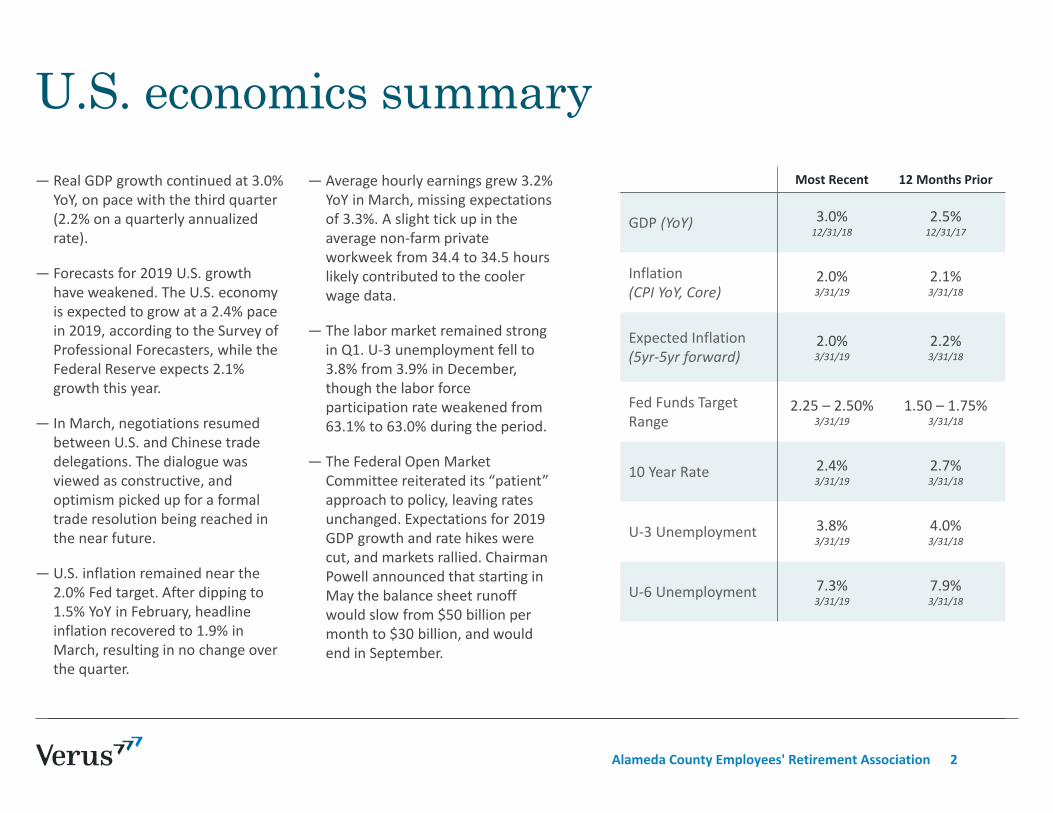
U.S. economics summary— Real GDP growth continued at 3.0%
YoY, on pace with the third quarter (2.2% on a quarterly annualized rate).
— Forecasts for 2019 U.S. growth have weakened. The U.S. economy is expected to grow at a 2.4% pace in 2019, according to the Survey of Professional Forecasters, while the Federal Reserve expects 2.1% growth this year.
— In March, negotiations resumed between U.S. and Chinese trade delegations. The dialogue was viewed as constructive, and optimism picked up for a formal trade resolution being reached in the near future.
— U.S. inflation remained near the 2.0% Fed target. After dipping to 1.5% YoY in February, headline inflation recovered to 1.9% in March, resulting in no change over the quarter.
— Average hourly earnings grew 3.2% YoY in March, missing expectations of 3.3%. A slight tick up in the average non‐farm private workweek from 34.4 to 34.5 hours likely contributed to the cooler wage data.
— The labor market remained strong in Q1. U‐3 unemployment fell to 3.8% from 3.9% in December, though the labor force participation rate weakened from 63.1% to 63.0% during the period.
— The Federal Open Market Committee reiterated its “patient” approach to policy, leaving rates unchanged. Expectations for 2019 GDP growth and rate hikes were cut, and markets rallied. Chairman Powell announced that starting in May the balance sheet runoff would slow from $50 billion per month to $30 billion, and would end in September.
Most Recent 12 Months Prior
GDP (YoY) 3.0%12/31/18
2.5%12/31/17
Inflation(CPI YoY, Core)
2.0%3/31/19
2.1%3/31/18
Expected Inflation (5yr‐5yr forward)
2.0%3/31/19
2.2%3/31/18
Fed Funds Target Range
2.25 – 2.50%3/31/19
1.50 – 1.75%3/31/18
10 Year Rate 2.4%3/31/19
2.7%3/31/18
U‐3 Unemployment 3.8%3/31/19
4.0%3/31/18
U‐6 Unemployment 7.3%3/31/19
7.9%3/31/18
Alameda County Employees' Retirement Association 2
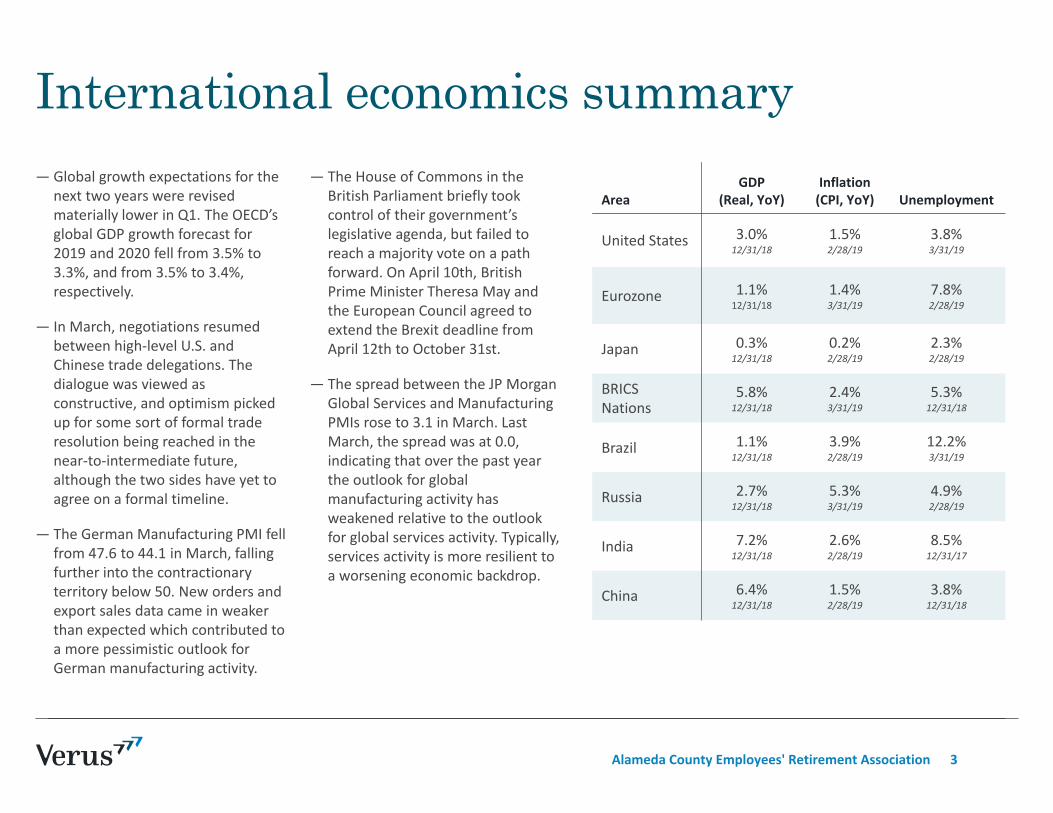
International economics summary—Global growth expectations for the
next two years were revised materially lower in Q1. The OECD’s global GDP growth forecast for 2019 and 2020 fell from 3.5% to 3.3%, and from 3.5% to 3.4%, respectively.
— In March, negotiations resumed between high‐level U.S. and Chinese trade delegations. The dialogue was viewed as constructive, and optimism picked up for some sort of formal trade resolution being reached in the near‐to‐intermediate future, although the two sides have yet to agree on a formal timeline.
— The German Manufacturing PMI fell from 47.6 to 44.1 in March, falling further into the contractionary territory below 50. New orders and export sales data came in weaker than expected which contributed to a more pessimistic outlook for German manufacturing activity.
— The House of Commons in the British Parliament briefly took control of their government’s legislative agenda, but failed to reach a majority vote on a path forward. On April 10th, British Prime Minister Theresa May and the European Council agreed to extend the Brexit deadline from April 12th to October 31st.
— The spread between the JP Morgan Global Services and Manufacturing PMIs rose to 3.1 in March. Last March, the spread was at 0.0, indicating that over the past year the outlook for global manufacturing activity has weakened relative to the outlook for global services activity. Typically, services activity is more resilient to a worsening economic backdrop.
AreaGDP
(Real, YoY)Inflation (CPI, YoY) Unemployment
United States 3.0%12/31/18
1.5%2/28/19
3.8%3/31/19
Eurozone 1.1%12/31/18
1.4%3/31/19
7.8%2/28/19
Japan 0.3%12/31/18
0.2%2/28/19
2.3%2/28/19
BRICS Nations
5.8%12/31/18
2.4%3/31/19
5.3%12/31/18
Brazil 1.1%12/31/18
3.9%2/28/19
12.2%3/31/19
Russia 2.7%12/31/18
5.3%3/31/19
4.9%2/28/19
India 7.2%12/31/18
2.6%2/28/19
8.5%12/31/17
China 6.4%12/31/18
1.5%2/28/19
3.8%12/31/18
Alameda County Employees' Retirement Association 3
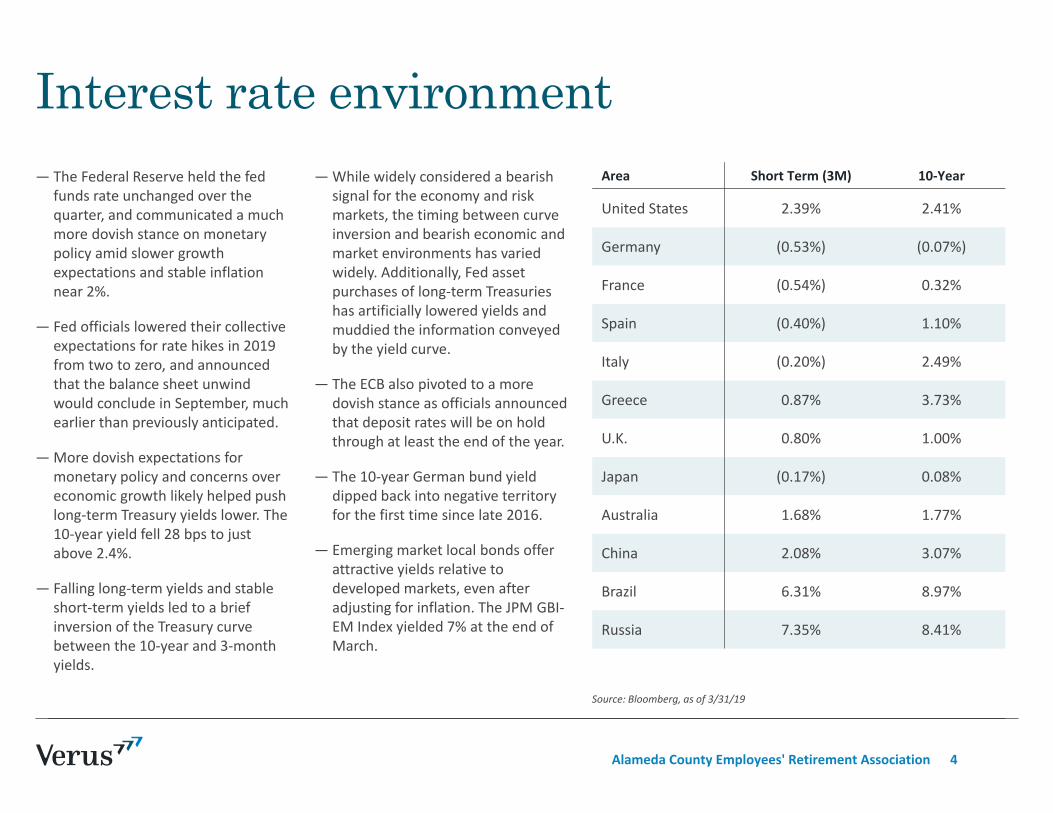
Interest rate environment— The Federal Reserve held the fed
funds rate unchanged over the quarter, and communicated a much more dovish stance on monetary policy amid slower growth expectations and stable inflation near 2%.
— Fed officials lowered their collective expectations for rate hikes in 2019 from two to zero, and announced that the balance sheet unwind would conclude in September, much earlier than previously anticipated.
— More dovish expectations for monetary policy and concerns over economic growth likely helped push long‐term Treasury yields lower. The 10‐year yield fell 28 bps to just above 2.4%.
— Falling long‐term yields and stable short‐term yields led to a brief inversion of the Treasury curve between the 10‐year and 3‐month yields.
—While widely considered a bearish signal for the economy and risk markets, the timing between curve inversion and bearish economic and market environments has varied widely. Additionally, Fed asset purchases of long‐term Treasuries has artificially lowered yields and muddied the information conveyed by the yield curve.
— The ECB also pivoted to a more dovish stance as officials announced that deposit rates will be on hold through at least the end of the year.
— The 10‐year German bund yield dipped back into negative territory for the first time since late 2016.
— Emerging market local bonds offer attractive yields relative to developed markets, even after adjusting for inflation. The JPM GBI‐EM Index yielded 7% at the end of March.
Source: Bloomberg, as of 3/31/19
Area Short Term (3M) 10‐Year
United States 2.39% 2.41%
Germany (0.53%) (0.07%)
France (0.54%) 0.32%
Spain (0.40%) 1.10%
Italy (0.20%) 2.49%
Greece 0.87% 3.73%
U.K. 0.80% 1.00%
Japan (0.17%) 0.08%
Australia 1.68% 1.77%
China 2.08% 3.07%
Brazil 6.31% 8.97%
Russia 7.35% 8.41%
Alameda County Employees' Retirement Association 4
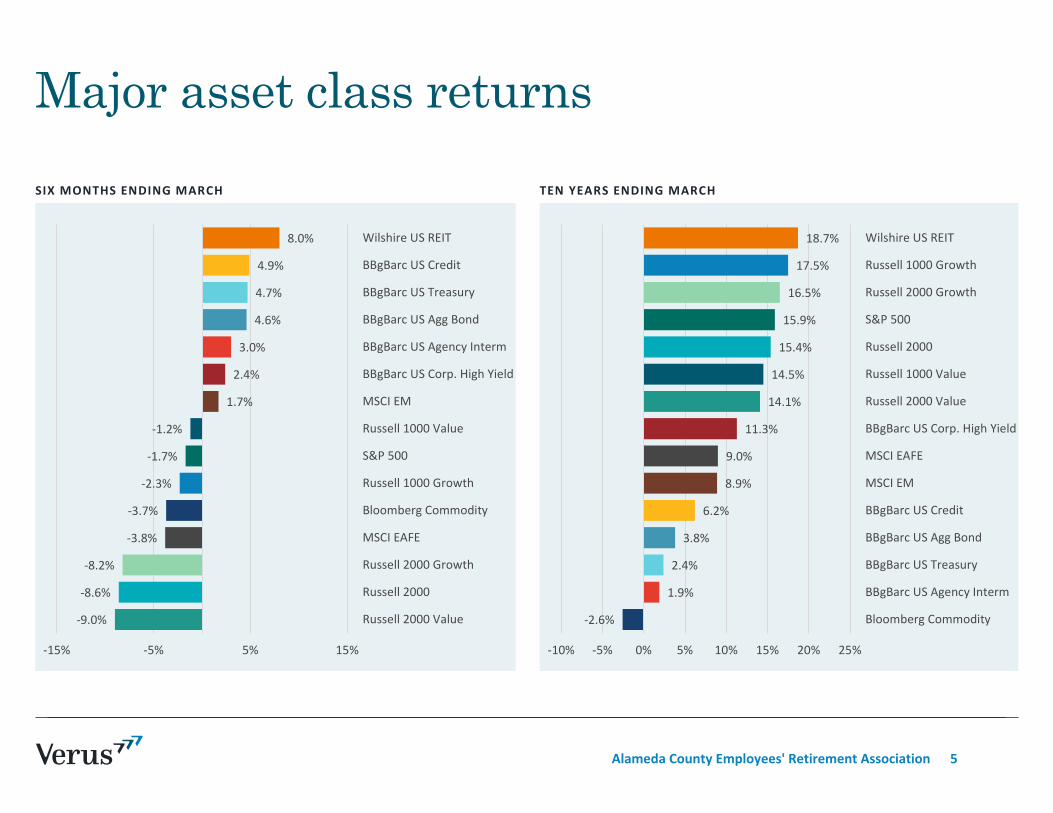
SIX MONTHS ENDING MARCH
Major asset class returnsTEN YEARS ENDING MARCH
-9.0%
-8.6%
-8.2%
-3.8%
-3.7%
-2.3%
-1.7%
-1.2%
1.7%
2.4%
3.0%
4.6%
4.7%
4.9%
8.0%
-15% -5% 5% 15%
Russell 2000 Value
Russell 2000
Russell 2000 Growth
MSCI EAFE
Bloomberg Commodity
Russell 1000 Growth
S&P 500
Russell 1000 Value
MSCI EM
BBgBarc US Corp. High Yield
BBgBarc US Agency Interm
BBgBarc US Agg Bond
BBgBarc US Treasury
BBgBarc US Credit
Wilshire US REIT
-2.6%
1.9%
2.4%
3.8%
6.2%
8.9%
9.0%
11.3%
14.1%
14.5%
15.4%
15.9%
16.5%
17.5%
18.7%
-10% -5% 0% 5% 10% 15% 20% 25%
Bloomberg Commodity
BBgBarc US Agency Interm
BBgBarc US Treasury
BBgBarc US Agg Bond
BBgBarc US Credit
MSCI EM
MSCI EAFE
BBgBarc US Corp. High Yield
Russell 2000 Value
Russell 1000 Value
Russell 2000
S&P 500
Russell 2000 Growth
Russell 1000 Growth
Wilshire US REIT
Alameda County Employees' Retirement Association 5
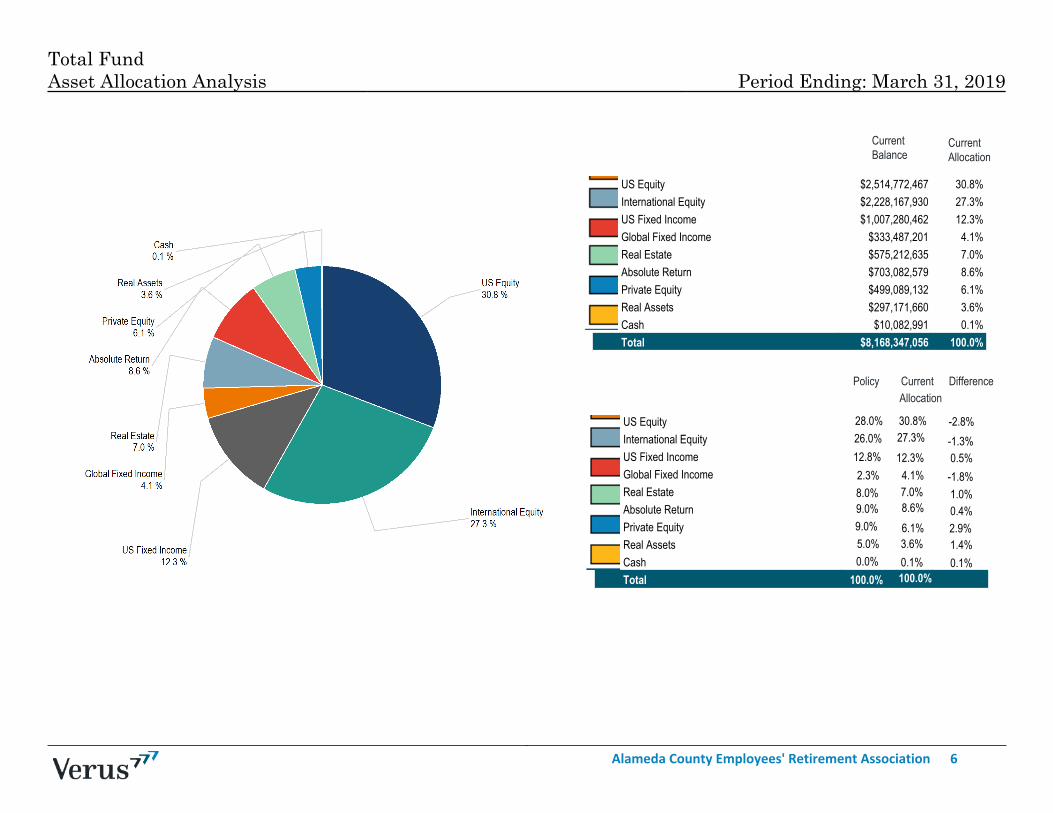
Total FundAsset Allocation Analysis Period Ending: March 31, 2019
Current Balance
Current Allocation
_
US Equity $2,514,772,467 30.8%International Equity $2,228,167,930 27.3%US Fixed Income $1,007,280,462 12.3%Global Fixed Income $333,487,201 4.1%Real Estate $575,212,635 7.0%Absolute Return $703,082,579 8.6%Private Equity $499,089,132 6.1%Real Assets $297,171,660 3.6%Cash $10,082,991 0.1%Total $8,168,347,056 100.0%
_
Policy Current Difference
Difference
US Equity 30.8%28.0%International Equity 27.3%26.0%US Fixed Income 12.3%12.8%Global Fixed Income 4.1%2.3%Real Estate 7.0%8.0%Absolute Return 8.6%9.0%Private Equity 6.1%9.0%Real Assets 3.6%5.0%Cash 0.1%0.0%Total 100.0% 100.0%
_
Allocation
-1.3%-2.8%
0.5%-1.8%
2.9%
0.1%
1.0%0.4%
1.4%
Alameda County Employees' Retirement Association 6
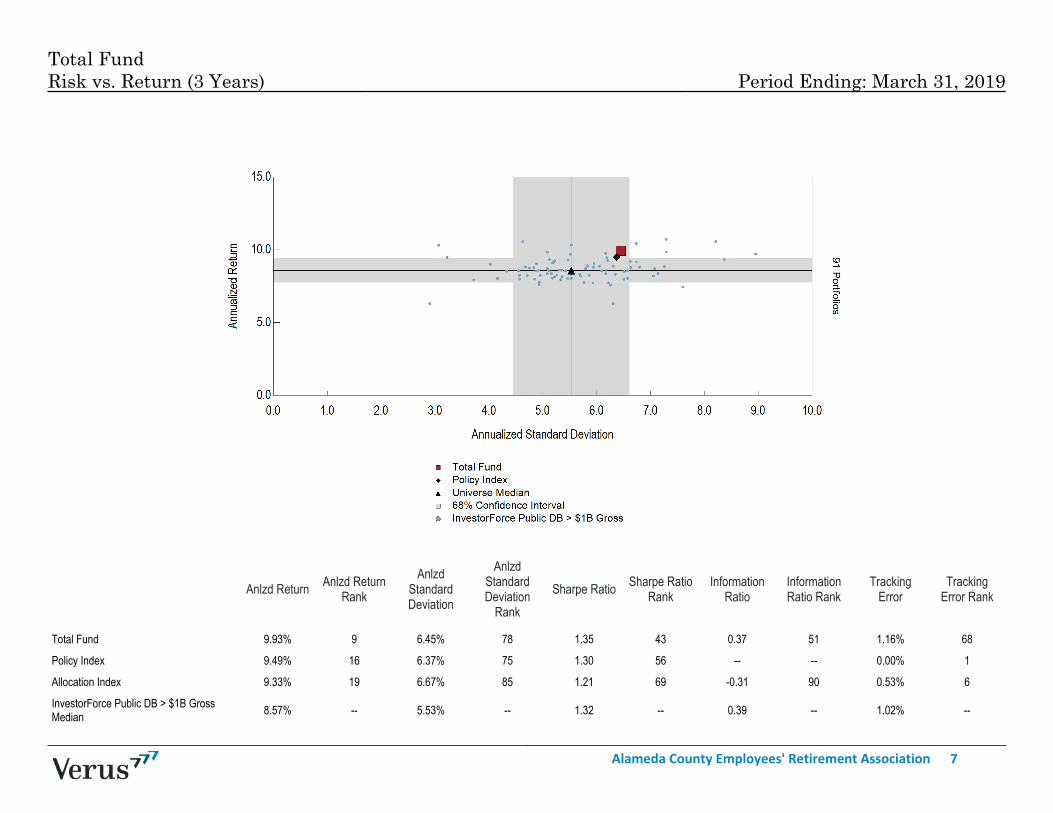
Anlzd Return Anlzd ReturnRank
AnlzdStandardDeviation
AnlzdStandardDeviation
Rank
Sharpe Ratio Sharpe RatioRank
InformationRatio
InformationRatio Rank
TrackingError
TrackingError Rank
_
Total Fund 9.93% 9 6.45% 78 1.35 43 0.37 51 1.16% 68
Policy Index 9.49% 16 6.37% 75 1.30 56 -- -- 0.00% 1
Allocation Index 9.33% 19 6.67% 85 1.21 69 -0.31 90 0.53% 6
InvestorForce Public DB > $1B GrossMedian 8.57% -- 5.53% -- 1.32 -- 0.39 -- 1.02% --
Total FundRisk vs. Return (3 Years) Period Ending: March 31, 2019
Alameda County Employees' Retirement Association 7
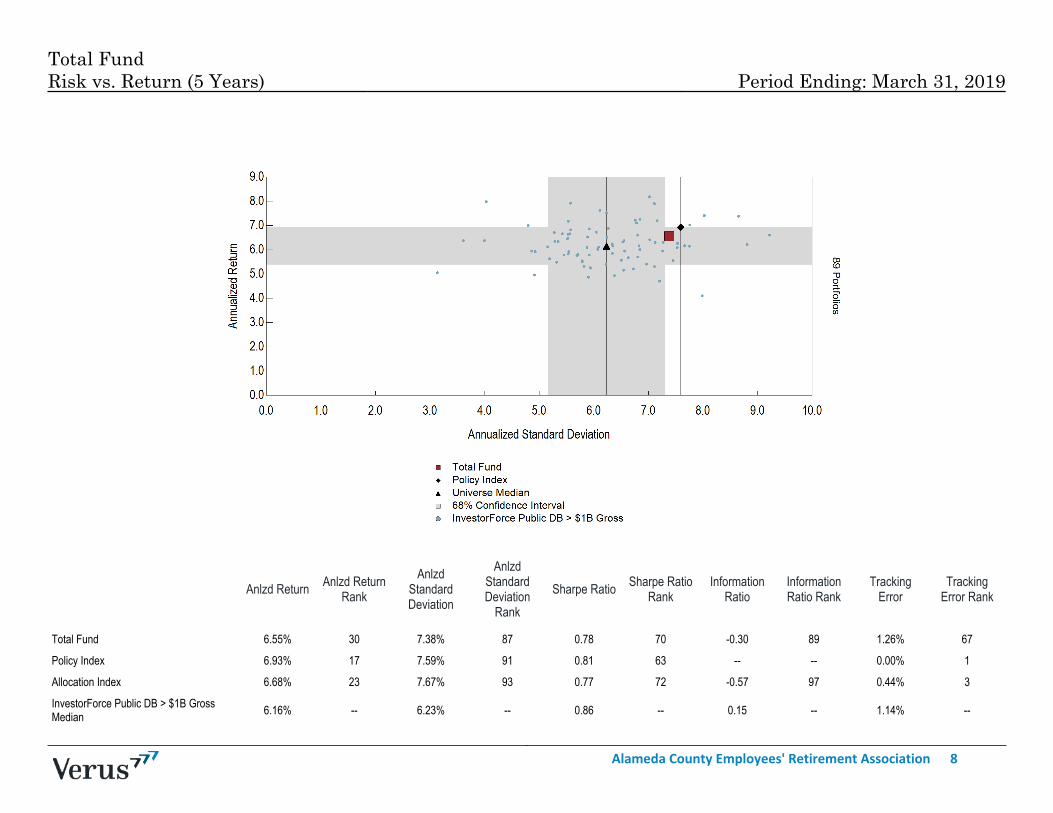
Total FundRisk vs. Return (5 Years) Period Ending: March 31, 2019
Anlzd Return Anlzd ReturnRank
AnlzdStandardDeviation
AnlzdStandardDeviation
Rank
Sharpe Ratio Sharpe RatioRank
InformationRatio
InformationRatio Rank
TrackingError
TrackingError Rank
_
Total Fund 6.55% 30 7.38% 87 0.78 70 -0.30 89 1.26% 67
Policy Index 6.93% 17 7.59% 91 0.81 63 -- -- 0.00% 1
Allocation Index 6.68% 23 7.67% 93 0.77 72 -0.57 97 0.44% 3
InvestorForce Public DB > $1B GrossMedian 6.16% -- 6.23% -- 0.86 -- 0.15 -- 1.14% --
Alameda County Employees' Retirement Association 8
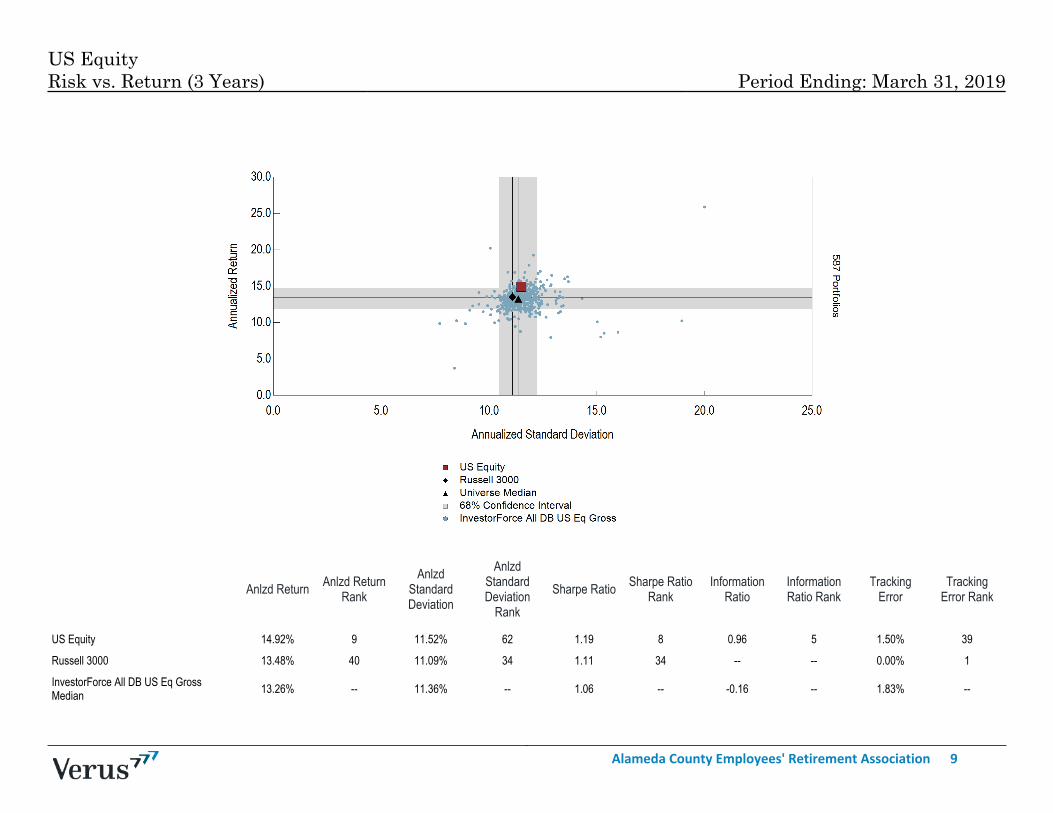
US EquityRisk vs. Return (3 Years) Period Ending: March 31, 2019
Anlzd Return Anlzd ReturnRank
AnlzdStandardDeviation
AnlzdStandardDeviation
Rank
Sharpe Ratio Sharpe RatioRank
InformationRatio
InformationRatio Rank
TrackingError
TrackingError Rank
_
US Equity 14.92% 9 11.52% 62 1.19 8 0.96 5 1.50% 39
Russell 3000 13.48% 40 11.09% 34 1.11 34 -- -- 0.00% 1
InvestorForce All DB US Eq GrossMedian 13.26% -- 11.36% -- 1.06 -- -0.16 -- 1.83% --
XXXXX
Alameda County Employees' Retirement Association 9
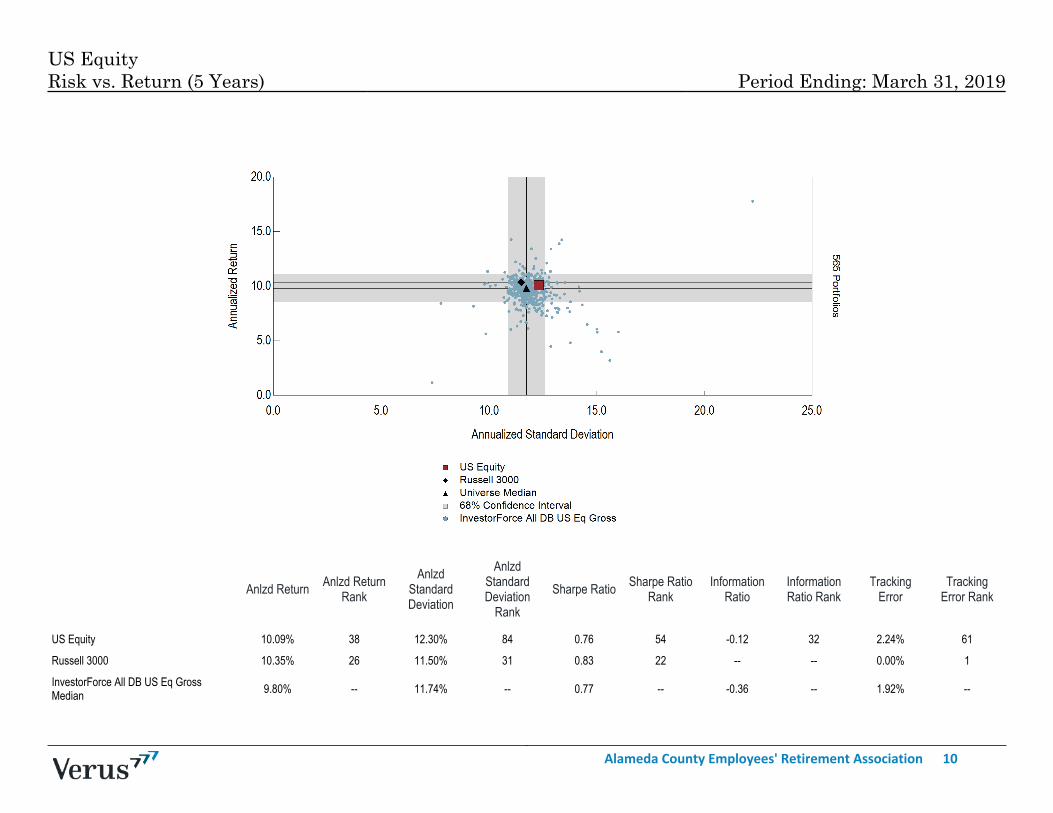
US EquityRisk vs. Return (5 Years) Period Ending: March 31, 2019
Anlzd Return Anlzd ReturnRank
AnlzdStandardDeviation
AnlzdStandardDeviation
Rank
Sharpe Ratio Sharpe RatioRank
InformationRatio
InformationRatio Rank
TrackingError
TrackingError Rank
_
US Equity 10.09% 38 12.30% 84 0.76 54 -0.12 32 2.24% 61
Russell 3000 10.35% 26 11.50% 31 0.83 22 -- -- 0.00% 1
InvestorForce All DB US Eq GrossMedian 9.80% -- 11.74% -- 0.77 -- -0.36 -- 1.92% --
XXXXX
Alameda County Employees' Retirement Association 10
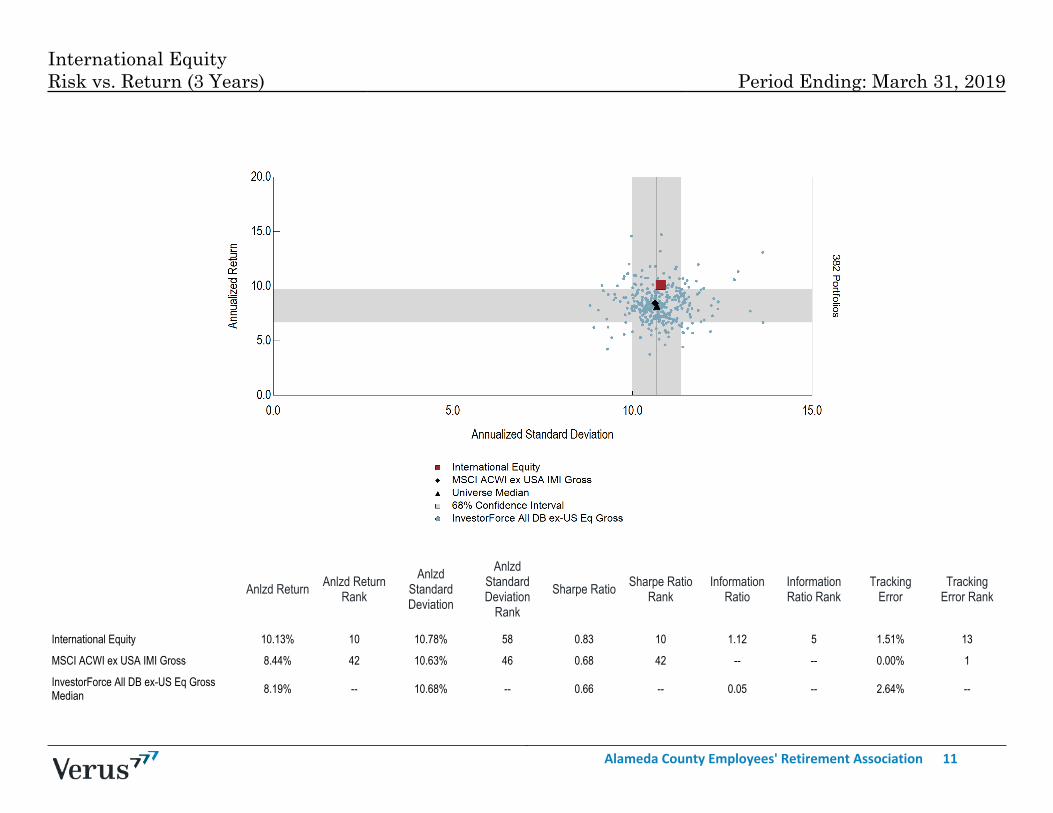
International EquityRisk vs. Return (3 Years) Period Ending: March 31, 2019
Anlzd Return Anlzd ReturnRank
AnlzdStandardDeviation
AnlzdStandardDeviation
Rank
Sharpe Ratio Sharpe RatioRank
InformationRatio
InformationRatio Rank
TrackingError
TrackingError Rank
_
International Equity 10.13% 10 10.78% 58 0.83 10 1.12 5 1.51% 13
MSCI ACWI ex USA IMI Gross 8.44% 42 10.63% 46 0.68 42 -- -- 0.00% 1
InvestorForce All DB ex-US Eq GrossMedian 8.19% -- 10.68% -- 0.66 -- 0.05 -- 2.64% --
Alameda County Employees' Retirement Association 11
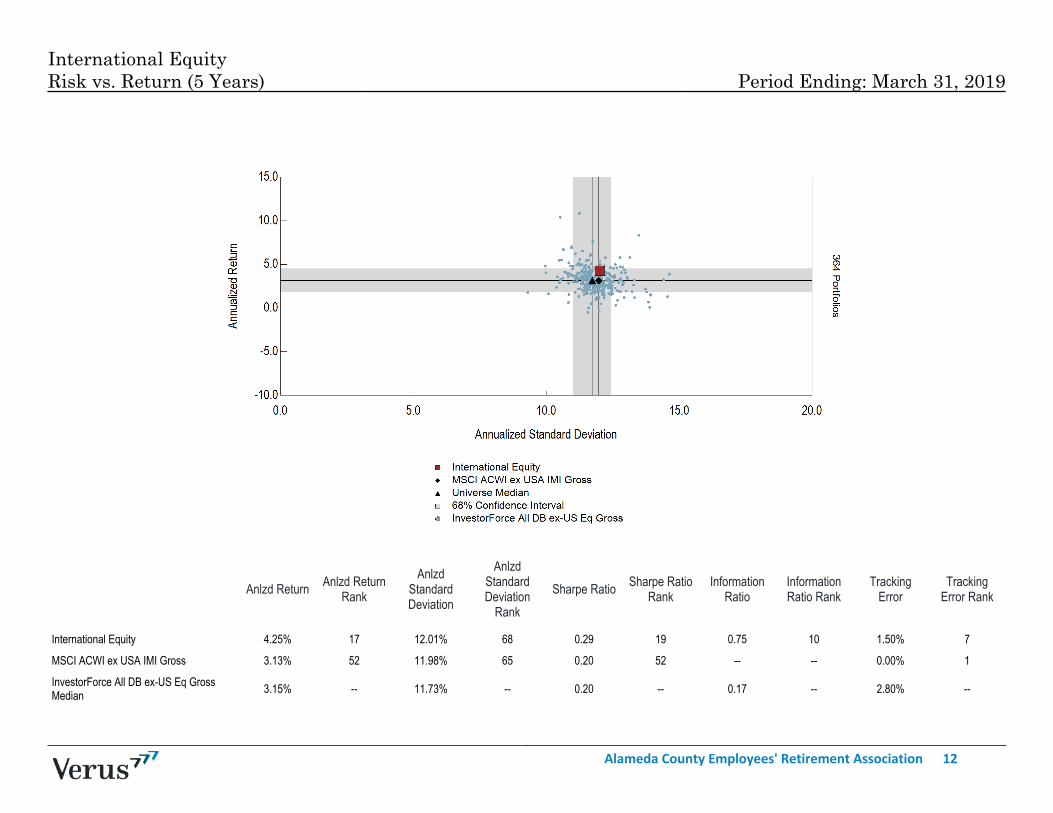
International EquityRisk vs. Return (5 Years) Period Ending: March 31, 2019
Anlzd Return Anlzd ReturnRank
AnlzdStandardDeviation
AnlzdStandardDeviation
Rank
Sharpe Ratio Sharpe RatioRank
InformationRatio
InformationRatio Rank
TrackingError
TrackingError Rank
_
International Equity 4.25% 17 12.01% 68 0.29 19 0.75 10 1.50% 7
MSCI ACWI ex USA IMI Gross 3.13% 52 11.98% 65 0.20 52 -- -- 0.00% 1
InvestorForce All DB ex-US Eq GrossMedian 3.15% -- 11.73% -- 0.20 -- 0.17 -- 2.80% --
Alameda County Employees' Retirement Association 12
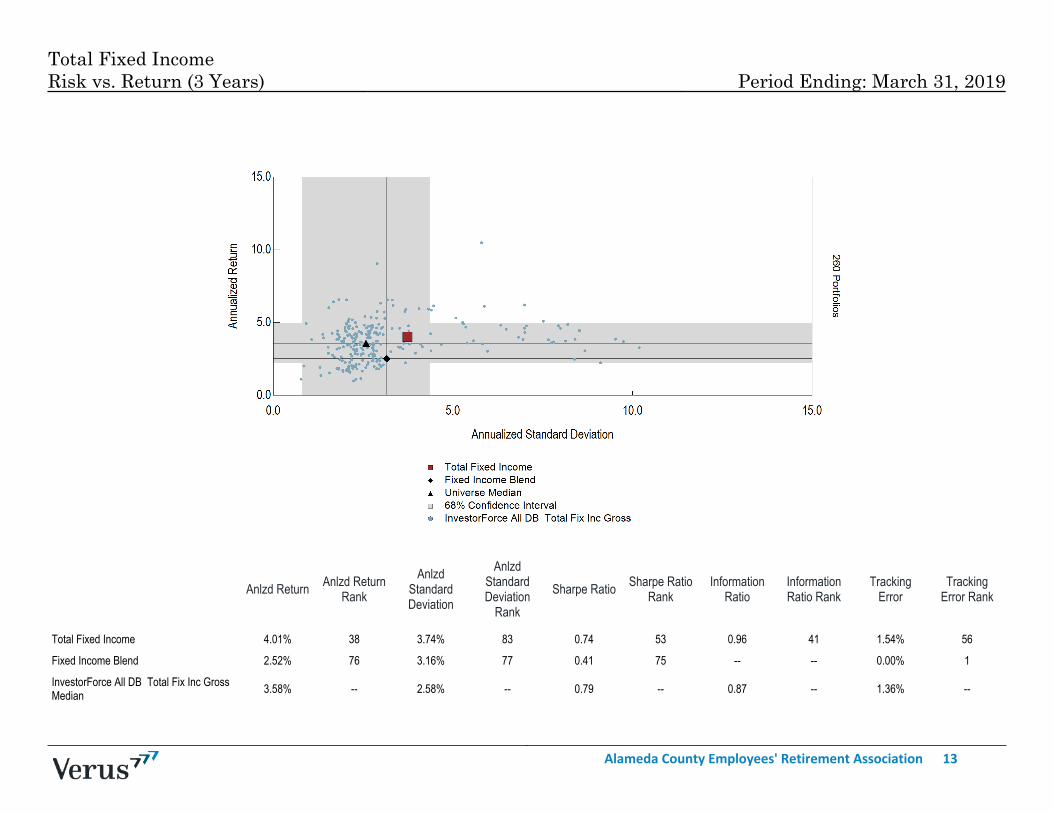
Total Fixed IncomeRisk vs. Return (3 Years) Period Ending: March 31, 2019
Anlzd Return Anlzd ReturnRank
AnlzdStandardDeviation
AnlzdStandardDeviation
Rank
Sharpe Ratio Sharpe RatioRank
InformationRatio
InformationRatio Rank
TrackingError
TrackingError Rank
_
Total Fixed Income 4.01% 38 3.74% 83 0.74 53 0.96 41 1.54% 56
Fixed Income Blend 2.52% 76 3.16% 77 0.41 75 -- -- 0.00% 1
InvestorForce All DB Total Fix Inc GrossMedian 3.58% -- 2.58% -- 0.79 -- 0.87 -- 1.36% --
Alameda County Employees' Retirement Association 13
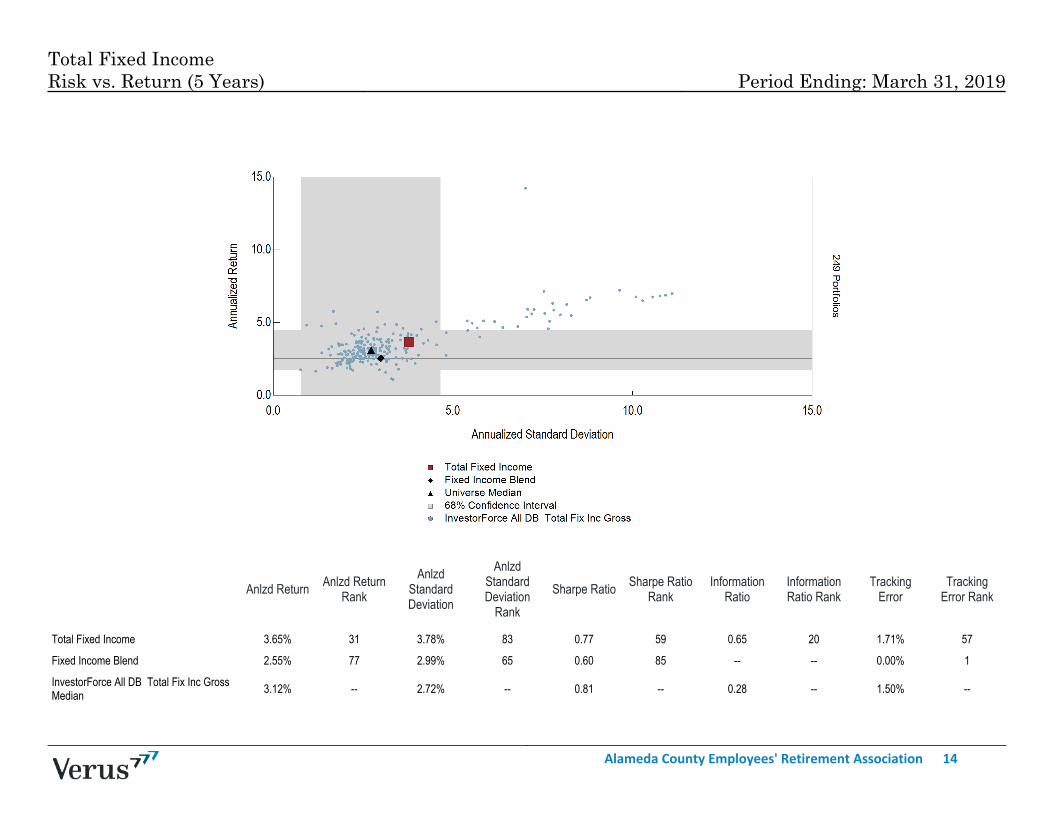
Total Fixed IncomeRisk vs. Return (5 Years) Period Ending: March 31, 2019
Anlzd Return Anlzd ReturnRank
AnlzdStandardDeviation
AnlzdStandardDeviation
Rank
Sharpe Ratio Sharpe RatioRank
InformationRatio
InformationRatio Rank
TrackingError
TrackingError Rank
_
Total Fixed Income 3.65% 31 3.78% 83 0.77 59 0.65 20 1.71% 57
Fixed Income Blend 2.55% 77 2.99% 65 0.60 85 -- -- 0.00% 1
InvestorForce All DB Total Fix Inc GrossMedian 3.12% -- 2.72% -- 0.81 -- 0.28 -- 1.50% --
Alameda County Employees' Retirement Association 14
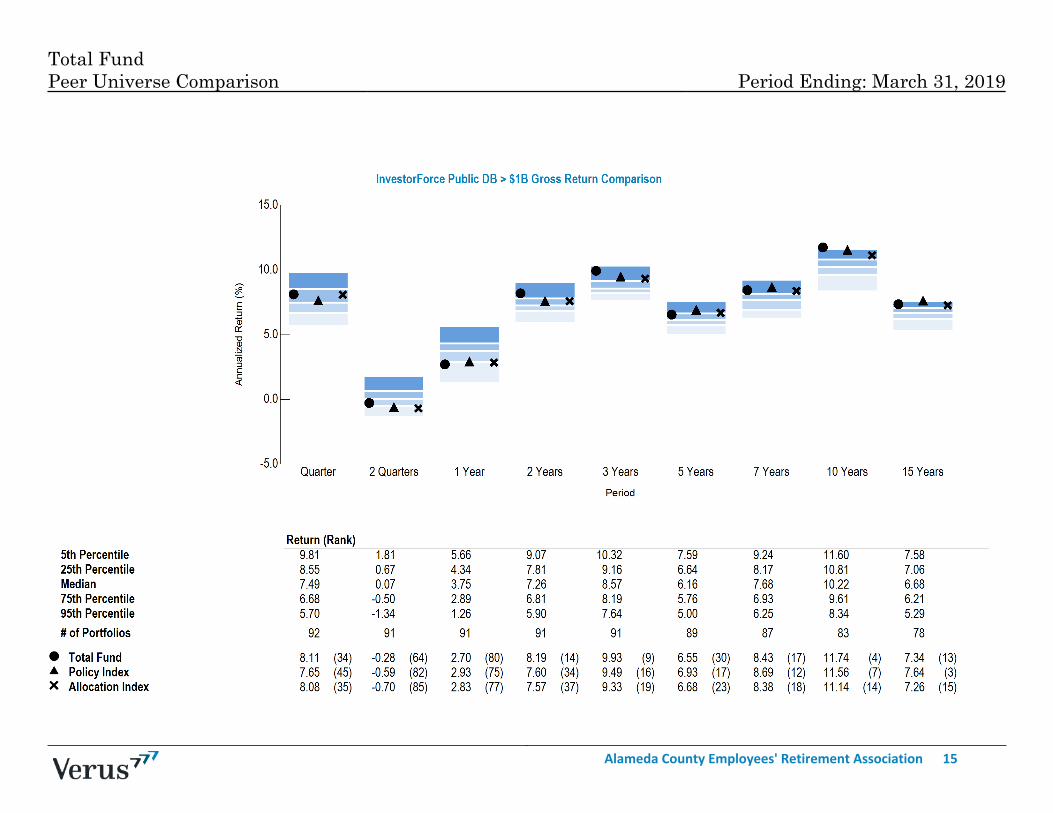
Total FundPeer Universe Comparison Period Ending: March 31, 2019
Alameda County Employees' Retirement Association 15
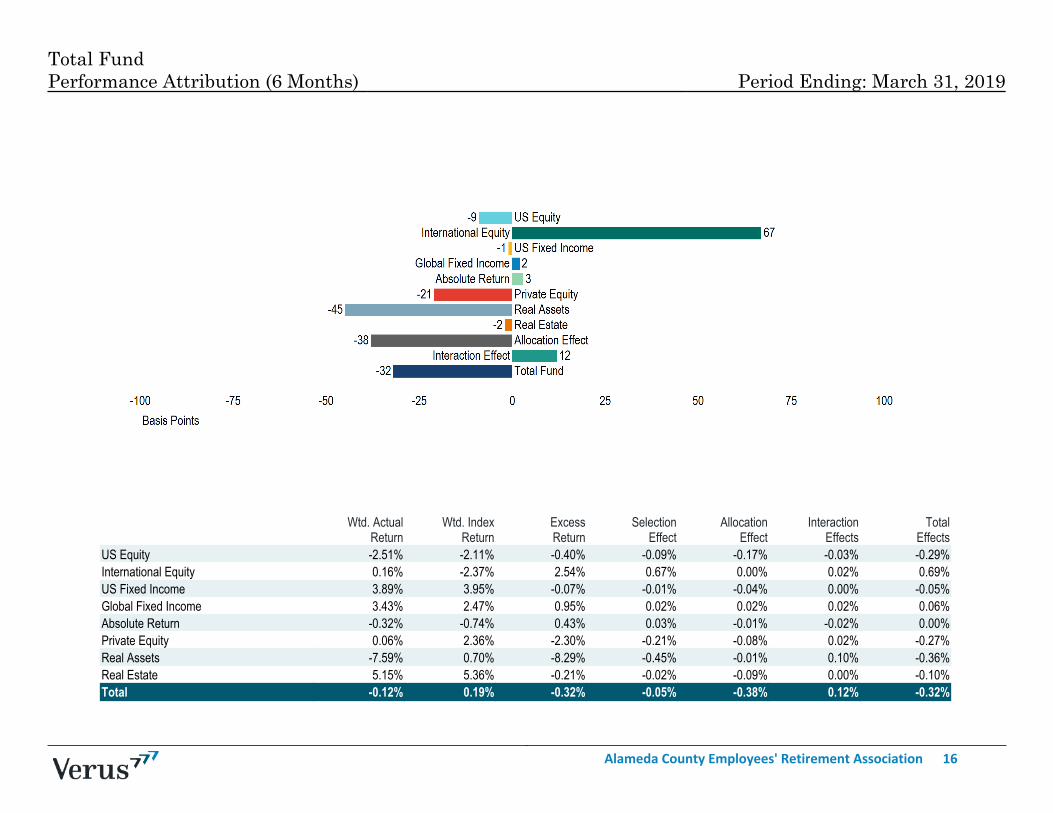
Total FundPerformance Attribution (6 Months) Period Ending: March 31, 2019
Wtd. ActualReturn
Wtd. IndexReturn
ExcessReturn
SelectionEffect
AllocationEffect
InteractionEffects
TotalEffects
US Equity -2.51% -2.11% -0.40% -0.09% -0.17% -0.03% -0.29%International Equity 0.16% -2.37% 2.54% 0.67% 0.00% 0.02% 0.69%US Fixed Income 3.89% 3.95% -0.07% -0.01% -0.04% 0.00% -0.05%Global Fixed Income 3.43% 2.47% 0.95% 0.02% 0.02% 0.02% 0.06%Absolute Return -0.32% -0.74% 0.43% 0.03% -0.01% -0.02% 0.00%Private Equity 0.06% 2.36% -2.30% -0.21% -0.08% 0.02% -0.27%Real Assets -7.59% 0.70% -8.29% -0.45% -0.01% 0.10% -0.36%Real Estate 5.15% 5.36% -0.21% -0.02% -0.09% 0.00% -0.10%Total -0.12% 0.19% -0.32% -0.05% -0.38% 0.12% -0.32%
Alameda County Employees' Retirement Association 16
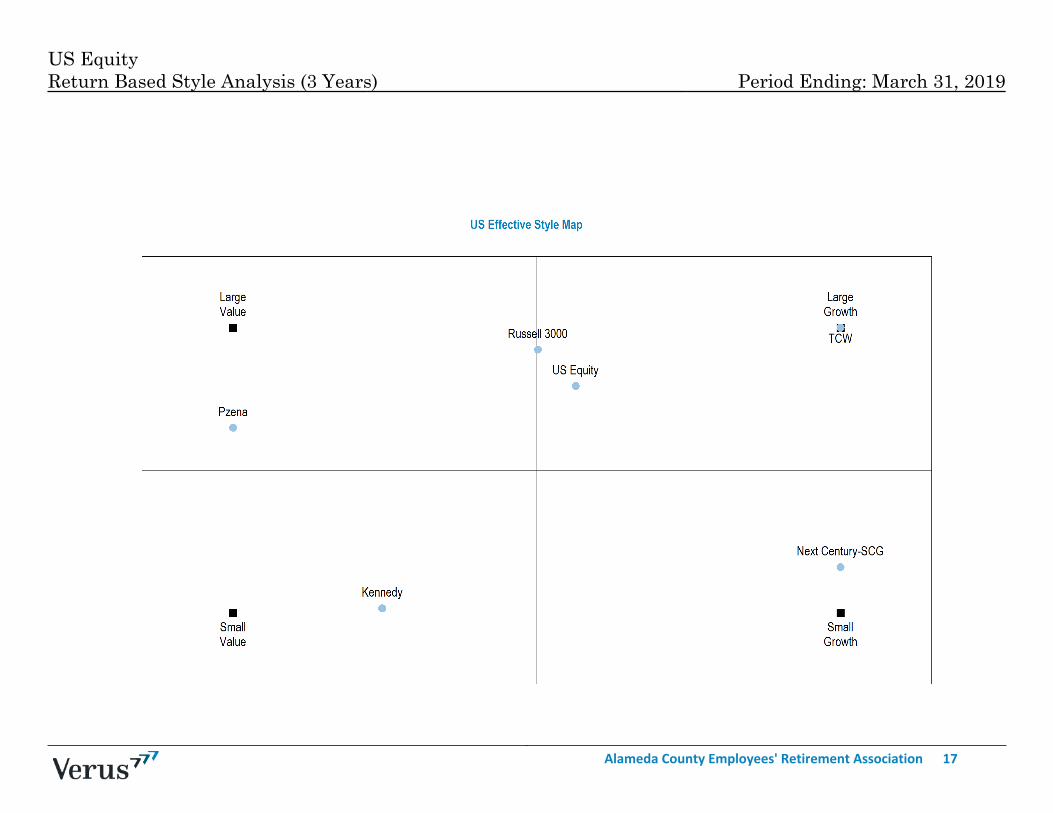
US EquityReturn Based Style Analysis (3 Years) Period Ending: March 31, 2019
Alameda County Employees' Retirement Association 17
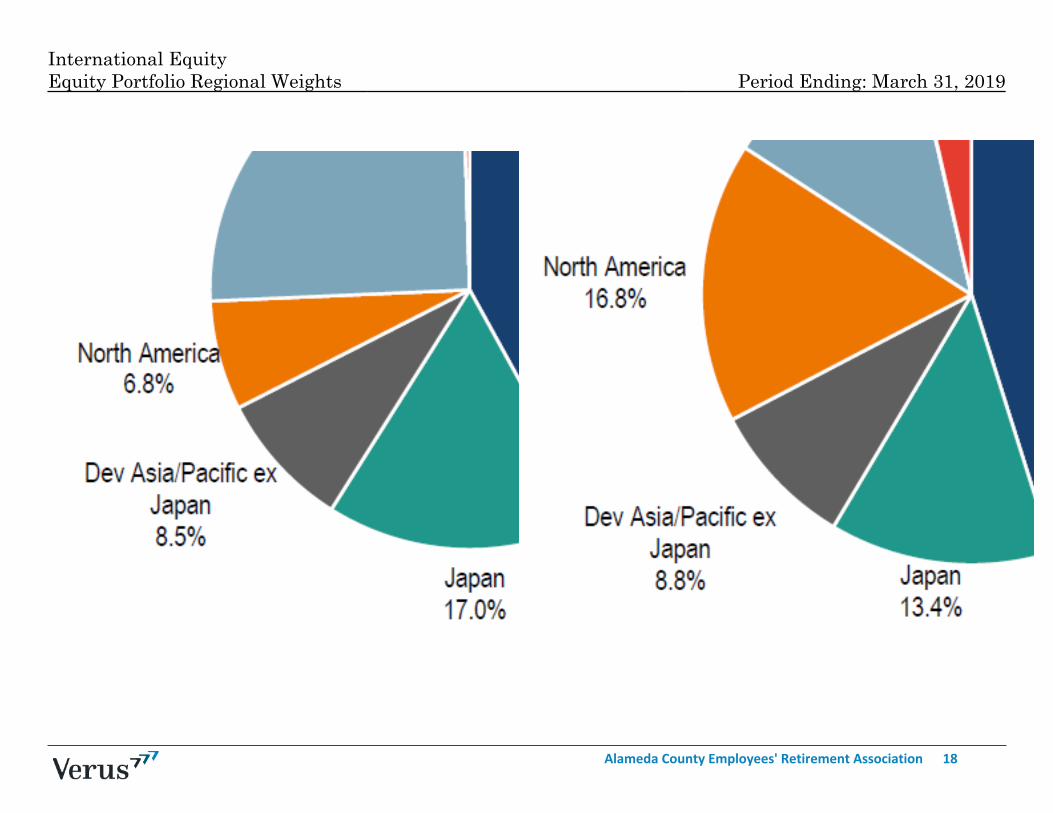
International EquityEquity Portfolio Regional Weights Period Ending: March 31, 2019
Alameda County Employees' Retirement Association 18
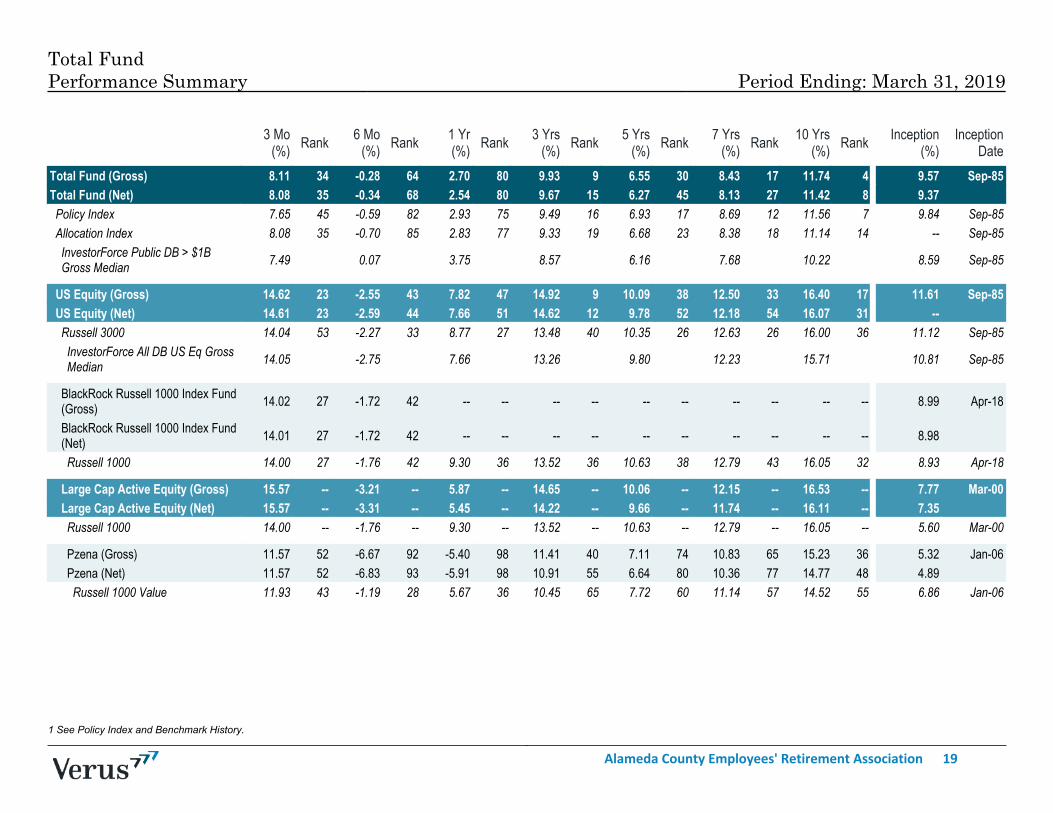
1 See Policy Index and Benchmark History.
3 Mo(%) Rank 6 Mo
(%) Rank 1 Yr(%) Rank 3 Yrs
(%) Rank 5 Yrs(%) Rank 7 Yrs
(%) Rank 10 Yrs(%) Rank Inception
(%)Inception
Date_
Total Fund (Gross) 8.11 34 -0.28 64 2.70 80 9.93 9 6.55 30 8.43 17 11.74 4 9.57 Sep-85Total Fund (Net) 8.08 35 -0.34 68 2.54 80 9.67 15 6.27 45 8.13 27 11.42 8 9.37Policy Index 7.65 45 -0.59 82 2.93 75 9.49 16 6.93 17 8.69 12 11.56 7 9.84 Sep-85Allocation Index 8.08 35 -0.70 85 2.83 77 9.33 19 6.68 23 8.38 18 11.14 14 -- Sep-85InvestorForce Public DB > $1BGross Median 7.49 0.07 3.75 8.57 6.16 7.68 10.22 8.59 Sep-85
US Equity (Gross) 14.62 23 -2.55 43 7.82 47 14.92 9 10.09 38 12.50 33 16.40 17 11.61 Sep-85US Equity (Net) 14.61 23 -2.59 44 7.66 51 14.62 12 9.78 52 12.18 54 16.07 31 --Russell 3000 14.04 53 -2.27 33 8.77 27 13.48 40 10.35 26 12.63 26 16.00 36 11.12 Sep-85InvestorForce All DB US Eq GrossMedian 14.05 -2.75 7.66 13.26 9.80 12.23 15.71 10.81 Sep-85
BlackRock Russell 1000 Index Fund(Gross) 14.02 27 -1.72 42 -- -- -- -- -- -- -- -- -- -- 8.99 Apr-18
BlackRock Russell 1000 Index Fund(Net) 14.01 27 -1.72 42 -- -- -- -- -- -- -- -- -- -- 8.98
Russell 1000 14.00 27 -1.76 42 9.30 36 13.52 36 10.63 38 12.79 43 16.05 32 8.93 Apr-18
Large Cap Active Equity (Gross) 15.57 -- -3.21 -- 5.87 -- 14.65 -- 10.06 -- 12.15 -- 16.53 -- 7.77 Mar-00Large Cap Active Equity (Net) 15.57 -- -3.31 -- 5.45 -- 14.22 -- 9.66 -- 11.74 -- 16.11 -- 7.35Russell 1000 14.00 -- -1.76 -- 9.30 -- 13.52 -- 10.63 -- 12.79 -- 16.05 -- 5.60 Mar-00
Pzena (Gross) 11.57 52 -6.67 92 -5.40 98 11.41 40 7.11 74 10.83 65 15.23 36 5.32 Jan-06Pzena (Net) 11.57 52 -6.83 93 -5.91 98 10.91 55 6.64 80 10.36 77 14.77 48 4.89Russell 1000 Value 11.93 43 -1.19 28 5.67 36 10.45 65 7.72 60 11.14 57 14.52 55 6.86 Jan-06
Total FundPerformance Summary Period Ending: March 31, 2019
Alameda County Employees' Retirement Association 19
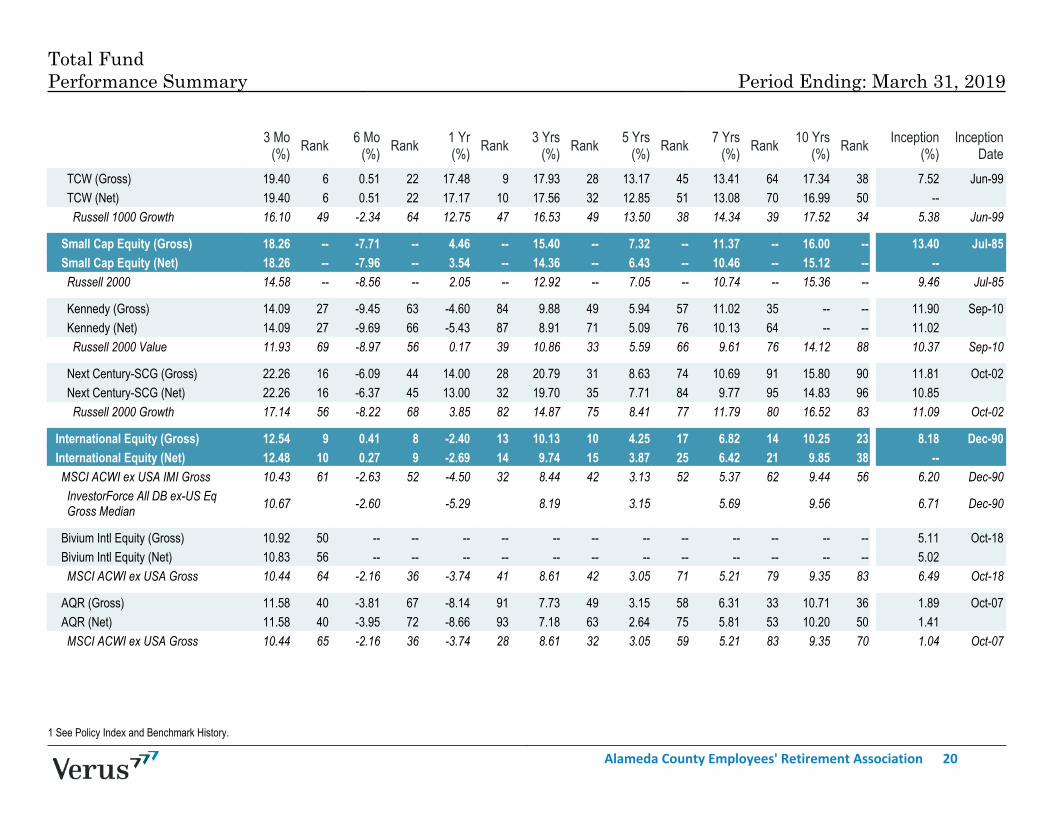
1 See Policy Index and Benchmark History.
3 Mo(%) Rank 6 Mo
(%) Rank 1 Yr(%) Rank 3 Yrs
(%) Rank 5 Yrs(%) Rank 7 Yrs
(%) Rank 10 Yrs(%) Rank Inception
(%)Inception
Date_
TCW (Gross) 19.40 6 0.51 22 17.48 9 17.93 28 13.17 45 13.41 64 17.34 38 7.52 Jun-99TCW (Net) 19.40 6 0.51 22 17.17 10 17.56 32 12.85 51 13.08 70 16.99 50 --Russell 1000 Growth 16.10 49 -2.34 64 12.75 47 16.53 49 13.50 38 14.34 39 17.52 34 5.38 Jun-99
Small Cap Equity (Gross) 18.26 -- -7.71 -- 4.46 -- 15.40 -- 7.32 -- 11.37 -- 16.00 -- 13.40 Jul-85Small Cap Equity (Net) 18.26 -- -7.96 -- 3.54 -- 14.36 -- 6.43 -- 10.46 -- 15.12 -- --Russell 2000 14.58 -- -8.56 -- 2.05 -- 12.92 -- 7.05 -- 10.74 -- 15.36 -- 9.46 Jul-85
Kennedy (Gross) 14.09 27 -9.45 63 -4.60 84 9.88 49 5.94 57 11.02 35 -- -- 11.90 Sep-10Kennedy (Net) 14.09 27 -9.69 66 -5.43 87 8.91 71 5.09 76 10.13 64 -- -- 11.02Russell 2000 Value 11.93 69 -8.97 56 0.17 39 10.86 33 5.59 66 9.61 76 14.12 88 10.37 Sep-10
Next Century-SCG (Gross) 22.26 16 -6.09 44 14.00 28 20.79 31 8.63 74 10.69 91 15.80 90 11.81 Oct-02Next Century-SCG (Net) 22.26 16 -6.37 45 13.00 32 19.70 35 7.71 84 9.77 95 14.83 96 10.85Russell 2000 Growth 17.14 56 -8.22 68 3.85 82 14.87 75 8.41 77 11.79 80 16.52 83 11.09 Oct-02
International Equity (Gross) 12.54 9 0.41 8 -2.40 13 10.13 10 4.25 17 6.82 14 10.25 23 8.18 Dec-90International Equity (Net) 12.48 10 0.27 9 -2.69 14 9.74 15 3.87 25 6.42 21 9.85 38 --MSCI ACWI ex USA IMI Gross 10.43 61 -2.63 52 -4.50 32 8.44 42 3.13 52 5.37 62 9.44 56 6.20 Dec-90InvestorForce All DB ex-US EqGross Median 10.67 -2.60 -5.29 8.19 3.15 5.69 9.56 6.71 Dec-90
Bivium Intl Equity (Gross) 10.92 50 -- -- -- -- -- -- -- -- -- -- -- -- 5.11 Oct-18Bivium Intl Equity (Net) 10.83 56 -- -- -- -- -- -- -- -- -- -- -- -- 5.02MSCI ACWI ex USA Gross 10.44 64 -2.16 36 -3.74 41 8.61 42 3.05 71 5.21 79 9.35 83 6.49 Oct-18
AQR (Gross) 11.58 40 -3.81 67 -8.14 91 7.73 49 3.15 58 6.31 33 10.71 36 1.89 Oct-07AQR (Net) 11.58 40 -3.95 72 -8.66 93 7.18 63 2.64 75 5.81 53 10.20 50 1.41MSCI ACWI ex USA Gross 10.44 65 -2.16 36 -3.74 28 8.61 32 3.05 59 5.21 83 9.35 70 1.04 Oct-07
Total FundPerformance Summary Period Ending: March 31, 2019
Alameda County Employees' Retirement Association 20
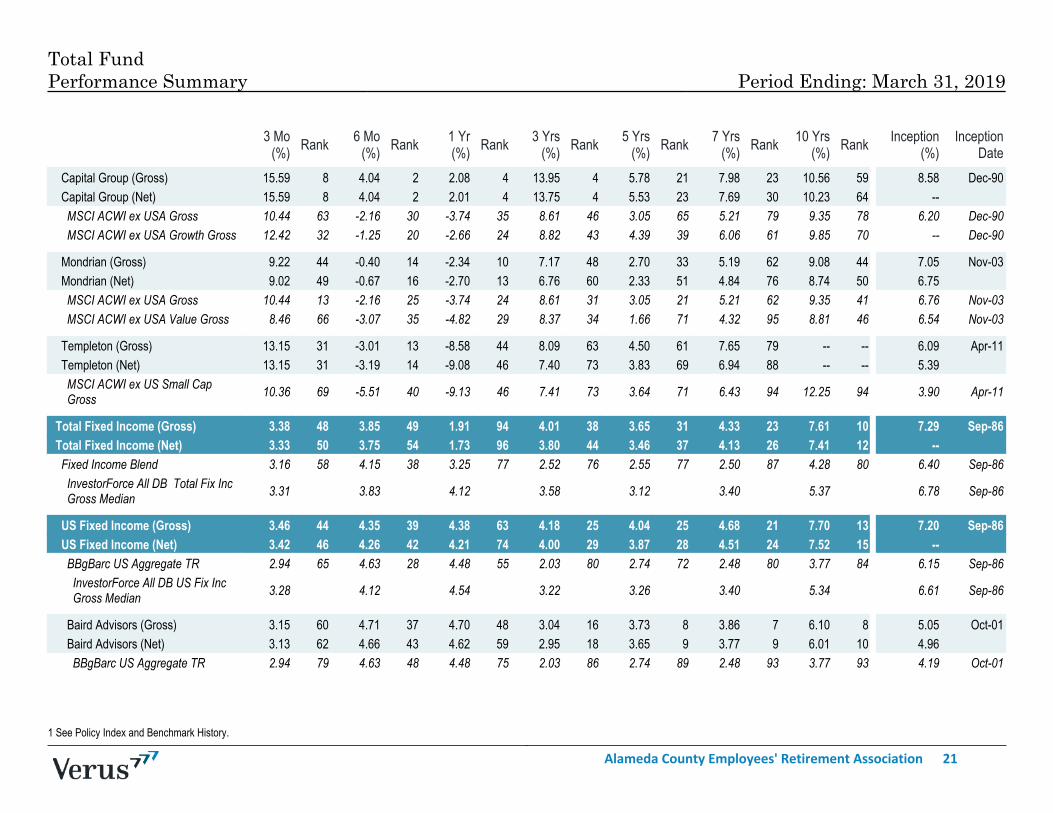
1 See Policy Index and Benchmark History.
Total FundPerformance Summary Period Ending: March 31, 2019
3 Mo(%) Rank 6 Mo
(%) Rank 1 Yr(%) Rank 3 Yrs
(%) Rank 5 Yrs(%) Rank 7 Yrs
(%) Rank 10 Yrs(%) Rank Inception
(%)Inception
Date_
Capital Group (Gross) 15.59 8 4.04 2 2.08 4 13.95 4 5.78 21 7.98 23 10.56 59 8.58 Dec-90Capital Group (Net) 15.59 8 4.04 2 2.01 4 13.75 4 5.53 23 7.69 30 10.23 64 --MSCI ACWI ex USA Gross 10.44 63 -2.16 30 -3.74 35 8.61 46 3.05 65 5.21 79 9.35 78 6.20 Dec-90MSCI ACWI ex USA Growth Gross 12.42 32 -1.25 20 -2.66 24 8.82 43 4.39 39 6.06 61 9.85 70 -- Dec-90
Mondrian (Gross) 9.22 44 -0.40 14 -2.34 10 7.17 48 2.70 33 5.19 62 9.08 44 7.05 Nov-03Mondrian (Net) 9.02 49 -0.67 16 -2.70 13 6.76 60 2.33 51 4.84 76 8.74 50 6.75MSCI ACWI ex USA Gross 10.44 13 -2.16 25 -3.74 24 8.61 31 3.05 21 5.21 62 9.35 41 6.76 Nov-03MSCI ACWI ex USA Value Gross 8.46 66 -3.07 35 -4.82 29 8.37 34 1.66 71 4.32 95 8.81 46 6.54 Nov-03
Templeton (Gross) 13.15 31 -3.01 13 -8.58 44 8.09 63 4.50 61 7.65 79 -- -- 6.09 Apr-11Templeton (Net) 13.15 31 -3.19 14 -9.08 46 7.40 73 3.83 69 6.94 88 -- -- 5.39MSCI ACWI ex US Small CapGross 10.36 69 -5.51 40 -9.13 46 7.41 73 3.64 71 6.43 94 12.25 94 3.90 Apr-11
Total Fixed Income (Gross) 3.38 48 3.85 49 1.91 94 4.01 38 3.65 31 4.33 23 7.61 10 7.29 Sep-86Total Fixed Income (Net) 3.33 50 3.75 54 1.73 96 3.80 44 3.46 37 4.13 26 7.41 12 --Fixed Income Blend 3.16 58 4.15 38 3.25 77 2.52 76 2.55 77 2.50 87 4.28 80 6.40 Sep-86InvestorForce All DB Total Fix IncGross Median 3.31 3.83 4.12 3.58 3.12 3.40 5.37 6.78 Sep-86
US Fixed Income (Gross) 3.46 44 4.35 39 4.38 63 4.18 25 4.04 25 4.68 21 7.70 13 7.20 Sep-86US Fixed Income (Net) 3.42 46 4.26 42 4.21 74 4.00 29 3.87 28 4.51 24 7.52 15 --BBgBarc US Aggregate TR 2.94 65 4.63 28 4.48 55 2.03 80 2.74 72 2.48 80 3.77 84 6.15 Sep-86InvestorForce All DB US Fix IncGross Median 3.28 4.12 4.54 3.22 3.26 3.40 5.34 6.61 Sep-86
Baird Advisors (Gross) 3.15 60 4.71 37 4.70 48 3.04 16 3.73 8 3.86 7 6.10 8 5.05 Oct-01Baird Advisors (Net) 3.13 62 4.66 43 4.62 59 2.95 18 3.65 9 3.77 9 6.01 10 4.96BBgBarc US Aggregate TR 2.94 79 4.63 48 4.48 75 2.03 86 2.74 89 2.48 93 3.77 93 4.19 Oct-01
Alameda County Employees' Retirement Association 21
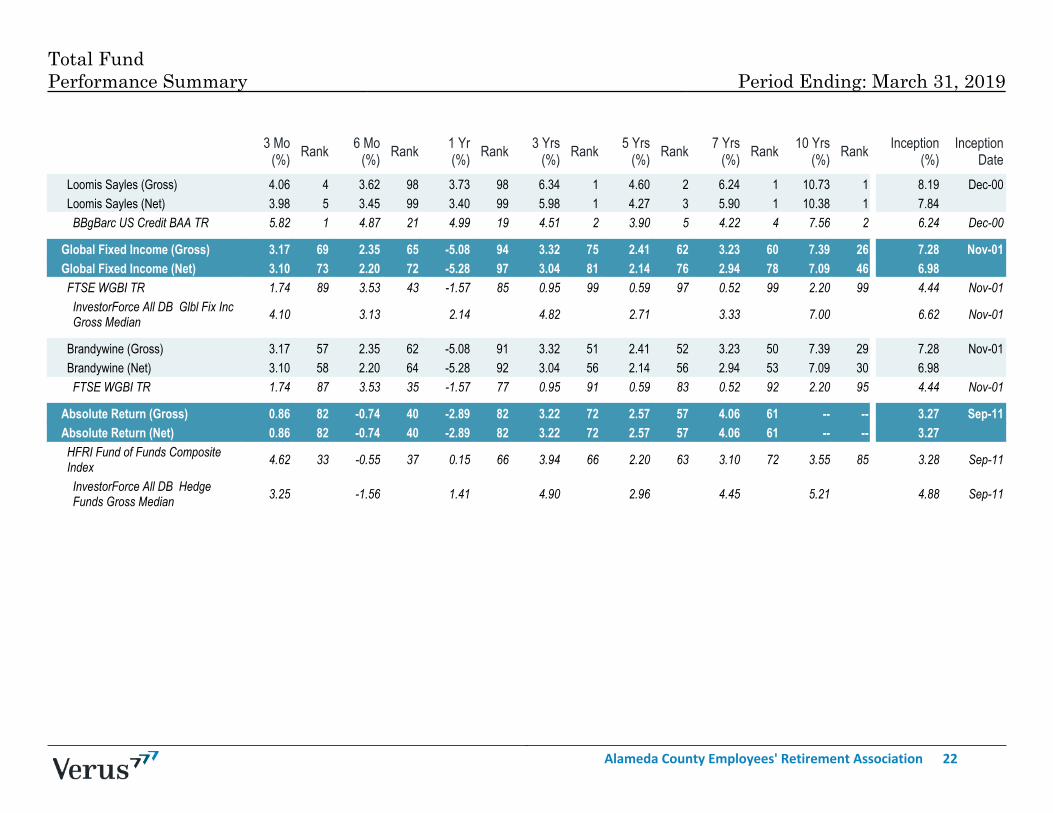
3 Mo(%) Rank 6 Mo
(%) Rank 1 Yr(%) Rank 3 Yrs
(%) Rank 5 Yrs(%) Rank 7 Yrs
(%) Rank 10 Yrs(%) Rank Inception
(%)Inception
Date_
Loomis Sayles (Gross) 4.06 4 3.62 98 3.73 98 6.34 1 4.60 2 6.24 1 10.73 1 8.19 Dec-00Loomis Sayles (Net) 3.98 5 3.45 99 3.40 99 5.98 1 4.27 3 5.90 1 10.38 1 7.84BBgBarc US Credit BAA TR 5.82 1 4.87 21 4.99 19 4.51 2 3.90 5 4.22 4 7.56 2 6.24 Dec-00
Global Fixed Income (Gross) 3.17 69 2.35 65 -5.08 94 3.32 75 2.41 62 3.23 60 7.39 26 7.28 Nov-01Global Fixed Income (Net) 3.10 73 2.20 72 -5.28 97 3.04 81 2.14 76 2.94 78 7.09 46 6.98FTSE WGBI TR 1.74 89 3.53 43 -1.57 85 0.95 99 0.59 97 0.52 99 2.20 99 4.44 Nov-01InvestorForce All DB Glbl Fix IncGross Median 4.10 3.13 2.14 4.82 2.71 3.33 7.00 6.62 Nov-01
Brandywine (Gross) 3.17 57 2.35 62 -5.08 91 3.32 51 2.41 52 3.23 50 7.39 29 7.28 Nov-01Brandywine (Net) 3.10 58 2.20 64 -5.28 92 3.04 56 2.14 56 2.94 53 7.09 30 6.98FTSE WGBI TR 1.74 87 3.53 35 -1.57 77 0.95 91 0.59 83 0.52 92 2.20 95 4.44 Nov-01
Absolute Return (Gross) 0.86 82 -0.74 40 -2.89 82 3.22 72 2.57 57 4.06 61 -- -- 3.27 Sep-11Absolute Return (Net) 0.86 82 -0.74 40 -2.89 82 3.22 72 2.57 57 4.06 61 -- -- 3.27HFRI Fund of Funds CompositeIndex 4.62 33 -0.55 37 0.15 66 3.94 66 2.20 63 3.10 72 3.55 85 3.28 Sep-11
InvestorForce All DB HedgeFunds Gross Median 3.25 -1.56 1.41 4.90 2.96 4.45 5.21 4.88 Sep-11
Total FundPerformance Summary Period Ending: March 31, 2019
Alameda County Employees' Retirement Association 22
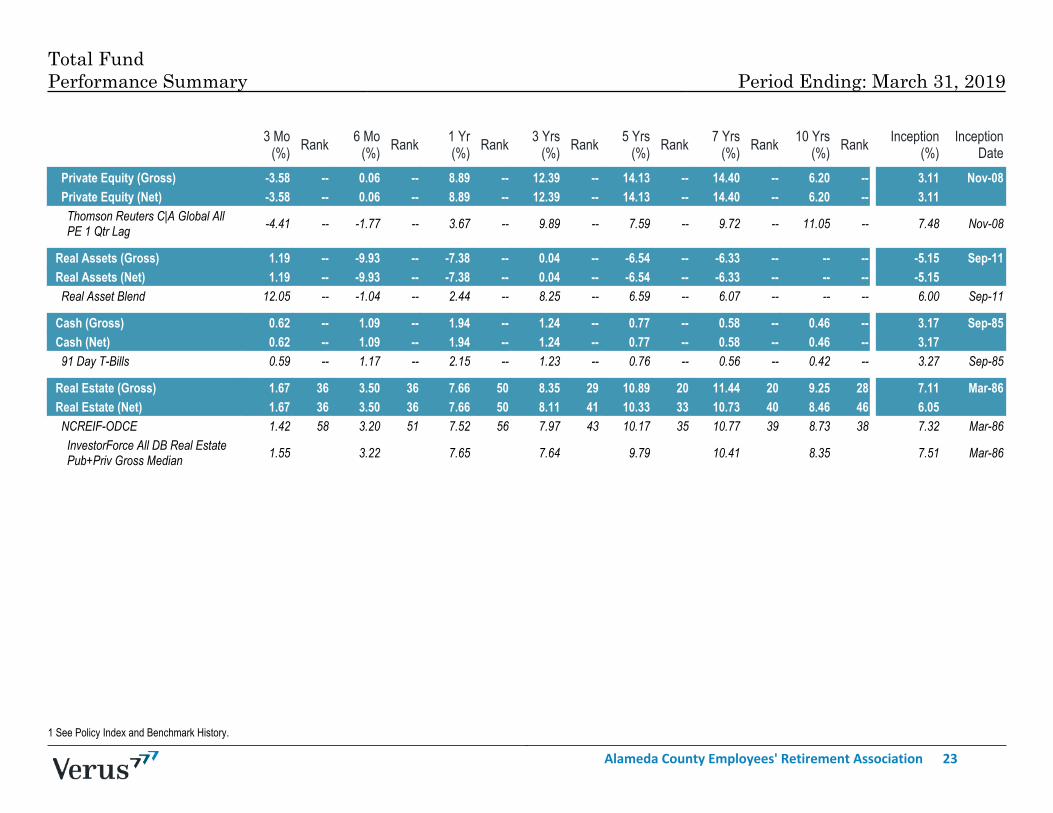
1 See Policy Index and Benchmark History.
Total FundPerformance Summary Period Ending: March 31, 2019
3 Mo(%) Rank 6 Mo
(%) Rank 1 Yr(%) Rank 3 Yrs
(%) Rank 5 Yrs(%) Rank 7 Yrs
(%) Rank 10 Yrs(%) Rank Inception
(%)Inception
Date_
Private Equity (Gross) -3.58 -- 0.06 -- 8.89 -- 12.39 -- 14.13 -- 14.40 -- 6.20 -- 3.11 Nov-08Private Equity (Net) -3.58 -- 0.06 -- 8.89 -- 12.39 -- 14.13 -- 14.40 -- 6.20 -- 3.11Thomson Reuters C|A Global AllPE 1 Qtr Lag -4.41 -- -1.77 -- 3.67 -- 9.89 -- 7.59 -- 9.72 -- 11.05 -- 7.48 Nov-08
Real Assets (Gross) 1.19 -- -9.93 -- -7.38 -- 0.04 -- -6.54 -- -6.33 -- -- -- -5.15 Sep-11Real Assets (Net) 1.19 -- -9.93 -- -7.38 -- 0.04 -- -6.54 -- -6.33 -- -- -- -5.15Real Asset Blend 12.05 -- -1.04 -- 2.44 -- 8.25 -- 6.59 -- 6.07 -- -- -- 6.00 Sep-11
Cash (Gross) 0.62 -- 1.09 -- 1.94 -- 1.24 -- 0.77 -- 0.58 -- 0.46 -- 3.17 Sep-85Cash (Net) 0.62 -- 1.09 -- 1.94 -- 1.24 -- 0.77 -- 0.58 -- 0.46 -- 3.1791 Day T-Bills 0.59 -- 1.17 -- 2.15 -- 1.23 -- 0.76 -- 0.56 -- 0.42 -- 3.27 Sep-85
Real Estate (Gross) 1.67 36 3.50 36 7.66 50 8.35 29 10.89 20 11.44 20 9.25 28 7.11 Mar-86Real Estate (Net) 1.67 36 3.50 36 7.66 50 8.11 41 10.33 33 10.73 40 8.46 46 6.05NCREIF-ODCE 1.42 58 3.20 51 7.52 56 7.97 43 10.17 35 10.77 39 8.73 38 7.32 Mar-86InvestorForce All DB Real EstatePub+Priv Gross Median 1.55 3.22 7.65 7.64 9.79 10.41 8.35 7.51 Mar-86
XXXXX
Alameda County Employees' Retirement Association 23
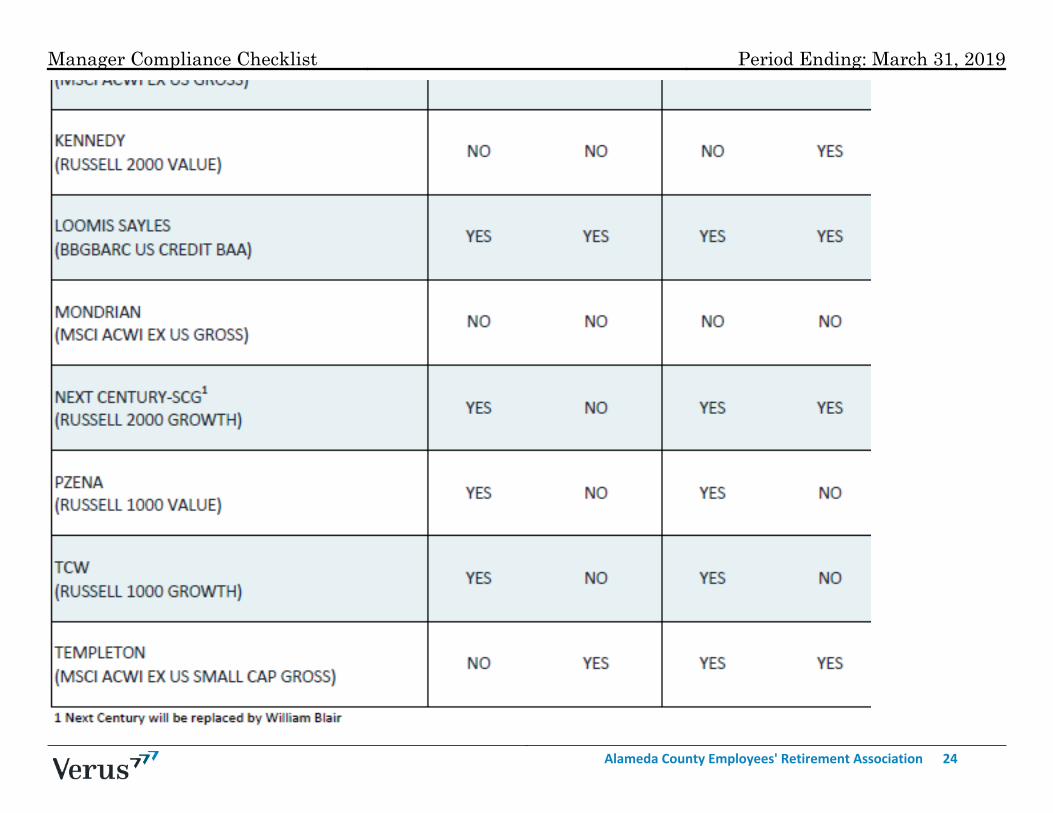
Manager Compliance Checklist Period Ending: March 31, 2019
Alameda County Employees' Retirement Association 24
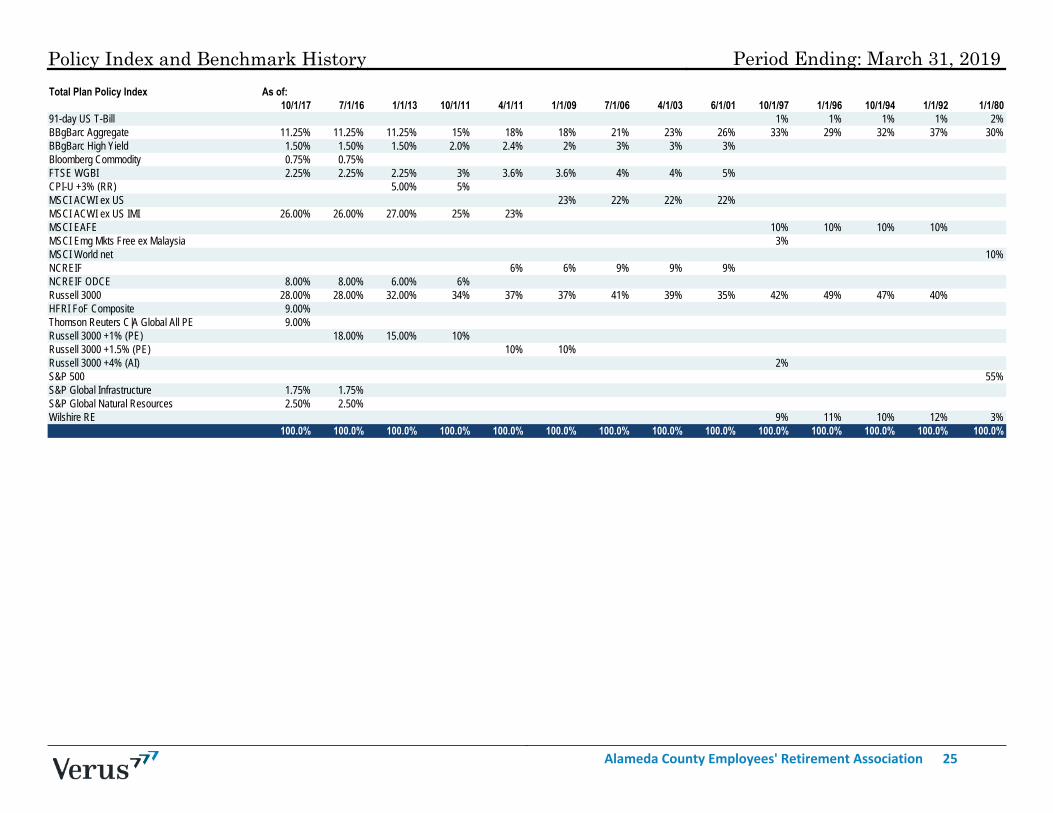
Policy Index and Benchmark History Period Ending: March 31, 2019Total Plan Policy Index As of:
10/1/17 7/1/16 1/1/13 10/1/11 4/1/11 1/1/09 7/1/06 4/1/03 6/1/01 10/1/97 1/1/96 10/1/94 1/1/92 1/1/801% 1% 1% 1% 2%
11.25% 11.25% 11.25% 15% 18% 18% 21% 23% 26% 33% 29% 32% 37% 30%1.50% 1.50% 1.50% 2.0% 2.4% 2% 3% 3% 3%0.75% 0.75%2.25% 2.25% 2.25% 3% 3.6% 3.6% 4% 4% 5%
5.00% 5%23% 22% 22% 22%
26.00% 26.00% 27.00% 25% 23%10% 10% 10% 10%3%
10%6% 6% 9% 9% 9%
8.00% 8.00% 6.00% 6%28.00% 28.00% 32.00% 34% 37% 37% 41% 39% 35% 42% 49% 47% 40%9.00%9.00%
18.00% 15.00% 10%10% 10%
2%55%
1.75% 1.75%2.50% 2.50%
91-day US T-BillBBgBarc AggregateBBgBarc High YieldBloomberg CommodityFTSE WGBICPI-U +3% (RR)MSCI ACWI ex USMSCI ACWI ex US IMIMSCI EAFEMSCI Emg Mkts Free ex MalaysiaMSCI World netNCREIFNCREIF ODCERussell 3000HFRI FoF Composite Thomson Reuters C|A Global All PERussell 3000 +1% (PE)Russell 3000 +1.5% (PE)Russell 3000 +4% (AI)S&P 500S&P Global InfrastructureS&P Global Natural ResourcesWilshire RE 9% 11% 10% 12% 3%
100.0% 100.0% 100.0% 100.0% 100.0% 100.0% 100.0% 100.0% 100.0% 100.0% 100.0% 100.0% 100.0% 100.0%
Alameda County Employees' Retirement Association 25
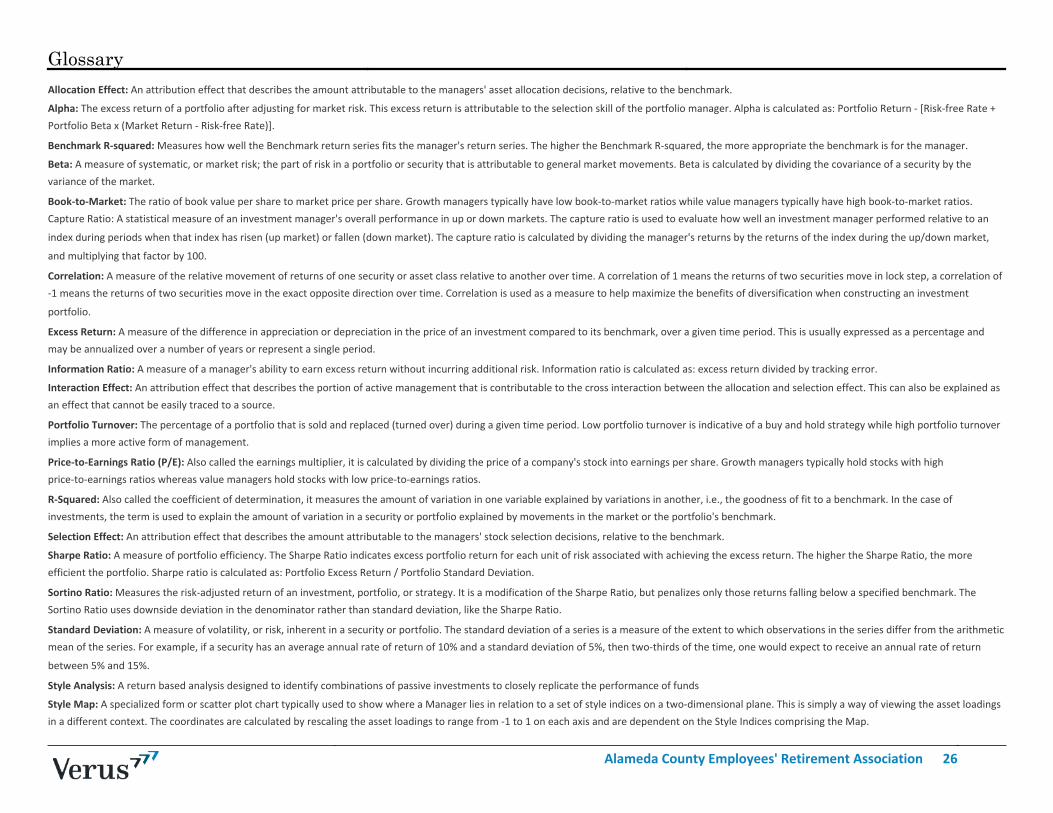
Allocation Effect: An attribution effect that describes the amount attributable to the managers' asset allocation decisions, relative to the benchmark.
Alpha: The excess return of a portfolio after adjusting for market risk. This excess return is attributable to the selection skill of the portfolio manager. Alpha is calculated as: Portfolio Return - [Risk-free Rate +
Portfolio Beta x (Market Return - Risk-free Rate)].
Benchmark R-squared: Measures how well the Benchmark return series fits the manager's return series. The higher the Benchmark R-squared, the more appropriate the benchmark is for the manager.
Beta: A measure of systematic, or market risk; the part of risk in a portfolio or security that is attributable to general market movements. Beta is calculated by dividing the covariance of a security by the
variance of the market.
Book-to-Market: The ratio of book value per share to market price per share. Growth managers typically have low book-to-market ratios while value managers typically have high book-to-market ratios.
Capture Ratio: A statistical measure of an investment manager's overall performance in up or down markets. The capture ratio is used to evaluate how well an investment manager performed relative to an
index during periods when that index has risen (up market) or fallen (down market). The capture ratio is calculated by dividing the manager's returns by the returns of the index during the up/down market,
and multiplying that factor by 100.
Correlation: A measure of the relative movement of returns of one security or asset class relative to another over time. A correlation of 1 means the returns of two securities move in lock step, a correlation of
-1 means the returns of two securities move in the exact opposite direction over time. Correlation is used as a measure to help maximize the benefits of diversification when constructing an investment
portfolio.
Excess Return: A measure of the difference in appreciation or depreciation in the price of an investment compared to its benchmark, over a given time period. This is usually expressed as a percentage and
may be annualized over a number of years or represent a single period.
Information Ratio: A measure of a manager's ability to earn excess return without incurring additional risk. Information ratio is calculated as: excess return divided by tracking error.
Interaction Effect: An attribution effect that describes the portion of active management that is contributable to the cross interaction between the allocation and selection effect. This can also be explained as
an effect that cannot be easily traced to a source.
Portfolio Turnover: The percentage of a portfolio that is sold and replaced (turned over) during a given time period. Low portfolio turnover is indicative of a buy and hold strategy while high portfolio turnover
implies a more active form of management.
Price-to-Earnings Ratio (P/E): Also called the earnings multiplier, it is calculated by dividing the price of a company's stock into earnings per share. Growth managers typically hold stocks with high
price-to-earnings ratios whereas value managers hold stocks with low price-to-earnings ratios.
R-Squared: Also called the coefficient of determination, it measures the amount of variation in one variable explained by variations in another, i.e., the goodness of fit to a benchmark. In the case of
investments, the term is used to explain the amount of variation in a security or portfolio explained by movements in the market or the portfolio's benchmark.
Selection Effect: An attribution effect that describes the amount attributable to the managers' stock selection decisions, relative to the benchmark.
Sharpe Ratio: A measure of portfolio efficiency. The Sharpe Ratio indicates excess portfolio return for each unit of risk associated with achieving the excess return. The higher the Sharpe Ratio, the more
efficient the portfolio. Sharpe ratio is calculated as: Portfolio Excess Return / Portfolio Standard Deviation.
Sortino Ratio: Measures the risk-adjusted return of an investment, portfolio, or strategy. It is a modification of the Sharpe Ratio, but penalizes only those returns falling below a specified benchmark. The
Sortino Ratio uses downside deviation in the denominator rather than standard deviation, like the Sharpe Ratio.
Standard Deviation: A measure of volatility, or risk, inherent in a security or portfolio. The standard deviation of a series is a measure of the extent to which observations in the series differ from the arithmetic
mean of the series. For example, if a security has an average annual rate of return of 10% and a standard deviation of 5%, then two-thirds of the time, one would expect to receive an annual rate of return
between 5% and 15%.
Style Analysis: A return based analysis designed to identify combinations of passive investments to closely replicate the performance of funds
Style Map: A specialized form or scatter plot chart typically used to show where a Manager lies in relation to a set of style indices on a two-dimensional plane. This is simply a way of viewing the asset loadings
in a different context. The coordinates are calculated by rescaling the asset loadings to range from -1 to 1 on each axis and are dependent on the Style Indices comprising the Map.
Glossary
Alameda County Employees' Retirement Association 26
This report contains confidential and proprietary information and is subject to the terms and conditions of the Consulting Agreement. It is being provided for use solely by the customer. The reportmay not be sold or otherwise provided, in whole or in part, to any other person or entity without written permission from Verus Advisory, Inc., (hereinafter Verus) or as required by law or any
regulatory authority. The information presented does not constitute a recommendation by Verus and cannot be used for advertising or sales promotion purposes. This does not constitute an offer
or a solicitation of an offer to buy or sell securities, commodities or any other financial instruments or products.
The information presented has been prepared using data from third party sources that Verus believes to be reliable. While Verus exercised reasonable professional care in preparing the report, itcannot guarantee the accuracy of the information provided by third party sources. Therefore, Verus makes no representations or warranties as to the accuracy of the information presented. Verus
takes no responsibility or liability (including damages) for any error, omission, or inaccuracy in the data supplied by any third party. Nothing contained herein is, or should be relied on as a promise,
representation, or guarantee as to future performance or a particular outcome. Even with portfolio diversification, asset allocation, and a long-term approach, investing involves risk of loss that the
investor should be prepared to bear.
The information presented may be deemed to contain forward-looking information. Examples of forward looking information include, but are not limited to, (a) projections of or statementsregarding return on investment, future earnings, interest income, other income, growth prospects, capital structure and other financial terms, (b) statements of plans or objectives of management,
(c) statements of future economic performance, and (d) statements of assumptions, such as economic conditions underlying other statements. Such forward-looking information can be identified
by the use of forward looking terminology such as believes, expects, may, will, should, anticipates, or the negative of any of the foregoing or other variations thereon comparable terminology, or by
discussion of strategy. No assurance can be given that the future results described by the forward-looking information will be achieved. Such statements are subject to risks, uncertainties, and
other factors which could cause the actual results to differ materially from future results expressed or implied by such forward looking information. The findings, rankings, and opinions expressed
herein are the intellectual property of Verus and are subject to change without notice. The information presented does not claim to be all-inclusive, nor does it contain all information that clients
may desire for their purposes. The information presented should be read in conjunction with any other material provided by Verus, investment managers, and custodians.
Verus will make every reasonable effort to obtain and include accurate market values. However, if managers or custodians are unable to provide the reporting period's market values prior to thereport issuance, Verus may use the last reported market value or make estimates based on the manager's stated or estimated returns and other information available at the time. These estimates
may differ materially from the actual value. Hedge fund market values presented in this report are provided by the fund manager or custodian. Market values presented for private equity
investments reflect the last reported NAV by the custodian or manager net of capital calls and distributions as of the end of the reporting period. These values are estimates and may differ
materially from the investments actual value. Private equity managers report performance using an internal rate of return (IRR), which differs from the time-weighted rate of return (TWRR)
calculation done by Verus. It is inappropriate to compare IRR and TWRR to each other. IRR figures reported in the illiquid alternative pages are provided by the respective managers, and Verus has
not made any attempts to verify these returns. Until a partnership is liquidated (typically over 10-12 years), the IRR is only an interim estimated return. The actual IRR performance of any LP is not
known until the final liquidation.
Verus receives universe data from InvestorForce, eVestment Alliance, and Morningstar. We believe this data to be robust and appropriate for peer comparison. Nevertheless, these universes maynot be comprehensive of all peer investors/managers but rather of the investors/managers that comprise that database. The resulting universe composition is not static and will change over time.
Returns are annualized when they cover more than one year. Investment managers may revise their data after report distribution. Verus will make the appropriate correction to the client account
but may or may not disclose the change to the client based on the materiality of the change.
Disclaimer
Alameda County Employees' Retirement Association 27
PERIOD ENDING: MARCH 31, 2019
Absolute Return Performance ReportAlameda County Employees’ Retirement Association
VERUSINVESTMENTS.COM
SEATTLE 206‐622‐3700LOS ANGELES 310‐297‐1777
SAN FRANCISCO 415‐362‐3484
Past performance is no guarantee of future results. This document is provided for informational purposes only and is directed to institutional clients and eligible institutionalcounterparties only and is not intended for retail investors. Nothing herein constitutes investment, legal, accounting or tax advice, or a recommendation to buy, sell or hold a security or pursue a particular investment vehicle or any trading strategy. This document may include or imply estimates, outlooks, projections and other “forward‐looking statements.” No assurance can be given that future results described or implied by any forward looking information will be achieved. Investing entails risks, including possible loss of principal. Verus Advisory Inc. and Verus Investors, LLC (“Verus”) file a single form ADV under the United States Investment Advisors Act of 1940, as amended. Additional information about Verus Advisory, Inc. and Verus Investors, LLC is available on the SEC’s website at www.adviserinfo.sec.gov. Verus – also known as Verus Advisory™ or Verus Investors™.
Table of Contents
2018 Hedge Fund Environment
PAGE 3
ACERA Performance PAGE 9
Appendix PAGE 14
2
Hedge Fund Environment
March 31, 2019ACERA 3
Markets volatile, rates back to 2017 levels
Our hedge fund outlook combines our views of macroeconomic, geopolitical, and capital market conditions along with hedge fund industry metrics and trends across the strategy set. Key observations include:
― Trade tensions ‐ Markets move day to day on trade deal rumors between the U.S. and China as escalations continued, diminishing expectations of any imminent resolution.
― Synchronized growth no longer ‐ Reversing from 2017 and early 2018, global growth has softened amid continued economic and political uncertainty around the world. Central bank policy expectations has followed this softening with markets expecting rate cuts, rather than continued hiking, from the Fed in 2019 and beyond.
― Factor struggles drive alt risk premia underperformance – Value, Momentum, and Trend continue to drive underperformance of the alternative beta universe relative to both expectations and the broader hedge fund universe. Hedge funds have been able to outperform equity markets over the six month period of Q418/Q119, taking advantage of the significant market swings during that time.
March 31, 2019ACERA
Outlook
4
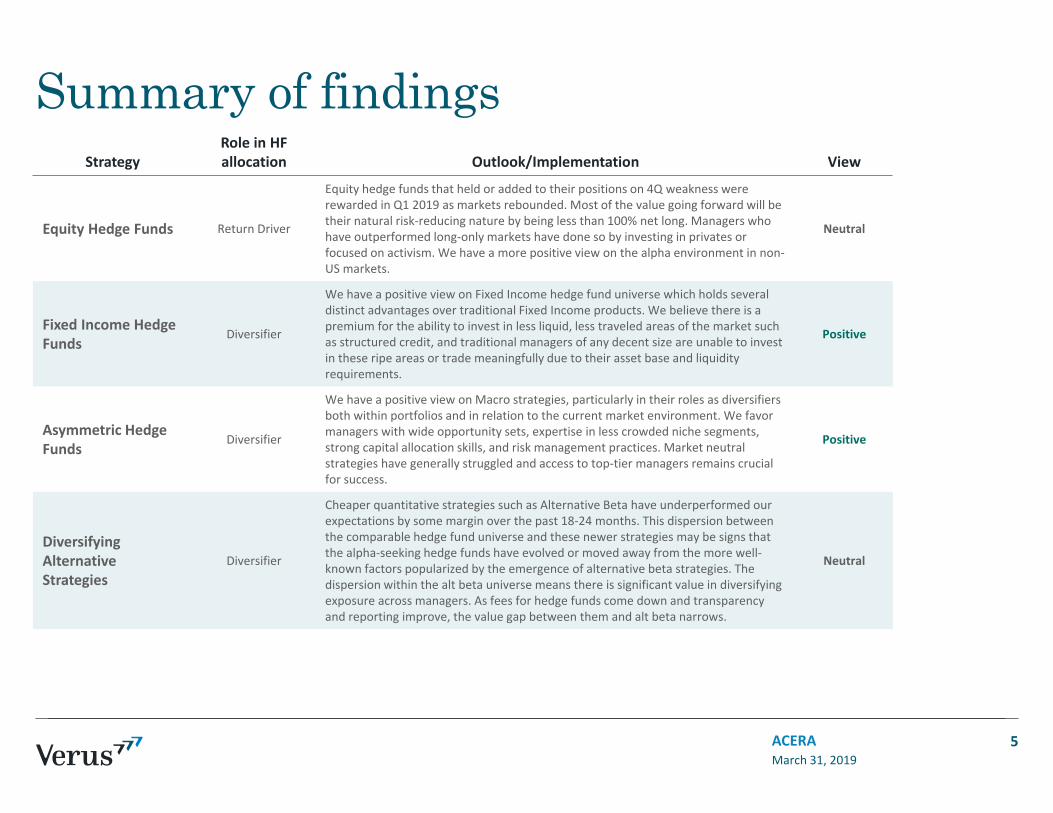
Summary of findings
March 31, 2019ACERA 5
StrategyRole in HF allocation Outlook/Implementation View
Equity Hedge Funds Return Driver
Equity hedge funds that held or added to their positions on 4Q weakness were rewarded in Q1 2019 as markets rebounded. Most of the value going forward will be their natural risk‐reducing nature by being less than 100% net long. Managers who have outperformed long‐only markets have done so by investing in privates or focused on activism. We have a more positive view on the alpha environment in non‐US markets.
Neutral
Fixed Income Hedge Funds
Diversifier
We have a positive view on Fixed Income hedge fund universe which holds several distinct advantages over traditional Fixed Income products. We believe there is a premium for the ability to invest in less liquid, less traveled areas of the market such as structured credit, and traditional managers of any decent size are unable to invest in these ripe areas or trade meaningfully due to their asset base and liquidity requirements.
Positive
Asymmetric Hedge Funds
Diversifier
We have a positive view on Macro strategies, particularly in their roles as diversifiers both within portfolios and in relation to the current market environment. We favor managers with wide opportunity sets, expertise in less crowded niche segments, strong capital allocation skills, and risk management practices. Market neutral strategies have generally struggled and access to top‐tier managers remains crucial for success.
Positive
Diversifying Alternative Strategies
Diversifier
Cheaper quantitative strategies such as Alternative Beta have underperformed our expectations by some margin over the past 18‐24 months. This dispersion between the comparable hedge fund universe and these newer strategies may be signs that the alpha‐seeking hedge funds have evolved or moved away from the more well‐known factors popularized by the emergence of alternative beta strategies. The dispersion within the alt beta universe means there is significant value in diversifying exposure across managers. As fees for hedge funds come down and transparency and reporting improve, the value gap between them and alt beta narrows.
Neutral
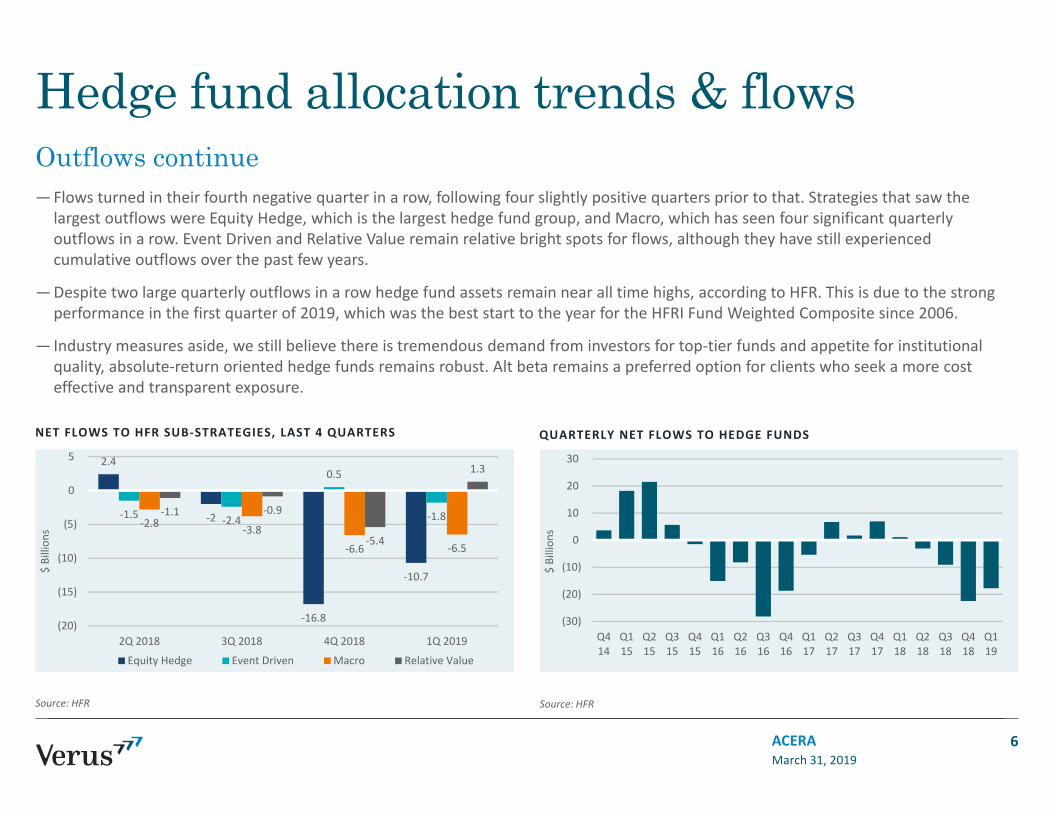
2.4
‐2
‐16.8
‐10.7
‐1.5 ‐2.4
0.5
‐1.8‐2.8 ‐3.8
‐6.6 ‐6.5
‐1.1 ‐0.9
‐5.4
1.3
(20)
(15)
(10)
(5)
0
5
2Q 2018 3Q 2018 4Q 2018 1Q 2019
$ Billion
s
Equity Hedge Event Driven Macro Relative Value
(30)
(20)
(10)
0
10
20
30
Q119
Q418
Q318
Q218
Q118
Q417
Q317
Q217
Q117
Q416
Q316
Q216
Q116
Q415
Q315
Q215
Q115
Q414
$ Billion
s
NET FLOWS TO HFR SUB‐STRATEGIES, LAST 4 QUARTERS
Hedge fund allocation trends & flows
—Flows turned in their fourth negative quarter in a row, following four slightly positive quarters prior to that. Strategies that saw the largest outflows were Equity Hedge, which is the largest hedge fund group, and Macro, which has seen four significant quarterly outflows in a row. Event Driven and Relative Value remain relative bright spots for flows, although they have still experienced cumulative outflows over the past few years.
—Despite two large quarterly outflows in a row hedge fund assets remain near all time highs, according to HFR. This is due to the strong performance in the first quarter of 2019, which was the best start to the year for the HFRI Fund Weighted Composite since 2006.
— Industry measures aside, we still believe there is tremendous demand from investors for top‐tier funds and appetite for institutional quality, absolute‐return oriented hedge funds remains robust. Alt beta remains a preferred option for clients who seek a more cost effective and transparent exposure.
March 31, 2019ACERA
QUARTERLY NET FLOWS TO HEDGE FUNDS
Source: HFR
6
Source: HFR
Outflows continue
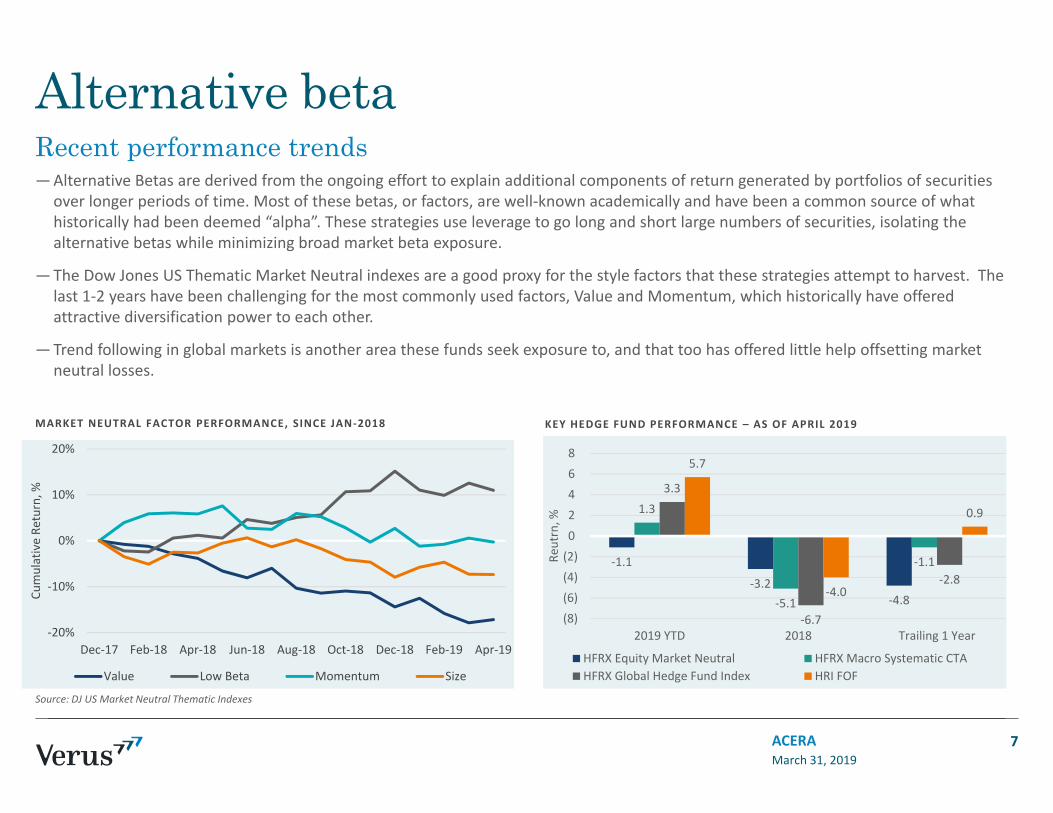
Alternative beta—Alternative Betas are derived from the ongoing effort to explain additional components of return generated by portfolios of securities
over longer periods of time. Most of these betas, or factors, are well‐known academically and have been a common source of what historically had been deemed “alpha”. These strategies use leverage to go long and short large numbers of securities, isolating the alternative betas while minimizing broad market beta exposure.
—The Dow Jones US Thematic Market Neutral indexes are a good proxy for the style factors that these strategies attempt to harvest. The last 1‐2 years have been challenging for the most commonly used factors, Value and Momentum, which historically have offered attractive diversification power to each other.
—Trend following in global markets is another area these funds seek exposure to, and that too has offered little help offsetting market neutral losses.
March 31, 2019ACERA
Source: DJ US Market Neutral Thematic Indexes
7
Recent performance trends
‐20%
‐10%
0%
10%
20%
Dec‐17 Feb‐18 Apr‐18 Jun‐18 Aug‐18 Oct‐18 Dec‐18 Feb‐19 Apr‐19
Cumulative Re
turn, %
Value Low Beta Momentum Size
‐1.1
‐3.2‐4.8
1.3
‐5.1
‐1.1
3.3
‐6.7
‐2.8
5.7
‐4.0
0.9
(8)(6)(4)(2)02468
2019 YTD 2018 Trailing 1 Year
Reutrn, %
HFRX Equity Market Neutral HFRX Macro Systematic CTAHFRX Global Hedge Fund Index HRI FOF
MARKET NEUTRAL FACTOR PERFORMANCE, SINCE JAN‐2018 KEY HEDGE FUND PERFORMANCE – AS OF APRIL 2019
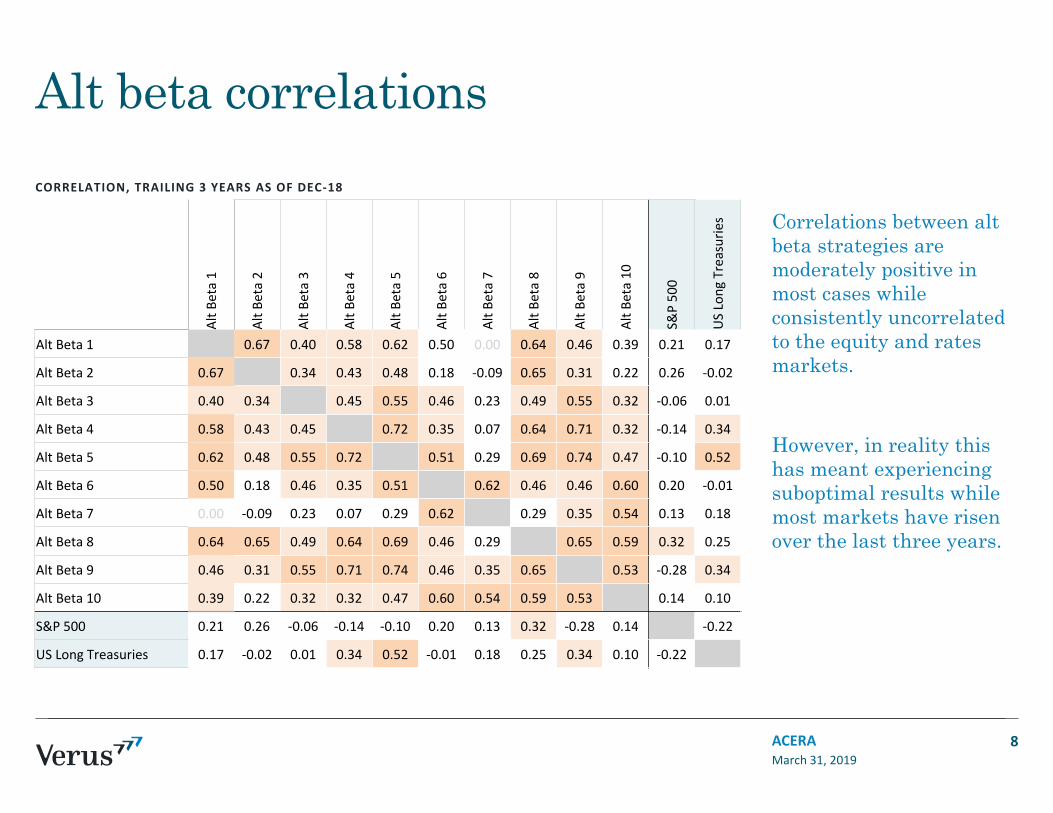
CORRELATION, TRAILING 3 YEARS AS OF DEC‐18
Alt beta correlations
March 31, 2019ACERA
Correlations between alt beta strategies are moderately positive in most cases while consistently uncorrelated to the equity and rates markets.
However, in reality this has meant experiencing suboptimal results while most markets have risen over the last three years.
8
Alt B
eta 1
Alt B
eta 2
Alt B
eta 3
Alt B
eta 4
Alt B
eta 5
Alt B
eta 6
Alt B
eta 7
Alt B
eta 8
Alt B
eta 9
Alt B
eta 10
S&P 50
0
US Long
Treasuries
Alt Beta 1 1.00 0.67 0.40 0.58 0.62 0.50 0.00 0.64 0.46 0.39 0.21 0.17
Alt Beta 2 0.67 1.00 0.34 0.43 0.48 0.18 ‐0.09 0.65 0.31 0.22 0.26 ‐0.02
Alt Beta 3 0.40 0.34 1.00 0.45 0.55 0.46 0.23 0.49 0.55 0.32 ‐0.06 0.01
Alt Beta 4 0.58 0.43 0.45 1.00 0.72 0.35 0.07 0.64 0.71 0.32 ‐0.14 0.34
Alt Beta 5 0.62 0.48 0.55 0.72 1.00 0.51 0.29 0.69 0.74 0.47 ‐0.10 0.52
Alt Beta 6 0.50 0.18 0.46 0.35 0.51 1.00 0.62 0.46 0.46 0.60 0.20 ‐0.01
Alt Beta 7 0.00 ‐0.09 0.23 0.07 0.29 0.62 1.00 0.29 0.35 0.54 0.13 0.18
Alt Beta 8 0.64 0.65 0.49 0.64 0.69 0.46 0.29 1.00 0.65 0.59 0.32 0.25
Alt Beta 9 0.46 0.31 0.55 0.71 0.74 0.46 0.35 0.65 1.00 0.53 ‐0.28 0.34
Alt Beta 10 0.39 0.22 0.32 0.32 0.47 0.60 0.54 0.59 0.53 1.00 0.14 0.10
S&P 500 0.21 0.26 ‐0.06 ‐0.14 ‐0.10 0.20 0.13 0.32 ‐0.28 0.14 1.00 ‐0.22
US Long Treasuries 0.17 ‐0.02 0.01 0.34 0.52 ‐0.01 0.18 0.25 0.34 0.10 ‐0.22 1.00
ACERA Performance
March 31, 2019ACERA 9
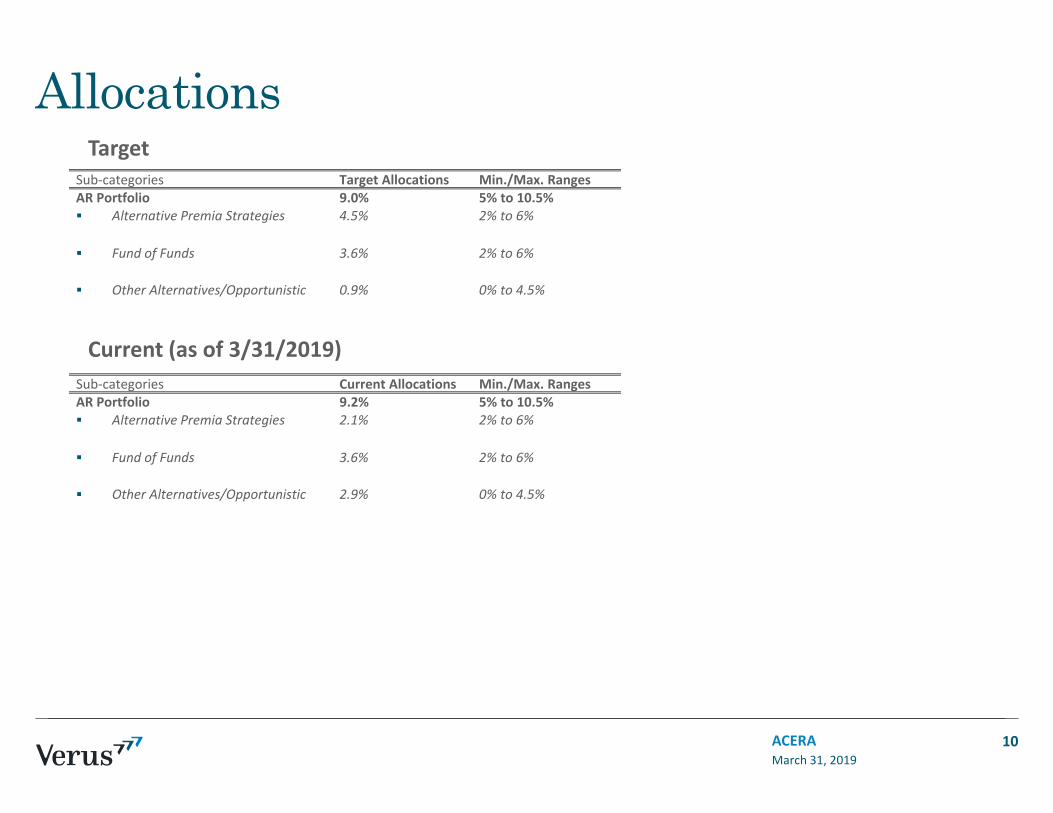
AllocationsSub‐categories Target Allocations Min./Max. RangesAR Portfolio 9.0% 5% to 10.5% Alternative Premia Strategies
Fund of Funds
4.5%
3.6%
2% to 6%
2% to 6%
Other Alternatives/Opportunistic 0.9% 0% to 4.5%
March 31, 2019ACERA 10
Target
Current (as of 3/31/2019)Sub‐categories Current Allocations Min./Max. RangesAR Portfolio 9.2% 5% to 10.5% Alternative Premia Strategies
Fund of Funds
2.1%
3.6%
2% to 6%
2% to 6%
Other Alternatives/Opportunistic 2.9% 0% to 4.5%
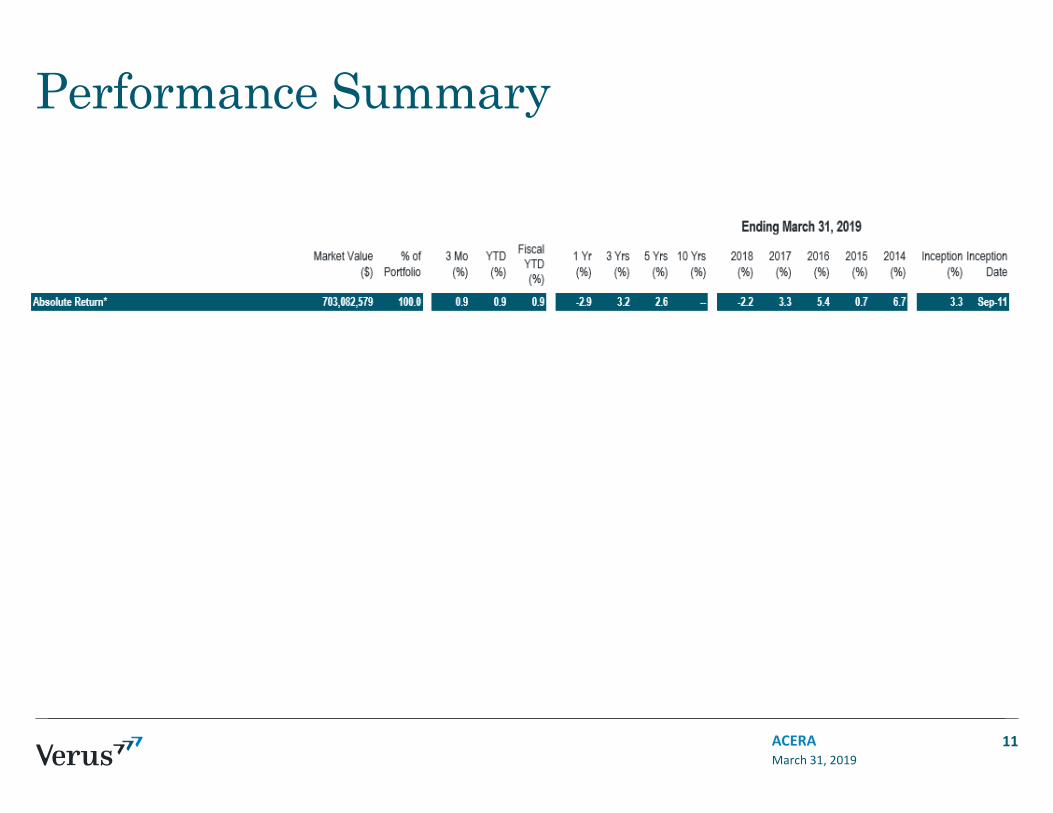
Performance Summary
March 31, 2019ACERA 11
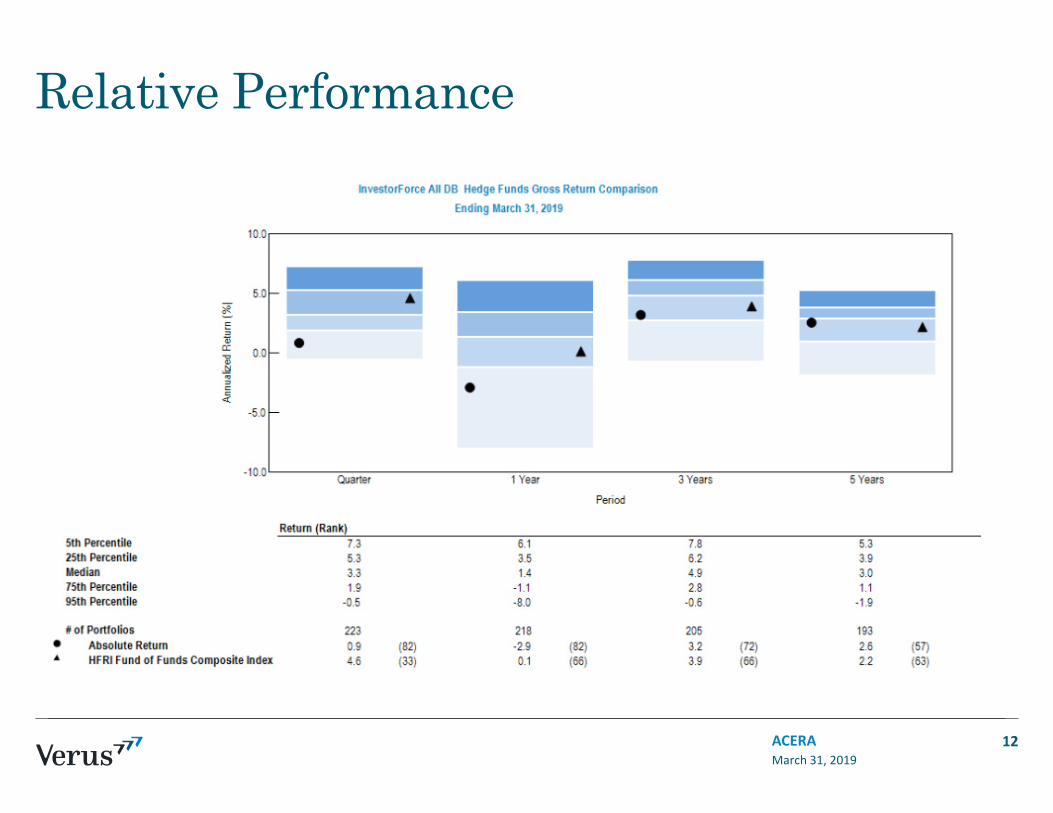
Relative Performance
March 31, 2019ACERA 12
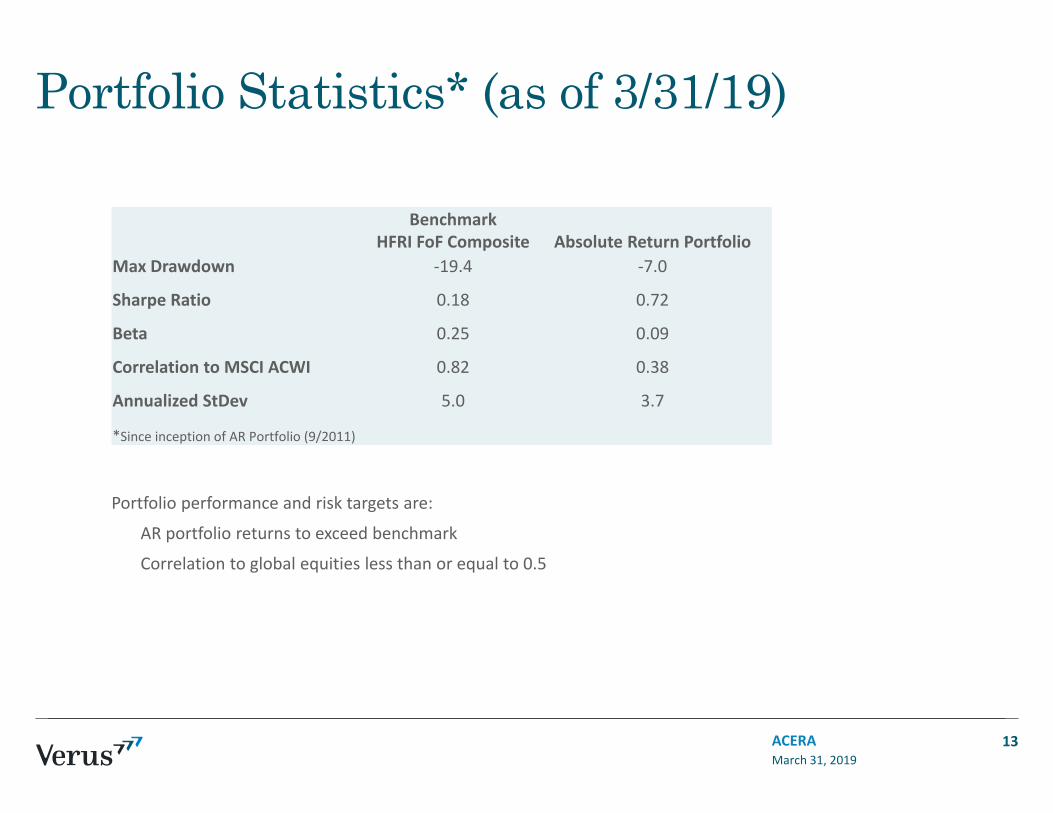
Portfolio Statistics* (as of 3/31/19)
BenchmarkHFRI FoF Composite Absolute Return Portfolio
Max Drawdown ‐19.4 ‐7.0
Sharpe Ratio 0.18 0.72
Beta 0.25 0.09
Correlation to MSCI ACWI 0.82 0.38
Annualized StDev 5.0 3.7
*Since inception of AR Portfolio (9/2011)
March 31, 2019ACERA 13
Portfolio performance and risk targets are:
AR portfolio returns to exceed benchmark
Correlation to global equities less than or equal to 0.5
Appendix
March 31, 2019ACERA 14
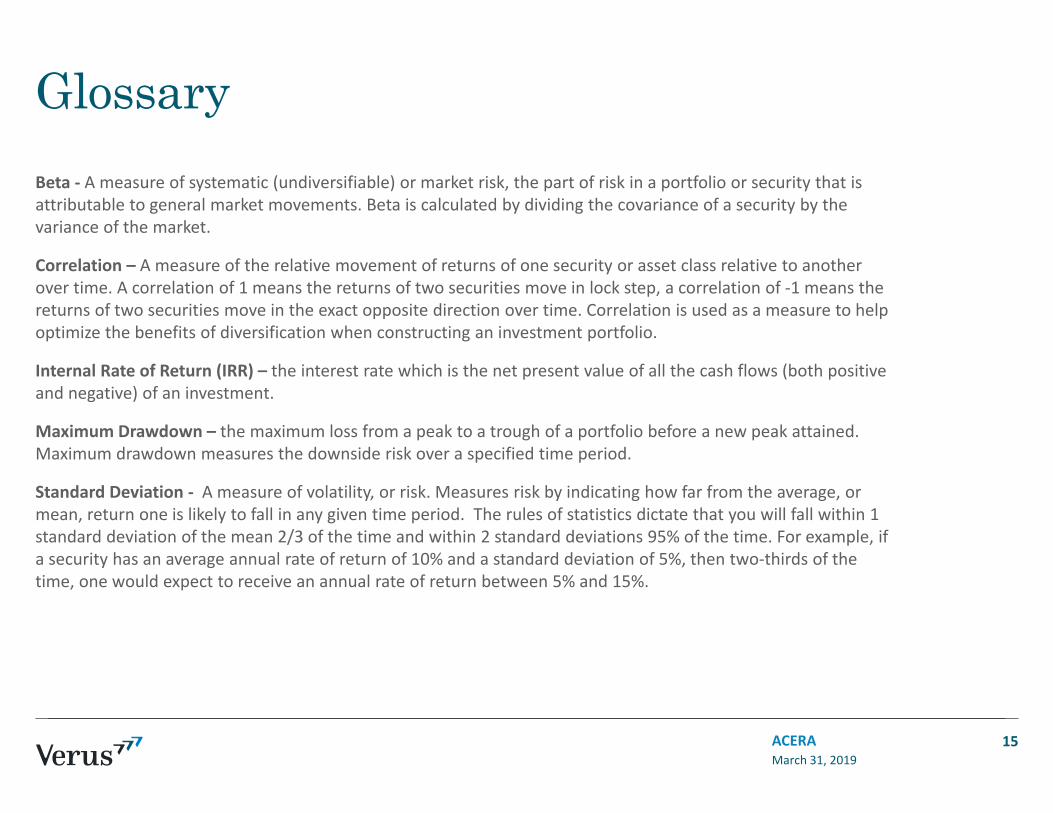
GlossaryBeta ‐ A measure of systematic (undiversifiable) or market risk, the part of risk in a portfolio or security that is attributable to general market movements. Beta is calculated by dividing the covariance of a security by the variance of the market.
Correlation – A measure of the relative movement of returns of one security or asset class relative to another over time. A correlation of 1 means the returns of two securities move in lock step, a correlation of ‐1 means the returns of two securities move in the exact opposite direction over time. Correlation is used as a measure to help optimize the benefits of diversification when constructing an investment portfolio.
Internal Rate of Return (IRR) – the interest rate which is the net present value of all the cash flows (both positive and negative) of an investment.
Maximum Drawdown – the maximum loss from a peak to a trough of a portfolio before a new peak attained. Maximum drawdown measures the downside risk over a specified time period.
Standard Deviation ‐ A measure of volatility, or risk. Measures risk by indicating how far from the average, or mean, return one is likely to fall in any given time period. The rules of statistics dictate that you will fall within 1 standard deviation of the mean 2/3 of the time and within 2 standard deviations 95% of the time. For example, if a security has an average annual rate of return of 10% and a standard deviation of 5%, then two‐thirds of the time, one would expect to receive an annual rate of return between 5% and 15%.
March 31, 2019ACERA 15
GlossarySharpe Ratio ‐ A measure of that explains the return of an investment compared to its risk. The Sharpe Ratio indicates excess portfolio return for each unit of risk over the risk free rate (usually short‐term Treasuries or LIBOR) per unit of volatility. The higher the Sharpe Ratio, the greater its risk‐adjusted return.
Time Weighted Return – A measure of the compound rate of growth in a portfolio, which eliminates the distorting effects of growth rates created by inflows and outflows of money.
March 31, 2019ACERA 16

PERIOD ENDING: DECEMBER 31, 2018
Private Equity Performance ReviewAlameda County Employees’ Retirement Association
VERUSINVESTMENTS.COM
SEATTLE 206‐622‐3700LOS ANGELES 310‐297‐1777
SAN FRANCISCO 415‐362‐3484
Past performance is no guarantee of future results. This document is provided for informational purposes only and is directed to institutional clients and eligible institutional counterparties only and is not intended for retail investors. Nothing herein constitutes investment, legal, accounting or tax advice, or a recommendation to buy, sell or hold a security or pursue a particular investment vehicle or any trading strategy. This document may include or imply estimates, outlooks, projections and other “forward‐looking statements.” No assurance can be given that future results described or implied by any forward looking information will be achieved. Investing entails risks, including possible loss of principal. Verus Advisory Inc. and Verus Investors, LLC (“Verus”) file a single form ADV under the United States Investment Advisors Act of 1940, as amended.
Table of Contents
2
Market Commentary 3
Private Equity Strategies― Portfolio Overview― Portfolio Summary― Portfolio Activity
7
Private Equity Portfolio Performance
8
Private Equity Portfolio Diversification― PE Portfolio Diversification by Strategy― PE Portfolio Diversification by Geography― PE Portfolio Diversification by Industry― PE Portfolio Diversification by Vintage Year
10
Significant Events / Material Exceptions to Policy
14
Market Commentary
ACERA 3June 2019
Period Ending: December 31, 2018
DEBT RELATED
— HY and leveraged/syndicated loan issuance were down. In 2018, US high yield issuance of $168 billion1, the lowest issuance total since 2009, was down 40.2% versus 2019. The institutional issuance of $730 billion1, 21% off 2017’s record level.
— Spreads loosed across the board except for CCC index. US HY Credit Index loosed by 166 bps or 44.5%2 versus the same period last year. Except for CCC index tightened by 44bps, a 3.6%2 decrease versus 2H 2017, BB, B loosed by 146 bps and 140 bps respectively, a 54.5%2 and 32.7%2 increase versus the same period last year.
— Slight increase in LBO debt, but improvement in interest coverage. US total leverage (Debt / EBITDA) for 2018 at 5.8x3 up 1.4% from the same time last year. Interest coverage ratio (EBITDA / Cash Interest) ended Q4’18 at 2.7x3, down 6.2% from 3.1x3 at the end of 2017.
GLOBAL
— Investment activity up. During 2018, PE firms globally invested in $729.6 billion6&13 worth of deals,5.9% from the same time prior year and closed on 19,995 transactions6&13, up 6.5% from 2017.
— Mixed movement of purchase price multiples by region. As of December 31, 2018, global median purchase price multiples (Enterprise Value / EBITDA) was 10.8x1, a 1.8% decrease from the same time last year. This was driven by a 0.1% decrease in US purchase multiples at 10.6x7, a 15.8% increase in purchase price multiples in Europe at 11.5x11 , and a 17.5% decrease in the rest of the world at 9.2x11.
— Increase in dry powder in all regions, slightly down in the rest of world. For 2018, global total PE dry powder was at $1.36 trillion4, up (14.9%) from end of 2017. Total PE dry powder was: up in the US 14.4% to $735.9 billion4; up in Europe by 15.7% to $281.3 billion4; up in Asia by 18.1% to $302.2 billion4; and down the rest of world by 1.8% to $43.2 billion4 .
US BUYOUTS
— Fundraising down significantly. In 2018, US buyout firms raised $123.2 billion5, down by 30.2% from same time prior year. Both the number of funds closed and average fund size decreased from 1H 2017 to 1H 2018, 1175 to 1125 and $1.51 billion5 to $1.1 billion5 , respectively.
— Slight decline in LBO price multiples. As of December 31, 2018, US LBO purchase price multiples (Enterprise Value / EBITDA) were at 10.6x7 , a ‐0.1% decrease from 2017.
Market Commentary
ACERA 4June 2019
Period Ending: December 31, 2018
— Investment activity up. During 2018, US buyout firms invested in $264.0 billion6 worth of deals, up 50.9% from the same time last year and closed on 2,787 transactions6, up 22.0% versus the same time in 2017. Keurig Dr Pepper, Inc. ($21.0 billion6), Refinitiv ($17.0 billion6), and Johnson Controls’ Power Solutions business ($13.2 billion6) contributed to the increase in capital deployed.
— Dry powder up. For 2018, US buyout dry powder was $402.4 billion4, up by 12.2% from the same time in 2017.
— Exits activity strong. In 2018, US buyout firms exited 928 companies6, representing $178.4 billion6 in total transaction value. This represented a 19.3% increase in the number of exits and a 26.1% increase in total transaction value compared to the same time last year.
US VENTURE CAPITAL
— Fundraising increased. US VC firms raised $41.5 billion5 during 2018, a 37.6% increase from the same period last year. 342 funds5 closed in 2018, a 54.1% increase from the same period last year. The average US VC fund size decreased by 10.7% at $121.4 million5 versus the same period last year.
— Dry powder up. As of Q4 2018, US VC dry powder was at $110.8 billion4, up 10.7% from the last year.
— Investment activity up sharply from last year. US VC firms deployed $113.0 billion12 in capital during 2018, a 47.2% increase from 2017. The number of rounds closed at 5,51012, a 28.1% increase from the same time last year. The average investment per deal increased 15% from last year, to $20.6 million12.
— All stages valuations were up. Compared to 2017, the average pre‐money valuations increased across all stages in 2018: up 16.7% at $7.0 million8 for Seed stage, 29.0% at $20.0 million8 for Series A, 37.9% at $55.5 million for Series B, 36.9% at $115.0 million8 for Series C, and 45.4% at $325.0 million8 for Series D. Over the past 3 years, the average pre‐money valuations of Seed stage, Series A, Series B, Series C and Series D investments were up 40.0%, 56.6%, 44.9%, 64.3% and 95.6%, respectively9.
— Exit activity up. US VC firms exited 662 companies12 in 2018, down by 2.1% from the same period last year, representing $87.6 billion12 in transaction value, up 69.4% from the same period 2017.
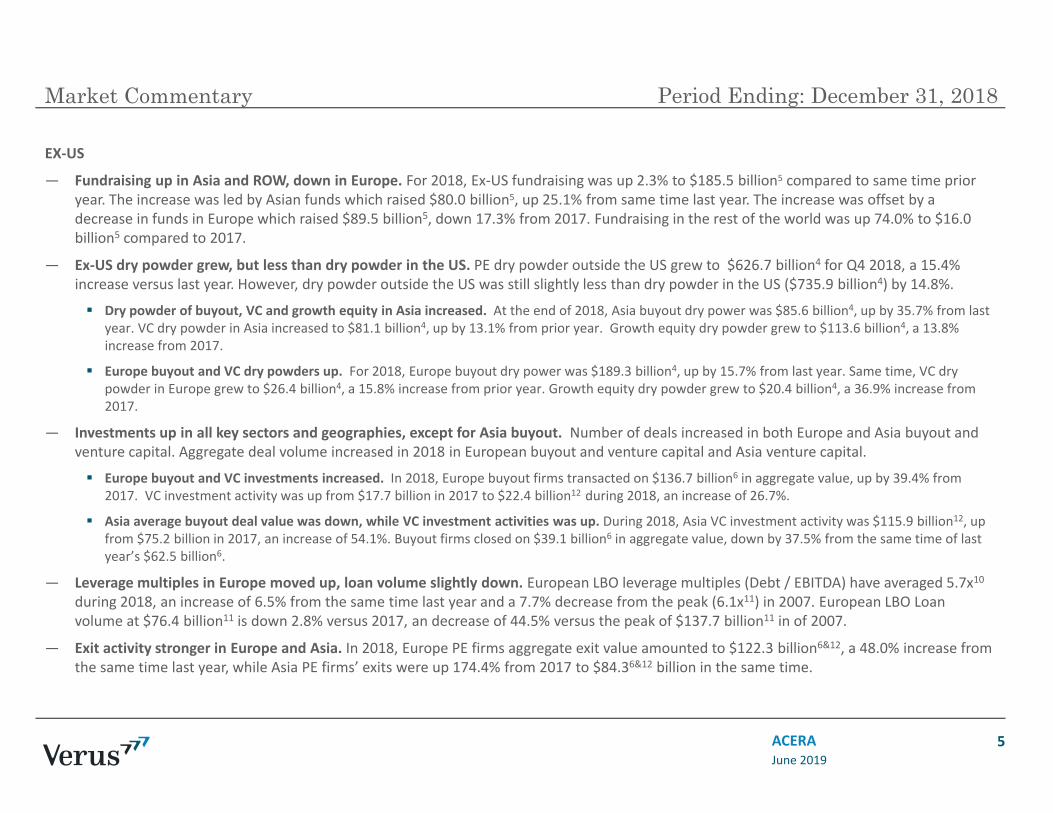
Market Commentary
ACERA 5June 2019
Period Ending: December 31, 2018
EX‐US
— Fundraising up in Asia and ROW, down in Europe. For 2018, Ex‐US fundraising was up 2.3% to $185.5 billion5 compared to same time prior year. The increase was led by Asian funds which raised $80.0 billion5, up 25.1% from same time last year. The increase was offset by a decrease in funds in Europe which raised $89.5 billion5, down 17.3% from 2017. Fundraising in the rest of the world was up 74.0% to $16.0 billion5 compared to 2017.
— Ex‐US dry powder grew, but less than dry powder in the US. PE dry powder outside the US grew to $626.7 billion4 for Q4 2018, a 15.4% increase versus last year. However, dry powder outside the US was still slightly less than dry powder in the US ($735.9 billion4) by 14.8%.
Dry powder of buyout, VC and growth equity in Asia increased. At the end of 2018, Asia buyout dry power was $85.6 billion4, up by 35.7% from last year. VC dry powder in Asia increased to $81.1 billion4, up by 13.1% from prior year. Growth equity dry powder grew to $113.6 billion4, a 13.8% increase from 2017.
Europe buyout and VC dry powders up. For 2018, Europe buyout dry power was $189.3 billion4, up by 15.7% from last year. Same time, VC dry powder in Europe grew to $26.4 billion4, a 15.8% increase from prior year. Growth equity dry powder grew to $20.4 billion4, a 36.9% increase from 2017.
— Investments up in all key sectors and geographies, except for Asia buyout. Number of deals increased in both Europe and Asia buyout and venture capital. Aggregate deal volume increased in 2018 in European buyout and venture capital and Asia venture capital.
Europe buyout and VC investments increased. In 2018, Europe buyout firms transacted on $136.7 billion6 in aggregate value, up by 39.4% from 2017. VC investment activity was up from $17.7 billion in 2017 to $22.4 billion12 during 2018, an increase of 26.7%.
Asia average buyout deal value was down, while VC investment activities was up. During 2018, Asia VC investment activity was $115.9 billion12, up from $75.2 billion in 2017, an increase of 54.1%. Buyout firms closed on $39.1 billion6 in aggregate value, down by 37.5% from the same time of last year’s $62.5 billion6.
— Leverage multiples in Europe moved up, loan volume slightly down. European LBO leverage multiples (Debt / EBITDA) have averaged 5.7x10during 2018, an increase of 6.5% from the same time last year and a 7.7% decrease from the peak (6.1x11) in 2007. European LBO Loan volume at $76.4 billion11 is down 2.8% versus 2017, an decrease of 44.5% versus the peak of $137.7 billion11 in of 2007.
— Exit activity stronger in Europe and Asia. In 2018, Europe PE firms aggregate exit value amounted to $122.3 billion6&12, a 48.0% increase from the same time last year, while Asia PE firms’ exits were up 174.4% from 2017 to $84.36&12 billion in the same time.
ACERA 6
Market Commentary
June 2019
Period Ending: December 31, 2018
Outlook
— Momentum of increase in PE allocations plateaus. A recent survey of institutional investors conducted on December 31, 2018 indicated that 46%13 intend to increase their allocation for private equity compared to 53%13 during the same period last year. 49%13 intend to maintain their allocation for private equity compared to 43%13 during the same period last year.
— Institutional investors most interested in investing in North America and like small‐ to mid‐market buyouts. Based on the survey conducted on December 31, 2018, Institutional investors view US as the most attractive location to invest in the current economic climate with 67%13
(versus Western Europe 49%13) choosing it as their preferred developed markets investment destination, and with 49%13 choosing China (versus India 30%13) as their preferred emerging markets investment destination. In the same survey, 54%13 of institutional investors also cited the small to mid‐market buyout strategy as presenting the best opportunities in the current financial climate. venture capital strategy was mentioned next with 46%13 of institutional investors believing it presented the best opportunities.
Notes
1. Leveraged Loan Monthly Refinitiv LPC2. Guggenheim High‐Yield Bank Loan Outlook3. LCD’s Leveraged Buyout Review4. Preqin Dry powder by Geography (Preqin Website) Dry powder includes Buyout, Distressed PE, Growth, Mezzanine, Co‐investments, Balanced, and Venture Strategies.5. Preqin Private Equity Fundraising6. Preqin Private Equity‐Backed Buyout Deals and Exits7. US LBO Review8. PitchBook‐NVCA Venture Monitor9. PitchBook’s VC Valuations10. LCD European Leveraged Buyout Review11. European Leveraged Lending Review
a. Ex US Multiples were estimated utilizing a number of sources including Preqin Private Equity‐Backed Buyout Deals and Exits Factsheet, LCD’s Leveragedb. Buyout Review, Europe Leverage Lending Review and Leveraged Loan Monthly Refinitiv LPC.
12. Preqin Venture Capital Deals and Exits13. Preqin Investor Outlook: Alternative Assets
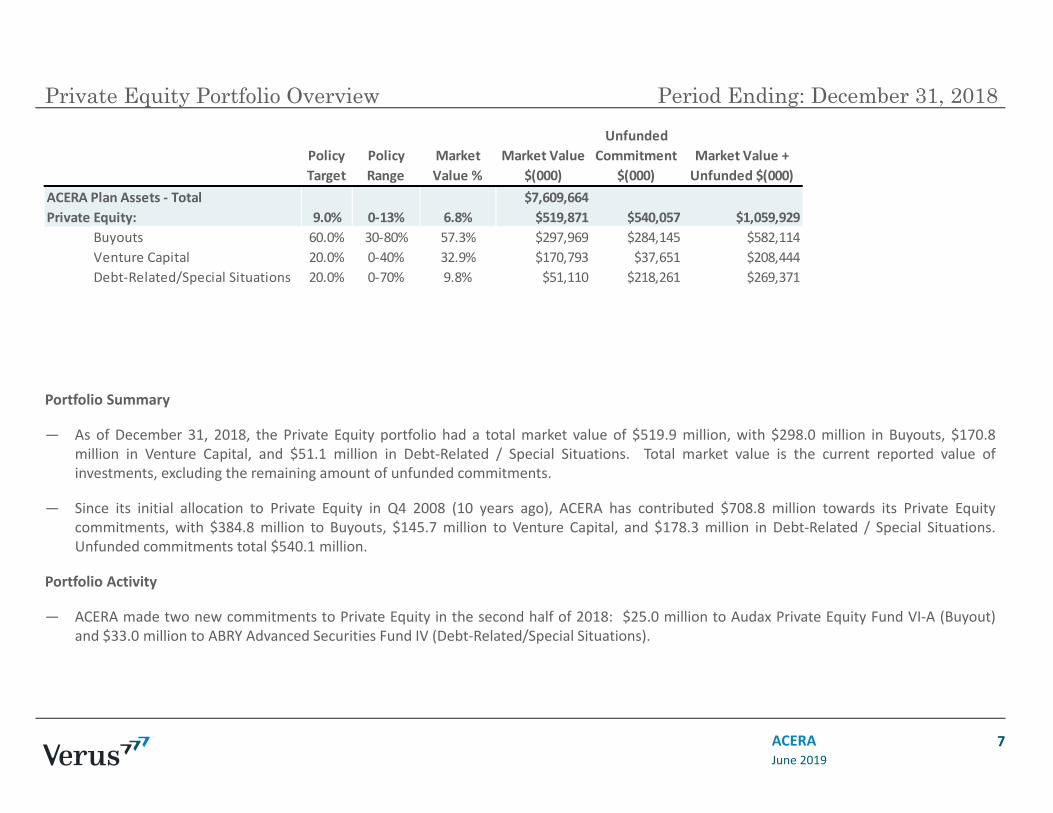
ACERA 7
Private Equity Portfolio Overview
Portfolio Summary
— As of December 31, 2018, the Private Equity portfolio had a total market value of $519.9 million, with $298.0 million in Buyouts, $170.8million in Venture Capital, and $51.1 million in Debt‐Related / Special Situations. Total market value is the current reported value ofinvestments, excluding the remaining amount of unfunded commitments.
— Since its initial allocation to Private Equity in Q4 2008 (10 years ago), ACERA has contributed $708.8 million towards its Private Equitycommitments, with $384.8 million to Buyouts, $145.7 million to Venture Capital, and $178.3 million in Debt‐Related / Special Situations.Unfunded commitments total $540.1 million.
Portfolio Activity
— ACERA made two new commitments to Private Equity in the second half of 2018: $25.0 million to Audax Private Equity Fund VI‐A (Buyout)and $33.0 million to ABRY Advanced Securities Fund IV (Debt‐Related/Special Situations).
June 2019
Period Ending: December 31, 2018
Policy Target
Policy Range
Market Value %
Market Value $(000)
Unfunded Commitment
$(000)Market Value + Unfunded $(000)
ACERA Plan Assets ‐ Total $7,609,664Private Equity: 9.0% 0‐13% 6.8% $519,871 $540,057 $1,059,929
Buyouts 60.0% 30‐80% 57.3% $297,969 $284,145 $582,114Venture Capital 20.0% 0‐40% 32.9% $170,793 $37,651 $208,444Debt‐Related/Special Situations 20.0% 0‐70% 9.8% $51,110 $218,261 $269,371
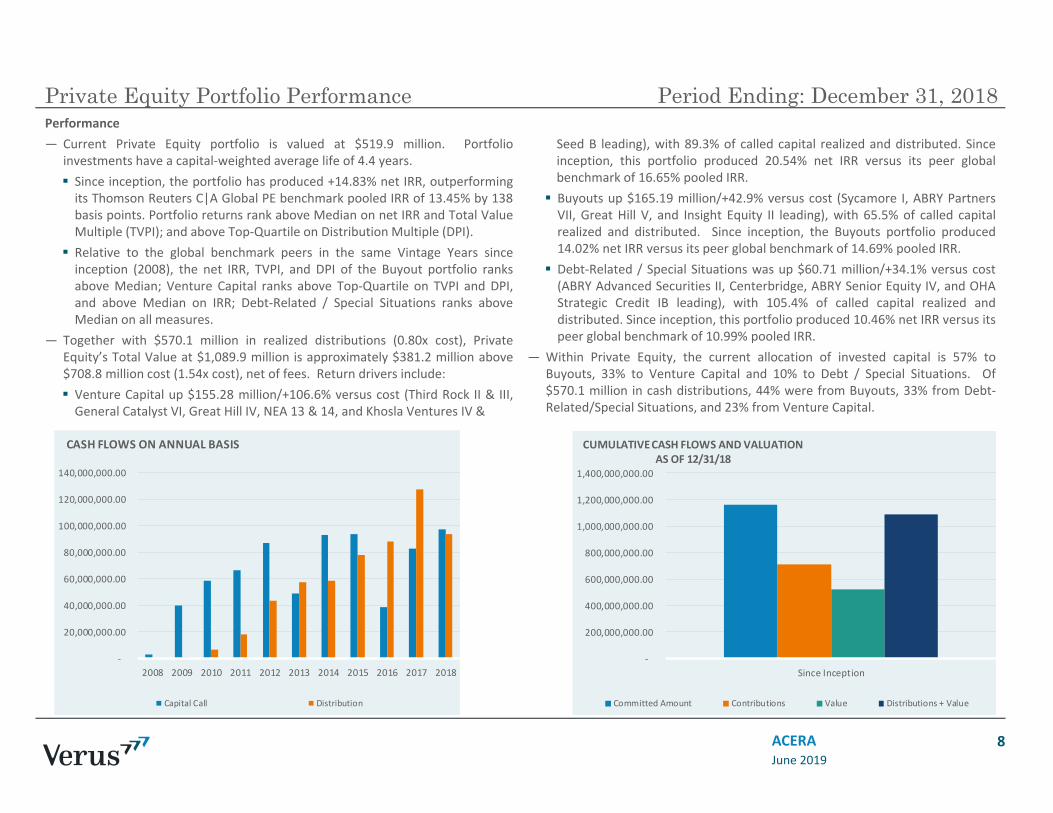
Private Equity Portfolio Performance
ACERA 8
Performance— Current Private Equity portfolio is valued at $519.9 million. Portfolio
investments have a capital‐weighted average life of 4.4 years. Since inception, the portfolio has produced +14.83% net IRR, outperformingits Thomson Reuters C|A Global PE benchmark pooled IRR of 13.45% by 138basis points. Portfolio returns rank above Median on net IRR and Total ValueMultiple (TVPI); and above Top‐Quartile on Distribution Multiple (DPI). Relative to the global benchmark peers in the same Vintage Years sinceinception (2008), the net IRR, TVPI, and DPI of the Buyout portfolio ranksabove Median; Venture Capital ranks above Top‐Quartile on TVPI and DPI,and above Median on IRR; Debt‐Related / Special Situations ranks aboveMedian on all measures.
— Together with $570.1 million in realized distributions (0.80x cost), PrivateEquity’s Total Value at $1,089.9 million is approximately $381.2 million above$708.8 million cost (1.54x cost), net of fees. Return drivers include: Venture Capital up $155.28 million/+106.6% versus cost (Third Rock II & III,General Catalyst VI, Great Hill IV, NEA 13 & 14, and Khosla Ventures IV &
Seed B leading), with 89.3% of called capital realized and distributed. Sinceinception, this portfolio produced 20.54% net IRR versus its peer globalbenchmark of 16.65% pooled IRR. Buyouts up $165.19 million/+42.9% versus cost (Sycamore I, ABRY PartnersVII, Great Hill V, and Insight Equity II leading), with 65.5% of called capitalrealized and distributed. Since inception, the Buyouts portfolio produced14.02% net IRR versus its peer global benchmark of 14.69% pooled IRR. Debt‐Related / Special Situations was up $60.71 million/+34.1% versus cost(ABRY Advanced Securities II, Centerbridge, ABRY Senior Equity IV, and OHAStrategic Credit IB leading), with 105.4% of called capital realized anddistributed. Since inception, this portfolio produced 10.46% net IRR versus itspeer global benchmark of 10.99% pooled IRR.
— Within Private Equity, the current allocation of invested capital is 57% toBuyouts, 33% to Venture Capital and 10% to Debt / Special Situations. Of$570.1 million in cash distributions, 44% were from Buyouts, 33% from Debt‐Related/Special Situations, and 23% from Venture Capital.
June 2019
Period Ending: December 31, 2018
‐
20,000,000.00
40,000,000.00
60,000,000.00
80,000,000.00
100,000,000.00
120,000,000.00
140,000,000.00
2008 2009 2010 2011 2012 2013 2014 2015 2016 2017 2018
CASH FLOWS ON ANNUAL BASIS
Capital Call Distribution
‐
200,000,000.00
400,000,000.00
600,000,000.00
800,000,000.00
1,000,000,000.00
1,200,000,000.00
1,400,000,000.00
Since Inception
CUMULATIVE CASH FLOWS AND VALUATIONAS OF 12/31/18
Committed Amount Contributions Value Distributions + Value
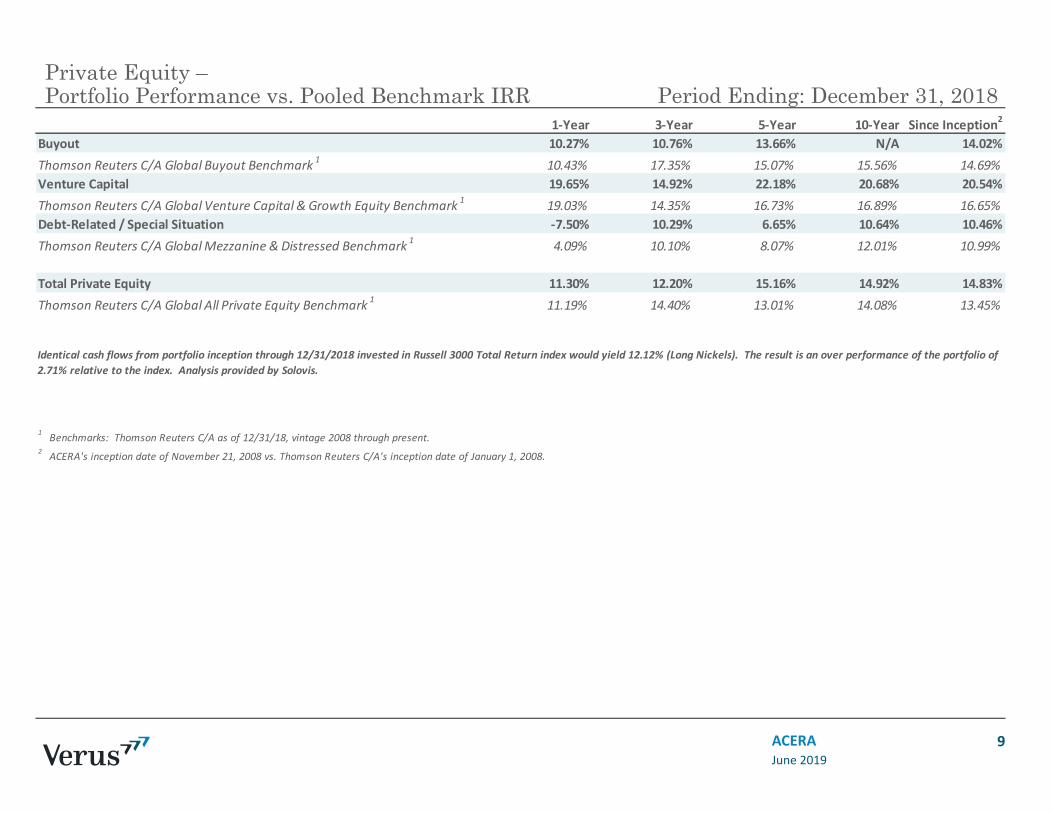
ACERA 9
Portfolio Performance vs. Pooled Benchmark IRR
June 2019
Period Ending: December 31, 2018Private Equity –
1‐Year 3‐Year 5‐Year 10‐Year Since Inception2
Buyout 10.27% 10.76% 13.66% N/A 14.02%Thomson Reuters C/A Global Buyout Benchmark 1 10.43% 17.35% 15.07% 15.56% 14.69%Venture Capital 19.65% 14.92% 22.18% 20.68% 20.54%Thomson Reuters C/A Global Venture Capital & Growth Equity Benchmark 1 19.03% 14.35% 16.73% 16.89% 16.65%Debt‐Related / Special Situation ‐7.50% 10.29% 6.65% 10.64% 10.46%Thomson Reuters C/A Global Mezzanine & Distressed Benchmark 1 4.09% 10.10% 8.07% 12.01% 10.99%
Total Private Equity 11.30% 12.20% 15.16% 14.92% 14.83%Thomson Reuters C/A Global All Private Equity Benchmark 1 11.19% 14.40% 13.01% 14.08% 13.45%
1 Benchmarks: Thomson Reuters C/A as of 12/31/18, vintage 2008 through present. 2 ACERA's inception date of November 21, 2008 vs. Thomson Reuters C/A's inception date of January 1, 2008.
Identical cash flows from portfolio inception through 12/31/2018 invested in Russell 3000 Total Return index would yield 12.12% (Long Nickels). The result is an over performance of the portfolio of 2.71% relative to the index. Analysis provided by Solovis.
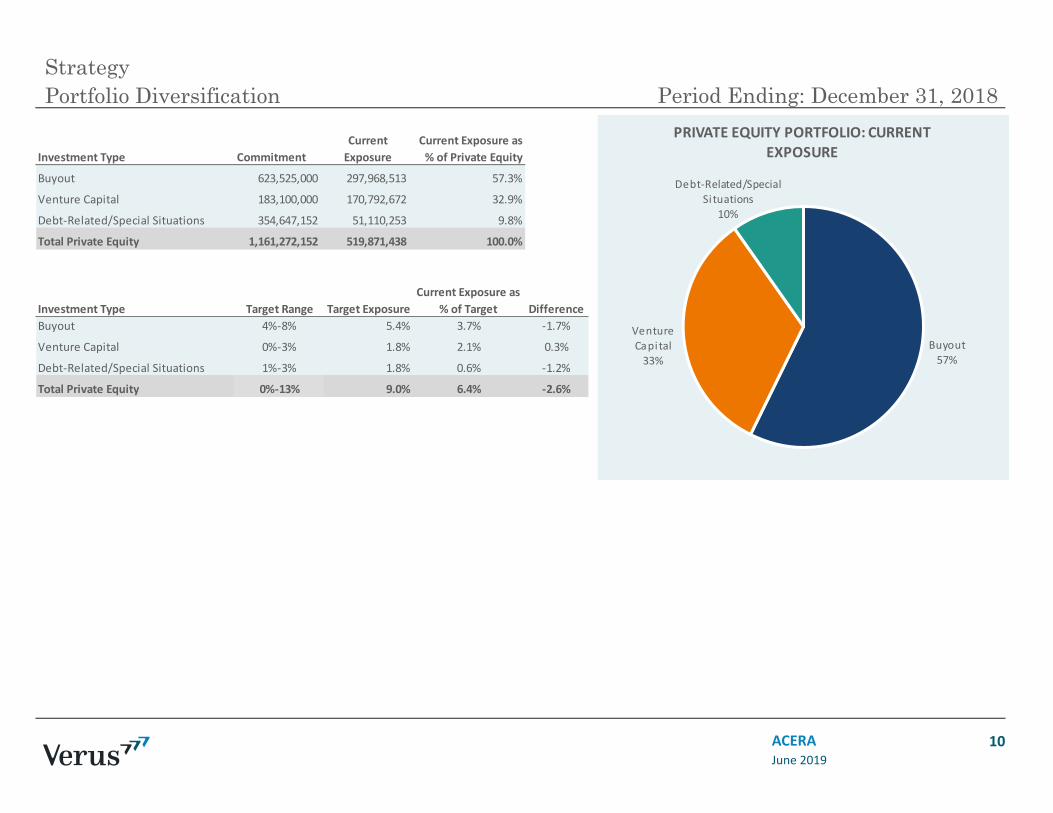
Portfolio DiversificationStrategy
ACERA 10June 2019
Period Ending: December 31, 2018
Investment Type CommitmentCurrent Exposure
Current Exposure as % of Private Equity
Buyout 623,525,000 297,968,513 57.3%
Venture Capital 183,100,000 170,792,672 32.9%
Debt‐Related/Special Situations 354,647,152 51,110,253 9.8%
Total Private Equity 1,161,272,152 519,871,438 100.0%
Investment Type Target Range Target ExposureCurrent Exposure as
% of Target DifferenceBuyout 4%‐8% 5.4% 3.7% ‐1.7%
Venture Capital 0%‐3% 1.8% 2.1% 0.3%
Debt‐Related/Special Situations 1%‐3% 1.8% 0.6% ‐1.2%
Total Private Equity 0%‐13% 9.0% 6.4% ‐2.6%
Buyout57%
Venture Capital33%
Debt‐Related/Special Si tuations
10%
PRIVATE EQUITY PORTFOLIO: CURRENT EXPOSURE
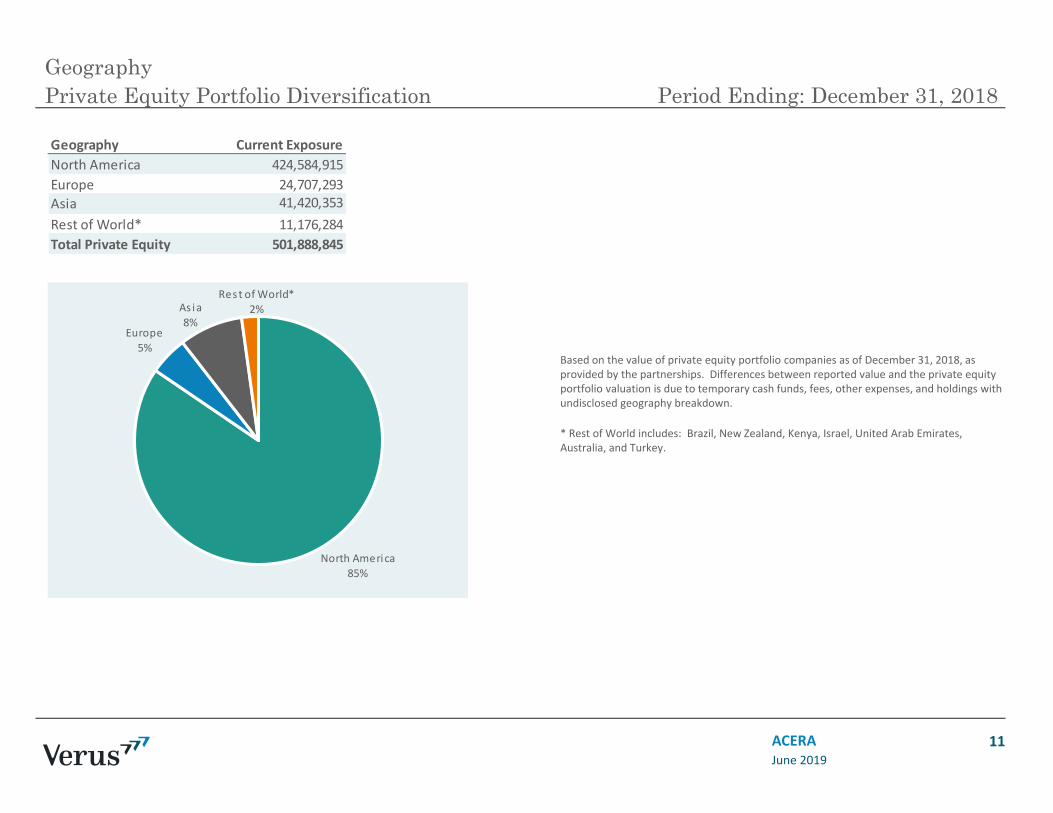
Private Equity Portfolio DiversificationGeography
ACERA 11
Based on the value of private equity portfolio companies as of December 31, 2018, as provided by the partnerships. Differences between reported value and the private equity portfolio valuation is due to temporary cash funds, fees, other expenses, and holdings with undisclosed geography breakdown.
* Rest of World includes: Brazil, New Zealand, Kenya, Israel, United Arab Emirates, Australia, and Turkey.
June 2019
Period Ending: December 31, 2018
Geography Current ExposureNorth America 424,584,915Europe 24,707,293Asia 41,420,353Rest of World* 11,176,284Total Private Equity 501,888,845
North America85%
Europe5%
As ia8%
Rest of World*2%
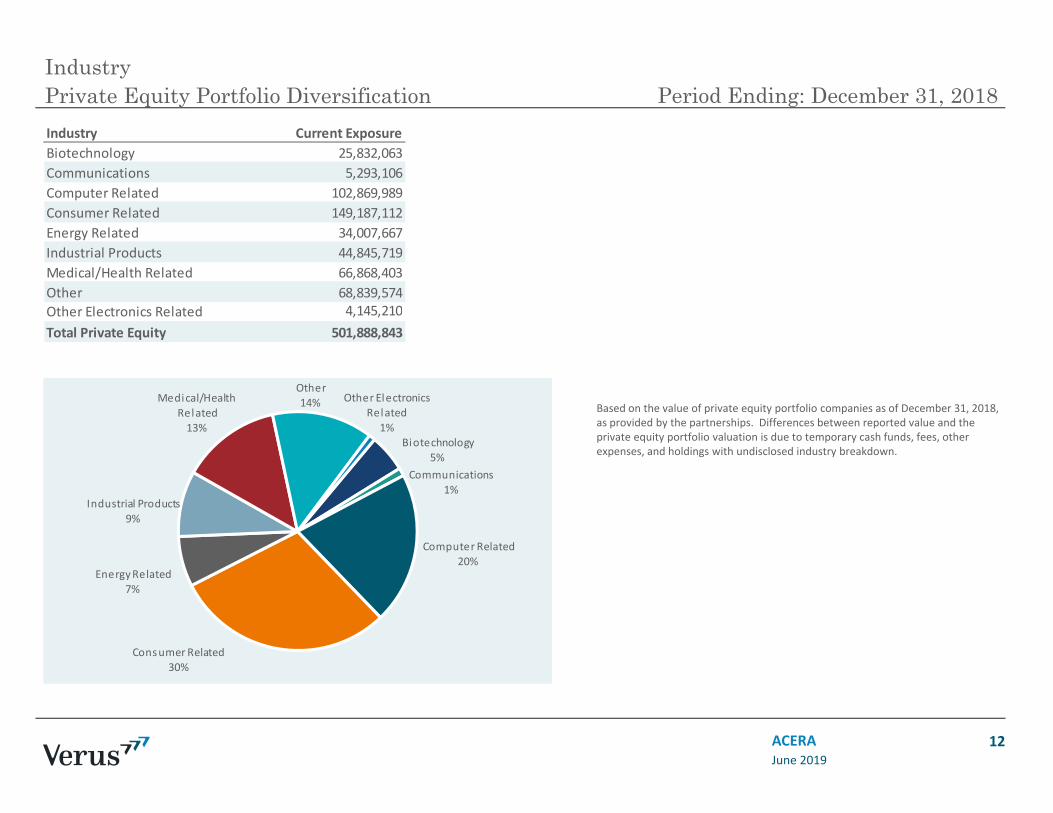
Private Equity Portfolio DiversificationIndustry
ACERA 12
Based on the value of private equity portfolio companies as of December 31, 2018, as provided by the partnerships. Differences between reported value and the private equity portfolio valuation is due to temporary cash funds, fees, other expenses, and holdings with undisclosed industry breakdown.
June 2019
Period Ending: December 31, 2018Industry Current ExposureBiotechnology 25,832,063Communications 5,293,106Computer Related 102,869,989Consumer Related 149,187,112Energy Related 34,007,667Industrial Products 44,845,719Medical/Health Related 66,868,403Other 68,839,574Other Electronics Related 4,145,210Total Private Equity 501,888,843
Biotechnology5%
Communications1%
Computer Related20%
Consumer Related30%
Energy Related7%
Industrial Products9%
Medical/Health Related13%
Other 14% Other Electronics
Related1%
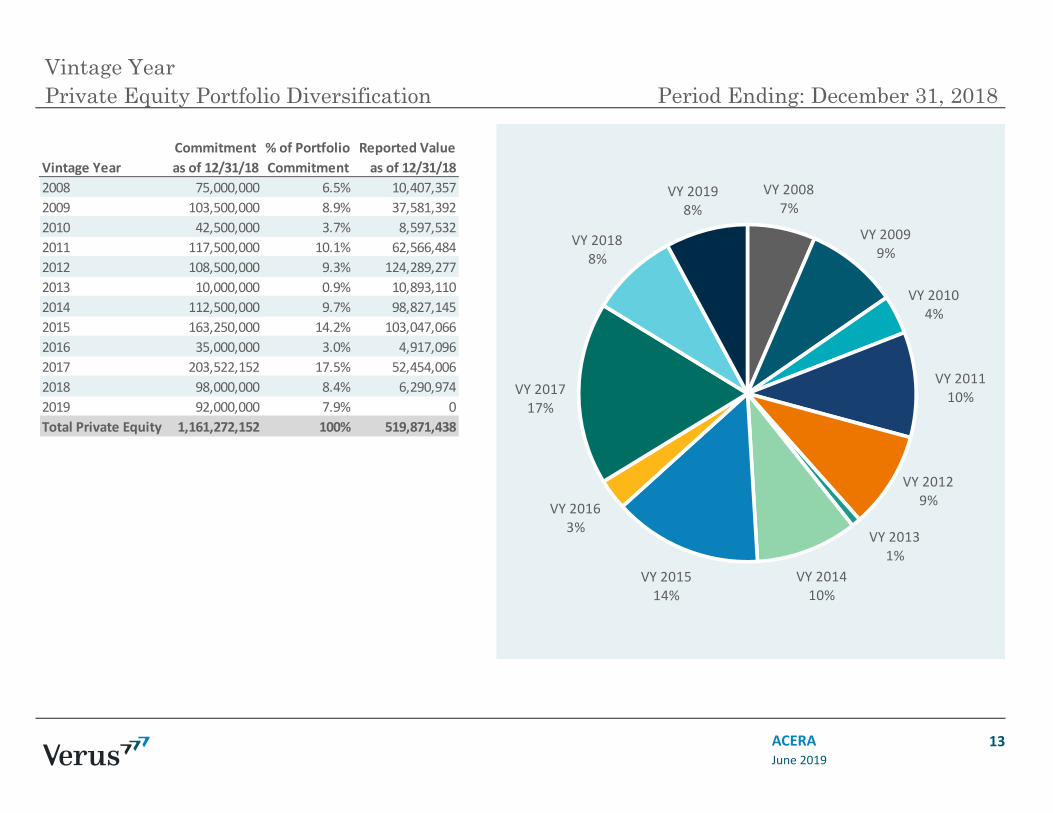
Private Equity Portfolio DiversificationVintage Year
ACERA 13June 2019
Period Ending: December 31, 2018
Vintage YearCommitment as of 12/31/18
% of Portfolio Commitment
Reported Value as of 12/31/18
2008 75,000,000 6.5% 10,407,3572009 103,500,000 8.9% 37,581,3922010 42,500,000 3.7% 8,597,5322011 117,500,000 10.1% 62,566,4842012 108,500,000 9.3% 124,289,2772013 10,000,000 0.9% 10,893,1102014 112,500,000 9.7% 98,827,1452015 163,250,000 14.2% 103,047,0662016 35,000,000 3.0% 4,917,0962017 203,522,152 17.5% 52,454,0062018 98,000,000 8.4% 6,290,9742019 92,000,000 7.9% 0Total Private Equity 1,161,272,152 100% 519,871,438
VY 20087%
VY 20099%
VY 20104%
VY 201110%
VY 20129%
VY 20131%
VY 201410%
VY 201514%
VY 20163%
VY 201717%
VY 20188%
VY 20198%
Significant Events / Material Exceptions to Policy
— As of December 31, 2018, the Private Equity Portfolio is below its neutral target allocation of 9.0%, as commitments continue to be made to various funds. The allocation target increased from 6.0% to 9.0% in September 2017.
June 2019ACERA 14
Period Ending: December 31, 2018

PERIOD ENDING: DECEMBER 31, 2018
Real Assets Review
Alameda County Employees’ Retirement Association
VERUSINVESTMENTS.COM
SEATTLE 206‐622‐3700LOS ANGELES 310‐297‐1777
SAN FRANCISCO 415‐362‐3484
Past performance is no guarantee of future results. This document is provided for informational purposes only and is directed to institutional clients and eligible institutional counterparties only and is not intended for retail investors. Nothing herein constitutes investment, legal, accounting or tax advice, or a recommendation to buy, sell or hold a security or pursue a particular investment vehicle or any trading strategy. This document may include or imply estimates, outlooks, projections and other “forward‐looking statements.” No assurance can be given that future results described or implied by any forward looking information will be achieved. Investing entails risks, including possible loss of principal. Verus Advisory Inc. and Verus Investors, LLC (“Verus”) file a single form ADV under the United States Investment Advisors Act of 1940, as amended.
Table of Contents
2
Real Assets Portfolio Performance
8
Real Assets Portfolio Diversification― RA Portfolio Diversification by Strategy― RA Portfolio Diversification by Geography― RA Portfolio Diversification by Vintage Year
10
Real Assets Market Overview 3
Real Assets Program Update 13
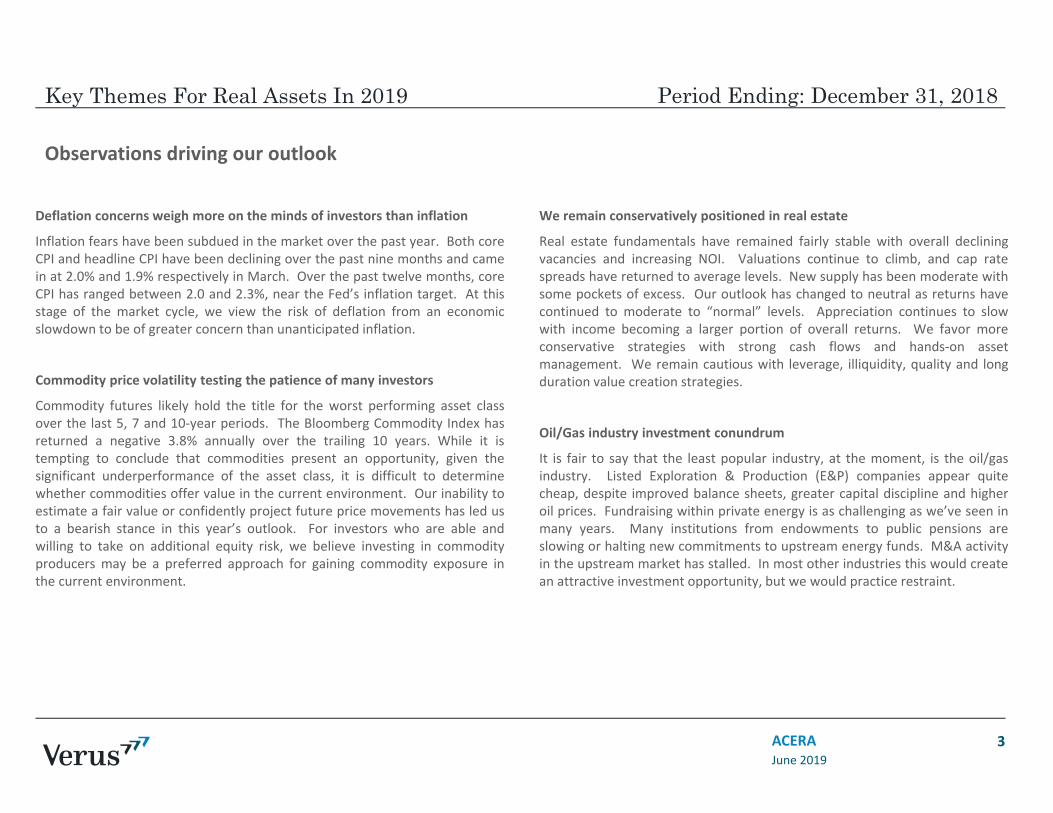
Key Themes For Real Assets In 2019
June 2019ACERA 3
Period Ending: December 31, 2018
Observations driving our outlook
Deflation concerns weigh more on the minds of investors than inflation
Inflation fears have been subdued in the market over the past year. Both coreCPI and headline CPI have been declining over the past nine months and camein at 2.0% and 1.9% respectively in March. Over the past twelve months, coreCPI has ranged between 2.0 and 2.3%, near the Fed’s inflation target. At thisstage of the market cycle, we view the risk of deflation from an economicslowdown to be of greater concern than unanticipated inflation.
Commodity price volatility testing the patience of many investors
Commodity futures likely hold the title for the worst performing asset classover the last 5, 7 and 10‐year periods. The Bloomberg Commodity Index hasreturned a negative 3.8% annually over the trailing 10 years. While it istempting to conclude that commodities present an opportunity, given thesignificant underperformance of the asset class, it is difficult to determinewhether commodities offer value in the current environment. Our inability toestimate a fair value or confidently project future price movements has led usto a bearish stance in this year’s outlook. For investors who are able andwilling to take on additional equity risk, we believe investing in commodityproducers may be a preferred approach for gaining commodity exposure inthe current environment.
We remain conservatively positioned in real estate
Real estate fundamentals have remained fairly stable with overall decliningvacancies and increasing NOI. Valuations continue to climb, and cap ratespreads have returned to average levels. New supply has been moderate withsome pockets of excess. Our outlook has changed to neutral as returns havecontinued to moderate to “normal” levels. Appreciation continues to slowwith income becoming a larger portion of overall returns. We favor moreconservative strategies with strong cash flows and hands‐on assetmanagement. We remain cautious with leverage, illiquidity, quality and longduration value creation strategies.
Oil/Gas industry investment conundrum
It is fair to say that the least popular industry, at the moment, is the oil/gasindustry. Listed Exploration & Production (E&P) companies appear quitecheap, despite improved balance sheets, greater capital discipline and higheroil prices. Fundraising within private energy is as challenging as we’ve seen inmany years. Many institutions from endowments to public pensions areslowing or halting new commitments to upstream energy funds. M&A activityin the upstream market has stalled. In most other industries this would createan attractive investment opportunity, but we would practice restraint.
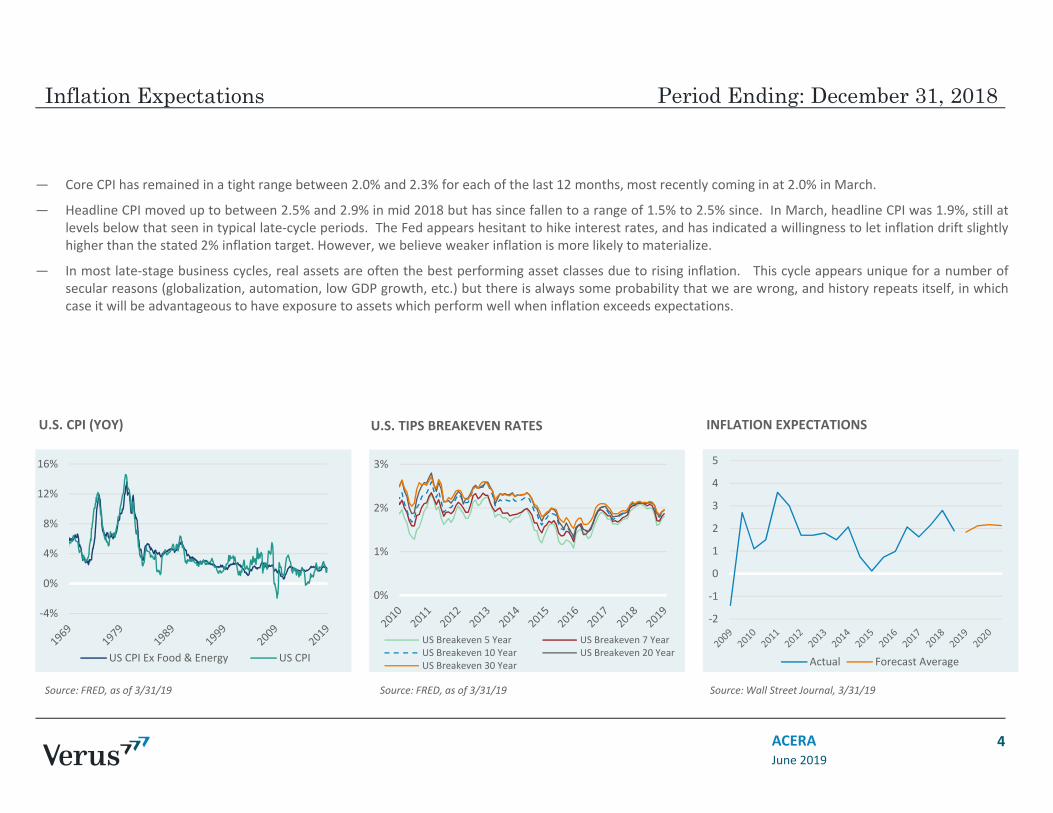
Inflation Expectations
June 2019ACERA 4
Period Ending: December 31, 2018
Source: FRED, as of 3/31/19 Source: FRED, as of 3/31/19 Source: Wall Street Journal, 3/31/19
U.S. CPI (YOY) U.S. TIPS BREAKEVEN RATES INFLATION EXPECTATIONS
— Core CPI has remained in a tight range between 2.0% and 2.3% for each of the last 12 months, most recently coming in at 2.0% in March.
— Headline CPI moved up to between 2.5% and 2.9% in mid 2018 but has since fallen to a range of 1.5% to 2.5% since. In March, headline CPI was 1.9%, still atlevels below that seen in typical late‐cycle periods. The Fed appears hesitant to hike interest rates, and has indicated a willingness to let inflation drift slightlyhigher than the stated 2% inflation target. However, we believe weaker inflation is more likely to materialize.
— In most late‐stage business cycles, real assets are often the best performing asset classes due to rising inflation. This cycle appears unique for a number ofsecular reasons (globalization, automation, low GDP growth, etc.) but there is always some probability that we are wrong, and history repeats itself, in whichcase it will be advantageous to have exposure to assets which perform well when inflation exceeds expectations.
‐4%
0%
4%
8%
12%
16%
US CPI Ex Food & Energy US CPI
0%
1%
2%
3%
US Breakeven 5 Year US Breakeven 7 YearUS Breakeven 10 Year US Breakeven 20 YearUS Breakeven 30 Year
‐2
‐1
0
1
2
3
4
5
Actual Forecast Average
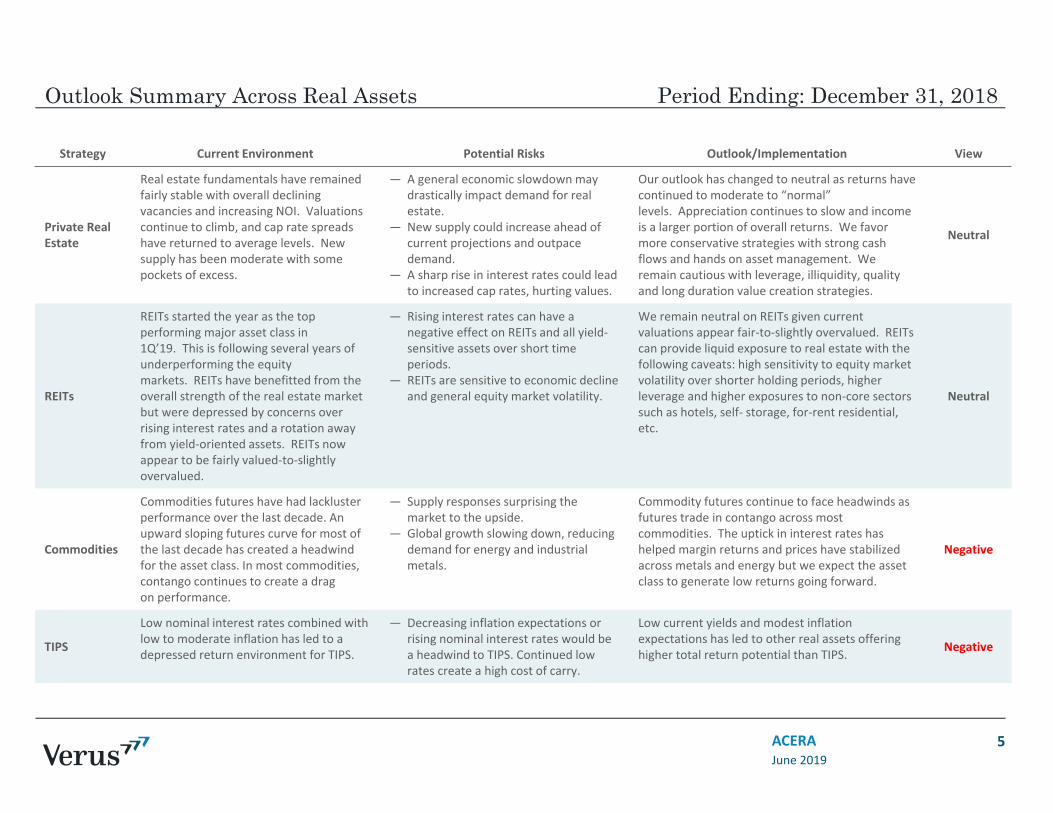
Outlook Summary Across Real Assets
June 2019ACERA 5
Period Ending: December 31, 2018
Strategy Current Environment Potential Risks Outlook/Implementation View
Private Real Estate
Real estate fundamentals have remained fairly stable with overall declining vacancies and increasing NOI. Valuations continue to climb, and cap rate spreads have returned to average levels. New supply has been moderate with some pockets of excess.
― A general economic slowdown may drastically impact demand for real estate.
― New supply could increase ahead of current projections and outpace demand.
― A sharp rise in interest rates could lead to increased cap rates, hurting values.
Our outlook has changed to neutral as returns have continued to moderate to “normal” levels. Appreciation continues to slow and income is a larger portion of overall returns. We favor more conservative strategies with strong cash flows and hands on asset management. We remain cautious with leverage, illiquidity, quality and long duration value creation strategies.
Neutral
REITs
REITs started the year as the top performing major asset class in 1Q’19. This is following several years of underperforming the equity markets. REITs have benefitted from the overall strength of the real estate market but were depressed by concerns over rising interest rates and a rotation away from yield‐oriented assets. REITs now appear to be fairly valued‐to‐slightly overvalued.
― Rising interest rates can have a negative effect on REITs and all yield‐sensitive assets over short time periods.
― REITs are sensitive to economic decline and general equity market volatility.
We remain neutral on REITs given current valuations appear fair‐to‐slightly overvalued. REITs can provide liquid exposure to real estate with the following caveats: high sensitivity to equity market volatility over shorter holding periods, higher leverage and higher exposures to non‐core sectors such as hotels, self‐ storage, for‐rent residential, etc.
Neutral
Commodities
Commodities futures have had lackluster performance over the last decade. An upward sloping futures curve for most of the last decade has created a headwind for the asset class. In most commodities, contango continues to create a drag on performance.
― Supply responses surprising the market to the upside.
― Global growth slowing down, reducing demand for energy and industrial metals.
Commodity futures continue to face headwinds as futures trade in contango across most commodities. The uptick in interest rates has helped margin returns and prices have stabilized across metals and energy but we expect the asset class to generate low returns going forward.
Negative
TIPS
Low nominal interest rates combined with low to moderate inflation has led to a depressed return environment for TIPS.
― Decreasing inflation expectations or rising nominal interest rates would be a headwind to TIPS. Continued low rates create a high cost of carry.
Low current yields and modest inflation expectations has led to other real assets offering higher total return potential than TIPS. Negative
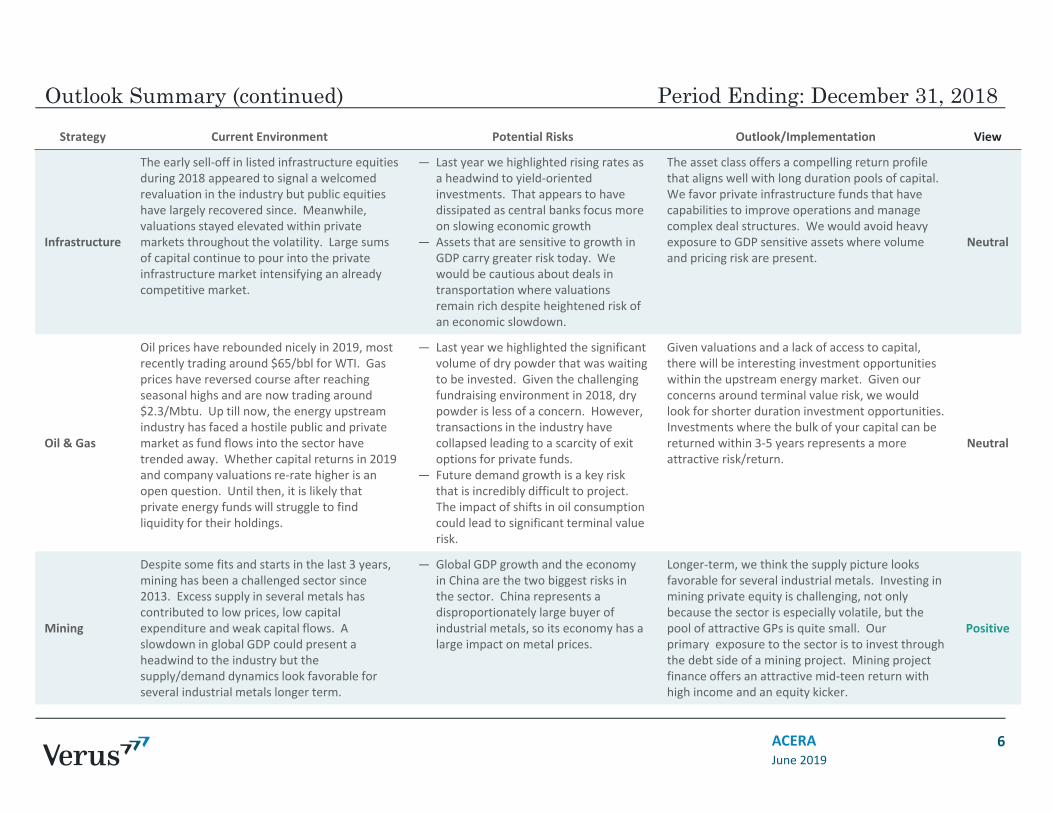
Outlook Summary (continued)
June 2019ACERA 6
Period Ending: December 31, 2018Strategy Current Environment Potential Risks Outlook/Implementation View
Infrastructure
The early sell‐off in listed infrastructure equities during 2018 appeared to signal a welcomed revaluation in the industry but public equities have largely recovered since. Meanwhile, valuations stayed elevated within private markets throughout the volatility. Large sums of capital continue to pour into the private infrastructure market intensifying an already competitive market.
― Last year we highlighted rising rates as a headwind to yield‐oriented investments. That appears to have dissipated as central banks focus more on slowing economic growth
― Assets that are sensitive to growth in GDP carry greater risk today. We would be cautious about deals in transportation where valuations remain rich despite heightened risk of an economic slowdown.
The asset class offers a compelling return profile that aligns well with long duration pools of capital. We favor private infrastructure funds that have capabilities to improve operations and manage complex deal structures. We would avoid heavy exposure to GDP sensitive assets where volume and pricing risk are present.
Neutral
Oil & Gas
Oil prices have rebounded nicely in 2019, most recently trading around $65/bbl for WTI. Gas prices have reversed course after reaching seasonal highs and are now trading around $2.3/Mbtu. Up till now, the energy upstream industry has faced a hostile public and private market as fund flows into the sector have trended away. Whether capital returns in 2019 and company valuations re‐rate higher is an open question. Until then, it is likely that private energy funds will struggle to find liquidity for their holdings.
― Last year we highlighted the significant volume of dry powder that was waiting to be invested. Given the challenging fundraising environment in 2018, dry powder is less of a concern. However, transactions in the industry have collapsed leading to a scarcity of exit options for private funds.
― Future demand growth is a key risk that is incredibly difficult to project. The impact of shifts in oil consumption could lead to significant terminal value risk.
Given valuations and a lack of access to capital, there will be interesting investment opportunities within the upstream energy market. Given our concerns around terminal value risk, we would look for shorter duration investment opportunities. Investments where the bulk of your capital can be returned within 3‐5 years represents a more attractive risk/return.
Neutral
Mining
Despite some fits and starts in the last 3 years, mining has been a challenged sector since 2013. Excess supply in several metals has contributed to low prices, low capital expenditure and weak capital flows. A slowdown in global GDP could present a headwind to the industry but the supply/demand dynamics look favorable for several industrial metals longer term.
― Global GDP growth and the economy in China are the two biggest risks in the sector. China represents a disproportionately large buyer of industrial metals, so its economy has a large impact on metal prices.
Longer‐term, we think the supply picture looks favorable for several industrial metals. Investing in mining private equity is challenging, not only because the sector is especially volatile, but the pool of attractive GPs is quite small. Our primary exposure to the sector is to invest through the debt side of a mining project. Mining project finance offers an attractive mid‐teen return with high income and an equity kicker.
Positive
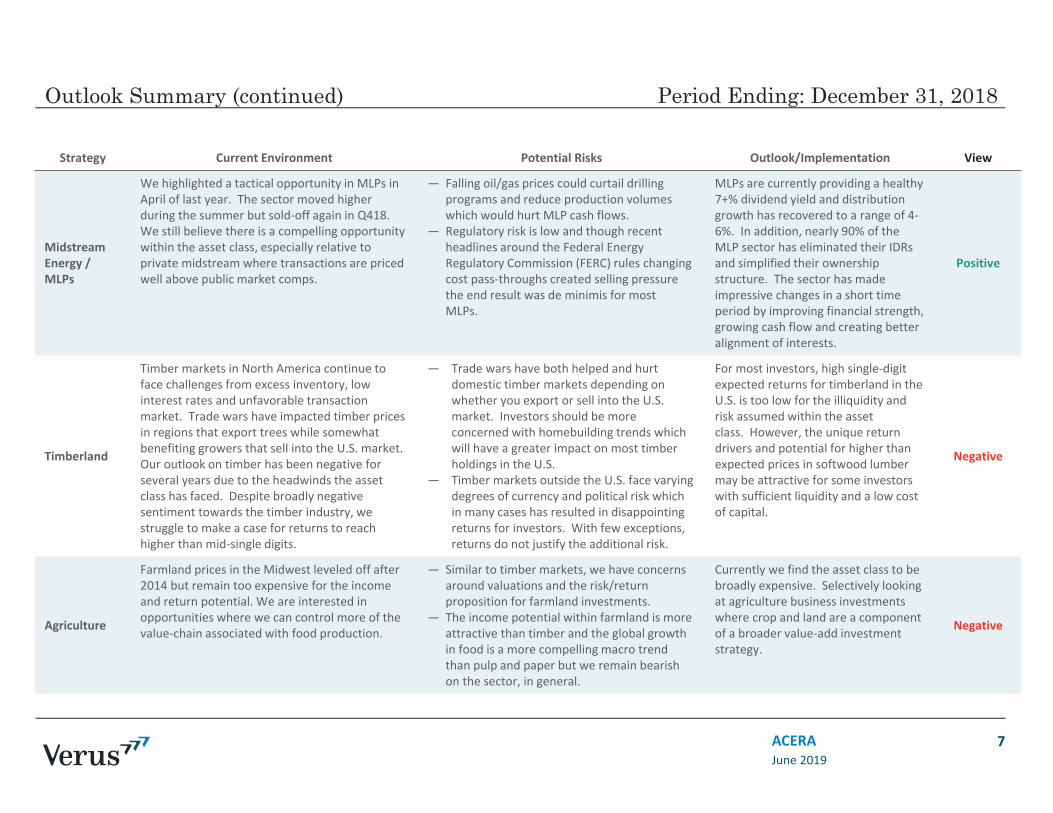
Outlook Summary (continued)
June 2019ACERA 7
Period Ending: December 31, 2018
Strategy Current Environment Potential Risks Outlook/Implementation View
Midstream Energy / MLPs
We highlighted a tactical opportunity in MLPs in April of last year. The sector moved higher during the summer but sold‐off again in Q418. We still believe there is a compelling opportunity within the asset class, especially relative to private midstream where transactions are priced well above public market comps.
― Falling oil/gas prices could curtail drilling programs and reduce production volumes which would hurt MLP cash flows.
― Regulatory risk is low and though recent headlines around the Federal Energy Regulatory Commission (FERC) rules changing cost pass‐throughs created selling pressure the end result was de minimis for most MLPs.
MLPs are currently providing a healthy 7+% dividend yield and distribution growth has recovered to a range of 4‐6%. In addition, nearly 90% of the MLP sector has eliminated their IDRs and simplified their ownership structure. The sector has made impressive changes in a short time period by improving financial strength, growing cash flow and creating better alignment of interests.
Positive
Timberland
Timber markets in North America continue to face challenges from excess inventory, low interest rates and unfavorable transaction market. Trade wars have impacted timber prices in regions that export trees while somewhat benefiting growers that sell into the U.S. market. Our outlook on timber has been negative for several years due to the headwinds the asset class has faced. Despite broadly negative sentiment towards the timber industry, we struggle to make a case for returns to reach higher than mid‐single digits.
― Trade wars have both helped and hurt domestic timber markets depending on whether you export or sell into the U.S. market. Investors should be more concerned with homebuilding trends which will have a greater impact on most timber holdings in the U.S.
― Timber markets outside the U.S. face varying degrees of currency and political risk which in many cases has resulted in disappointing returns for investors. With few exceptions, returns do not justify the additional risk.
For most investors, high single‐digit expected returns for timberland in the U.S. is too low for the illiquidity and risk assumed within the asset class. However, the unique return drivers and potential for higher than expected prices in softwood lumber may be attractive for some investors with sufficient liquidity and a low cost of capital.
Negative
Agriculture
Farmland prices in the Midwest leveled off after 2014 but remain too expensive for the income and return potential. We are interested in opportunities where we can control more of the value‐chain associated with food production.
― Similar to timber markets, we have concerns around valuations and the risk/return proposition for farmland investments.
― The income potential within farmland is more attractive than timber and the global growth in food is a more compelling macro trend than pulp and paper but we remain bearish on the sector, in general.
Currently we find the asset class to be broadly expensive. Selectively looking at agriculture business investments where crop and land are a component of a broader value‐add investment strategy.
Negative
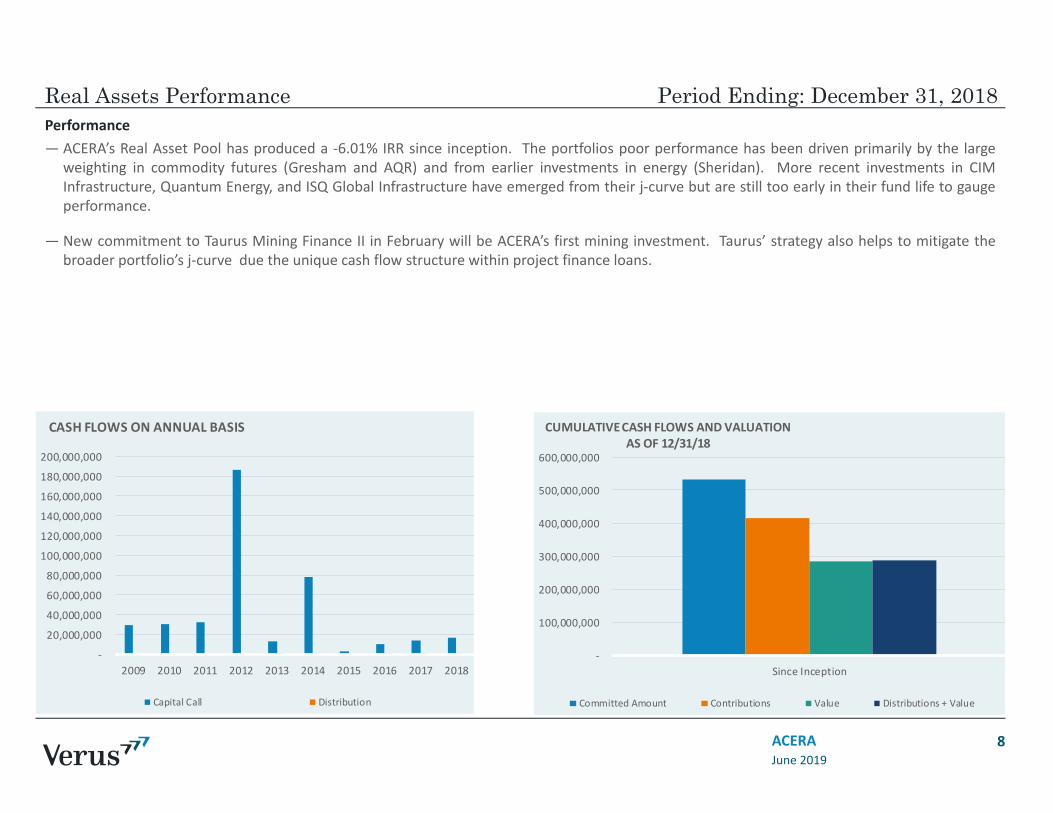
Real Assets Performance
June 2019ACERA 8
Performance— ACERA’s Real Asset Pool has produced a ‐6.01% IRR since inception. The portfolios poor performance has been driven primarily by the large
weighting in commodity futures (Gresham and AQR) and from earlier investments in energy (Sheridan). More recent investments in CIMInfrastructure, Quantum Energy, and ISQ Global Infrastructure have emerged from their j‐curve but are still too early in their fund life to gaugeperformance.
— New commitment to Taurus Mining Finance II in February will be ACERA’s first mining investment. Taurus’ strategy also helps to mitigate thebroader portfolio’s j‐curve due the unique cash flow structure within project finance loans.
Period Ending: December 31, 2018
‐
20,000,000
40,000,000
60,000,000
80,000,000
100,000,000
120,000,000
140,000,000
160,000,000
180,000,000
200,000,000
2009 2010 2011 2012 2013 2014 2015 2016 2017 2018
CASH FLOWS ON ANNUAL BASIS
Capital Call Distribution
‐
100,000,000
200,000,000
300,000,000
400,000,000
500,000,000
600,000,000
Since Inception
CUMULATIVE CASH FLOWS AND VALUATIONAS OF 12/31/18
Committed Amount Contributions Value Distributions + Value
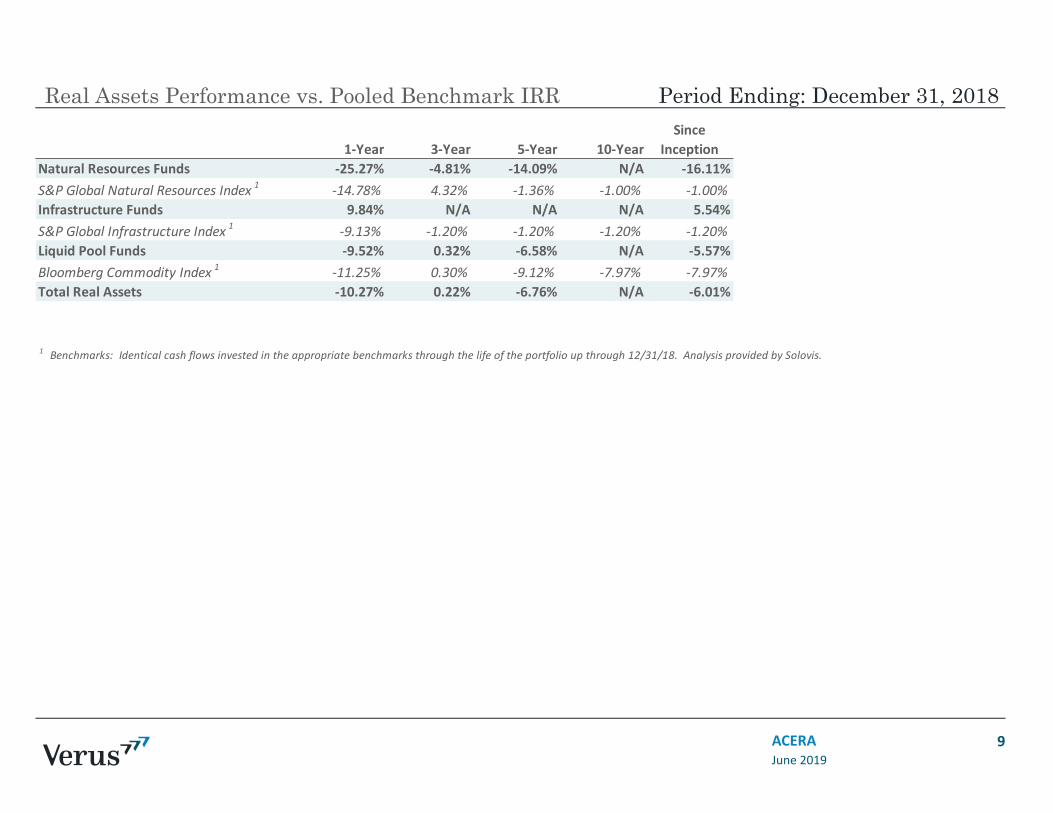
Real Assets Performance vs. Pooled Benchmark IRR
ACERA 9
Period Ending: December 31, 2018
June 2019
1‐Year 3‐Year 5‐Year 10‐YearSince
InceptionNatural Resources Funds ‐25.27% ‐4.81% ‐14.09% N/A ‐16.11%S&P Global Natural Resources Index 1 ‐14.78% 4.32% ‐1.36% ‐1.00% ‐1.00%Infrastructure Funds 9.84% N/A N/A N/A 5.54%S&P Global Infrastructure Index 1 ‐9.13% ‐1.20% ‐1.20% ‐1.20% ‐1.20%Liquid Pool Funds ‐9.52% 0.32% ‐6.58% N/A ‐5.57%Bloomberg Commodity Index 1 ‐11.25% 0.30% ‐9.12% ‐7.97% ‐7.97%Total Real Assets ‐10.27% 0.22% ‐6.76% N/A ‐6.01%
1 Benchmarks: Identical cash flows invested in the appropriate benchmarks through the life of the portfolio up through 12/31/18. Analysis provided by Solovis.
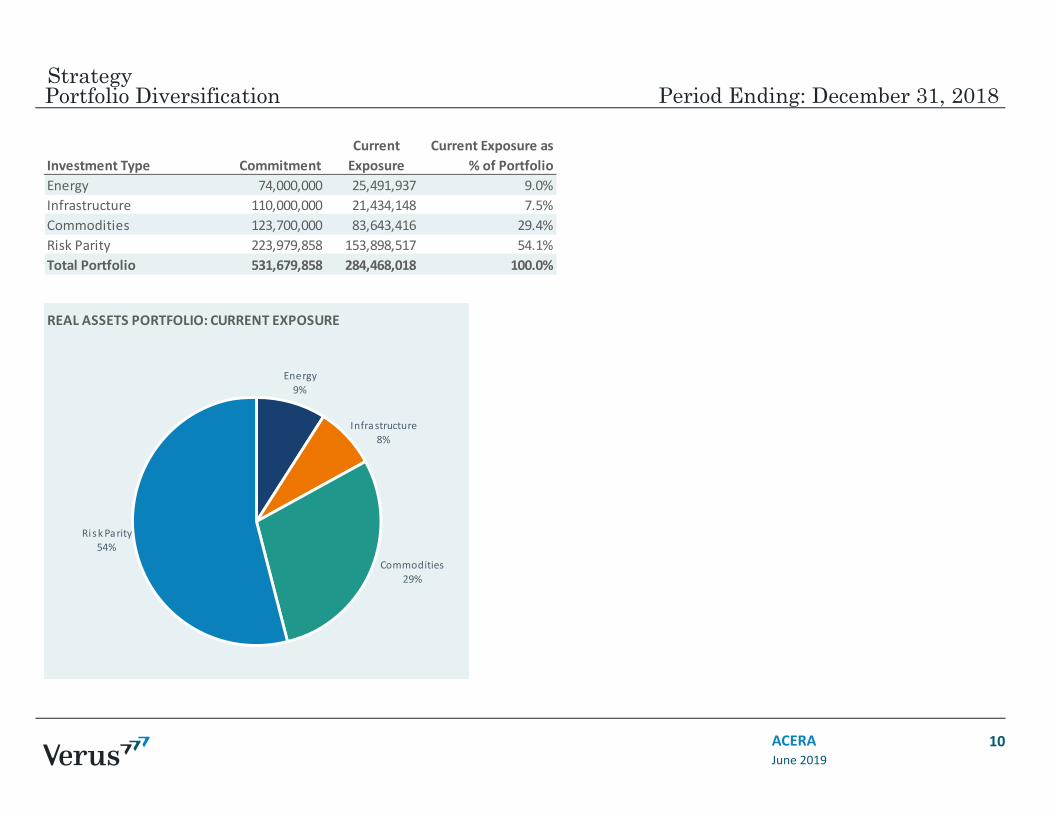
Portfolio Diversification
ACERA 10
Period Ending: December 31, 2018
June 2019
Strategy
Investment Type CommitmentCurrent Exposure
Current Exposure as % of Portfolio
Energy 74,000,000 25,491,937 9.0%Infrastructure 110,000,000 21,434,148 7.5%Commodities 123,700,000 83,643,416 29.4%Risk Parity 223,979,858 153,898,517 54.1%Total Portfolio 531,679,858 284,468,018 100.0%
Energy9%
Infrastructure8%
Commodities29%
Risk Parity54%
REAL ASSETS PORTFOLIO: CURRENT EXPOSURE
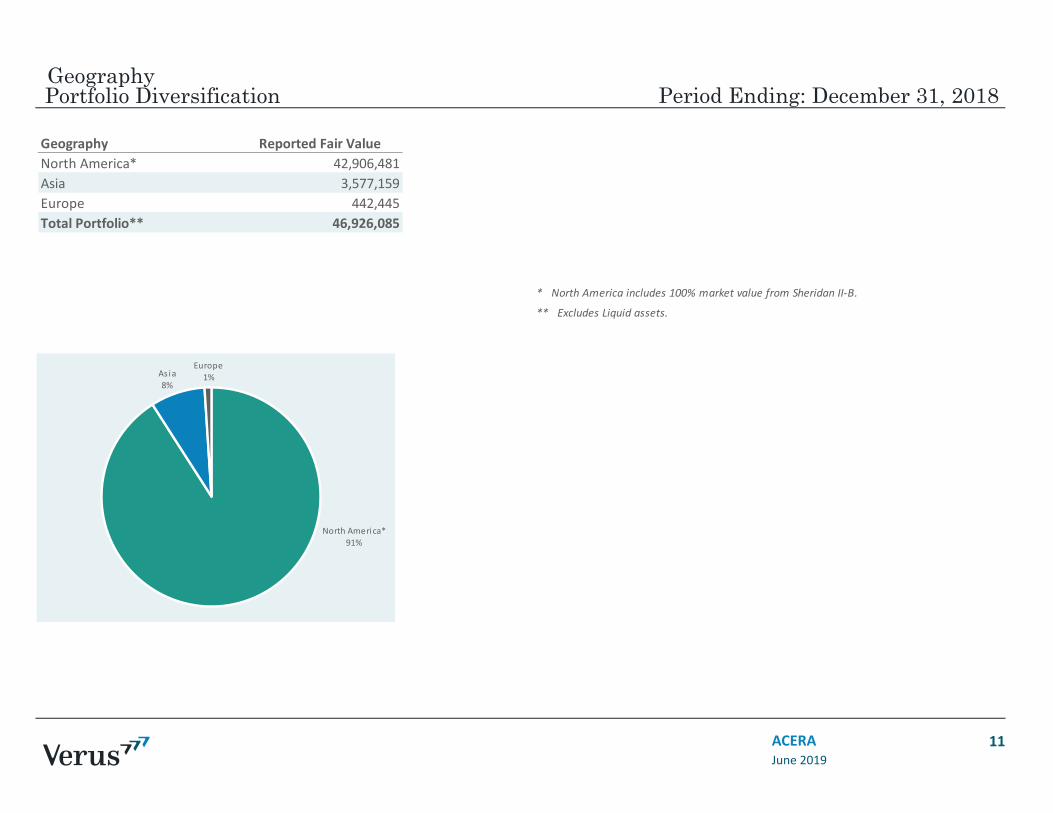
Portfolio Diversification
ACERA 11
Period Ending: December 31, 2018
June 2019
Geography
* North America includes 100% market value from Sheridan II‐B.
** Excludes Liquid assets.
Geography Reported Fair ValueNorth America* 42,906,481Asia 3,577,159Europe 442,445Total Portfolio** 46,926,085
North America*91%
As ia8%
Europe1%
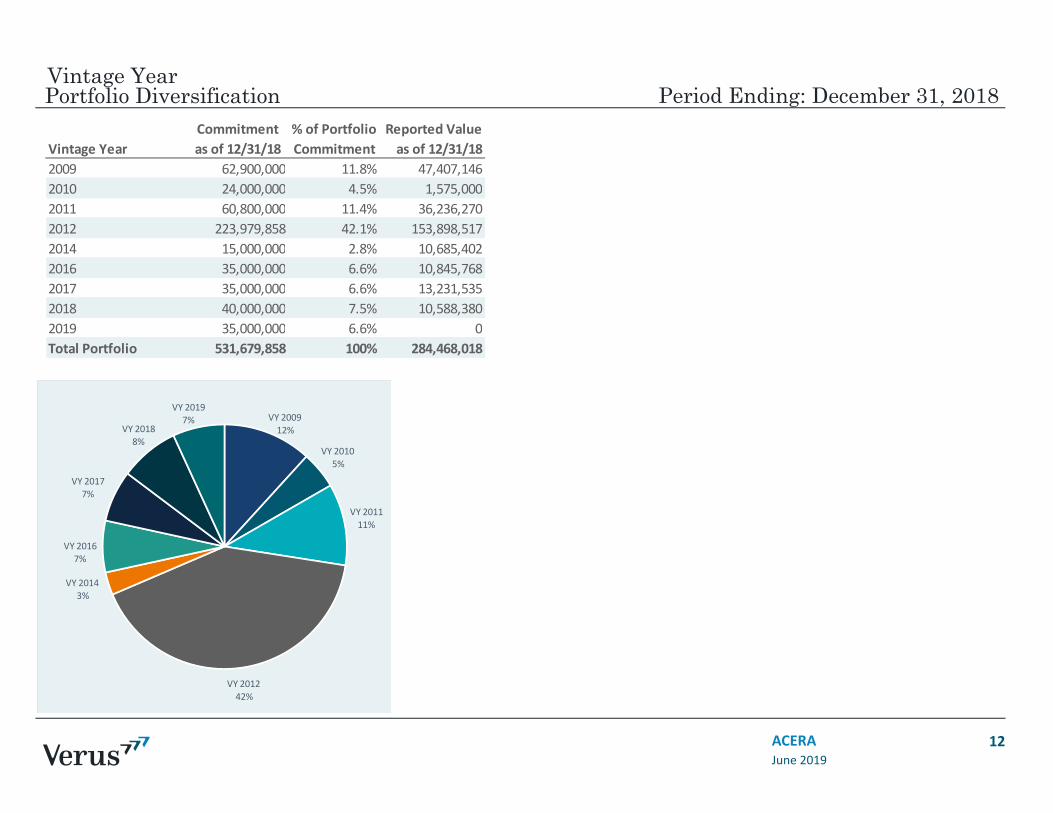
Portfolio Diversification
ACERA 12
Period Ending: December 31, 2018
June 2019
Vintage Year
Vintage YearCommitment as of 12/31/18
% of Portfolio Commitment
Reported Value as of 12/31/18
2009 62,900,000 11.8% 47,407,1462010 24,000,000 4.5% 1,575,0002011 60,800,000 11.4% 36,236,2702012 223,979,858 42.1% 153,898,5172014 15,000,000 2.8% 10,685,4022016 35,000,000 6.6% 10,845,7682017 35,000,000 6.6% 13,231,5352018 40,000,000 7.5% 10,588,3802019 35,000,000 6.6% 0Total Portfolio 531,679,858 100% 284,468,018
VY 200912%
VY 20105%
VY 201111%
VY 201242%
VY 20143%
VY 20167%
VY 20177%
VY 20188%
VY 20197%
— ACERA committed to Taurus Mining Finance II in February which marked the portfolios first mining investment and the first dedicated debt fund.
— We are actively looking at an opportunity in Core Infrastructure which we may bring to the Board in August.
— Valuations across most asset classes has made it challenging to find attractive opportunities. There has been a slowing of capital deployed among private market funds, generally, reflecting a highly competitive market that is valued richly. For now, we are being patient which could result in a reduced level of commitments.
ACERA 13
Period Ending: December 31, 2018Real Assets Program Update
June 2019
Semiannual Real Estate
Performance Measurement Review
Callan PUBLIC VERSION
June 2019
Avery Robinson, CAIA
Senior Vice President
2 ACERA Real Estate Review Knowledge. Experience. Integrity.
Real Estate Market Overview
● U.S. real estate fundamentals are healthy. The real estate sector continued to see steady returns driven by above inflation-level rent growth in many metropolitan areas.
● Within the NPI, the vacancy rate for U.S. property was 5.8% in the fourth quarter of 2018, near its lowest level since 2001. Vacancies were below their 20-year average in every major sector, however the rate of absorption has flattened.
● Net operating income has been growing annually, and is expected to be the primary driver of returns going forward as the real estate cycle is in a mature phase and appreciation has been moderating.
● Valuations continue to creep higher, although there is a dispersion between property sectors. The office sector has had varying levels of performance based on location, suburban versus CBD (Central Business District), as well as market, primary or secondary/tertiary. Industrial performance has been strong and multi-family may benefit from increased demand in the presence of declining home affordability.
● Supply and demand fundamentals are balanced but peaking. Supply is in check and aided by strict commercial real estate lending standards. Demand continues on the back of synchronized domestic growth.
● The industrial sector is performing the strongest, benefitting as structural shifts in the economy, property markets, and consumer habits continue to dampen demand for traditional retail space. Office is performing as expected late in the cycle and tenant improvements and other capital expenditures are increasingly eroding cash flow. Multifamily remains strong due to positive demographic trends, except for the Class A luxury segment in prime markets such as New York. Retail is the laggard.
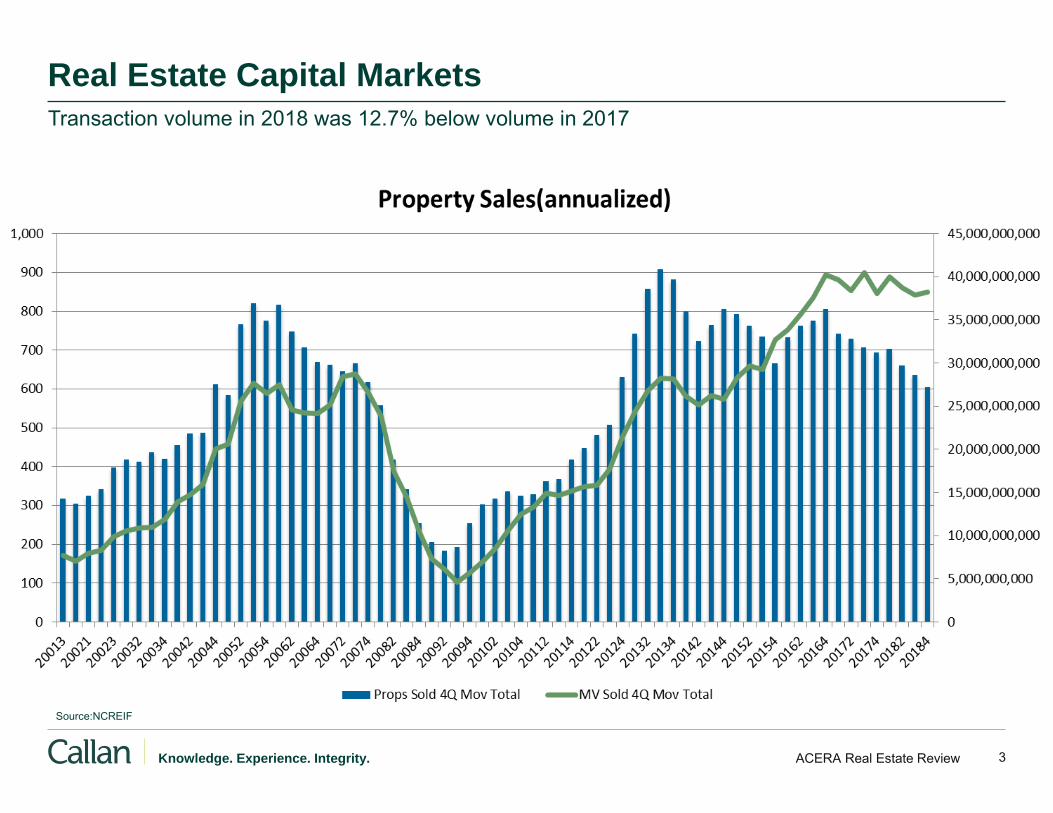
3 ACERA Real Estate Review Knowledge. Experience. Integrity.
Real Estate Capital Markets
Transaction volume in 2018 was 12.7% below volume in 2017
Source:NCREIF
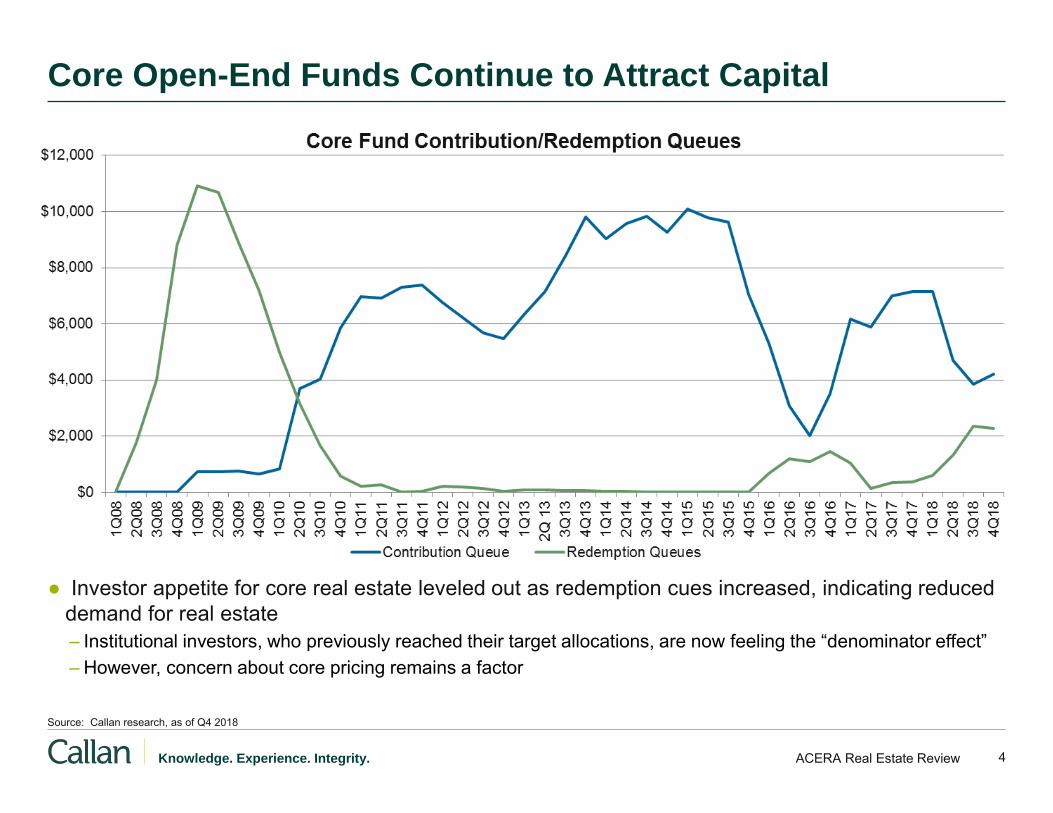
4 ACERA Real Estate Review Knowledge. Experience. Integrity.
Core Open-End Funds Continue to Attract Capital
● Investor appetite for core real estate leveled out as redemption cues increased, indicating reduced demand for real estate – Institutional investors, who previously reached their target allocations, are now feeling the “denominator effect” – However, concern about core pricing remains a factor
Source: Callan research, as of Q4 2018
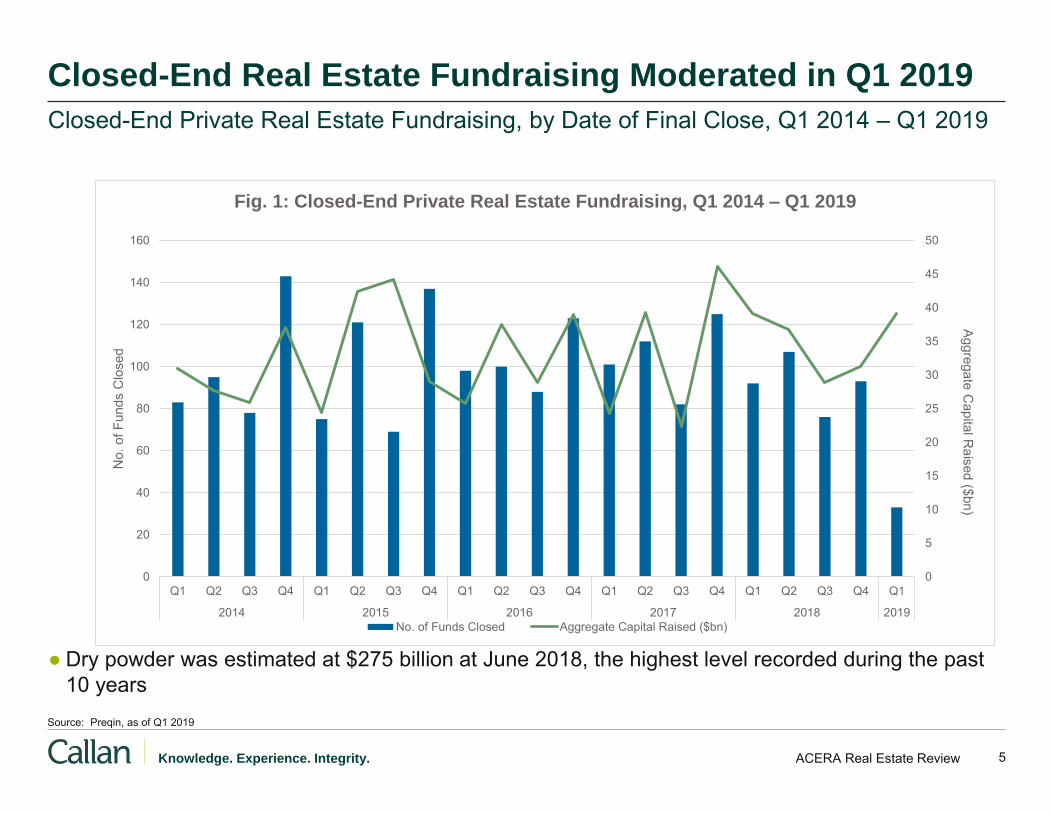
5 ACERA Real Estate Review Knowledge. Experience. Integrity.
Closed-End Real Estate Fundraising Moderated in Q1 2019
● Dry powder was estimated at $275 billion at June 2018, the highest level recorded during the past 10 years
Closed-End Private Real Estate Fundraising, by Date of Final Close, Q1 2014 – Q1 2019
Source: Preqin, as of Q1 2019
0
5
10
15
20
25
30
35
40
45
50
0
20
40
60
80
100
120
140
160
Q1 Q2 Q3 Q4 Q1 Q2 Q3 Q4 Q1 Q2 Q3 Q4 Q1 Q2 Q3 Q4 Q1 Q2 Q3 Q4 Q1
2014 2015 2016 2017 2018 2019
Aggregate Capital R
aised ($bn)
No.
of F
unds
Clo
sed
Fig. 1: Closed-End Private Real Estate Fundraising, Q1 2014 – Q1 2019
No. of Funds Closed Aggregate Capital Raised ($bn)
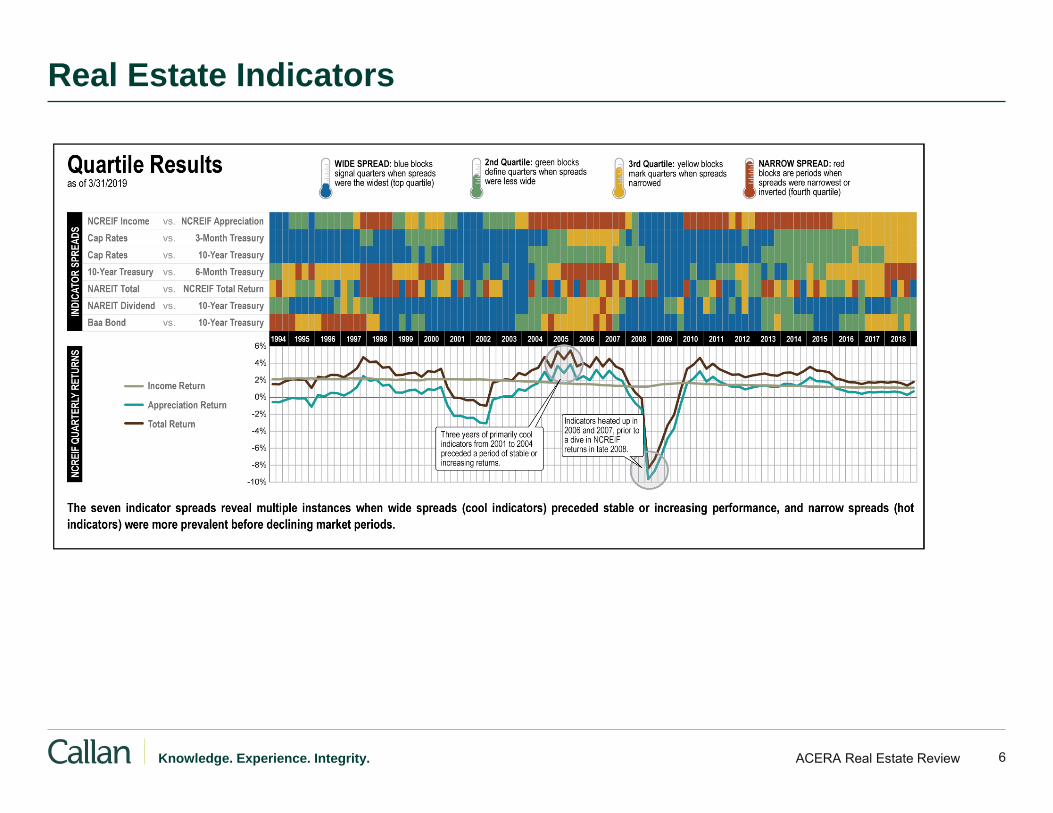
6 ACERA Real Estate Review Knowledge. Experience. Integrity.
Real Estate Indicators
7 ACERA Real Estate Review Knowledge. Experience. Integrity.
International Real Estate
Asia
● The growth of the middle class in Asia is steady and the demand for institutional quality real estate is commensurate.
● The number of open-end core funds focused on the Asia Pacific market have increased over recent years and include both sector-diversified and sector-specific (e.g. logistics) funds, supporting the development of the institutional real estate market in the region. During Q1 2019, India had the first successful IPO for a REIT which substantiates the institutionalization of the asset class in India.
Europe
● Political uncertainty continues to weigh on overall growth throughout Europe, but real estate fundamentals remain strong in key gateway markets given the continued lack of new supply. Cap rates for prime real estate remain low, as real estate continues to be an attractive asset class as a result of low interest rates throughout the region.
● Office rents continue to steadily rise year-over-year, while retail rental growth has lagged. Rental growth for industrial assets has been positive but well below the breakneck pace of the U.S.
The U.S. Remains a Dominant Market in Global Real Estate, Asia is Increasingly Important
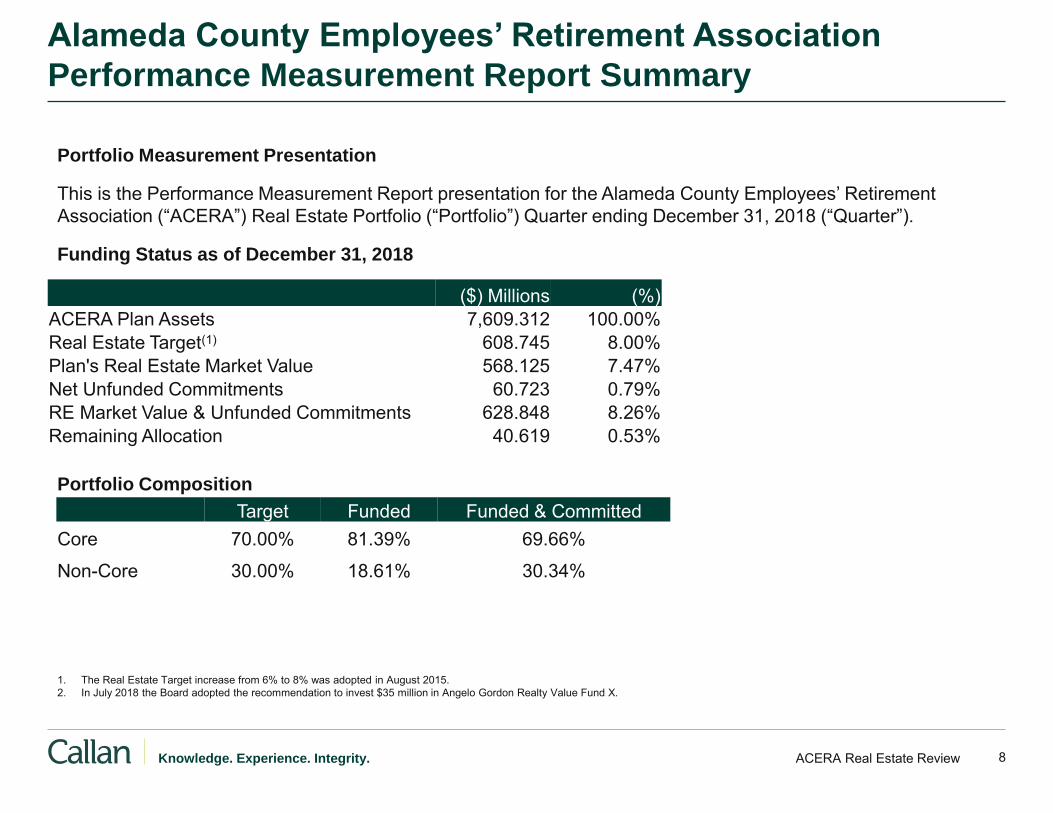
8 ACERA Real Estate Review Knowledge. Experience. Integrity.
Alameda County Employees’ Retirement Association
Performance Measurement Report Summary
Portfolio Measurement Presentation
This is the Performance Measurement Report presentation for the Alameda County Employees’ Retirement
Association (“ACERA”) Real Estate Portfolio (“Portfolio”) Quarter ending December 31, 2018 (“Quarter”).
Funding Status as of December 31, 2018
Portfolio Composition
($) Millions (%) ACERA Plan Assets 7,609.312 100.00% Real Estate Target(1) 608.745 8.00% Plan's Real Estate Market Value 568.125 7.47% Net Unfunded Commitments 60.723 0.79% RE Market Value & Unfunded Commitments 628.848 8.26% Remaining Allocation 40.619 0.53%
Target Funded Funded & Committed Core 70.00% 81.39% 69.66% Non-Core 30.00% 18.61% 30.34%
1. The Real Estate Target increase from 6% to 8% was adopted in August 2015. 2. In July 2018 the Board adopted the recommendation to invest $35 million in Angelo Gordon Realty Value Fund X.
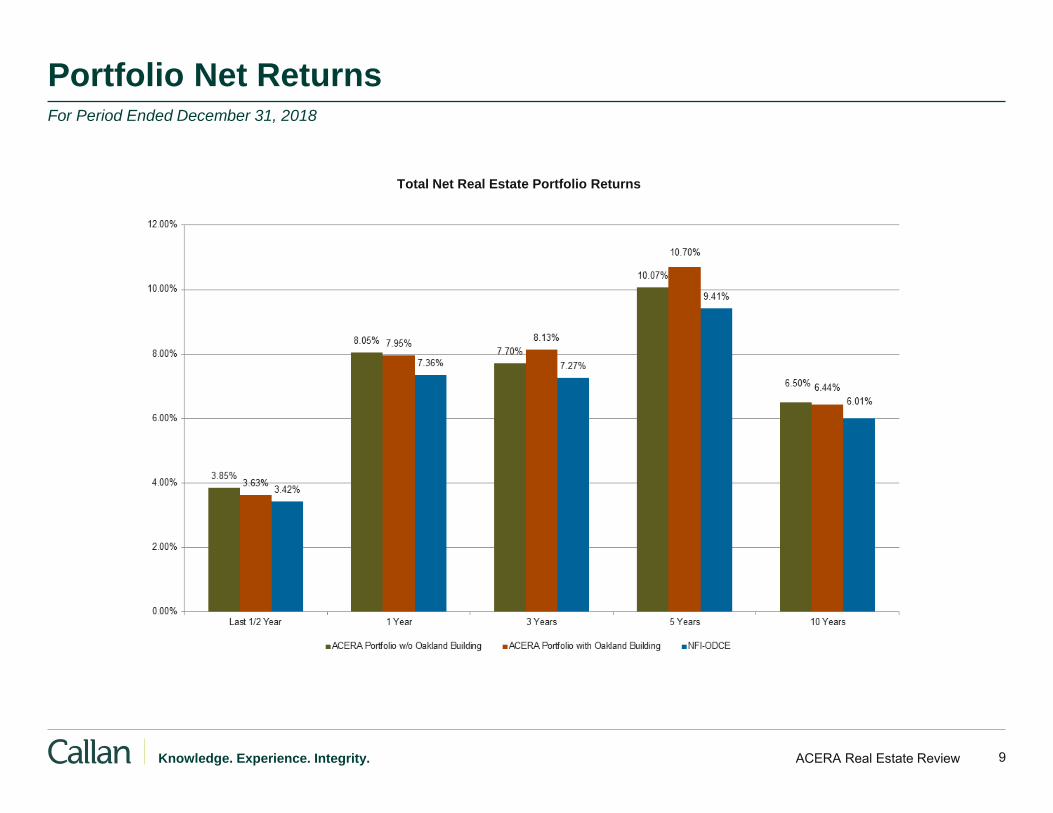
9 ACERA Real Estate Review Knowledge. Experience. Integrity.
Portfolio Net Returns
Total Net Real Estate Portfolio Returns
For Period Ended December 31, 2018
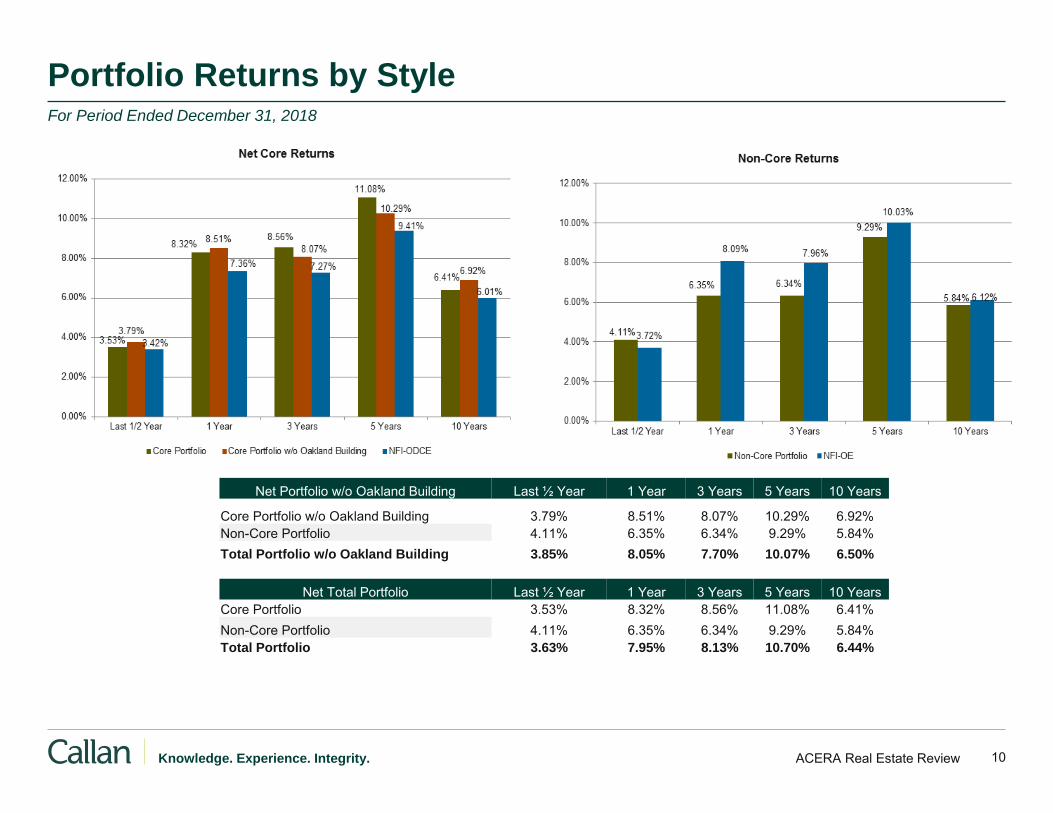
10 ACERA Real Estate Review Knowledge. Experience. Integrity.
Portfolio Returns by Style
Net Portfolio w/o Oakland Building Last ½ Year 1 Year 3 Years 5 Years 10 Years
Core Portfolio w/o Oakland Building 3.79% 8.51% 8.07% 10.29% 6.92% Non-Core Portfolio 4.11% 6.35% 6.34% 9.29% 5.84% Total Portfolio w/o Oakland Building 3.85% 8.05% 7.70% 10.07% 6.50%
Net Total Portfolio Last ½ Year 1 Year 3 Years 5 Years 10 Years Core Portfolio 3.53% 8.32% 8.56% 11.08% 6.41% Non-Core Portfolio 4.11% 6.35% 6.34% 9.29% 5.84% Total Portfolio 3.63% 7.95% 8.13% 10.70% 6.44%
For Period Ended December 31, 2018
11 ACERA Real Estate Review Knowledge. Experience. Integrity.
Performance Drivers and Detractors by Style
Core Portfolio (Excluding Oakland Building)
● The ACERA Core Portfolio has outperformed the benchmark during every period over the last ten years and it continued that trend this during the second half of 2018 beating the benchmark by 19 bps.
● The Lion Industrial Trust was the strongest performer during the second half of last year.
● The PGIM Prisa Fund was also a strong performer.
● The UBS Trumbull Property Fund was a weak performer for the Core Portfolio.
Non-Core Portfolio
● The portfolio’s outperformance was driven mainly by the CIM VI – 2 (Urban REIT) Fund.
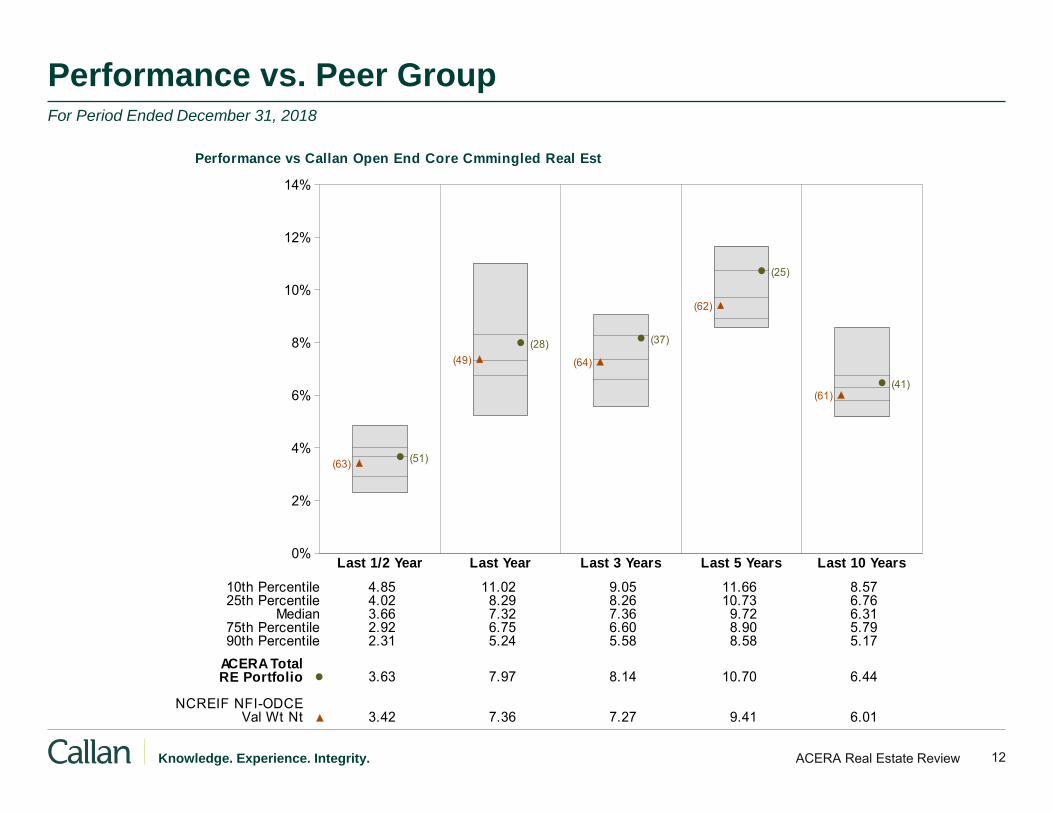
12 ACERA Real Estate Review Knowledge. Experience. Integrity.
Performance vs. Peer Group For Period Ended December 31, 2018
Performance vs Callan Open End Core Cmmingled Real Est
0%
2%
4%
6%
8%
10%
12%
14%
Last 1/2 Year Last Year Last 3 Years Last 5 Years Last 10 Years
(51)(63)
(28)(49)
(37)
(64)
(25)
(62)
(41)(61)
10th Percentile 4.85 11.02 9.05 11.66 8.5725th Percentile 4.02 8.29 8.26 10.73 6.76
Median 3.66 7.32 7.36 9.72 6.3175th Percentile 2.92 6.75 6.60 8.90 5.7990th Percentile 2.31 5.24 5.58 8.58 5.17
ACERA TotalRE Portfolio 3.63 7.97 8.14 10.70 6.44
NCREIF NFI-ODCEVal Wt Nt 3.42 7.36 7.27 9.41 6.01
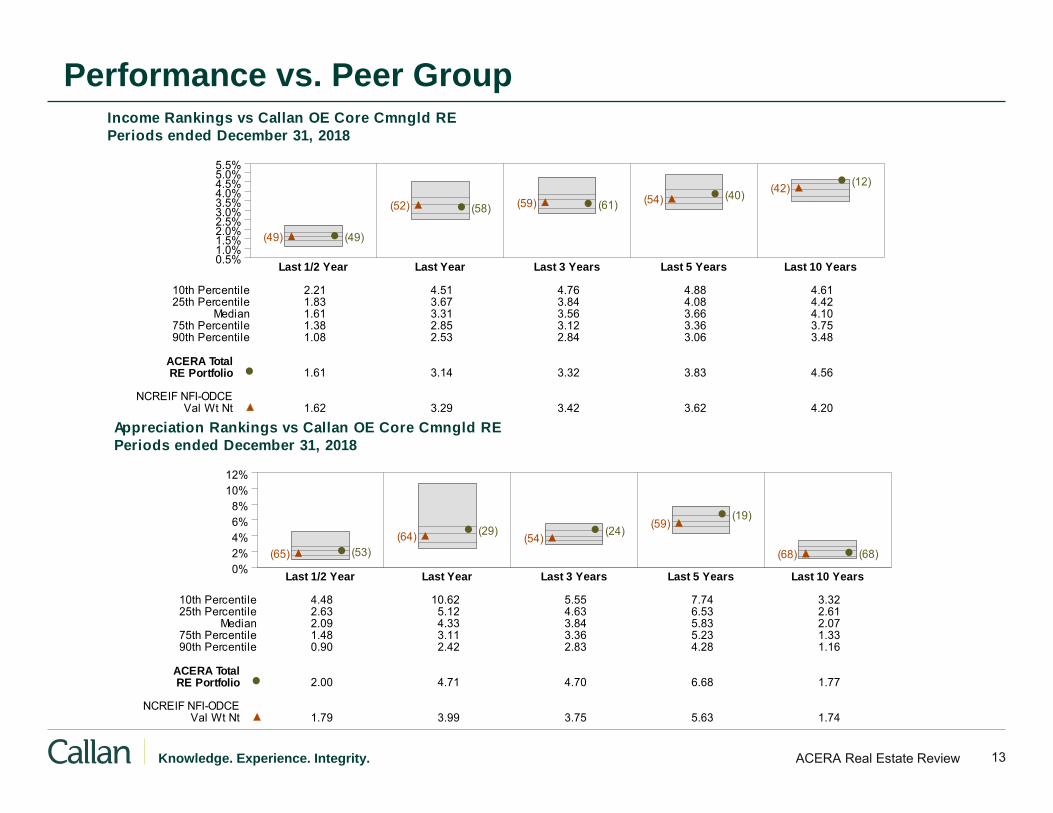
13 ACERA Real Estate Review Knowledge. Experience. Integrity.
Performance vs. Peer Group Income Rankings vs Callan OE Core Cmngld RE
Periods ended December 31, 2018
0.5%1.0%1.5%2.0%2.5%3.0%3.5%4.0%4.5%5.0%5.5%
Last 1/2 Year Last Year Last 3 Years Last 5 Years Last 10 Years
(49)(49)
(58)(52) (61)(59)(40)(54)
(12)(42)
10th Percentile 2.21 4.51 4.76 4.88 4.6125th Percentile 1.83 3.67 3.84 4.08 4.42
Median 1.61 3.31 3.56 3.66 4.1075th Percentile 1.38 2.85 3.12 3.36 3.7590th Percentile 1.08 2.53 2.84 3.06 3.48
ACERA TotalRE Portfolio 1.61 3.14 3.32 3.83 4.56
NCREIF NFI-ODCEVal Wt Nt 1.62 3.29 3.42 3.62 4.20
Appreciation Rankings vs Callan OE Core Cmngld RE
Periods ended December 31, 2018
0%2%4%6%8%
10%12%
Last 1/2 Year Last Year Last 3 Years Last 5 Years Last 10 Years
(53)(65)
(29)(64) (24)(54)
(19)(59)
(68)(68)
10th Percentile 4.48 10.62 5.55 7.74 3.3225th Percentile 2.63 5.12 4.63 6.53 2.61
Median 2.09 4.33 3.84 5.83 2.0775th Percentile 1.48 3.11 3.36 5.23 1.3390th Percentile 0.90 2.42 2.83 4.28 1.16
ACERA TotalRE Portfolio 2.00 4.71 4.70 6.68 1.77
NCREIF NFI-ODCEVal Wt Nt 1.79 3.99 3.75 5.63 1.74
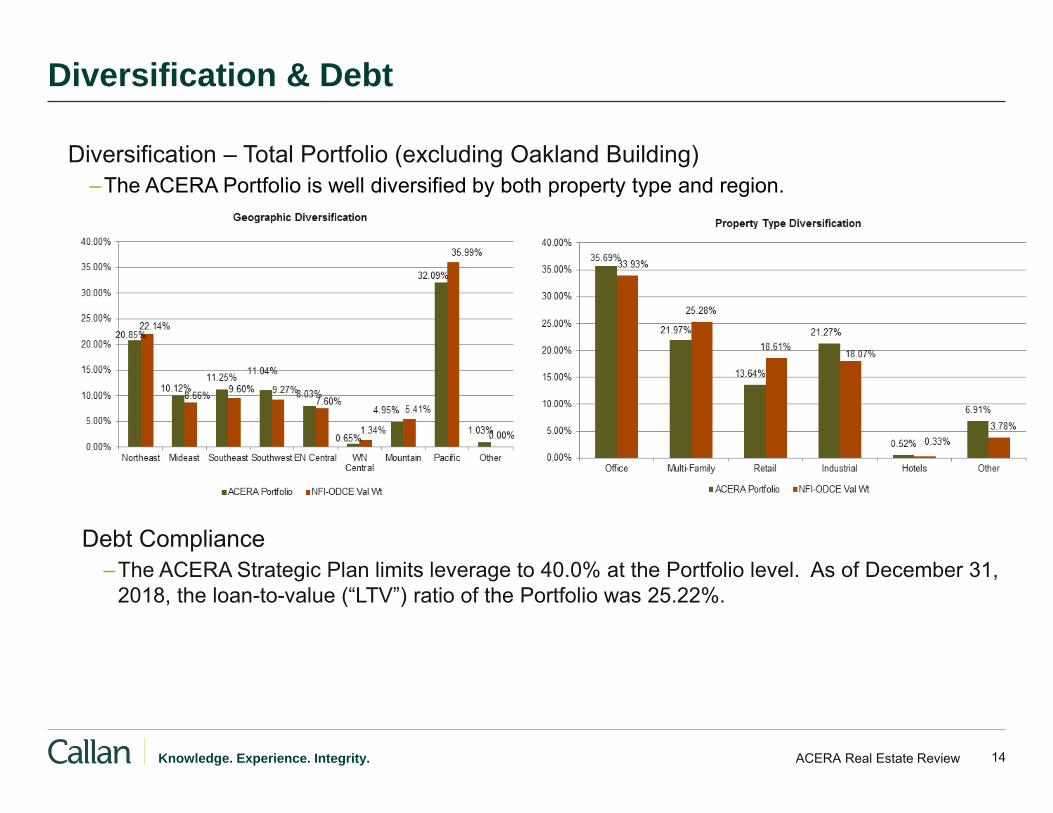
14 ACERA Real Estate Review Knowledge. Experience. Integrity.
Diversification & Debt
Debt Compliance –The ACERA Strategic Plan limits leverage to 40.0% at the Portfolio level. As of December 31,
2018, the loan-to-value (“LTV”) ratio of the Portfolio was 25.22%.
Diversification – Total Portfolio (excluding Oakland Building) –The ACERA Portfolio is well diversified by both property type and region.
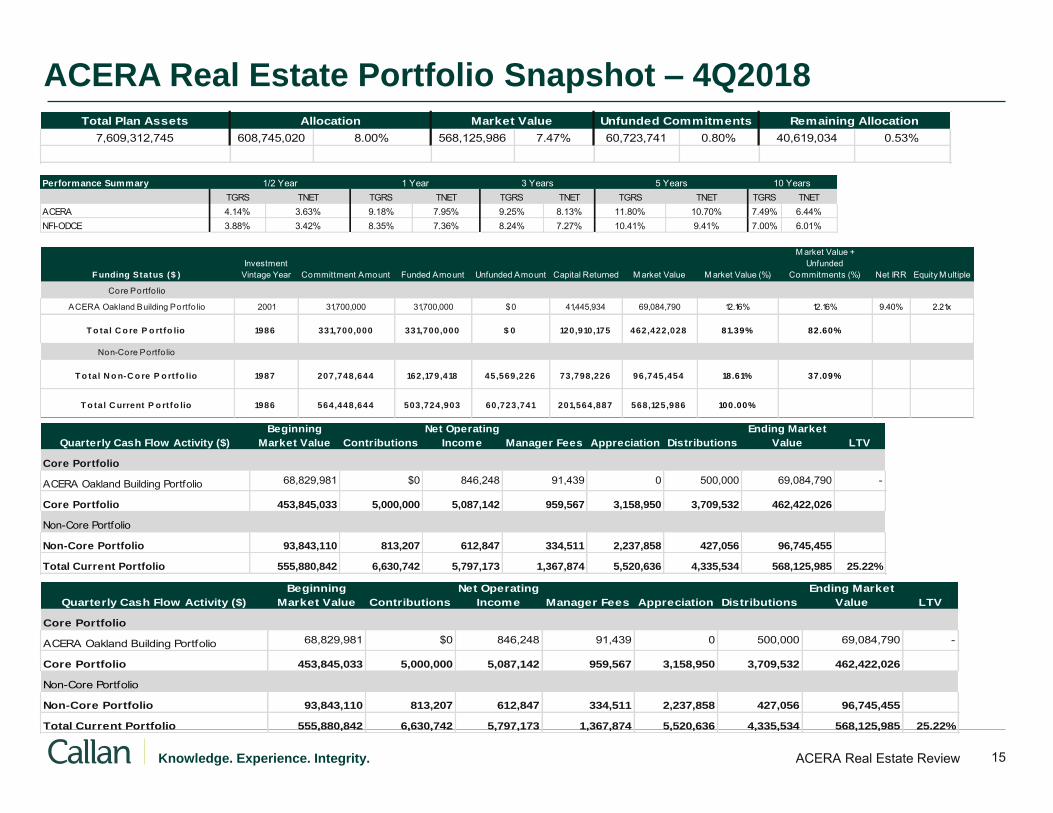
15 ACERA Real Estate Review Knowledge. Experience. Integrity.
ACERA Real Estate Portfolio Snapshot – 4Q2018
F unding Status ($ )
Investment Vintage Year Committment Amount Funded Amount Unfunded Amount Capital Returned M arket Value M arket Value (%)
M arket Value + Unfunded
Commitments (%) Net IRR Equity M ultiple
Core Portfo lio
ACERA Oakland Building Portfo lio 2001 31,700,000 31,700,000 $0 41,445,934 69,084,790 12.16% 12.16% 9.40% 2.21x
T o tal C o re P o rtfo lio 1986 331,700,000 331,700,000 $ 0 120,910,175 462,422,028 81.39% 82.60%
Non-Core Portfo lio
T o tal N o n-C o re P o rtfo lio 1987 207,748,644 162,179,418 45,569,226 73,798,226 96,745,454 18.61% 37.09%
T o tal C urrent P o rtfo lio 1986 564,448,644 503,724,903 60,723,741 201,564,887 568,125,986 100.00%
Performance Summary
TGRS TNET TGRS TNET TGRS TNET TGRS TNET TGRS TNETACERA 4.14% 3.63% 9.18% 7.95% 9.25% 8.13% 11.80% 10.70% 7.49% 6.44%NFI-ODCE 3.88% 3.42% 8.35% 7.36% 8.24% 7.27% 10.41% 9.41% 7.00% 6.01%
1/2 Year 1 Year 3 Years 5 Years 10 Years
Total Plan Assets
7,609,312,745 608,745,020 8.00% 568,125,986 7.47% 60,723,741 0.80% 40,619,034 0.53%Allocation Market Value Unfunded Commitments Remaining Allocation
Quarterly Cash Flow Activity ($)
Beginning
Market Value Contributions
Net Operating
Income Manager Fees Appreciation Distributions
Ending Market
Value LTV
Core Portfolio
ACERA Oakland Building Portfolio 68,829,981 $0 846,248 91,439 0 500,000 69,084,790 -
Core Portfolio 453,845,033 5,000,000 5,087,142 959,567 3,158,950 3,709,532 462,422,026
Non-Core Portfolio
Non-Core Portfolio 93,843,110 813,207 612,847 334,511 2,237,858 427,056 96,745,455
Total Current Portfolio 555,880,842 6,630,742 5,797,173 1,367,874 5,520,636 4,335,534 568,125,985 25.22%
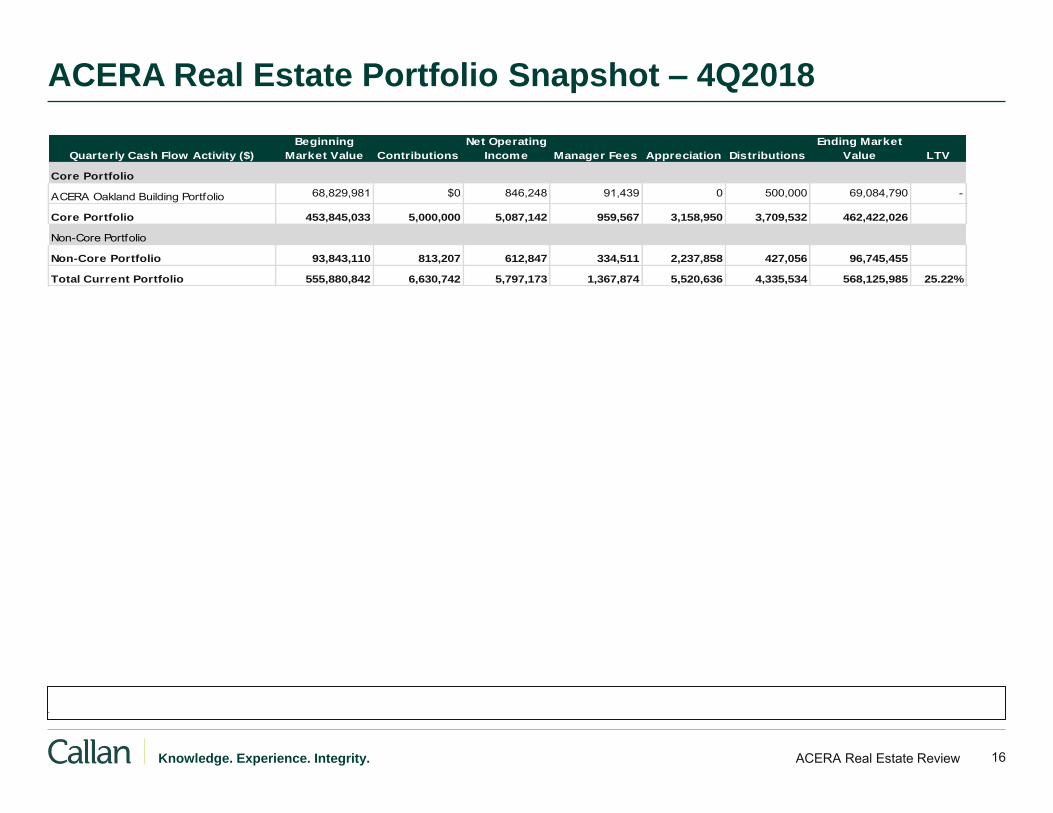
16 ACERA Real Estate Review Knowledge. Experience. Integrity.
ACERA Real Estate Portfolio Snapshot – 4Q2018
.
Quarterly Cash Flow Activity ($)
Beginning
Market Value Contributions
Net Operating
Income Manager Fees Appreciation Distributions
Ending Market
Value LTV
Core Portfolio
ACERA Oakland Building Portfolio 68,829,981 $0 846,248 91,439 0 500,000 69,084,790 -
Core Portfolio 453,845,033 5,000,000 5,087,142 959,567 3,158,950 3,709,532 462,422,026
Non-Core Portfolio
Non-Core Portfolio 93,843,110 813,207 612,847 334,511 2,237,858 427,056 96,745,455
Total Current Portfolio 555,880,842 6,630,742 5,797,173 1,367,874 5,520,636 4,335,534 568,125,985 25.22%
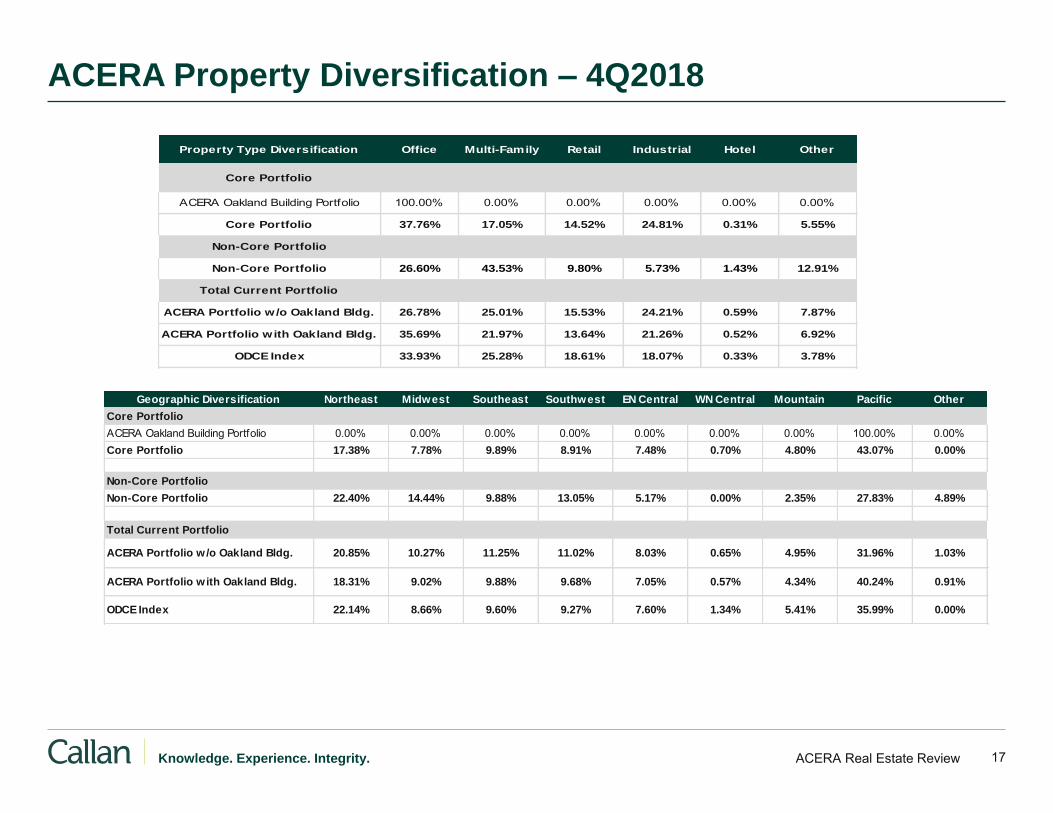
17 ACERA Real Estate Review Knowledge. Experience. Integrity.
ACERA Property Diversification – 4Q2018
Property Type Diversification Office Multi-Family Retail Industrial Hotel Other
Core Portfolio
ACERA Oakland Building Portfolio 100.00% 0.00% 0.00% 0.00% 0.00% 0.00%
Core Portfolio 37.76% 17.05% 14.52% 24.81% 0.31% 5.55%
Non-Core Portfolio
Non-Core Portfolio 26.60% 43.53% 9.80% 5.73% 1.43% 12.91%
Total Current Portfolio
ACERA Portfolio w/o Oakland Bldg. 26.78% 25.01% 15.53% 24.21% 0.59% 7.87%
ACERA Portfolio with Oakland Bldg. 35.69% 21.97% 13.64% 21.26% 0.52% 6.92%
ODCE Index 33.93% 25.28% 18.61% 18.07% 0.33% 3.78%
Geographic Diversification Northeast Midwest Southeast Southwest EN Central WN Central Mountain Pacific Other
Core Portfolio
ACERA Oakland Building Portfolio 0.00% 0.00% 0.00% 0.00% 0.00% 0.00% 0.00% 100.00% 0.00%Core Portfolio 17.38% 7.78% 9.89% 8.91% 7.48% 0.70% 4.80% 43.07% 0.00%
Non-Core Portfolio
Non-Core Portfolio 22.40% 14.44% 9.88% 13.05% 5.17% 0.00% 2.35% 27.83% 4.89%
Total Current Portfolio
ACERA Portfolio w/o Oakland Bldg. 20.85% 10.27% 11.25% 11.02% 8.03% 0.65% 4.95% 31.96% 1.03%
ACERA Portfolio with Oakland Bldg. 18.31% 9.02% 9.88% 9.68% 7.05% 0.57% 4.34% 40.24% 0.91%
ODCE Index 22.14% 8.66% 9.60% 9.27% 7.60% 1.34% 5.41% 35.99% 0.00%
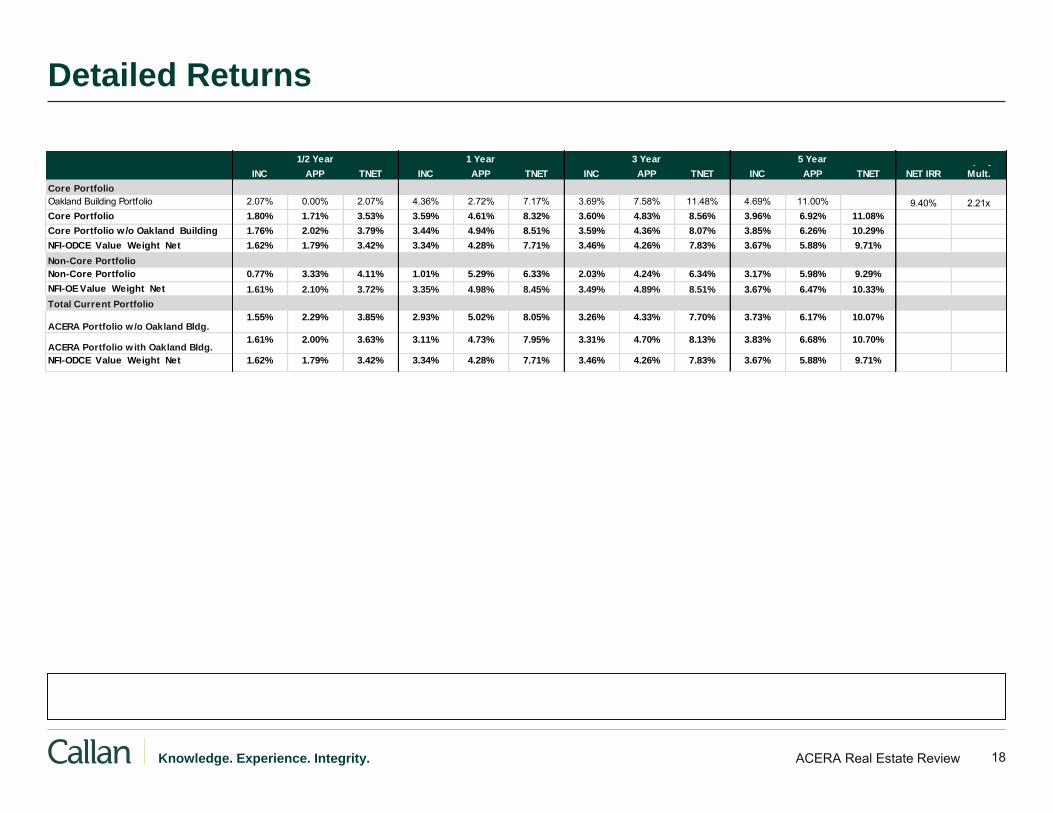
18 ACERA Real Estate Review Knowledge. Experience. Integrity.
Detailed Returns
INC APP TNET INC APP TNET INC APP TNET INC APP TNET NET IRR
Equity
Mult.
Core Portfolio
Oakland Building Portfolio 2.07% 0.00% 2.07% 4.36% 2.72% 7.17% 3.69% 7.58% 11.48% 4.69% 11.00% 9.40% 2.21xCore Portfolio 1.80% 1.71% 3.53% 3.59% 4.61% 8.32% 3.60% 4.83% 8.56% 3.96% 6.92% 11.08%
Core Portfolio w/o Oakland Building 1.76% 2.02% 3.79% 3.44% 4.94% 8.51% 3.59% 4.36% 8.07% 3.85% 6.26% 10.29%
NFI-ODCE Value Weight Net 1.62% 1.79% 3.42% 3.34% 4.28% 7.71% 3.46% 4.26% 7.83% 3.67% 5.88% 9.71%
Non-Core Portfolio
Non-Core Portfolio 0.77% 3.33% 4.11% 1.01% 5.29% 6.33% 2.03% 4.24% 6.34% 3.17% 5.98% 9.29%
NFI-OE Value Weight Net 1.61% 2.10% 3.72% 3.35% 4.98% 8.45% 3.49% 4.89% 8.51% 3.67% 6.47% 10.33%
Total Current Portfolio
ACERA Portfolio w/o Oakland Bldg.1.55% 2.29% 3.85% 2.93% 5.02% 8.05% 3.26% 4.33% 7.70% 3.73% 6.17% 10.07%
ACERA Portfolio with Oakland Bldg.1.61% 2.00% 3.63% 3.11% 4.73% 7.95% 3.31% 4.70% 8.13% 3.83% 6.68% 10.70%
NFI-ODCE Value Weight Net 1.62% 1.79% 3.42% 3.34% 4.28% 7.71% 3.46% 4.26% 7.83% 3.67% 5.88% 9.71%
1/2 Year 1 Year 3 Year 5 Year
19 ACERA Real Estate Review Knowledge. Experience. Integrity.
Performance
Capitalization rate: Commonly known as cap rate, is a rate that helps in evaluating a real estate investment. Cap rate = Net operating income / Current market value (Sale price) of the asset.
Net operating income: Commonly known as NOI, is the annual income generated by an income-producing property, taking into account all income collected from operations, and deducting all expenses incurred from operations.
Real Estate Appraisal: The act of estimating the value of a property. A real estate appraisal may take into account the quality of the property, values of surrounding properties, and market conditions in the area.
Income Return (“INC”): Net operating income net of debt service before deduction of capital items (e.g., roof replacement, renovations, etc.)
Appreciation Return (“APP”): Increase or decrease in an investment's value based on internal or third party appraisal, recognition of capital expenditures which did not add value, uncollectible accrued income, or realized gain or loss from sales.
Total Gross Return (“TGRS”): The sum of the income return and appreciation return before adjusting for fees paid to and/or accrued by the manager.
Total Net Return (“TNET”): Total gross return less Advisor fees reported. All fees are requested (asset management, accrued incentives, paid incentives). No fee data is verified. May not include any fees paid directly by the investor as opposed to those paid from cash flows.
Inception Returns: The total net return for an investment or portfolio over the period of time the client has had funds invested. Total portfolio Inception Returns may include returns from investments no longer held in the current portfolio.
Net IRR: IRR after advisory fees, incentive, and promote. This includes actual cash flows and a reversion representing the LP Net Assets at market value as of the period end reporting date.
Equity Multiple: The ratio of Total Value to Paid‐in‐Capital (TVPIC). It represents the Total Return of the investment to the original investment not taking into consideration the time invested. Total Value is computed by adding the Residual Value and Distributions. It is calculated net of all investment advisory and incentive fees and promote.
Definitions
20 ACERA Real Estate Review Knowledge. Experience. Integrity.
Style Groups
The Style Groups consist of returns from commingled funds with similar risk/return investment strategies. Investor portfolios/investments are compared to comparable style groupings.
Core: Direct investments in operating, fully leased, office, retail, industrial, or multifamily properties using little or no leverage (normally less than 30%).
Value‐Added: Core returning investments that take on moderate additional risk from one or more of the following sources: leasing, re‐development, exposure to non‐traditional property types, the use of leverage.
Opportunistic: Investments that take on additional risk in order to achieve a higher return. Typical sources of risks are: development, land investing, operating company investing, international exposure, high leverage, distressed properties.
Definitions
21 ACERA Real Estate Review Knowledge. Experience. Integrity.
Indices
Stylized Index: Weights the various style group participants so as to be comparable to the investor’s portfolio holdings for each period.
Open‐End Diversified Core Equity Index (“ODCE”): A core index that includes only open‐end diversified core strategy funds with at least 95% of their investments in U.S. markets. The ODCE is the first of the NCREIF Fund Database products, created in May 2005, and is an index of investment returns reporting on both a historical and current basis (24 active vehicles). The ODCE Index is capitalization‐weighted and is reported gross and net of fees. Measurement is time‐weighted and includes leverage.
NCREIF Fund Index Open‐End Index (“OE”): NFI-OE is an aggregate of open-end, commingled equity real estate funds with diverse investment strategies. Funds comprising NFI-OE have varied concentrations of sector and region, core and non-core, leverage, and life cycle.
NAREIT Equity Index: This is an index of Equity Real Estate Investment Trust returns reflecting the stock value changes of REIT issues as determined through public market transactions.
Definitions
22 ACERA Real Estate Review Knowledge. Experience. Integrity.
Cash Flow Statements
Beginning Market Value: Value of real estate, cash, and other holdings from prior period end.
Contributions: Cash funded to the investment for acquisition and capital items (i.e., initial investment cost or significant capital improvements).
Distributions: Actual cash returned from the investment, representing distributions of income from operations.
Withdrawals: Cash returned from the investment, representing returns of capital or net sales proceeds.
Ending Market Value: The value of an investment as determined by actual sales dollars invested and withdrawn plus the effects of appreciation and reinvestment; market value is equal to the ending cumulative balance of the cash flow statement (NAV).
Unfunded Commitments: Capital allocated to managers which has not yet been called for investment. Amounts are as reported by managers.
Remaining Allocation: The difference between the ending market value + the unfunded commitments and the target allocation. This figure represents dollars available for allocation.
Definitions
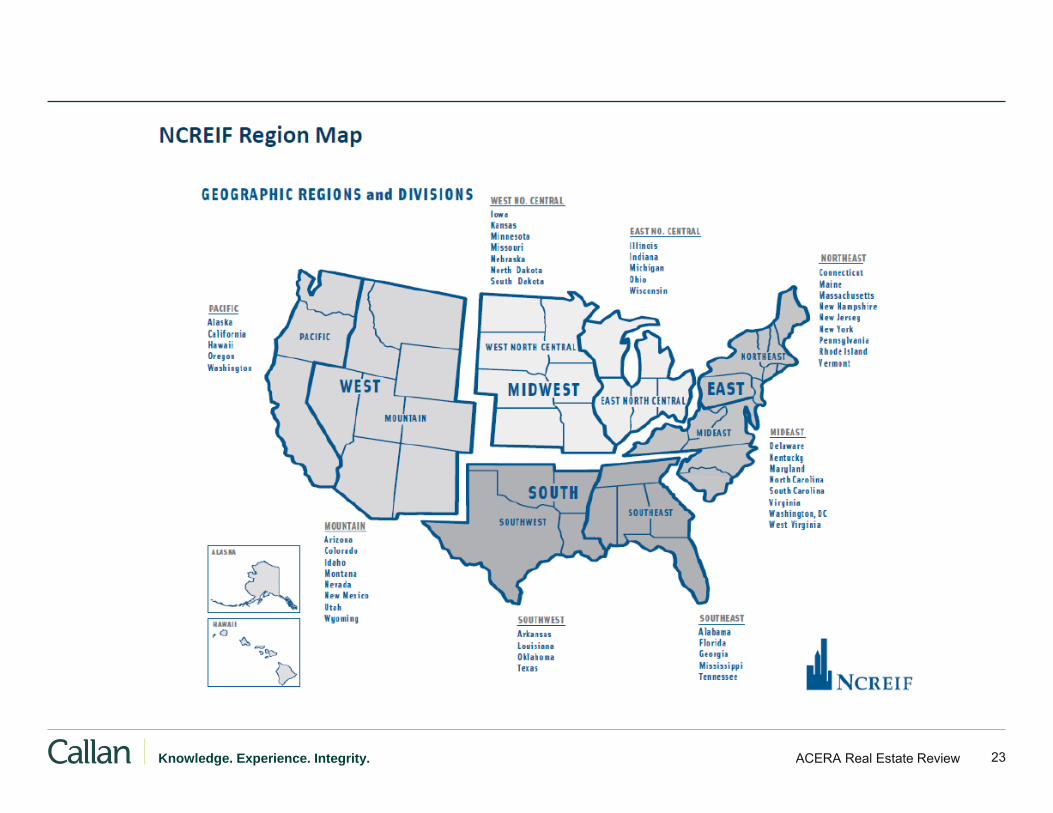
23 ACERA Real Estate Review Knowledge. Experience. Integrity.

INVESTMENT MANAGER, CONSULTANT, AND CUSTODIAN FEES
For Quarter Ending March 31, 2019
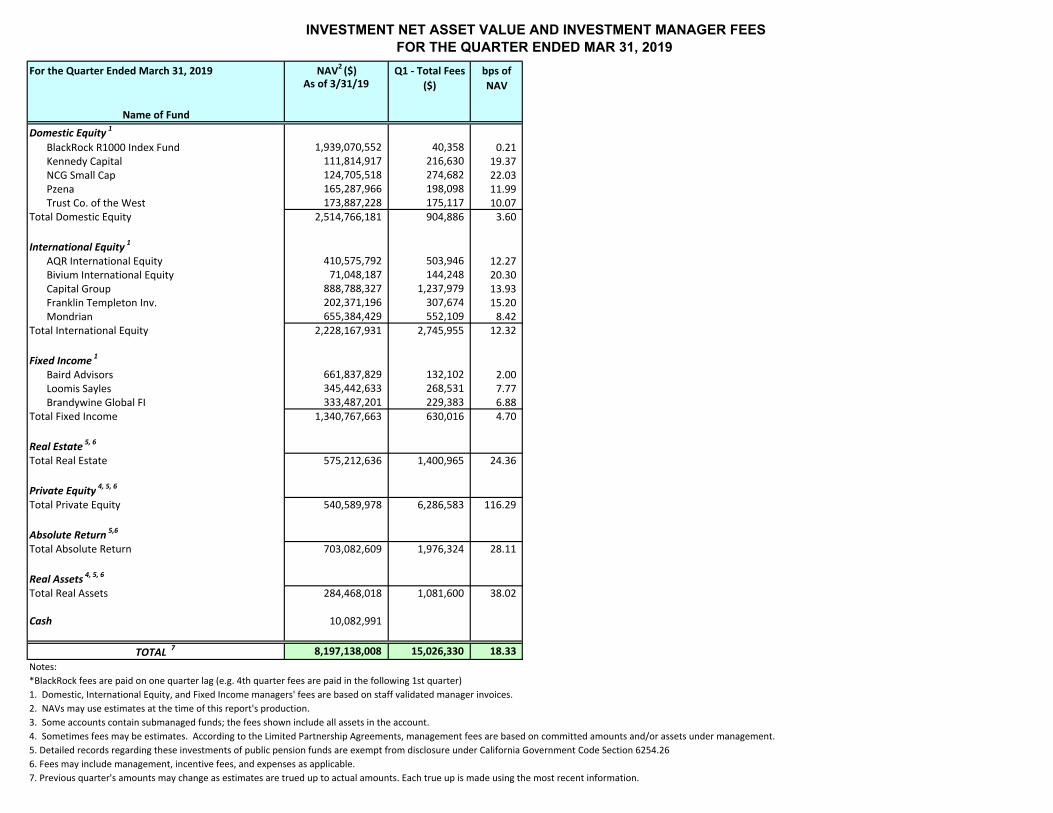
INVESTMENT NET ASSET VALUE AND INVESTMENT MANAGER FEESFOR THE QUARTER ENDED MAR 31, 2019
For the Quarter Ended March 31, 2019 NAV2 ($) Q1 ‐ Total Fees bps of
Name of Fund
As of 3/31/19 ($) NAV
Domestic Equity 1
BlackRock R1000 Index Fund 1,939,070,552 40,358 0.21 Kennedy Capital 111,814,917 216,630 19.37 NCG Small Cap 124,705,518 274,682 22.03 Pzena 165,287,966 198,098 11.99 Trust Co. of the West 173,887,228 175,117 10.07
Total Domestic Equity 2,514,766,181 904,886 3.60
International Equity 1
AQR International Equity 410,575,792 503,946 12.27 Bivium International Equity 71,048,187 144,248 20.30 Capital Group 888,788,327 1,237,979 13.93 Franklin Templeton Inv. 202,371,196 307,674 15.20 Mondrian 655,384,429 552,109 8.42
Total International Equity 2,228,167,931 2,745,955 12.32
Fixed Income 1
Baird Advisors 661,837,829 132,102 2.00 Loomis Sayles 345,442,633 268,531 7.77 Brandywine Global FI 333,487,201 229,383 6.88
Total Fixed Income 1,340,767,663 630,016 4.70
Real Estate 5, 6
Total Real Estate 575,212,636 1,400,965 24.36
Private Equity 4, 5, 6
Total Private Equity 540,589,978 6,286,583 116.29
Absolute Return 5,6
Total Absolute Return 703,082,609 1,976,324 28.11
Real Assets 4, 5, 6
Total Real Assets 284,468,018 1,081,600 38.02
Cash 10,082,991
TOTAL 7 8,197,138,008 15,026,330 18.33 Notes:*BlackRock fees are paid on one quarter lag (e.g. 4th quarter fees are paid in the following 1st quarter)1. Domestic, International Equity, and Fixed Income managers' fees are based on staff validated manager invoices. 2. NAVs may use estimates at the time of this report's production.3. Some accounts contain submanaged funds; the fees shown include all assets in the account.4. Sometimes fees may be estimates. According to the Limited Partnership Agreements, management fees are based on committed amounts and/or assets under management.5. Detailed records regarding these investments of public pension funds are exempt from disclosure under California Government Code Section 6254.266. Fees may include management, incentive fees, and expenses as applicable.7. Previous quarter's amounts may change as estimates are trued up to actual amounts. Each true up is made using the most recent information.
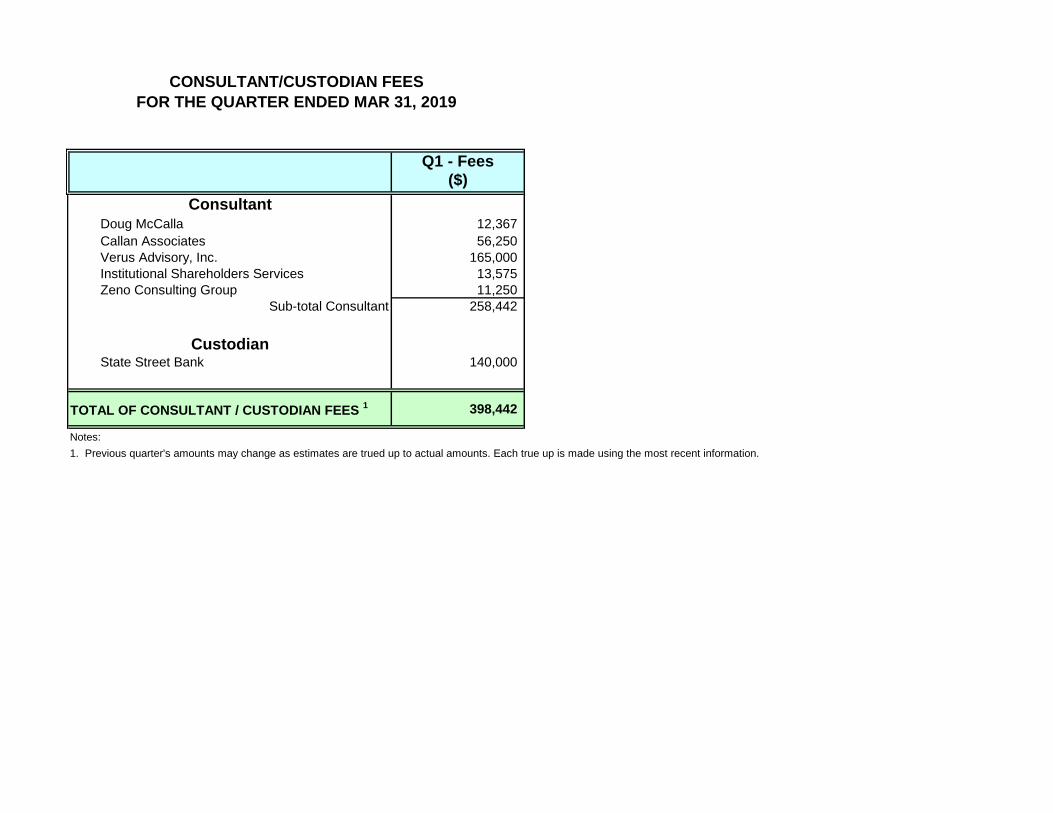
Q1 - Fees($)
Consultant Doug McCalla 12,367 Callan Associates 56,250 Verus Advisory, Inc. 165,000 Institutional Shareholders Services 13,575 Zeno Consulting Group 11,250
Sub-total Consultant 258,442
CustodianState Street Bank 140,000
TOTAL OF CONSULTANT / CUSTODIAN FEES 1 398,442
Notes:1. Previous quarter's amounts may change as estimates are trued up to actual amounts. Each true up is made using the most recent information.
CONSULTANT/CUSTODIAN FEES
FOR THE QUARTER ENDED MAR 31, 2019
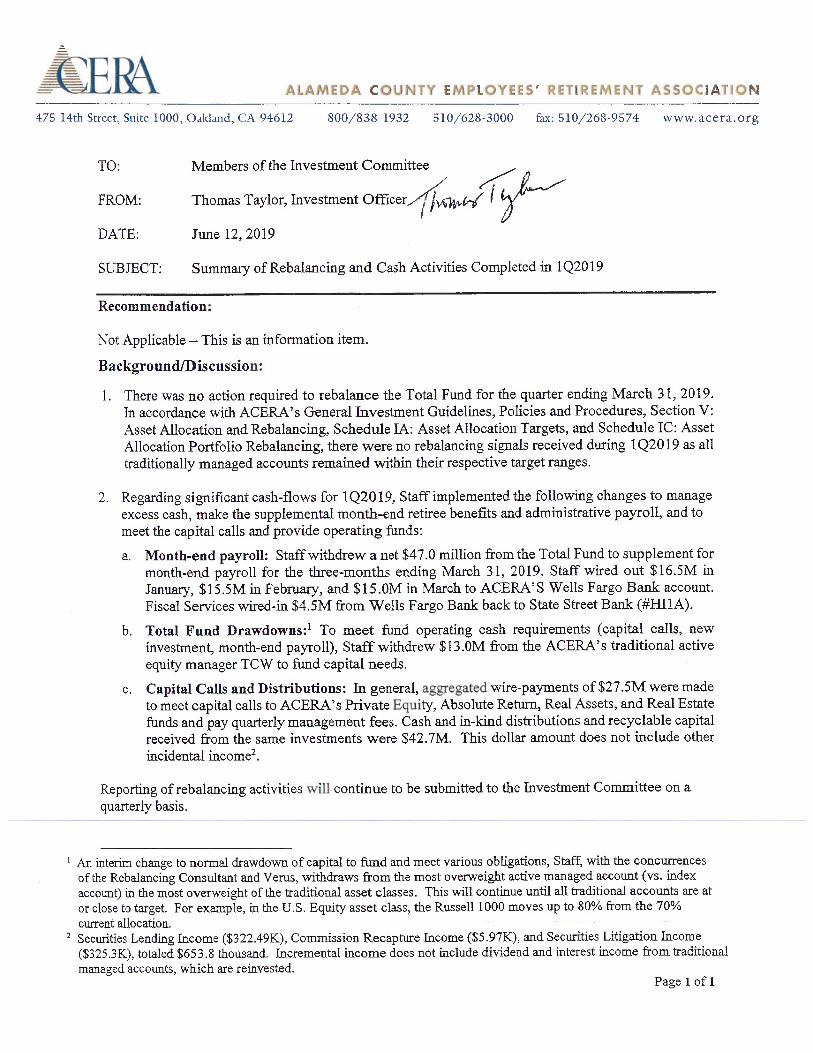
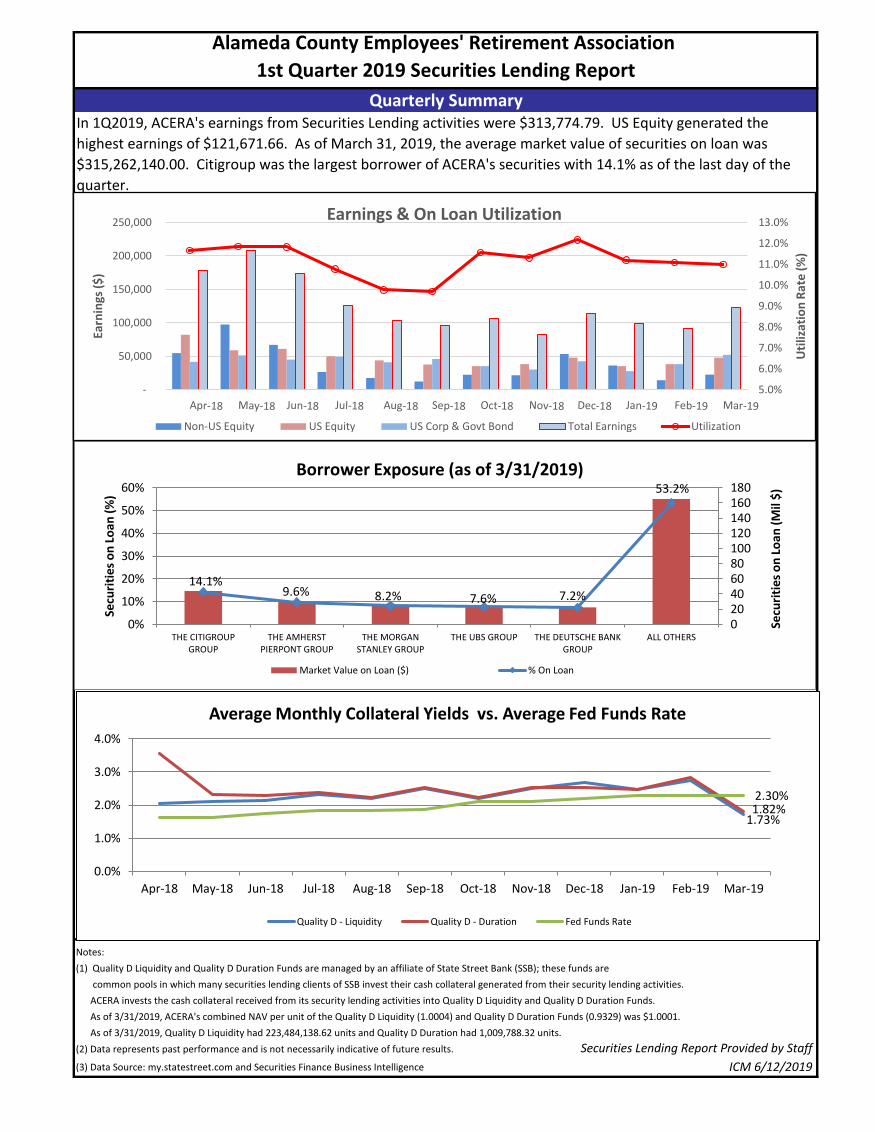
Notes:
(1) Quality D Liquidity and Quality D Duration Funds are managed by an affiliate of State Street Bank (SSB); these funds are
common pools in which many securities lending clients of SSB invest their cash collateral generated from their security lending activities.
ACERA invests the cash collateral received from its security lending activities into Quality D Liquidity and Quality D Duration Funds.
As of 3/31/2019, ACERA's combined NAV per unit of the Quality D Liquidity (1.0004) and Quality D Duration Funds (0.9329) was $1.0001.
As of 3/31/2019, Quality D Liquidity had 223,484,138.62 units and Quality D Duration had 1,009,788.32 units.
(2) Data represents past performance and is not necessarily indicative of future results. Securities Lending Report Provided by Staff
(3) Data Source: my.statestreet.com and Securities Finance Business Intelligence ICM 6/12/2019
Alameda County Employees' Retirement Association
1st Quarter 2019 Securities Lending Report
Quarterly SummaryIn 1Q2019, ACERA's earnings from Securities Lending activities were $313,774.79. US Equity generated the
highest earnings of $121,671.66. As of March 31, 2019, the average market value of securities on loan was
$315,262,140.00. Citigroup was the largest borrower of ACERA's securities with 14.1% as of the last day of the
quarter.
14.1%9.6% 8.2% 7.6% 7.2%
53.2%
020406080100120140160180
0%
10%
20%
30%
40%
50%
60%
THE CITIGROUPGROUP
THE AMHERSTPIERPONT GROUP
THE MORGANSTANLEY GROUP
THE UBS GROUP THE DEUTSCHE BANKGROUP
ALL OTHERS
Secu
riti
es o
n L
oan
(M
il $
)
Secu
riti
es o
n L
oan
(%
)
Borrower Exposure (as of 3/31/2019)
Market Value on Loan ($) % On Loan
1.73%1.82%2.30%
0.0%
1.0%
2.0%
3.0%
4.0%
Apr-18 May-18 Jun-18 Jul-18 Aug-18 Sep-18 Oct-18 Nov-18 Dec-18 Jan-19 Feb-19 Mar-19
Average Monthly Collateral Yields vs. Average Fed Funds Rate
Quality D - Liquidity Quality D - Duration Fed Funds Rate
5.0%
6.0%
7.0%
8.0%
9.0%
10.0%
11.0%
12.0%
13.0%
-
50,000
100,000
150,000
200,000
250,000
Uti
lizat
ion
Rat
e (%
)
Earn
ings
($)
Earnings & On Loan Utilization
Non-US Equity US Equity US Corp & Govt Bond Total Earnings Utilization
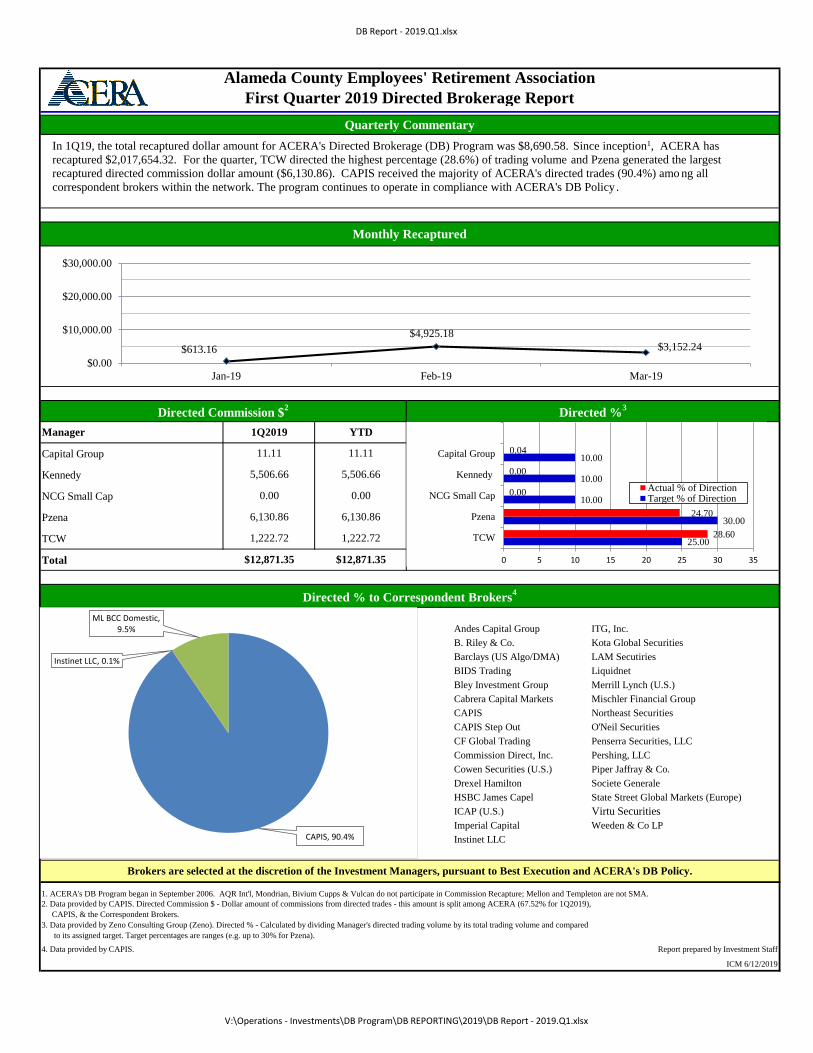
DB Report - 2019.Q1.xlsx
Capital Group
Kennedy
NCG Small Cap
Pzena
TCW
Total
Andes Capital Group ITG, Inc.
B. Riley & Co. Kota Global Securities
Barclays (US Algo/DMA) LAM Secutiries
BIDS Trading Liquidnet
Bley Investment Group Merrill Lynch (U.S.)
Cabrera Capital Markets Mischler Financial Group
CAPIS Northeast Securities
CAPIS Step Out O'Neil Securities
CF Global Trading Penserra Securities, LLC
Commission Direct, Inc. Pershing, LLC
Cowen Securities (U.S.) Piper Jaffray & Co.
Drexel Hamilton Societe Generale
HSBC James Capel State Street Global Markets (Europe)
ICAP (U.S.) Virtu Securities
Imperial Capital Weeden & Co LP
Instinet LLC
1. ACERA's DB Program began in September 2006. AQR Int'l, Mondrian, Bivium Cupps & Vulcan do not participate in Commission Recapture; Mellon and Templeton are not SMA.
4. Data provided by CAPIS. Report prepared by Investment Staff
ICM 6/12/2019
Manager 1Q2019 YTD
Alameda County Employees' Retirement Association
First Quarter 2019 Directed Brokerage Report
Quarterly Commentary
Monthly Recaptured
Directed Commission $2
Directed %3
11.11
5,506.66
0.00
6,130.86
11.11
3. Data provided by Zeno Consulting Group (Zeno). Directed % - Calculated by dividing Manager's directed trading volume by its total trading volume and compared
to its assigned target. Target percentages are ranges (e.g. up to 30% for Pzena).
5,506.66
0.00
6,130.86
1,222.72
Brokers are selected at the discretion of the Investment Managers, pursuant to Best Execution and ACERA's DB Policy.
2. Data provided by CAPIS. Directed Commission $ - Dollar amount of commissions from directed trades - this amount is split among ACERA (67.52% for 1Q2019),
CAPIS, & the Correspondent Brokers.
$12,871.35 $12,871.35
Directed % to Correspondent Brokers4
1,222.72 25.00
30.00
10.00
10.00
10.00
28.60
24.70
0.00
0.00
0.04
0 5 10 15 20 25 30 35
TCW
Pzena
NCG Small Cap
Kennedy
Capital Group
Actual % of DirectionTarget % of Direction
$613.16
$4,925.18
$3,152.24
$0.00
$10,000.00
$20,000.00
$30,000.00
Jan-19 Feb-19 Mar-19
In 1Q19, the total recaptured dollar amount for ACERA's Directed Brokerage (DB) Program was $8,690.58. Since inception1, ACERA has
recaptured $2,017,654.32. For the quarter, TCW directed the highest percentage (28.6%) of trading volume and Pzena generated the largest
recaptured directed commission dollar amount ($6,130.86). CAPIS received the majority of ACERA's directed trades (90.4%) amo ng all
correspondent brokers within the network. The program continues to operate in compliance with ACERA's DB Policy.
CAPIS, 90.4%
Instinet LLC, 0.1%
ML BCC Domestic, 9.5%
V:\Operations - Investments\DB Program\DB REPORTING\2019\DB Report - 2019.Q1.xlsx
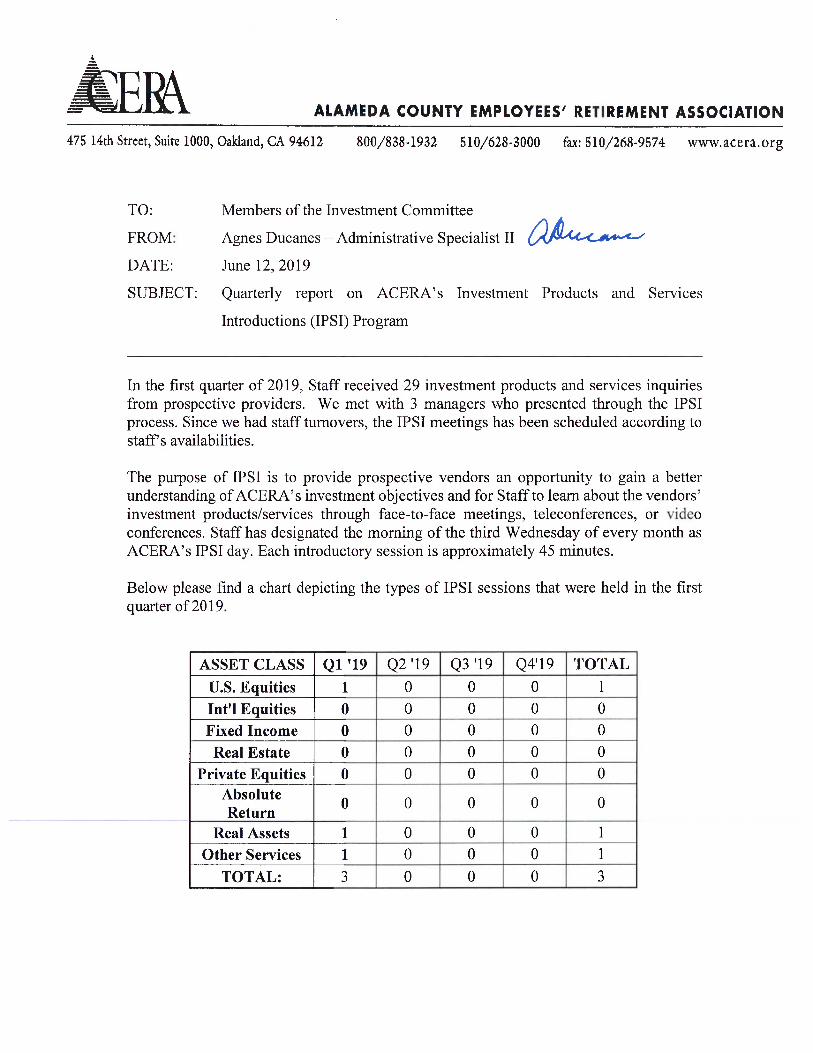
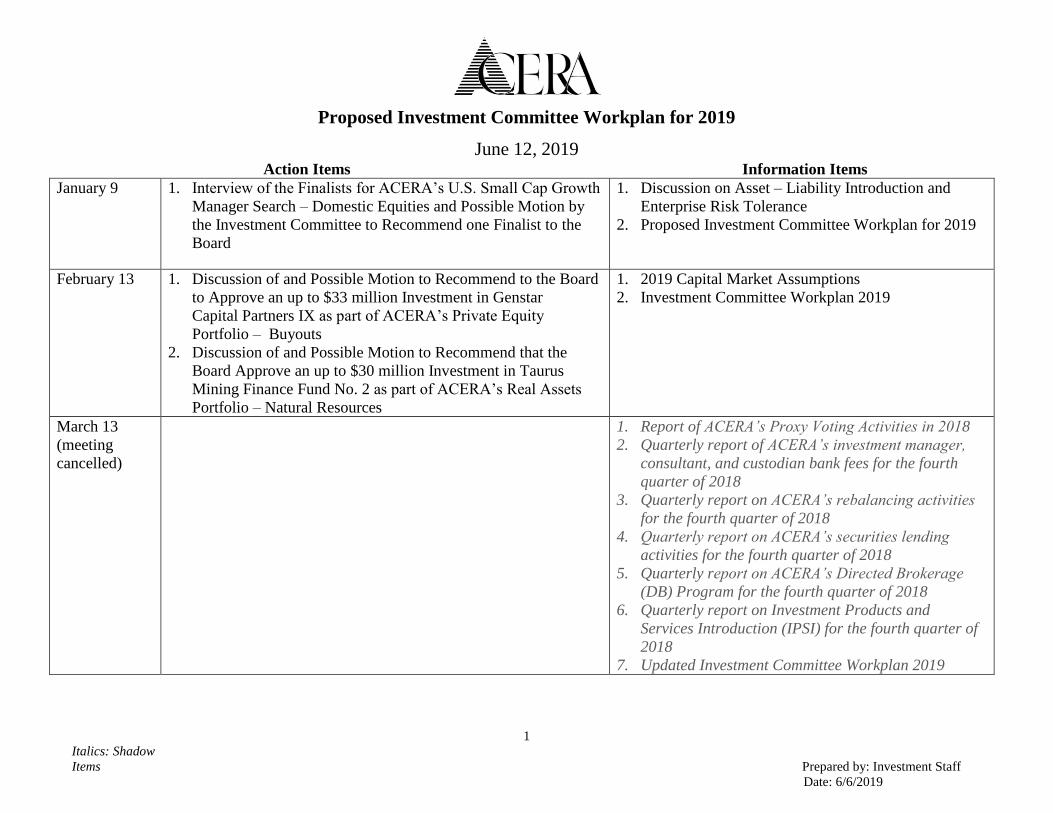
Proposed Investment Committee Workplan for 2019
June 12, 2019 Action Items Information Items
Italics: Shadow
Items Prepared by: Investment Staff
Date: 6/6/2019
1
January 9 1. Interview of the Finalists for ACERA’s U.S. Small Cap Growth
Manager Search – Domestic Equities and Possible Motion by
the Investment Committee to Recommend one Finalist to the
Board
1. Discussion on Asset – Liability Introduction and
Enterprise Risk Tolerance
2. Proposed Investment Committee Workplan for 2019
February 13
1. Discussion of and Possible Motion to Recommend to the Board
to Approve an up to $33 million Investment in Genstar
Capital Partners IX as part of ACERA’s Private Equity
Portfolio – Buyouts
2. Discussion of and Possible Motion to Recommend that the
Board Approve an up to $30 million Investment in Taurus
Mining Finance Fund No. 2 as part of ACERA’s Real Assets
Portfolio – Natural Resources
1. 2019 Capital Market Assumptions
2. Investment Committee Workplan 2019
March 13
(meeting
cancelled)
1. Report of ACERA’s Proxy Voting Activities in 2018
2. Quarterly report of ACERA’s investment manager,
consultant, and custodian bank fees for the fourth
quarter of 2018
3. Quarterly report on ACERA’s rebalancing activities
for the fourth quarter of 2018
4. Quarterly report on ACERA’s securities lending
activities for the fourth quarter of 2018
5. Quarterly report on ACERA’s Directed Brokerage
(DB) Program for the fourth quarter of 2018
6. Quarterly report on Investment Products and
Services Introduction (IPSI) for the fourth quarter of
2018
7. Updated Investment Committee Workplan 2019
Proposed Investment Committee Workplan for 2019
June 12, 2019 Action Items Information Items
Italics: Shadow
Items Prepared by: Investment Staff
Date: 6/6/2019
2
April 17 1. Discussion of and Possible Motion to Recommend to the Board
to Adopt an Investment in ACERA’s Real Estate Portfolio –
Core Plus Debt (JP Morgan Mezzanine Debt)
1. Asset – Liability Integration
2. Discussion of an establishment of a working group to
evaluate a possible ESG Policy
3. Closed Session: Govt. Code section 54956.81 –
Consider the purchase or sale of a specific pension
fund investment, and Govt. Code section 54957.1(d)
(4) – Anticipated litigation (1 matter)
May 15
(meeting
moved to third
Wednesday
due to SACRS
Conference)
1. Discussion of and Possible Motion to Recommend to the Board
to Adopt an up to $60 million Investment in Great Hill Equity
Partners VII as part of ACERA’s Private Equity Portfolio –
Buyouts and Venture Capital
2. Discussion of and Possible Motion to Recommend to the Board
to Adopt Alternative #2 in the Asset – Liability Integration
Study
1. Education Session: Timberland
2. Real Assets Policy Update: Modification of Index
Name in Benchmark Composite
June 12 1. Discussion of and Possible Motion to Recommend to the Board
to Adopt an up to $33 million Investment in Altas Partner
Holdings II as part of ACERA’s Private Equity Portfolio –
Buyouts
1. Review of Pzena Investment Management, LLC
(Traditional Manager – Large Cap Value)
2. Semiannual Performance Review for the Period
Ending March 31, 2019 – Equities and Fixed Income
3. Semiannual Performance Review for the Period
Ending December 31, 2018 – Private Equities
4. Semiannual Performance Review for the Period
Ending March 31, 2019 – Absolute Return
5. Semiannual Performance Review for the Period
Ending December 31, 2018 – Real Assets
6. Semiannual Performance Review for the Period
Ending March 31, 2019 – Real Estate
7. Closed Session: Govt. Code section 54956.81 –
Consider the purchase or sale of a specific pension
Proposed Investment Committee Workplan for 2019
June 12, 2019 Action Items Information Items
Italics: Shadow
Items Prepared by: Investment Staff
Date: 6/6/2019
3
fund investment, and Govt. Code section 54957.1(d)
(4) – Anticipated litigation (1 matter)
8. Quarterly report of ACERA’s investment manager,
consultant, and custodian fees for the first quarter of
2019
9. Quarterly report on ACERA’s rebalancing activities
for the first quarter of 2019
10. Quarterly report on ACERA’s securities lending
activities for the first quarter of 2019
11. Quarterly report on ACERA’s Directed Brokerage
(DB) Program for the first quarter of 2019
12. Quarterly report on Investment Products and
Services Introduction (IPSI) for the first quarter of
2019
13. Updated Investment Committee Workplan 2019
July 10 1. Discussion of and Possible Motion to Recommend to the Board
to Adopt Private Credit Investment Policy
1. Review of Trust Company of the West (Traditional
Manager – Large Cap Growth)
2. Report on ACERA’s U.S. Large Cap Value Manager
Search (tentative)
August 14 1. Discussion of and Possible Motion to Adopt the proposed
timeline, search criteria, and evaluation matrix for ACERA’s
U.S. Large Cap Value Manager Search (tentative)
2. Discussion of and Possible Motion to Recommend to the Board
to Adopt an Investment in ACERA’s Real Estate Portfolio
3. Discussion of and Possible Motion to Recommend to the Board
to Adopt an Investment in ACERA’s Real Assets Portfolio
1. Review of State Street Bank and Trust Company
2. Review of the Emerging Investment Manager Policy
(tentative)
3. Review of ESG Mission Statement (tentative)
Proposed Investment Committee Workplan for 2019
June 12, 2019 Action Items Information Items
Italics: Shadow
Items Prepared by: Investment Staff
Date: 6/6/2019
4
September 11 1. Discussion of and Possible Motion to Recommend to the Board
to Adopt Amendments on ACERA’s Emerging Manager Policy
2. Discussion of and Possible Motion to Recommend to the Board
to Adopt an Investment in ACERA’s Private Equities Portfolio
1. Review on Hedge Fund/Absolute Return
2. Quarterly report of ACERA’s investment manager,
consultant, and custodian bank fees for the second
quarter of 2019
3. Quarterly report on ACERA’s rebalancing activities
for the second quarter of 2019
4. Quarterly report on ACERA’s securities lending
activities for the second quarter of 2019
5. Quarterly report on ACERA’s Directed Brokerage
(DB) Program for the second quarter of 2019
6. Quarterly report on Investment Products and
Services Introduction (IPSI) for the second quarter of
2019
7. Updated Investment Committee Workplan for 2019
October 9
1. Discussion of and Possible Motion to Recommend to the Board
a possible Extension of the Custody Contract with State Street
Bank and Trust Company (tentative)
2. Discussion of and Possible Motion to Recommend to the Board
to Adopt an Investment in ACERA’s Private Equities Portfolio
– Private Credit
1. Education Session: Investment Due Diligence
November 6
(meeting
moved to first
Wednesday
due to SACRS
Conference)
1. Discussion of and Possible Motion to Recommend to the Board
to approve a short list of candidates for ACERA’s U.S. Large
Cap Value Manager Search (tentative)
2. Discussion of and Possible Motion to Recommend to the Board
to Adopt an Investment in ACERA’s Private Equities Portfolio
Proposed Investment Committee Workplan for 2019
June 12, 2019 Action Items Information Items
Italics: Shadow
Items Prepared by: Investment Staff
Date: 6/6/2019
5
December 11 1. Discussion of and Possible Motion to Recommend to the Board
to Approve the Finalists for ACERA’s U.S. Large Cap Value
Manager Search (tentative)
1. Semiannual Performance Review for the Period
Ending September 30, 2019 – Equities and Fixed
Income
2. Semiannual Performance Review for the Period
Ending June 30, 2019 – Private Equity
3. Semiannual Performance Review for the Period
Ending September 30, 2019 – Absolute Return
4. Semiannual Performance Review for the Period
Ending June 30, 2019 – Real Assets
5. Semiannual Performance Review for the Period
Ending September 30, 2019 – Real Estate
6. CA Gov. Code § 7514.7 Information Report
7. Quarterly report of ACERA’s investment manager,
consultant, and custodian bank fees for the third
quarter of 2019
8. Quarterly report on ACERA’s rebalancing activities
for the third quarter 2019
9. Quarterly report on ACERA’s securities lending
activities for the third quarter of 2019
10. Quarterly report on ACERA’s Directed Brokerage
(DB) Program for the third quarter of 2019
11. Quarterly report on Investment Products and
Services Introductions (IPSI) for the third quarter of
2019
12. Updated Investment Committee Workplan for 2019
Notes: 1. This workplan is subject to change without prior notice. Periodic rearrangements of agenda items will be made to the workplan to provide a reasonable length of time for each meeting. 2. Meeting date is assumed to be the second Wednesday of each month.
3. Educational sessions may be added to the Agenda from time-to-time e.g., Portable Alpha, Market and Currency Overlay, Equity Overlay, and Emerging Managers in Private Equity investments.
Recommendations and reports on ACERA’s Real Estate, Private Equity, Absolute Return, and Real Assets investments will be added to the Agenda from time-to-time.
Proposed Investment Committee Workplan for 2019
June 12, 2019 Action Items Information Items
Italics: Shadow
Items Prepared by: Investment Staff
Date: 6/6/2019
6
Future Items: 1. Interview of the Finalists for ACERA’s U.S. Large Cap Value
Manager Search and Possible Motion by the Investment
Committee to Recommend one Finalist to the Board (tentative)
2. Discussion of and Possible Motion to Recommend to the Board
to Adopt an Investment in ACERA’s Real Estate (Placeholder)
3. Discussion and Possible Motion to Recommend to the Board to
Adopt an Investment in Private Equities Portfolio (Placeholder)
4. Discussion of and Possible Motion to Recommend to the Board
to Adopt an Investment in ACERA’s Real Assets Portfolio
(Placeholder)
5. Discussion of and Possible Motion to Recommend to the Board
to Adopt an Investment in ACERA’s Absolute Return
(Placeholder)
6. Discussion of and Possible Motion to Recommend to the Board
to Adopt an Investment in ACERA’s Real Estate (Placeholder)