Embed Size (px)
Citation preview
pwc
Alberta Finance and Enterprise
Alberta Industry Sector Performance and Prospects May, 2009
Alberta Industry Sector Performance and Prospects
Alberta Finance and Enterprise
.
Table of Contents
Executive Summary
1 Introduction.....................................................................................................................................................1
1.1 Background .......................................................................................................................................1
1.2 Project Goals and Purpose ...............................................................................................................1
2 Macroeconomic Analysis ...............................................................................................................................3
2.1 Canadian Economy...........................................................................................................................3
2.2 Alberta Economy...............................................................................................................................7
3 Overall Economic and Industry Sector Trends ..............................................................................................9
4 Industry Sector Analysis...............................................................................................................................19
4.1 Oil and Gas Extraction ....................................................................................................................19
4.2 Energy Services ..............................................................................................................................31
4.3 Value added energy – Refined Petroleum and Chemicals .............................................................39
4.4 Primary Agriculture..........................................................................................................................50
4.5 Agri-Food Industries – Processed Food and Beverages ................................................................60
4.6 Forest Products ...............................................................................................................................69
4.7 Industrial Manufacturing..................................................................................................................77
4.8 Plastic Product Industries................................................................................................................84
4.9 Construction and Engineering.........................................................................................................89
4.10 Information and Communications Technology (ICT) ......................................................................98
4.11 Transportation and Logistics ..........................................................................................................106
4.12 Financial Services Industry ...........................................................................................................115
4.13 Tourism .........................................................................................................................................121
4.14 Aerospace and Defence................................................................................................................127
4.15 Environmental Products and Services ..........................................................................................134
4.16 Biotechnology and Medical Devices .............................................................................................140
4.17 Culture...........................................................................................................................................146
4.18 Education Services........................................................................................................................152
4.19 Health Care Services ....................................................................................................................160
Appendix A –ICT Sector Industry Sector Definition..........................................................................................168
Appendix B – Sources of Information and Indicator Definitions .......................................................................169
Alberta Industry Sector Performance and Prospects
Alberta Finance and Enterprise
Executive Summary Alberta’s economy has expanded at an extraordinary pace in recent years. This exceptional growth has driven living standards in Alberta to new heights. As of 2007, Alberta’s Gross Domestic Product (GDP) per capita, a proxy measure of living standards, was about 70% above the rest of Canada’s.
The origins of Alberta’s recent economic success can largely be traced to the surge in oil and gas prices. The price of West Texas Intermediate (WTI) crude oil jumped more than a fourfold between early 2004 and July 2008. Natural gas prices, while not experiencing the same increase, also remained above historical norms over this period.
Elevated energy prices spurred investment in Alberta’s oil patch. In Alberta’s oil sands, home to the world’s second largest proven reserve of oil, capital investment tripled between 2003 and 2007. With rising levels of investment came a frenzied pace of job creation in Alberta’s oil and gas industry. In terms of output, the oil and gas industry’s share of provincial nominal GDP rose to its highest level since the last major oil price spike nearly two decades earlier.
While the global energy boom most directly impacted the oil and gas industry, it has also created wide ranging benefits for other industries. Alberta’s construction industry, for example, was a major beneficiary of the massive amounts of capital spending in the oil and gas industry, as well as the subsequent surge in housing starts and infrastructure spending. Many manufacturing industries also benefited directly from growth in the oil and gas industry, which helped offset the effects of a stronger Canadian dollar. In particular, the industrial manufacturing sector (i.e. machinery manufacturing and metal fabrication), a major supplier of oil and gas field equipment, has seen its employment levels more than double since 1997. Within the service sector, huge inflows of capital into the energy sector produced greater volumes of financial transactions, lifting Alberta’s financial services industries. Alberta’s transportation industries also benefited greatly from the energy boom due to the need to transport rising volumes of materials and people.
However, some industries related to downstream oil and gas production have not fared as well. In particular, petroleum refineries, chemical manufacturers and the pipeline industry have grown at a slower rate than the provincial average since 2000, both in terms of employment and real GDP. Alberta’s new energy strategy addresses the need to develop the downstream component of the value chain. By moving Alberta’s raw energy resources up the value chain and converting them into other usable products, such as petrochemicals or refined products, Alberta can capture a greater share of the economic benefits from resource development. Outside the energy related industries, primary agriculture is the only industry sector to record negative GDP growth since 2000, brought down by drought conditions, bovine spongiform encepathlopathy (BSE), and rising input costs in recent years. The forest products sector has also suffered, held back by the U.S. housing crisis, high energy costs, mountain pine beetle and a strong dollar.
One area of relative weakness is the province’s productivity performance. While labour productivity in Alberta remains the highest of all provinces, growth in productivity has been lacklustre. This weak performance can largely be traced to the oil and gas sector, where soaring energy prices accelerated development of more costly conventional reserves as well as increased capital spending in the oil sands, where there are long lead times between construction and production. Another source of weakness has been the construction industry, where material and labour shortages has led to scheduling problems and an inefficient use of labour. Alberta’s productivity growth leaders have been the industrial manufacturing, information and communications technology (ICT) and primary agriculture sectors. Moving forward, investments in business R&D, machinery and equipment and training will be key to achieving productivity growth in the future. The Alberta Government’s new 10% provincial R&D tax credit should boost Alberta’s business R&D performance, while the $100 million Alberta Enterprise Corporation will help alleviate Alberta’s venture capital shortfall and improve rates of technology commercialization.
Alberta Industry Sector Performance and Prospects
Alberta Finance and Enterprise
In recent years, many industry sectors have faced chronic labour shortages. Even with the huge influx of new workers entering the province, Alberta’s labour market remained tight. Labour shortages put enormous upward pressure on wages, driving up business costs across the province. While cost pressures originated in the oil and gas industry, they also spread to other sectors. Companies in all industries competed for an ever shrinking pool of qualified workers and many were forced to match salaries in the over-heated oil and gas industry. Moreover, these cost pressures have eroded Alberta’s international cost competitiveness in recent years.
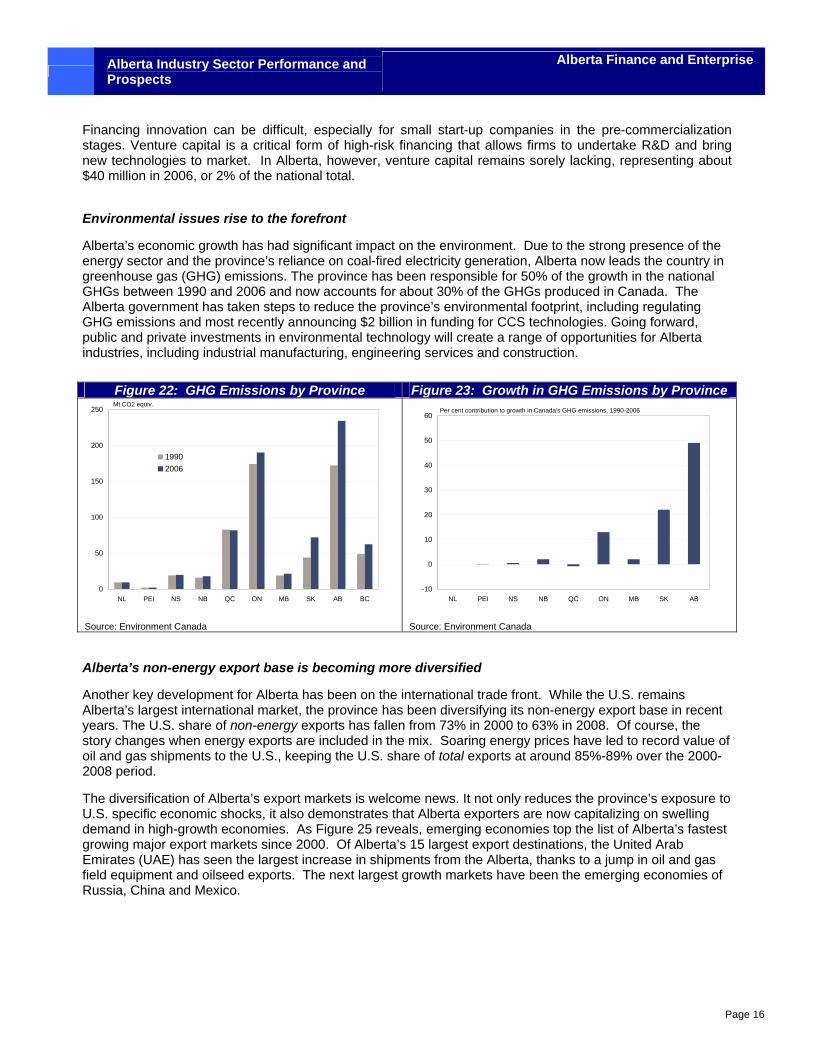
Alberta’s economic growth has had significant impact on the environment. Due to the strong presence of the energy sector and the province’s reliance on coal-fired electricity generation, Alberta now leads the country in greenhouse gas (GHG) emissions and growth in GHGs since 1990. Going forward, public and private investments in environmental technology, such as carbon capture and storage (CCS), will create a range of opportunities for Alberta industries, including industrial manufacturing, engineering services and construction.
Another key development for Alberta has been on the international trade front. While the U.S. remains Alberta’s largest international market, the province has been diversifying its non-energy export base in recent years. Ongoing diversification outside U.S. markets will be key to the growth of most industry sectors, particularly given the current weakness south of the border.
Looking ahead, 2009 should be a reversal of fortunes for the oil and gas sector and its related industries (e.g. energy services). Falling revenues, uncertainty in the global economy, and weak financing conditions have already translated into several oil and gas projects being cancelled or put on hold. The Canadian Association of Petroleum Producers (CAPP) expects oil sands investment to plunge 50% in 2009 from record levels reached in 2008 and overall drilling activity to decline by about 30%.1 Providing a partial offset to the weak revenue outlook is a reduction of cost pressures, reflecting a softening labour market and lower material costs.
1 CAPP. 2009. “Canada’s Oil, Natural Gas and Oil Sands Overview and Outlook”. Washington D.C. Presentation
Alberta Industry Sector Performance and Prospects
Alberta Finance and Enterprise
Page 1
1 Introduction 1.1 Background The current financial crisis, the collapse in oil prices and the global economic recession has ushered in a period of heightened uncertainty for Alberta’s economy. As a result, it is now expected that, after several years of robust economic growth, Alberta’s economy will slow significantly in the near term. Recent events serve as a reminder that Alberta’s long-run economic prosperity depends not on market fluctuations, such as changes in oil prices, but on ensuring that its industries remain globally competitive and productive.
The Alberta Government is committed to improving Alberta’s industry competitiveness and productivity and intends to develop a strategy to meet these goals. To assist with this initiative, the Economic Policy and Analysis branch of the Ministry of Alberta Finance and Enterprise commissioned PricewaterhouseCoopers to examine the performance and prospects for key industry sectors in Alberta.
1.2 Project Goals and Purpose This study examines recent performance and prospects across a number of Alberta’s key industry sectors. To provide context, the study begins with a review of the economic environment in Canada and Alberta and description of overall industry trends.
The goals of the project are:
• To develop industry sector profiles, including a snapshot of recent performance and a general description of the structure of the sector.
• To analyze overall economic trends, such as employment shifts towards service producing industries, and changes in productivity.
• To provide an analysis of recent industry sector performance, including an assessment of the factors influencing growth and performance across each of the industry sectors since 2000.
• To examine growth prospects and threats for each sector, including but not limited to the impacts of the recent financial crises and global recession. This will be addressed through a Strength Weaknesses Opportunities Threats (SWOT) analysis for each sector.
The report will cover the following industry sectors:
• Primary energy – conventional oil and gas, oil sands
• Engineering and construction
• Energy service industries • Information communications and technology (ICT)
• Value added energy – refined petroleum and chemicals
• Transportation and Logistics
• Primary agriculture • Financial services industries
• Agri-food industries – processed food and beverages
• Tourism
Alberta Industry Sector Performance and Prospects
Alberta Finance and Enterprise
Page 2
• Forest products – wood building products and paper/pulp
• Cultural industries
• Industrial manufacturing – metal fabrication and industrial machinery and equipment
• Educational services
• Plastic product industries • Healthcare services
• Biotechnology and medical devices • Environmental products and services
• Aerospace and defence
Alberta Industry Sector Performance and Prospects
Alberta Finance and Enterprise
Page 3
2 Macroeconomic Analysis 2.1 Canadian Economy Introduction
As of the fourth quarter of 2008, the Canadian economy has been mired in what is turning out to be a serious recession. Over the past year, a collapsing U.S. housing market and turmoil in credit and financial markets have pushed the U.S. economy into a deep and protracted recession that has spilled over to other G8 countries2 and emerging markets. As an export oriented economy, the global recession and prospects for a global recovery are particularly significant for Canada.
The following section will review how the Canadian economy fell into recession, and the outlook for recovery.
2008 Year in Review: Global Financial Crisis
2008 will be remembered as a year of almost unprecedented volatility and market failure. The year began under a cloud of uncertainty and market tension due to the ongoing housing market collapse in the United States. Financial market tensions began on March 13, 2008, when it was revealed that Bear Stearns, one of the oldest and most venerable investment banks in the United States, was in serious financial trouble and would not survive the week without a large infusion of capital. An immediate crisis was deferred when the Federal Reserve (the Fed) facilitated the sale of Bear Stearns to J.P. Morgan for just $2 a share. The financial market remained highly constrained until the first week of September, when U.S. mortgage giants Fannie Mae and Freddie Mac were effectively nationalized. This was followed by the revelation that Lehman Brothers, another large U.S. investment bank, was in dire financial trouble. With no private sector partners willing to take on its troubles, the Fed and the U.S. Treasury opted to let Lehman Brothers fail. On the day Lehman filed for bankruptcy, Merrill Lynch announced that it had sold itself to Bank of America to avoid a similar fate. These heretofore unthinkable financial market events were capped when American Insurance Group (AIG), at the time the largest insurance company in the world, required a massive $85 billion bailout after revealing that it did not have sufficient liquidity to cover margin calls arising from its deteriorating credit rating.
Subsequently, risk spreads, already at heightened levels due to ongoing tension in credit markets, exploded. The failure of Lehman Brothers created an environment of extreme risk aversion, in which financial institutions became reluctant to lend to each other, uncertain of who might be the next to fail. This resulted in the interbank-lending market, effectively the oil in the engine of credit markets, coming to a virtual standstill. As credit dried up, the world economy went into a tailspin and global equity markets plummeted.
As the year came to a close, nearly all advanced economies were in or on the brink of recession and dealing with their own domestic financial crises while growth in emerging market economies like China and India had slowed considerably. The ongoing impact of the 2008 financial crisis has lead the International Monetary Fund (IMF) to dramatically revise its outlook for the global economy, prediction a contraction in world economic growth in 2009 and a very weak recovery in 2010.
2 Includes Canada, France, Germany, Italy, Japan, Russia, the U.S., and the U.K.
Alberta Industry Sector Performance and Prospects
Alberta Finance and Enterprise
Page 4
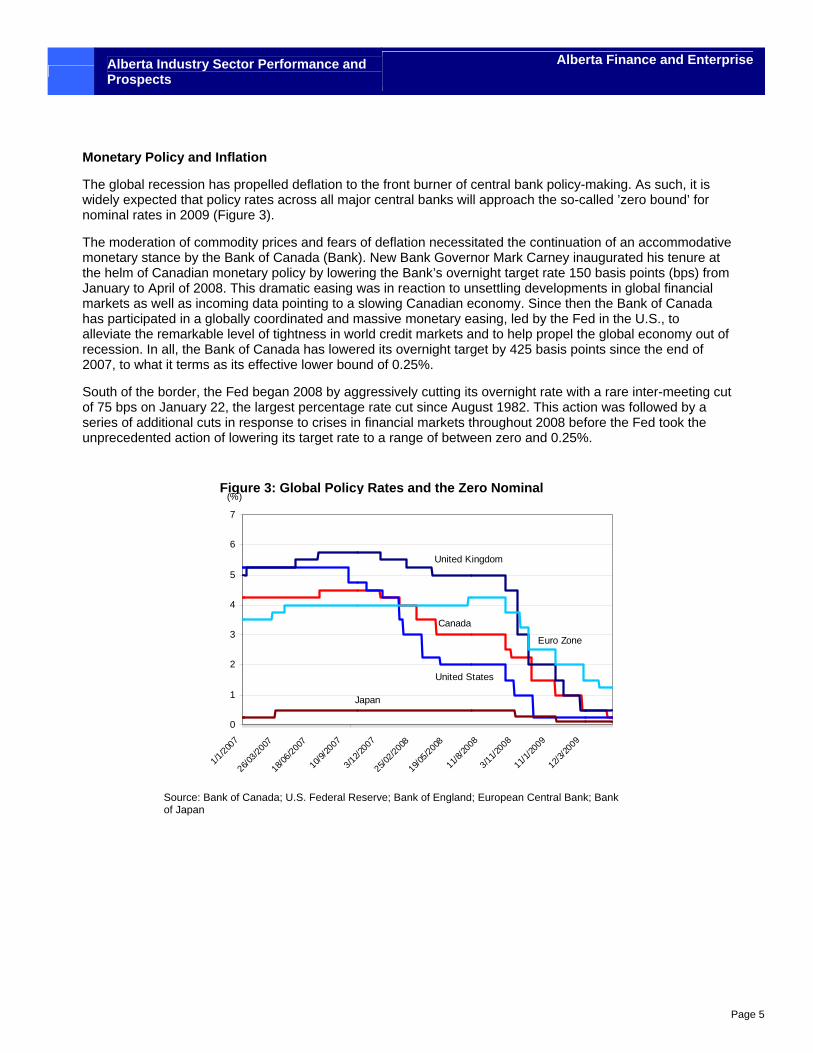
Figure 2: “Canadian Petro Dollar” continues to track oil prices
The Canadian Economy in 2008
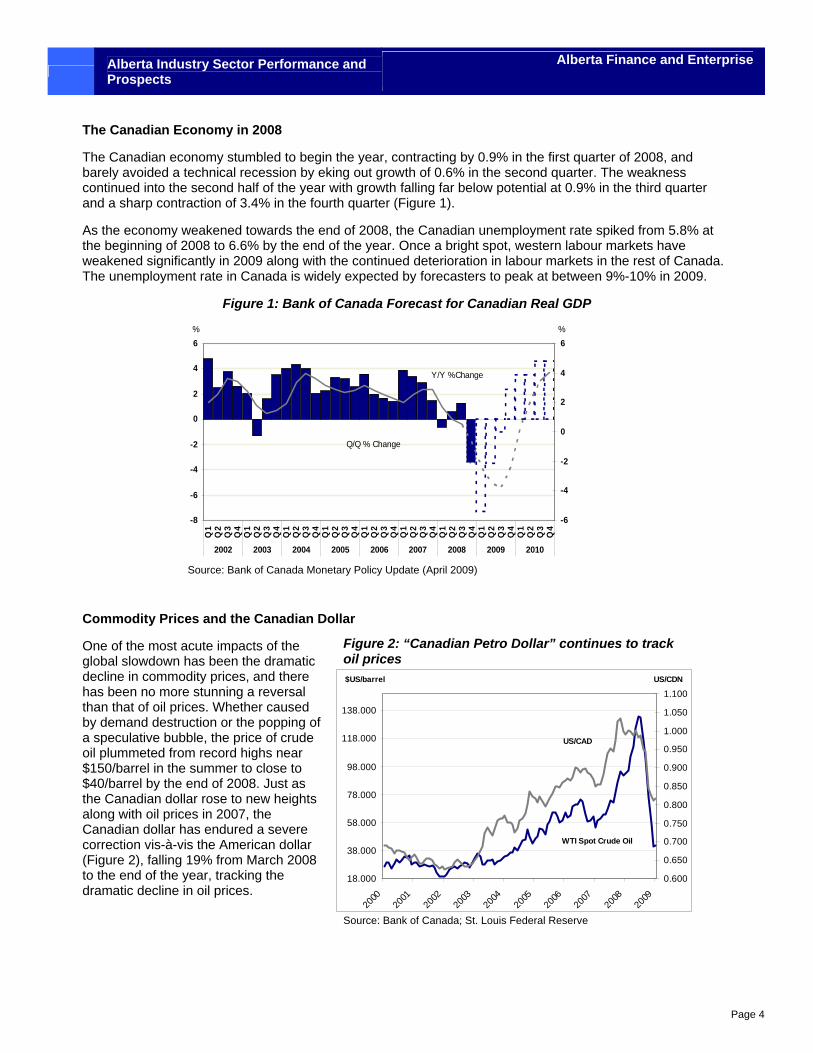
The Canadian economy stumbled to begin the year, contracting by 0.9% in the first quarter of 2008, and barely avoided a technical recession by eking out growth of 0.6% in the second quarter. The weakness continued into the second half of the year with growth falling far below potential at 0.9% in the third quarter and a sharp contraction of 3.4% in the fourth quarter (Figure 1).
As the economy weakened towards the end of 2008, the Canadian unemployment rate spiked from 5.8% at the beginning of 2008 to 6.6% by the end of the year. Once a bright spot, western labour markets have weakened significantly in 2009 along with the continued deterioration in labour markets in the rest of Canada. The unemployment rate in Canada is widely expected by forecasters to peak at between 9%-10% in 2009.
Figure 1: Bank of Canada Forecast for Canadian Real GDP
Commodity Prices and the Canadian Dollar
One of the most acute impacts of the global slowdown has been the dramatic decline in commodity prices, and there has been no more stunning a reversal than that of oil prices. Whether caused by demand destruction or the popping of a speculative bubble, the price of crude oil plummeted from record highs near $150/barrel in the summer to close to $40/barrel by the end of 2008. Just as the Canadian dollar rose to new heights along with oil prices in 2007, the Canadian dollar has endured a severe correction vis-à-vis the American dollar (Figure 2), falling 19% from March 2008 to the end of the year, tracking the dramatic decline in oil prices.
Source: Bank of Canada; St. Louis Federal Reserve
Source: Bank of Canada Monetary Policy Update (April 2009)
-8
-6
-4
-2
0
2
4
6
Q1
Q2
Q3
Q4
Q1
Q2
Q3
Q4
Q1
Q2
Q3
Q4
Q1
Q2
Q3
Q4
Q1
Q2
Q3
Q4
Q1
Q2
Q3
Q4
Q1
Q2
Q3
Q4
Q1
Q2
Q3
Q4
Q1
Q2
Q3
Q4
2002 2003 2004 2005 2006 2007 2008 2009 2010
-6
-4
-2
0
2
4
6%
Y/Y %Change
Q/Q % Change
%
18.000
38.000
58.000
78.000
98.000
118.000
138.000
2000
2001
2002
2003
2004
2005
2006
2007
2008
2009
0.600
0.650
0.700
0.750
0.800
0.850
0.900
0.950
1.000
1.050
1.100
US/CAD
WTI Spot Crude Oil
$US/barrel US/CDN
Alberta Industry Sector Performance and Prospects
Alberta Finance and Enterprise
Page 5
Monetary Policy and Inflation
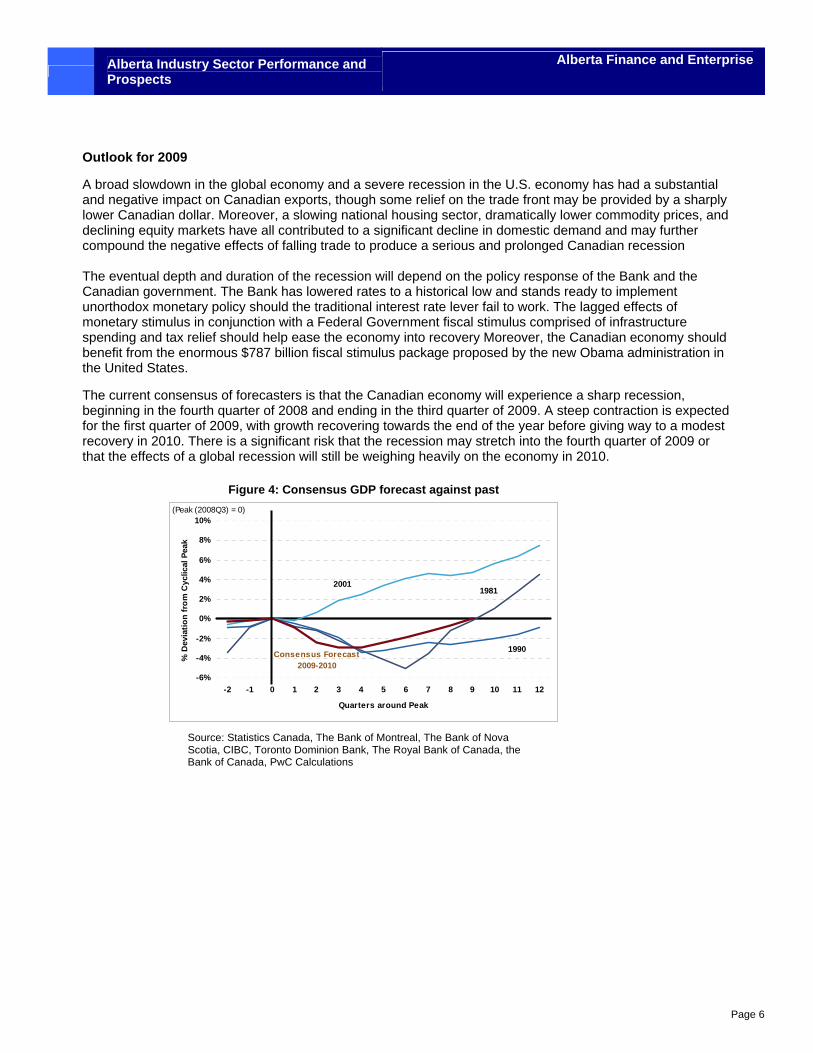
The global recession has propelled deflation to the front burner of central bank policy-making. As such, it is widely expected that policy rates across all major central banks will approach the so-called ’zero bound’ for nominal rates in 2009 (Figure 3).
The moderation of commodity prices and fears of deflation necessitated the continuation of an accommodative monetary stance by the Bank of Canada (Bank). New Bank Governor Mark Carney inaugurated his tenure at the helm of Canadian monetary policy by lowering the Bank’s overnight target rate 150 basis points (bps) from January to April of 2008. This dramatic easing was in reaction to unsettling developments in global financial markets as well as incoming data pointing to a slowing Canadian economy. Since then the Bank of Canada has participated in a globally coordinated and massive monetary easing, led by the Fed in the U.S., to alleviate the remarkable level of tightness in world credit markets and to help propel the global economy out of recession. In all, the Bank of Canada has lowered its overnight target by 425 basis points since the end of 2007, to what it terms as its effective lower bound of 0.25%.
South of the border, the Fed began 2008 by aggressively cutting its overnight rate with a rare inter-meeting cut of 75 bps on January 22, the largest percentage rate cut since August 1982. This action was followed by a series of additional cuts in response to crises in financial markets throughout 2008 before the Fed took the unprecedented action of lowering its target rate to a range of between zero and 0.25%.
0
1
2
3
4
5
6
7
1/1/20
07
26/03/2
007
18/06
/2007
10/9/
2007
3/12/2
007
25/02
/2008
19/05
/2008
11/8/
2008
3/11/2
008
11/1/
2009
12/3/20
09
United Kingdom
Canada
Euro Zone
Japan
United States
(%)
Figure 3: Global Policy Rates and the Zero Nominal
Source: Bank of Canada; U.S. Federal Reserve; Bank of England; European Central Bank; Bank of Japan
Alberta Industry Sector Performance and Prospects
Alberta Finance and Enterprise
Page 6
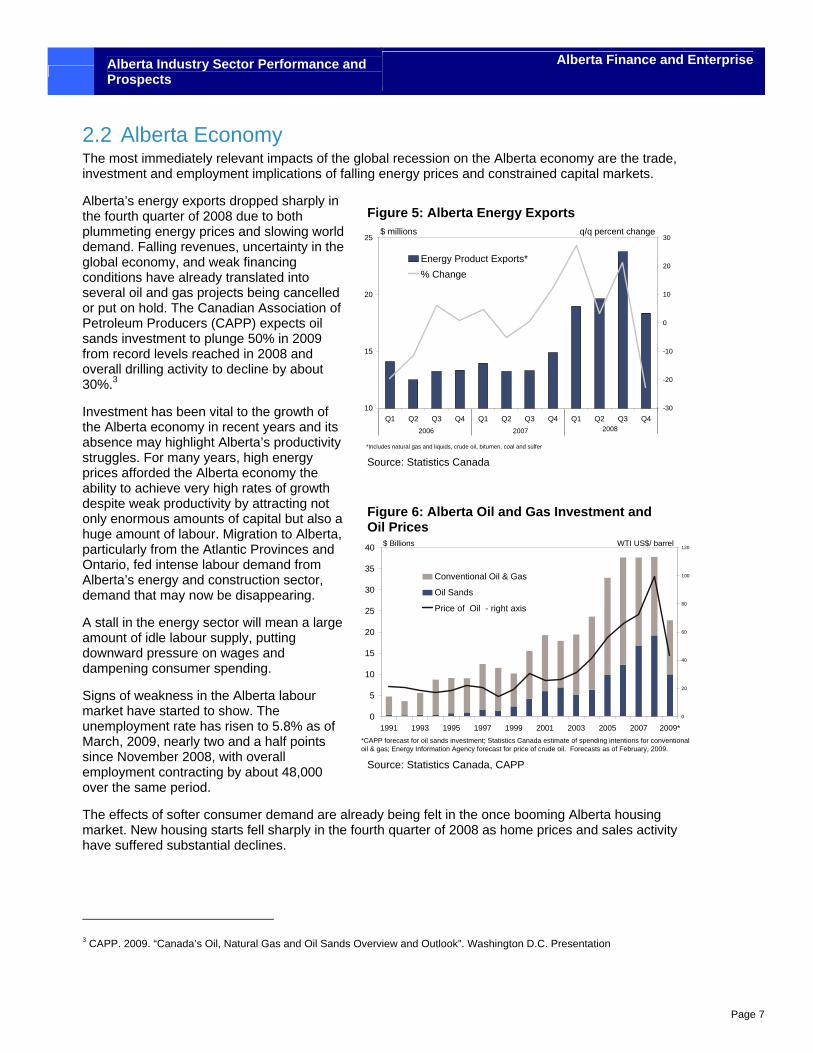
Figure 4: Consensus GDP forecast against past
Source: Statistics Canada, The Bank of Montreal, The Bank of Nova Scotia, CIBC, Toronto Dominion Bank, The Royal Bank of Canada, the Bank of Canada, PwC Calculations
Outlook for 2009
A broad slowdown in the global economy and a severe recession in the U.S. economy has had a substantial and negative impact on Canadian exports, though some relief on the trade front may be provided by a sharply lower Canadian dollar. Moreover, a slowing national housing sector, dramatically lower commodity prices, and declining equity markets have all contributed to a significant decline in domestic demand and may further compound the negative effects of falling trade to produce a serious and prolonged Canadian recession The eventual depth and duration of the recession will depend on the policy response of the Bank and the Canadian government. The Bank has lowered rates to a historical low and stands ready to implement unorthodox monetary policy should the traditional interest rate lever fail to work. The lagged effects of monetary stimulus in conjunction with a Federal Government fiscal stimulus comprised of infrastructure spending and tax relief should help ease the economy into recovery Moreover, the Canadian economy should benefit from the enormous $787 billion fiscal stimulus package proposed by the new Obama administration in the United States.
The current consensus of forecasters is that the Canadian economy will experience a sharp recession, beginning in the fourth quarter of 2008 and ending in the third quarter of 2009. A steep contraction is expected for the first quarter of 2009, with growth recovering towards the end of the year before giving way to a modest recovery in 2010. There is a significant risk that the recession may stretch into the fourth quarter of 2009 or that the effects of a global recession will still be weighing heavily on the economy in 2010.
-6%
-4%
-2%
0%
2%
4%
6%
8%
10%
-2 -1 0 1 2 3 4 5 6 7 8 9 10 11 12
Quarters around Peak
% D
evia
tion
from
Cyc
lical
Pea
k
(Peak (2008Q3) = 0)
20011981
1990Consensus Forecast 2009-2010
Alberta Industry Sector Performance and Prospects
Alberta Finance and Enterprise
Page 7
Figure 5: Alberta Energy Exports
Source: Statistics Canada
Figure 6: Alberta Oil and Gas Investment and Oil Prices
Source: Statistics Canada, CAPP
2.2 Alberta Economy The most immediately relevant impacts of the global recession on the Alberta economy are the trade, investment and employment implications of falling energy prices and constrained capital markets.
Alberta’s energy exports dropped sharply in the fourth quarter of 2008 due to both plummeting energy prices and slowing world demand. Falling revenues, uncertainty in the global economy, and weak financing conditions have already translated into several oil and gas projects being cancelled or put on hold. The Canadian Association of Petroleum Producers (CAPP) expects oil sands investment to plunge 50% in 2009 from record levels reached in 2008 and overall drilling activity to decline by about 30%.3
Investment has been vital to the growth of the Alberta economy in recent years and its absence may highlight Alberta’s productivity struggles. For many years, high energy prices afforded the Alberta economy the ability to achieve very high rates of growth despite weak productivity by attracting not only enormous amounts of capital but also a huge amount of labour. Migration to Alberta, particularly from the Atlantic Provinces and Ontario, fed intense labour demand from Alberta’s energy and construction sector, demand that may now be disappearing.
A stall in the energy sector will mean a large amount of idle labour supply, putting downward pressure on wages and dampening consumer spending.
Signs of weakness in the Alberta labour market have started to show. The unemployment rate has risen to 5.8% as of March, 2009, nearly two and a half points since November 2008, with overall employment contracting by about 48,000 over the same period.
The effects of softer consumer demand are already being felt in the once booming Alberta housing market. New housing starts fell sharply in the fourth quarter of 2008 as home prices and sales activity have suffered substantial declines.
3 CAPP. 2009. “Canada’s Oil, Natural Gas and Oil Sands Overview and Outlook”. Washington D.C. Presentation
0
5
10
15
20
25
30
35
40
1991 1993 1995 1997 1999 2001 2003 2005 2007 2009*0
20
40
60
80
100
120
Conventional Oil & Gas
Oil Sands
Price of Oil - right axis
$ Billions
*CAPP forecast for oil sands investment; Statistics Canada estimate of spending intentions for conventional oil & gas; Energy Information Agency forecast for price of crude oil. Forecasts as of February, 2009.
WTI US$/ barrel
10
15
20
25
Q1 Q2 Q3 Q4 Q1 Q2 Q3 Q4 Q1 Q2 Q3 Q4-30
-20
-10
0
10
20
30
Energy Product Exports*% Change
$ millions
2006 2007 2008
q/q percent change
*Includes natural gas and liquids, crude oil, bitumen, coal and sulfer
Alberta Industry Sector Performance and Prospects
Alberta Finance and Enterprise
Page 8
Outlook
2009 should prove to be a difficult year for the Alberta economy. Slowing growth in the energy and construction sectors amid global economic uncertainty will cool Alberta’s labour market and put pressure on consumer spending. The Alberta Government is currently forecasting a contraction of real GDP equal to 2% with the unemployment rate hitting 5.8% in 2009.4
However, by 2010, most forecasters expect the Canadian economy to begin recovering from the current recession. Providing additional support to Alberta’s economy is the expectation that crude oil prices will improve in 2010, largely reflecting stronger global demand. As of March 10, 2009, the Energy Information Agency forecasts the price of crude oil to rise from $42/barrel in 2009 to $53/barrel in 2010. These developments should help renew capital spending, as delayed projects in the energy sector come back on stream.
4 Alberta Finance and Enterprise. Economic Update. February 19, 2009.
Alberta Industry Sector Performance and Prospects
Alberta Finance and Enterprise
Page 9
3 Overall Economic and Industry Sector Trends
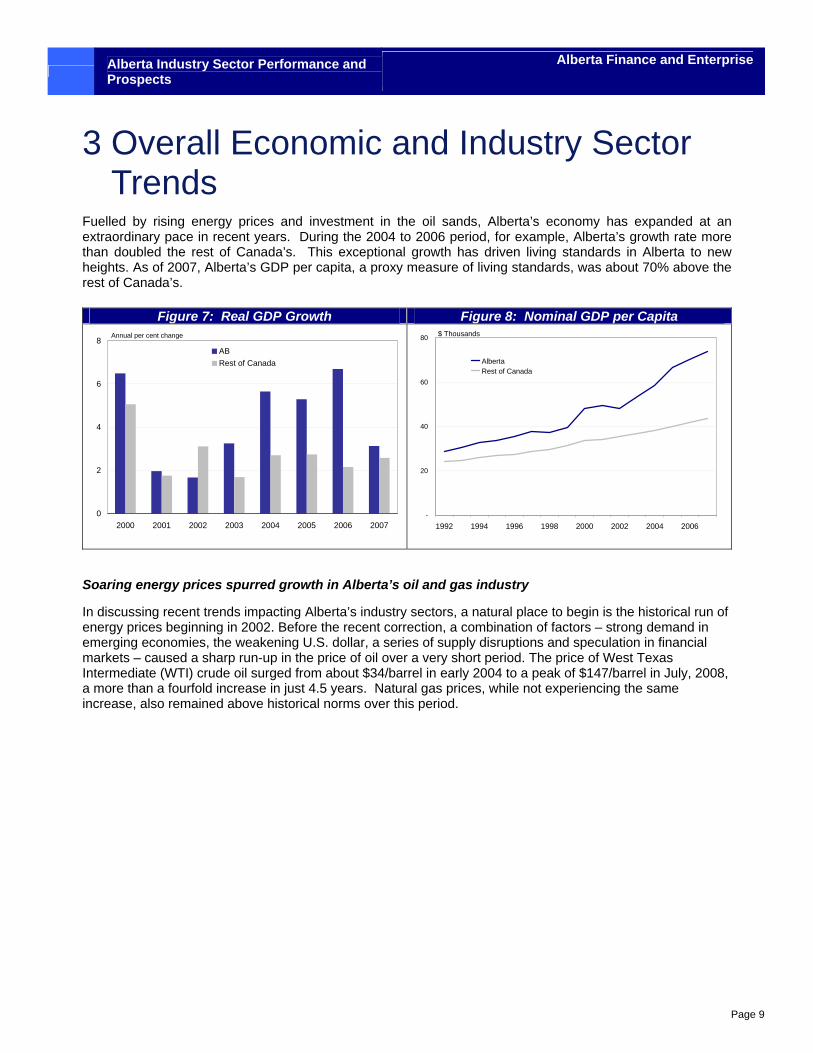
Fuelled by rising energy prices and investment in the oil sands, Alberta’s economy has expanded at an extraordinary pace in recent years. During the 2004 to 2006 period, for example, Alberta’s growth rate more than doubled the rest of Canada’s. This exceptional growth has driven living standards in Alberta to new heights. As of 2007, Alberta’s GDP per capita, a proxy measure of living standards, was about 70% above the rest of Canada’s.
Soaring energy prices spurred growth in Alberta’s oil and gas industry
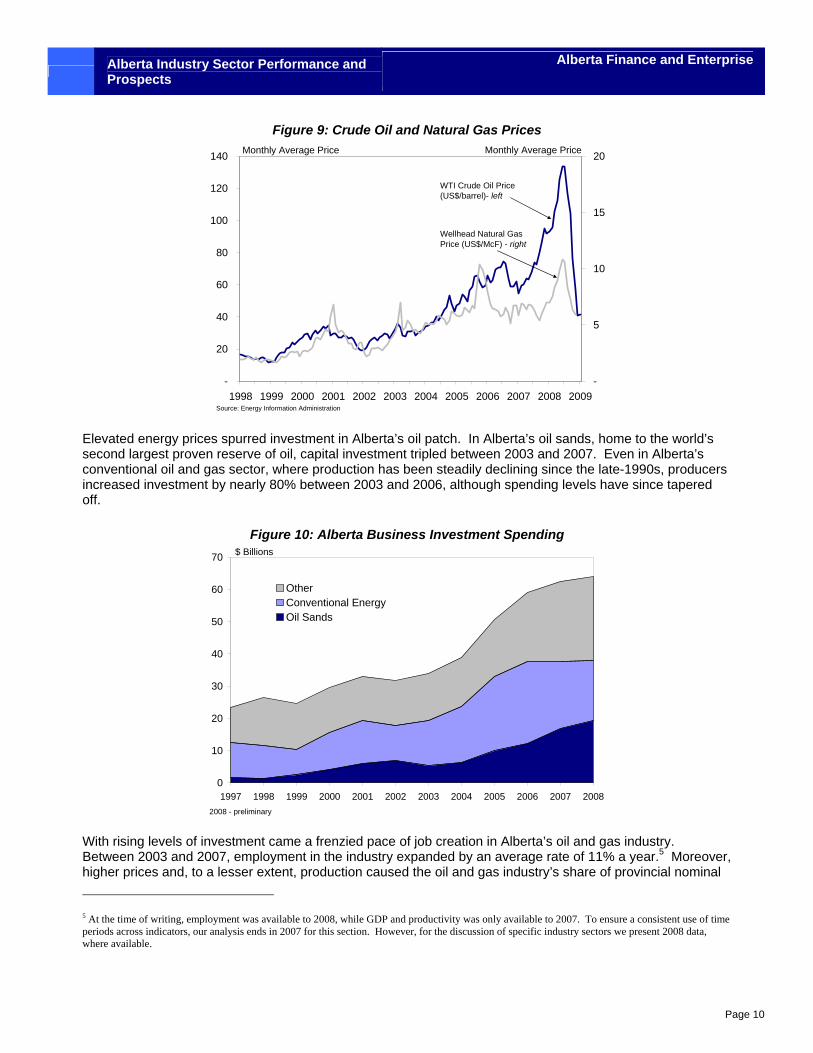
In discussing recent trends impacting Alberta’s industry sectors, a natural place to begin is the historical run of energy prices beginning in 2002. Before the recent correction, a combination of factors – strong demand in emerging economies, the weakening U.S. dollar, a series of supply disruptions and speculation in financial markets – caused a sharp run-up in the price of oil over a very short period. The price of West Texas Intermediate (WTI) crude oil surged from about $34/barrel in early 2004 to a peak of $147/barrel in July, 2008, a more than a fourfold increase in just 4.5 years. Natural gas prices, while not experiencing the same increase, also remained above historical norms over this period.
Figure 7: Real GDP Growth Figure 8: Nominal GDP per Capita
0
2
4
6
8
2000 2001 2002 2003 2004 2005 2006 2007
ABRest of Canada
Annual per cent change
-
20
40
60
80
1992 1994 1996 1998 2000 2002 2004 2006
AlbertaRest of Canada
$ Thousands
Alberta Industry Sector Performance and Prospects
Alberta Finance and Enterprise
Page 10
Figure 9: Crude Oil and Natural Gas Prices
-
20
40
60
80
100
120
140
1998 1999 2000 2001 2002 2003 2004 2005 2006 2007 2008 2009-
5
10
15
20Monthly Average Price
WTI Crude Oil Price (US$/barrel)- left
Wellhead Natural Gas Price (US$/McF) - right
Monthly Average Price
Source: Energy Information Administration
Elevated energy prices spurred investment in Alberta’s oil patch. In Alberta’s oil sands, home to the world’s second largest proven reserve of oil, capital investment tripled between 2003 and 2007. Even in Alberta’s conventional oil and gas sector, where production has been steadily declining since the late-1990s, producers increased investment by nearly 80% between 2003 and 2006, although spending levels have since tapered off.
Figure 10: Alberta Business Investment Spending
0
10
20
30
40
50
60
70
1997 1998 1999 2000 2001 2002 2003 2004 2005 2006 2007 2008
Other Conventional EnergyOil Sands
$ Billions
2008 - preliminary
With rising levels of investment came a frenzied pace of job creation in Alberta’s oil and gas industry. Between 2003 and 2007, employment in the industry expanded by an average rate of 11% a year.5 Moreover, higher prices and, to a lesser extent, production caused the oil and gas industry’s share of provincial nominal 5 At the time of writing, employment was available to 2008, while GDP and productivity was only available to 2007. To ensure a consistent use of time periods across indicators, our analysis ends in 2007 for this section. However, for the discussion of specific industry sectors we present 2008 data, where available.
Alberta Industry Sector Performance and Prospects
Alberta Finance and Enterprise
Page 11
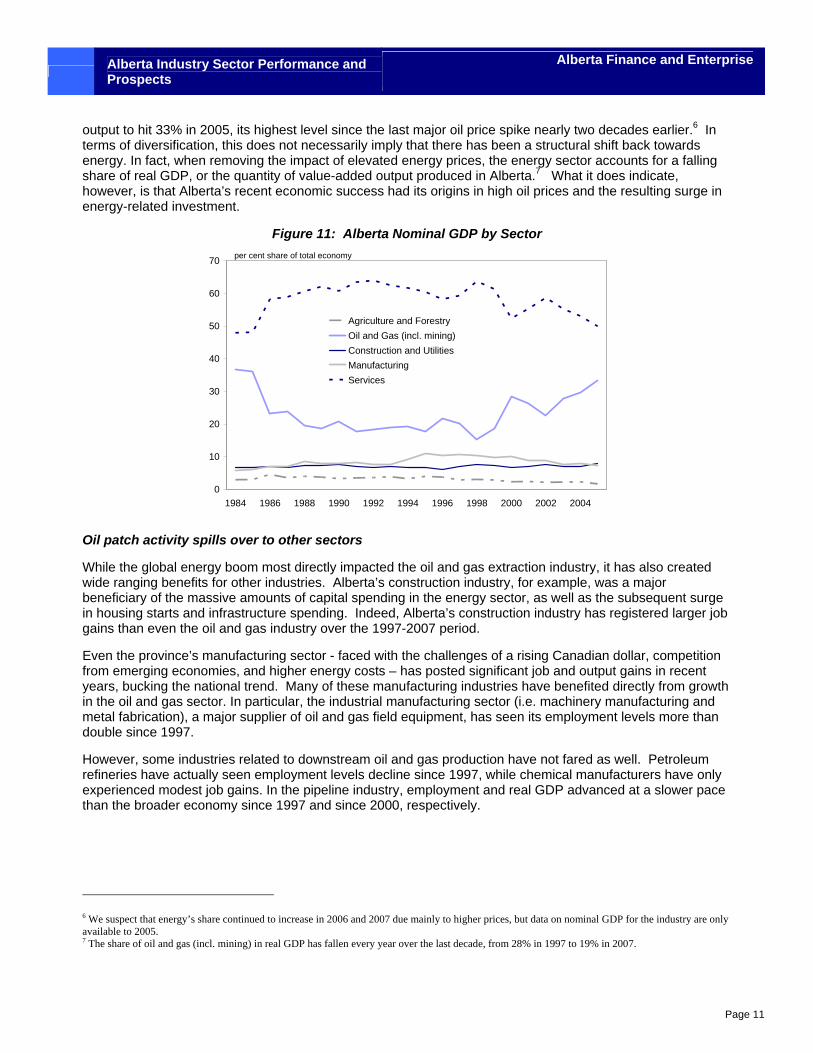
output to hit 33% in 2005, its highest level since the last major oil price spike nearly two decades earlier.6 In terms of diversification, this does not necessarily imply that there has been a structural shift back towards energy. In fact, when removing the impact of elevated energy prices, the energy sector accounts for a falling share of real GDP, or the quantity of value-added output produced in Alberta.7 What it does indicate, however, is that Alberta’s recent economic success had its origins in high oil prices and the resulting surge in energy-related investment.
Figure 11: Alberta Nominal GDP by Sector
0
10
20
30
40
50
60
70
1984 1986 1988 1990 1992 1994 1996 1998 2000 2002 2004
Agriculture and ForestryOil and Gas (incl. mining)Construction and UtilitiesManufacturingServices
per cent share of total economy
Oil patch activity spills over to other sectors
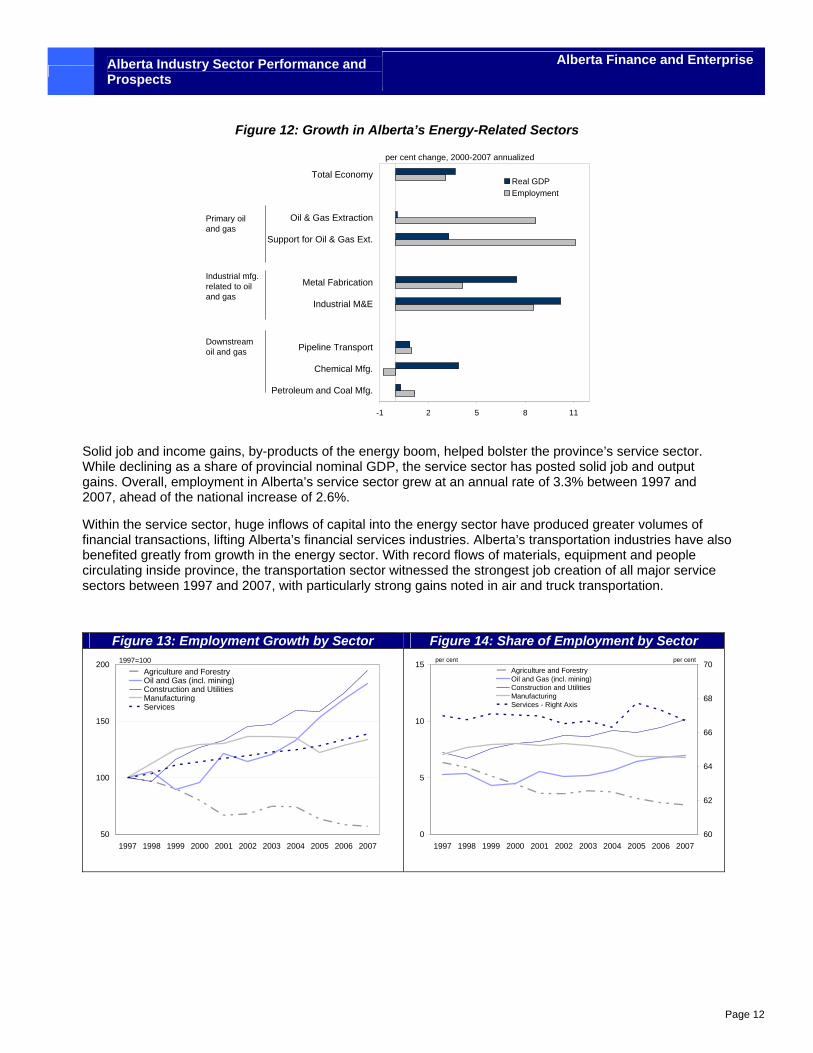
While the global energy boom most directly impacted the oil and gas extraction industry, it has also created wide ranging benefits for other industries. Alberta’s construction industry, for example, was a major beneficiary of the massive amounts of capital spending in the energy sector, as well as the subsequent surge in housing starts and infrastructure spending. Indeed, Alberta’s construction industry has registered larger job gains than even the oil and gas industry over the 1997-2007 period.
Even the province’s manufacturing sector - faced with the challenges of a rising Canadian dollar, competition from emerging economies, and higher energy costs – has posted significant job and output gains in recent years, bucking the national trend. Many of these manufacturing industries have benefited directly from growth in the oil and gas sector. In particular, the industrial manufacturing sector (i.e. machinery manufacturing and metal fabrication), a major supplier of oil and gas field equipment, has seen its employment levels more than double since 1997.
However, some industries related to downstream oil and gas production have not fared as well. Petroleum refineries have actually seen employment levels decline since 1997, while chemical manufacturers have only experienced modest job gains. In the pipeline industry, employment and real GDP advanced at a slower pace than the broader economy since 1997 and since 2000, respectively.
6 We suspect that energy’s share continued to increase in 2006 and 2007 due mainly to higher prices, but data on nominal GDP for the industry are only available to 2005. 7 The share of oil and gas (incl. mining) in real GDP has fallen every year over the last decade, from 28% in 1997 to 19% in 2007.
Alberta Industry Sector Performance and Prospects
Alberta Finance and Enterprise
Page 12
Figure 12: Growth in Alberta’s Energy-Related Sectors
-1 2 5 8 11
Petroleum and Coal Mfg.
Chemical Mfg.
Pipeline Transport
Industrial M&E
Metal Fabrication
Support for Oil & Gas Ext.
Oil & Gas Extraction
Total EconomyReal GDPEmployment
Downstream oil and gas
Primary oil and gas
Industrial mfg. related to oil and gas
per cent change, 2000-2007 annualized
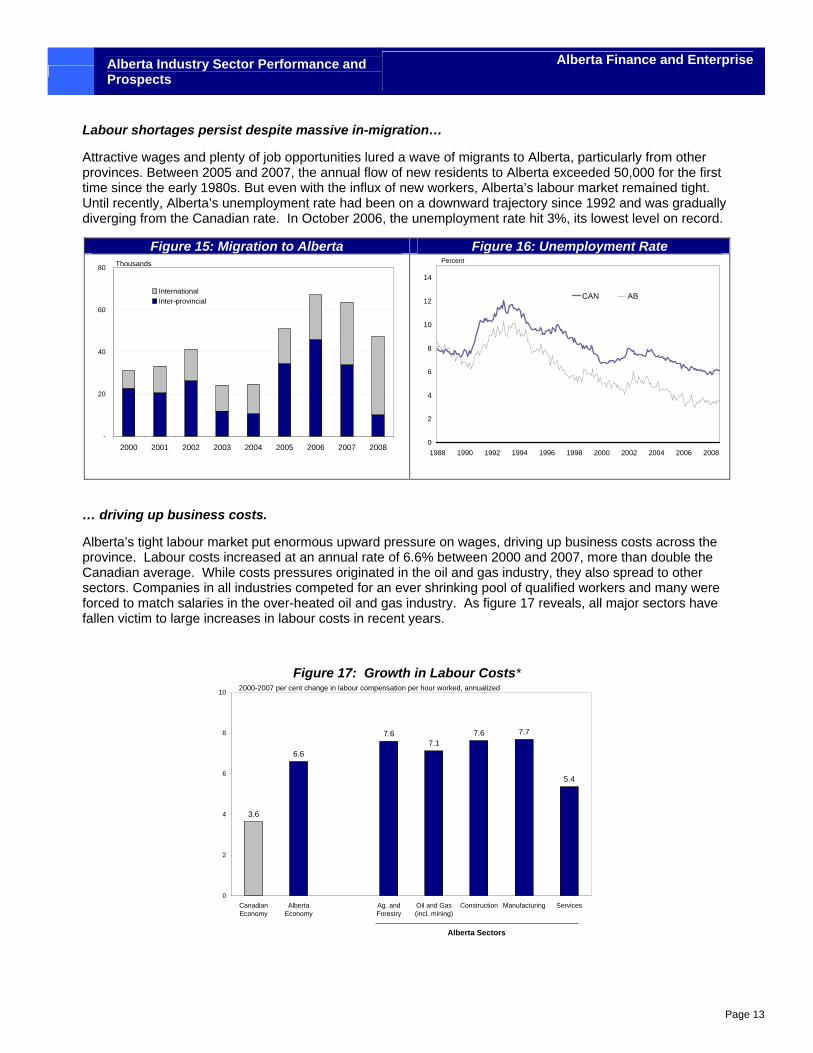
Solid job and income gains, by-products of the energy boom, helped bolster the province’s service sector. While declining as a share of provincial nominal GDP, the service sector has posted solid job and output gains. Overall, employment in Alberta’s service sector grew at an annual rate of 3.3% between 1997 and 2007, ahead of the national increase of 2.6%.
Within the service sector, huge inflows of capital into the energy sector have produced greater volumes of financial transactions, lifting Alberta’s financial services industries. Alberta’s transportation industries have also benefited greatly from growth in the energy sector. With record flows of materials, equipment and people circulating inside province, the transportation sector witnessed the strongest job creation of all major service sectors between 1997 and 2007, with particularly strong gains noted in air and truck transportation.
Figure 13: Employment Growth by Sector Figure 14: Share of Employment by Sector
50
100
150
200
1997 1998 1999 2000 2001 2002 2003 2004 2005 2006 2007
Agriculture and ForestryOil and Gas (incl. mining)Construction and UtilitiesManufacturingServices
1997=100
0
5
10
15
1997 1998 1999 2000 2001 2002 2003 2004 2005 2006 200760
62
64
66
68
70Agriculture and ForestryOil and Gas (incl. mining)Construction and UtilitiesManufacturingServices - Right Axis
per cent per cent
Alberta Industry Sector Performance and Prospects
Alberta Finance and Enterprise
Page 13
Labour shortages persist despite massive in-migration…
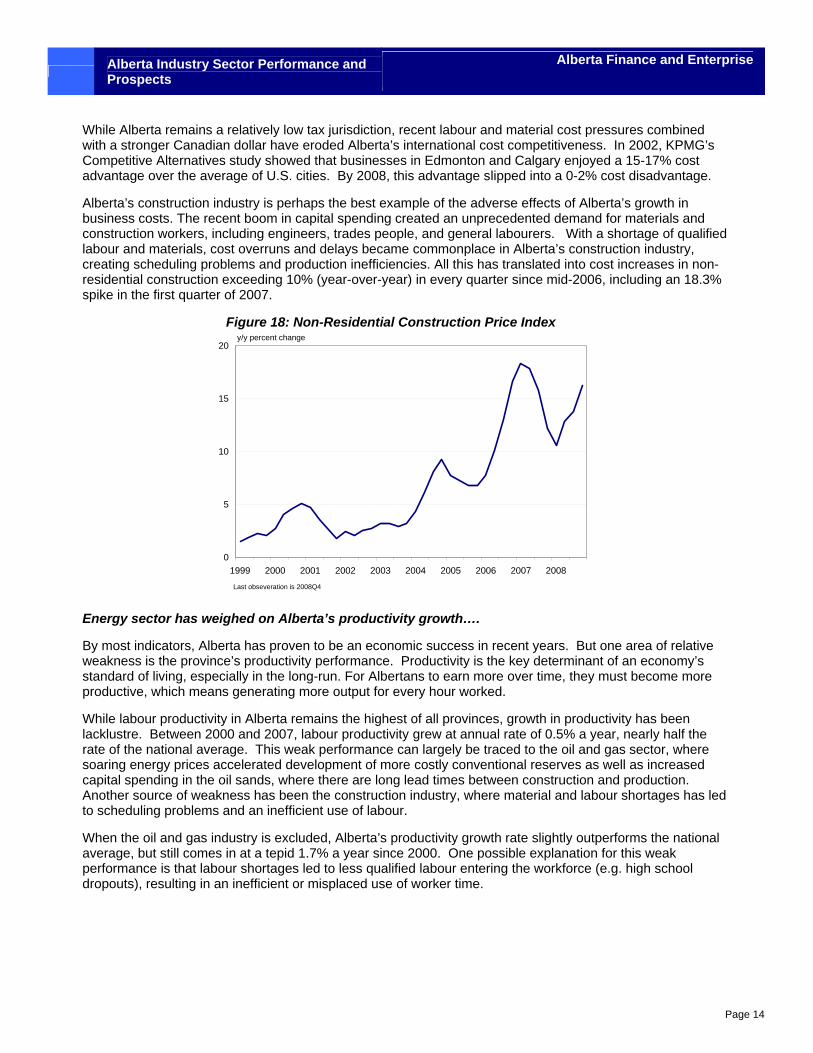
Attractive wages and plenty of job opportunities lured a wave of migrants to Alberta, particularly from other provinces. Between 2005 and 2007, the annual flow of new residents to Alberta exceeded 50,000 for the first time since the early 1980s. But even with the influx of new workers, Alberta’s labour market remained tight. Until recently, Alberta’s unemployment rate had been on a downward trajectory since 1992 and was gradually diverging from the Canadian rate. In October 2006, the unemployment rate hit 3%, its lowest level on record.
Figure 15: Migration to Alberta Figure 16: Unemployment Rate
-
20
40
60
80
2000 2001 2002 2003 2004 2005 2006 2007 2008
InternationalInter-provincial
Thousands
0
2
4
6
8
10
12
14
1988 1990 1992 1994 1996 1998 2000 2002 2004 2006 2008
CAN AB
Percent
… driving up business costs.
Alberta’s tight labour market put enormous upward pressure on wages, driving up business costs across the province. Labour costs increased at an annual rate of 6.6% between 2000 and 2007, more than double the Canadian average. While costs pressures originated in the oil and gas industry, they also spread to other sectors. Companies in all industries competed for an ever shrinking pool of qualified workers and many were forced to match salaries in the over-heated oil and gas industry. As figure 17 reveals, all major sectors have fallen victim to large increases in labour costs in recent years.
Figure 17: Growth in Labour Costs*
3.6
6.6
7.67.1
7.6 7.7
5.4
0
2
4
6
8
10
CanadianEconomy
AlbertaEconomy
Ag. andForestry
Oil and Gas(incl. mining)
Construction Manufacturing Services
Alberta Sectors
2000-2007 per cent change in labour compensation per hour worked, annualized
Alberta Industry Sector Performance and Prospects
Alberta Finance and Enterprise
Page 14
While Alberta remains a relatively low tax jurisdiction, recent labour and material cost pressures combined with a stronger Canadian dollar have eroded Alberta’s international cost competitiveness. In 2002, KPMG’s Competitive Alternatives study showed that businesses in Edmonton and Calgary enjoyed a 15-17% cost advantage over the average of U.S. cities. By 2008, this advantage slipped into a 0-2% cost disadvantage.
Alberta’s construction industry is perhaps the best example of the adverse effects of Alberta’s growth in business costs. The recent boom in capital spending created an unprecedented demand for materials and construction workers, including engineers, trades people, and general labourers. With a shortage of qualified labour and materials, cost overruns and delays became commonplace in Alberta’s construction industry, creating scheduling problems and production inefficiencies. All this has translated into cost increases in non-residential construction exceeding 10% (year-over-year) in every quarter since mid-2006, including an 18.3% spike in the first quarter of 2007.
Figure 18: Non-Residential Construction Price Index
0
5
10
15
20
1999 2000 2001 2002 2003 2004 2005 2006 2007 2008
Last obseveration is 2008Q4
y/y percent change
Energy sector has weighed on Alberta’s productivity growth….
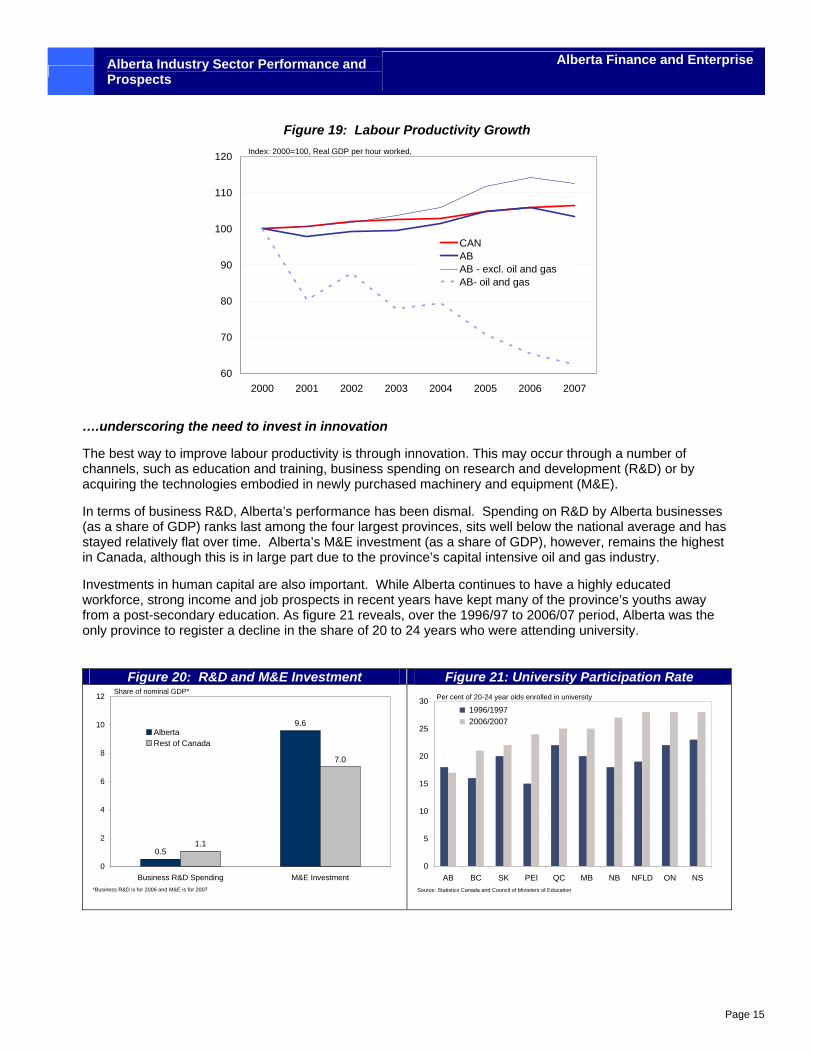
By most indicators, Alberta has proven to be an economic success in recent years. But one area of relative weakness is the province’s productivity performance. Productivity is the key determinant of an economy’s standard of living, especially in the long-run. For Albertans to earn more over time, they must become more productive, which means generating more output for every hour worked.
While labour productivity in Alberta remains the highest of all provinces, growth in productivity has been lacklustre. Between 2000 and 2007, labour productivity grew at annual rate of 0.5% a year, nearly half the rate of the national average. This weak performance can largely be traced to the oil and gas sector, where soaring energy prices accelerated development of more costly conventional reserves as well as increased capital spending in the oil sands, where there are long lead times between construction and production. Another source of weakness has been the construction industry, where material and labour shortages has led to scheduling problems and an inefficient use of labour.
When the oil and gas industry is excluded, Alberta’s productivity growth rate slightly outperforms the national average, but still comes in at a tepid 1.7% a year since 2000. One possible explanation for this weak performance is that labour shortages led to less qualified labour entering the workforce (e.g. high school dropouts), resulting in an inefficient or misplaced use of worker time.
Alberta Industry Sector Performance and Prospects
Alberta Finance and Enterprise
Page 15
Figure 19: Labour Productivity Growth
60
70
80
90
100
110
120
2000 2001 2002 2003 2004 2005 2006 2007
CANAB AB - excl. oil and gasAB- oil and gas
Index: 2000=100, Real GDP per hour worked,
….underscoring the need to invest in innovation
The best way to improve labour productivity is through innovation. This may occur through a number of channels, such as education and training, business spending on research and development (R&D) or by acquiring the technologies embodied in newly purchased machinery and equipment (M&E).
In terms of business R&D, Alberta’s performance has been dismal. Spending on R&D by Alberta businesses (as a share of GDP) ranks last among the four largest provinces, sits well below the national average and has stayed relatively flat over time. Alberta’s M&E investment (as a share of GDP), however, remains the highest in Canada, although this is in large part due to the province’s capital intensive oil and gas industry.
Investments in human capital are also important. While Alberta continues to have a highly educated workforce, strong income and job prospects in recent years have kept many of the province’s youths away from a post-secondary education. As figure 21 reveals, over the 1996/97 to 2006/07 period, Alberta was the only province to register a decline in the share of 20 to 24 years who were attending university.
Figure 20: R&D and M&E Investment Figure 21: University Participation Rate
0.5
9.6
1.1
7.0
0
2
4
6
8
10
12
Business R&D Spending M&E Investment
AlbertaRest of Canada
*Business R&D is for 2006 and M&E is for 2007
Share of nominal GDP*
0
5
10
15
20
25
30
AB BC SK PEI QC MB NB NFLD ON NS
1996/1997 2006/2007
Per cent of 20-24 year olds enrolled in university
Source: Statistics Canada and Council of Ministers of Education
Alberta Industry Sector Performance and Prospects
Alberta Finance and Enterprise
Page 16
Financing innovation can be difficult, especially for small start-up companies in the pre-commercialization stages. Venture capital is a critical form of high-risk financing that allows firms to undertake R&D and bring new technologies to market. In Alberta, however, venture capital remains sorely lacking, representing about $40 million in 2006, or 2% of the national total.
Environmental issues rise to the forefront
Alberta’s economic growth has had significant impact on the environment. Due to the strong presence of the energy sector and the province’s reliance on coal-fired electricity generation, Alberta now leads the country in greenhouse gas (GHG) emissions. The province has been responsible for 50% of the growth in the national GHGs between 1990 and 2006 and now accounts for about 30% of the GHGs produced in Canada. The Alberta government has taken steps to reduce the province’s environmental footprint, including regulating GHG emissions and most recently announcing $2 billion in funding for CCS technologies. Going forward, public and private investments in environmental technology will create a range of opportunities for Alberta industries, including industrial manufacturing, engineering services and construction.
Alberta’s non-energy export base is becoming more diversified
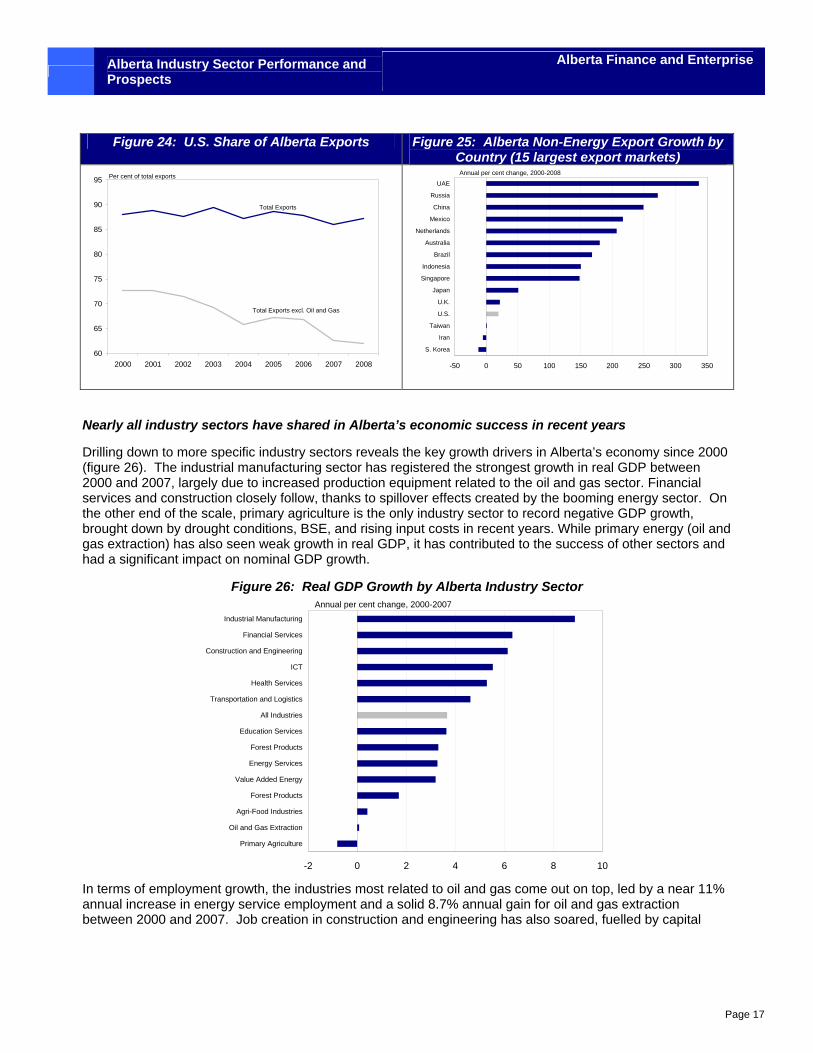
Another key development for Alberta has been on the international trade front. While the U.S. remains Alberta’s largest international market, the province has been diversifying its non-energy export base in recent years. The U.S. share of non-energy exports has fallen from 73% in 2000 to 63% in 2008. Of course, the story changes when energy exports are included in the mix. Soaring energy prices have led to record value of oil and gas shipments to the U.S., keeping the U.S. share of total exports at around 85%-89% over the 2000-2008 period.
The diversification of Alberta’s export markets is welcome news. It not only reduces the province’s exposure to U.S. specific economic shocks, it also demonstrates that Alberta exporters are now capitalizing on swelling demand in high-growth economies. As Figure 25 reveals, emerging economies top the list of Alberta’s fastest growing major export markets since 2000. Of Alberta’s 15 largest export destinations, the United Arab Emirates (UAE) has seen the largest increase in shipments from the Alberta, thanks to a jump in oil and gas field equipment and oilseed exports. The next largest growth markets have been the emerging economies of Russia, China and Mexico.
Figure 22: GHG Emissions by Province Figure 23: Growth in GHG Emissions by Province
0
50
100
150
200
250
NL PEI NS NB QC ON MB SK AB BC
19902006
Mt CO2 equiv.
Source: Environment Canada
-10
0
10
20
30
40
50
60
NL PEI NS NB QC ON MB SK AB
Per cent contribution to growth in Canada's GHG emissions, 1990-2006
Source: Environment Canada
Alberta Industry Sector Performance and Prospects
Alberta Finance and Enterprise
Page 17
Nearly all industry sectors have shared in Alberta’s economic success in recent years
Drilling down to more specific industry sectors reveals the key growth drivers in Alberta’s economy since 2000 (figure 26). The industrial manufacturing sector has registered the strongest growth in real GDP between 2000 and 2007, largely due to increased production equipment related to the oil and gas sector. Financial services and construction closely follow, thanks to spillover effects created by the booming energy sector. On the other end of the scale, primary agriculture is the only industry sector to record negative GDP growth, brought down by drought conditions, BSE, and rising input costs in recent years. While primary energy (oil and gas extraction) has also seen weak growth in real GDP, it has contributed to the success of other sectors and had a significant impact on nominal GDP growth.
Figure 26: Real GDP Growth by Alberta Industry Sector
-2 0 2 4 6 8 10
Primary Agriculture
Oil and Gas Extraction
Agri-Food Industries
Forest Products
Value Added Energy
Energy Services
Forest Products
Education Services
All Industries
Transportation and Logistics
Health Services
ICT
Construction and Engineering
Financial Services
Industrial Manufacturing
Annual per cent change, 2000-2007
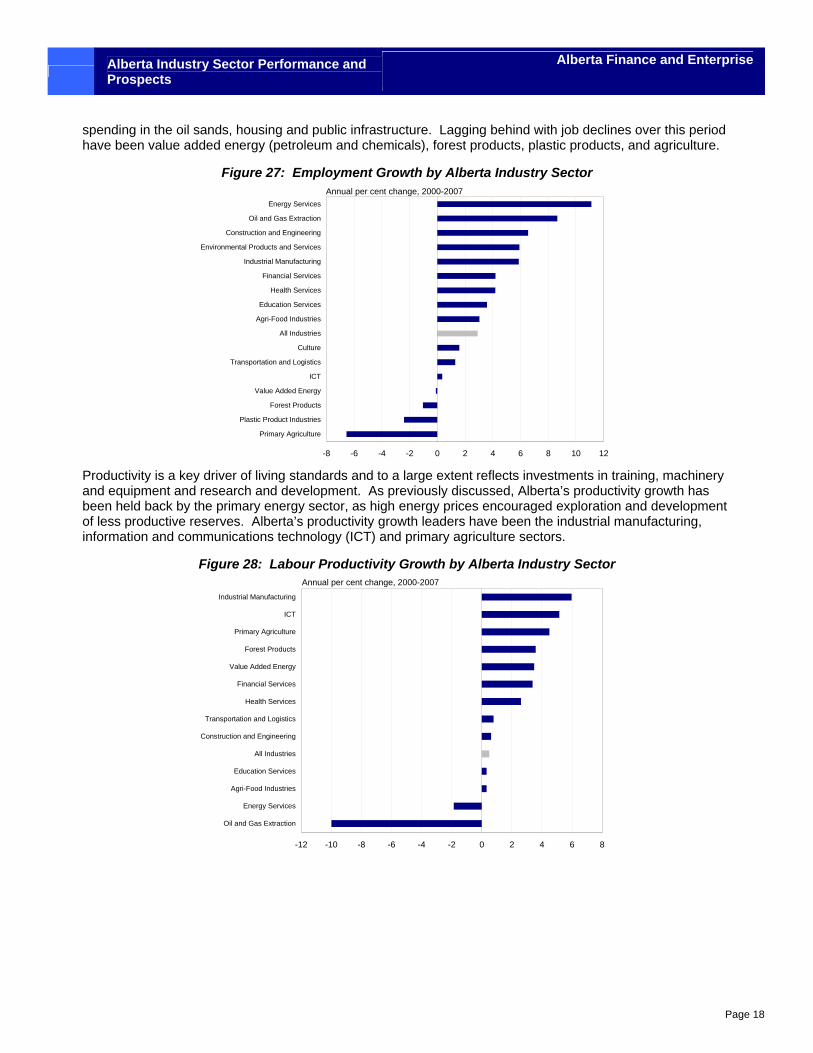
In terms of employment growth, the industries most related to oil and gas come out on top, led by a near 11% annual increase in energy service employment and a solid 8.7% annual gain for oil and gas extraction between 2000 and 2007. Job creation in construction and engineering has also soared, fuelled by capital
Figure 24: U.S. Share of Alberta Exports Figure 25: Alberta Non-Energy Export Growth by Country (15 largest export markets)
60
65
70
75
80
85
90
95
2000 2001 2002 2003 2004 2005 2006 2007 2008
Total Exports
Total Exports excl. Oil and Gas
Per cent of total exports
-50 0 50 100 150 200 250 300 350
S. Korea
Iran
Taiwan
U.S.
U.K.
Japan
Singapore
Indonesia
Brazil
Australia
Netherlands
Mexico
China
Russia
UAE
Annual per cent change, 2000-2008
Alberta Industry Sector Performance and Prospects
Alberta Finance and Enterprise
Page 18
spending in the oil sands, housing and public infrastructure. Lagging behind with job declines over this period have been value added energy (petroleum and chemicals), forest products, plastic products, and agriculture.
Figure 27: Employment Growth by Alberta Industry Sector
-8 -6 -4 -2 0 2 4 6 8 10 12
Primary Agriculture
Plastic Product Industries
Forest Products
Value Added Energy
ICT
Transportation and Logistics
Culture
All Industries
Agri-Food Industries
Education Services
Health Services
Financial Services
Industrial Manufacturing
Environmental Products and Services
Construction and Engineering
Oil and Gas Extraction
Energy Services
Annual per cent change, 2000-2007
Productivity is a key driver of living standards and to a large extent reflects investments in training, machinery and equipment and research and development. As previously discussed, Alberta’s productivity growth has been held back by the primary energy sector, as high energy prices encouraged exploration and development of less productive reserves. Alberta’s productivity growth leaders have been the industrial manufacturing, information and communications technology (ICT) and primary agriculture sectors.
Figure 28: Labour Productivity Growth by Alberta Industry Sector
-12 -10 -8 -6 -4 -2 0 2 4 6 8
Oil and Gas Extraction
Energy Services
Agri-Food Industries
Education Services
All Industries
Construction and Engineering
Transportation and Logistics
Health Services
Financial Services
Value Added Energy
Forest Products
Primary Agriculture
ICT
Industrial Manufacturing
Annual per cent change, 2000-2007
Alberta Industry Sector Performance and Prospects
Alberta Finance and Enterprise
Page 19
4 Industry Sector Analysis 4.1 Oil and Gas Extraction 4.1.1 Profile
Indicators
Numbers in italics represent annual % change
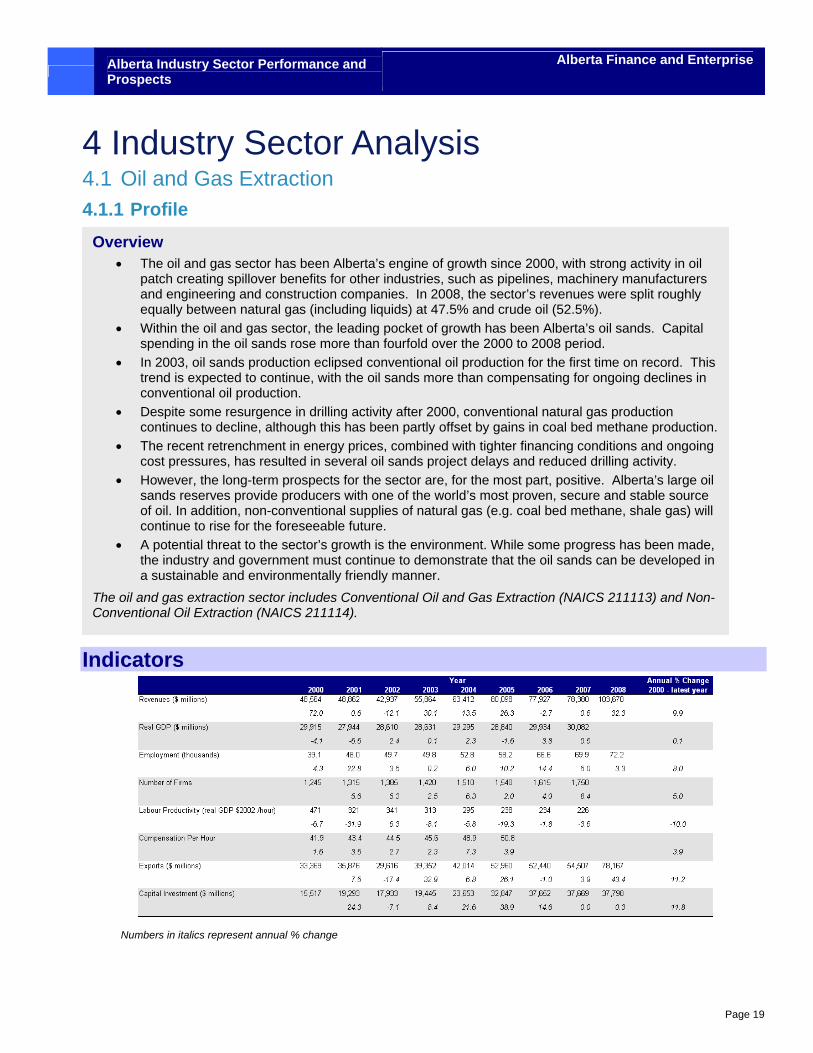
Overview • The oil and gas sector has been Alberta’s engine of growth since 2000, with strong activity in oil
patch creating spillover benefits for other industries, such as pipelines, machinery manufacturers and engineering and construction companies. In 2008, the sector’s revenues were split roughly equally between natural gas (including liquids) at 47.5% and crude oil (52.5%).
• Within the oil and gas sector, the leading pocket of growth has been Alberta’s oil sands. Capital spending in the oil sands rose more than fourfold over the 2000 to 2008 period.
• In 2003, oil sands production eclipsed conventional oil production for the first time on record. This trend is expected to continue, with the oil sands more than compensating for ongoing declines in conventional oil production.
• Despite some resurgence in drilling activity after 2000, conventional natural gas production continues to decline, although this has been partly offset by gains in coal bed methane production.
• The recent retrenchment in energy prices, combined with tighter financing conditions and ongoing cost pressures, has resulted in several oil sands project delays and reduced drilling activity.
• However, the long-term prospects for the sector are, for the most part, positive. Alberta’s large oil sands reserves provide producers with one of the world’s most proven, secure and stable source of oil. In addition, non-conventional supplies of natural gas (e.g. coal bed methane, shale gas) will continue to rise for the foreseeable future.
• A potential threat to the sector’s growth is the environment. While some progress has been made, the industry and government must continue to demonstrate that the oil sands can be developed in a sustainable and environmentally friendly manner.
The oil and gas extraction sector includes Conventional Oil and Gas Extraction (NAICS 211113) and Non-Conventional Oil Extraction (NAICS 211114).
Alberta Industry Sector Performance and Prospects
Alberta Finance and Enterprise
Page 20
Industry Sector Snapshot Number of Firms by Size
0
20
40
60
80
100
<10 10-49 50-100 >100
Primary EnergyAlberta Economy
Per cent of total, 2007
Number of Employees
N=1,750
Size of Primary Energy Sector
30.0
3.5
86.3
73.5
0
20
40
60
80
100
Alberta Economy Canadian Primary Energy Sector
Nominal GDPEmployment
Per cent of total*
*Nominal GDP is for 2005, Employment is for 2007
Wages and Productivity
0 50 100 150 200 250 300
Compensation PerHour
Labour Productivity(real GDP /hour)
Primary Energy- ABPrimary Energy- CANAlberta Economy
Dollars*
*Productivity is for 2007 , Compensation is for 2005
Capital Investment and Export Intensity
64.5
30.6
51.443.2
0
20
40
60
80
Capital Investment (% of GDP) Exports (% of revenue)
Primary EnergyAlberta Economy*
Per cent, 2005
*For exports, Alberta economy includes only goods-producing industries
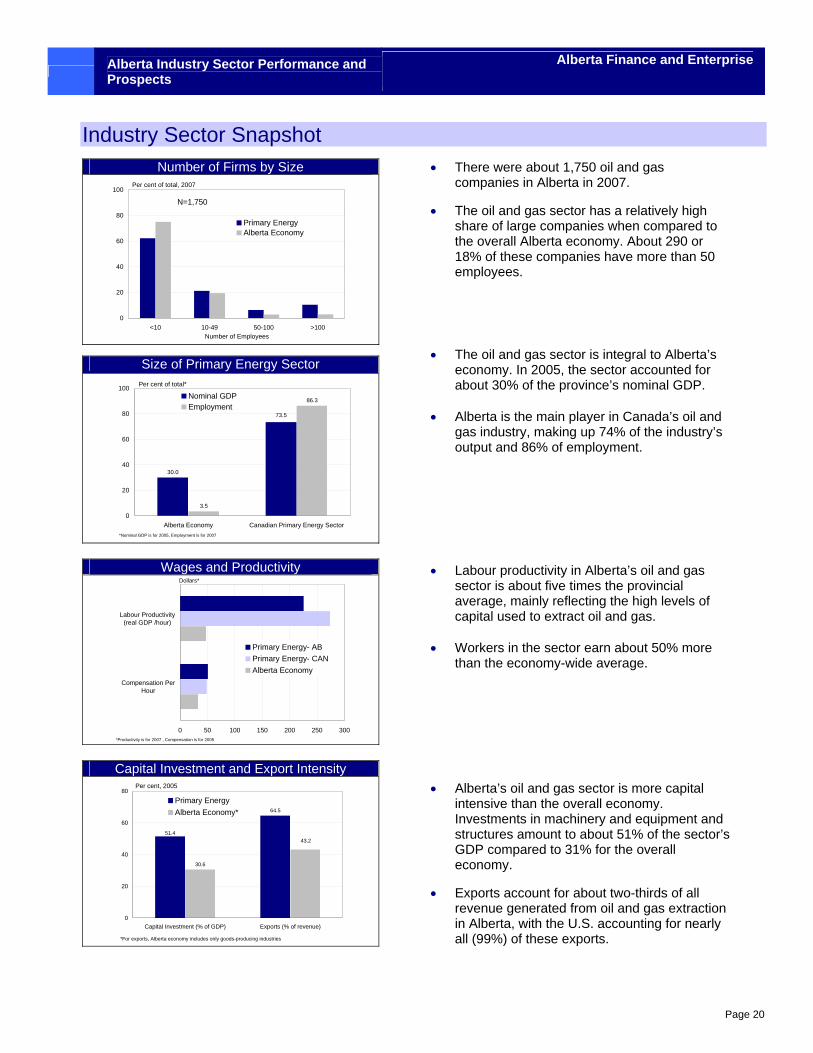
• There were about 1,750 oil and gas companies in Alberta in 2007.
• The oil and gas sector has a relatively high share of large companies when compared to the overall Alberta economy. About 290 or 18% of these companies have more than 50 employees.
• The oil and gas sector is integral to Alberta’s economy. In 2005, the sector accounted for about 30% of the province’s nominal GDP.
• Alberta is the main player in Canada’s oil and
gas industry, making up 74% of the industry’s output and 86% of employment.
• Labour productivity in Alberta’s oil and gas sector is about five times the provincial average, mainly reflecting the high levels of capital used to extract oil and gas.
• Workers in the sector earn about 50% more
than the economy-wide average.
• Alberta’s oil and gas sector is more capital intensive than the overall economy. Investments in machinery and equipment and structures amount to about 51% of the sector’s GDP compared to 31% for the overall economy.
• Exports account for about two-thirds of all revenue generated from oil and gas extraction in Alberta, with the U.S. accounting for nearly all (99%) of these exports.
Alberta Industry Sector Performance and Prospects
Alberta Finance and Enterprise
Page 21
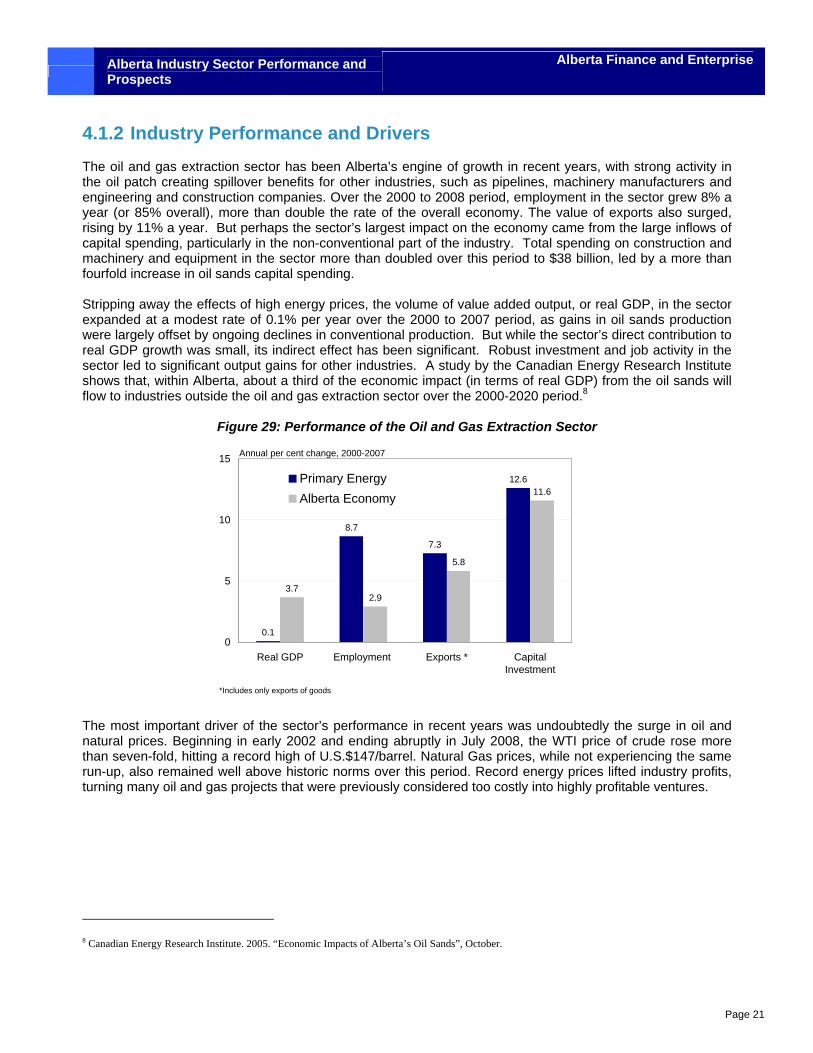
4.1.2 Industry Performance and Drivers The oil and gas extraction sector has been Alberta’s engine of growth in recent years, with strong activity in the oil patch creating spillover benefits for other industries, such as pipelines, machinery manufacturers and engineering and construction companies. Over the 2000 to 2008 period, employment in the sector grew 8% a year (or 85% overall), more than double the rate of the overall economy. The value of exports also surged, rising by 11% a year. But perhaps the sector’s largest impact on the economy came from the large inflows of capital spending, particularly in the non-conventional part of the industry. Total spending on construction and machinery and equipment in the sector more than doubled over this period to $38 billion, led by a more than fourfold increase in oil sands capital spending.
Stripping away the effects of high energy prices, the volume of value added output, or real GDP, in the sector expanded at a modest rate of 0.1% per year over the 2000 to 2007 period, as gains in oil sands production were largely offset by ongoing declines in conventional production. But while the sector’s direct contribution to real GDP growth was small, its indirect effect has been significant. Robust investment and job activity in the sector led to significant output gains for other industries. A study by the Canadian Energy Research Institute shows that, within Alberta, about a third of the economic impact (in terms of real GDP) from the oil sands will flow to industries outside the oil and gas extraction sector over the 2000-2020 period.8
Figure 29: Performance of the Oil and Gas Extraction Sector
0.1
8.7
7.3
12.6
3.72.9
5.8
11.6
0
5
10
15
Real GDP Employment Exports * CapitalInvestment
Primary EnergyAlberta Economy
Annual per cent change, 2000-2007
*Includes only exports of goods
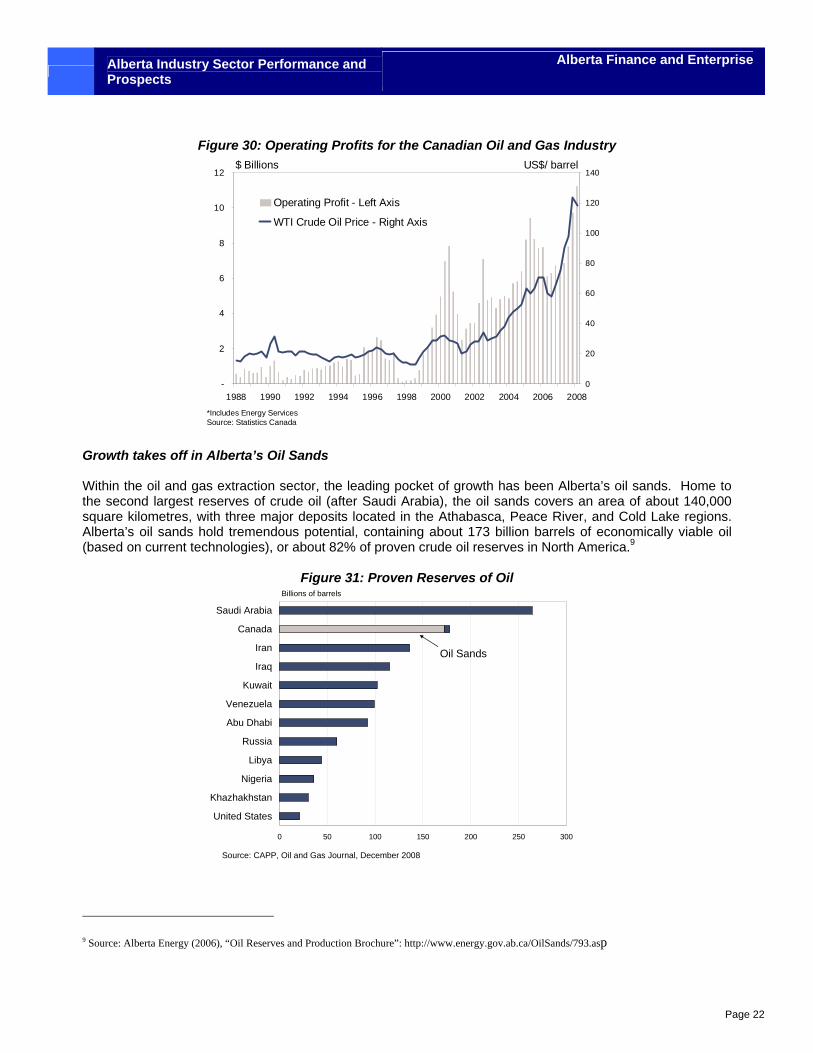
The most important driver of the sector’s performance in recent years was undoubtedly the surge in oil and natural prices. Beginning in early 2002 and ending abruptly in July 2008, the WTI price of crude rose more than seven-fold, hitting a record high of U.S.$147/barrel. Natural Gas prices, while not experiencing the same run-up, also remained well above historic norms over this period. Record energy prices lifted industry profits, turning many oil and gas projects that were previously considered too costly into highly profitable ventures.
8 Canadian Energy Research Institute. 2005. “Economic Impacts of Alberta’s Oil Sands”, October.
Alberta Industry Sector Performance and Prospects
Alberta Finance and Enterprise
Page 22
Figure 30: Operating Profits for the Canadian Oil and Gas Industry
-
2
4
6
8
10
12
1988 1990 1992 1994 1996 1998 2000 2002 2004 2006 20080
20
40
60
80
100
120
140
Operating Profit - Left Axis
WTI Crude Oil Price - Right Axis
$ Billions
*Includes Energy ServicesSource: Statistics Canada
US$/ barrel
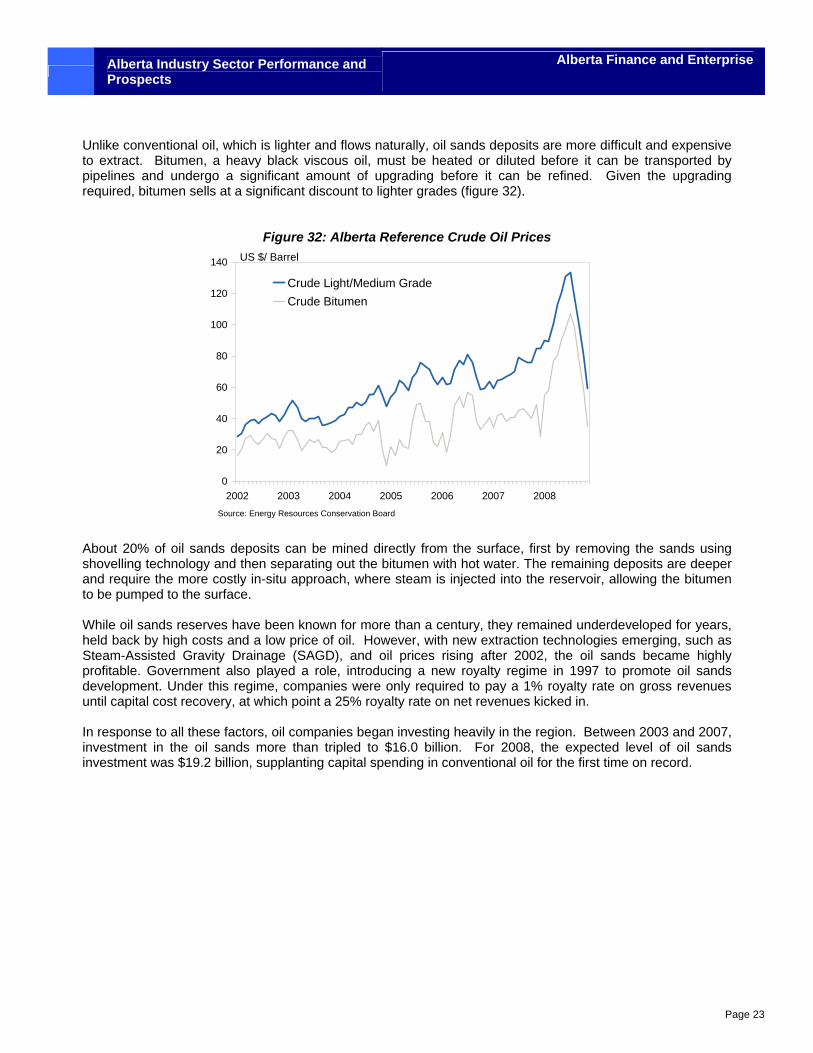
Growth takes off in Alberta’s Oil Sands Within the oil and gas extraction sector, the leading pocket of growth has been Alberta’s oil sands. Home to the second largest reserves of crude oil (after Saudi Arabia), the oil sands covers an area of about 140,000 square kilometres, with three major deposits located in the Athabasca, Peace River, and Cold Lake regions. Alberta’s oil sands hold tremendous potential, containing about 173 billion barrels of economically viable oil (based on current technologies), or about 82% of proven crude oil reserves in North America.9
Figure 31: Proven Reserves of Oil
0 50 100 150 200 250 300
United States
Khazhakhstan
Nigeria
Libya
Russia
Abu Dhabi
Venezuela
Kuwait
Iraq
Iran
Canada
Saudi Arabia
Oil Sands
Source: CAPP, Oil and Gas Journal, December 2008
Billions of barrels
9 Source: Alberta Energy (2006), “Oil Reserves and Production Brochure”: http://www.energy.gov.ab.ca/OilSands/793.asp
Alberta Industry Sector Performance and Prospects
Alberta Finance and Enterprise
Page 23
Unlike conventional oil, which is lighter and flows naturally, oil sands deposits are more difficult and expensive to extract. Bitumen, a heavy black viscous oil, must be heated or diluted before it can be transported by pipelines and undergo a significant amount of upgrading before it can be refined. Given the upgrading required, bitumen sells at a significant discount to lighter grades (figure 32).
Figure 32: Alberta Reference Crude Oil Prices
0
20
40
60
80
100
120
140
2002 2003 2004 2005 2006 2007 2008
Crude Light/Medium GradeCrude Bitumen
US $/ Barrel
Source: Energy Resources Conservation Board
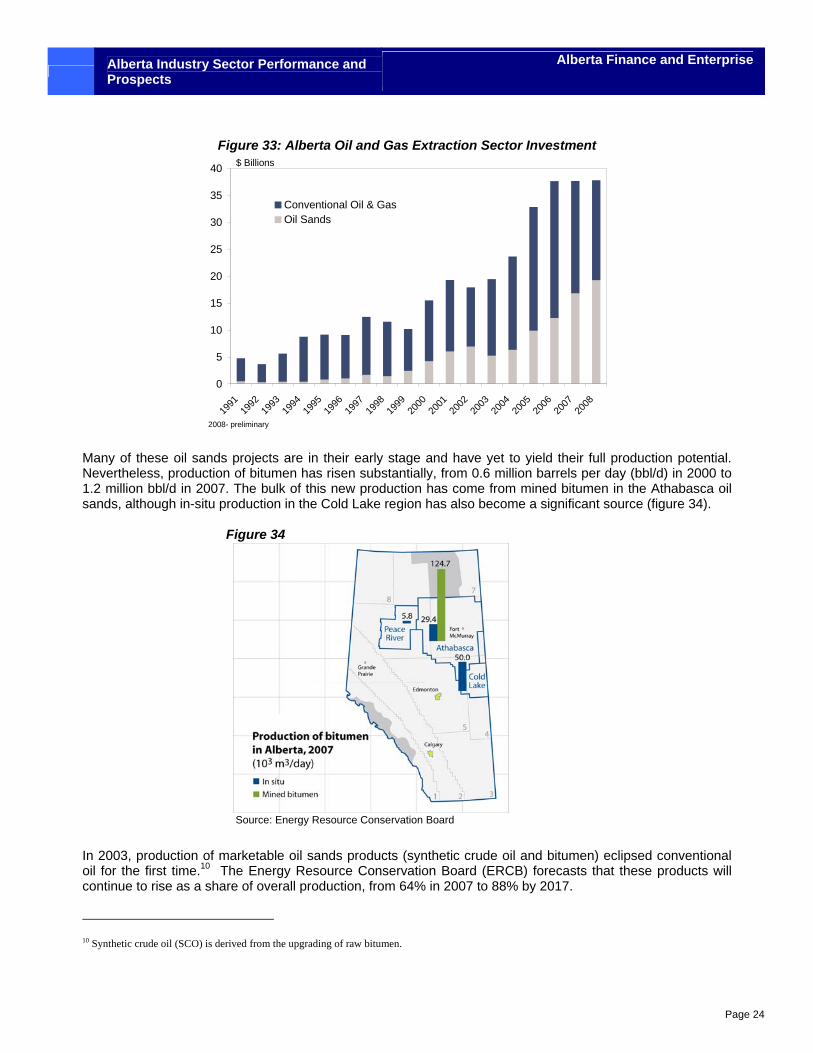
About 20% of oil sands deposits can be mined directly from the surface, first by removing the sands using shovelling technology and then separating out the bitumen with hot water. The remaining deposits are deeper and require the more costly in-situ approach, where steam is injected into the reservoir, allowing the bitumen to be pumped to the surface. While oil sands reserves have been known for more than a century, they remained underdeveloped for years, held back by high costs and a low price of oil. However, with new extraction technologies emerging, such as Steam-Assisted Gravity Drainage (SAGD), and oil prices rising after 2002, the oil sands became highly profitable. Government also played a role, introducing a new royalty regime in 1997 to promote oil sands development. Under this regime, companies were only required to pay a 1% royalty rate on gross revenues until capital cost recovery, at which point a 25% royalty rate on net revenues kicked in. In response to all these factors, oil companies began investing heavily in the region. Between 2003 and 2007, investment in the oil sands more than tripled to $16.0 billion. For 2008, the expected level of oil sands investment was $19.2 billion, supplanting capital spending in conventional oil for the first time on record.
Alberta Industry Sector Performance and Prospects
Alberta Finance and Enterprise
Page 24
Figure 33: Alberta Oil and Gas Extraction Sector Investment
0
5
10
15
20
25
30
35
40
1991
1992
1993
1994
1995
1996
1997
1998
1999
2000
2001
2002
2003
2004
2005
2006
2007
2008
Conventional Oil & GasOil Sands
$ Billions
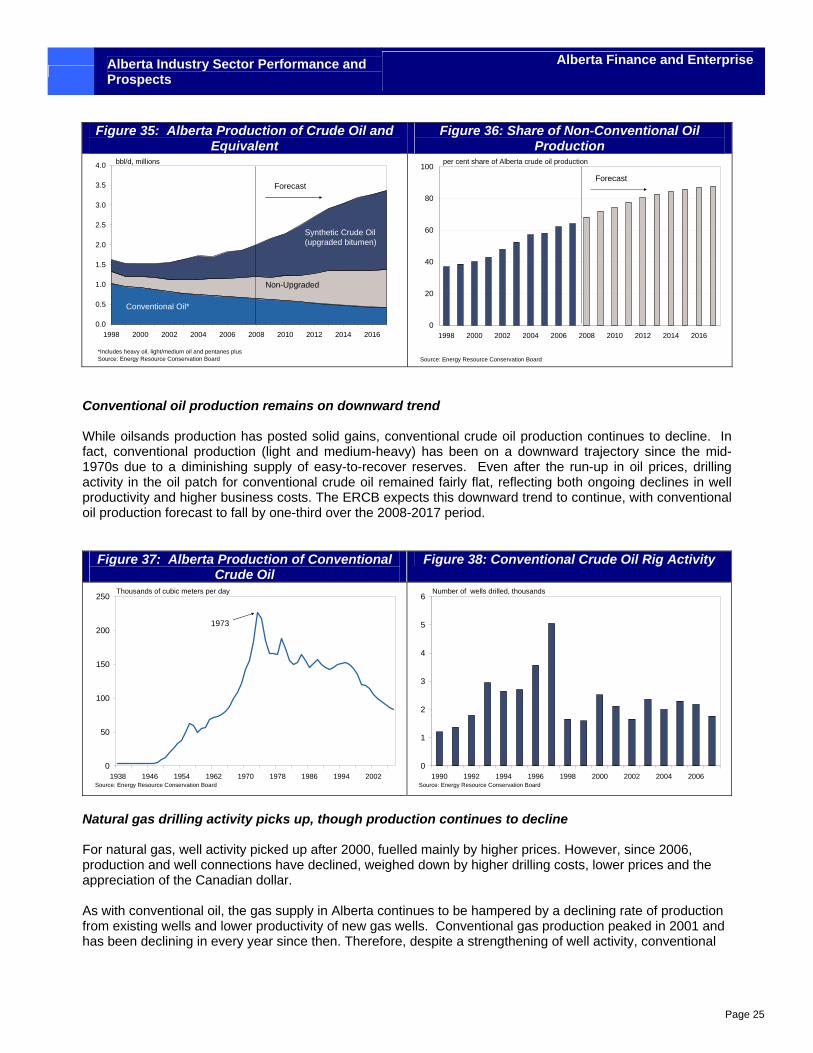
2008- preliminary Many of these oil sands projects are in their early stage and have yet to yield their full production potential. Nevertheless, production of bitumen has risen substantially, from 0.6 million barrels per day (bbl/d) in 2000 to 1.2 million bbl/d in 2007. The bulk of this new production has come from mined bitumen in the Athabasca oil sands, although in-situ production in the Cold Lake region has also become a significant source (figure 34).
Figure 34 In 2003, production of marketable oil sands products (synthetic crude oil and bitumen) eclipsed conventional oil for the first time.10 The Energy Resource Conservation Board (ERCB) forecasts that these products will continue to rise as a share of overall production, from 64% in 2007 to 88% by 2017. 10 Synthetic crude oil (SCO) is derived from the upgrading of raw bitumen.
Source: Energy Resource Conservation Board
Alberta Industry Sector Performance and Prospects
Alberta Finance and Enterprise
Page 25
Figure 35: Alberta Production of Crude Oil and Equivalent
Figure 36: Share of Non-Conventional Oil Production
0.0
0.5
1.0
1.5
2.0
2.5
3.0
3.5
4.0
1998 2000 2002 2004 2006 2008 2010 2012 2014 2016
bbl/d, millions
*Includes heavy oil, light/medium oil and pentanes plusSource: Energy Resource Conservation Board
Non-Upgraded
Synthetic Crude Oil (upgraded bitumen)
Conventional Oil*
Forecast
0
20
40
60
80
100
1998 2000 2002 2004 2006 2008 2010 2012 2014 2016
Source: Energy Resource Conservation Board
per cent share of Alberta crude oil production
Forecast
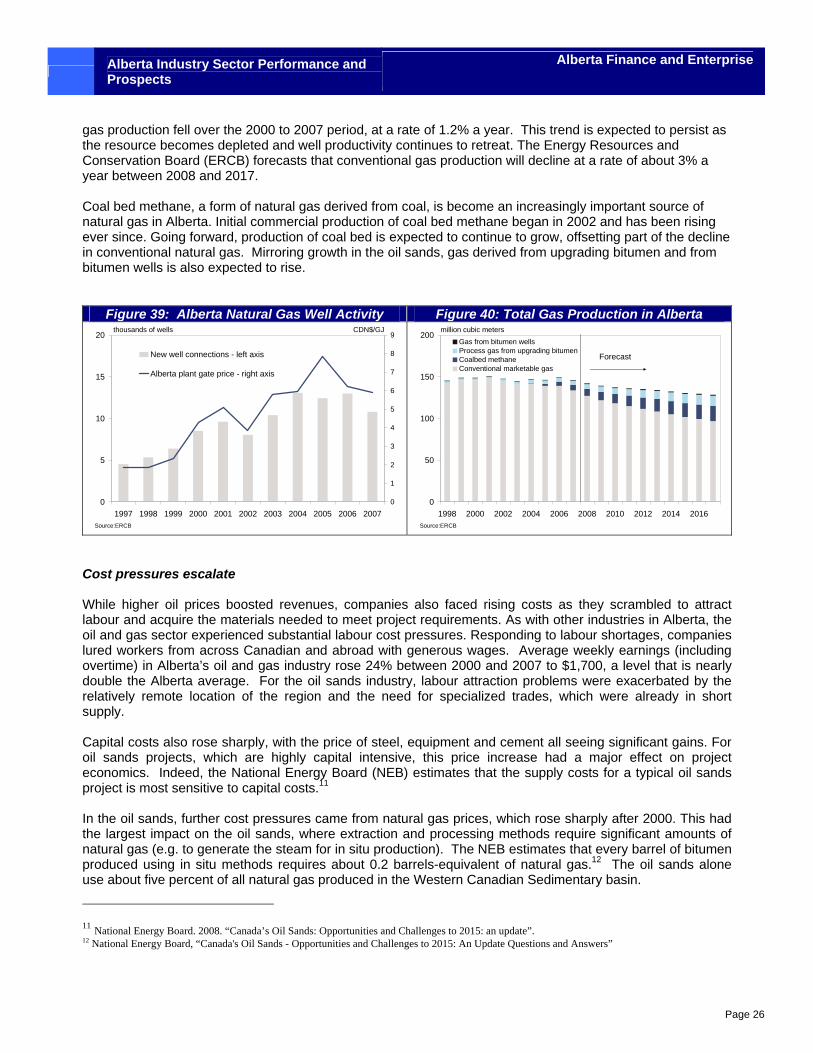
Conventional oil production remains on downward trend While oilsands production has posted solid gains, conventional crude oil production continues to decline. In fact, conventional production (light and medium-heavy) has been on a downward trajectory since the mid-1970s due to a diminishing supply of easy-to-recover reserves. Even after the run-up in oil prices, drilling activity in the oil patch for conventional crude oil remained fairly flat, reflecting both ongoing declines in well productivity and higher business costs. The ERCB expects this downward trend to continue, with conventional oil production forecast to fall by one-third over the 2008-2017 period.
Figure 37: Alberta Production of Conventional Crude Oil
Figure 38: Conventional Crude Oil Rig Activity
0
50
100
150
200
250
1938 1946 1954 1962 1970 1978 1986 1994 2002Source: Energy Resource Conservation Board
Thousands of cubic meters per day
1973
0
1
2
3
4
5
6
1990 1992 1994 1996 1998 2000 2002 2004 2006Source: Energy Resource Conservation Board
Number of wells drilled, thousands
Natural gas drilling activity picks up, though production continues to decline For natural gas, well activity picked up after 2000, fuelled mainly by higher prices. However, since 2006, production and well connections have declined, weighed down by higher drilling costs, lower prices and the appreciation of the Canadian dollar. As with conventional oil, the gas supply in Alberta continues to be hampered by a declining rate of production from existing wells and lower productivity of new gas wells. Conventional gas production peaked in 2001 and has been declining in every year since then. Therefore, despite a strengthening of well activity, conventional
Alberta Industry Sector Performance and Prospects
Alberta Finance and Enterprise
Page 26
gas production fell over the 2000 to 2007 period, at a rate of 1.2% a year. This trend is expected to persist as the resource becomes depleted and well productivity continues to retreat. The Energy Resources and Conservation Board (ERCB) forecasts that conventional gas production will decline at a rate of about 3% a year between 2008 and 2017. Coal bed methane, a form of natural gas derived from coal, is become an increasingly important source of natural gas in Alberta. Initial commercial production of coal bed methane began in 2002 and has been rising ever since. Going forward, production of coal bed is expected to continue to grow, offsetting part of the decline in conventional natural gas. Mirroring growth in the oil sands, gas derived from upgrading bitumen and from bitumen wells is also expected to rise.
Figure 39: Alberta Natural Gas Well Activity Figure 40: Total Gas Production in Alberta
0
5
10
15
20
1997 1998 1999 2000 2001 2002 2003 2004 2005 2006 20070
1
2
3
4
5
6
7
8
9
New well connections - left axis
Alberta plant gate price - right axis
Source:ERCB
thousands of wells CDN$/GJ
0
50
100
150
200
1998 2000 2002 2004 2006 2008 2010 2012 2014 2016
Gas from bitumen wellsProcess gas from upgrading bitumenCoalbed methaneConventional marketable gas
Source:ERCB
million cubic meters
Forecast
Cost pressures escalate While higher oil prices boosted revenues, companies also faced rising costs as they scrambled to attract labour and acquire the materials needed to meet project requirements. As with other industries in Alberta, the oil and gas sector experienced substantial labour cost pressures. Responding to labour shortages, companies lured workers from across Canadian and abroad with generous wages. Average weekly earnings (including overtime) in Alberta’s oil and gas industry rose 24% between 2000 and 2007 to $1,700, a level that is nearly double the Alberta average. For the oil sands industry, labour attraction problems were exacerbated by the relatively remote location of the region and the need for specialized trades, which were already in short supply. Capital costs also rose sharply, with the price of steel, equipment and cement all seeing significant gains. For oil sands projects, which are highly capital intensive, this price increase had a major effect on project economics. Indeed, the National Energy Board (NEB) estimates that the supply costs for a typical oil sands project is most sensitive to capital costs.11 In the oil sands, further cost pressures came from natural gas prices, which rose sharply after 2000. This had the largest impact on the oil sands, where extraction and processing methods require significant amounts of natural gas (e.g. to generate the steam for in situ production). The NEB estimates that every barrel of bitumen produced using in situ methods requires about 0.2 barrels-equivalent of natural gas.12 The oil sands alone use about five percent of all natural gas produced in the Western Canadian Sedimentary basin.
11 National Energy Board. 2008. “Canada’s Oil Sands: Opportunities and Challenges to 2015: an update”. 12 National Energy Board, “Canada's Oil Sands - Opportunities and Challenges to 2015: An Update Questions and Answers”
Alberta Industry Sector Performance and Prospects
Alberta Finance and Enterprise
Page 27
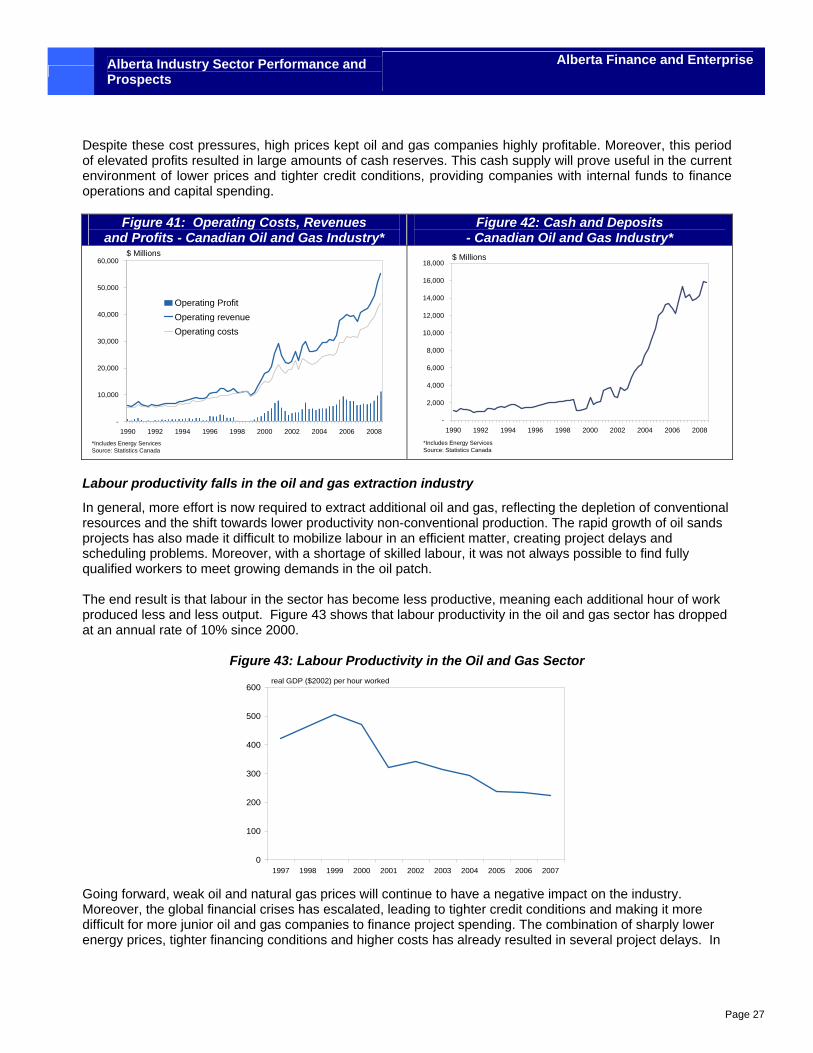
Despite these cost pressures, high prices kept oil and gas companies highly profitable. Moreover, this period of elevated profits resulted in large amounts of cash reserves. This cash supply will prove useful in the current environment of lower prices and tighter credit conditions, providing companies with internal funds to finance operations and capital spending.
Figure 41: Operating Costs, Revenues
and Profits - Canadian Oil and Gas Industry* Figure 42: Cash and Deposits
- Canadian Oil and Gas Industry*
-
10,000
20,000
30,000
40,000
50,000
60,000
1990 1992 1994 1996 1998 2000 2002 2004 2006 2008
Operating ProfitOperating revenueOperating costs
$ Millions
*Includes Energy ServicesSource: Statistics Canada
-
2,000
4,000
6,000
8,000
10,000
12,000
14,000
16,000
18,000
1990 1992 1994 1996 1998 2000 2002 2004 2006 2008
$ Millions
*Includes Energy ServicesSource: Statistics Canada
Labour productivity falls in the oil and gas extraction industry
In general, more effort is now required to extract additional oil and gas, reflecting the depletion of conventional resources and the shift towards lower productivity non-conventional production. The rapid growth of oil sands projects has also made it difficult to mobilize labour in an efficient matter, creating project delays and scheduling problems. Moreover, with a shortage of skilled labour, it was not always possible to find fully qualified workers to meet growing demands in the oil patch. The end result is that labour in the sector has become less productive, meaning each additional hour of work produced less and less output. Figure 43 shows that labour productivity in the oil and gas sector has dropped at an annual rate of 10% since 2000.
Figure 43: Labour Productivity in the Oil and Gas Sector
0
100
200
300
400
500
600
1997 1998 1999 2000 2001 2002 2003 2004 2005 2006 2007
real GDP ($2002) per hour worked
Going forward, weak oil and natural gas prices will continue to have a negative impact on the industry. Moreover, the global financial crises has escalated, leading to tighter credit conditions and making it more difficult for more junior oil and gas companies to finance project spending. The combination of sharply lower energy prices, tighter financing conditions and higher costs has already resulted in several project delays. In
Alberta Industry Sector Performance and Prospects
Alberta Finance and Enterprise
Page 28
the oil sands, 14 projects have been announced as being delayed as of December, 2008.13 For example, Shell Canada has deferred its planned expansion of its Scotford upgrader, while Petro Canada is delaying construction of its $25 billion Fort Hills mining and upgrader project. As a result, the Canadian Association of Petroleum Producers (CAPP) is now expecting that capital spending in the oil sands will drop by half, from $20 billion in 2008 to $10 billion in 2009.14 Oil sands companies are treading near break-even points on their operations. As of June 2006, the NEB estimated that integrated mining and SAGD operations were economic at U.S.$30-U.S.$35 barrel (WTI), slightly below current price levels of around U.S.$40 to U.S.$50 (February and March). However, it is now likely that the breakeven prices are even higher, reflecting recent cost pressures.15 The good new is that companies may finally be able to control costs, as labour shortages ease and material costs continue to decline. Moreover, the recent depreciation of the Canadian dollar has, in part, cushioned the effects of lower oil prices, which are priced in U.S. dollars. The long-term prospects for the industry are, for the most part, positive. Alberta’s large oil sands reserves provide producers with one of the world’s most stable, proven and secure supplies of oil available. Non-conventional supplies of natural gas (e.g. coal bed methane) continue to rise and will continue to help offset declines in conventional production. Moreover, technologies for extracting non-conventional resources have improved in recent years, helping companies’ lower costs and increase production. The main threat is the environment. While some progress has been made, with the government recently pledging $2 billion to develop CCS technologies, the industry and government will need to demonstrate that it can develop the oil sands in a sustainable and environmentally friendly manner.
4.1.3 SWOT Analysis
Strengths
• Alberta’s oil sands contain the world’s second largest reserves of crude oil after Saudi Arabia. These reserves are proven and can be recovered with today’s technologies. In addition, the province has proven unconventional natural gas reserves of coal bed methane, shale and tight gas.
• Alberta has a very favourable investment climate. Unlike many other petroleum producing jurisdictions, oil and gas companies in Alberta operate in a certain and stable environment and face little political risk.
• Oil and gas companies have access to one of the world’s most extensive networks of pipelines. These pipelines may help attract northern gas to Alberta, which would increase the supply of natural gas and natural gas liquids.
• Alberta’s oil and gas sector is highly innovative, employing the latest extraction and procession
technologies and equipment. Industry works closely with government, through organizations like Alberta Energy Research Institute (AERI), to advance energy technology.
13 CAPP’s Crude Oil Forecast December 2008 – Interim Update. 14 Includes investments in construction and machinery and equipment. Source: “Canada’s Oil, Natural Gas and Oil Sands, Overview and Outlook”, Greg Stringham, information presented in Washington DC, CAPP, February 2009. 15 Break-even estimates vary widely. In January 2008, Strategy West estimated that the break-even WTI price was about $60/barrel for a typical oil sands project.
Alberta Industry Sector Performance and Prospects
Alberta Finance and Enterprise
Page 29
Weaknesses
• Alberta’s oil and gas sector is very dependent on the U.S. market, subjecting the sector to a high degree of market risk. U.S. imposed restrictions on the importation of Alberta’s energy resources in response to environmental concerns would have a major impact on the sector.
• Conventional oil and natural gas production is on a downward trend. The industry is becoming highly
dependent on Alberta’s non-conventional resources of bitumen and coal bed methane, which are generally more costly to extract with today’s technologies.
• The oil sands are highly reliant on natural gas for both mining and especially in situ operations. This
makes operating costs highly sensitive to the price of natural gas. Moreover, natural gas production is declining, raising the need to find alternate methods of producing heat, such as the gasification of bitumen.
• Large amounts of water are required to create the steam for SAGD. Ongoing development of the oil
sands will continue to drain water resources from the North Saskatchewan and Athabasca rivers.
Opportunities
• To reduce reliance on natural gas, there are opportunities for oil sands producers to increase production of synthesis gas (syngas), which involves the gasification of bitumen. While gasification is already underway, for example at Nexen’s Long Lake SAGD project, companies are only beginning to realize its potential. The challenge will be to combine gasification with CCS technologies. This way a growing supply of feed stocks (e.g. bitumen bottoms and petroleum coke) can be gasified to meet oil sands energy requirements, while also minimizing the environmental footprint through the sequestering of resulting carbon emissions.
• Despite declining production levels, there are still opportunities for conventional oil and gas. According
to the Petroleum Technology Alliance of Canada (PTAC) there are about 3.6 billion barrels of conventional oil reserves that could be added over the next decade in Alberta through enhanced recovery, assuming the right incentives are in place and the appropriate technologies employed.16
• To help replace declining conventional natural gas resources, there is potential to recover significant
reserves of coal bed methane, tight gas, and shale gas.
• Northern gas could provide an alternate source of fuel for the oil sands.
• To limit withdrawals of water during periods of low river flows, oil sands producers will need to improve on-site water storage capacity. Some newer mines now include significant water storage as part of their design.
• One application of CCS involves injecting carbon dioxide (CO2) from oil sands into conventional oil
fields, allowing companies to reduce emissions while also improving oil recovery. The Government of Alberta has committed $2 billion to develop CCS technologies.
• To improve their environmental record, oil sands producers must continue to demonstrate detoxification and reclamation of mining and tailings ponds.
16 Petroleum Technology Alliance of Canada. 2008. “Ramping Up Recovery: A Business Case for the Increased Recovery of Oil and Gas”, June
Alberta Industry Sector Performance and Prospects
Alberta Finance and Enterprise
Page 30
• Rapidly declining construction costs, a result of the global economic slowdown, may provide an opportunity for some of the more capitalized companies to move forward on oil sands projects.
Threats
• Lower oil prices, if sustained, make many oil sands and conventional drilling projects uneconomical, threatening growth of the sector.
• Alberta’s reliance on natural gas to meet electricity requirements (e.g. for SAGD) subjects the oil sands to significant market risk. A spike in natural gas prices could result in significant operating costs, hurting profitability.
• There is some uncertainty as to whether transportation infrastructure can keep pace with rapid oil sands developments. This could slow the movement of materials and equipment, resulting in both construction and production delays.
• Despite some moderation in activity, skilled labour shortages persist in Alberta’s oil patch. A lack of skilled labour could threaten the future pace of development and stifle labour productivity.
• Inadequate infrastructure and public services in the Fort McMurray area could reduce the quality of life for residents and hurt the regions ability to attract and retain workers.
• Oil sands producers are under tremendous political and public pressure to reduce their environmental footprint. Recent media reports on “dirty oil” from Alberta’s oil sands and the death of several hundred ducks in the Syncrude tailings pond in August 2008 have negatively impacted public perception.
• The U.S. government is proposing an economy-wide cap-and-trade program to reduce GHG emissions. This may impose additional costs and risks to Alberta oil sands exports to the U.S.
• Some oil sands producers have considered switching to cheaper fuel alternatives to natural gas, such as coke, a by-product of the bitumen recovery process. This would result in a significant increase in GHG emissions. Alberta Environment has recently announced that it will set pollution standards to limit the burning of coke.
• While GHG intensity has declined in the oil sands, overall emissions have increased due to higher levels of oil production. Oil sands producers must find ways – through CCS and other technologies – to curtail emissions or face the prospect of steeper regulations.
• Alberta’s new royalty framework results in a higher level of government take when oil and natural gas prices are high. However, at this point, it is unclear whether the royalty system will have a significant impact on investment.
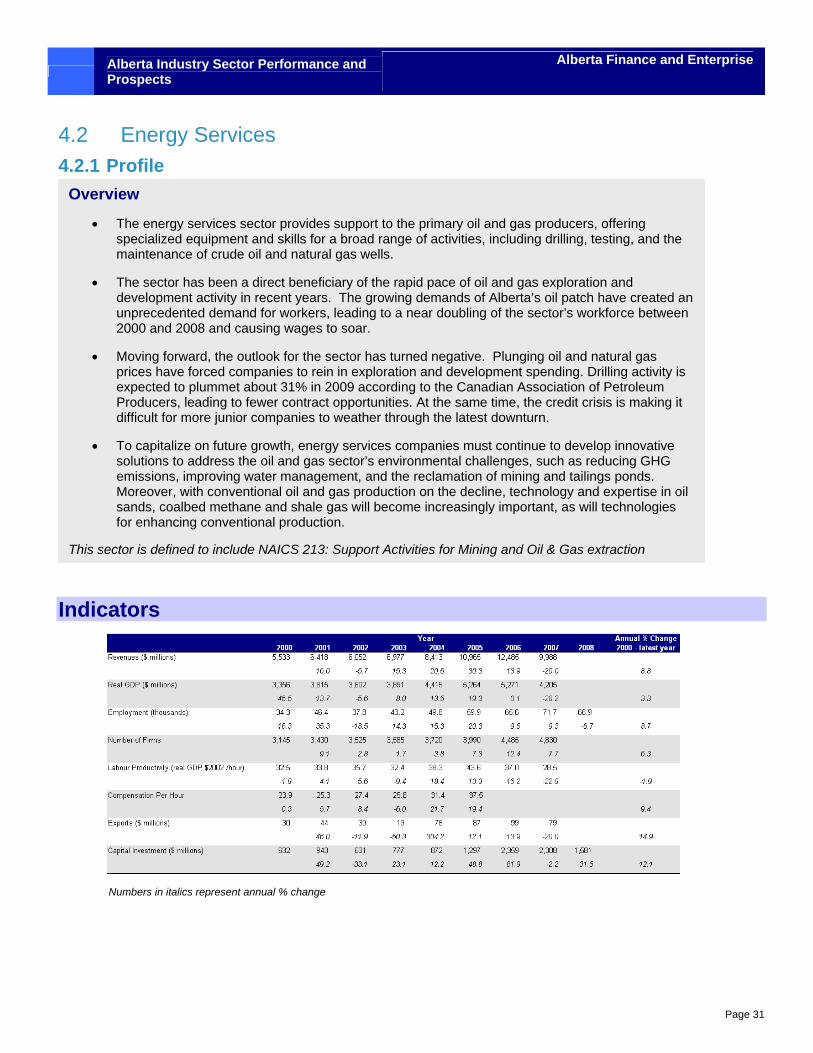
Alberta Industry Sector Performance and Prospects
Alberta Finance and Enterprise
Page 31
4.2 Energy Services 4.2.1 Profile
Indicators
Numbers in italics represent annual % change
Overview
• The energy services sector provides support to the primary oil and gas producers, offering specialized equipment and skills for a broad range of activities, including drilling, testing, and the maintenance of crude oil and natural gas wells.
• The sector has been a direct beneficiary of the rapid pace of oil and gas exploration and development activity in recent years. The growing demands of Alberta’s oil patch have created an unprecedented demand for workers, leading to a near doubling of the sector’s workforce between 2000 and 2008 and causing wages to soar.
• Moving forward, the outlook for the sector has turned negative. Plunging oil and natural gas prices have forced companies to rein in exploration and development spending. Drilling activity is expected to plummet about 31% in 2009 according to the Canadian Association of Petroleum Producers, leading to fewer contract opportunities. At the same time, the credit crisis is making it difficult for more junior companies to weather through the latest downturn.
• To capitalize on future growth, energy services companies must continue to develop innovative solutions to address the oil and gas sector’s environmental challenges, such as reducing GHG emissions, improving water management, and the reclamation of mining and tailings ponds. Moreover, with conventional oil and gas production on the decline, technology and expertise in oil sands, coalbed methane and shale gas will become increasingly important, as will technologies for enhancing conventional production.
This sector is defined to include NAICS 213: Support Activities for Mining and Oil & Gas extraction
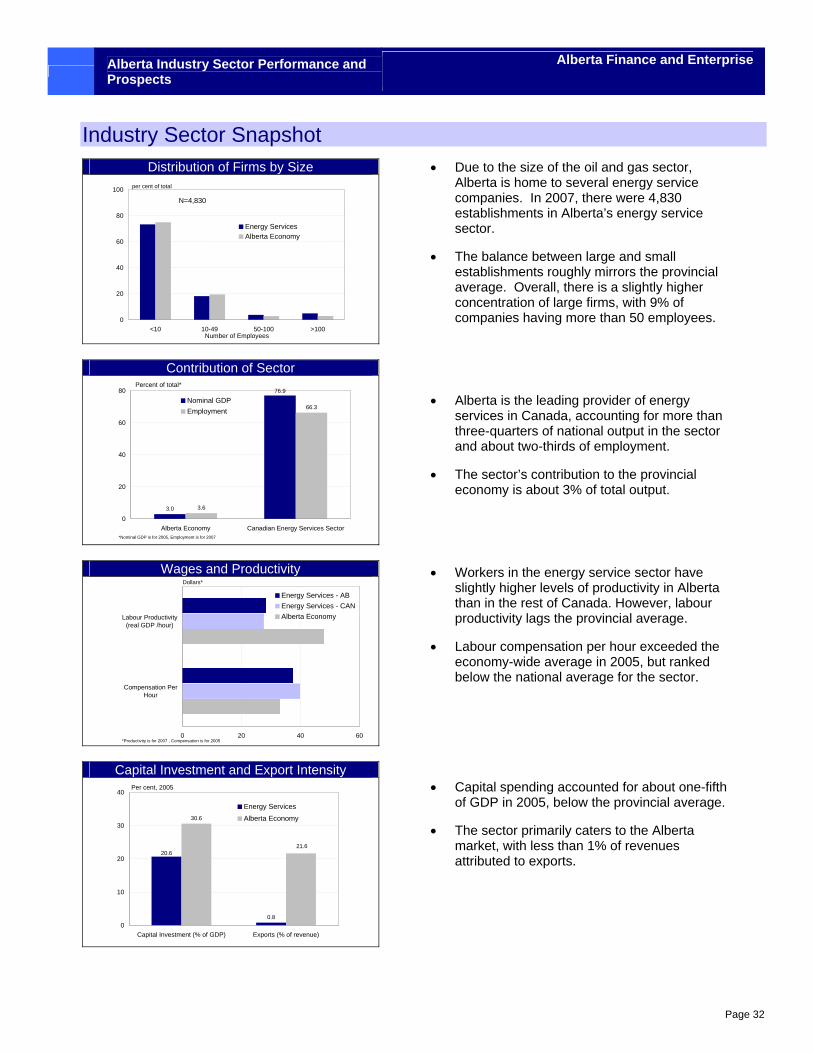
Alberta Industry Sector Performance and Prospects
Alberta Finance and Enterprise
Page 32
Industry Sector Snapshot Distribution of Firms by Size
0
20
40
60
80
100
<10 10-49 50-100 >100
Energy ServicesAlberta Economy
per cent of total
Number of Employees
N=4,830
Contribution of Sector
3.0 3.6
66.3
76.9
0
20
40
60
80
Alberta Economy Canadian Energy Services Sector
Nominal GDPEmployment
Percent of total*
*Nominal GDP is for 2005, Employment is for 2007
Wages and Productivity
0 20 40 60
Compensation PerHour
Labour Productivity(real GDP /hour)
Energy Services - ABEnergy Services - CANAlberta Economy
Dollars*
*Productivity is for 2007 , Compensation is for 2005
Capital Investment and Export Intensity
0.8
30.6
20.621.6
0
10
20
30
40
Capital Investment (% of GDP) Exports (% of revenue)
Energy ServicesAlberta Economy
Per cent, 2005
• Due to the size of the oil and gas sector, Alberta is home to several energy service companies. In 2007, there were 4,830 establishments in Alberta’s energy service sector.
• The balance between large and small establishments roughly mirrors the provincial average. Overall, there is a slightly higher concentration of large firms, with 9% of companies having more than 50 employees.
• Alberta is the leading provider of energy services in Canada, accounting for more than three-quarters of national output in the sector and about two-thirds of employment.
• The sector’s contribution to the provincial economy is about 3% of total output.
• Workers in the energy service sector have slightly higher levels of productivity in Alberta than in the rest of Canada. However, labour productivity lags the provincial average.
• Labour compensation per hour exceeded the economy-wide average in 2005, but ranked below the national average for the sector.
• Capital spending accounted for about one-fifth of GDP in 2005, below the provincial average.
• The sector primarily caters to the Alberta market, with less than 1% of revenues attributed to exports.
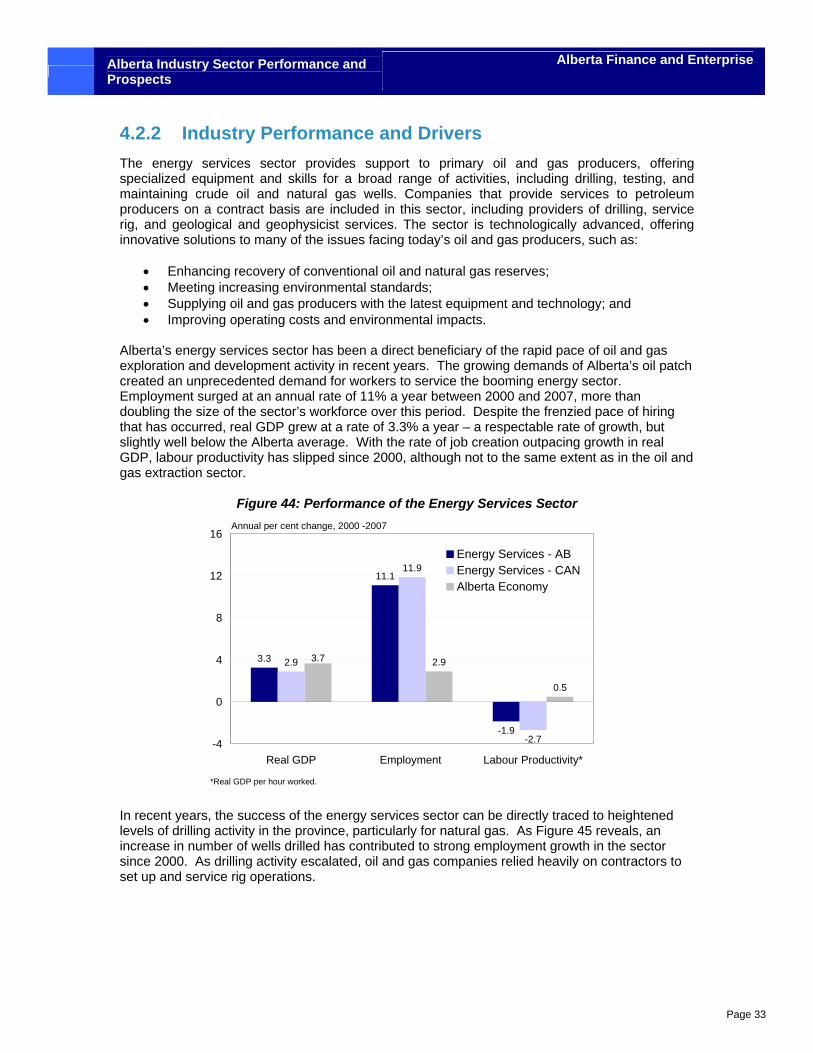
Alberta Industry Sector Performance and Prospects
Alberta Finance and Enterprise
Page 33
4.2.2 Industry Performance and Drivers The energy services sector provides support to primary oil and gas producers, offering specialized equipment and skills for a broad range of activities, including drilling, testing, and maintaining crude oil and natural gas wells. Companies that provide services to petroleum producers on a contract basis are included in this sector, including providers of drilling, service rig, and geological and geophysicist services. The sector is technologically advanced, offering innovative solutions to many of the issues facing today’s oil and gas producers, such as:
• Enhancing recovery of conventional oil and natural gas reserves; • Meeting increasing environmental standards; • Supplying oil and gas producers with the latest equipment and technology; and • Improving operating costs and environmental impacts.
Alberta’s energy services sector has been a direct beneficiary of the rapid pace of oil and gas exploration and development activity in recent years. The growing demands of Alberta’s oil patch created an unprecedented demand for workers to service the booming energy sector. Employment surged at an annual rate of 11% a year between 2000 and 2007, more than doubling the size of the sector’s workforce over this period. Despite the frenzied pace of hiring that has occurred, real GDP grew at a rate of 3.3% a year – a respectable rate of growth, but slightly well below the Alberta average. With the rate of job creation outpacing growth in real GDP, labour productivity has slipped since 2000, although not to the same extent as in the oil and gas extraction sector.
Figure 44: Performance of the Energy Services Sector
3.3
11.1
-1.9
2.9
11.9
-2.7
2.9
0.5
3.7
-4
0
4
8
12
16
Real GDP Employment Labour Productivity*
Energy Services - ABEnergy Services - CANAlberta Economy
Annual per cent change, 2000 -2007
*Real GDP per hour worked.
In recent years, the success of the energy services sector can be directly traced to heightened levels of drilling activity in the province, particularly for natural gas. As Figure 45 reveals, an increase in number of wells drilled has contributed to strong employment growth in the sector since 2000. As drilling activity escalated, oil and gas companies relied heavily on contractors to set up and service rig operations.
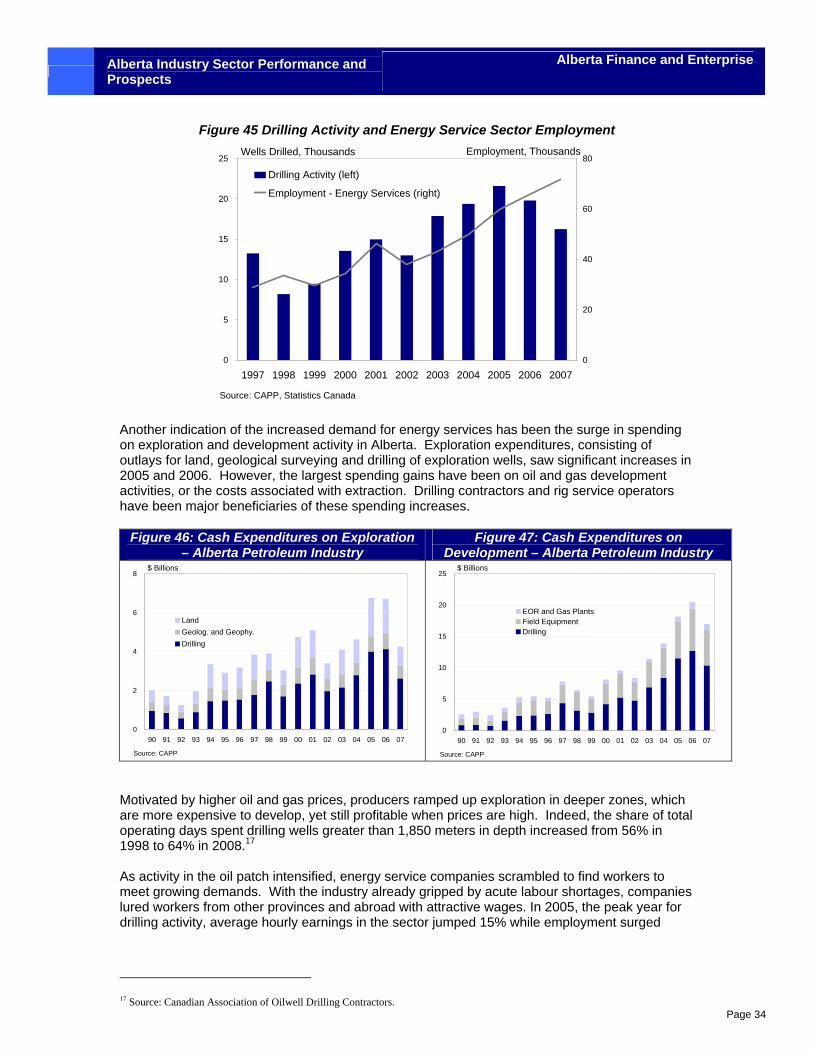
Alberta Industry Sector Performance and Prospects
Alberta Finance and Enterprise
Page 34
Figure 45 Drilling Activity and Energy Service Sector Employment
0
5
10
15
20
25
1997 1998 1999 2000 2001 2002 2003 2004 2005 2006 20070
20
40
60
80
Drilling Activity (left)
Employment - Energy Services (right)
Wells Drilled, Thousands
Source: CAPP, Statistics Canada
Employment, Thousands
Another indication of the increased demand for energy services has been the surge in spending on exploration and development activity in Alberta. Exploration expenditures, consisting of outlays for land, geological surveying and drilling of exploration wells, saw significant increases in 2005 and 2006. However, the largest spending gains have been on oil and gas development activities, or the costs associated with extraction. Drilling contractors and rig service operators have been major beneficiaries of these spending increases.
Figure 46: Cash Expenditures on Exploration – Alberta Petroleum Industry
Figure 47: Cash Expenditures on Development – Alberta Petroleum Industry
0
2
4
6
8
90 91 92 93 94 95 96 97 98 99 00 01 02 03 04 05 06 07
LandGeolog. and Geophy.Drilling
$ Billions
Source: CAPP
0
5
10
15
20
25
90 91 92 93 94 95 96 97 98 99 00 01 02 03 04 05 06 07
EOR and Gas PlantsField EquipmentDrilling
$ Billions
Source: CAPP
Motivated by higher oil and gas prices, producers ramped up exploration in deeper zones, which are more expensive to develop, yet still profitable when prices are high. Indeed, the share of total operating days spent drilling wells greater than 1,850 meters in depth increased from 56% in 1998 to 64% in 2008.17 As activity in the oil patch intensified, energy service companies scrambled to find workers to meet growing demands. With the industry already gripped by acute labour shortages, companies lured workers from other provinces and abroad with attractive wages. In 2005, the peak year for drilling activity, average hourly earnings in the sector jumped 15% while employment surged
17 Source: Canadian Association of Oilwell Drilling Contractors.
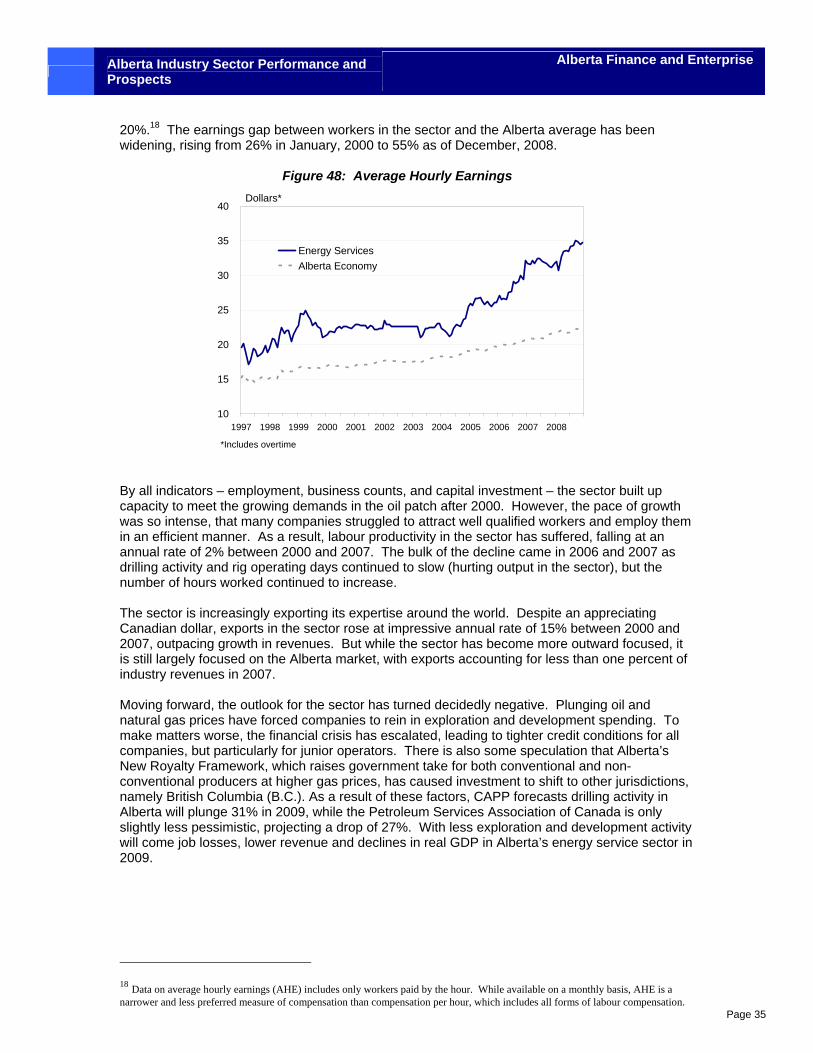
Alberta Industry Sector Performance and Prospects
Alberta Finance and Enterprise
Page 35
20%.18 The earnings gap between workers in the sector and the Alberta average has been widening, rising from 26% in January, 2000 to 55% as of December, 2008. Figure 48: Average Hourly Earnings
10
15
20
25
30
35
40
1997 1998 1999 2000 2001 2002 2003 2004 2005 2006 2007 2008
Energy ServicesAlberta Economy
Dollars*
*Includes overtime By all indicators – employment, business counts, and capital investment – the sector built up capacity to meet the growing demands in the oil patch after 2000. However, the pace of growth was so intense, that many companies struggled to attract well qualified workers and employ them in an efficient manner. As a result, labour productivity in the sector has suffered, falling at an annual rate of 2% between 2000 and 2007. The bulk of the decline came in 2006 and 2007 as drilling activity and rig operating days continued to slow (hurting output in the sector), but the number of hours worked continued to increase. The sector is increasingly exporting its expertise around the world. Despite an appreciating Canadian dollar, exports in the sector rose at impressive annual rate of 15% between 2000 and 2007, outpacing growth in revenues. But while the sector has become more outward focused, it is still largely focused on the Alberta market, with exports accounting for less than one percent of industry revenues in 2007. Moving forward, the outlook for the sector has turned decidedly negative. Plunging oil and natural gas prices have forced companies to rein in exploration and development spending. To make matters worse, the financial crisis has escalated, leading to tighter credit conditions for all companies, but particularly for junior operators. There is also some speculation that Alberta’s New Royalty Framework, which raises government take for both conventional and non-conventional producers at higher gas prices, has caused investment to shift to other jurisdictions, namely British Columbia (B.C.). As a result of these factors, CAPP forecasts drilling activity in Alberta will plunge 31% in 2009, while the Petroleum Services Association of Canada is only slightly less pessimistic, projecting a drop of 27%. With less exploration and development activity will come job losses, lower revenue and declines in real GDP in Alberta’s energy service sector in 2009.
18 Data on average hourly earnings (AHE) includes only workers paid by the hour. While available on a monthly basis, AHE is a narrower and less preferred measure of compensation than compensation per hour, which includes all forms of labour compensation.
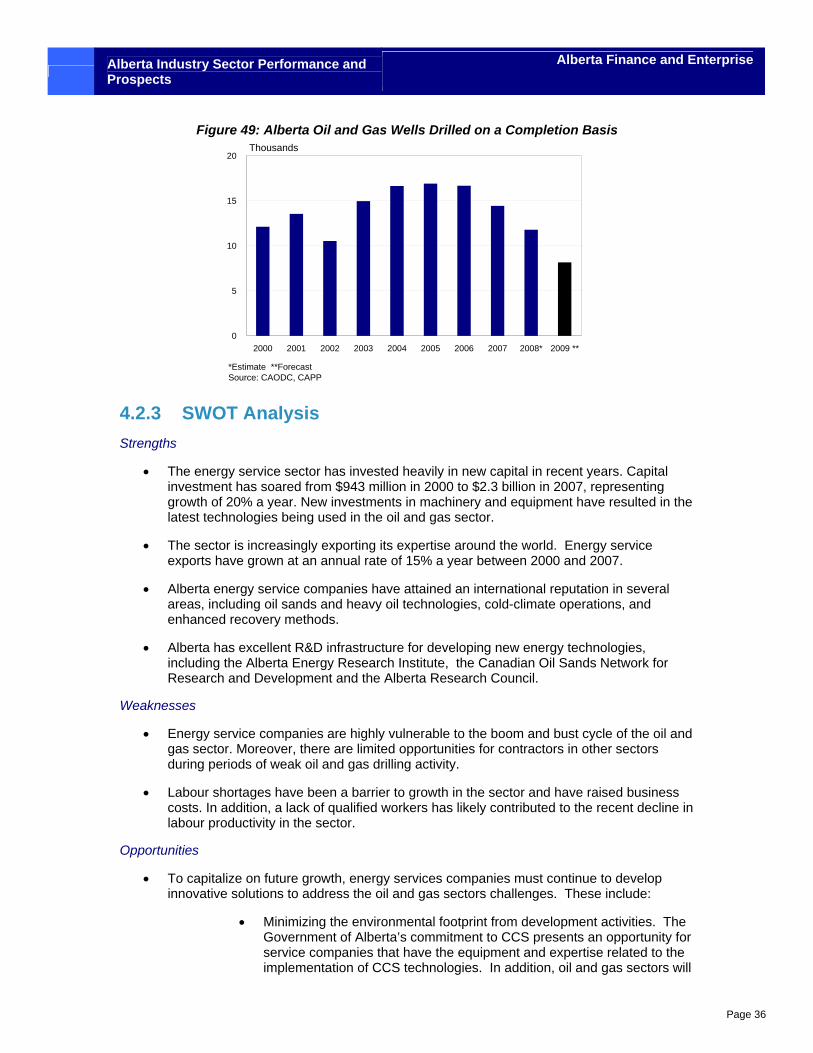
Alberta Industry Sector Performance and Prospects
Alberta Finance and Enterprise
Page 36
Figure 49: Alberta Oil and Gas Wells Drilled on a Completion Basis
0
5
10
15
20
2000 2001 2002 2003 2004 2005 2006 2007 2008* 2009 **
Thousands
*Estimate **ForecastSource: CAODC, CAPP
4.2.3 SWOT Analysis Strengths
• The energy service sector has invested heavily in new capital in recent years. Capital investment has soared from $943 million in 2000 to $2.3 billion in 2007, representing growth of 20% a year. New investments in machinery and equipment have resulted in the latest technologies being used in the oil and gas sector.
• The sector is increasingly exporting its expertise around the world. Energy service exports have grown at an annual rate of 15% a year between 2000 and 2007.
• Alberta energy service companies have attained an international reputation in several areas, including oil sands and heavy oil technologies, cold-climate operations, and enhanced recovery methods.
• Alberta has excellent R&D infrastructure for developing new energy technologies, including the Alberta Energy Research Institute, the Canadian Oil Sands Network for Research and Development and the Alberta Research Council.
Weaknesses
• Energy service companies are highly vulnerable to the boom and bust cycle of the oil and gas sector. Moreover, there are limited opportunities for contractors in other sectors during periods of weak oil and gas drilling activity.
• Labour shortages have been a barrier to growth in the sector and have raised business costs. In addition, a lack of qualified workers has likely contributed to the recent decline in labour productivity in the sector.
Opportunities
• To capitalize on future growth, energy services companies must continue to develop innovative solutions to address the oil and gas sectors challenges. These include:
• Minimizing the environmental footprint from development activities. The Government of Alberta’s commitment to CCS presents an opportunity for service companies that have the equipment and expertise related to the implementation of CCS technologies. In addition, oil and gas sectors will
Alberta Industry Sector Performance and Prospects
Alberta Finance and Enterprise
Page 37
need service companies to help meet new GHG standards set by the provincial and federal government.19
• Improving water use management, including water conservation and recycling technology.
• Reclamation of mining and tailings ponds.
• Reducing reliance on natural gas as an energy source, particularly in non-conventional oil extraction.
• Higher level of industrial integration. Integration of facilities leads to operating efficiencies, lower costs and reduced environmental impacts.
• With conventional production on the decline for oil and natural gas, the energy service sector must have the capacity to develop and implement new technologies for the oil sands (e.g. VAPEX, THAI)20, coal bed methane, shale gas and other non-conventional sources.
• As conventional oil and gas becomes more costly and difficult to extract, there are opportunities in the areas of enhanced oil recovery and new extraction techniques, such as advanced seismic and horizontal drilling.
• The economic slowdown should alleviate some of the cost pressures the sector has faced in recent years. Labour shortages are likely to ease, and the cost of many materials has already started to fall.
• There are opportunities to export energy services to other oil and gas producing jurisdictions, particularly in specialty areas, such as enhanced oil recovery, cold climate operations and heavy oil.
• Due to the global financial crisis and the collapse in energy prices, a new stimulus package for oil and gas drilling was announced by the Alberta Government in February, 2009. The package, which should offset some of the effects of the downturn for energy service companies, includes the following:
• A one-year $466M drilling royalty credit equal to 10% to 50% of royalties owed;
• A one-year $1.04B well investment program, which caps royalties at 5% for the first year of production on all conventional wells; and
• A $30M orphan well fund for the reclamation of old wells.
Threats
• Due to falling energy prices, drilling activity has been weakening in recent months and is forecast to fall 27%-31% in 2009. This will result in a significant slowdown for the energy service sectors, leading to weaker revenue, declining profitability and job losses. To date, contractors that specialize in new drilling have experienced the sharpest declines, while companies that service existing wells are faring relatively well.
19 Alberta Government legislation announced in July, 2007 requires an immediate 12% reduction in GHG emission intensity for large emitters. The Federal Government requires an 18% reduction in emissions intensity, rising 2%/ year thereafter. (Source: CAPP). 20 VAPEX - Vapour Extraction Process injects hydrocarbon solvents into the upper well to dilute the bitumen and allow it to flow. THAI – Toe to Heel Air Injection combines vertical air injection with a horizontal production well. This process ignites the bitumen and creates a vertical wall of fire, moving from the "toe" of the horizontal well toward the "heel". Source: CommodityMine
Alberta Industry Sector Performance and Prospects
Alberta Finance and Enterprise
Page 38
• With fewer contracts available, the buying power has shifted to drilling customers, resulting in a highly competitive bidding environment and reducing profit margins in the short-run.
• The credit crisis is reducing access to capital just when it is needed most. Smaller companies will face the most significant financing constraints; many will not have the working capital to weather through the latest downturn, facing the risk of bankruptcy. Even larger drilling companies are being impacted. In March, Precision Drilling Trust announced that, due to weaker demand, it was suspending distributions to strengthen its balance sheet and reduce debt.
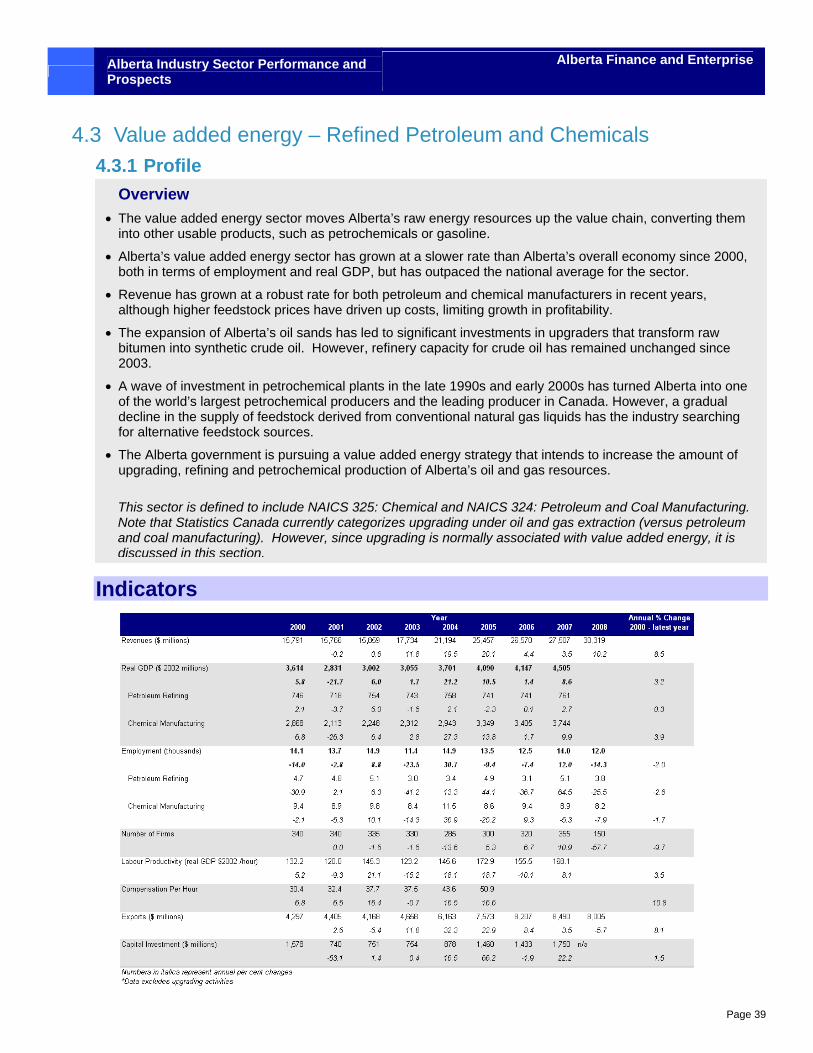
Alberta Industry Sector Performance and Prospects
Alberta Finance and Enterprise
Page 39
4.3 Value added energy – Refined Petroleum and Chemicals 4.3.1 Profile
Indicators
Overview • The value added energy sector moves Alberta’s raw energy resources up the value chain, converting them
into other usable products, such as petrochemicals or gasoline.
• Alberta’s value added energy sector has grown at a slower rate than Alberta’s overall economy since 2000, both in terms of employment and real GDP, but has outpaced the national average for the sector.
• Revenue has grown at a robust rate for both petroleum and chemical manufacturers in recent years, although higher feedstock prices have driven up costs, limiting growth in profitability.
• The expansion of Alberta’s oil sands has led to significant investments in upgraders that transform raw bitumen into synthetic crude oil. However, refinery capacity for crude oil has remained unchanged since 2003.
• A wave of investment in petrochemical plants in the late 1990s and early 2000s has turned Alberta into one of the world’s largest petrochemical producers and the leading producer in Canada. However, a gradual decline in the supply of feedstock derived from conventional natural gas liquids has the industry searching for alternative feedstock sources.
• The Alberta government is pursuing a value added energy strategy that intends to increase the amount of upgrading, refining and petrochemical production of Alberta’s oil and gas resources.
This sector is defined to include NAICS 325: Chemical and NAICS 324: Petroleum and Coal Manufacturing. Note that Statistics Canada currently categorizes upgrading under oil and gas extraction (versus petroleum and coal manufacturing). However, since upgrading is normally associated with value added energy, it is discussed in this section.
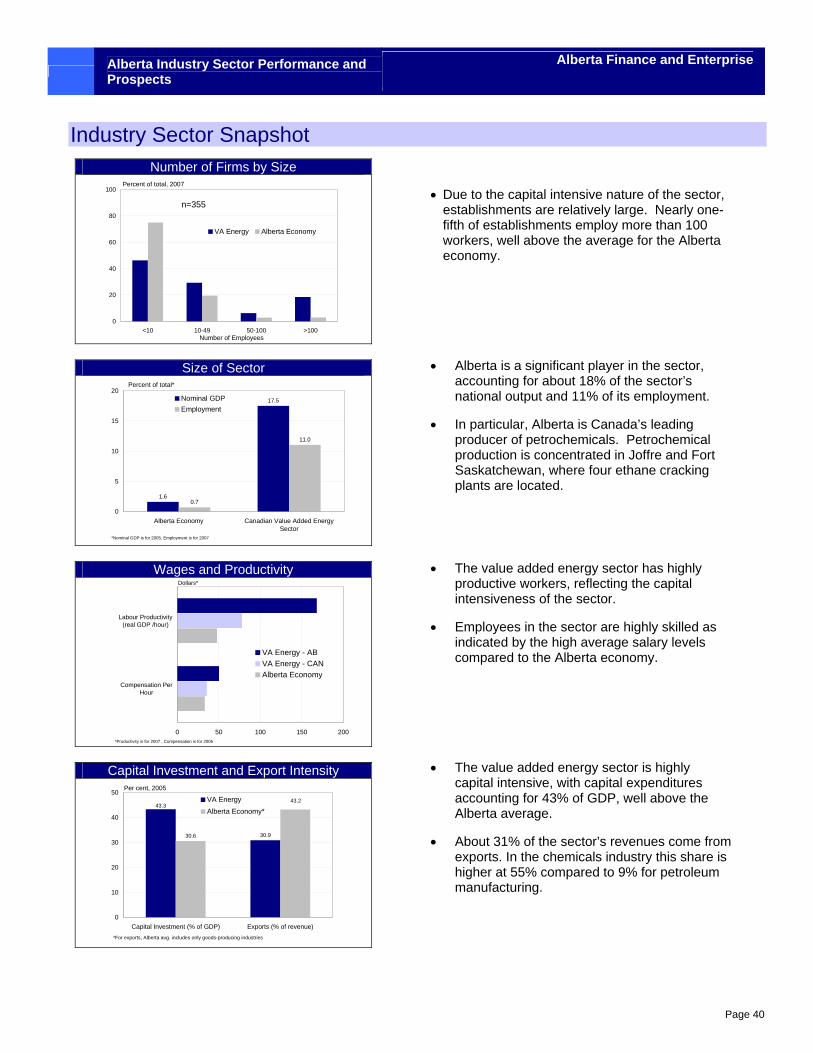
Alberta Industry Sector Performance and Prospects
Alberta Finance and Enterprise
Page 40
Industry Sector Snapshot Number of Firms by Size
0
20
40
60
80
100
<10 10-49 50-100 >100
VA Energy Alberta Economy
Percent of total, 2007
n=355
Number of Employees
Size of Sector
1.6
17.5
0.7
11.0
0
5
10
15
20
Alberta Economy Canadian Value Added EnergySector
Nominal GDPEmployment
Percent of total*
*Nominal GDP is for 2005, Employment is for 2007
Wages and Productivity
0 50 100 150 200
Compensation PerHour
Labour Productivity(real GDP /hour)
VA Energy - ABVA Energy - CANAlberta Economy
Dollars*
*Productivity is for 2007 , Compensation is for 2005
Capital Investment and Export Intensity
30.930.6
43.343.2
0
10
20
30
40
50
Capital Investment (% of GDP) Exports (% of revenue)
VA EnergyAlberta Economy*
Per cent, 2005
*For exports, Alberta avg. includes only goods-producing industries
• Due to the capital intensive nature of the sector, establishments are relatively large. Nearly one-fifth of establishments employ more than 100 workers, well above the average for the Alberta economy.
• Alberta is a significant player in the sector, accounting for about 18% of the sector’s national output and 11% of its employment.
• In particular, Alberta is Canada’s leading producer of petrochemicals. Petrochemical production is concentrated in Joffre and Fort Saskatchewan, where four ethane cracking plants are located.
• The value added energy sector has highly productive workers, reflecting the capital intensiveness of the sector.
• Employees in the sector are highly skilled as indicated by the high average salary levels compared to the Alberta economy.
• The value added energy sector is highly capital intensive, with capital expenditures accounting for 43% of GDP, well above the Alberta average.
• About 31% of the sector’s revenues come from exports. In the chemicals industry this share is higher at 55% compared to 9% for petroleum manufacturing.
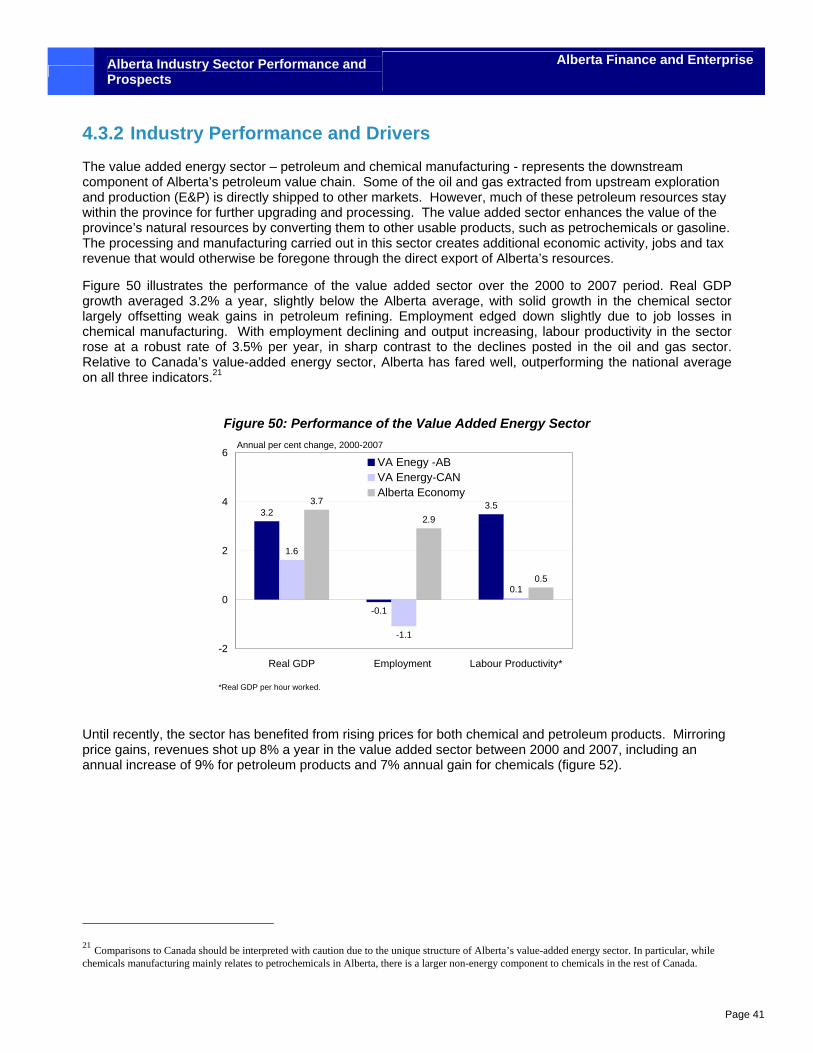
Alberta Industry Sector Performance and Prospects
Alberta Finance and Enterprise
Page 41
4.3.2 Industry Performance and Drivers The value added energy sector – petroleum and chemical manufacturing - represents the downstream component of Alberta’s petroleum value chain. Some of the oil and gas extracted from upstream exploration and production (E&P) is directly shipped to other markets. However, much of these petroleum resources stay within the province for further upgrading and processing. The value added sector enhances the value of the province’s natural resources by converting them to other usable products, such as petrochemicals or gasoline. The processing and manufacturing carried out in this sector creates additional economic activity, jobs and tax revenue that would otherwise be foregone through the direct export of Alberta’s resources.
Figure 50 illustrates the performance of the value added sector over the 2000 to 2007 period. Real GDP growth averaged 3.2% a year, slightly below the Alberta average, with solid growth in the chemical sector largely offsetting weak gains in petroleum refining. Employment edged down slightly due to job losses in chemical manufacturing. With employment declining and output increasing, labour productivity in the sector rose at a robust rate of 3.5% per year, in sharp contrast to the declines posted in the oil and gas sector. Relative to Canada’s value-added energy sector, Alberta has fared well, outperforming the national average on all three indicators.21
Figure 50: Performance of the Value Added Energy Sector
3.2
-0.1
3.5
1.6
-1.1
0.1
3.7
2.9
0.5
-2
0
2
4
6
Real GDP Employment Labour Productivity*
VA Enegy -ABVA Energy-CANAlberta Economy
Annual per cent change, 2000-2007
*Real GDP per hour worked.
Until recently, the sector has benefited from rising prices for both chemical and petroleum products. Mirroring price gains, revenues shot up 8% a year in the value added sector between 2000 and 2007, including an annual increase of 9% for petroleum products and 7% annual gain for chemicals (figure 52).
21 Comparisons to Canada should be interpreted with caution due to the unique structure of Alberta’s value-added energy sector. In particular, while chemicals manufacturing mainly relates to petrochemicals in Alberta, there is a larger non-energy component to chemicals in the rest of Canada.
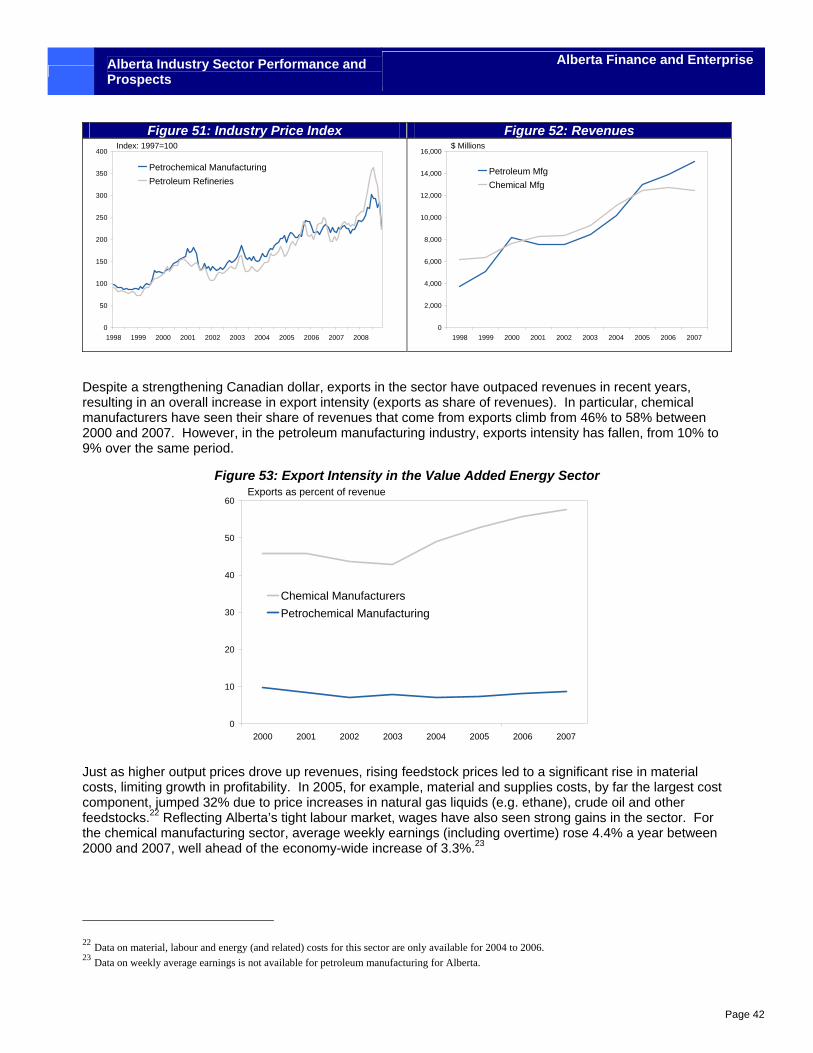
Alberta Industry Sector Performance and Prospects
Alberta Finance and Enterprise
Page 42
Figure 51: Industry Price Index Figure 52: Revenues
0
50
100
150
200
250
300
350
400
1998 1999 2000 2001 2002 2003 2004 2005 2006 2007 2008
Petrochemical ManufacturingPetroleum Refineries
Index: 1997=100
0
2,000
4,000
6,000
8,000
10,000
12,000
14,000
16,000
1998 1999 2000 2001 2002 2003 2004 2005 2006 2007
Petroleum MfgChemical Mfg
$ Millions
Despite a strengthening Canadian dollar, exports in the sector have outpaced revenues in recent years, resulting in an overall increase in export intensity (exports as share of revenues). In particular, chemical manufacturers have seen their share of revenues that come from exports climb from 46% to 58% between 2000 and 2007. However, in the petroleum manufacturing industry, exports intensity has fallen, from 10% to 9% over the same period.
Figure 53: Export Intensity in the Value Added Energy Sector
0
10
20
30
40
50
60
2000 2001 2002 2003 2004 2005 2006 2007
Chemical ManufacturersPetrochemical Manufacturing
Exports as percent of revenue
Just as higher output prices drove up revenues, rising feedstock prices led to a significant rise in material costs, limiting growth in profitability. In 2005, for example, material and supplies costs, by far the largest cost component, jumped 32% due to price increases in natural gas liquids (e.g. ethane), crude oil and other feedstocks.22 Reflecting Alberta’s tight labour market, wages have also seen strong gains in the sector. For the chemical manufacturing sector, average weekly earnings (including overtime) rose 4.4% a year between 2000 and 2007, well ahead of the economy-wide increase of 3.3%.23
22 Data on material, labour and energy (and related) costs for this sector are only available for 2004 to 2006. 23 Data on weekly average earnings is not available for petroleum manufacturing for Alberta.
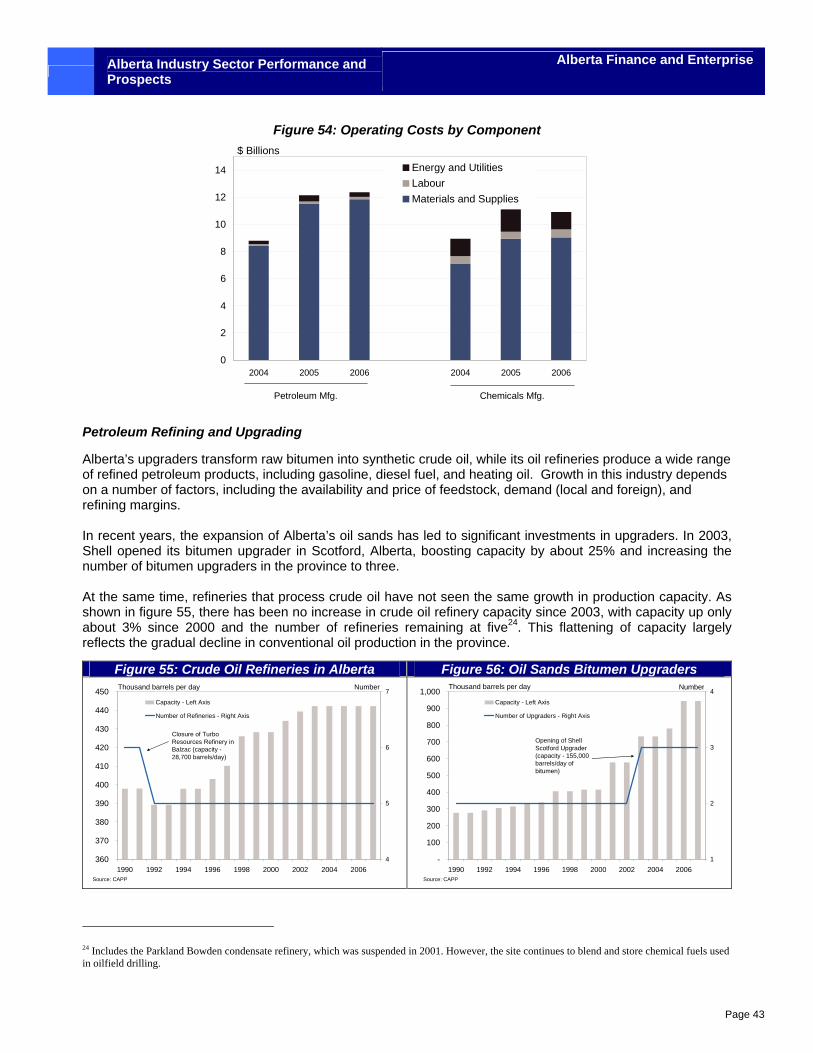
Alberta Industry Sector Performance and Prospects
Alberta Finance and Enterprise
Page 43
Figure 54: Operating Costs by Component
0
2
4
6
8
10
12
14
2004 2005 2006 2004 2005 2006
Energy and UtilitiesLabourMaterials and Supplies
$ Billions
Petroleum Mfg. Chemicals Mfg.
Petroleum Refining and Upgrading
Alberta’s upgraders transform raw bitumen into synthetic crude oil, while its oil refineries produce a wide range of refined petroleum products, including gasoline, diesel fuel, and heating oil. Growth in this industry depends on a number of factors, including the availability and price of feedstock, demand (local and foreign), and refining margins. In recent years, the expansion of Alberta’s oil sands has led to significant investments in upgraders. In 2003, Shell opened its bitumen upgrader in Scotford, Alberta, boosting capacity by about 25% and increasing the number of bitumen upgraders in the province to three. At the same time, refineries that process crude oil have not seen the same growth in production capacity. As shown in figure 55, there has been no increase in crude oil refinery capacity since 2003, with capacity up only about 3% since 2000 and the number of refineries remaining at five24. This flattening of capacity largely reflects the gradual decline in conventional oil production in the province.
24 Includes the Parkland Bowden condensate refinery, which was suspended in 2001. However, the site continues to blend and store chemical fuels used in oilfield drilling.
Figure 55: Crude Oil Refineries in Alberta Figure 56: Oil Sands Bitumen Upgraders
360
370
380
390
400
410
420
430
440
450
1990 1992 1994 1996 1998 2000 2002 2004 20064
5
6
7Capacity - Left Axis
Number of Refineries - Right Axis
Closure of Turbo Resources Refinery in Balzac (capacity - 28,700 barrels/day)
Number
Source: CAPP
Thousand barrels per day
-
100
200
300
400
500
600
700
800
900
1,000
1990 1992 1994 1996 1998 2000 2002 2004 20061
2
3
4Capacity - Left Axis
Number of Upgraders - Right Axis
Thousand barrels per day
Opening of Shell Scotford Upgrader (capacity - 155,000 barrels/day of bitumen)
Number
Source: CAPP
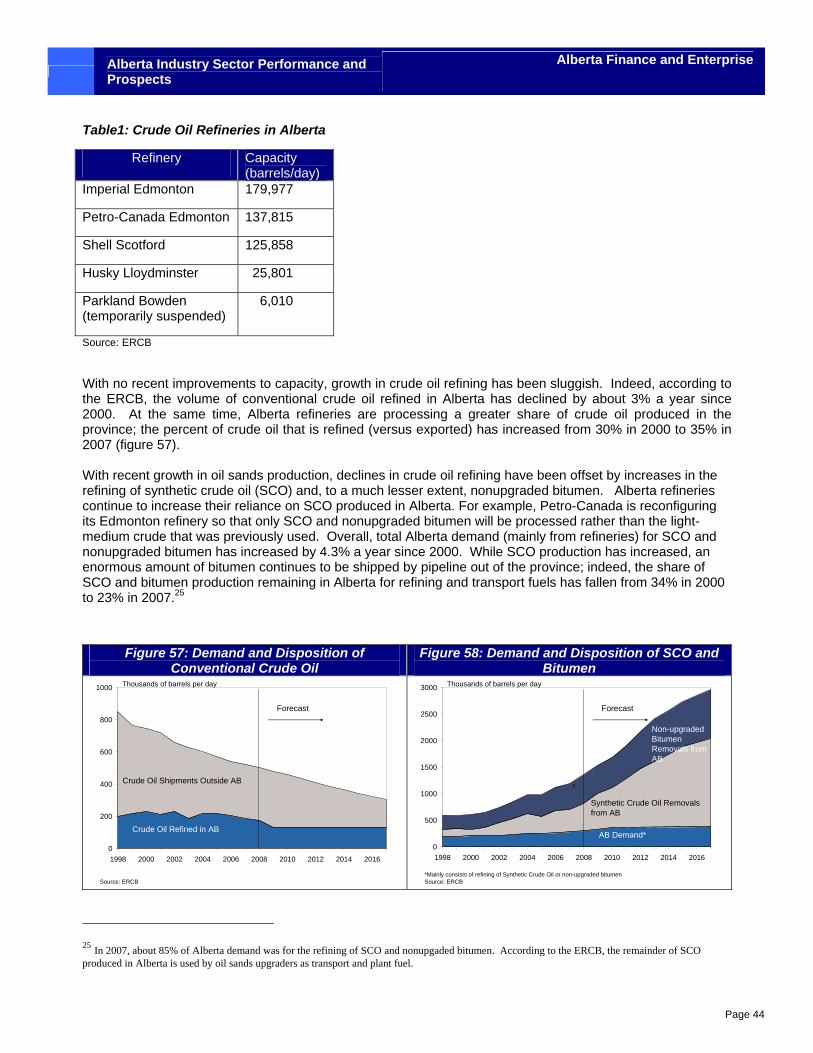
Alberta Industry Sector Performance and Prospects
Alberta Finance and Enterprise
Page 44
Table1: Crude Oil Refineries in Alberta
Refinery Capacity (barrels/day)
Imperial Edmonton 179,977
Petro-Canada Edmonton 137,815
Shell Scotford 125,858
Husky Lloydminster 25,801
Parkland Bowden (temporarily suspended)
6,010
Source: ERCB
With no recent improvements to capacity, growth in crude oil refining has been sluggish. Indeed, according to the ERCB, the volume of conventional crude oil refined in Alberta has declined by about 3% a year since 2000. At the same time, Alberta refineries are processing a greater share of crude oil produced in the province; the percent of crude oil that is refined (versus exported) has increased from 30% in 2000 to 35% in 2007 (figure 57). With recent growth in oil sands production, declines in crude oil refining have been offset by increases in the refining of synthetic crude oil (SCO) and, to a much lesser extent, nonupgraded bitumen. Alberta refineries continue to increase their reliance on SCO produced in Alberta. For example, Petro-Canada is reconfiguring its Edmonton refinery so that only SCO and nonupgraded bitumen will be processed rather than the light-medium crude that was previously used. Overall, total Alberta demand (mainly from refineries) for SCO and nonupgraded bitumen has increased by 4.3% a year since 2000. While SCO production has increased, an enormous amount of bitumen continues to be shipped by pipeline out of the province; indeed, the share of SCO and bitumen production remaining in Alberta for refining and transport fuels has fallen from 34% in 2000 to 23% in 2007.25
Figure 57: Demand and Disposition of Conventional Crude Oil
Figure 58: Demand and Disposition of SCO and Bitumen
0
200
400
600
800
1000
1998 2000 2002 2004 2006 2008 2010 2012 2014 2016
Thousands of barrels per day
Source: ERCB
Crude Oil Shipments Outside AB
Synthetic Crude Oil (upgraded bitumen)
Crude Oil Refined in AB
Forecast
0
500
1000
1500
2000
2500
3000
1998 2000 2002 2004 2006 2008 2010 2012 2014 2016
Thousands of barrels per day
*Mainly consists of refining of Synthetic Crude Oil or non-upgraded bitumenSource: ERCB
Synthetic Crude Oil Removals from AB
Non-upgraded Bitumen Removals from AB
AB Demand*
Forecast
h
25 In 2007, about 85% of Alberta demand was for the refining of SCO and nonupgaded bitumen. According to the ERCB, the remainder of SCO produced in Alberta is used by oil sands upgraders as transport and plant fuel.
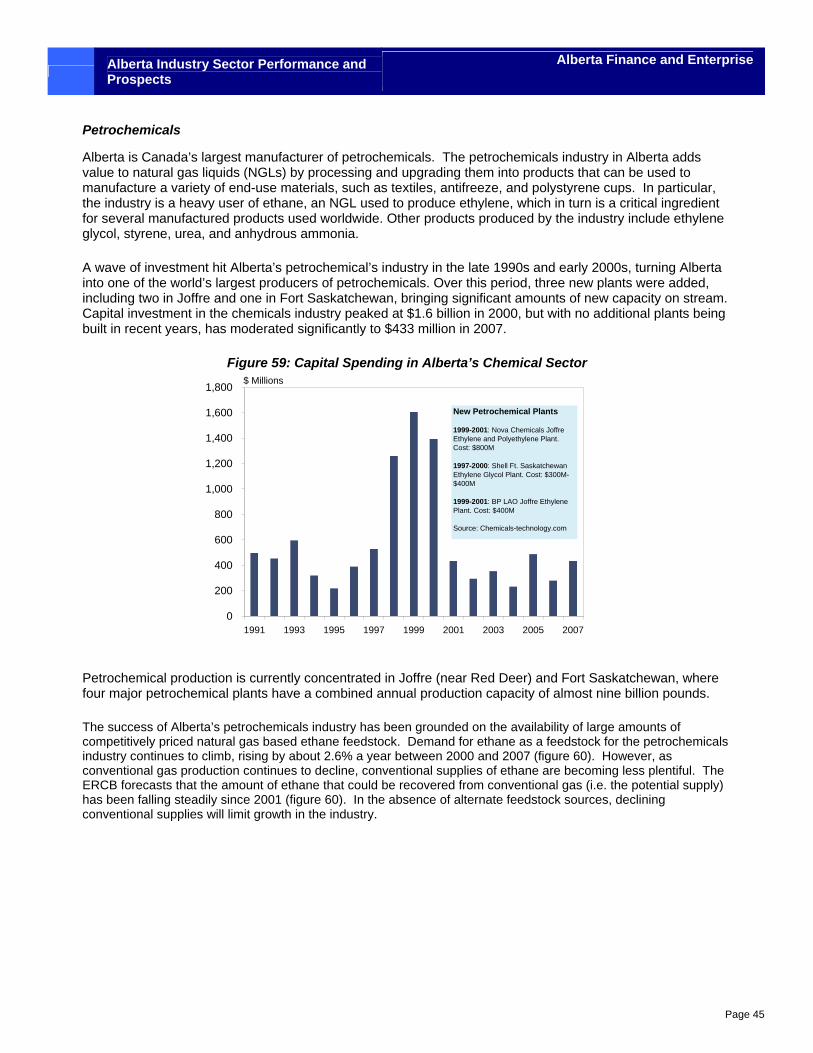
Alberta Industry Sector Performance and Prospects
Alberta Finance and Enterprise
Page 45
Petrochemicals
Alberta is Canada’s largest manufacturer of petrochemicals. The petrochemicals industry in Alberta adds value to natural gas liquids (NGLs) by processing and upgrading them into products that can be used to manufacture a variety of end-use materials, such as textiles, antifreeze, and polystyrene cups. In particular, the industry is a heavy user of ethane, an NGL used to produce ethylene, which in turn is a critical ingredient for several manufactured products used worldwide. Other products produced by the industry include ethylene glycol, styrene, urea, and anhydrous ammonia.
A wave of investment hit Alberta’s petrochemical’s industry in the late 1990s and early 2000s, turning Alberta into one of the world’s largest producers of petrochemicals. Over this period, three new plants were added, including two in Joffre and one in Fort Saskatchewan, bringing significant amounts of new capacity on stream. Capital investment in the chemicals industry peaked at $1.6 billion in 2000, but with no additional plants being built in recent years, has moderated significantly to $433 million in 2007.
Figure 59: Capital Spending in Alberta’s Chemical Sector
0
200
400
600
800
1,000
1,200
1,400
1,600
1,800
1991 1993 1995 1997 1999 2001 2003 2005 2007
$ Millions
New Petrochemical Plants
1999-2001: Nova Chemicals Joffre Ethylene and Polyethylene Plant. Cost: $800M
1997-2000: Shell Ft. Saskatchewan Ethylene Glycol Plant. Cost: $300M-$400M
1999-2001: BP LAO Joffre Ethylene Plant. Cost: $400M
Source: Chemicals-technology.com
Petrochemical production is currently concentrated in Joffre (near Red Deer) and Fort Saskatchewan, where four major petrochemical plants have a combined annual production capacity of almost nine billion pounds.
The success of Alberta’s petrochemicals industry has been grounded on the availability of large amounts of competitively priced natural gas based ethane feedstock. Demand for ethane as a feedstock for the petrochemicals industry continues to climb, rising by about 2.6% a year between 2000 and 2007 (figure 60). However, as conventional gas production continues to decline, conventional supplies of ethane are becoming less plentiful. The ERCB forecasts that the amount of ethane that could be recovered from conventional gas (i.e. the potential supply) has been falling steadily since 2001 (figure 60). In the absence of alternate feedstock sources, declining conventional supplies will limit growth in the industry.
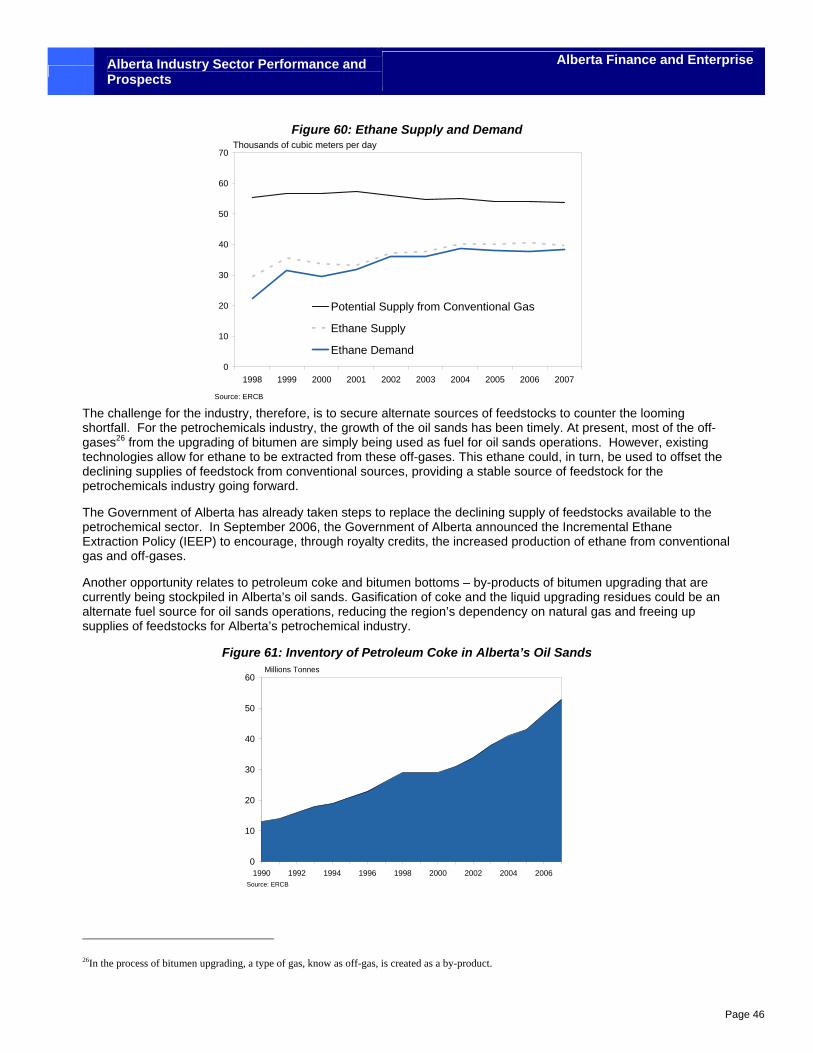
Alberta Industry Sector Performance and Prospects
Alberta Finance and Enterprise
Page 46
Figure 60: Ethane Supply and Demand
0
10
20
30
40
50
60
70
1998 1999 2000 2001 2002 2003 2004 2005 2006 2007
Potential Supply from Conventional Gas
Ethane Supply
Ethane Demand
Thousands of cubic meters per day
Source: ERCB The challenge for the industry, therefore, is to secure alternate sources of feedstocks to counter the looming shortfall. For the petrochemicals industry, the growth of the oil sands has been timely. At present, most of the off-gases26 from the upgrading of bitumen are simply being used as fuel for oil sands operations. However, existing technologies allow for ethane to be extracted from these off-gases. This ethane could, in turn, be used to offset the declining supplies of feedstock from conventional sources, providing a stable source of feedstock for the petrochemicals industry going forward.
The Government of Alberta has already taken steps to replace the declining supply of feedstocks available to the petrochemical sector. In September 2006, the Government of Alberta announced the Incremental Ethane Extraction Policy (IEEP) to encourage, through royalty credits, the increased production of ethane from conventional gas and off-gases.
Another opportunity relates to petroleum coke and bitumen bottoms – by-products of bitumen upgrading that are currently being stockpiled in Alberta’s oil sands. Gasification of coke and the liquid upgrading residues could be an alternate fuel source for oil sands operations, reducing the region’s dependency on natural gas and freeing up supplies of feedstocks for Alberta’s petrochemical industry.
Figure 61: Inventory of Petroleum Coke in Alberta’s Oil Sands
0
10
20
30
40
50
60
1990 1992 1994 1996 1998 2000 2002 2004 2006
Millions Tonnes
Source: ERCB
26In the process of bitumen upgrading, a type of gas, know as off-gas, is created as a by-product.
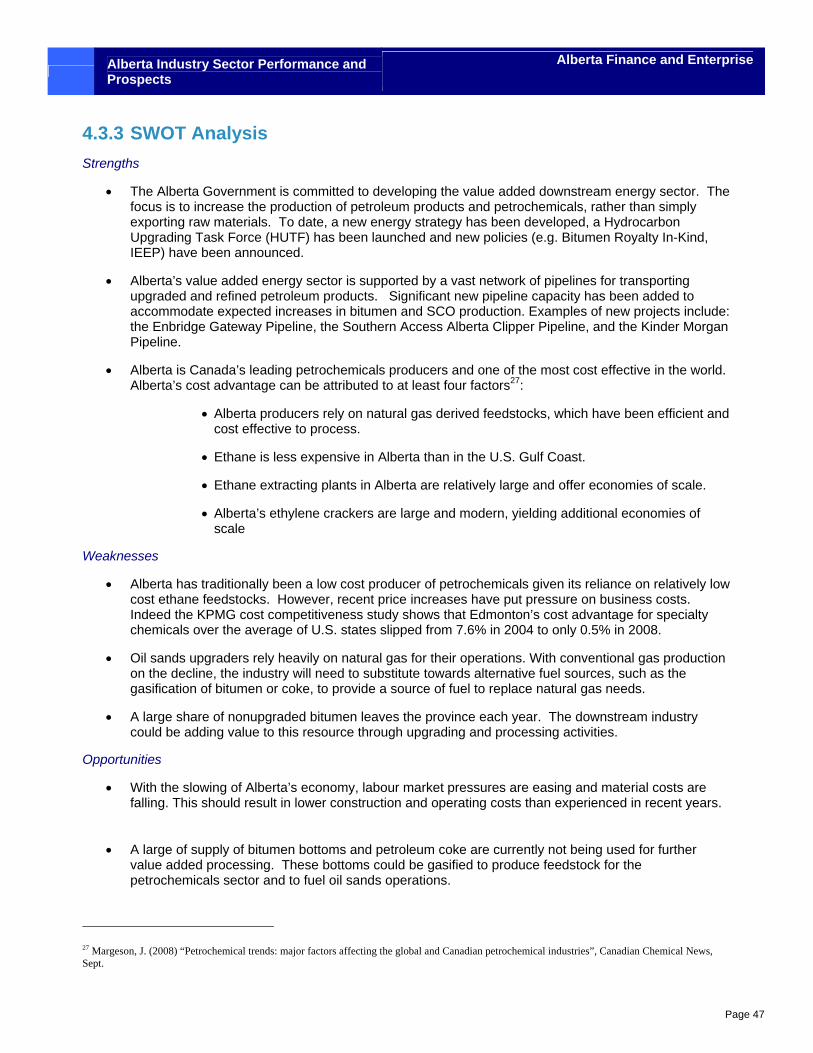
Alberta Industry Sector Performance and Prospects
Alberta Finance and Enterprise
Page 47
4.3.3 SWOT Analysis Strengths
• The Alberta Government is committed to developing the value added downstream energy sector. The focus is to increase the production of petroleum products and petrochemicals, rather than simply exporting raw materials. To date, a new energy strategy has been developed, a Hydrocarbon Upgrading Task Force (HUTF) has been launched and new policies (e.g. Bitumen Royalty In-Kind, IEEP) have been announced.
• Alberta’s value added energy sector is supported by a vast network of pipelines for transporting upgraded and refined petroleum products. Significant new pipeline capacity has been added to accommodate expected increases in bitumen and SCO production. Examples of new projects include: the Enbridge Gateway Pipeline, the Southern Access Alberta Clipper Pipeline, and the Kinder Morgan Pipeline.
• Alberta is Canada’s leading petrochemicals producers and one of the most cost effective in the world. Alberta’s cost advantage can be attributed to at least four factors27:
• Alberta producers rely on natural gas derived feedstocks, which have been efficient and cost effective to process.
• Ethane is less expensive in Alberta than in the U.S. Gulf Coast.
• Ethane extracting plants in Alberta are relatively large and offer economies of scale.
• Alberta’s ethylene crackers are large and modern, yielding additional economies of scale
Weaknesses
• Alberta has traditionally been a low cost producer of petrochemicals given its reliance on relatively low cost ethane feedstocks. However, recent price increases have put pressure on business costs. Indeed the KPMG cost competitiveness study shows that Edmonton’s cost advantage for specialty chemicals over the average of U.S. states slipped from 7.6% in 2004 to only 0.5% in 2008.
• Oil sands upgraders rely heavily on natural gas for their operations. With conventional gas production on the decline, the industry will need to substitute towards alternative fuel sources, such as the gasification of bitumen or coke, to provide a source of fuel to replace natural gas needs.
• A large share of nonupgraded bitumen leaves the province each year. The downstream industry could be adding value to this resource through upgrading and processing activities.
Opportunities
• With the slowing of Alberta’s economy, labour market pressures are easing and material costs are falling. This should result in lower construction and operating costs than experienced in recent years.
• A large of supply of bitumen bottoms and petroleum coke are currently not being used for further
value added processing. These bottoms could be gasified to produce feedstock for the petrochemicals sector and to fuel oil sands operations.
27 Margeson, J. (2008) “Petrochemical trends: major factors affecting the global and Canadian petrochemical industries”, Canadian Chemical News, Sept.
Alberta Industry Sector Performance and Prospects
Alberta Finance and Enterprise
Page 48
• There are opportunities emerging for the oil sands to reduce its dependency on Alberta’s natural gas, for example through gasification of bitumen bottoms or coke or the refining of fuel gas. This would also free up volumes of natural gas for higher valued markets.
• Approximately three million barrels a day of bitumen is expected to be upgraded by 2020, leaving
massive deposits of bitumen bottoms and petroleum coke that could be gasified and turned into feedstocks for the petrochemicals industry. The HUTF has identified a range of products that could be produced from these feedstocks including ethylene, propylene, benzene, polyethylene.
• The Edmonton area, particularly Alberta’s Industrial Heartland region, has been targeted as the
location for creating a world class chemical cluster using a long-term supply of competitively priced petrochemical feedstock from the oil sands.
• According to Alberta Energy, the oil sands presents the following opportunities for Alberta’s
petrochemical industry28: • Integration of petrochemical plants with refineries that convert bitumen into higher valued
products; • Gasification of oil sands by-products, for example creating syngas from bitumen bottoms
and petroleum coke; and • Use off-gases from refining and upgrading as feedstock.
• The Government of Alberta has announced that it will begin collecting bitumen royalties in-kind, which means that instead of taking oilsands royalties in cash the government will be receiving physical volumes in order to stimulate investments in upgrading, refining and petrochemicals. This program will help address concerns that Alberta’s current oil sands royalty regime is not designed to encourage secondary manufacturing of bitumen.
• Integration of oilsands, upgrading and petrochemical operations will reduce the overall environmental
footprint.
Threats
• New environmental regulations, such as caps on GHG emissions, could raise operating costs for upgraders, refineries and petrochemical plants.
• Weaker global demand combined with an increase in ethylene production capacity in the Middle East is expected to put downward pressure on ethylene prices. This may hurt profitability in the short-term.
• While the government can provide some support to implement its value added energy strategy– e.g. building infrastructure and offering incentives (e.g. Bitumen Royalty in Kind) – the key challenge is getting industry to invest in these downstream activities.
• A petrochemical cluster requires a steady supply of bitumen based feedstocks. Should oil sands upgrading activity slow significantly due to ongoing weakness in the global economy and sluggish oil prices, the feasibility of a petrochemical cluster could be compromised.
• The collapse in energy prices has led to several construction delays or cancellations for upgraders in the Capital Region. This raises the risk that a growing share of nonupgraded bitumen will be shipped by pipeline to the U.S., resulting in lost economic opportunities for Alberta.
• In order to develop new chemical clusters using the oil sands as a feedstock source, large investments in infrastructure are required (roads, pipelines, rail, water sewage treatment, etc.). Based
28 Alberta Energy. http://www.energy.gov.ab.ca/Petrochemical/842.asp

Alberta Industry Sector Performance and Prospects
Alberta Finance and Enterprise
Page 49
on the experiences of other jurisdictions, Alberta’s petrochemical will only succeed if there are significant investments in infrastructure by government.
• Business costs in Alberta have increased recently, reducing the project economics associated with building upgraders, refineries and petrochemical plants in the province. Should these cost pressures be sustained, there is a risk that much-needed investments will be foregone.
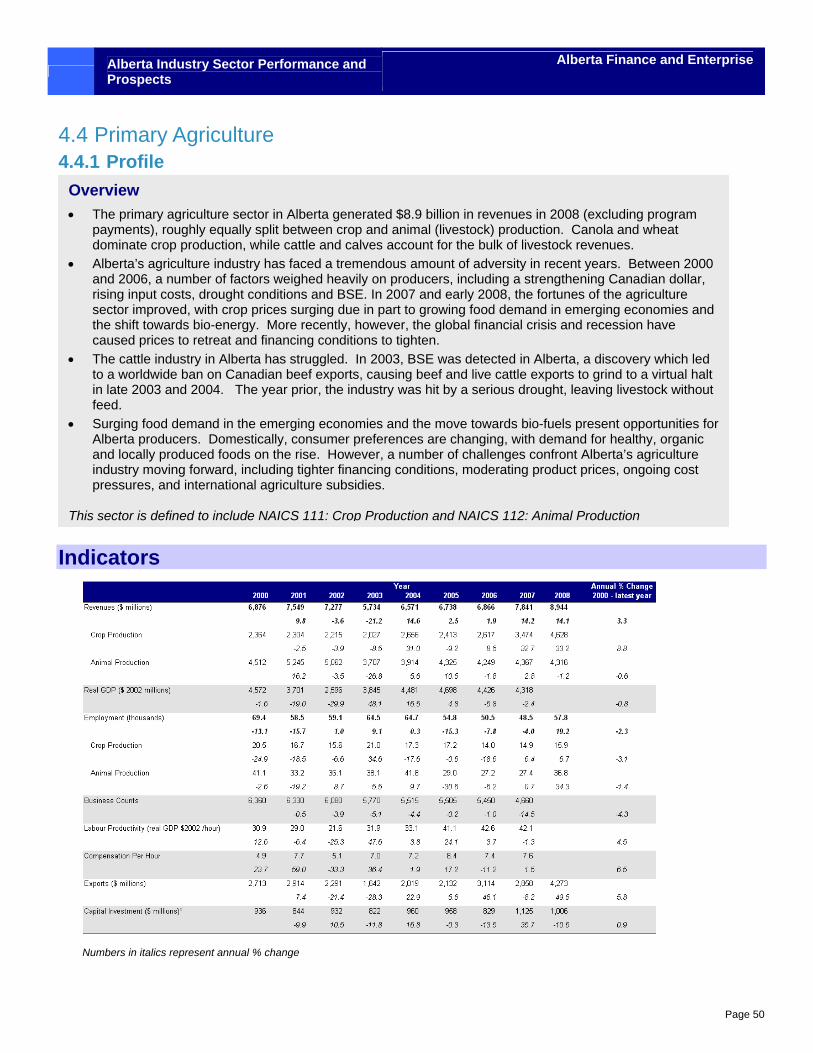
Alberta Industry Sector Performance and Prospects
Alberta Finance and Enterprise
Page 50
4.4 Primary Agriculture 4.4.1 Profile
Indicators
Numbers in italics represent annual % change
Overview • The primary agriculture sector in Alberta generated $8.9 billion in revenues in 2008 (excluding program
payments), roughly equally split between crop and animal (livestock) production. Canola and wheat dominate crop production, while cattle and calves account for the bulk of livestock revenues.
• Alberta’s agriculture industry has faced a tremendous amount of adversity in recent years. Between 2000 and 2006, a number of factors weighed heavily on producers, including a strengthening Canadian dollar, rising input costs, drought conditions and BSE. In 2007 and early 2008, the fortunes of the agriculture sector improved, with crop prices surging due in part to growing food demand in emerging economies and the shift towards bio-energy. More recently, however, the global financial crisis and recession have caused prices to retreat and financing conditions to tighten.
• The cattle industry in Alberta has struggled. In 2003, BSE was detected in Alberta, a discovery which led to a worldwide ban on Canadian beef exports, causing beef and live cattle exports to grind to a virtual halt in late 2003 and 2004. The year prior, the industry was hit by a serious drought, leaving livestock without feed.
• Surging food demand in the emerging economies and the move towards bio-fuels present opportunities for Alberta producers. Domestically, consumer preferences are changing, with demand for healthy, organic and locally produced foods on the rise. However, a number of challenges confront Alberta’s agriculture industry moving forward, including tighter financing conditions, moderating product prices, ongoing cost pressures, and international agriculture subsidies.
This sector is defined to include NAICS 111: Crop Production and NAICS 112: Animal Production
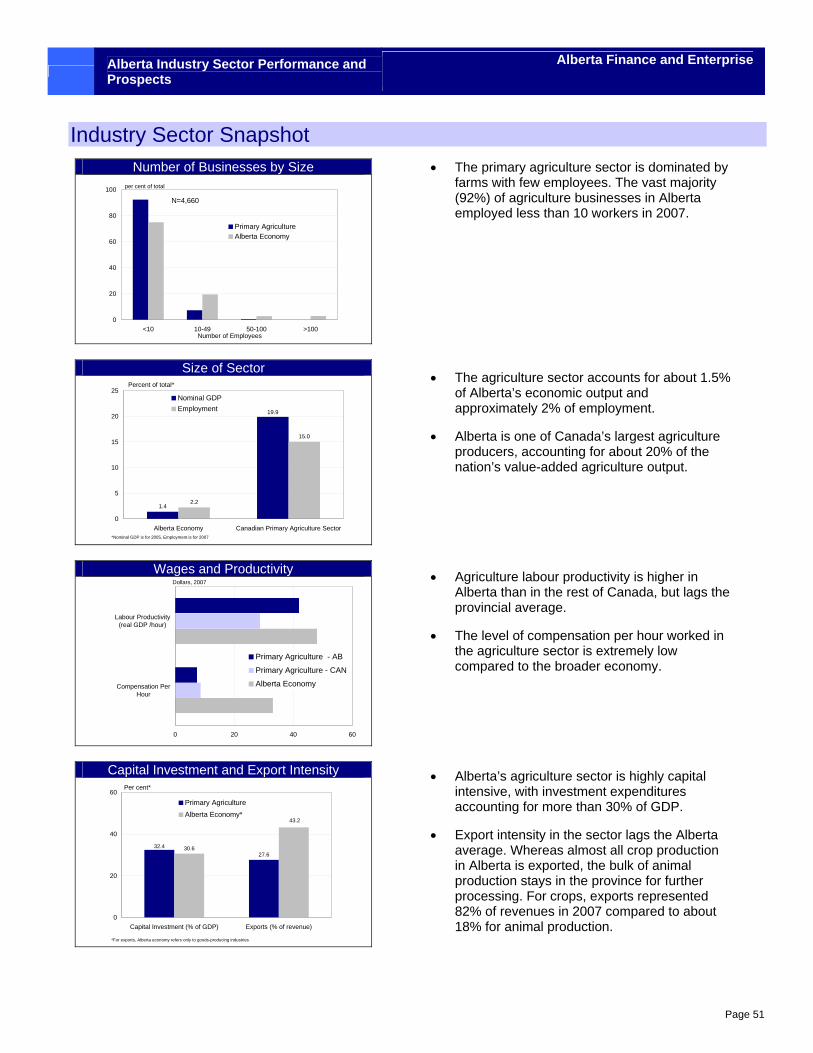
Alberta Industry Sector Performance and Prospects
Alberta Finance and Enterprise
Page 51
Industry Sector Snapshot Number of Businesses by Size
0
20
40
60
80
100
<10 10-49 50-100 >100
Primary AgricultureAlberta Economy
per cent of total
Number of Employees
N=4,660
Size of Sector
1.42.2
15.0
19.9
0
5
10
15
20
25
Alberta Economy Canadian Primary Agriculture Sector
Nominal GDPEmployment
Percent of total*
*Nominal GDP is for 2005, Employment is for 2007
Wages and Productivity
0 20 40 60
Compensation PerHour
Labour Productivity(real GDP /hour)
Primary Agriculture - AB
Primary Agriculture - CAN
Alberta Economy
Dollars, 2007
Capital Investment and Export Intensity
27.630.632.4
43.2
0
20
40
60
Capital Investment (% of GDP) Exports (% of revenue)
Primary AgricultureAlberta Economy*
Per cent*
*For exports, Alberta economy refers only to goods-producing industries
• The primary agriculture sector is dominated by farms with few employees. The vast majority (92%) of agriculture businesses in Alberta employed less than 10 workers in 2007.
• The agriculture sector accounts for about 1.5% of Alberta’s economic output and approximately 2% of employment.
• Alberta is one of Canada’s largest agriculture producers, accounting for about 20% of the nation’s value-added agriculture output.
• Agriculture labour productivity is higher in Alberta than in the rest of Canada, but lags the provincial average.
• The level of compensation per hour worked in the agriculture sector is extremely low compared to the broader economy.
• Alberta’s agriculture sector is highly capital intensive, with investment expenditures accounting for more than 30% of GDP.
• Export intensity in the sector lags the Alberta average. Whereas almost all crop production in Alberta is exported, the bulk of animal production stays in the province for further processing. For crops, exports represented 82% of revenues in 2007 compared to about 18% for animal production.
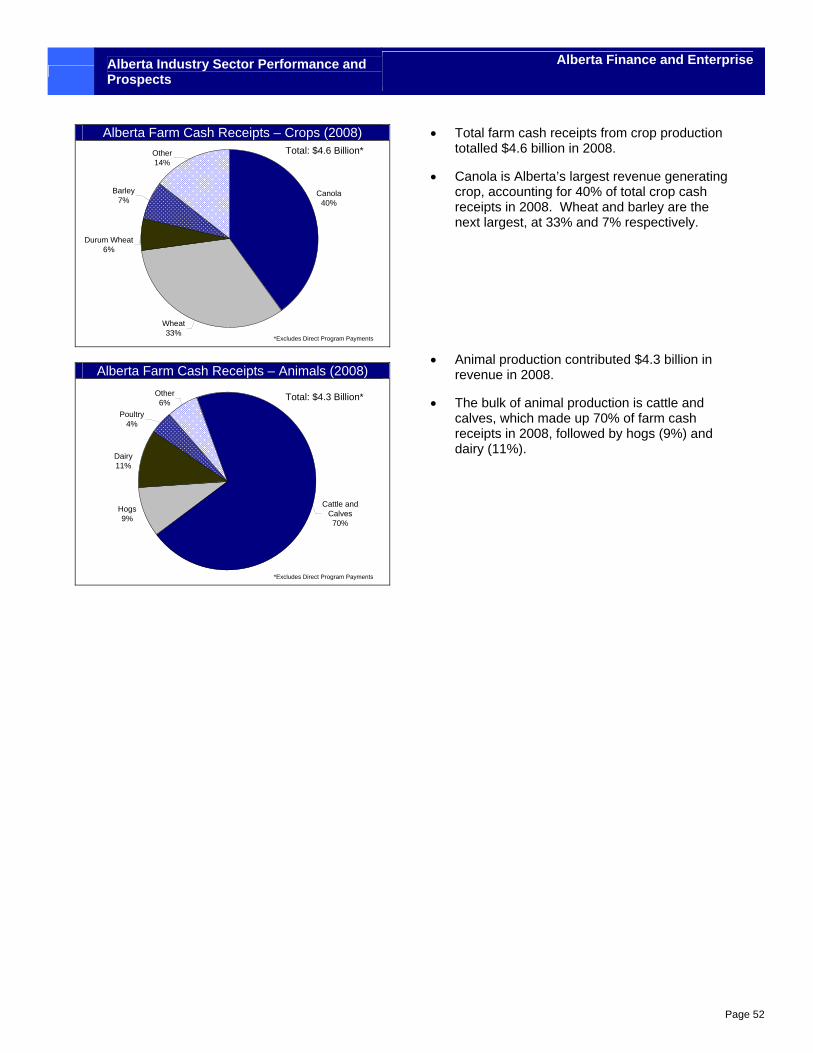
Alberta Industry Sector Performance and Prospects
Alberta Finance and Enterprise
Page 52
Alberta Farm Cash Receipts – Crops (2008)
Durum Wheat6%
Barley7%
Other14%
Canola40%
Wheat33%
Total: $4.6 Billion*
*Excludes Direct Program Payments
Alberta Farm Cash Receipts – Animals (2008)
Dairy 11%
Poultry4%
Other6%
Cattle and Calves70%
Hogs9%
Total: $4.3 Billion*
*Excludes Direct Program Payments
• Total farm cash receipts from crop production totalled $4.6 billion in 2008.
• Canola is Alberta’s largest revenue generating crop, accounting for 40% of total crop cash receipts in 2008. Wheat and barley are the next largest, at 33% and 7% respectively.
• Animal production contributed $4.3 billion in revenue in 2008.
• The bulk of animal production is cattle and calves, which made up 70% of farm cash receipts in 2008, followed by hogs (9%) and dairy (11%).
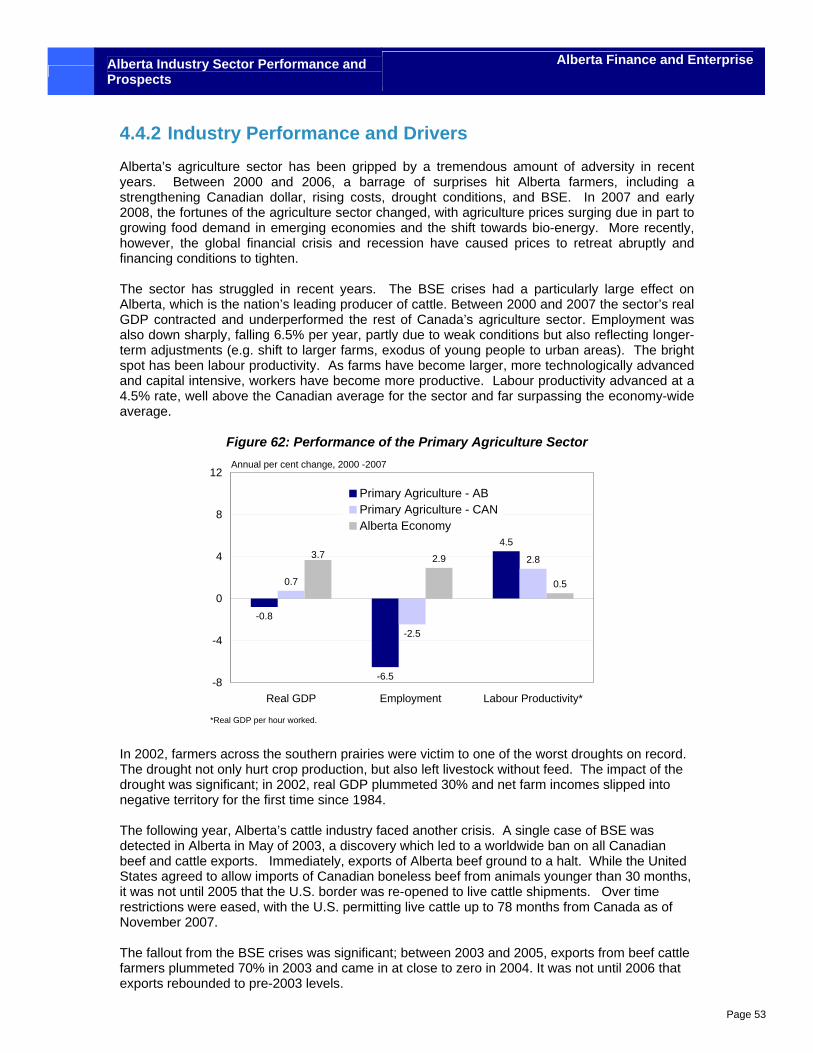
Alberta Industry Sector Performance and Prospects
Alberta Finance and Enterprise
Page 53
4.4.2 Industry Performance and Drivers Alberta’s agriculture sector has been gripped by a tremendous amount of adversity in recent years. Between 2000 and 2006, a barrage of surprises hit Alberta farmers, including a strengthening Canadian dollar, rising costs, drought conditions, and BSE. In 2007 and early 2008, the fortunes of the agriculture sector changed, with agriculture prices surging due in part to growing food demand in emerging economies and the shift towards bio-energy. More recently, however, the global financial crisis and recession have caused prices to retreat abruptly and financing conditions to tighten. The sector has struggled in recent years. The BSE crises had a particularly large effect on Alberta, which is the nation’s leading producer of cattle. Between 2000 and 2007 the sector’s real GDP contracted and underperformed the rest of Canada’s agriculture sector. Employment was also down sharply, falling 6.5% per year, partly due to weak conditions but also reflecting longer-term adjustments (e.g. shift to larger farms, exodus of young people to urban areas). The bright spot has been labour productivity. As farms have become larger, more technologically advanced and capital intensive, workers have become more productive. Labour productivity advanced at a 4.5% rate, well above the Canadian average for the sector and far surpassing the economy-wide average.
Figure 62: Performance of the Primary Agriculture Sector
-0.8
-6.5
4.5
0.7
-2.5
2.82.9
0.5
3.7
-8
-4
0
4
8
12
Real GDP Employment Labour Productivity*
Primary Agriculture - ABPrimary Agriculture - CANAlberta Economy
Annual per cent change, 2000 -2007
*Real GDP per hour worked.
In 2002, farmers across the southern prairies were victim to one of the worst droughts on record. The drought not only hurt crop production, but also left livestock without feed. The impact of the drought was significant; in 2002, real GDP plummeted 30% and net farm incomes slipped into negative territory for the first time since 1984. The following year, Alberta’s cattle industry faced another crisis. A single case of BSE was detected in Alberta in May of 2003, a discovery which led to a worldwide ban on all Canadian beef and cattle exports. Immediately, exports of Alberta beef ground to a halt. While the United States agreed to allow imports of Canadian boneless beef from animals younger than 30 months, it was not until 2005 that the U.S. border was re-opened to live cattle shipments. Over time restrictions were eased, with the U.S. permitting live cattle up to 78 months from Canada as of November 2007. The fallout from the BSE crises was significant; between 2003 and 2005, exports from beef cattle farmers plummeted 70% in 2003 and came in at close to zero in 2004. It was not until 2006 that exports rebounded to pre-2003 levels.
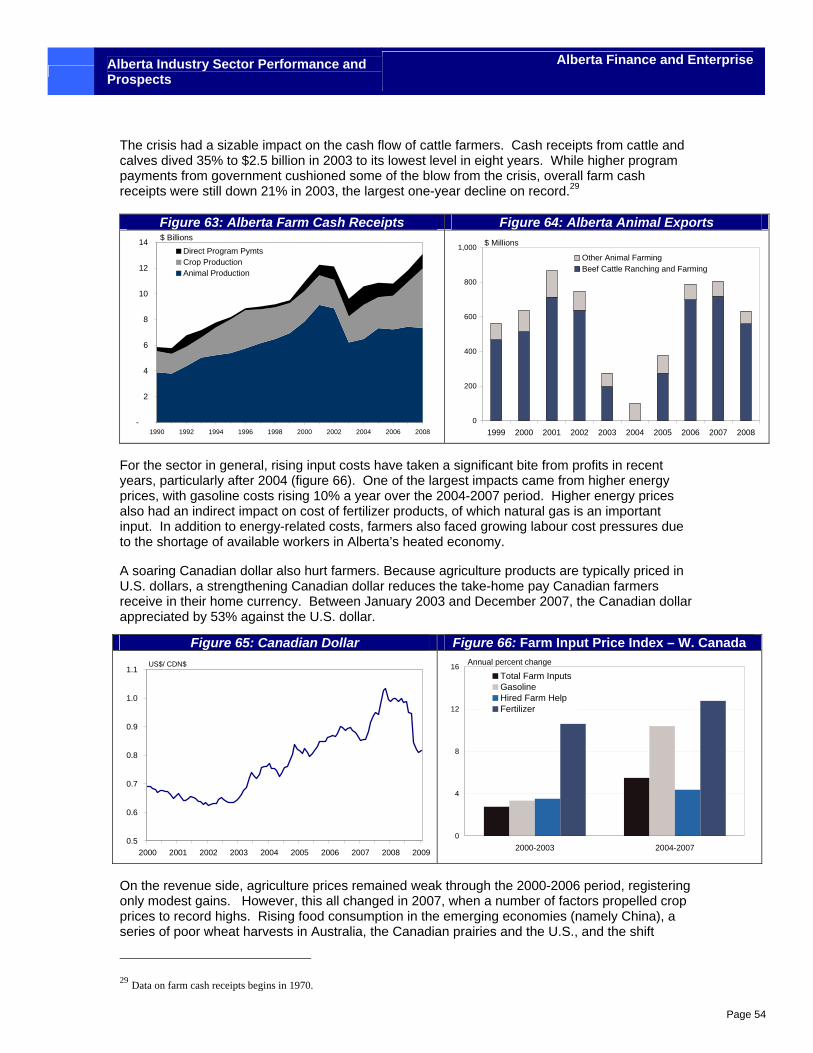
Alberta Industry Sector Performance and Prospects
Alberta Finance and Enterprise
Page 54
The crisis had a sizable impact on the cash flow of cattle farmers. Cash receipts from cattle and calves dived 35% to $2.5 billion in 2003 to its lowest level in eight years. While higher program payments from government cushioned some of the blow from the crisis, overall farm cash receipts were still down 21% in 2003, the largest one-year decline on record.29
Figure 63: Alberta Farm Cash Receipts Figure 64: Alberta Animal Exports
-
2
4
6
8
10
12
14
1990 1992 1994 1996 1998 2000 2002 2004 2006 2008
Direct Program PymtsCrop ProductionAnimal Production
$ Billions
0
200
400
600
800
1,000
1999 2000 2001 2002 2003 2004 2005 2006 2007 2008
Other Animal FarmingBeef Cattle Ranching and Farming
$ Millions
For the sector in general, rising input costs have taken a significant bite from profits in recent years, particularly after 2004 (figure 66). One of the largest impacts came from higher energy prices, with gasoline costs rising 10% a year over the 2004-2007 period. Higher energy prices also had an indirect impact on cost of fertilizer products, of which natural gas is an important input. In addition to energy-related costs, farmers also faced growing labour cost pressures due to the shortage of available workers in Alberta’s heated economy. A soaring Canadian dollar also hurt farmers. Because agriculture products are typically priced in U.S. dollars, a strengthening Canadian dollar reduces the take-home pay Canadian farmers receive in their home currency. Between January 2003 and December 2007, the Canadian dollar appreciated by 53% against the U.S. dollar.
On the revenue side, agriculture prices remained weak through the 2000-2006 period, registering only modest gains. However, this all changed in 2007, when a number of factors propelled crop prices to record highs. Rising food consumption in the emerging economies (namely China), a series of poor wheat harvests in Australia, the Canadian prairies and the U.S., and the shift
29 Data on farm cash receipts begins in 1970.
Figure 65: Canadian Dollar Figure 66: Farm Input Price Index – W. Canada
0.5
0.6
0.7
0.8
0.9
1.0
1.1
2000 2001 2002 2003 2004 2005 2006 2007 2008 2009
US$/ CDN$
0
4
8
12
16
2000-2003 2004-2007
Total Farm InputsGasolineHired Farm HelpFertilizer
Annual percent change
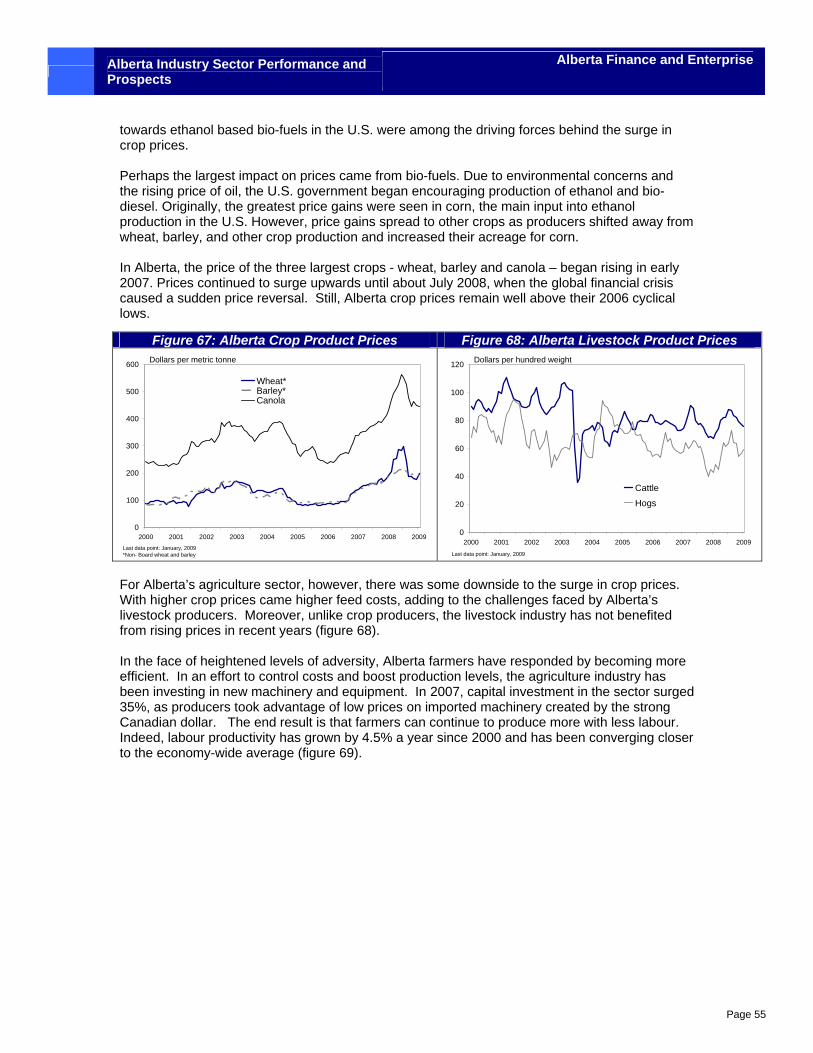
Alberta Industry Sector Performance and Prospects
Alberta Finance and Enterprise
Page 55
towards ethanol based bio-fuels in the U.S. were among the driving forces behind the surge in crop prices. Perhaps the largest impact on prices came from bio-fuels. Due to environmental concerns and the rising price of oil, the U.S. government began encouraging production of ethanol and bio-diesel. Originally, the greatest price gains were seen in corn, the main input into ethanol production in the U.S. However, price gains spread to other crops as producers shifted away from wheat, barley, and other crop production and increased their acreage for corn. In Alberta, the price of the three largest crops - wheat, barley and canola – began rising in early 2007. Prices continued to surge upwards until about July 2008, when the global financial crisis caused a sudden price reversal. Still, Alberta crop prices remain well above their 2006 cyclical lows.
For Alberta’s agriculture sector, however, there was some downside to the surge in crop prices. With higher crop prices came higher feed costs, adding to the challenges faced by Alberta’s livestock producers. Moreover, unlike crop producers, the livestock industry has not benefited from rising prices in recent years (figure 68). In the face of heightened levels of adversity, Alberta farmers have responded by becoming more efficient. In an effort to control costs and boost production levels, the agriculture industry has been investing in new machinery and equipment. In 2007, capital investment in the sector surged 35%, as producers took advantage of low prices on imported machinery created by the strong Canadian dollar. The end result is that farmers can continue to produce more with less labour. Indeed, labour productivity has grown by 4.5% a year since 2000 and has been converging closer to the economy-wide average (figure 69).
Figure 67: Alberta Crop Product Prices Figure 68: Alberta Livestock Product Prices
0
100
200
300
400
500
600
2000 2001 2002 2003 2004 2005 2006 2007 2008 2009
Wheat*Barley*Canola
Dollars per metric tonne
Last data point: January, 2009*Non- Board wheat and barley
0
20
40
60
80
100
120
2000 2001 2002 2003 2004 2005 2006 2007 2008 2009
Cattle
Hogs
Dollars per hundred weight
Last data point: January, 2009
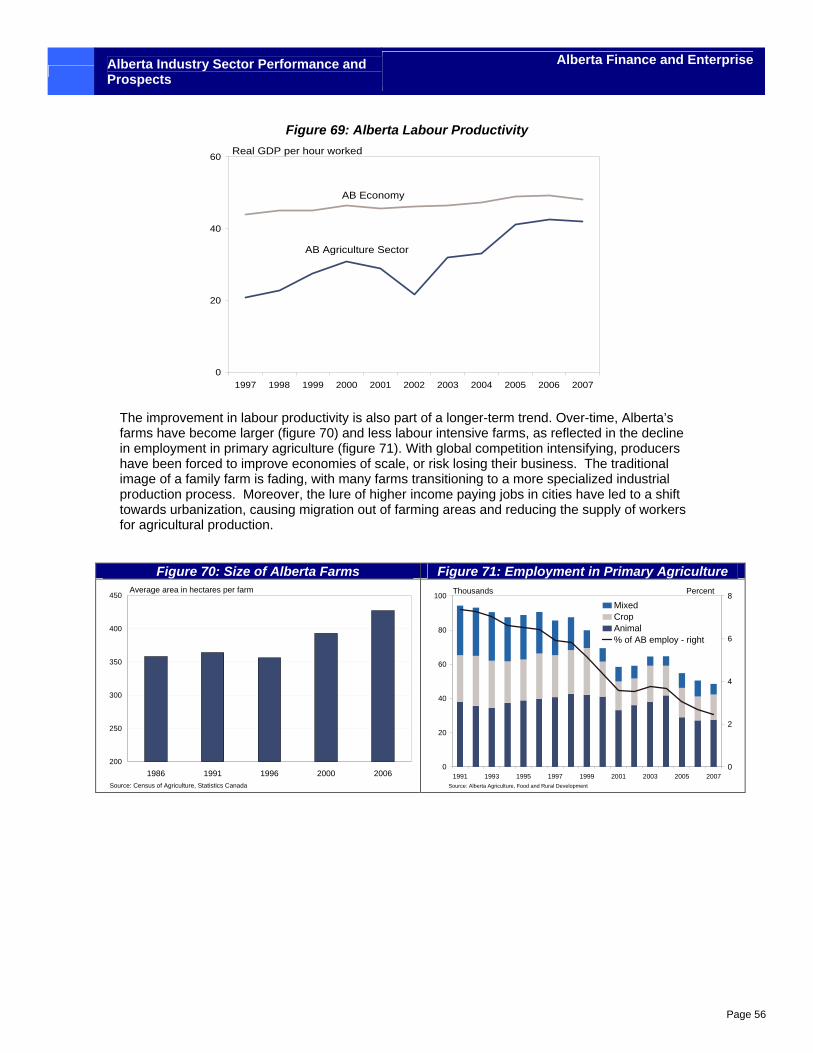
Alberta Industry Sector Performance and Prospects
Alberta Finance and Enterprise
Page 56
Figure 69: Alberta Labour Productivity
0
20
40
60
1997 1998 1999 2000 2001 2002 2003 2004 2005 2006 2007
Real GDP per hour worked
AB Economy
AB Agriculture Sector
The improvement in labour productivity is also part of a longer-term trend. Over-time, Alberta’s farms have become larger (figure 70) and less labour intensive farms, as reflected in the decline in employment in primary agriculture (figure 71). With global competition intensifying, producers have been forced to improve economies of scale, or risk losing their business. The traditional image of a family farm is fading, with many farms transitioning to a more specialized industrial production process. Moreover, the lure of higher income paying jobs in cities have led to a shift towards urbanization, causing migration out of farming areas and reducing the supply of workers for agricultural production.
Figure 70: Size of Alberta Farms Figure 71: Employment in Primary Agriculture
200
250
300
350
400
450
1986 1991 1996 2000 2006
Average area in hectares per farm
Source: Census of Agriculture, Statistics Canada
0
20
40
60
80
100
1991 1993 1995 1997 1999 2001 2003 2005 20070
2
4
6
8MixedCropAnimal% of AB employ - right
Thousands Percent
Source: Alberta Agriculture, Food and Rural Development
Alberta Industry Sector Performance and Prospects
Alberta Finance and Enterprise
Page 57
4.4.3 SWOT Analysis Strengths
• Alberta’s agriculture workers are becoming much more productive, thanks to increased spending on machinery and equipment and new technologies. In recent years, Alberta’s growth in agriculture labour productivity has surpassed the national average.
• Alberta agriculture producers are expanding into new markets. The share of Alberta’s agriculture exports to the U.S. has fallen from 34% in 2000 to 28% in the 2008.30 Rapidly expanding markets for Alberta’s agriculture products during the last ten years include Mexico, Indonesia and the United Arab Emirates.
• The Alberta Government has several programs and institutes for promoting research in agriculture, including the Ag Research fund, the Agrivalue Fund, and the Alberta Agriculture Research Institute.
Weaknesses
• The agriculture sector is a significant contributor of GHG emissions. In 2006, agriculture accounted for about 10% of GHG emissions in Canada, well above its share of total output. Moreover, while GHG emissions from agriculture have levelled off in recent years, they remain about 21% above 1990 levels.31
• Recent cases of BSE in Alberta have hurt the province’s reputation as a quality producer of safe food.
• International agriculture subsidies, particularly in the European Union, put many Alberta producers at a competitive disadvantage in the global marketplace.
• The sector is still highly dependent on the U.S. market, particularly for livestock exports.
• There is growing concern over the long-term supply of water, particularly in southern Alberta. Irrigation farming, oil and gas production and a strong economy has put growing demands on the province’s water resources in recent years.
Opportunities
• The shift towards bio-fuels is benefiting Alberta’s crop producers, both indirectly through higher prices and directly through increased demand. Bio-fuel production in Canada remains small relative to the U.S., but is likely to pick-up with the federal government announcing that it will require, by 2010, gasoline to have 5% ethanol content and on-road diesel and heating oil to have 2% bio-diesel blend.
• Increasing public health concerns over pesticides, antibiotics and hormones is creating
unprecedented opportunities for organic farmers. Statistics Canada reports that the number of certified organic producers in Canada increased 60% between 2001 and 2006. While the costs of meeting organic standards are substantial, organic farmers can charge a significant premium for their products.
• There is also a growing demand for locally grown food, as reflected in the popularity of
the “100-mile diet”. While few people adhere to this diet, awareness of the potential
30 Some of this increase can be attributed to a spike in prices for products exported to non-US markets. 31 Environment Canada (2008) “Canada's Greenhouse Gas Emissions: Understanding the Trends, 1990-2006”
Alberta Industry Sector Performance and Prospects
Alberta Finance and Enterprise
Page 58
health and environmental benefits of eating local is growing and presents an opportunity for Alberta farmers.
• Emerging economies, such as China, are a rapidly growing source of global food
demand, with millions entering the ranks of the middle class every year and expanding their diet to include a wider range of foods, particularly protein-based foods. To date, Alberta producers have been slow to capitalize on China. In fact, China’s share of Alberta’s agriculture exports was 7.1% in 2008 compared to 6.8% in 2000.
• Given recent health scares (e.g. BSE, listeriosis) and the resulting economic fallout,
concerted efforts to improve food safety and traceability would put Canadian producers at a competitive advantage.
• Global warming is both a threat and opportunity. Longer growing seasons may improve
crop yields and allow new crops to be introduced. However, global warming increases the risk of drought conditions, particularly in southern Alberta.
• With increased global competition, Alberta producers must continue to find innovative
ways to increase yields and reduce costs. This will require significant public and private investments in R&D.
• Agriculture producers have been increasing their acreage of canola at the expense of
other crops, driven by strong prices, and increased demand in Asia (cooking oil) and Europe (biodiesel).
• The federal government has introduced several incentive programs to encourage the
production of biofuels (e.g. ethanol, biodiesel) from agriculture products. These include the Capital Formation Assistance Program for Renewable Fuels Production, Biofuels Opportunities for Producers Initiative and the Agricultural Bioproducts Innovation Program.
Threats
• The recently introduced Country of Origin Labelling (COOL) legislation in the U.S. forces all Canadian and foreign beef and pork producers to label the origin of their products, creating an additional business cost. However, if Canada is perceived to be a safe food source, this legislation could also benefit the industry.
• There have been some major set-backs on the international trade front, with the Doha Round negotiations breaking down in July 2008 after participating countries failed to reach a compromise on agriculture subsidies. It is unlikely that there will be much progress on removing trade barriers and lowering agriculture subsidies in the near term as governments turn their attention towards protecting local industries during the global recession.
• It is becoming more difficult to attract and retain workers in the agriculture sector. While the average age of farmers is increasing, many children are leaving the family farm to pursue other career opportunities.
• Increased market uncertainty and price volatility is making it difficult for producers to
manage risk. Access to credit is increasingly important but becoming less available due to the global credit crisis. Government income programs are also rising in importance.
• While business costs in Alberta have moderated somewhat, they still remain elevated. In Alberta, labour shortages persist and energy and fertilizer prices remain above historical norms. These cost pressures will continue to constrain profit margins.

Alberta Industry Sector Performance and Prospects
Alberta Finance and Enterprise
Page 59
• The agriculture sector draws heavily on Alberta’s water resources, mainly for irrigation. Due to recent growth, there are growing concerns over potential water shortages in southern Alberta.
• The recent decline in energy prices may reduce demand and feasibility of ethanol and bio-diesel as alternative fuel sources. A shift away from bio-energy would likely put downward pressure on crop prices and demand.
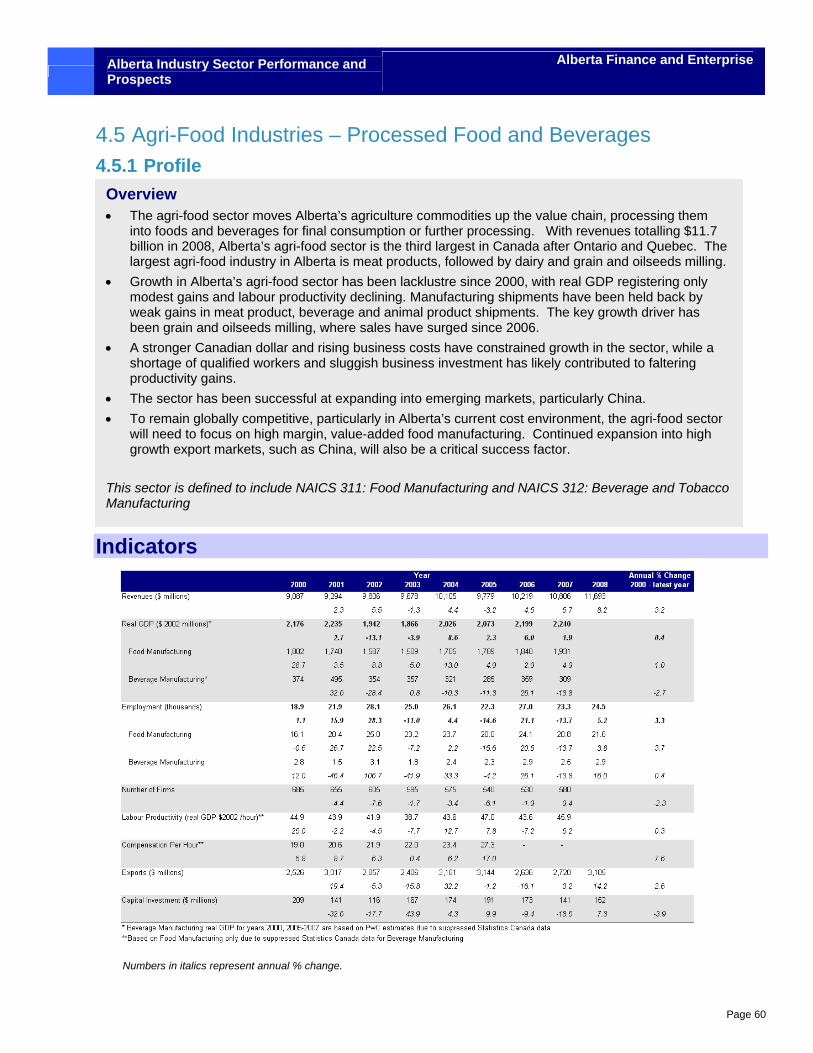
Alberta Industry Sector Performance and Prospects
Alberta Finance and Enterprise
Page 60
4.5 Agri-Food Industries – Processed Food and Beverages 4.5.1 Profile
Indicators
Numbers in italics represent annual % change.
Overview • The agri-food sector moves Alberta’s agriculture commodities up the value chain, processing them
into foods and beverages for final consumption or further processing. With revenues totalling $11.7 billion in 2008, Alberta’s agri-food sector is the third largest in Canada after Ontario and Quebec. The largest agri-food industry in Alberta is meat products, followed by dairy and grain and oilseeds milling.
• Growth in Alberta’s agri-food sector has been lacklustre since 2000, with real GDP registering only modest gains and labour productivity declining. Manufacturing shipments have been held back by weak gains in meat product, beverage and animal product shipments. The key growth driver has been grain and oilseeds milling, where sales have surged since 2006.
• A stronger Canadian dollar and rising business costs have constrained growth in the sector, while a shortage of qualified workers and sluggish business investment has likely contributed to faltering productivity gains.
• The sector has been successful at expanding into emerging markets, particularly China. • To remain globally competitive, particularly in Alberta’s current cost environment, the agri-food sector
will need to focus on high margin, value-added food manufacturing. Continued expansion into high growth export markets, such as China, will also be a critical success factor.
This sector is defined to include NAICS 311: Food Manufacturing and NAICS 312: Beverage and Tobacco Manufacturing
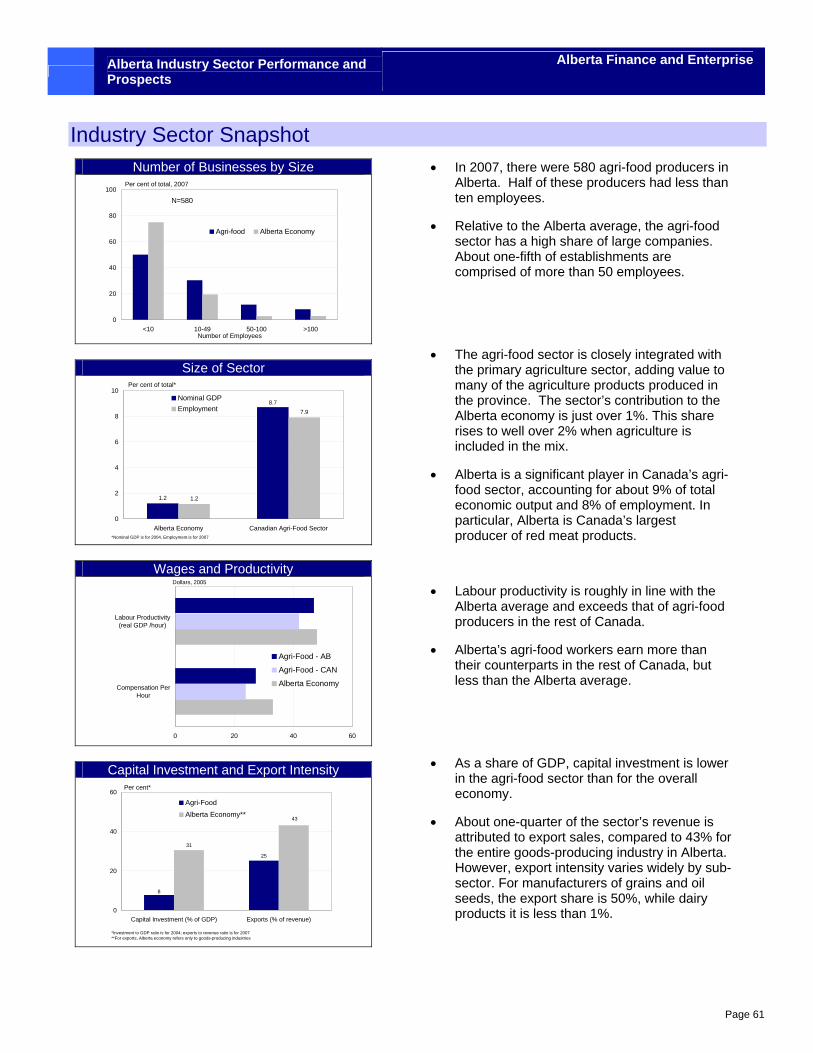
Alberta Industry Sector Performance and Prospects
Alberta Finance and Enterprise
Page 61
Industry Sector Snapshot Number of Businesses by Size
0
20
40
60
80
100
<10 10-49 50-100 >100
Agri-food Alberta Economy
Per cent of total, 2007
Number of Employees
N=580
Size of Sector
1.2 1.2
7.98.7
0
2
4
6
8
10
Alberta Economy Canadian Agri-Food Sector
Nominal GDPEmployment
Per cent of total*
*Nominal GDP is for 2004, Employment is for 2007
Wages and Productivity
0 20 40 60
Compensation PerHour
Labour Productivity(real GDP /hour)
Agri-Food - AB
Agri-Food - CAN
Alberta Economy
Dollars, 2005
Capital Investment and Export Intensity
25
31
8
43
0
20
40
60
Capital Investment (% of GDP) Exports (% of revenue)
Agri-FoodAlberta Economy**
Per cent*
*Investment to GDP ratio is for 2004; exports to revenue ratio is for 2007**For exports, Alberta economy refers only to goods-producing industries
• In 2007, there were 580 agri-food producers in Alberta. Half of these producers had less than ten employees.
• Relative to the Alberta average, the agri-food sector has a high share of large companies. About one-fifth of establishments are comprised of more than 50 employees.
• The agri-food sector is closely integrated with the primary agriculture sector, adding value to many of the agriculture products produced in the province. The sector’s contribution to the Alberta economy is just over 1%. This share rises to well over 2% when agriculture is included in the mix.
• Alberta is a significant player in Canada’s agri-food sector, accounting for about 9% of total economic output and 8% of employment. In particular, Alberta is Canada’s largest producer of red meat products.
• Labour productivity is roughly in line with the Alberta average and exceeds that of agri-food producers in the rest of Canada.
• Alberta’s agri-food workers earn more than their counterparts in the rest of Canada, but less than the Alberta average.
• As a share of GDP, capital investment is lower in the agri-food sector than for the overall economy.
• About one-quarter of the sector’s revenue is attributed to export sales, compared to 43% for the entire goods-producing industry in Alberta. However, export intensity varies widely by sub-sector. For manufacturers of grains and oil seeds, the export share is 50%, while dairy products it is less than 1%.
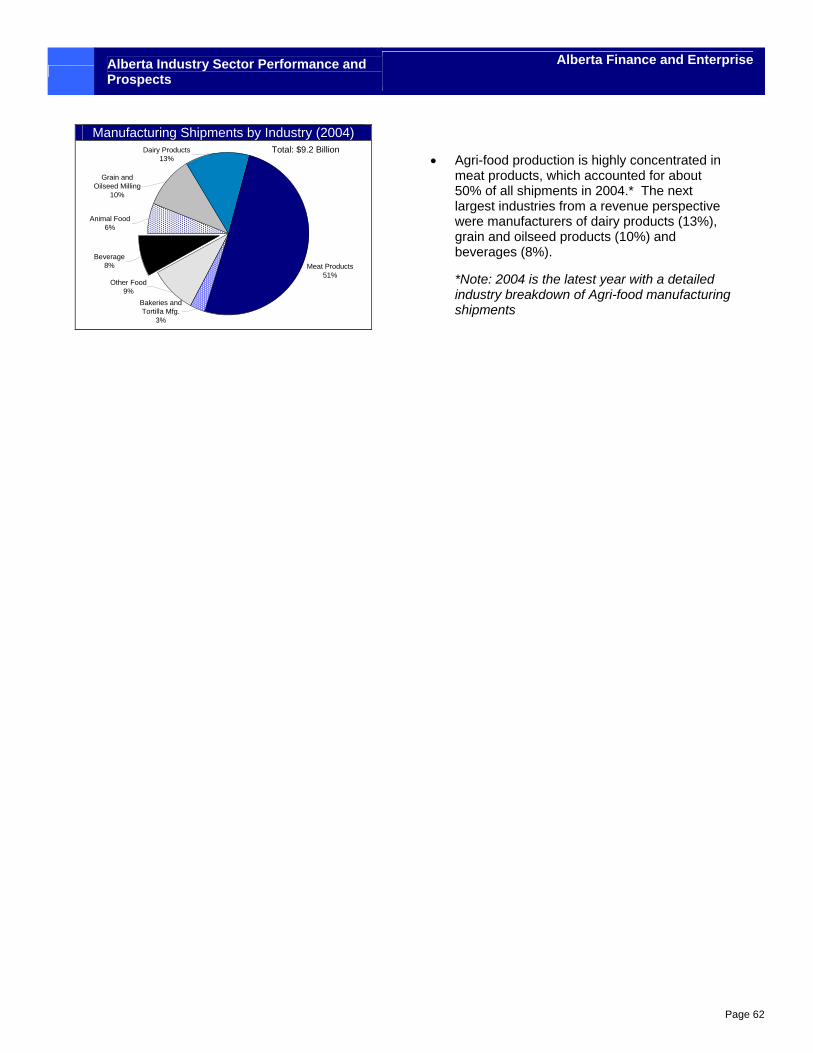
Alberta Industry Sector Performance and Prospects
Alberta Finance and Enterprise
Page 62
Manufacturing Shipments by Industry (2004)
Grain and Oilseed Milling
10%
Animal Food6%
Bakeries and Tortilla Mfg.
3%
Meat Products51%
Dairy Products13%
Other Food9%
Beverage8%
Total: $9.2 Billion
• Agri-food production is highly concentrated in meat products, which accounted for about 50% of all shipments in 2004.* The next largest industries from a revenue perspective were manufacturers of dairy products (13%), grain and oilseed products (10%) and beverages (8%).
*Note: 2004 is the latest year with a detailed industry breakdown of Agri-food manufacturing shipments
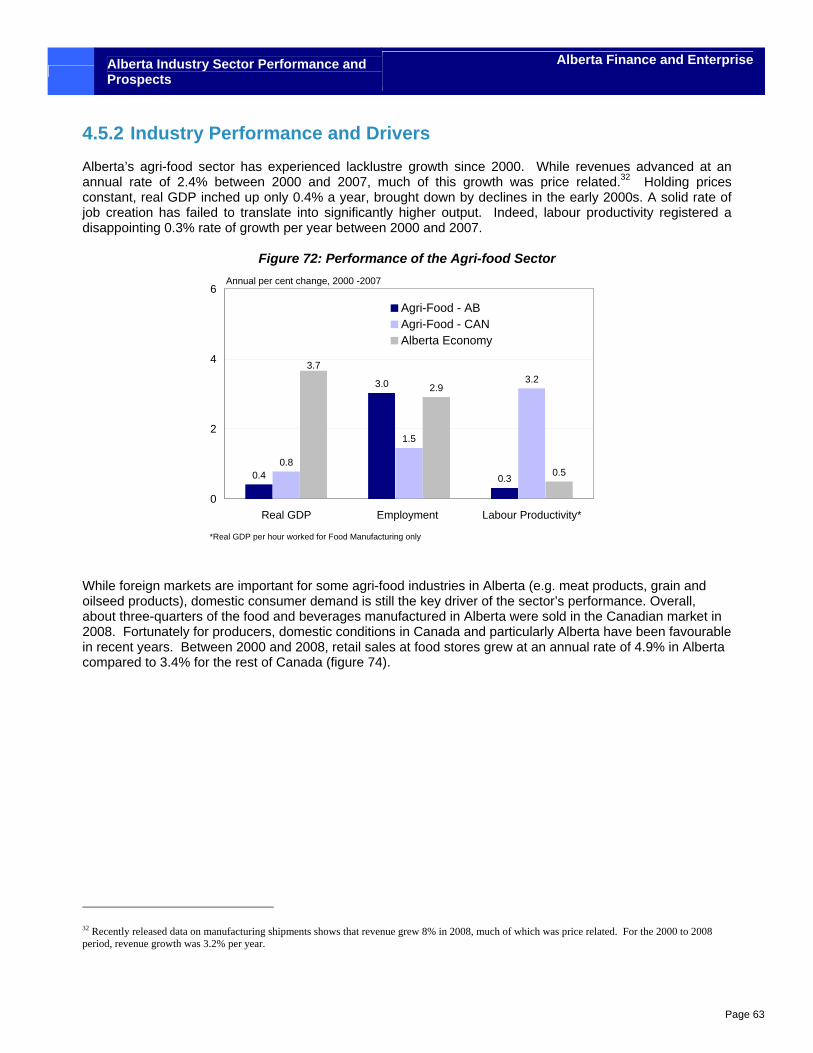
Alberta Industry Sector Performance and Prospects
Alberta Finance and Enterprise
Page 63
4.5.2 Industry Performance and Drivers Alberta’s agri-food sector has experienced lacklustre growth since 2000. While revenues advanced at an annual rate of 2.4% between 2000 and 2007, much of this growth was price related.32 Holding prices constant, real GDP inched up only 0.4% a year, brought down by declines in the early 2000s. A solid rate of job creation has failed to translate into significantly higher output. Indeed, labour productivity registered a disappointing 0.3% rate of growth per year between 2000 and 2007.
Figure 72: Performance of the Agri-food Sector
0.4
3.0
0.30.8
1.5
3.22.9
0.5
3.7
0
2
4
6
Real GDP Employment Labour Productivity*
Agri-Food - ABAgri-Food - CANAlberta Economy
Annual per cent change, 2000 -2007
*Real GDP per hour worked for Food Manufacturing only
While foreign markets are important for some agri-food industries in Alberta (e.g. meat products, grain and oilseed products), domestic consumer demand is still the key driver of the sector’s performance. Overall, about three-quarters of the food and beverages manufactured in Alberta were sold in the Canadian market in 2008. Fortunately for producers, domestic conditions in Canada and particularly Alberta have been favourable in recent years. Between 2000 and 2008, retail sales at food stores grew at an annual rate of 4.9% in Alberta compared to 3.4% for the rest of Canada (figure 74).
32 Recently released data on manufacturing shipments shows that revenue grew 8% in 2008, much of which was price related. For the 2000 to 2008 period, revenue growth was 3.2% per year.
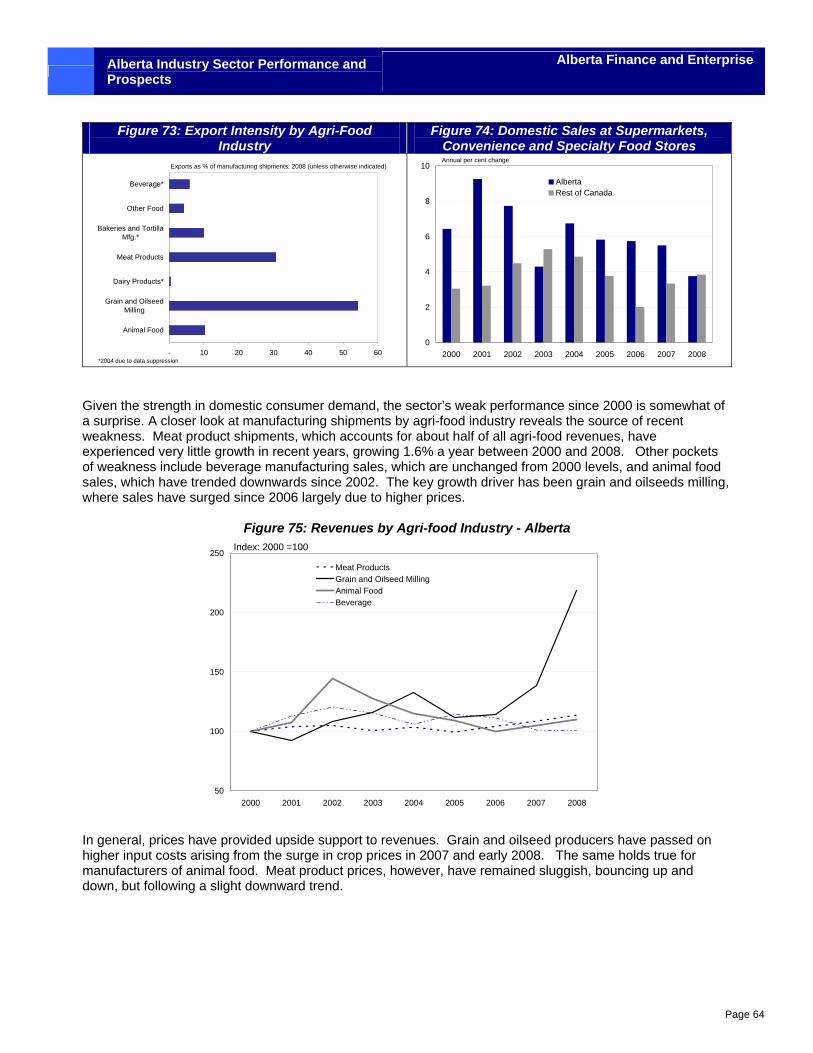
Alberta Industry Sector Performance and Prospects
Alberta Finance and Enterprise
Page 64
Figure 73: Export Intensity by Agri-Food Industry
Figure 74: Domestic Sales at Supermarkets, Convenience and Specialty Food Stores
- 10 20 30 40 50 60
Animal Food
Grain and OilseedMilling
Dairy Products*
Meat Products
Bakeries and TortillaMfg.*
Other Food
Beverage*
Exports as % of manufacturing shipments, 2008 (unless otherwise indicated)
*2004 due to data suppression
0
2
4
6
8
10
2000 2001 2002 2003 2004 2005 2006 2007 2008
AlbertaRest of Canada
Annual per cent change
Given the strength in domestic consumer demand, the sector’s weak performance since 2000 is somewhat of a surprise. A closer look at manufacturing shipments by agri-food industry reveals the source of recent weakness. Meat product shipments, which accounts for about half of all agri-food revenues, have experienced very little growth in recent years, growing 1.6% a year between 2000 and 2008. Other pockets of weakness include beverage manufacturing sales, which are unchanged from 2000 levels, and animal food sales, which have trended downwards since 2002. The key growth driver has been grain and oilseeds milling, where sales have surged since 2006 largely due to higher prices.
Figure 75: Revenues by Agri-food Industry - Alberta
50
100
150
200
250
2000 2001 2002 2003 2004 2005 2006 2007 2008
Meat ProductsGrain and Oilseed MillingAnimal FoodBeverage
Index: 2000 =100
In general, prices have provided upside support to revenues. Grain and oilseed producers have passed on higher input costs arising from the surge in crop prices in 2007 and early 2008. The same holds true for manufacturers of animal food. Meat product prices, however, have remained sluggish, bouncing up and down, but following a slight downward trend.
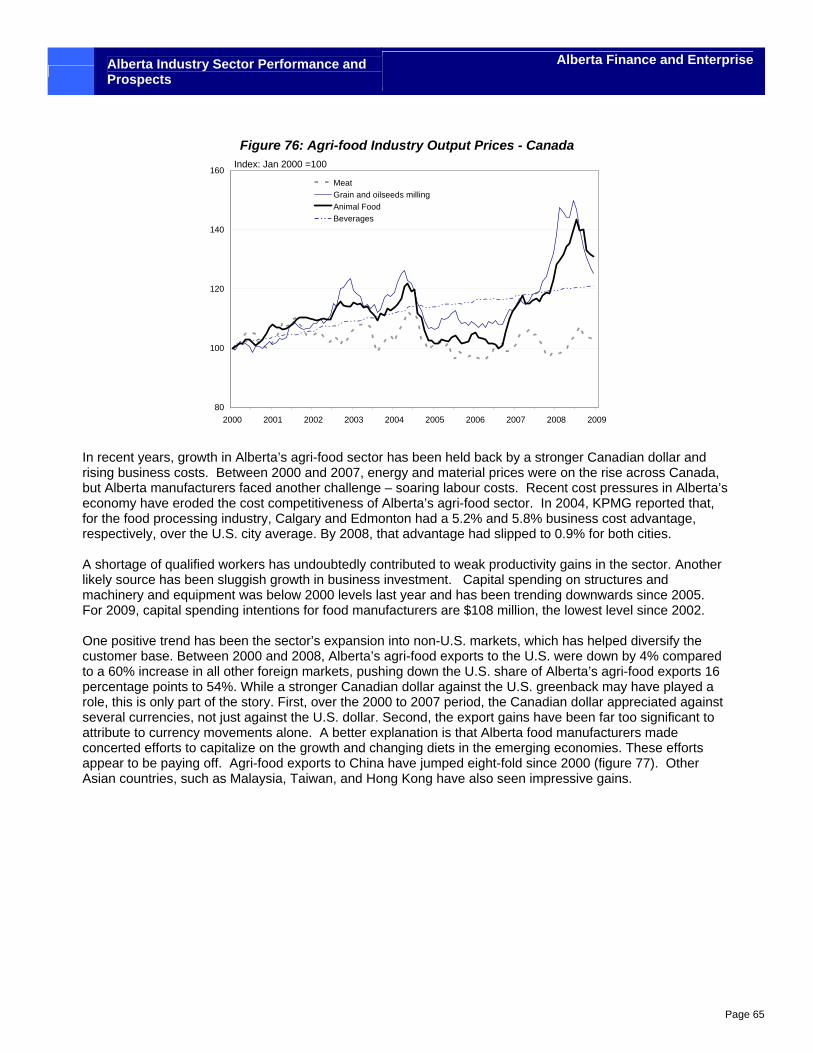
Alberta Industry Sector Performance and Prospects
Alberta Finance and Enterprise
Page 65
Figure 76: Agri-food Industry Output Prices - Canada
80
100
120
140
160
2000 2001 2002 2003 2004 2005 2006 2007 2008 2009
MeatGrain and oilseeds millingAnimal FoodBeverages
Index: Jan 2000 =100
In recent years, growth in Alberta’s agri-food sector has been held back by a stronger Canadian dollar and rising business costs. Between 2000 and 2007, energy and material prices were on the rise across Canada, but Alberta manufacturers faced another challenge – soaring labour costs. Recent cost pressures in Alberta’s economy have eroded the cost competitiveness of Alberta’s agri-food sector. In 2004, KPMG reported that, for the food processing industry, Calgary and Edmonton had a 5.2% and 5.8% business cost advantage, respectively, over the U.S. city average. By 2008, that advantage had slipped to 0.9% for both cities. A shortage of qualified workers has undoubtedly contributed to weak productivity gains in the sector. Another likely source has been sluggish growth in business investment. Capital spending on structures and machinery and equipment was below 2000 levels last year and has been trending downwards since 2005. For 2009, capital spending intentions for food manufacturers are $108 million, the lowest level since 2002. One positive trend has been the sector’s expansion into non-U.S. markets, which has helped diversify the customer base. Between 2000 and 2008, Alberta’s agri-food exports to the U.S. were down by 4% compared to a 60% increase in all other foreign markets, pushing down the U.S. share of Alberta’s agri-food exports 16 percentage points to 54%. While a stronger Canadian dollar against the U.S. greenback may have played a role, this is only part of the story. First, over the 2000 to 2007 period, the Canadian dollar appreciated against several currencies, not just against the U.S. dollar. Second, the export gains have been far too significant to attribute to currency movements alone. A better explanation is that Alberta food manufacturers made concerted efforts to capitalize on the growth and changing diets in the emerging economies. These efforts appear to be paying off. Agri-food exports to China have jumped eight-fold since 2000 (figure 77). Other Asian countries, such as Malaysia, Taiwan, and Hong Kong have also seen impressive gains.
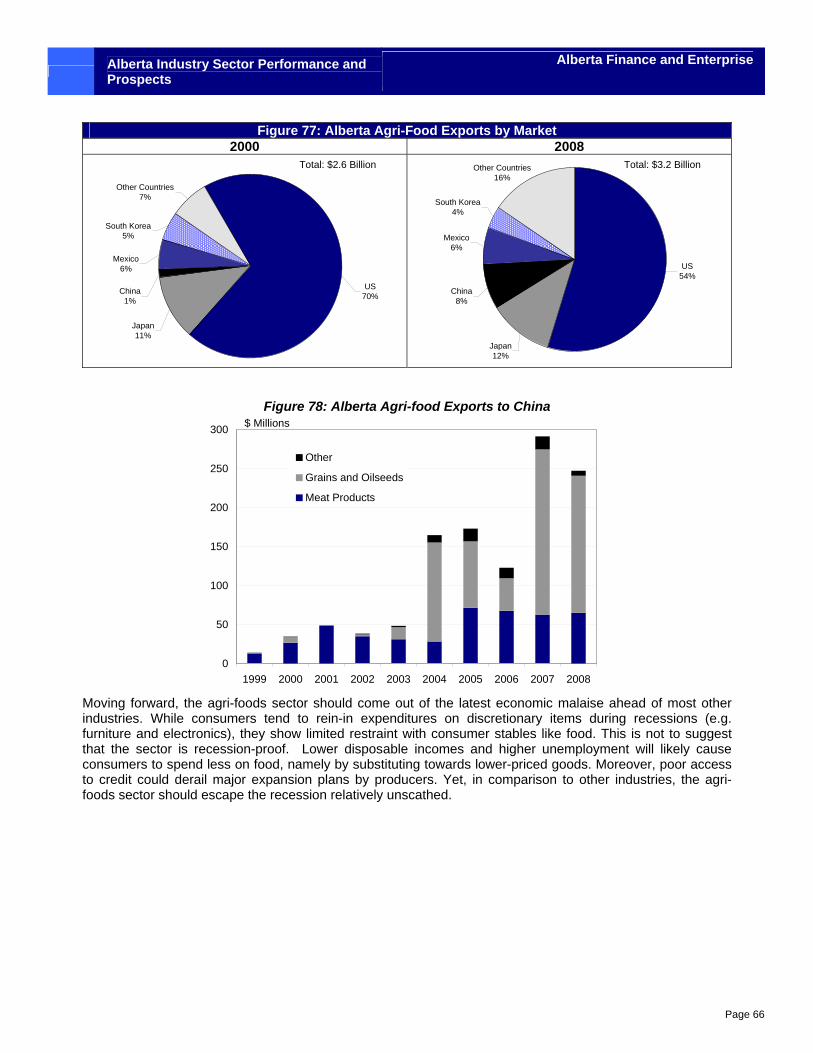
Alberta Industry Sector Performance and Prospects
Alberta Finance and Enterprise
Page 66
Figure 77: Alberta Agri-Food Exports by Market 2000 2008
Other Countries7%
China1%
Mexico6%
South Korea5%
US70%
Japan11%
Total: $2.6 Billion Other Countries16%
China8%
Mexico6%
South Korea4%
US54%
Japan12%
Total: $3.2 Billion
Figure 78: Alberta Agri-food Exports to China
0
50
100
150
200
250
300
1999 2000 2001 2002 2003 2004 2005 2006 2007 2008
Other
Grains and Oilseeds
Meat Products
$ Millions
Moving forward, the agri-foods sector should come out of the latest economic malaise ahead of most other industries. While consumers tend to rein-in expenditures on discretionary items during recessions (e.g. furniture and electronics), they show limited restraint with consumer stables like food. This is not to suggest that the sector is recession-proof. Lower disposable incomes and higher unemployment will likely cause consumers to spend less on food, namely by substituting towards lower-priced goods. Moreover, poor access to credit could derail major expansion plans by producers. Yet, in comparison to other industries, the agri-foods sector should escape the recession relatively unscathed.
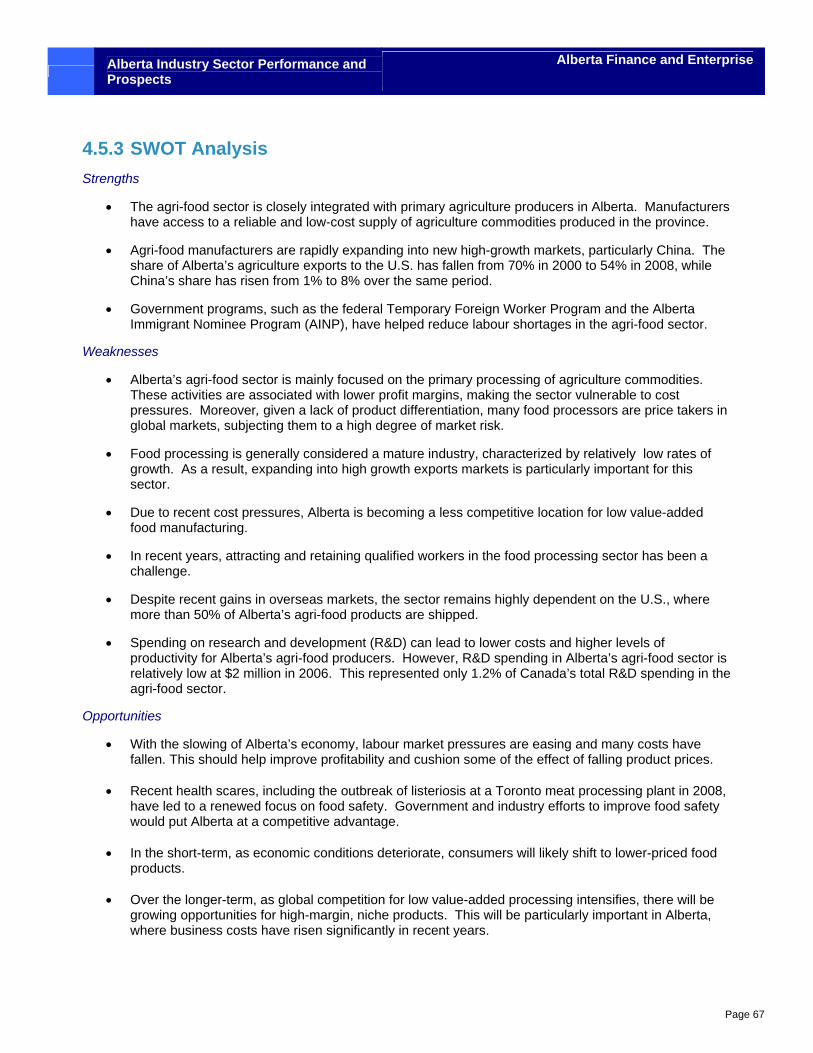
Alberta Industry Sector Performance and Prospects
Alberta Finance and Enterprise
Page 67
4.5.3 SWOT Analysis Strengths
• The agri-food sector is closely integrated with primary agriculture producers in Alberta. Manufacturers have access to a reliable and low-cost supply of agriculture commodities produced in the province.
• Agri-food manufacturers are rapidly expanding into new high-growth markets, particularly China. The share of Alberta’s agriculture exports to the U.S. has fallen from 70% in 2000 to 54% in 2008, while China’s share has risen from 1% to 8% over the same period.
• Government programs, such as the federal Temporary Foreign Worker Program and the Alberta Immigrant Nominee Program (AINP), have helped reduce labour shortages in the agri-food sector.
Weaknesses
• Alberta’s agri-food sector is mainly focused on the primary processing of agriculture commodities. These activities are associated with lower profit margins, making the sector vulnerable to cost pressures. Moreover, given a lack of product differentiation, many food processors are price takers in global markets, subjecting them to a high degree of market risk.
• Food processing is generally considered a mature industry, characterized by relatively low rates of growth. As a result, expanding into high growth exports markets is particularly important for this sector.
• Due to recent cost pressures, Alberta is becoming a less competitive location for low value-added food manufacturing.
• In recent years, attracting and retaining qualified workers in the food processing sector has been a challenge.
• Despite recent gains in overseas markets, the sector remains highly dependent on the U.S., where more than 50% of Alberta’s agri-food products are shipped.
• Spending on research and development (R&D) can lead to lower costs and higher levels of productivity for Alberta’s agri-food producers. However, R&D spending in Alberta’s agri-food sector is relatively low at $2 million in 2006. This represented only 1.2% of Canada’s total R&D spending in the agri-food sector.
Opportunities
• With the slowing of Alberta’s economy, labour market pressures are easing and many costs have fallen. This should help improve profitability and cushion some of the effect of falling product prices.
• Recent health scares, including the outbreak of listeriosis at a Toronto meat processing plant in 2008,
have led to a renewed focus on food safety. Government and industry efforts to improve food safety would put Alberta at a competitive advantage.
• In the short-term, as economic conditions deteriorate, consumers will likely shift to lower-priced food
products.
• Over the longer-term, as global competition for low value-added processing intensifies, there will be growing opportunities for high-margin, niche products. This will be particularly important in Alberta, where business costs have risen significantly in recent years.
Alberta Industry Sector Performance and Prospects
Alberta Finance and Enterprise
Page 68
• The agri-food sector must be responsive to changing diets, both locally and abroad. In Canada,
immigrant populations account for a growing share of the population and have very different diets than their Canadian-born counterparts. On a more global level, there is a general trend towards healthy, organic and convenience foods.
• The sector must cater to a customer base that is becoming more diverse in terms of their food
preferences, in part driven by a rising number of immigrants and the growth of niche markets, such as organic foods. This may require that agri-food producers expand their product mix in order to protect against the imports of such niche, specialty products.
• As growing numbers enter the middle class in the emerging economies, there will continue to be a
shift towards protein-based foods, such as beef. This presents an opportunity for the large number of meat producers in Alberta.
• The shift towards biofuels is creating opportunities for Alberta’s grains and oilseeds processors.
Virgin oil and waste vegetable oil, especially canola oil, is used as feedstock to produce biodiesel, particularly in the European Union.
• The Federal Government has introduced several incentive programs to encourage the production of
biofuels (e.g. ethanol, biodiesel) from agriculture products. These include the Capital Formation Assistance Program for Renewable Fuels Production, Biofuels Opportunities for Producers Initiative and the Agricultural Bioproducts Innovation Program.
Threats
• Alberta’s agri-food producers cannot compete on costs alone. The cost of business in the province has increased recently and competition from lower-cost producers is intensifying.
• In the short-term, the recession may force consumers to reduce spending on high-priced food products. However, in the long-run, failure to move up the value-chain towards high-margin, differentiated products could threaten growth in the sector.
• The global credit crisis is making it more difficult for agri-food manufacturers to finance operations and capital purchases.
• The success of the sector depends on its ability to expand into new export markets. On the trade front, there have been some setbacks. First, international trade talks at the Doha Round in July 2008 broke down due to disagreements over agriculture subsidies. Second, the new Country of Origin Labelling (COOL) legislation, introduced by the U.S. in September 2008, is considered by some to be a de facto trade tariff. Finally, the global recession raises the risk that some countries may introduce protectionist policies, such as increasing subsidizes for domestically produced goods.
• In some countries, particularly in Europe, there has been a shift in consumer preferences away from genetically modified foods. Many consumers are demanding new labelling requirements so that genetically modified food can be identified.
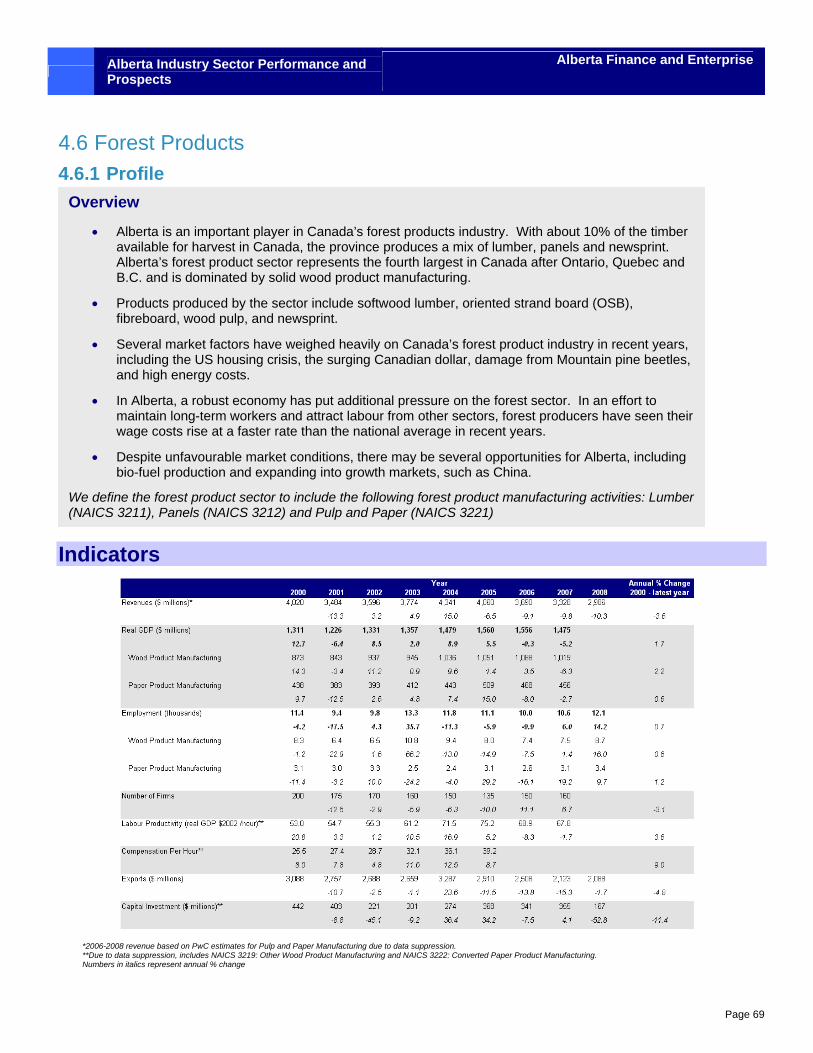
Alberta Industry Sector Performance and Prospects
Alberta Finance and Enterprise
Page 69
4.6 Forest Products 4.6.1 Profile
Indicators
*2006-2008 revenue based on PwC estimates for Pulp and Paper Manufacturing due to data suppression. **Due to data suppression, includes NAICS 3219: Other Wood Product Manufacturing and NAICS 3222: Converted Paper Product Manufacturing. Numbers in italics represent annual % change
Overview
• Alberta is an important player in Canada’s forest products industry. With about 10% of the timber available for harvest in Canada, the province produces a mix of lumber, panels and newsprint. Alberta’s forest product sector represents the fourth largest in Canada after Ontario, Quebec and B.C. and is dominated by solid wood product manufacturing.
• Products produced by the sector include softwood lumber, oriented strand board (OSB), fibreboard, wood pulp, and newsprint.
• Several market factors have weighed heavily on Canada’s forest product industry in recent years, including the US housing crisis, the surging Canadian dollar, damage from Mountain pine beetles, and high energy costs.
• In Alberta, a robust economy has put additional pressure on the forest sector. In an effort to maintain long-term workers and attract labour from other sectors, forest producers have seen their wage costs rise at a faster rate than the national average in recent years.
• Despite unfavourable market conditions, there may be several opportunities for Alberta, including bio-fuel production and expanding into growth markets, such as China.
We define the forest product sector to include the following forest product manufacturing activities: Lumber (NAICS 3211), Panels (NAICS 3212) and Pulp and Paper (NAICS 3221)
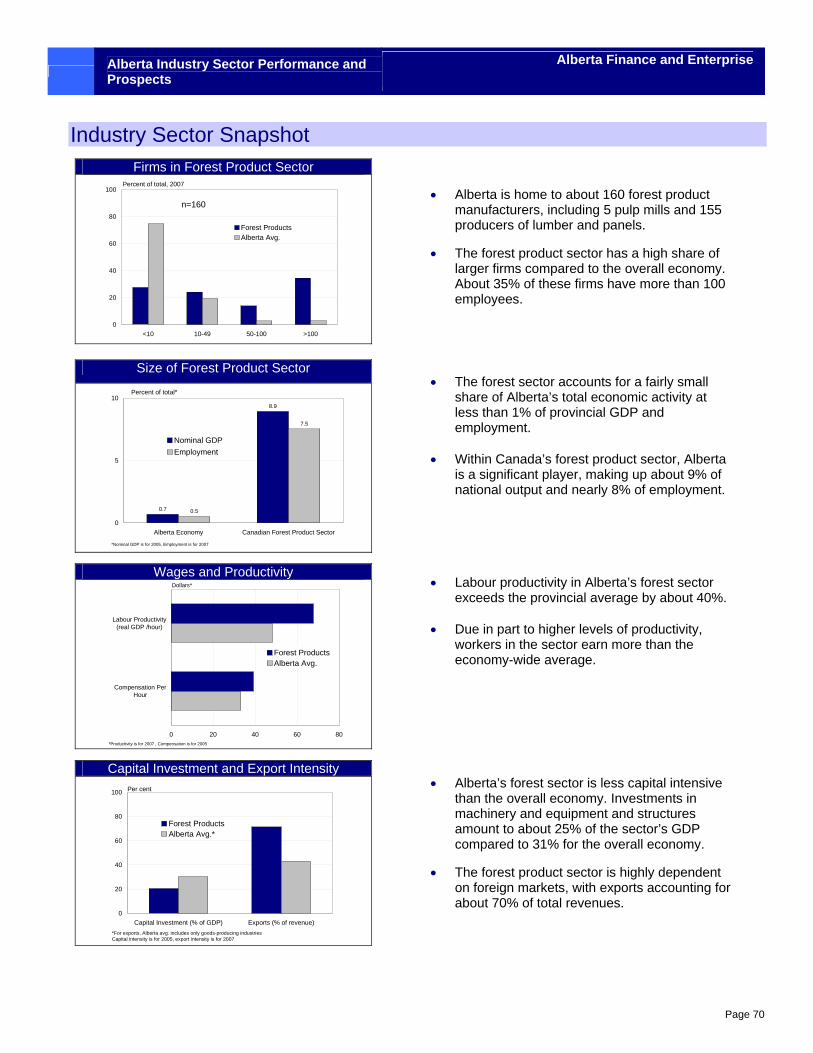
Alberta Industry Sector Performance and Prospects
Alberta Finance and Enterprise
Page 70
Industry Sector Snapshot Firms in Forest Product Sector
0
20
40
60
80
100
<10 10-49 50-100 >100
Forest ProductsAlberta Avg.
Percent of total, 2007
n=160
Size of Forest Product Sector
0.7
8.9
0.5
7.5
0
5
10
Alberta Economy Canadian Forest Product Sector
Nominal GDPEmployment
Percent of total*
*Nominal GDP is for 2005, Employment is for 2007
Wages and Productivity
0 20 40 60 80
Compensation PerHour
Labour Productivity(real GDP /hour)
Forest ProductsAlberta Avg.
Dollars*
*Productivity is for 2007 , Compensation is for 2005
Capital Investment and Export Intensity
0
20
40
60
80
100
Capital Investment (% of GDP) Exports (% of revenue)
Forest ProductsAlberta Avg.*
Per cent
*For exports, Alberta avg. includes only goods-producing industries Capital intensity is for 2005, export intensity is for 2007
• Alberta is home to about 160 forest product manufacturers, including 5 pulp mills and 155 producers of lumber and panels.
• The forest product sector has a high share of larger firms compared to the overall economy. About 35% of these firms have more than 100 employees.
• The forest sector accounts for a fairly small share of Alberta’s total economic activity at less than 1% of provincial GDP and employment.
• Within Canada’s forest product sector, Alberta
is a significant player, making up about 9% of national output and nearly 8% of employment.
• Labour productivity in Alberta’s forest sector exceeds the provincial average by about 40%.
• Due in part to higher levels of productivity,
workers in the sector earn more than the economy-wide average.
• Alberta’s forest sector is less capital intensive
than the overall economy. Investments in machinery and equipment and structures amount to about 25% of the sector’s GDP compared to 31% for the overall economy.
• The forest product sector is highly dependent on foreign markets, with exports accounting for about 70% of total revenues.
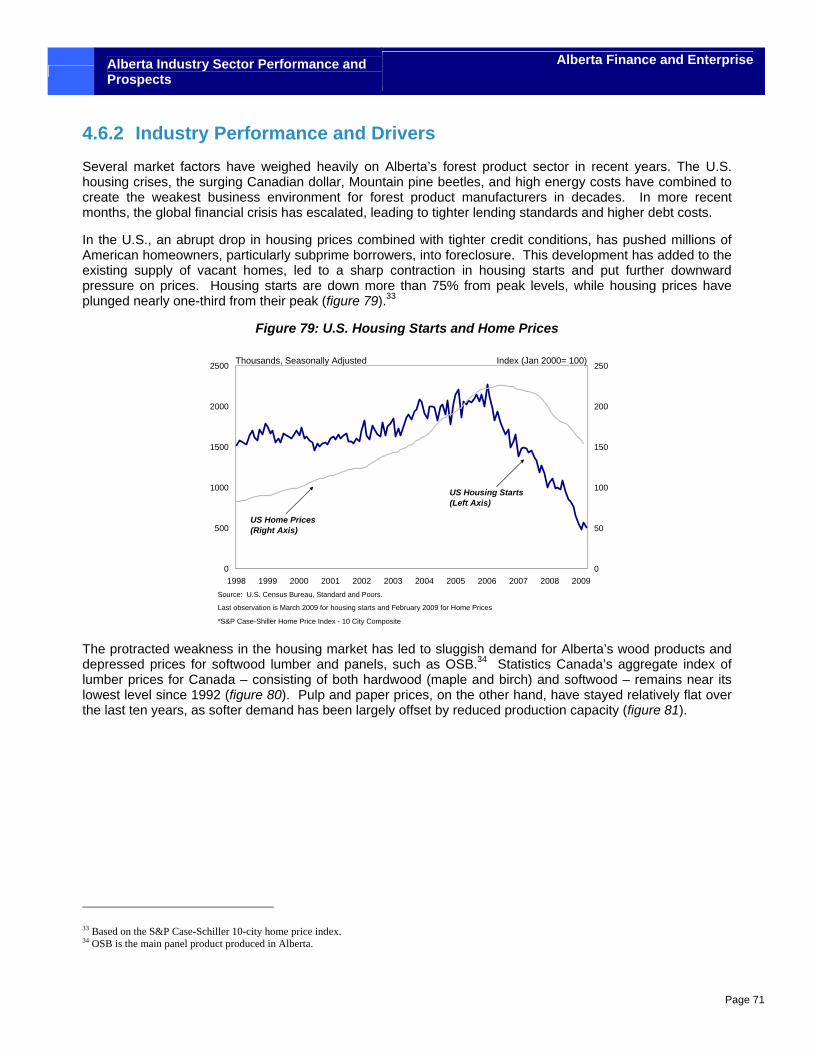
Alberta Industry Sector Performance and Prospects
Alberta Finance and Enterprise
Page 71
4.6.2 Industry Performance and Drivers Several market factors have weighed heavily on Alberta’s forest product sector in recent years. The U.S. housing crises, the surging Canadian dollar, Mountain pine beetles, and high energy costs have combined to create the weakest business environment for forest product manufacturers in decades. In more recent months, the global financial crisis has escalated, leading to tighter lending standards and higher debt costs.
In the U.S., an abrupt drop in housing prices combined with tighter credit conditions, has pushed millions of American homeowners, particularly subprime borrowers, into foreclosure. This development has added to the existing supply of vacant homes, led to a sharp contraction in housing starts and put further downward pressure on prices. Housing starts are down more than 75% from peak levels, while housing prices have plunged nearly one-third from their peak (figure 79).33
Figure 79: U.S. Housing Starts and Home Prices
0
500
1000
1500
2000
2500
1998 1999 2000 2001 2002 2003 2004 2005 2006 2007 2008 20090
50
100
150
200
250Thousands, Seasonally Adjusted
US Home Prices (Right Axis)
Source: U.S. Census Bureau, Standard and Poors.
*S&P Case-Shiller Home Price Index - 10 City Composite
Last observation is March 2009 for housing starts and February 2009 for Home Prices
Index (Jan 2000= 100)
US Housing Starts(Left Axis)
The protracted weakness in the housing market has led to sluggish demand for Alberta’s wood products and depressed prices for softwood lumber and panels, such as OSB.34 Statistics Canada’s aggregate index of lumber prices for Canada – consisting of both hardwood (maple and birch) and softwood – remains near its lowest level since 1992 (figure 80). Pulp and paper prices, on the other hand, have stayed relatively flat over the last ten years, as softer demand has been largely offset by reduced production capacity (figure 81).
33 Based on the S&P Case-Schiller 10-city home price index. 34 OSB is the main panel product produced in Alberta.
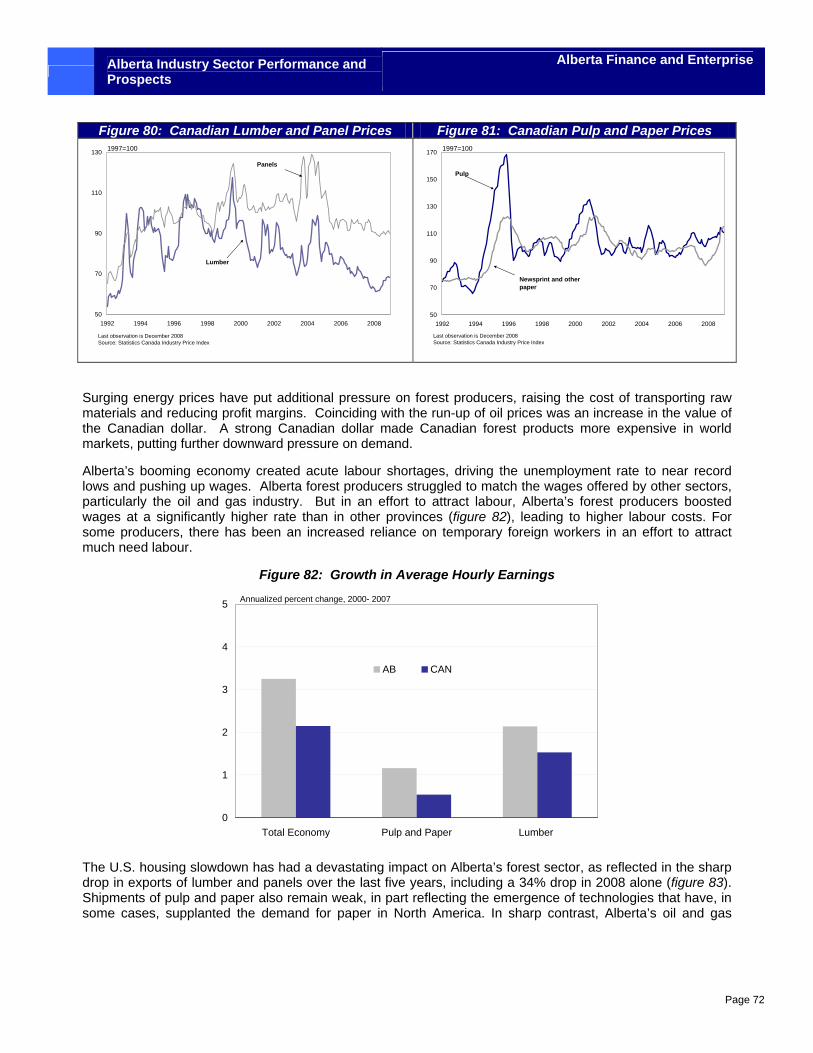
Alberta Industry Sector Performance and Prospects
Alberta Finance and Enterprise
Page 72
Figure 80: Canadian Lumber and Panel Prices Figure 81: Canadian Pulp and Paper Prices
50
70
90
110
130
1992 1994 1996 1998 2000 2002 2004 2006 2008
1997=100
Last observation is December 2008 Source: Statistics Canada Industry Price Index
Lumber
Panels
50
70
90
110
130
150
170
1992 1994 1996 1998 2000 2002 2004 2006 2008
1997=100
Last observation is December 2008 Source: Statistics Canada Industry Price Index
Pulp
Newsprint and other paper
Surging energy prices have put additional pressure on forest producers, raising the cost of transporting raw materials and reducing profit margins. Coinciding with the run-up of oil prices was an increase in the value of the Canadian dollar. A strong Canadian dollar made Canadian forest products more expensive in world markets, putting further downward pressure on demand.
Alberta’s booming economy created acute labour shortages, driving the unemployment rate to near record lows and pushing up wages. Alberta forest producers struggled to match the wages offered by other sectors, particularly the oil and gas industry. But in an effort to attract labour, Alberta’s forest producers boosted wages at a significantly higher rate than in other provinces (figure 82), leading to higher labour costs. For some producers, there has been an increased reliance on temporary foreign workers in an effort to attract much need labour.
Figure 82: Growth in Average Hourly Earnings
0
1
2
3
4
5
Total Economy Pulp and Paper Lumber
AB CAN
Annualized percent change, 2000- 2007
The U.S. housing slowdown has had a devastating impact on Alberta’s forest sector, as reflected in the sharp drop in exports of lumber and panels over the last five years, including a 34% drop in 2008 alone (figure 83). Shipments of pulp and paper also remain weak, in part reflecting the emergence of technologies that have, in some cases, supplanted the demand for paper in North America. In sharp contrast, Alberta’s oil and gas
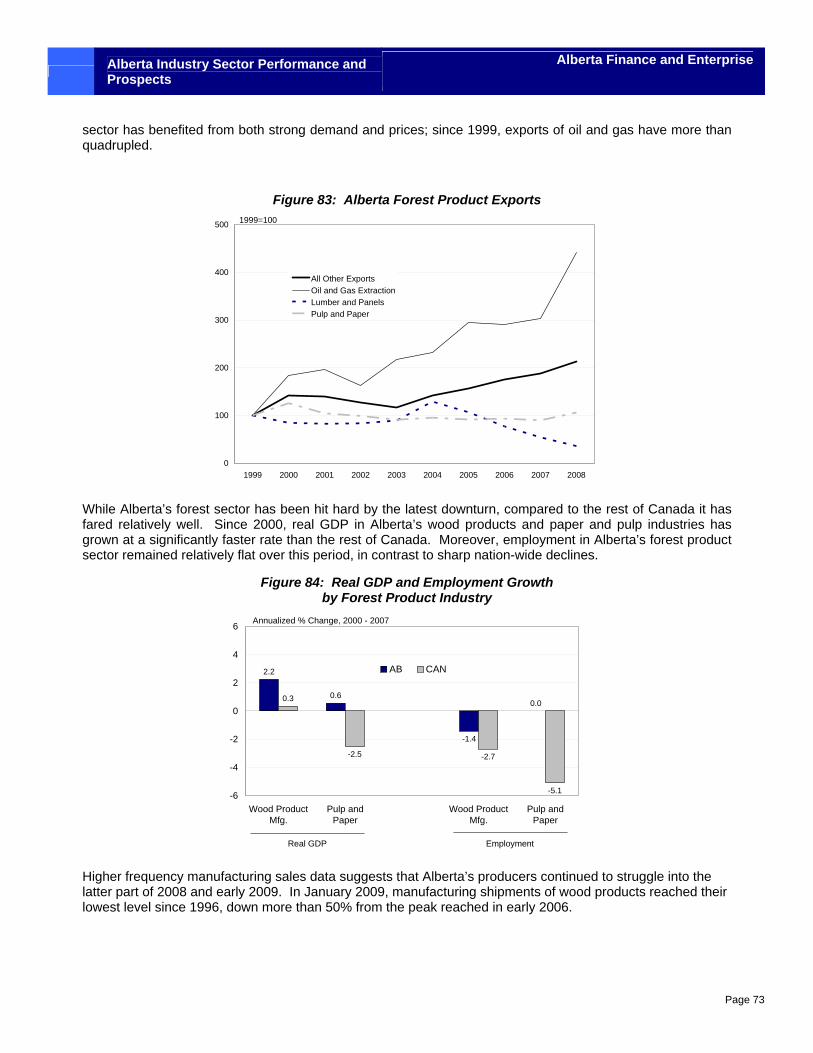
Alberta Industry Sector Performance and Prospects
Alberta Finance and Enterprise
Page 73
sector has benefited from both strong demand and prices; since 1999, exports of oil and gas have more than quadrupled.
Figure 83: Alberta Forest Product Exports
0
100
200
300
400
500
1999 2000 2001 2002 2003 2004 2005 2006 2007 2008
All Other ExportsOil and Gas ExtractionLumber and PanelsPulp and Paper
1999=100
While Alberta’s forest sector has been hit hard by the latest downturn, compared to the rest of Canada it has fared relatively well. Since 2000, real GDP in Alberta’s wood products and paper and pulp industries has grown at a significantly faster rate than the rest of Canada. Moreover, employment in Alberta’s forest product sector remained relatively flat over this period, in contrast to sharp nation-wide declines.
Figure 84: Real GDP and Employment Growth by Forest Product Industry
2.2
0.6
-1.4
0.00.3
-2.5 -2.7
-5.1-6
-4
-2
0
2
4
6
Wood ProductMfg.
Pulp andPaper
Wood ProductMfg.
Pulp andPaper
AB CAN
Annualized % Change, 2000 - 2007
Real GDP Employment
Higher frequency manufacturing sales data suggests that Alberta’s producers continued to struggle into the latter part of 2008 and early 2009. In January 2009, manufacturing shipments of wood products reached their lowest level since 1996, down more than 50% from the peak reached in early 2006.
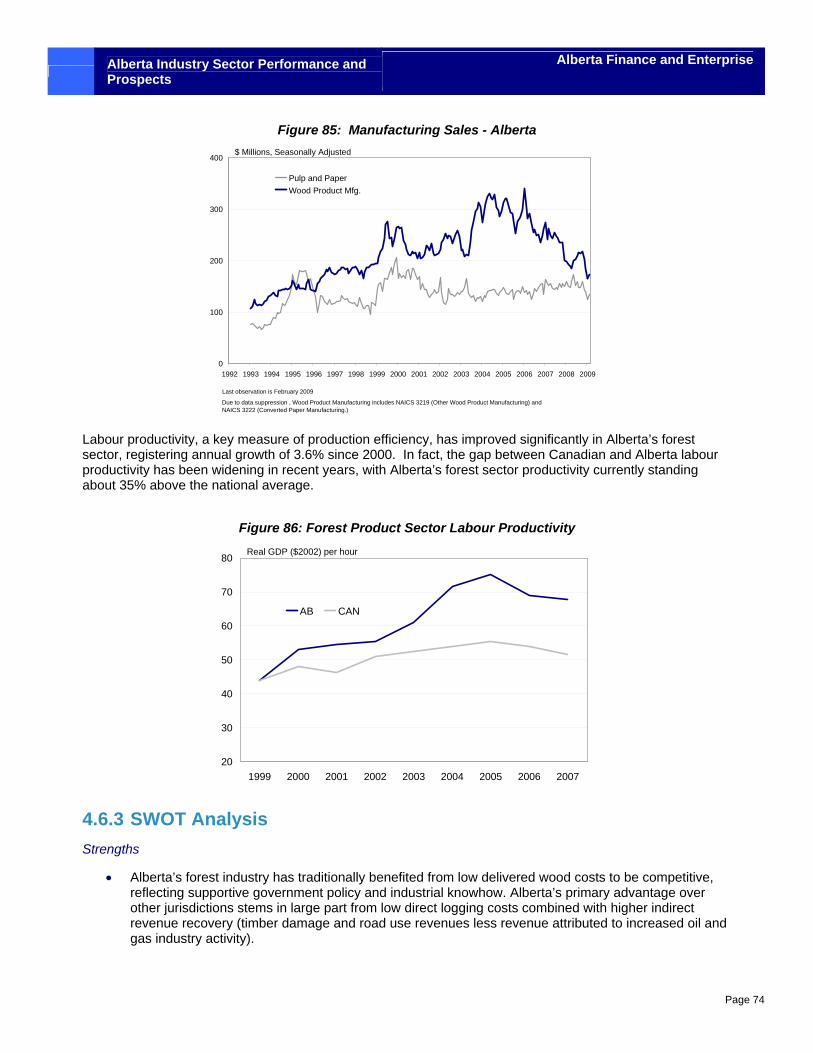
Alberta Industry Sector Performance and Prospects
Alberta Finance and Enterprise
Page 74
Figure 85: Manufacturing Sales - Alberta
0
100
200
300
400
1992 1993 1994 1995 1996 1997 1998 1999 2000 2001 2002 2003 2004 2005 2006 2007 2008 2009
Pulp and PaperWood Product Mfg.
Last observation is February 2009
$ Millions, Seasonally Adjusted
Due to data suppression , Wood Product Manufacturing includes NAICS 3219 (Other Wood Product Manufacturing) and NAICS 3222 (Converted Paper Manufacturing.)
Labour productivity, a key measure of production efficiency, has improved significantly in Alberta’s forest sector, registering annual growth of 3.6% since 2000. In fact, the gap between Canadian and Alberta labour productivity has been widening in recent years, with Alberta’s forest sector productivity currently standing about 35% above the national average.
Figure 86: Forest Product Sector Labour Productivity
20
30
40
50
60
70
80
1999 2000 2001 2002 2003 2004 2005 2006 2007
AB CAN
Real GDP ($2002) per hour
4.6.3 SWOT Analysis Strengths
• Alberta’s forest industry has traditionally benefited from low delivered wood costs to be competitive, reflecting supportive government policy and industrial knowhow. Alberta’s primary advantage over other jurisdictions stems in large part from low direct logging costs combined with higher indirect revenue recovery (timber damage and road use revenues less revenue attributed to increased oil and gas industry activity).
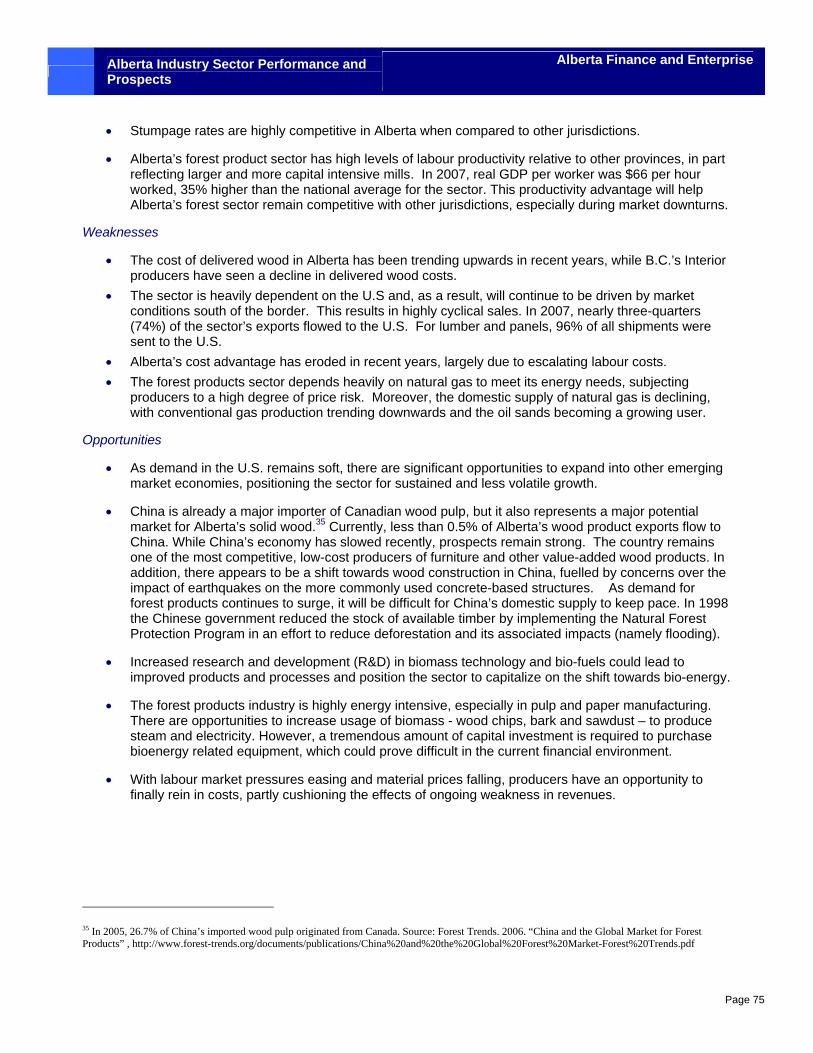
Alberta Industry Sector Performance and Prospects
Alberta Finance and Enterprise
Page 75
• Stumpage rates are highly competitive in Alberta when compared to other jurisdictions.
• Alberta’s forest product sector has high levels of labour productivity relative to other provinces, in part reflecting larger and more capital intensive mills. In 2007, real GDP per worker was $66 per hour worked, 35% higher than the national average for the sector. This productivity advantage will help Alberta’s forest sector remain competitive with other jurisdictions, especially during market downturns.
Weaknesses
• The cost of delivered wood in Alberta has been trending upwards in recent years, while B.C.’s Interior producers have seen a decline in delivered wood costs.
• The sector is heavily dependent on the U.S and, as a result, will continue to be driven by market conditions south of the border. This results in highly cyclical sales. In 2007, nearly three-quarters (74%) of the sector’s exports flowed to the U.S. For lumber and panels, 96% of all shipments were sent to the U.S.
• Alberta’s cost advantage has eroded in recent years, largely due to escalating labour costs. • The forest products sector depends heavily on natural gas to meet its energy needs, subjecting
producers to a high degree of price risk. Moreover, the domestic supply of natural gas is declining, with conventional gas production trending downwards and the oil sands becoming a growing user.
Opportunities
• As demand in the U.S. remains soft, there are significant opportunities to expand into other emerging market economies, positioning the sector for sustained and less volatile growth.
• China is already a major importer of Canadian wood pulp, but it also represents a major potential market for Alberta’s solid wood.35 Currently, less than 0.5% of Alberta’s wood product exports flow to China. While China’s economy has slowed recently, prospects remain strong. The country remains one of the most competitive, low-cost producers of furniture and other value-added wood products. In addition, there appears to be a shift towards wood construction in China, fuelled by concerns over the impact of earthquakes on the more commonly used concrete-based structures. As demand for forest products continues to surge, it will be difficult for China’s domestic supply to keep pace. In 1998 the Chinese government reduced the stock of available timber by implementing the Natural Forest Protection Program in an effort to reduce deforestation and its associated impacts (namely flooding).
• Increased research and development (R&D) in biomass technology and bio-fuels could lead to improved products and processes and position the sector to capitalize on the shift towards bio-energy.
• The forest products industry is highly energy intensive, especially in pulp and paper manufacturing. There are opportunities to increase usage of biomass - wood chips, bark and sawdust – to produce steam and electricity. However, a tremendous amount of capital investment is required to purchase bioenergy related equipment, which could prove difficult in the current financial environment.
• With labour market pressures easing and material prices falling, producers have an opportunity to finally rein in costs, partly cushioning the effects of ongoing weakness in revenues.
35 In 2005, 26.7% of China’s imported wood pulp originated from Canada. Source: Forest Trends. 2006. “China and the Global Market for Forest Products” , http://www.forest-trends.org/documents/publications/China%20and%20the%20Global%20Forest%20Market-Forest%20Trends.pdf
Alberta Industry Sector Performance and Prospects
Alberta Finance and Enterprise
Page 76
Threats
• Alberta’s competitive low-cost operating environment has enabled Alberta’s industry to develop and manage through the market cycle. However, Alberta’s low cost leadership strategy (i.e. becoming the lowest cost producer) does not provide much room to manoeuvre during the weak market conditions currently facing the industry. Government and industry will continue to bump up against trade and stewardship issues as they search for ways to trim costs significantly.
• High growth markets for pulp, namely in Asia, are increasingly being serviced by low cost producers located in China and Central and South America. This represents a long-term threat to Alberta’s pulp producers, which are higher cost and located further from these growth markets.
• With the supply of unsold homes remaining well above historic norms, weakness in the U.S. housing market is expected to continue over the near term. Industry will continue to struggle with weak demand for wood products south of the border and sluggish prices.
• The mountain pine beetle infestation has been on the rise in Alberta’s forests since 2000, reducing the harvest available for the forest product sector in the long-term. According to the Alberta Forest Product Association, about three million trees have been infected in Alberta. The latest update from the Alberta Government reads:
“Mountain pine beetles continue to threaten Alberta’s pine forest. Results of aerial surveys of Alberta's pine forests in 2008 indicate the number of beetle-attacked trees has declined in the Leading Edge Zone around Grande Cache, Slave Lake and Whitecourt in areas where the Department focused beetle control efforts last year. However, the number of attacked trees continues to increase in the south.” Source: Alberta Sustainable Resource Development36
36 http://www.srd.gov.ab.ca/forests/health/conditionsmaps/mountainpinebeetle.aspx
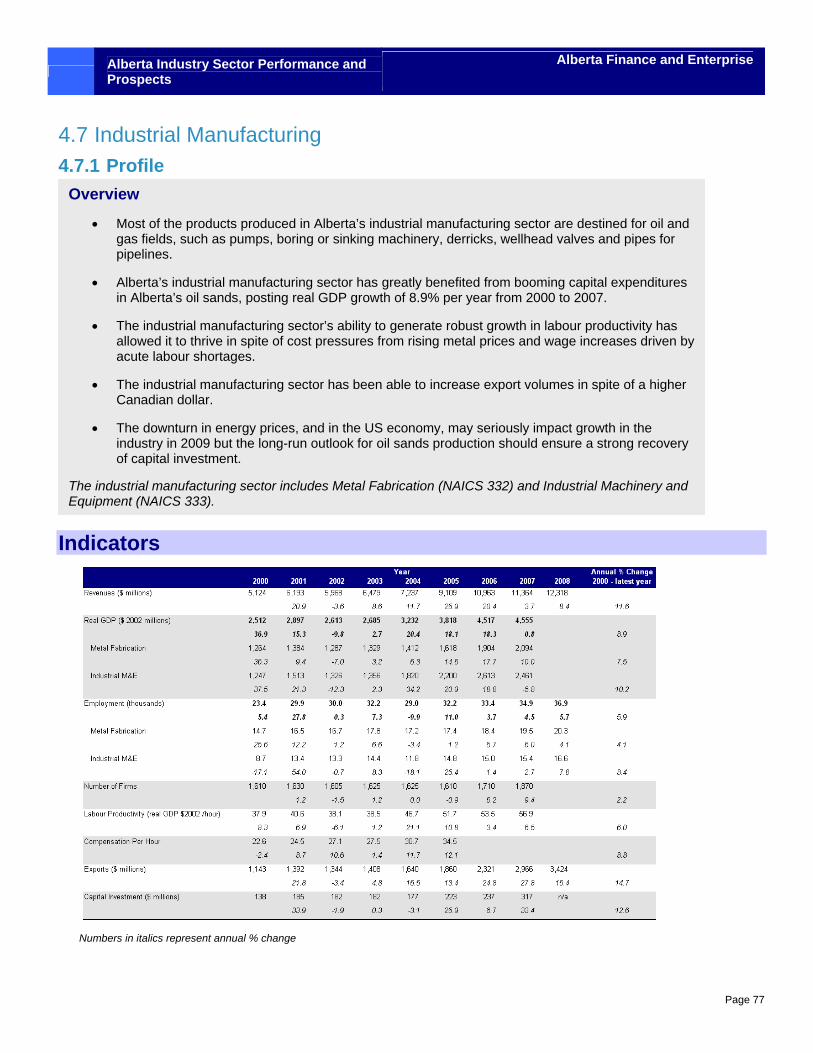
Alberta Industry Sector Performance and Prospects
Alberta Finance and Enterprise
Page 77
4.7 Industrial Manufacturing 4.7.1 Profile
Indicators
Numbers in italics represent annual % change
Overview
• Most of the products produced in Alberta’s industrial manufacturing sector are destined for oil and gas fields, such as pumps, boring or sinking machinery, derricks, wellhead valves and pipes for pipelines.
• Alberta’s industrial manufacturing sector has greatly benefited from booming capital expenditures in Alberta’s oil sands, posting real GDP growth of 8.9% per year from 2000 to 2007.
• The industrial manufacturing sector’s ability to generate robust growth in labour productivity has allowed it to thrive in spite of cost pressures from rising metal prices and wage increases driven by acute labour shortages.
• The industrial manufacturing sector has been able to increase export volumes in spite of a higher Canadian dollar.
• The downturn in energy prices, and in the US economy, may seriously impact growth in the industry in 2009 but the long-run outlook for oil sands production should ensure a strong recovery of capital investment.
The industrial manufacturing sector includes Metal Fabrication (NAICS 332) and Industrial Machinery and Equipment (NAICS 333).
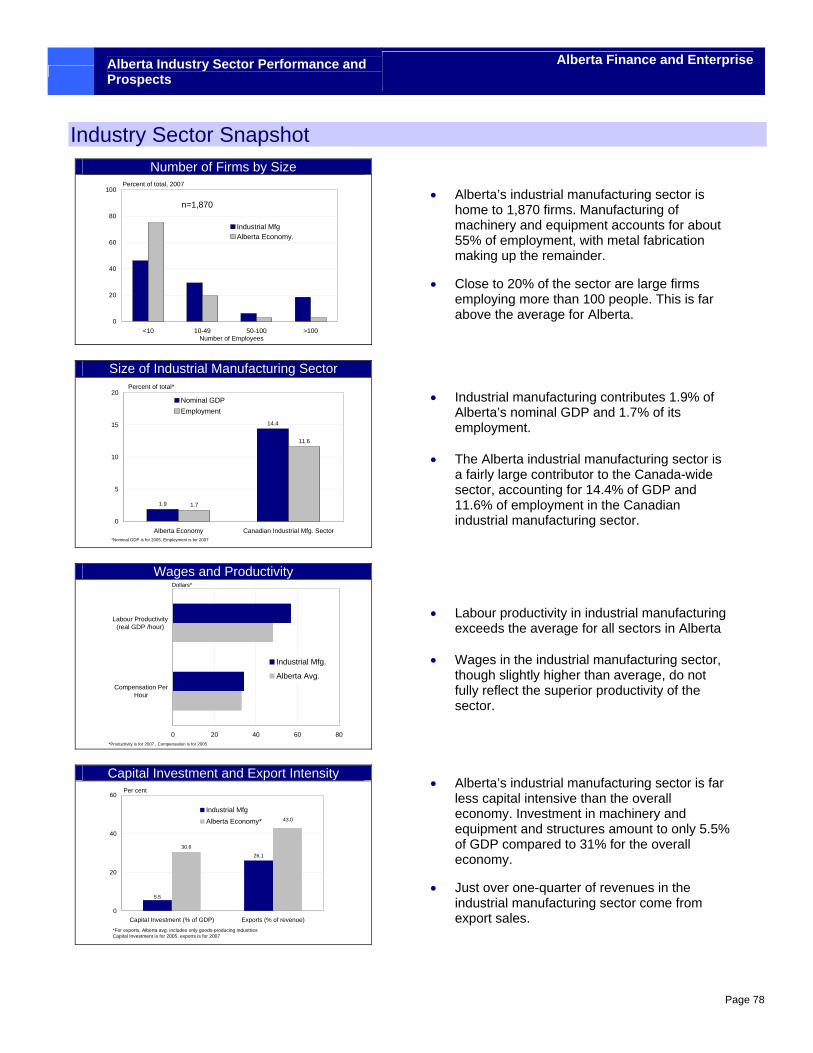
Alberta Industry Sector Performance and Prospects
Alberta Finance and Enterprise
Page 78
Industry Sector Snapshot Number of Firms by Size
0
20
40
60
80
100
<10 10-49 50-100 >100
Industrial MfgAlberta Economy.
Percent of total, 2007
n=1,870
Number of Employees
Size of Industrial Manufacturing Sector
1.9
14.4
1.7
11.6
0
5
10
15
20
Alberta Economy Canadian Industrial Mfg. Sector
Nominal GDPEmployment
Percent of total*
*Nominal GDP is for 2005, Employment is for 2007
Wages and Productivity
0 20 40 60 80
Compensation PerHour
Labour Productivity(real GDP /hour)
Industrial Mfg.
Alberta Avg.
Dollars*
*Productivity is for 2007 , Compensation is for 2005
Capital Investment and Export Intensity
26.1
30.6
5.5
43.0
0
20
40
60
Capital Investment (% of GDP) Exports (% of revenue)
Industrial MfgAlberta Economy*
Per cent
*For exports, Alberta avg. includes only goods-producing industries Capital Investment is for 2005, exports is for 2007
• Alberta’s industrial manufacturing sector is home to 1,870 firms. Manufacturing of machinery and equipment accounts for about 55% of employment, with metal fabrication making up the remainder.
• Close to 20% of the sector are large firms employing more than 100 people. This is far above the average for Alberta.
• Industrial manufacturing contributes 1.9% of Alberta’s nominal GDP and 1.7% of its employment.
• The Alberta industrial manufacturing sector is
a fairly large contributor to the Canada-wide sector, accounting for 14.4% of GDP and 11.6% of employment in the Canadian industrial manufacturing sector.
• Labour productivity in industrial manufacturing exceeds the average for all sectors in Alberta
• Wages in the industrial manufacturing sector,
though slightly higher than average, do not fully reflect the superior productivity of the sector.
• Alberta’s industrial manufacturing sector is far
less capital intensive than the overall economy. Investment in machinery and equipment and structures amount to only 5.5% of GDP compared to 31% for the overall economy.
• Just over one-quarter of revenues in the industrial manufacturing sector come from export sales.
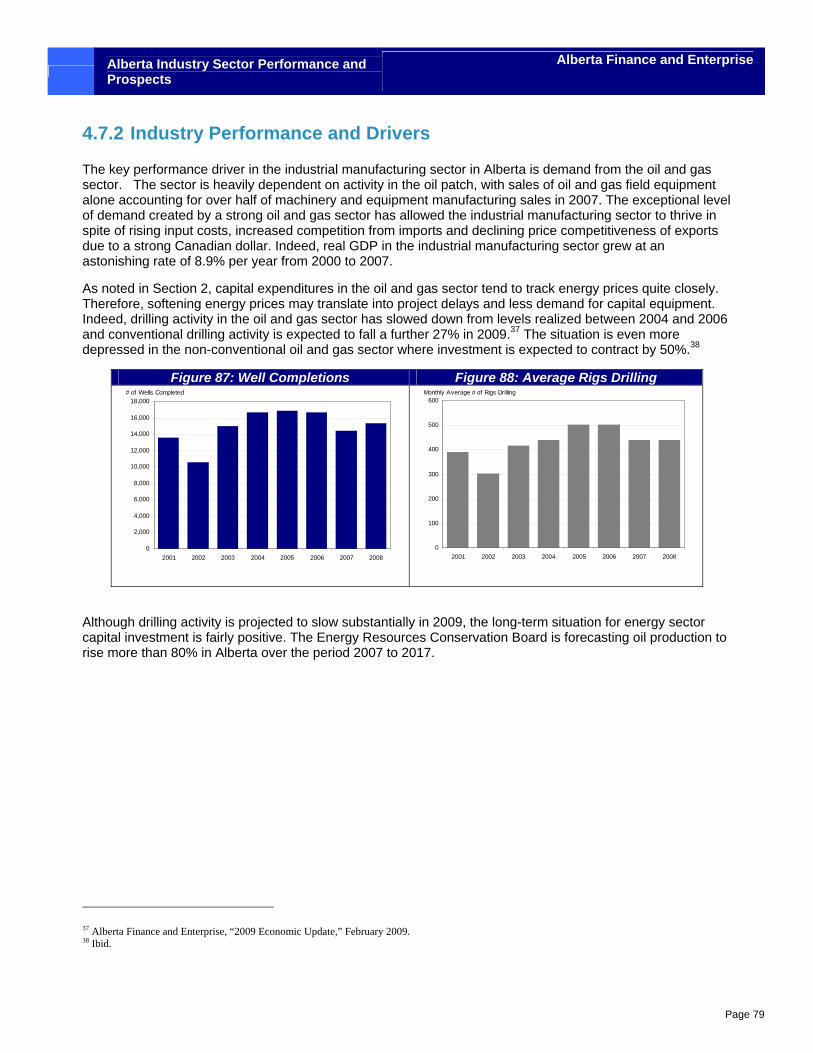
Alberta Industry Sector Performance and Prospects
Alberta Finance and Enterprise
Page 79
4.7.2 Industry Performance and Drivers
The key performance driver in the industrial manufacturing sector in Alberta is demand from the oil and gas sector. The sector is heavily dependent on activity in the oil patch, with sales of oil and gas field equipment alone accounting for over half of machinery and equipment manufacturing sales in 2007. The exceptional level of demand created by a strong oil and gas sector has allowed the industrial manufacturing sector to thrive in spite of rising input costs, increased competition from imports and declining price competitiveness of exports due to a strong Canadian dollar. Indeed, real GDP in the industrial manufacturing sector grew at an astonishing rate of 8.9% per year from 2000 to 2007.
As noted in Section 2, capital expenditures in the oil and gas sector tend to track energy prices quite closely. Therefore, softening energy prices may translate into project delays and less demand for capital equipment. Indeed, drilling activity in the oil and gas sector has slowed down from levels realized between 2004 and 2006 and conventional drilling activity is expected to fall a further 27% in 2009.37 The situation is even more depressed in the non-conventional oil and gas sector where investment is expected to contract by 50%.38
Figure 87: Well Completions Figure 88: Average Rigs Drilling
0
2,000
4,000
6,000
8,000
10,000
12,000
14,000
16,000
18,000
2001 2002 2003 2004 2005 2006 2007 2008
# of Wells Completed
0
100
200
300
400
500
600
2001 2002 2003 2004 2005 2006 2007 2008
Monthly Average # of Rigs Drilling
Although drilling activity is projected to slow substantially in 2009, the long-term situation for energy sector capital investment is fairly positive. The Energy Resources Conservation Board is forecasting oil production to rise more than 80% in Alberta over the period 2007 to 2017.
37 Alberta Finance and Enterprise, “2009 Economic Update,” February 2009. 38 Ibid.
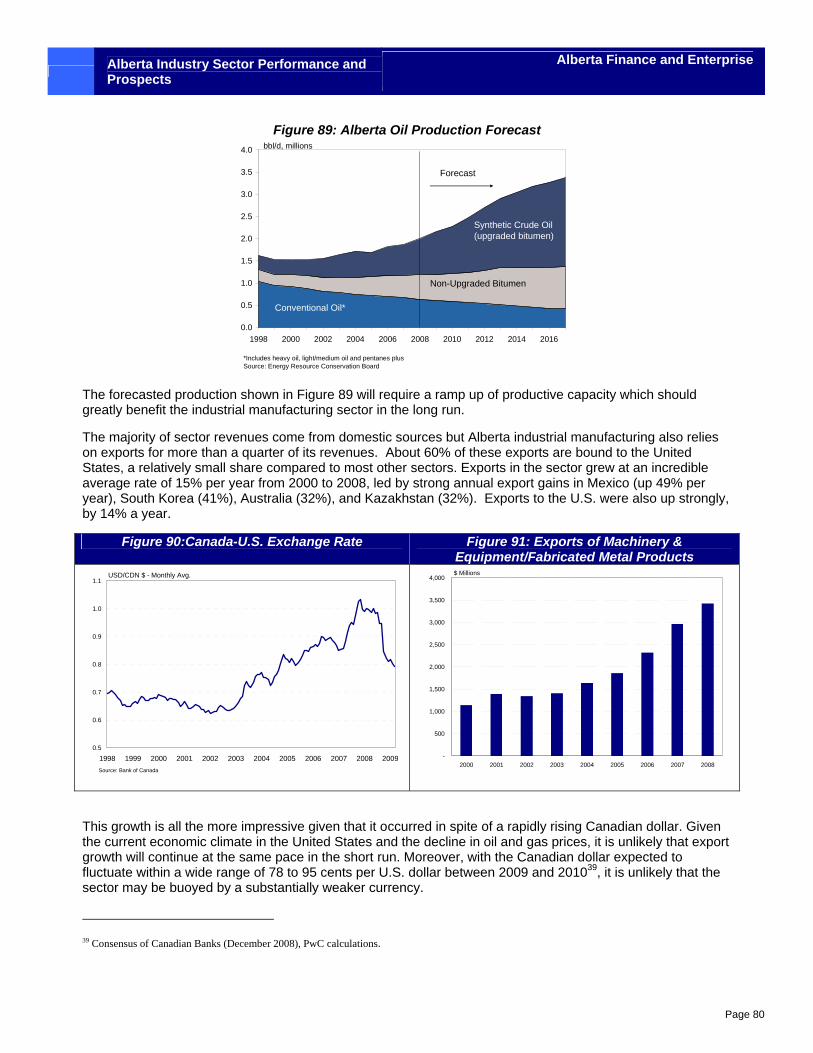
Alberta Industry Sector Performance and Prospects
Alberta Finance and Enterprise
Page 80
Figure 89: Alberta Oil Production Forecast
0.0
0.5
1.0
1.5
2.0
2.5
3.0
3.5
4.0
1998 2000 2002 2004 2006 2008 2010 2012 2014 2016
bbl/d, millions
*Includes heavy oil, light/medium oil and pentanes plusSource: Energy Resource Conservation Board
Non-Upgraded Bitumen
Synthetic Crude Oil (upgraded bitumen)
Conventional Oil*
Forecast
The forecasted production shown in Figure 89 will require a ramp up of productive capacity which should greatly benefit the industrial manufacturing sector in the long run.
The majority of sector revenues come from domestic sources but Alberta industrial manufacturing also relies on exports for more than a quarter of its revenues. About 60% of these exports are bound to the United States, a relatively small share compared to most other sectors. Exports in the sector grew at an incredible average rate of 15% per year from 2000 to 2008, led by strong annual export gains in Mexico (up 49% per year), South Korea (41%), Australia (32%), and Kazakhstan (32%). Exports to the U.S. were also up strongly, by 14% a year.
Figure 90:Canada-U.S. Exchange Rate Figure 91: Exports of Machinery & Equipment/Fabricated Metal Products
0.5
0.6
0.7
0.8
0.9
1.0
1.1
1998 1999 2000 2001 2002 2003 2004 2005 2006 2007 2008 2009
USD/CDN $ - Monthly Avg.
Source: Bank of Canada -
500
1,000
1,500
2,000
2,500
3,000
3,500
4,000
2000 2001 2002 2003 2004 2005 2006 2007 2008
$ Millions
This growth is all the more impressive given that it occurred in spite of a rapidly rising Canadian dollar. Given the current economic climate in the United States and the decline in oil and gas prices, it is unlikely that export growth will continue at the same pace in the short run. Moreover, with the Canadian dollar expected to fluctuate within a wide range of 78 to 95 cents per U.S. dollar between 2009 and 201039, it is unlikely that the sector may be buoyed by a substantially weaker currency.
39 Consensus of Canadian Banks (December 2008), PwC calculations.
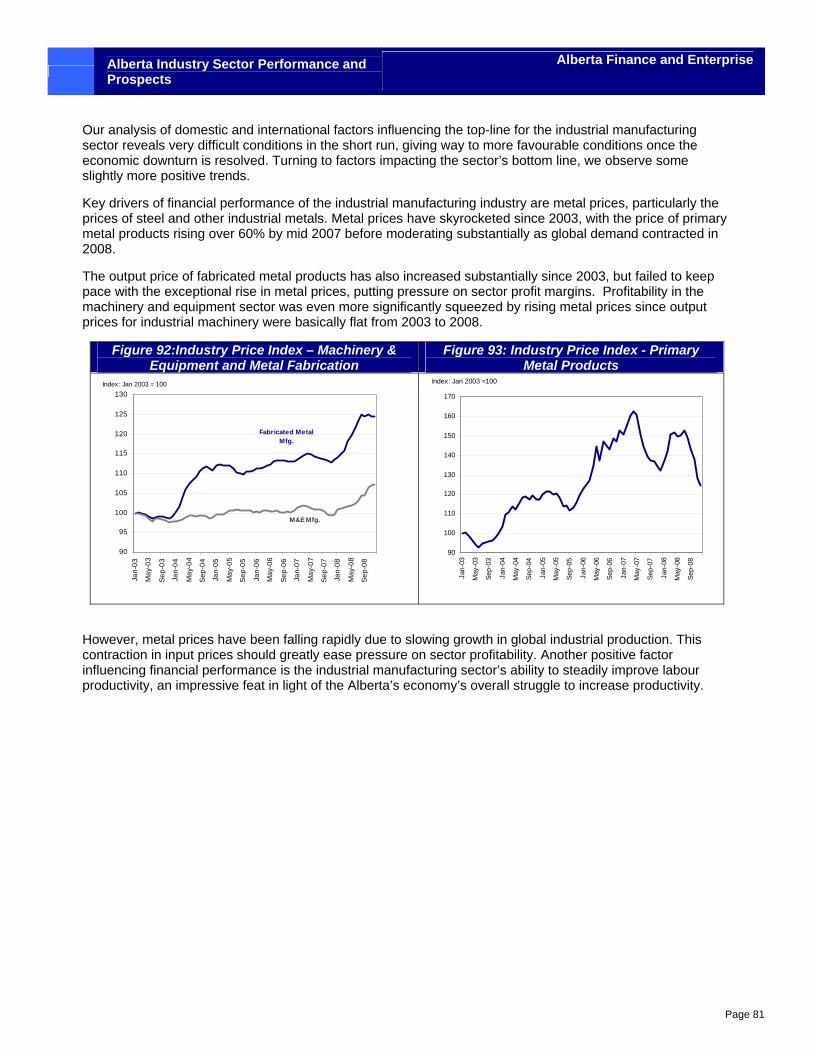
Alberta Industry Sector Performance and Prospects
Alberta Finance and Enterprise
Page 81
Our analysis of domestic and international factors influencing the top-line for the industrial manufacturing sector reveals very difficult conditions in the short run, giving way to more favourable conditions once the economic downturn is resolved. Turning to factors impacting the sector’s bottom line, we observe some slightly more positive trends.
Key drivers of financial performance of the industrial manufacturing industry are metal prices, particularly the prices of steel and other industrial metals. Metal prices have skyrocketed since 2003, with the price of primary metal products rising over 60% by mid 2007 before moderating substantially as global demand contracted in 2008.
The output price of fabricated metal products has also increased substantially since 2003, but failed to keep pace with the exceptional rise in metal prices, putting pressure on sector profit margins. Profitability in the machinery and equipment sector was even more significantly squeezed by rising metal prices since output prices for industrial machinery were basically flat from 2003 to 2008.
Figure 92:Industry Price Index – Machinery & Equipment and Metal Fabrication
Figure 93: Industry Price Index - Primary Metal Products
90
95
100
105
110
115
120
125
130
Jan-
03
May
-03
Sep-
03
Jan-
04
May
-04
Sep-
04
Jan-
05
May
-05
Sep-
05
Jan-
06
May
-06
Sep-
06
Jan-
07
May
-07
Sep-
07
Jan-
08
May
-08
Sep-
08
Fabricated Metal Mfg.
M&E Mfg.
Index: Jan 2003 = 100
90
100
110
120
130
140
150
160
170
Jan-
03
May
-03
Sep-
03
Jan-
04
May
-04
Sep-
04
Jan-
05
May
-05
Sep-
05
Jan-
06
May
-06
Sep-
06
Jan-
07
May
-07
Sep-
07
Jan-
08
May
-08
Sep-
08
Index: Jan 2003 =100
However, metal prices have been falling rapidly due to slowing growth in global industrial production. This contraction in input prices should greatly ease pressure on sector profitability. Another positive factor influencing financial performance is the industrial manufacturing sector’s ability to steadily improve labour productivity, an impressive feat in light of the Alberta’s economy’s overall struggle to increase productivity.
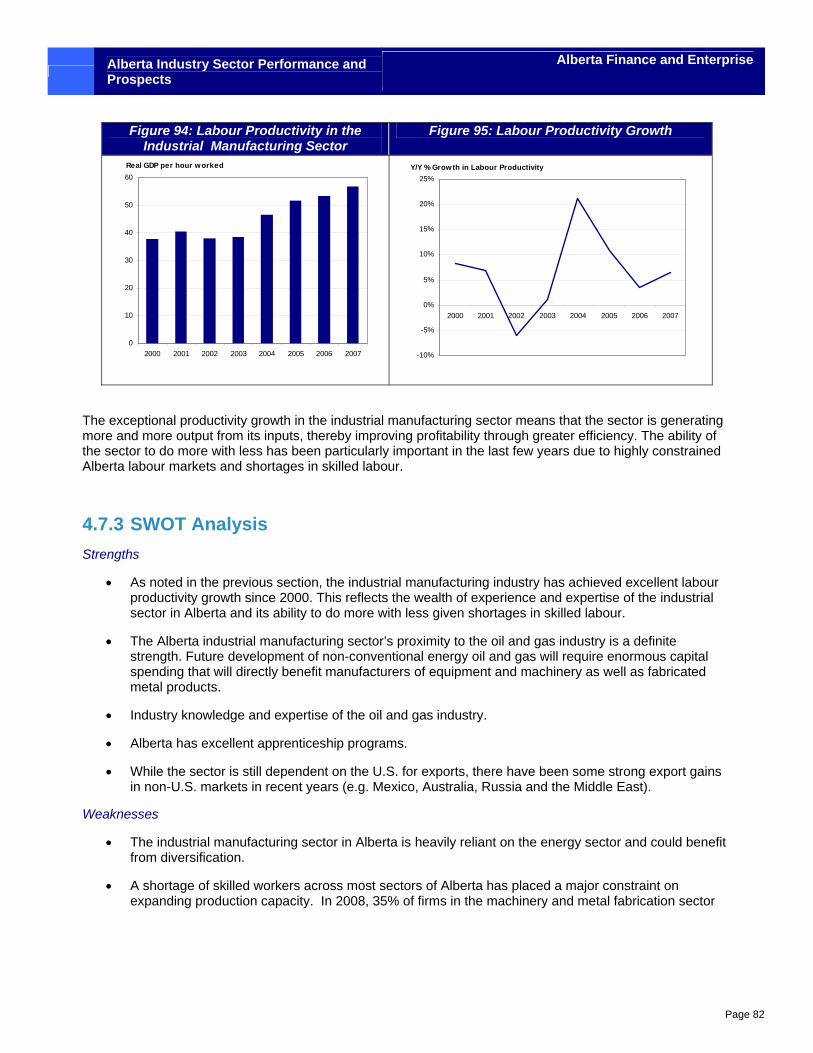
Alberta Industry Sector Performance and Prospects
Alberta Finance and Enterprise
Page 82
Figure 94: Labour Productivity in the Industrial Manufacturing Sector
Figure 95: Labour Productivity Growth
0
10
20
30
40
50
60
2000 2001 2002 2003 2004 2005 2006 2007
Real GDP per hour worked
-10%
-5%
0%
5%
10%
15%
20%
25%
2000 2001 2002 2003 2004 2005 2006 2007
Y/Y % Growth in Labour Productivity
The exceptional productivity growth in the industrial manufacturing sector means that the sector is generating more and more output from its inputs, thereby improving profitability through greater efficiency. The ability of the sector to do more with less has been particularly important in the last few years due to highly constrained Alberta labour markets and shortages in skilled labour.
4.7.3 SWOT Analysis Strengths
• As noted in the previous section, the industrial manufacturing industry has achieved excellent labour productivity growth since 2000. This reflects the wealth of experience and expertise of the industrial sector in Alberta and its ability to do more with less given shortages in skilled labour.
• The Alberta industrial manufacturing sector’s proximity to the oil and gas industry is a definite strength. Future development of non-conventional energy oil and gas will require enormous capital spending that will directly benefit manufacturers of equipment and machinery as well as fabricated metal products.
• Industry knowledge and expertise of the oil and gas industry.
• Alberta has excellent apprenticeship programs.
• While the sector is still dependent on the U.S. for exports, there have been some strong export gains in non-U.S. markets in recent years (e.g. Mexico, Australia, Russia and the Middle East).
Weaknesses
• The industrial manufacturing sector in Alberta is heavily reliant on the energy sector and could benefit from diversification.
• A shortage of skilled workers across most sectors of Alberta has placed a major constraint on expanding production capacity. In 2008, 35% of firms in the machinery and metal fabrication sector
Alberta Industry Sector Performance and Prospects
Alberta Finance and Enterprise
Page 83
identified lack of skilled workers as a weakness.40 For many companies, this has led to forgone business opportunities.
• For companies that export, transportation costs can be high due to Alberta’s land-locked and relatively isolated location.
• Industrial manufacturers outside the oil and gas sector are at a competitive disadvantage, due to the cost pressures created by the energy boom.
Opportunities
• Although the oil and gas sector weakened substantially towards the end of 2008, over the long run, global energy market drivers, such as robust emerging market industrialization, will lead to higher energy prices and ramped up oil sands production, including investments in upgraders.
• Diversification of the customer base domestically, developing products for deployment in non-energy sectors (or in the alternative energy sector) or in products that can be sold into the energy sector once major projects are completed.
• Diversification of customer base internationally with less reliance on the United States.
• Improving productivity through worker training and ongoing investments in new technologies will ensure the industry remains globally competitive in the long-run and help the sector weather fluctuations in market conditions (e.g. oil prices).
Threats
• As observed in the past year, energy prices can be extremely volatile. This volatility, combined with a lack of diversification exposes the industrial manufacturing sector to substantial cyclical fluctuations and sector specific policy shocks like increased royalties and stricter environmental regulations.
• In the short-run, a decline in oil and gas exploration and development activity will hurt industry revenues, which combined with ongoing labour cost pressures, will likely put downward pressure on profitability.
40GTS Group.2008.”Alberta Metal Fabrication and Machinery Manufacturing: Sector Overview”.
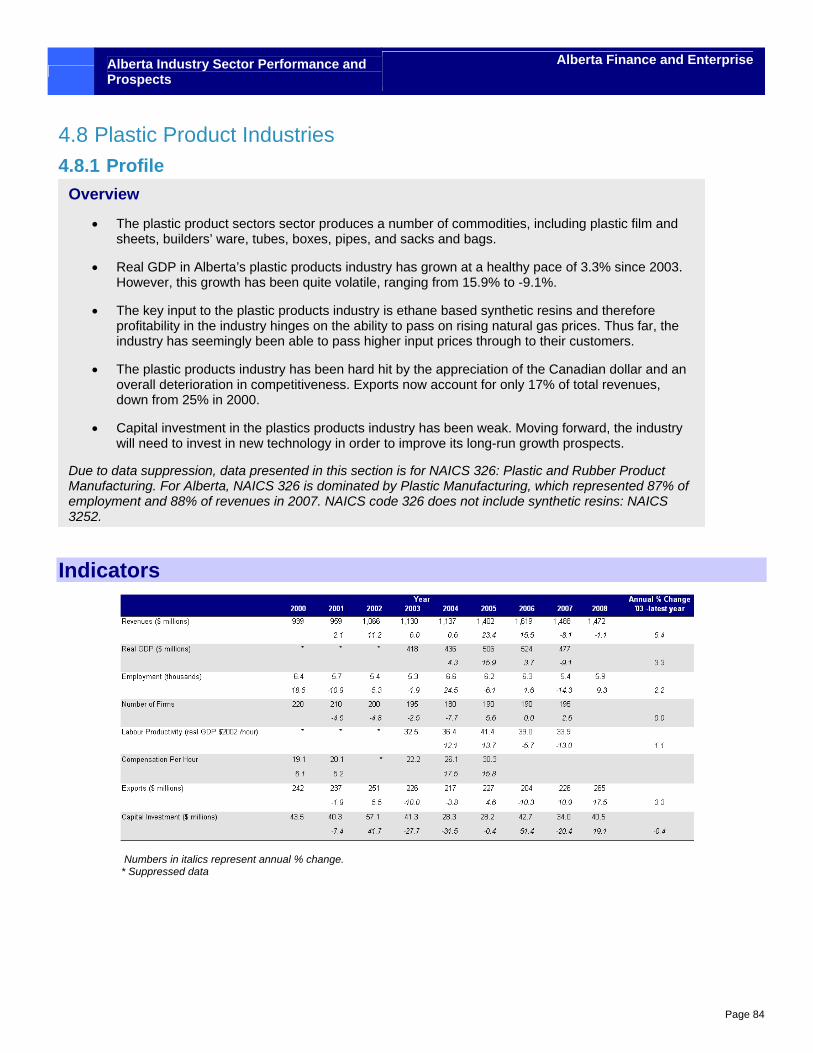
Alberta Industry Sector Performance and Prospects
Alberta Finance and Enterprise
Page 84
4.8 Plastic Product Industries 4.8.1 Profile
Indicators
Numbers in italics represent annual % change. * Suppressed data
Overview
• The plastic product sectors sector produces a number of commodities, including plastic film and sheets, builders’ ware, tubes, boxes, pipes, and sacks and bags.
• Real GDP in Alberta’s plastic products industry has grown at a healthy pace of 3.3% since 2003. However, this growth has been quite volatile, ranging from 15.9% to -9.1%.
• The key input to the plastic products industry is ethane based synthetic resins and therefore profitability in the industry hinges on the ability to pass on rising natural gas prices. Thus far, the industry has seemingly been able to pass higher input prices through to their customers.
• The plastic products industry has been hard hit by the appreciation of the Canadian dollar and an overall deterioration in competitiveness. Exports now account for only 17% of total revenues, down from 25% in 2000.
• Capital investment in the plastics products industry has been weak. Moving forward, the industry will need to invest in new technology in order to improve its long-run growth prospects.
Due to data suppression, data presented in this section is for NAICS 326: Plastic and Rubber Product Manufacturing. For Alberta, NAICS 326 is dominated by Plastic Manufacturing, which represented 87% of employment and 88% of revenues in 2007. NAICS code 326 does not include synthetic resins: NAICS 3252.
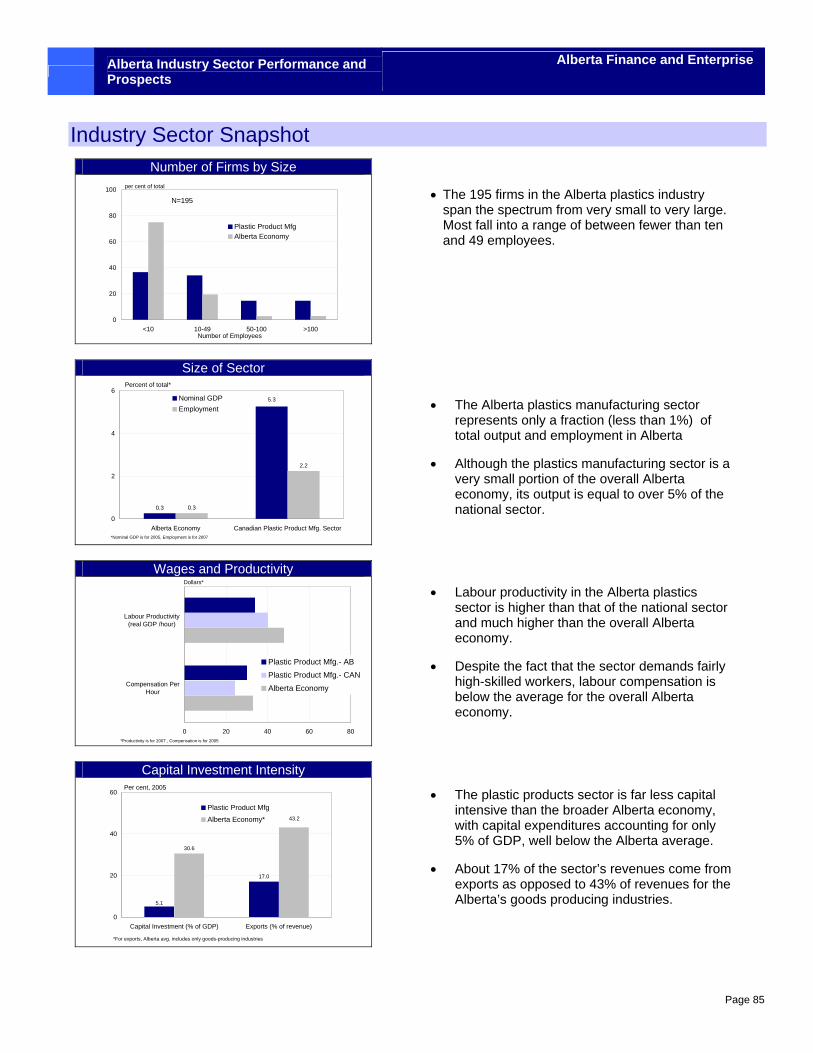
Alberta Industry Sector Performance and Prospects
Alberta Finance and Enterprise
Page 85
Industry Sector Snapshot Number of Firms by Size
0
20
40
60
80
100
<10 10-49 50-100 >100
Plastic Product MfgAlberta Economy
per cent of total
Number of Employees
N=195
Size of Sector
0.3 0.3
2.2
5.3
0
2
4
6
Alberta Economy Canadian Plastic Product Mfg. Sector
Nominal GDPEmployment
Percent of total*
*Nominal GDP is for 2005, Employment is for 2007
Wages and Productivity
0 20 40 60 80
Compensation PerHour
Labour Productivity(real GDP /hour)
Plastic Product Mfg.- ABPlastic Product Mfg.- CAN
Alberta Economy
Dollars*
*Productivity is for 2007 , Compensation is for 2005
Capital Investment Intensity
17.0
30.6
5.1
43.2
0
20
40
60
Capital Investment (% of GDP) Exports (% of revenue)
Plastic Product MfgAlberta Economy*
Per cent, 2005
*For exports, Alberta avg. includes only goods-producing industries
• The 195 firms in the Alberta plastics industry span the spectrum from very small to very large. Most fall into a range of between fewer than ten and 49 employees.
• The Alberta plastics manufacturing sector represents only a fraction (less than 1%) of total output and employment in Alberta
• Although the plastics manufacturing sector is a very small portion of the overall Alberta economy, its output is equal to over 5% of the national sector.
• Labour productivity in the Alberta plastics sector is higher than that of the national sector and much higher than the overall Alberta economy.
• Despite the fact that the sector demands fairly high-skilled workers, labour compensation is below the average for the overall Alberta economy.
• The plastic products sector is far less capital intensive than the broader Alberta economy, with capital expenditures accounting for only 5% of GDP, well below the Alberta average.
• About 17% of the sector’s revenues come from exports as opposed to 43% of revenues for the Alberta’s goods producing industries.
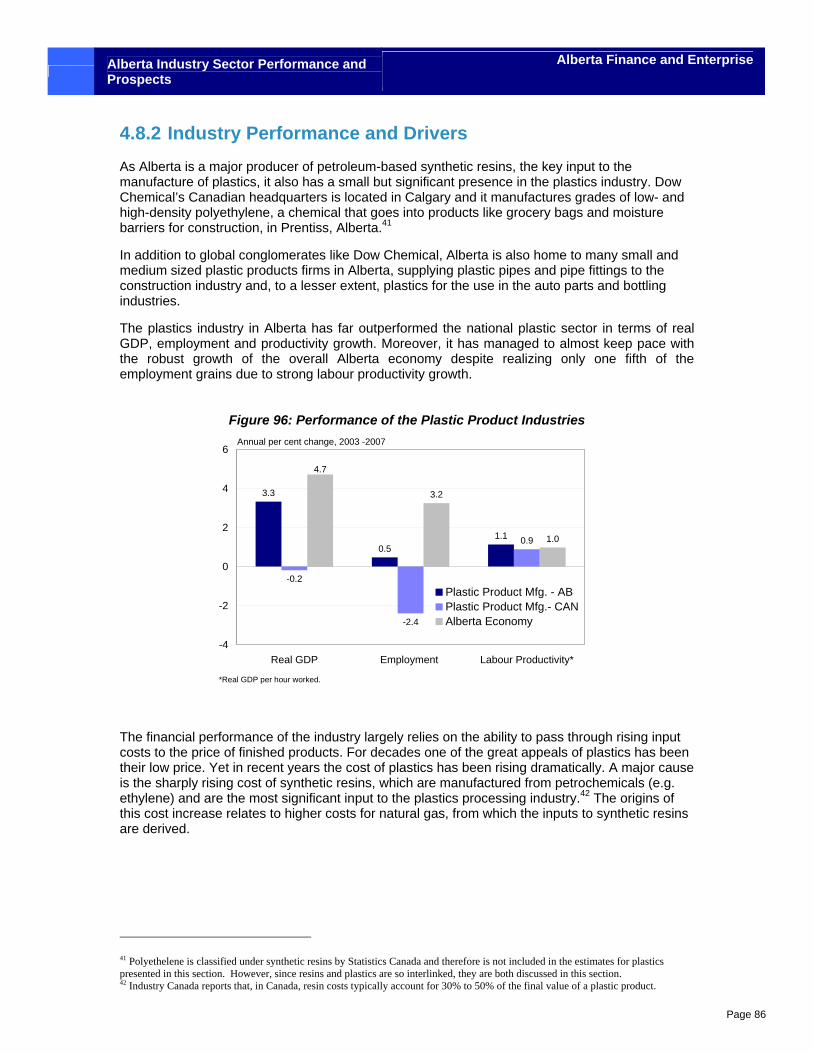
Alberta Industry Sector Performance and Prospects
Alberta Finance and Enterprise
Page 86
4.8.2 Industry Performance and Drivers As Alberta is a major producer of petroleum-based synthetic resins, the key input to the manufacture of plastics, it also has a small but significant presence in the plastics industry. Dow Chemical’s Canadian headquarters is located in Calgary and it manufactures grades of low- and high-density polyethylene, a chemical that goes into products like grocery bags and moisture barriers for construction, in Prentiss, Alberta.41
In addition to global conglomerates like Dow Chemical, Alberta is also home to many small and medium sized plastic products firms in Alberta, supplying plastic pipes and pipe fittings to the construction industry and, to a lesser extent, plastics for the use in the auto parts and bottling industries.
The plastics industry in Alberta has far outperformed the national plastic sector in terms of real GDP, employment and productivity growth. Moreover, it has managed to almost keep pace with the robust growth of the overall Alberta economy despite realizing only one fifth of the employment grains due to strong labour productivity growth.
Figure 96: Performance of the Plastic Product Industries
3.3
0.51.1
-0.2
-2.4
0.9
3.2
1.0
4.7
-4
-2
0
2
4
6
Real GDP Employment Labour Productivity*
Plastic Product Mfg. - ABPlastic Product Mfg.- CANAlberta Economy
Annual per cent change, 2003 -2007
*Real GDP per hour worked.
The financial performance of the industry largely relies on the ability to pass through rising input costs to the price of finished products. For decades one of the great appeals of plastics has been their low price. Yet in recent years the cost of plastics has been rising dramatically. A major cause is the sharply rising cost of synthetic resins, which are manufactured from petrochemicals (e.g. ethylene) and are the most significant input to the plastics processing industry.42 The origins of this cost increase relates to higher costs for natural gas, from which the inputs to synthetic resins are derived.
41 Polyethelene is classified under synthetic resins by Statistics Canada and therefore is not included in the estimates for plastics presented in this section. However, since resins and plastics are so interlinked, they are both discussed in this section. 42 Industry Canada reports that, in Canada, resin costs typically account for 30% to 50% of the final value of a plastic product.
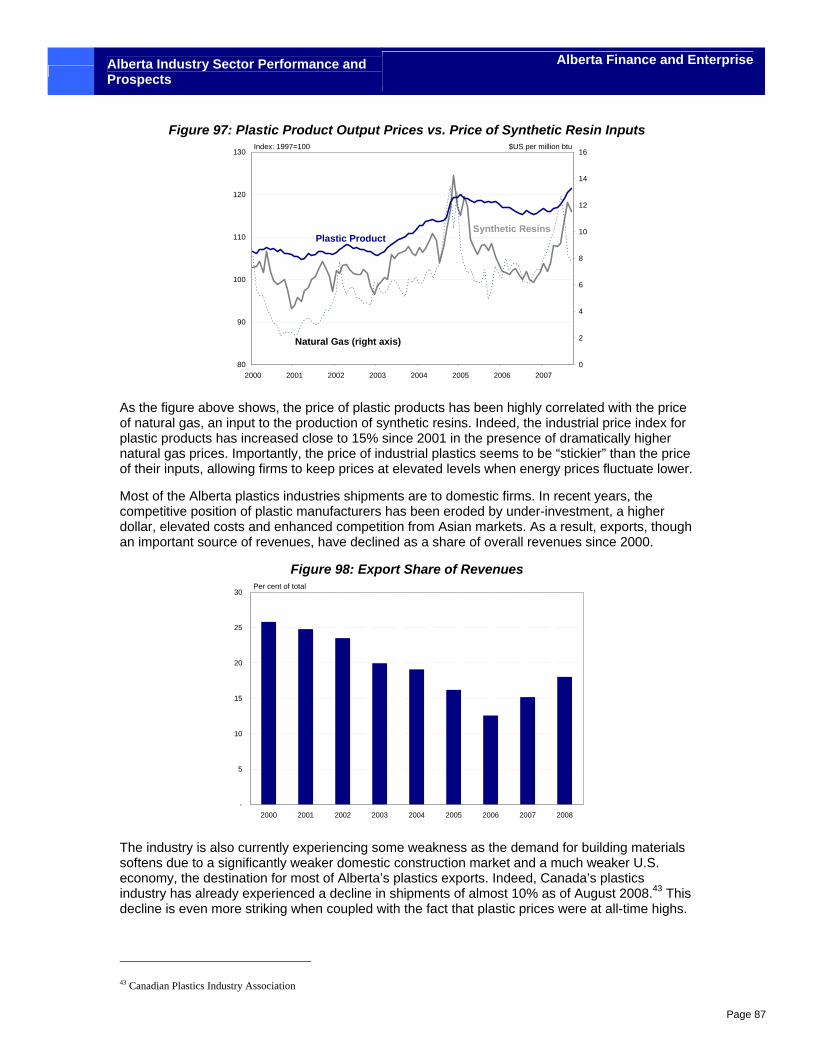
Alberta Industry Sector Performance and Prospects
Alberta Finance and Enterprise
Page 87
Figure 97: Plastic Product Output Prices vs. Price of Synthetic Resin Inputs
80
90
100
110
120
130
2000 2001 2002 2003 2004 2005 2006 20070
2
4
6
8
10
12
14
16
Plastic Product Synthetic Resins
Index: 1997=100
Natural Gas (right axis)
$US per million btu
As the figure above shows, the price of plastic products has been highly correlated with the price of natural gas, an input to the production of synthetic resins. Indeed, the industrial price index for plastic products has increased close to 15% since 2001 in the presence of dramatically higher natural gas prices. Importantly, the price of industrial plastics seems to be “stickier” than the price of their inputs, allowing firms to keep prices at elevated levels when energy prices fluctuate lower.
Most of the Alberta plastics industries shipments are to domestic firms. In recent years, the competitive position of plastic manufacturers has been eroded by under-investment, a higher dollar, elevated costs and enhanced competition from Asian markets. As a result, exports, though an important source of revenues, have declined as a share of overall revenues since 2000.
Figure 98: Export Share of Revenues
-
5
10
15
20
25
30
2000 2001 2002 2003 2004 2005 2006 2007 2008
Per cent of total
The industry is also currently experiencing some weakness as the demand for building materials softens due to a significantly weaker domestic construction market and a much weaker U.S. economy, the destination for most of Alberta’s plastics exports. Indeed, Canada’s plastics industry has already experienced a decline in shipments of almost 10% as of August 2008.43 This decline is even more striking when coupled with the fact that plastic prices were at all-time highs.
43 Canadian Plastics Industry Association
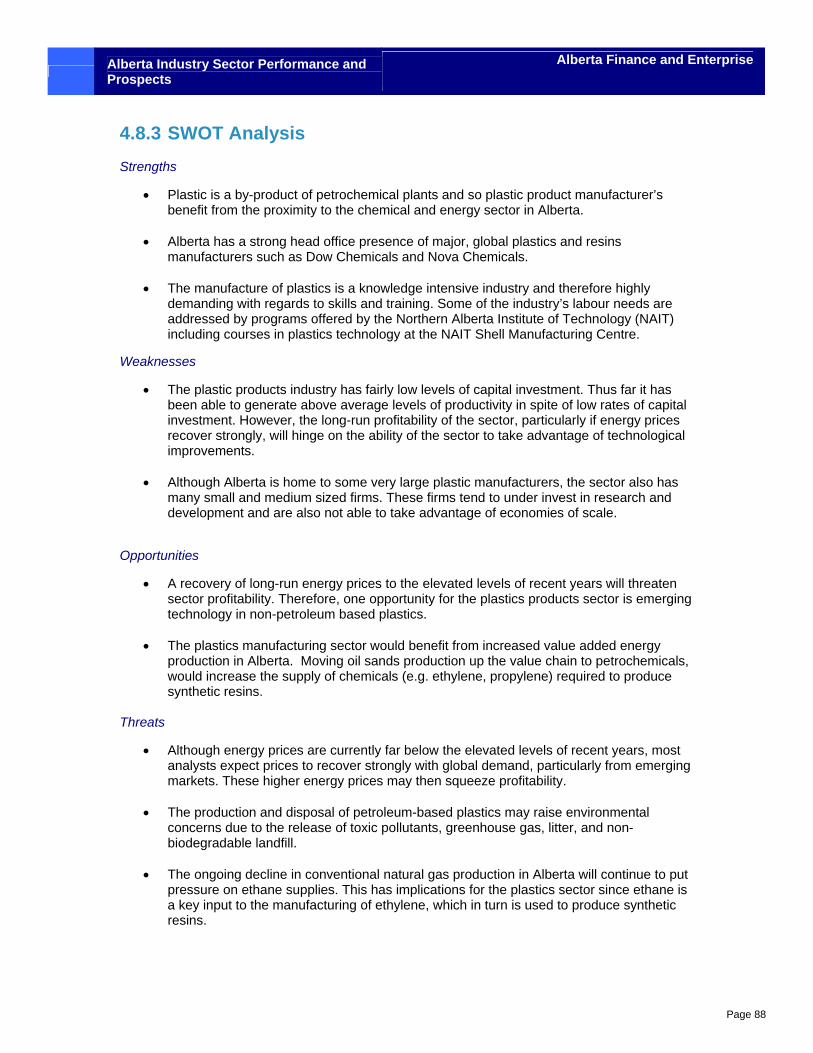
Alberta Industry Sector Performance and Prospects
Alberta Finance and Enterprise
Page 88
4.8.3 SWOT Analysis Strengths
• Plastic is a by-product of petrochemical plants and so plastic product manufacturer’s benefit from the proximity to the chemical and energy sector in Alberta.
• Alberta has a strong head office presence of major, global plastics and resins
manufacturers such as Dow Chemicals and Nova Chemicals.
• The manufacture of plastics is a knowledge intensive industry and therefore highly demanding with regards to skills and training. Some of the industry’s labour needs are addressed by programs offered by the Northern Alberta Institute of Technology (NAIT) including courses in plastics technology at the NAIT Shell Manufacturing Centre.
Weaknesses
• The plastic products industry has fairly low levels of capital investment. Thus far it has been able to generate above average levels of productivity in spite of low rates of capital investment. However, the long-run profitability of the sector, particularly if energy prices recover strongly, will hinge on the ability of the sector to take advantage of technological improvements.
• Although Alberta is home to some very large plastic manufacturers, the sector also has
many small and medium sized firms. These firms tend to under invest in research and development and are also not able to take advantage of economies of scale.
Opportunities
• A recovery of long-run energy prices to the elevated levels of recent years will threaten sector profitability. Therefore, one opportunity for the plastics products sector is emerging technology in non-petroleum based plastics.
• The plastics manufacturing sector would benefit from increased value added energy
production in Alberta. Moving oil sands production up the value chain to petrochemicals, would increase the supply of chemicals (e.g. ethylene, propylene) required to produce synthetic resins.
Threats
• Although energy prices are currently far below the elevated levels of recent years, most analysts expect prices to recover strongly with global demand, particularly from emerging markets. These higher energy prices may then squeeze profitability.
• The production and disposal of petroleum-based plastics may raise environmental
concerns due to the release of toxic pollutants, greenhouse gas, litter, and non-biodegradable landfill.
• The ongoing decline in conventional natural gas production in Alberta will continue to put
pressure on ethane supplies. This has implications for the plastics sector since ethane is a key input to the manufacturing of ethylene, which in turn is used to produce synthetic resins.
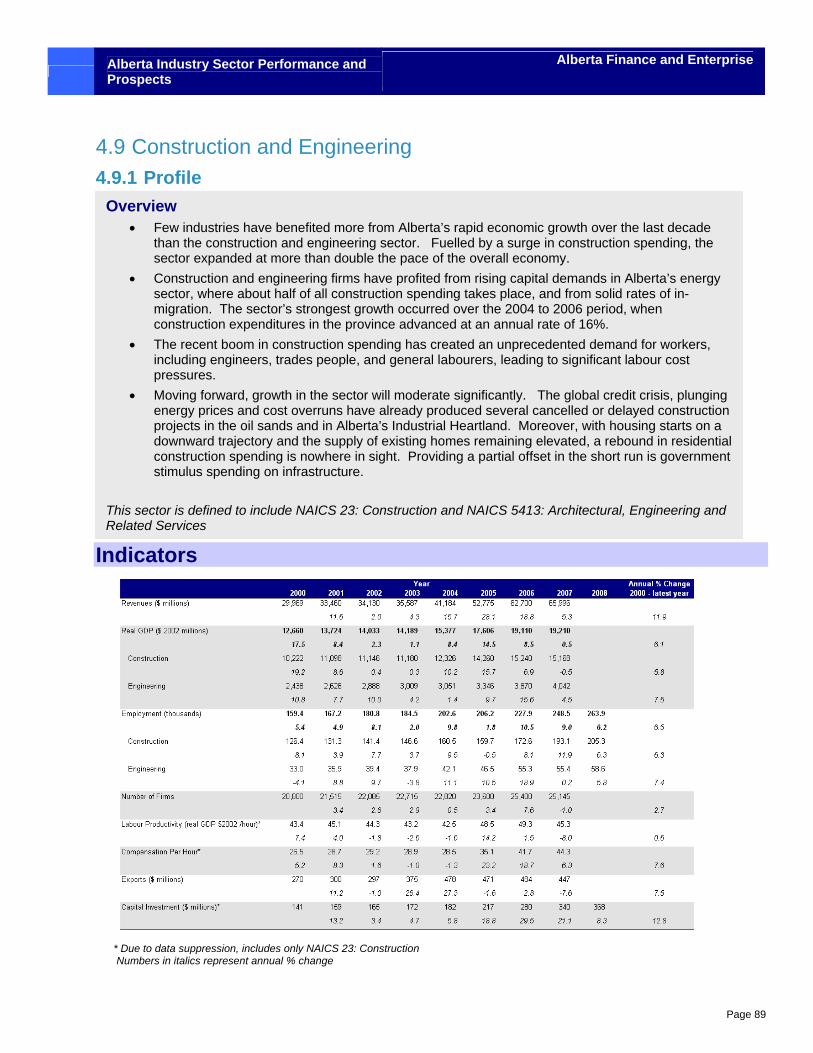
Alberta Industry Sector Performance and Prospects
Alberta Finance and Enterprise
Page 89
4.9 Construction and Engineering 4.9.1 Profile
Indicators
* Due to data suppression, includes only NAICS 23: Construction Numbers in italics represent annual % change
Overview • Few industries have benefited more from Alberta’s rapid economic growth over the last decade
than the construction and engineering sector. Fuelled by a surge in construction spending, the sector expanded at more than double the pace of the overall economy.
• Construction and engineering firms have profited from rising capital demands in Alberta’s energy sector, where about half of all construction spending takes place, and from solid rates of in-migration. The sector’s strongest growth occurred over the 2004 to 2006 period, when construction expenditures in the province advanced at an annual rate of 16%.
• The recent boom in construction spending has created an unprecedented demand for workers, including engineers, trades people, and general labourers, leading to significant labour cost pressures.
• Moving forward, growth in the sector will moderate significantly. The global credit crisis, plunging energy prices and cost overruns have already produced several cancelled or delayed construction projects in the oil sands and in Alberta’s Industrial Heartland. Moreover, with housing starts on a downward trajectory and the supply of existing homes remaining elevated, a rebound in residential construction spending is nowhere in sight. Providing a partial offset in the short run is government stimulus spending on infrastructure.
This sector is defined to include NAICS 23: Construction and NAICS 5413: Architectural, Engineering and Related Services
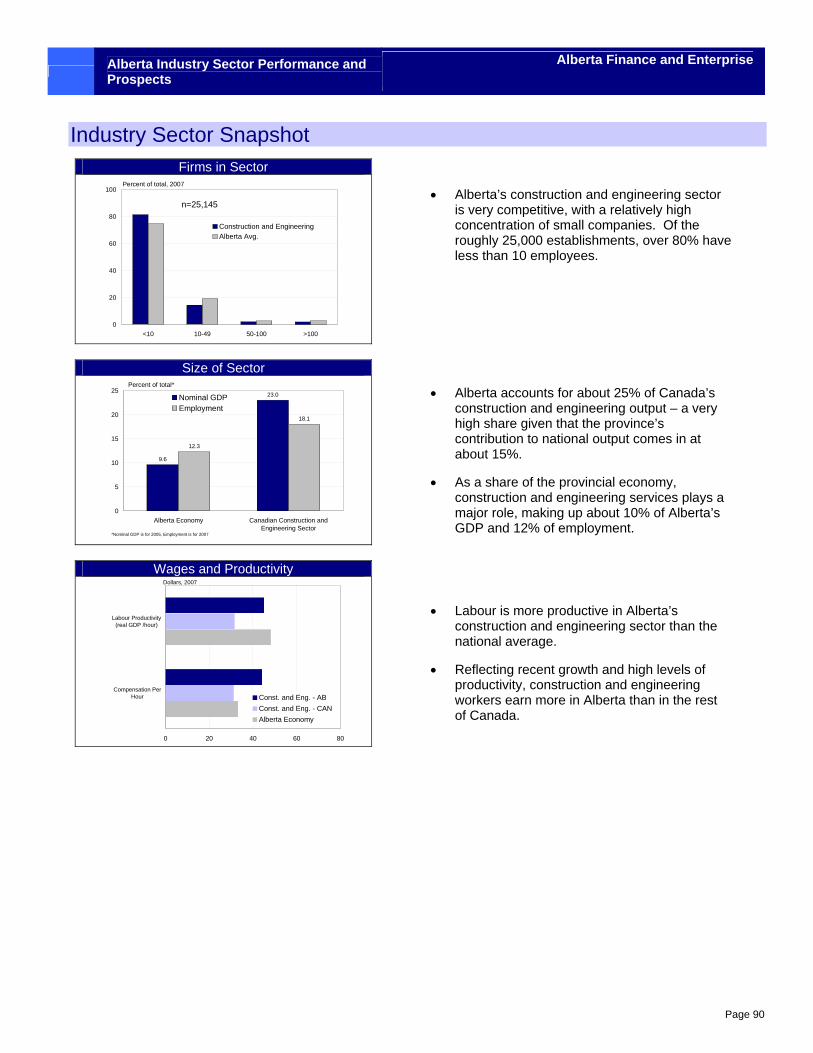
Alberta Industry Sector Performance and Prospects
Alberta Finance and Enterprise
Page 90
Industry Sector Snapshot Firms in Sector
0
20
40
60
80
100
<10 10-49 50-100 >100
Construction and EngineeringAlberta Avg.
Percent of total, 2007
n=25,145
Size of Sector
9.6
23.0
12.3
18.1
0
5
10
15
20
25
Alberta Economy Canadian Construction andEngineering Sector
Nominal GDPEmployment
Percent of total*
*Nominal GDP is for 2005, Employment is for 2007
Wages and Productivity
0 20 40 60 80
Compensation PerHour
Labour Productivity(real GDP /hour)
Const. and Eng. - ABConst. and Eng. - CANAlberta Economy
Dollars, 2007
• Alberta’s construction and engineering sector is very competitive, with a relatively high concentration of small companies. Of the roughly 25,000 establishments, over 80% have less than 10 employees.
• Alberta accounts for about 25% of Canada’s construction and engineering output – a very high share given that the province’s contribution to national output comes in at about 15%.
• As a share of the provincial economy, construction and engineering services plays a major role, making up about 10% of Alberta’s GDP and 12% of employment.
• Labour is more productive in Alberta’s construction and engineering sector than the national average.
• Reflecting recent growth and high levels of productivity, construction and engineering workers earn more in Alberta than in the rest of Canada.
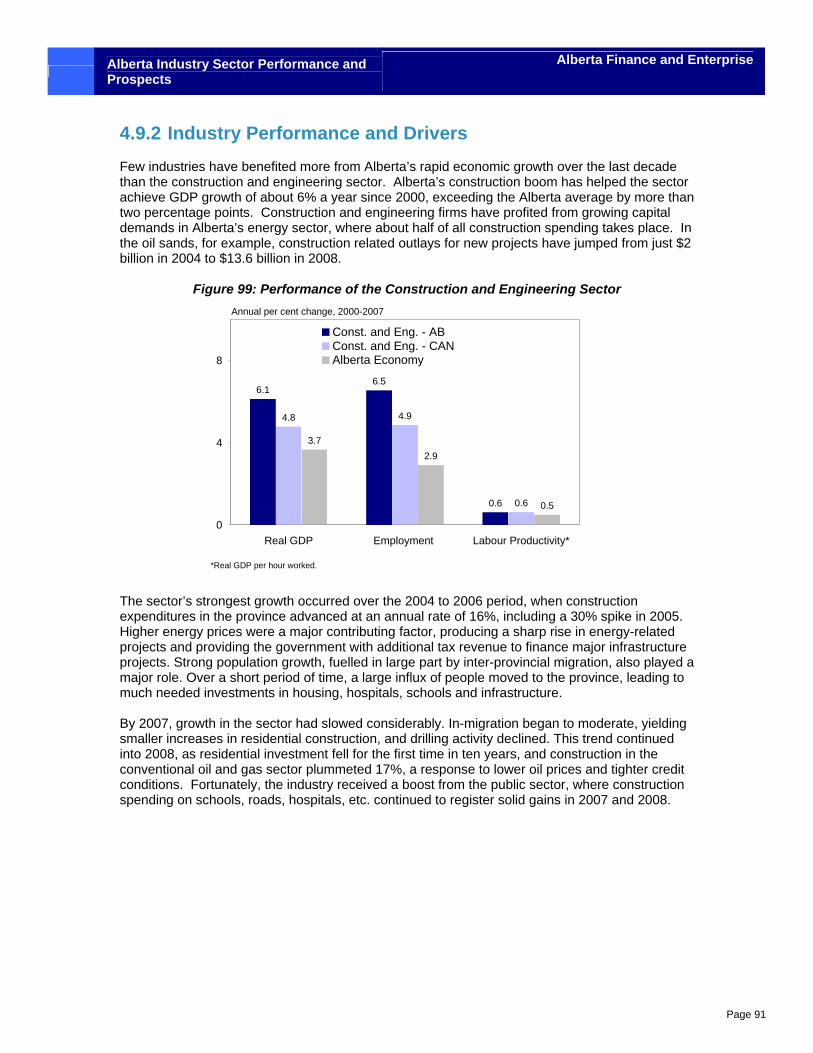
Alberta Industry Sector Performance and Prospects
Alberta Finance and Enterprise
Page 91
4.9.2 Industry Performance and Drivers Few industries have benefited more from Alberta’s rapid economic growth over the last decade than the construction and engineering sector. Alberta’s construction boom has helped the sector achieve GDP growth of about 6% a year since 2000, exceeding the Alberta average by more than two percentage points. Construction and engineering firms have profited from growing capital demands in Alberta’s energy sector, where about half of all construction spending takes place. In the oil sands, for example, construction related outlays for new projects have jumped from just $2 billion in 2004 to $13.6 billion in 2008.
Figure 99: Performance of the Construction and Engineering Sector
6.16.5
0.6
4.8 4.9
0.6
3.72.9
0.5
0
4
8
Real GDP Employment Labour Productivity*
Const. and Eng. - ABConst. and Eng. - CANAlberta Economy
Annual per cent change, 2000-2007
*Real GDP per hour worked.
The sector’s strongest growth occurred over the 2004 to 2006 period, when construction expenditures in the province advanced at an annual rate of 16%, including a 30% spike in 2005. Higher energy prices were a major contributing factor, producing a sharp rise in energy-related projects and providing the government with additional tax revenue to finance major infrastructure projects. Strong population growth, fuelled in large part by inter-provincial migration, also played a major role. Over a short period of time, a large influx of people moved to the province, leading to much needed investments in housing, hospitals, schools and infrastructure. By 2007, growth in the sector had slowed considerably. In-migration began to moderate, yielding smaller increases in residential construction, and drilling activity declined. This trend continued into 2008, as residential investment fell for the first time in ten years, and construction in the conventional oil and gas sector plummeted 17%, a response to lower oil prices and tighter credit conditions. Fortunately, the industry received a boost from the public sector, where construction spending on schools, roads, hospitals, etc. continued to register solid gains in 2007 and 2008.
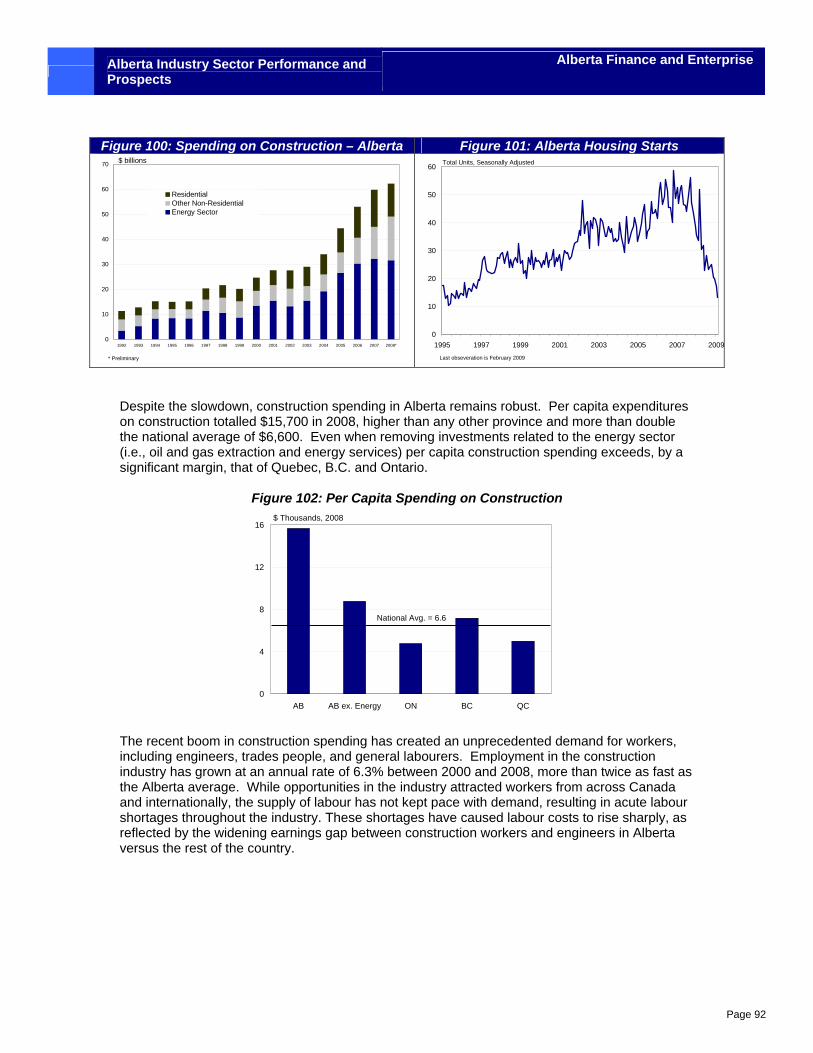
Alberta Industry Sector Performance and Prospects
Alberta Finance and Enterprise
Page 92
Figure 100: Spending on Construction – Alberta Figure 101: Alberta Housing Starts
0
10
20
30
40
50
60
70
1992 1993 1994 1995 1996 1997 1998 1999 2000 2001 2002 2003 2004 2005 2006 2007 2008*
ResidentialOther Non-ResidentialEnergy Sector
$ billions
* Preliminary
0
10
20
30
40
50
60
1995 1997 1999 2001 2003 2005 2007 2009
Last obseveration is February 2009
Total Units, Seasonally Adjusted
Despite the slowdown, construction spending in Alberta remains robust. Per capita expenditures on construction totalled $15,700 in 2008, higher than any other province and more than double the national average of $6,600. Even when removing investments related to the energy sector (i.e., oil and gas extraction and energy services) per capita construction spending exceeds, by a significant margin, that of Quebec, B.C. and Ontario.
Figure 102: Per Capita Spending on Construction
0
4
8
12
16
AB AB ex. Energy ON BC QC
$ Thousands, 2008
National Avg. = 6.6
The recent boom in construction spending has created an unprecedented demand for workers, including engineers, trades people, and general labourers. Employment in the construction industry has grown at an annual rate of 6.3% between 2000 and 2008, more than twice as fast as the Alberta average. While opportunities in the industry attracted workers from across Canada and internationally, the supply of labour has not kept pace with demand, resulting in acute labour shortages throughout the industry. These shortages have caused labour costs to rise sharply, as reflected by the widening earnings gap between construction workers and engineers in Alberta versus the rest of the country.
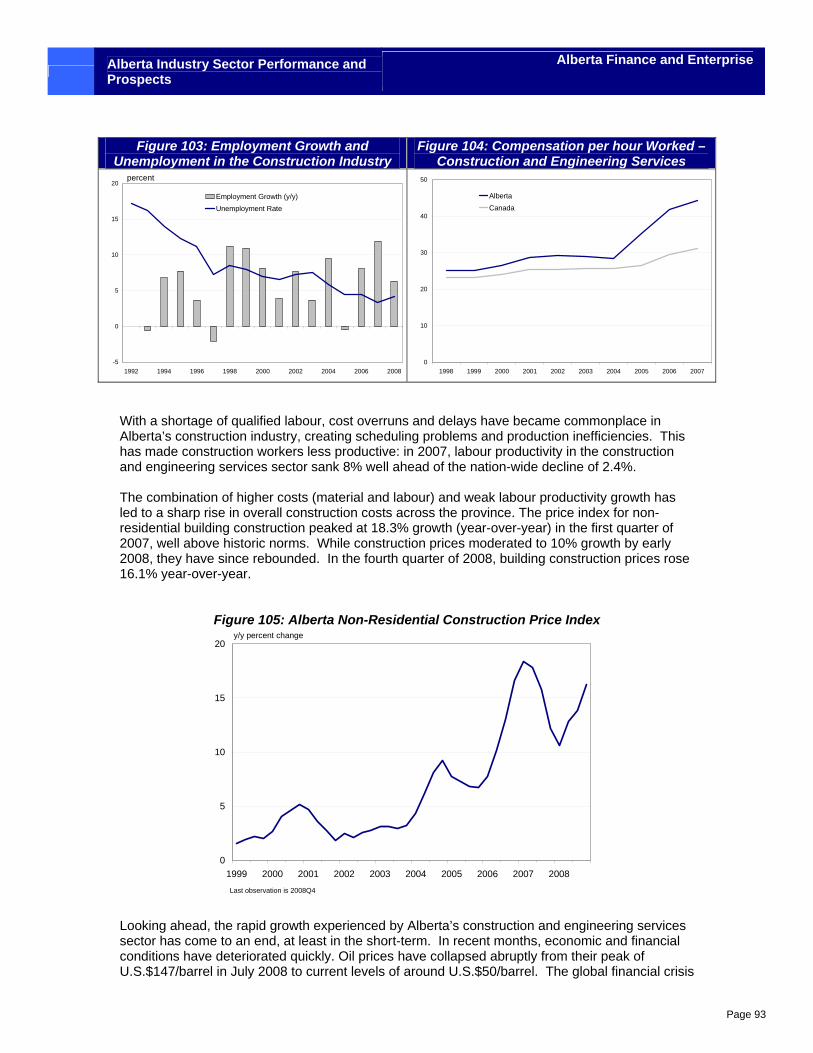
Alberta Industry Sector Performance and Prospects
Alberta Finance and Enterprise
Page 93
Figure 103: Employment Growth and
Unemployment in the Construction Industry Figure 104: Compensation per hour Worked –
Construction and Engineering Services
-5
0
5
10
15
20
1992 1994 1996 1998 2000 2002 2004 2006 2008
Employment Growth (y/y)Unemployment Rate
percent
0
10
20
30
40
50
1998 1999 2000 2001 2002 2003 2004 2005 2006 2007
AlbertaCanada
With a shortage of qualified labour, cost overruns and delays have became commonplace in Alberta’s construction industry, creating scheduling problems and production inefficiencies. This has made construction workers less productive: in 2007, labour productivity in the construction and engineering services sector sank 8% well ahead of the nation-wide decline of 2.4%. The combination of higher costs (material and labour) and weak labour productivity growth has led to a sharp rise in overall construction costs across the province. The price index for non-residential building construction peaked at 18.3% growth (year-over-year) in the first quarter of 2007, well above historic norms. While construction prices moderated to 10% growth by early 2008, they have since rebounded. In the fourth quarter of 2008, building construction prices rose 16.1% year-over-year.
Figure 105: Alberta Non-Residential Construction Price Index
0
5
10
15
20
1999 2000 2001 2002 2003 2004 2005 2006 2007 2008
Last observation is 2008Q4
y/y percent change
Looking ahead, the rapid growth experienced by Alberta’s construction and engineering services sector has come to an end, at least in the short-term. In recent months, economic and financial conditions have deteriorated quickly. Oil prices have collapsed abruptly from their peak of U.S.$147/barrel in July 2008 to current levels of around U.S.$50/barrel. The global financial crisis
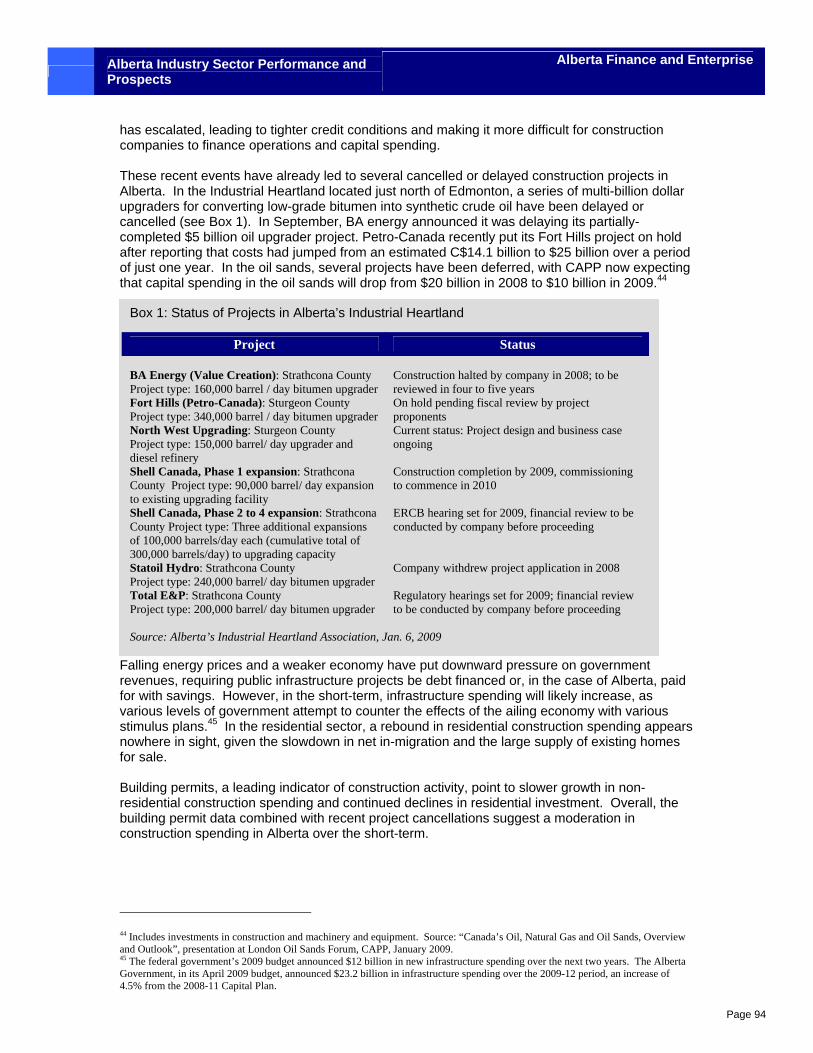
Alberta Industry Sector Performance and Prospects
Alberta Finance and Enterprise
Page 94
Box 1: Status of Projects in Alberta’s Industrial Heartland
Project Status BA Energy (Value Creation): Strathcona County Project type: 160,000 barrel / day bitumen upgrader
Construction halted by company in 2008; to be reviewed in four to five years
Fort Hills (Petro-Canada): Sturgeon County Project type: 340,000 barrel / day bitumen upgrader
On hold pending fiscal review by project proponents
North West Upgrading: Sturgeon County Project type: 150,000 barrel/ day upgrader and diesel refinery
Current status: Project design and business case ongoing
Shell Canada, Phase 1 expansion: Strathcona County Project type: 90,000 barrel/ day expansion to existing upgrading facility
Construction completion by 2009, commissioning to commence in 2010
Shell Canada, Phase 2 to 4 expansion: Strathcona County Project type: Three additional expansions of 100,000 barrels/day each (cumulative total of 300,000 barrels/day) to upgrading capacity
ERCB hearing set for 2009, financial review to be conducted by company before proceeding
Statoil Hydro: Strathcona County Project type: 240,000 barrel/ day bitumen upgrader
Company withdrew project application in 2008
Total E&P: Strathcona County Project type: 200,000 barrel/ day bitumen upgrader
Regulatory hearings set for 2009; financial review to be conducted by company before proceeding
Source: Alberta’s Industrial Heartland Association, Jan. 6, 2009
has escalated, leading to tighter credit conditions and making it more difficult for construction companies to finance operations and capital spending. These recent events have already led to several cancelled or delayed construction projects in Alberta. In the Industrial Heartland located just north of Edmonton, a series of multi-billion dollar upgraders for converting low-grade bitumen into synthetic crude oil have been delayed or cancelled (see Box 1). In September, BA energy announced it was delaying its partially-completed $5 billion oil upgrader project. Petro-Canada recently put its Fort Hills project on hold after reporting that costs had jumped from an estimated C$14.1 billion to $25 billion over a period of just one year. In the oil sands, several projects have been deferred, with CAPP now expecting that capital spending in the oil sands will drop from $20 billion in 2008 to $10 billion in 2009.44
Falling energy prices and a weaker economy have put downward pressure on government revenues, requiring public infrastructure projects be debt financed or, in the case of Alberta, paid for with savings. However, in the short-term, infrastructure spending will likely increase, as various levels of government attempt to counter the effects of the ailing economy with various stimulus plans.45 In the residential sector, a rebound in residential construction spending appears nowhere in sight, given the slowdown in net in-migration and the large supply of existing homes for sale. Building permits, a leading indicator of construction activity, point to slower growth in non-residential construction spending and continued declines in residential investment. Overall, the building permit data combined with recent project cancellations suggest a moderation in construction spending in Alberta over the short-term.
44 Includes investments in construction and machinery and equipment. Source: “Canada’s Oil, Natural Gas and Oil Sands, Overview and Outlook”, presentation at London Oil Sands Forum, CAPP, January 2009. 45 The federal government’s 2009 budget announced $12 billion in new infrastructure spending over the next two years. The Alberta Government, in its April 2009 budget, announced $23.2 billion in infrastructure spending over the 2009-12 period, an increase of 4.5% from the 2008-11 Capital Plan.
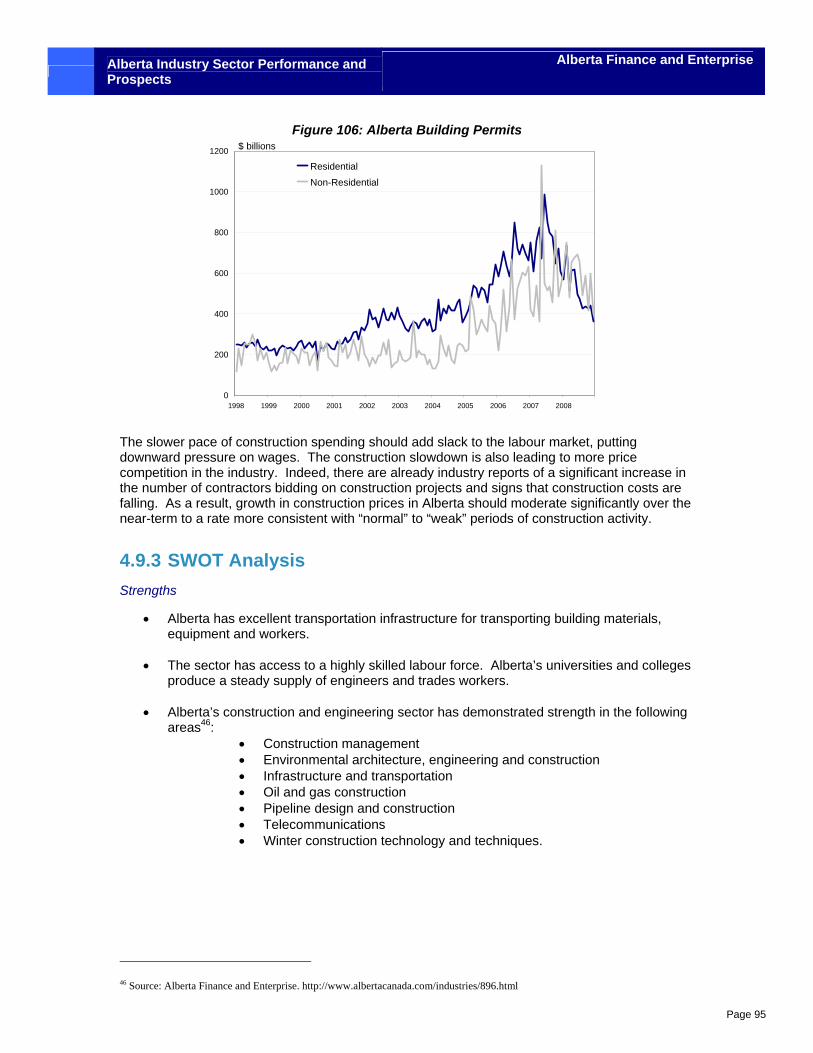
Alberta Industry Sector Performance and Prospects
Alberta Finance and Enterprise
Page 95
Figure 106: Alberta Building Permits
0
200
400
600
800
1000
1200
1998 1999 2000 2001 2002 2003 2004 2005 2006 2007 2008
ResidentialNon-Residential
$ billions
The slower pace of construction spending should add slack to the labour market, putting downward pressure on wages. The construction slowdown is also leading to more price competition in the industry. Indeed, there are already industry reports of a significant increase in the number of contractors bidding on construction projects and signs that construction costs are falling. As a result, growth in construction prices in Alberta should moderate significantly over the near-term to a rate more consistent with “normal” to “weak” periods of construction activity.
4.9.3 SWOT Analysis Strengths
• Alberta has excellent transportation infrastructure for transporting building materials, equipment and workers.
• The sector has access to a highly skilled labour force. Alberta’s universities and colleges
produce a steady supply of engineers and trades workers.
• Alberta’s construction and engineering sector has demonstrated strength in the following areas46:
• Construction management • Environmental architecture, engineering and construction • Infrastructure and transportation • Oil and gas construction • Pipeline design and construction • Telecommunications • Winter construction technology and techniques.
46 Source: Alberta Finance and Enterprise. http://www.albertacanada.com/industries/896.html
Alberta Industry Sector Performance and Prospects
Alberta Finance and Enterprise
Page 96
Weaknesses
• During the recent boom in construction activity, companies struggled to keep pace with the demand. As a result, for many companies, there was less focus placed on technology adoption, developing project management expertise and training staff.
• An abundance of job opportunities and high wages has attracted a high share of inexperienced workers into Alberta’s construction industry. This has likely resulted in construction delays, hurting overall productivity. Indeed, labour productivity has advanced at a modest pace of 0.5% a year since 2000 and fell in 2007. Moreover, having inexperienced workers increases the risk of worksite accidents.
• In Alberta, one of the key challenges is to not only attract the skilled workers needed to support industrial growth, but also to retain these workers to maintain new facilities or facilities currently under construction.
• There is a shortage of qualified apprentices and journeypersons in Alberta. Alberta’s Building and Educating Tomorrow’s Workforce strategy has identified possible explanations for these shortages:
• Cost of apprenticeship training; • Lack of apprentices with necessary academic skills and motivation; and • Difficult for apprentices to find employment with a company that will
provide the full period of training.
Opportunities
• Due to lower commodity prices, the price of materials, such as steel, has come down significantly. In the short-run, this should help offset some of the downward pressure on profits caused by weaker revenues.
• Alberta’s construction companies are developing specialized expertise in heavy oil and oil sands construction. This expertise could be exported to other countries.
• Due to more stringent environmental regulations (e.g. Alberta and federal GHG intensity targets), there are growing opportunities in environmental design, engineering and construction.
• To improve productivity and reduce costs, there is an increased focus on “lean” construction processes and best practices. The government of Alberta’s Lean Enterprise Assessment Program (LEAP) helps companies identify areas for process improvement and cost reduction.
• As part of its economic stimulus package, the federal government has introduced a series of measure that will likely boost spending in the construction sector in Alberta’s residential sector.
• Home Renovation Tax Credit. A 15% tax credit can be claimed on home renovation spending for work performed or goods acquired after January 27, 2009 and before February 1, 2010.
• First-Time Home Buyers’ Credit. A tax credit of $750 is available to first-time home buyers after January 27, 2009.
• Home Buyers Plan. $15 million in assistance to first-time homeowners by allowing them to withdraw up to $25,000 tax free from a registered retirement savings.
Alberta Industry Sector Performance and Prospects
Alberta Finance and Enterprise
Page 97
• In the non-residential sector, the stimulus package includes $12 billion in new infrastructure funding over the next two years. Of this amount, about 60% is targeted to provincial, territorial, and municipal infrastructure, 30% will be directed toward knowledge infrastructure projects and the remainder to federal and aboriginal infrastructure. In Alberta, the Federal Government has already announced that the Telus World of Science in Calgary and the twinning of the Trans-Canada Highway through Banff National Park are being fast-tracked under the new spending plan.47
• The $2 billion investment by the government of Alberta for CCS will create additional opportunities for the sector.
Threats
• To date, a number of oil sands and upgrader projects have been delayed, reflecting the drop in energy prices, the global credit crisis and cost overruns. Should conditions deteriorate further, there is a risk of further project delays or cancellations.
• Alberta’s construction industry relies on a highly mobile workforce that draws heavily on workers from other provinces. When construction activity is strong in neighbouring provinces, it becomes more difficult to attract workers. With construction in the four western provinces expected to remain strong over the next 10 years, competition for workers will be tight and companies will likely be forced to recruit out-of-country. 48
• The slowdown in construction has increased the number of bidders for potential projects, leading to more price competition, which in turn may reduce profit margins.
• Despite the recent moderation of activity, labour shortages are expected to persist in Alberta’s construction and engineering sector. The Construction Sector Council (CSC) has identified a number of challenges that the construction sector must overcome to address this issue:49
• Train and upgrade the workforce in the skills that will be in demand;
• Replace the drain of workers created by retirement and the growing need to maintain newly constructed facilities;
• Manage a workforce that is becoming increasingly selective in terms of the jobs they are prepared to undertake;
• Attract workers to remote work sites, for example in Fort McMurray.
• Over the longer-term, the CSC expects more pressure on labour shortages due to a retiring workforce. Specifically, the CSC expects that 16% of the construction workforce (16,812) will need to be replaced over the 2004 to 2014 period in order to maintain 2004 labour force levels. Training programs need to address this shortfall.
• Negative press about the environmental effects of the oil sands and the new environmental regulations both in Canada and the U.S. could impact future development
47 Department of Finance Canada. Canada’s Economic Action plan: A first report to Canadians http://www.fin.gc.ca/pub/report-rapport/2009-1/cepc4c-eng.asp 48 Source: Workforce Strategy for Alberta’s Construction Industry 49 Construction Sector Council, “Construction Looking Forward: Labour Requirements from 2006 to 2014 for Alberta”, 2006.
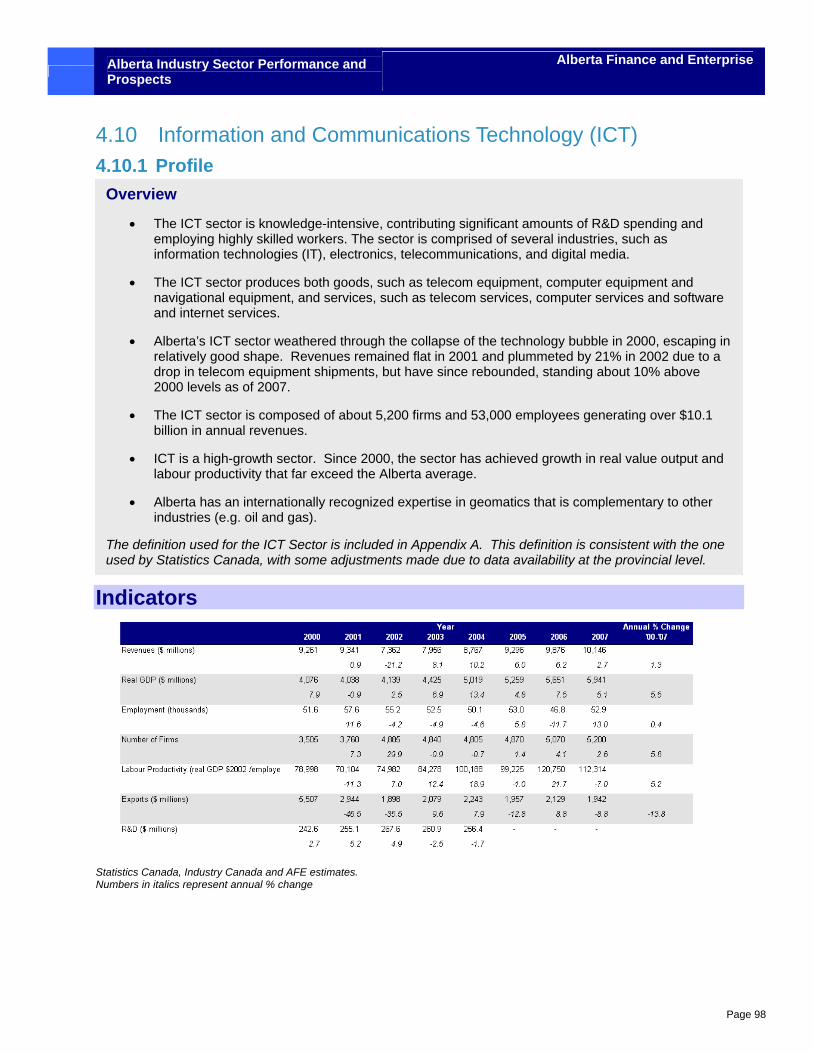
Alberta Industry Sector Performance and Prospects
Alberta Finance and Enterprise
Page 98
4.10 Information and Communications Technology (ICT) 4.10.1 Profile
Indicators
Statistics Canada, Industry Canada and AFE estimates. Numbers in italics represent annual % change
Overview
• The ICT sector is knowledge-intensive, contributing significant amounts of R&D spending and employing highly skilled workers. The sector is comprised of several industries, such as information technologies (IT), electronics, telecommunications, and digital media.
• The ICT sector produces both goods, such as telecom equipment, computer equipment and navigational equipment, and services, such as telecom services, computer services and software and internet services.
• Alberta’s ICT sector weathered through the collapse of the technology bubble in 2000, escaping in relatively good shape. Revenues remained flat in 2001 and plummeted by 21% in 2002 due to a drop in telecom equipment shipments, but have since rebounded, standing about 10% above 2000 levels as of 2007.
• The ICT sector is composed of about 5,200 firms and 53,000 employees generating over $10.1 billion in annual revenues.
• ICT is a high-growth sector. Since 2000, the sector has achieved growth in real value output and labour productivity that far exceed the Alberta average.
• Alberta has an internationally recognized expertise in geomatics that is complementary to other industries (e.g. oil and gas).
The definition used for the ICT Sector is included in Appendix A. This definition is consistent with the one used by Statistics Canada, with some adjustments made due to data availability at the provincial level.
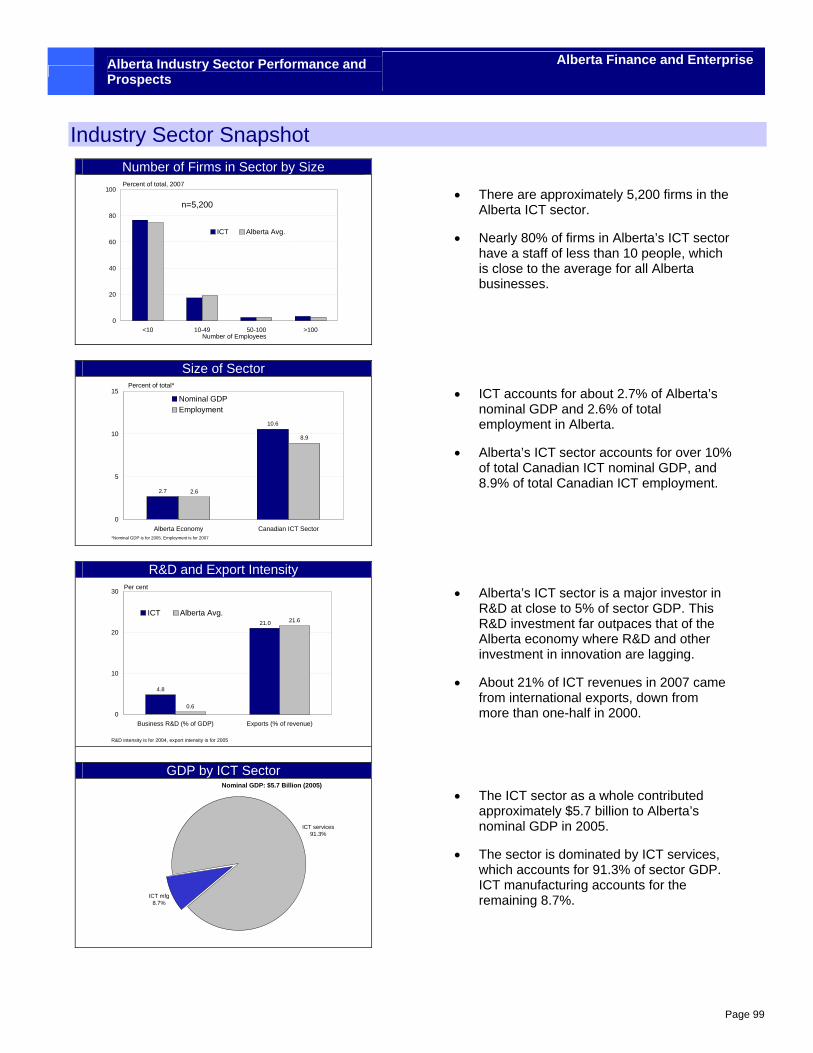
Alberta Industry Sector Performance and Prospects
Alberta Finance and Enterprise
Page 99
Industry Sector Snapshot Number of Firms in Sector by Size
0
20
40
60
80
100
<10 10-49 50-100 >100
ICT Alberta Avg.
Percent of total, 2007
n=5,200
Number of Employees
Size of Sector
2.7
10.6
2.6
8.9
0
5
10
15
Alberta Economy Canadian ICT Sector
Nominal GDPEmployment
Percent of total*
*Nominal GDP is for 2005, Employment is for 2007
R&D and Export Intensity
4.8
0.6
21.621.0
0
10
20
30
Business R&D (% of GDP) Exports (% of revenue)
ICT Alberta Avg.
Per cent
R&D intensity is for 2004, export intensity is for 2005
GDP by ICT Sector
ICT mfg8.7%
ICT services91.3%
Nominal GDP: $5.7 Billion (2005)
• There are approximately 5,200 firms in the Alberta ICT sector.
• Nearly 80% of firms in Alberta’s ICT sector have a staff of less than 10 people, which is close to the average for all Alberta businesses.
• ICT accounts for about 2.7% of Alberta’s nominal GDP and 2.6% of total employment in Alberta.
• Alberta’s ICT sector accounts for over 10% of total Canadian ICT nominal GDP, and 8.9% of total Canadian ICT employment.
• Alberta’s ICT sector is a major investor in R&D at close to 5% of sector GDP. This R&D investment far outpaces that of the Alberta economy where R&D and other investment in innovation are lagging.
• About 21% of ICT revenues in 2007 came from international exports, down from more than one-half in 2000.
• The ICT sector as a whole contributed approximately $5.7 billion to Alberta’s nominal GDP in 2005.
• The sector is dominated by ICT services, which accounts for 91.3% of sector GDP. ICT manufacturing accounts for the remaining 8.7%.
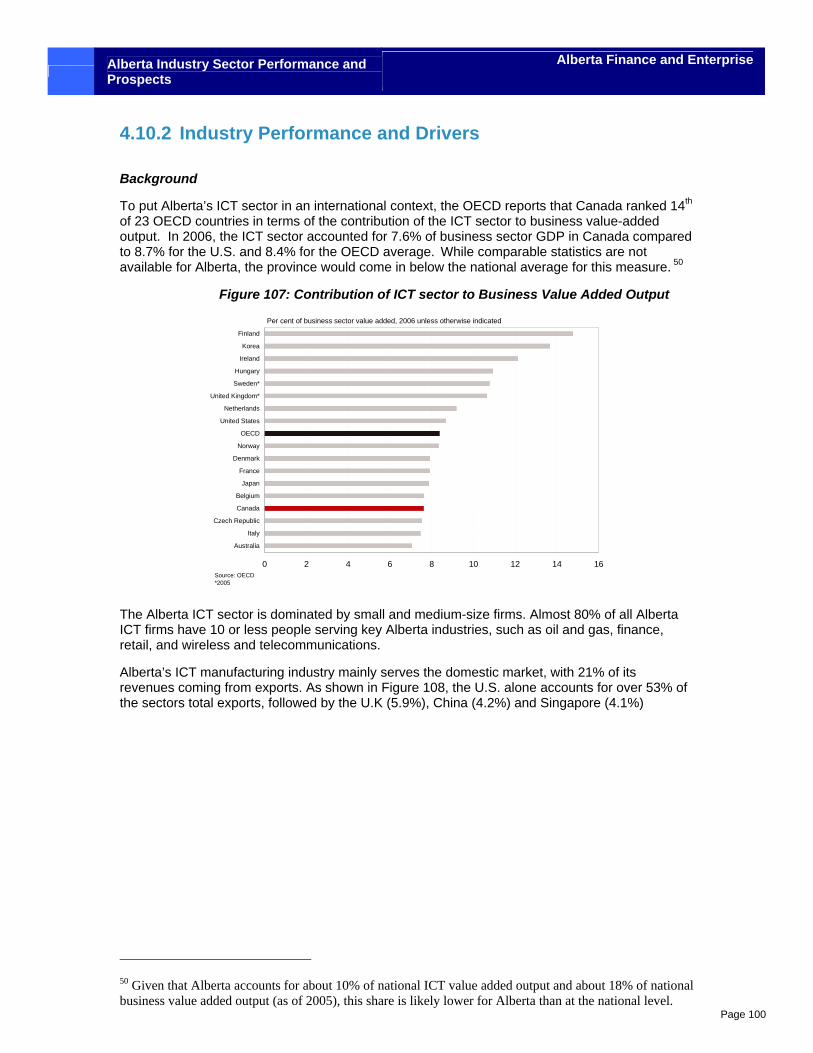
Alberta Industry Sector Performance and Prospects
Alberta Finance and Enterprise
Page 100
4.10.2 Industry Performance and Drivers
Background
To put Alberta’s ICT sector in an international context, the OECD reports that Canada ranked 14th of 23 OECD countries in terms of the contribution of the ICT sector to business value-added output. In 2006, the ICT sector accounted for 7.6% of business sector GDP in Canada compared to 8.7% for the U.S. and 8.4% for the OECD average. While comparable statistics are not available for Alberta, the province would come in below the national average for this measure. 50
Figure 107: Contribution of ICT sector to Business Value Added Output
0 2 4 6 8 10 12 14 16
Australia
Italy
Czech Republic
Canada
Belgium
Japan
France
Denmark
Norway
OECD
United States
Netherlands
United Kingdom*
Sweden*
Hungary
Ireland
Korea
Finland
Per cent of business sector value added, 2006 unless otherwise indicated
Source: OECD*2005
The Alberta ICT sector is dominated by small and medium-size firms. Almost 80% of all Alberta ICT firms have 10 or less people serving key Alberta industries, such as oil and gas, finance, retail, and wireless and telecommunications.
Alberta’s ICT manufacturing industry mainly serves the domestic market, with 21% of its revenues coming from exports. As shown in Figure 108, the U.S. alone accounts for over 53% of the sectors total exports, followed by the U.K (5.9%), China (4.2%) and Singapore (4.1%)
50 Given that Alberta accounts for about 10% of national ICT value added output and about 18% of national business value added output (as of 2005), this share is likely lower for Alberta than at the national level.
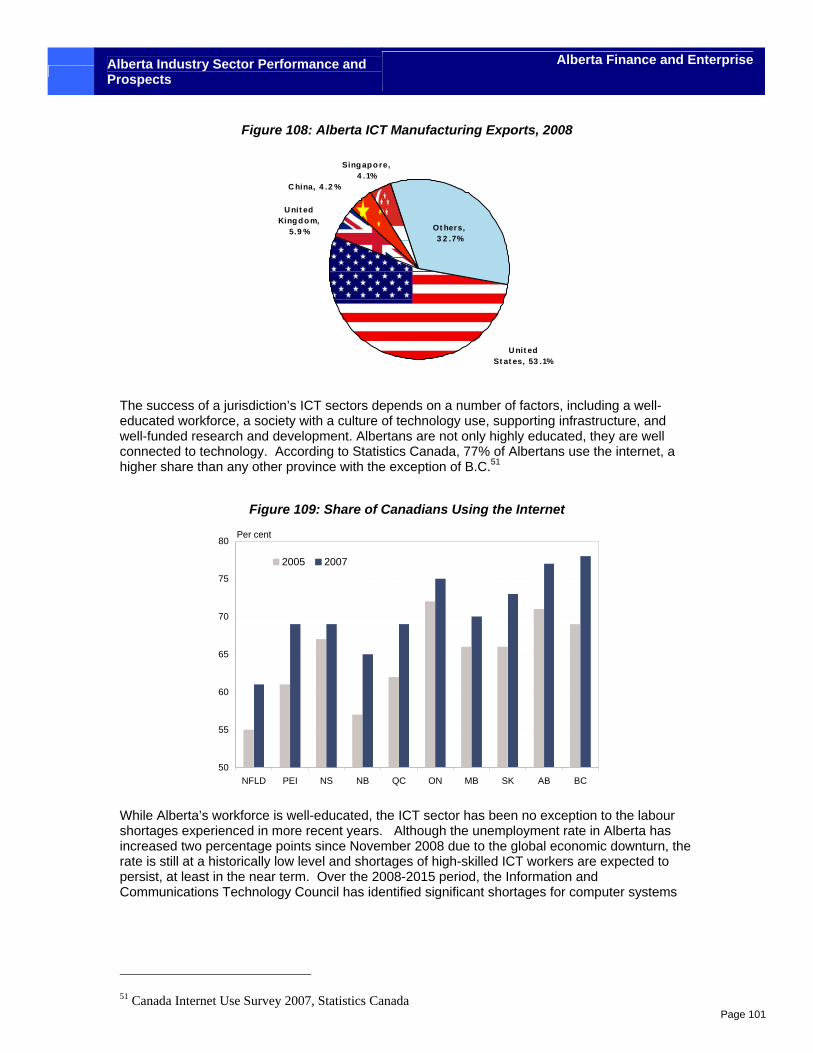
Alberta Industry Sector Performance and Prospects
Alberta Finance and Enterprise
Page 101
Figure 108: Alberta ICT Manufacturing Exports, 2008
U nit ed King d o m,
5.9 %
U nit ed St at es, 53 .1%
Ot hers, 3 2 .7%
Sing ap o re, 4 .1%
C hina, 4 .2 %
The success of a jurisdiction’s ICT sectors depends on a number of factors, including a well-educated workforce, a society with a culture of technology use, supporting infrastructure, and well-funded research and development. Albertans are not only highly educated, they are well connected to technology. According to Statistics Canada, 77% of Albertans use the internet, a higher share than any other province with the exception of B.C.51
Figure 109: Share of Canadians Using the Internet
50
55
60
65
70
75
80
NFLD PEI NS NB QC ON MB SK AB BC
2005 2007
Per cent
While Alberta’s workforce is well-educated, the ICT sector has been no exception to the labour shortages experienced in more recent years. Although the unemployment rate in Alberta has increased two percentage points since November 2008 due to the global economic downturn, the rate is still at a historically low level and shortages of high-skilled ICT workers are expected to persist, at least in the near term. Over the 2008-2015 period, the Information and Communications Technology Council has identified significant shortages for computer systems
51 Canada Internet Use Survey 2007, Statistics Canada
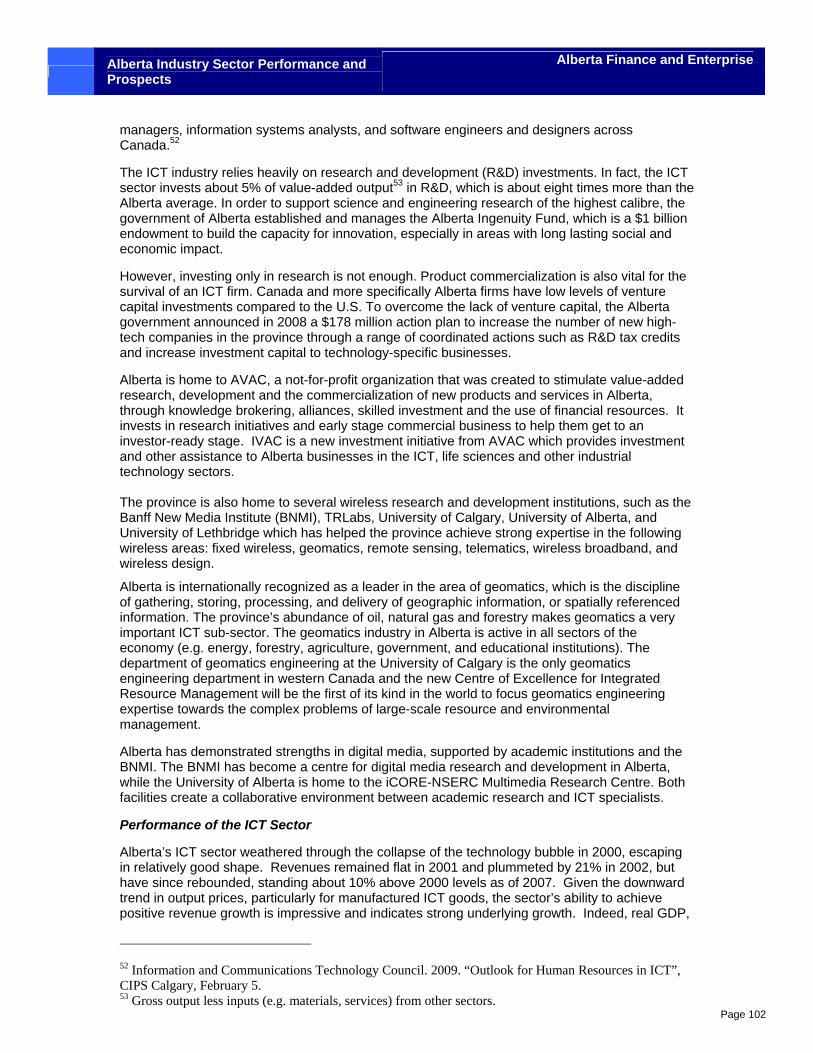
Alberta Industry Sector Performance and Prospects
Alberta Finance and Enterprise
Page 102
managers, information systems analysts, and software engineers and designers across Canada.52
The ICT industry relies heavily on research and development (R&D) investments. In fact, the ICT sector invests about 5% of value-added output53 in R&D, which is about eight times more than the Alberta average. In order to support science and engineering research of the highest calibre, the government of Alberta established and manages the Alberta Ingenuity Fund, which is a $1 billion endowment to build the capacity for innovation, especially in areas with long lasting social and economic impact.
However, investing only in research is not enough. Product commercialization is also vital for the survival of an ICT firm. Canada and more specifically Alberta firms have low levels of venture capital investments compared to the U.S. To overcome the lack of venture capital, the Alberta government announced in 2008 a $178 million action plan to increase the number of new high-tech companies in the province through a range of coordinated actions such as R&D tax credits and increase investment capital to technology-specific businesses.
Alberta is home to AVAC, a not-for-profit organization that was created to stimulate value-added research, development and the commercialization of new products and services in Alberta, through knowledge brokering, alliances, skilled investment and the use of financial resources. It invests in research initiatives and early stage commercial business to help them get to an investor-ready stage. IVAC is a new investment initiative from AVAC which provides investment and other assistance to Alberta businesses in the ICT, life sciences and other industrial technology sectors. The province is also home to several wireless research and development institutions, such as the Banff New Media Institute (BNMI), TRLabs, University of Calgary, University of Alberta, and University of Lethbridge which has helped the province achieve strong expertise in the following wireless areas: fixed wireless, geomatics, remote sensing, telematics, wireless broadband, and wireless design.
Alberta is internationally recognized as a leader in the area of geomatics, which is the discipline of gathering, storing, processing, and delivery of geographic information, or spatially referenced information. The province’s abundance of oil, natural gas and forestry makes geomatics a very important ICT sub-sector. The geomatics industry in Alberta is active in all sectors of the economy (e.g. energy, forestry, agriculture, government, and educational institutions). The department of geomatics engineering at the University of Calgary is the only geomatics engineering department in western Canada and the new Centre of Excellence for Integrated Resource Management will be the first of its kind in the world to focus geomatics engineering expertise towards the complex problems of large-scale resource and environmental management.
Alberta has demonstrated strengths in digital media, supported by academic institutions and the BNMI. The BNMI has become a centre for digital media research and development in Alberta, while the University of Alberta is home to the iCORE-NSERC Multimedia Research Centre. Both facilities create a collaborative environment between academic research and ICT specialists.
Performance of the ICT Sector
Alberta’s ICT sector weathered through the collapse of the technology bubble in 2000, escaping in relatively good shape. Revenues remained flat in 2001 and plummeted by 21% in 2002, but have since rebounded, standing about 10% above 2000 levels as of 2007. Given the downward trend in output prices, particularly for manufactured ICT goods, the sector’s ability to achieve positive revenue growth is impressive and indicates strong underlying growth. Indeed, real GDP,
52 Information and Communications Technology Council. 2009. “Outlook for Human Resources in ICT”, CIPS Calgary, February 5. 53 Gross output less inputs (e.g. materials, services) from other sectors.
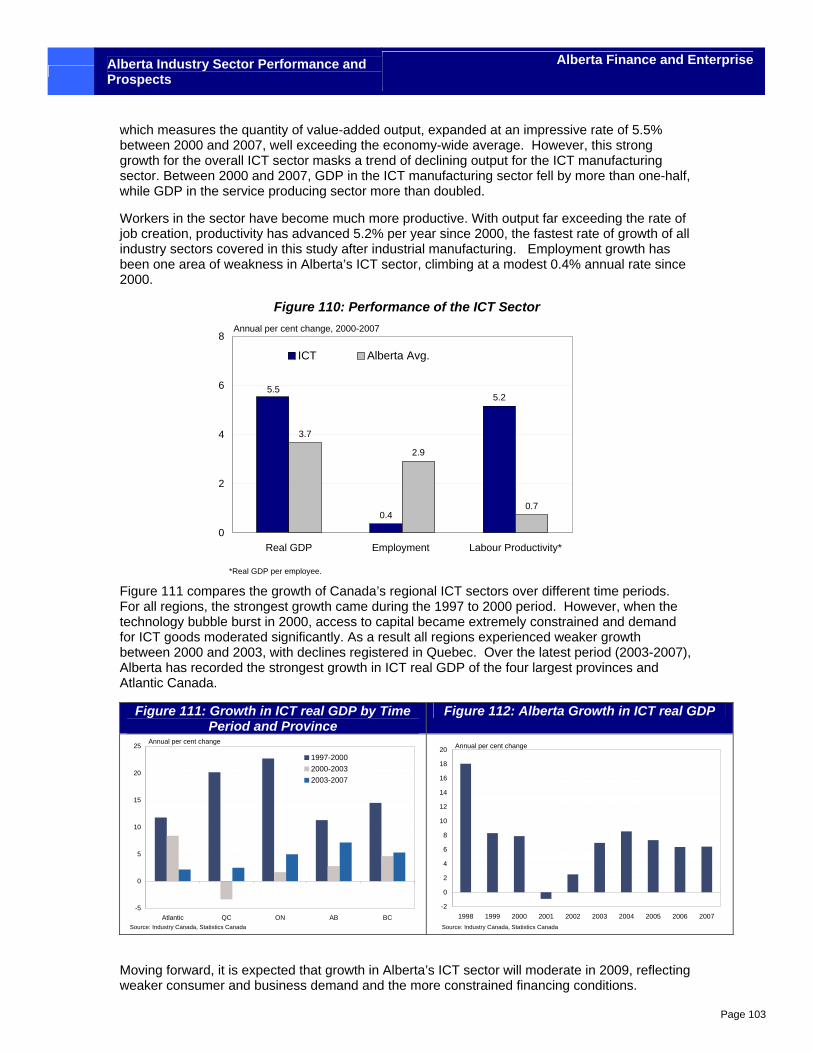
Alberta Industry Sector Performance and Prospects
Alberta Finance and Enterprise
Page 103
which measures the quantity of value-added output, expanded at an impressive rate of 5.5% between 2000 and 2007, well exceeding the economy-wide average. However, this strong growth for the overall ICT sector masks a trend of declining output for the ICT manufacturing sector. Between 2000 and 2007, GDP in the ICT manufacturing sector fell by more than one-half, while GDP in the service producing sector more than doubled.
Workers in the sector have become much more productive. With output far exceeding the rate of job creation, productivity has advanced 5.2% per year since 2000, the fastest rate of growth of all industry sectors covered in this study after industrial manufacturing. Employment growth has been one area of weakness in Alberta’s ICT sector, climbing at a modest 0.4% annual rate since 2000.
Figure 110: Performance of the ICT Sector
0.4
5.2
3.7
2.9
0.7
5.5
0
2
4
6
8
Real GDP Employment Labour Productivity*
ICT Alberta Avg.
Annual per cent change, 2000-2007
*Real GDP per employee.
Figure 111 compares the growth of Canada’s regional ICT sectors over different time periods. For all regions, the strongest growth came during the 1997 to 2000 period. However, when the technology bubble burst in 2000, access to capital became extremely constrained and demand for ICT goods moderated significantly. As a result all regions experienced weaker growth between 2000 and 2003, with declines registered in Quebec. Over the latest period (2003-2007), Alberta has recorded the strongest growth in ICT real GDP of the four largest provinces and Atlantic Canada.
Figure 111: Growth in ICT real GDP by Time Period and Province
Figure 112: Alberta Growth in ICT real GDP
-5
0
5
10
15
20
25
Atlantic QC ON AB BC
1997-20002000-20032003-2007
Annual per cent change
Source: Industry Canada, Statistics Canada
-2
0
2
4
6
8
10
12
14
16
18
20
1998 1999 2000 2001 2002 2003 2004 2005 2006 2007
Annual per cent change
Source: Industry Canada, Statistics Canada
Moving forward, it is expected that growth in Alberta’s ICT sector will moderate in 2009, reflecting weaker consumer and business demand and the more constrained financing conditions.
Alberta Industry Sector Performance and Prospects
Alberta Finance and Enterprise
Page 104
According to OECD’s 2008 Information and Technology Outlook, global projections for ICT spending have been revised sharply downward, and the global ICT sector is expected to shrink in 2009, although not nearly to the same extent as in 2001-2002 following the collapse of the technology bubble. ICT services are expected to fare relatively well, as internet and communications technologies are part of what is considered to be essential (e.g. non-discretionary) spending.
4.10.3 SWOT Analysis
Strengths
• According to the Calgary Economic Development Authority, the City of Calgary is home to the largest number of technology start up firms per capita in Canada. In the summer of 2008, the provincial government announced a $178 million action plan to increase the number of new companies in emerging advanced technology sectors, such as ICT.
• To improve access to capital, the Alberta Government has established a $100 million fund managed by Alberta Enterprise Corporation. The fund co-invests with venture capital firms in a number of priority areas, including ICT, life sciences, green technology and nanotechnology.
• Exceptional centres for ICT research and development, such as the BNMI, University of Calgary, University of Alberta, Athabasca University, and University of Lethbridge, as well as the research consortium TRLabs.
• The Alberta Ingenuity Fund, with a value of about $650 million was created in 2000 to
attract and fund science and engineering researchers in Alberta. • Alberta is a recognized world leader in geomatics engineering. Forty percent of Canada’s
geomatics industry is located in Alberta, supported by the province’s strong resource based economy.
• The government has built a high-speed network linking government offices, schools,
health-care facilities and libraries, including approximately 4,200 connections in 429 communities. This broadband network, the SuperNet, includes 13,000 kilometres of fibre optic and wireless connections, and provides Albertans in both rural and urban communities with opportunities to access high-speed network services.
• Alberta has the second highest share of internet users in the country.
• Alberta is becoming a leader in nanotechnology, with the National Institute of Nanotechnology (NINT) based out of the University of Alberta.
Weaknesses
• Shortage of ICT skilled workers represents a major constraint on the sector’s growth.
• Federal and provincial governments in Canada tend to get new technology solutions from U.S.-based companies instead of considering Canadian technology.
• Lack of venture capital investment in Canada. Many venture capitalists instead prefer to invest in well established U.S. markets, such as California or Boston.
• A strong focus on research, but less emphasis on the commercialization of ICT products.
Alberta Industry Sector Performance and Prospects
Alberta Finance and Enterprise
Page 105
Opportunities
• Lower telecommunication costs might allow ICT service firms in Alberta to expand their markets to anywhere in the globe where a phone line and internet connection are available.
• More integration of Alberta’s ICT sector with other major industries in the province, including oil and gas, to improve their productivity.
• Re-evaluation of procurement processes to support the innovations within small to medium sized ICT companies by encouraging or backstopping partnership arrangements with larger service providers while innovations are being proven.
• The federal government's recent wireless spectrum auction may speed up the adoption of wireless applications among Canadian firms including firms in the first responder/healthcare community, where some believe this market is now turning more to advanced technology in an effort to operate better and more efficiently. (Cash crunch, rising loonie slows Canadian tech growth by Kavita Gosyne, September 29, 2008 ITBusiness.ca - http://www.itbusiness.ca/it/client/en/home/News.asp?id=50094).
• Nanotechnology has the potential to significantly contribute to many areas of the economy, including energy, agriculture and forestry, as advanced materials allow for more efficient production and potentially new products.
• High growth areas of the sector include Web2.0, social networking, and new wireless applications (e.g. payments).
Threats
• Significantly lower labour costs in other countries (e.g. India and China).
• Softening of Alberta’s natural resource based sectors may prove troublesome for the ICT sector which has historically relied on the strong performance of the energy, forestry, agriculture and environmental sectors.
• Information technology (IT) workers are being highly sought after by Canadian firms while enrolments in IT courses continue to decline sharply.
• While somewhat dated, the 2005 Alberta Wireless and Telecom Industry Survey found that the top four potential barriers to growth in the industry were:
Ability to obtain funding (57% of respondents);
Attracting and retaining high calibre employees (47%);
Accessing new markets (31%); and
Building effective industry collaborations and alliances (22%).
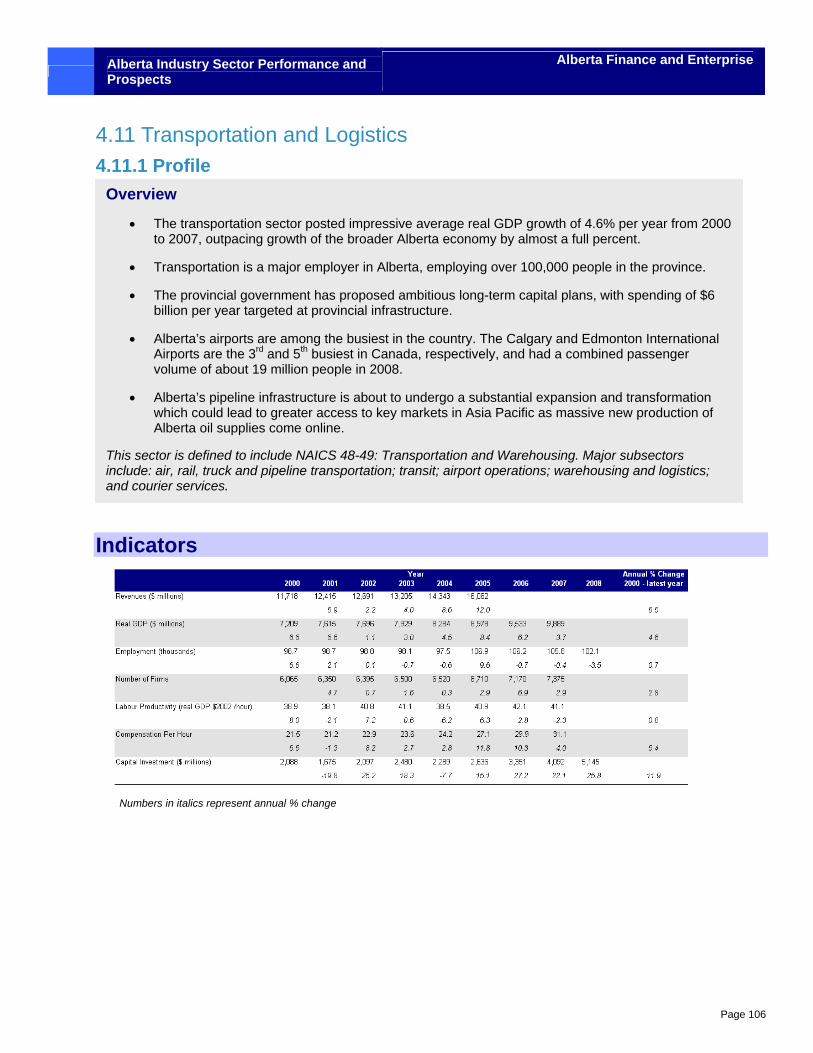
Alberta Industry Sector Performance and Prospects
Alberta Finance and Enterprise
Page 106
4.11 Transportation and Logistics 4.11.1 Profile
Indicators
Numbers in italics represent annual % change
Overview
• The transportation sector posted impressive average real GDP growth of 4.6% per year from 2000 to 2007, outpacing growth of the broader Alberta economy by almost a full percent.
• Transportation is a major employer in Alberta, employing over 100,000 people in the province.
• The provincial government has proposed ambitious long-term capital plans, with spending of $6 billion per year targeted at provincial infrastructure.
• Alberta’s airports are among the busiest in the country. The Calgary and Edmonton International Airports are the 3rd and 5th busiest in Canada, respectively, and had a combined passenger volume of about 19 million people in 2008.
• Alberta’s pipeline infrastructure is about to undergo a substantial expansion and transformation which could lead to greater access to key markets in Asia Pacific as massive new production of Alberta oil supplies come online.
This sector is defined to include NAICS 48-49: Transportation and Warehousing. Major subsectors include: air, rail, truck and pipeline transportation; transit; airport operations; warehousing and logistics; and courier services.
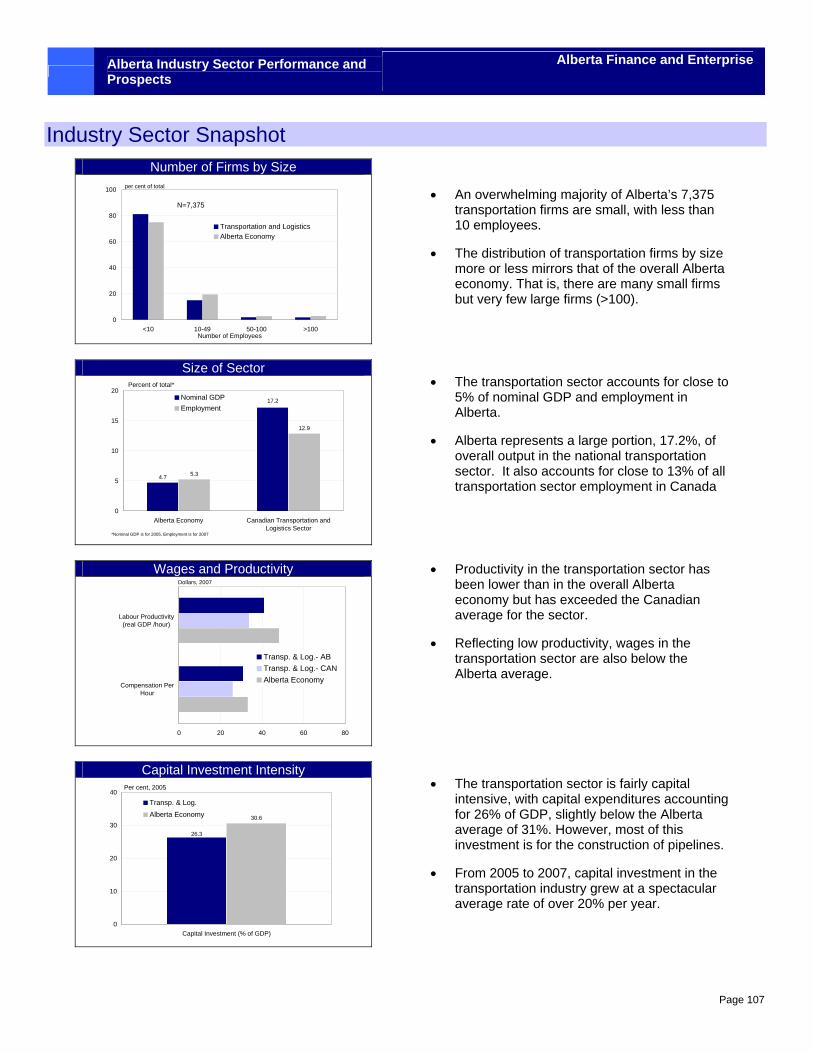
Alberta Industry Sector Performance and Prospects
Alberta Finance and Enterprise
Page 107
Industry Sector Snapshot Number of Firms by Size
0
20
40
60
80
100
<10 10-49 50-100 >100
Transportation and LogisticsAlberta Economy
per cent of total
Number of Employees
N=7,375
Size of Sector
4.7 5.3
12.9
17.2
0
5
10
15
20
Alberta Economy Canadian Transportation andLogistics Sector
Nominal GDPEmployment
Percent of total*
*Nominal GDP is for 2005, Employment is for 2007
Wages and Productivity
0 20 40 60 80
Compensation PerHour
Labour Productivity(real GDP /hour)
Transp. & Log.- ABTransp. & Log.- CANAlberta Economy
Dollars, 2007
Capital Investment Intensity
30.6
26.3
0
10
20
30
40
Capital Investment (% of GDP)
Transp. & Log.Alberta Economy
Per cent, 2005
• An overwhelming majority of Alberta’s 7,375 transportation firms are small, with less than 10 employees.
• The distribution of transportation firms by size more or less mirrors that of the overall Alberta economy. That is, there are many small firms but very few large firms (>100).
• The transportation sector accounts for close to 5% of nominal GDP and employment in Alberta.
• Alberta represents a large portion, 17.2%, of overall output in the national transportation sector. It also accounts for close to 13% of all transportation sector employment in Canada
• Productivity in the transportation sector has been lower than in the overall Alberta economy but has exceeded the Canadian average for the sector.
• Reflecting low productivity, wages in the transportation sector are also below the Alberta average.
• The transportation sector is fairly capital intensive, with capital expenditures accounting for 26% of GDP, slightly below the Alberta average of 31%. However, most of this investment is for the construction of pipelines.
• From 2005 to 2007, capital investment in the transportation industry grew at a spectacular average rate of over 20% per year.
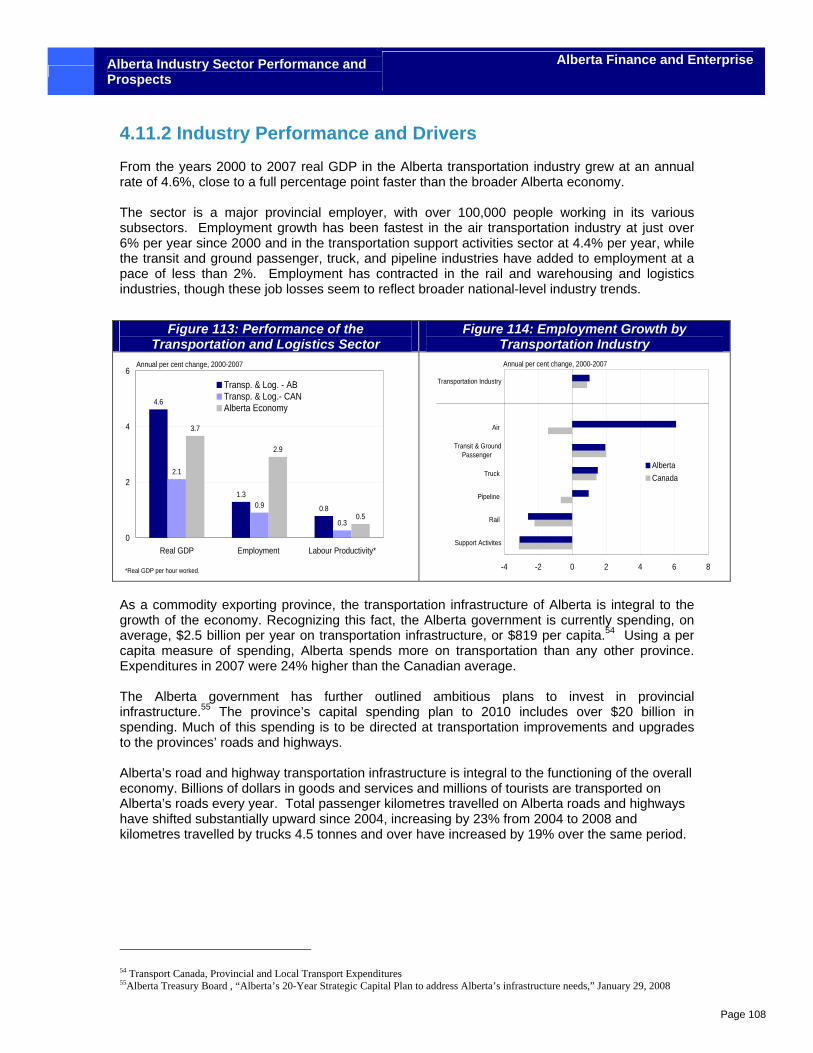
Alberta Industry Sector Performance and Prospects
Alberta Finance and Enterprise
Page 108
4.11.2 Industry Performance and Drivers From the years 2000 to 2007 real GDP in the Alberta transportation industry grew at an annual rate of 4.6%, close to a full percentage point faster than the broader Alberta economy. The sector is a major provincial employer, with over 100,000 people working in its various subsectors. Employment growth has been fastest in the air transportation industry at just over 6% per year since 2000 and in the transportation support activities sector at 4.4% per year, while the transit and ground passenger, truck, and pipeline industries have added to employment at a pace of less than 2%. Employment has contracted in the rail and warehousing and logistics industries, though these job losses seem to reflect broader national-level industry trends.
As a commodity exporting province, the transportation infrastructure of Alberta is integral to the growth of the economy. Recognizing this fact, the Alberta government is currently spending, on average, $2.5 billion per year on transportation infrastructure, or $819 per capita.54 Using a per capita measure of spending, Alberta spends more on transportation than any other province. Expenditures in 2007 were 24% higher than the Canadian average. The Alberta government has further outlined ambitious plans to invest in provincial infrastructure.55 The province’s capital spending plan to 2010 includes over $20 billion in spending. Much of this spending is to be directed at transportation improvements and upgrades to the provinces’ roads and highways. Alberta’s road and highway transportation infrastructure is integral to the functioning of the overall economy. Billions of dollars in goods and services and millions of tourists are transported on Alberta’s roads every year. Total passenger kilometres travelled on Alberta roads and highways have shifted substantially upward since 2004, increasing by 23% from 2004 to 2008 and kilometres travelled by trucks 4.5 tonnes and over have increased by 19% over the same period.
54 Transport Canada, Provincial and Local Transport Expenditures 55Alberta Treasury Board , “Alberta’s 20-Year Strategic Capital Plan to address Alberta’s infrastructure needs,” January 29, 2008
Figure 113: Performance of the Transportation and Logistics Sector
Figure 114: Employment Growth by Transportation Industry
4.6
1.3
0.8
2.1
0.9
0.3
3.7
2.9
0.5
0
2
4
6
Real GDP Employment Labour Productivity*
Transp. & Log. - ABTransp. & Log.- CANAlberta Economy
Annual per cent change, 2000-2007
*Real GDP per hour worked. -4 -2 0 2 4 6 8
Support Activites
Rail
Pipeline
Truck
Transit & GroundPassenger
Air
Transportation Industry
AlbertaCanada
Annual per cent change, 2000-2007
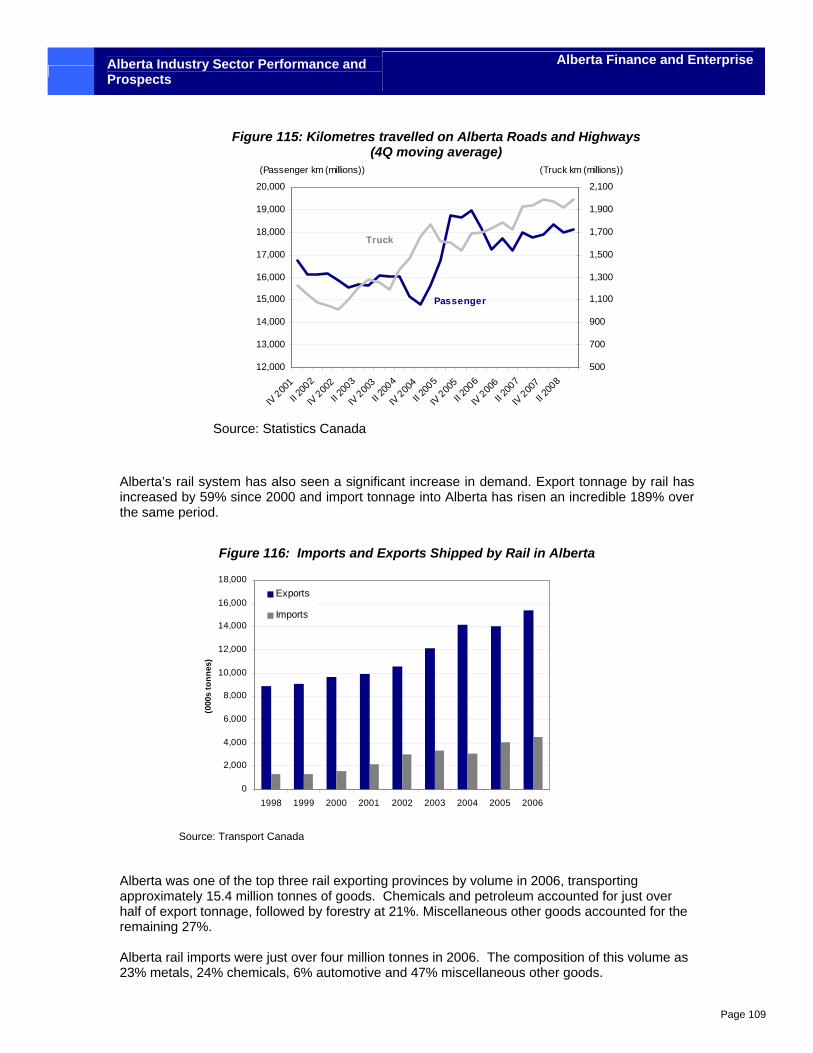
Alberta Industry Sector Performance and Prospects
Alberta Finance and Enterprise
Page 109
Source: Statistics Canada
Alberta’s rail system has also seen a significant increase in demand. Export tonnage by rail has increased by 59% since 2000 and import tonnage into Alberta has risen an incredible 189% over the same period. Source: Transport Canada Alberta was one of the top three rail exporting provinces by volume in 2006, transporting approximately 15.4 million tonnes of goods. Chemicals and petroleum accounted for just over half of export tonnage, followed by forestry at 21%. Miscellaneous other goods accounted for the remaining 27%. Alberta rail imports were just over four million tonnes in 2006. The composition of this volume as 23% metals, 24% chemicals, 6% automotive and 47% miscellaneous other goods.
Figure 115: Kilometres travelled on Alberta Roads and Highways (4Q moving average)
12,000
13,000
14,000
15,000
16,000
17,000
18,000
19,000
20,000
IV 2001
II 200
2
IV 2002
II 200
3
IV 2003
II 200
4
IV 2004
II 200
5
IV 2005
II 200
6
IV 2006
II 200
7
IV 2007
II 200
8500
700
900
1,100
1,300
1,500
1,700
1,900
2,100
(Passenger km (millions)) (Truck km (millions))
Passenger
Truck
Figure 116: Imports and Exports Shipped by Rail in Alberta
0
2,000
4,000
6,000
8,000
10,000
12,000
14,000
16,000
18,000
1998 1999 2000 2001 2002 2003 2004 2005 2006
(000
s to
nnes
)
Exports
Imports
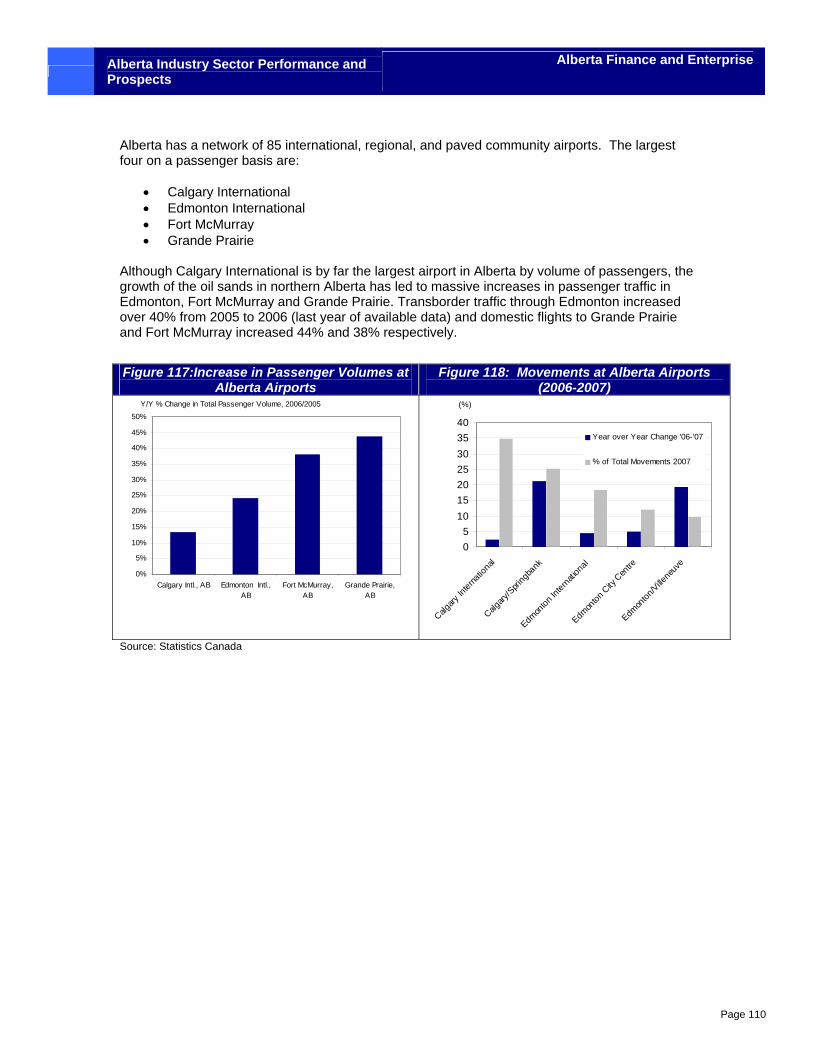
Alberta Industry Sector Performance and Prospects
Alberta Finance and Enterprise
Page 110
Alberta has a network of 85 international, regional, and paved community airports. The largest four on a passenger basis are:
• Calgary International • Edmonton International • Fort McMurray • Grande Prairie
Although Calgary International is by far the largest airport in Alberta by volume of passengers, the growth of the oil sands in northern Alberta has led to massive increases in passenger traffic in Edmonton, Fort McMurray and Grande Prairie. Transborder traffic through Edmonton increased over 40% from 2005 to 2006 (last year of available data) and domestic flights to Grande Prairie and Fort McMurray increased 44% and 38% respectively.
Source: Statistics Canada
Figure 117:Increase in Passenger Volumes at Alberta Airports
Figure 118: Movements at Alberta Airports (2006-2007)
0%
5%
10%
15%
20%
25%
30%
35%
40%
45%
50%
Calgary Intl., AB Edmonton Intl.,AB
Fort McMurray,AB
Grande Prairie,AB
Y/Y % Change in Total Passenger Volume, 2006/2005
05
10152025303540
Calgary
Interna
tional
Calgary
/Spri
ngban
k
Edmon
ton In
ternatio
nal
Edmon
ton C
ity C
entre
Edmon
ton/Ville
neuve
Year over Year Change '06-'07
% of Total Movements 2007
(%)
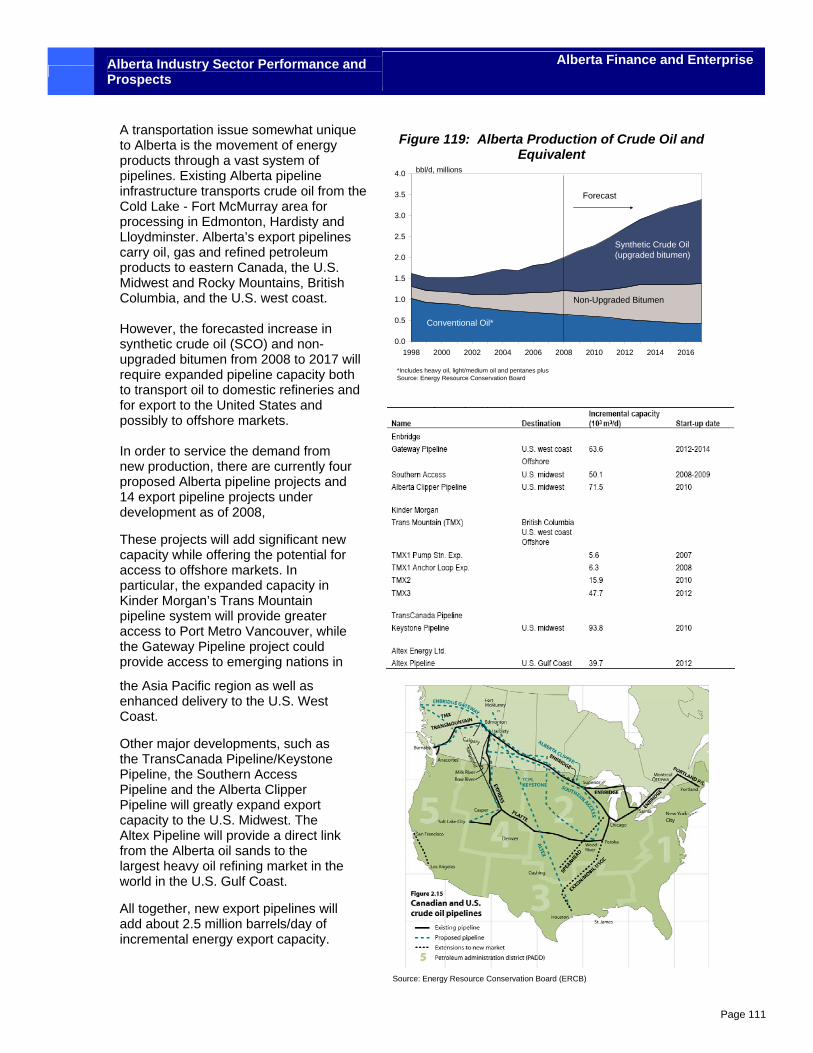
Alberta Industry Sector Performance and Prospects
Alberta Finance and Enterprise
Page 111
A transportation issue somewhat unique to Alberta is the movement of energy products through a vast system of pipelines. Existing Alberta pipeline infrastructure transports crude oil from the Cold Lake - Fort McMurray area for processing in Edmonton, Hardisty and Lloydminster. Alberta’s export pipelines carry oil, gas and refined petroleum products to eastern Canada, the U.S. Midwest and Rocky Mountains, British Columbia, and the U.S. west coast. However, the forecasted increase in synthetic crude oil (SCO) and non-upgraded bitumen from 2008 to 2017 will require expanded pipeline capacity both to transport oil to domestic refineries and for export to the United States and possibly to offshore markets. In order to service the demand from new production, there are currently four proposed Alberta pipeline projects and 14 export pipeline projects under development as of 2008,
These projects will add significant new capacity while offering the potential for access to offshore markets. In particular, the expanded capacity in Kinder Morgan’s Trans Mountain pipeline system will provide greater access to Port Metro Vancouver, while the Gateway Pipeline project could provide access to emerging nations in
the Asia Pacific region as well as enhanced delivery to the U.S. West Coast.
Other major developments, such as the TransCanada Pipeline/Keystone Pipeline, the Southern Access Pipeline and the Alberta Clipper Pipeline will greatly expand export capacity to the U.S. Midwest. The Altex Pipeline will provide a direct link from the Alberta oil sands to the largest heavy oil refining market in the world in the U.S. Gulf Coast.
All together, new export pipelines will add about 2.5 million barrels/day of incremental energy export capacity.
Figure 119: Alberta Production of Crude Oil and Equivalent
0.0
0.5
1.0
1.5
2.0
2.5
3.0
3.5
4.0
1998 2000 2002 2004 2006 2008 2010 2012 2014 2016
bbl/d, millions
*Includes heavy oil, light/medium oil and pentanes plusSource: Energy Resource Conservation Board
Non-Upgraded Bitumen
Synthetic Crude Oil (upgraded bitumen)
Conventional Oil*
Forecast
Source: Energy Resource Conservation Board (ERCB)
Alberta Industry Sector Performance and Prospects
Alberta Finance and Enterprise
Page 112
In addition to the physical movement of goods, the transportation sector also relies on transportation logistics. Logistics is the management of the flow of goods, information and other resources between the point of origin and the point of consumption in order to meet the requirements of consumers. Logistics involves the integration of information, transportation, inventory, warehousing, material handling and packaging.
Logistics and warehousing have been a rapidly growing sector in Alberta with Calgary alone accounting for an increase of over four million square feet of distribution facilities since 2000. Large retailers such as Sears, Canadian Tire and third party logistics providers like SCM have set up facilities in Alberta and the sector is one of the largest employers in the province.
Firms have been drawn to locate in Alberta by a number of factors. These include
• affordable and developable land;
• a skilled workforce; and
• a central geographic location with access to key markets.
However, there is some concern that rapid economic growth in recent years, and the emergence of Alberta’s major cities as regional distribution hubs, has increased demands on Alberta’s road networks and contributed to a shortage of skilled labour in the logistics sector. To address these concerns, the Alberta Government has invested in upgrading the ring roads around both Edmonton and Calgary to alleviate traffic congestion. Furthermore, Alberta’s secondary and post-secondary teaching institutions continue to be encouraged to develop and expand programs for graduating students with the skills required by Alberta’s growing warehousing and logistics sector.
4.11.3 SWOT Analysis
Strengths
• Alberta’s well developed system of energy pipelines and current proposals to develop new pipelines or enhance existing pipeline networks could provide Alberta’s energy producers with strategic access to fast growing offshore markets via West Coast ports.
• Alberta is well served by a diverse array of transportation options including road, rail, air and pipeline. This diversity provides Alberta with an advantage in integrating transportation of goods and reaching key markets in Canada, the United States and abroad.
• In per-capita terms, the Alberta government is currently outspending all other provinces in terms of transportation expenditures.56 This commitment to the transportation networks of the province will aid in the long-run growth of the economy and the transportation sector.
• Alberta has two thriving international airports, handling 19 million passengers in 2008.
• Alberta’s tax rates for diesel fuel are the lowest of the Canadian provinces.
56 Transport Canada. 2008.”Distribution of Provincial and Local Transport Expenditures by Province/Territory, 1997/98 – 2006/07”.
Alberta Industry Sector Performance and Prospects
Alberta Finance and Enterprise
Page 113
Weaknesses
• As with the broad Canadian population, the transportation workforce is aging and a large portion of workers are nearing retirement. The sector will need to address human resource challenges presented by the retirement of baby-boomers by initiating education, training and other programs that will attract young workers into the transportation industry. The trucking sector already has problems finding workers, partly because of the long hours and time away from home.
• The rapid pace of globalization and the industrialization of emerging Asian markets have pushed the capacity limits of some West Coast ports. Congestion in the supply chain from Western Canada to Port Metro Vancouver is currently being worked on by all stakeholders in the supply chain with the aim of increasing fluidity and capacity in the system.
• Alberta Transportation estimates that in 2006-07, 14% of Alberta’s provincial highways were in poor condition.57 These highways are a vital component in the movement of goods and services throughout Alberta’s economy and their deterioration should be addressed to prevent undue constraints on trade flows.
Opportunities
• Development of Port Alberta, an inland transportation and distribution port near the Edmonton International Airport. The Edmonton International Airport could become a gateway for cargo transportation combining air, rail, and road transportation infrastructure at a single point, with centralized access to key points such as Grande Prairie and Fort McMurray as well as ports on the West Coast of B.C.
• Continued use of alternative or innovative financing arrangements such as private public partnerships to ensure stability of infrastructure funding.
• Further development and use of the Northwest Transportation Corridor (NTC). The NTC is the closest North American gateway to Asia-Pacific markets. The NTC has full infrastructure capability that is under-utilized, including an underdeveloped global air cargo route.
• Partners in Compliance - A joint venture between the Alberta Motor Transport Association, Alberta Infrastructure and Alberta Transportation. The Partners in Compliance Program (“PIC”) is designed to address the issues of regulatory non- compliance and its costly repercussions. The purpose of PIC is not only to assist carriers in developing their own internal regulatory compliance and maintenance program, it is designed to reduce the financial and human costs of incidents through diligent, ongoing self-maintenance practices. The Partners in Compliance program offers participating carriers realistic, achievable goals that guarantee success if established benchmarks are met.
• High speed rail between Calgary and Edmonton corridor. The Government of Alberta
has been exploring the possibility of linking Calgary, Red Deer and Edmonton by high-speed rail passenger service, significantly reducing travel times between the two cities.
57 Government of Alberta, “Alberta’s 20-year Strategic Capital Plan” January 29, 2008
Alberta Industry Sector Performance and Prospects
Alberta Finance and Enterprise
Page 114
Threats
• High energy prices place serious cost pressures on the transportation sector from soaring fuel costs. Although prices have moderated since the summer of 2008, expectations are for prices to return to elevated levels as the global economy recovers.
• New export pipelines are vitally important to the future success of the Alberta oilsands. However, environmental and First Nations objections to these projects pose a threat to their eventual development. New export pipelines construction could also be slowed by a significant fall in commodity prices as well as by a lack of credit availability.
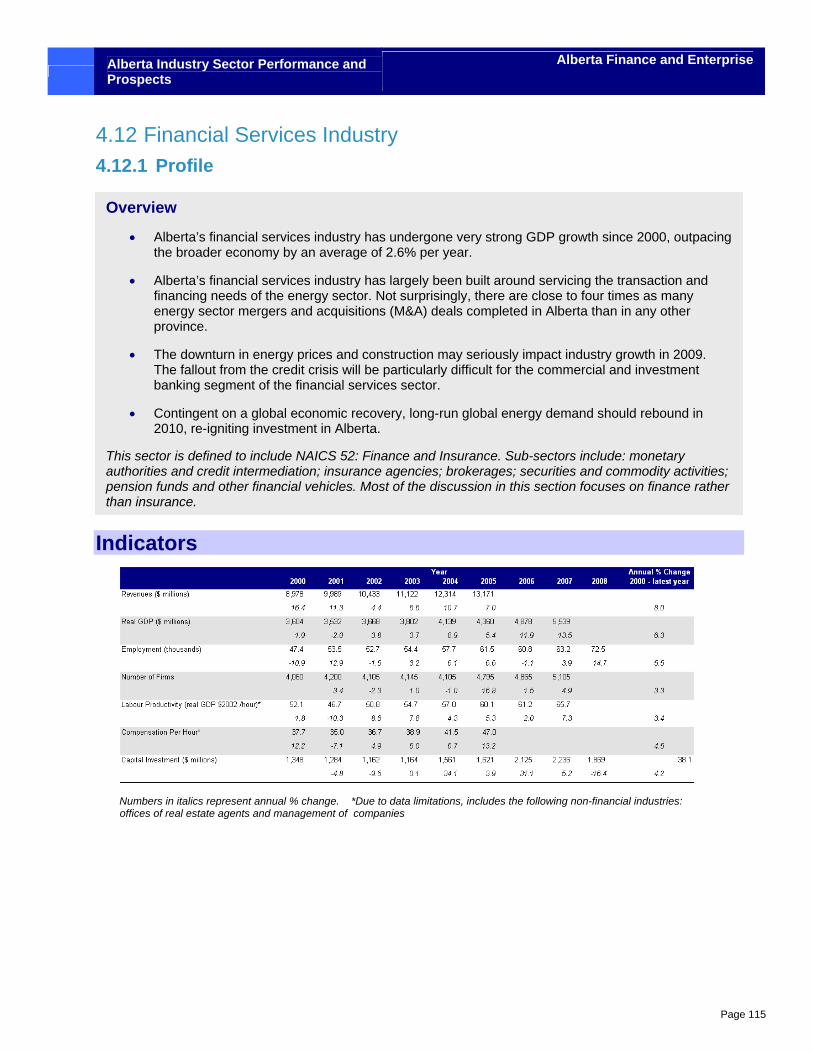
Alberta Industry Sector Performance and Prospects
Alberta Finance and Enterprise
Page 115
4.12 Financial Services Industry 4.12.1 Profile
Indicators
Numbers in italics represent annual % change. *Due to data limitations, includes the following non-financial industries:
offices of real estate agents and management of companies
Overview
• Alberta’s financial services industry has undergone very strong GDP growth since 2000, outpacing the broader economy by an average of 2.6% per year.
• Alberta’s financial services industry has largely been built around servicing the transaction and financing needs of the energy sector. Not surprisingly, there are close to four times as many energy sector mergers and acquisitions (M&A) deals completed in Alberta than in any other province.
• The downturn in energy prices and construction may seriously impact industry growth in 2009. The fallout from the credit crisis will be particularly difficult for the commercial and investment banking segment of the financial services sector.
• Contingent on a global economic recovery, long-run global energy demand should rebound in 2010, re-igniting investment in Alberta.
This sector is defined to include NAICS 52: Finance and Insurance. Sub-sectors include: monetary authorities and credit intermediation; insurance agencies; brokerages; securities and commodity activities; pension funds and other financial vehicles. Most of the discussion in this section focuses on finance rather than insurance.
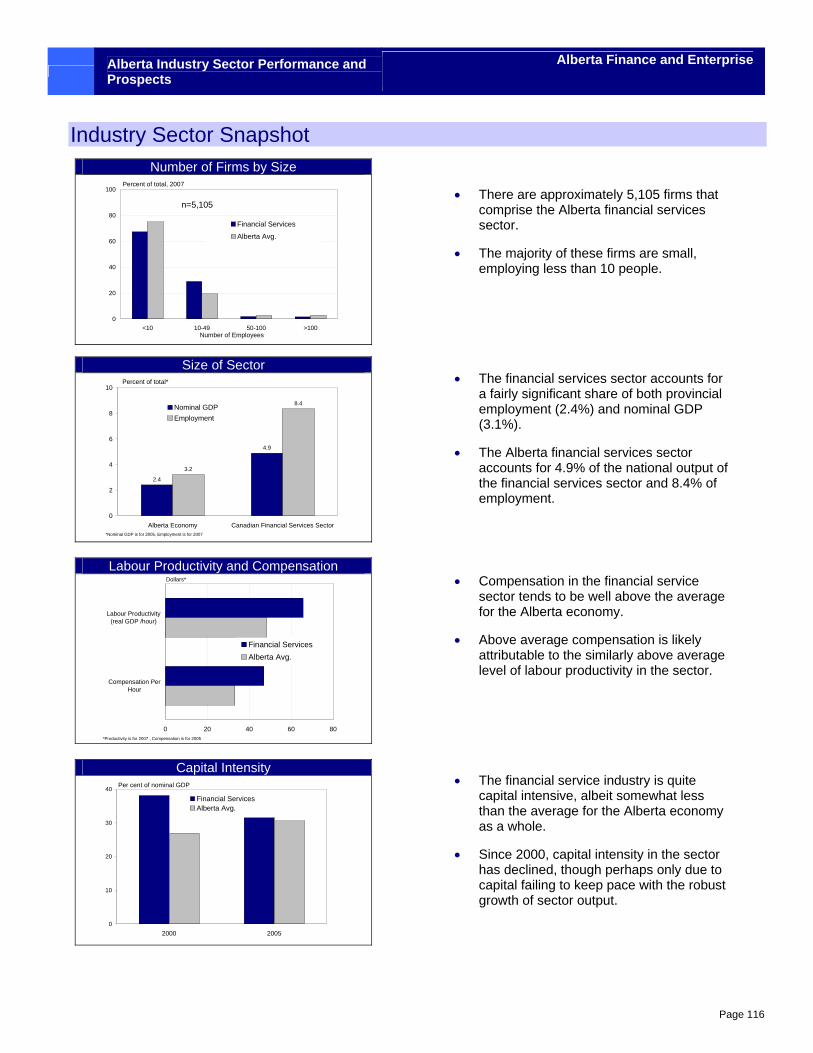
Alberta Industry Sector Performance and Prospects
Alberta Finance and Enterprise
Page 116
Industry Sector Snapshot Number of Firms by Size
0
20
40
60
80
100
<10 10-49 50-100 >100
Financial Services
Alberta Avg.
Percent of total, 2007
n=5,105
Number of Employees
Size of Sector
2.4
4.9
3.2
8.4
0
2
4
6
8
10
Alberta Economy Canadian Financial Services Sector
Nominal GDPEmployment
Percent of total*
*Nominal GDP is for 2005, Employment is for 2007
Labour Productivity and Compensation
0 20 40 60 80
Compensation PerHour
Labour Productivity(real GDP /hour)
Financial ServicesAlberta Avg.
Dollars*
*Productivity is for 2007 , Compensation is for 2005
Capital Intensity
0
10
20
30
40
2000 2005
Financial ServicesAlberta Avg.
Per cent of nominal GDP
• There are approximately 5,105 firms that comprise the Alberta financial services sector.
• The majority of these firms are small, employing less than 10 people.
• The financial services sector accounts for a fairly significant share of both provincial employment (2.4%) and nominal GDP (3.1%).
• The Alberta financial services sector accounts for 4.9% of the national output of the financial services sector and 8.4% of employment.
• Compensation in the financial service sector tends to be well above the average for the Alberta economy.
• Above average compensation is likely attributable to the similarly above average level of labour productivity in the sector.
• The financial service industry is quite capital intensive, albeit somewhat less than the average for the Alberta economy as a whole.
• Since 2000, capital intensity in the sector has declined, though perhaps only due to capital failing to keep pace with the robust growth of sector output.
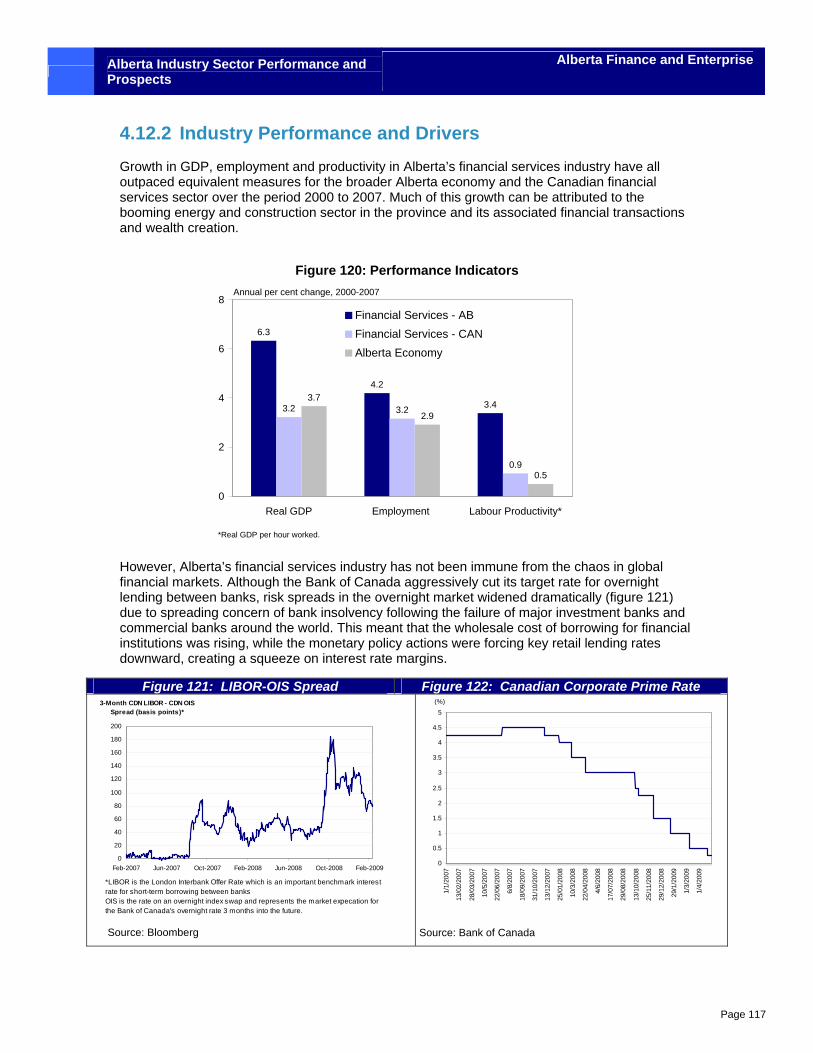
Alberta Industry Sector Performance and Prospects
Alberta Finance and Enterprise
Page 117
4.12.2 Industry Performance and Drivers Growth in GDP, employment and productivity in Alberta’s financial services industry have all outpaced equivalent measures for the broader Alberta economy and the Canadian financial services sector over the period 2000 to 2007. Much of this growth can be attributed to the booming energy and construction sector in the province and its associated financial transactions and wealth creation.
Figure 120: Performance Indicators
6.3
4.2
3.43.2 3.2
0.9
3.7
2.9
0.5
0
2
4
6
8
Real GDP Employment Labour Productivity*
Financial Services - ABFinancial Services - CANAlberta Economy
Annual per cent change, 2000-2007
*Real GDP per hour worked.
However, Alberta’s financial services industry has not been immune from the chaos in global financial markets. Although the Bank of Canada aggressively cut its target rate for overnight lending between banks, risk spreads in the overnight market widened dramatically (figure 121) due to spreading concern of bank insolvency following the failure of major investment banks and commercial banks around the world. This meant that the wholesale cost of borrowing for financial institutions was rising, while the monetary policy actions were forcing key retail lending rates downward, creating a squeeze on interest rate margins.
Figure 121: LIBOR-OIS Spread Figure 122: Canadian Corporate Prime Rate
0
20
40
60
80
100
120
140
160
180
200
Feb-2007 Jun-2007 Oct-2007 Feb-2008 Jun-2008 Oct-2008 Feb-2009
3-Month CDN LIBOR - CDN OIS Spread (basis points)*
*LIBOR is the London Interbank Offer Rate which is an important benchmark interest rate for short-term borrowing between banksOIS is the rate on an overnight index swap and represents the market expecation for the Bank of Canada's overnight rate 3 months into the future.
0
0.5
1
1.5
2
2.5
3
3.5
4
4.5
5
1/1/
2007
13/0
2/20
07
28/0
3/20
07
10/5
/200
7
22/0
6/20
07
6/8/
2007
18/0
9/20
07
31/1
0/20
07
13/1
2/20
07
25/0
1/20
08
10/3
/200
8
22/0
4/20
08
4/6/
2008
17/0
7/20
08
29/0
8/20
08
13/1
0/20
08
25/1
1/20
08
29/1
2/20
08
29/1
/200
9
1/3/
2009
1/4/
2009
(%)
Source: Bloomberg Source: Bank of Canada
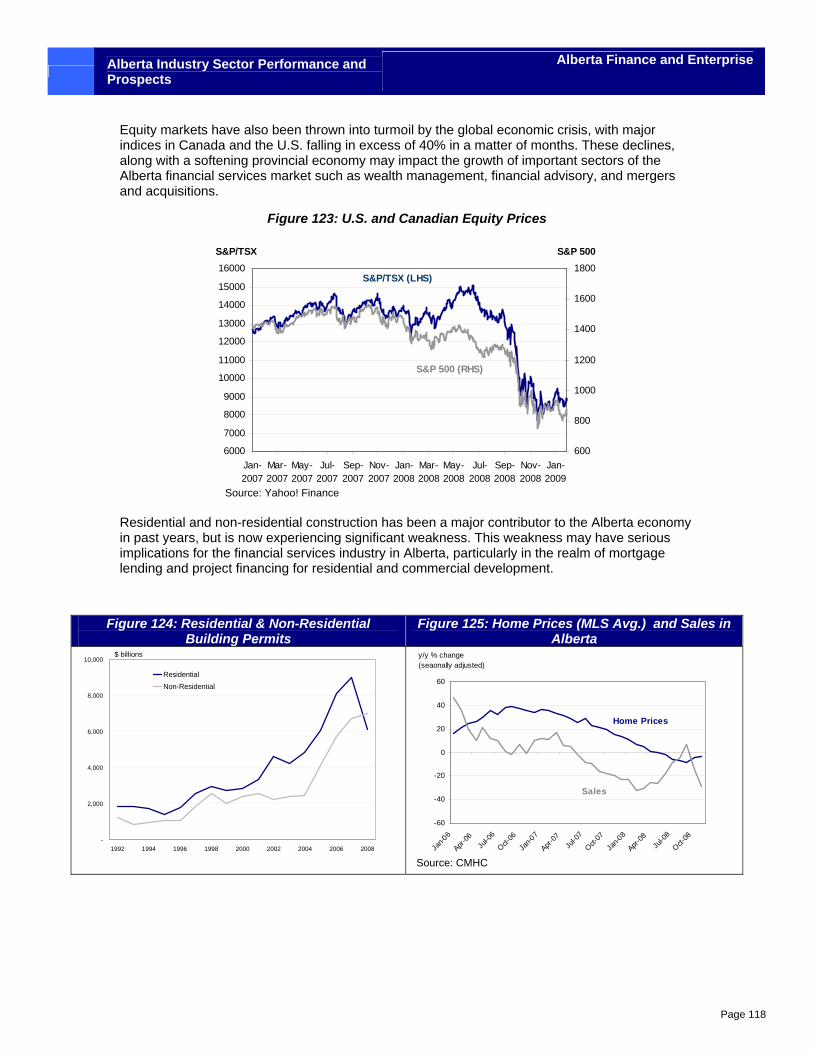
Alberta Industry Sector Performance and Prospects
Alberta Finance and Enterprise
Page 118
Equity markets have also been thrown into turmoil by the global economic crisis, with major indices in Canada and the U.S. falling in excess of 40% in a matter of months. These declines, along with a softening provincial economy may impact the growth of important sectors of the Alberta financial services market such as wealth management, financial advisory, and mergers and acquisitions.
Figure 123: U.S. and Canadian Equity Prices
6000
7000
8000
9000
10000
11000
12000
13000
14000
15000
16000
Jan-2007
Mar-2007
May-2007
Jul-2007
Sep-2007
Nov-2007
Jan-2008
Mar-2008
May-2008
Jul-2008
Sep-2008
Nov-2008
Jan-2009
600
800
1000
1200
1400
1600
1800S&P/TSX (LHS)
S&P 500 (RHS)
S&P/TSX S&P 500
Residential and non-residential construction has been a major contributor to the Alberta economy in past years, but is now experiencing significant weakness. This weakness may have serious implications for the financial services industry in Alberta, particularly in the realm of mortgage lending and project financing for residential and commercial development.
Figure 124: Residential & Non-Residential Building Permits
Figure 125: Home Prices (MLS Avg.) and Sales in Alberta
-
2,000
4,000
6,000
8,000
10,000
1992 1994 1996 1998 2000 2002 2004 2006 2008
ResidentialNon-Residential
$ billions
-60
-40
-20
0
20
40
60
Jan-0
6
Apr-06
Jul-0
6
Oct-06
Jan-0
7
Apr-07
Jul-0
7
Oct-07
Jan-0
8
Apr-08
Jul-0
8
Oct-08
y/y % change (seaonally adjusted)
Sales
Home Prices
Source: CMHC
Source: Yahoo! Finance
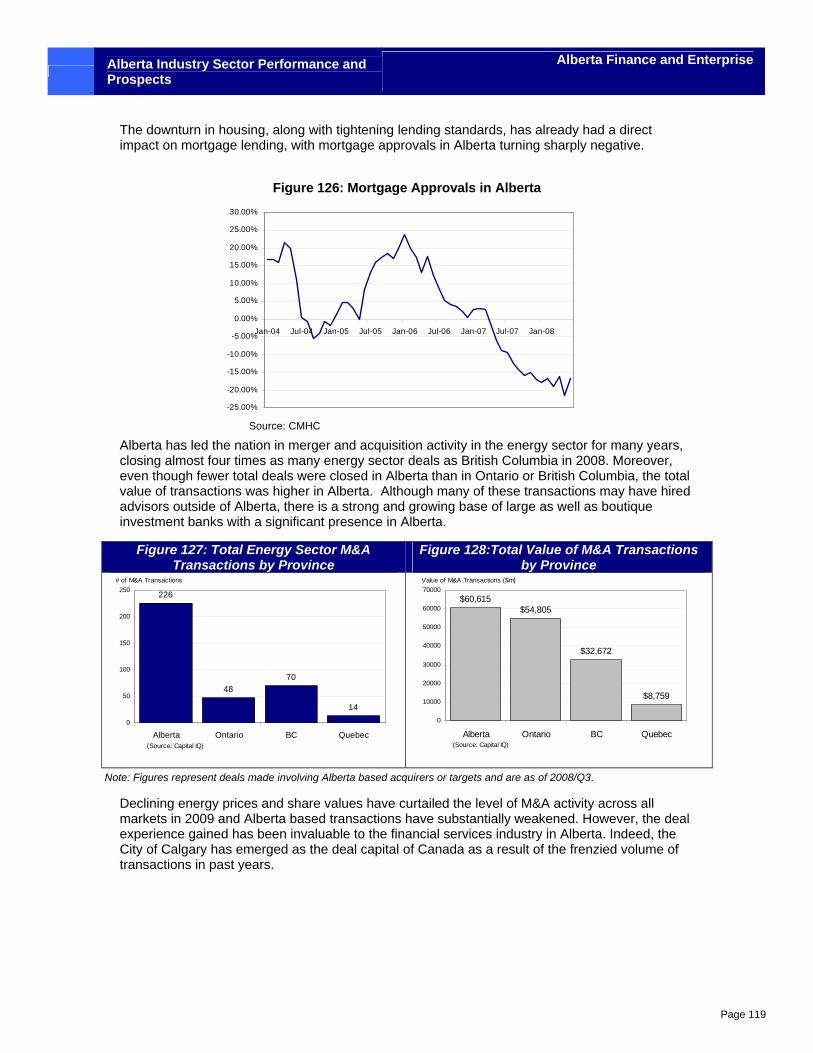
Alberta Industry Sector Performance and Prospects
Alberta Finance and Enterprise
Page 119
The downturn in housing, along with tightening lending standards, has already had a direct impact on mortgage lending, with mortgage approvals in Alberta turning sharply negative.
Figure 126: Mortgage Approvals in Alberta
-25.00%
-20.00%
-15.00%
-10.00%
-5.00%
0.00%
5.00%
10.00%
15.00%
20.00%
25.00%
30.00%
Jan-04 Jul-04 Jan-05 Jul-05 Jan-06 Jul-06 Jan-07 Jul-07 Jan-08
Alberta has led the nation in merger and acquisition activity in the energy sector for many years, closing almost four times as many energy sector deals as British Columbia in 2008. Moreover, even though fewer total deals were closed in Alberta than in Ontario or British Columbia, the total value of transactions was higher in Alberta. Although many of these transactions may have hired advisors outside of Alberta, there is a strong and growing base of large as well as boutique investment banks with a significant presence in Alberta.
Figure 127: Total Energy Sector M&A Transactions by Province
Figure 128:Total Value of M&A Transactions by Province
226
4870
14
0
50
100
150
200
250
Alberta Ontario BC Quebec(Source: Capital IQ)
# of M&A Transactions
$60,615$54,805
$32,672
$8,759
0
10000
20000
30000
40000
50000
60000
70000
Alberta Ontario BC Quebec(Source: Capital IQ)
Value of M&A Transactions ($m)
Declining energy prices and share values have curtailed the level of M&A activity across all markets in 2009 and Alberta based transactions have substantially weakened. However, the deal experience gained has been invaluable to the financial services industry in Alberta. Indeed, the City of Calgary has emerged as the deal capital of Canada as a result of the frenzied volume of transactions in past years.
Source: CMHC
Note: Figures represent deals made involving Alberta based acquirers or targets and are as of 2008/Q3.
Alberta Industry Sector Performance and Prospects
Alberta Finance and Enterprise
Page 120
4.12.3 SWOT Analysis Strengths
• The capital inflows and transaction volumes associated with the Alberta energy sector are clearly a major strength of the Alberta financial services sector. The high volume of deal-flow in recent years has turned Calgary into Canada’s M&A capital and the investment banking community in that city has gained valuable experience that they can now leverage in other sectors.
• Alberta has done exceptionally well in attracting the head offices of many Canadian and international firms. More head offices means more decision makers located in the province, and therefore increased demand for key financial advisory services.
Weaknesses
• Like many sectors in Alberta, the financial services industry is highly reliant on the energy sector for growth.
Opportunities
• The Alberta banking industry has gained valuable experience from the volume of transactions generated by the energy boom of the past five years. This presents and excellent opportunity to leverage that experience into other sectors of the Alberta economy.
• One area where Alberta’s financial sector is lagging is venture capital. This deficiency is closely associated with Alberta’s overall struggles with innovation and productivity growth. The expertise in business evaluation and deal-making gained in past years presents an opportunity for the unlocking of entrepreneurial spirits in non-energy sectors of the Alberta economy.
Threats
• Given the reliance of the Alberta economy on energy as a growth driver, in absence of economic diversification, any threat to that sector could destabilize the Alberta economy and therefore its financial services industry.
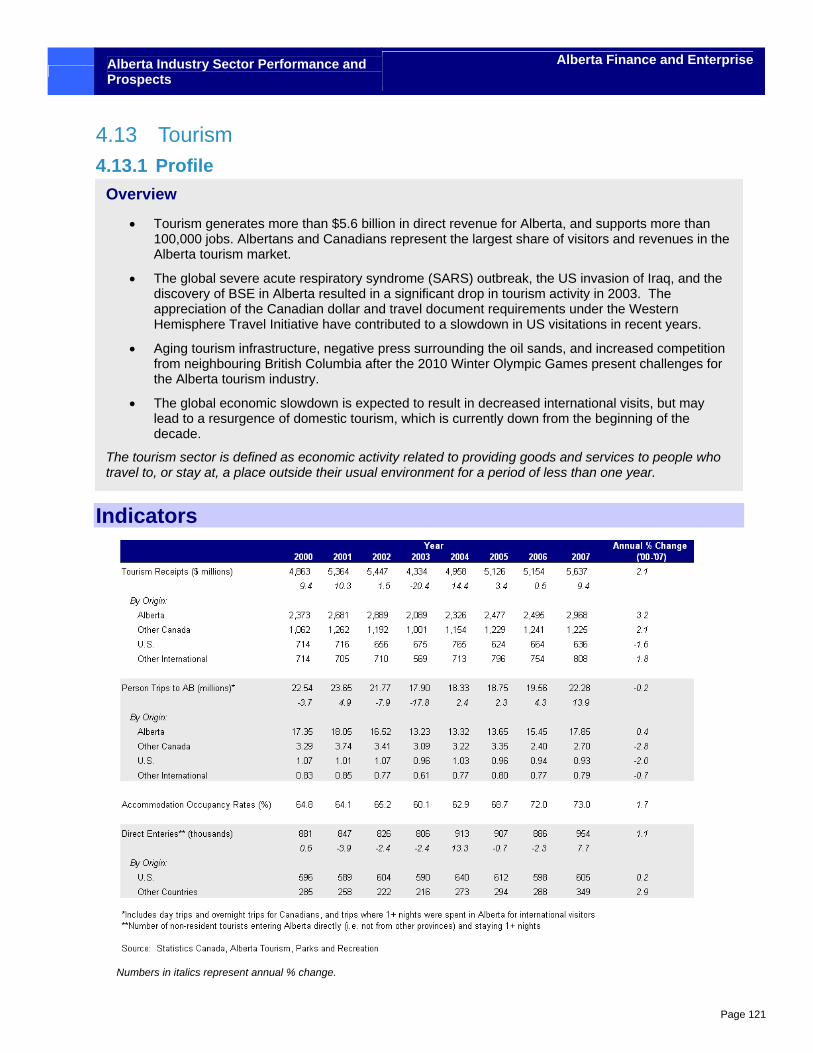
Alberta Industry Sector Performance and Prospects
Alberta Finance and Enterprise
Page 121
4.13 Tourism 4.13.1 Profile
Indicators
Numbers in italics represent annual % change.
Overview
• Tourism generates more than $5.6 billion in direct revenue for Alberta, and supports more than 100,000 jobs. Albertans and Canadians represent the largest share of visitors and revenues in the Alberta tourism market.
• The global severe acute respiratory syndrome (SARS) outbreak, the US invasion of Iraq, and the discovery of BSE in Alberta resulted in a significant drop in tourism activity in 2003. The appreciation of the Canadian dollar and travel document requirements under the Western Hemisphere Travel Initiative have contributed to a slowdown in US visitations in recent years.
• Aging tourism infrastructure, negative press surrounding the oil sands, and increased competition from neighbouring British Columbia after the 2010 Winter Olympic Games present challenges for the Alberta tourism industry.
• The global economic slowdown is expected to result in decreased international visits, but may lead to a resurgence of domestic tourism, which is currently down from the beginning of the decade.
The tourism sector is defined as economic activity related to providing goods and services to people who travel to, or stay at, a place outside their usual environment for a period of less than one year.
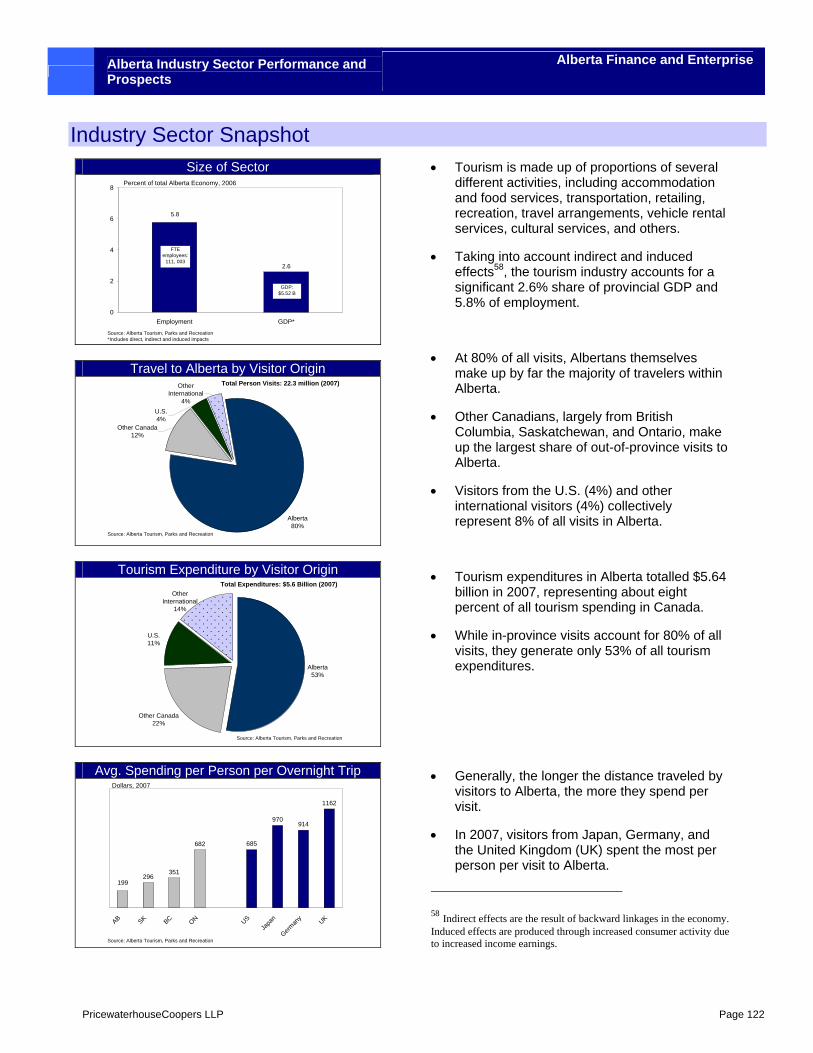
Alberta Industry Sector Performance and Prospects
Alberta Finance and Enterprise
PricewaterhouseCoopers LLP Page 122
Industry Sector Snapshot Size of Sector
2.6
5.8
0
2
4
6
8
Employment GDP*
Percent of total Alberta Economy, 2006
GDP: $5.52 B
FTE employees:
111, 003
Source: Alberta Tourism, Parks and Recreation*Includes direct, indirect and induced impacts
Travel to Alberta by Visitor Origin
Alberta80%
Other Canada12%
U.S.4%
Other International
4%
Total Person Visits: 22.3 million (2007)
Source: Alberta Tourism, Parks and Recreation
Tourism Expenditure by Visitor Origin
Alberta53%
Other Canada22%
U.S.11%
Other International
14%
Total Expenditures: $5.6 Billion (2007)
Source: Alberta Tourism, Parks and Recreation
Avg. Spending per Person per Overnight Trip
296351
682 685
970914
1162
199
AB SK BC ON USJa
pan
German
y UK
Dollars, 2007
Source: Alberta Tourism, Parks and Recreation
• Tourism is made up of proportions of several different activities, including accommodation and food services, transportation, retailing, recreation, travel arrangements, vehicle rental services, cultural services, and others.
• Taking into account indirect and induced effects58, the tourism industry accounts for a significant 2.6% share of provincial GDP and 5.8% of employment.
• At 80% of all visits, Albertans themselves make up by far the majority of travelers within Alberta.
• Other Canadians, largely from British Columbia, Saskatchewan, and Ontario, make up the largest share of out-of-province visits to Alberta.
• Visitors from the U.S. (4%) and other international visitors (4%) collectively represent 8% of all visits in Alberta.
• Tourism expenditures in Alberta totalled $5.64 billion in 2007, representing about eight percent of all tourism spending in Canada.
• While in-province visits account for 80% of all visits, they generate only 53% of all tourism expenditures.
• Generally, the longer the distance traveled by visitors to Alberta, the more they spend per visit.
• In 2007, visitors from Japan, Germany, and the United Kingdom (UK) spent the most per person per visit to Alberta.
58 Indirect effects are the result of backward linkages in the economy. Induced effects are produced through increased consumer activity due to increased income earnings.
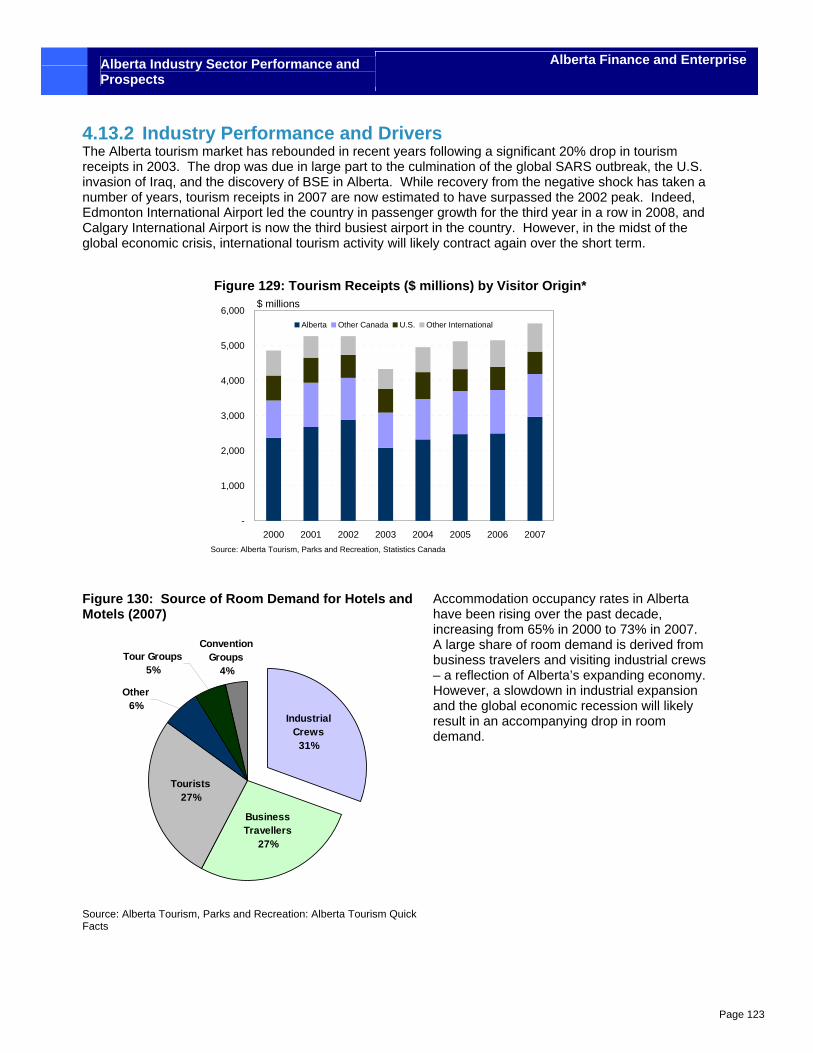
Alberta Industry Sector Performance and Prospects
Alberta Finance and Enterprise
Page 123
4.13.2 Industry Performance and Drivers The Alberta tourism market has rebounded in recent years following a significant 20% drop in tourism receipts in 2003. The drop was due in large part to the culmination of the global SARS outbreak, the U.S. invasion of Iraq, and the discovery of BSE in Alberta. While recovery from the negative shock has taken a number of years, tourism receipts in 2007 are now estimated to have surpassed the 2002 peak. Indeed, Edmonton International Airport led the country in passenger growth for the third year in a row in 2008, and Calgary International Airport is now the third busiest airport in the country. However, in the midst of the global economic crisis, international tourism activity will likely contract again over the short term.
Figure 129: Tourism Receipts ($ millions) by Visitor Origin*
-
1,000
2,000
3,000
4,000
5,000
6,000
2000 2001 2002 2003 2004 2005 2006 2007
Alberta Other Canada U.S. Other International
$ millions
Source: Alberta Tourism, Parks and Recreation, Statistics Canada Figure 130: Source of Room Demand for Hotels and Motels (2007)
Convention Groups
4%Tour Groups
5%
Other6%
Tourists27%
Business Travellers
27%
Industrial Crews
31%
Source: Alberta Tourism, Parks and Recreation: Alberta Tourism Quick Facts
Accommodation occupancy rates in Alberta have been rising over the past decade, increasing from 65% in 2000 to 73% in 2007. A large share of room demand is derived from business travelers and visiting industrial crews – a reflection of Alberta’s expanding economy. However, a slowdown in industrial expansion and the global economic recession will likely result in an accompanying drop in room demand.
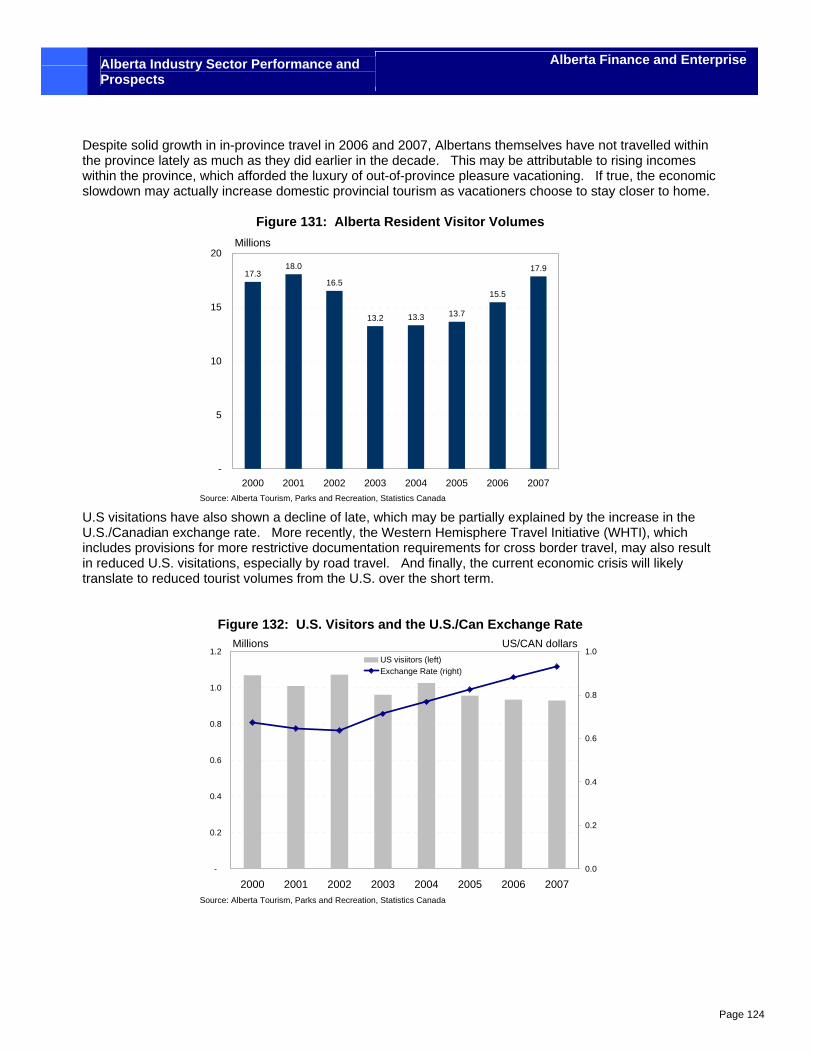
Alberta Industry Sector Performance and Prospects
Alberta Finance and Enterprise
Page 124
Despite solid growth in in-province travel in 2006 and 2007, Albertans themselves have not travelled within the province lately as much as they did earlier in the decade. This may be attributable to rising incomes within the province, which afforded the luxury of out-of-province pleasure vacationing. If true, the economic slowdown may actually increase domestic provincial tourism as vacationers choose to stay closer to home.
Figure 131: Alberta Resident Visitor Volumes
17.318.0
16.5
13.2 13.3 13.7
15.5
17.9
-
5
10
15
20
2000 2001 2002 2003 2004 2005 2006 2007
Millions
Source: Alberta Tourism, Parks and Recreation, Statistics Canada U.S visitations have also shown a decline of late, which may be partially explained by the increase in the U.S./Canadian exchange rate. More recently, the Western Hemisphere Travel Initiative (WHTI), which includes provisions for more restrictive documentation requirements for cross border travel, may also result in reduced U.S. visitations, especially by road travel. And finally, the current economic crisis will likely translate to reduced tourist volumes from the U.S. over the short term.
Figure 132: U.S. Visitors and the U.S./Can Exchange Rate
-
0.2
0.4
0.6
0.8
1.0
1.2
2000 2001 2002 2003 2004 2005 2006 20070.0
0.2
0.4
0.6
0.8
1.0US visiitors (left)Exchange Rate (right)
Millions
Source: Alberta Tourism, Parks and Recreation, Statistics Canada
US/CAN dollars
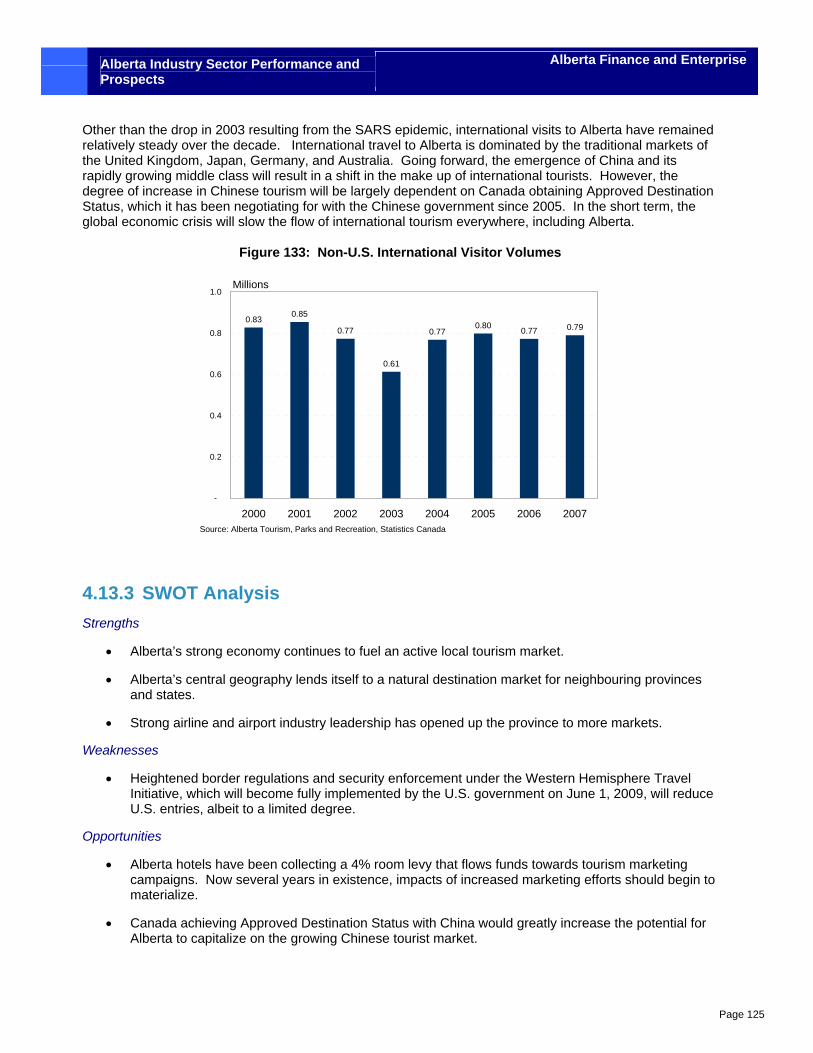
Alberta Industry Sector Performance and Prospects
Alberta Finance and Enterprise
Page 125
Other than the drop in 2003 resulting from the SARS epidemic, international visits to Alberta have remained relatively steady over the decade. International travel to Alberta is dominated by the traditional markets of the United Kingdom, Japan, Germany, and Australia. Going forward, the emergence of China and its rapidly growing middle class will result in a shift in the make up of international tourists. However, the degree of increase in Chinese tourism will be largely dependent on Canada obtaining Approved Destination Status, which it has been negotiating for with the Chinese government since 2005. In the short term, the global economic crisis will slow the flow of international tourism everywhere, including Alberta.
Figure 133: Non-U.S. International Visitor Volumes
0.830.85
0.77
0.61
0.770.80 0.77 0.79
-
0.2
0.4
0.6
0.8
1.0
2000 2001 2002 2003 2004 2005 2006 2007
Millions
Source: Alberta Tourism, Parks and Recreation, Statistics Canada
4.13.3 SWOT Analysis Strengths
• Alberta’s strong economy continues to fuel an active local tourism market.
• Alberta’s central geography lends itself to a natural destination market for neighbouring provinces and states.
• Strong airline and airport industry leadership has opened up the province to more markets.
Weaknesses
• Heightened border regulations and security enforcement under the Western Hemisphere Travel Initiative, which will become fully implemented by the U.S. government on June 1, 2009, will reduce U.S. entries, albeit to a limited degree.
Opportunities
• Alberta hotels have been collecting a 4% room levy that flows funds towards tourism marketing campaigns. Now several years in existence, impacts of increased marketing efforts should begin to materialize.
• Canada achieving Approved Destination Status with China would greatly increase the potential for Alberta to capitalize on the growing Chinese tourist market.
Alberta Industry Sector Performance and Prospects
Alberta Finance and Enterprise
Page 126
• Continued achievement of bilateral Open Skies agreements, which would allow increased international flights into and within Canada, would increase airport activity and related tourism expenditures.
• The Edmonton International Airport has launched a billion-dollar expansion that will double the number of aircraft gates and add other state-of-the-art infrastructure by 2012 to speed up passenger flow and check-in.
• The Canadian “Badlands” of South East Alberta are an untapped natural beauty now beginning to be developed for the tourism market.
• A slowdown in economic activity may be an opportunity to increase the domestic provincial tourism market as residents cut back on discretionary spending.
• E-Marketing offers new opportunities in all markets.
Threats
• The current global economic slowdown is likely to impact negatively on both pleasure-based and business/industrial-based tourism and travel demand over the short term. Temporary workers and crews currently represent a significant proportion of hotel and related revenues.
• The 2010 Winter Games in Vancouver and Whistler is expected to draw a significant amount of domestic and international visitors to neighbouring British Columbia both during and after the Games. As a fellow winter destination market, Alberta may see many of its visitors siphoned away to British Columbia in the afterglow of the Games. However, Alberta has established an Olympic and Paralympic Secretariat designed to capitalize on the world-wide exposure generated by the Games in Vancouver, which may in fact turn the threat into an opportunity.
• As the mountain pine beetle outbreak makes its way over the Rockies from British Columbia, Alberta’s national parks will be seriously threatened and may see significant and rapid tree mortality over the coming decade. Such a blemish on the face of these provincial treasures could have significant consequences for the Alberta tourism market.
• As global environmental awareness and media attention increases, Alberta’s oil sands development will continue to generate negative publicity for the province and threaten its reputation for natural beauty.
• Growing consumer awareness and interest in supporting environmentally-responsible travel practices, for instance the carbon footprint is a rising concern for Canadian travellers. (Source: CBoC – Travel Exclusive – Key Trends for the Canadian Travel Industry (Nov.-Dec. 2008))
• In the short term, tightening global credit markets could delay or cancel large resort developments
scheduled throughout the province.
• Commercial airline restructuring in the U.S. may affect air access into Alberta.
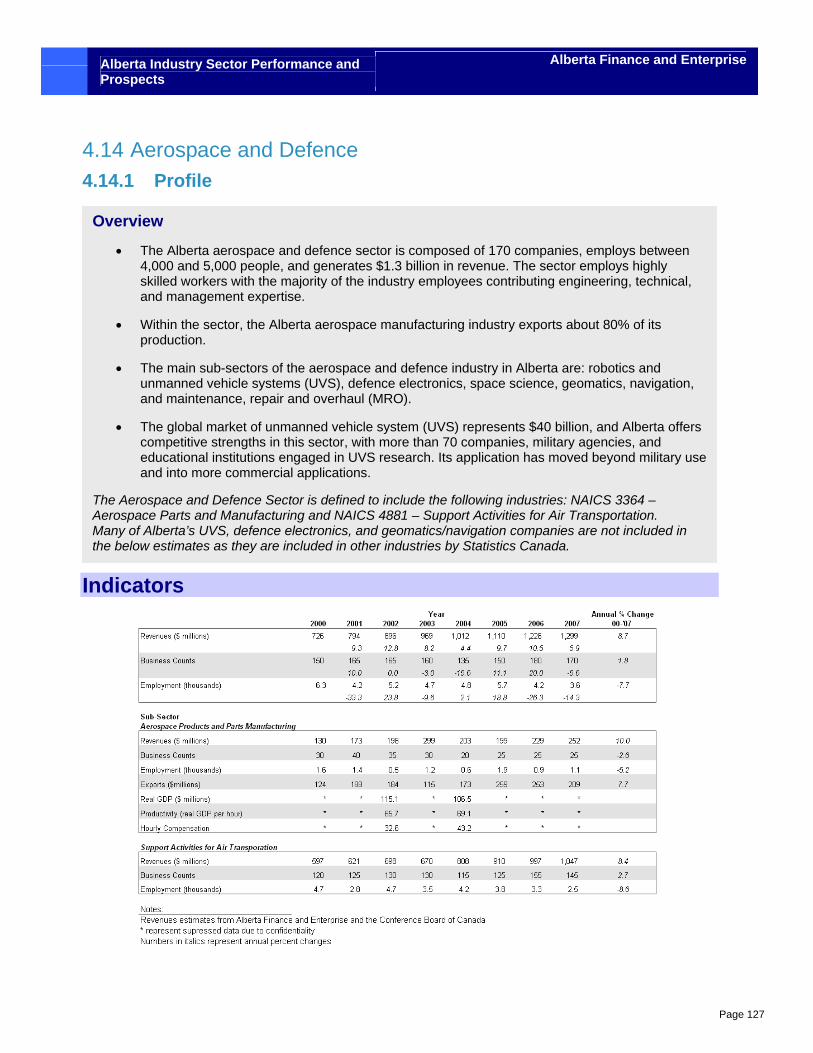
Alberta Industry Sector Performance and Prospects
Alberta Finance and Enterprise
Page 127
4.14 Aerospace and Defence 4.14.1 Profile
Indicators
Overview
• The Alberta aerospace and defence sector is composed of 170 companies, employs between 4,000 and 5,000 people, and generates $1.3 billion in revenue. The sector employs highly skilled workers with the majority of the industry employees contributing engineering, technical, and management expertise.
• Within the sector, the Alberta aerospace manufacturing industry exports about 80% of its production.
• The main sub-sectors of the aerospace and defence industry in Alberta are: robotics and unmanned vehicle systems (UVS), defence electronics, space science, geomatics, navigation, and maintenance, repair and overhaul (MRO).
• The global market of unmanned vehicle system (UVS) represents $40 billion, and Alberta offers competitive strengths in this sector, with more than 70 companies, military agencies, and educational institutions engaged in UVS research. Its application has moved beyond military use and into more commercial applications.
The Aerospace and Defence Sector is defined to include the following industries: NAICS 3364 – Aerospace Parts and Manufacturing and NAICS 4881 – Support Activities for Air Transportation. Many of Alberta’s UVS, defence electronics, and geomatics/navigation companies are not included in the below estimates as they are included in other industries by Statistics Canada.
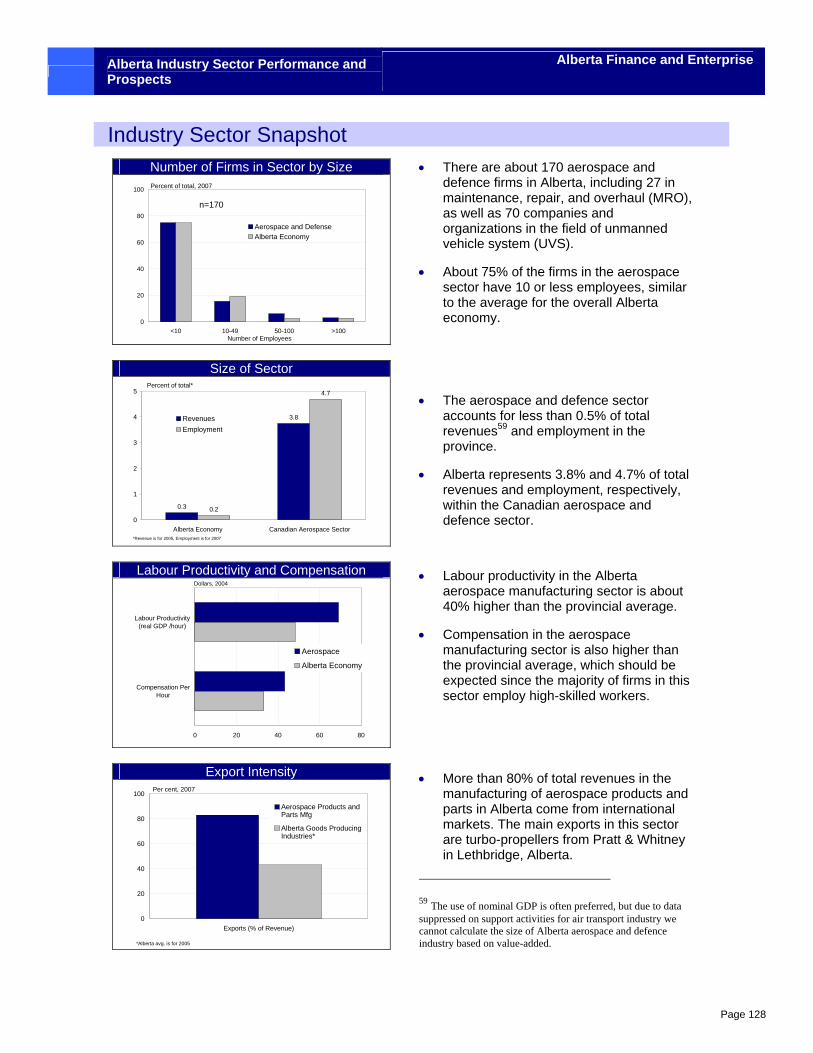
Alberta Industry Sector Performance and Prospects
Alberta Finance and Enterprise
Page 128
Industry Sector Snapshot Number of Firms in Sector by Size
0
20
40
60
80
100
<10 10-49 50-100 >100
Aerospace and DefenseAlberta Economy
Percent of total, 2007
n=170
Number of Employees
Size of Sector
0.3
3.8
0.2
4.7
0
1
2
3
4
5
Alberta Economy Canadian Aerospace Sector
RevenuesEmployment
Percent of total*
*Revenue is for 2005, Employment is for 2007
Labour Productivity and Compensation
0 20 40 60 80
Compensation PerHour
Labour Productivity(real GDP /hour)
Aerospace
Alberta Economy
Dollars, 2004
Export Intensity
0
20
40
60
80
100
Exports (% of Revenue)
Aerospace Products andParts Mfg
Alberta Goods ProducingIndustries*
Per cent, 2007
*Alberta avg. is for 2005
• There are about 170 aerospace and defence firms in Alberta, including 27 in maintenance, repair, and overhaul (MRO), as well as 70 companies and organizations in the field of unmanned vehicle system (UVS).
• About 75% of the firms in the aerospace sector have 10 or less employees, similar to the average for the overall Alberta economy.
• The aerospace and defence sector accounts for less than 0.5% of total revenues59 and employment in the province.
• Alberta represents 3.8% and 4.7% of total revenues and employment, respectively, within the Canadian aerospace and defence sector.
• Labour productivity in the Alberta aerospace manufacturing sector is about 40% higher than the provincial average.
• Compensation in the aerospace manufacturing sector is also higher than the provincial average, which should be expected since the majority of firms in this sector employ high-skilled workers.
• More than 80% of total revenues in the manufacturing of aerospace products and parts in Alberta come from international markets. The main exports in this sector are turbo-propellers from Pratt & Whitney in Lethbridge, Alberta.
59 The use of nominal GDP is often preferred, but due to data suppressed on support activities for air transport industry we cannot calculate the size of Alberta aerospace and defence industry based on value-added.
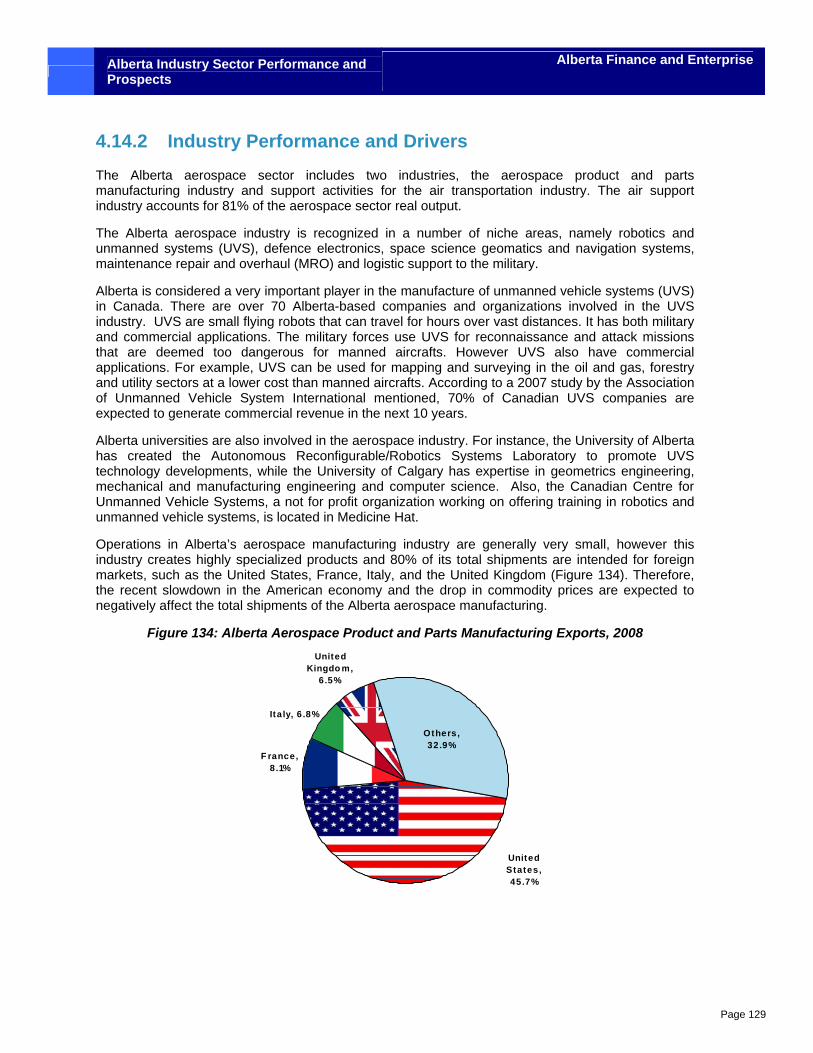
Alberta Industry Sector Performance and Prospects
Alberta Finance and Enterprise
Page 129
4.14.2 Industry Performance and Drivers
The Alberta aerospace sector includes two industries, the aerospace product and parts manufacturing industry and support activities for the air transportation industry. The air support industry accounts for 81% of the aerospace sector real output.
The Alberta aerospace industry is recognized in a number of niche areas, namely robotics and unmanned systems (UVS), defence electronics, space science geomatics and navigation systems, maintenance repair and overhaul (MRO) and logistic support to the military.
Alberta is considered a very important player in the manufacture of unmanned vehicle systems (UVS) in Canada. There are over 70 Alberta-based companies and organizations involved in the UVS industry. UVS are small flying robots that can travel for hours over vast distances. It has both military and commercial applications. The military forces use UVS for reconnaissance and attack missions that are deemed too dangerous for manned aircrafts. However UVS also have commercial applications. For example, UVS can be used for mapping and surveying in the oil and gas, forestry and utility sectors at a lower cost than manned aircrafts. According to a 2007 study by the Association of Unmanned Vehicle System International mentioned, 70% of Canadian UVS companies are expected to generate commercial revenue in the next 10 years.
Alberta universities are also involved in the aerospace industry. For instance, the University of Alberta has created the Autonomous Reconfigurable/Robotics Systems Laboratory to promote UVS technology developments, while the University of Calgary has expertise in geometrics engineering, mechanical and manufacturing engineering and computer science. Also, the Canadian Centre for Unmanned Vehicle Systems, a not for profit organization working on offering training in robotics and unmanned vehicle systems, is located in Medicine Hat.
Operations in Alberta’s aerospace manufacturing industry are generally very small, however this industry creates highly specialized products and 80% of its total shipments are intended for foreign markets, such as the United States, France, Italy, and the United Kingdom (Figure 134). Therefore, the recent slowdown in the American economy and the drop in commodity prices are expected to negatively affect the total shipments of the Alberta aerospace manufacturing.
Figure 134: Alberta Aerospace Product and Parts Manufacturing Exports, 2008
F rance, 8 .1%
Italy, 6 .8%
United Kingdo m,
6.5%
Others, 32.9%
United States, 45.7%
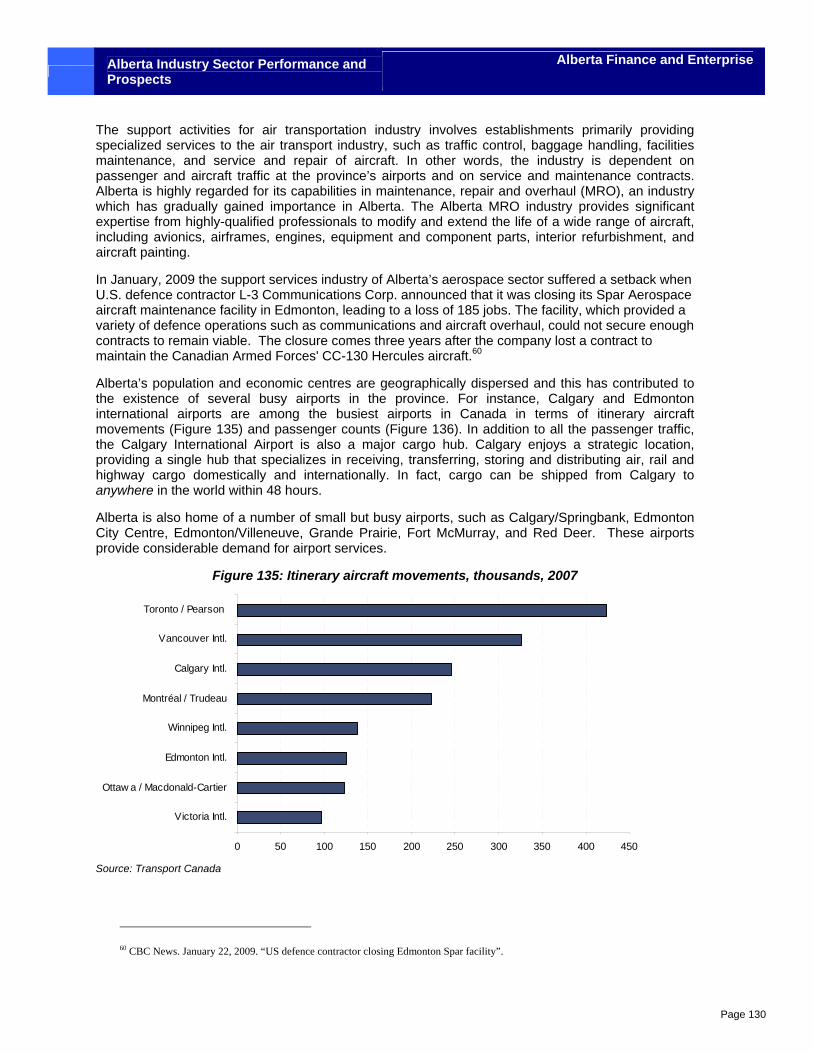
Alberta Industry Sector Performance and Prospects
Alberta Finance and Enterprise
Page 130
The support activities for air transportation industry involves establishments primarily providing specialized services to the air transport industry, such as traffic control, baggage handling, facilities maintenance, and service and repair of aircraft. In other words, the industry is dependent on passenger and aircraft traffic at the province’s airports and on service and maintenance contracts. Alberta is highly regarded for its capabilities in maintenance, repair and overhaul (MRO), an industry which has gradually gained importance in Alberta. The Alberta MRO industry provides significant expertise from highly-qualified professionals to modify and extend the life of a wide range of aircraft, including avionics, airframes, engines, equipment and component parts, interior refurbishment, and aircraft painting.
In January, 2009 the support services industry of Alberta’s aerospace sector suffered a setback when U.S. defence contractor L-3 Communications Corp. announced that it was closing its Spar Aerospace aircraft maintenance facility in Edmonton, leading to a loss of 185 jobs. The facility, which provided a variety of defence operations such as communications and aircraft overhaul, could not secure enough contracts to remain viable. The closure comes three years after the company lost a contract to maintain the Canadian Armed Forces' CC-130 Hercules aircraft.60
Alberta’s population and economic centres are geographically dispersed and this has contributed to the existence of several busy airports in the province. For instance, Calgary and Edmonton international airports are among the busiest airports in Canada in terms of itinerary aircraft movements (Figure 135) and passenger counts (Figure 136). In addition to all the passenger traffic, the Calgary International Airport is also a major cargo hub. Calgary enjoys a strategic location, providing a single hub that specializes in receiving, transferring, storing and distributing air, rail and highway cargo domestically and internationally. In fact, cargo can be shipped from Calgary to anywhere in the world within 48 hours.
Alberta is also home of a number of small but busy airports, such as Calgary/Springbank, Edmonton City Centre, Edmonton/Villeneuve, Grande Prairie, Fort McMurray, and Red Deer. These airports provide considerable demand for airport services.
Figure 135: Itinerary aircraft movements, thousands, 2007
0 50 100 150 200 250 300 350 400 450
Victoria Intl.
Ottaw a / Macdonald-Cartier
Edmonton Intl.
Winnipeg Intl.
Montréal / Trudeau
Calgary Intl.
Vancouver Intl.
Toronto / Pearson
Source: Transport Canada
60 CBC News. January 22, 2009. “US defence contractor closing Edmonton Spar facility”.
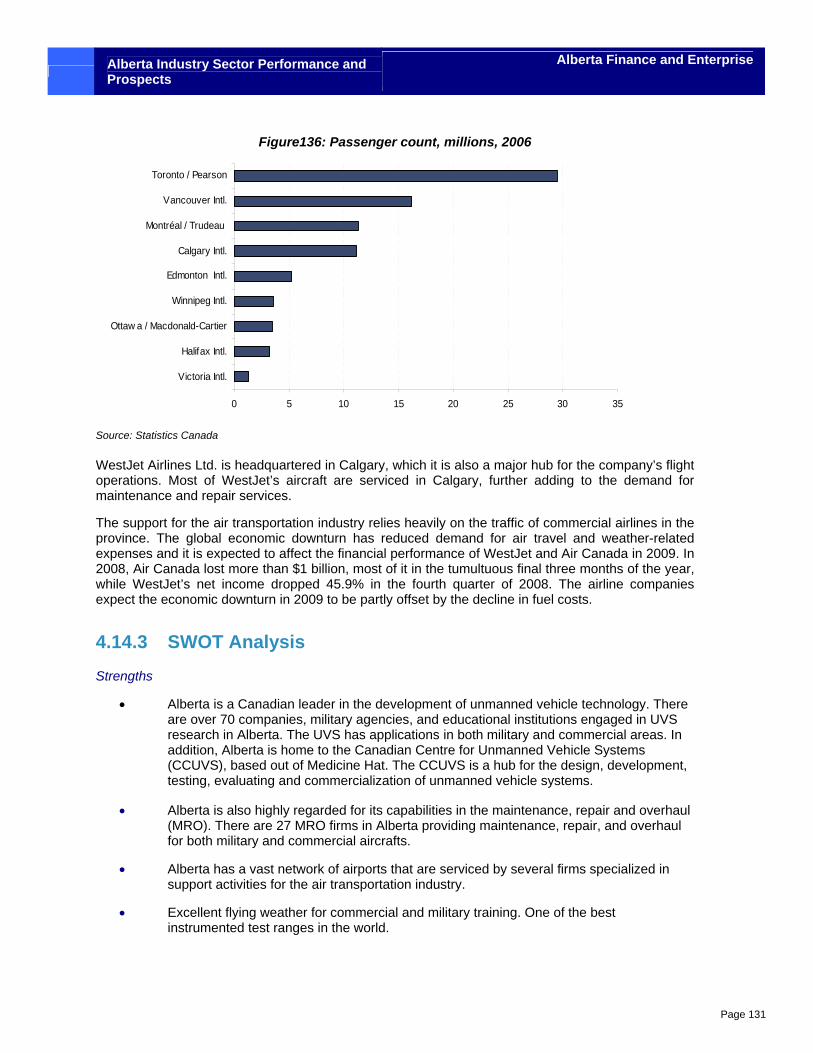
Alberta Industry Sector Performance and Prospects
Alberta Finance and Enterprise
Page 131
Figure136: Passenger count, millions, 2006
0 5 10 15 20 25 30 35
Victoria Intl.
Halifax Intl.
Ottaw a / Macdonald-Cartier
Winnipeg Intl.
Edmonton Intl.
Calgary Intl.
Montréal / Trudeau
Vancouver Intl.
Toronto / Pearson
Source: Statistics Canada
WestJet Airlines Ltd. is headquartered in Calgary, which it is also a major hub for the company’s flight operations. Most of WestJet’s aircraft are serviced in Calgary, further adding to the demand for maintenance and repair services.
The support for the air transportation industry relies heavily on the traffic of commercial airlines in the province. The global economic downturn has reduced demand for air travel and weather-related expenses and it is expected to affect the financial performance of WestJet and Air Canada in 2009. In 2008, Air Canada lost more than $1 billion, most of it in the tumultuous final three months of the year, while WestJet’s net income dropped 45.9% in the fourth quarter of 2008. The airline companies expect the economic downturn in 2009 to be partly offset by the decline in fuel costs.
4.14.3 SWOT Analysis
Strengths
• Alberta is a Canadian leader in the development of unmanned vehicle technology. There are over 70 companies, military agencies, and educational institutions engaged in UVS research in Alberta. The UVS has applications in both military and commercial areas. In addition, Alberta is home to the Canadian Centre for Unmanned Vehicle Systems (CCUVS), based out of Medicine Hat. The CCUVS is a hub for the design, development, testing, evaluating and commercialization of unmanned vehicle systems.
• Alberta is also highly regarded for its capabilities in the maintenance, repair and overhaul (MRO). There are 27 MRO firms in Alberta providing maintenance, repair, and overhaul for both military and commercial aircrafts.
• Alberta has a vast network of airports that are serviced by several firms specialized in support activities for the air transportation industry.
• Excellent flying weather for commercial and military training. One of the best instrumented test ranges in the world.
Alberta Industry Sector Performance and Prospects
Alberta Finance and Enterprise
Page 132
• Alberta is becoming recognized as a world-class flight and technician training center. Some countries that don’t have the capacity to train aviation specialist are sending students to Alberta (e.g. Sky Wings Aviation Academy in Red Deer, Alberta).
• The University of Alberta and the University of Calgary are national leaders in space
science research, accounting for about 50% of the Natural Sciences and Engineering Research Council of Canada (NSERC) funding for the study of space science.
Weaknesses
• Alberta’s universities have no specific aerospace engineering program, which it makes more difficult to create a significant aerospace cluster in the province.
• Skills development. Lack of training programs and awareness of aerospace career opportunities in Alberta.
• Recent growth in Alberta’s economy has put upward pressure on business costs, making
Alberta’s aerospace industry less cost competitive on an international level. • Despite significant investments in space science research at the University of Calgary
and the University of Alberta, there is very little applied R&D that focuses on bringing technology to the market (e.g. commercialization). The province’s new technology commercialization action plan, which includes a 10% provincial R&D tax credit, may provide some support in this regard.
• The aerospace products and parts manufacturing sector in the province is highly
dependent on exports, mainly to the U.S. and Europe. The current global economic slowdown has the potential to severely and negatively impact the industry.
Opportunities
• Potential for UVS companies to sell their products beyond military use and into commercial applications, such as oil and gas pipeline surveillance, forestry monitoring, law enforcement, etc.
• Growth of the aerospace sector could be accelerated by leveraging off research done at Alberta’s university and colleges with a focus on technology commercialization. A closer connection between university and more market-oriented company R&D could be created through a center of excellence for aerospace R&D.
• To ensure workers in the aerospace sector do not migrate to higher paying sectors (e.g. oil and gas), there is an opportunity for government to increase investment in aerospace R&D and to develop a human resources strategy specific to the aerospace industry.
• Creation of Port Alberta, making Edmonton International Airport a gateway for cargo transportation. This would increase demand for support activities for air transportation in the province.
• To improve Alberta’s aerospace infrastructure, a high tech airpark could be created to centralize aerospace innovations while also attracting new technology to the province.
Alberta Industry Sector Performance and Prospects
Alberta Finance and Enterprise
Page 133
Threats
• Opportunities for Alberta’s UVS sector might be limited if oil and gas companies continue to put capital investment spending on hold.
• Competition from established aerospace clusters in other provinces and countries (e.g. Montreal and Seattle) that might want to venture into developing expertise in the UVS and MRO sectors. In Southeast Asia, several low cost companies offering MRO services have emerged, placing additional stress on Alberta companies.
• The industry is susceptible to changes in federal policies towards defence procurement contracts.
• The bulk of companies in Alberta’s aerospace sector are small and medium sized enterprises (SMEs), making them highly vulnerable to the recent deterioration in credit markets. Moreover, relative to larger companies, it is more difficult and costly for SMEs to market themselves globally.
• The tightening of the U.S. International Traffic in Arms Regulations (ITAR) may impact suppliers of security-related technologies and products to the U.S.
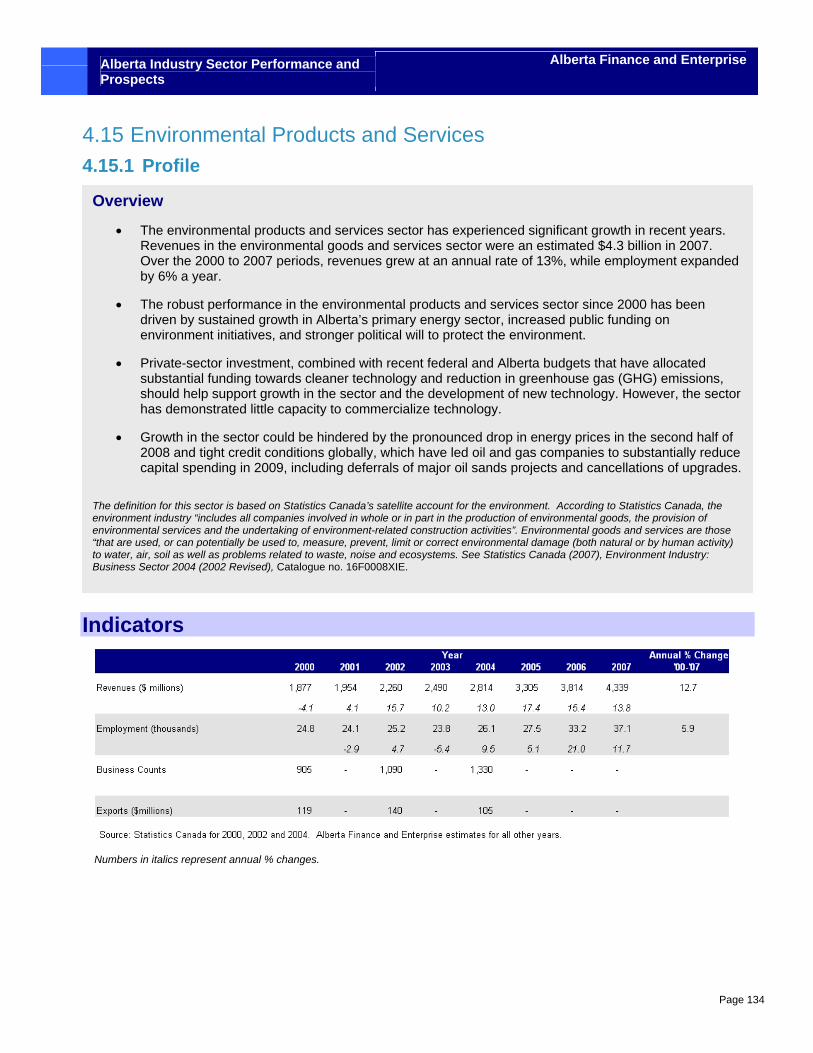
Alberta Industry Sector Performance and Prospects
Alberta Finance and Enterprise
Page 134
4.15 Environmental Products and Services 4.15.1 Profile
Indicators
Numbers in italics represent annual % changes.
Overview
• The environmental products and services sector has experienced significant growth in recent years. Revenues in the environmental goods and services sector were an estimated $4.3 billion in 2007. Over the 2000 to 2007 periods, revenues grew at an annual rate of 13%, while employment expanded by 6% a year.
• The robust performance in the environmental products and services sector since 2000 has been driven by sustained growth in Alberta’s primary energy sector, increased public funding on environment initiatives, and stronger political will to protect the environment.
• Private-sector investment, combined with recent federal and Alberta budgets that have allocated substantial funding towards cleaner technology and reduction in greenhouse gas (GHG) emissions, should help support growth in the sector and the development of new technology. However, the sector has demonstrated little capacity to commercialize technology.
• Growth in the sector could be hindered by the pronounced drop in energy prices in the second half of 2008 and tight credit conditions globally, which have led oil and gas companies to substantially reduce capital spending in 2009, including deferrals of major oil sands projects and cancellations of upgrades.
The definition for this sector is based on Statistics Canada’s satellite account for the environment. According to Statistics Canada, the environment industry “includes all companies involved in whole or in part in the production of environmental goods, the provision of environmental services and the undertaking of environment-related construction activities”. Environmental goods and services are those “that are used, or can potentially be used to, measure, prevent, limit or correct environmental damage (both natural or by human activity) to water, air, soil as well as problems related to waste, noise and ecosystems. See Statistics Canada (2007), Environment Industry: Business Sector 2004 (2002 Revised), Catalogue no. 16F0008XIE.
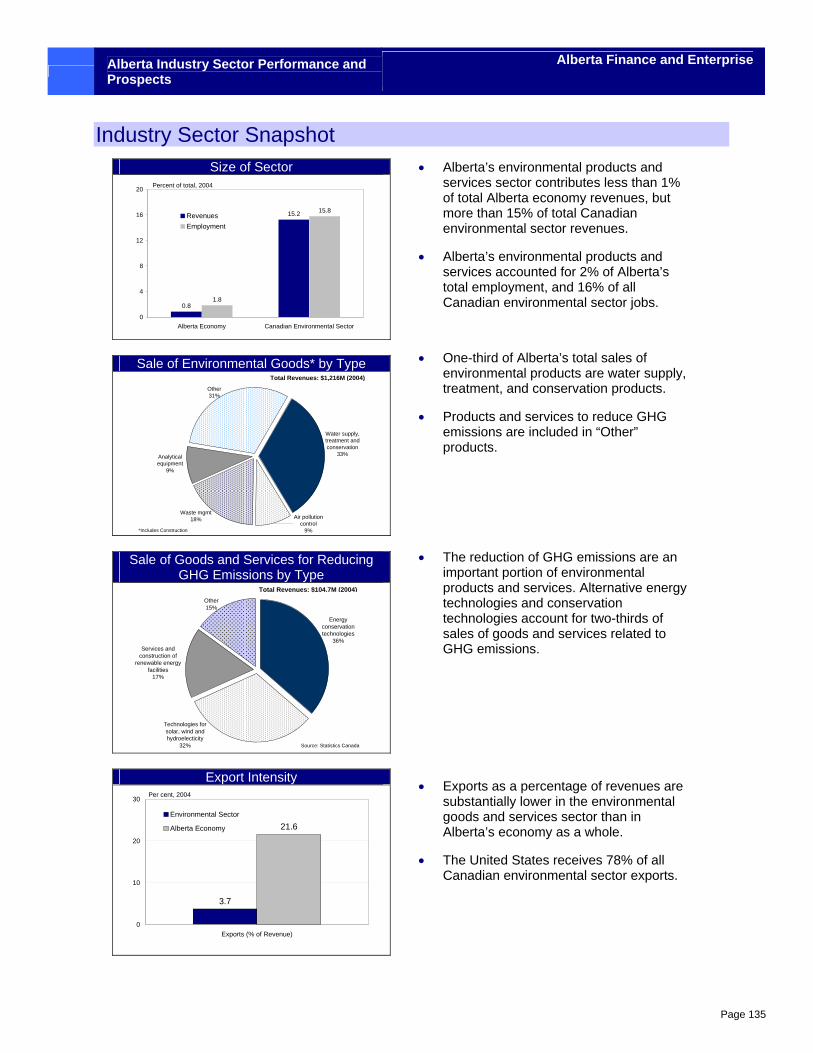
Alberta Industry Sector Performance and Prospects
Alberta Finance and Enterprise
Page 135
Industry Sector Snapshot Size of Sector
0.8
15.2
1.8
15.8
0
4
8
12
16
20
Alberta Economy Canadian Environmental Sector
RevenuesEmployment
Percent of total, 2004
Sale of Environmental Goods* by Type
Other31%
Air pollution control
9%
Water supply, treatment and conservation
33%Analytical equipment
9%
Waste mgmt18%
Total Revenues: $1,216M (2004)
*Includes Construction
Sale of Goods and Services for Reducing GHG Emissions by Type
Services and construction of
renewable energy facilities
17%
Other15%
Energy conservation technologies
36%
Technologies for solar, wind and hydroelecticity
32%
Total Revenues: $104.7M (2004)
Source: Statistics Canada
Export Intensity
3.7
21.6
0
10
20
30
Exports (% of Revenue)
Environmental Sector
Alberta Economy
Per cent, 2004
• Alberta’s environmental products and services sector contributes less than 1% of total Alberta economy revenues, but more than 15% of total Canadian environmental sector revenues.
• Alberta’s environmental products and services accounted for 2% of Alberta’s total employment, and 16% of all Canadian environmental sector jobs.
• One-third of Alberta’s total sales of environmental products are water supply, treatment, and conservation products.
• Products and services to reduce GHG emissions are included in “Other” products.
• The reduction of GHG emissions are an important portion of environmental products and services. Alternative energy technologies and conservation technologies account for two-thirds of sales of goods and services related to GHG emissions.
• Exports as a percentage of revenues are substantially lower in the environmental goods and services sector than in Alberta’s economy as a whole.
• The United States receives 78% of all Canadian environmental sector exports.
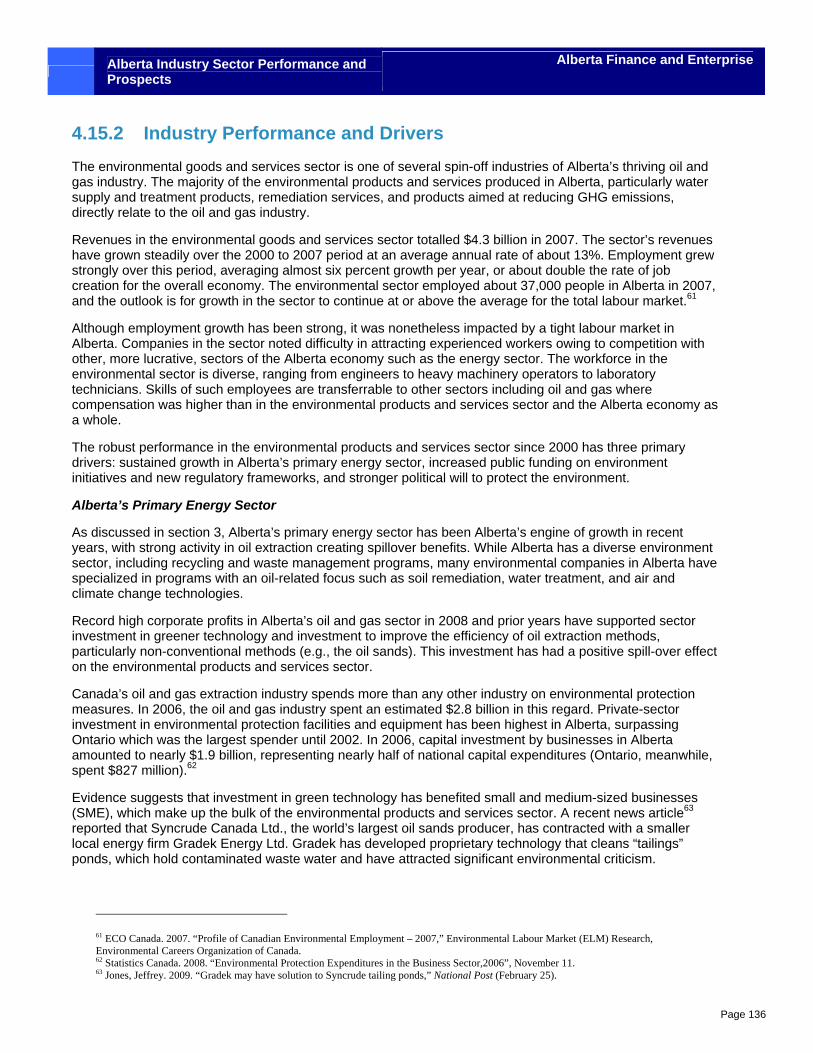
Alberta Industry Sector Performance and Prospects
Alberta Finance and Enterprise
Page 136
4.15.2 Industry Performance and Drivers
The environmental goods and services sector is one of several spin-off industries of Alberta’s thriving oil and gas industry. The majority of the environmental products and services produced in Alberta, particularly water supply and treatment products, remediation services, and products aimed at reducing GHG emissions, directly relate to the oil and gas industry.
Revenues in the environmental goods and services sector totalled $4.3 billion in 2007. The sector’s revenues have grown steadily over the 2000 to 2007 period at an average annual rate of about 13%. Employment grew strongly over this period, averaging almost six percent growth per year, or about double the rate of job creation for the overall economy. The environmental sector employed about 37,000 people in Alberta in 2007, and the outlook is for growth in the sector to continue at or above the average for the total labour market.61
Although employment growth has been strong, it was nonetheless impacted by a tight labour market in Alberta. Companies in the sector noted difficulty in attracting experienced workers owing to competition with other, more lucrative, sectors of the Alberta economy such as the energy sector. The workforce in the environmental sector is diverse, ranging from engineers to heavy machinery operators to laboratory technicians. Skills of such employees are transferrable to other sectors including oil and gas where compensation was higher than in the environmental products and services sector and the Alberta economy as a whole.
The robust performance in the environmental products and services sector since 2000 has three primary drivers: sustained growth in Alberta’s primary energy sector, increased public funding on environment initiatives and new regulatory frameworks, and stronger political will to protect the environment.
Alberta’s Primary Energy Sector
As discussed in section 3, Alberta’s primary energy sector has been Alberta’s engine of growth in recent years, with strong activity in oil extraction creating spillover benefits. While Alberta has a diverse environment sector, including recycling and waste management programs, many environmental companies in Alberta have specialized in programs with an oil-related focus such as soil remediation, water treatment, and air and climate change technologies.
Record high corporate profits in Alberta’s oil and gas sector in 2008 and prior years have supported sector investment in greener technology and investment to improve the efficiency of oil extraction methods, particularly non-conventional methods (e.g., the oil sands). This investment has had a positive spill-over effect on the environmental products and services sector.
Canada’s oil and gas extraction industry spends more than any other industry on environmental protection measures. In 2006, the oil and gas industry spent an estimated $2.8 billion in this regard. Private-sector investment in environmental protection facilities and equipment has been highest in Alberta, surpassing Ontario which was the largest spender until 2002. In 2006, capital investment by businesses in Alberta amounted to nearly $1.9 billion, representing nearly half of national capital expenditures (Ontario, meanwhile, spent $827 million).62
Evidence suggests that investment in green technology has benefited small and medium-sized businesses (SME), which make up the bulk of the environmental products and services sector. A recent news article63 reported that Syncrude Canada Ltd., the world’s largest oil sands producer, has contracted with a smaller local energy firm Gradek Energy Ltd. Gradek has developed proprietary technology that cleans “tailings” ponds, which hold contaminated waste water and have attracted significant environmental criticism.
61 ECO Canada. 2007. “Profile of Canadian Environmental Employment – 2007,” Environmental Labour Market (ELM) Research, Environmental Careers Organization of Canada. 62 Statistics Canada. 2008. “Environmental Protection Expenditures in the Business Sector,2006”, November 11. 63 Jones, Jeffrey. 2009. “Gradek may have solution to Syncrude tailing ponds,” National Post (February 25).
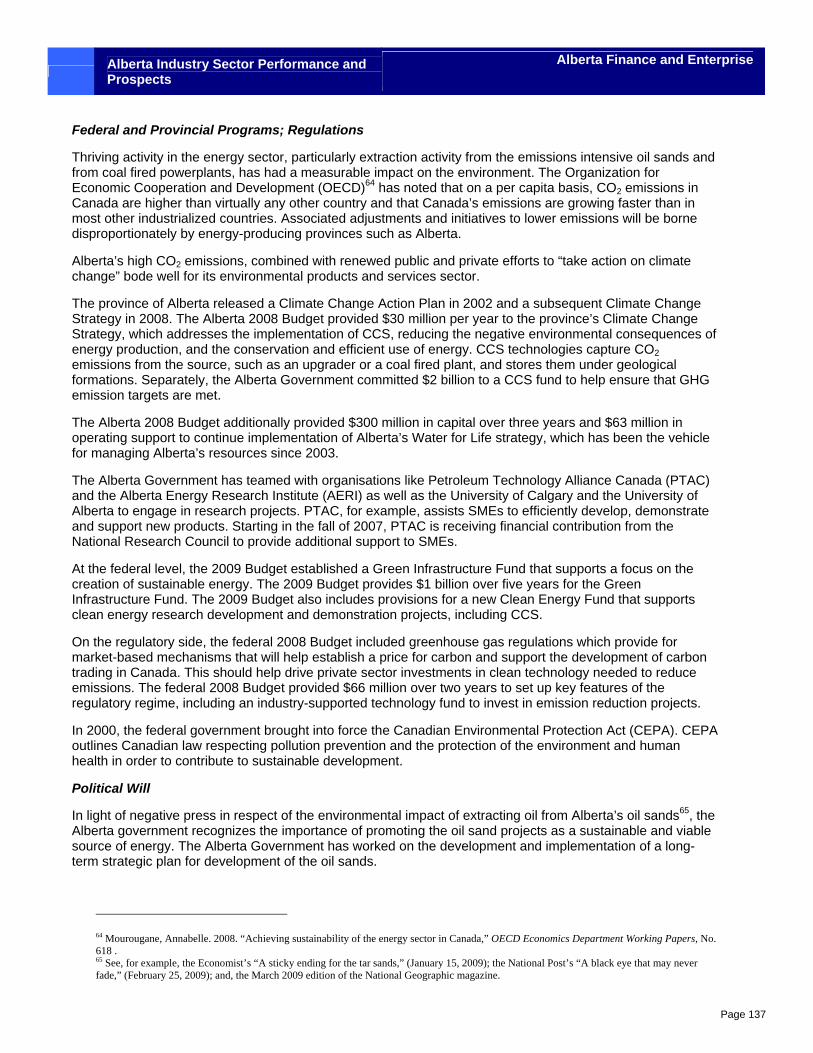
Alberta Industry Sector Performance and Prospects
Alberta Finance and Enterprise
Page 137
Federal and Provincial Programs; Regulations
Thriving activity in the energy sector, particularly extraction activity from the emissions intensive oil sands and from coal fired powerplants, has had a measurable impact on the environment. The Organization for Economic Cooperation and Development (OECD)64 has noted that on a per capita basis, CO2 emissions in Canada are higher than virtually any other country and that Canada’s emissions are growing faster than in most other industrialized countries. Associated adjustments and initiatives to lower emissions will be borne disproportionately by energy-producing provinces such as Alberta.
Alberta’s high CO2 emissions, combined with renewed public and private efforts to “take action on climate change” bode well for its environmental products and services sector.
The province of Alberta released a Climate Change Action Plan in 2002 and a subsequent Climate Change Strategy in 2008. The Alberta 2008 Budget provided $30 million per year to the province’s Climate Change Strategy, which addresses the implementation of CCS, reducing the negative environmental consequences of energy production, and the conservation and efficient use of energy. CCS technologies capture CO2 emissions from the source, such as an upgrader or a coal fired plant, and stores them under geological formations. Separately, the Alberta Government committed $2 billion to a CCS fund to help ensure that GHG emission targets are met.
The Alberta 2008 Budget additionally provided $300 million in capital over three years and $63 million in operating support to continue implementation of Alberta’s Water for Life strategy, which has been the vehicle for managing Alberta’s resources since 2003.
The Alberta Government has teamed with organisations like Petroleum Technology Alliance Canada (PTAC) and the Alberta Energy Research Institute (AERI) as well as the University of Calgary and the University of Alberta to engage in research projects. PTAC, for example, assists SMEs to efficiently develop, demonstrate and support new products. Starting in the fall of 2007, PTAC is receiving financial contribution from the National Research Council to provide additional support to SMEs.
At the federal level, the 2009 Budget established a Green Infrastructure Fund that supports a focus on the creation of sustainable energy. The 2009 Budget provides $1 billion over five years for the Green Infrastructure Fund. The 2009 Budget also includes provisions for a new Clean Energy Fund that supports clean energy research development and demonstration projects, including CCS.
On the regulatory side, the federal 2008 Budget included greenhouse gas regulations which provide for market-based mechanisms that will help establish a price for carbon and support the development of carbon trading in Canada. This should help drive private sector investments in clean technology needed to reduce emissions. The federal 2008 Budget provided $66 million over two years to set up key features of the regulatory regime, including an industry-supported technology fund to invest in emission reduction projects.
In 2000, the federal government brought into force the Canadian Environmental Protection Act (CEPA). CEPA outlines Canadian law respecting pollution prevention and the protection of the environment and human health in order to contribute to sustainable development.
Political Will
In light of negative press in respect of the environmental impact of extracting oil from Alberta’s oil sands65, the Alberta government recognizes the importance of promoting the oil sand projects as a sustainable and viable source of energy. The Alberta Government has worked on the development and implementation of a long-term strategic plan for development of the oil sands.
64 Mourougane, Annabelle. 2008. “Achieving sustainability of the energy sector in Canada,” OECD Economics Department Working Papers, No. 618 . 65 See, for example, the Economist’s “A sticky ending for the tar sands,” (January 15, 2009); the National Post’s “A black eye that may never fade,” (February 25, 2009); and, the March 2009 edition of the National Geographic magazine.
Alberta Industry Sector Performance and Prospects
Alberta Finance and Enterprise
Page 138
Canadian governments have also enforced environmental legislation. The Alberta and federal Governments in February 2009 charged Syncrude with offences under environmental protection laws, including Alberta’s Environmental Protection and Enhancement Act. Alberta’s environment minister noted that the charges against Syncrude are the “first of its kind to be laid in this manner in Alberta”.
There is political pressure from the United States, by far the largest consumer of Canadian oil and gas exports, for Canada and Alberta in particular to take action against oil sands-related emissions. The Economist noted in a recent article66 that some policymakers in the United States have criticized oil production in Alberta’s oil sands due to environmental concerns.
The new U.S. administration appears to be strongly committed to the environment, with clean energy and energy reduction a prominent part of the proposed economic stimulus package.
4.15.3 SWOT Analysis
Strengths
• Alberta’s environmental products and services sector has a strong foundation of innovative talent and a wide range of expertise. The province is home to numerous award-winning environmental companies.
• Alberta’s oil sands are the second largest proven crude oil reserves in the world and in the longer term can be an important source of crude oil globally. The long-term outlook for energy prices and energy demand support further development of the oil sands, with further potential spin-off benefits for the environmental products and services sector.
• Recent federal and Alberta budgets have allocated substantial funding towards alternate energy technology and reduction in GHG emissions.
• Labour shortages in Alberta’s economy may ease in light of current economic conditions, and help ease the shortage of skilled labour in the environmental products and services sector.
• Continued demand for products and services by the traditional oil and gas sector, including site remediation.
Weaknesses
• A shortage of skilled labour, and lack of training and development infrastructure. Moreover, senior management and technical specialist ranks are significantly older than the average workforce and new graduate numbers are declining.
• Higher wages and salaries paid by oil and gas sector negatively impact labour availability and retention in the environmental products and services sector.
• Most environmental product companies are small and medium sized businesses and can lack sufficient human and financial resources for the development of projects.
• Little capacity by the sector to demonstrate and commercialize technology.
Opportunities
• Development of cutting edge technology including tailing ponds remediation technology and CSS. 66 The Economist. February 23 2009. “The greening of Canada?”.
Alberta Industry Sector Performance and Prospects
Alberta Finance and Enterprise
Page 139
• Development of a stronger export market.
• The newly elected administration in the United States appears to have the political will to demand change with respect to the environmental impact of oil sands production.
• The United States’ increasing interest in alternate energy and energy efficiency products could provide a large and growing marketplace for companies in Alberta’s environmental products and services sector.
• The current economic climate may allow for a refocus of activity away from expansion of new oil sands projects and towards exploring how to make future operations greener and more efficient.
• Water related infrastructure is reaching a stage where investment will be required to optimize resource use and prevent the deterioration of existing facilities. Water re-use initiatives have had some success and need to be encouraged especially for large industrial developments such as Alberta’s Industrial Heartland. Wastewater re-use and recycling will increase in order to improve the overall efficiency of water use and lessen the dependency on fresh water resources.
• Research and commercialization of technologies to solve Alberta specific projects, such as water impoundment in the oil sands tailing ponds.
• CCS could represent a worldwide market of $100 billion by the year 2020. This offers an excellent opportunity for exports if Alberta firms are able to offer competitive products and services. Growth areas include capture equipment, pipelines, policy development, environmental impact assessments, storage development & monitoring.
Threats
• The economic weakness underpinning the drop in energy prices could persist for some time, and impact investment in cleaner technology. The pronounced drop in energy prices in the second half of 2008 and tight credit conditions globally have led oil and gas companies to substantially reduce capital spending in 2009, including deferrals of major oil sands projects and cancellations of upgraders.
• Provided there are viable alternatives available, the United States, by far the largest consumer of Alberta’s energy exports, could follow through with the movement to boycott so-called “dirty” sources of energy such as Alberta’s oil sands.
• Competition from other countries (e.g., the United States) whose businesses have better success at commercializing new technology.
• A marked and potentially lengthy slowdown in Alberta’s primary energy sector and the Alberta economy as a whole could hinder spin-off benefits to the environmental products and services sector.
• On-going global criticism of non-conventional oil extraction methods.
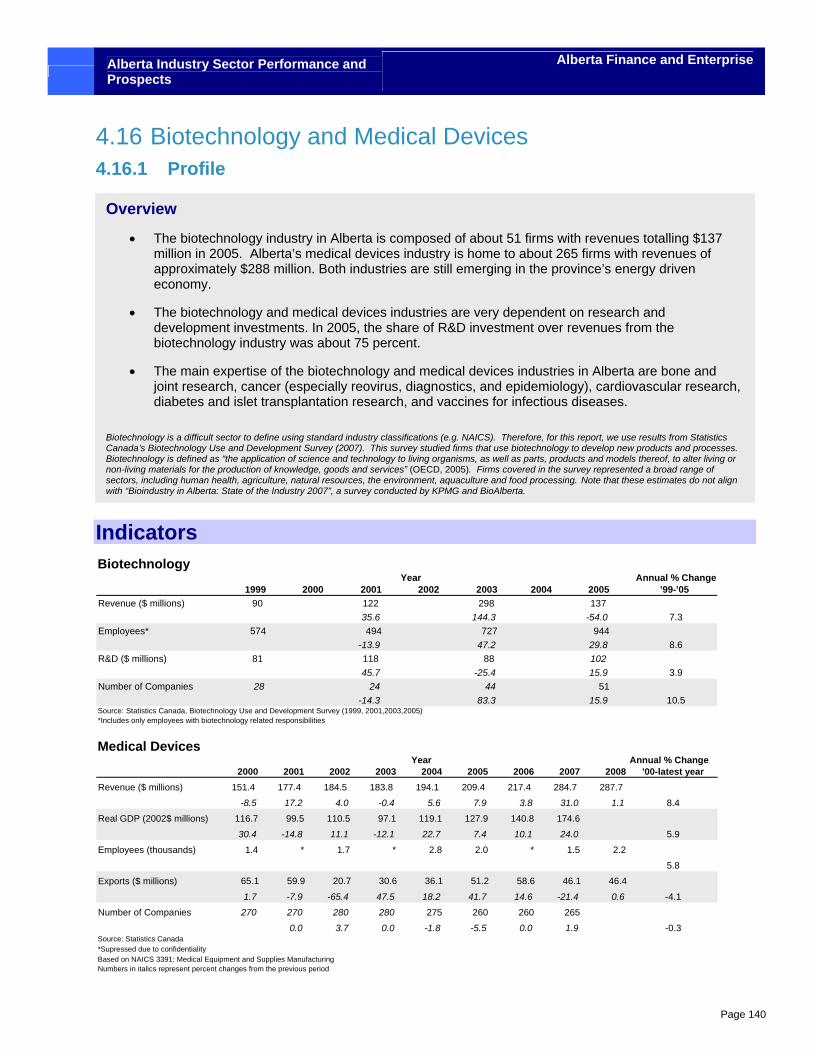
Alberta Industry Sector Performance and Prospects
Alberta Finance and Enterprise
Page 140
4.16 Biotechnology and Medical Devices 4.16.1 Profile
Indicators Biotechnology
Annual % Change1999 2000 2001 2002 2003 2004 2005 '99-'05
Revenue ($ millions) 90 122 298 137 35.6 144.3 -54.0 7.3
Employees* 574 494 727 944-13.9 47.2 29.8 8.6
R&D ($ millions) 81 118 88 102 45.7 -25.4 15.9 3.9
Number of Companies 28 24 44 51-14.3 83.3 15.9 10.5
Source: Statistics Canada, Biotechnology Use and Development Survey (1999, 2001,2003,2005)*Includes only employees with biotechnology related responsibilities
Year
Medical Devices Annual % Change
2000 2001 2002 2003 2004 2005 2006 2007 2008 '00-latest yearRevenue ($ millions) 151.4 177.4 184.5 183.8 194.1 209.4 217.4 284.7 287.7
-8.5 17.2 4.0 -0.4 5.6 7.9 3.8 31.0 1.1 8.4
Real GDP (2002$ millions) 116.7 99.5 110.5 97.1 119.1 127.9 140.8 174.6
30.4 -14.8 11.1 -12.1 22.7 7.4 10.1 24.0 5.9
Employees (thousands) 1.4 * 1.7 * 2.8 2.0 * 1.5 2.2
5.8
Exports ($ millions) 65.1 59.9 20.7 30.6 36.1 51.2 58.6 46.1 46.4
1.7 -7.9 -65.4 47.5 18.2 41.7 14.6 -21.4 0.6 -4.1
Number of Companies 270 270 280 280 275 260 260 265
0.0 3.7 0.0 -1.8 -5.5 0.0 1.9 -0.3Source: Statistics Canada*Supressed due to confidentialityBased on NAICS 3391: Medical Equipment and Supplies ManufacturingNumbers in italics represent percent changes from the previous period
Year
Overview
• The biotechnology industry in Alberta is composed of about 51 firms with revenues totalling $137 million in 2005. Alberta’s medical devices industry is home to about 265 firms with revenues of approximately $288 million. Both industries are still emerging in the province’s energy driven economy.
• The biotechnology and medical devices industries are very dependent on research and development investments. In 2005, the share of R&D investment over revenues from the biotechnology industry was about 75 percent.
• The main expertise of the biotechnology and medical devices industries in Alberta are bone and joint research, cancer (especially reovirus, diagnostics, and epidemiology), cardiovascular research, diabetes and islet transplantation research, and vaccines for infectious diseases.
Biotechnology is a difficult sector to define using standard industry classifications (e.g. NAICS). Therefore, for this report, we use results from Statistics Canada’s Biotechnology Use and Development Survey (2007). This survey studied firms that use biotechnology to develop new products and processes. Biotechnology is defined as “the application of science and technology to living organisms, as well as parts, products and models thereof, to alter living or non-living materials for the production of knowledge, goods and services” (OECD, 2005). Firms covered in the survey represented a broad range of sectors, including human health, agriculture, natural resources, the environment, aquaculture and food processing. Note that these estimates do not align with “Bioindustry in Alberta: State of the Industry 2007”, a survey conducted by KPMG and BioAlberta.
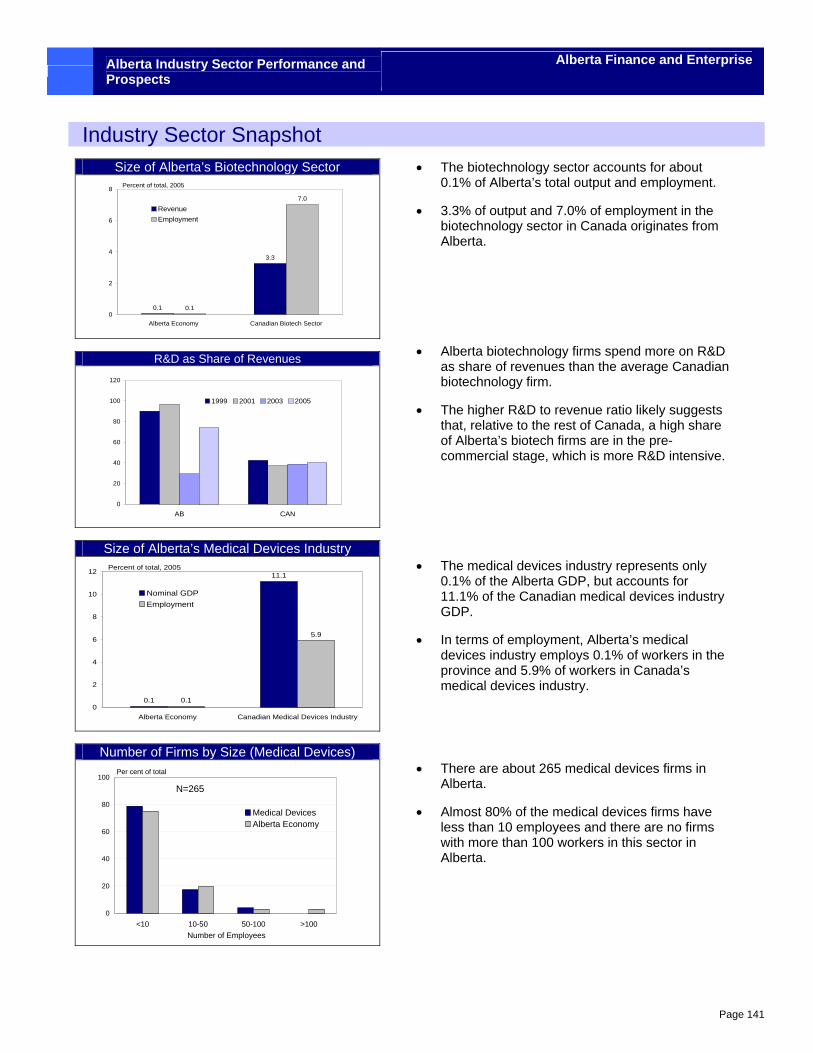
Alberta Industry Sector Performance and Prospects
Alberta Finance and Enterprise
Page 141
Industry Sector Snapshot • The biotechnology sector accounts for about
0.1% of Alberta’s total output and employment.
• 3.3% of output and 7.0% of employment in the biotechnology sector in Canada originates from Alberta.
• Alberta biotechnology firms spend more on R&D as share of revenues than the average Canadian biotechnology firm.
• The higher R&D to revenue ratio likely suggests that, relative to the rest of Canada, a high share of Alberta’s biotech firms are in the pre-commercial stage, which is more R&D intensive.
• The medical devices industry represents only 0.1% of the Alberta GDP, but accounts for 11.1% of the Canadian medical devices industry GDP.
• In terms of employment, Alberta’s medical devices industry employs 0.1% of workers in the province and 5.9% of workers in Canada’s medical devices industry.
• There are about 265 medical devices firms in Alberta.
• Almost 80% of the medical devices firms have less than 10 employees and there are no firms with more than 100 workers in this sector in Alberta.
Size of Alberta’s Biotechnology Sector
0.1
3.3
0.1
7.0
0
2
4
6
8
Alberta Economy Canadian Biotech Sector
RevenueEmployment
Percent of total, 2005
R&D as Share of Revenues
0
20
40
60
80
100
120
AB CAN
1999 2001 2003 2005
Size of Alberta’s Medical Devices Industry
0.1
11.1
0.1
5.9
0
2
4
6
8
10
12
Alberta Economy Canadian Medical Devices Industry
Nominal GDPEmployment
Percent of total, 2005
Number of Firms by Size (Medical Devices)
0
20
40
60
80
100
<10 10-50 50-100 >100
Medical DevicesAlberta Economy
Per cent of total
N=265
Number of Employees
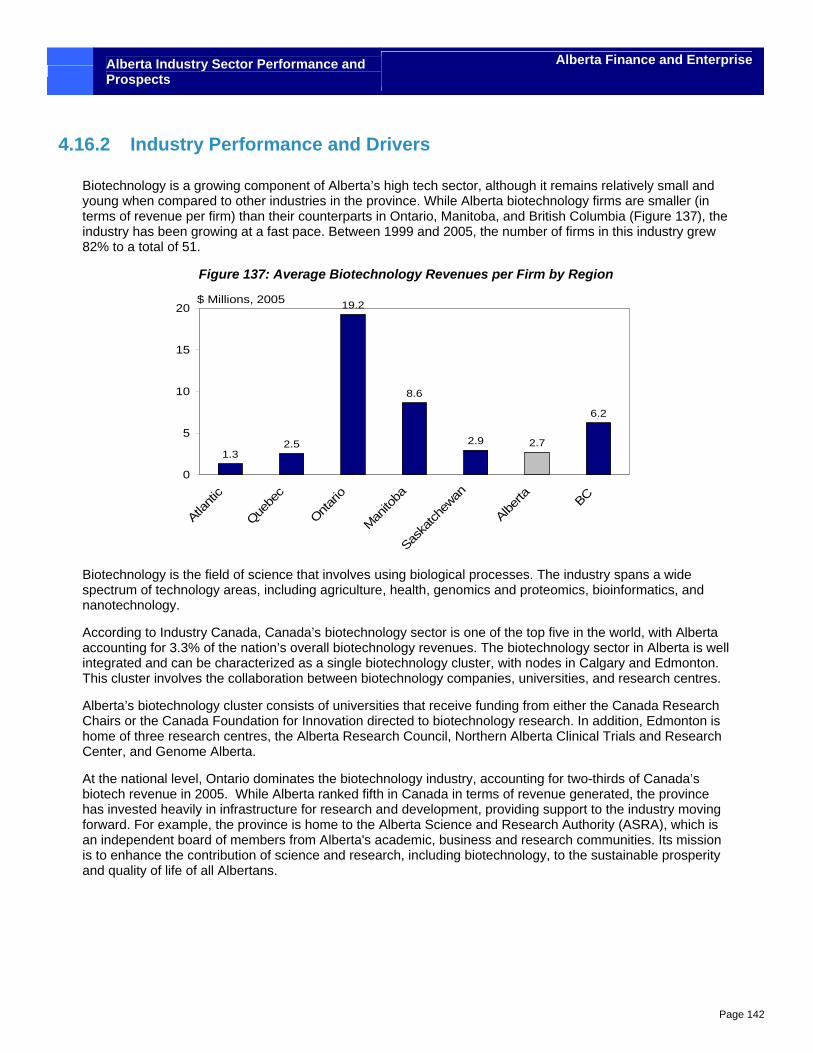
Alberta Industry Sector Performance and Prospects
Alberta Finance and Enterprise
Page 142
4.16.2 Industry Performance and Drivers
Biotechnology is a growing component of Alberta’s high tech sector, although it remains relatively small and young when compared to other industries in the province. While Alberta biotechnology firms are smaller (in terms of revenue per firm) than their counterparts in Ontario, Manitoba, and British Columbia (Figure 137), the industry has been growing at a fast pace. Between 1999 and 2005, the number of firms in this industry grew 82% to a total of 51.
Figure 137: Average Biotechnology Revenues per Firm by Region
1.32.5
19.2
8.6
2.9 2.7
6.2
0
5
10
15
20
Atlanti
c
Quebe
c
Ontario
Manito
ba
Saska
tchew
an
Alberta BC
$ Millions, 2005
Biotechnology is the field of science that involves using biological processes. The industry spans a wide spectrum of technology areas, including agriculture, health, genomics and proteomics, bioinformatics, and nanotechnology.
According to Industry Canada, Canada’s biotechnology sector is one of the top five in the world, with Alberta accounting for 3.3% of the nation’s overall biotechnology revenues. The biotechnology sector in Alberta is well integrated and can be characterized as a single biotechnology cluster, with nodes in Calgary and Edmonton. This cluster involves the collaboration between biotechnology companies, universities, and research centres.
Alberta’s biotechnology cluster consists of universities that receive funding from either the Canada Research Chairs or the Canada Foundation for Innovation directed to biotechnology research. In addition, Edmonton is home of three research centres, the Alberta Research Council, Northern Alberta Clinical Trials and Research Center, and Genome Alberta.
At the national level, Ontario dominates the biotechnology industry, accounting for two-thirds of Canada’s biotech revenue in 2005. While Alberta ranked fifth in Canada in terms of revenue generated, the province has invested heavily in infrastructure for research and development, providing support to the industry moving forward. For example, the province is home to the Alberta Science and Research Authority (ASRA), which is an independent board of members from Alberta's academic, business and research communities. Its mission is to enhance the contribution of science and research, including biotechnology, to the sustainable prosperity and quality of life of all Albertans.
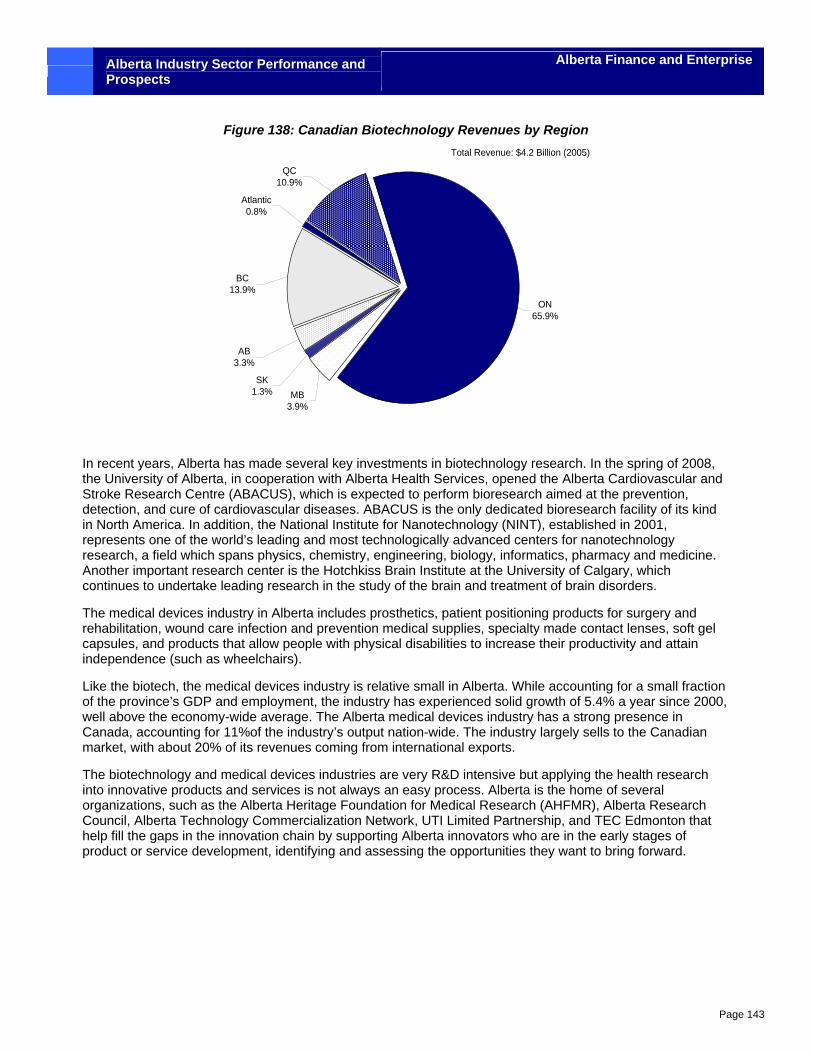
Alberta Industry Sector Performance and Prospects
Alberta Finance and Enterprise
Page 143
Figure 138: Canadian Biotechnology Revenues by Region
BC13.9%
AB3.3%
SK1.3% MB
3.9%
ON65.9%
QC10.9%
Atlantic0.8%
Total Revenue: $4.2 Billion (2005)
In recent years, Alberta has made several key investments in biotechnology research. In the spring of 2008, the University of Alberta, in cooperation with Alberta Health Services, opened the Alberta Cardiovascular and Stroke Research Centre (ABACUS), which is expected to perform bioresearch aimed at the prevention, detection, and cure of cardiovascular diseases. ABACUS is the only dedicated bioresearch facility of its kind in North America. In addition, the National Institute for Nanotechnology (NINT), established in 2001, represents one of the world’s leading and most technologically advanced centers for nanotechnology research, a field which spans physics, chemistry, engineering, biology, informatics, pharmacy and medicine. Another important research center is the Hotchkiss Brain Institute at the University of Calgary, which continues to undertake leading research in the study of the brain and treatment of brain disorders.
The medical devices industry in Alberta includes prosthetics, patient positioning products for surgery and rehabilitation, wound care infection and prevention medical supplies, specialty made contact lenses, soft gel capsules, and products that allow people with physical disabilities to increase their productivity and attain independence (such as wheelchairs).
Like the biotech, the medical devices industry is relative small in Alberta. While accounting for a small fraction of the province’s GDP and employment, the industry has experienced solid growth of 5.4% a year since 2000, well above the economy-wide average. The Alberta medical devices industry has a strong presence in Canada, accounting for 11%of the industry’s output nation-wide. The industry largely sells to the Canadian market, with about 20% of its revenues coming from international exports.
The biotechnology and medical devices industries are very R&D intensive but applying the health research into innovative products and services is not always an easy process. Alberta is the home of several organizations, such as the Alberta Heritage Foundation for Medical Research (AHFMR), Alberta Research Council, Alberta Technology Commercialization Network, UTI Limited Partnership, and TEC Edmonton that help fill the gaps in the innovation chain by supporting Alberta innovators who are in the early stages of product or service development, identifying and assessing the opportunities they want to bring forward.
Alberta Industry Sector Performance and Prospects
Alberta Finance and Enterprise
Page 144
4.16.3 SWOT Analysis
Strengths
• Alberta is the home of three renowned universities for their medical research and health management programs, including a Master of Biomedical Technology (MBT) graduate program at the University of Calgary.
• Commercialization infrastructure for health and bio industries through the Alberta Research Council, Alberta Technology Commercialization Network, UTI Limited Partnership, and TEC Edmonton.
• Federal taxation offers a 20% non-refundable tax credit for public companies and a 35% refundable tax credit for private companies on current R&D expenditures, including capital expenditures on R&D and machinery and equipment. In addition, the Alberta Government has recently enhanced the Federal program with a fully refundable 10% provincial R&D tax credit.
• Several research and funding organizations are located in Alberta, such as the Alberta Cancer Board, Alberta Heritage Foundation for Medical Research (AHFMR), Alberta Ingenuity Fund, National Institute for Nanotechnology, and the Protein Engineering Centre of Excellence.
Weaknesses
• A more effective and consistent mechanism is needed to transfer technology from research to industry.
• Alberta’s industry is relatively young, and depends largely on research and development expenditure. More mature industries in other provinces or countries might have a better structure to compete.
• The present patent system is a cause of uncertainty and delay in translating scientific discoveries into commercial successes. As a result, much of the patent work for Alberta biotechnology companies is done by U.S. attorneys.
• Historically low levels of venture capital investment in Canada. Many venture capitalists prefer to go straight to the U.S., instead of major Canadian markets.
Opportunities
• The Alberta Government’s action plan for technology commercialization provides more resources, including an R&D tax credit and $100 million dollar venture capital fund managed by Alberta Enterprise Corporation, to move research projects from their conception to commercial stage. This action plan should improve access to capital and encourage growth of Alberta’s biotechnology sector.
• New and maturing biotechnology companies can benefit through a partnering relationship through financial and human resource expertise, networking, production capability, and distribution channels.
Threats
• The economic downturn and ongoing constraints in financial markets may continue to reduce the supply of risk capital (e.g. angel investors, venture capital), limiting growth in biotechnology sector.
• Reduction of public funding during the economic downturn, a problem when supporting and expanding the current infrastructure for university research. Failure to provide adequate support for facilities, equipment and support staff in Alberta may result in the loss of scientists to organizations outside the province.
Alberta Industry Sector Performance and Prospects
Alberta Finance and Enterprise
Page 145
• Labour shortages in the Alberta biotechnology sector could present a problem given the ongoing growth in international biotechnology activity and the high mobility of qualified people with research and production expertise.
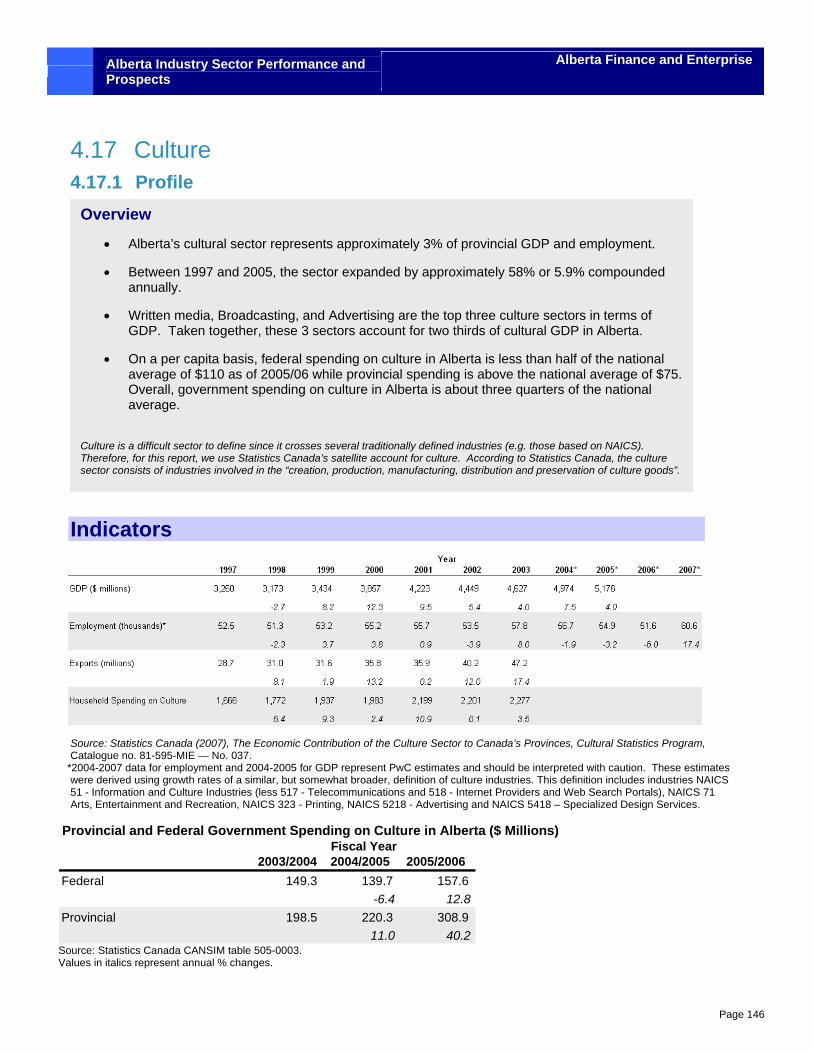
Alberta Industry Sector Performance and Prospects
Alberta Finance and Enterprise
Page 146
4.17 Culture 4.17.1 Profile
Indicators
Source: Statistics Canada (2007), The Economic Contribution of the Culture Sector to Canada’s Provinces, Cultural Statistics Program, Catalogue no. 81-595-MIE — No. 037.
*2004-2007 data for employment and 2004-2005 for GDP represent PwC estimates and should be interpreted with caution. These estimates were derived using growth rates of a similar, but somewhat broader, definition of culture industries. This definition includes industries NAICS 51 - Information and Culture Industries (less 517 - Telecommunications and 518 - Internet Providers and Web Search Portals), NAICS 71 Arts, Entertainment and Recreation, NAICS 323 - Printing, NAICS 5218 - Advertising and NAICS 5418 – Specialized Design Services.
Provincial and Federal Government Spending on Culture in Alberta ($ Millions)
2003/2004 2004/2005 2005/2006Federal 149.3 139.7 157.6
-6.4 12.8Provincial 198.5 220.3 308.9
11.0 40.2
Fiscal Year
Source: Statistics Canada CANSIM table 505-0003. Values in italics represent annual % changes.
Overview
• Alberta’s cultural sector represents approximately 3% of provincial GDP and employment.
• Between 1997 and 2005, the sector expanded by approximately 58% or 5.9% compounded annually.
• Written media, Broadcasting, and Advertising are the top three culture sectors in terms of GDP. Taken together, these 3 sectors account for two thirds of cultural GDP in Alberta.
• On a per capita basis, federal spending on culture in Alberta is less than half of the national average of $110 as of 2005/06 while provincial spending is above the national average of $75. Overall, government spending on culture in Alberta is about three quarters of the national average.
Culture is a difficult sector to define since it crosses several traditionally defined industries (e.g. those based on NAICS). Therefore, for this report, we use Statistics Canada’s satellite account for culture. According to Statistics Canada, the culture sector consists of industries involved in the “creation, production, manufacturing, distribution and preservation of culture goods”.
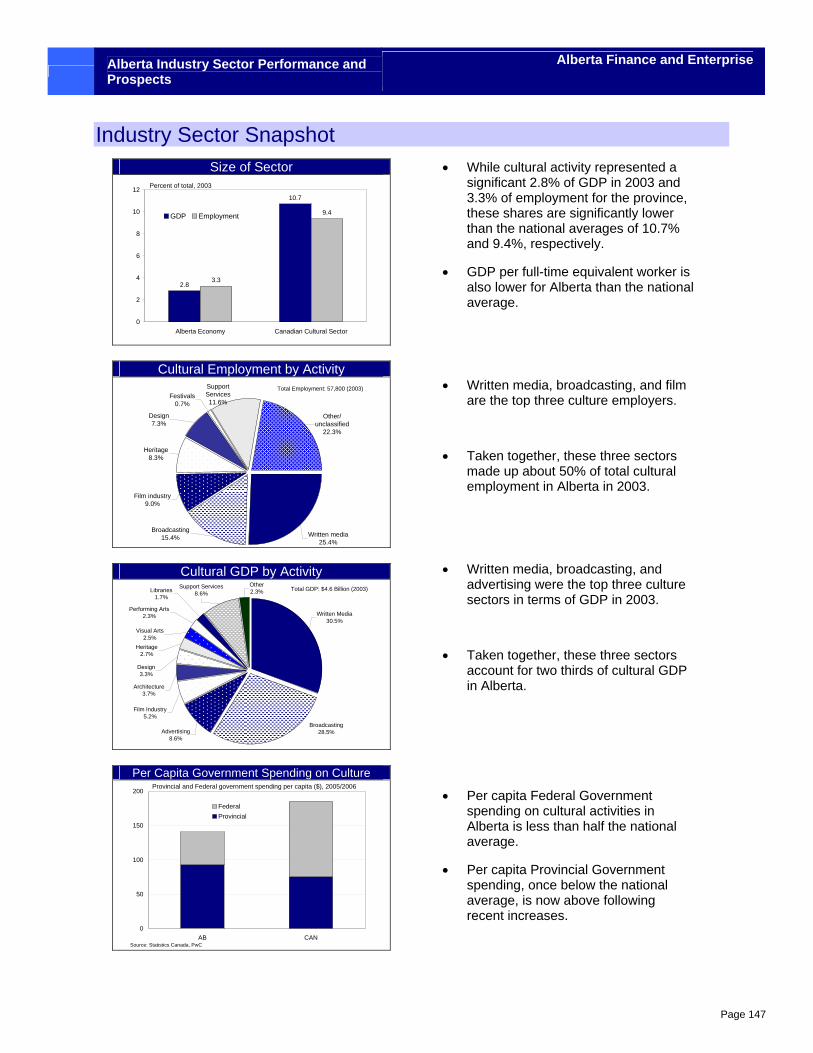
Alberta Industry Sector Performance and Prospects
Alberta Finance and Enterprise
Page 147
Industry Sector Snapshot Size of Sector
2.8
10.7
3.3
9.4
0
2
4
6
8
10
12
Alberta Economy Canadian Cultural Sector
GDP Employment
Percent of total, 2003
Cultural Employment by Activity
Written media25.4%
Broadcasting15.4%
Film industry9.0%
Heritage8.3%
Design7.3%
Festivals0.7%
Support Services11.6%
Other/ unclassified
22.3%
Total Employment: 57,800 (2003)
Cultural GDP by Activity Other2.3%Libraries
1.7%
Support Services8.6%
Visual Arts2.5%
Heritage2.7%
Design3.3%
Architecture3.7%
Film Industry5.2%
Advertising8.6%
Broadcasting28.5%
Written Media30.5%
Performing Arts2.3%
Total GDP: $4.6 Billion (2003)
Per Capita Government Spending on Culture
0
50
100
150
200
AB CAN
FederalProvincial
Provincial and Federal government spending per capita ($), 2005/2006
Source: Statistics Canada, PwC
• While cultural activity represented a significant 2.8% of GDP in 2003 and 3.3% of employment for the province, these shares are significantly lower than the national averages of 10.7% and 9.4%, respectively.
• GDP per full-time equivalent worker is also lower for Alberta than the national average.
• Written media, broadcasting, and film are the top three culture employers.
• Taken together, these three sectors made up about 50% of total cultural employment in Alberta in 2003.
• Written media, broadcasting, and advertising were the top three culture sectors in terms of GDP in 2003.
• Taken together, these three sectors account for two thirds of cultural GDP in Alberta.
• Per capita Federal Government spending on cultural activities in Alberta is less than half the national average.
• Per capita Provincial Government spending, once below the national average, is now above following recent increases.
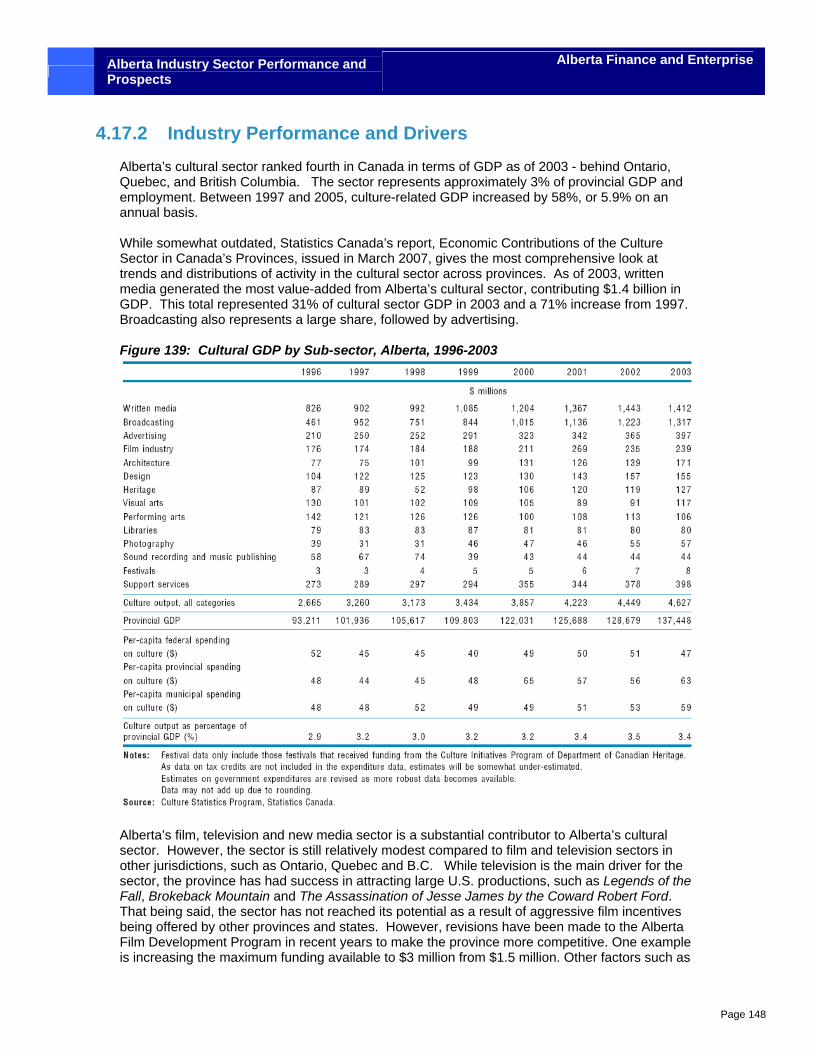
Alberta Industry Sector Performance and Prospects
Alberta Finance and Enterprise
Page 148
4.17.2 Industry Performance and Drivers Alberta’s cultural sector ranked fourth in Canada in terms of GDP as of 2003 - behind Ontario, Quebec, and British Columbia. The sector represents approximately 3% of provincial GDP and employment. Between 1997 and 2005, culture-related GDP increased by 58%, or 5.9% on an annual basis. While somewhat outdated, Statistics Canada’s report, Economic Contributions of the Culture Sector in Canada’s Provinces, issued in March 2007, gives the most comprehensive look at trends and distributions of activity in the cultural sector across provinces. As of 2003, written media generated the most value-added from Alberta’s cultural sector, contributing $1.4 billion in GDP. This total represented 31% of cultural sector GDP in 2003 and a 71% increase from 1997. Broadcasting also represents a large share, followed by advertising. Figure 139: Cultural GDP by Sub-sector, Alberta, 1996-2003
Alberta’s film, television and new media sector is a substantial contributor to Alberta’s cultural sector. However, the sector is still relatively modest compared to film and television sectors in other jurisdictions, such as Ontario, Quebec and B.C. While television is the main driver for the sector, the province has had success in attracting large U.S. productions, such as Legends of the Fall, Brokeback Mountain and The Assassination of Jesse James by the Coward Robert Ford. That being said, the sector has not reached its potential as a result of aggressive film incentives being offered by other provinces and states. However, revisions have been made to the Alberta Film Development Program in recent years to make the province more competitive. One example is increasing the maximum funding available to $3 million from $1.5 million. Other factors such as
Alberta Industry Sector Performance and Prospects
Alberta Finance and Enterprise
Page 149
U.S. writers strike, screen writers guild strike as well as an unstable Canadian dollar have contributed to a decline in film and television production across Canada. Going forward, these sectors are likely to see rapid and dramatic changes to their market structure as technological convergence evolves. It is important to note that this sector has had historic under-investment. Convergence is the melding of four historically separate sectors – telecommunications, information technology, media and entertainment, and consumer electronics made possible by the ability of different network platforms to easily exchange data, and the merging of consumer devices. Media is no longer being consumed on separate devices like televisions, audio equipment, cell phones, personal computers, or video game consoles. Instead, technologies are blending so that consumers can enjoy a seamless stream of data, video, and music anywhere. Convergence signifies an ending of one-way information flows and the emergence of interactive media consumption and communication. It also represents new opportunities for innovative media companies to compete on a global basis. Public Funding In fiscal year 2005/06, federal spending in Alberta was less than half of the Canadian average while provincial spending came in higher than the national average. Overall, government spending on culture in Alberta was about three quarters of the national average.
Per capita Federal Spending Per capita Provincial Spending
Alberta Canadian
Avg. Alberta Canadian Avg. 2003/2004 $ 46.89 $ 109.41 $ 62.36 $ 67.31 2004/2005 $ 43.12 $ 112.65 $ 68.01 $ 70.95 2005/2006 $ 47.44 $ 110.00 $ 92.98 $ 75.43
Source: CANSIM Table #505-0003 - Federal, provincial and territorial government expenditures on culture, by culture activity. Public spending on cultural activities in Alberta is largely directed towards heritage institutions, broadcasting, and libraries. In addition, traditional cultural activities - the literary arts, the performing arts and the visual arts – are provided funding by the Alberta Foundation for the Arts (AFA). The AFA contributes more than $20 million annually through 13 programs. For 2008-09, $36 million from lottery revenues will be distributed by the AFA to individual artists and arts organizations in the visual, performing and literary arts and cultural industries, an increase of $9 million from the previous year. In a 2005 study commissioned by the AFA67, which looked at the activities of 481 arts organizations funded by the AFA in 2003/2004, it was estimated that such organizations contributed about $58 million in direct value-added, and a further $95 million in indirect value-added to the provincial economy. In total, the arts organizations directly supported about 3,500 Alberta jobs. By observing the spending habits of Alberta households, one can see private expenditures on culture largely go towards broadcasting (e.g., cable subscriptions), written media (e.g., newspapers and magazines), and the film industry (e.g., box office and rentals). 67 Econometric Research Ltd. 2005. “The Economic Impact of the Arts in Alberta: Measuring the Value of the Arts”, prepared on behalf of the Alberta Foundation for the Arts.
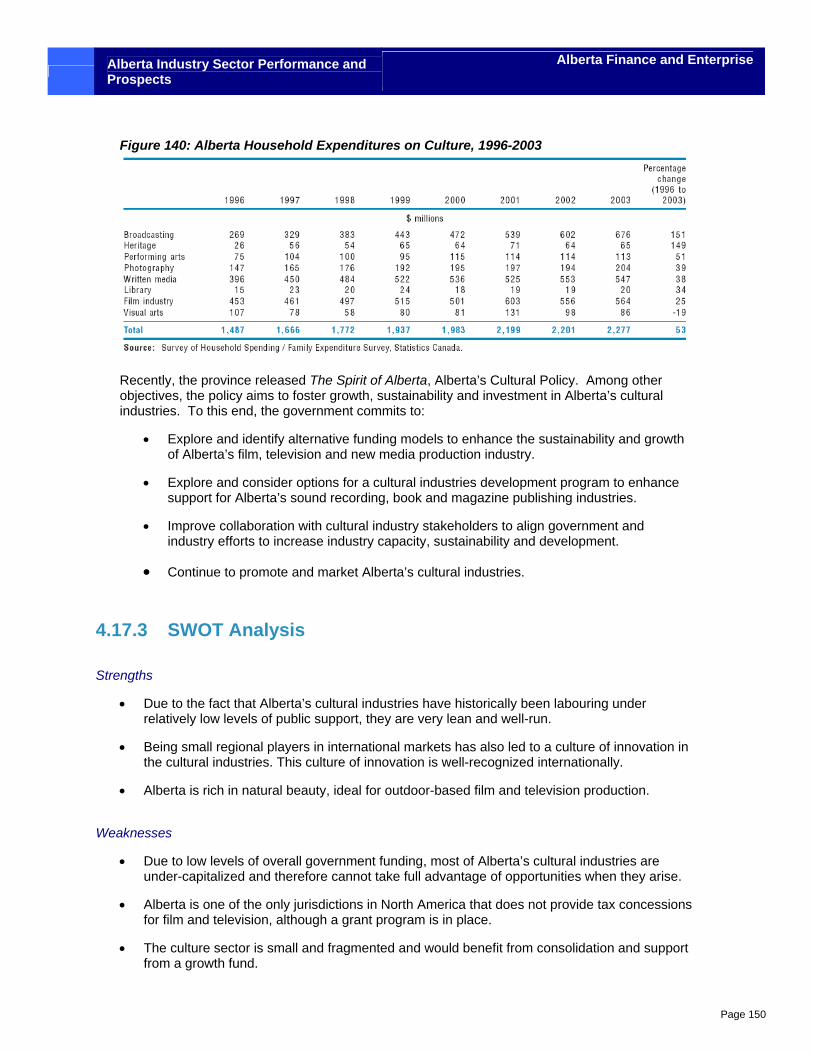
Alberta Industry Sector Performance and Prospects
Alberta Finance and Enterprise
Page 150
Figure 140: Alberta Household Expenditures on Culture, 1996-2003
Recently, the province released The Spirit of Alberta, Alberta’s Cultural Policy. Among other objectives, the policy aims to foster growth, sustainability and investment in Alberta’s cultural industries. To this end, the government commits to:
• Explore and identify alternative funding models to enhance the sustainability and growth of Alberta’s film, television and new media production industry.
• Explore and consider options for a cultural industries development program to enhance support for Alberta’s sound recording, book and magazine publishing industries.
• Improve collaboration with cultural industry stakeholders to align government and industry efforts to increase industry capacity, sustainability and development.
• Continue to promote and market Alberta’s cultural industries.
4.17.3 SWOT Analysis
Strengths
• Due to the fact that Alberta’s cultural industries have historically been labouring under relatively low levels of public support, they are very lean and well-run.
• Being small regional players in international markets has also led to a culture of innovation in the cultural industries. This culture of innovation is well-recognized internationally.
• Alberta is rich in natural beauty, ideal for outdoor-based film and television production.
Weaknesses
• Due to low levels of overall government funding, most of Alberta’s cultural industries are under-capitalized and therefore cannot take full advantage of opportunities when they arise.
• Alberta is one of the only jurisdictions in North America that does not provide tax concessions for film and television, although a grant program is in place.
• The culture sector is small and fragmented and would benefit from consolidation and support from a growth fund.
Alberta Industry Sector Performance and Prospects
Alberta Finance and Enterprise
Page 151
• Alberta’s cultural industries lack capacity, capability and strategic business skills.
• There is inherent conflict between creative excellence and commercial success.
• The sector is focused on survival, not long-term re-vitalization.
• The sector relies heavily on public funding.
Opportunities
• Any infusion of government funding could reap generous dividends. A 2005 study commissioned by the AFA suggested that when considering that 481 arts organizations that received $13 million through AFA programs, generated total value-added of $153 million for the provincial economy, the return on public arts funding is up to 12:1.
• As global standards of living increase, demand for cultural goods and services will also increase, opening up new markets and distribution channels.
• Technological convergence is changing the dynamics of media and communication, allowing innovative producers of culture to market and distribute globally without large capitalization.
• The scale of current demand for creativity along side the desire to participate in producing and creating it is on an extraordinary and under-reported scale.
• Alberta has the potential to exploit emerging markets and outsourcing to be lean and hence repatriating profits back to Alberta.
• Individual consumers have access to books, film and music more cheaply, which in turn stimulates their demand and capacity to enjoy creative and cultural offerings.
• If globalization is intensifying competition in the Canadian market, it similarly offers Alberta companies new markets in which to compete.
Threats
• The film and television sector has lost a number of crews in recent years, resulting in a significant decline in production capacity.
• Many foreign governments are making concerted efforts to attract foreign film productions and develop their creative sectors.
• Alberta is losing talent to other jurisdictions, which have well supported and mature cultural industries.
• Alberta is falling behind other countries in not diversifying.
• The culture industry is not an attractive sector for venture capital investment.
• There is increased international competition in this industry.
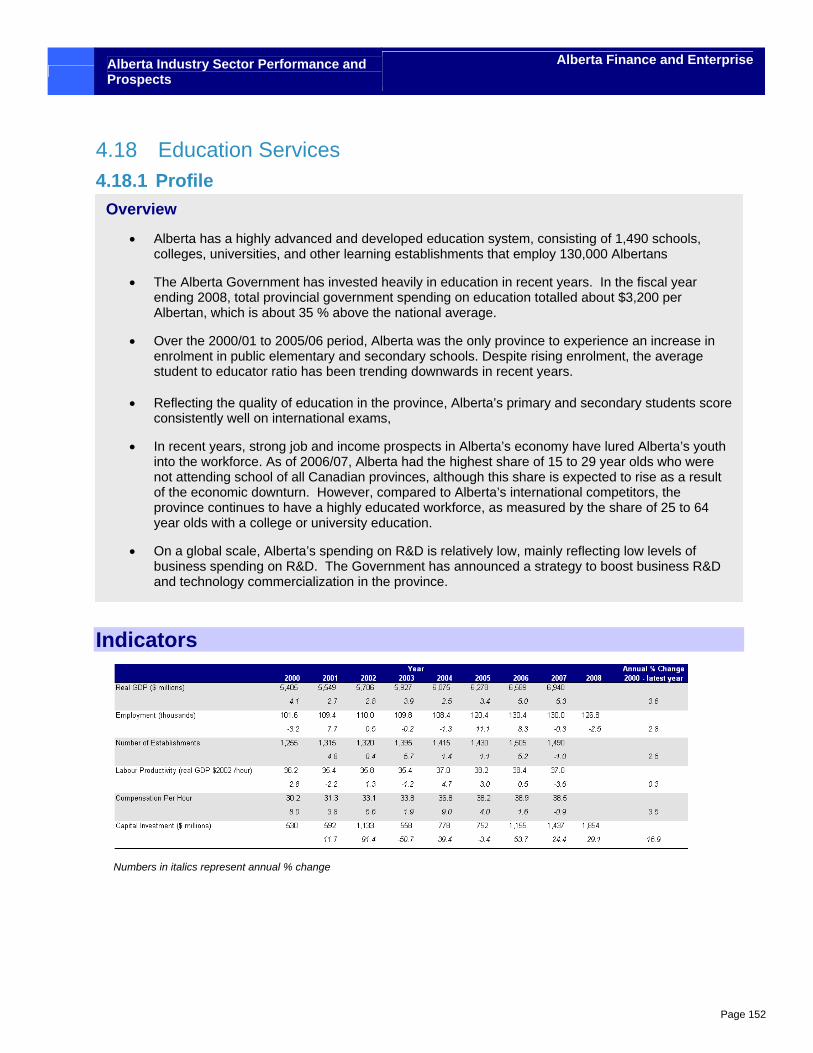
Alberta Industry Sector Performance and Prospects
Alberta Finance and Enterprise
Page 152
4.18 Education Services 4.18.1 Profile
Indicators
Numbers in italics represent annual % change
Overview
• Alberta has a highly advanced and developed education system, consisting of 1,490 schools, colleges, universities, and other learning establishments that employ 130,000 Albertans
• The Alberta Government has invested heavily in education in recent years. In the fiscal year ending 2008, total provincial government spending on education totalled about $3,200 per Albertan, which is about 35 % above the national average.
• Over the 2000/01 to 2005/06 period, Alberta was the only province to experience an increase in enrolment in public elementary and secondary schools. Despite rising enrolment, the average student to educator ratio has been trending downwards in recent years.
• Reflecting the quality of education in the province, Alberta’s primary and secondary students score
consistently well on international exams,
• In recent years, strong job and income prospects in Alberta’s economy have lured Alberta’s youth into the workforce. As of 2006/07, Alberta had the highest share of 15 to 29 year olds who were not attending school of all Canadian provinces, although this share is expected to rise as a result of the economic downturn. However, compared to Alberta’s international competitors, the province continues to have a highly educated workforce, as measured by the share of 25 to 64 year olds with a college or university education.
• On a global scale, Alberta’s spending on R&D is relatively low, mainly reflecting low levels of business spending on R&D. The Government has announced a strategy to boost business R&D and technology commercialization in the province.
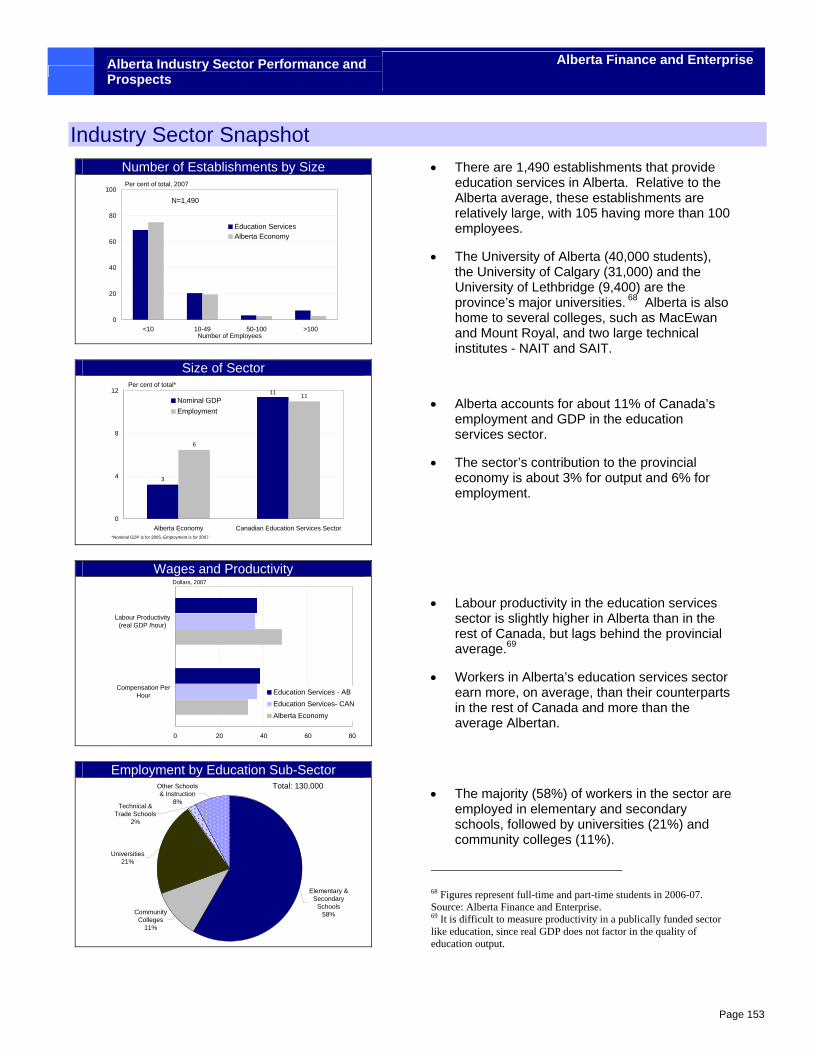
Alberta Industry Sector Performance and Prospects
Alberta Finance and Enterprise
Page 153
Industry Sector Snapshot Number of Establishments by Size
0
20
40
60
80
100
<10 10-49 50-100 >100
Education ServicesAlberta Economy
Per cent of total, 2007
Number of Employees
N=1,490
Size of Sector
3
6
1111
0
4
8
12
Alberta Economy Canadian Education Services Sector
Nominal GDPEmployment
Per cent of total*
*Nominal GDP is for 2005, Employment is for 2007
Wages and Productivity
0 20 40 60 80
Compensation PerHour
Labour Productivity(real GDP /hour)
Education Services - ABEducation Services- CANAlberta Economy
Dollars, 2007
Employment by Education Sub-Sector
Universities21%
Technical & Trade Schools
2%
Other Schools & Instruction
8%
Elementary & Secondary
Schools58%Community
Colleges 11%
Total: 130,000
• There are 1,490 establishments that provide education services in Alberta. Relative to the Alberta average, these establishments are relatively large, with 105 having more than 100 employees.
• The University of Alberta (40,000 students), the University of Calgary (31,000) and the University of Lethbridge (9,400) are the province’s major universities. 68 Alberta is also home to several colleges, such as MacEwan and Mount Royal, and two large technical institutes - NAIT and SAIT.
• Alberta accounts for about 11% of Canada’s employment and GDP in the education services sector.
• The sector’s contribution to the provincial economy is about 3% for output and 6% for employment.
• Labour productivity in the education services sector is slightly higher in Alberta than in the rest of Canada, but lags behind the provincial average.69
• Workers in Alberta’s education services sector earn more, on average, than their counterparts in the rest of Canada and more than the average Albertan.
• The majority (58%) of workers in the sector are employed in elementary and secondary schools, followed by universities (21%) and community colleges (11%).
68 Figures represent full-time and part-time students in 2006-07. Source: Alberta Finance and Enterprise. 69 It is difficult to measure productivity in a publically funded sector like education, since real GDP does not factor in the quality of education output.
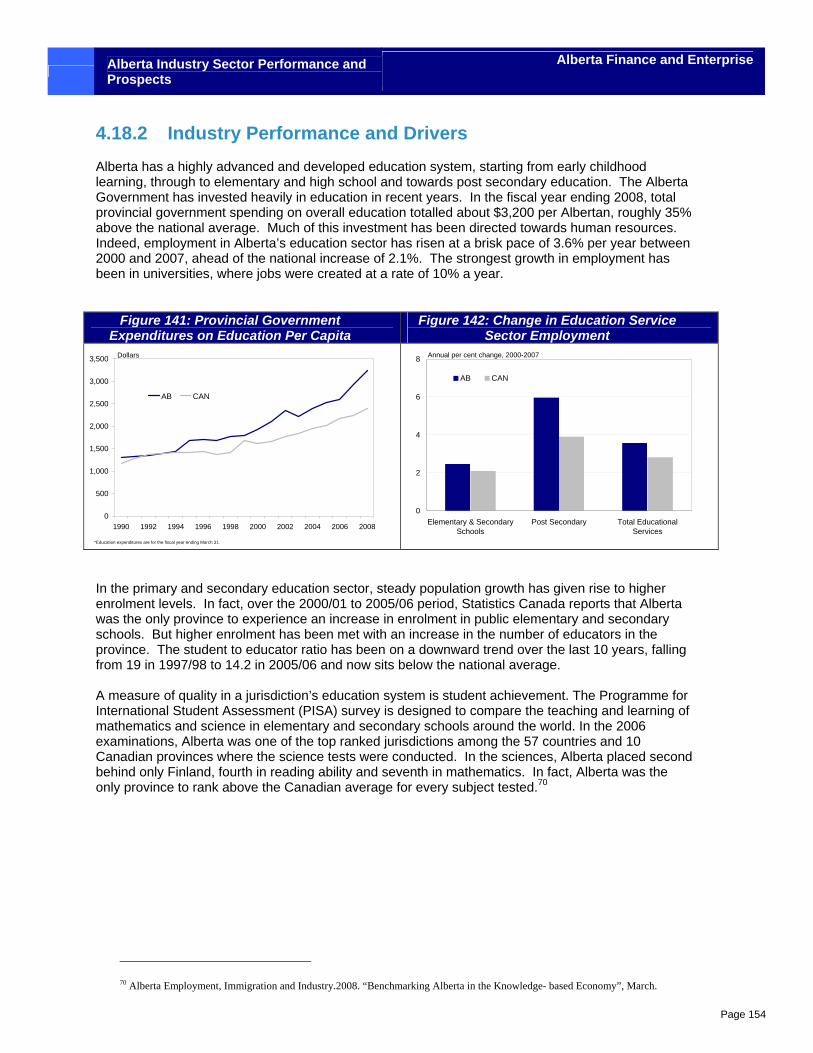
Alberta Industry Sector Performance and Prospects
Alberta Finance and Enterprise
Page 154
4.18.2 Industry Performance and Drivers
Alberta has a highly advanced and developed education system, starting from early childhood learning, through to elementary and high school and towards post secondary education. The Alberta Government has invested heavily in education in recent years. In the fiscal year ending 2008, total provincial government spending on overall education totalled about $3,200 per Albertan, roughly 35% above the national average. Much of this investment has been directed towards human resources. Indeed, employment in Alberta’s education sector has risen at a brisk pace of 3.6% per year between 2000 and 2007, ahead of the national increase of 2.1%. The strongest growth in employment has been in universities, where jobs were created at a rate of 10% a year.
Figure 141: Provincial Government
Expenditures on Education Per Capita Figure 142: Change in Education Service
Sector Employment
0
500
1,000
1,500
2,000
2,500
3,000
3,500
1990 1992 1994 1996 1998 2000 2002 2004 2006 2008
AB CAN
Dollars
*Education expenditures are for the fiscal year ending March 31.
0
2
4
6
8
Elementary & SecondarySchools
Post Secondary Total EducationalServices
AB CAN
Annual per cent change, 2000-2007
In the primary and secondary education sector, steady population growth has given rise to higher enrolment levels. In fact, over the 2000/01 to 2005/06 period, Statistics Canada reports that Alberta was the only province to experience an increase in enrolment in public elementary and secondary schools. But higher enrolment has been met with an increase in the number of educators in the province. The student to educator ratio has been on a downward trend over the last 10 years, falling from 19 in 1997/98 to 14.2 in 2005/06 and now sits below the national average. A measure of quality in a jurisdiction’s education system is student achievement. The Programme for International Student Assessment (PISA) survey is designed to compare the teaching and learning of mathematics and science in elementary and secondary schools around the world. In the 2006 examinations, Alberta was one of the top ranked jurisdictions among the 57 countries and 10 Canadian provinces where the science tests were conducted. In the sciences, Alberta placed second behind only Finland, fourth in reading ability and seventh in mathematics. In fact, Alberta was the only province to rank above the Canadian average for every subject tested.70
70 Alberta Employment, Immigration and Industry.2008. “Benchmarking Alberta in the Knowledge- based Economy”, March.
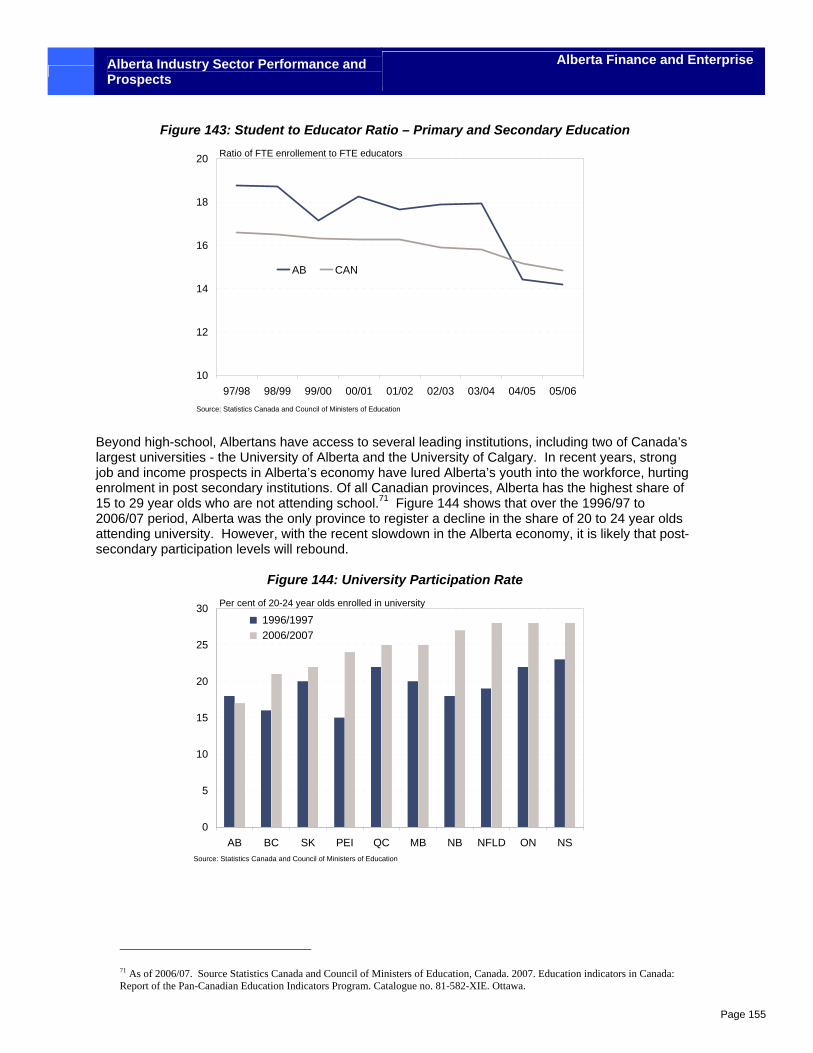
Alberta Industry Sector Performance and Prospects
Alberta Finance and Enterprise
Page 155
Figure 143: Student to Educator Ratio – Primary and Secondary Education
10
12
14
16
18
20
97/98 98/99 99/00 00/01 01/02 02/03 03/04 04/05 05/06
AB CAN
Ratio of FTE enrollement to FTE educators
Source: Statistics Canada and Council of Ministers of Education Beyond high-school, Albertans have access to several leading institutions, including two of Canada’s largest universities - the University of Alberta and the University of Calgary. In recent years, strong job and income prospects in Alberta’s economy have lured Alberta’s youth into the workforce, hurting enrolment in post secondary institutions. Of all Canadian provinces, Alberta has the highest share of 15 to 29 year olds who are not attending school.71 Figure 144 shows that over the 1996/97 to 2006/07 period, Alberta was the only province to register a decline in the share of 20 to 24 year olds attending university. However, with the recent slowdown in the Alberta economy, it is likely that post-secondary participation levels will rebound.
Figure 144: University Participation Rate
0
5
10
15
20
25
30
AB BC SK PEI QC MB NB NFLD ON NS
1996/1997 2006/2007
Per cent of 20-24 year olds enrolled in university
Source: Statistics Canada and Council of Ministers of Education
71 As of 2006/07. Source Statistics Canada and Council of Ministers of Education, Canada. 2007. Education indicators in Canada: Report of the Pan-Canadian Education Indicators Program. Catalogue no. 81-582-XIE. Ottawa.
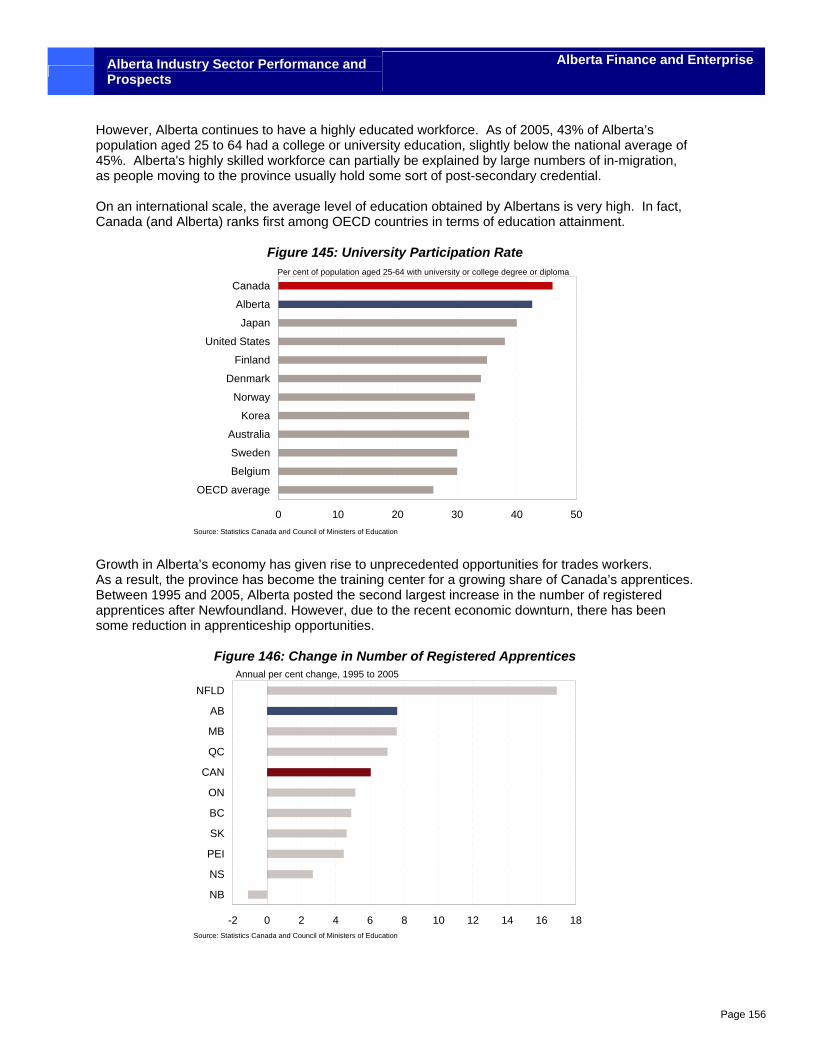
Alberta Industry Sector Performance and Prospects
Alberta Finance and Enterprise
Page 156
However, Alberta continues to have a highly educated workforce. As of 2005, 43% of Alberta’s population aged 25 to 64 had a college or university education, slightly below the national average of 45%. Alberta's highly skilled workforce can partially be explained by large numbers of in-migration, as people moving to the province usually hold some sort of post-secondary credential. On an international scale, the average level of education obtained by Albertans is very high. In fact, Canada (and Alberta) ranks first among OECD countries in terms of education attainment.
Figure 145: University Participation Rate
0 10 20 30 40 50
OECD average
Belgium
Sweden
Australia
Korea
Norway
Denmark
Finland
United States
Japan
Alberta
CanadaPer cent of population aged 25-64 with university or college degree or diploma
Source: Statistics Canada and Council of Ministers of Education
Growth in Alberta’s economy has given rise to unprecedented opportunities for trades workers. As a result, the province has become the training center for a growing share of Canada’s apprentices. Between 1995 and 2005, Alberta posted the second largest increase in the number of registered apprentices after Newfoundland. However, due to the recent economic downturn, there has been some reduction in apprenticeship opportunities.
Figure 146: Change in Number of Registered Apprentices
-2 0 2 4 6 8 10 12 14 16 18
NB
NS
PEI
SK
BC
ON
CAN
QC
MB
AB
NFLDAnnual per cent change, 1995 to 2005
Source: Statistics Canada and Council of Ministers of Education
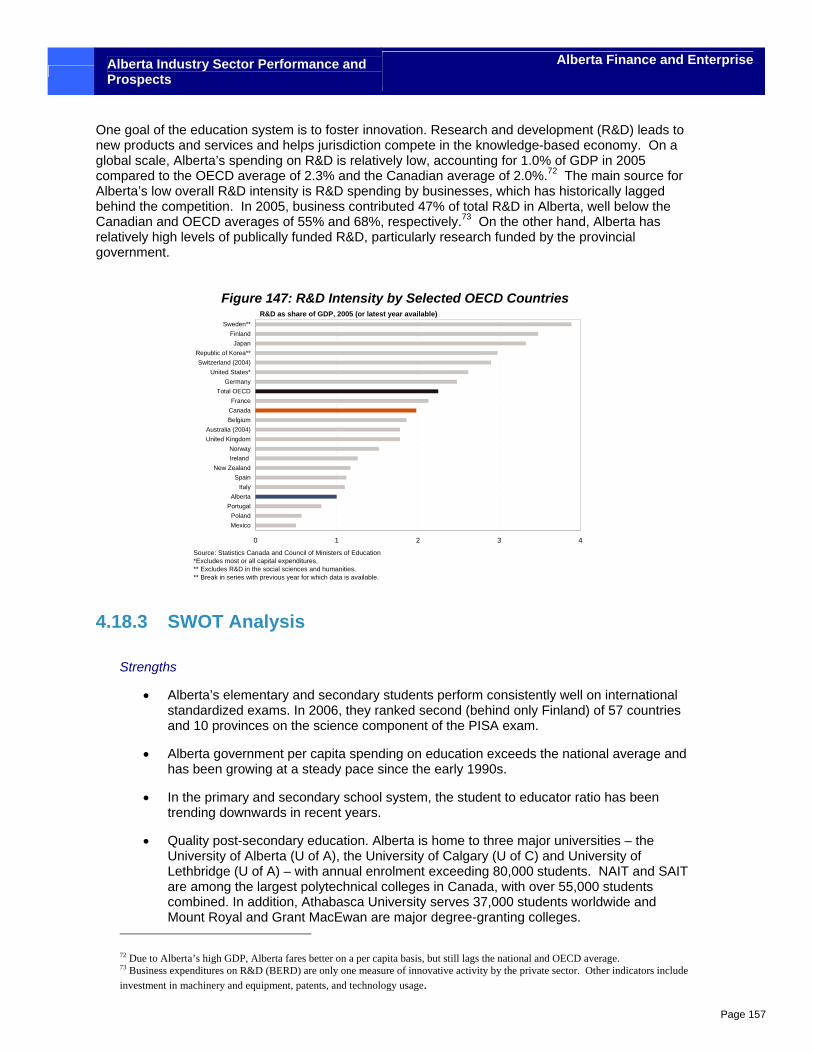
Alberta Industry Sector Performance and Prospects
Alberta Finance and Enterprise
Page 157
One goal of the education system is to foster innovation. Research and development (R&D) leads to new products and services and helps jurisdiction compete in the knowledge-based economy. On a global scale, Alberta’s spending on R&D is relatively low, accounting for 1.0% of GDP in 2005 compared to the OECD average of 2.3% and the Canadian average of 2.0%.72 The main source for Alberta’s low overall R&D intensity is R&D spending by businesses, which has historically lagged behind the competition. In 2005, business contributed 47% of total R&D in Alberta, well below the Canadian and OECD averages of 55% and 68%, respectively.73 On the other hand, Alberta has relatively high levels of publically funded R&D, particularly research funded by the provincial government.
Figure 147: R&D Intensity by Selected OECD Countries
0 1 2 3 4
MexicoPoland
PortugalAlberta
ItalySpain
New ZealandIreland Norway
United KingdomAustralia (2004)
BelgiumCanadaFrance
Total OECDGermany
United States*Switzerland (2004)
Republic of Korea**Japan
FinlandSweden**
R&D as share of GDP, 2005 (or latest year available)
Source: Statistics Canada and Council of Ministers of Education*Excludes most or all capital expenditures. ** Excludes R&D in the social sciences and humanities. ** Break in series with previous year for which data is available.
4.18.3 SWOT Analysis
Strengths
• Alberta’s elementary and secondary students perform consistently well on international standardized exams. In 2006, they ranked second (behind only Finland) of 57 countries and 10 provinces on the science component of the PISA exam.
• Alberta government per capita spending on education exceeds the national average and has been growing at a steady pace since the early 1990s.
• In the primary and secondary school system, the student to educator ratio has been trending downwards in recent years.
• Quality post-secondary education. Alberta is home to three major universities – the University of Alberta (U of A), the University of Calgary (U of C) and University of Lethbridge (U of A) – with annual enrolment exceeding 80,000 students. NAIT and SAIT are among the largest polytechnical colleges in Canada, with over 55,000 students combined. In addition, Athabasca University serves 37,000 students worldwide and Mount Royal and Grant MacEwan are major degree-granting colleges.
72 Due to Alberta’s high GDP, Alberta fares better on a per capita basis, but still lags the national and OECD average. 73 Business expenditures on R&D (BERD) are only one measure of innovative activity by the private sector. Other indicators include investment in machinery and equipment, patents, and technology usage.
Alberta Industry Sector Performance and Prospects
Alberta Finance and Enterprise
Page 158
• World-class research. Alberta’s universities are world leaders in a number of research areas, including science and medicine, arts and culture, energy, and agriculture. Some examples include:
Urban Alliance (U of C). A partnership between the U of C and the City of Calgary created to develop innovative solutions to complex issues facing Calgary.
Hotchkiss Brain Institute (U of C). Samuel Weiss, director of the institute, won the prestigious Gairdner International Award for his advancements in the field of development neurobiology and neural degeneration.
National Institute for Nanotechnology (U of A). The 20,000 square foot building is one of the world’s most technologically advanced research facilities.
Alberta Diabetes Institute (U of A). A new research facility dedicated to discovering ways to prevent, treat, and cure diabetes through multidisciplinary research and teamwork.
Weaknesses
• Alberta has a relatively high share of 18-29 year olds who are not attending school, mainly reflecting attractive job and income opportunities now available to workers without a post-secondary education. However, there will likely be some improvement in post-secondary participation levels given the slowdown in the economy.
• Despite high levels of public spending on R&D, investment in R&D by businesses remains low. As a result, much of the R&D conducted in Alberta is basic research, mainly at the university level. Much of this research does not go beyond the concept stage and does not lead to the development of commercialized technologies in Alberta.
Opportunities
• Historically an economic downturn results in increased enrolment in advanced education as people upgrade skills. This translates into more business for advanced learning institutions and a more highly educated workforce.
• The Alberta Government has developed a Research and Innovation Framework, which will help ensure the focused growth of Alberta's whole research and innovation system. This new framework is intended to improve Alberta's research and innovation system by making it less complex, more focused on strategic priorities, more consolidated, and with less overlap and stronger links between the players.
• The Alberta Government has launched an Action Plan – Bringing Technology to the Market. Launched June 2008, the plan intends to increase the number of companies in emerging advanced technology sectors. The plan should also improve the link between university and business research activities, leading to a higher rate of technology commercialization in the province. The plan includes:
• Youth Technopreneurship Program. Business plan contests for young (post secondary and secondary) entrepreneurs with prizes totalling $10,000 to $20,000;
• Alberta Enterprise Corporation. $100 million in venture capital funds for priority, underserved sectors (e.g. life sciences, ICT, environmental technologies, nanotechnology);
Alberta Industry Sector Performance and Prospects
Alberta Finance and Enterprise
Page 159
• Alberta R&D tax credit. A 10% credit on eligible R&D expenditures up to $4 million, which is fully refundable for all companies; and
• Innovation Voucher Pilot Program. A $10,000 to $50,000 voucher to help knowledge-driven businesses get their ideas and products to markets faster.
• As part of its fiscal economic stimulus package announced January 2009, the Federal government has committed up to $2 billion for the Knowledge Infrastructure Program. These funds can be used by post-secondary institutions to support maintenance of existing facilities, new capital projects, upgrading laboratories and improving energy efficiency.
Threats
• The reduction of investment in the construction industry is resulting in a drop in employment opportunities for both apprentices and journeypersons. This will pose a short-term challenge to ensure apprentices complete their certification. In the longer term, the anticipated increase in future construction investment combined with expected retirements will require a steady labour supply to meet the new demands. The challenge for apprenticeship training will be to maintain a long-term system perspective while still responding to short-term labour market demands.
• Alberta’s educators are aging and will need to be replaced to meet rising enrolment levels. In Alberta’s primary and secondary schools, 31% of full-time educators are over the age of 50 as of 2005/2006, the third highest share after B.C. and Manitoba. The problem is even worse in Alberta’s universities, where Statistics Canada reports that 48% of full-time teaching staff was over the age of 50 in 2005/2006.74
• Heightened global competition is increasing the cost of attracting and retaining faculty members to Alberta. The Association of Universities and Colleges of Canada (AUCC) reports that countries throughout the OECD are setting ambitious targets for R&D investments, raising the demand for faculty members going forward. In Canada cost pressures are already starting to mount, with the AUCC reporting that salaries have increased at more than double the annual inflation rate since 1999.75
• The current economic crisis is putting pressure on government budgets across Canada. However, for Alberta to remain a competitive jurisdiction for research, the province must continue to invest in university infrastructure and research during the downturn.
• Many of Alberta’s post-secondary institutions have buildings that were constructed in the 1960s and 1970s or earlier and are in need of maintenance and repair. The province's 2008-2011 capital plan includes $1.8 billion for both preservation ($400 million) and expansion ($1.4 billion) projects at public post-secondary institutions.
74 Statistics Canada and Council of Ministers of Education in Canada. 2007. “Education indicators in Canada: Report of the Pan-Canadian Education Indicators Program”. 75 AUCC. 2008. “Trends in Higher Education: Volume 3. Finance”
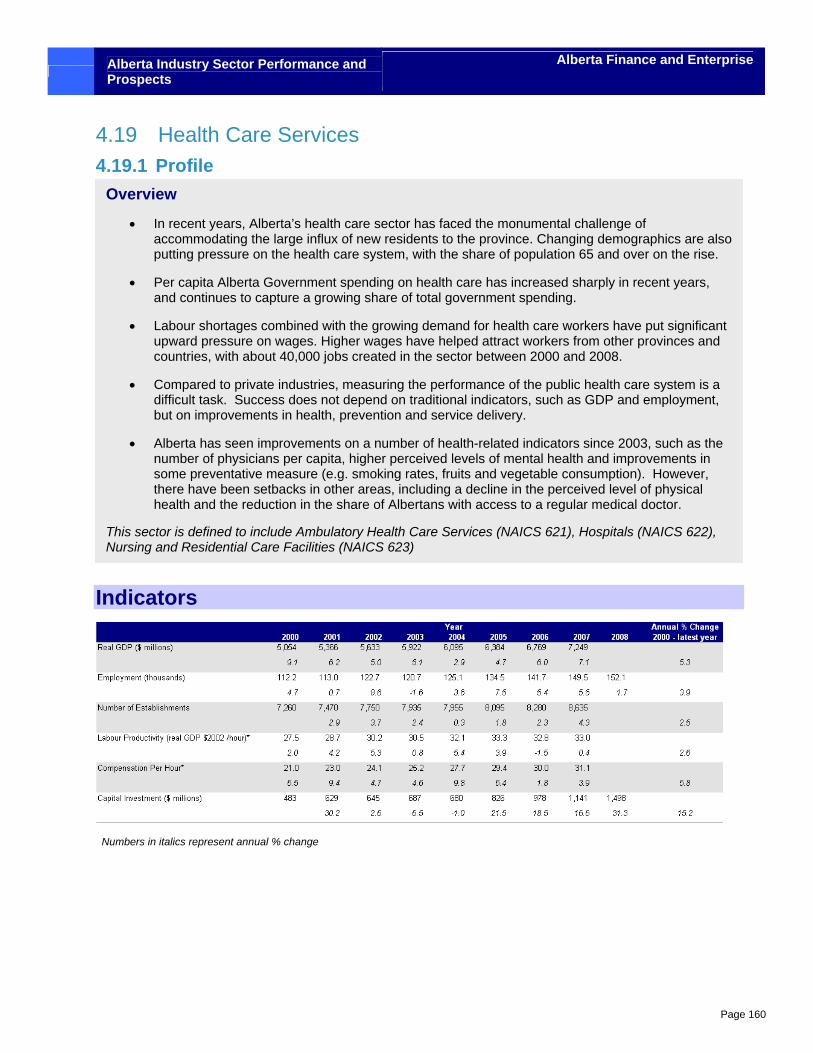
Alberta Industry Sector Performance and Prospects
Alberta Finance and Enterprise
Page 160
4.19 Health Care Services 4.19.1 Profile
Indicators
Numbers in italics represent annual % change
Overview
• In recent years, Alberta’s health care sector has faced the monumental challenge of accommodating the large influx of new residents to the province. Changing demographics are also putting pressure on the health care system, with the share of population 65 and over on the rise.
• Per capita Alberta Government spending on health care has increased sharply in recent years, and continues to capture a growing share of total government spending.
• Labour shortages combined with the growing demand for health care workers have put significant upward pressure on wages. Higher wages have helped attract workers from other provinces and countries, with about 40,000 jobs created in the sector between 2000 and 2008.
• Compared to private industries, measuring the performance of the public health care system is a difficult task. Success does not depend on traditional indicators, such as GDP and employment, but on improvements in health, prevention and service delivery.
• Alberta has seen improvements on a number of health-related indicators since 2003, such as the number of physicians per capita, higher perceived levels of mental health and improvements in some preventative measure (e.g. smoking rates, fruits and vegetable consumption). However, there have been setbacks in other areas, including a decline in the perceived level of physical health and the reduction in the share of Albertans with access to a regular medical doctor.
This sector is defined to include Ambulatory Health Care Services (NAICS 621), Hospitals (NAICS 622), Nursing and Residential Care Facilities (NAICS 623)
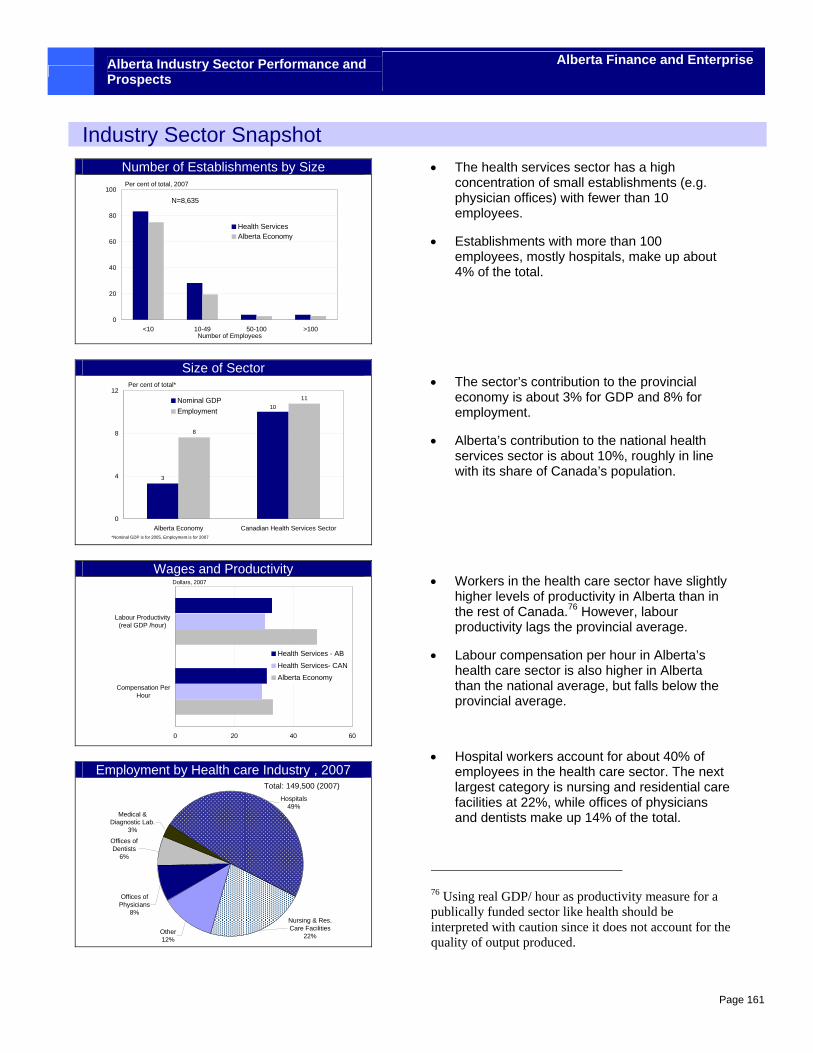
Alberta Industry Sector Performance and Prospects
Alberta Finance and Enterprise
Page 161
Industry Sector Snapshot Number of Establishments by Size
0
20
40
60
80
100
<10 10-49 50-100 >100
Health ServicesAlberta Economy
Per cent of total, 2007
Number of Employees
N=8,635
Size of Sector
3
8
1110
0
4
8
12
Alberta Economy Canadian Health Services Sector
Nominal GDPEmployment
Per cent of total*
*Nominal GDP is for 2005, Employment is for 2007
Wages and Productivity
0 20 40 60
Compensation PerHour
Labour Productivity(real GDP /hour)
Health Services - ABHealth Services- CANAlberta Economy
Dollars, 2007
Employment by Health care Industry , 2007
Medical & Diagnostic Lab.
3%
Hospitals49%
Nursing & Res. Care Facilities
22%
Offices of Physicians
8%
Offices of Dentists
6%
Other12%
Total: 149,500 (2007)
• The health services sector has a high concentration of small establishments (e.g. physician offices) with fewer than 10 employees.
• Establishments with more than 100 employees, mostly hospitals, make up about 4% of the total.
• The sector’s contribution to the provincial economy is about 3% for GDP and 8% for employment.
• Alberta’s contribution to the national health services sector is about 10%, roughly in line with its share of Canada’s population.
• Workers in the health care sector have slightly higher levels of productivity in Alberta than in the rest of Canada.76 However, labour productivity lags the provincial average.
• Labour compensation per hour in Alberta’s health care sector is also higher in Alberta than the national average, but falls below the provincial average.
• Hospital workers account for about 40% of employees in the health care sector. The next largest category is nursing and residential care facilities at 22%, while offices of physicians and dentists make up 14% of the total.
76 Using real GDP/ hour as productivity measure for a publically funded sector like health should be interpreted with caution since it does not account for the quality of output produced.
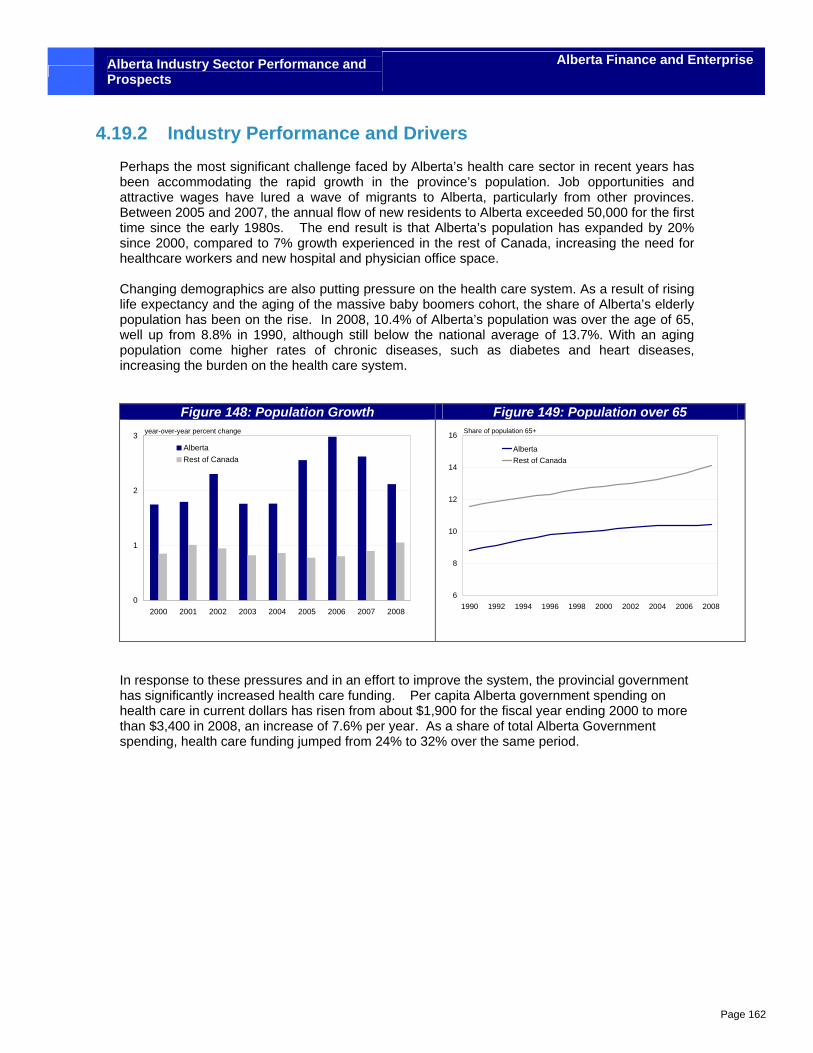
Alberta Industry Sector Performance and Prospects
Alberta Finance and Enterprise
Page 162
4.19.2 Industry Performance and Drivers Perhaps the most significant challenge faced by Alberta’s health care sector in recent years has been accommodating the rapid growth in the province’s population. Job opportunities and attractive wages have lured a wave of migrants to Alberta, particularly from other provinces. Between 2005 and 2007, the annual flow of new residents to Alberta exceeded 50,000 for the first time since the early 1980s. The end result is that Alberta’s population has expanded by 20% since 2000, compared to 7% growth experienced in the rest of Canada, increasing the need for healthcare workers and new hospital and physician office space. Changing demographics are also putting pressure on the health care system. As a result of rising life expectancy and the aging of the massive baby boomers cohort, the share of Alberta’s elderly population has been on the rise. In 2008, 10.4% of Alberta’s population was over the age of 65, well up from 8.8% in 1990, although still below the national average of 13.7%. With an aging population come higher rates of chronic diseases, such as diabetes and heart diseases, increasing the burden on the health care system.
Figure 148: Population Growth Figure 149: Population over 65
0
1
2
3
2000 2001 2002 2003 2004 2005 2006 2007 2008
AlbertaRest of Canada
year-over-year percent change
6
8
10
12
14
16
1990 1992 1994 1996 1998 2000 2002 2004 2006 2008
AlbertaRest of Canada
Share of population 65+
In response to these pressures and in an effort to improve the system, the provincial government has significantly increased health care funding. Per capita Alberta government spending on health care in current dollars has risen from about $1,900 for the fiscal year ending 2000 to more than $3,400 in 2008, an increase of 7.6% per year. As a share of total Alberta Government spending, health care funding jumped from 24% to 32% over the same period.
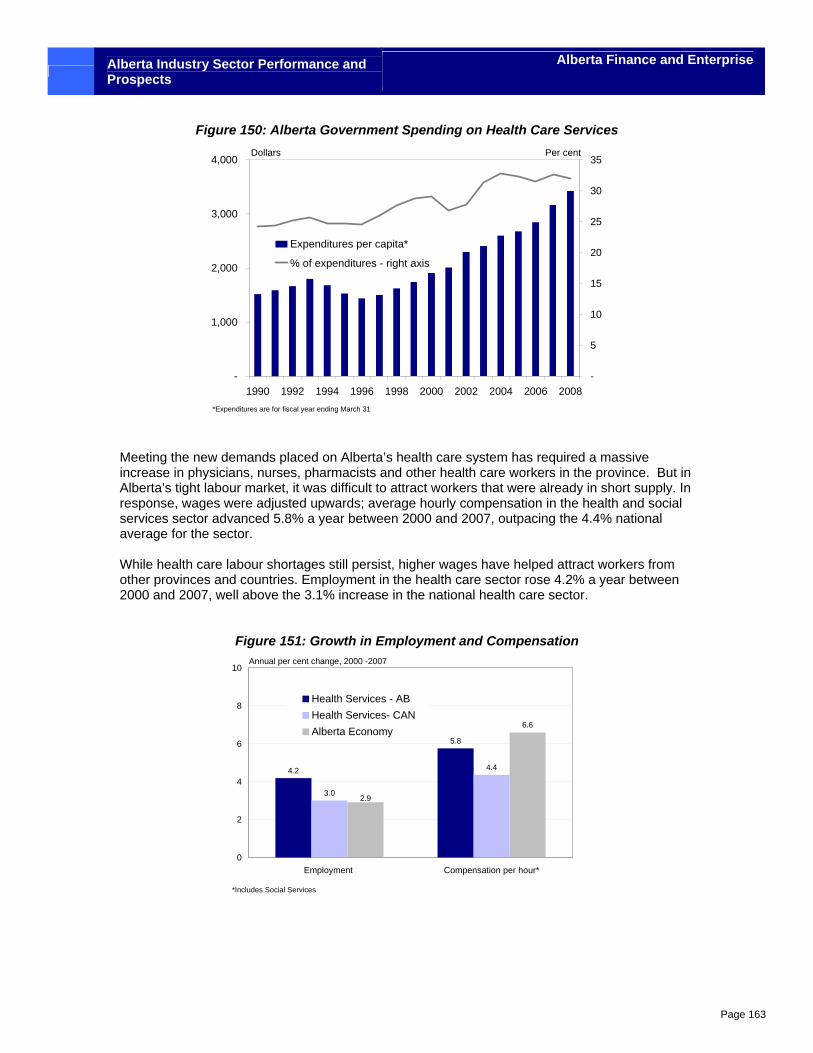
Alberta Industry Sector Performance and Prospects
Alberta Finance and Enterprise
Page 163
Figure 150: Alberta Government Spending on Health Care Services
-
1,000
2,000
3,000
4,000
1990 1992 1994 1996 1998 2000 2002 2004 2006 2008-
5
10
15
20
25
30
35
Expenditures per capita*
% of expenditures - right axis
Dollars Per cent
*Expenditures are for fiscal year ending March 31
Meeting the new demands placed on Alberta’s health care system has required a massive increase in physicians, nurses, pharmacists and other health care workers in the province. But in Alberta’s tight labour market, it was difficult to attract workers that were already in short supply. In response, wages were adjusted upwards; average hourly compensation in the health and social services sector advanced 5.8% a year between 2000 and 2007, outpacing the 4.4% national average for the sector. While health care labour shortages still persist, higher wages have helped attract workers from other provinces and countries. Employment in the health care sector rose 4.2% a year between 2000 and 2007, well above the 3.1% increase in the national health care sector.
Figure 151: Growth in Employment and Compensation
4.2
5.8
3.0
4.4
6.6
2.9
0
2
4
6
8
10
Employment Compensation per hour*
Health Services - ABHealth Services- CANAlberta Economy
Annual per cent change, 2000 -2007
*Includes Social Services
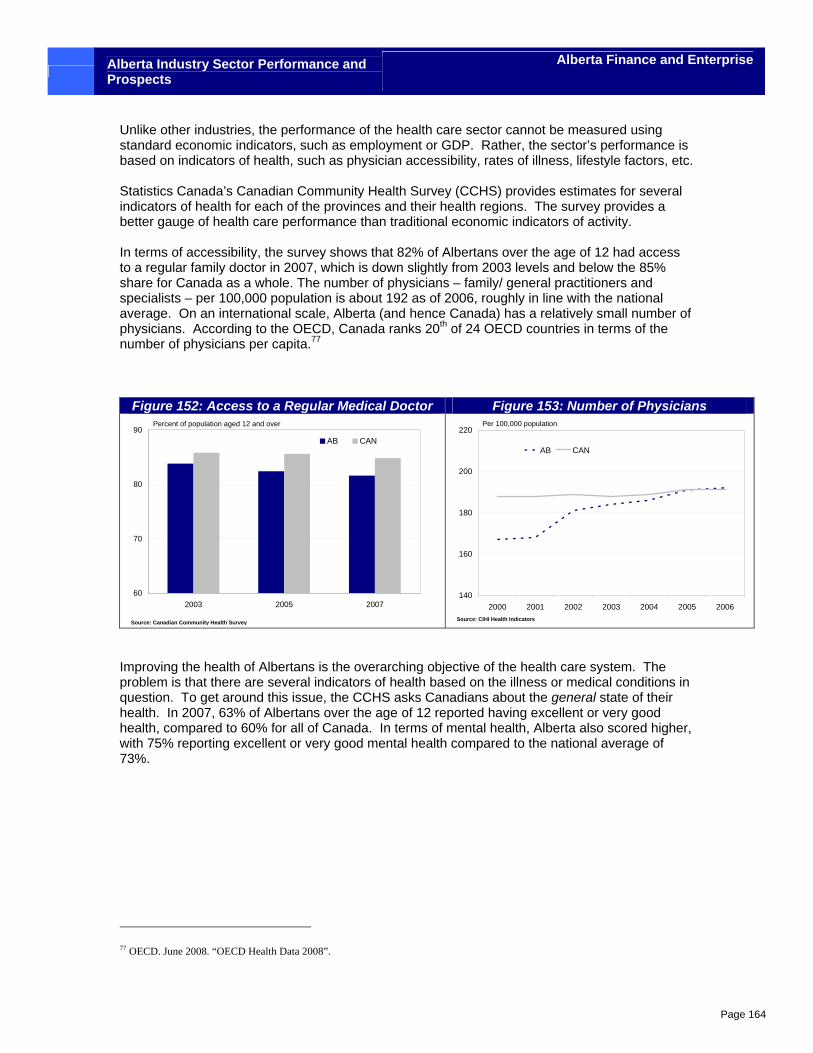
Alberta Industry Sector Performance and Prospects
Alberta Finance and Enterprise
Page 164
Unlike other industries, the performance of the health care sector cannot be measured using standard economic indicators, such as employment or GDP. Rather, the sector’s performance is based on indicators of health, such as physician accessibility, rates of illness, lifestyle factors, etc. Statistics Canada’s Canadian Community Health Survey (CCHS) provides estimates for several indicators of health for each of the provinces and their health regions. The survey provides a better gauge of health care performance than traditional economic indicators of activity. In terms of accessibility, the survey shows that 82% of Albertans over the age of 12 had access to a regular family doctor in 2007, which is down slightly from 2003 levels and below the 85% share for Canada as a whole. The number of physicians – family/ general practitioners and specialists – per 100,000 population is about 192 as of 2006, roughly in line with the national average. On an international scale, Alberta (and hence Canada) has a relatively small number of physicians. According to the OECD, Canada ranks 20th of 24 OECD countries in terms of the number of physicians per capita.77
Figure 152: Access to a Regular Medical Doctor Figure 153: Number of Physicians
60
70
80
90
2003 2005 2007
AB CAN
Percent of population aged 12 and over
Source: Canadian Community Health Survey
140
160
180
200
220
2000 2001 2002 2003 2004 2005 2006
AB CAN
Per 100,000 population
Source: CIHI Health Indicators
Improving the health of Albertans is the overarching objective of the health care system. The problem is that there are several indicators of health based on the illness or medical conditions in question. To get around this issue, the CCHS asks Canadians about the general state of their health. In 2007, 63% of Albertans over the age of 12 reported having excellent or very good health, compared to 60% for all of Canada. In terms of mental health, Alberta also scored higher, with 75% reporting excellent or very good mental health compared to the national average of 73%.
77 OECD. June 2008. “OECD Health Data 2008”.
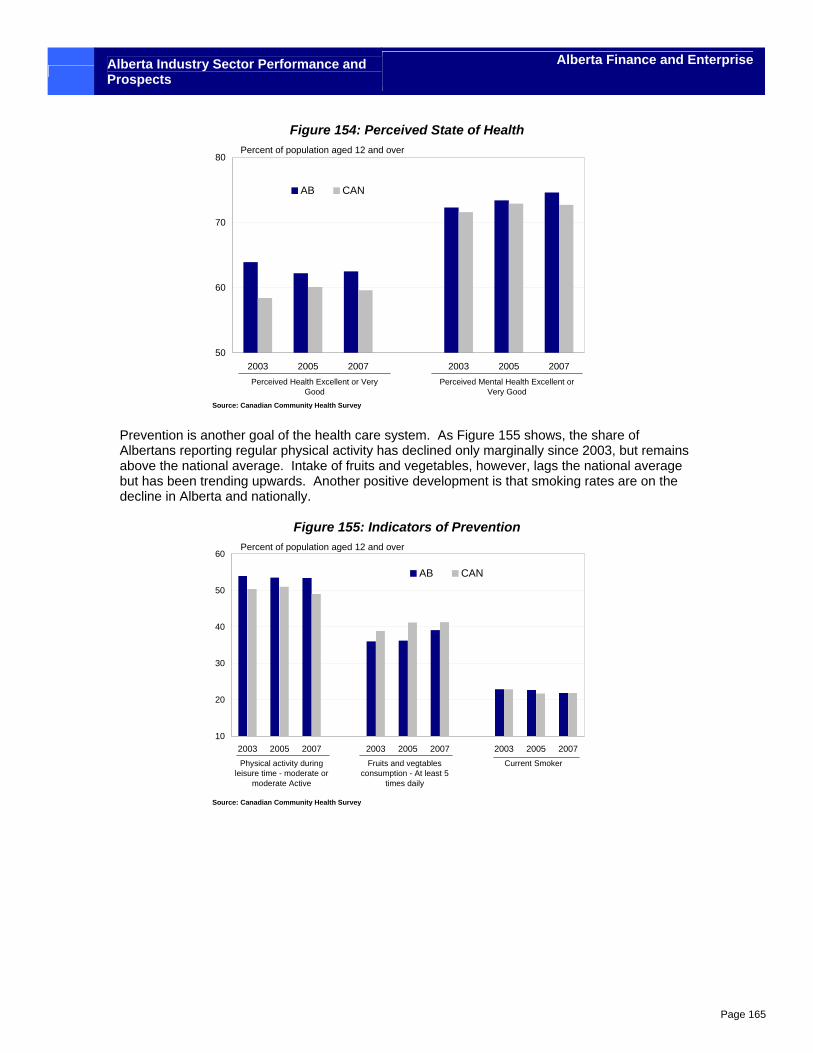
Alberta Industry Sector Performance and Prospects
Alberta Finance and Enterprise
Page 165
Figure 154: Perceived State of Health
50
60
70
80
2003 2005 2007 2003 2005 2007
AB CAN
Percent of population aged 12 and over
Perceived Health Excellent or Very Good
Perceived Mental Health Excellent or Very Good
Source: Canadian Community Health Survey
Prevention is another goal of the health care system. As Figure 155 shows, the share of Albertans reporting regular physical activity has declined only marginally since 2003, but remains above the national average. Intake of fruits and vegetables, however, lags the national average but has been trending upwards. Another positive development is that smoking rates are on the decline in Alberta and nationally.
Figure 155: Indicators of Prevention
10
20
30
40
50
60
2003 2005 2007 2003 2005 2007 2003 2005 2007
AB CAN
Percent of population aged 12 and over
Physical activity during leisure time - moderate or
moderate Active
Source: Canadian Community Health Survey
Fruits and vegtables consumption - At least 5
times daily
Current Smoker
Alberta Industry Sector Performance and Prospects
Alberta Finance and Enterprise
Page 166
4.19.3 SWOT Analysis
Strengths
• Alberta has made significant investments in health care in recent years. According to the Canadian Institute for Health Information, the number of physicians in Alberta (per 100,000 population) has been steadily increasing since 2000.
• Alberta is becoming a leader in research in the health sciences and has gained a reputation as a center of excellence in biomedical, clinical, population health and health services research. Examples include the Alberta Heart Institute, the Alberta Bone and Joint Health Program and Network, and the Comprehensive Tissue Centre.
• The Alberta Government has been actively seeking ways to improve the health care system. On April 16th, 2008 it launched a Vision 2020 strategy document, a Health Action Plan, which has since led to a Continuing Care Strategy and Pharmaceutical Strategy, and a Children’s Mental Health Plan.
• To improve healthcare delivery, there has been a shift towards primary health care, as well as the significant investment in the electronic health care record and physician office system. The governance structure has also changed from a regional to a single health authority entity, with improvement expectations focused on quality, accessibility and sustainability
Weaknesses
• Chronic labour shortages plague health care sector in Alberta and across Canada. The Alberta Government expects these shortages to continue. Between 2008 and 2018, the demand for physicians, dentists and veterinarians is expected to exceed the supply by about 13%.78
• Health care costs in Canada have been rising at an unsustainable rate. Public spending on health continues to consume an increasing share of government expenditures in Alberta and the rest of Canada.
• There is an urban-rural health gap in Canada. According to recent research by the Canadian Institute for Health Information, rural Canadians have higher health-related factors (e.g. smoking and obesity), lower life expectancy for men, higher overall mortality risks, and increased circulatory and respiratory disease mortality risk.79 Aboriginals also score relatively poorly on a variety of health-related indicators.
• Despite high levels of spending, Alberta has a low number of physicians when compared to other countries (see previous section).
Opportunities
• In 2004, Canada’s premiers developed “A 10-Year Plan to Strengthen Health Care”, to ensure timely access to high quality services. The plan strives to reduce wait times; improve prevention, promotion and public health; develop a national pharmaceutical strategy; improve homecare; develop human resources; and reform primary health care.
78 Alberta Employment and Immigration. 2008. “Alberta’s Occupational Demand and Supply Outlook: 2008-2018”. 79 Canadian Institute for Health Information. 2006. “How Healthy Are Rural Canadians? An Assessment of Their Health Status and Health Determinants”, September.
Alberta Industry Sector Performance and Prospects
Alberta Finance and Enterprise
Page 167
The Alberta Government is closely monitoring its progress in these areas, with the latest progress report issued in December 2007. 80
• Continuing reform is necessary to keep costs within capacity of public funding while
ensuring accessibility, delivery of patient centres quality care, and accountability.
• A move to one singe health region, the Alberta Health Services Board (AHS), and closer collaboration between Alberta Health and Wellness (AHW) and AHS may improve healthcare delivery.
Threats
• The recent rate of growth in health care costs is unsustainable. Should health care costs to increase at current rates, additional tax revenue will need to be raised or spending on other government programs scaled back.
• Increased international travel combined with the rise of new pathogens, e.g. severe acute respiratory syndrome (SARS), have increased the risk of communicable disease outbreaks.
• Chronic conditions and injuries are on the rise, overtaking communicable disease as the leading cause of illness. As the population continues to age, the incidence of chronic conditions, such as diabetes and cardiovascular disease, will only continue to increase.
• The incidences of diabetes, cardiovascular disease and chronic renal failure have increased. Diabetes increases the risk of other chronic conditions, such as hypertension, blindness and mental health problems.
• Rising expectation for access to supports and services due to new high-profile technological advancement in health care delivery.
• Alberta’s population is increasing and aging, placing increased demands on the healthcare system.
• Social instability and family instability can result in poor physical and mental health outcomes for children.
• Increased crime rates, mental health and addictions issues are having an impact on the health system.
• In certain communities the population is being affected by increased contamination of water, air and soil. However, environmental health affects do not usually show up until the next generation.
Sources:
Alberta Health and Wellness: “Health Trends in Alberta: A Working Document”, 2007. “Report on the Health of Albertans”, July 2006. The Centre for Innovation Studies: “The Alberta Health Industries Innovation System”, December 2007 80 See Alberta Health and Wellness: Alberta Progress on the 10-Year Plan to Strengthen Health Care 2007, http://www.health.alberta.ca/newsroom/pub-health-care-system.html
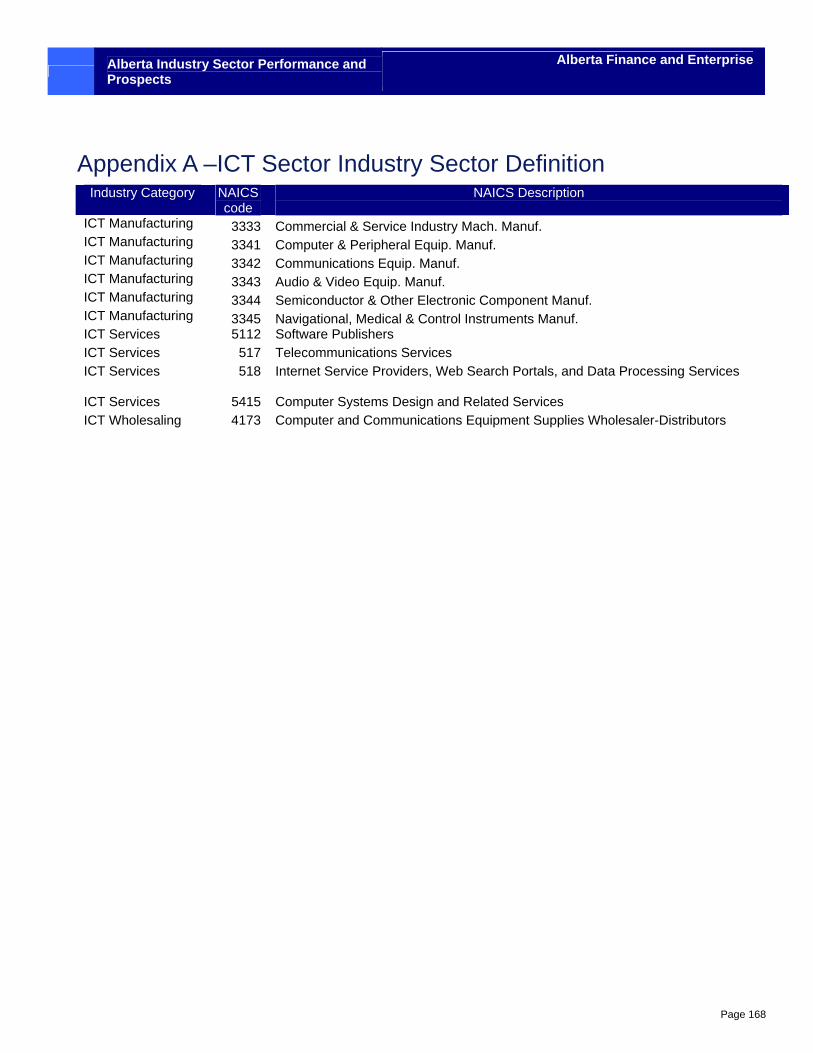
Alberta Industry Sector Performance and Prospects
Alberta Finance and Enterprise
Page 168
Appendix A –ICT Sector Industry Sector Definition Industry Category NAICS
code NAICS Description
ICT Manufacturing 3333 Commercial & Service Industry Mach. Manuf. ICT Manufacturing 3341 Computer & Peripheral Equip. Manuf. ICT Manufacturing 3342 Communications Equip. Manuf. ICT Manufacturing 3343 Audio & Video Equip. Manuf. ICT Manufacturing 3344 Semiconductor & Other Electronic Component Manuf. ICT Manufacturing 3345 Navigational, Medical & Control Instruments Manuf. ICT Services 5112 Software Publishers ICT Services 517 Telecommunications Services ICT Services 518 Internet Service Providers, Web Search Portals, and Data Processing Services
ICT Services 5415 Computer Systems Design and Related Services ICT Wholesaling 4173 Computer and Communications Equipment Supplies Wholesaler-Distributors
Alberta Industry Sector Performance and Prospects
Alberta Finance and Enterprise
Page 169
Appendix B – Sources of Information and Indicator Definitions
Data Sources
Unless otherwise indicated, all data presented in this report are from the Statistics Canada CANSIM database.
SWOT Information Sources
The SWOT analysis is based primarily on input received from industry sector experts across several departments within the Government of Alberta, including:
• Alberta Finance and Enterprise; • Alberta Energy; • Alberta Culture and Community Spirit; • Alberta Tourism, Parks and Recreation; • Alberta Advanced Education and Technology; • Alberta Transportation; • Alberta Agriculture, Food and Rural Development; • Alberta Health and Wellness; and • Alberta Education
In addition, publications from industry associations (as cited) were used and various PwC industry experts were consulted.
Definitions81
Revenues The total value of goods and services sold. For manufacturing industries, this represents shipments of goods produced, except shipments to internal warehouses and goods on consignment. Gross domestic product (GDP) The total unduplicated value of the goods and services produced by an industry. To make comparisons of GDP from one year to another, the effect of price variations must be eliminated. Thus, the variation solely in quantities produced is estimated by real GDP, that is, GDP for the period calculated at the price of another period (usually an earlier year), called the base year, such as 1997. Employment The number of persons drawing pay for services rendered or for paid absences, regardless whether employed on a full time, part-time or on a temporary basis. Hours Worked The total number of hours that a person spends working, whether paid or not. This includes regular and overtime hours, breaks, travel time, training in the workplace and time lost in brief work stoppages where workers remain at their posts. Time lost to strikes, lockouts, annual vacation, public holidays, sick leave, maternity leave or leave for personal needs is not included.
81 Based on Statistics Canada glossary definitions.
Alberta Industry Sector Performance and Prospects
Alberta Finance and Enterprise
Page 170
Labour Productivity Real GDP per hour worked. Total labour compensation All payments in cash or in kind made by domestic producers to workers for services rendered—in other words, total payroll. It includes the salaries and supplementary labour income of paid workers, plus an imputed labour income for self-employed workers. Capital Expenditures Gross expenditures on machinery and equipment (M&E) and structures. Excludes repair expenditures.