Embed Size (px)
Citation preview
ALBERTA’S UPSTREAM
OIL AND GAS ASSETS
INVENTORY STUDY Opportunities to Reduce Greenhouse Gas
Emissions at Existing Distributed Facilities
Cap-Op Energy September 30, 2013
Prepared for Alberta Innovates – Energy and Environmental Solutions
Alberta’s Oil and Gas Assets Inventory Study October 3, 2013
1
Acknowledgements
This report was prepared by Cap-Op Energy Inc. for PTAC Petroleum Technology Alliance Canada with
support from Alberta Innovates – Energy and Environment Solutions. The principal authors were Liz
Brennan, Peter MacLeod, Hannah Simmons and Adam Winter. The authors wish to express their
appreciation for the invaluable assistance, insight and comments received during the course of this work
from representatives of PTAC and the members of the project steering committee.
Disclaimer
PTAC Petroleum Technology Alliance Canada and Cap-Op Energy Inc. do not warrant or make any
representations or claims as to the validity, accuracy, currency, timeliness, completeness or otherwise of
the information contained in this report, nor shall they be liable or responsible for any claim or damage,
direct, indirect, special, consequential or otherwise arising out of the interpretation, use or reliance upon,
authorized or unauthorized, of such information.
The material and information in this report are being made available only under the conditions set out
herein. Alberta Innovates – Energy and Environment Solutions reserve copyrights to this report. No
material from this report may be copied, reproduced, republished, uploaded, posted, transmitted or
distributed in any way, unless otherwise indicated on this report, except for personal or internal company
use.
Alberta’s Oil and Gas Assets Inventory Study October 3, 2013
2
Table of Contents
Executive Summary ....................................................................................................................................... 4
Introduction .................................................................................................................................................. 6
Context ...................................................................................................................................................... 6
Objective ................................................................................................................................................... 7
Study Technologies ................................................................................................................................... 7
Methods Overview........................................................................................................................................ 9
Alberta Facilities ............................................................................................................................................ 9
Facilities and Assets Matrix ..................................................................................................................... 10
Deriving Asset Counts from Facility Counts ................................................................................................ 10
Wells........................................................................................................................................................ 10
Compressor Stations ............................................................................................................................... 10
Batteries .................................................................................................................................................. 11
Gas Gathering System ............................................................................................................................. 11
Gas Plant ................................................................................................................................................. 11
Low Greenhouse Gas Alternative Technologies ......................................................................................... 13
Methods and Study Parameters ............................................................................................................. 13
Summary of Findings............................................................................................................................... 14
Asset and Technology Linkages .............................................................................................................. 15
High Bleed to Low Bleed Pneumatic Instruments .............................................................................. 16
Pneumatic (Chemical Injection) Pumps to Low/No Bleed Pneumatic Pumps .................................... 17
Instrument Gas to Instrument Air ....................................................................................................... 17
Engines Coupled with Waste Heat Recovery ...................................................................................... 18
Engines Coupled with Vent Gas Capture ............................................................................................ 18
Engines Coupled with Air Fuel Ratio Controllers ................................................................................ 19
Well Site Vent Gas Capture ................................................................................................................. 20
Green (Reduced Emissions) Completions at New Gas Well Sites ....................................................... 20
Alberta’s Oil and Gas Assets Inventory Study October 3, 2013
3
Discussion ................................................................................................................................................... 21
Magnitude of GHG Emissions Reductions Possible ................................................................................ 21
Barriers to Reducing GHG Emissions from Upstream Oil and Gas Facilities ........................................... 21
Cost of Reducing GHG Emissions from Oil and Gas Facilities ................................................................. 22
Conclusion ................................................................................................................................................... 24
References .................................................................................................................................................. 25
Appendix A: Facility Process Flow Diagrams ............................................................................................... 27
Alberta’s Oil and Gas Assets Inventory Study October 3, 2013
4
Executive Summary Activities in Canada’s upstream oil and gas sector result in significant emissions of both carbon dioxide
(CO2) from combustion and flaring, as well as methane (CH4) from venting. However, little analysis into
the potential impact of applying existing energy efficiency upgrades to the sector has been completed.
These energy efficiency upgrades are, at present, not regulated or incentivized; yet, the potential
completion of energy efficiency projects provides the opportunity to realize substantial greenhouse gas
(GHG) emissions reductions.
At a national level, energy-related activities are the largest source of GHG emissions reported in the
Canadian National Inventory Report. In 2011, 163 Mt carbon dioxide equivalent (CO2e) was attributable
to the upstream oil and gas sector. This accounts for 23% of emissions in the Canadian National Inventory
Report.
Upstream oil and gas facilities include batteries, compressor stations, gas gathering stations, and gas
plants. Further, these facilities include pneumatic controllers, pneumatic pumps and engines that bleed
methane gas or produce combustion emissions as part of their normal operations. Emissions from these
assets of the oil and gas industry are significant.
An opportunity exists to reduce the emissions associated with these facilities using new market-ready
technologies. These technologies can reduce or eliminate the amount of CO2 emitted and methane vented
as part of normal operations, capture vented methane to be sold or re-used in an engine, or replace
natural gas in pneumatic instruments with compressed air. The objective of this inventory study is to
establish the link between upstream oil and gas facility assets and alternative, market-ready technologies
that perform an equivalent function while emitting fewer or no greenhouse gases. Establishing this link
allows for the determination of the existing assets that could benefit from energy efficiency upgrades.
Then, the volume of greenhouse gas emissions per year that could be reduced from the upstream oil and
gas sector in Alberta are estimated. The compilation of this dataset can inform public or private energy
efficiency projects or programs in the province.
At PTAC’s request, Cap-Op Energy conducted a desktop review of the distributed oil and gas facilities in
Alberta, and related methane control and energy efficiency technologies. The review was comprised of
three main components: an inventory of distributed oil and gas facilities in Alberta, a subsequent
inventory of the typical assets at each facility and a review of the applicable methane control or energy
efficiency technologies. The information gained from this three-phase review was used to inform
estimations of the potential greenhouse gas reductions possible within the upstream sector in Alberta.
The eight GHG reducing technologies studied in this report include:
Low/no-bleed pneumatic controllers
Engine fuel management systems (air-fuel ratio systems)
Vent gas capture (SlipStreamTM Technology)
Low/no-bleed pneumatic pumps
Custom waste heat recovery systems for process heat
Instrument gas to instrument air for pneumatic technologies
Well-site vent gas capture
Green completions

Alberta’s Oil and Gas Assets Inventory Study October 3, 2013
5
The conservative estimate of the stock of GHG emitting equipment that could be retrofitted with the
GHG efficient technologies was multiplied by the average GHG emissions reductions offered by each
technology. The resulting emissions reductions opportunity was the calculated as 35,300,000 tonnes
of CO2e per year. As such, the results presented within this report demonstrate that a large
opportunity to reduce GHG emissions within the upstream oil and gas sector of Alberta exists.
Alberta’s Oil and Gas Assets Inventory Study October 3, 2013
6
Introduction
Context Alberta is an important oil and gas producing region within Canada, and therefore has much higher
greenhouse gas emissions than other Canadian provinces, due in large part to the production and
processing of fossil fuel resources. The upstream oil and gas (UOG) sector activities generally include the
exploration for, and the production of, hydrocarbon resources. Downstream processes include separating
produced oil and gas mixtures, removing water from each of the product streams, removing acid gases
from natural gas, processing the sulphur gases, refining oil into transportation fuels, as well as
compressing and transporting the products to further processing or distribution. These activities result in
emissions of both carbon dioxide (CO2) from combustion and flaring, as well as methane (CH4) from
venting of raw gas or solution gas1.
Upstream oil and gas activities associated with the production of conventional crude oil and natural gas
are characterized by remote facility locations, which require robust and reliable equipment that can be
powered without access to electrical grids, or regular deliveries of processed liquid fuels. In many cases,
upstream oil and gas facilities are powered by raw natural gas, also called fuel gas. Upstream oil and gas
facilities include batteries, compressor stations, gas gathering stations, and gas plants.
Methane is the primary component in natural gas, comprising 85.8% of natural gas (averaged across the
province of Alberta) (Johnson & Coderre, 2012), and has a global warming potential of 21 times that of
carbon dioxide (CO2). Raw natural gas is emitted from natural gas production system processes such as
well completions and work-overs, well clean-up activities, pneumatic controllers, tank venting, and
fugitive venting. Similarly, methane is vented from liquid petroleum system processes such as pneumatic
controllers, tank venting, fugitives, refining, and process upsets (Natural Resources Defense Council,
2012). Combustion emissions are generated from the use of engines in compression, as well as from
flaring, when flaring is employed to dispose of excess raw gas.
Emissions from these aspects of the oil and gas industry are significant. At a national level, energy-related
activities are the largest source of GHG emissions reported in the Canadian National Inventory Report. In
2011, 163 Mt CO2e was attributable to the oil and gas sector in Canada, which represents 23% of the
national greenhouse gas total emissions (of 702 Mt CO2e) (Environment Canada, 2013). Within Alberta,
oil and gas and mining together (but excluding oil sands) constitute 18% of the province’s greenhouse gas
emissions (AESRD, 2013). There is substantial uncertainty in the estimations of fugitive and vented
methane emissions from the oil and gas industry. The American National Inventory has been described as
underestimating methane emissions, particularly with respect to gas vented during well completions, gas
vented for liquids unloading (“blowdown2” events), venting from well workovers3, and flaring (Natural
1 Solution gas, or associated gas, is produced in association with crude oil, and is separated from the produced oil in an “Oil Battery”, which collects produced volumes from multiple wells, and includes separation and storage infrastructure. 2 A gas blowdown is the term for venting or flaring accumulated gas that is hindering the production process. Gas may accumulate in low pressure wells or other production equipment or facilities. For example, a natural gas well may begin to accumulate fluids that prevent further gas flow. These fluids can be removed by depressuring the well and allowing the fluids to phase to gas and be vented (or flared) to the atmosphere. 3 A well workover generally refers to work performed on a well to replace a completion. Well workovers may be performed on wells with completions in poor condition, or due to changing operating conditions.
Alberta’s Oil and Gas Assets Inventory Study October 3, 2013
7
Resources Defense Council, 2012). That report highlights that similar uncertainty issues with respect to
methane emissions exist in Canada. Small emission sources that may result in cumulatively large emissions
totals have not been included in emissions monitoring and reporting programs, and not all emissions
sources are accounted for, particularly as new techniques are developed for unconventional gas
production. The NRDC paper indicates “natural gas processing plants discovered methane emissions were
roughly an order of magnitude higher than estimated” (Natural Resources Defense Council, 2012, pp.13).
The inaccuracy within the EPA estimates for the United States National Inventory stem from a lack of
quality field data, as well as the inability to apply one emissions factor that correctly describes the
emissions sources from each field. Emissions factors and Activity factors used within the American
National Inventory have continued to evolve, in an increasing fashion, as date becomes available from
field operators, and from participants in such programs as the EPA’s Natural Gas STAR.
An opportunity exists to reduce emissions with new market-ready4 technologies, which reduce or
eliminate the amount of methane vented as part of normal operations, capture vented methane to be
sold or re-used in an engine, or replace natural gas in pneumatic instruments with compressed air. These
technologies are available today and able to provide functionally-equivalent retrofit options, yet
understanding the magnitude of the opportunity to reduce greenhouse gas emissions in this sector is
important in order to stimulate public and private efforts towards methane emissions reductions.
Objective The objective of this inventory study is to establish the link between oil and gas facility assets and
alternative, market-ready technologies that perform an equivalent function while emitting fewer or no
greenhouse gases, in order to understand the gross opportunity for greenhouse gas emissions reductions
in the Province of Alberta. The establishment of the link between facility assets and retrofit technologies
will allow for the determination of the quantity of existing assets that could benefit from energy efficiency
upgrades. Then, a gross volume of greenhouse gas emissions per year that could be reduced from the
upstream oil and gas sector in Alberta can be estimated.
The compilation of this dataset can inform public or private energy efficiency projects or programs in the
province. The task is complicated by the need for proprietary data sets and inventories in order to
definitively address this problem, many of which are incomplete or non-existent. Therefore, a “top-down”
approach will be employed to conservatively estimate the numbers of assets per facilities based on the
Alberta Energy Regulator (AER) data.
Study Technologies This study focuses on a limited number of the possible methane control and/or energy efficiency retrofit
technologies that are applicable to upstream oil and gas equipment. Technologies included in this study
were chosen from a longer list of possible technologies, all of which are presented in studies or
publications highlighting methane control or energy efficiency technologies and their results to date. Such
sources include the Canadian Association of Petroleum Producers (CAPP) Best Management Practices, the
Environmental Protection Agency (EPA) Gas STAR program, and the Natural Defense Council’s 2012 report
entitled “Leaking Profits: The U.S. Oil Industry can Reduce Pollution, Conserve Resources, and Make
Money by Preventing Methane Waste”. Technologies included in this study are also market-ready, have
4 For the purposes of this paper, market-ready technologies are those that have moved beyond the demonstration phase of development, have been field-tested, and are commercially available.
Alberta’s Oil and Gas Assets Inventory Study October 3, 2013
8
the potential to be economic (i.e. the technologies show payback in 1 to 15 years, if carbon credit revenue
and fuel gas savings considered), and in some cases, already have an approved carbon offset credit
protocol in Alberta.
1. Engine Fuel Management: An engine management system that controls the engine’s air-to-fuel
ratio is implemented to improve fuel use efficiency.
2. Facility Vent Gas Capture: An engine management system that captures and uses vented
hydrocarbons, and then monitors and controls the addition of these hydrocarbons into the engine
fuel source. The SlipStreamTM by REM Technology is the primary example of this technology.
3. Low Bleed Pneumatics: High bleed pneumatic controllers (both snap-acting and throttle acting)
that are operated with natural gas can be retrofitted with low-bleed or self-contained pneumatic
controllers. High bleed controllers are defined as having a bleed rate greater than 0.17m3 per hour
(6 ft3 per hour), while low bleed controllers have a bleed rate less than 6 ft3 per hour, and may
include non-bleed controllers.
4. Waste Heat Recovery: Recovering waste heat from various processes reduces the requirement
for heat generation from fossil fuel combustion. A waste heat recovery system captures and
makes use of heat that would have otherwise been wasted to the atmosphere, such as exhaust
gases.
5. Chemical Pump Electrification: Chemical injection pumps, used to inject methanol and other
chemicals into wells and flow lines, are often powered by pressurized natural gas, and bleed
methane as part of their normal operations. Such natural-gas powered pumps can be replaced
with solar-charged direct current electric pumps, or standard alternating current electric pumps.
6. Instrument Gas to Instrument Air: Pneumatic controllers that use (and bleed) pressurized natural
gas as part of their normal operations can be retrofitted to run on compressed air. Atmospheric
air is compressed, stored in a volume tank, filtered, and dried for instrument use. Air used for
small pneumatic pumps, gas compressor motor starters, and pneumatic tools, does not need to
be dried. Such a system is ideally suited to a facility with multiple pneumatic devices that can all
be operated from one suite of air compressor equipment.
7. Well Site Vent Gas Capture: Vented natural gas from pneumatic instruments located at a well site
is captured. The fuel gas is routed to power a small flameless, gas-fired appliance that converts
natural gas or propane into usable infrared energy displacing the need to burn other fuels for
heat. The Cata-DyneTM heater by CCI Thermal Technologies is an example of this technology.
8. Green Completions (Reduced Emissions Completions): Temporary processing equipment is
brought to a wellbore cleanup in order to capture well cleanup fluids and gases, and to separate
fluids, gases, and debris. Processing equipment may include gas-liquid-sand separator traps,
portable separators, portable gas dehydration units, additional tanks, and small compressors.
Such processing equipment can be owned by the producer, or rented from a service company for
the duration of a well cleanup. Minimal permanent infrastructure is needed to link the processing
Alberta’s Oil and Gas Assets Inventory Study October 3, 2013
9
equipment with the well. This technology offers GHG reductions at new gas wells, and has not
been extensively deployed in Alberta.
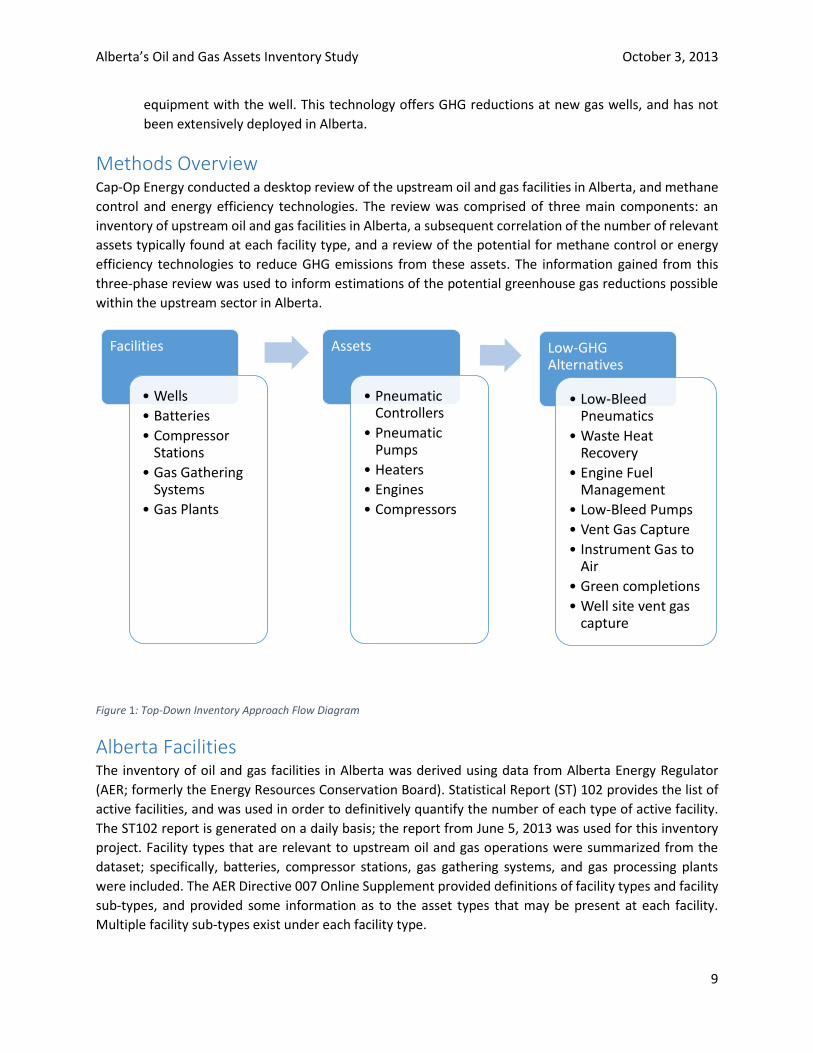
Methods Overview Cap-Op Energy conducted a desktop review of the upstream oil and gas facilities in Alberta, and methane
control and energy efficiency technologies. The review was comprised of three main components: an
inventory of upstream oil and gas facilities in Alberta, a subsequent correlation of the number of relevant
assets typically found at each facility type, and a review of the potential for methane control or energy
efficiency technologies to reduce GHG emissions from these assets. The information gained from this
three-phase review was used to inform estimations of the potential greenhouse gas reductions possible
within the upstream sector in Alberta.
Figure 1: Top-Down Inventory Approach Flow Diagram
Alberta Facilities The inventory of oil and gas facilities in Alberta was derived using data from Alberta Energy Regulator
(AER; formerly the Energy Resources Conservation Board). Statistical Report (ST) 102 provides the list of
active facilities, and was used in order to definitively quantify the number of each type of active facility.
The ST102 report is generated on a daily basis; the report from June 5, 2013 was used for this inventory
project. Facility types that are relevant to upstream oil and gas operations were summarized from the
dataset; specifically, batteries, compressor stations, gas gathering systems, and gas processing plants
were included. The AER Directive 007 Online Supplement provided definitions of facility types and facility
sub-types, and provided some information as to the asset types that may be present at each facility.
Multiple facility sub-types exist under each facility type.
Facilities
• Wells
• Batteries
• Compressor Stations
• Gas Gathering Systems
• Gas Plants
Assets
• Pneumatic Controllers
• Pneumatic Pumps
• Heaters
• Engines
• Compressors
Low-GHG Alternatives
• Low-Bleed Pneumatics
• Waste Heat Recovery
• Engine Fuel Management
• Low-Bleed Pumps
• Vent Gas Capture
• Instrument Gas to Air
• Green completions
• Well site vent gas capture
Alberta’s Oil and Gas Assets Inventory Study October 3, 2013
10
Gas wells and conventional oil wells were of interest from this study. The AER ST59 report was used in
order to determine the average rate of drilling gas wells over one year. Data from the Canadian
Association of Petroleum Producers was used to determine the number of active oil and gas wells in
Alberta.
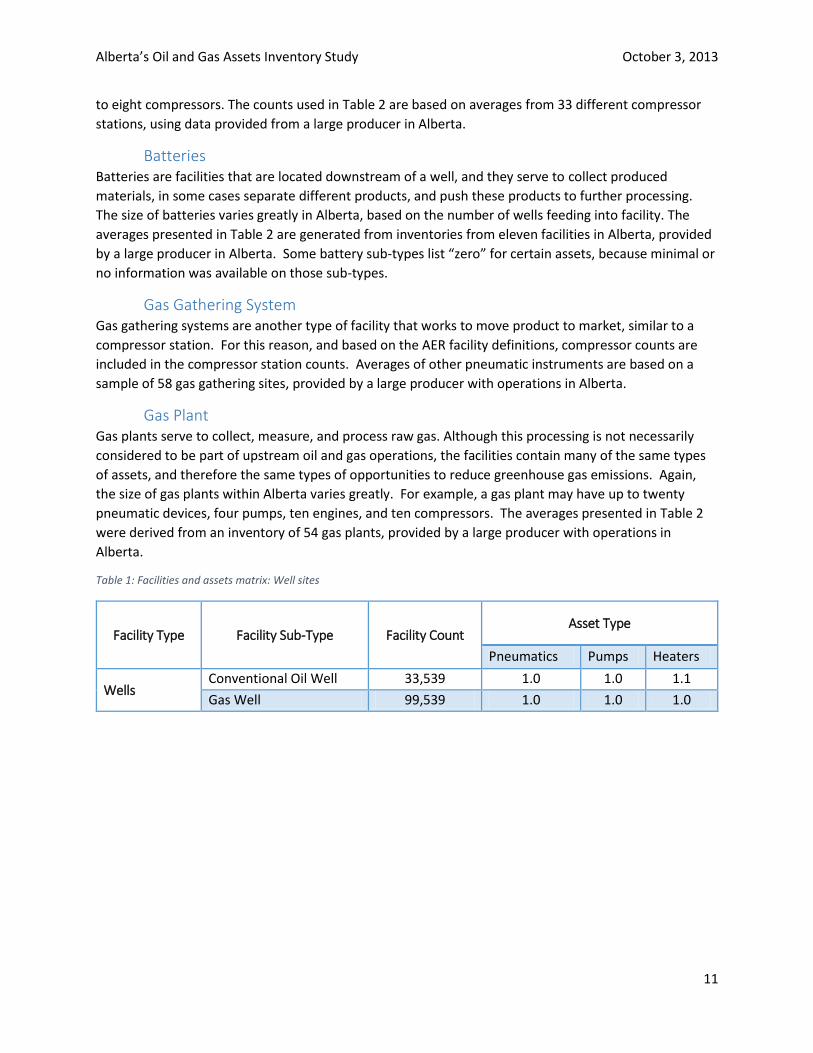
Facilities and Assets Matrix A Facilities and Assets matrix is presented below in Table 1. Average numbers of assets per facility type
are shown, based on typical Piping and Instrumentation Diagrams (P&ID) and Process Flow diagrams, as
well as averages from the inventory of a producer with operations in Alberta. Assets found at well sites
include pumps, pneumatic instruments, and heaters. Assets found at compressor stations, batteries, gas
gathering systems and gas plants include pneumatic pumps, pneumatic instruments, compressors, and
reciprocating engines.
Deriving Asset Counts from Facility Counts The information sources mentioned previously were also used to generate the inventory of assets at each
facility sub-type in a “top-down” manner (i.e. starting from the general types of facilities and working
down to the assets at each facility). This approach was determined to be appropriate compared to a
“bottom-up” approach (such as summing all assets across all producers) because it allowed for the
determination of the inventory across all producers in Alberta, and was best able to account for the
variability in facilities by making use of facility sub-types as defined by the AER. This approach is explained
in Figure 1 above, and the results are shown below in Table 1 and Table 2, which contains a summary of
Alberta Facilities.
Assets of interest included pneumatic instruments (such as pressure, temperature, or level controllers),
chemical injection pumps, compressors, and (reciprocating) engines. The AER definitions and other
materials (such as AER directives and P&ID diagrams) formed the basis of the asset inventory. Several
industry subject-matter experts were interviewed in order to more completely estimate the number of
assets at each facility sub-type. Where possible, average numbers of assets per facility were used. Where
a range of assets at each facility type was possible, the average presented is conservative.
Wells Conventional oil and gas well sites are comprised of pneumatic control instruments, pneumatic pumps,
and small heaters, amongst other assets. The well site asset counts used in Table 1 were derived from
data on 54 well sites from a large producer in Alberta. A large range of pneumatic devices are possible at
well sites; the minimum is one, although there can be many more, so a conservative estimate was chosen.
The pneumatic pump and heater counts reflect standard well site configurations. A generic Piping and
Instrument Diagram (P&ID) has been provided from a large producer with operations in Alberta, and is
attached in Appendix A. This diagram shows that the averages presented in Table 1 for each of pneumatic
controllers, pumps and heaters are conservative.
Compressor Stations Compressor stations are comprised of pneumatic instruments, compressors, and reciprocating engines
to power the compressors, amongst other assets. Compressor stations are another facility type that can
exhibit a wide range of numbers of each asset type, based on location and volume of products handled.
For example, there are larger compressor stations with at least 40 pneumatics devices, six pumps and up
Alberta’s Oil and Gas Assets Inventory Study October 3, 2013
11
to eight compressors. The counts used in Table 2 are based on averages from 33 different compressor
stations, using data provided from a large producer in Alberta.
Batteries Batteries are facilities that are located downstream of a well, and they serve to collect produced
materials, in some cases separate different products, and push these products to further processing.
The size of batteries varies greatly in Alberta, based on the number of wells feeding into facility. The
averages presented in Table 2 are generated from inventories from eleven facilities in Alberta, provided
by a large producer in Alberta. Some battery sub-types list “zero” for certain assets, because minimal or
no information was available on those sub-types.
Gas Gathering System Gas gathering systems are another type of facility that works to move product to market, similar to a
compressor station. For this reason, and based on the AER facility definitions, compressor counts are
included in the compressor station counts. Averages of other pneumatic instruments are based on a
sample of 58 gas gathering sites, provided by a large producer with operations in Alberta.
Gas Plant Gas plants serve to collect, measure, and process raw gas. Although this processing is not necessarily
considered to be part of upstream oil and gas operations, the facilities contain many of the same types
of assets, and therefore the same types of opportunities to reduce greenhouse gas emissions. Again,
the size of gas plants within Alberta varies greatly. For example, a gas plant may have up to twenty
pneumatic devices, four pumps, ten engines, and ten compressors. The averages presented in Table 2
were derived from an inventory of 54 gas plants, provided by a large producer with operations in
Alberta.
Table 1: Facilities and assets matrix: Well sites
Facility Type Facility Sub-Type Facility Count Asset Type
Pneumatics Pumps Heaters
Wells Conventional Oil Well 33,539 1.0 1.0 1.1
Gas Well 99,539 1.0 1.0 1.0
Alberta’s Oil and Gas Assets Inventory Study October 3, 2013
12
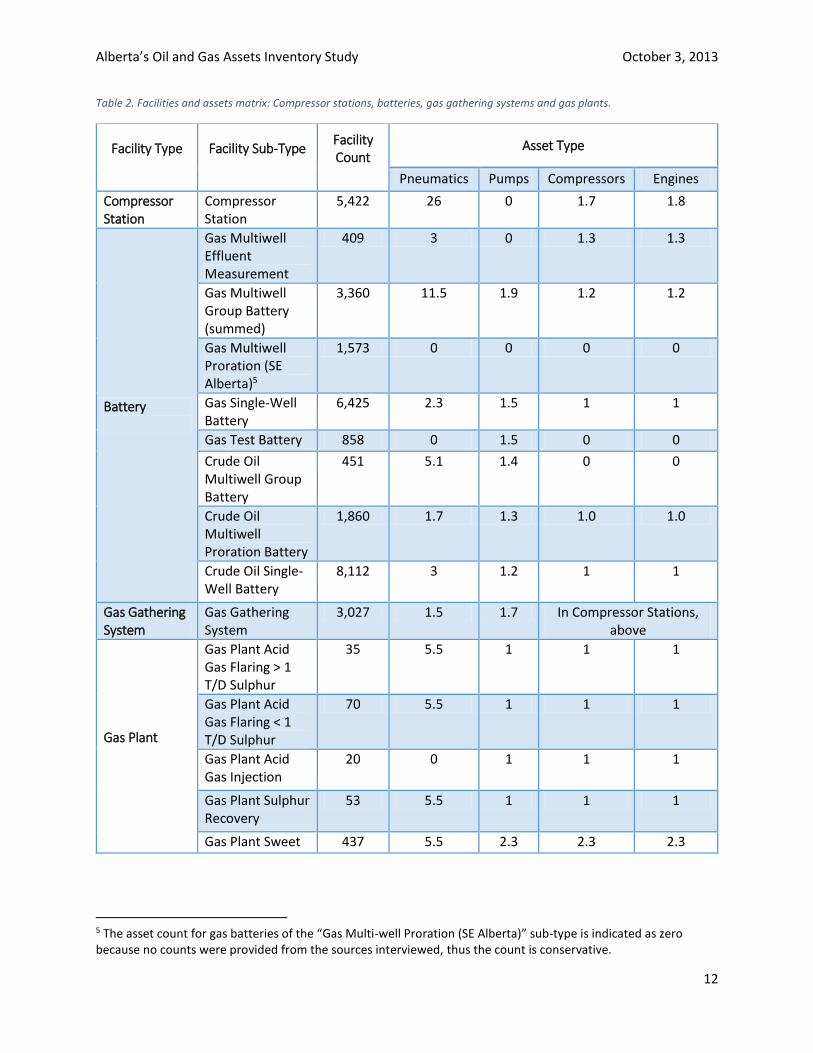
Table 2. Facilities and assets matrix: Compressor stations, batteries, gas gathering systems and gas plants.
Facility Type
Facility Sub-Type
Facility Count
Asset Type
Pneumatics Pumps Compressors Engines
Compressor Station
Compressor Station
5,422 26 0 1.7 1.8
Battery
Gas Multiwell Effluent Measurement
409 3 0 1.3 1.3
Gas Multiwell Group Battery (summed)
3,360 11.5 1.9 1.2 1.2
Gas Multiwell Proration (SE Alberta)5
1,573 0 0 0 0
Gas Single-Well Battery
6,425 2.3 1.5 1 1
Gas Test Battery 858 0 1.5 0 0
Crude Oil Multiwell Group Battery
451 5.1 1.4 0 0
Crude Oil Multiwell Proration Battery
1,860 1.7 1.3 1.0 1.0
Crude Oil Single-Well Battery
8,112 3 1.2 1 1
Gas Gathering System
Gas Gathering System
3,027 1.5 1.7 In Compressor Stations, above
Gas Plant
Gas Plant Acid Gas Flaring > 1 T/D Sulphur
35 5.5 1 1 1
Gas Plant Acid Gas Flaring < 1 T/D Sulphur
70 5.5 1 1 1
Gas Plant Acid Gas Injection
20 0 1 1 1
Gas Plant Sulphur Recovery
53 5.5 1 1 1
Gas Plant Sweet 437 5.5 2.3 2.3 2.3
5 The asset count for gas batteries of the “Gas Multi-well Proration (SE Alberta)” sub-type is indicated as zero because no counts were provided from the sources interviewed, thus the count is conservative.
Alberta’s Oil and Gas Assets Inventory Study October 3, 2013
13
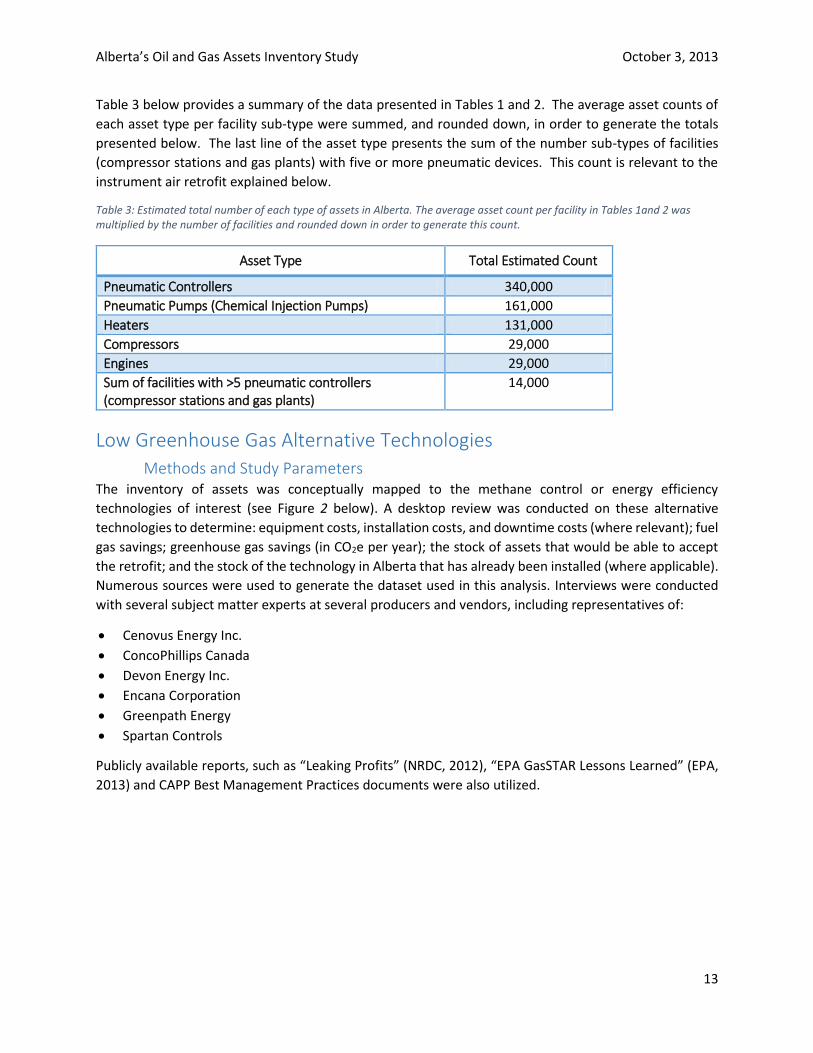
Table 3 below provides a summary of the data presented in Tables 1 and 2. The average asset counts of
each asset type per facility sub-type were summed, and rounded down, in order to generate the totals
presented below. The last line of the asset type presents the sum of the number sub-types of facilities
(compressor stations and gas plants) with five or more pneumatic devices. This count is relevant to the
instrument air retrofit explained below.
Table 3: Estimated total number of each type of assets in Alberta. The average asset count per facility in Tables 1and 2 was multiplied by the number of facilities and rounded down in order to generate this count.
Asset Type Total Estimated Count
Pneumatic Controllers 340,000
Pneumatic Pumps (Chemical Injection Pumps) 161,000
Heaters 131,000
Compressors 29,000
Engines 29,000
Sum of facilities with >5 pneumatic controllers (compressor stations and gas plants)
14,000
Low Greenhouse Gas Alternative Technologies
Methods and Study Parameters The inventory of assets was conceptually mapped to the methane control or energy efficiency
technologies of interest (see Figure 2 below). A desktop review was conducted on these alternative
technologies to determine: equipment costs, installation costs, and downtime costs (where relevant); fuel
gas savings; greenhouse gas savings (in CO2e per year); the stock of assets that would be able to accept
the retrofit; and the stock of the technology in Alberta that has already been installed (where applicable).
Numerous sources were used to generate the dataset used in this analysis. Interviews were conducted
with several subject matter experts at several producers and vendors, including representatives of:
Cenovus Energy Inc.
ConcoPhillips Canada
Devon Energy Inc.
Encana Corporation
Greenpath Energy
Spartan Controls
Publicly available reports, such as “Leaking Profits” (NRDC, 2012), “EPA GasSTAR Lessons Learned” (EPA,
2013) and CAPP Best Management Practices documents were also utilized.
Alberta’s Oil and Gas Assets Inventory Study October 3, 2013
14
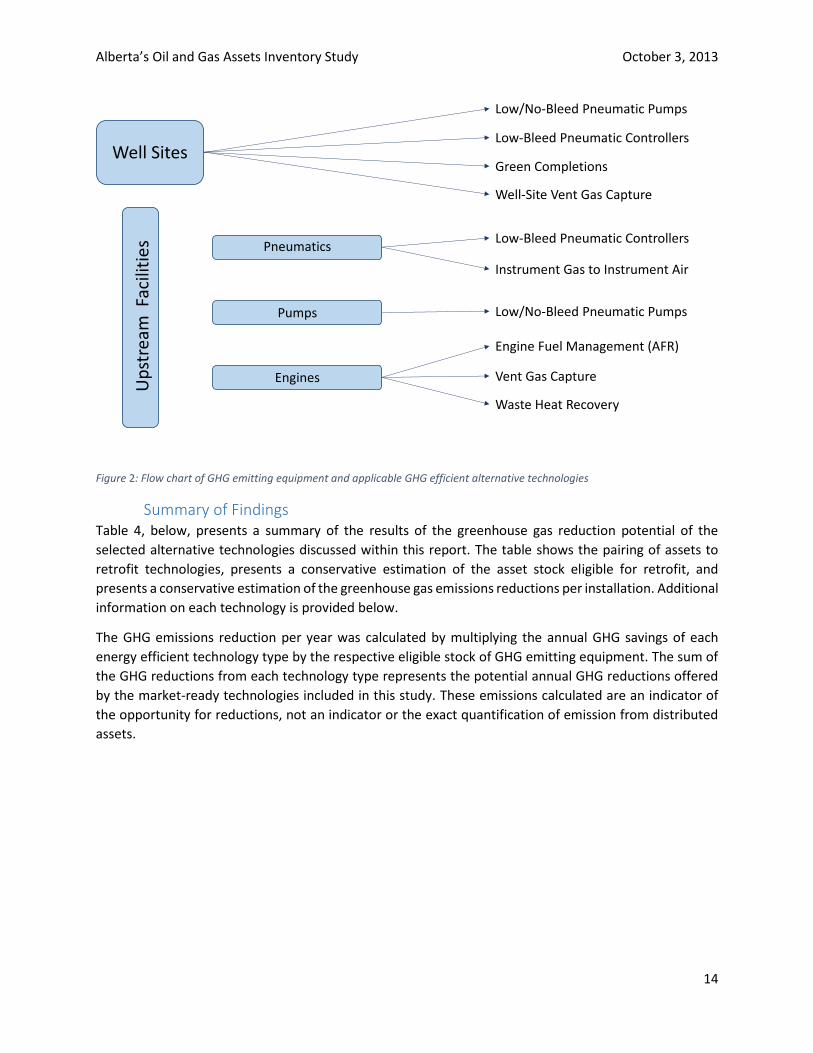
Figure 2: Flow chart of GHG emitting equipment and applicable GHG efficient alternative technologies
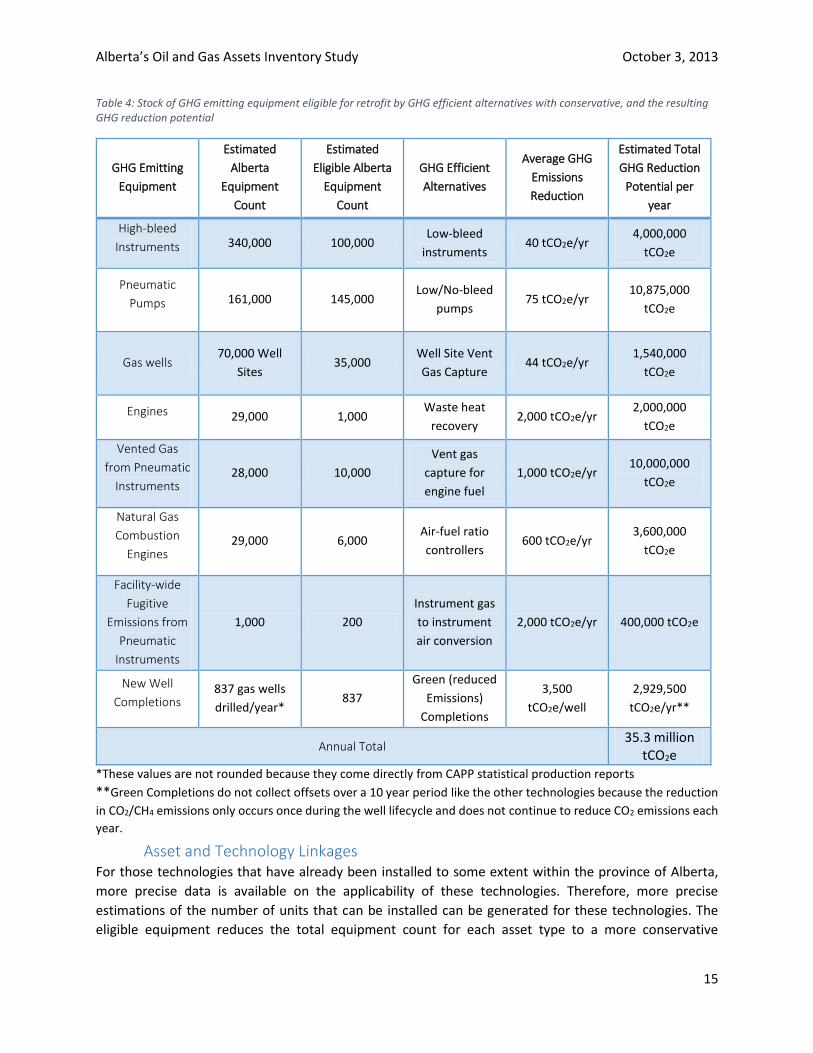
Summary of Findings Table 4, below, presents a summary of the results of the greenhouse gas reduction potential of the
selected alternative technologies discussed within this report. The table shows the pairing of assets to
retrofit technologies, presents a conservative estimation of the asset stock eligible for retrofit, and
presents a conservative estimation of the greenhouse gas emissions reductions per installation. Additional
information on each technology is provided below.
The GHG emissions reduction per year was calculated by multiplying the annual GHG savings of each
energy efficient technology type by the respective eligible stock of GHG emitting equipment. The sum of
the GHG reductions from each technology type represents the potential annual GHG reductions offered
by the market-ready technologies included in this study. These emissions calculated are an indicator of
the opportunity for reductions, not an indicator or the exact quantification of emission from distributed
assets.
Waste Heat Recovery
Well SitesU
pst
ream
Fac
iliti
es Pneumatics
Pumps
Engines
Green Completions
Well-Site Vent Gas Capture
Low-Bleed Pneumatic Controllers
Instrument Gas to Instrument Air
Low/No-Bleed Pneumatic Pumps
Engine Fuel Management (AFR)
Vent Gas Capture
Low-Bleed Pneumatic Controllers
Low/No-Bleed Pneumatic Pumps
Alberta’s Oil and Gas Assets Inventory Study October 3, 2013
15
Table 4: Stock of GHG emitting equipment eligible for retrofit by GHG efficient alternatives with conservative, and the resulting GHG reduction potential
GHG Emitting
Equipment
Estimated
Alberta
Equipment
Count
Estimated
Eligible Alberta
Equipment
Count
GHG Efficient
Alternatives
Average GHG
Emissions
Reduction
Estimated Total
GHG Reduction
Potential per
year
High-bleed
Instruments 340,000 100,000 Low-bleed
instruments 40 tCO2e/yr
4,000,000
tCO2e
Pneumatic
Pumps 161,000 145,000 Low/No-bleed
pumps 75 tCO2e/yr
10,875,000
tCO2e
Gas wells 70,000 Well
Sites 35,000
Well Site Vent
Gas Capture 44 tCO2e/yr
1,540,000
tCO2e
Engines 29,000 1,000 Waste heat
recovery 2,000 tCO2e/yr
2,000,000
tCO2e
Vented Gas
from Pneumatic
Instruments 28,000 10,000
Vent gas
capture for
engine fuel
1,000 tCO2e/yr 10,000,000
tCO2e
Natural Gas
Combustion
Engines 29,000 6,000
Air-fuel ratio
controllers 600 tCO2e/yr
3,600,000
tCO2e
Facility-wide
Fugitive
Emissions from
Pneumatic
Instruments
1,000 200
Instrument gas
to instrument
air conversion
2,000 tCO2e/yr 400,000 tCO2e
New Well
Completions 837 gas wells
drilled/year* 837
Green (reduced
Emissions)
Completions
3,500
tCO2e/well
2,929,500
tCO2e/yr**
Annual Total 35.3 million
tCO2e
*These values are not rounded because they come directly from CAPP statistical production reports
**Green Completions do not collect offsets over a 10 year period like the other technologies because the reduction
in CO2/CH4 emissions only occurs once during the well lifecycle and does not continue to reduce CO2 emissions each
year.
Asset and Technology Linkages For those technologies that have already been installed to some extent within the province of Alberta,
more precise data is available on the applicability of these technologies. Therefore, more precise
estimations of the number of units that can be installed can be generated for these technologies. The
eligible equipment reduces the total equipment count for each asset type to a more conservative
Alberta’s Oil and Gas Assets Inventory Study October 3, 2013
16
estimation of the stock that could be retrofitted, and therefore creates a more conservative estimation of
the magnitude of emissions reductions that can be achieved with specific technologies over the coming
decade.
The difference between the total equipment count and the eligible equipment count arises from certain
conditions that make some assets ineligible to be upgraded. These conditions, or eligibility criteria, include
the age of the asset (some assets may be too new), distance from an electricity grid (they may be too
close or too far from an electricity grid), and other technology-specific factors are discussed in the
following sections. The eligibility criteria also takes into account that multiple technologies may be
applicable to an asset at a particular facility type, therefore only one type of retrofit technology is applied
to each asset, and carbon emissions reductions are not accounted for twice. For example, a facility with
more than five venting sources and a compressor engine are most suitable vent gas capture system
(SlipStreamTM) as opposed to replacing multiple pneumatics. The criteria used in the creation of the
eligible count contribute to the conservativeness of the final estimation.
This paper aims to identify the gross opportunity to reduce emissions. The objective of this paper is to
show the opportunity for energy efficiency projects and carbon emissions reductions, rather than to
explicitly quantify the emissions from oil and gas facilities. The eligible count aims to examine all facilities
that could be retrofitted or changed without economic constraint.
High Bleed to Low Bleed Pneumatic Instruments
Asset Linkages
Across all facility types, high bleed pneumatic controllers (such as level controllers, pressure controllers,
or temperature controllers) can be retrofitted with low-bleed controllers. Pneumatic controllers bleed
dynamically (while they perform a function), and statically (while they wait to perform a function). Low
bleed controllers have a reduced static bleed volume, and can result in up to 40 tonnes of CO2e per year
saved per installation. Low bleed controllers have been installed as part of normal practice since 2008,
although many high bleed controllers still exist at the numerous older active wells within the province of
Alberta.
Eligible Count
The eligible equipment count for high bleed controllers excludes an estimation of those well sites that are
new since 2008, as well as locations with an average of more than five pneumatic instruments, as other
retrofit technologies may be able to better address those sites. At larger facilities, replacing pneumatic
controllers may be redundant because these facilities may be more suited for an instrument air
conversion, a vent gas capture system or connection to electric grid. Therefore, low-bleed controllers
would be an effective alternative technology for locations with few pneumatic controllers on site, such as
well sites and batteries. Thus, there are approximately 100,000 eligible pneumatic controllers.
GHG reductions
The GHG reductions of 40 tonnes per year comes from the Cap-Op Energy inventory of high to low bleed
pneumatic conversions and real quantifications from producers who have installed this type of retrofit.
The figure of 40 tonnes of CO2e per year is conservative compared to the 70 tonnes of CO2e per year as
estimated by the United States EPA. If the estimated eligible 100,000 high bleed controllers were changed
for low-bleed controllers, retrofits could result in GHG emissions reductions of up to 4,000,000 tonnes
CO2e per year.
Alberta’s Oil and Gas Assets Inventory Study October 3, 2013
17
Pneumatic (Chemical Injection) Pumps to Low/No Bleed Pneumatic Pumps
Asset Linkages
Pneumatic pumps, which function as chemical injection pumps, can be retrofitted with low-bleed
alternatives, or electric pumps (which may be able to run on solar electric power). As with pneumatic
controllers, the amount of methane released as a part of normal operations is substantially reduced on a
low-bleed pump.
Eligible Count
Subject matter expert interviews indicated that relatively few (<1%) of pumps in Alberta have been
retrofitted with a low-bleed alternative, and a large opportunity still exists. The eligible count of pumps
to be retrofitted excludes those pumps that are found at facilities with greater than five pneumatic
instruments, because these facilities may be more suited to vent gas capture or instrument air
conversions.
This criteria removes gas plants and compressor stations from the facilities to target for pump
conversions. The eligible count was a conservative estimate of 145,000 pumps based on extrapolations
from our facilities to assets linkages. The CAPP BMP for Chemical Injection Pumps (2008) estimates that
there may be over a 1,000,000 pneumatic powered chemical injection pumps in the oil and gas industry.
GHG Reductions
The GHG reductions of 75 tonnes of CO2e per year comes from the Cap-Op Energy inventory and
producer’s quantification of the reductions associated with this type of retrofit. Therefore, the installation
of low/no-bleed pumps in the place of the 145,000 high bleed pumps currently in service could result in
reductions of up to 10,875,000 tonnes CO2e per year.
Instrument Gas to Instrument Air
Asset Linkages
For facilities with numerous pneumatic components on site, such as compressor stations and gas plants,
all of the pneumatic controllers can be retrofitted to run on compressed air instead of natural gas.
Retrofitting the instruments to run on air instead of gas necessitates access to electricity to power air
compressors. For this type of retrofit, operational and economic factors also come into play; an
instrument gas to instrument air retrofit is best suited to sites with many pneumatic devices.
Eligible Count
It is not possible to estimate the eligible equipment count with publicly available data given the criteria
presented here. Therefore, the estimations that comprise the eligible equipment count are comprised of
province-wide extrapolations, based on the number of scheduled conversions planned by interviewed
producers, and their share of production in Alberta. The eligible count is intended to include facilities that
are easily accessible but not in such close proximity to the electrical grid that pumps and controllers will
be converted from pneumatic air to electricity. This eligible count of 200 facilities may be extremely
conservative but is intended to be the most accurate number based on data available.
GHG Reductions
Although these retrofits result in variable greenhouse gas savings, an average of 2,000 tonnes CO2e pear
year was used, informed by initial results from instrument gas to instrument air installations in the
province by large oil and gas producers. Using the estimation of 200 eligible sites in Alberta, Instrument
Air systems could result in GHG emissions reductions up to 400,000 tonnes CO2e per year.
Alberta’s Oil and Gas Assets Inventory Study October 3, 2013
18
Engines Coupled with Waste Heat Recovery
GHG Reductions
Engines are used for compression and other upstream processes that move products to market, and in
the process create a significant amount of heat. Gas plants are an example of a facility that would be able
to make use of low quality waste heat that can be captured at these facilities using waste heat recovery
units, and diverted to one or more other processes.
Eligible Count
ERCB statistical reports indicate that there are more than 31,000 engines at gas facilities in the province.
Due to the large installation cost (waste heat projects require larger amounts of downtime to retrofit
facilities with the equipment to capture waste heat) and variability of GHG savings from waste heat
projects, a conservative estimate was made on the number of facilities where waste heat could be
applicable, and so a large discrepancy between the total number of facilities and the eligible facility
estimation of 1000 sites. This eligible count only includes largest gas facilities and larger compressor
stations because large amounts of waste heat are required to make the type of waste heat recovery
possible. Other facilities may be suitable for smaller waste heat recovery systems but will not be able to
capture the 2,000 tCO2e estimated, below.
GHG Reductions
Waste heat recovery systems could result in GHG emissions reductions of up to 2,000 tonnes CO2e per
year. This estimate comes from producer experience and projects for scheduled projects. These are larger
energy efficiency projects and can result in greater CO2e savings. Across the 1000 eligible sites, 2,000,000
tonnes CO2e per year could be saved by employing waste heat recovery systems.
Engines Coupled with Vent Gas Capture
Asset Linkages
A Vent Gas Capture (VGC) system is another alternative for facilities with multiple pneumatic devices, or
other equipment venting or bleeding small amounts of low-pressure methane. The diffuse sources of
methane are captured and fed into an engine using a computer-controlled system. An example of this is
SlipStreamTM Technology, from Spartan Controls.
Eligible Count
The application of a VGC system may be an operationally-appropriate solution for gas plants and other
large facilities, depending on site-specific conditions. VGC systems are not reliant upon electricity grids,
as instrument gas to instrument air systems are. They allow for the collection of fuel gas from many
sources, and thus the estimation of eligible vent gas capture sites is larger than the instrument gas to
instrument air sites. VGC systems can be paired with rich burn or lean burn engines that have a digital air
fuel ratio control system installed (see below).
The eligible count targeted sites that had an average of five or pneumatic instruments. Sites that were
targeted for instrument air conversions, or sites that produce sour gas, were not considered in this count.
The engines at facilities eligible for vent gas capture may already have an AFR, be eligible for an AFR, or
have a lean burning engine if they are a newer facility. There are approximately 10,000 sites eligible. The
eligible count in the PEMA Inventory Report is slightly less than the population count of facilities (10,083)
in the 2009 Accurata report.
Alberta’s Oil and Gas Assets Inventory Study October 3, 2013
19
GHG Reductions
The GHG reductions of 1,000 tonnes per year are conservative estimates from different producer
quantification and the 2009 Accurata Report. The emissions reductions indicated in the Accurata report
range from 912.5 tonnes CO2e per year to 8687 tonnes CO2e per year. Implemented across the 10,000
eligible sites, this results in greenhouse gas emissions reductions of up to 10,000,000 tonnes CO2e per
year. The emissions reductions estimated in the 2009 Accurata report were 9,400,000 tCO2e. The eligible
count of facilities is very similar to the 2009 Accurata report on SlipStreamTM technology, but because our
initial population used different criteria to determine the eligible count our overall reductions differ
slightly.
Engines Coupled with Air Fuel Ratio Controllers
Asset Linkages
Many engines that are operating in oil and gas facilities are “rich burn” engines, meaning that more fuel
gas is used than is stoichiometrically necessary. These engines can be retrofitted with a device that
controls and optimizes the ratio of air to fuel. Air-Fuel Ratio (AFR) controllers are generally only suited to
older, rich burn engines, instead of newer, lean burn engines. Furthermore, a VGC system can be paired
with an AFR system.
Eligible Count
The count of eligible engines is reduced from the total engine count in Alberta as newer engines are, in
most cases, already lean burn systems. Other factors that further limit the use of AFR systems include
engine tuning and other process-specific challenges, and in some cases, other energy efficiency projects
may be more appropriate compared to AFR controls.
The eligible count was produced from extensive surveys of subject matter experts. Vendors, producers
and the Accurata Report on REM AFR systems informed the eligible count of engines that could be
retrofitted with an AFR system in Alberta. The eligible count removed new engines that are lean burning
or have already have an AFR installed. Feedback (including planned installs by producers) was used to
extrapolate the eligible count over the Alberta. A single producer estimated that a very small percentage
of their 1000 rich burn engines had already been retrofitted with an AFR. The eligible count was
determined to be 6,000 engines. The eligible count was compared to the Accurata Report on REM AFR
Systems (2006).The Accurata Report on REM AFR Systems (2006) estimates that 3,913,000 tCO2e can be
reduced by AFR systems. This reductions estimated in the report would require approximately 6,500 AFRs
installed in Alberta to achieve these reductions. Therefore, the eligible count presented here is somewhat
more conservative than the Accurata Report.
GHG Reductions
The installation of an air-fuel ratio controller results, on average, of reductions of 600 tonnes CO2e per
year. This estimation comes from vendor information, producer projects and Cap-Op inventory. Multiplied
over the approximately 6,000 eligible engines in Alberta, air-fuel ratio controllers could result in GHG
emissions reductions of up to 3,600,000 tonnes CO2e pear year. The eligible assets is a conservative
estimate from SME at vendors. This takes into account economic constraints, engines that have been
retrofitted, smaller engines where an AFR may not be viable and newer engines that may already be lean
burning.
Alberta’s Oil and Gas Assets Inventory Study October 3, 2013
20
Well Site Vent Gas Capture
Asset Linkages
A well site vent gas capture system can make use of the gas emitted from pneumatic controllers at a well
site and feed it to a small flameless, gas-fired appliance that converts natural gas or propane into usable
infrared energy. An example of such a system is a Cata-Dyne™ heater.
Eligible Count
The eligible count was derived from the AER (ERCB) ST59 report for 2012. This report shows the number
of new wells drilled each year. (The “development” category of this report was considered, while the
“exploratory” and “observation” categories were excluded.) This information indicates that there are
approximately 140,000 active wells in Alberta. With a range of 1-3 wells per conventional well site there
may be approximately 70,000 well sites operating in Alberta (NEB, 2009). According to CAPP BMP for
Pneumatic Instruments (2008), over 50% of well sites in Alberta use fuel gas while 30% use propane
because they are sour wells. This number continues to grow with the continued development of
resources. With half of Alberta well sites running on fuel gas, there are approximately 35,000 well sites
that could have WSVGC systems. The eligible count is conservative, but as more multi wells and
unconventional wells are drilled the ability to capture vent gas will continue and the emissions reduced
per well site will increase.
GHG Reductions
The greenhouse gas savings per installation were informed by initial results from a producer’s pilot
project. Approximately 44 tonnes CO2e per year can be saved per installation. If 100% of gas well sites
were retrofitted with well-site vent gas capture systems, GHG emissions reductions of up to 1,540,000
tonnes CO2e per year could result.
Green (Reduced Emissions) Completions at New Gas Well Sites
Asset Linkages
As a well is being drilled and completed, a green completion process can be implemented to capture gas,
sands, and drilling fluids that are emitted or removed from the well as part of the normal completions
process. Temporary processing equipment brought on site can be connected to the well with some
minimal additional piping and infrastructure. This results in the capture of raw natural gas and its
subsequent processing, such that it can be routed to a sales line, instead of being vented directly to
atmosphere.
Eligible Count
This process can be applied to every new gas well being drilled, and the AER ST59 report for 2012 indicates
a rate of drilling of 837 new gas wells per year. All green completions were included in the eligible count
because this technology has not been readily adapted and the payback occurs over the lifetime of a green
completion.
GHG Reductions
The green completions technique has been used successfully and profitably in other gas basins in North
America, capturing a conservative average of 3,500 tonnes CO2e per well. If 100% of new gas wells (837
wells per year) were completed with a green completions system, GHG emissions reductions of up to
2,929,500 tonnes CO2e per year could result.
Alberta’s Oil and Gas Assets Inventory Study October 3, 2013
21
Discussion
Magnitude of GHG Emissions Reductions Possible The results presented shows that the eight GHG-efficient technologies addressed in this report may yield
up to 34 million tonnes of CO2e per year if they could be implemented across eligible equipment in the
province of Alberta. This magnitude of reductions from Alberta’s upstream oil and gas sector is substantial,
considering 163 Mt CO2e per year is attributable to the upstream oil and gas sector across Canada in the
National Inventory (Environment Canada, 2013).
The possible greenhouse gas emissions reductions presented within this report are also greater than other
published numbers. For example, upstream venting and flaring emissions from 2008 are estimated at 8.03
million tonnes of CO2e (Johnson & Coderre, An analysis of flaring and venting activity in the Alberta
upstream oil and gas industry, 2011). However, it should be noted that the estimate presented in this
report is based on a different methodology than in the National Inventory Report, thus, the two estimates
are not directly comparable.
The Canadian National Inventory Report detailing national GHG emissions indicates that 163 Mt CO2e per
year is attributable to oil and natural gas activities. The estimate of GHG savings available in Alberta
appear to be roughly 20 percent of all Natural Gas processing emissions across Canada, and thus may
appear to be over-estimated. The Natural Resources Defense Council in the United States found that as
emissions reductions projects were completed, the increased information about the GHG emissions
reductions unveiled the true magnitude of vented and fugitive emissions in the upstream oil and gas
sector. The US National Inventory was claimed to have under-estimated the fugitive and vented emissions
in the upstream oil and gas sector by as much as an order of magnitude (Natural Resources Defense
Council, 2012). This may also be the case within Canada and Alberta, and therefore the estimate of
possible GHG emissions reductions presented in this study may not be a significant over-estimation.
The estimation of GHG reductions possible from these GHG efficient technologies was prepared using
conservative assumptions. However, the potential for reductions may be inaccurate for the following
reasons. First, calculations of GHG reductions possible from each technology are based on results from
retrofits completed over the last decade in both Canada and the United States. The first retrofits
completed are likely the highest yielding, in the sense that they would be the oldest facilities offering the
greatest GHG reduction potential. Second, using these numbers is applicable to a certain (unknown)
number of facilities, although new facilities constructed in the last decade may have already been
designed with the most efficient technologies (such as low-bleed models of pneumatic controllers).
Therefore, the GHG reductions possible per technology is accurate for the first many retrofits, but as the
retrofits are performed on increasingly new equipment, the GHG resulting emissions reductions will
decrease. Finally, the time, labor, and costs required to complete all of the retrofits may make achieving
the full potential GHG emissions reductions unlikely in the immediate future.
Barriers to Reducing GHG Emissions from Upstream Oil and Gas Facilities The opportunity exists to substantially reduce methane emissions in Alberta with the market-ready
technologies presented in this report. Although these technologies are able to provide functionally-
equivalent retrofit options, and save enough methane or fuel gas to pay for themselves within 1-15 years,
many barriers prevent producing companies from prioritizing the installation of such technologies.
Barriers are primarily operational or economic in nature.
Alberta’s Oil and Gas Assets Inventory Study October 3, 2013
22
Operational factors include site-specific challenges (such as unique operating conditions that are not
suitable to a retrofit technology). Operational complexity and data management burdens may arise from
the installation of new technologies without any obvious benefit to the operator. If detailed engineering
is required for a complex technology retrofit at each site, then the rate of installations may be slowed,
and installation costs will add significantly to the unit purchase price. Production downtime is discouraged
in organizations where operator incentives are tied to production. Finally, if field operations have a
complex ownership structure, buy-in must be achieved from each of the owners, and this can be a
disincentive to proceed with small projects.
Financial barriers exist because GHG control technologies compete with core business projects based on
internal rate of return, so it may be difficult for novel technologies to be awarded corporate funding
(Natural Resources Defense Council, 2012). Economic barriers are also presented by the current low price
of natural gas (which impacts the expected rate of return on energy efficiency projects), and may also
arise in the cases of producers who keep low operations/maintenance budgets. Fuel gas is reported as
“shrinkage” instead of an operating cost; no royalties must be paid on shrinkage, whereas royalties are
paid on fuel gas savings. This distinction may serve to discourage energy efficiency projects. An additional
financial barrier may be greater risks cost escalation when new retrofit technologies are implemented at
older facilities.
Cost of Reducing GHG Emissions from Oil and Gas Facilities Most of the technologies presented in this study have the potential to earn positive returns on investment
(ROI) for the producer, as captured methane displaces the need for other fuel use, or in some cases can
be directly sold to market. Unfortunately given the current low price of natural gas, the majority of these
technologies yield unacceptably long payback periods when evaluated on fuel gas savings alone.
Carbon offsets in Alberta enable producers to see greater returns from many of these technology types
when carbon offset verification is pursued under approved protocols. For the purpose of this cursory
financial evaluation, carbon offsets are included in the payback period analysis for all technology types,
even if they are not covered by a current Alberta protocol. At the time of writing, there is only protocol
coverage for: instrument gas to instrument air, waste heat recovery, vent gas capture and air-fuel ratio
controllers.
The current price cap on carbon offset values in Alberta is indirectly set at $15/tCO2e as this is the price
producers can pay into the Alberta Environment and Sustainable Resource Development Climate Change
and Emissions Management Fund in lieu of generating offsets. The price of $15/tCO2e is considered the
maximum gross value of an offset, but this must be netted down to account for risk, administrative and
verification costs associated with producing offsets to get to a more representative value. For this study
$10/tCO2e is used as the net offset value (which is a best-case scenario, attainable only when offsets are
pursued at large scale). As shown in Table 5, carbon-inclusive payback periods of one to 15 years are
calculated for each technology.
Alberta’s Oil and Gas Assets Inventory Study October 3, 2013
23
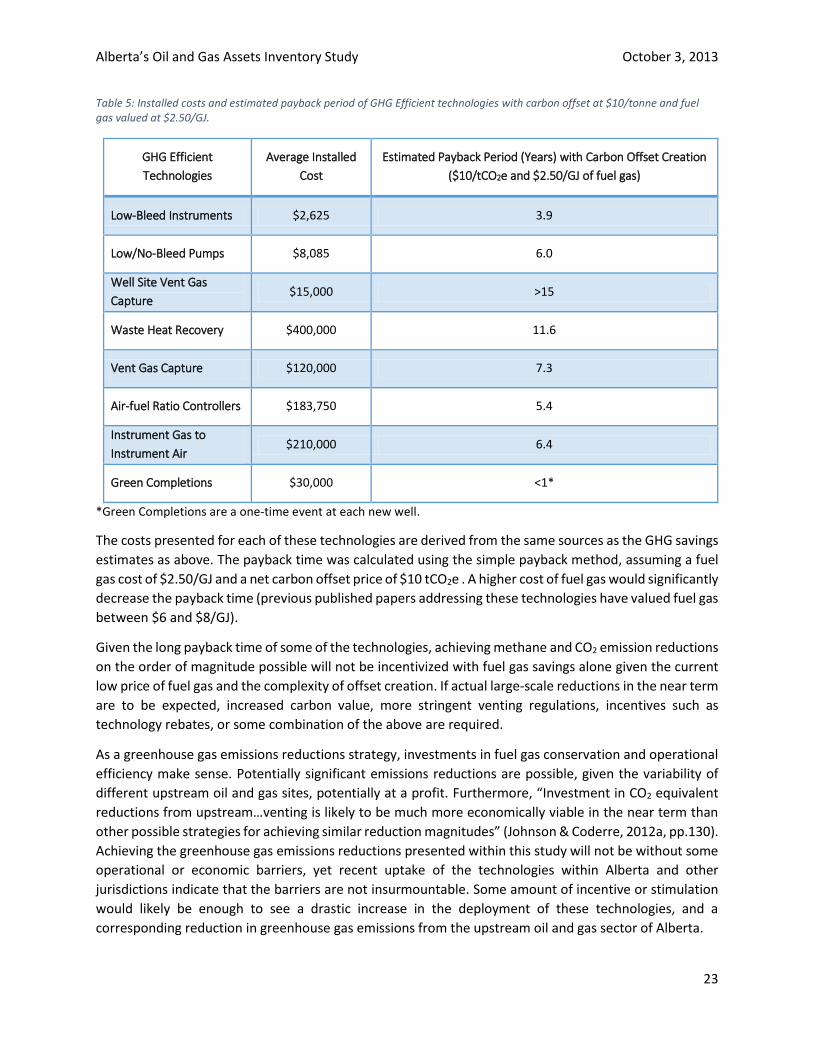
Table 5: Installed costs and estimated payback period of GHG Efficient technologies with carbon offset at $10/tonne and fuel gas valued at $2.50/GJ.
GHG Efficient
Technologies
Average Installed
Cost
Estimated Payback Period (Years) with Carbon Offset Creation
($10/tCO2e and $2.50/GJ of fuel gas)
Low-Bleed Instruments $2,625 3.9
Low/No-Bleed Pumps $8,085 6.0
Well Site Vent Gas
Capture $15,000 >15
Waste Heat Recovery $400,000 11.6
Vent Gas Capture $120,000 7.3
Air-fuel Ratio Controllers $183,750 5.4
Instrument Gas to
Instrument Air $210,000 6.4
Green Completions $30,000 <1*
*Green Completions are a one-time event at each new well.
The costs presented for each of these technologies are derived from the same sources as the GHG savings
estimates as above. The payback time was calculated using the simple payback method, assuming a fuel
gas cost of $2.50/GJ and a net carbon offset price of $10 tCO2e . A higher cost of fuel gas would significantly
decrease the payback time (previous published papers addressing these technologies have valued fuel gas
between $6 and $8/GJ).
Given the long payback time of some of the technologies, achieving methane and CO2 emission reductions
on the order of magnitude possible will not be incentivized with fuel gas savings alone given the current
low price of fuel gas and the complexity of offset creation. If actual large-scale reductions in the near term
are to be expected, increased carbon value, more stringent venting regulations, incentives such as
technology rebates, or some combination of the above are required.
As a greenhouse gas emissions reductions strategy, investments in fuel gas conservation and operational
efficiency make sense. Potentially significant emissions reductions are possible, given the variability of
different upstream oil and gas sites, potentially at a profit. Furthermore, “Investment in CO2 equivalent
reductions from upstream…venting is likely to be much more economically viable in the near term than
other possible strategies for achieving similar reduction magnitudes” (Johnson & Coderre, 2012a, pp.130).
Achieving the greenhouse gas emissions reductions presented within this study will not be without some
operational or economic barriers, yet recent uptake of the technologies within Alberta and other
jurisdictions indicate that the barriers are not insurmountable. Some amount of incentive or stimulation
would likely be enough to see a drastic increase in the deployment of these technologies, and a
corresponding reduction in greenhouse gas emissions from the upstream oil and gas sector of Alberta.
Alberta’s Oil and Gas Assets Inventory Study October 3, 2013
24
Conclusion In sum, a large opportunity exists to reduce methane and combustion emissions from the upstream oil
and gas sector in Alberta. The opportunity to reduce GHG emissions in the upstream oil and gas sector of
Alberta offered by the eight GHG efficient alternative technologies studied in this report may amount to
as much as 35,300,000 tonnes of CO2e per year. This figure is an estimation; however, it demonstrates
that the opportunity is significant, and investments in upstream oil and gas energy efficiency projects can
result in meaningful GHG emissions reductions.
The eight market-ready technologies presented in this report each offer significant emissions reductions
opportunities, when considering the extensive stock of GHG emitting equipment across the province. The
deployment of these technologies can result in the reduction of fugitive and vented methane emissions
and combustion emissions, as well as fuel gas savings, and the potential to earn carbon offset revenues.
Achieving methane and CO2 emission reductions on the order of magnitude possible will not be
incentivized with fuel gas savings alone given the current $2.50/GJ price of fuel gas. If actual reductions in
the near term are to be expected, increased carbon value, more stringent venting regulations, incentives
such as technology rebates, or some combination of the above are required.
Alberta’s Oil and Gas Assets Inventory Study October 3, 2013
25
References Accurata Inc. (2006). Emissions and Efficiency Enhancements with REM AFR Systems. Calgary: PTAC.
Accurata Inc. (2009). REM Technology Inc Slipstream System: Industry Impact Assessment with Field
Quantification Tests. Calgary: PTAC.
AER. (2011). Directive 007: Volumetric and Infrastructure Requirements . Calgary: Alberta Energy
Regulators.
AER. (2012). Statistical Series 60: Upstream Petroleum Industry Flaring and Venting Report. Calgary:
Alberta Energy Regulators.
AER. (2013). Statistical Series 102: New/Active Reporting Facilities List. Calgary: Alberta Energy
Regulators.
AER. (2013). Statistical Series 59: Alberta Drilling Activity Monthly Statistics. Calgary: Alberta Energy
Regulators.
AESRD. (2013, June 18). Regulating Greenhouse Gas Emissions. Retrieved from Alberta Environment and
Sustainable Resource Development: http://www.environment.alberta.ca/0915.html
CAPP. (2008). Fuel Gas Best Management Practices: Efficient Use of Fuel Gas in Pneumatic Instruments.
Calgary: CAPP.
CAPP. (2008). Fuel Gas Best Management Practices: Efficient Use of Fuel Gas in Chemical Injection
Pumps. Calgary: Canadian Association of Petroleum Producers.
CAPP. (2012). Alberta Production: Operated Gas Wells. Canadian Association of Petroleum Producers.
CAPP. (2012). Alberta Production: Operating Oil Wells - Bitumen. Canadian Association of Petroleum
Producers.
CAPP. (2012). Alberta Production: Operating Oil Wells - Conventional. Canadian Association of Petroleum
Producers.
Environment Canada. (2013). National Inventory Report 1990 - 2010: Greenhouse Gas Sources and Sinks
in Canada - Executive Summary. Ottawa: Government of Canada.
EPA. (2006). Lessons Learned from Natural Gas STAR Partners: Convert Gas Pneumatic Controls to
Instrument Air. Washington, DC: United States Environmental Protection Agency: Air and
Radiation.
EPA. (2006). Lessons Learned from Natural Gas STAR Partners: Options For Reducing Methane Emissions
From Pneumatic Devices in the Natural Gas Industry. Washington, DC.
EPA. (2011). Lessons Learned from Natural Gas STAR Partners: Convert Natural Gas-Driven Chemical
Pumps. Washington.
Gibb, B., Terrell, K., & Zahner, F. (2006). Emissions and Efficiency Enhancements with REM AFR Systems.
Calgary: Petroleum Technology Alliance Canada.
Alberta’s Oil and Gas Assets Inventory Study October 3, 2013
26
Johnson, M. R., & Coderre, A. R. (2011). An analysis of flaring and venting activity in the Alberta
upstream oil and gas industry. Journal of the Air & Waste Management Association, 190-200.
Johnson, M. R., & Coderre, A. R. (2012a). Opportunities for CO2 equivalent reductions via flare and vent
mitigation: A case stduy for Alberta, Canada. International Journal of Greenhouse Gas Control,
121-131.
Johnson, M., & Coderre, A. (2012). Compositions and greenhouse gas emission factors of flared and
vented gas in the Western Canadian Sedimentary Basin. Journal of the Air & Waste
Management Association, 992-1002.
Kenilworth. (2012). BTEX Emissions Reduced By 99.9% in Pilot Project. Lloydminster, Alberta.
Ladlee, J., & Jacquet, J. (2011). The Implications of Multi-Well Pads in the Marcellus Shale. Cornell
University.
Natural Resources Defense Council. (2012). Leaking Profits: The U.S. OIl and Gas Industry Can Reduce
Pollution, Conserve Resources, and Make Money by Preventing Methane Waste.
www.nrdc.org/energy/leaking-profits.asp: Natural Resources Defense Council.
NEB. (2009). A Primer for Understanding Canadian Shale Gas - Energy Briefing Note. Canadian National
Energy Board.
Alberta’s Oil and Gas Assets Inventory Study October 3, 2013
27
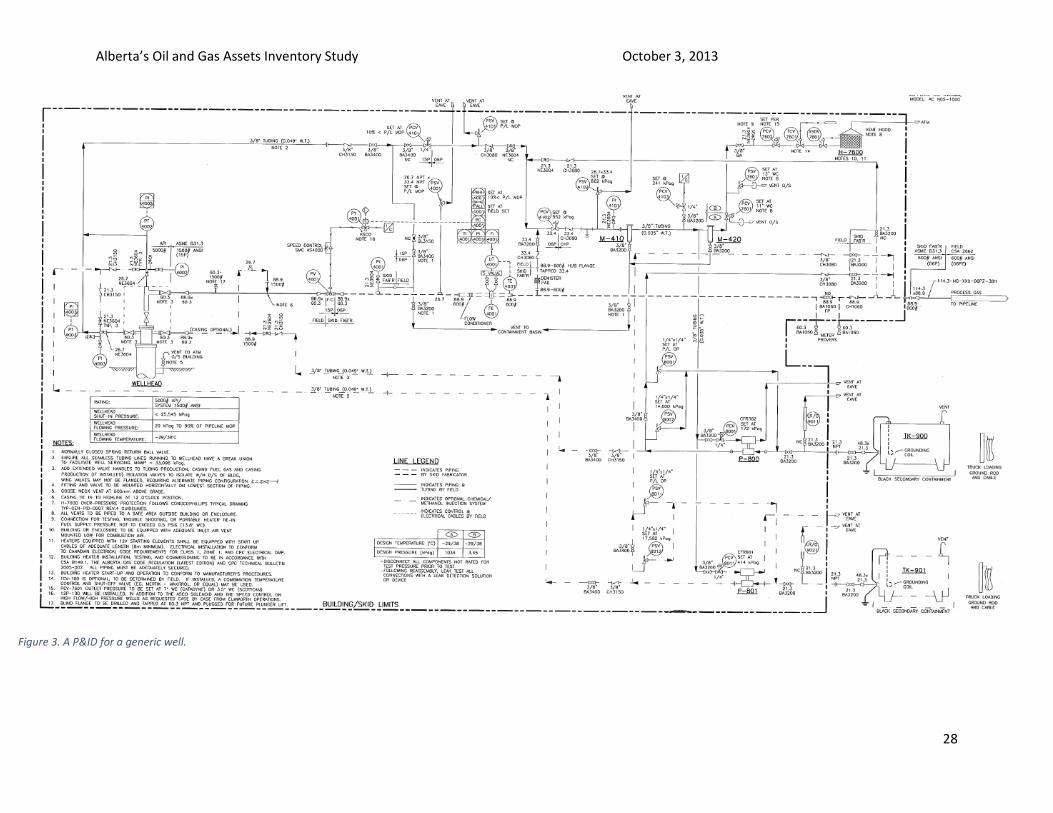
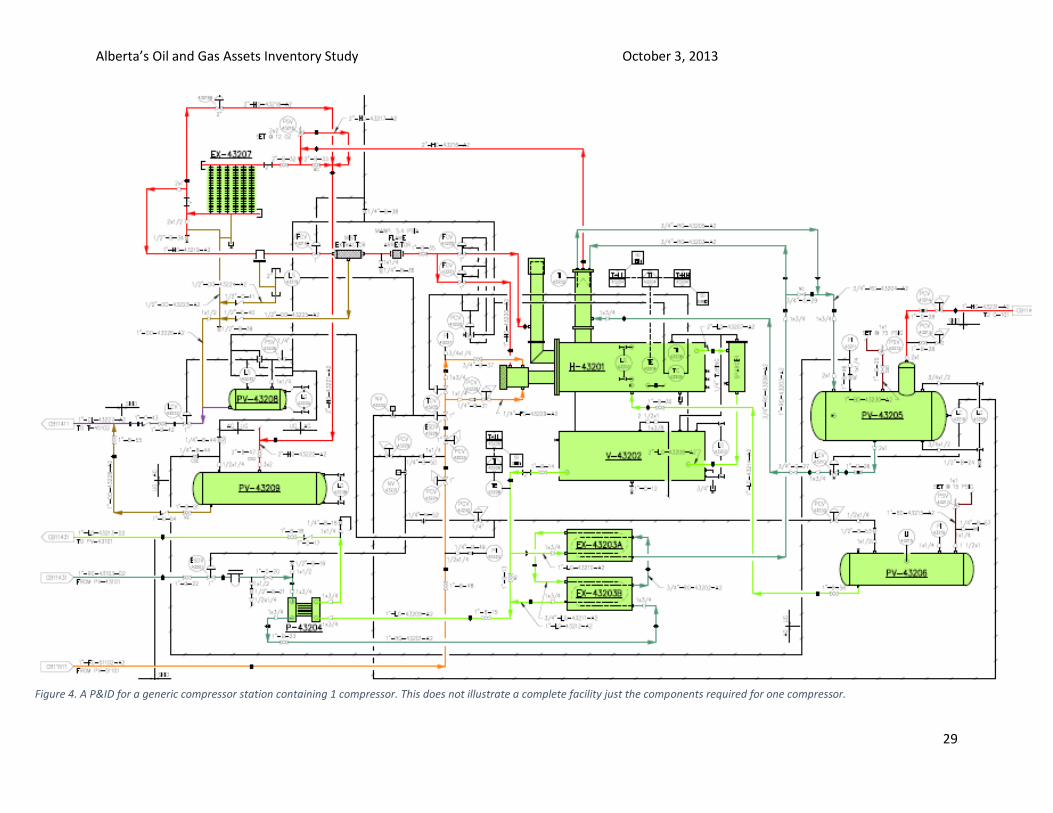
Appendix A: Facility Process Flow Diagrams Below are diagrams for Piping and Instrumentation Diagram (P&ID) that provide examples for the two facility types resulting in the two most
numerous asset counts presented in this report. These schematics provide examples of the types of materials that were used to inform the asset
counts, and in both cases, demonstrate that the counts used herein are conservative, and significantly lower than the instrumentation present in
these diagrams.
Wells are where the largest number of pneumatic devices are located, due to the large volume of active wells in Alberta. These sites are small,
and therefore can easily be illustrated on a one page P&ID. A generic compressor station was used to illustrate all the assets associated with a
single compressor. Compressors were the second most abundant facility type after wells. Batteries, Gas Gathering Facilities and Gas Plants were
excluded from Appendix A because these P&ID’s are much larger and simple schematic cannot illustrate all the assets at a facility. These facilities
are also not as numerous as wells and compressor stations, therefore they contribute to a smaller percentage of assets that are generating GHG
emissions.
Alberta’s Oil and Gas Assets Inventory Study October 3, 2013
28
Figure 3. A P&ID for a generic well.
Alberta’s Oil and Gas Assets Inventory Study October 3, 2013
29
Figure 4. A P&ID for a generic compressor station containing 1 compressor. This does not illustrate a complete facility just the components required for one compressor.