Embed Size (px)
DESCRIPTION
Alcohol & Other Drug Use. Percentage of U.S. high school students receiving mostly A’s, B’s, C’s or D/F’s who used alcohol during their lifetime – Youth Risk Behavior Survey, 2003.*. *p
Citation preview
Alcohol & Other Drug Use
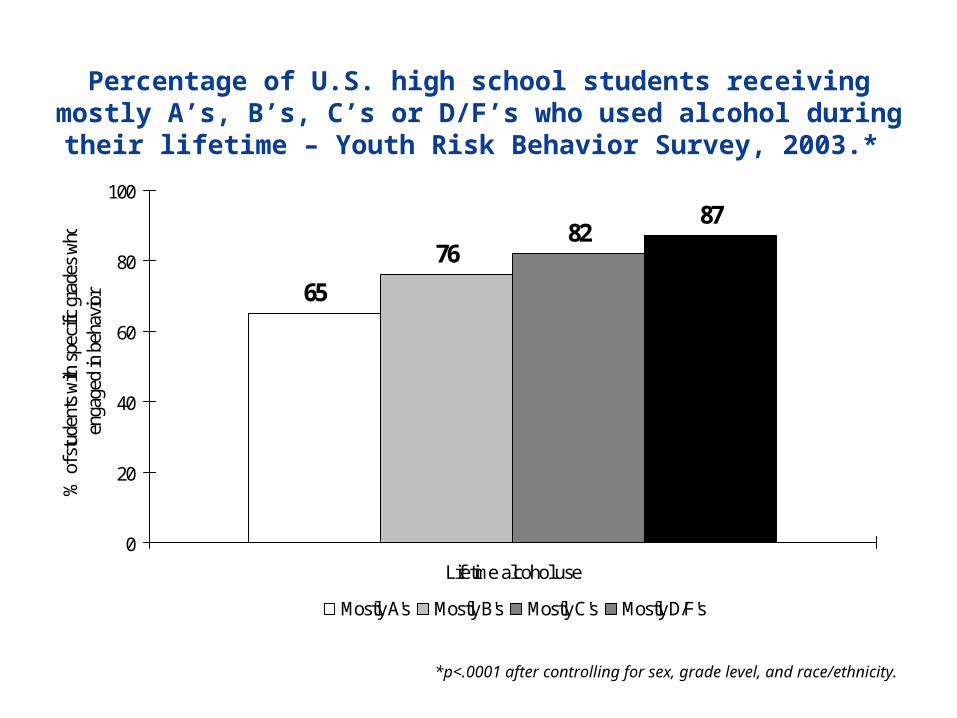
Percentage of U.S. high school students receiving mostly A’s, B’s, C’s or D/F’s who used alcohol during their lifetime – Youth Risk Behavior Survey, 2003.*
65
7682
87
0
20
40
60
80
100
Lifetime alcohol use
% o
f stu
dent
s wi
th s
pecif
ic gr
ades
who
en
gage
d in
beh
avio
r
Mostly A's Mostly B's Mostly C's Mostly D/F's
*p<.0001 after controlling for sex, grade level, and race/ethnicity.
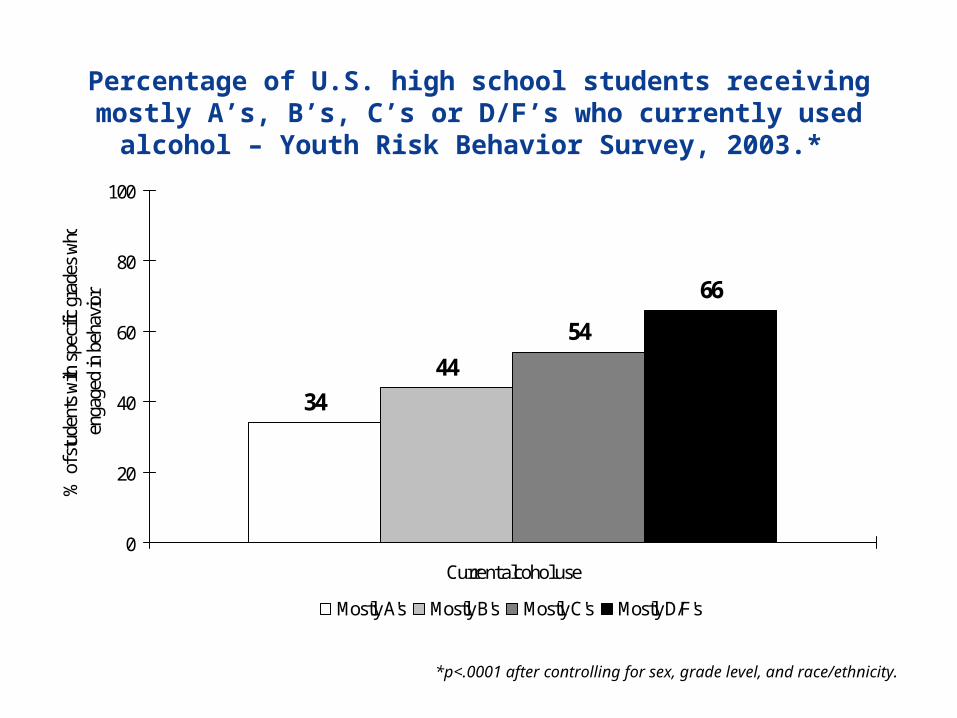
Percentage of U.S. high school students receiving mostly A’s, B’s, C’s or D/F’s who currently used alcohol – Youth Risk Behavior Survey, 2003.*
34
44
54
66
0
20
40
60
80
100
Current alcohol use
% o
f stu
dent
s wi
th s
pecif
ic gr
ades
who
en
gage
d in
beh
avio
r
Mostly A's Mostly B's Mostly C's Mostly D/F's
*p<.0001 after controlling for sex, grade level, and race/ethnicity.
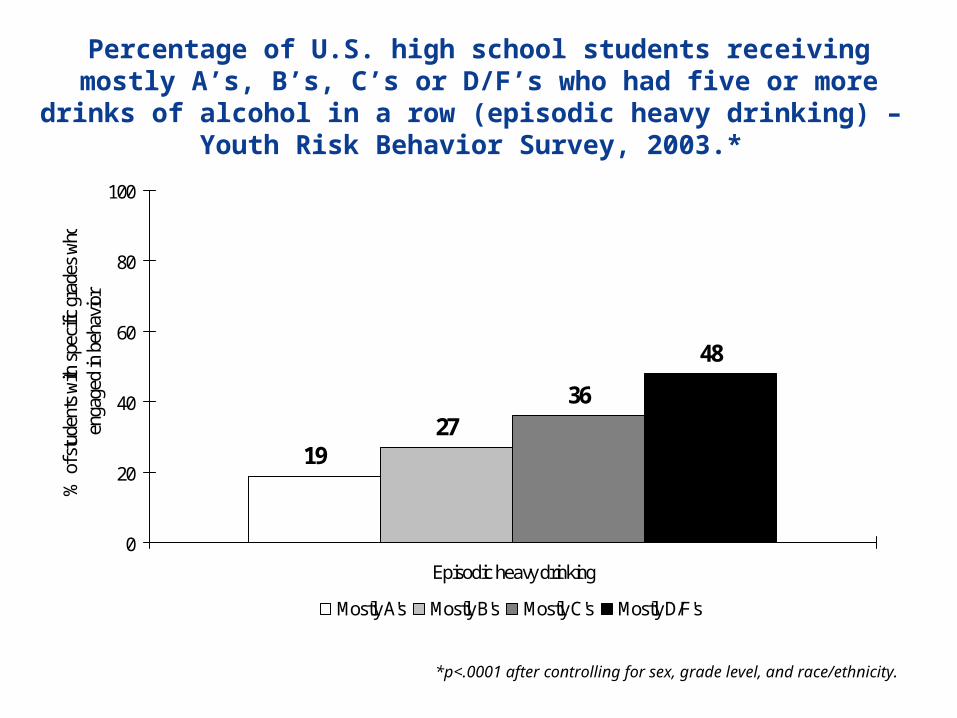
Percentage of U.S. high school students receiving mostly A’s, B’s, C’s or D/F’s who had five or more drinks of alcohol in a row (episodic heavy drinking) –
Youth Risk Behavior Survey, 2003.*
1927
36
48
0
20
40
60
80
100
Episodic heavy drinking
% o
f stu
dent
s wi
th s
pecif
ic gr
ades
who
en
gage
d in
beh
avio
r
Mostly A's Mostly B's Mostly C's Mostly D/F's
*p<.0001 after controlling for sex, grade level, and race/ethnicity.
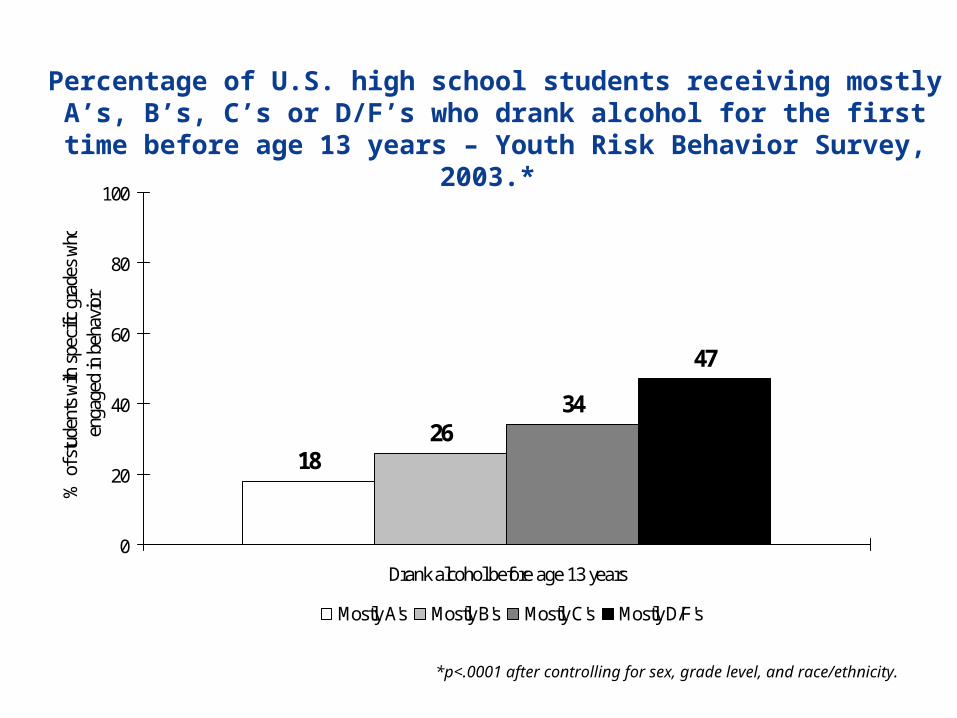
Percentage of U.S. high school students receiving mostly A’s, B’s, C’s or D/F’s who drank alcohol for the first time before age 13 years – Youth Risk Behavior Survey, 2003.*
1826
34
47
0
20
40
60
80
100
Drank alcohol before age 13 years
% o
f stu
dent
s wi
th s
pecif
ic gr
ades
who
en
gage
d in
beh
avio
r
Mostly A's Mostly B's Mostly C's Mostly D/F's
*p<.0001 after controlling for sex, grade level, and race/ethnicity.
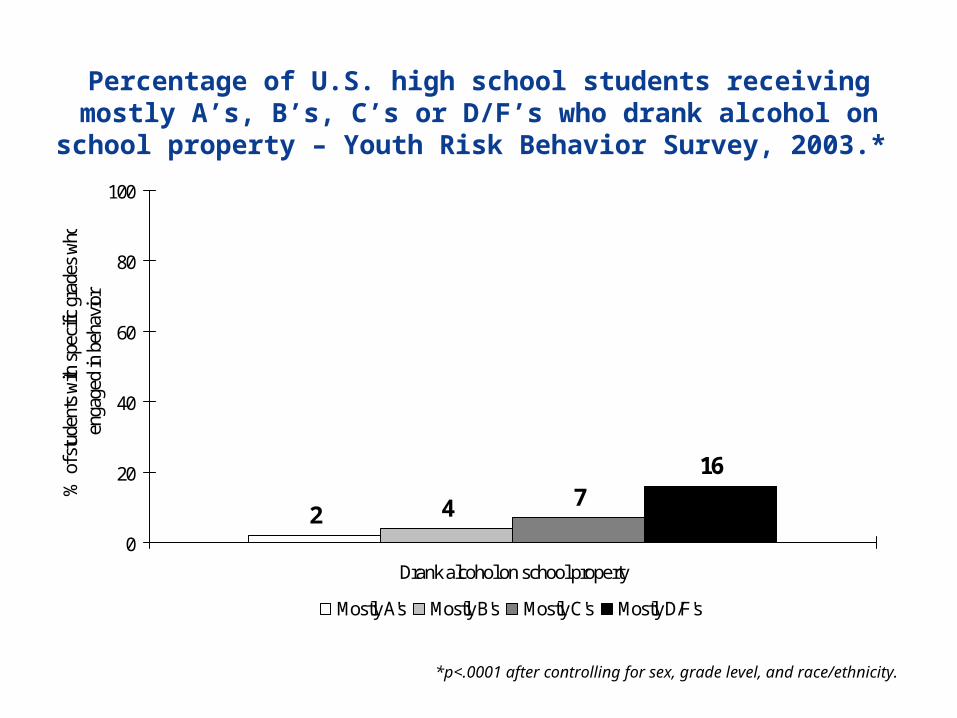
Percentage of U.S. high school students receiving mostly A’s, B’s, C’s or D/F’s who drank alcohol on school property – Youth Risk Behavior Survey, 2003.*
2 4 716
0
20
40
60
80
100
Drank alcohol on school property
% o
f stu
dent
s wi
th s
pecif
ic gr
ades
who
en
gage
d in
beh
avio
r
Mostly A's Mostly B's Mostly C's Mostly D/F's
*p<.0001 after controlling for sex, grade level, and race/ethnicity.
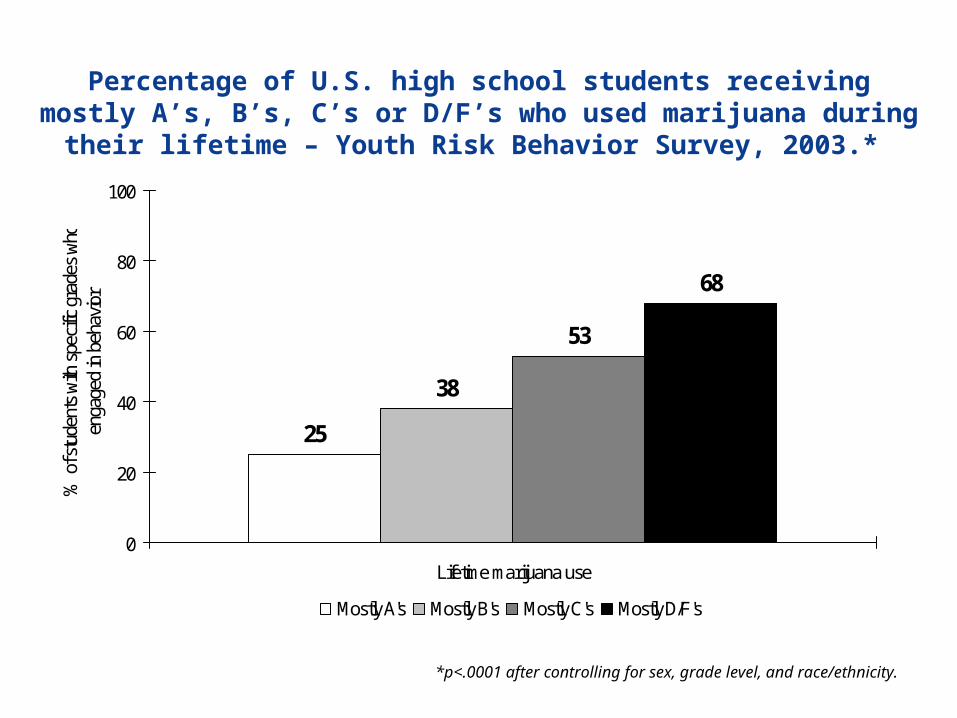
Percentage of U.S. high school students receiving mostly A’s, B’s, C’s or D/F’s who used marijuana during their lifetime – Youth Risk Behavior Survey, 2003.*
25
38
53
68
0
20
40
60
80
100
Lifetime marijuana use
% o
f stu
dent
s wi
th s
pecif
ic gr
ades
who
en
gage
d in
beh
avio
r
Mostly A's Mostly B's Mostly C's Mostly D/F's
*p<.0001 after controlling for sex, grade level, and race/ethnicity.
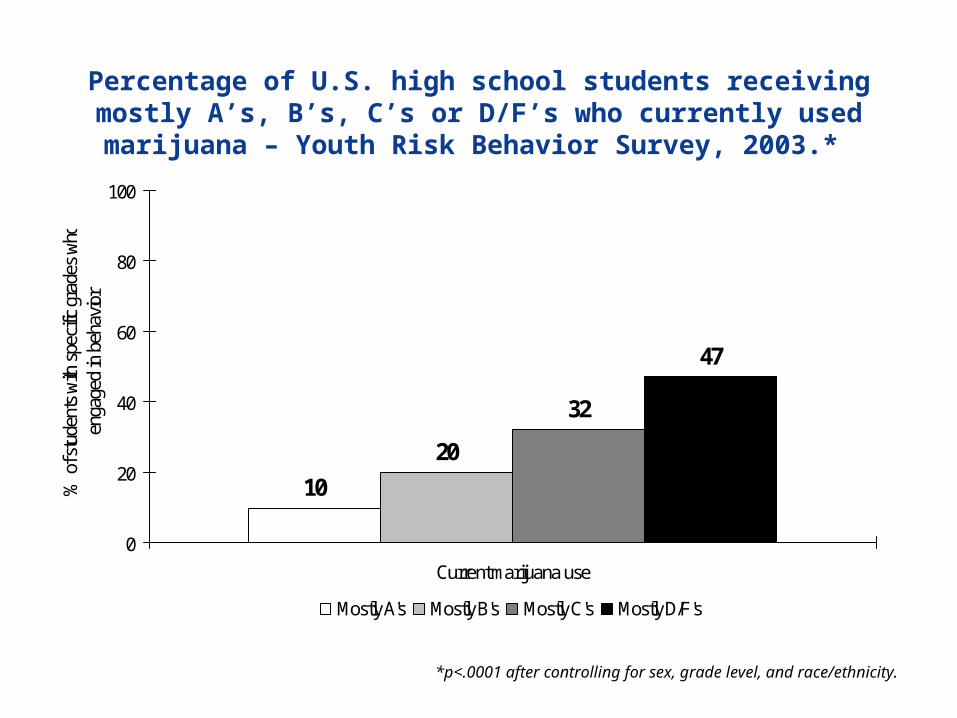
Percentage of U.S. high school students receiving mostly A’s, B’s, C’s or D/F’s who currently used marijuana – Youth Risk Behavior Survey, 2003.*
10
20
32
47
0
20
40
60
80
100
Current marijuana use
% o
f stu
dent
s wi
th s
pecif
ic gr
ades
who
en
gage
d in
beh
avio
r
Mostly A's Mostly B's Mostly C's Mostly D/F's
*p<.0001 after controlling for sex, grade level, and race/ethnicity.
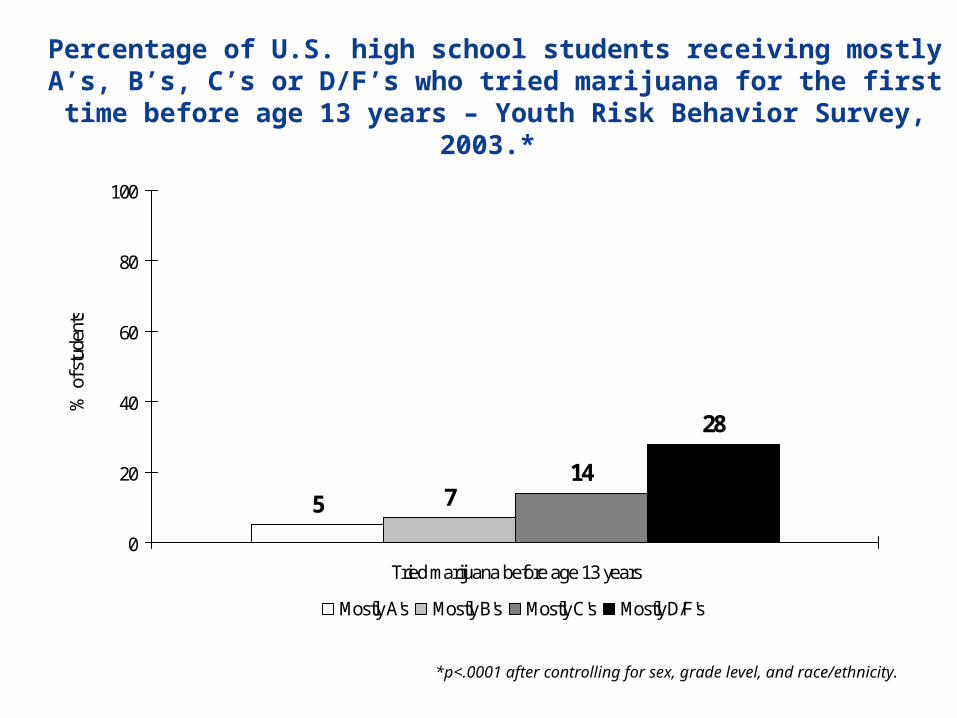
Percentage of U.S. high school students receiving mostly A’s, B’s, C’s or D/F’s who tried marijuana for the first time before age 13 years – Youth Risk Behavior Survey, 2003.*
5 714
28
0
20
40
60
80
100
Tried marijuana before age 13 years
% o
f stu
dent
s
Mostly A's Mostly B's Mostly C's Mostly D/F's
*p<.0001 after controlling for sex, grade level, and race/ethnicity.
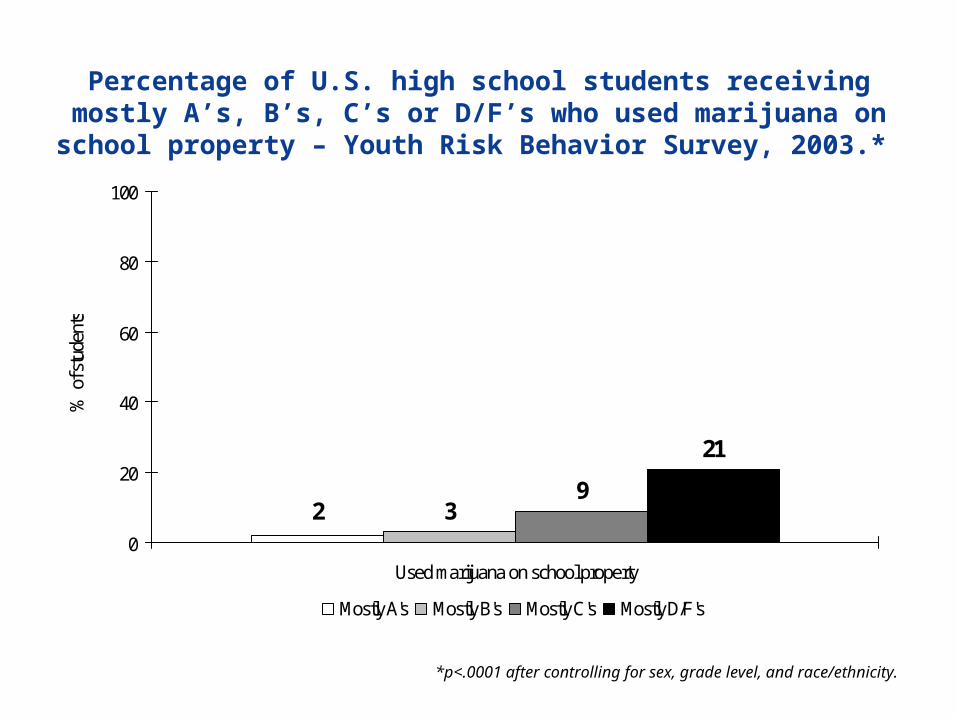
Percentage of U.S. high school students receiving mostly A’s, B’s, C’s or D/F’s who used marijuana on school property – Youth Risk Behavior Survey, 2003.*
2 39
21
0
20
40
60
80
100
Used marijuana on school property
% o
f stu
dent
s
Mostly A's Mostly B's Mostly C's Mostly D/F's
*p<.0001 after controlling for sex, grade level, and race/ethnicity.
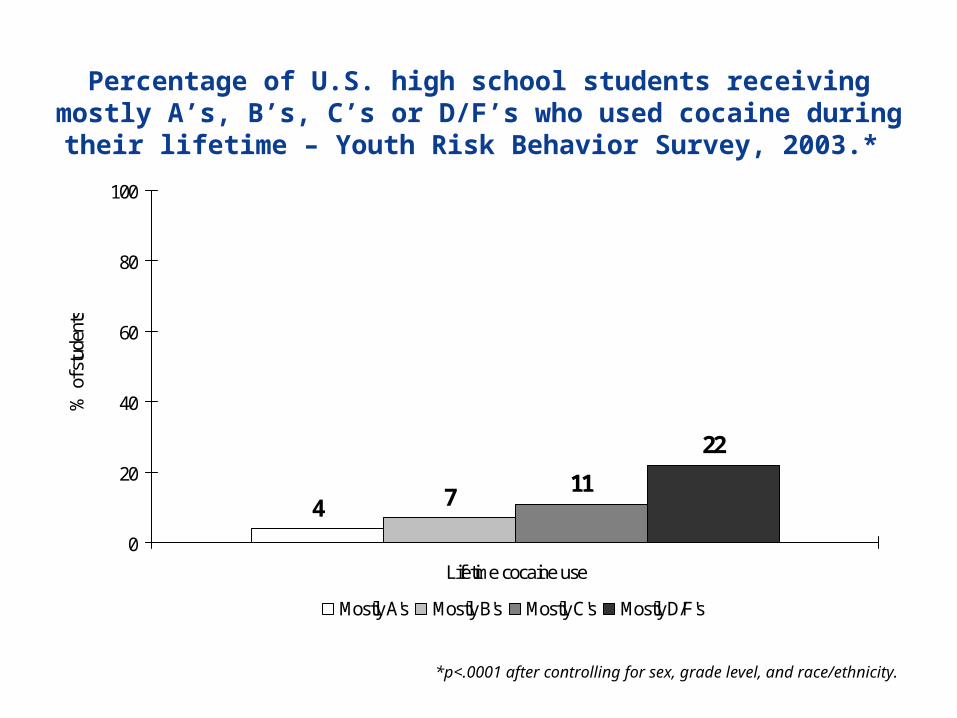
Percentage of U.S. high school students receiving mostly A’s, B’s, C’s or D/F’s who used cocaine during their lifetime – Youth Risk Behavior Survey, 2003.*
4 711
22
0
20
40
60
80
100
Lifetime cocaine use
% o
f stu
dent
s
Mostly A's Mostly B's Mostly C's Mostly D/F's
*p<.0001 after controlling for sex, grade level, and race/ethnicity.
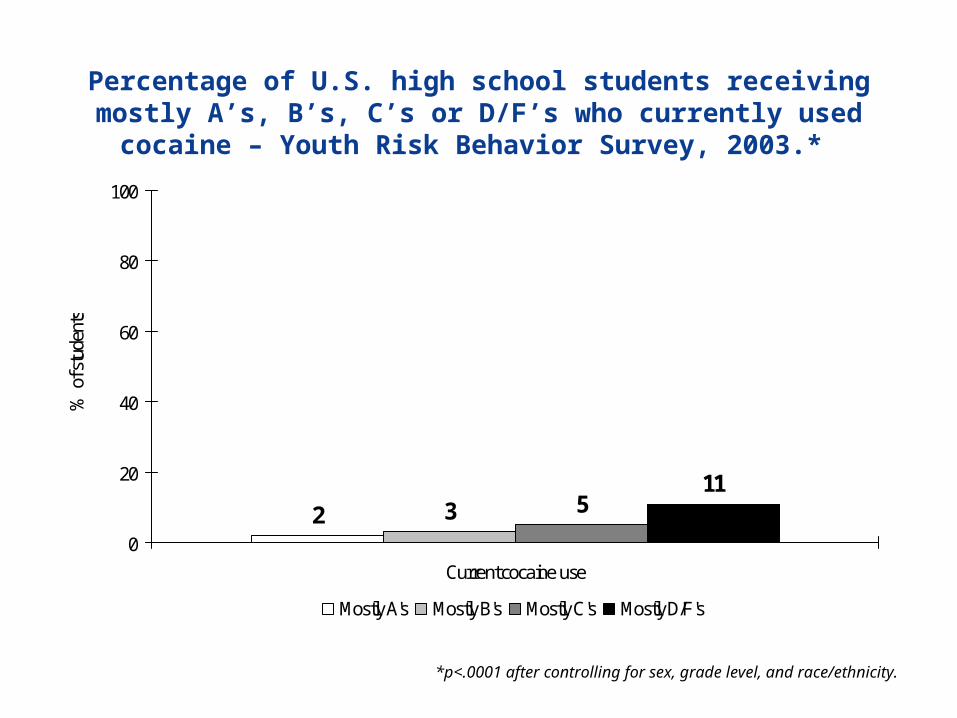
Percentage of U.S. high school students receiving mostly A’s, B’s, C’s or D/F’s who currently used cocaine – Youth Risk Behavior Survey, 2003.*
2 3 511
0
20
40
60
80
100
Current cocaine use
% o
f stu
dent
s
Mostly A's Mostly B's Mostly C's Mostly D/F's
*p<.0001 after controlling for sex, grade level, and race/ethnicity.
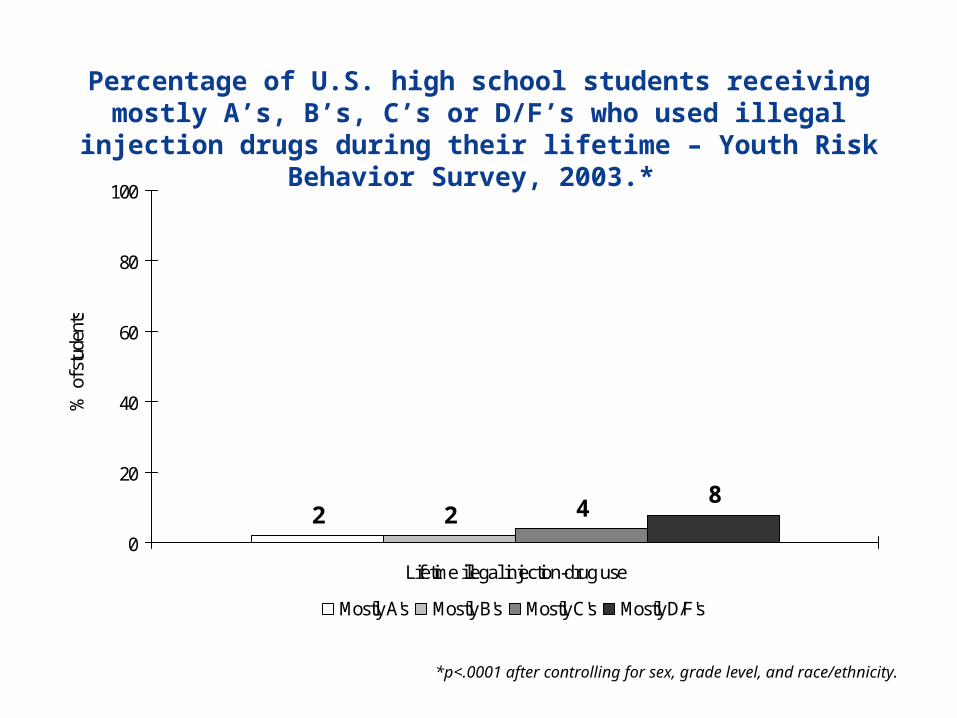
Percentage of U.S. high school students receiving mostly A’s, B’s, C’s or D/F’s who used illegal injection drugs during their lifetime – Youth Risk Behavior Survey, 2003.*
2 2 48
0
20
40
60
80
100
Lifetime illegal injection-drug use
% o
f stu
dent
s
Mostly A's Mostly B's Mostly C's Mostly D/F's
*p<.0001 after controlling for sex, grade level, and race/ethnicity.

Percentage of U.S. high school students receiving mostly A’s, B’s, C’s or D/F’s who used inhalants during their lifetime – Youth Risk Behavior Survey, 2003.*
8 11 14
24
0
20
40
60
80
100
Lifetime inhalant use
% o
f stu
dent
s
Mostly A's Mostly B's Mostly C's Mostly D/F's
*p<.0001 after controlling for sex, grade level, and race/ethnicity.

Percentage of U.S. high school students receiving mostly A’s, B’s, C’s or D/F’s who currently used inhalants – Youth Risk Behavior Survey, 2003.*
2 3 512
0
20
40
60
80
100
Current inhalant use
% o
f stu
dent
s
Mostly A's Mostly B's Mostly C's Mostly D/F's
*p<.0001 after controlling for sex, grade level, and race/ethnicity.
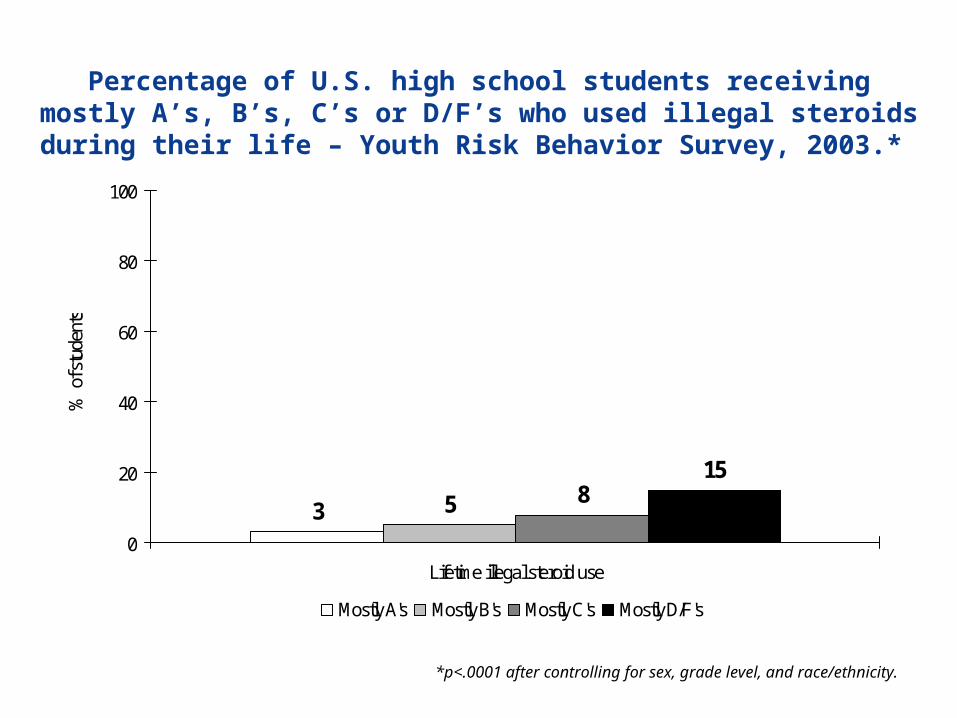
Percentage of U.S. high school students receiving mostly A’s, B’s, C’s or D/F’s who used illegal steroids during their life – Youth Risk Behavior Survey, 2003.*
3 5 815
0
20
40
60
80
100
Lifetime illegal steroid use
% o
f stu
dent
s
Mostly A's Mostly B's Mostly C's Mostly D/F's
*p<.0001 after controlling for sex, grade level, and race/ethnicity.
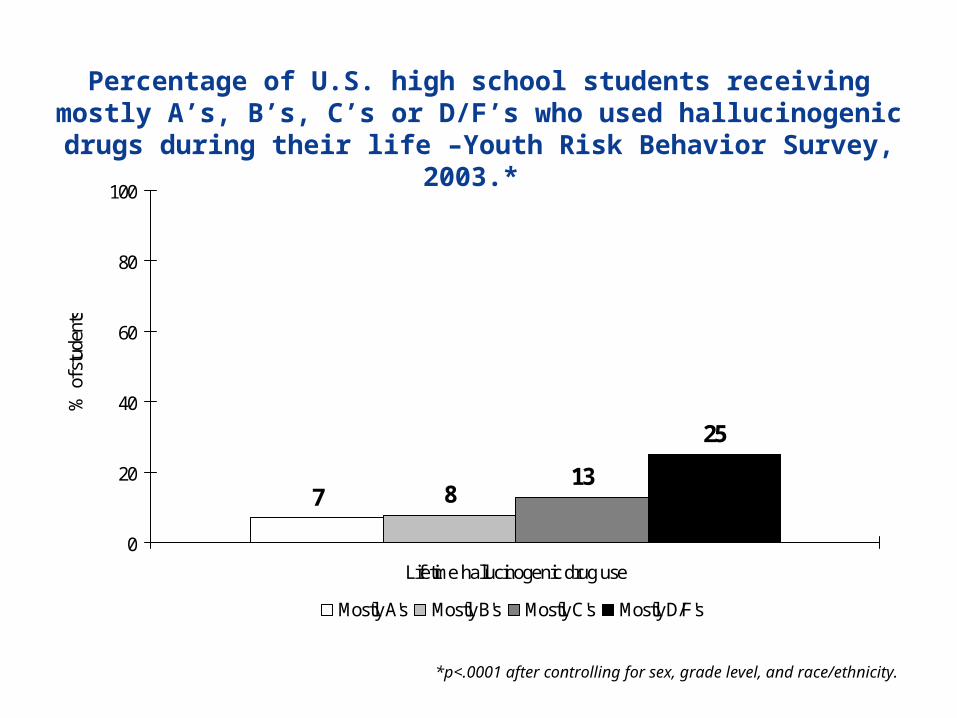
Percentage of U.S. high school students receiving mostly A’s, B’s, C’s or D/F’s who used hallucinogenic drugs during their life –Youth Risk Behavior Survey, 2003.*
7 813
25
0
20
40
60
80
100
Lifetime hallucinogenic drug use
% o
f stu
dent
s
Mostly A's Mostly B's Mostly C's Mostly D/F's
*p<.0001 after controlling for sex, grade level, and race/ethnicity.
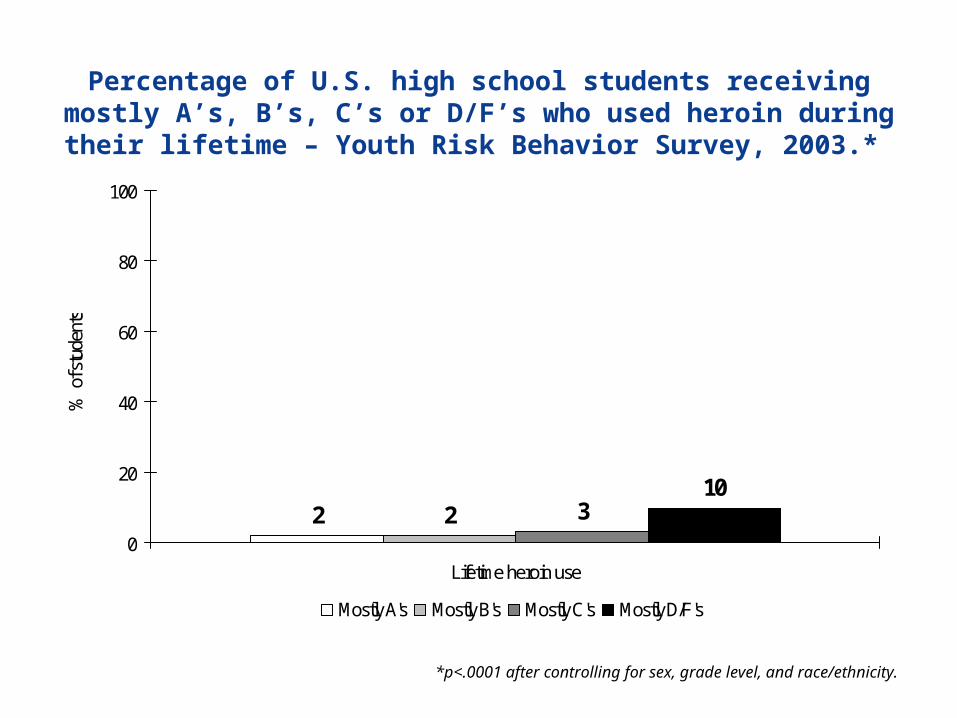
Percentage of U.S. high school students receiving mostly A’s, B’s, C’s or D/F’s who used heroin during their lifetime – Youth Risk Behavior Survey, 2003.*
2 2 310
0
20
40
60
80
100
Lifetime heroin use
% o
f stu
dent
s
Mostly A's Mostly B's Mostly C's Mostly D/F's
*p<.0001 after controlling for sex, grade level, and race/ethnicity.
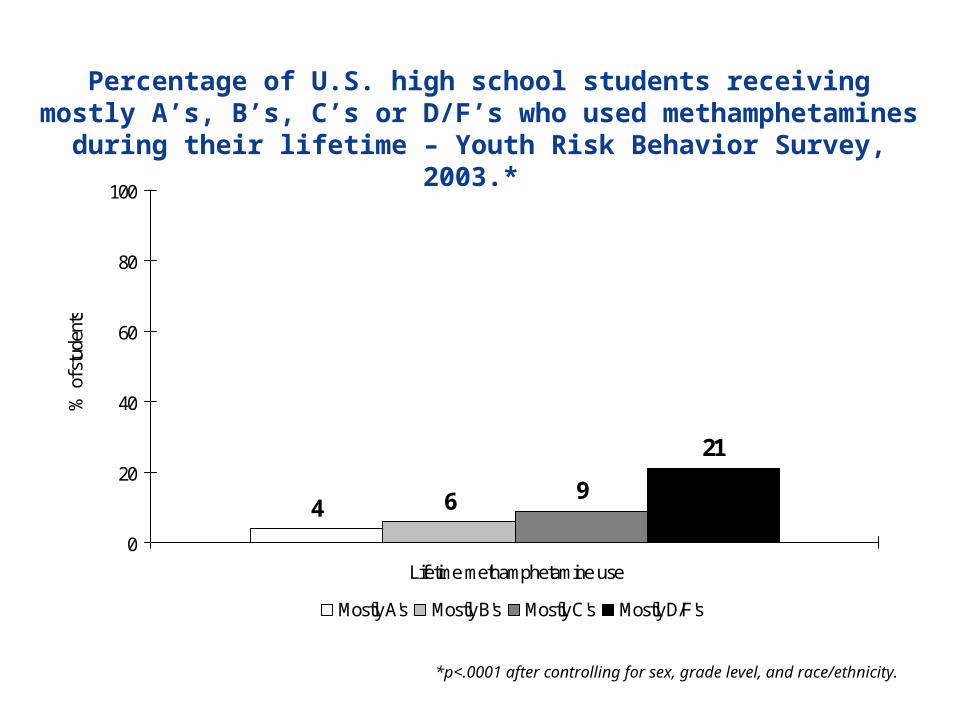
Percentage of U.S. high school students receiving mostly A’s, B’s, C’s or D/F’s who used methamphetamines during their lifetime – Youth Risk Behavior Survey, 2003.*
4 6 9
21
0
20
40
60
80
100
Lifetime methamphetamine use
% o
f stu
dent
s
Mostly A's Mostly B's Mostly C's Mostly D/F's
*p<.0001 after controlling for sex, grade level, and race/ethnicity.
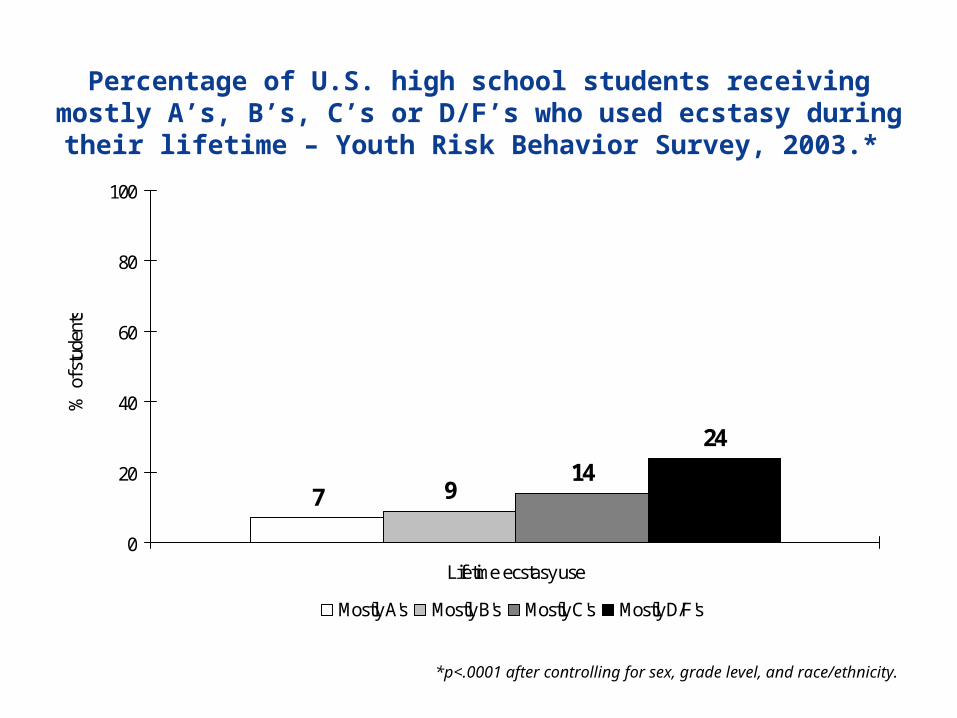
Percentage of U.S. high school students receiving mostly A’s, B’s, C’s or D/F’s who used ecstasy during their lifetime – Youth Risk Behavior Survey, 2003.*
7 914
24
0
20
40
60
80
100
Lifetime ecstasy use
% o
f stu
dent
s
Mostly A's Mostly B's Mostly C's Mostly D/F's
*p<.0001 after controlling for sex, grade level, and race/ethnicity.
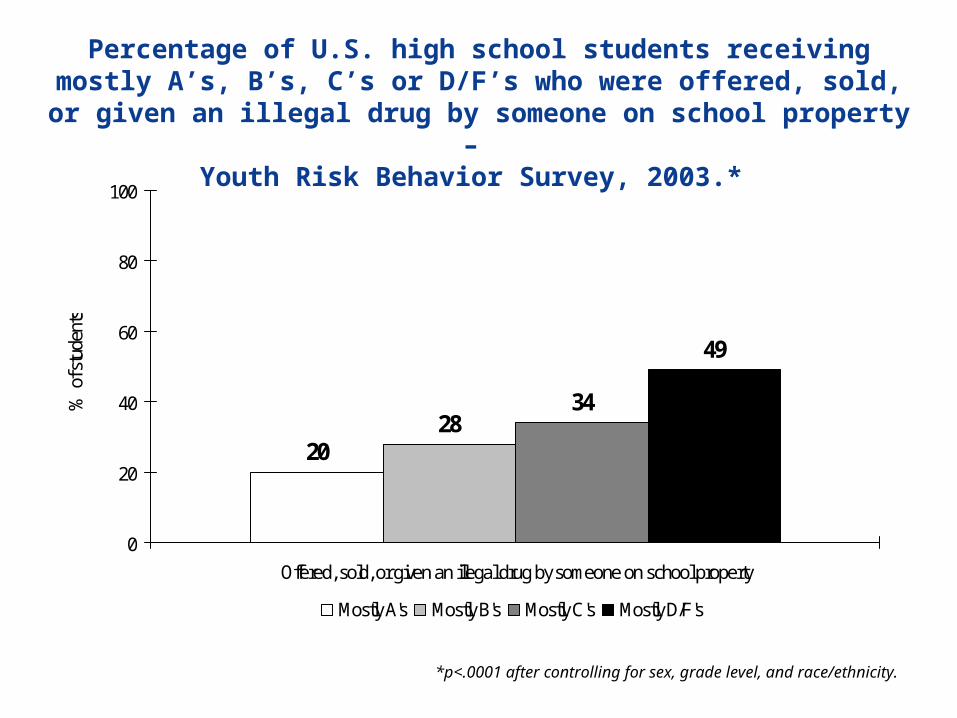
Percentage of U.S. high school students receiving mostly A’s, B’s, C’s or D/F’s who were offered, sold, or given an illegal drug by someone on school property –
Youth Risk Behavior Survey, 2003.*
2028
34
49
0
20
40
60
80
100
Offered, sold, or given an illegal drug by someone on school property
% o
f stu
dent
s
Mostly A's Mostly B's Mostly C's Mostly D/F's
*p<.0001 after controlling for sex, grade level, and race/ethnicity.