Embed Size (px)
Citation preview
University of Minnesota –Twin Ci3es Students
Katherine Lust, PhD, MPH, RD Boynton Health Service University of Minnesota
Alcohol and First Year Students: What You Need to Know as an Advisor/
Staff/Faculty Member
Focus on the First Year Conference February 13, 2013
University of Minnesota –Twin Ci3es Students
Katherine Lust, PhD, MPH, RD Boynton Health Service University of Minnesota
Agenda
• IntroducOons • Overview of College Student Health Survey & Health Minds Survey • Overview of NCHIP (NaOonal College Health
Improvement Program) • Panel discussion
Alcohol Use and Mental Health
at the University of Minnesota
Toben F. Nelson, ScD Division of Epidemiology and Community Health
• 2 modules – Mental Health – Alcohol and Other Drugs
• Focus on service utilization and satisfaction with services
• Web-based survey • Part of a national sample • Conducted in Spring 2012 • Minnesota response rate = 35%
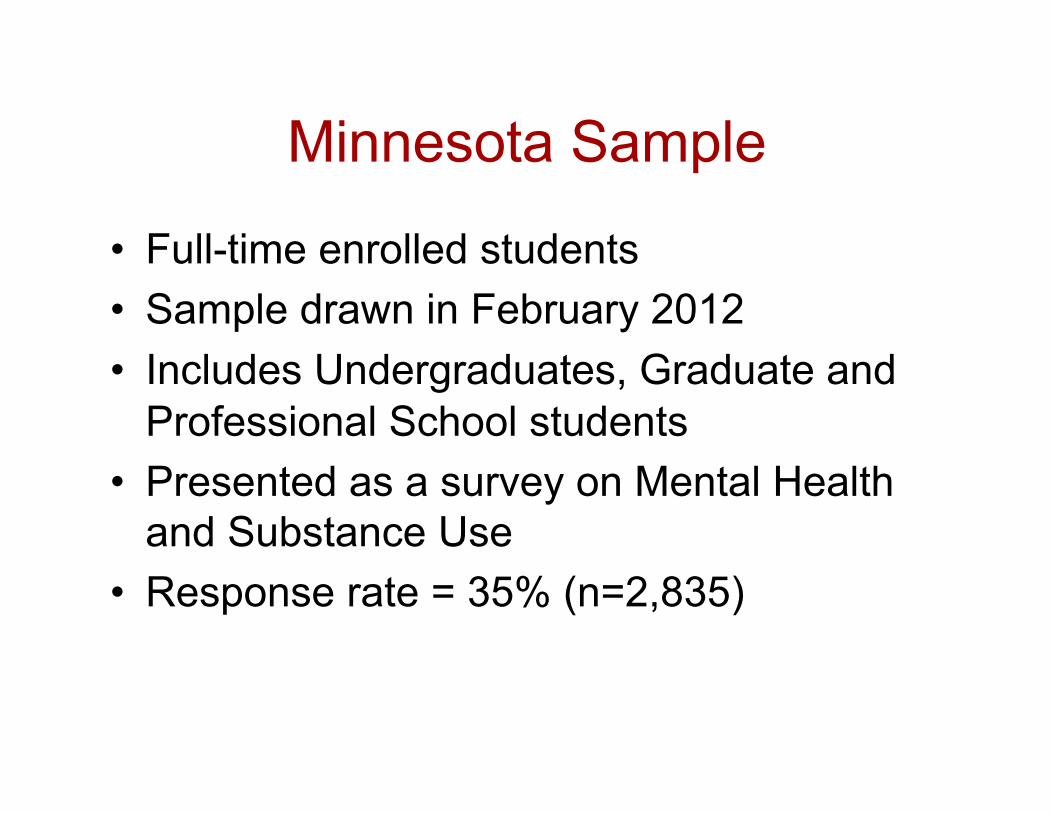
Minnesota Sample
• Full-time enrolled students • Sample drawn in February 2012 • Includes Undergraduates, Graduate and
Professional School students • Presented as a survey on Mental Health
and Substance Use • Response rate = 35% (n=2,835)
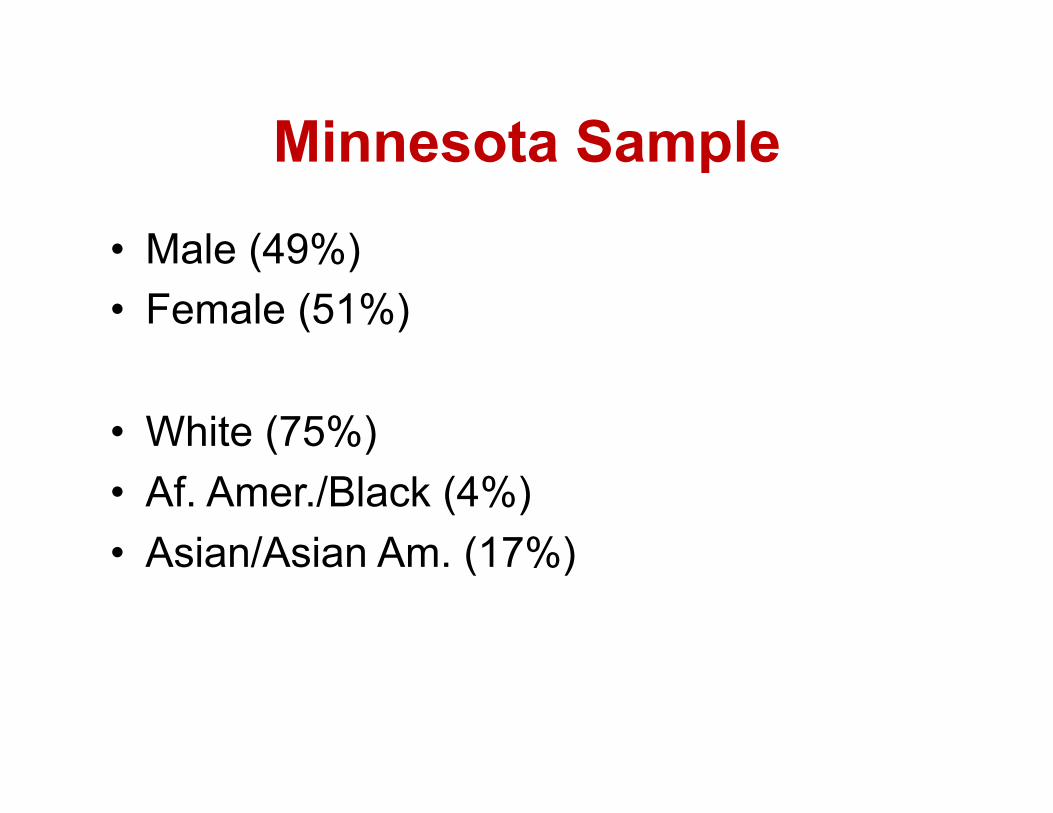
• Male (49%) • Female (51%)
• White (75%) • Af. Amer./Black (4%) • Asian/Asian Am. (17%)
Minnesota Sample
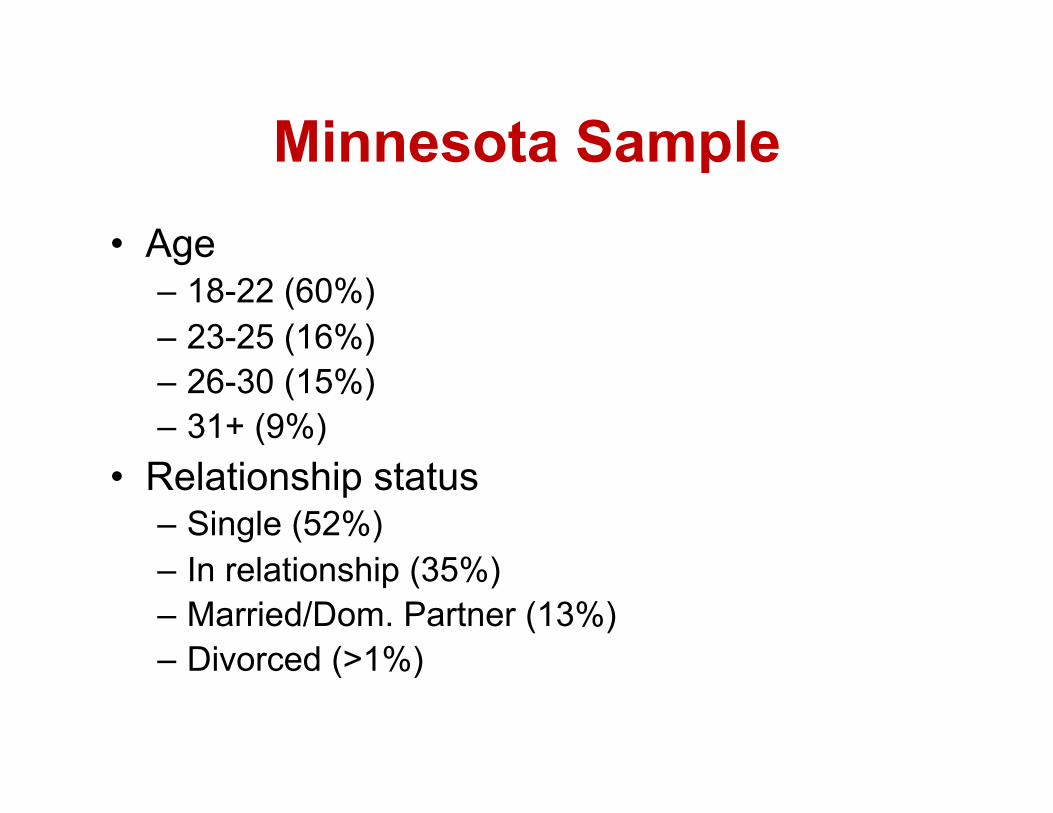
• Age – 18-22 (60%) – 23-25 (16%) – 26-30 (15%) – 31+ (9%)
• Relationship status – Single (52%) – In relationship (35%) – Married/Dom. Partner (13%) – Divorced (>1%)
Minnesota Sample
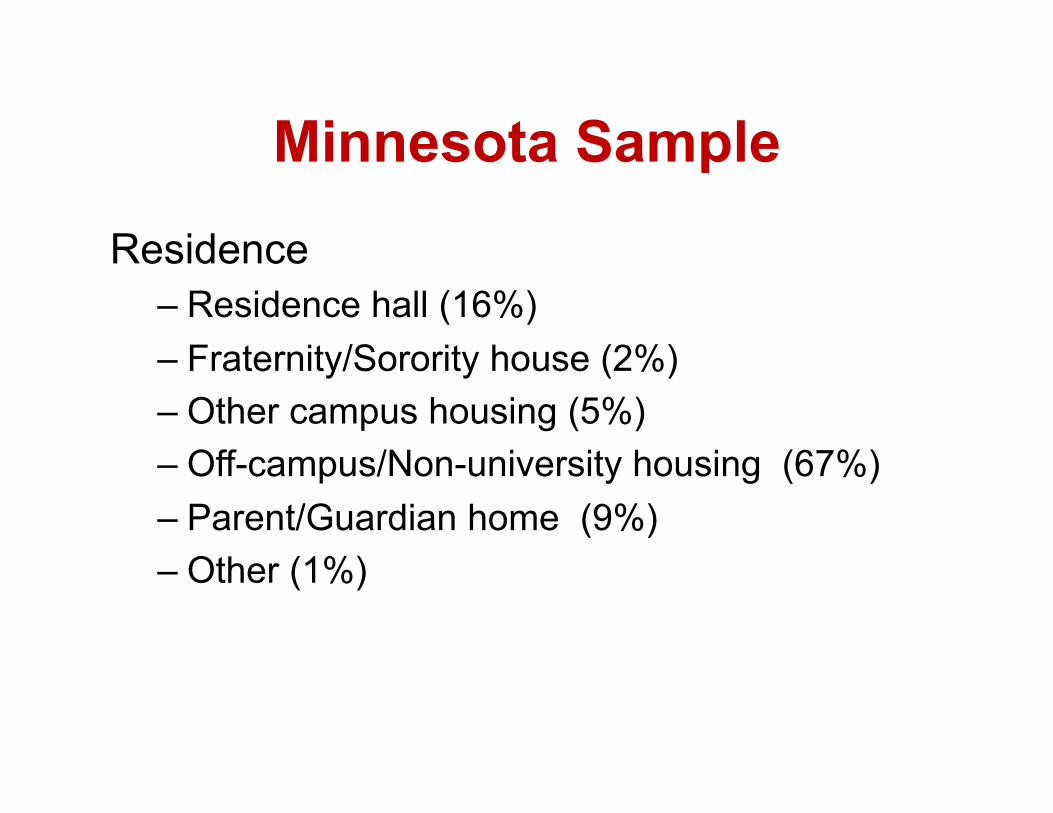
Residence – Residence hall (16%) – Fraternity/Sorority house (2%) – Other campus housing (5%) – Off-campus/Non-university housing (67%) – Parent/Guardian home (9%) – Other (1%)
Minnesota Sample
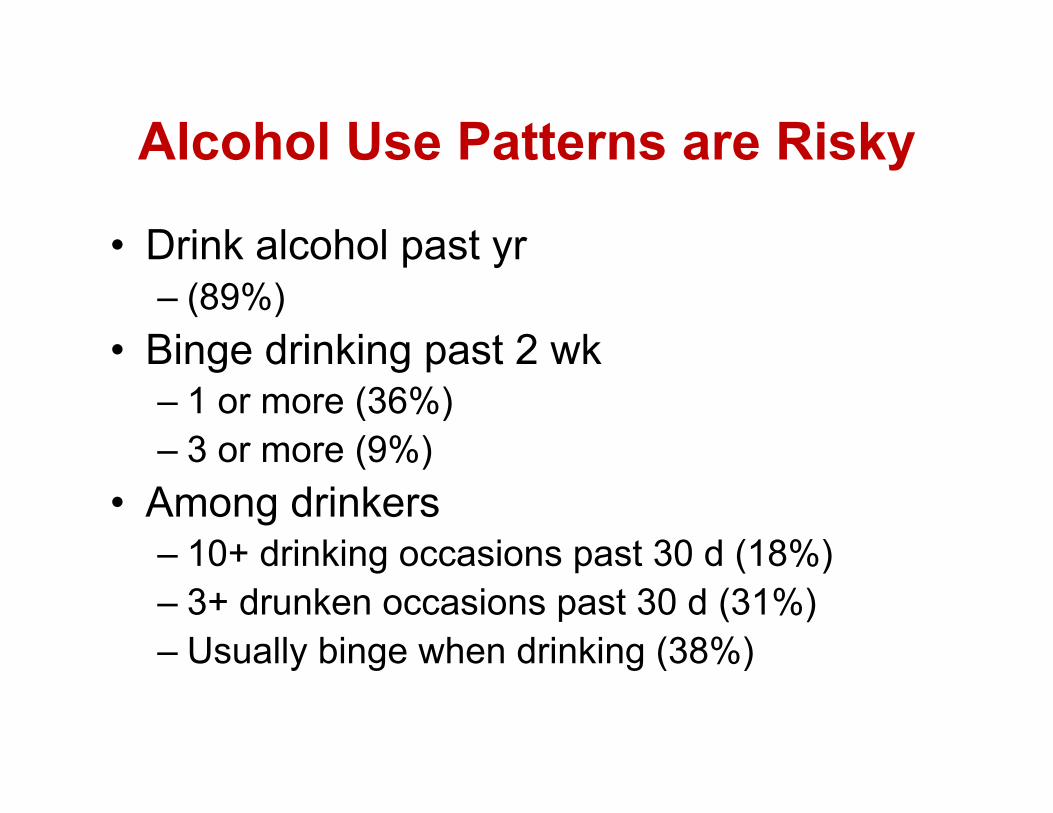
Alcohol Use Patterns are Risky
• Drink alcohol past yr – (89%)
• Binge drinking past 2 wk – 1 or more (36%) – 3 or more (9%)
• Among drinkers – 10+ drinking occasions past 30 d (18%) – 3+ drunken occasions past 30 d (31%) – Usually binge when drinking (38%)
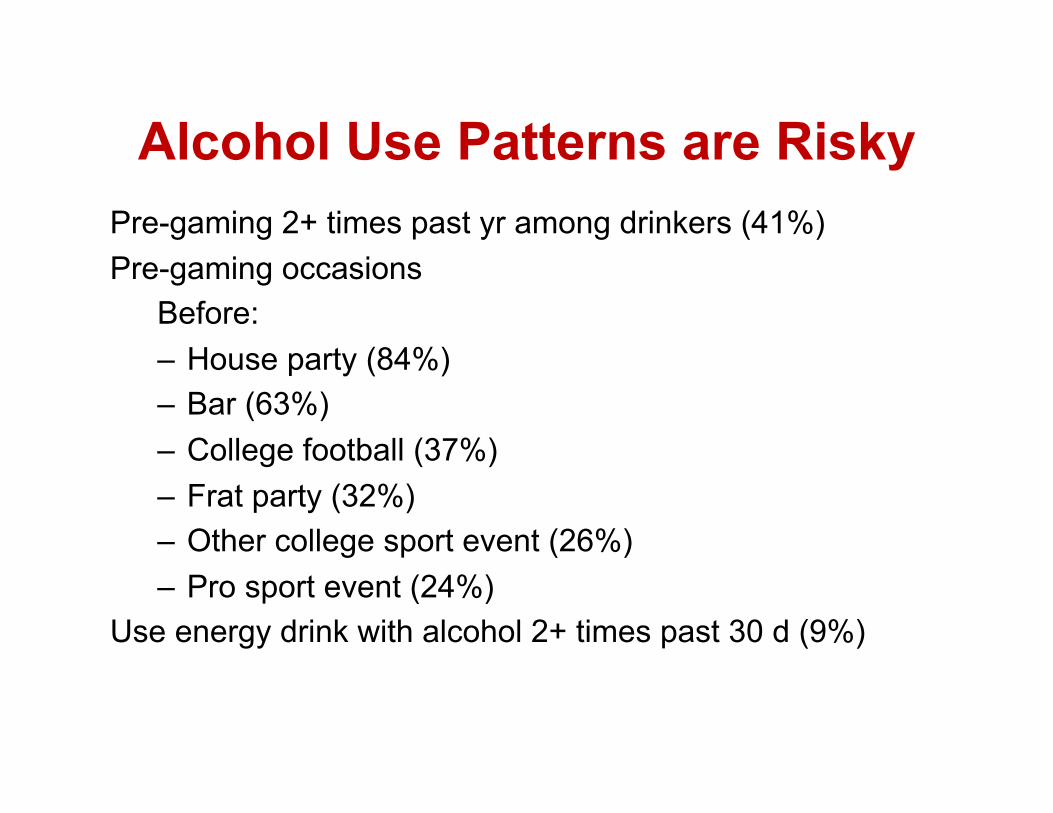
Alcohol Use Patterns are Risky Pre-gaming 2+ times past yr among drinkers (41%) Pre-gaming occasions
Before: – House party (84%) – Bar (63%) – College football (37%) – Frat party (32%) – Other college sport event (26%) – Pro sport event (24%)
Use energy drink with alcohol 2+ times past 30 d (9%)
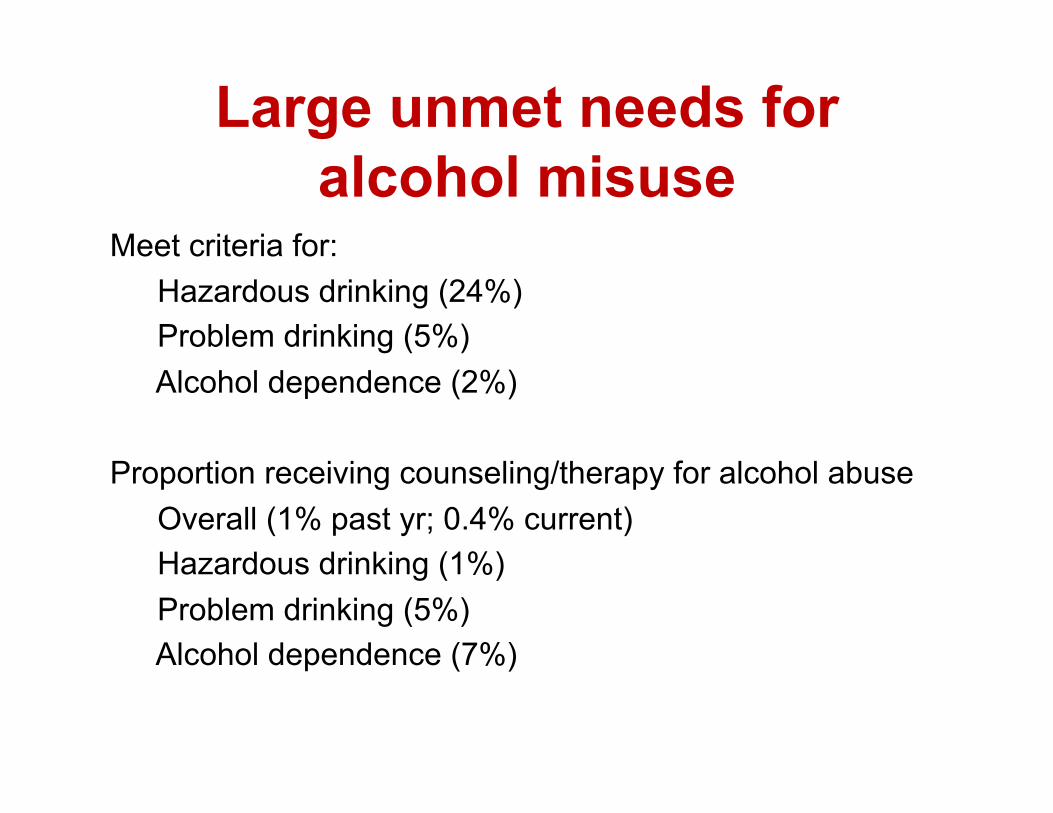
Large unmet needs for alcohol misuse
Meet criteria for: Hazardous drinking (24%) Problem drinking (5%) Alcohol dependence (2%)
Proportion receiving counseling/therapy for alcohol abuse Overall (1% past yr; 0.4% current) Hazardous drinking (1%) Problem drinking (5%) Alcohol dependence (7%)
University of Minnesota –Twin Ci3es Students
Katherine Lust, PhD, MPH, RD Boynton Health Service University of Minnesota
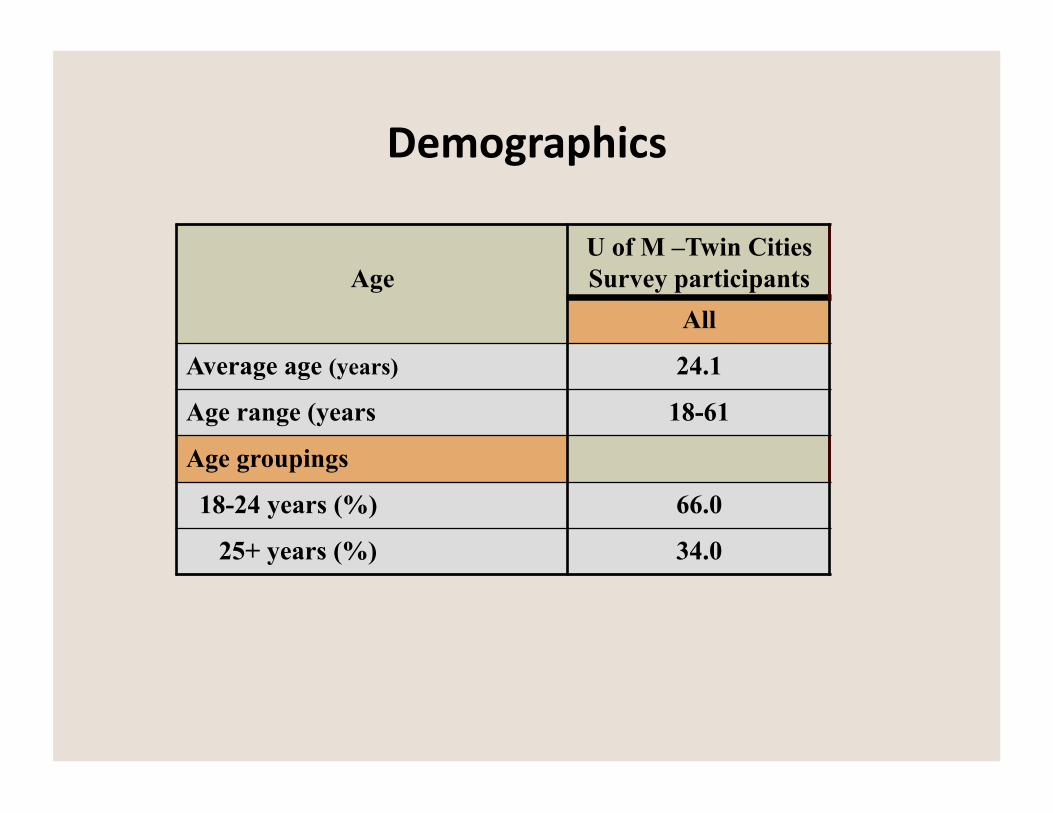
Demographics
Age U of M –Twin Cities Survey participants
All
Average age (years) 24.1
Age range (years 18-61
Age groupings
18-24 years (%) 66.0
25+ years (%) 34.0
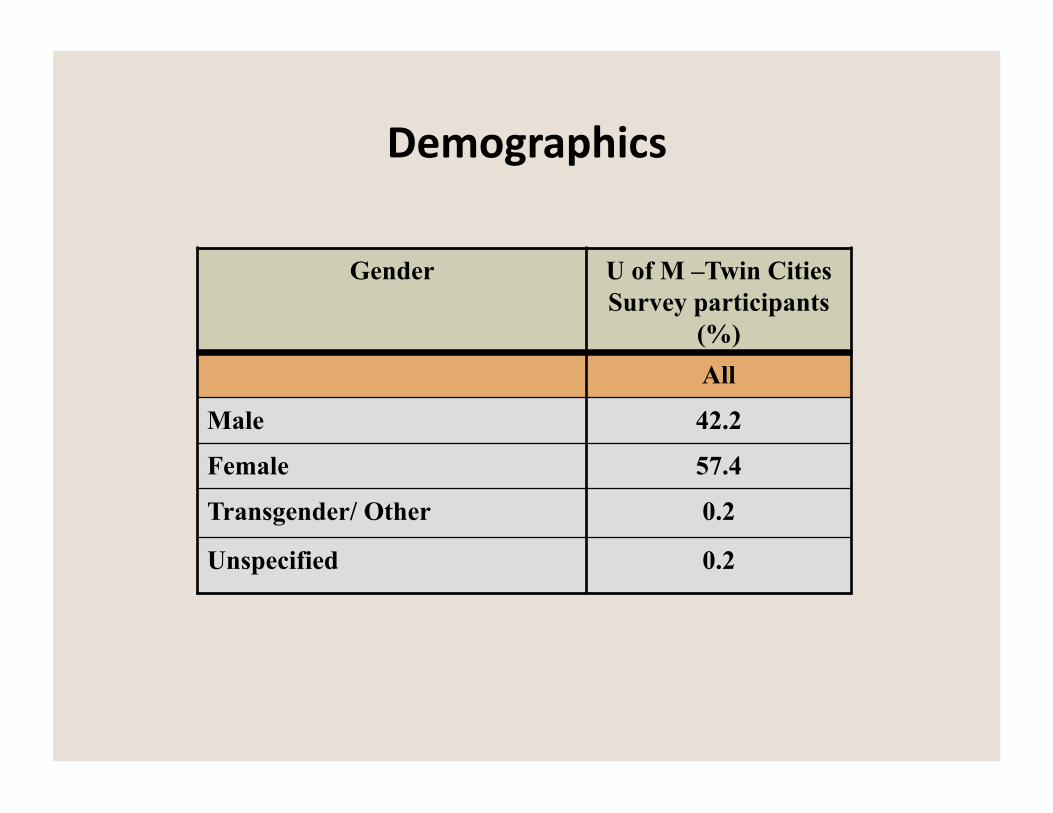
Demographics
Gender U of M –Twin Cities Survey participants
(%) All
Male 42.2
Female 57.4
Transgender/ Other 0.2
Unspecified 0.2
Analysis: Academic performance
Grade Point Average: self report
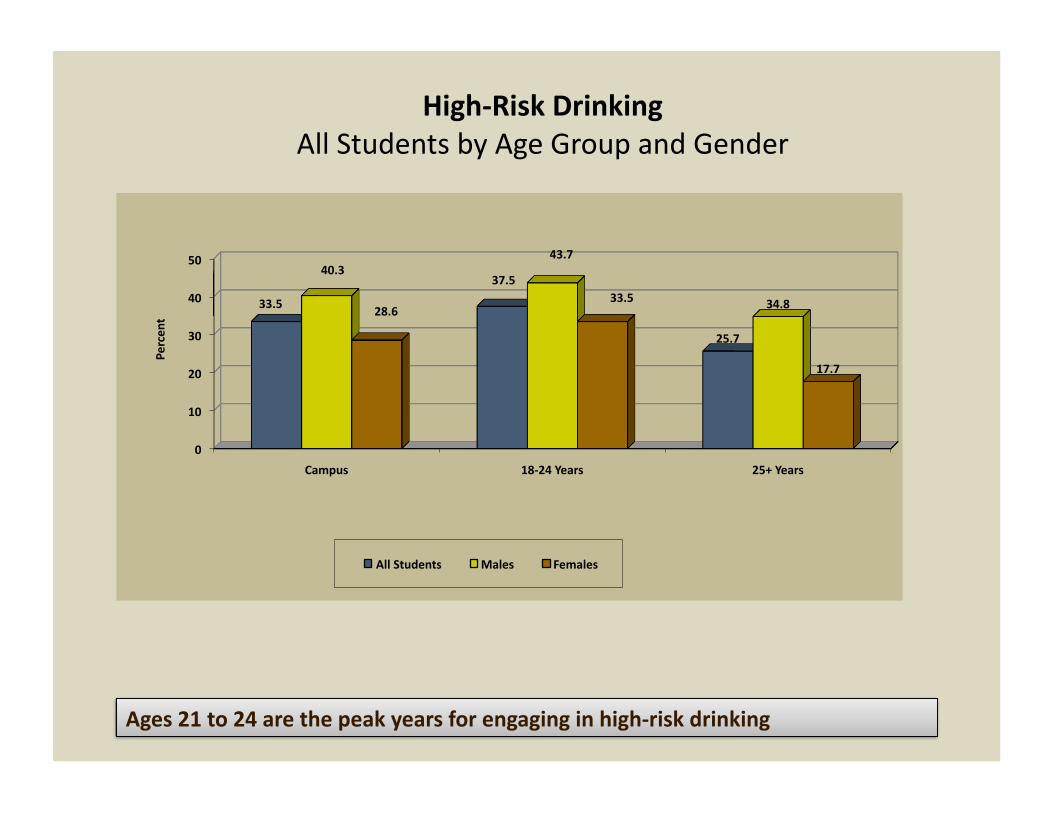
High-‐Risk Drinking All Students by Age Group and Gender
Ages 21 to 24 are the peak years for engaging in high-‐risk drinking
0
10
20
30
40
50
Campus 18-‐24 Years 25+ Years
33.5
37.5
25.7
40.3 43.7
34.8 28.6 33.5
17.7
Percen
t
All Students Males Females
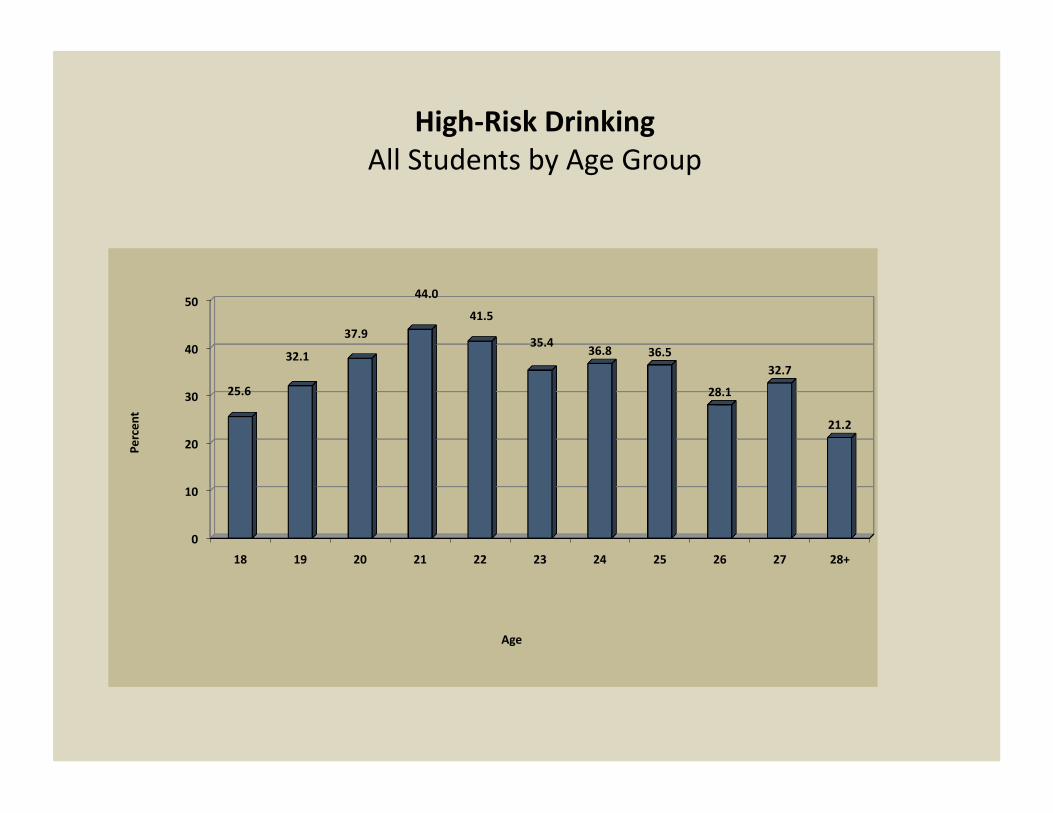
High-‐Risk Drinking All Students by Age Group
0
10
20
30
40
50
18 19 20 21 22 23 24 25 26 27 28+
25.6
32.1
37.9
44.0
41.5
35.4 36.8 36.5
28.1
32.7
21.2
Percen
t
Age
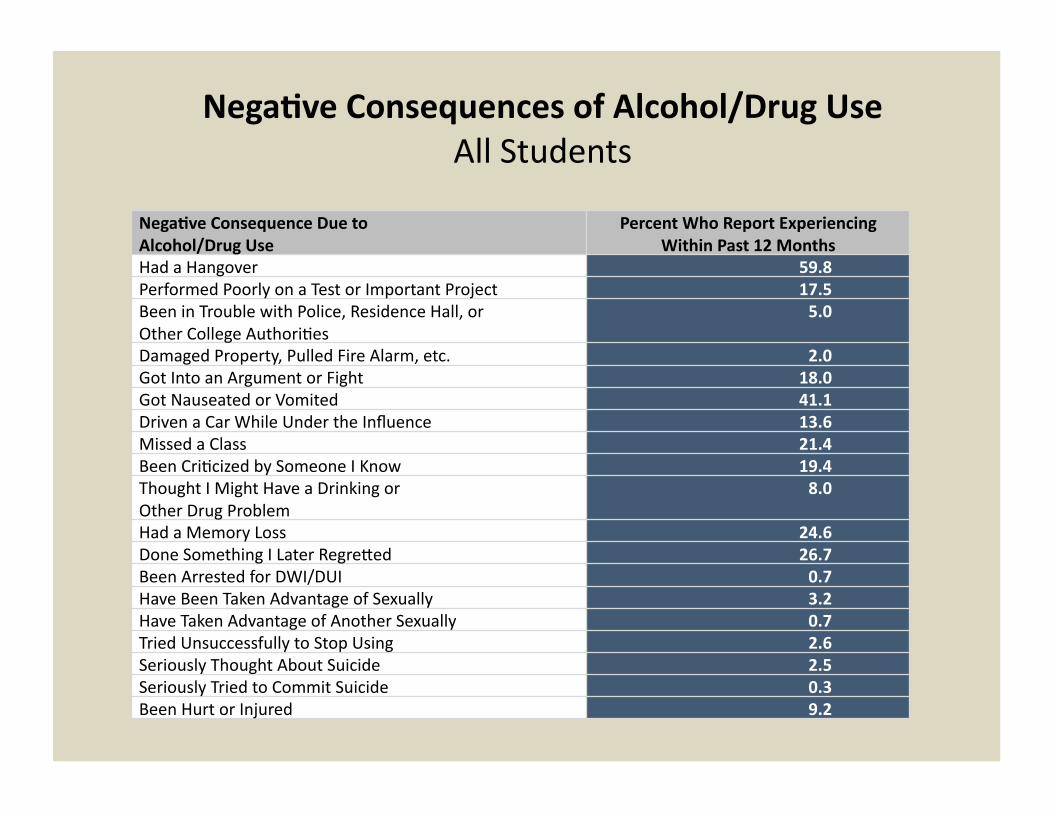
NegaOve Consequence Due to Alcohol/Drug Use
Percent Who Report Experiencing Within Past 12 Months
Had a Hangover 59.8 Performed Poorly on a Test or Important Project 17.5 Been in Trouble with Police, Residence Hall, or Other College Authori3es
5.0
Damaged Property, Pulled Fire Alarm, etc. 2.0 Got Into an Argument or Fight 18.0 Got Nauseated or Vomited 41.1 Driven a Car While Under the Influence 13.6 Missed a Class 21.4 Been Cri3cized by Someone I Know 19.4 Thought I Might Have a Drinking or Other Drug Problem
8.0
Had a Memory Loss 24.6 Done Something I Later RegreTed 26.7 Been Arrested for DWI/DUI 0.7 Have Been Taken Advantage of Sexually 3.2 Have Taken Advantage of Another Sexually 0.7 Tried Unsuccessfully to Stop Using 2.6 Seriously Thought About Suicide 2.5 Seriously Tried to Commit Suicide 0.3 Been Hurt or Injured 9.2
NegaOve Consequences of Alcohol/Drug Use All Students
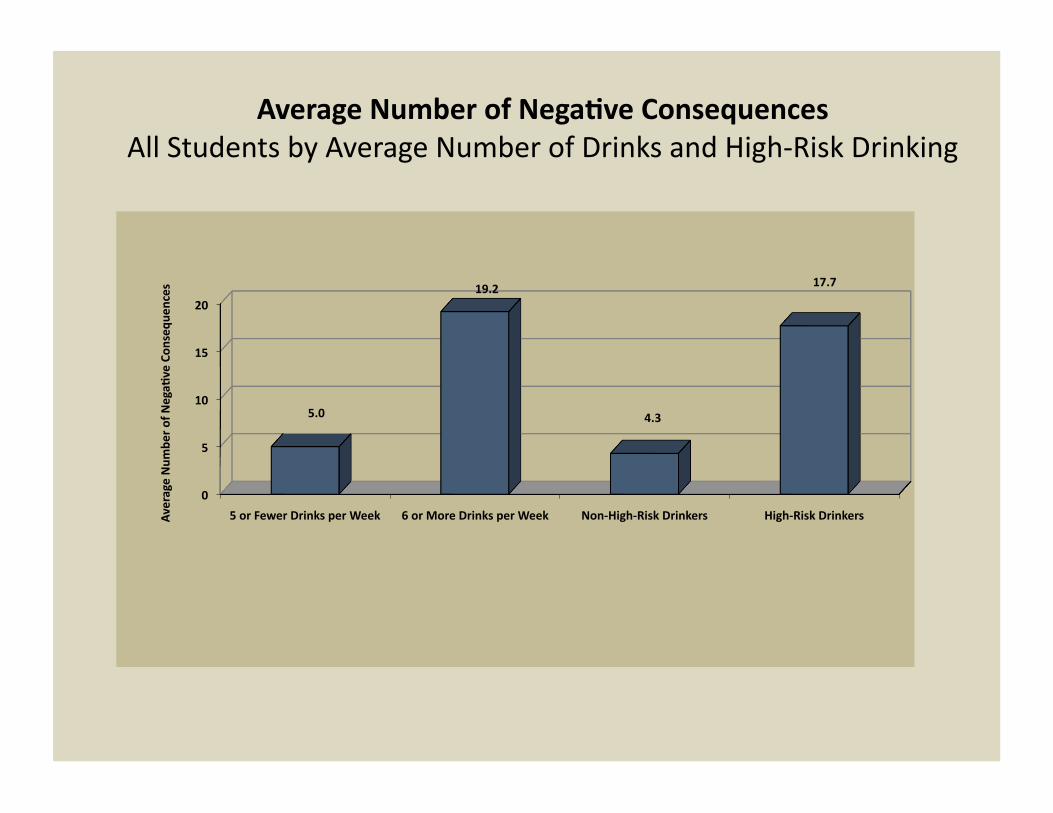
Average Number of NegaOve Consequences All Students by Average Number of Drinks and High-‐Risk Drinking
0
5
10
15
20
5 or Fewer Drinks per Week 6 or More Drinks per Week Non-‐High-‐Risk Drinkers High-‐Risk Drinkers
5.0
19.2
4.3
17.7
Average Num
ber of NegaO
ve Con
sequ
ences
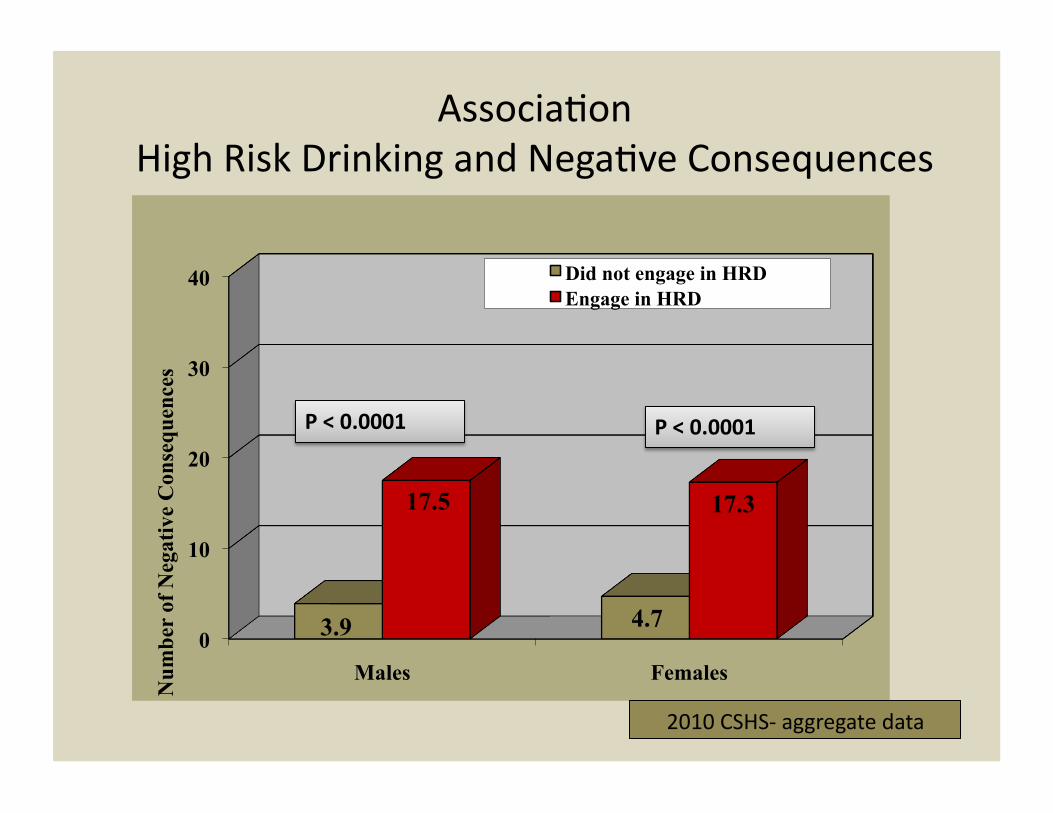
Associa3on High Risk Drinking and Nega3ve Consequences
0
10
20
30
40
Males Females
3.9 4.7
17.5 17.3
Num
ber
of N
egat
ive
Con
sequ
ence
s
Did not engage in HRD Engage in HRD
P < 0.0001 P < 0.0001
2010 CSHS-‐ aggregate data
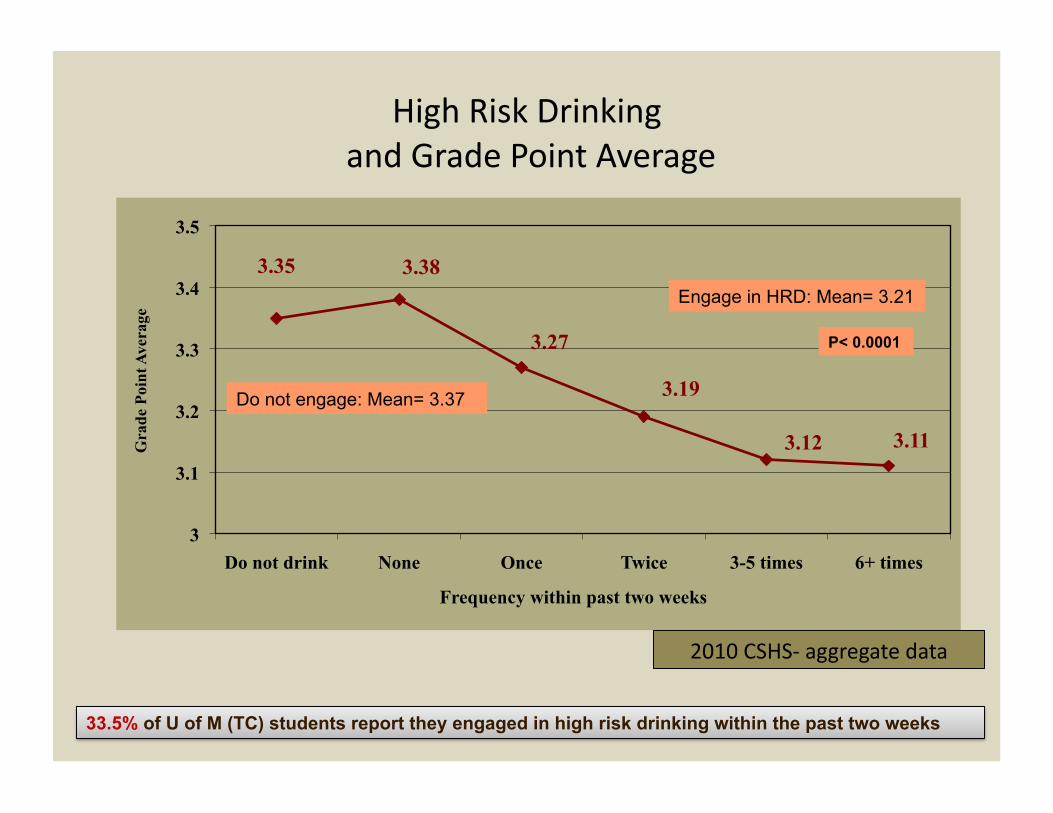
High Risk Drinking and Grade Point Average
3.35 3.38
3.27
3.19
3.12 3.11
3
3.1
3.2
3.3
3.4
3.5
Do not drink None Once Twice 3-5 times 6+ times
Gra
de P
oint
Ave
rage
Frequency within past two weeks
33.5% of U of M (TC) students report they engaged in high risk drinking within the past two weeks
Engage in HRD: Mean= 3.21
Do not engage: Mean= 3.37
P< 0.0001
2010 CSHS-‐ aggregate data
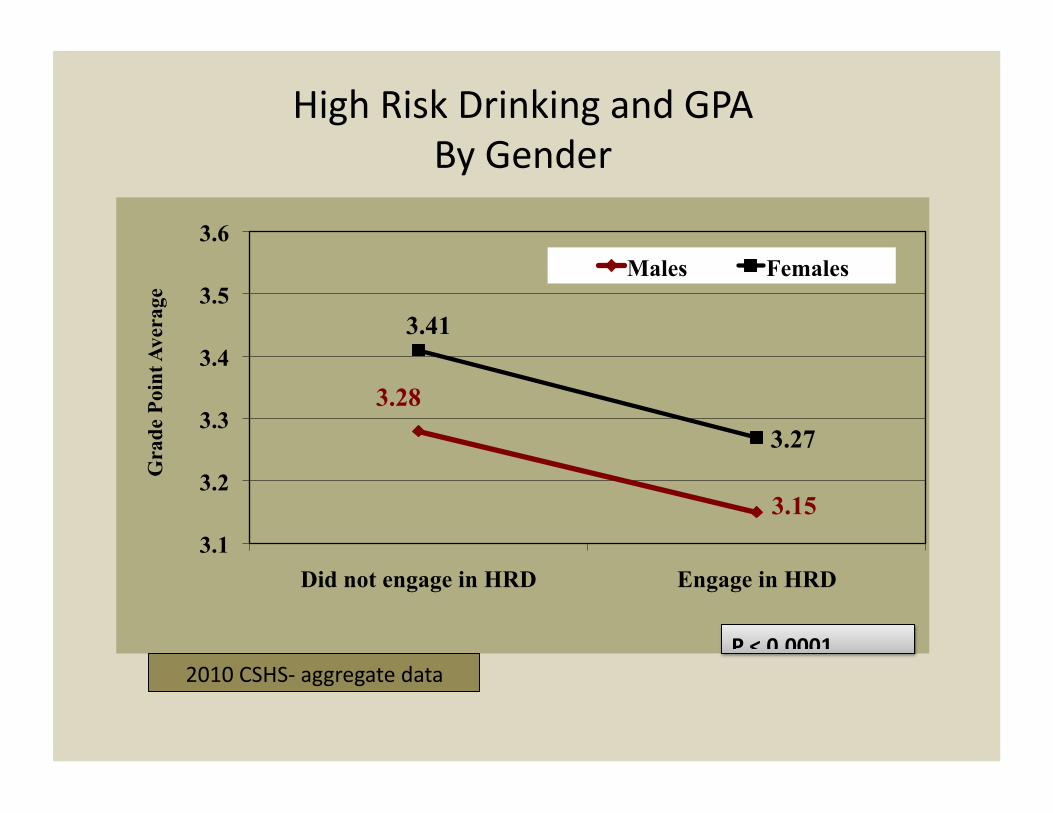
High Risk Drinking and GPA By Gender
3.28
3.15
3.41
3.27
3.1
3.2
3.3
3.4
3.5
3.6
Did not engage in HRD Engage in HRD
Gra
de P
oint
Ave
rage
Males Females
P < 0.0001 2010 CSHS-‐ aggregate data
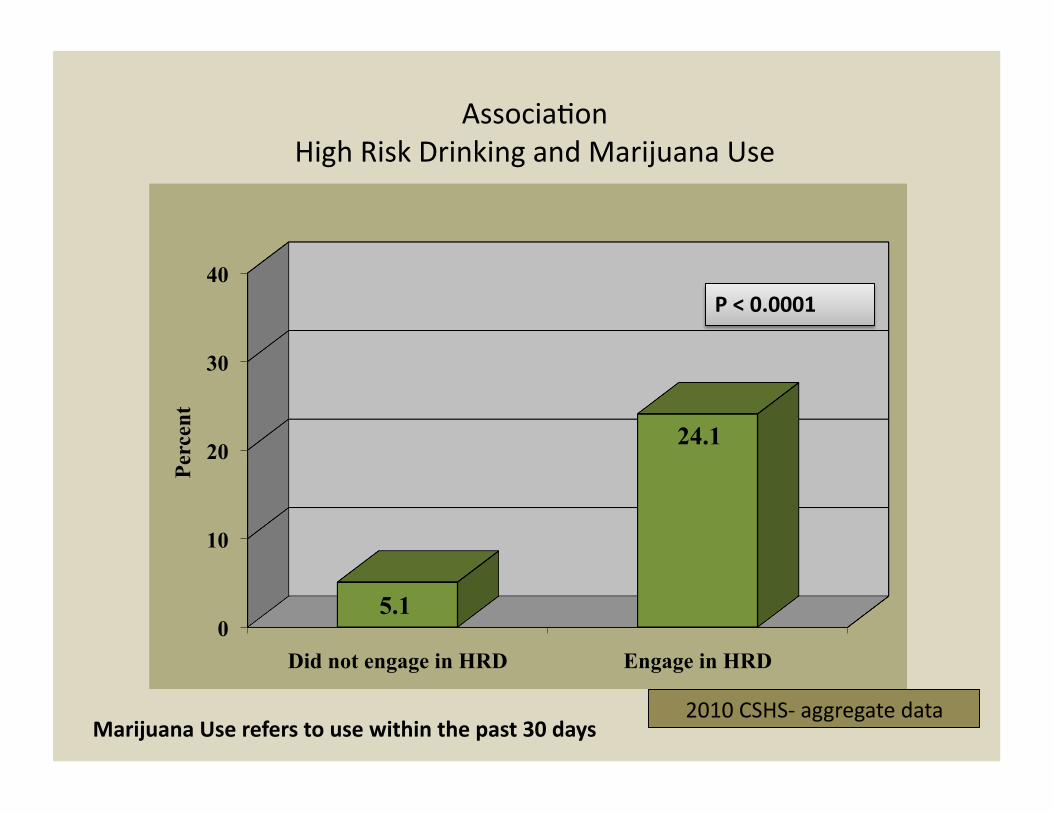
Associa3on High Risk Drinking and Marijuana Use
0
10
20
30
40
Did not engage in HRD Engage in HRD
5.1
24.1
Perc
ent
P < 0.0001
Marijuana Use refers to use within the past 30 days 2010 CSHS-‐ aggregate data
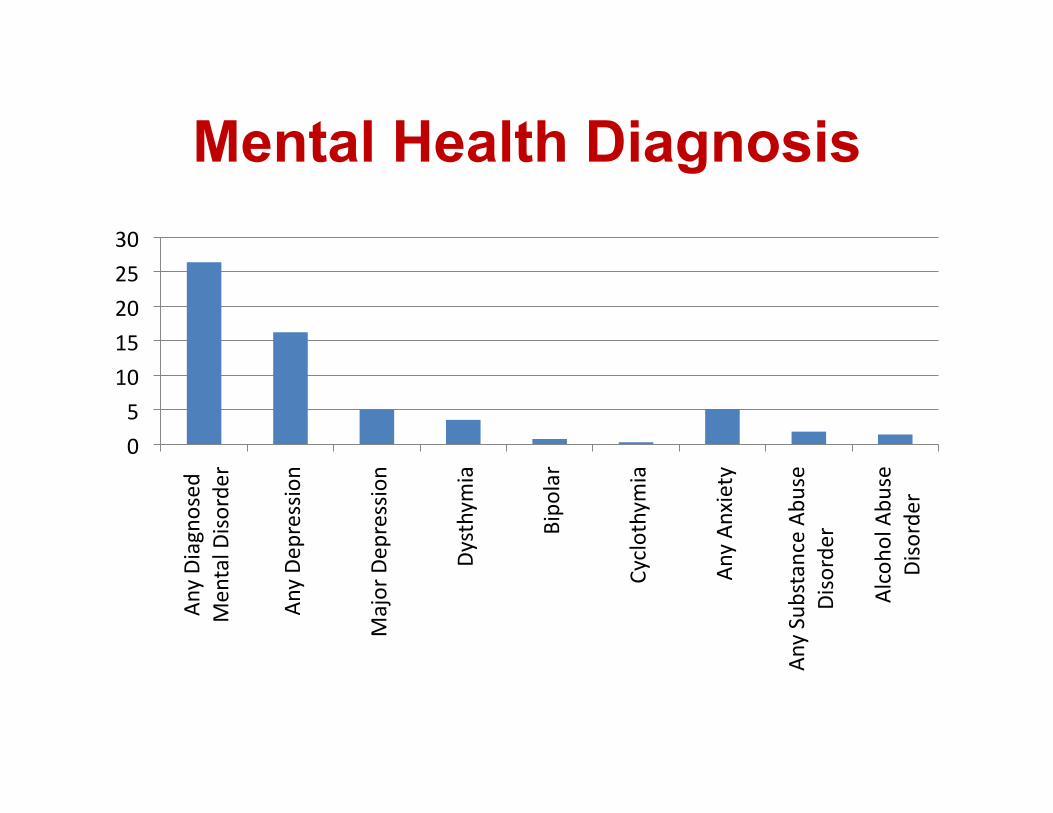
Mental Health Diagnosis
0
5
10
15
20
25
30
Any Diagnosed
Men
tal D
isorde
r
Any Dep
ression
Major Dep
ression
Dysthym
ia
Bipo
lar
Cyclothymia
Any Anxiety
Any Sub
stance Abu
se
Disorde
r
Alcoh
ol Abu
se
Disorde
r
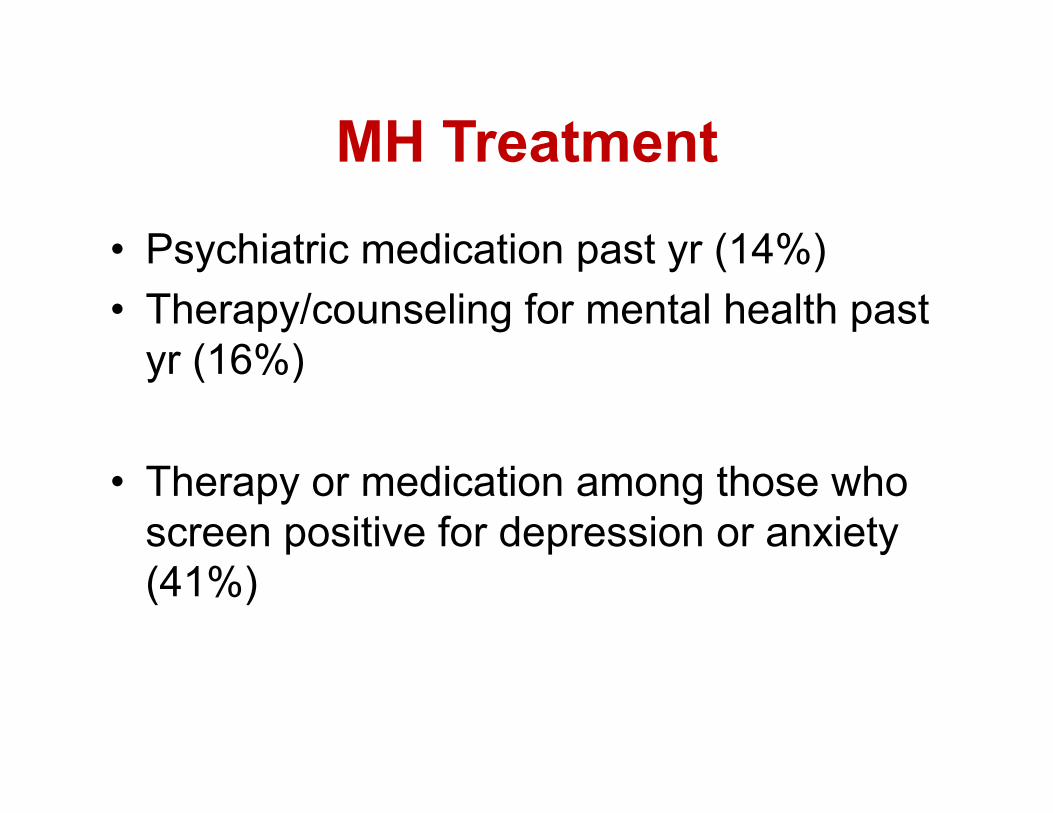
MH Treatment
• Psychiatric medication past yr (14%) • Therapy/counseling for mental health past
yr (16%)
• Therapy or medication among those who screen positive for depression or anxiety (41%)
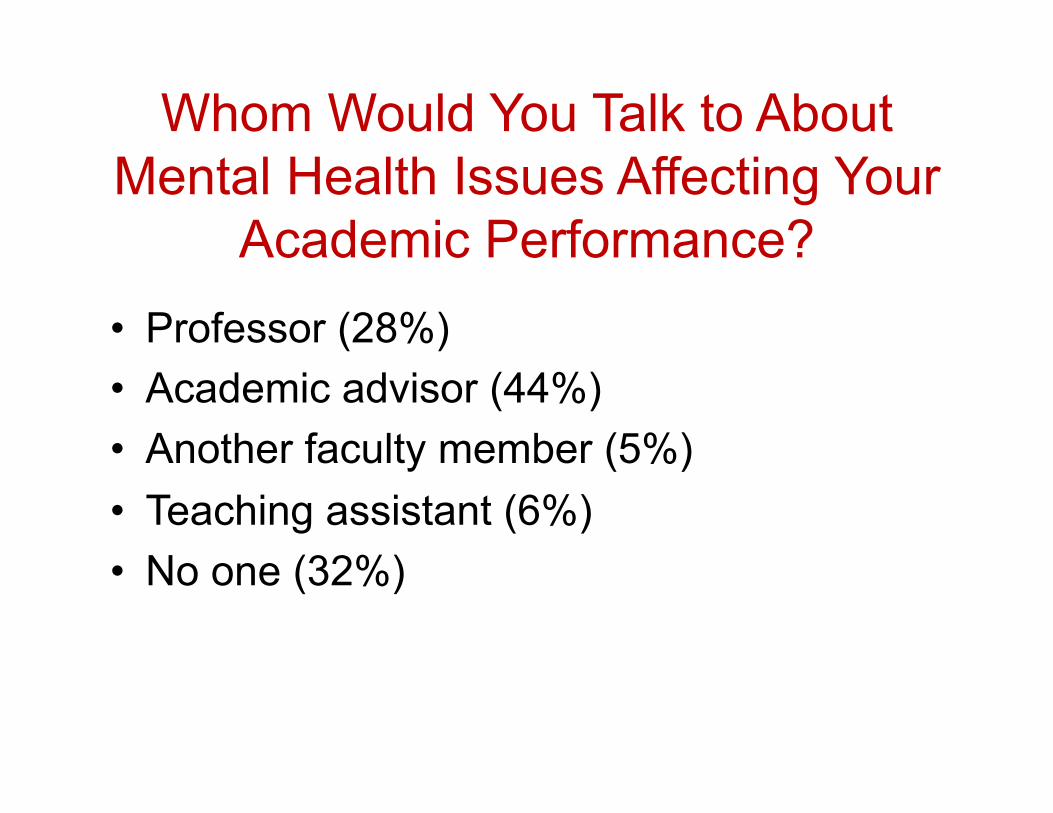
Whom Would You Talk to About Mental Health Issues Affecting Your
Academic Performance? • Professor (28%) • Academic advisor (44%) • Another faculty member (5%) • Teaching assistant (6%) • No one (32%)
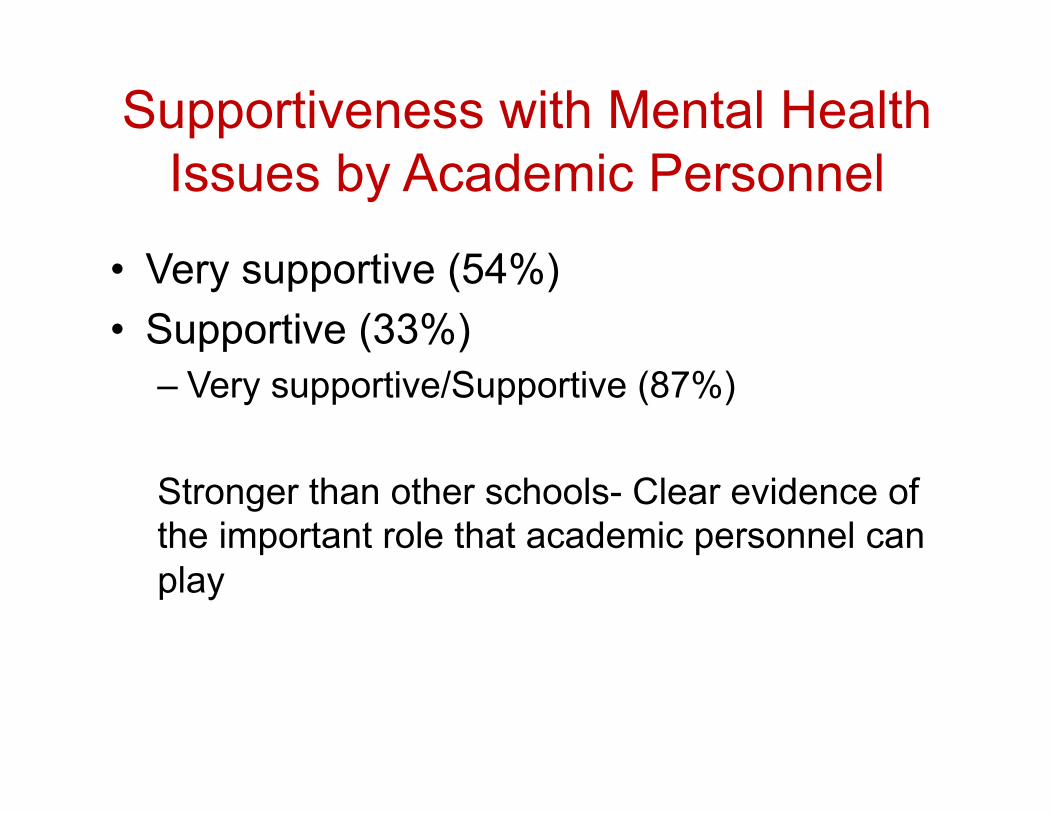
Supportiveness with Mental Health Issues by Academic Personnel
• Very supportive (54%) • Supportive (33%)
– Very supportive/Supportive (87%)
Stronger than other schools- Clear evidence of the important role that academic personnel can play
Religiosity may overlooked Students reported they are:
– Very religious (11%) – Fairly religious (28%)
Several comments about the lack of integra5on of religious beliefs in addressing mental health and
alcohol issues on-‐campus.
Finances are a concern for students that may contribute to mental health
or substance use issues Current financial situation:
– It’s a financial struggle (17%) – It’s tight, but I’m doing fine (60%)
Financial situation growing up – Very poor, not enough to get by (2%) – Enough but not many extras (31%)
Cost and 5me constraints (due to work) may impact mental health status, use and interven5on/
treatment.
Final Thoughts
• Much more to learn from analysis of data • Plans to find analytic support • Rapid response surveys • 2013 administration
Toben F. Nelson, ScD Assistant Professor Division of Epidemiology & Community Health School of Public Health hTp://umn.edu/~anelson [email protected]
QuesOons and Comments