Embed Size (px)
Citation preview
B I O C H E M I S T R Y
1788
Bergmann, M., Zervas, L., and Salzmann, L. (1933),
Blumenfeld, 0. 0, and Gallop, P. M. (1962), Biochtm-
Boedtker, H., and Doty, P. (1956), J . Am. Chem. Soc.
Bornstein, P., and Piez, K. A. (1965), Science 148, 1353. Gallop, P. M. (1955), Arch. Biochem. Biophys. 54, 486. Gallop, P. M., Seifter, S., and Meilman, E. (1959),
Hormann, H. (1960), Leder 11, 173. Lewis, M. S., and Piez, K. A. (1964), Biochemistry 3,
Ber. 66, 1288.
istry I , 947.
78,4267.
Nature 183, 1659.
1126.
1.59 21.,
Acad. Sci. 121, 494.
Lipmann, F., and Tuttle, L. C . (1945), J . Bid . Chem.
Nagai, Y., Gross, J . , and Piez, K. A. (19641, Ann. N . Y.
Piez, K. A. (1904), J . Bid . Chem. 239, PC 4315. Piez, K. A., Eigner, E. A., and Lewis, M. A. (1963),
Rosen, H. (1957), Arch. Biochem. Biophys. 67, 10. Smithies, 0. (1959), Advan. Protein Chem. 14, 65. Yphantis, D. A. (1960), Ann. N . Y. Acad. Sci. 88, 586. Yphantis, D. A. (1964), Biochemistry 3, 297.
Biochemistry 2,58 .
Alkali Metal Binding by Ethylenediaminetetraacetate, Adenosine 5'-Triphosphate, and Pyrophosphate*
Jean Botts,? Augusta Chashin, and Ho Lee Young':
ABSTRACT: From titration curves for ethylenedia- minetetraacetate (EDTA), adenosine 5'-triphosphate (ATP), and pyrophosphate (PP) in the presence of the chloride salts of Li, Na, K, Rb, or Cs, the affinity con- stants are calculated for the binding of the alkali metal ion to the last two dissociation products of the acid H4Y. Analytical expressions give correction factors
I n order to understand the metal ion dependence of enzyme activity for an enzyme such as myosin ATPase,' it is important to know the affinities of the metal ions for the various reactants in the system. Under appropriate conditions, the ATPase activity of myosin in the presence of KCl or RbCl can be considerably enhanced by the addition of a modifier such as EDTA or PP. The enhancement with EDTA has been attributed to its ability to combine with the inhibiting ion, MgZ+ (Friess, 1954; Friess et af., 1954; Offer, 1964). However, se- questering of MgP+ would seem not to be the sole basis for activation, at least with PP, since PP can actually intensify the inhibition brought about by addition of a small amount of Mg2+. Since activation
-
* From the Cardiovascular Research Institute, University of California Medical Center, San Francisco. Received March 24, 1965; revised June 8, 1965. Supported by a U.S. Public Health Service grant (HE-06285).
t Research Career Development Awardee, U.S. Public Health Service.
$ Fellow of the San Francisco Heart Association. Present address: Exobiology Division, National Aeronautics and Space Administration, Ames Research Center, Moffett Field, Calif.
1 Abbreviations used in this work: ATP, adenosine 5'-tri- phosphate; ATPase, adenosine triphosphatase: PP, pyrophos- phate.
applicable when measurements for the binding of one monovalent cation are made in the presence of another such cation. Comparison of the affinity constants shows that EDTA is better able to distinguish among the cations in the series than is either ATP or PP. PP binds each of the cations more strongly than does ATP or EDTA.
with EDTA or PP occurs only in the presence of a specific metal ion, M+, interaction of the modifier with M+ may play a role in the activation process. In any event, it is desirable to know the state of the modifier and of the substrate in free solution for a given reaction system. From analysis of titration curves for EDTA, PP, or ATP in MCI the affinities of these substances for M+ can be calculated. For a given pH and [MI, it then is possible to find the extent to which the substrate and the modifier are combined with the metal ion.
Reactions between the tetravalent compound (EDTA, PP, or ATP) and a monovalent cation (H+ and Li+, Na+, K+, Rbf, or Cs+) were analyzed in accordance with the following equilibrium scheme:
where Y represents the tetravalent compound, and H and M are the hydrogen and monovalent metal atoms. Here K3, K4, and K g are dissociation constants whereas K5, K7, and KQ are stability constants. (Titration curves did
J E A N B O T T S , A U G U S T A ( ' H A S H I N , A N D H O I . E E Y O U N G
V O L . 4, N O . 9, S F P T F M R E R 1 9 6 5
not include the pH range for the first two dissociations of H4Y.) The theoretical analysis for scheme (l), exclusive of the reaction governed by Kg. has been presented elsewhere (Botts, 1964). The analysis has also been shown to apply to any successive pair of dissocia- tions of an n-valent acid provided there is no overlap with other neighboring dissociations (Botts, 1965).
From each titration curve for Y in a given salt solu- tion, the titration curve for the same concentration of salt alone can be subtracted for corresponding pH values. The resulting “difference curve” (pH versus net concentration of added base) has three inflection points (pH, < pHm < pH4) in the region of the two final acid dissociations, pH3 and pH4 lying in the buffered regions governed by K3 and Kq in scheme ( I ) and pH, being the pH value at the inflection point in the unbuffered region between pH3 and pH4. In the analysis of the basic scheme (1) the equation for the difference curve is successively differentiated; by setting the second derivative equal to zero analytical expressions for the inflection points are obtained, and it is then possible to show that the inflection points on the difference curve must be collinear and equally spaced.
When a monovalent metal ion is bound through a reaction such as that governed by K5 or K7, a shift in the difference curve occurs. In order to relate the equi- librium constants to the experimental measurements, it is useful to introduce the experimentally obtainable quantities, a and 0. It has been shown (Botts, 1964) that, when the inflection points are not too close together,
and when Kg = 0,
O I 2
Equivalents of Base
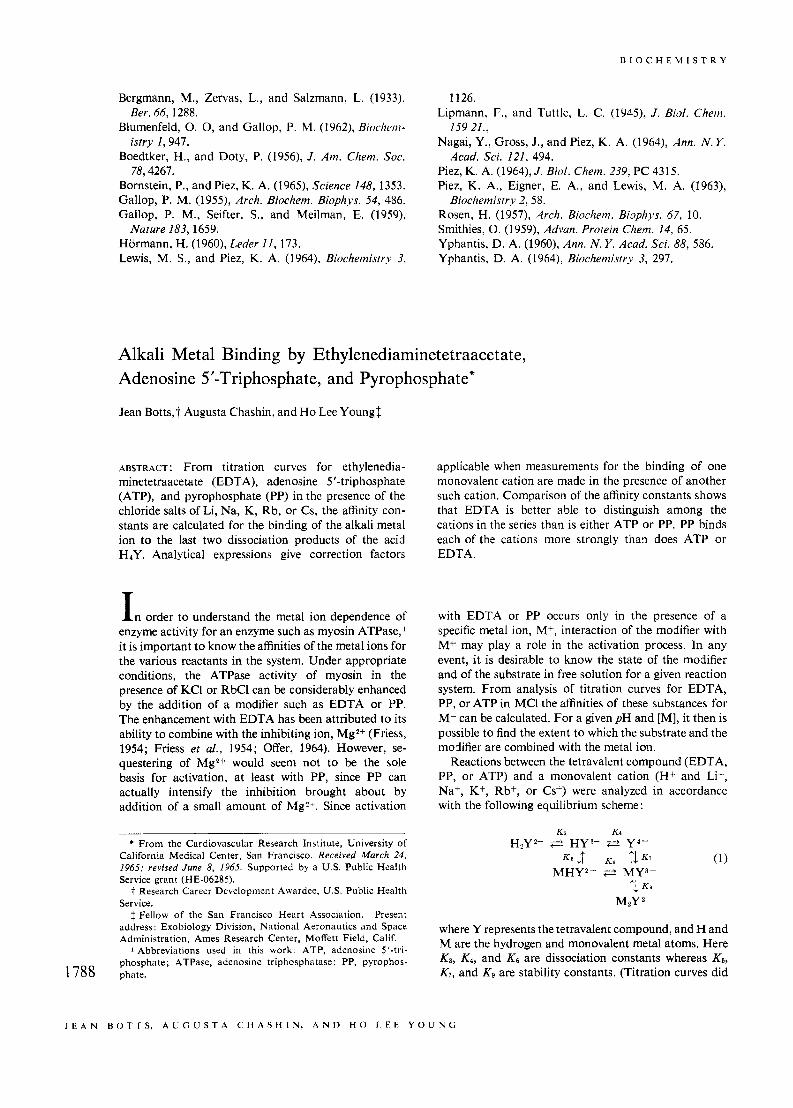
FIGURE 1: Difference curves for 1 mM EDTA in 0.2 M
CsCl or 0.2 M LiCl at 2 5 ” .
difficult to estimate accurately. However, when the two dissociating groups do not overlap, the inflection points at pH3 and pH4 are identical with the “midpoints of titration” at pH3* and pH4*. Under these conditions, a can be conveniently evaluated from the hydrogen ion concentration, [H3*], corresponding to the pH for which half of the third acid dissociation has taken place. When there is significant overlap between the dissociat- ing groups, [Ha] < a < [H3*], Le., the experimental quantity related to the equilibrium constants is neither the inflection point nor the midpoint of titration but rather a point in between these two. In this case, a can be evaluated in terms of the slope of the difference curve at the intermediate inflection point, ( d y / d ~ ) ~ ;
where [H3], [Hm], and [H4] are the hydrogen ion con- centrations corresponding to the three inflection points of the difference curve and K3‘, K4‘, K5‘, and K7‘ are the apparent equilibrium constants corresponding to the equilibrium constants identified in scheme (1).
In all of the analyses discussed in this paper, /3 is obtained as the square of the hydrogen ion concentra- tion corresponding to the intermediate inflection point of the difference curve. Because the inflection points are collinear and equally spaced, p H , is readily found by applying a ruled straight-edge to the difference curve in a simple trial-and-error approach (Botts, 1964). By this technique a whole family of lines can be obtained which intersect the titration curve at three equally spaced, collinear points in the region of the three in- flection points; but, in practice, all these lines pass through the same intermediate intersection point so that pH, is evaluated without ambiguity. Two different methods can be used to find a. As indicated in equation (2), a is approximately equal to [Ha] when the inflection points are well separated, Le., when there is essentially no overlap in the titration of the two dissociating groups; but, in practice, these inflection points are
where [Yo] is the total concentration of the substance being titrated, y is the pH, and x is the net concentration of added base (Botts, 1964).
When [Yo] is not known accurately, it can, in princi- ple, be calculated either by measuring the moles of base necessary to titrate one dissociating group of the acid or by measuring the slope of the difference curve in the region of maximum buffering for one isolated dissociation. In the analysis of the difference curves discussed here, the first method was used; it gave somewhat more consistent results and slightly higher values of [Yo].
In summary, from each difference curve a value is found for a and for 0. Throughout this paper it will be assumed that 0 is found experimentally as [H,]* and that a is evaluated either as [Ha*] or by means of equa- tion (4), depending on whether the dissociating groups overlap. The interpretation of a and 0 in terms of equilibrium constants will necessarily depend upon the reaction scheme applied, however. For example, when K9 cannot be neglected, another term must be added to the right-hand side of equation (3), as discussed here. 1789
A I K A l I h l F T A 1 I P I N I ~ I N C i R Y E D T A , A T P , A N D P Y R O P H O S P H A T F
B I O C H E M I S T R Y
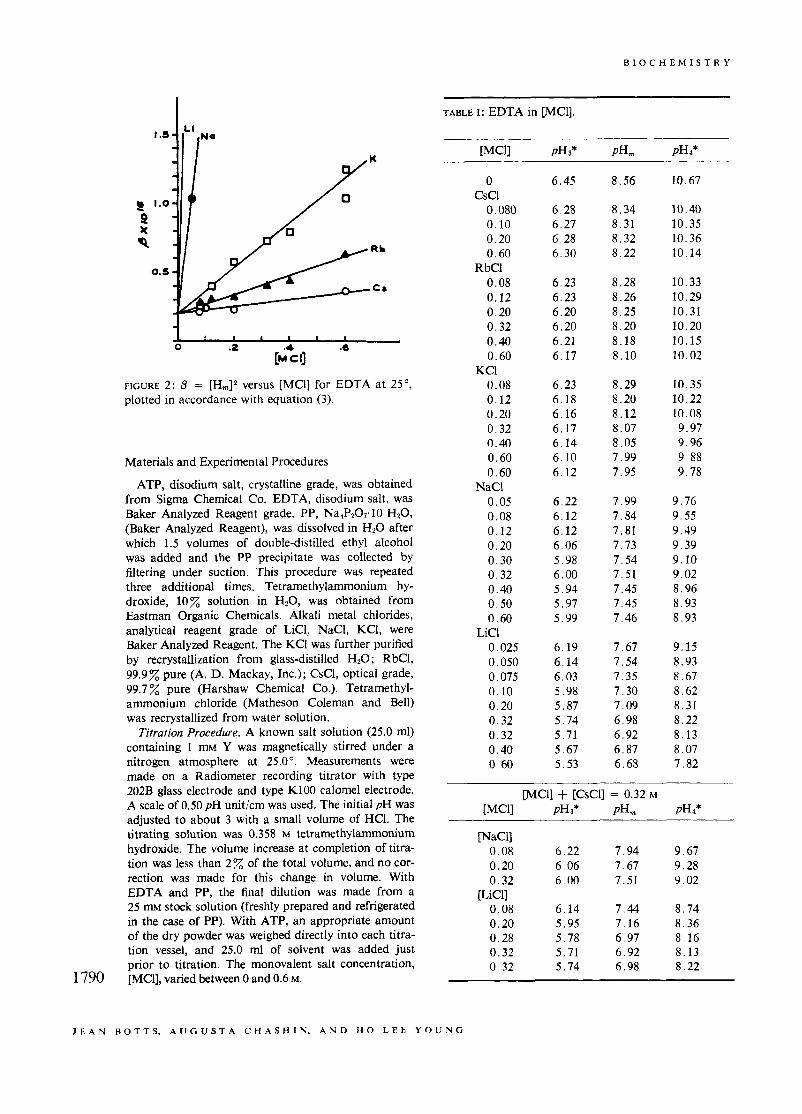
FIGURE 2: /3 = [Hm12 versus [MCl] for EDTA at 25", plotted in accordance with equation (3).
Materials and Experimental Procedures
ATP, disodium salt, crystalline grade, was obtained from Sigma Chemical Co. EDTA, disodium salt, was Baker Analyzed Reagent grade. PP, NaaP,0,.10 HzO, (Baker Analyzed Reagent), was dissolved in H 2 0 after which 1.5 volumes of double-distilled ethyl alcohol was added and the PP precipitate was collected by filtering under suction. This procedure was repeated three additional times. Tetramethylammonium hy- droxide, 10% solution in H 2 0 , was obtained from Eastman Organic Chemicals. Alkali metal chlorides, analytical reagent grade of LiCl, NaCl, KCl, were Baker Analyzed Reagent. The KCI was further purified by recrystallization from glass-distilled H20; RbCl, 99.9% pure (A. D. Mackay, Inc.); CsCI, optical grade, 99.7 pure (Harshaw Chemical Co.). Tetramethyl- ammonium chloride (Matheson Coleman and Bell) was recrystallized from water solution.
Titration Procedure. A known salt solution (25.0 ml) containing 1 mM Y was magnetically stirred under a nitrogen atmosphere at 25.0". Measurements were made on a Radiometer recording titrator with type 202B glass electrode and type KlOO calomel electrode. A scale of 0.50 pH unit/cm was used. The initial pH was adjusted to about 3 with a small volume of HCI. The titrating solution was 0.358 M tetramethylammonium hydroxide. The volume increase at completion of titra- tion was less than 2 z of the total volume, and no cor- rection was made for this change in volume. With EDTA and PP, the final dilution was made from a 25 rn stock solution (freshly prepared and refrigerated in the case of PP). With ATP, an appropriate amount of the dry powder was weighed directly into each titra- tion vessel, and 25.0 ml of solvent was added just prior to titration. The monovalent salt concentration, [MCI], vaned between 0 and 0.6 M. 1790
TABLE I: EDTA in [MCl].
0 CSCl
0,080 0.10 0.20 0.60
0.08 0.12 0.20 0.32 0.40 0.60
0.08 0.12 0.20 0.32 0.40 0.60 0.60
0.05 0.08 0.12 0.20 0.30 0.32 0.40 0.50 0.60
0.025 0.050 0.075 0.10 0.20 0.32 0.32 0.40 0.60
RbCl
KCI
NaCl
LiCl
6.45 8.56 10.67
6.28 8.34 10.40 6.27 8.31 10.35 6.28 8.32 10.36 6.30 8.22 10.14
6.23 8.28 10.33 6.23 8.26 10.29 6.20 8.25 10.31 6.20 8.20 10.20 6.21 8.18 10.15 6.17 8.10 10.02
6.23 8.29 10.35 6.18 8.20 10.22 6.16 8.12 10.08 6.17 8.07 9.97 6.14 8.05 9.96 6.10 7.99 9.88 6.12 7.95 9.78
6.22 7.99 9.76 6.12 7.84 9.55 6.12 7.81 9.49 6.06 7.73 9.39 5.98 7.54 9.10 6.00 7.51 9.02 5.94 7.45 8.96 5.97 7.45 8.93 5.99 7.46 8.93
6.19 7.67 9.15 6.14 7.54 8.93 6.03 7.35 8.67 5.98 7.30 8.62 5.87 7.09 8.31 5.74 6.98 8.22 5.71 6.92 8.13 5.67 6.87 8.07 5.53 6.68 7.82
Wac11 0.08 0.20 0.32
0.08 0.20 0.28 0.32 0.32
[LiCl]
6.22 7.94 9.67 6.06 7.67 9.28 6.00 7.51 9.02
6.14 7.44 8.74 5.95 7.16 8.36 5.78 6.97 8.16 5.71 6.92 8.13 5.74 6.98 8.22
J E A N B O T T S , A U G U S T A C H A S H I N , A N D f l O L E E Y O I J N G
V O L . 4, N O . 9, S E P T E M B E R 1 9 6 5
' O r
a.
I 1 I I I I I
0 .2 .4 6
[M c0
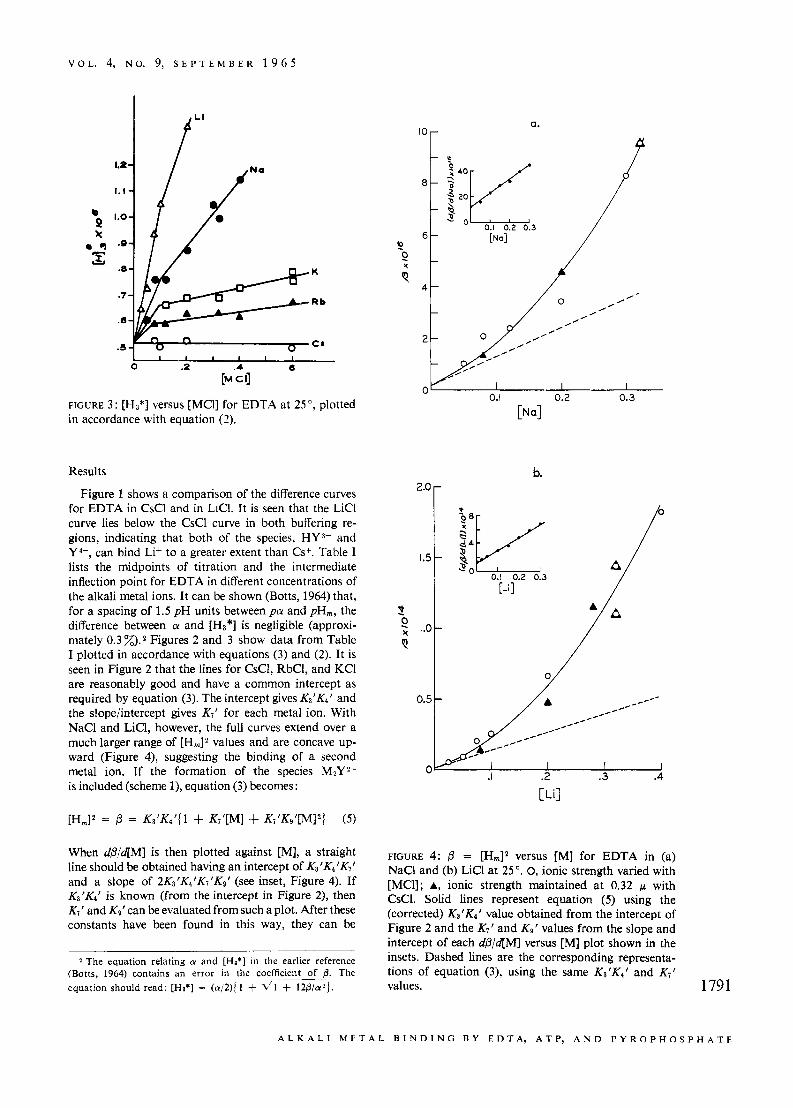
FIGURE 3 : [H3*] versus [MCI] for EDTA at 25 ", plotted in accordance with equation (2).
Results
Figure 1 shows a comparison of the difference curves for EDTA in CsCl and in LiCI. It is seen that the LiCl curve lies below the CsCl curve in both buffering re- gions, indicating that both of the species, HY3- and Y 4--, can bind Li+ to a greater extent than Csf. Table I lists the midpoints of titration and the intermediate inflection point for EDTA in different concentrations of the alkali metal ions. It can be shown (Botts, 1964) that, for a spacing of 1.5 pH units between pa and pH,, the difference between a and [H3*] is negligible (approxi- mately 0.3 z). Figures 2 and 3 show data from Table I plotted in accordance with equations (3) and (2). It is seen in Figure 2 that the lines for CsCl, RbCl, and KCI are reasonably good and have a common intercept as required by equation (3). The intercept gives K3'K4' and the slope/intercept gives K7' for each metal ion. With NaCl and LiC1, however, the full curves extend over a much larger range of [H,I2 values and are concave up- ward (Figure 4), suggesting the binding of a second metal ion. If the formation of the species M2Y2- is included (scheme l), equation (3) becomes:
[H,]* = fi = K3'K4'( 1 + K;'[M] + K;'Ks'[MI2) (5 )
When dfi/d[M] is then plotted against [MI, a straight line should be obtained having an intercept of K3'K4'K7' and a slope of 2K3'K4'K?'Kg' (see inset, Figure 4). If K3'K4' is known (from the intercept in Figure 2), then K7' and Kg' can be evaluated from such a plot. After these constants have been found in this way, they can be
2 The equation relating a and [Ha*] in the earlier reference (Botts, 1964) contains an error in the coefficient of B. The equation should read: [Ha'] = (a/2){ 1 f 41 4- 12P/az).
? 0
Q. A t
b.
2.0 r
P
0.5 -
FIGURE 4: p = [HJ2 versus [MI for EDTA in (a) NaCl and (b) LiCl at 25 '. 0, ionic strength varied with [MCl]; A, ionic strength maintained at 0.32 p with CsC1. Solid lines represent equation ( 5 ) using the (corrected) Ka'K4' value obtained from the intercept of Figure 2 and the K?' and Kg' values from the slope and intercept of each dfi/d[M] versus [MI plot shown in the insets. Dashed lines are the corresponding representa- tions of equation (3), using the same K3'K4' and K7' values. 1791
A L K A L I M F T A L B I N D I N G R Y E D T A , A T P , A N D P Y R O P H O S P M A T F
B I O C H E M I S T R Y
substituted into equation (5). The curve representing equation (5) for each metal can then be drawn as il- lustrated in Figure 4.
In Figure 4, a comparison is made of the data in which the ionic strength is maintained at 0.32 p with CsCl (i.e,, [MCI] + [CsCl] = 0.32 M) and that in which [MCl] is varied in the absence of CsCI. (Although the nonzero slope of the CsCl curve in Figure 2 indicates that Cs itself may be weakly bound to the Y 4- form of EDTA, a salt such as tetramethylammonium chloride was not used to furnish an “indifferent” cation because tetramethylammonium chloride is often found to con- tain impurities even after recrystallization.) Maintaining the ionic strength seems to make little difference in the appearance of these curves.
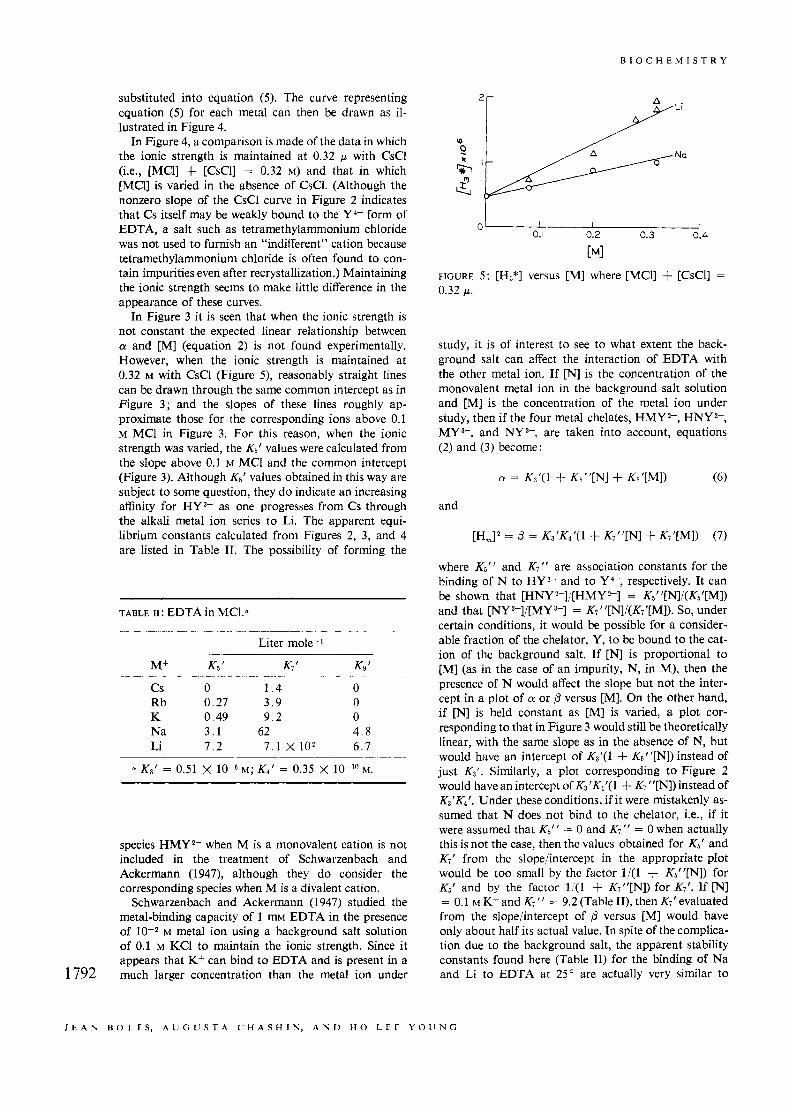
In Figure 3 it is seen that when the ionic strength is not constant the expected linear relationship between a and [MI (equation 2) is not found experimentally. However, when the ionic strength is maintained at 0.32 M with CsCl (Figure 5) , reasonably straight lines can be drawn through the same common intercept as in Figure 3; and the slopes of these lines roughly ap- proximate those for the corresponding ions above 0.1 M MC1 in Figure 3. For this reason, when the ionic strength was varied, the K5’ values were calculated from the slope above 0.1 M MCI and the common intercept (Figure 3). Although K5’ values obtained in this way are subject to some question, they do indicate an increasing affinity for HY 3- as one progresses from Cs through the alkali metal ion series to Li. The apparent equi- librium constants calculated from Figures 2, 3, and 4 are listed in Table 11. The possibility of forming the
TABLE 11: EDTA in MCI:
Liter mole-’
c s 0 1 . 4 0 Rb 0.27 3.9 0 K 0.49 9 .2 0 Na 3.1 62 4 . 8 Li 1 . 2 7 .1 X lo2 6.7
species HMY2- when M is a monovalent cation is not included in the treatment of Schwarzenbach and Ackermann (1947), although they do consider the corresponding species when M is a divalent cation.
Schwarzenbach and Ackermann (1 947) studied the metal-binding capacity of 1 mM EDTA in the presence of 10-2 M metal ion using a background salt solution of 0.1 M KCI to maintain the ionic strength. Since it appears that K+ can bind to EDTA and is present in a much larger concentration than the metal ion under 1792
0 ’ I I I I 0.1 0.2 0.3 0.4
[MI
FIGURE 5: [H3*] versus [MI where [MCI] + [CsCI] = 0.32 p.
study, it is of interest to see to what extent the back- ground salt can affect the interaction of EDTA with the other metal ion. If [N] is the concentration of the monovalent metal ion in the background salt solution and [MI is the concentration of the metal ion under study, then if the four metal chelates, HMY 2--, HNY *--, MY3-, and NY3-, are taken into account, equations (2) and (3) become:
and
where K6’’ and K7“ are association constants for the binding of N to HY 3- and to Y 4--, respectively. It can be shown that [HNY2-I/[HMY *-I = K5”[NI/(K5’[MI) and that [NY 3-]/[MY3-] = Kj”[N]/(K7’[M]). So, under certain conditions, it would be possible for a consider- able fraction of the chelator, Y, to be bound to the cat- ion of the background salt. If N is proportional to [MI (as in the case of an impurity, N, in M), then the presence of N would affect the slope but not the inter- cept in a plot of a or /3 versus [MI. On the other hand, if [N] is held constant as [MI is varied, a plot cor- responding to that in Figure 3 would still be theoretically linear, with the same slope as in the absence of N, but would have an intercept of K3’(l + K5”[N]) instead of just K3‘. Similarly, a plot corresponding to Figure 2 would have an intercept of K3’K4’(1 + Kj”[N]) instead of K3‘K4’. Under these conditions, if it were mistakenly as- sumed that N does not bind to the chelator, Le., if it were assumed that K5” = 0 and Kj” = 0 when actually this is not the case, then the values obtained for Ks‘ and Kj’ from the slope/intercept in the appropriate plot would be too small by the factor l / ( l + Ks”[N]) for Ks‘ and by the factor l / ( l + K,”[N]) for IC,‘. If [N] = 0.1 M K+ and Kj” = 9.2 (Table II), then Kit evaluated from the slope/intercept of /3 versus [MI would have only about half its actual value. In spite of the complica- tion due to the background salt, the apparent stability constants found here (Table 11) for the binding of Na and Li to EDTA at 25” are actually very similar to
J E A N B O T T S , A L I G U S T A ( ’ H A S H I N , A N D H O L E I - Y O L I N G
V O L . 4, N O . 9, S E P T E M B E R 1 9 6 5
TABLE I I I : ATP in [MCI].
0 CSCl
0.20 0.40 0.60
0.20 0.20 0.40 0.60
0.20 0.20 0.40 0.60 0.60
0.050 0,080 0.12 0.20 0.30
0.050 0.080 0.12
RbCl
KC1
NaCl
LiCl
4.18
4.09 3.99 3.97
3.93 3.92 3.96 3.94
4.02 3.96 3.93 3.92 3.85
3.99 3.99 3.88 3.80 3.76
3.92 3.90 3.84
5.69
5.30 5.17 5.12
5.25 5.18 5.13 5.08
5.25 5.22 5.13 5.02 5.00
5.35 5.30 5.19 5.04 4.97
5.15 5.07 4.96
7.20
6.51 6.34 6.27
6.56 6.44 6.30 6.22
6.48 6.48 6.32 6.12 6.16
6.71 6.61 6.50 6.28 6.18
6.38 6.24 6.08
4.17
4.10 4.03 4.00
3.98 3.96 3.99 3.95
4.07 3.97 3.96 3.98 3.93
4.01 4.02 3.95 3.81 3.84
4.00 3.94 3.88
those reported by Schwarzenbach and Ackermann (1947) for a specific concentration of Na or Li in 0.1 M KC1 at 20’. This agreement may be fortuitous in part, however, since there are differences both in the experimental conditions and in the method of calculat- ing the constants.
It is seen that the presence of a relatively large amount
of an extraneous, weakly binding metal ion such as K+ can theoretically introduce a sizable error in the calculation of the apparent stability constants for a more strongly binding metal. A similar difficulty can be caused by a strongly binding cation impurity which, even in small amounts, can introduce a detectable error. For example, if [“j = 2 X 10⁻³ M Na+ (as with 10-3 M disodium EDTA) and if K7” = 62 (Table 11), then l/(l + K7”[N]) would be 0.89 and the calculated Ki’ value in MCl would be too low by this factor. The correction for the sodium present in disodium EDTA has been made in the Ki’ values listed in Table 11; for the K5’ values the correction was less than 1 and was therefore ignored.
With EDTA the two dissociating groups are, in general, so well separated that the slope at the inter- mediate inflection point is too great to be measured accurately. With ATP the spacing of the dissociating groups is somewhat closer and the slope at the inter- mediate inflection point can be readily obtained. There- fore, with ATP it is possible to express a in terms of the exact equation (4) and compare this value with [H3*] as shown in Table 111. For a spacing of more than one pH unit between pH, and pH3*, a and [H3*] should differ by less than 3% (see footnote 2). Although the observed difference is, in some cases, greater than this, the agreement of the K5’ values resulting from plots of Q
and of [H3*] versus [MI is fairly good (Table IV). There is some variation in the values due to considerable scatter of the points.
Other constants in Table IV were evaluated from Figure 6 and from plots analogous to Figure 4 by means of the procedure outlined for EDTA. It is interesting to compare these K7’ values with the cor- responding stability constants reported by Smith and Alberty (1956). In their titrations an indifferent salt was used to keep the ionic strength constant for different concentrations of M ([MCl] + [(n-C3H&NBr] = 0.2 w ) . In their analysis, both K5’ and Ks’ were tacitly as- sumed to be zero; from equation (2), if K5’ = 0, [H3]
TABLE IV: ATP in MC1:
K g ’ (liters mole-’)
(from (from M+ [H3*1) eq. 4)
(from eq. 3 or 5 )
K,’ (liters mole-’)
c s <0.5 <0.5 R b <0 .5 < O S K -0.6 -0.5 Na 5* 4b Li 7b 6b
8 10
8 8.8
49
(from Smith and
(from Alberty, eq. 8) 1956)
7 8 9 11.5
17 14.3 55 37.5
Kg ’ (liters
mole-’) (from eq. 5)
0 0 0 . 6 8 . 5 3 . 4
K8’ = 0.68 X mole 1iterr1; K 4 ‘ = 0.18 X mole liter-l. * Calculated from d[H3*]/d[M] or d~r/d[M] for
1793 [MI < 0.2 M.
A I K A I I V I T A L B I N D I N G B Y ~ D T A , A T P , A N D P Y R O P H O S P H A T E
B I O C H E M I S T R Y
l0L I / I /
I .o
O' Oll 012 013 014 015 2 6
[MCU
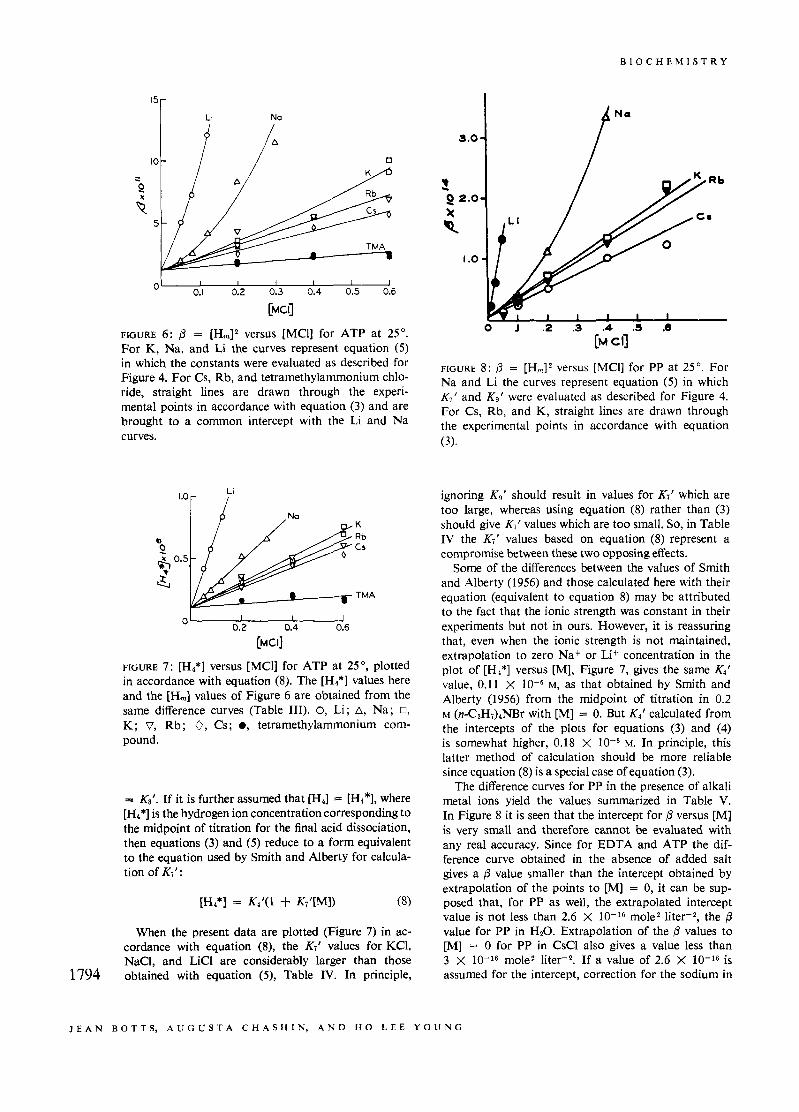
FIGURE 6 : p = [Hm12 versus [MCI] for ATP at 25". For K, Na, and Li the curves represent equation ( 5 ) in which the constants were evaluated as described for Figure 4. For Cs, Rb, and tetramethylammonium chlo- ride, straight lines are drawn through the experi- mental points in accordance with equation (3) and are brought to a common intercept with the Li and Na curves.
LI ' .Or I
0- 0.2 0.4 0.6
IMCd
FIGURE 7: [H4*] versus [MCI] for ATP at 25", plotted in accordance with equation (8). The [H4*] values here and the [Hm] values of Figure 6 are obtained from the same difference curves (Table 111). 0, Li; A, Na; 0, K; V, Rb; 0, Cs; 0, tetramethylammonium com- pound.
= K3'. If it is further assumed that [H4] = [H4*], where [H4*] is the hydrogen ion concentration corresponding to the midpoint of titration for the final acid dissociation, then equations (3) and (5) reduce to a form equivalent to the equation used by Smith and Alberty for calcula- tion of K7' :
When the present data are plotted (Figure 7) in ac- cordance with equation (8), the K7' values for KCI, NaCl, and LiCl are considerably larger than those obtained with equation (9, Table IV. In principle, 1794
FIGURE 8 : j3 = [Hm12 versus [MCl] for PP at 25". For Na and Li the curves represent equation ( 5 ) in which K7' and K9' were evaluated as described for Figure 4. For Cs, Rb, and K , straight lines are drawn through the experimental points in accordance with equation (3).
ignoring K9' should result in values for K7' which are too large, whereas using equation (8) rather than (3) should give K7' values which are too small. So, in Table IV the K7' values based on equation (8) represent a compromise between these two opposing effects.
Some of the differences between the values of Smith and Alberty (1956) and those calculated here with their equation (equivalent to equation 8) may be attributed to the fact that the ionic strength was constant in their experiments but not in ours. However, it is reassuring that, even when the ionic strength is not maintained, extrapolation to zero Na+ or Lif concentration in the plot of [H4*] versus [MI, Figure 7, gives the same K4' value, 0.11 x M, as that obtained by Smith and Alberty (1956) from the midpoint of titration in 0.2 M ( ~ z - C ~ H ~ ) ~ N B ~ with [MI = 0. But K4' calculated from the intercepts of the plots for equations (3) and (4) is somewhat higher, 0.18 X IOe6 M. In principle, this latter method of calculation should be more reliable since equation (8) is a special case of equation (3).
The difference curves for PP in the presence of alkali metal ions yield the values summarized in Table V. In Figure 8 it is seen that the intercept for p versus [MI is very small and therefore cannot be evaluated with any real accuracy. Since for EDTA and ATP the dif- ference curve obtained in the absence of added salt gives a j3 value smaller than the intercept obtained by extrapolation of the points to [MI = 0, it can be sup- posed that, for PP as well, the extrapolated intercept value is not less than 2.6 X 10-l6 mole2 l i ter2, the p value for PP in H 2 0 . Extrapolation of the j3 values to [MI = 0 for PP in CsCl also gives a value less than 3 x 10-l6 mole2 l i ter2. If a value of 2.6 X 10-l6 is assumed for the intercept, correction for the sodium in
J E A N B O T T S , A U G U S T A C H A S H I N , A N D H O L E E Y O U N G
V O L . 4, N O . 9, S E P T E M B L K 1 9 6 5
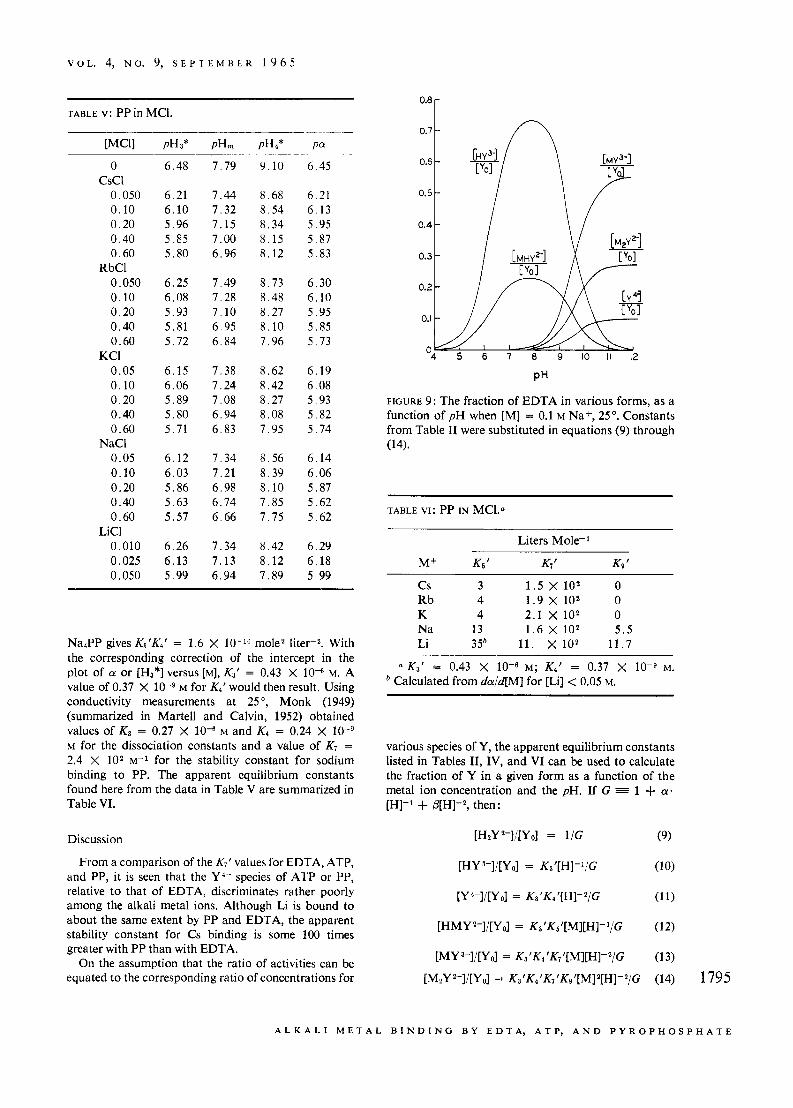
TABLE v: PP in MCI.
0 CSCl
0.050 0.10 0.20 0.40 0.60
0.050 0.10 0.20 0.40 0.60
0.05 0.10 0.20 0.40 0.60
0.05 0.10 0.20 0.40 0.60
0.010 0,025 0.050
RbCl
KCI
NaCl
LiCl
6.48
6.21 6.10 5.96 5.85 5.80
6.25 6.08 5.93 5.81 5.72
6.15 6.06 5.89 5.80 5.71
6.12 6.03 5.86 5.63 5.57
6.26 6.13 5.99
7.79
7.44 7.32 7.15 7.00 6.96
7.49 7.28 7.10 6.95 6.84
7.38 7.24 7.08 6.94 6.83
7.34 7.21 6.98 6.74 6.66
7.34 7.13 6.94
9.10
8.68 8.54 8.34 8.15 8.12
8.73 8.48 8.27 8.10 7.96
8.62 8.42 8.27 8.08 7.95
8.56 8.39 8.10 7.85 7.75
8.42 8.12 7.89
6.45
6.21 6.13 5.95 5.87 5.83
6.30 6.10 5.95 5.85 5.73
6.19 6.08 5.93 5.82 5.74
6.14 6.06 5.87 5.62 5.62
6.29 6.18 5.99
Na4PP gives K3’K4’ = 1.6 X mole2 liter-2. With the corresponding correction of the intercept in the plot of a or [Ha*] versus [MI, K3’ = 0.43 X 10” M. A value of 0.37 X M for K4’ would then result. Using conductivity measurements at 25”, Monk (1949) (summarized in Martell and Calvin, 1952) obtained values of K3 = 0.27 X 10” M and K4 = 0.24 X M for the dissociation constants and a value of K7 = 2.4 X lo2 M - ~ for the stability constant for sodium binding to PP. The apparent equilibrium constants found here from the data in Table V are summarized in Table VI.
Discussion
From a comparison of the K7’ values for EDTA, ATP, and PP, it is seen that the Y4- species of ATP or PP, relative to that of EDTA, discriminates rather poorly among the alkali metal ions. Although Li is bound to about the same extent by PP and EDTA, the apparent stability constant for Cs binding is some 100 times greater with PP than with EDTA.
On the assumption that the ratio of activities can be equated to the corresponding ratio of concentrations for
0.8 -
0.7 -
0.6 -
0.5 -
0.4 -
0.3 -
0.2 -
0.1 -
PH
FIGURE 9: The fraction of EDTA in various forms, as a function of pH when [MI = 0.1 M Na+, 25’. Constants from Table I1 were substituted in equations (9) through (14).
TABLE VI: PP IN MCl:
Liters Mole-’
c s 3 1 . 5 X l o 2 0 Rb 4 1 . 9 X 10² 0 K 4 2.1 x 10² 0 Na 13 1 . 6 X lo2 5.5 Li 35b 11. X 102 11.7
a K3’ = 0.43 X M; K4’ = 0.37 X M.
Calculated from da/d[M] for [Li] < 0.05 M.
various species of Y, the apparent equilibrium constants listed in Tables 11, IV, and VI can be used to calculate the fraction of Y in a given form as a function of the metal ion concentration and the pH. If G 1 + a. [HI-’ + @[HI+, then:
[H,Y2-1/[Yo1 = 1/G (9)
[HY 3-]/[Yo] = K3’[H]-’/G (1 0)
[Y4-I/[Yol = K3‘K4‘[H]-’/G (1 1)
[HMY2-]/[Ya] = K3’K5’[M][H]-’/G (12)
[MY”]/[Yo] = K3’Kq’K7’[M][H]-2/G (13)
[M?Y2-]/[Yo] = K~‘Kq’K7’K~’[M]2[H]-2/G (14) 1795
A L K A L I M E T A L B I N D I N G B Y E D T A , A T P , A N D P Y R O P H O S P H A T E
B 1 0 C H E M I Y 'r K Y
Figure I) gives examples of such calculations, useful for References enzymological applications.
In summary, titration curves for EDTA, ATP, and PP in the presence of alkali metal ion, M, have been analyzed in terms of a scheme which allows for binding of metal ions to give the species HMY *-, MY 3-, and MzY2-, where Y represents the compound being ti- trated. The apparent stability constants for metal bind- ing are tabulated and can be used to calculate the frac- tion of Y in each of its various forms as a function of [MI and pH.
Botts, J. (1964), J. Phys. Chem. 68, 640. Botts, J. (1965), in Molecular Biology of Muscular Con-
traction, Ebashi, s., ed., Tokyo, Igaku-shoin (in press). Friess, E. T. (1954), Arch. Biochem. Biophys. 51, 17. Friess, E. T., Morales, M. F., and Bowen, W. J. (1954),
Arch. Biochem. Biophys. 53, 311. Martell, A. E., and Calvin, M. (1952), Chemistry of
Metal Chelate Compounds, New York, Prentice- Hall.
Monk, J. (1949), J. Am. Chem. SOC. 71,423. Offer, G. W. (1964), Biochim. Biophys. Acta 89, 566. Scnwarzenbach, G., and Ackermann, H. (1947), Helv.
Smith, R. M., and Alberty, R. A. (1956), J . Phys. Chem.
Acknowledgments
The authors are grateful to Drs. Gunther Eichhorn and Manuel Morales for their helpful suggestioris in the preparation of this manuscript. 60,180.
Chim. Acta 30, 1798.
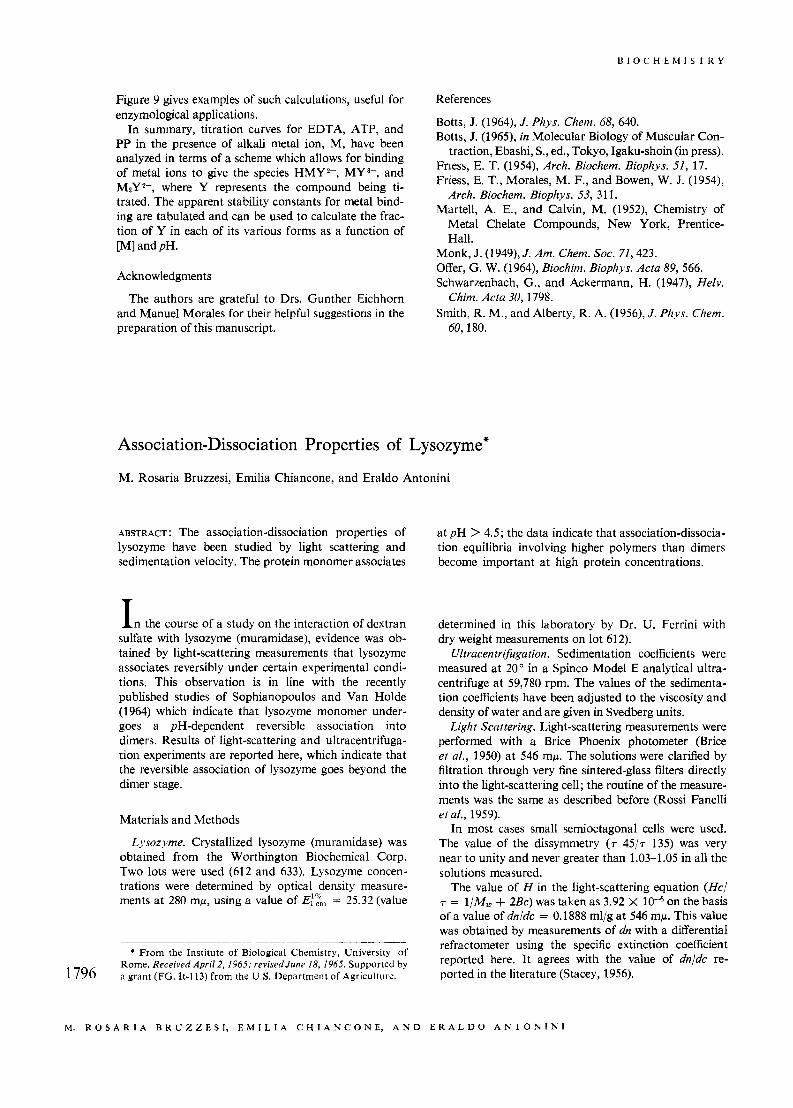
Association-Dissociation Properties of Lysozyme*
M. Rosaria Bruzzesi, Emilia Chiancone, and Eraldo Antonini
ABSTRACT: The association-dissociation properties of lysozyme have been studied by light scattering and sedimentation velocity. The protein monomer associates
I n the course of a study on the interaction of dextran sulfate with lysozyme (muramidase), evidence was ob- tained by light-scattering measurements that lysozyme associates reversibly under certain experimental condi- tions. This observation is in line with the recently published studies of Sophianopoulos and Van Holde (1964) which indicate that lysozyme monomer under- goes a pH-dependent reversible association into dimers. Results of light-scattering and ultracentrifuga- tion experiments are reported here, which indicate that the reversible association of lysozyme goes beyond the dimer stage.
Materials and Methods
Lysozyme. Crystallized lysozyme (muramidase) was obtained from the Worthington Biochemical Corp. Two lots were used (612 and 633). Lysozyme concen- trations were determined by optical density measure- ments a t 280 mp, using a value of = 25.32 (value
* From the Institute of Biological Chemistry, University of Rome. Received April 2, 1965; revisedJirne 18, 1965. Supported by a grant (FG. It-1 13) from the U.S. Department of Agriculture. 1 796
at pH > 4.5; the data indicate that association-dissocia- tion equilibria involving higher polymers than dimers become important a t high protein concentrations.
determined in this laboratory by Dr. U. Ferrini with dry weight measurements on lot 612).
Ultracentrifugation. Sedimentation coefficients were measured at 20" in a Spinco Model E analytical ultra- centrifuge at 59,780 rpm. The values of the sedimenta- tion coefficients have been adjusted to the viscosity and density of water and are given in Svedberg units.
Light Scattering. Light-scattering measurements were performed with a Brice Phoenix photometer (Brice et af., 1950) a t 546 mp. The solutions were clarified by filtration through very fine sintered-glass filters directly into the light-scattering cell; the routine of the measure- ments was the same as described before (Rossi Fanelli et a/., 1959).
In most cases small semioctagonal cells were used. The value of the dissymmetry ( r 45/r 135) was very near to unity and never greater than 1.03-1.05 in all the solutions measured.
The value of H in the light-scattering equation (Hc/ T = 1/M, + 2Bc) was taken as 3.92 X on the basis of a value of dnjdc = 0.1888 ml/g at 546 mp. This value was obtained by measurements of dn with a differential refractometer using the specific extinction coefficient reported here. It agrees with the value of dn/dc re- ported in the literature (Stacey, 1956).
M. R O S A R I A B R U Z Z E S I , E M I L I A C H I A N C O N E , A N D E R A L D O A N T O N I N I


![Triphosphate Tunnel Metalloenzyme Function in Senescence ... · Triphosphate Tunnel Metalloenzyme Function in Senescence Highlights a Biological Diversification of This Protein Superfamily1[OPEN]](https://img.pdfslide.net/doc/110x75/5e1eadbfbc21573d060be539/triphosphate-tunnel-metalloenzyme-function-in-senescence-triphosphate-tunnel.jpg)