Embed Size (px)
Citation preview
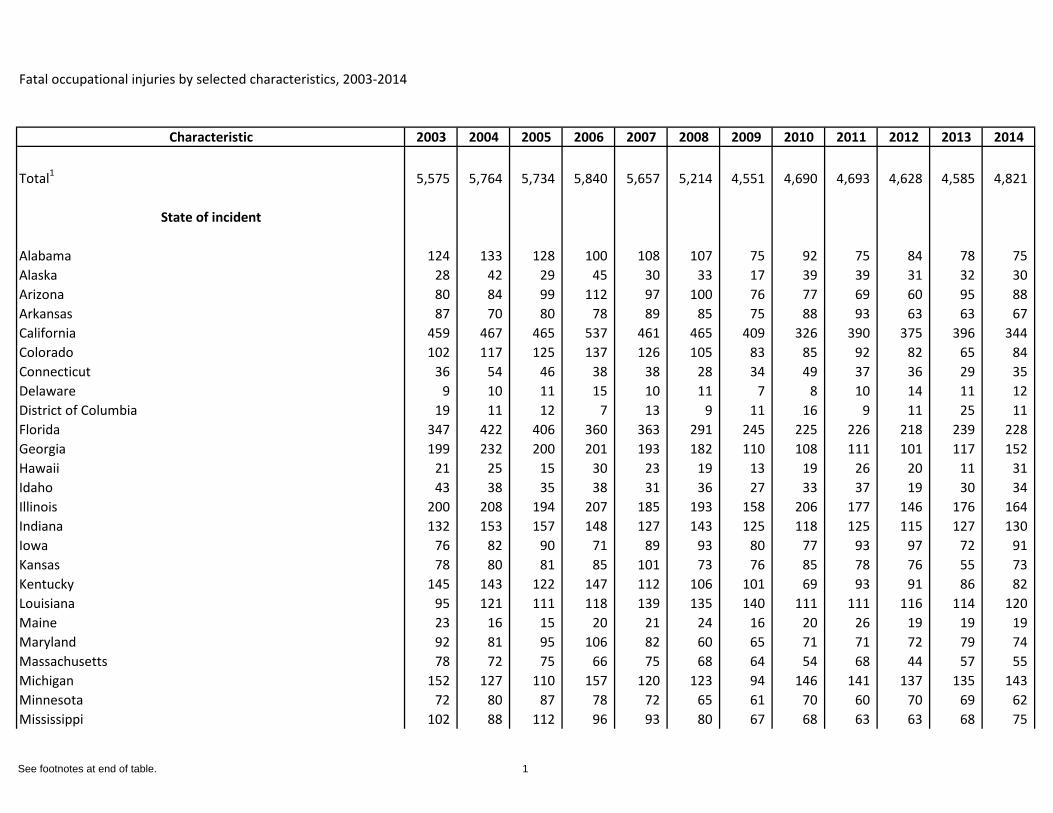
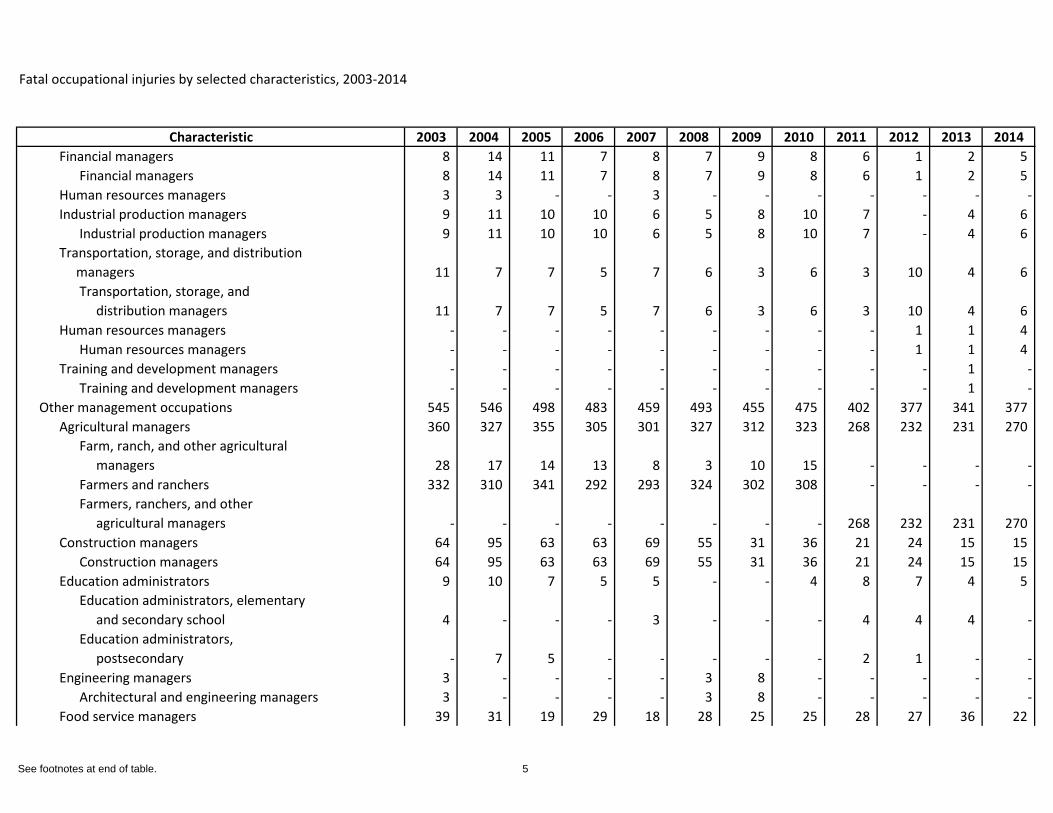
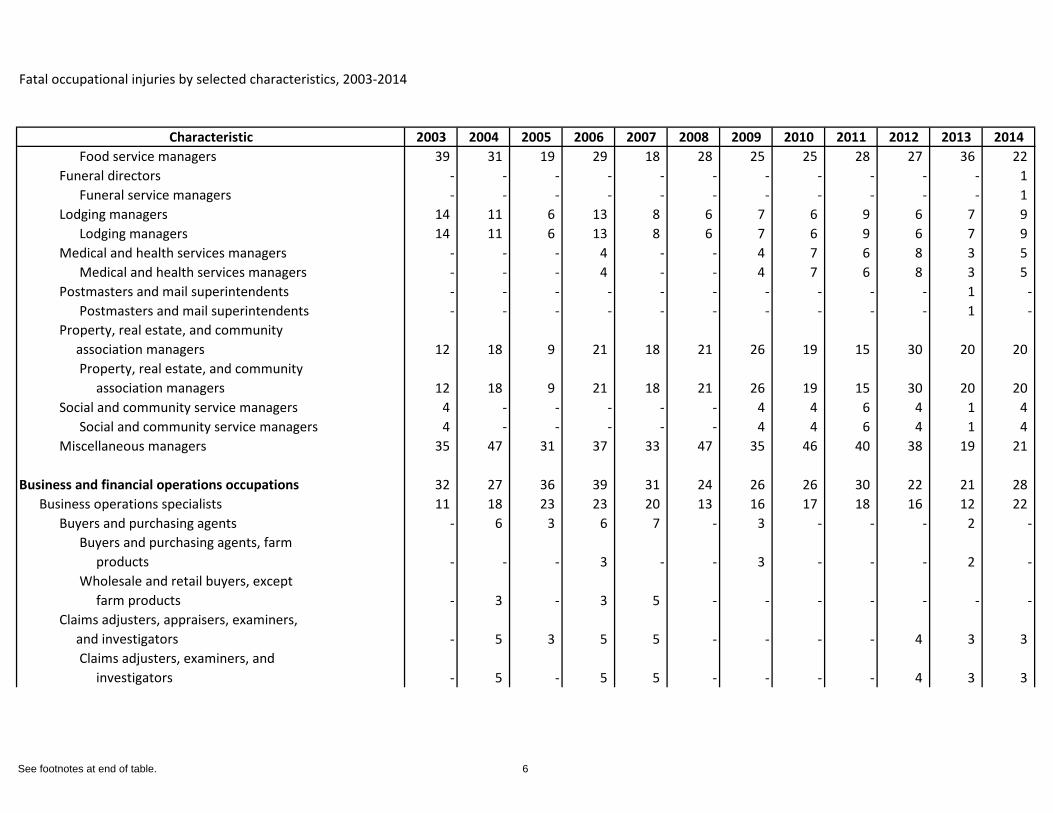
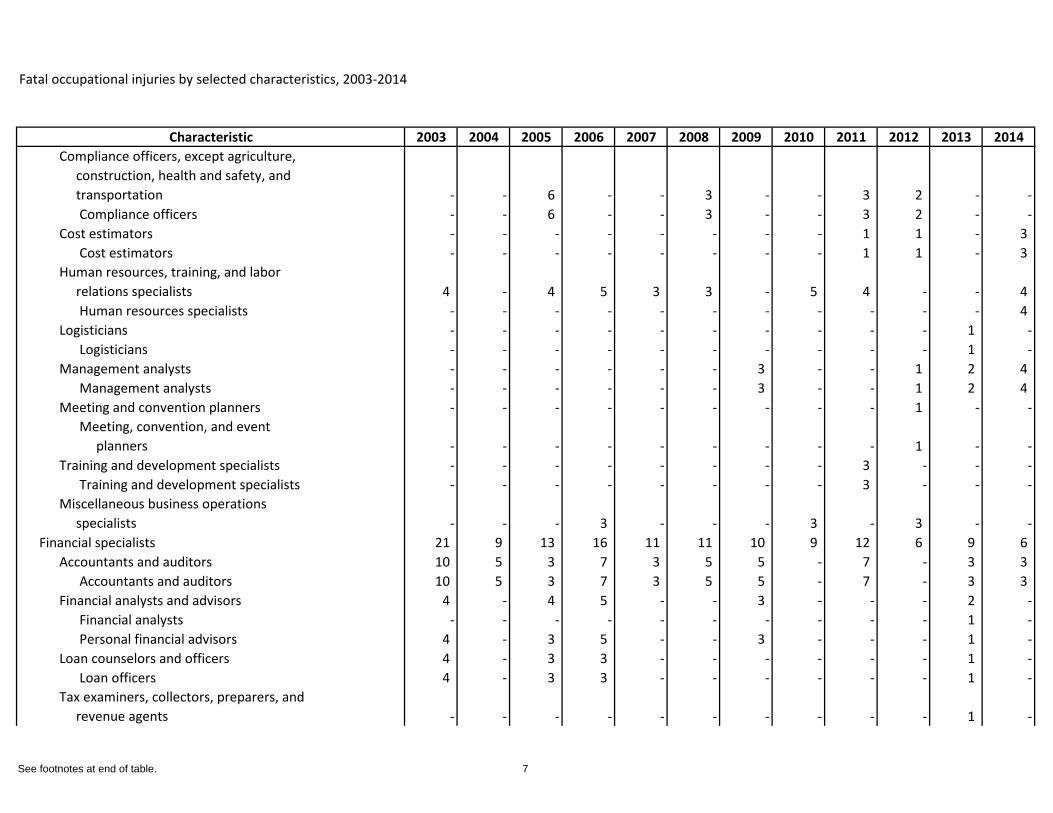
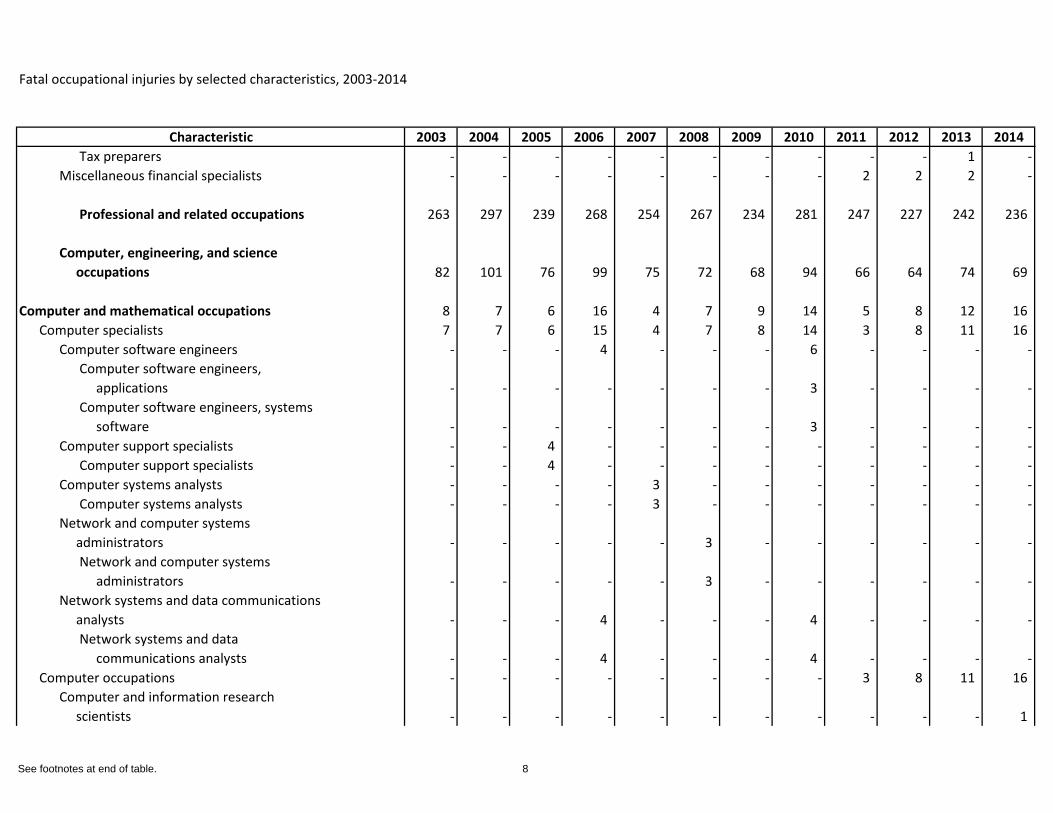
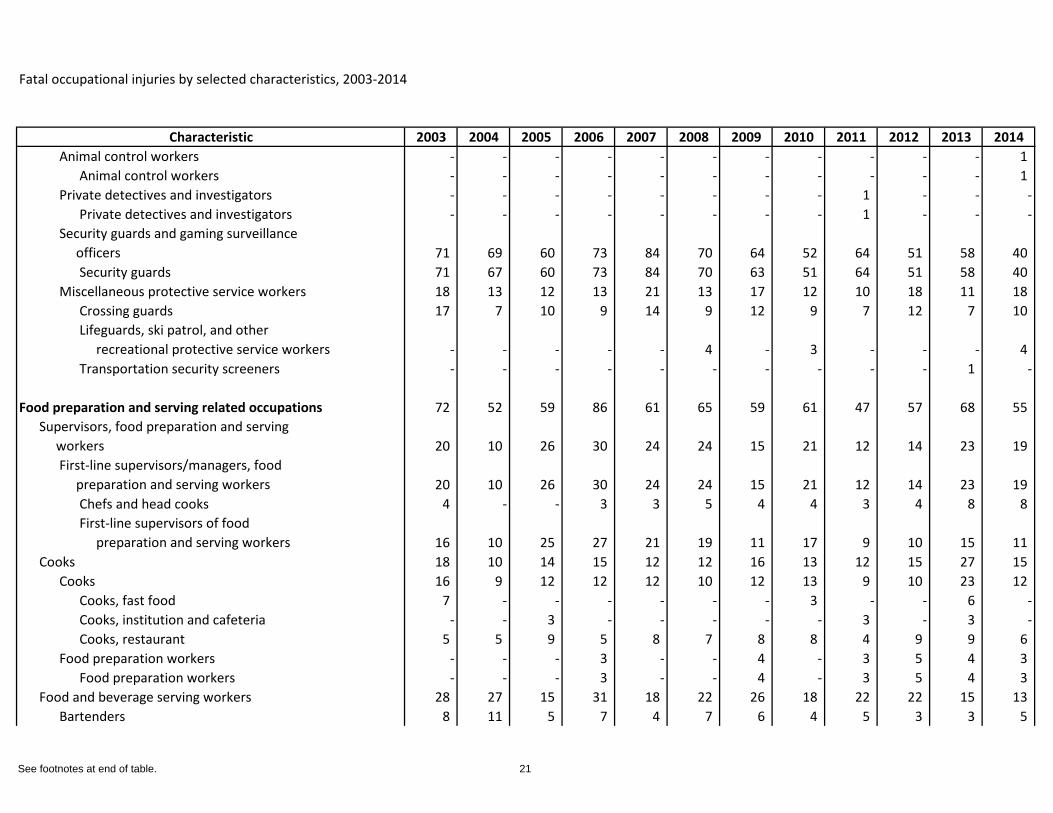
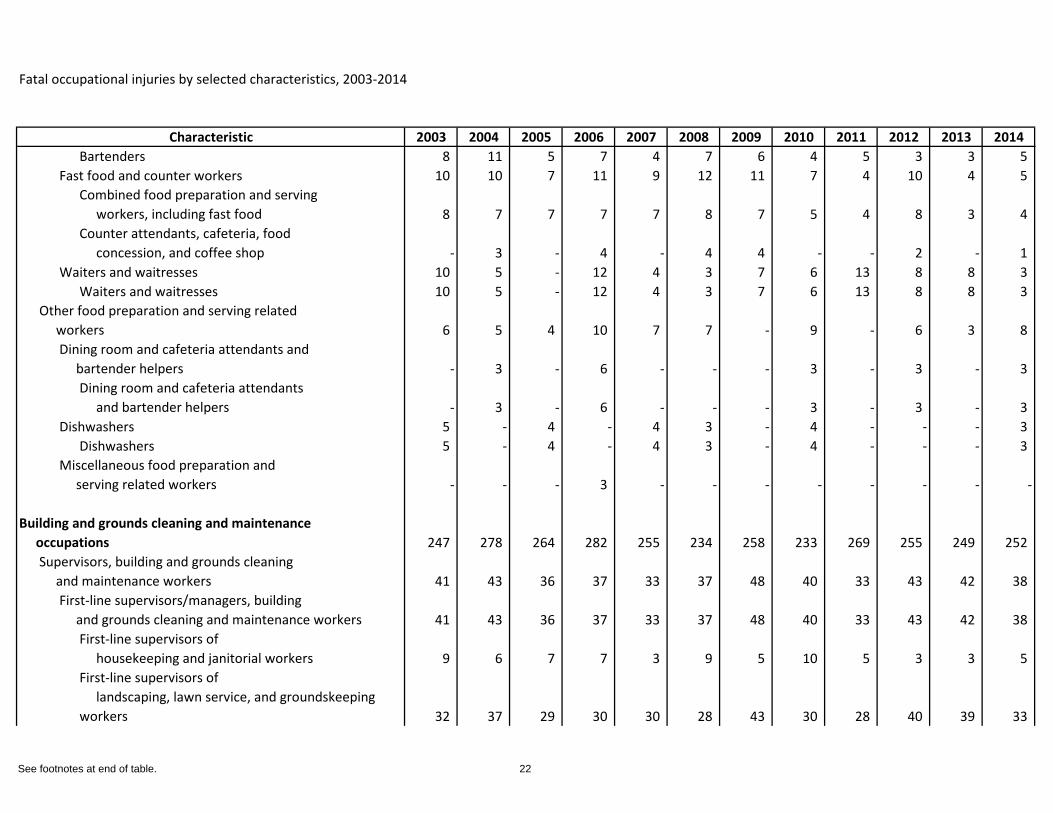
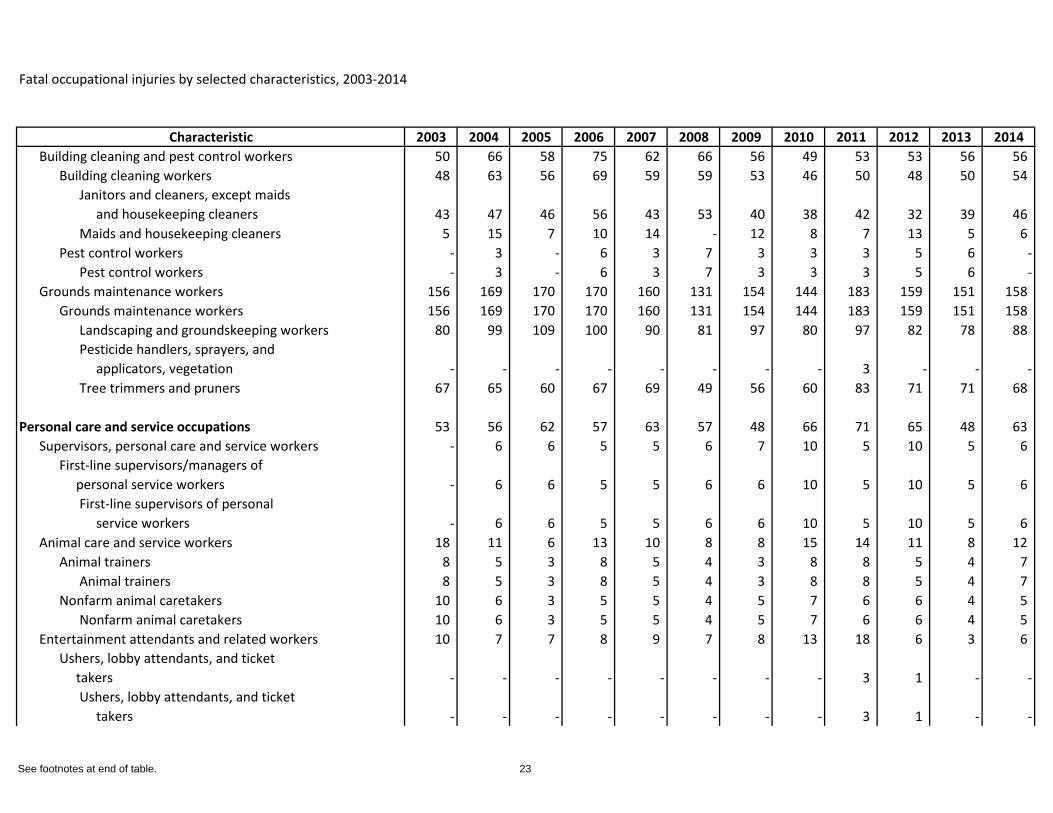
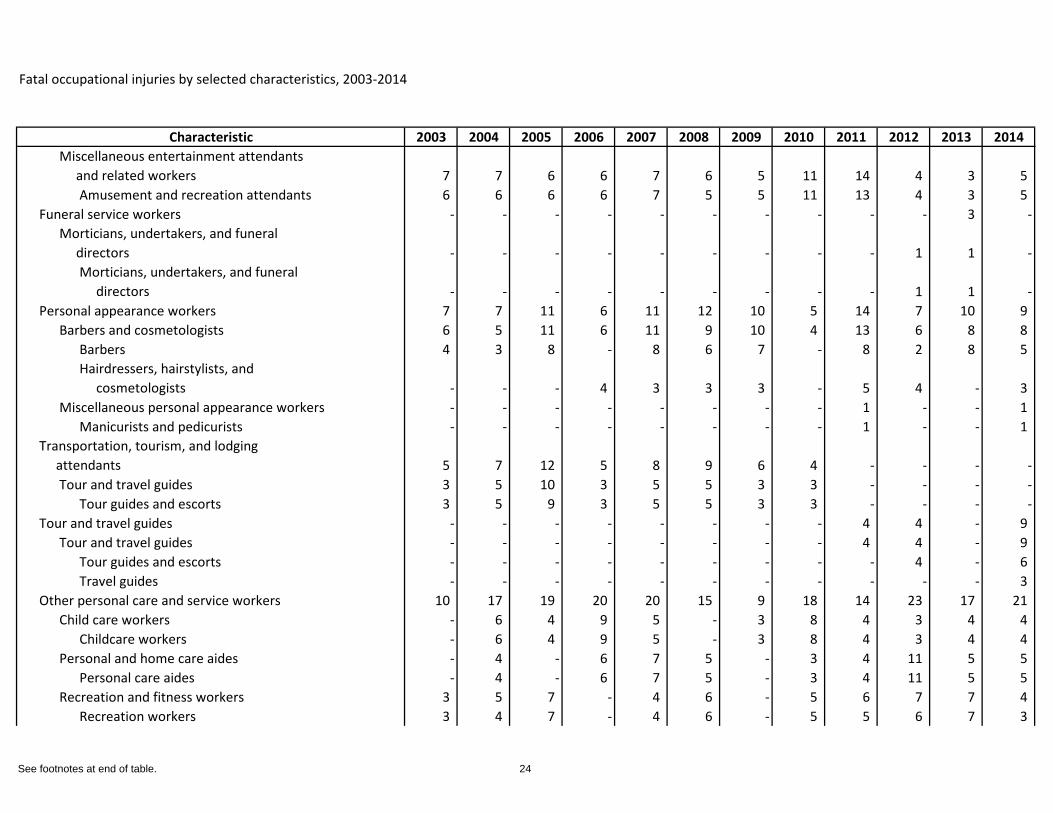
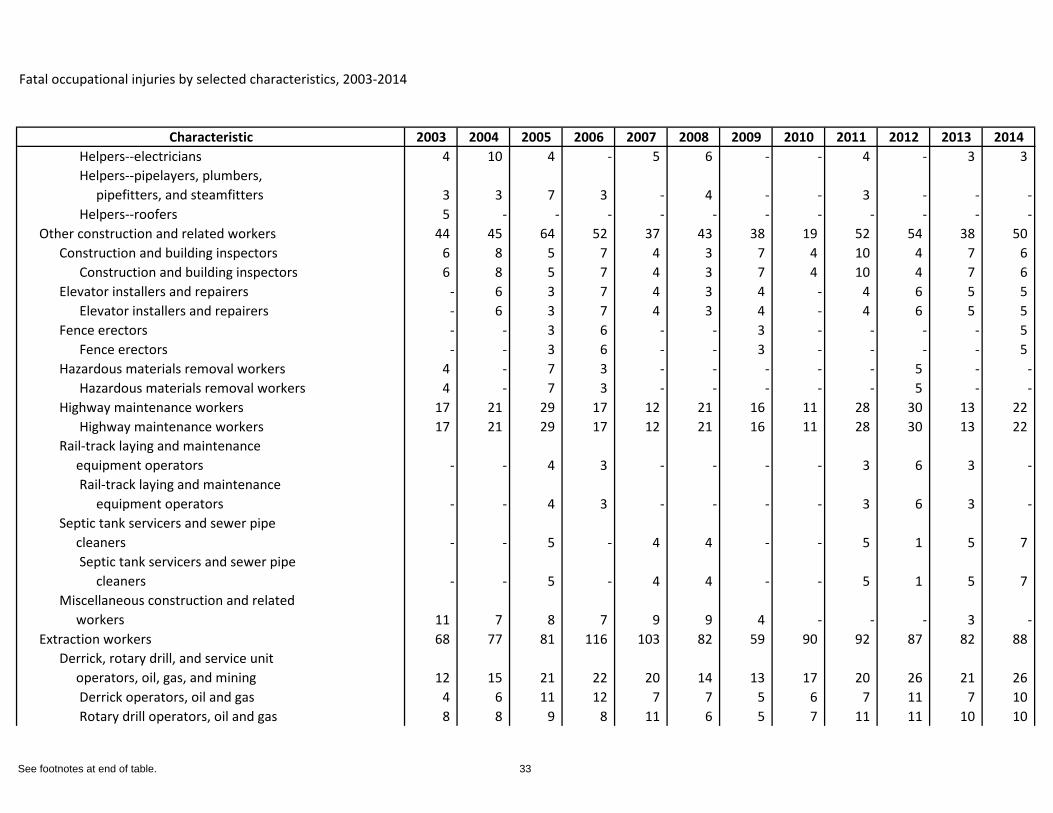
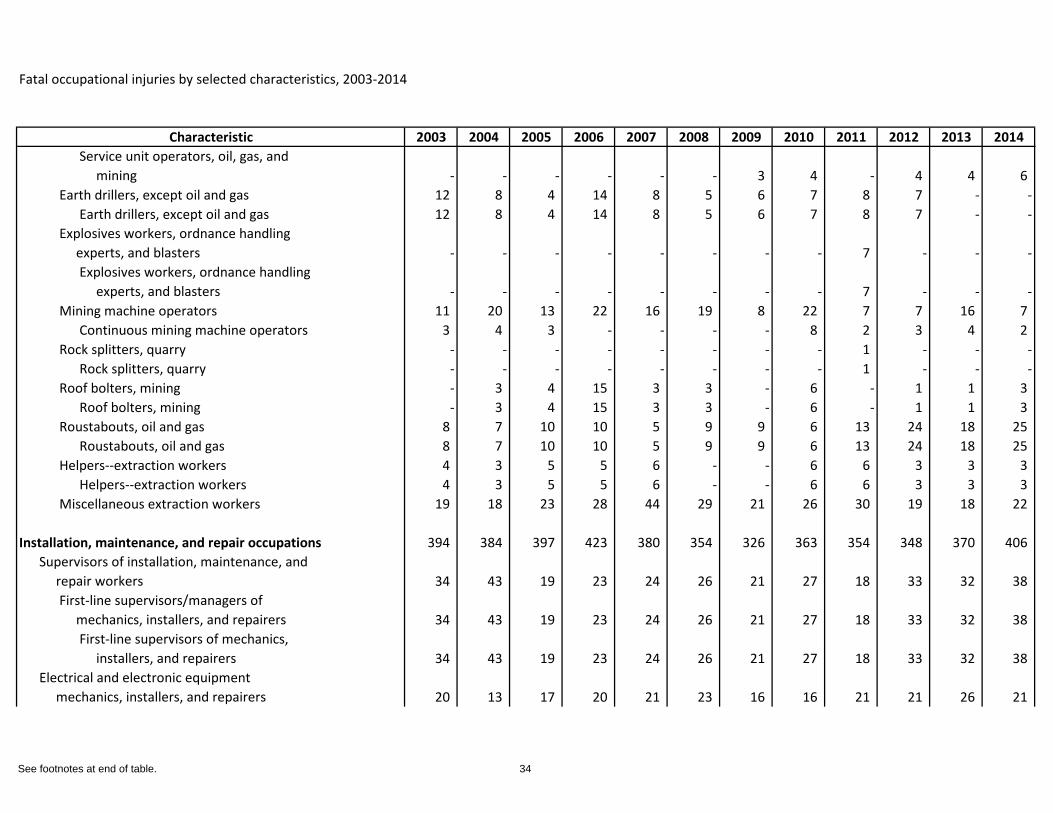
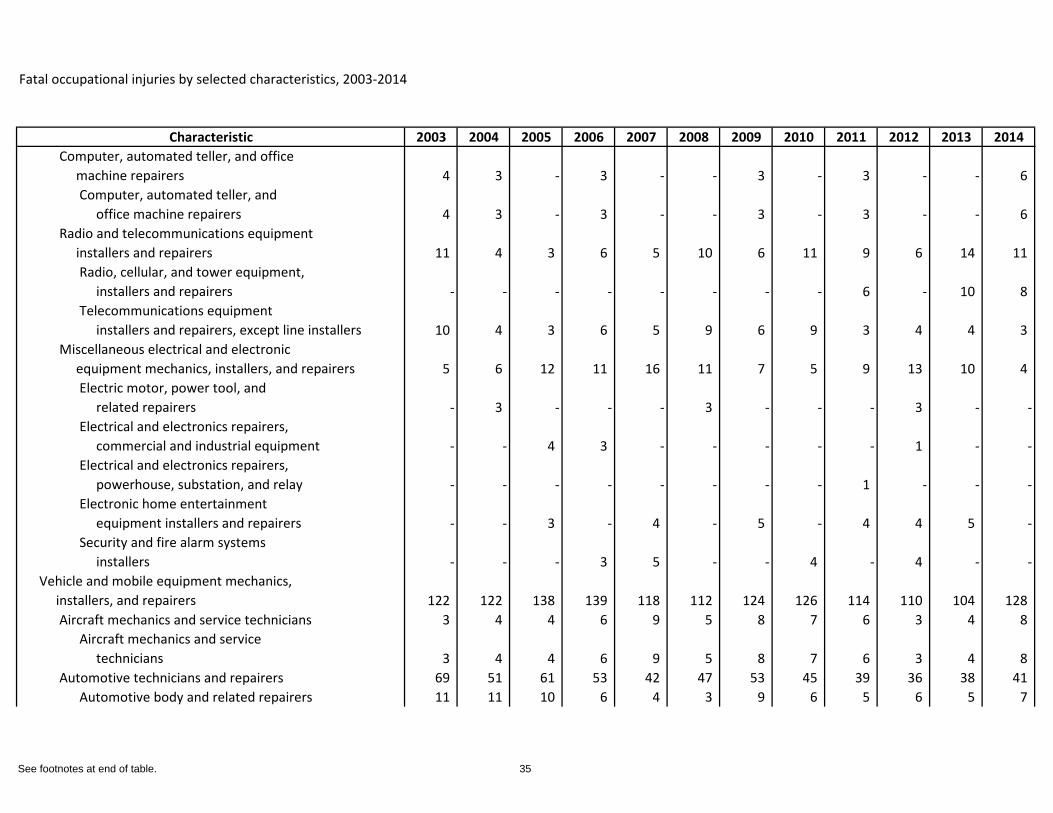
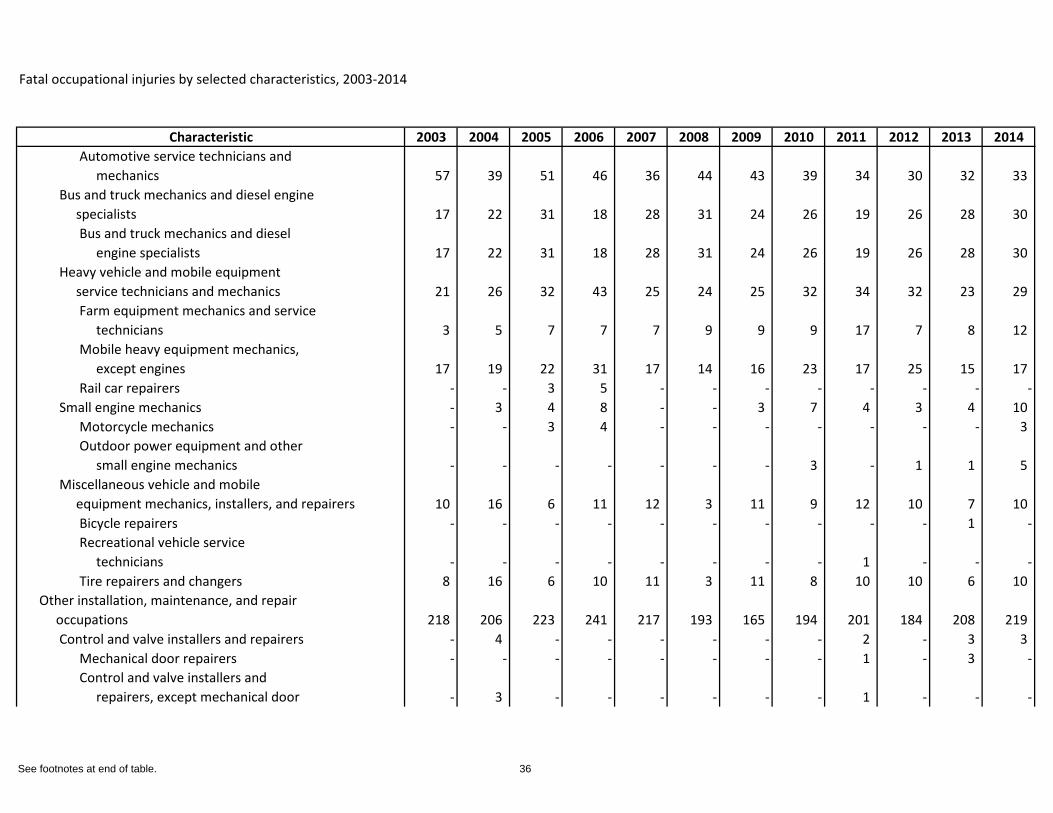
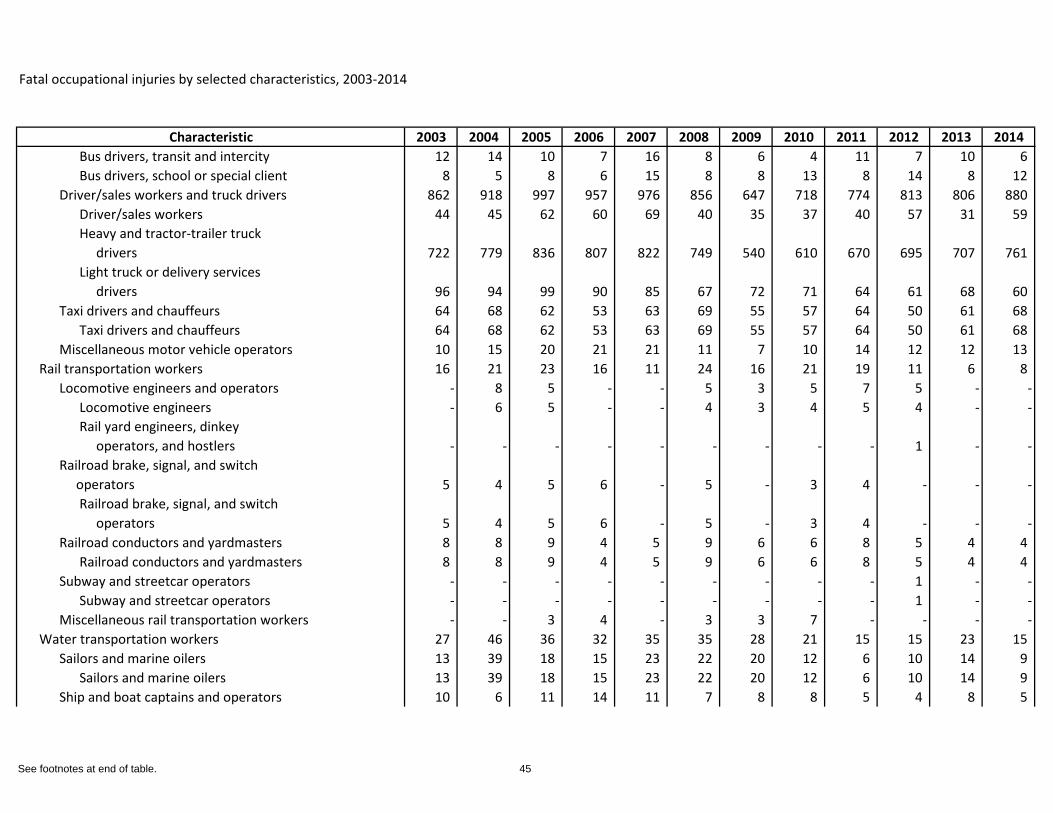
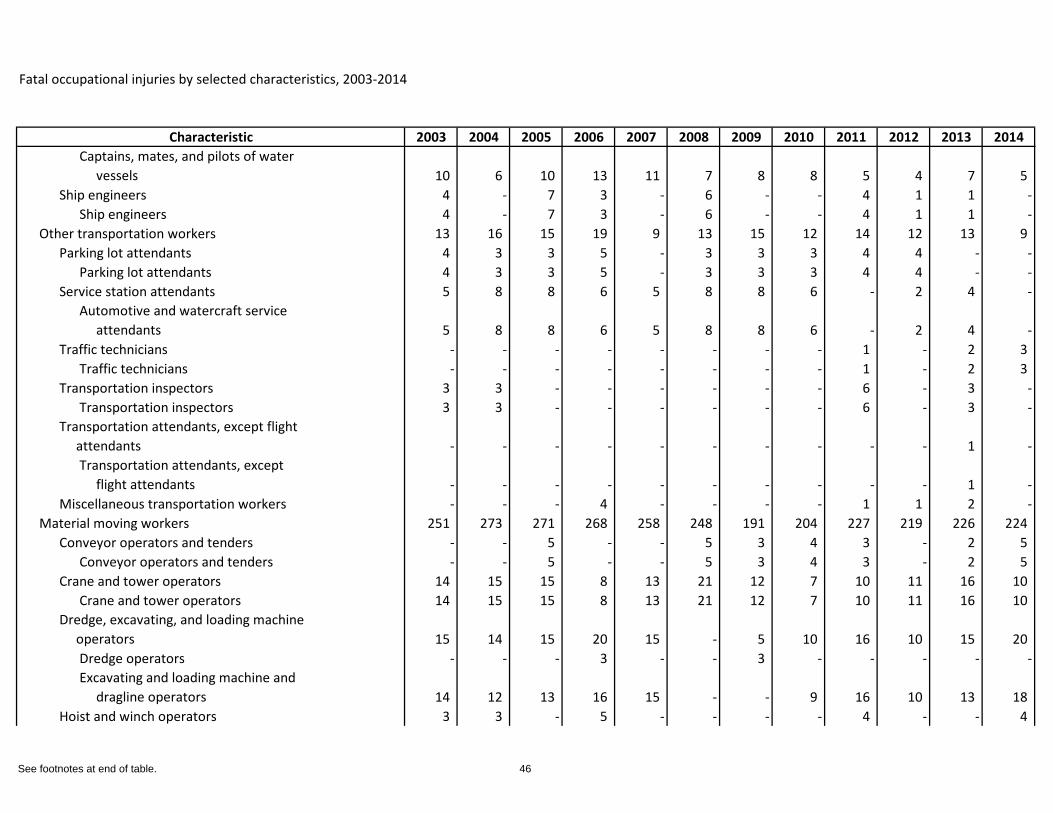
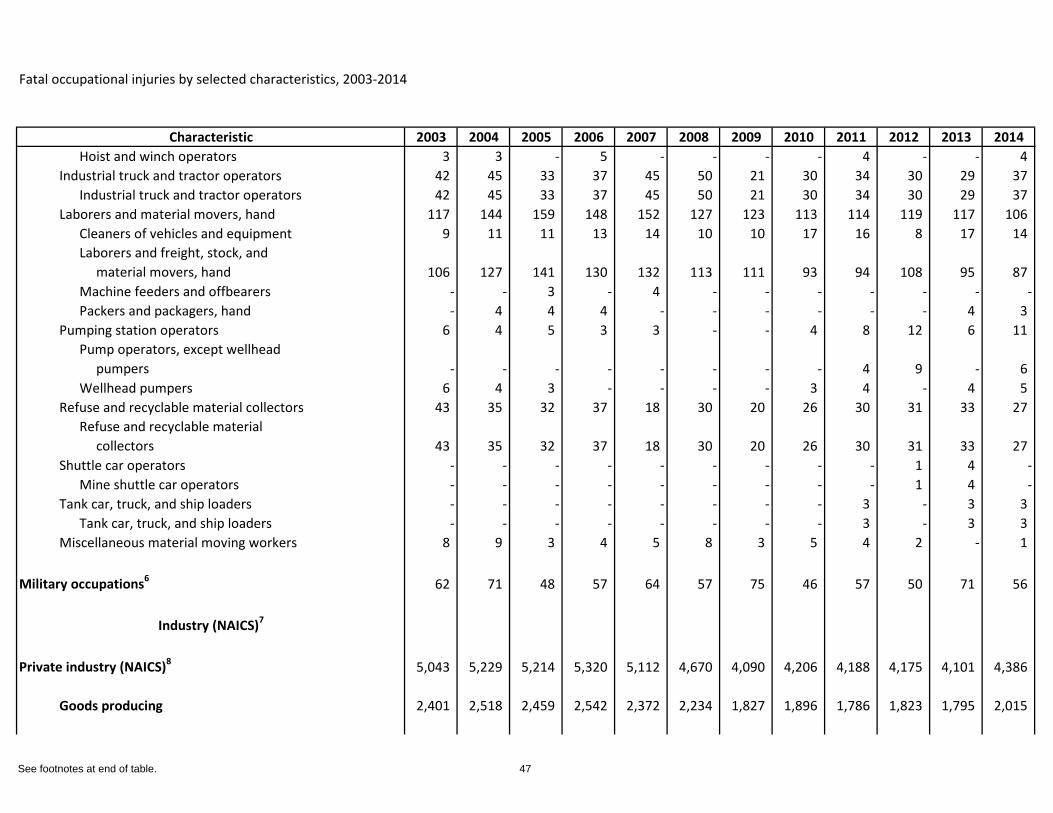
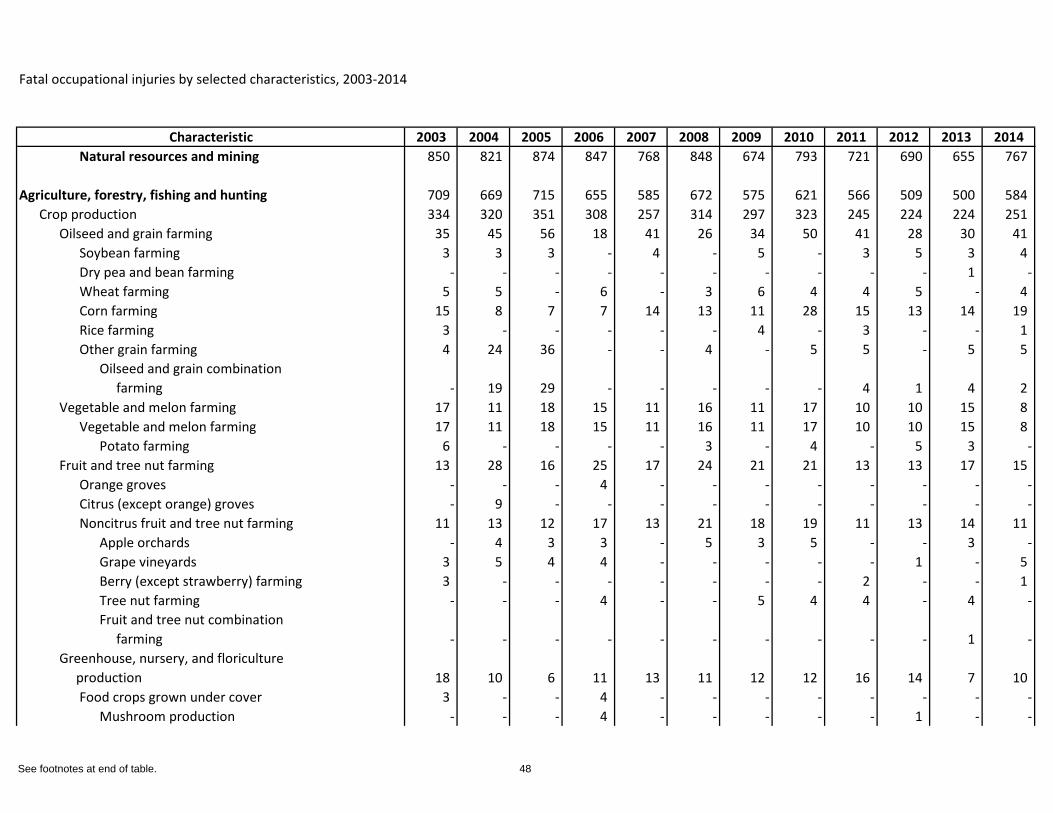
Fatal occupational injuries by selected characteristics, 2003-2014
Characteristic 2003 2004 2005 2006 2007 2008 2009 2010 2011 2012 2013 2014
Total1 5,575 5,764 5,734 5,840 5,657 5,214 4,551 4,690 4,693 4,628 4,585 4,821
State of incident
Alabama 124 133 128 100 108 107 75 92 75 84 78 75 Alaska 28 42 29 45 30 33 17 39 39 31 32 30 Arizona 80 84 99 112 97 100 76 77 69 60 95 88 Arkansas 87 70 80 78 89 85 75 88 93 63 63 67 California 459 467 465 537 461 465 409 326 390 375 396 344 Colorado 102 117 125 137 126 105 83 85 92 82 65 84 Connecticut 36 54 46 38 38 28 34 49 37 36 29 35 Delaware 9 10 11 15 10 11 7 8 10 14 11 12 District of Columbia 19 11 12 7 13 9 11 16 9 11 25 11 Florida 347 422 406 360 363 291 245 225 226 218 239 228 Georgia 199 232 200 201 193 182 110 108 111 101 117 152 Hawaii 21 25 15 30 23 19 13 19 26 20 11 31 Idaho 43 38 35 38 31 36 27 33 37 19 30 34 Illinois 200 208 194 207 185 193 158 206 177 146 176 164 Indiana 132 153 157 148 127 143 125 118 125 115 127 130 Iowa 76 82 90 71 89 93 80 77 93 97 72 91 Kansas 78 80 81 85 101 73 76 85 78 76 55 73 Kentucky 145 143 122 147 112 106 101 69 93 91 86 82 Louisiana 95 121 111 118 139 135 140 111 111 116 114 120 Maine 23 16 15 20 21 24 16 20 26 19 19 19 Maryland 92 81 95 106 82 60 65 71 71 72 79 74 Massachusetts 78 72 75 66 75 68 64 54 68 44 57 55 Michigan 152 127 110 157 120 123 94 146 141 137 135 143 Minnesota 72 80 87 78 72 65 61 70 60 70 69 62 Mississippi 102 88 112 96 93 80 67 68 63 63 68 75
See footnotes at end of table. 1
Fatal occupational injuries by selected characteristics, 2003-2014
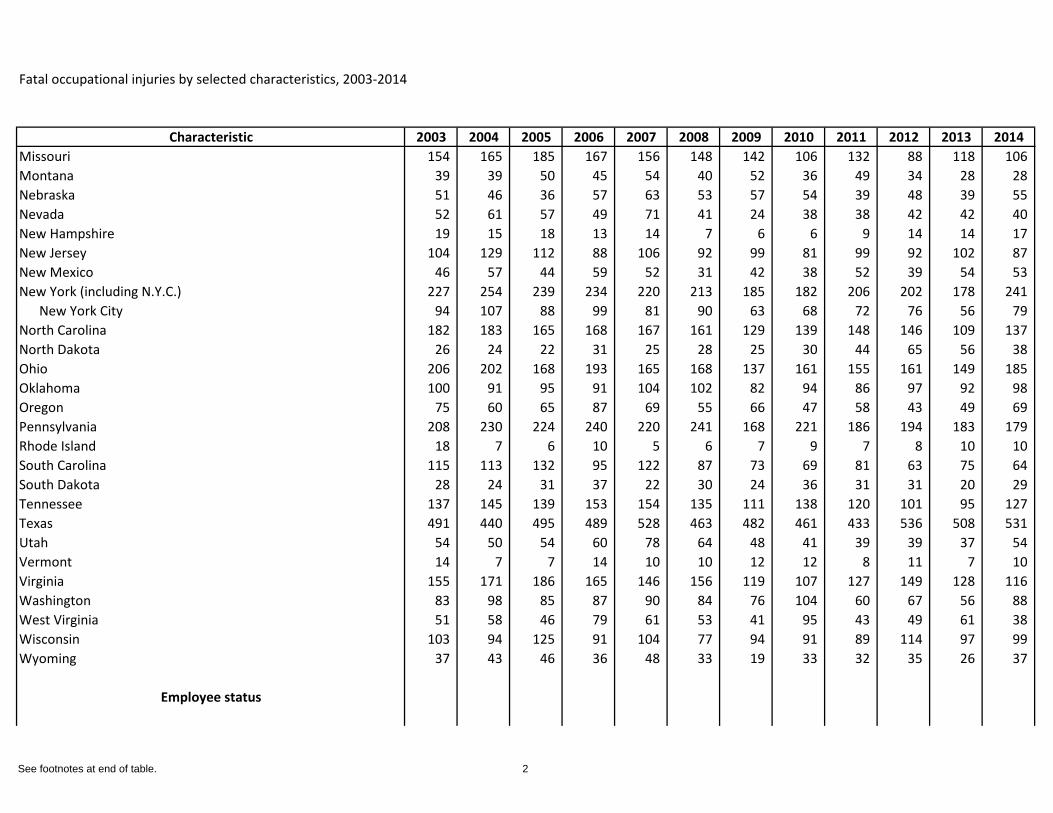
Characteristic 2003 2004 2005 2006 2007 2008 2009 2010 2011 2012 2013 2014Missouri 154 165 185 167 156 148 142 106 132 88 118 106 Montana 39 39 50 45 54 40 52 36 49 34 28 28 Nebraska 51 46 36 57 63 53 57 54 39 48 39 55 Nevada 52 61 57 49 71 41 24 38 38 42 42 40 New Hampshire 19 15 18 13 14 7 6 6 9 14 14 17 New Jersey 104 129 112 88 106 92 99 81 99 92 102 87 New Mexico 46 57 44 59 52 31 42 38 52 39 54 53 New York (including N.Y.C.) 227 254 239 234 220 213 185 182 206 202 178 241
New York City 94 107 88 99 81 90 63 68 72 76 56 79 North Carolina 182 183 165 168 167 161 129 139 148 146 109 137 North Dakota 26 24 22 31 25 28 25 30 44 65 56 38 Ohio 206 202 168 193 165 168 137 161 155 161 149 185 Oklahoma 100 91 95 91 104 102 82 94 86 97 92 98 Oregon 75 60 65 87 69 55 66 47 58 43 49 69 Pennsylvania 208 230 224 240 220 241 168 221 186 194 183 179 Rhode Island 18 7 6 10 5 6 7 9 7 8 10 10 South Carolina 115 113 132 95 122 87 73 69 81 63 75 64 South Dakota 28 24 31 37 22 30 24 36 31 31 20 29 Tennessee 137 145 139 153 154 135 111 138 120 101 95 127 Texas 491 440 495 489 528 463 482 461 433 536 508 531 Utah 54 50 54 60 78 64 48 41 39 39 37 54 Vermont 14 7 7 14 10 10 12 12 8 11 7 10 Virginia 155 171 186 165 146 156 119 107 127 149 128 116 Washington 83 98 85 87 90 84 76 104 60 67 56 88 West Virginia 51 58 46 79 61 53 41 95 43 49 61 38 Wisconsin 103 94 125 91 104 77 94 91 89 114 97 99 Wyoming 37 43 46 36 48 33 19 33 32 35 26 37
Employee status
See footnotes at end of table. 2
Fatal occupational injuries by selected characteristics, 2003-2014
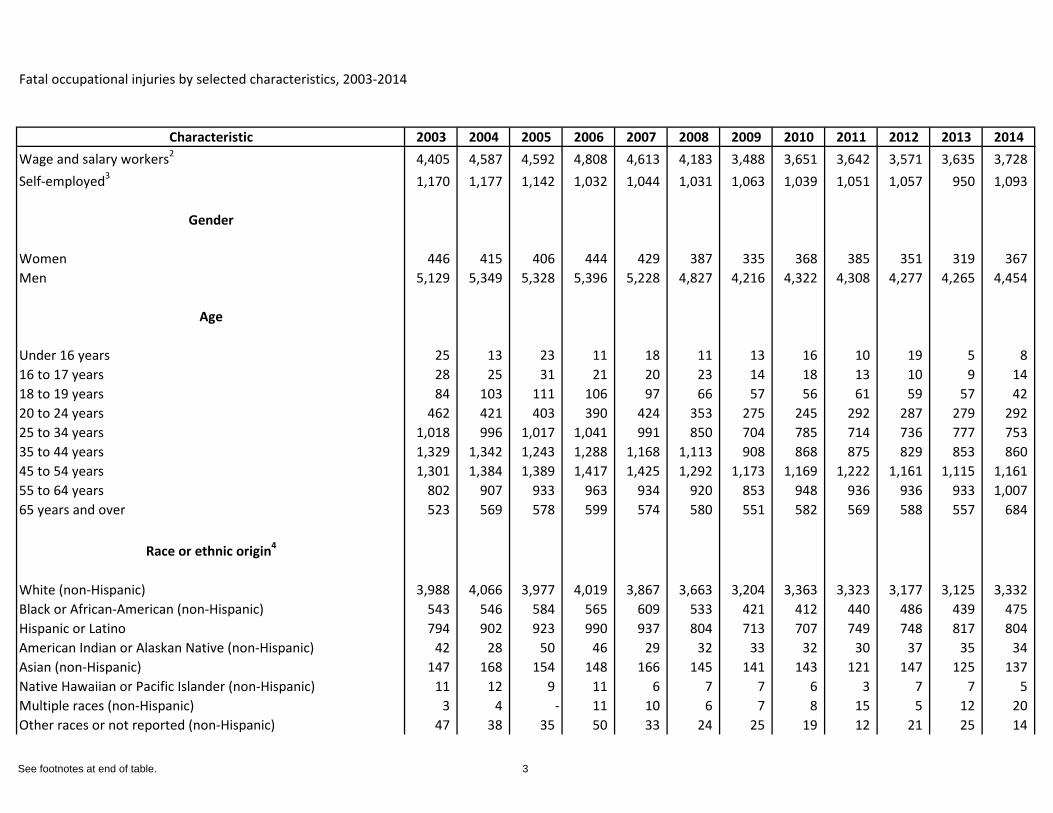
Characteristic 2003 2004 2005 2006 2007 2008 2009 2010 2011 2012 2013 2014Wage and salary workers2 4,405 4,587 4,592 4,808 4,613 4,183 3,488 3,651 3,642 3,571 3,635 3,728 Self-employed3 1,170 1,177 1,142 1,032 1,044 1,031 1,063 1,039 1,051 1,057 950 1,093
Gender
Women 446 415 406 444 429 387 335 368 385 351 319 367 Men 5,129 5,349 5,328 5,396 5,228 4,827 4,216 4,322 4,308 4,277 4,265 4,454
Age
Under 16 years 25 13 23 11 18 11 13 16 10 19 5 8 16 to 17 years 28 25 31 21 20 23 14 18 13 10 9 14 18 to 19 years 84 103 111 106 97 66 57 56 61 59 57 42 20 to 24 years 462 421 403 390 424 353 275 245 292 287 279 292 25 to 34 years 1,018 996 1,017 1,041 991 850 704 785 714 736 777 753 35 to 44 years 1,329 1,342 1,243 1,288 1,168 1,113 908 868 875 829 853 860 45 to 54 years 1,301 1,384 1,389 1,417 1,425 1,292 1,173 1,169 1,222 1,161 1,115 1,161 55 to 64 years 802 907 933 963 934 920 853 948 936 936 933 1,007 65 years and over 523 569 578 599 574 580 551 582 569 588 557 684
Race or ethnic origin4
White (non-Hispanic) 3,988 4,066 3,977 4,019 3,867 3,663 3,204 3,363 3,323 3,177 3,125 3,332 Black or African-American (non-Hispanic) 543 546 584 565 609 533 421 412 440 486 439 475 Hispanic or Latino 794 902 923 990 937 804 713 707 749 748 817 804 American Indian or Alaskan Native (non-Hispanic) 42 28 50 46 29 32 33 32 30 37 35 34 Asian (non-Hispanic) 147 168 154 148 166 145 141 143 121 147 125 137 Native Hawaiian or Pacific Islander (non-Hispanic) 11 12 9 11 6 7 7 6 3 7 7 5 Multiple races (non-Hispanic) 3 4 - 11 10 6 7 8 15 5 12 20 Other races or not reported (non-Hispanic) 47 38 35 50 33 24 25 19 12 21 25 14
See footnotes at end of table. 3
Fatal occupational injuries by selected characteristics, 2003-2014
Characteristic 2003 2004 2005 2006 2007 2008 2009 2010 2011 2012 2013 2014
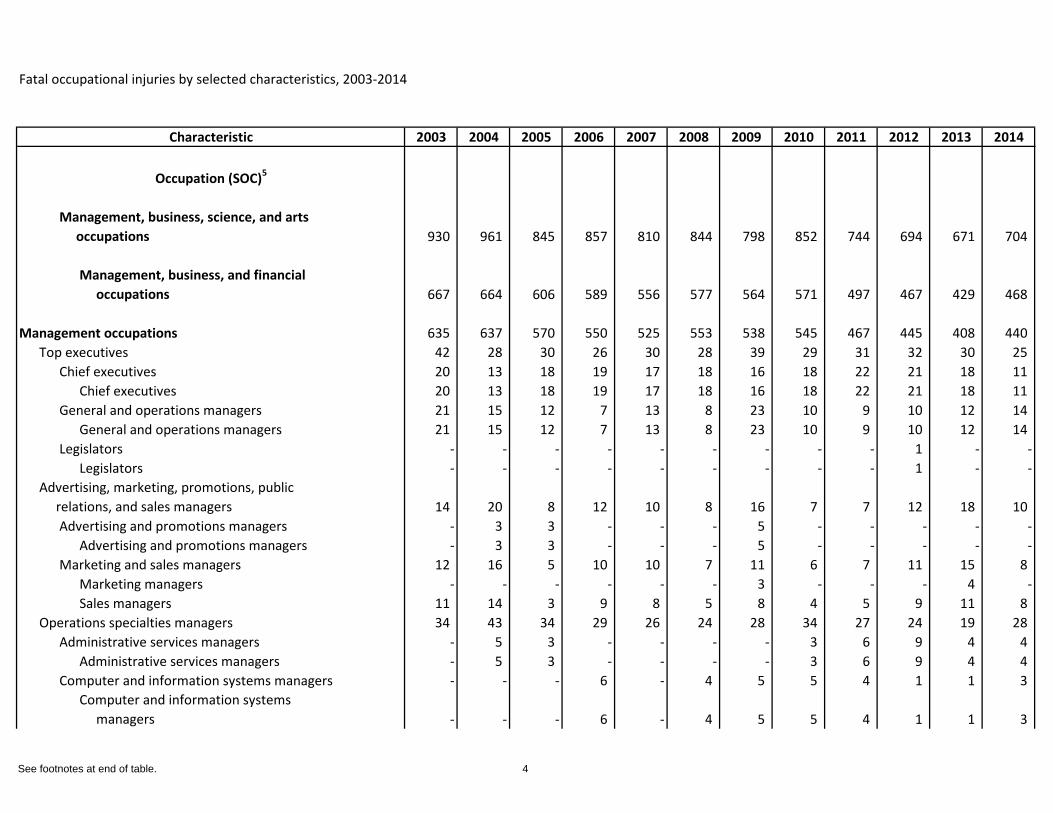
Occupation (SOC)5
Management, business, science, and arts occupations 930 961 845 857 810 844 798 852 744 694 671 704
Management, business, and financial occupations 667 664 606 589 556 577 564 571 497 467 429 468
Management occupations 635 637 570 550 525 553 538 545 467 445 408 440 Top executives 42 28 30 26 30 28 39 29 31 32 30 25
Chief executives 20 13 18 19 17 18 16 18 22 21 18 11 Chief executives 20 13 18 19 17 18 16 18 22 21 18 11
General and operations managers 21 15 12 7 13 8 23 10 9 10 12 14 General and operations managers 21 15 12 7 13 8 23 10 9 10 12 14
Legislators - - - - - - - - - 1 - -Legislators - - - - - - - - - 1 - -
Advertising, marketing, promotions, public relations, and sales managers 14 20 8 12 10 8 16 7 7 12 18 10
Advertising and promotions managers - 3 3 - - - 5 - - - - -Advertising and promotions managers - 3 3 - - - 5 - - - - -
Marketing and sales managers 12 16 5 10 10 7 11 6 7 11 15 8 Marketing managers - - - - - - 3 - - - 4 -Sales managers 11 14 3 9 8 5 8 4 5 9 11 8
Operations specialties managers 34 43 34 29 26 24 28 34 27 24 19 28 Administrative services managers - 5 3 - - - - 3 6 9 4 4
Administrative services managers - 5 3 - - - - 3 6 9 4 4 Computer and information systems managers - - - 6 - 4 5 5 4 1 1 3
Computer and information systems managers - - - 6 - 4 5 5 4 1 1 3
See footnotes at end of table. 4
Fatal occupational injuries by selected characteristics, 2003-2014
Characteristic 2003 2004 2005 2006 2007 2008 2009 2010 2011 2012 2013 2014Financial managers 8 14 11 7 8 7 9 8 6 1 2 5
Financial managers 8 14 11 7 8 7 9 8 6 1 2 5 Human resources managers 3 3 - - 3 - - - - - - -Industrial production managers 9 11 10 10 6 5 8 10 7 - 4 6
Industrial production managers 9 11 10 10 6 5 8 10 7 - 4 6 Transportation, storage, and distribution managers 11 7 7 5 7 6 3 6 3 10 4 6
Transportation, storage, and distribution managers 11 7 7 5 7 6 3 6 3 10 4 6
Human resources managers - - - - - - - - - 1 1 4 Human resources managers - - - - - - - - - 1 1 4
Training and development managers - - - - - - - - - - 1 -Training and development managers - - - - - - - - - - 1 -
Other management occupations 545 546 498 483 459 493 455 475 402 377 341 377 Agricultural managers 360 327 355 305 301 327 312 323 268 232 231 270
Farm, ranch, and other agricultural managers 28 17 14 13 8 3 10 15 - - - -Farmers and ranchers 332 310 341 292 293 324 302 308 - - - -Farmers, ranchers, and other agricultural managers - - - - - - - - 268 232 231 270
Construction managers 64 95 63 63 69 55 31 36 21 24 15 15 Construction managers 64 95 63 63 69 55 31 36 21 24 15 15
Education administrators 9 10 7 5 5 - - 4 8 7 4 5 Education administrators, elementary and secondary school 4 - - - 3 - - - 4 4 4 -Education administrators, postsecondary - 7 5 - - - - - 2 1 - -
Engineering managers 3 - - - - 3 8 - - - - -Architectural and engineering managers 3 - - - - 3 8 - - - - -
Food service managers 39 31 19 29 18 28 25 25 28 27 36 22
See footnotes at end of table. 5
Fatal occupational injuries by selected characteristics, 2003-2014
Characteristic 2003 2004 2005 2006 2007 2008 2009 2010 2011 2012 2013 2014Food service managers 39 31 19 29 18 28 25 25 28 27 36 22
Funeral directors - - - - - - - - - - - 1 Funeral service managers - - - - - - - - - - - 1
Lodging managers 14 11 6 13 8 6 7 6 9 6 7 9 Lodging managers 14 11 6 13 8 6 7 6 9 6 7 9
Medical and health services managers - - - 4 - - 4 7 6 8 3 5 Medical and health services managers - - - 4 - - 4 7 6 8 3 5
Postmasters and mail superintendents - - - - - - - - - - 1 -Postmasters and mail superintendents - - - - - - - - - - 1 -
Property, real estate, and community association managers 12 18 9 21 18 21 26 19 15 30 20 20
Property, real estate, and community association managers 12 18 9 21 18 21 26 19 15 30 20 20
Social and community service managers 4 - - - - - 4 4 6 4 1 4 Social and community service managers 4 - - - - - 4 4 6 4 1 4
Miscellaneous managers 35 47 31 37 33 47 35 46 40 38 19 21
Business and financial operations occupations 32 27 36 39 31 24 26 26 30 22 21 28 Business operations specialists 11 18 23 23 20 13 16 17 18 16 12 22
Buyers and purchasing agents - 6 3 6 7 - 3 - - - 2 -Buyers and purchasing agents, farm products - - - 3 - - 3 - - - 2 -Wholesale and retail buyers, except farm products - 3 - 3 5 - - - - - - -
Claims adjusters, appraisers, examiners, and investigators - 5 3 5 5 - - - - 4 3 3
Claims adjusters, examiners, and investigators - 5 - 5 5 - - - - 4 3 3
See footnotes at end of table. 6
Fatal occupational injuries by selected characteristics, 2003-2014
Characteristic 2003 2004 2005 2006 2007 2008 2009 2010 2011 2012 2013 2014Compliance officers, except agriculture, construction, health and safety, and transportation - - 6 - - 3 - - 3 2 - -
Compliance officers - - 6 - - 3 - - 3 2 - -Cost estimators - - - - - - - - 1 1 - 3
Cost estimators - - - - - - - - 1 1 - 3 Human resources, training, and labor relations specialists 4 - 4 5 3 3 - 5 4 - - 4
Human resources specialists - - - - - - - - - - - 4 Logisticians - - - - - - - - - - 1 -
Logisticians - - - - - - - - - - 1 -Management analysts - - - - - - 3 - - 1 2 4
Management analysts - - - - - - 3 - - 1 2 4 Meeting and convention planners - - - - - - - - - 1 - -
Meeting, convention, and event planners - - - - - - - - - 1 - -
Training and development specialists - - - - - - - - 3 - - -Training and development specialists - - - - - - - - 3 - - -
Miscellaneous business operations specialists - - - 3 - - - 3 - 3 - -
Financial specialists 21 9 13 16 11 11 10 9 12 6 9 6 Accountants and auditors 10 5 3 7 3 5 5 - 7 - 3 3
Accountants and auditors 10 5 3 7 3 5 5 - 7 - 3 3 Financial analysts and advisors 4 - 4 5 - - 3 - - - 2 -
Financial analysts - - - - - - - - - - 1 -Personal financial advisors 4 - 3 5 - - 3 - - - 1 -
Loan counselors and officers 4 - 3 3 - - - - - - 1 -Loan officers 4 - 3 3 - - - - - - 1 -
Tax examiners, collectors, preparers, and revenue agents - - - - - - - - - - 1 -
See footnotes at end of table. 7
Fatal occupational injuries by selected characteristics, 2003-2014
Characteristic 2003 2004 2005 2006 2007 2008 2009 2010 2011 2012 2013 2014Tax preparers - - - - - - - - - - 1 -
Miscellaneous financial specialists - - - - - - - - 2 2 2 -
Professional and related occupations 263 297 239 268 254 267 234 281 247 227 242 236
Computer, engineering, and science occupations 82 101 76 99 75 72 68 94 66 64 74 69
Computer and mathematical occupations 8 7 6 16 4 7 9 14 5 8 12 16 Computer specialists 7 7 6 15 4 7 8 14 3 8 11 16
Computer software engineers - - - 4 - - - 6 - - - -Computer software engineers, applications - - - - - - - 3 - - - -Computer software engineers, systems software - - - - - - - 3 - - - -
Computer support specialists - - 4 - - - - - - - - -Computer support specialists - - 4 - - - - - - - - -
Computer systems analysts - - - - 3 - - - - - - -Computer systems analysts - - - - 3 - - - - - - -
Network and computer systems administrators - - - - - 3 - - - - - -
Network and computer systems administrators - - - - - 3 - - - - - -
Network systems and data communications analysts - - - 4 - - - 4 - - - -
Network systems and data communications analysts - - - 4 - - - 4 - - - -
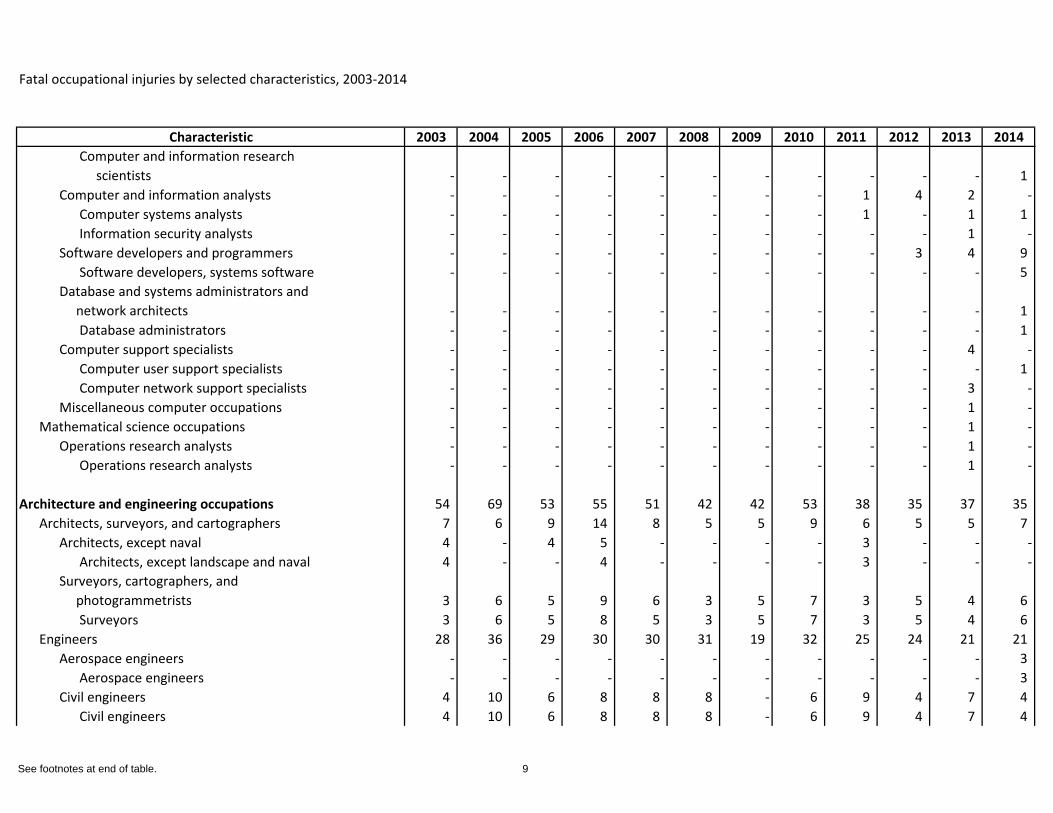
Computer occupations - - - - - - - - 3 8 11 16 Computer and information research scientists - - - - - - - - - - - 1
See footnotes at end of table. 8
Fatal occupational injuries by selected characteristics, 2003-2014
Characteristic 2003 2004 2005 2006 2007 2008 2009 2010 2011 2012 2013 2014Computer and information research scientists - - - - - - - - - - - 1
Computer and information analysts - - - - - - - - 1 4 2 -Computer systems analysts - - - - - - - - 1 - 1 1 Information security analysts - - - - - - - - - - 1 -
Software developers and programmers - - - - - - - - - 3 4 9 Software developers, systems software - - - - - - - - - - - 5
Database and systems administrators and network architects - - - - - - - - - - - 1
Database administrators - - - - - - - - - - - 1 Computer support specialists - - - - - - - - - - 4 -
Computer user support specialists - - - - - - - - - - - 1 Computer network support specialists - - - - - - - - - - 3 -
Miscellaneous computer occupations - - - - - - - - - - 1 -Mathematical science occupations - - - - - - - - - - 1 -
Operations research analysts - - - - - - - - - - 1 -Operations research analysts - - - - - - - - - - 1 -
Architecture and engineering occupations 54 69 53 55 51 42 42 53 38 35 37 35 Architects, surveyors, and cartographers 7 6 9 14 8 5 5 9 6 5 5 7
Architects, except naval 4 - 4 5 - - - - 3 - - -Architects, except landscape and naval 4 - - 4 - - - - 3 - - -
Surveyors, cartographers, and photogrammetrists 3 6 5 9 6 3 5 7 3 5 4 6
Surveyors 3 6 5 8 5 3 5 7 3 5 4 6 Engineers 28 36 29 30 30 31 19 32 25 24 21 21
Aerospace engineers - - - - - - - - - - - 3 Aerospace engineers - - - - - - - - - - - 3
Civil engineers 4 10 6 8 8 8 - 6 9 4 7 4 Civil engineers 4 10 6 8 8 8 - 6 9 4 7 4
See footnotes at end of table. 9
Fatal occupational injuries by selected characteristics, 2003-2014
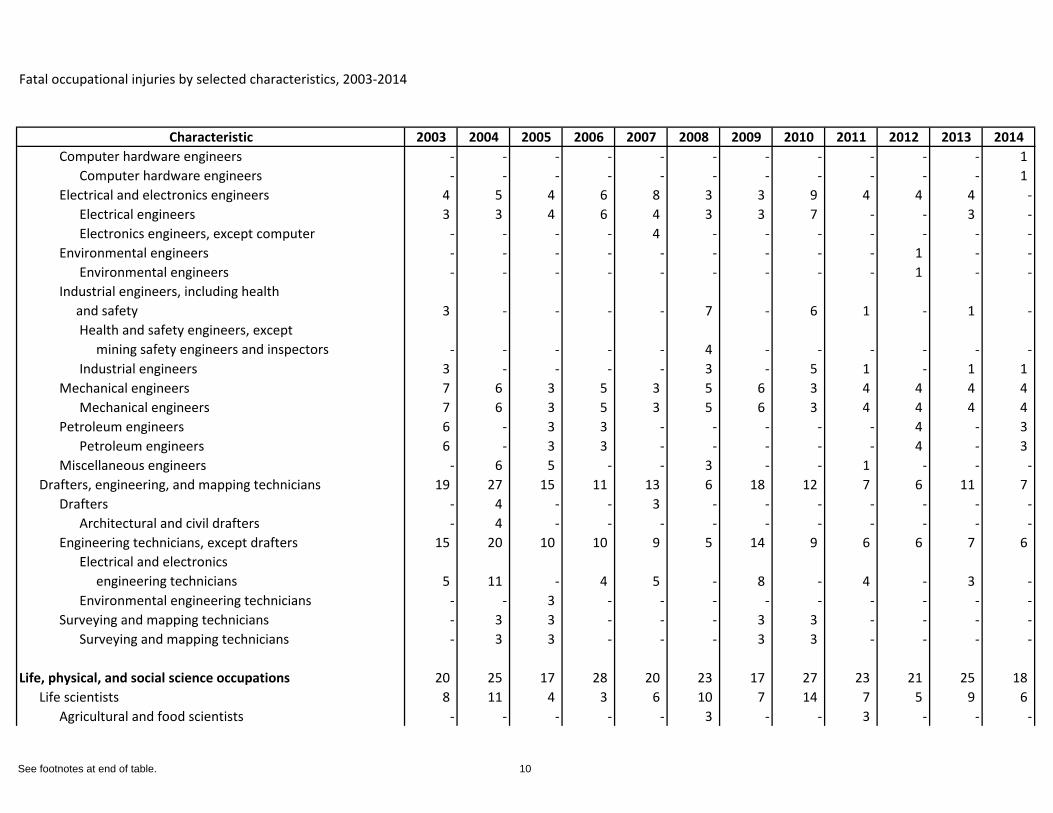
Characteristic 2003 2004 2005 2006 2007 2008 2009 2010 2011 2012 2013 2014Computer hardware engineers - - - - - - - - - - - 1
Computer hardware engineers - - - - - - - - - - - 1 Electrical and electronics engineers 4 5 4 6 8 3 3 9 4 4 4 -
Electrical engineers 3 3 4 6 4 3 3 7 - - 3 -Electronics engineers, except computer - - - - 4 - - - - - - -
Environmental engineers - - - - - - - - - 1 - -Environmental engineers - - - - - - - - - 1 - -
Industrial engineers, including health and safety 3 - - - - 7 - 6 1 - 1 -
Health and safety engineers, except mining safety engineers and inspectors - - - - - 4 - - - - - -Industrial engineers 3 - - - - 3 - 5 1 - 1 1
Mechanical engineers 7 6 3 5 3 5 6 3 4 4 4 4 Mechanical engineers 7 6 3 5 3 5 6 3 4 4 4 4
Petroleum engineers 6 - 3 3 - - - - - 4 - 3 Petroleum engineers 6 - 3 3 - - - - - 4 - 3
Miscellaneous engineers - 6 5 - - 3 - - 1 - - -Drafters, engineering, and mapping technicians 19 27 15 11 13 6 18 12 7 6 11 7
Drafters - 4 - - 3 - - - - - - -Architectural and civil drafters - 4 - - - - - - - - - -
Engineering technicians, except drafters 15 20 10 10 9 5 14 9 6 6 7 6 Electrical and electronics engineering technicians 5 11 - 4 5 - 8 - 4 - 3 -Environmental engineering technicians - - 3 - - - - - - - - -
Surveying and mapping technicians - 3 3 - - - 3 3 - - - -Surveying and mapping technicians - 3 3 - - - 3 3 - - - -
Life, physical, and social science occupations 20 25 17 28 20 23 17 27 23 21 25 18 Life scientists 8 11 4 3 6 10 7 14 7 5 9 6
Agricultural and food scientists - - - - - 3 - - 3 - - -
See footnotes at end of table. 10
Fatal occupational injuries by selected characteristics, 2003-2014
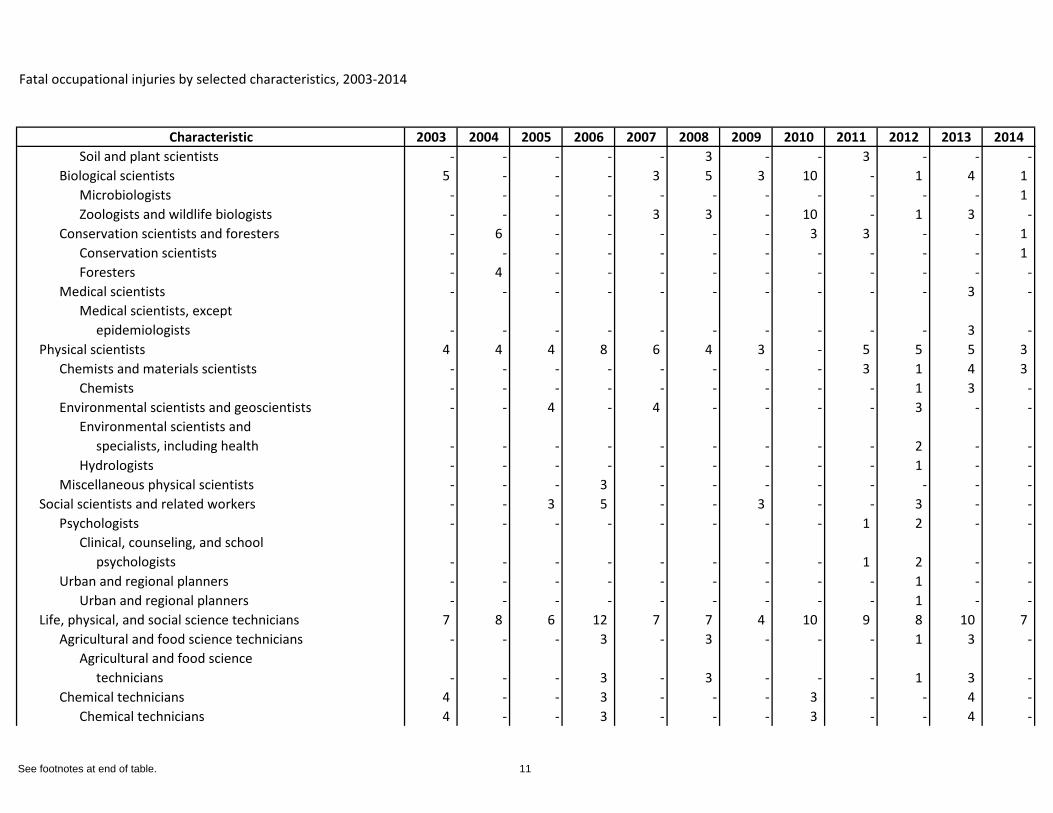
Characteristic 2003 2004 2005 2006 2007 2008 2009 2010 2011 2012 2013 2014Soil and plant scientists - - - - - 3 - - 3 - - -
Biological scientists 5 - - - 3 5 3 10 - 1 4 1 Microbiologists - - - - - - - - - - - 1 Zoologists and wildlife biologists - - - - 3 3 - 10 - 1 3 -
Conservation scientists and foresters - 6 - - - - - 3 3 - - 1 Conservation scientists - - - - - - - - - - - 1 Foresters - 4 - - - - - - - - - -
Medical scientists - - - - - - - - - - 3 -Medical scientists, except epidemiologists - - - - - - - - - - 3 -
Physical scientists 4 4 4 8 6 4 3 - 5 5 5 3 Chemists and materials scientists - - - - - - - - 3 1 4 3
Chemists - - - - - - - - - 1 3 -Environmental scientists and geoscientists - - 4 - 4 - - - - 3 - -
Environmental scientists and specialists, including health - - - - - - - - - 2 - -Hydrologists - - - - - - - - - 1 - -
Miscellaneous physical scientists - - - 3 - - - - - - - -Social scientists and related workers - - 3 5 - - 3 - - 3 - -
Psychologists - - - - - - - - 1 2 - -Clinical, counseling, and school psychologists - - - - - - - - 1 2 - -
Urban and regional planners - - - - - - - - - 1 - -Urban and regional planners - - - - - - - - - 1 - -
Life, physical, and social science technicians 7 8 6 12 7 7 4 10 9 8 10 7 Agricultural and food science technicians - - - 3 - 3 - - - 1 3 -
Agricultural and food science technicians - - - 3 - 3 - - - 1 3 -
Chemical technicians 4 - - 3 - - - 3 - - 4 -Chemical technicians 4 - - 3 - - - 3 - - 4 -
See footnotes at end of table. 11
Fatal occupational injuries by selected characteristics, 2003-2014
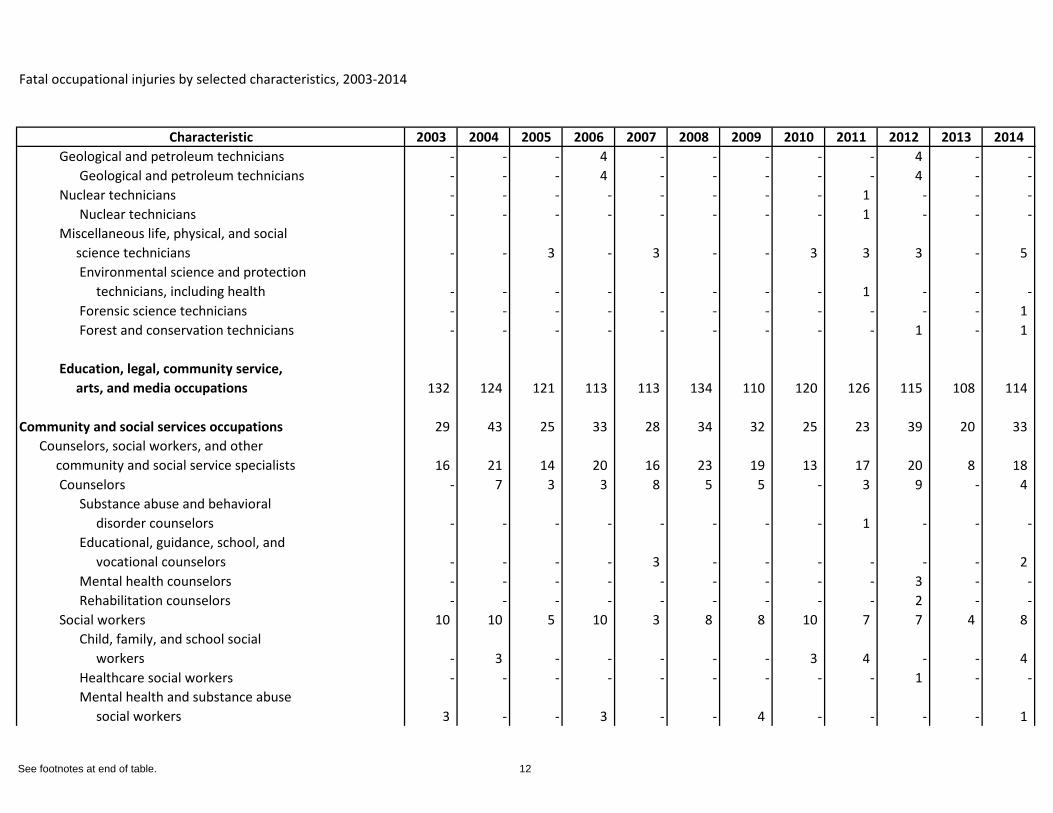
Characteristic 2003 2004 2005 2006 2007 2008 2009 2010 2011 2012 2013 2014Geological and petroleum technicians - - - 4 - - - - - 4 - -
Geological and petroleum technicians - - - 4 - - - - - 4 - -Nuclear technicians - - - - - - - - 1 - - -
Nuclear technicians - - - - - - - - 1 - - -Miscellaneous life, physical, and social science technicians - - 3 - 3 - - 3 3 3 - 5
Environmental science and protection technicians, including health - - - - - - - - 1 - - -Forensic science technicians - - - - - - - - - - - 1 Forest and conservation technicians - - - - - - - - - 1 - 1
Education, legal, community service, arts, and media occupations 132 124 121 113 113 134 110 120 126 115 108 114
Community and social services occupations 29 43 25 33 28 34 32 25 23 39 20 33 Counselors, social workers, and other community and social service specialists 16 21 14 20 16 23 19 13 17 20 8 18
Counselors - 7 3 3 8 5 5 - 3 9 - 4 Substance abuse and behavioral disorder counselors - - - - - - - - 1 - - -Educational, guidance, school, and vocational counselors - - - - 3 - - - - - - 2 Mental health counselors - - - - - - - - - 3 - -Rehabilitation counselors - - - - - - - - - 2 - -
Social workers 10 10 5 10 3 8 8 10 7 7 4 8 Child, family, and school social workers - 3 - - - - - 3 4 - - 4 Healthcare social workers - - - - - - - - - 1 - -Mental health and substance abuse social workers 3 - - 3 - - 4 - - - - 1
See footnotes at end of table. 12
Fatal occupational injuries by selected characteristics, 2003-2014
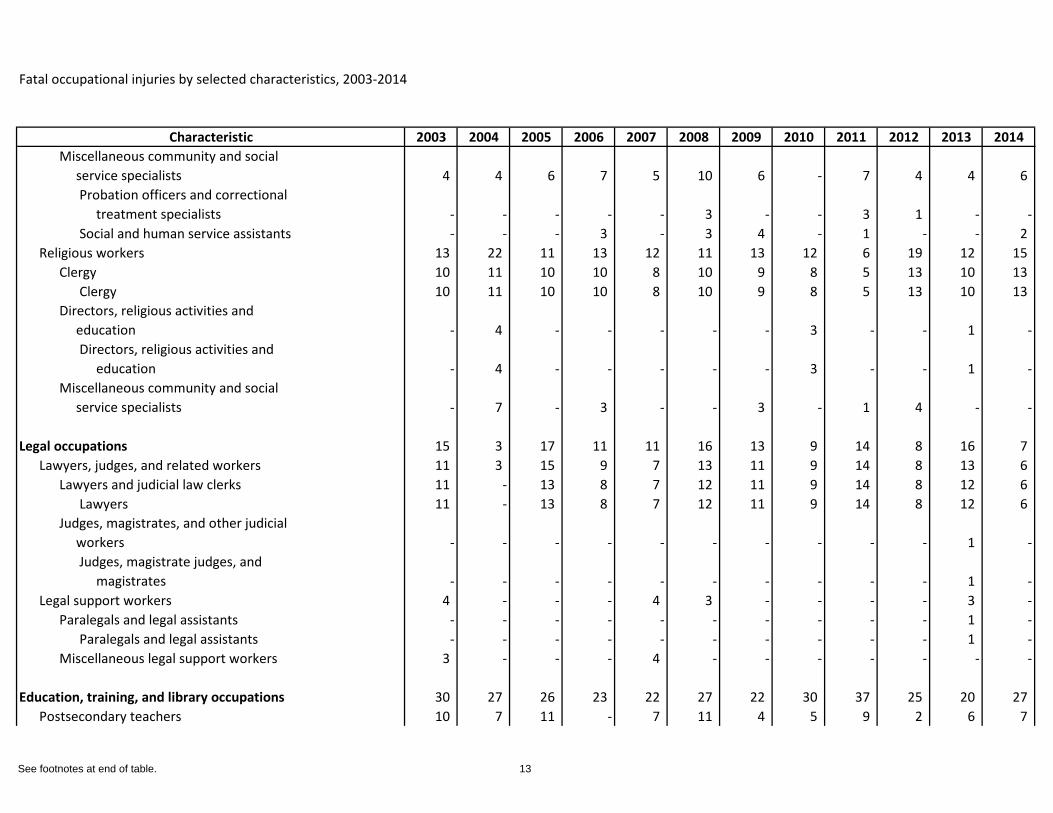
Characteristic 2003 2004 2005 2006 2007 2008 2009 2010 2011 2012 2013 2014Miscellaneous community and social service specialists 4 4 6 7 5 10 6 - 7 4 4 6
Probation officers and correctional treatment specialists - - - - - 3 - - 3 1 - -Social and human service assistants - - - 3 - 3 4 - 1 - - 2
Religious workers 13 22 11 13 12 11 13 12 6 19 12 15 Clergy 10 11 10 10 8 10 9 8 5 13 10 13
Clergy 10 11 10 10 8 10 9 8 5 13 10 13 Directors, religious activities and education - 4 - - - - - 3 - - 1 -
Directors, religious activities and education - 4 - - - - - 3 - - 1 -
Miscellaneous community and social service specialists - 7 - 3 - - 3 - 1 4 - -
Legal occupations 15 3 17 11 11 16 13 9 14 8 16 7 Lawyers, judges, and related workers 11 3 15 9 7 13 11 9 14 8 13 6
Lawyers and judicial law clerks 11 - 13 8 7 12 11 9 14 8 12 6 Lawyers 11 - 13 8 7 12 11 9 14 8 12 6
Judges, magistrates, and other judicial workers - - - - - - - - - - 1 -
Judges, magistrate judges, and magistrates - - - - - - - - - - 1 -
Legal support workers 4 - - - 4 3 - - - - 3 -Paralegals and legal assistants - - - - - - - - - - 1 -
Paralegals and legal assistants - - - - - - - - - - 1 -Miscellaneous legal support workers 3 - - - 4 - - - - - - -
Education, training, and library occupations 30 27 26 23 22 27 22 30 37 25 20 27 Postsecondary teachers 10 7 11 - 7 11 4 5 9 2 6 7
See footnotes at end of table. 13
Fatal occupational injuries by selected characteristics, 2003-2014
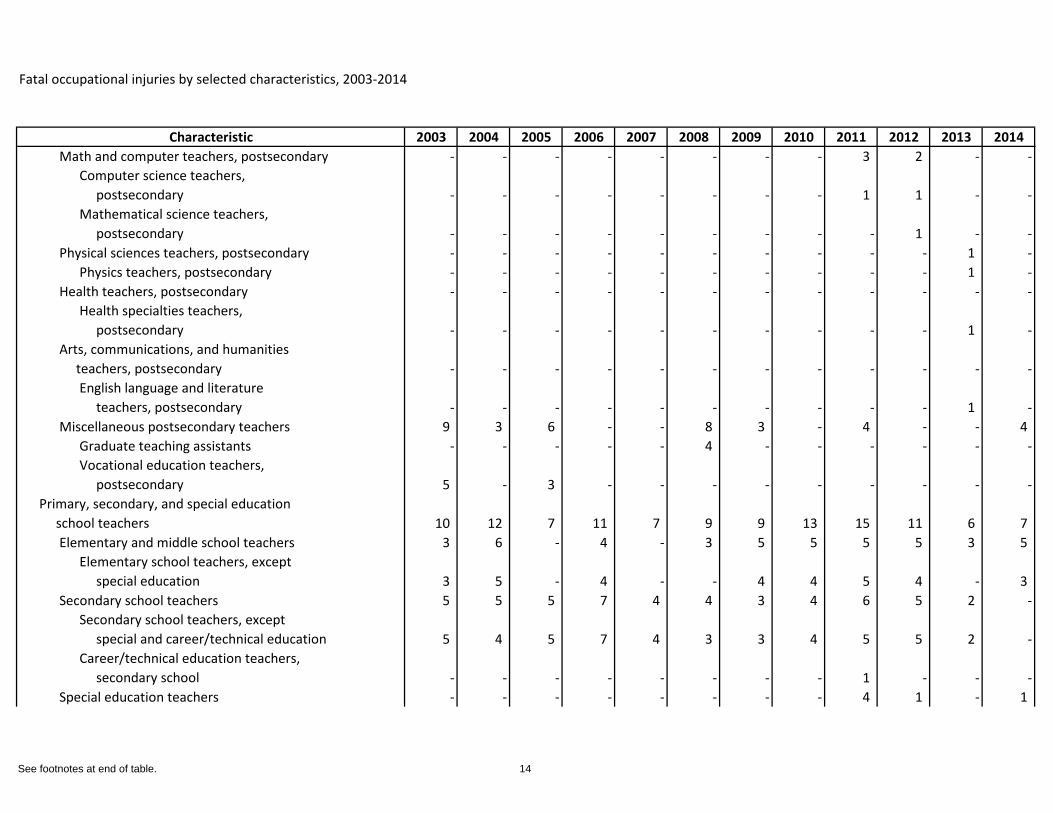
Characteristic 2003 2004 2005 2006 2007 2008 2009 2010 2011 2012 2013 2014Math and computer teachers, postsecondary - - - - - - - - 3 2 - -
Computer science teachers, postsecondary - - - - - - - - 1 1 - -Mathematical science teachers, postsecondary - - - - - - - - - 1 - -
Physical sciences teachers, postsecondary - - - - - - - - - - 1 -Physics teachers, postsecondary - - - - - - - - - - 1 -
Health teachers, postsecondary - - - - - - - - - - - -Health specialties teachers, postsecondary - - - - - - - - - - 1 -
Arts, communications, and humanities teachers, postsecondary - - - - - - - - - - - -
English language and literature teachers, postsecondary - - - - - - - - - - 1 -
Miscellaneous postsecondary teachers 9 3 6 - - 8 3 - 4 - - 4 Graduate teaching assistants - - - - - 4 - - - - - -Vocational education teachers, postsecondary 5 - 3 - - - - - - - - -
Primary, secondary, and special education school teachers 10 12 7 11 7 9 9 13 15 11 6 7
Elementary and middle school teachers 3 6 - 4 - 3 5 5 5 5 3 5 Elementary school teachers, except special education 3 5 - 4 - - 4 4 5 4 - 3
Secondary school teachers 5 5 5 7 4 4 3 4 6 5 2 -Secondary school teachers, except special and career/technical education 5 4 5 7 4 3 3 4 5 5 2 -Career/technical education teachers, secondary school - - - - - - - - 1 - - -
Special education teachers - - - - - - - - 4 1 - 1
See footnotes at end of table. 14
Fatal occupational injuries by selected characteristics, 2003-2014
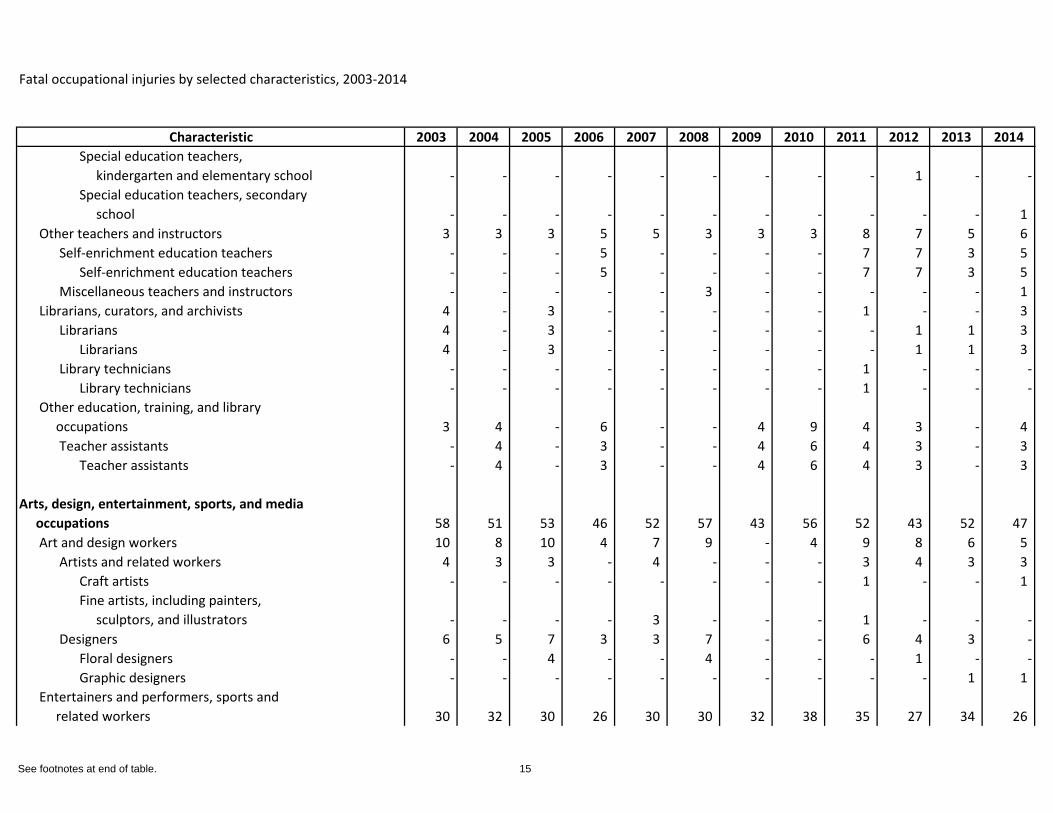
Characteristic 2003 2004 2005 2006 2007 2008 2009 2010 2011 2012 2013 2014Special education teachers, kindergarten and elementary school - - - - - - - - - 1 - -Special education teachers, secondary school - - - - - - - - - - - 1
Other teachers and instructors 3 3 3 5 5 3 3 3 8 7 5 6 Self-enrichment education teachers - - - 5 - - - - 7 7 3 5
Self-enrichment education teachers - - - 5 - - - - 7 7 3 5 Miscellaneous teachers and instructors - - - - - 3 - - - - - 1
Librarians, curators, and archivists 4 - 3 - - - - - 1 - - 3 Librarians 4 - 3 - - - - - - 1 1 3
Librarians 4 - 3 - - - - - - 1 1 3 Library technicians - - - - - - - - 1 - - -
Library technicians - - - - - - - - 1 - - -Other education, training, and library occupations 3 4 - 6 - - 4 9 4 3 - 4
Teacher assistants - 4 - 3 - - 4 6 4 3 - 3 Teacher assistants - 4 - 3 - - 4 6 4 3 - 3
Arts, design, entertainment, sports, and media occupations 58 51 53 46 52 57 43 56 52 43 52 47
Art and design workers 10 8 10 4 7 9 - 4 9 8 6 5 Artists and related workers 4 3 3 - 4 - - - 3 4 3 3
Craft artists - - - - - - - - 1 - - 1 Fine artists, including painters, sculptors, and illustrators - - - - 3 - - - 1 - - -
Designers 6 5 7 3 3 7 - - 6 4 3 -Floral designers - - 4 - - 4 - - - 1 - -Graphic designers - - - - - - - - - - 1 1
Entertainers and performers, sports and related workers 30 32 30 26 30 30 32 38 35 27 34 26
See footnotes at end of table. 15
Fatal occupational injuries by selected characteristics, 2003-2014
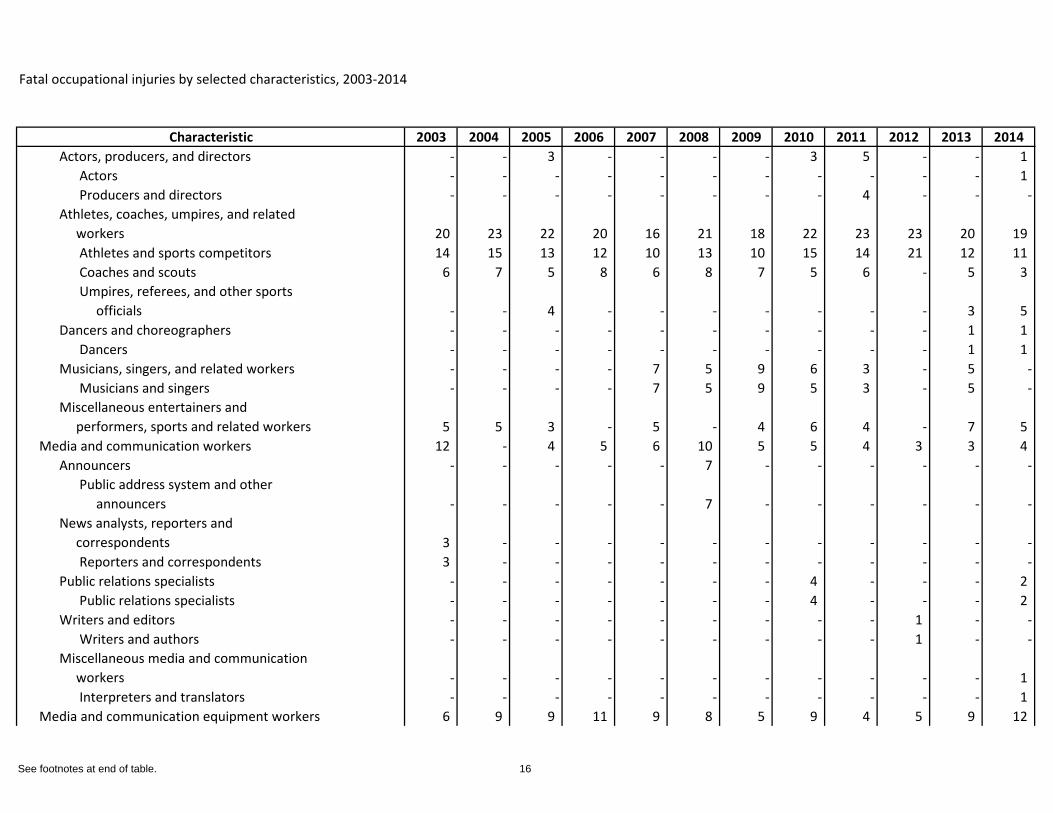
Characteristic 2003 2004 2005 2006 2007 2008 2009 2010 2011 2012 2013 2014Actors, producers, and directors - - 3 - - - - 3 5 - - 1
Actors - - - - - - - - - - - 1 Producers and directors - - - - - - - - 4 - - -
Athletes, coaches, umpires, and related workers 20 23 22 20 16 21 18 22 23 23 20 19
Athletes and sports competitors 14 15 13 12 10 13 10 15 14 21 12 11 Coaches and scouts 6 7 5 8 6 8 7 5 6 - 5 3 Umpires, referees, and other sports officials - - 4 - - - - - - - 3 5
Dancers and choreographers - - - - - - - - - - 1 1 Dancers - - - - - - - - - - 1 1
Musicians, singers, and related workers - - - - 7 5 9 6 3 - 5 -Musicians and singers - - - - 7 5 9 5 3 - 5 -
Miscellaneous entertainers and performers, sports and related workers 5 5 3 - 5 - 4 6 4 - 7 5
Media and communication workers 12 - 4 5 6 10 5 5 4 3 3 4 Announcers - - - - - 7 - - - - - -
Public address system and other announcers - - - - - 7 - - - - - -
News analysts, reporters and correspondents 3 - - - - - - - - - - -
Reporters and correspondents 3 - - - - - - - - - - -Public relations specialists - - - - - - - 4 - - - 2
Public relations specialists - - - - - - - 4 - - - 2 Writers and editors - - - - - - - - - 1 - -
Writers and authors - - - - - - - - - 1 - -Miscellaneous media and communication workers - - - - - - - - - - - 1
Interpreters and translators - - - - - - - - - - - 1 Media and communication equipment workers 6 9 9 11 9 8 5 9 4 5 9 12
See footnotes at end of table. 16
Fatal occupational injuries by selected characteristics, 2003-2014
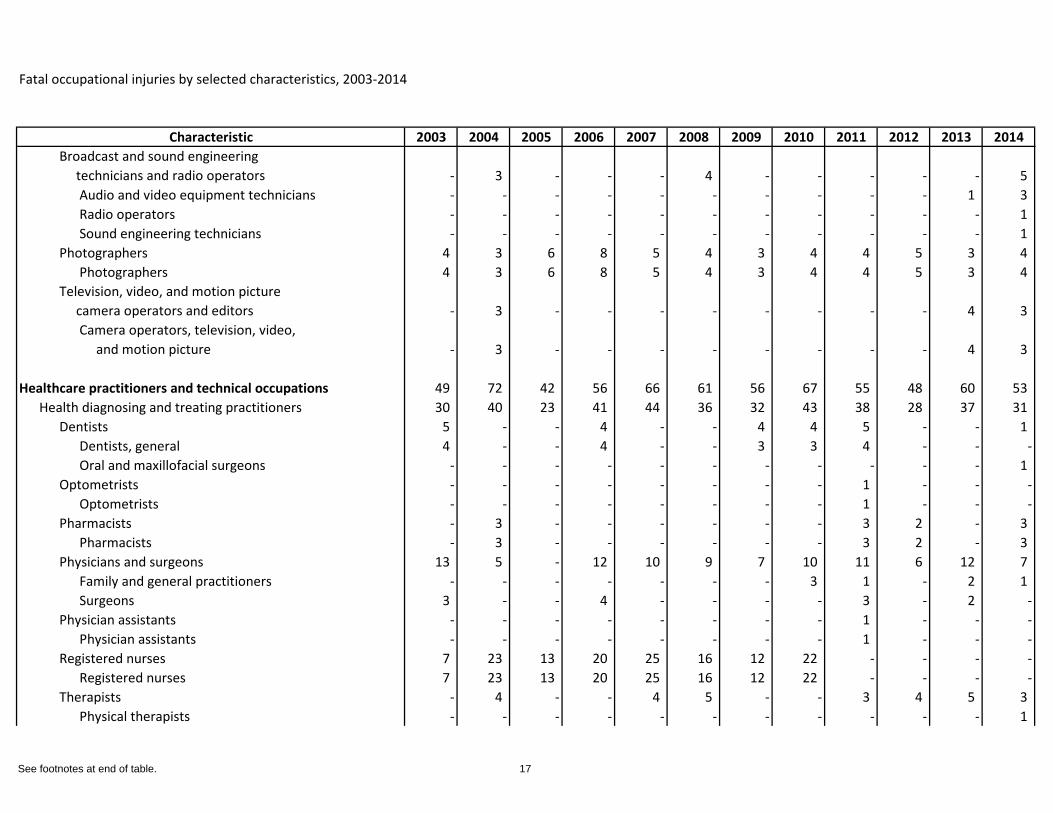
Characteristic 2003 2004 2005 2006 2007 2008 2009 2010 2011 2012 2013 2014Broadcast and sound engineering technicians and radio operators - 3 - - - 4 - - - - - 5
Audio and video equipment technicians - - - - - - - - - - 1 3 Radio operators - - - - - - - - - - - 1 Sound engineering technicians - - - - - - - - - - - 1
Photographers 4 3 6 8 5 4 3 4 4 5 3 4 Photographers 4 3 6 8 5 4 3 4 4 5 3 4
Television, video, and motion picture camera operators and editors - 3 - - - - - - - - 4 3
Camera operators, television, video, and motion picture - 3 - - - - - - - - 4 3
Healthcare practitioners and technical occupations 49 72 42 56 66 61 56 67 55 48 60 53 Health diagnosing and treating practitioners 30 40 23 41 44 36 32 43 38 28 37 31
Dentists 5 - - 4 - - 4 4 5 - - 1 Dentists, general 4 - - 4 - - 3 3 4 - - -Oral and maxillofacial surgeons - - - - - - - - - - - 1
Optometrists - - - - - - - - 1 - - -Optometrists - - - - - - - - 1 - - -
Pharmacists - 3 - - - - - - 3 2 - 3 Pharmacists - 3 - - - - - - 3 2 - 3
Physicians and surgeons 13 5 - 12 10 9 7 10 11 6 12 7 Family and general practitioners - - - - - - - 3 1 - 2 1 Surgeons 3 - - 4 - - - - 3 - 2 -
Physician assistants - - - - - - - - 1 - - -Physician assistants - - - - - - - - 1 - - -
Registered nurses 7 23 13 20 25 16 12 22 - - - -Registered nurses 7 23 13 20 25 16 12 22 - - - -
Therapists - 4 - - 4 5 - - 3 4 5 3 Physical therapists - - - - - - - - - - - 1
See footnotes at end of table. 17
Fatal occupational injuries by selected characteristics, 2003-2014
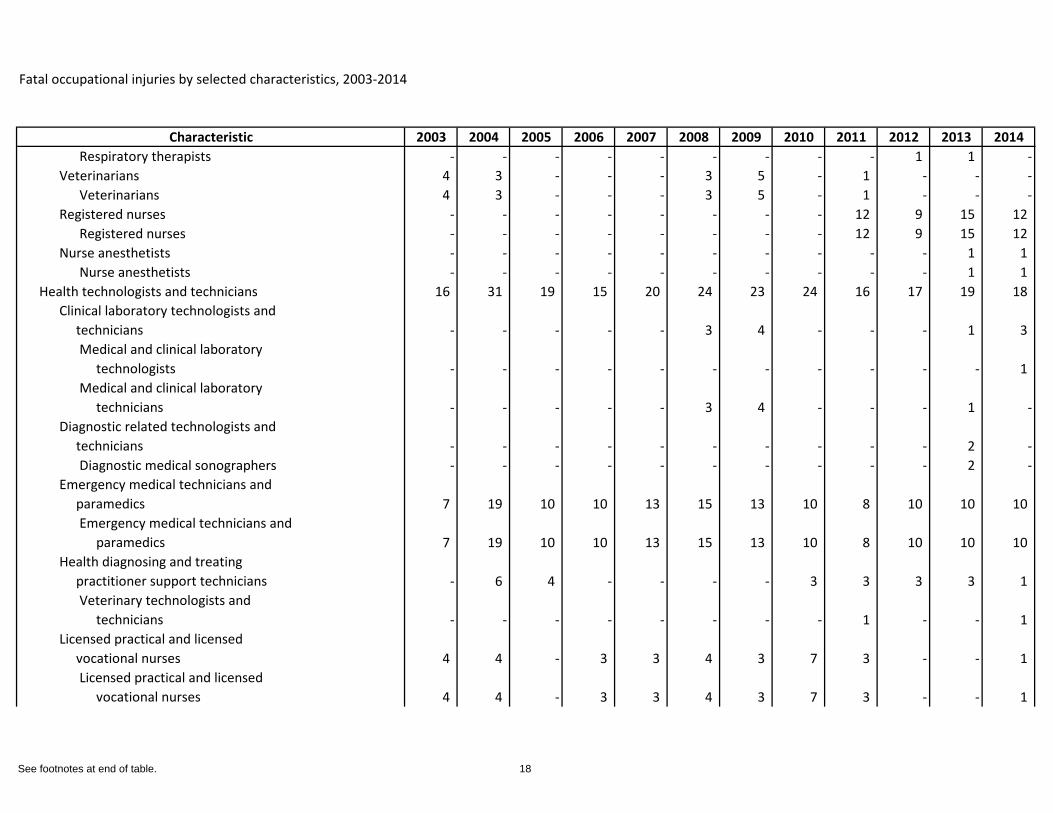
Characteristic 2003 2004 2005 2006 2007 2008 2009 2010 2011 2012 2013 2014Respiratory therapists - - - - - - - - - 1 1 -
Veterinarians 4 3 - - - 3 5 - 1 - - -Veterinarians 4 3 - - - 3 5 - 1 - - -
Registered nurses - - - - - - - - 12 9 15 12 Registered nurses - - - - - - - - 12 9 15 12
Nurse anesthetists - - - - - - - - - - 1 1 Nurse anesthetists - - - - - - - - - - 1 1
Health technologists and technicians 16 31 19 15 20 24 23 24 16 17 19 18 Clinical laboratory technologists and technicians - - - - - 3 4 - - - 1 3
Medical and clinical laboratory technologists - - - - - - - - - - - 1 Medical and clinical laboratory technicians - - - - - 3 4 - - - 1 -
Diagnostic related technologists and technicians - - - - - - - - - - 2 -
Diagnostic medical sonographers - - - - - - - - - - 2 -Emergency medical technicians and paramedics 7 19 10 10 13 15 13 10 8 10 10 10
Emergency medical technicians and paramedics 7 19 10 10 13 15 13 10 8 10 10 10
Health diagnosing and treating practitioner support technicians - 6 4 - - - - 3 3 3 3 1
Veterinary technologists and technicians - - - - - - - - 1 - - 1
Licensed practical and licensed vocational nurses 4 4 - 3 3 4 3 7 3 - - 1
Licensed practical and licensed vocational nurses 4 4 - 3 3 4 3 7 3 - - 1
See footnotes at end of table. 18
Fatal occupational injuries by selected characteristics, 2003-2014
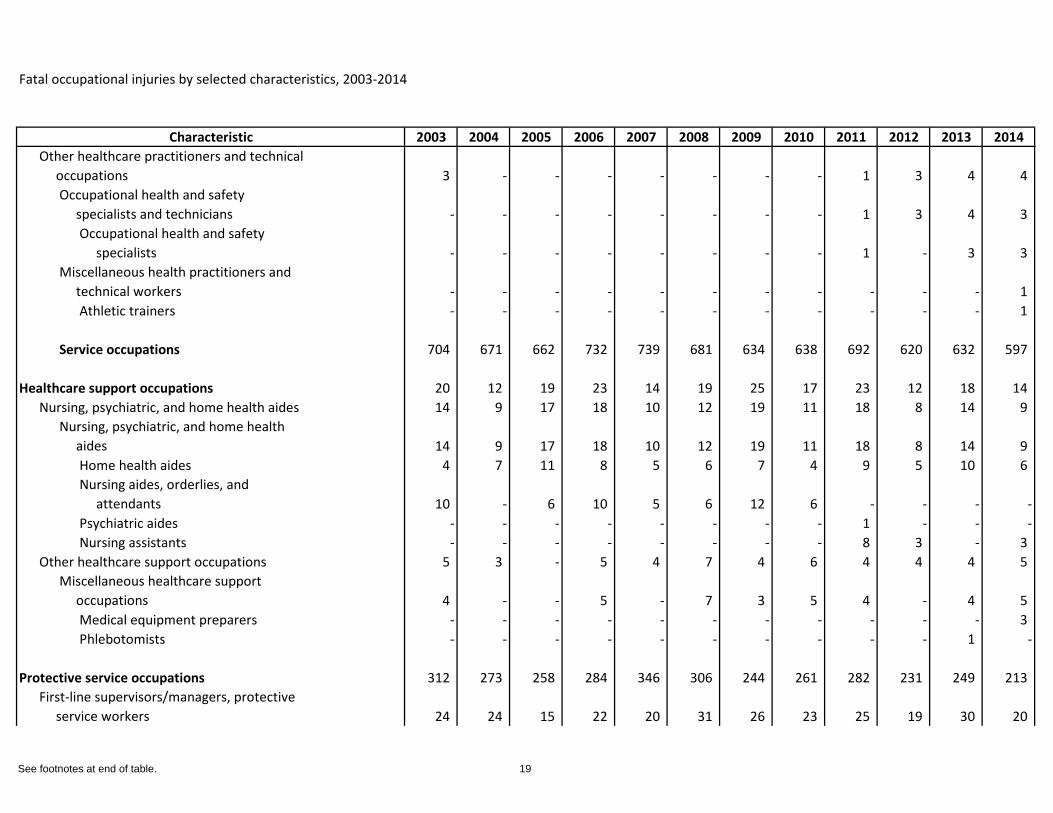
Characteristic 2003 2004 2005 2006 2007 2008 2009 2010 2011 2012 2013 2014Other healthcare practitioners and technical occupations 3 - - - - - - - 1 3 4 4
Occupational health and safety specialists and technicians - - - - - - - - 1 3 4 3
Occupational health and safety specialists - - - - - - - - 1 - 3 3
Miscellaneous health practitioners and technical workers - - - - - - - - - - - 1
Athletic trainers - - - - - - - - - - - 1
Service occupations 704 671 662 732 739 681 634 638 692 620 632 597
Healthcare support occupations 20 12 19 23 14 19 25 17 23 12 18 14 Nursing, psychiatric, and home health aides 14 9 17 18 10 12 19 11 18 8 14 9
Nursing, psychiatric, and home health aides 14 9 17 18 10 12 19 11 18 8 14 9
Home health aides 4 7 11 8 5 6 7 4 9 5 10 6 Nursing aides, orderlies, and attendants 10 - 6 10 5 6 12 6 - - - -Psychiatric aides - - - - - - - - 1 - - -Nursing assistants - - - - - - - - 8 3 - 3
Other healthcare support occupations 5 3 - 5 4 7 4 6 4 4 4 5 Miscellaneous healthcare support occupations 4 - - 5 - 7 3 5 4 - 4 5
Medical equipment preparers - - - - - - - - - - - 3 Phlebotomists - - - - - - - - - - 1 -
Protective service occupations 312 273 258 284 346 306 244 261 282 231 249 213 First-line supervisors/managers, protective service workers 24 24 15 22 20 31 26 23 25 19 30 20
See footnotes at end of table. 19
Fatal occupational injuries by selected characteristics, 2003-2014
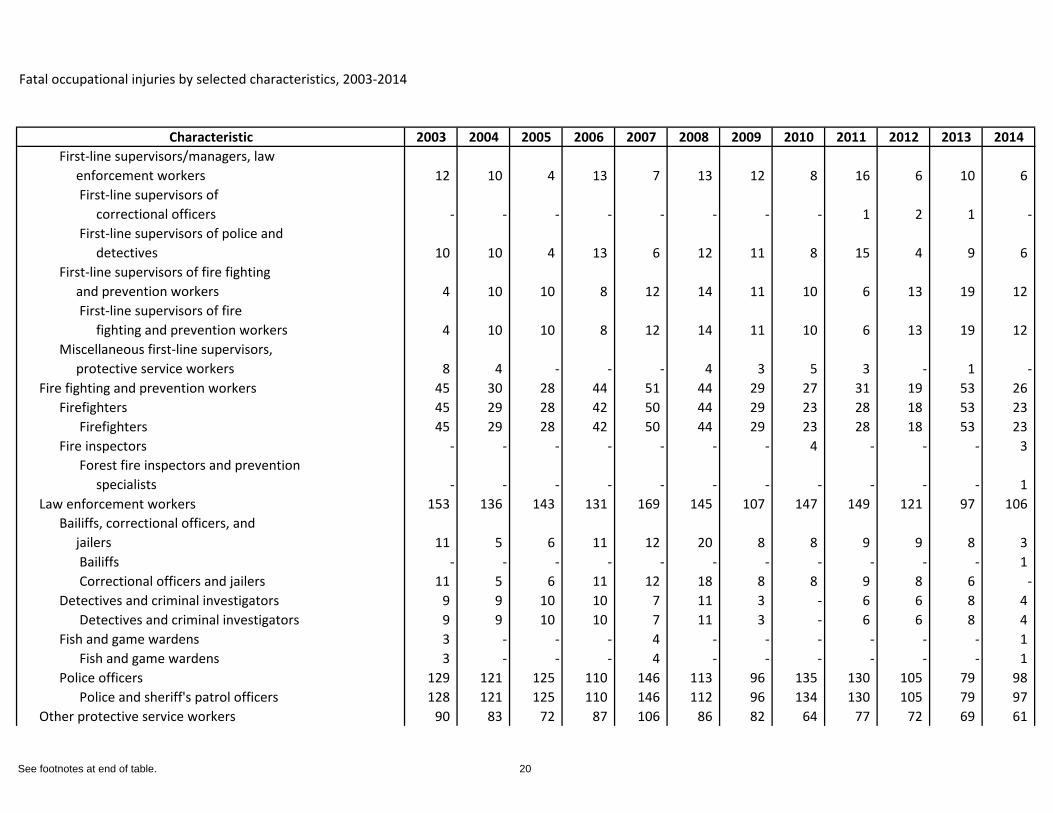
Characteristic 2003 2004 2005 2006 2007 2008 2009 2010 2011 2012 2013 2014First-line supervisors/managers, law enforcement workers 12 10 4 13 7 13 12 8 16 6 10 6
First-line supervisors of correctional officers - - - - - - - - 1 2 1 -First-line supervisors of police and detectives 10 10 4 13 6 12 11 8 15 4 9 6
First-line supervisors of fire fighting and prevention workers 4 10 10 8 12 14 11 10 6 13 19 12
First-line supervisors of fire fighting and prevention workers 4 10 10 8 12 14 11 10 6 13 19 12
Miscellaneous first-line supervisors, protective service workers 8 4 - - - 4 3 5 3 - 1 -
Fire fighting and prevention workers 45 30 28 44 51 44 29 27 31 19 53 26 Firefighters 45 29 28 42 50 44 29 23 28 18 53 23
Firefighters 45 29 28 42 50 44 29 23 28 18 53 23 Fire inspectors - - - - - - - 4 - - - 3
Forest fire inspectors and prevention specialists - - - - - - - - - - - 1
Law enforcement workers 153 136 143 131 169 145 107 147 149 121 97 106 Bailiffs, correctional officers, and jailers 11 5 6 11 12 20 8 8 9 9 8 3
Bailiffs - - - - - - - - - - - 1 Correctional officers and jailers 11 5 6 11 12 18 8 8 9 8 6 -
Detectives and criminal investigators 9 9 10 10 7 11 3 - 6 6 8 4 Detectives and criminal investigators 9 9 10 10 7 11 3 - 6 6 8 4
Fish and game wardens 3 - - - 4 - - - - - - 1 Fish and game wardens 3 - - - 4 - - - - - - 1
Police officers 129 121 125 110 146 113 96 135 130 105 79 98 Police and sheriff's patrol officers 128 121 125 110 146 112 96 134 130 105 79 97
Other protective service workers 90 83 72 87 106 86 82 64 77 72 69 61
See footnotes at end of table. 20
Fatal occupational injuries by selected characteristics, 2003-2014
Characteristic 2003 2004 2005 2006 2007 2008 2009 2010 2011 2012 2013 2014Animal control workers - - - - - - - - - - - 1
Animal control workers - - - - - - - - - - - 1 Private detectives and investigators - - - - - - - - 1 - - -
Private detectives and investigators - - - - - - - - 1 - - -Security guards and gaming surveillance officers 71 69 60 73 84 70 64 52 64 51 58 40
Security guards 71 67 60 73 84 70 63 51 64 51 58 40 Miscellaneous protective service workers 18 13 12 13 21 13 17 12 10 18 11 18
Crossing guards 17 7 10 9 14 9 12 9 7 12 7 10 Lifeguards, ski patrol, and other recreational protective service workers - - - - - 4 - 3 - - - 4 Transportation security screeners - - - - - - - - - - 1 -
Food preparation and serving related occupations 72 52 59 86 61 65 59 61 47 57 68 55 Supervisors, food preparation and serving workers 20 10 26 30 24 24 15 21 12 14 23 19
First-line supervisors/managers, food preparation and serving workers 20 10 26 30 24 24 15 21 12 14 23 19
Chefs and head cooks 4 - - 3 3 5 4 4 3 4 8 8 First-line supervisors of food preparation and serving workers 16 10 25 27 21 19 11 17 9 10 15 11
Cooks 18 10 14 15 12 12 16 13 12 15 27 15 Cooks 16 9 12 12 12 10 12 13 9 10 23 12
Cooks, fast food 7 - - - - - - 3 - - 6 -Cooks, institution and cafeteria - - 3 - - - - - 3 - 3 -Cooks, restaurant 5 5 9 5 8 7 8 8 4 9 9 6
Food preparation workers - - - 3 - - 4 - 3 5 4 3 Food preparation workers - - - 3 - - 4 - 3 5 4 3
Food and beverage serving workers 28 27 15 31 18 22 26 18 22 22 15 13 Bartenders 8 11 5 7 4 7 6 4 5 3 3 5
See footnotes at end of table. 21
Fatal occupational injuries by selected characteristics, 2003-2014
Characteristic 2003 2004 2005 2006 2007 2008 2009 2010 2011 2012 2013 2014Bartenders 8 11 5 7 4 7 6 4 5 3 3 5
Fast food and counter workers 10 10 7 11 9 12 11 7 4 10 4 5 Combined food preparation and serving workers, including fast food 8 7 7 7 7 8 7 5 4 8 3 4 Counter attendants, cafeteria, food concession, and coffee shop - 3 - 4 - 4 4 - - 2 - 1
Waiters and waitresses 10 5 - 12 4 3 7 6 13 8 8 3 Waiters and waitresses 10 5 - 12 4 3 7 6 13 8 8 3
Other food preparation and serving related workers 6 5 4 10 7 7 - 9 - 6 3 8
Dining room and cafeteria attendants and bartender helpers - 3 - 6 - - - 3 - 3 - 3
Dining room and cafeteria attendants and bartender helpers - 3 - 6 - - - 3 - 3 - 3
Dishwashers 5 - 4 - 4 3 - 4 - - - 3 Dishwashers 5 - 4 - 4 3 - 4 - - - 3
Miscellaneous food preparation and serving related workers - - - 3 - - - - - - - -
Building and grounds cleaning and maintenance occupations 247 278 264 282 255 234 258 233 269 255 249 252
Supervisors, building and grounds cleaning and maintenance workers 41 43 36 37 33 37 48 40 33 43 42 38
First-line supervisors/managers, building and grounds cleaning and maintenance workers 41 43 36 37 33 37 48 40 33 43 42 38
First-line supervisors of housekeeping and janitorial workers 9 6 7 7 3 9 5 10 5 3 3 5 First-line supervisors of landscaping, lawn service, and groundskeeping workers 32 37 29 30 30 28 43 30 28 40 39 33
See footnotes at end of table. 22
Fatal occupational injuries by selected characteristics, 2003-2014
Characteristic 2003 2004 2005 2006 2007 2008 2009 2010 2011 2012 2013 2014Building cleaning and pest control workers 50 66 58 75 62 66 56 49 53 53 56 56
Building cleaning workers 48 63 56 69 59 59 53 46 50 48 50 54 Janitors and cleaners, except maids and housekeeping cleaners 43 47 46 56 43 53 40 38 42 32 39 46 Maids and housekeeping cleaners 5 15 7 10 14 - 12 8 7 13 5 6
Pest control workers - 3 - 6 3 7 3 3 3 5 6 -Pest control workers - 3 - 6 3 7 3 3 3 5 6 -
Grounds maintenance workers 156 169 170 170 160 131 154 144 183 159 151 158 Grounds maintenance workers 156 169 170 170 160 131 154 144 183 159 151 158
Landscaping and groundskeeping workers 80 99 109 100 90 81 97 80 97 82 78 88 Pesticide handlers, sprayers, and applicators, vegetation - - - - - - - - 3 - - -Tree trimmers and pruners 67 65 60 67 69 49 56 60 83 71 71 68
Personal care and service occupations 53 56 62 57 63 57 48 66 71 65 48 63 Supervisors, personal care and service workers - 6 6 5 5 6 7 10 5 10 5 6
First-line supervisors/managers of personal service workers - 6 6 5 5 6 6 10 5 10 5 6
First-line supervisors of personal service workers - 6 6 5 5 6 6 10 5 10 5 6
Animal care and service workers 18 11 6 13 10 8 8 15 14 11 8 12 Animal trainers 8 5 3 8 5 4 3 8 8 5 4 7
Animal trainers 8 5 3 8 5 4 3 8 8 5 4 7 Nonfarm animal caretakers 10 6 3 5 5 4 5 7 6 6 4 5
Nonfarm animal caretakers 10 6 3 5 5 4 5 7 6 6 4 5 Entertainment attendants and related workers 10 7 7 8 9 7 8 13 18 6 3 6
Ushers, lobby attendants, and ticket takers - - - - - - - - 3 1 - -
Ushers, lobby attendants, and ticket takers - - - - - - - - 3 1 - -
See footnotes at end of table. 23
Fatal occupational injuries by selected characteristics, 2003-2014
Characteristic 2003 2004 2005 2006 2007 2008 2009 2010 2011 2012 2013 2014Miscellaneous entertainment attendants and related workers 7 7 6 6 7 6 5 11 14 4 3 5
Amusement and recreation attendants 6 6 6 6 7 5 5 11 13 4 3 5 Funeral service workers - - - - - - - - - - 3 -
Morticians, undertakers, and funeral directors - - - - - - - - - 1 1 -
Morticians, undertakers, and funeral directors - - - - - - - - - 1 1 -
Personal appearance workers 7 7 11 6 11 12 10 5 14 7 10 9 Barbers and cosmetologists 6 5 11 6 11 9 10 4 13 6 8 8
Barbers 4 3 8 - 8 6 7 - 8 2 8 5 Hairdressers, hairstylists, and cosmetologists - - - 4 3 3 3 - 5 4 - 3
Miscellaneous personal appearance workers - - - - - - - - 1 - - 1 Manicurists and pedicurists - - - - - - - - 1 - - 1
Transportation, tourism, and lodging attendants 5 7 12 5 8 9 6 4 - - - -
Tour and travel guides 3 5 10 3 5 5 3 3 - - - -Tour guides and escorts 3 5 9 3 5 5 3 3 - - - -
Tour and travel guides - - - - - - - - 4 4 - 9 Tour and travel guides - - - - - - - - 4 4 - 9
Tour guides and escorts - - - - - - - - - 4 - 6 Travel guides - - - - - - - - - - - 3
Other personal care and service workers 10 17 19 20 20 15 9 18 14 23 17 21 Child care workers - 6 4 9 5 - 3 8 4 3 4 4
Childcare workers - 6 4 9 5 - 3 8 4 3 4 4 Personal and home care aides - 4 - 6 7 5 - 3 4 11 5 5
Personal care aides - 4 - 6 7 5 - 3 4 11 5 5 Recreation and fitness workers 3 5 7 - 4 6 - 5 6 7 7 4
Recreation workers 3 4 7 - 4 6 - 5 5 6 7 3
See footnotes at end of table. 24
Fatal occupational injuries by selected characteristics, 2003-2014
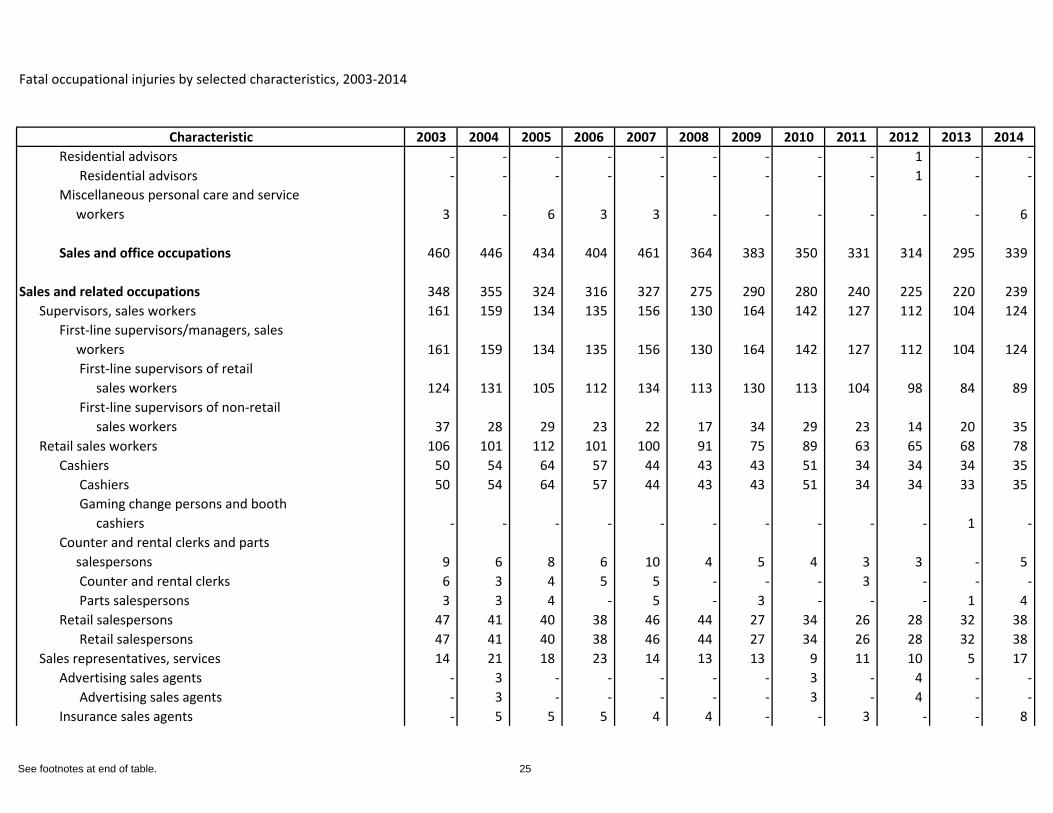
Characteristic 2003 2004 2005 2006 2007 2008 2009 2010 2011 2012 2013 2014Residential advisors - - - - - - - - - 1 - -
Residential advisors - - - - - - - - - 1 - -Miscellaneous personal care and service workers 3 - 6 3 3 - - - - - - 6
Sales and office occupations 460 446 434 404 461 364 383 350 331 314 295 339
Sales and related occupations 348 355 324 316 327 275 290 280 240 225 220 239 Supervisors, sales workers 161 159 134 135 156 130 164 142 127 112 104 124
First-line supervisors/managers, sales workers 161 159 134 135 156 130 164 142 127 112 104 124
First-line supervisors of retail sales workers 124 131 105 112 134 113 130 113 104 98 84 89 First-line supervisors of non-retail sales workers 37 28 29 23 22 17 34 29 23 14 20 35
Retail sales workers 106 101 112 101 100 91 75 89 63 65 68 78 Cashiers 50 54 64 57 44 43 43 51 34 34 34 35
Cashiers 50 54 64 57 44 43 43 51 34 34 33 35 Gaming change persons and booth cashiers - - - - - - - - - - 1 -
Counter and rental clerks and parts salespersons 9 6 8 6 10 4 5 4 3 3 - 5
Counter and rental clerks 6 3 4 5 5 - - - 3 - - -Parts salespersons 3 3 4 - 5 - 3 - - - 1 4
Retail salespersons 47 41 40 38 46 44 27 34 26 28 32 38 Retail salespersons 47 41 40 38 46 44 27 34 26 28 32 38
Sales representatives, services 14 21 18 23 14 13 13 9 11 10 5 17 Advertising sales agents - 3 - - - - - 3 - 4 - -
Advertising sales agents - 3 - - - - - 3 - 4 - -Insurance sales agents - 5 5 5 4 4 - - 3 - - 8
See footnotes at end of table. 25
Fatal occupational injuries by selected characteristics, 2003-2014
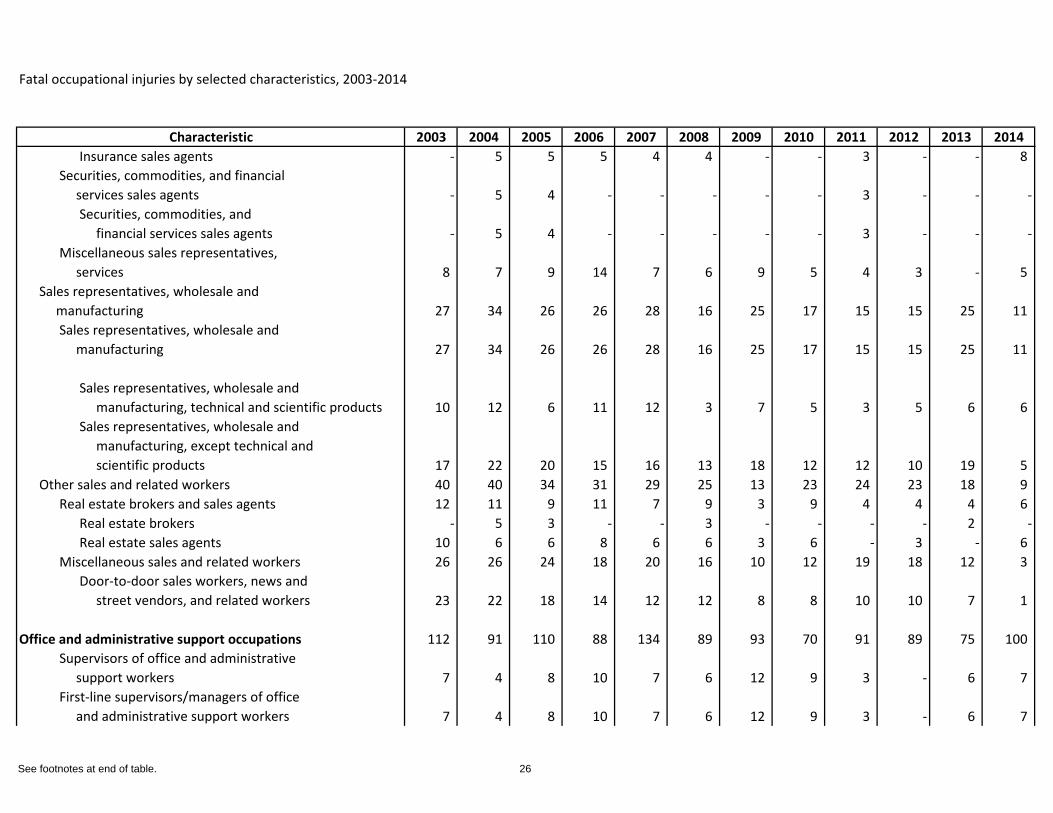
Characteristic 2003 2004 2005 2006 2007 2008 2009 2010 2011 2012 2013 2014Insurance sales agents - 5 5 5 4 4 - - 3 - - 8
Securities, commodities, and financial services sales agents - 5 4 - - - - - 3 - - -
Securities, commodities, and financial services sales agents - 5 4 - - - - - 3 - - -
Miscellaneous sales representatives, services 8 7 9 14 7 6 9 5 4 3 - 5
Sales representatives, wholesale and manufacturing 27 34 26 26 28 16 25 17 15 15 25 11
Sales representatives, wholesale and manufacturing 27 34 26 26 28 16 25 17 15 15 25 11
Sales representatives, wholesale and manufacturing, technical and scientific products 10 12 6 11 12 3 7 5 3 5 6 6 Sales representatives, wholesale and manufacturing, except technical and scientific products 17 22 20 15 16 13 18 12 12 10 19 5
Other sales and related workers 40 40 34 31 29 25 13 23 24 23 18 9 Real estate brokers and sales agents 12 11 9 11 7 9 3 9 4 4 4 6
Real estate brokers - 5 3 - - 3 - - - - 2 -Real estate sales agents 10 6 6 8 6 6 3 6 - 3 - 6
Miscellaneous sales and related workers 26 26 24 18 20 16 10 12 19 18 12 3 Door-to-door sales workers, news and street vendors, and related workers 23 22 18 14 12 12 8 8 10 10 7 1
Office and administrative support occupations 112 91 110 88 134 89 93 70 91 89 75 100 Supervisors of office and administrative support workers 7 4 8 10 7 6 12 9 3 - 6 7 First-line supervisors/managers of office and administrative support workers 7 4 8 10 7 6 12 9 3 - 6 7
See footnotes at end of table. 26
Fatal occupational injuries by selected characteristics, 2003-2014
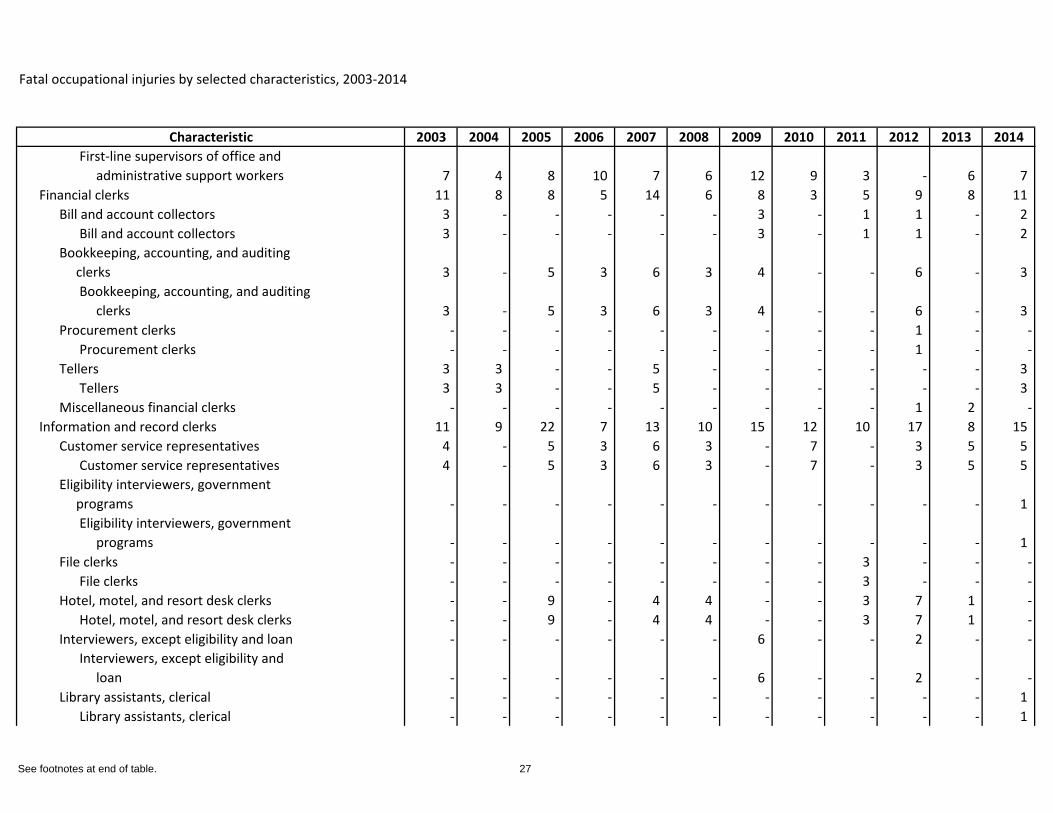
Characteristic 2003 2004 2005 2006 2007 2008 2009 2010 2011 2012 2013 2014First-line supervisors of office and administrative support workers 7 4 8 10 7 6 12 9 3 - 6 7
Financial clerks 11 8 8 5 14 6 8 3 5 9 8 11 Bill and account collectors 3 - - - - - 3 - 1 1 - 2
Bill and account collectors 3 - - - - - 3 - 1 1 - 2 Bookkeeping, accounting, and auditing clerks 3 - 5 3 6 3 4 - - 6 - 3
Bookkeeping, accounting, and auditing clerks 3 - 5 3 6 3 4 - - 6 - 3
Procurement clerks - - - - - - - - - 1 - -Procurement clerks - - - - - - - - - 1 - -
Tellers 3 3 - - 5 - - - - - - 3 Tellers 3 3 - - 5 - - - - - - 3
Miscellaneous financial clerks - - - - - - - - - 1 2 -Information and record clerks 11 9 22 7 13 10 15 12 10 17 8 15
Customer service representatives 4 - 5 3 6 3 - 7 - 3 5 5 Customer service representatives 4 - 5 3 6 3 - 7 - 3 5 5
Eligibility interviewers, government programs - - - - - - - - - - - 1
Eligibility interviewers, government programs - - - - - - - - - - - 1
File clerks - - - - - - - - 3 - - -File clerks - - - - - - - - 3 - - -
Hotel, motel, and resort desk clerks - - 9 - 4 4 - - 3 7 1 -Hotel, motel, and resort desk clerks - - 9 - 4 4 - - 3 7 1 -
Interviewers, except eligibility and loan - - - - - - 6 - - 2 - -Interviewers, except eligibility and loan - - - - - - 6 - - 2 - -
Library assistants, clerical - - - - - - - - - - - 1 Library assistants, clerical - - - - - - - - - - - 1
See footnotes at end of table. 27
Fatal occupational injuries by selected characteristics, 2003-2014
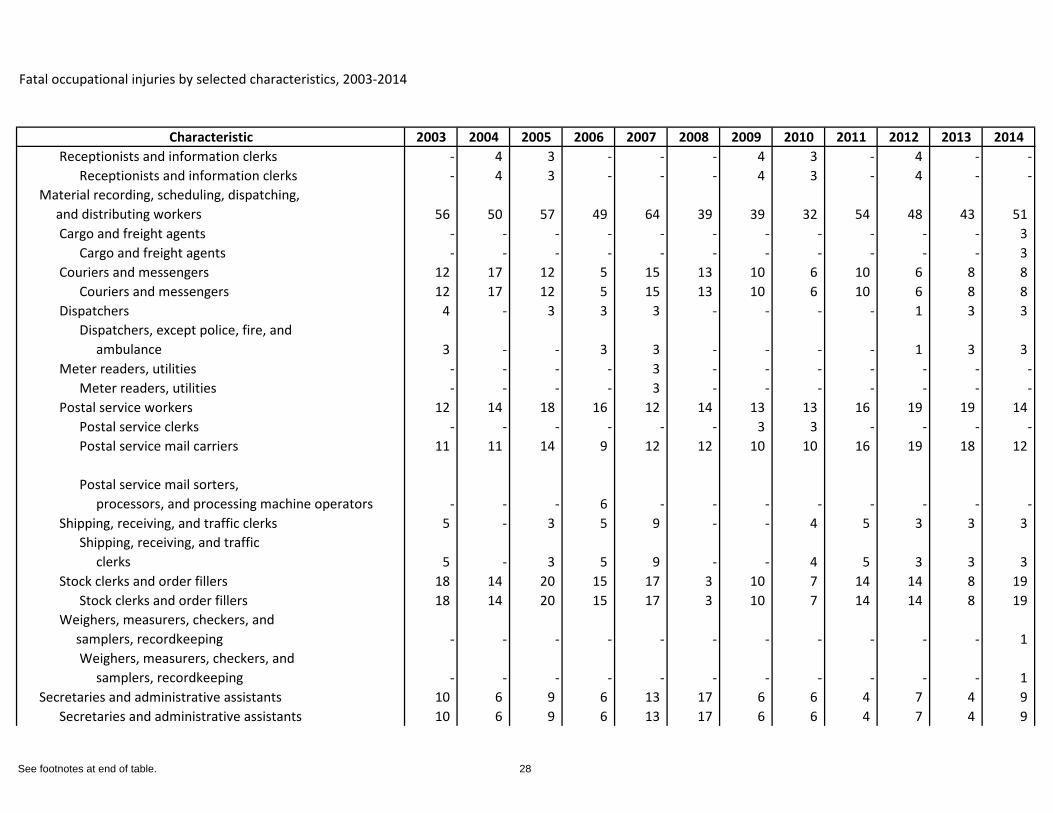
Characteristic 2003 2004 2005 2006 2007 2008 2009 2010 2011 2012 2013 2014Receptionists and information clerks - 4 3 - - - 4 3 - 4 - -
Receptionists and information clerks - 4 3 - - - 4 3 - 4 - -Material recording, scheduling, dispatching, and distributing workers 56 50 57 49 64 39 39 32 54 48 43 51
Cargo and freight agents - - - - - - - - - - - 3 Cargo and freight agents - - - - - - - - - - - 3
Couriers and messengers 12 17 12 5 15 13 10 6 10 6 8 8 Couriers and messengers 12 17 12 5 15 13 10 6 10 6 8 8
Dispatchers 4 - 3 3 3 - - - - 1 3 3 Dispatchers, except police, fire, and ambulance 3 - - 3 3 - - - - 1 3 3
Meter readers, utilities - - - - 3 - - - - - - -Meter readers, utilities - - - - 3 - - - - - - -
Postal service workers 12 14 18 16 12 14 13 13 16 19 19 14 Postal service clerks - - - - - - 3 3 - - - -Postal service mail carriers 11 11 14 9 12 12 10 10 16 19 18 12
Postal service mail sorters, processors, and processing machine operators - - - 6 - - - - - - - -
Shipping, receiving, and traffic clerks 5 - 3 5 9 - - 4 5 3 3 3 Shipping, receiving, and traffic clerks 5 - 3 5 9 - - 4 5 3 3 3
Stock clerks and order fillers 18 14 20 15 17 3 10 7 14 14 8 19 Stock clerks and order fillers 18 14 20 15 17 3 10 7 14 14 8 19
Weighers, measurers, checkers, and samplers, recordkeeping - - - - - - - - - - - 1
Weighers, measurers, checkers, and samplers, recordkeeping - - - - - - - - - - - 1
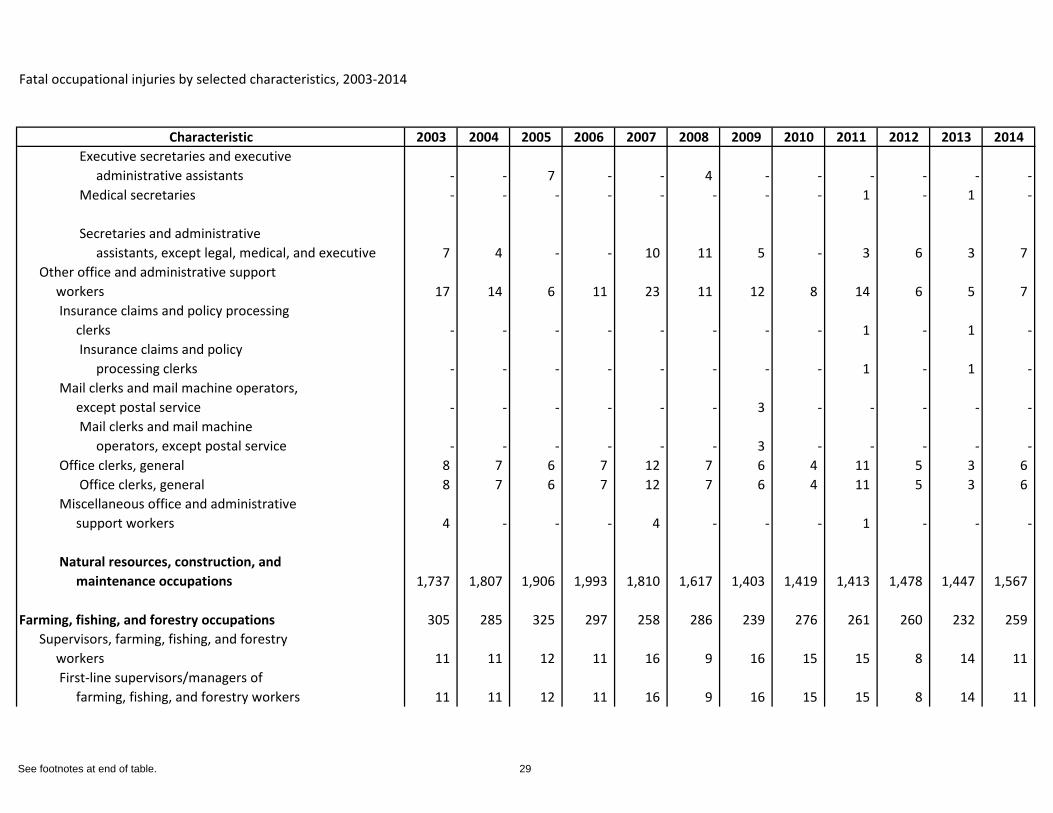
Secretaries and administrative assistants 10 6 9 6 13 17 6 6 4 7 4 9 Secretaries and administrative assistants 10 6 9 6 13 17 6 6 4 7 4 9
See footnotes at end of table. 28
Fatal occupational injuries by selected characteristics, 2003-2014
Characteristic 2003 2004 2005 2006 2007 2008 2009 2010 2011 2012 2013 2014Executive secretaries and executive administrative assistants - - 7 - - 4 - - - - - -Medical secretaries - - - - - - - - 1 - 1 -
Secretaries and administrative assistants, except legal, medical, and executive 7 4 - - 10 11 5 - 3 6 3 7
Other office and administrative support workers 17 14 6 11 23 11 12 8 14 6 5 7
Insurance claims and policy processing clerks - - - - - - - - 1 - 1 -
Insurance claims and policy processing clerks - - - - - - - - 1 - 1 -
Mail clerks and mail machine operators, except postal service - - - - - - 3 - - - - -
Mail clerks and mail machine operators, except postal service - - - - - - 3 - - - - -
Office clerks, general 8 7 6 7 12 7 6 4 11 5 3 6 Office clerks, general 8 7 6 7 12 7 6 4 11 5 3 6
Miscellaneous office and administrative support workers 4 - - - 4 - - - 1 - - -
Natural resources, construction, and maintenance occupations 1,737 1,807 1,906 1,993 1,810 1,617 1,403 1,419 1,413 1,478 1,447 1,567
Farming, fishing, and forestry occupations 305 285 325 297 258 286 239 276 261 260 232 259 Supervisors, farming, fishing, and forestry workers 11 11 12 11 16 9 16 15 15 8 14 11
First-line supervisors/managers of farming, fishing, and forestry workers 11 11 12 11 16 9 16 15 15 8 14 11
See footnotes at end of table. 29
Fatal occupational injuries by selected characteristics, 2003-2014
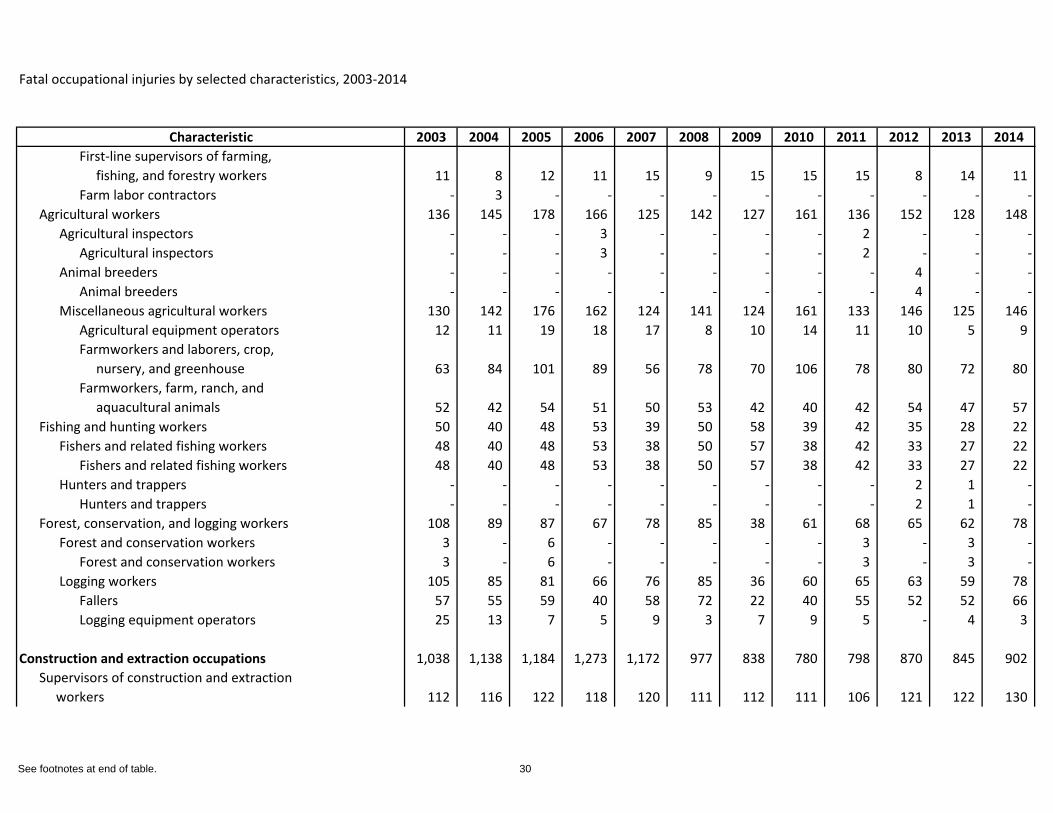
Characteristic 2003 2004 2005 2006 2007 2008 2009 2010 2011 2012 2013 2014First-line supervisors of farming, fishing, and forestry workers 11 8 12 11 15 9 15 15 15 8 14 11 Farm labor contractors - 3 - - - - - - - - - -
Agricultural workers 136 145 178 166 125 142 127 161 136 152 128 148 Agricultural inspectors - - - 3 - - - - 2 - - -
Agricultural inspectors - - - 3 - - - - 2 - - -Animal breeders - - - - - - - - - 4 - -
Animal breeders - - - - - - - - - 4 - -Miscellaneous agricultural workers 130 142 176 162 124 141 124 161 133 146 125 146
Agricultural equipment operators 12 11 19 18 17 8 10 14 11 10 5 9 Farmworkers and laborers, crop, nursery, and greenhouse 63 84 101 89 56 78 70 106 78 80 72 80 Farmworkers, farm, ranch, and aquacultural animals 52 42 54 51 50 53 42 40 42 54 47 57
Fishing and hunting workers 50 40 48 53 39 50 58 39 42 35 28 22 Fishers and related fishing workers 48 40 48 53 38 50 57 38 42 33 27 22
Fishers and related fishing workers 48 40 48 53 38 50 57 38 42 33 27 22 Hunters and trappers - - - - - - - - - 2 1 -
Hunters and trappers - - - - - - - - - 2 1 -Forest, conservation, and logging workers 108 89 87 67 78 85 38 61 68 65 62 78
Forest and conservation workers 3 - 6 - - - - - 3 - 3 -Forest and conservation workers 3 - 6 - - - - - 3 - 3 -
Logging workers 105 85 81 66 76 85 36 60 65 63 59 78 Fallers 57 55 59 40 58 72 22 40 55 52 52 66 Logging equipment operators 25 13 7 5 9 3 7 9 5 - 4 3
Construction and extraction occupations 1,038 1,138 1,184 1,273 1,172 977 838 780 798 870 845 902 Supervisors of construction and extraction workers 112 116 122 118 120 111 112 111 106 121 122 130
See footnotes at end of table. 30
Fatal occupational injuries by selected characteristics, 2003-2014
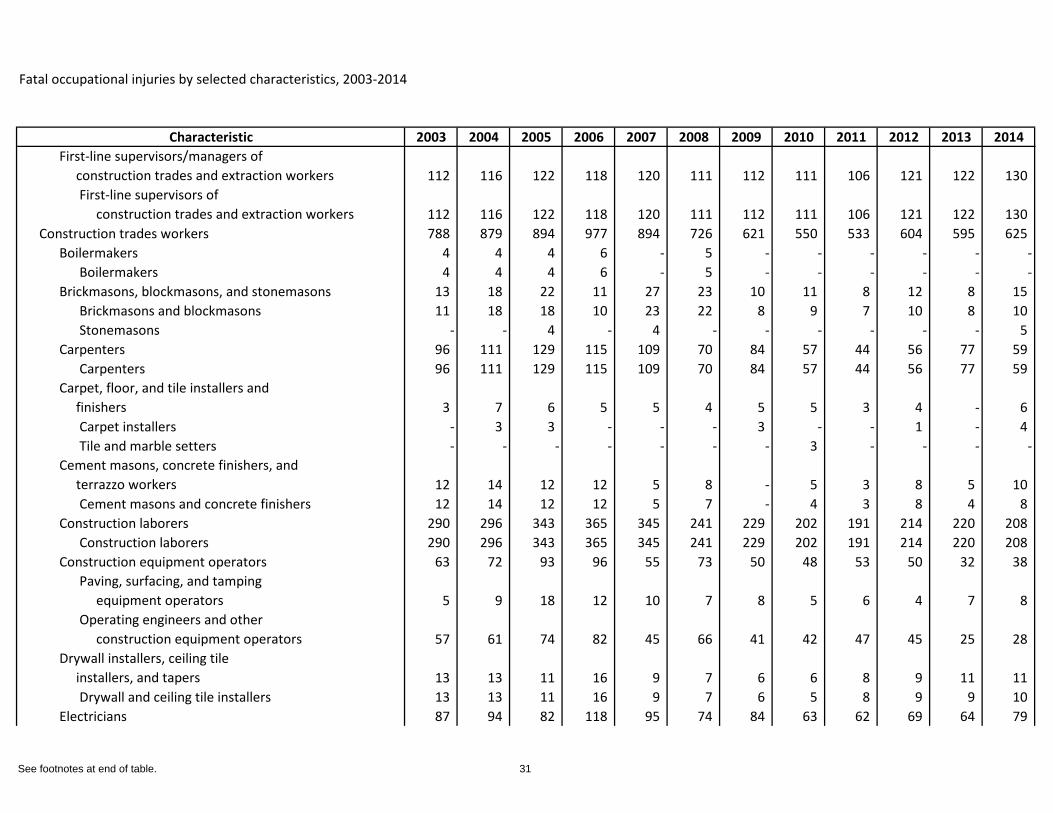
Characteristic 2003 2004 2005 2006 2007 2008 2009 2010 2011 2012 2013 2014First-line supervisors/managers of construction trades and extraction workers 112 116 122 118 120 111 112 111 106 121 122 130
First-line supervisors of construction trades and extraction workers 112 116 122 118 120 111 112 111 106 121 122 130
Construction trades workers 788 879 894 977 894 726 621 550 533 604 595 625 Boilermakers 4 4 4 6 - 5 - - - - - -
Boilermakers 4 4 4 6 - 5 - - - - - -Brickmasons, blockmasons, and stonemasons 13 18 22 11 27 23 10 11 8 12 8 15
Brickmasons and blockmasons 11 18 18 10 23 22 8 9 7 10 8 10 Stonemasons - - 4 - 4 - - - - - - 5
Carpenters 96 111 129 115 109 70 84 57 44 56 77 59 Carpenters 96 111 129 115 109 70 84 57 44 56 77 59
Carpet, floor, and tile installers and finishers 3 7 6 5 5 4 5 5 3 4 - 6
Carpet installers - 3 3 - - - 3 - - 1 - 4 Tile and marble setters - - - - - - - 3 - - - -
Cement masons, concrete finishers, and terrazzo workers 12 14 12 12 5 8 - 5 3 8 5 10
Cement masons and concrete finishers 12 14 12 12 5 7 - 4 3 8 4 8 Construction laborers 290 296 343 365 345 241 229 202 191 214 220 208
Construction laborers 290 296 343 365 345 241 229 202 191 214 220 208 Construction equipment operators 63 72 93 96 55 73 50 48 53 50 32 38
Paving, surfacing, and tamping equipment operators 5 9 18 12 10 7 8 5 6 4 7 8 Operating engineers and other construction equipment operators 57 61 74 82 45 66 41 42 47 45 25 28
Drywall installers, ceiling tile installers, and tapers 13 13 11 16 9 7 6 6 8 9 11 11
Drywall and ceiling tile installers 13 13 11 16 9 7 6 5 8 9 9 10 Electricians 87 94 82 118 95 74 84 63 62 69 64 79
See footnotes at end of table. 31
Fatal occupational injuries by selected characteristics, 2003-2014
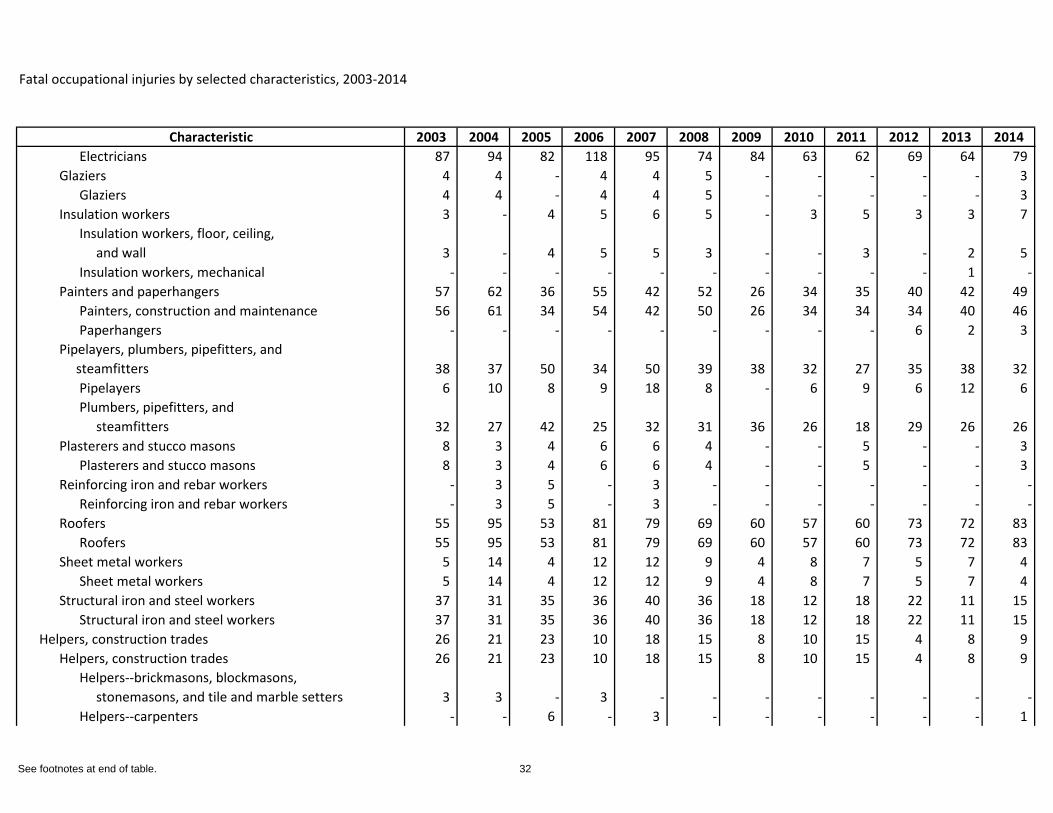
Characteristic 2003 2004 2005 2006 2007 2008 2009 2010 2011 2012 2013 2014Electricians 87 94 82 118 95 74 84 63 62 69 64 79
Glaziers 4 4 - 4 4 5 - - - - - 3 Glaziers 4 4 - 4 4 5 - - - - - 3
Insulation workers 3 - 4 5 6 5 - 3 5 3 3 7 Insulation workers, floor, ceiling, and wall 3 - 4 5 5 3 - - 3 - 2 5 Insulation workers, mechanical - - - - - - - - - - 1 -
Painters and paperhangers 57 62 36 55 42 52 26 34 35 40 42 49 Painters, construction and maintenance 56 61 34 54 42 50 26 34 34 34 40 46 Paperhangers - - - - - - - - - 6 2 3
Pipelayers, plumbers, pipefitters, and steamfitters 38 37 50 34 50 39 38 32 27 35 38 32
Pipelayers 6 10 8 9 18 8 - 6 9 6 12 6 Plumbers, pipefitters, and steamfitters 32 27 42 25 32 31 36 26 18 29 26 26
Plasterers and stucco masons 8 3 4 6 6 4 - - 5 - - 3 Plasterers and stucco masons 8 3 4 6 6 4 - - 5 - - 3
Reinforcing iron and rebar workers - 3 5 - 3 - - - - - - -Reinforcing iron and rebar workers - 3 5 - 3 - - - - - - -
Roofers 55 95 53 81 79 69 60 57 60 73 72 83 Roofers 55 95 53 81 79 69 60 57 60 73 72 83
Sheet metal workers 5 14 4 12 12 9 4 8 7 5 7 4 Sheet metal workers 5 14 4 12 12 9 4 8 7 5 7 4
Structural iron and steel workers 37 31 35 36 40 36 18 12 18 22 11 15 Structural iron and steel workers 37 31 35 36 40 36 18 12 18 22 11 15
Helpers, construction trades 26 21 23 10 18 15 8 10 15 4 8 9 Helpers, construction trades 26 21 23 10 18 15 8 10 15 4 8 9
Helpers--brickmasons, blockmasons, stonemasons, and tile and marble setters 3 3 - 3 - - - - - - - -Helpers--carpenters - - 6 - 3 - - - - - - 1
See footnotes at end of table. 32
Fatal occupational injuries by selected characteristics, 2003-2014
Characteristic 2003 2004 2005 2006 2007 2008 2009 2010 2011 2012 2013 2014Helpers--electricians 4 10 4 - 5 6 - - 4 - 3 3 Helpers--pipelayers, plumbers, pipefitters, and steamfitters 3 3 7 3 - 4 - - 3 - - -Helpers--roofers 5 - - - - - - - - - - -
Other construction and related workers 44 45 64 52 37 43 38 19 52 54 38 50 Construction and building inspectors 6 8 5 7 4 3 7 4 10 4 7 6
Construction and building inspectors 6 8 5 7 4 3 7 4 10 4 7 6 Elevator installers and repairers - 6 3 7 4 3 4 - 4 6 5 5
Elevator installers and repairers - 6 3 7 4 3 4 - 4 6 5 5 Fence erectors - - 3 6 - - 3 - - - - 5
Fence erectors - - 3 6 - - 3 - - - - 5 Hazardous materials removal workers 4 - 7 3 - - - - - 5 - -
Hazardous materials removal workers 4 - 7 3 - - - - - 5 - -Highway maintenance workers 17 21 29 17 12 21 16 11 28 30 13 22
Highway maintenance workers 17 21 29 17 12 21 16 11 28 30 13 22 Rail-track laying and maintenance equipment operators - - 4 3 - - - - 3 6 3 -
Rail-track laying and maintenance equipment operators - - 4 3 - - - - 3 6 3 -
Septic tank servicers and sewer pipe cleaners - - 5 - 4 4 - - 5 1 5 7
Septic tank servicers and sewer pipe cleaners - - 5 - 4 4 - - 5 1 5 7
Miscellaneous construction and related workers 11 7 8 7 9 9 4 - - - 3 -
Extraction workers 68 77 81 116 103 82 59 90 92 87 82 88 Derrick, rotary drill, and service unit operators, oil, gas, and mining 12 15 21 22 20 14 13 17 20 26 21 26
Derrick operators, oil and gas 4 6 11 12 7 7 5 6 7 11 7 10 Rotary drill operators, oil and gas 8 8 9 8 11 6 5 7 11 11 10 10
See footnotes at end of table. 33
Fatal occupational injuries by selected characteristics, 2003-2014
Characteristic 2003 2004 2005 2006 2007 2008 2009 2010 2011 2012 2013 2014Service unit operators, oil, gas, and mining - - - - - - 3 4 - 4 4 6
Earth drillers, except oil and gas 12 8 4 14 8 5 6 7 8 7 - -Earth drillers, except oil and gas 12 8 4 14 8 5 6 7 8 7 - -
Explosives workers, ordnance handling experts, and blasters - - - - - - - - 7 - - -
Explosives workers, ordnance handling experts, and blasters - - - - - - - - 7 - - -
Mining machine operators 11 20 13 22 16 19 8 22 7 7 16 7 Continuous mining machine operators 3 4 3 - - - - 8 2 3 4 2
Rock splitters, quarry - - - - - - - - 1 - - -Rock splitters, quarry - - - - - - - - 1 - - -
Roof bolters, mining - 3 4 15 3 3 - 6 - 1 1 3 Roof bolters, mining - 3 4 15 3 3 - 6 - 1 1 3
Roustabouts, oil and gas 8 7 10 10 5 9 9 6 13 24 18 25 Roustabouts, oil and gas 8 7 10 10 5 9 9 6 13 24 18 25
Helpers--extraction workers 4 3 5 5 6 - - 6 6 3 3 3 Helpers--extraction workers 4 3 5 5 6 - - 6 6 3 3 3
Miscellaneous extraction workers 19 18 23 28 44 29 21 26 30 19 18 22
Installation, maintenance, and repair occupations 394 384 397 423 380 354 326 363 354 348 370 406 Supervisors of installation, maintenance, and repair workers 34 43 19 23 24 26 21 27 18 33 32 38
First-line supervisors/managers of mechanics, installers, and repairers 34 43 19 23 24 26 21 27 18 33 32 38
First-line supervisors of mechanics, installers, and repairers 34 43 19 23 24 26 21 27 18 33 32 38
Electrical and electronic equipment mechanics, installers, and repairers 20 13 17 20 21 23 16 16 21 21 26 21
See footnotes at end of table. 34
Fatal occupational injuries by selected characteristics, 2003-2014
Characteristic 2003 2004 2005 2006 2007 2008 2009 2010 2011 2012 2013 2014Computer, automated teller, and office machine repairers 4 3 - 3 - - 3 - 3 - - 6
Computer, automated teller, and office machine repairers 4 3 - 3 - - 3 - 3 - - 6
Radio and telecommunications equipment installers and repairers 11 4 3 6 5 10 6 11 9 6 14 11
Radio, cellular, and tower equipment, installers and repairers - - - - - - - - 6 - 10 8 Telecommunications equipment installers and repairers, except line installers 10 4 3 6 5 9 6 9 3 4 4 3
Miscellaneous electrical and electronic equipment mechanics, installers, and repairers 5 6 12 11 16 11 7 5 9 13 10 4
Electric motor, power tool, and related repairers - 3 - - - 3 - - - 3 - -Electrical and electronics repairers, commercial and industrial equipment - - 4 3 - - - - - 1 - -Electrical and electronics repairers, powerhouse, substation, and relay - - - - - - - - 1 - - -Electronic home entertainment equipment installers and repairers - - 3 - 4 - 5 - 4 4 5 -Security and fire alarm systems installers - - - 3 5 - - 4 - 4 - -
Vehicle and mobile equipment mechanics, installers, and repairers 122 122 138 139 118 112 124 126 114 110 104 128
Aircraft mechanics and service technicians 3 4 4 6 9 5 8 7 6 3 4 8 Aircraft mechanics and service technicians 3 4 4 6 9 5 8 7 6 3 4 8
Automotive technicians and repairers 69 51 61 53 42 47 53 45 39 36 38 41 Automotive body and related repairers 11 11 10 6 4 3 9 6 5 6 5 7
See footnotes at end of table. 35
Fatal occupational injuries by selected characteristics, 2003-2014
Characteristic 2003 2004 2005 2006 2007 2008 2009 2010 2011 2012 2013 2014Automotive service technicians and mechanics 57 39 51 46 36 44 43 39 34 30 32 33
Bus and truck mechanics and diesel engine specialists 17 22 31 18 28 31 24 26 19 26 28 30
Bus and truck mechanics and diesel engine specialists 17 22 31 18 28 31 24 26 19 26 28 30
Heavy vehicle and mobile equipment service technicians and mechanics 21 26 32 43 25 24 25 32 34 32 23 29
Farm equipment mechanics and service technicians 3 5 7 7 7 9 9 9 17 7 8 12 Mobile heavy equipment mechanics, except engines 17 19 22 31 17 14 16 23 17 25 15 17 Rail car repairers - - 3 5 - - - - - - - -
Small engine mechanics - 3 4 8 - - 3 7 4 3 4 10 Motorcycle mechanics - - 3 4 - - - - - - - 3 Outdoor power equipment and other small engine mechanics - - - - - - - 3 - 1 1 5
Miscellaneous vehicle and mobile equipment mechanics, installers, and repairers 10 16 6 11 12 3 11 9 12 10 7 10
Bicycle repairers - - - - - - - - - - 1 -Recreational vehicle service technicians - - - - - - - - 1 - - -Tire repairers and changers 8 16 6 10 11 3 11 8 10 10 6 10
Other installation, maintenance, and repair occupations 218 206 223 241 217 193 165 194 201 184 208 219
Control and valve installers and repairers - 4 - - - - - - 2 - 3 3 Mechanical door repairers - - - - - - - - 1 - 3 -Control and valve installers and repairers, except mechanical door - 3 - - - - - - 1 - - -
See footnotes at end of table. 36
Fatal occupational injuries by selected characteristics, 2003-2014
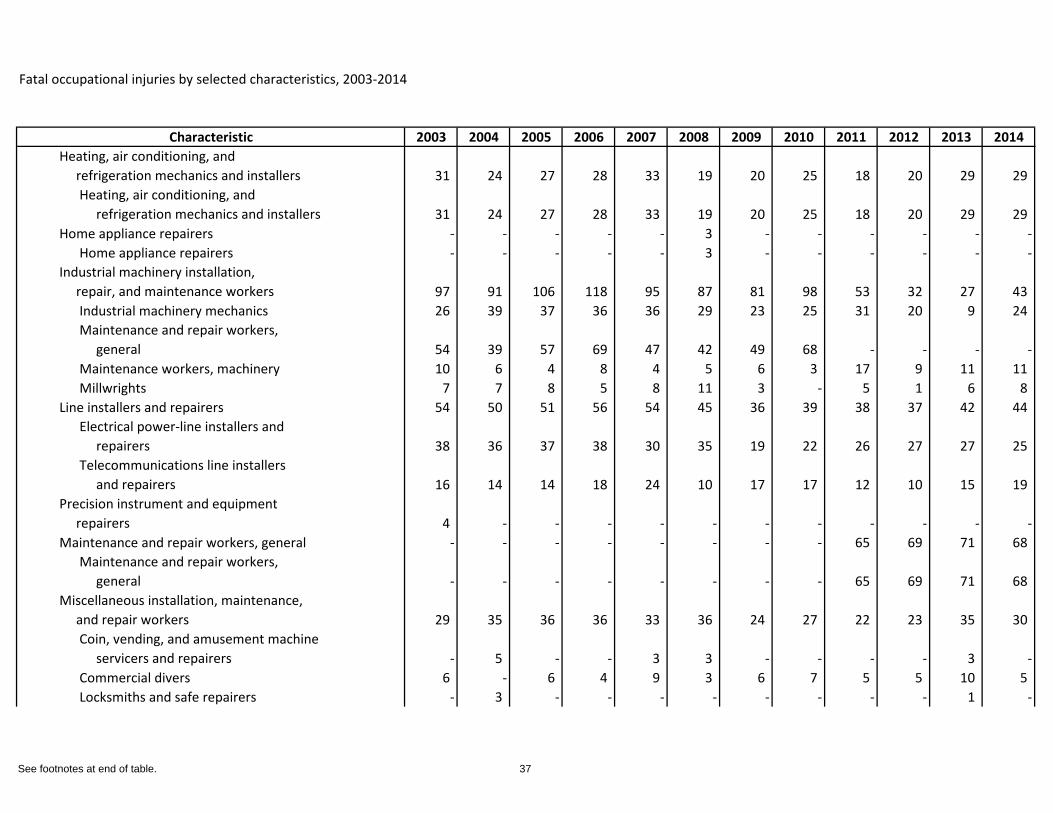
Characteristic 2003 2004 2005 2006 2007 2008 2009 2010 2011 2012 2013 2014Heating, air conditioning, and refrigeration mechanics and installers 31 24 27 28 33 19 20 25 18 20 29 29
Heating, air conditioning, and refrigeration mechanics and installers 31 24 27 28 33 19 20 25 18 20 29 29
Home appliance repairers - - - - - 3 - - - - - -Home appliance repairers - - - - - 3 - - - - - -
Industrial machinery installation, repair, and maintenance workers 97 91 106 118 95 87 81 98 53 32 27 43
Industrial machinery mechanics 26 39 37 36 36 29 23 25 31 20 9 24 Maintenance and repair workers, general 54 39 57 69 47 42 49 68 - - - -Maintenance workers, machinery 10 6 4 8 4 5 6 3 17 9 11 11 Millwrights 7 7 8 5 8 11 3 - 5 1 6 8
Line installers and repairers 54 50 51 56 54 45 36 39 38 37 42 44 Electrical power-line installers and repairers 38 36 37 38 30 35 19 22 26 27 27 25 Telecommunications line installers and repairers 16 14 14 18 24 10 17 17 12 10 15 19
Precision instrument and equipment repairers 4 - - - - - - - - - - -Maintenance and repair workers, general - - - - - - - - 65 69 71 68
Maintenance and repair workers, general - - - - - - - - 65 69 71 68
Miscellaneous installation, maintenance, and repair workers 29 35 36 36 33 36 24 27 22 23 35 30
Coin, vending, and amusement machine servicers and repairers - 5 - - 3 3 - - - - 3 -Commercial divers 6 - 6 4 9 3 6 7 5 5 10 5 Locksmiths and safe repairers - 3 - - - - - - - - 1 -
See footnotes at end of table. 37
Fatal occupational injuries by selected characteristics, 2003-2014
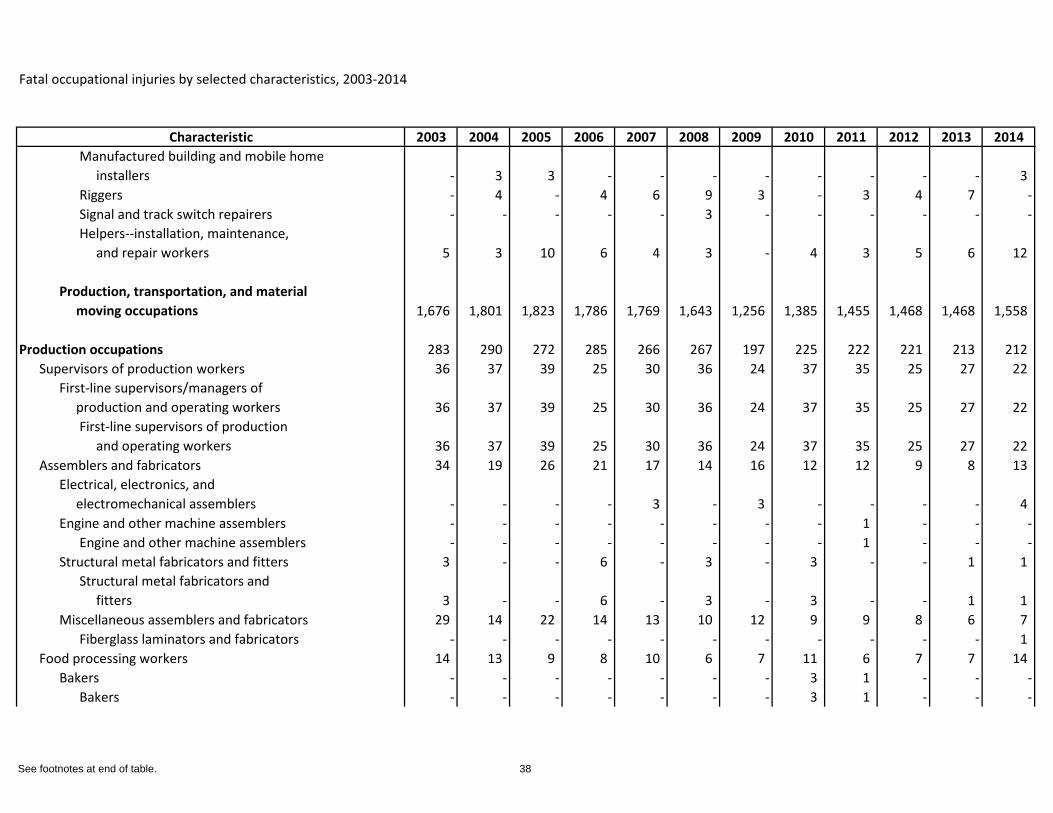
Characteristic 2003 2004 2005 2006 2007 2008 2009 2010 2011 2012 2013 2014Manufactured building and mobile home installers - 3 3 - - - - - - - - 3 Riggers - 4 - 4 6 9 3 - 3 4 7 -Signal and track switch repairers - - - - - 3 - - - - - -Helpers--installation, maintenance, and repair workers 5 3 10 6 4 3 - 4 3 5 6 12
Production, transportation, and material moving occupations 1,676 1,801 1,823 1,786 1,769 1,643 1,256 1,385 1,455 1,468 1,468 1,558
Production occupations 283 290 272 285 266 267 197 225 222 221 213 212 Supervisors of production workers 36 37 39 25 30 36 24 37 35 25 27 22
First-line supervisors/managers of production and operating workers 36 37 39 25 30 36 24 37 35 25 27 22
First-line supervisors of production and operating workers 36 37 39 25 30 36 24 37 35 25 27 22
Assemblers and fabricators 34 19 26 21 17 14 16 12 12 9 8 13 Electrical, electronics, and electromechanical assemblers - - - - 3 - 3 - - - - 4 Engine and other machine assemblers - - - - - - - - 1 - - -
Engine and other machine assemblers - - - - - - - - 1 - - -Structural metal fabricators and fitters 3 - - 6 - 3 - 3 - - 1 1
Structural metal fabricators and fitters 3 - - 6 - 3 - 3 - - 1 1
Miscellaneous assemblers and fabricators 29 14 22 14 13 10 12 9 9 8 6 7 Fiberglass laminators and fabricators - - - - - - - - - - - 1
Food processing workers 14 13 9 8 10 6 7 11 6 7 7 14 Bakers - - - - - - - 3 1 - - -
Bakers - - - - - - - 3 1 - - -
See footnotes at end of table. 38
Fatal occupational injuries by selected characteristics, 2003-2014
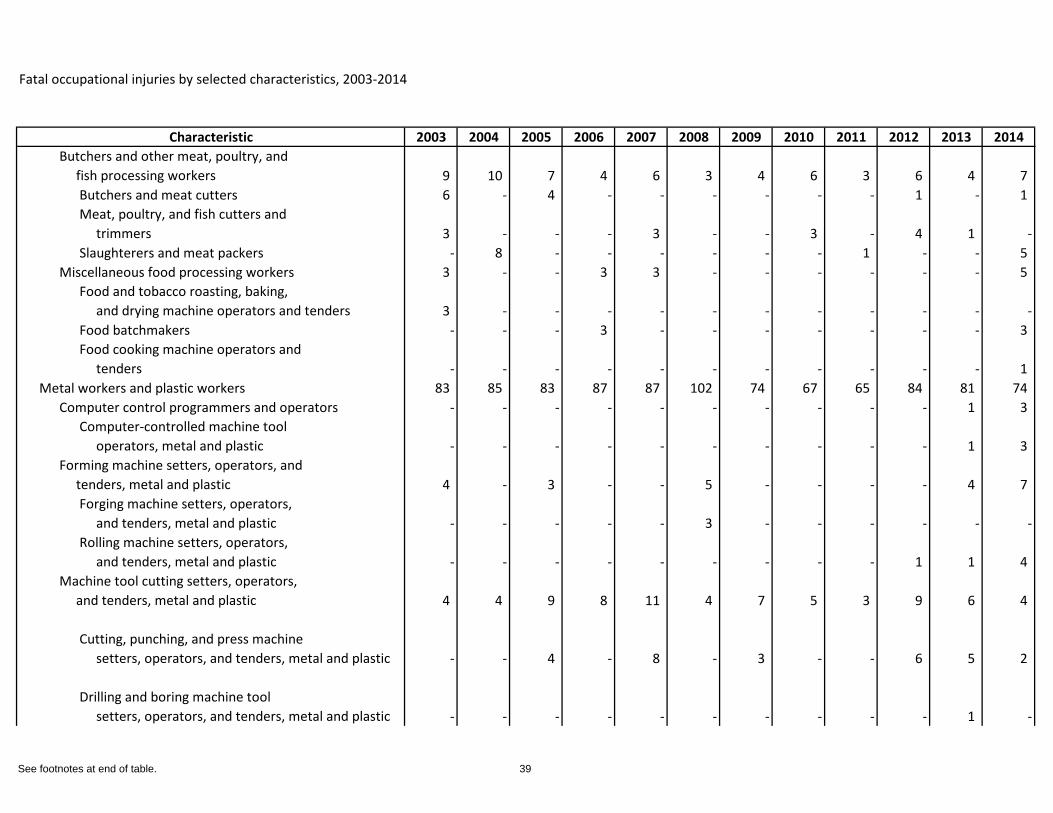
Characteristic 2003 2004 2005 2006 2007 2008 2009 2010 2011 2012 2013 2014Butchers and other meat, poultry, and fish processing workers 9 10 7 4 6 3 4 6 3 6 4 7
Butchers and meat cutters 6 - 4 - - - - - - 1 - 1 Meat, poultry, and fish cutters and trimmers 3 - - - 3 - - 3 - 4 1 -Slaughterers and meat packers - 8 - - - - - - 1 - - 5
Miscellaneous food processing workers 3 - - 3 3 - - - - - - 5 Food and tobacco roasting, baking, and drying machine operators and tenders 3 - - - - - - - - - - -Food batchmakers - - - 3 - - - - - - - 3 Food cooking machine operators and tenders - - - - - - - - - - - 1
Metal workers and plastic workers 83 85 83 87 87 102 74 67 65 84 81 74 Computer control programmers and operators - - - - - - - - - - 1 3
Computer-controlled machine tool operators, metal and plastic - - - - - - - - - - 1 3
Forming machine setters, operators, and tenders, metal and plastic 4 - 3 - - 5 - - - - 4 7
Forging machine setters, operators, and tenders, metal and plastic - - - - - 3 - - - - - -Rolling machine setters, operators, and tenders, metal and plastic - - - - - - - - - 1 1 4
Machine tool cutting setters, operators, and tenders, metal and plastic 4 4 9 8 11 4 7 5 3 9 6 4
Cutting, punching, and press machine setters, operators, and tenders, metal and plastic - - 4 - 8 - 3 - - 6 5 2
Drilling and boring machine tool setters, operators, and tenders, metal and plastic - - - - - - - - - - 1 -
See footnotes at end of table. 39
Fatal occupational injuries by selected characteristics, 2003-2014
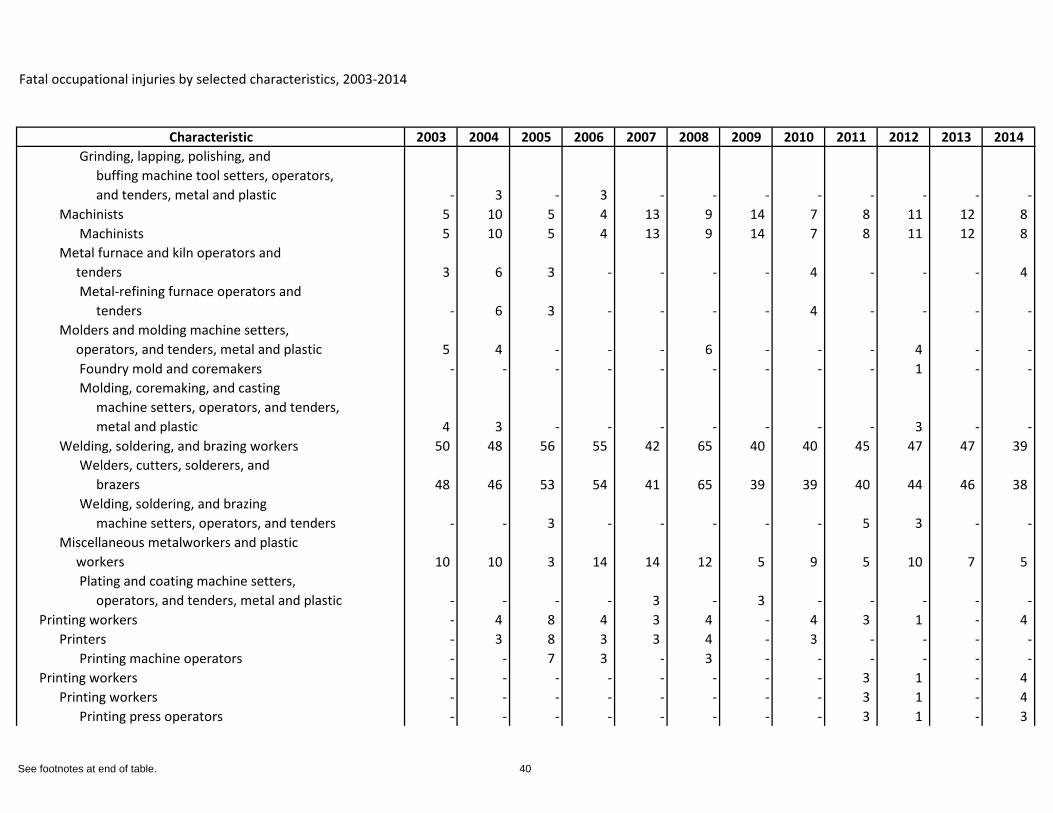
Characteristic 2003 2004 2005 2006 2007 2008 2009 2010 2011 2012 2013 2014Grinding, lapping, polishing, and buffing machine tool setters, operators, and tenders, metal and plastic - 3 - 3 - - - - - - - -
Machinists 5 10 5 4 13 9 14 7 8 11 12 8 Machinists 5 10 5 4 13 9 14 7 8 11 12 8
Metal furnace and kiln operators and tenders 3 6 3 - - - - 4 - - - 4
Metal-refining furnace operators and tenders - 6 3 - - - - 4 - - - -
Molders and molding machine setters, operators, and tenders, metal and plastic 5 4 - - - 6 - - - 4 - -
Foundry mold and coremakers - - - - - - - - - 1 - -Molding, coremaking, and casting machine setters, operators, and tenders, metal and plastic 4 3 - - - - - - - 3 - -
Welding, soldering, and brazing workers 50 48 56 55 42 65 40 40 45 47 47 39 Welders, cutters, solderers, and brazers 48 46 53 54 41 65 39 39 40 44 46 38 Welding, soldering, and brazing machine setters, operators, and tenders - - 3 - - - - - 5 3 - -
Miscellaneous metalworkers and plastic workers 10 10 3 14 14 12 5 9 5 10 7 5
Plating and coating machine setters, operators, and tenders, metal and plastic - - - - 3 - 3 - - - - -
Printing workers - 4 8 4 3 4 - 4 3 1 - 4 Printers - 3 8 3 3 4 - 3 - - - -
Printing machine operators - - 7 3 - 3 - - - - - -Printing workers - - - - - - - - 3 1 - 4
Printing workers - - - - - - - - 3 1 - 4 Printing press operators - - - - - - - - 3 1 - 3
See footnotes at end of table. 40
Fatal occupational injuries by selected characteristics, 2003-2014
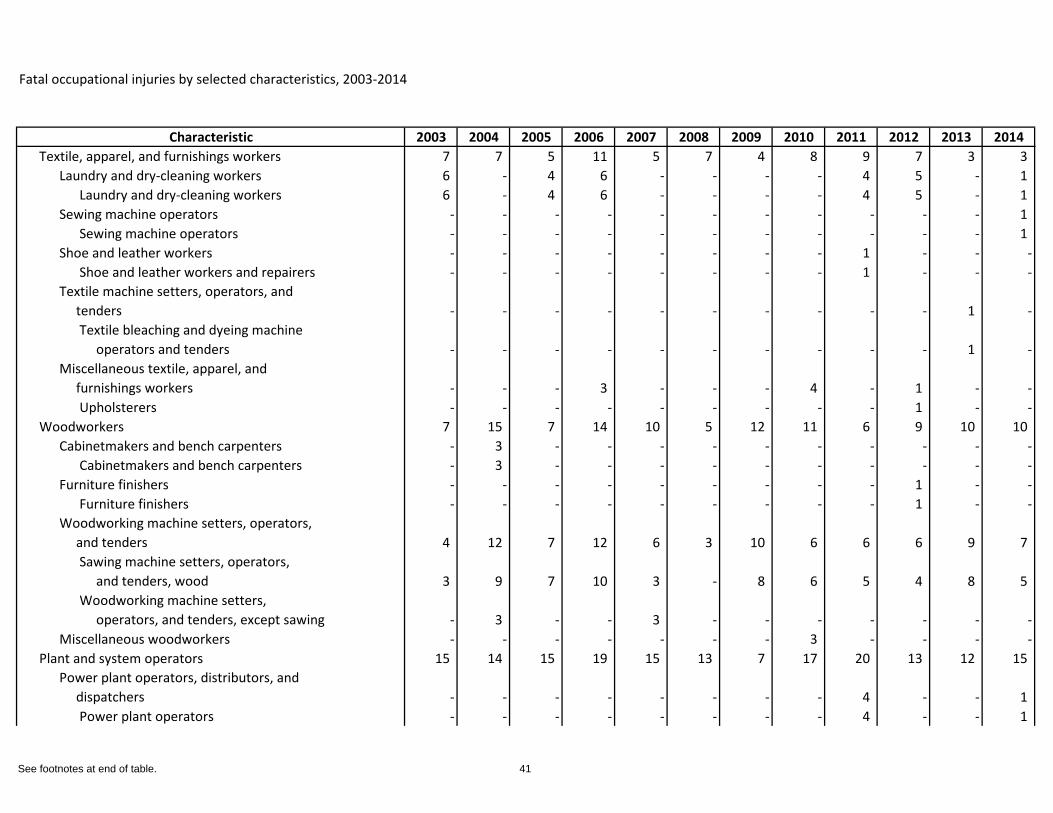
Characteristic 2003 2004 2005 2006 2007 2008 2009 2010 2011 2012 2013 2014Textile, apparel, and furnishings workers 7 7 5 11 5 7 4 8 9 7 3 3
Laundry and dry-cleaning workers 6 - 4 6 - - - - 4 5 - 1 Laundry and dry-cleaning workers 6 - 4 6 - - - - 4 5 - 1
Sewing machine operators - - - - - - - - - - - 1 Sewing machine operators - - - - - - - - - - - 1
Shoe and leather workers - - - - - - - - 1 - - -Shoe and leather workers and repairers - - - - - - - - 1 - - -
Textile machine setters, operators, and tenders - - - - - - - - - - 1 -
Textile bleaching and dyeing machine operators and tenders - - - - - - - - - - 1 -
Miscellaneous textile, apparel, and furnishings workers - - - 3 - - - 4 - 1 - -
Upholsterers - - - - - - - - - 1 - -Woodworkers 7 15 7 14 10 5 12 11 6 9 10 10
Cabinetmakers and bench carpenters - 3 - - - - - - - - - -Cabinetmakers and bench carpenters - 3 - - - - - - - - - -
Furniture finishers - - - - - - - - - 1 - -Furniture finishers - - - - - - - - - 1 - -
Woodworking machine setters, operators, and tenders 4 12 7 12 6 3 10 6 6 6 9 7
Sawing machine setters, operators, and tenders, wood 3 9 7 10 3 - 8 6 5 4 8 5 Woodworking machine setters, operators, and tenders, except sawing - 3 - - 3 - - - - - - -
Miscellaneous woodworkers - - - - - - - 3 - - - -Plant and system operators 15 14 15 19 15 13 7 17 20 13 12 15
Power plant operators, distributors, and dispatchers - - - - - - - - 4 - - 1
Power plant operators - - - - - - - - 4 - - 1
See footnotes at end of table. 41
Fatal occupational injuries by selected characteristics, 2003-2014
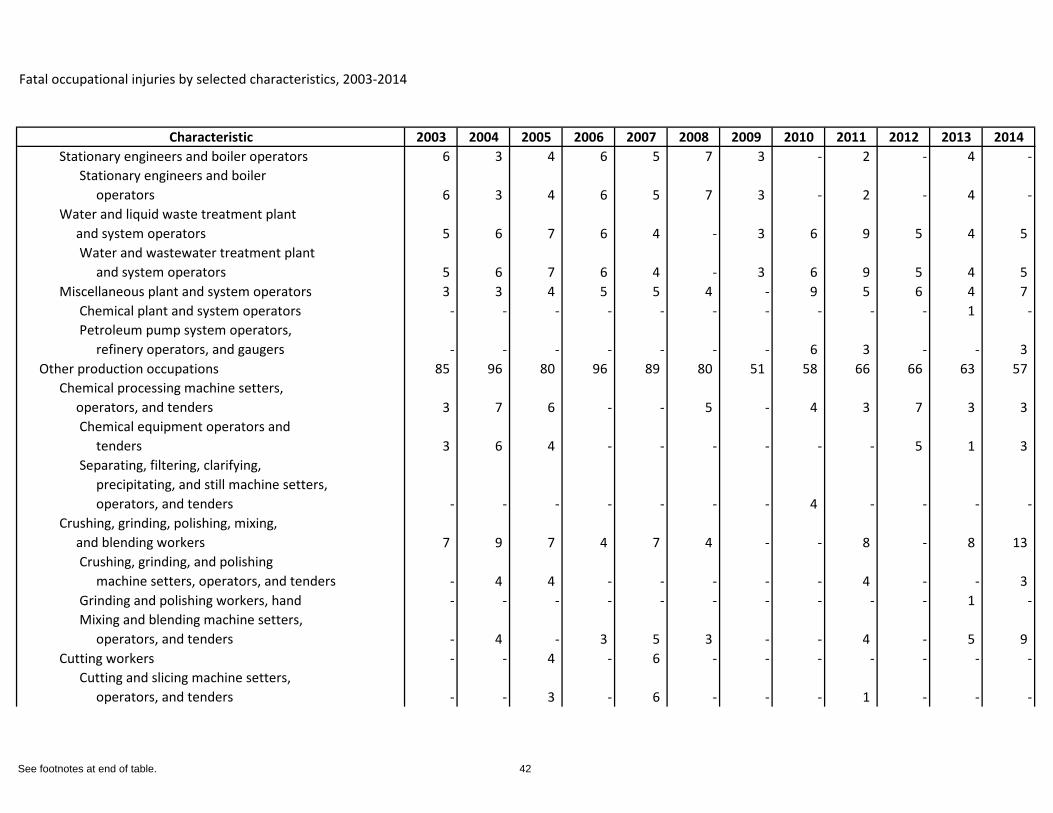
Characteristic 2003 2004 2005 2006 2007 2008 2009 2010 2011 2012 2013 2014Stationary engineers and boiler operators 6 3 4 6 5 7 3 - 2 - 4 -
Stationary engineers and boiler operators 6 3 4 6 5 7 3 - 2 - 4 -
Water and liquid waste treatment plant and system operators 5 6 7 6 4 - 3 6 9 5 4 5
Water and wastewater treatment plant and system operators 5 6 7 6 4 - 3 6 9 5 4 5
Miscellaneous plant and system operators 3 3 4 5 5 4 - 9 5 6 4 7 Chemical plant and system operators - - - - - - - - - - 1 -Petroleum pump system operators, refinery operators, and gaugers - - - - - - - 6 3 - - 3
Other production occupations 85 96 80 96 89 80 51 58 66 66 63 57 Chemical processing machine setters, operators, and tenders 3 7 6 - - 5 - 4 3 7 3 3
Chemical equipment operators and tenders 3 6 4 - - - - - - 5 1 3 Separating, filtering, clarifying, precipitating, and still machine setters, operators, and tenders - - - - - - - 4 - - - -
Crushing, grinding, polishing, mixing, and blending workers 7 9 7 4 7 4 - - 8 - 8 13
Crushing, grinding, and polishing machine setters, operators, and tenders - 4 4 - - - - - 4 - - 3 Grinding and polishing workers, hand - - - - - - - - - - 1 -Mixing and blending machine setters, operators, and tenders - 4 - 3 5 3 - - 4 - 5 9
Cutting workers - - 4 - 6 - - - - - - -Cutting and slicing machine setters, operators, and tenders - - 3 - 6 - - - 1 - - -
See footnotes at end of table. 42
Fatal occupational injuries by selected characteristics, 2003-2014
Characteristic 2003 2004 2005 2006 2007 2008 2009 2010 2011 2012 2013 2014
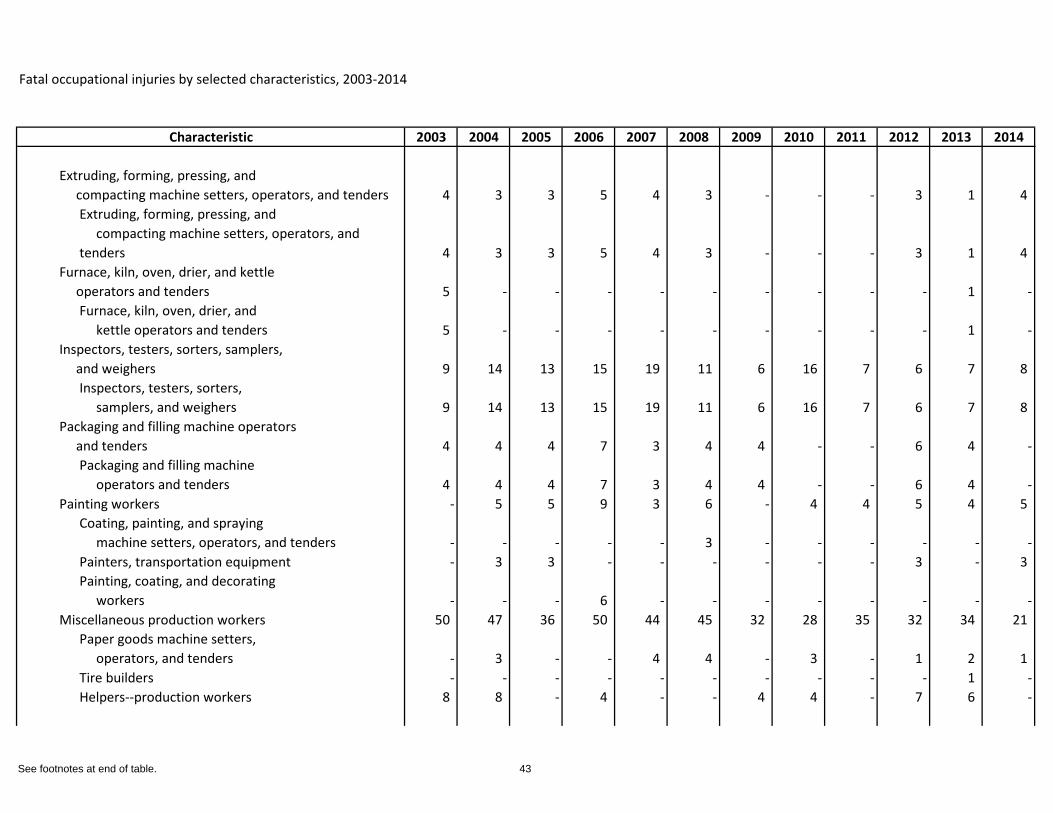
Extruding, forming, pressing, and compacting machine setters, operators, and tenders 4 3 3 5 4 3 - - - 3 1 4
Extruding, forming, pressing, and compacting machine setters, operators, and tenders 4 3 3 5 4 3 - - - 3 1 4
Furnace, kiln, oven, drier, and kettle operators and tenders 5 - - - - - - - - - 1 -
Furnace, kiln, oven, drier, and kettle operators and tenders 5 - - - - - - - - - 1 -
Inspectors, testers, sorters, samplers, and weighers 9 14 13 15 19 11 6 16 7 6 7 8
Inspectors, testers, sorters, samplers, and weighers 9 14 13 15 19 11 6 16 7 6 7 8
Packaging and filling machine operators and tenders 4 4 4 7 3 4 4 - - 6 4 -
Packaging and filling machine operators and tenders 4 4 4 7 3 4 4 - - 6 4 -
Painting workers - 5 5 9 3 6 - 4 4 5 4 5 Coating, painting, and spraying machine setters, operators, and tenders - - - - - 3 - - - - - -Painters, transportation equipment - 3 3 - - - - - - 3 - 3 Painting, coating, and decorating workers - - - 6 - - - - - - - -
Miscellaneous production workers 50 47 36 50 44 45 32 28 35 32 34 21 Paper goods machine setters, operators, and tenders - 3 - - 4 4 - 3 - 1 2 1 Tire builders - - - - - - - - - - 1 -Helpers--production workers 8 8 - 4 - - 4 4 - 7 6 -
See footnotes at end of table. 43
Fatal occupational injuries by selected characteristics, 2003-2014
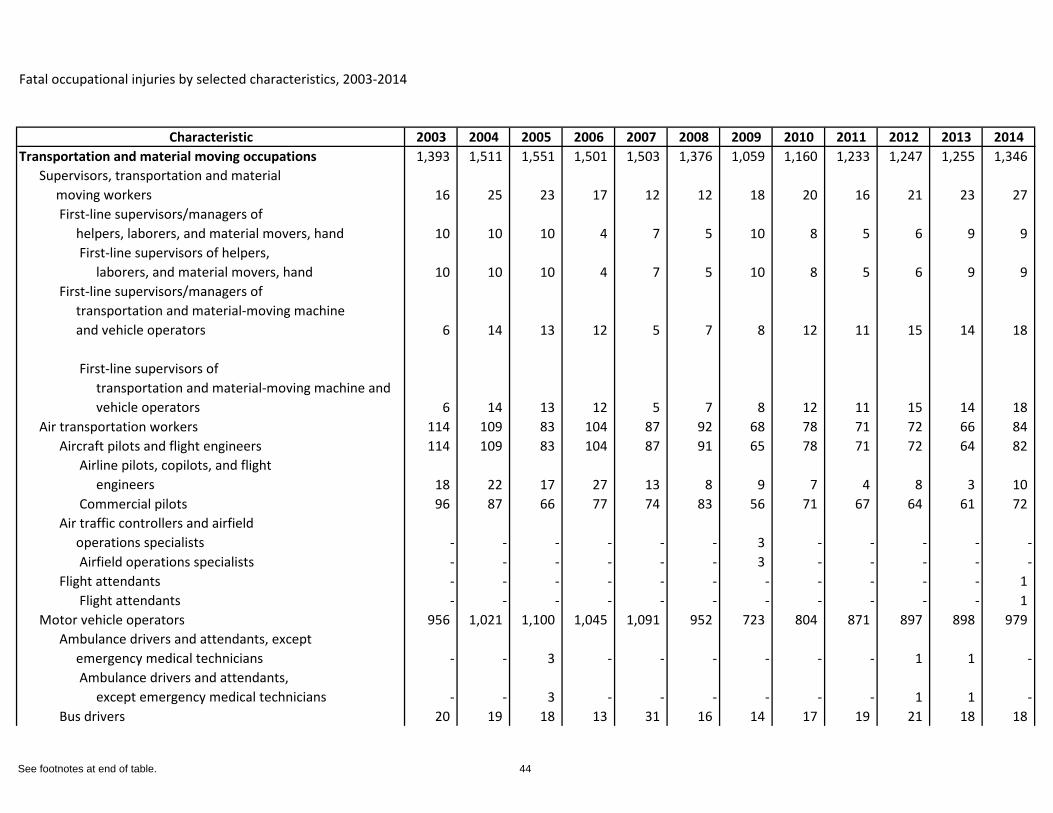
Characteristic 2003 2004 2005 2006 2007 2008 2009 2010 2011 2012 2013 2014Transportation and material moving occupations 1,393 1,511 1,551 1,501 1,503 1,376 1,059 1,160 1,233 1,247 1,255 1,346
Supervisors, transportation and material moving workers 16 25 23 17 12 12 18 20 16 21 23 27
First-line supervisors/managers of helpers, laborers, and material movers, hand 10 10 10 4 7 5 10 8 5 6 9 9
First-line supervisors of helpers, laborers, and material movers, hand 10 10 10 4 7 5 10 8 5 6 9 9
First-line supervisors/managers of transportation and material-moving machine and vehicle operators 6 14 13 12 5 7 8 12 11 15 14 18
First-line supervisors of transportation and material-moving machine and vehicle operators 6 14 13 12 5 7 8 12 11 15 14 18
Air transportation workers 114 109 83 104 87 92 68 78 71 72 66 84 Aircraft pilots and flight engineers 114 109 83 104 87 91 65 78 71 72 64 82
Airline pilots, copilots, and flight engineers 18 22 17 27 13 8 9 7 4 8 3 10 Commercial pilots 96 87 66 77 74 83 56 71 67 64 61 72
Air traffic controllers and airfield operations specialists - - - - - - 3 - - - - -
Airfield operations specialists - - - - - - 3 - - - - -Flight attendants - - - - - - - - - - - 1
Flight attendants - - - - - - - - - - - 1 Motor vehicle operators 956 1,021 1,100 1,045 1,091 952 723 804 871 897 898 979
Ambulance drivers and attendants, except emergency medical technicians - - 3 - - - - - - 1 1 -
Ambulance drivers and attendants, except emergency medical technicians - - 3 - - - - - - 1 1 -
Bus drivers 20 19 18 13 31 16 14 17 19 21 18 18
See footnotes at end of table. 44
Fatal occupational injuries by selected characteristics, 2003-2014
Characteristic 2003 2004 2005 2006 2007 2008 2009 2010 2011 2012 2013 2014Bus drivers, transit and intercity 12 14 10 7 16 8 6 4 11 7 10 6 Bus drivers, school or special client 8 5 8 6 15 8 8 13 8 14 8 12
Driver/sales workers and truck drivers 862 918 997 957 976 856 647 718 774 813 806 880 Driver/sales workers 44 45 62 60 69 40 35 37 40 57 31 59 Heavy and tractor-trailer truck drivers 722 779 836 807 822 749 540 610 670 695 707 761 Light truck or delivery services drivers 96 94 99 90 85 67 72 71 64 61 68 60
Taxi drivers and chauffeurs 64 68 62 53 63 69 55 57 64 50 61 68 Taxi drivers and chauffeurs 64 68 62 53 63 69 55 57 64 50 61 68
Miscellaneous motor vehicle operators 10 15 20 21 21 11 7 10 14 12 12 13 Rail transportation workers 16 21 23 16 11 24 16 21 19 11 6 8
Locomotive engineers and operators - 8 5 - - 5 3 5 7 5 - -Locomotive engineers - 6 5 - - 4 3 4 5 4 - -Rail yard engineers, dinkey operators, and hostlers - - - - - - - - - 1 - -
Railroad brake, signal, and switch operators 5 4 5 6 - 5 - 3 4 - - -
Railroad brake, signal, and switch operators 5 4 5 6 - 5 - 3 4 - - -
Railroad conductors and yardmasters 8 8 9 4 5 9 6 6 8 5 4 4 Railroad conductors and yardmasters 8 8 9 4 5 9 6 6 8 5 4 4
Subway and streetcar operators - - - - - - - - - 1 - -Subway and streetcar operators - - - - - - - - - 1 - -
Miscellaneous rail transportation workers - - 3 4 - 3 3 7 - - - -Water transportation workers 27 46 36 32 35 35 28 21 15 15 23 15
Sailors and marine oilers 13 39 18 15 23 22 20 12 6 10 14 9 Sailors and marine oilers 13 39 18 15 23 22 20 12 6 10 14 9
Ship and boat captains and operators 10 6 11 14 11 7 8 8 5 4 8 5
See footnotes at end of table. 45
Fatal occupational injuries by selected characteristics, 2003-2014
Characteristic 2003 2004 2005 2006 2007 2008 2009 2010 2011 2012 2013 2014Captains, mates, and pilots of water vessels 10 6 10 13 11 7 8 8 5 4 7 5
Ship engineers 4 - 7 3 - 6 - - 4 1 1 -Ship engineers 4 - 7 3 - 6 - - 4 1 1 -
Other transportation workers 13 16 15 19 9 13 15 12 14 12 13 9 Parking lot attendants 4 3 3 5 - 3 3 3 4 4 - -
Parking lot attendants 4 3 3 5 - 3 3 3 4 4 - -Service station attendants 5 8 8 6 5 8 8 6 - 2 4 -
Automotive and watercraft service attendants 5 8 8 6 5 8 8 6 - 2 4 -
Traffic technicians - - - - - - - - 1 - 2 3 Traffic technicians - - - - - - - - 1 - 2 3
Transportation inspectors 3 3 - - - - - - 6 - 3 -Transportation inspectors 3 3 - - - - - - 6 - 3 -
Transportation attendants, except flight attendants - - - - - - - - - - 1 -
Transportation attendants, except flight attendants - - - - - - - - - - 1 -
Miscellaneous transportation workers - - - 4 - - - - 1 1 2 -Material moving workers 251 273 271 268 258 248 191 204 227 219 226 224
Conveyor operators and tenders - - 5 - - 5 3 4 3 - 2 5 Conveyor operators and tenders - - 5 - - 5 3 4 3 - 2 5
Crane and tower operators 14 15 15 8 13 21 12 7 10 11 16 10 Crane and tower operators 14 15 15 8 13 21 12 7 10 11 16 10
Dredge, excavating, and loading machine operators 15 14 15 20 15 - 5 10 16 10 15 20
Dredge operators - - - 3 - - 3 - - - - -Excavating and loading machine and dragline operators 14 12 13 16 15 - - 9 16 10 13 18
Hoist and winch operators 3 3 - 5 - - - - 4 - - 4
See footnotes at end of table. 46
Fatal occupational injuries by selected characteristics, 2003-2014
Characteristic 2003 2004 2005 2006 2007 2008 2009 2010 2011 2012 2013 2014Hoist and winch operators 3 3 - 5 - - - - 4 - - 4
Industrial truck and tractor operators 42 45 33 37 45 50 21 30 34 30 29 37 Industrial truck and tractor operators 42 45 33 37 45 50 21 30 34 30 29 37
Laborers and material movers, hand 117 144 159 148 152 127 123 113 114 119 117 106 Cleaners of vehicles and equipment 9 11 11 13 14 10 10 17 16 8 17 14 Laborers and freight, stock, and material movers, hand 106 127 141 130 132 113 111 93 94 108 95 87 Machine feeders and offbearers - - 3 - 4 - - - - - - -Packers and packagers, hand - 4 4 4 - - - - - - 4 3
Pumping station operators 6 4 5 3 3 - - 4 8 12 6 11 Pump operators, except wellhead pumpers - - - - - - - - 4 9 - 6 Wellhead pumpers 6 4 3 - - - - 3 4 - 4 5
Refuse and recyclable material collectors 43 35 32 37 18 30 20 26 30 31 33 27 Refuse and recyclable material collectors 43 35 32 37 18 30 20 26 30 31 33 27
Shuttle car operators - - - - - - - - - 1 4 -Mine shuttle car operators - - - - - - - - - 1 4 -
Tank car, truck, and ship loaders - - - - - - - - 3 - 3 3 Tank car, truck, and ship loaders - - - - - - - - 3 - 3 3
Miscellaneous material moving workers 8 9 3 4 5 8 3 5 4 2 - 1
Military occupations6 62 71 48 57 64 57 75 46 57 50 71 56
Industry (NAICS)7
Private industry (NAICS)8 5,043 5,229 5,214 5,320 5,112 4,670 4,090 4,206 4,188 4,175 4,101 4,386
Goods producing 2,401 2,518 2,459 2,542 2,372 2,234 1,827 1,896 1,786 1,823 1,795 2,015
See footnotes at end of table. 47
Fatal occupational injuries by selected characteristics, 2003-2014
Characteristic 2003 2004 2005 2006 2007 2008 2009 2010 2011 2012 2013 2014Natural resources and mining 850 821 874 847 768 848 674 793 721 690 655 767
Agriculture, forestry, fishing and hunting 709 669 715 655 585 672 575 621 566 509 500 584 Crop production 334 320 351 308 257 314 297 323 245 224 224 251
Oilseed and grain farming 35 45 56 18 41 26 34 50 41 28 30 41 Soybean farming 3 3 3 - 4 - 5 - 3 5 3 4 Dry pea and bean farming - - - - - - - - - - 1 -Wheat farming 5 5 - 6 - 3 6 4 4 5 - 4 Corn farming 15 8 7 7 14 13 11 28 15 13 14 19 Rice farming 3 - - - - - 4 - 3 - - 1 Other grain farming 4 24 36 - - 4 - 5 5 - 5 5
Oilseed and grain combination farming - 19 29 - - - - - 4 1 4 2
Vegetable and melon farming 17 11 18 15 11 16 11 17 10 10 15 8 Vegetable and melon farming 17 11 18 15 11 16 11 17 10 10 15 8
Potato farming 6 - - - - 3 - 4 - 5 3 -Fruit and tree nut farming 13 28 16 25 17 24 21 21 13 13 17 15
Orange groves - - - 4 - - - - - - - -Citrus (except orange) groves - 9 - - - - - - - - - -Noncitrus fruit and tree nut farming 11 13 12 17 13 21 18 19 11 13 14 11
Apple orchards - 4 3 3 - 5 3 5 - - 3 -Grape vineyards 3 5 4 4 - - - - - 1 - 5 Berry (except strawberry) farming 3 - - - - - - - 2 - - 1 Tree nut farming - - - 4 - - 5 4 4 - 4 -Fruit and tree nut combination farming - - - - - - - - - - 1 -
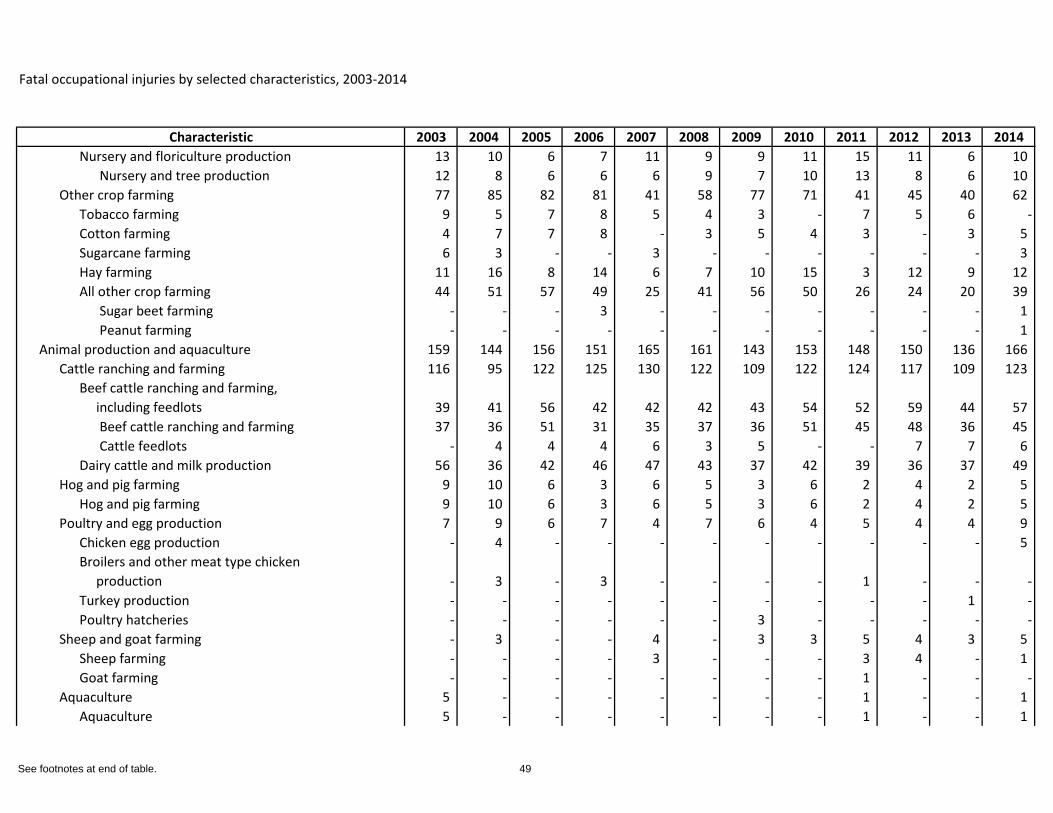
Greenhouse, nursery, and floriculture production 18 10 6 11 13 11 12 12 16 14 7 10
Food crops grown under cover 3 - - 4 - - - - - - - -Mushroom production - - - 4 - - - - - 1 - -
See footnotes at end of table. 48
Fatal occupational injuries by selected characteristics, 2003-2014
Characteristic 2003 2004 2005 2006 2007 2008 2009 2010 2011 2012 2013 2014Nursery and floriculture production 13 10 6 7 11 9 9 11 15 11 6 10
Nursery and tree production 12 8 6 6 6 9 7 10 13 8 6 10 Other crop farming 77 85 82 81 41 58 77 71 41 45 40 62
Tobacco farming 9 5 7 8 5 4 3 - 7 5 6 -Cotton farming 4 7 7 8 - 3 5 4 3 - 3 5 Sugarcane farming 6 3 - - 3 - - - - - - 3 Hay farming 11 16 8 14 6 7 10 15 3 12 9 12 All other crop farming 44 51 57 49 25 41 56 50 26 24 20 39
Sugar beet farming - - - 3 - - - - - - - 1 Peanut farming - - - - - - - - - - - 1
Animal production and aquaculture 159 144 156 151 165 161 143 153 148 150 136 166 Cattle ranching and farming 116 95 122 125 130 122 109 122 124 117 109 123
Beef cattle ranching and farming, including feedlots 39 41 56 42 42 42 43 54 52 59 44 57
Beef cattle ranching and farming 37 36 51 31 35 37 36 51 45 48 36 45 Cattle feedlots - 4 4 4 6 3 5 - - 7 7 6
Dairy cattle and milk production 56 36 42 46 47 43 37 42 39 36 37 49 Hog and pig farming 9 10 6 3 6 5 3 6 2 4 2 5
Hog and pig farming 9 10 6 3 6 5 3 6 2 4 2 5 Poultry and egg production 7 9 6 7 4 7 6 4 5 4 4 9
Chicken egg production - 4 - - - - - - - - - 5 Broilers and other meat type chicken production - 3 - 3 - - - - 1 - - -Turkey production - - - - - - - - - - 1 -Poultry hatcheries - - - - - - 3 - - - - -
Sheep and goat farming - 3 - - 4 - 3 3 5 4 3 5 Sheep farming - - - - 3 - - - 3 4 - 1 Goat farming - - - - - - - - 1 - - -
Aquaculture 5 - - - - - - - 1 - - 1 Aquaculture 5 - - - - - - - 1 - - 1
See footnotes at end of table. 49
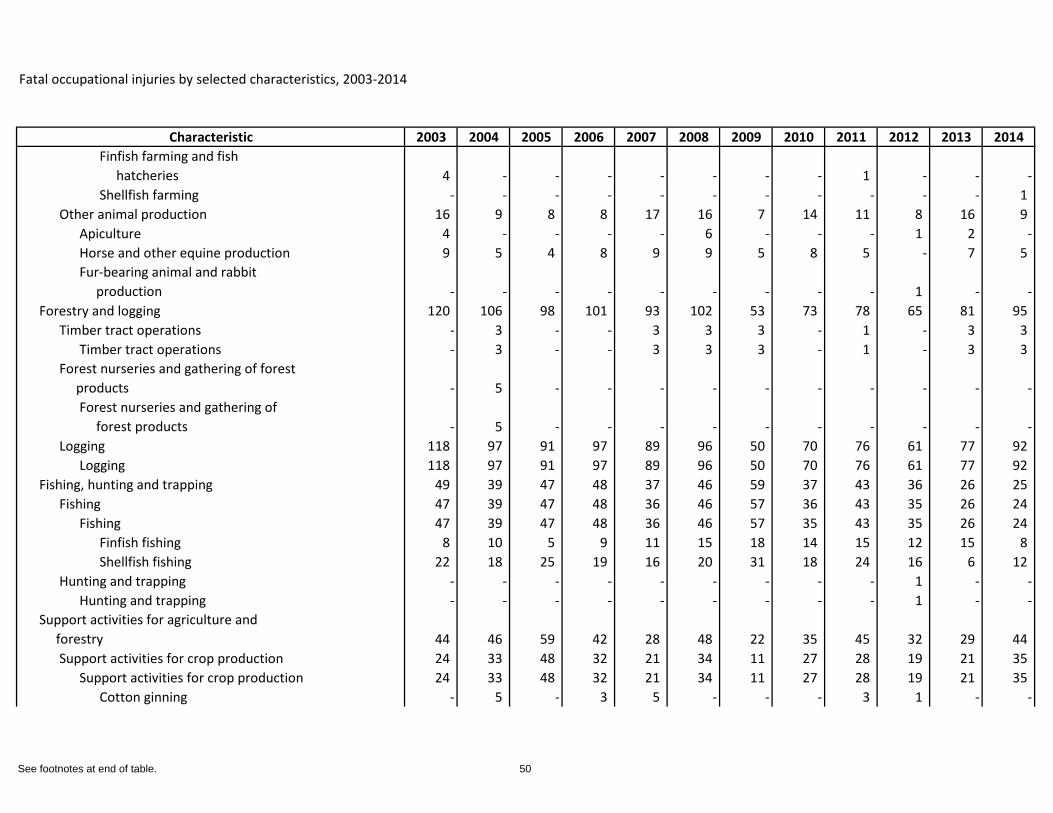
Fatal occupational injuries by selected characteristics, 2003-2014
Characteristic 2003 2004 2005 2006 2007 2008 2009 2010 2011 2012 2013 2014Finfish farming and fish hatcheries 4 - - - - - - - 1 - - -Shellfish farming - - - - - - - - - - - 1
Other animal production 16 9 8 8 17 16 7 14 11 8 16 9 Apiculture 4 - - - - 6 - - - 1 2 -Horse and other equine production 9 5 4 8 9 9 5 8 5 - 7 5 Fur-bearing animal and rabbit production - - - - - - - - - 1 - -
Forestry and logging 120 106 98 101 93 102 53 73 78 65 81 95 Timber tract operations - 3 - - 3 3 3 - 1 - 3 3
Timber tract operations - 3 - - 3 3 3 - 1 - 3 3 Forest nurseries and gathering of forest products - 5 - - - - - - - - - -
Forest nurseries and gathering of forest products - 5 - - - - - - - - - -
Logging 118 97 91 97 89 96 50 70 76 61 77 92 Logging 118 97 91 97 89 96 50 70 76 61 77 92
Fishing, hunting and trapping 49 39 47 48 37 46 59 37 43 36 26 25 Fishing 47 39 47 48 36 46 57 36 43 35 26 24
Fishing 47 39 47 48 36 46 57 35 43 35 26 24 Finfish fishing 8 10 5 9 11 15 18 14 15 12 15 8 Shellfish fishing 22 18 25 19 16 20 31 18 24 16 6 12
Hunting and trapping - - - - - - - - - 1 - -Hunting and trapping - - - - - - - - - 1 - -
Support activities for agriculture and forestry 44 46 59 42 28 48 22 35 45 32 29 44
Support activities for crop production 24 33 48 32 21 34 11 27 28 19 21 35 Support activities for crop production 24 33 48 32 21 34 11 27 28 19 21 35
Cotton ginning - 5 - 3 5 - - - 3 1 - -
See footnotes at end of table. 50
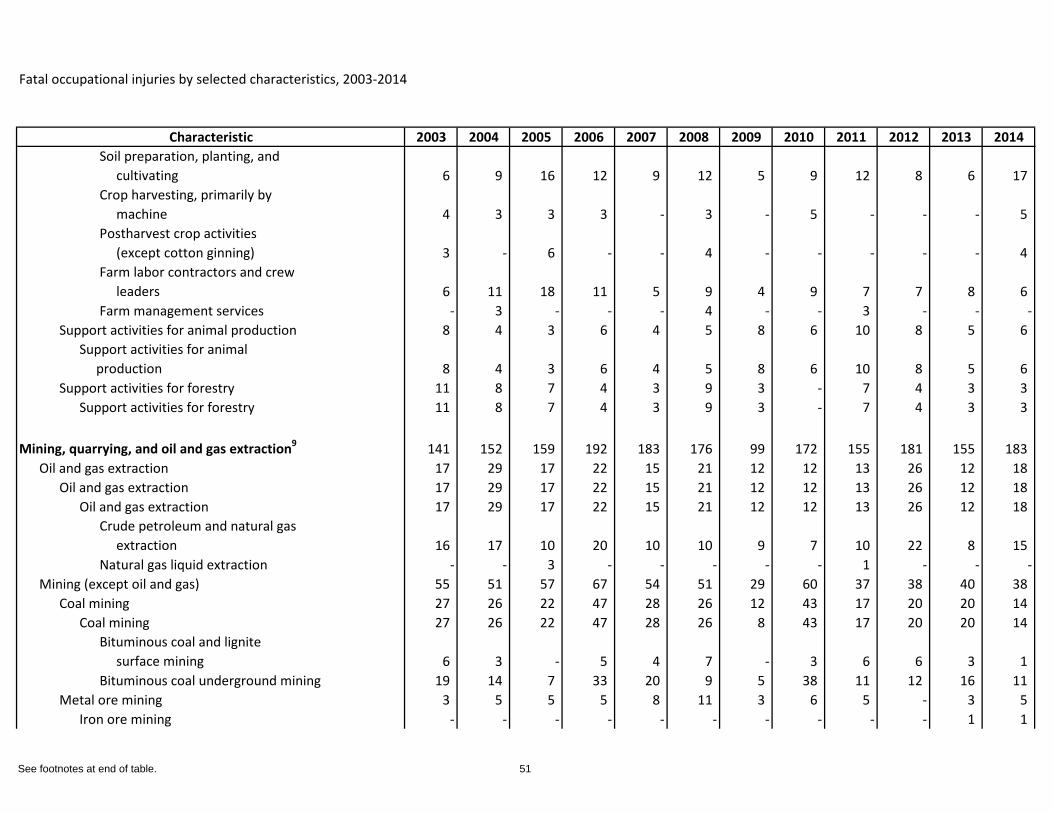
Fatal occupational injuries by selected characteristics, 2003-2014
Characteristic 2003 2004 2005 2006 2007 2008 2009 2010 2011 2012 2013 2014Soil preparation, planting, and cultivating 6 9 16 12 9 12 5 9 12 8 6 17 Crop harvesting, primarily by machine 4 3 3 3 - 3 - 5 - - - 5 Postharvest crop activities (except cotton ginning) 3 - 6 - - 4 - - - - - 4 Farm labor contractors and crew leaders 6 11 18 11 5 9 4 9 7 7 8 6 Farm management services - 3 - - - 4 - - 3 - - -
Support activities for animal production 8 4 3 6 4 5 8 6 10 8 5 6 Support activities for animal production 8 4 3 6 4 5 8 6 10 8 5 6
Support activities for forestry 11 8 7 4 3 9 3 - 7 4 3 3 Support activities for forestry 11 8 7 4 3 9 3 - 7 4 3 3
Mining, quarrying, and oil and gas extraction9 141 152 159 192 183 176 99 172 155 181 155 183 Oil and gas extraction 17 29 17 22 15 21 12 12 13 26 12 18
Oil and gas extraction 17 29 17 22 15 21 12 12 13 26 12 18 Oil and gas extraction 17 29 17 22 15 21 12 12 13 26 12 18
Crude petroleum and natural gas extraction 16 17 10 20 10 10 9 7 10 22 8 15 Natural gas liquid extraction - - 3 - - - - - 1 - - -
Mining (except oil and gas) 55 51 57 67 54 51 29 60 37 38 40 38 Coal mining 27 26 22 47 28 26 12 43 17 20 20 14
Coal mining 27 26 22 47 28 26 8 43 17 20 20 14 Bituminous coal and lignite surface mining 6 3 - 5 4 7 - 3 6 6 3 1 Bituminous coal underground mining 19 14 7 33 20 9 5 38 11 12 16 11
Metal ore mining 3 5 5 5 8 11 3 6 5 - 3 5 Iron ore mining - - - - - - - - - - 1 1
See footnotes at end of table. 51
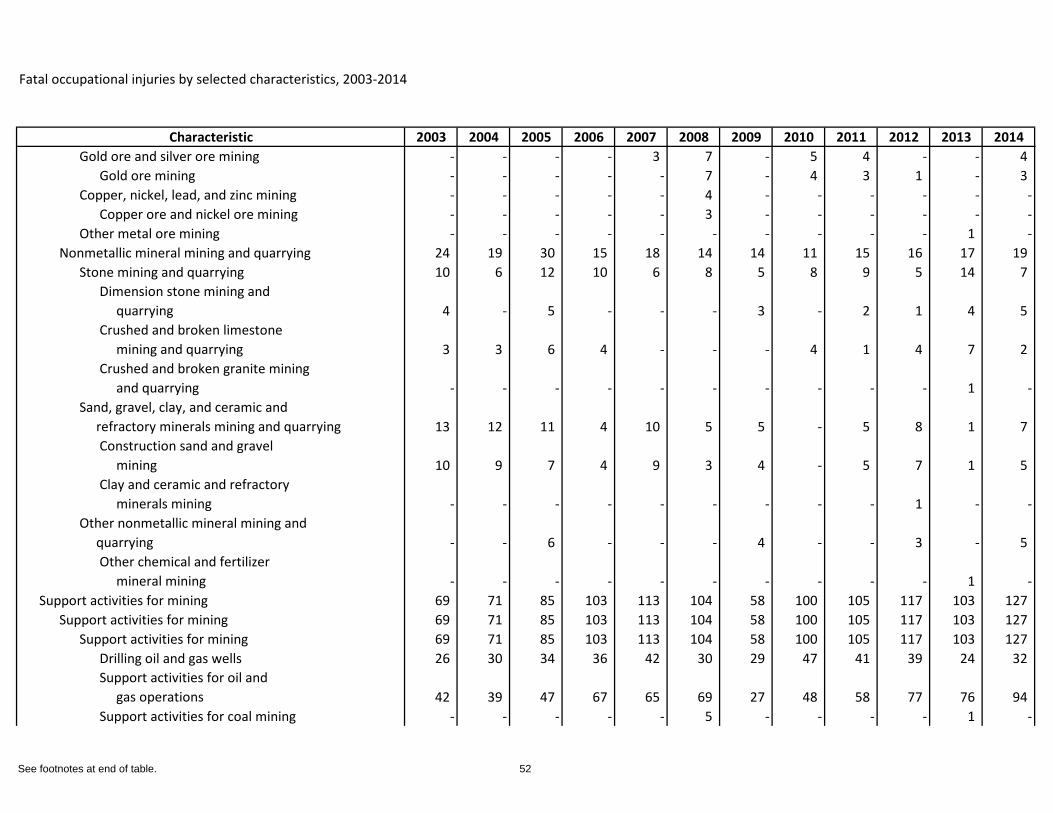
Fatal occupational injuries by selected characteristics, 2003-2014
Characteristic 2003 2004 2005 2006 2007 2008 2009 2010 2011 2012 2013 2014Gold ore and silver ore mining - - - - 3 7 - 5 4 - - 4
Gold ore mining - - - - - 7 - 4 3 1 - 3 Copper, nickel, lead, and zinc mining - - - - - 4 - - - - - -
Copper ore and nickel ore mining - - - - - 3 - - - - - -Other metal ore mining - - - - - - - - - - 1 -
Nonmetallic mineral mining and quarrying 24 19 30 15 18 14 14 11 15 16 17 19 Stone mining and quarrying 10 6 12 10 6 8 5 8 9 5 14 7
Dimension stone mining and quarrying 4 - 5 - - - 3 - 2 1 4 5 Crushed and broken limestone mining and quarrying 3 3 6 4 - - - 4 1 4 7 2 Crushed and broken granite mining and quarrying - - - - - - - - - - 1 -
Sand, gravel, clay, and ceramic and refractory minerals mining and quarrying 13 12 11 4 10 5 5 - 5 8 1 7
Construction sand and gravel mining 10 9 7 4 9 3 4 - 5 7 1 5 Clay and ceramic and refractory minerals mining - - - - - - - - - 1 - -
Other nonmetallic mineral mining and quarrying - - 6 - - - 4 - - 3 - 5
Other chemical and fertilizer mineral mining - - - - - - - - - - 1 -
Support activities for mining 69 71 85 103 113 104 58 100 105 117 103 127 Support activities for mining 69 71 85 103 113 104 58 100 105 117 103 127
Support activities for mining 69 71 85 103 113 104 58 100 105 117 103 127 Drilling oil and gas wells 26 30 34 36 42 30 29 47 41 39 24 32 Support activities for oil and gas operations 42 39 47 67 65 69 27 48 58 77 76 94 Support activities for coal mining - - - - - 5 - - - - 1 -
See footnotes at end of table. 52
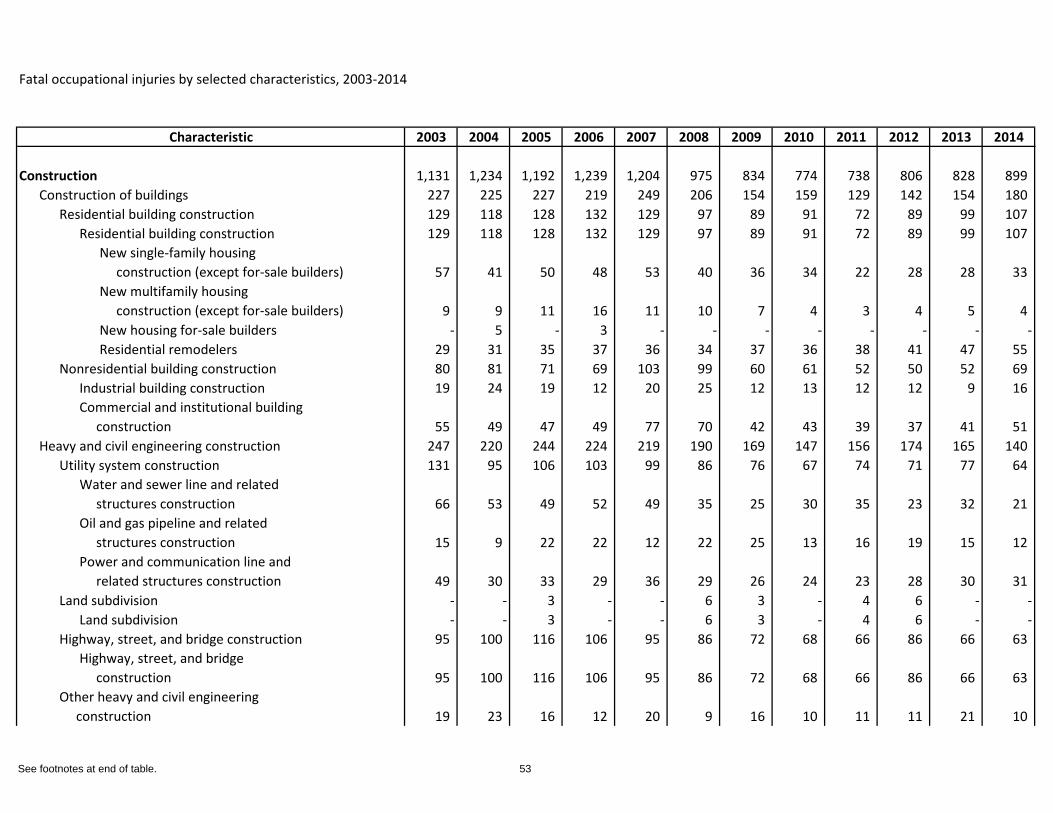
Fatal occupational injuries by selected characteristics, 2003-2014
Characteristic 2003 2004 2005 2006 2007 2008 2009 2010 2011 2012 2013 2014
Construction 1,131 1,234 1,192 1,239 1,204 975 834 774 738 806 828 899 Construction of buildings 227 225 227 219 249 206 154 159 129 142 154 180
Residential building construction 129 118 128 132 129 97 89 91 72 89 99 107 Residential building construction 129 118 128 132 129 97 89 91 72 89 99 107
New single-family housing construction (except for-sale builders) 57 41 50 48 53 40 36 34 22 28 28 33 New multifamily housing construction (except for-sale builders) 9 9 11 16 11 10 7 4 3 4 5 4 New housing for-sale builders - 5 - 3 - - - - - - - -Residential remodelers 29 31 35 37 36 34 37 36 38 41 47 55
Nonresidential building construction 80 81 71 69 103 99 60 61 52 50 52 69 Industrial building construction 19 24 19 12 20 25 12 13 12 12 9 16 Commercial and institutional building construction 55 49 47 49 77 70 42 43 39 37 41 51
Heavy and civil engineering construction 247 220 244 224 219 190 169 147 156 174 165 140 Utility system construction 131 95 106 103 99 86 76 67 74 71 77 64
Water and sewer line and related structures construction 66 53 49 52 49 35 25 30 35 23 32 21 Oil and gas pipeline and related structures construction 15 9 22 22 12 22 25 13 16 19 15 12 Power and communication line and related structures construction 49 30 33 29 36 29 26 24 23 28 30 31
Land subdivision - - 3 - - 6 3 - 4 6 - -Land subdivision - - 3 - - 6 3 - 4 6 - -
Highway, street, and bridge construction 95 100 116 106 95 86 72 68 66 86 66 63 Highway, street, and bridge construction 95 100 116 106 95 86 72 68 66 86 66 63
Other heavy and civil engineering construction 19 23 16 12 20 9 16 10 11 11 21 10
See footnotes at end of table. 53
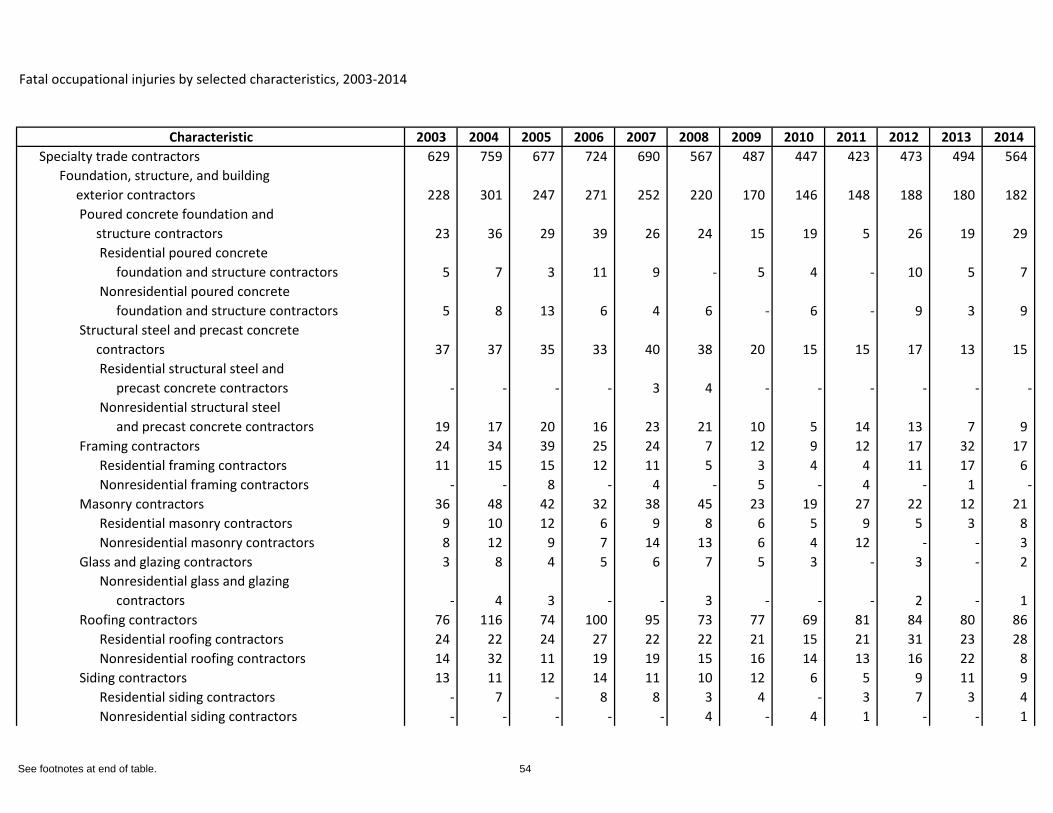
Fatal occupational injuries by selected characteristics, 2003-2014
Characteristic 2003 2004 2005 2006 2007 2008 2009 2010 2011 2012 2013 2014Specialty trade contractors 629 759 677 724 690 567 487 447 423 473 494 564
Foundation, structure, and building exterior contractors 228 301 247 271 252 220 170 146 148 188 180 182
Poured concrete foundation and structure contractors 23 36 29 39 26 24 15 19 5 26 19 29
Residential poured concrete foundation and structure contractors 5 7 3 11 9 - 5 4 - 10 5 7 Nonresidential poured concrete foundation and structure contractors 5 8 13 6 4 6 - 6 - 9 3 9
Structural steel and precast concrete contractors 37 37 35 33 40 38 20 15 15 17 13 15
Residential structural steel and precast concrete contractors - - - - 3 4 - - - - - -Nonresidential structural steel and precast concrete contractors 19 17 20 16 23 21 10 5 14 13 7 9
Framing contractors 24 34 39 25 24 7 12 9 12 17 32 17 Residential framing contractors 11 15 15 12 11 5 3 4 4 11 17 6 Nonresidential framing contractors - - 8 - 4 - 5 - 4 - 1 -
Masonry contractors 36 48 42 32 38 45 23 19 27 22 12 21 Residential masonry contractors 9 10 12 6 9 8 6 5 9 5 3 8 Nonresidential masonry contractors 8 12 9 7 14 13 6 4 12 - - 3
Glass and glazing contractors 3 8 4 5 6 7 5 3 - 3 - 2 Nonresidential glass and glazing contractors - 4 3 - - 3 - - - 2 - 1
Roofing contractors 76 116 74 100 95 73 77 69 81 84 80 86 Residential roofing contractors 24 22 24 27 22 22 21 15 21 31 23 28 Nonresidential roofing contractors 14 32 11 19 19 15 16 14 13 16 22 8
Siding contractors 13 11 12 14 11 10 12 6 5 9 11 9 Residential siding contractors - 7 - 8 8 3 4 - 3 7 3 4 Nonresidential siding contractors - - - - - 4 - 4 1 - - 1
See footnotes at end of table. 54
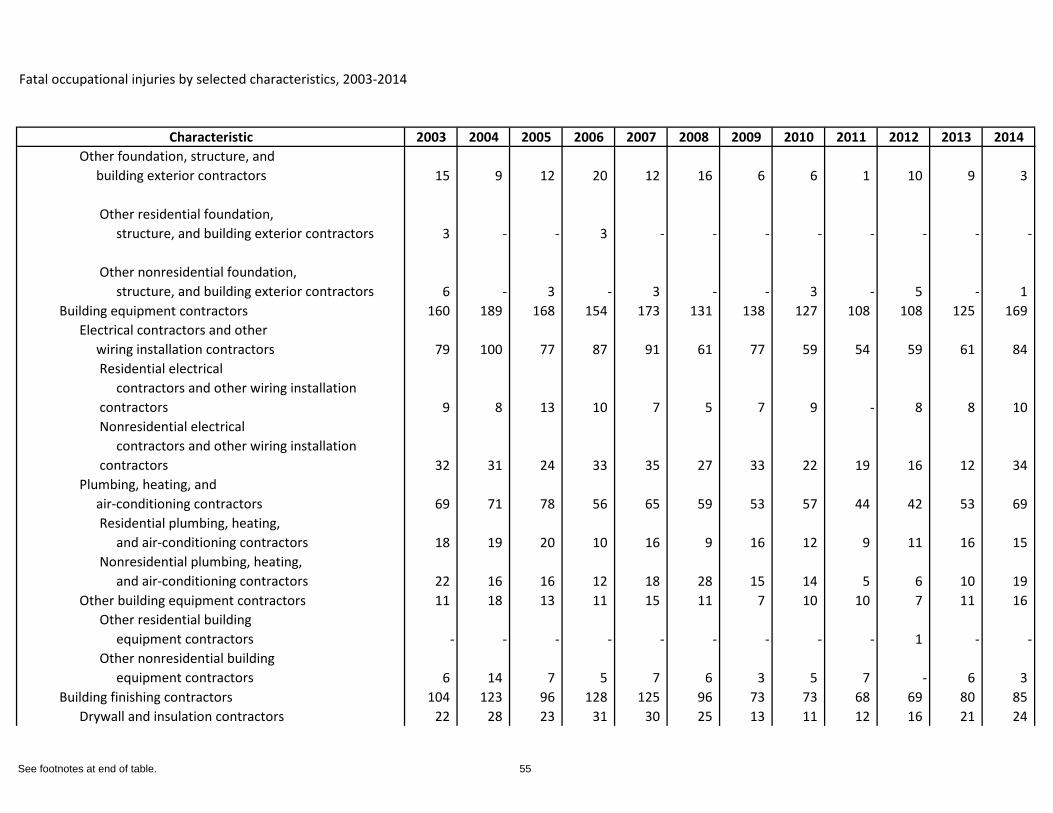
Fatal occupational injuries by selected characteristics, 2003-2014
Characteristic 2003 2004 2005 2006 2007 2008 2009 2010 2011 2012 2013 2014Other foundation, structure, and building exterior contractors 15 9 12 20 12 16 6 6 1 10 9 3
Other residential foundation, structure, and building exterior contractors 3 - - 3 - - - - - - - -
Other nonresidential foundation, structure, and building exterior contractors 6 - 3 - 3 - - 3 - 5 - 1
Building equipment contractors 160 189 168 154 173 131 138 127 108 108 125 169 Electrical contractors and other wiring installation contractors 79 100 77 87 91 61 77 59 54 59 61 84
Residential electrical contractors and other wiring installation contractors 9 8 13 10 7 5 7 9 - 8 8 10 Nonresidential electrical contractors and other wiring installation contractors 32 31 24 33 35 27 33 22 19 16 12 34
Plumbing, heating, and air-conditioning contractors 69 71 78 56 65 59 53 57 44 42 53 69
Residential plumbing, heating, and air-conditioning contractors 18 19 20 10 16 9 16 12 9 11 16 15 Nonresidential plumbing, heating, and air-conditioning contractors 22 16 16 12 18 28 15 14 5 6 10 19
Other building equipment contractors 11 18 13 11 15 11 7 10 10 7 11 16 Other residential building equipment contractors - - - - - - - - - 1 - -Other nonresidential building equipment contractors 6 14 7 5 7 6 3 5 7 - 6 3
Building finishing contractors 104 123 96 128 125 96 73 73 68 69 80 85 Drywall and insulation contractors 22 28 23 31 30 25 13 11 12 16 21 24
See footnotes at end of table. 55
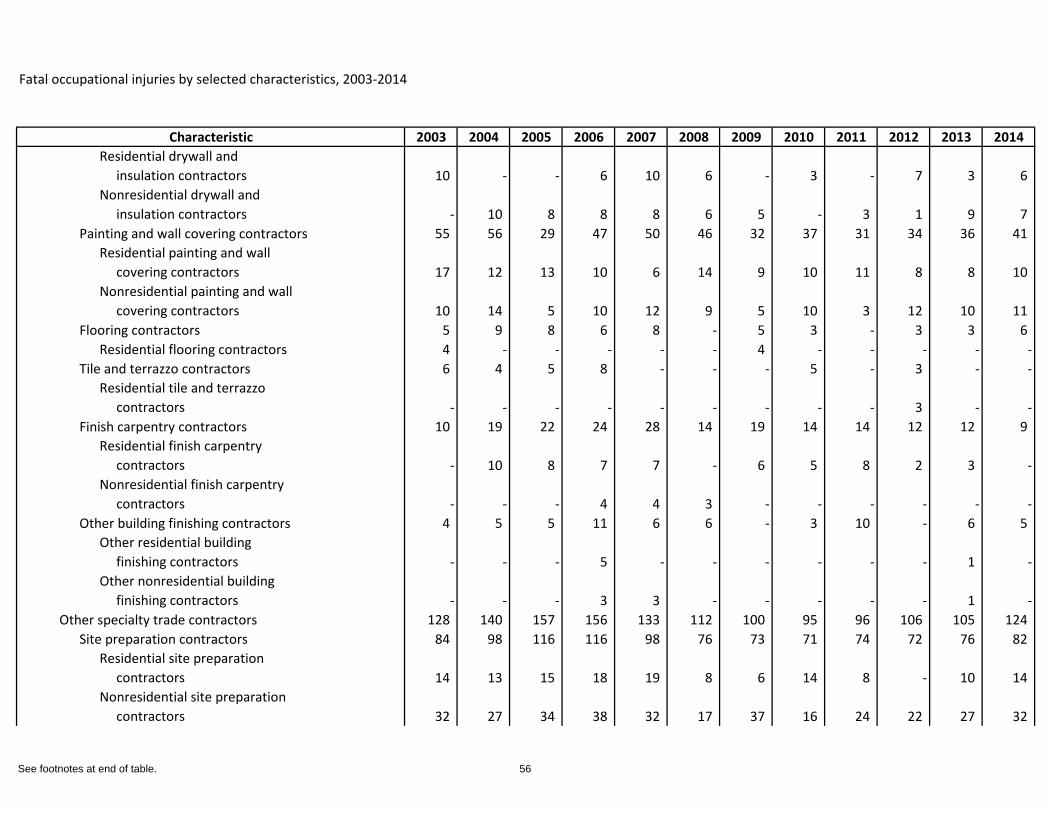
Fatal occupational injuries by selected characteristics, 2003-2014
Characteristic 2003 2004 2005 2006 2007 2008 2009 2010 2011 2012 2013 2014Residential drywall and insulation contractors 10 - - 6 10 6 - 3 - 7 3 6 Nonresidential drywall and insulation contractors - 10 8 8 8 6 5 - 3 1 9 7
Painting and wall covering contractors 55 56 29 47 50 46 32 37 31 34 36 41 Residential painting and wall covering contractors 17 12 13 10 6 14 9 10 11 8 8 10 Nonresidential painting and wall covering contractors 10 14 5 10 12 9 5 10 3 12 10 11
Flooring contractors 5 9 8 6 8 - 5 3 - 3 3 6 Residential flooring contractors 4 - - - - - 4 - - - - -
Tile and terrazzo contractors 6 4 5 8 - - - 5 - 3 - -Residential tile and terrazzo contractors - - - - - - - - - 3 - -
Finish carpentry contractors 10 19 22 24 28 14 19 14 14 12 12 9 Residential finish carpentry contractors - 10 8 7 7 - 6 5 8 2 3 -Nonresidential finish carpentry contractors - - - 4 4 3 - - - - - -
Other building finishing contractors 4 5 5 11 6 6 - 3 10 - 6 5 Other residential building finishing contractors - - - 5 - - - - - - 1 -Other nonresidential building finishing contractors - - - 3 3 - - - - - 1 -
Other specialty trade contractors 128 140 157 156 133 112 100 95 96 106 105 124 Site preparation contractors 84 98 116 116 98 76 73 71 74 72 76 82
Residential site preparation contractors 14 13 15 18 19 8 6 14 8 - 10 14 Nonresidential site preparation contractors 32 27 34 38 32 17 37 16 24 22 27 32
See footnotes at end of table. 56
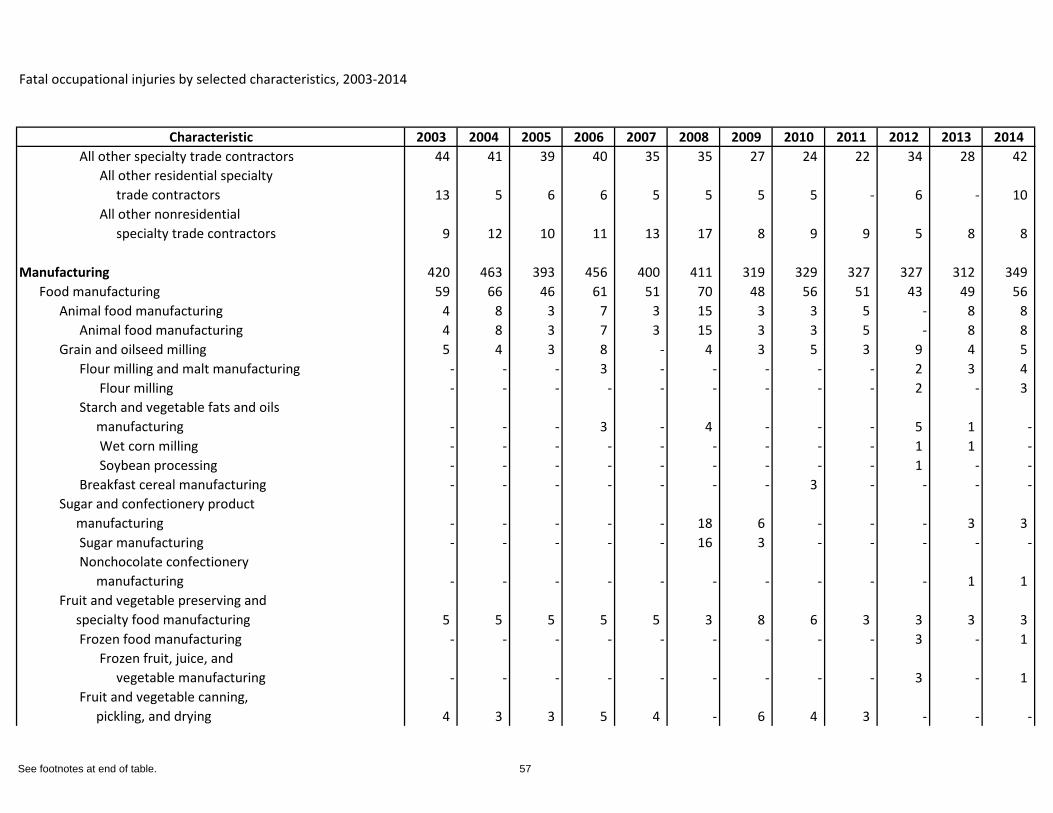
Fatal occupational injuries by selected characteristics, 2003-2014
Characteristic 2003 2004 2005 2006 2007 2008 2009 2010 2011 2012 2013 2014All other specialty trade contractors 44 41 39 40 35 35 27 24 22 34 28 42
All other residential specialty trade contractors 13 5 6 6 5 5 5 5 - 6 - 10 All other nonresidential specialty trade contractors 9 12 10 11 13 17 8 9 9 5 8 8
Manufacturing 420 463 393 456 400 411 319 329 327 327 312 349 Food manufacturing 59 66 46 61 51 70 48 56 51 43 49 56
Animal food manufacturing 4 8 3 7 3 15 3 3 5 - 8 8 Animal food manufacturing 4 8 3 7 3 15 3 3 5 - 8 8
Grain and oilseed milling 5 4 3 8 - 4 3 5 3 9 4 5 Flour milling and malt manufacturing - - - 3 - - - - - 2 3 4
Flour milling - - - - - - - - - 2 - 3 Starch and vegetable fats and oils manufacturing - - - 3 - 4 - - - 5 1 -
Wet corn milling - - - - - - - - - 1 1 -Soybean processing - - - - - - - - - 1 - -
Breakfast cereal manufacturing - - - - - - - 3 - - - -Sugar and confectionery product manufacturing - - - - - 18 6 - - - 3 3
Sugar manufacturing - - - - - 16 3 - - - - -Nonchocolate confectionery manufacturing - - - - - - - - - - 1 1
Fruit and vegetable preserving and specialty food manufacturing 5 5 5 5 5 3 8 6 3 3 3 3
Frozen food manufacturing - - - - - - - - - 3 - 1 Frozen fruit, juice, and vegetable manufacturing - - - - - - - - - 3 - 1
Fruit and vegetable canning, pickling, and drying 4 3 3 5 4 - 6 4 3 - - -
See footnotes at end of table. 57
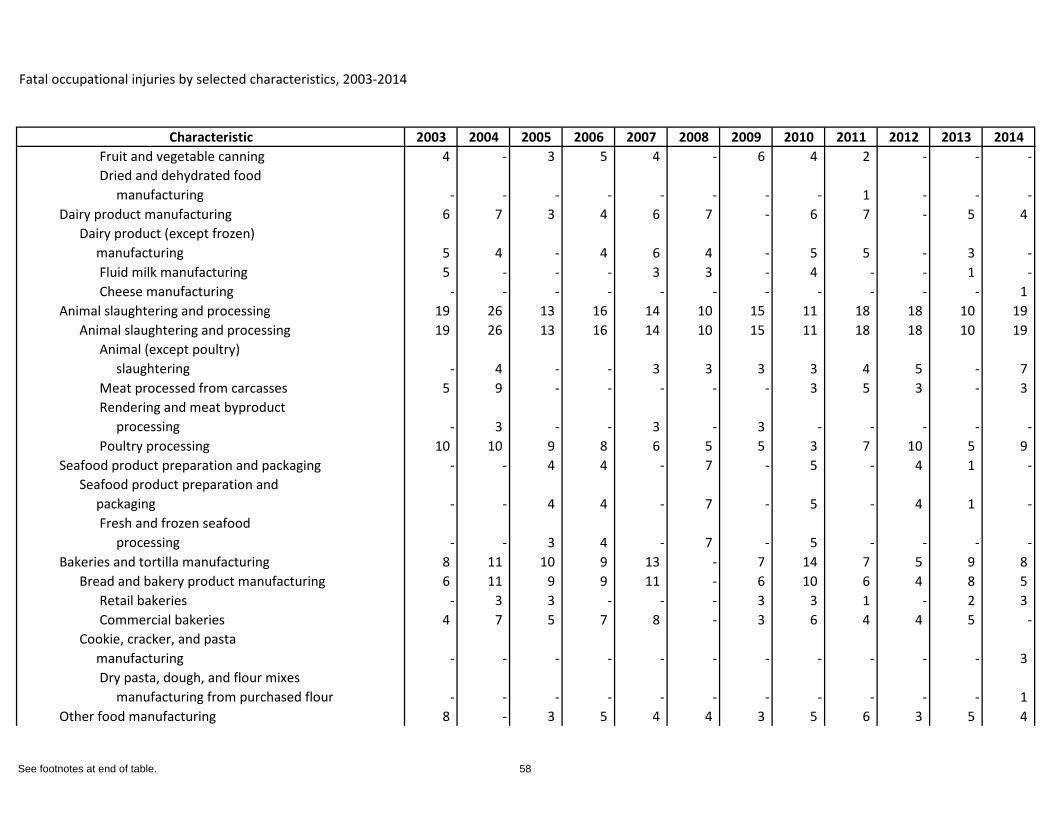
Fatal occupational injuries by selected characteristics, 2003-2014
Characteristic 2003 2004 2005 2006 2007 2008 2009 2010 2011 2012 2013 2014Fruit and vegetable canning 4 - 3 5 4 - 6 4 2 - - -Dried and dehydrated food manufacturing - - - - - - - - 1 - - -
Dairy product manufacturing 6 7 3 4 6 7 - 6 7 - 5 4 Dairy product (except frozen) manufacturing 5 4 - 4 6 4 - 5 5 - 3 -
Fluid milk manufacturing 5 - - - 3 3 - 4 - - 1 -Cheese manufacturing - - - - - - - - - - - 1
Animal slaughtering and processing 19 26 13 16 14 10 15 11 18 18 10 19 Animal slaughtering and processing 19 26 13 16 14 10 15 11 18 18 10 19
Animal (except poultry) slaughtering - 4 - - 3 3 3 3 4 5 - 7 Meat processed from carcasses 5 9 - - - - - 3 5 3 - 3 Rendering and meat byproduct processing - 3 - - 3 - 3 - - - - -Poultry processing 10 10 9 8 6 5 5 3 7 10 5 9
Seafood product preparation and packaging - - 4 4 - 7 - 5 - 4 1 -Seafood product preparation and packaging - - 4 4 - 7 - 5 - 4 1 -
Fresh and frozen seafood processing - - 3 4 - 7 - 5 - - - -
Bakeries and tortilla manufacturing 8 11 10 9 13 - 7 14 7 5 9 8 Bread and bakery product manufacturing 6 11 9 9 11 - 6 10 6 4 8 5
Retail bakeries - 3 3 - - - 3 3 1 - 2 3 Commercial bakeries 4 7 5 7 8 - 3 6 4 4 5 -
Cookie, cracker, and pasta manufacturing - - - - - - - - - - - 3
Dry pasta, dough, and flour mixes manufacturing from purchased flour - - - - - - - - - - - 1
Other food manufacturing 8 - 3 5 4 4 3 5 6 3 5 4
See footnotes at end of table. 58
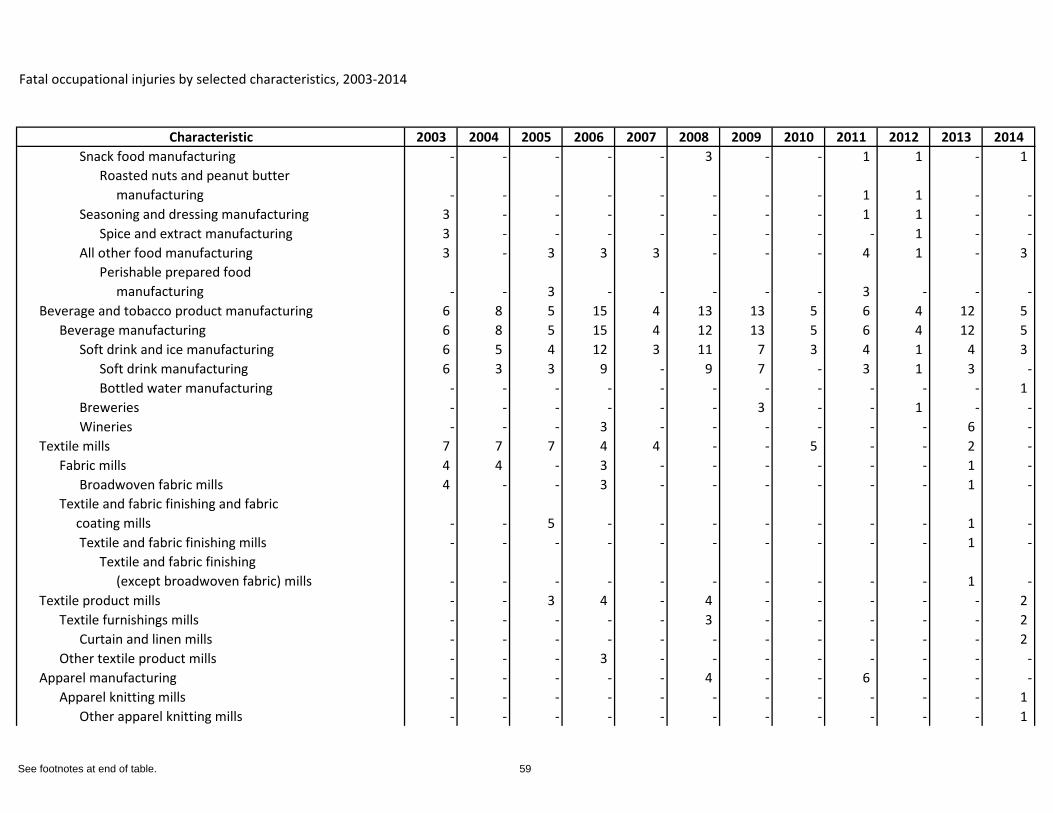
Fatal occupational injuries by selected characteristics, 2003-2014
Characteristic 2003 2004 2005 2006 2007 2008 2009 2010 2011 2012 2013 2014Snack food manufacturing - - - - - 3 - - 1 1 - 1
Roasted nuts and peanut butter manufacturing - - - - - - - - 1 1 - -
Seasoning and dressing manufacturing 3 - - - - - - - 1 1 - -Spice and extract manufacturing 3 - - - - - - - - 1 - -
All other food manufacturing 3 - 3 3 3 - - - 4 1 - 3 Perishable prepared food manufacturing - - 3 - - - - - 3 - - -
Beverage and tobacco product manufacturing 6 8 5 15 4 13 13 5 6 4 12 5 Beverage manufacturing 6 8 5 15 4 12 13 5 6 4 12 5
Soft drink and ice manufacturing 6 5 4 12 3 11 7 3 4 1 4 3 Soft drink manufacturing 6 3 3 9 - 9 7 - 3 1 3 -Bottled water manufacturing - - - - - - - - - - - 1
Breweries - - - - - - 3 - - 1 - -Wineries - - - 3 - - - - - - 6 -
Textile mills 7 7 7 4 4 - - 5 - - 2 -Fabric mills 4 4 - 3 - - - - - - 1 -
Broadwoven fabric mills 4 - - 3 - - - - - - 1 -Textile and fabric finishing and fabric coating mills - - 5 - - - - - - - 1 -
Textile and fabric finishing mills - - - - - - - - - - 1 -Textile and fabric finishing (except broadwoven fabric) mills - - - - - - - - - - 1 -
Textile product mills - - 3 4 - 4 - - - - - 2 Textile furnishings mills - - - - - 3 - - - - - 2
Curtain and linen mills - - - - - - - - - - - 2 Other textile product mills - - - 3 - - - - - - - -
Apparel manufacturing - - - - - 4 - - 6 - - -Apparel knitting mills - - - - - - - - - - - 1
Other apparel knitting mills - - - - - - - - - - - 1
See footnotes at end of table. 59
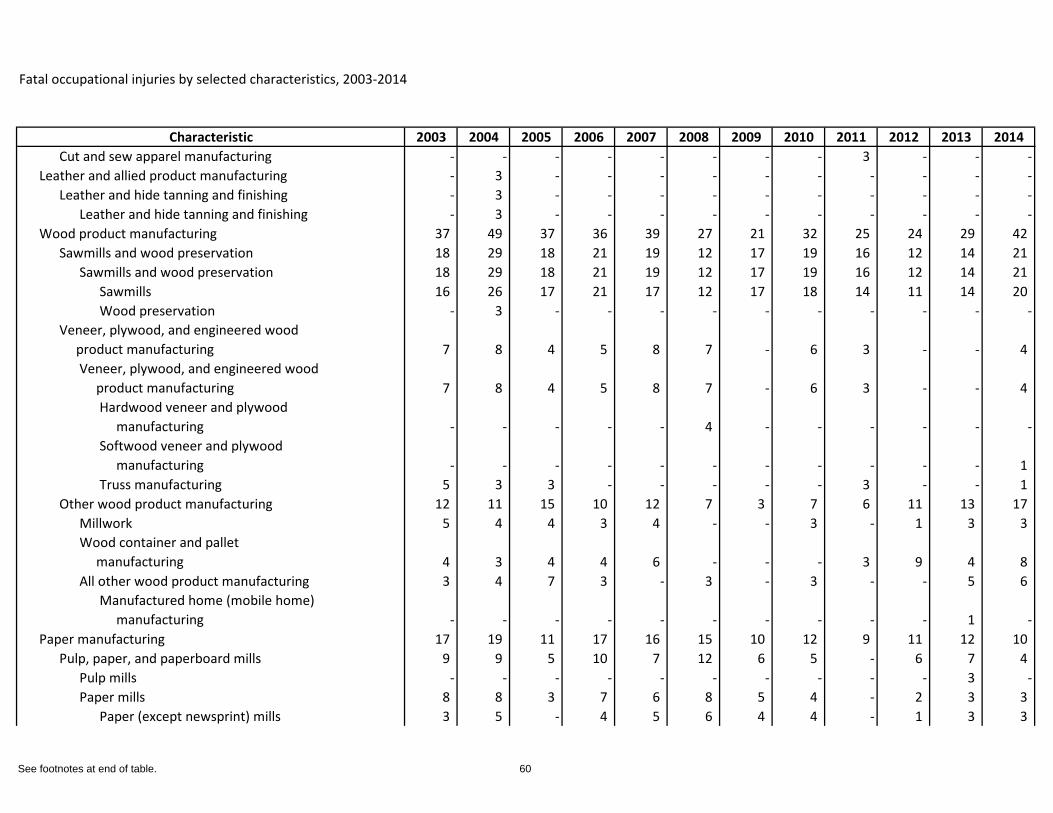
Fatal occupational injuries by selected characteristics, 2003-2014
Characteristic 2003 2004 2005 2006 2007 2008 2009 2010 2011 2012 2013 2014Cut and sew apparel manufacturing - - - - - - - - 3 - - -
Leather and allied product manufacturing - 3 - - - - - - - - - -Leather and hide tanning and finishing - 3 - - - - - - - - - -
Leather and hide tanning and finishing - 3 - - - - - - - - - -Wood product manufacturing 37 49 37 36 39 27 21 32 25 24 29 42
Sawmills and wood preservation 18 29 18 21 19 12 17 19 16 12 14 21 Sawmills and wood preservation 18 29 18 21 19 12 17 19 16 12 14 21
Sawmills 16 26 17 21 17 12 17 18 14 11 14 20 Wood preservation - 3 - - - - - - - - - -
Veneer, plywood, and engineered wood product manufacturing 7 8 4 5 8 7 - 6 3 - - 4
Veneer, plywood, and engineered wood product manufacturing 7 8 4 5 8 7 - 6 3 - - 4
Hardwood veneer and plywood manufacturing - - - - - 4 - - - - - -Softwood veneer and plywood manufacturing - - - - - - - - - - - 1 Truss manufacturing 5 3 3 - - - - - 3 - - 1
Other wood product manufacturing 12 11 15 10 12 7 3 7 6 11 13 17 Millwork 5 4 4 3 4 - - 3 - 1 3 3 Wood container and pallet manufacturing 4 3 4 4 6 - - - 3 9 4 8 All other wood product manufacturing 3 4 7 3 - 3 - 3 - - 5 6
Manufactured home (mobile home) manufacturing - - - - - - - - - - 1 -
Paper manufacturing 17 19 11 17 16 15 10 12 9 11 12 10 Pulp, paper, and paperboard mills 9 9 5 10 7 12 6 5 - 6 7 4
Pulp mills - - - - - - - - - - 3 -Paper mills 8 8 3 7 6 8 5 4 - 2 3 3
Paper (except newsprint) mills 3 5 - 4 5 6 4 4 - 1 3 3
See footnotes at end of table. 60
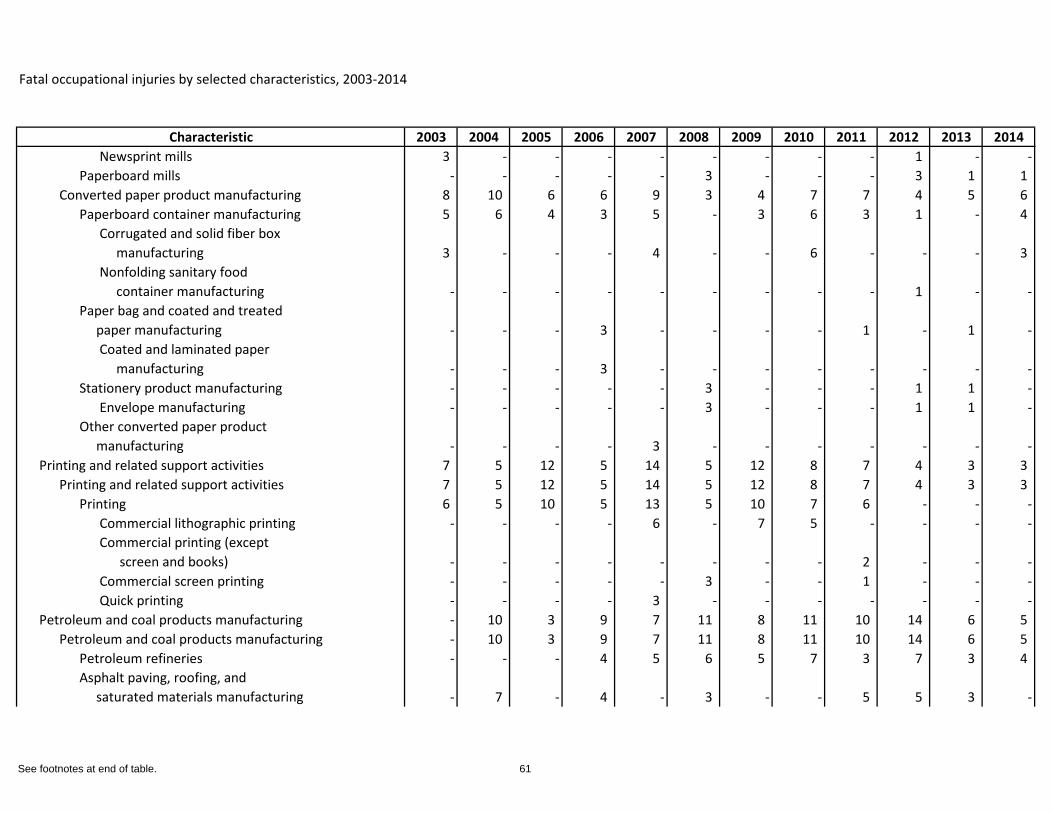
Fatal occupational injuries by selected characteristics, 2003-2014
Characteristic 2003 2004 2005 2006 2007 2008 2009 2010 2011 2012 2013 2014Newsprint mills 3 - - - - - - - - 1 - -
Paperboard mills - - - - - 3 - - - 3 1 1 Converted paper product manufacturing 8 10 6 6 9 3 4 7 7 4 5 6
Paperboard container manufacturing 5 6 4 3 5 - 3 6 3 1 - 4 Corrugated and solid fiber box manufacturing 3 - - - 4 - - 6 - - - 3 Nonfolding sanitary food container manufacturing - - - - - - - - - 1 - -
Paper bag and coated and treated paper manufacturing - - - 3 - - - - 1 - 1 -
Coated and laminated paper manufacturing - - - 3 - - - - - - - -
Stationery product manufacturing - - - - - 3 - - - 1 1 -Envelope manufacturing - - - - - 3 - - - 1 1 -
Other converted paper product manufacturing - - - - 3 - - - - - - -
Printing and related support activities 7 5 12 5 14 5 12 8 7 4 3 3 Printing and related support activities 7 5 12 5 14 5 12 8 7 4 3 3
Printing 6 5 10 5 13 5 10 7 6 - - -Commercial lithographic printing - - - - 6 - 7 5 - - - -Commercial printing (except screen and books) - - - - - - - - 2 - - -Commercial screen printing - - - - - 3 - - 1 - - -Quick printing - - - - 3 - - - - - - -
Petroleum and coal products manufacturing - 10 3 9 7 11 8 11 10 14 6 5 Petroleum and coal products manufacturing - 10 3 9 7 11 8 11 10 14 6 5
Petroleum refineries - - - 4 5 6 5 7 3 7 3 4 Asphalt paving, roofing, and saturated materials manufacturing - 7 - 4 - 3 - - 5 5 3 -
See footnotes at end of table. 61
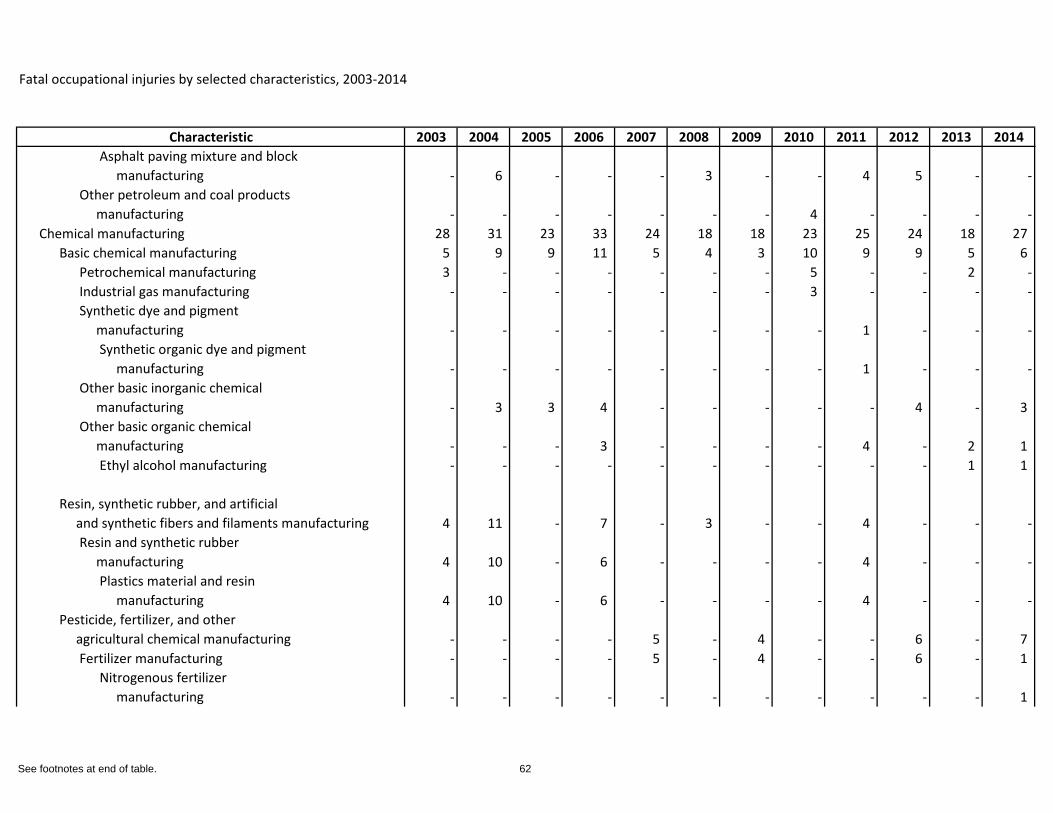
Fatal occupational injuries by selected characteristics, 2003-2014
Characteristic 2003 2004 2005 2006 2007 2008 2009 2010 2011 2012 2013 2014Asphalt paving mixture and block manufacturing - 6 - - - 3 - - 4 5 - -
Other petroleum and coal products manufacturing - - - - - - - 4 - - - -
Chemical manufacturing 28 31 23 33 24 18 18 23 25 24 18 27 Basic chemical manufacturing 5 9 9 11 5 4 3 10 9 9 5 6
Petrochemical manufacturing 3 - - - - - - 5 - - 2 -Industrial gas manufacturing - - - - - - - 3 - - - -Synthetic dye and pigment manufacturing - - - - - - - - 1 - - -
Synthetic organic dye and pigment manufacturing - - - - - - - - 1 - - -
Other basic inorganic chemical manufacturing - 3 3 4 - - - - - 4 - 3 Other basic organic chemical manufacturing - - - 3 - - - - 4 - 2 1
Ethyl alcohol manufacturing - - - - - - - - - - 1 1
Resin, synthetic rubber, and artificial and synthetic fibers and filaments manufacturing 4 11 - 7 - 3 - - 4 - - -
Resin and synthetic rubber manufacturing 4 10 - 6 - - - - 4 - - -
Plastics material and resin manufacturing 4 10 - 6 - - - - 4 - - -
Pesticide, fertilizer, and other agricultural chemical manufacturing - - - - 5 - 4 - - 6 - 7
Fertilizer manufacturing - - - - 5 - 4 - - 6 - 1 Nitrogenous fertilizer manufacturing - - - - - - - - - - - 1
See footnotes at end of table. 62
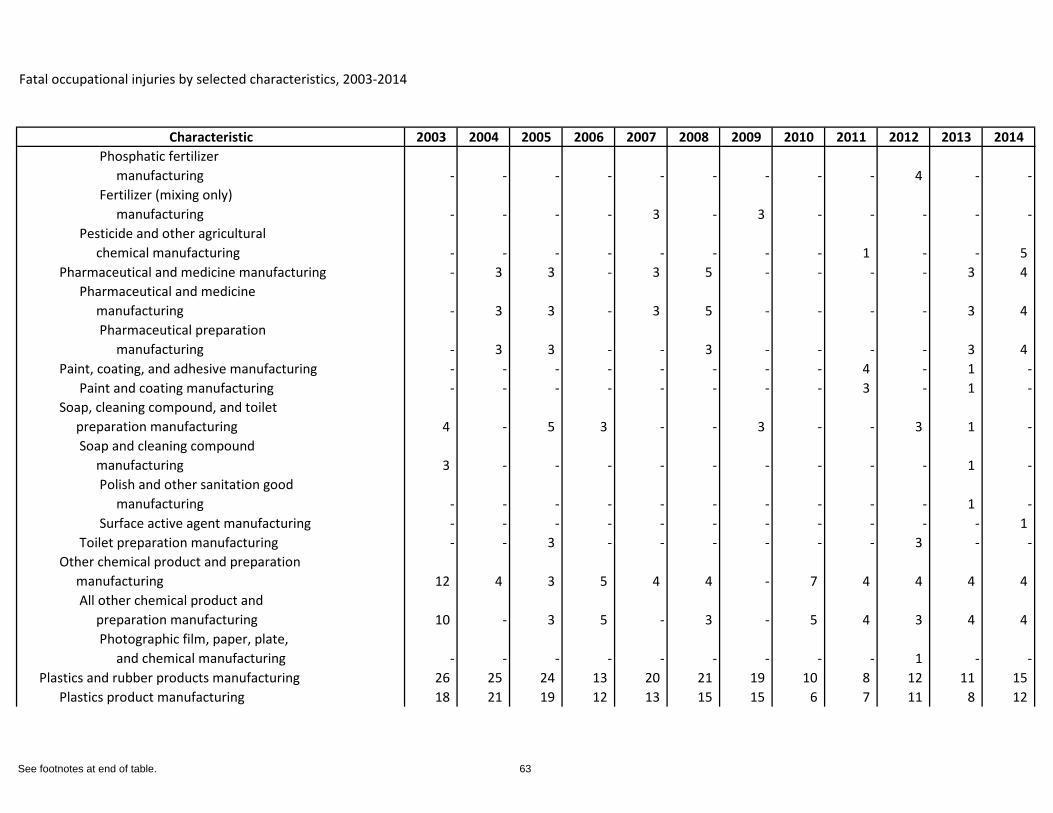
Fatal occupational injuries by selected characteristics, 2003-2014
Characteristic 2003 2004 2005 2006 2007 2008 2009 2010 2011 2012 2013 2014Phosphatic fertilizer manufacturing - - - - - - - - - 4 - -Fertilizer (mixing only) manufacturing - - - - 3 - 3 - - - - -
Pesticide and other agricultural chemical manufacturing - - - - - - - - 1 - - 5
Pharmaceutical and medicine manufacturing - 3 3 - 3 5 - - - - 3 4 Pharmaceutical and medicine manufacturing - 3 3 - 3 5 - - - - 3 4
Pharmaceutical preparation manufacturing - 3 3 - - 3 - - - - 3 4
Paint, coating, and adhesive manufacturing - - - - - - - - 4 - 1 -Paint and coating manufacturing - - - - - - - - 3 - 1 -
Soap, cleaning compound, and toilet preparation manufacturing 4 - 5 3 - - 3 - - 3 1 -
Soap and cleaning compound manufacturing 3 - - - - - - - - - 1 -
Polish and other sanitation good manufacturing - - - - - - - - - - 1 -Surface active agent manufacturing - - - - - - - - - - - 1
Toilet preparation manufacturing - - 3 - - - - - - 3 - -Other chemical product and preparation manufacturing 12 4 3 5 4 4 - 7 4 4 4 4
All other chemical product and preparation manufacturing 10 - 3 5 - 3 - 5 4 3 4 4
Photographic film, paper, plate, and chemical manufacturing - - - - - - - - - 1 - -
Plastics and rubber products manufacturing 26 25 24 13 20 21 19 10 8 12 11 15 Plastics product manufacturing 18 21 19 12 13 15 15 6 7 11 8 12
See footnotes at end of table. 63
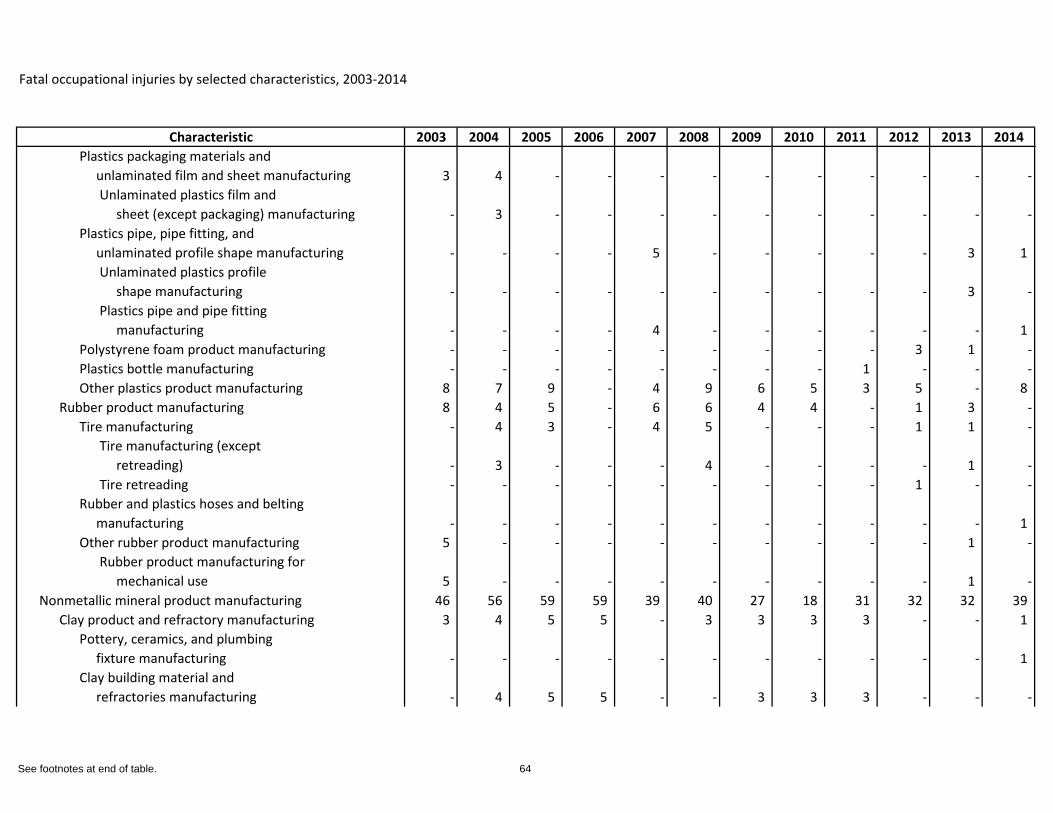
Fatal occupational injuries by selected characteristics, 2003-2014
Characteristic 2003 2004 2005 2006 2007 2008 2009 2010 2011 2012 2013 2014Plastics packaging materials and unlaminated film and sheet manufacturing 3 4 - - - - - - - - - -
Unlaminated plastics film and sheet (except packaging) manufacturing - 3 - - - - - - - - - -
Plastics pipe, pipe fitting, and unlaminated profile shape manufacturing - - - - 5 - - - - - 3 1
Unlaminated plastics profile shape manufacturing - - - - - - - - - - 3 -Plastics pipe and pipe fitting manufacturing - - - - 4 - - - - - - 1
Polystyrene foam product manufacturing - - - - - - - - - 3 1 -Plastics bottle manufacturing - - - - - - - - 1 - - -Other plastics product manufacturing 8 7 9 - 4 9 6 5 3 5 - 8
Rubber product manufacturing 8 4 5 - 6 6 4 4 - 1 3 -Tire manufacturing - 4 3 - 4 5 - - - 1 1 -
Tire manufacturing (except retreading) - 3 - - - 4 - - - - 1 -Tire retreading - - - - - - - - - 1 - -
Rubber and plastics hoses and belting manufacturing - - - - - - - - - - - 1 Other rubber product manufacturing 5 - - - - - - - - - 1 -
Rubber product manufacturing for mechanical use 5 - - - - - - - - - 1 -
Nonmetallic mineral product manufacturing 46 56 59 59 39 40 27 18 31 32 32 39 Clay product and refractory manufacturing 3 4 5 5 - 3 3 3 3 - - 1
Pottery, ceramics, and plumbing fixture manufacturing - - - - - - - - - - - 1 Clay building material and refractories manufacturing - 4 5 5 - - 3 3 3 - - -
See footnotes at end of table. 64
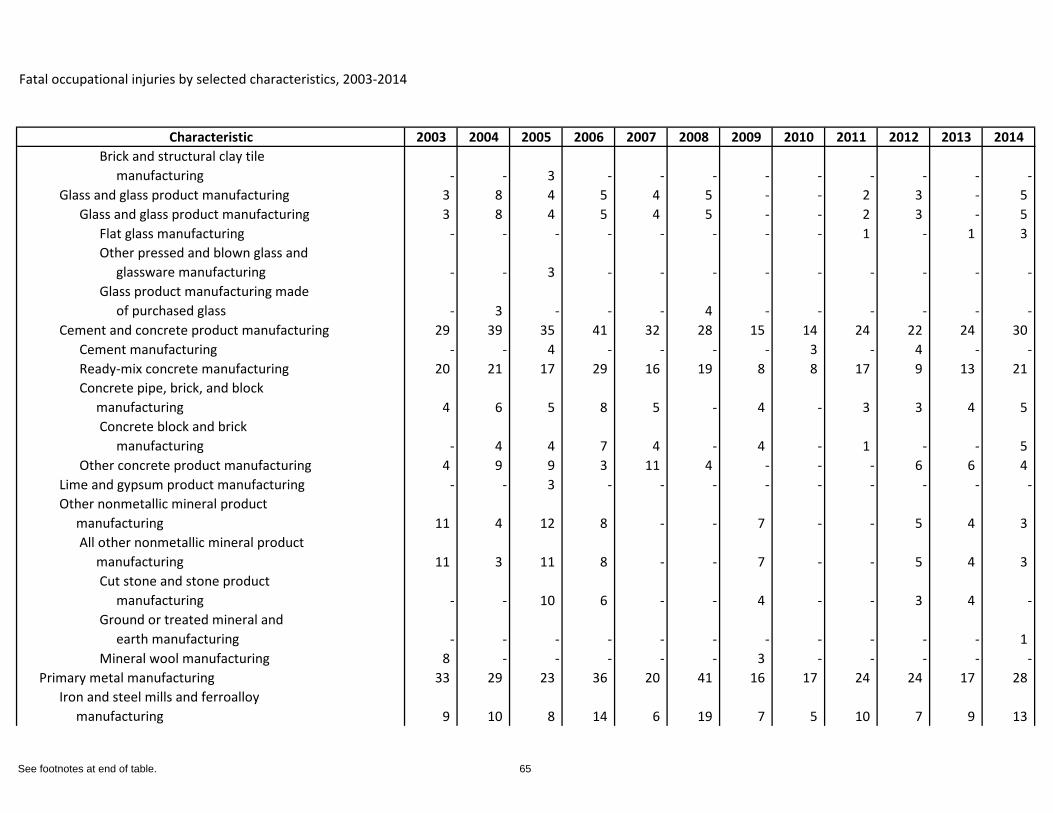
Fatal occupational injuries by selected characteristics, 2003-2014
Characteristic 2003 2004 2005 2006 2007 2008 2009 2010 2011 2012 2013 2014Brick and structural clay tile manufacturing - - 3 - - - - - - - - -
Glass and glass product manufacturing 3 8 4 5 4 5 - - 2 3 - 5 Glass and glass product manufacturing 3 8 4 5 4 5 - - 2 3 - 5
Flat glass manufacturing - - - - - - - - 1 - 1 3 Other pressed and blown glass and glassware manufacturing - - 3 - - - - - - - - -Glass product manufacturing made of purchased glass - 3 - - - 4 - - - - - -
Cement and concrete product manufacturing 29 39 35 41 32 28 15 14 24 22 24 30 Cement manufacturing - - 4 - - - - 3 - 4 - -Ready-mix concrete manufacturing 20 21 17 29 16 19 8 8 17 9 13 21 Concrete pipe, brick, and block manufacturing 4 6 5 8 5 - 4 - 3 3 4 5
Concrete block and brick manufacturing - 4 4 7 4 - 4 - 1 - - 5
Other concrete product manufacturing 4 9 9 3 11 4 - - - 6 6 4 Lime and gypsum product manufacturing - - 3 - - - - - - - - -Other nonmetallic mineral product manufacturing 11 4 12 8 - - 7 - - 5 4 3
All other nonmetallic mineral product manufacturing 11 3 11 8 - - 7 - - 5 4 3
Cut stone and stone product manufacturing - - 10 6 - - 4 - - 3 4 -Ground or treated mineral and earth manufacturing - - - - - - - - - - - 1 Mineral wool manufacturing 8 - - - - - 3 - - - - -
Primary metal manufacturing 33 29 23 36 20 41 16 17 24 24 17 28 Iron and steel mills and ferroalloy manufacturing 9 10 8 14 6 19 7 5 10 7 9 13
See footnotes at end of table. 65
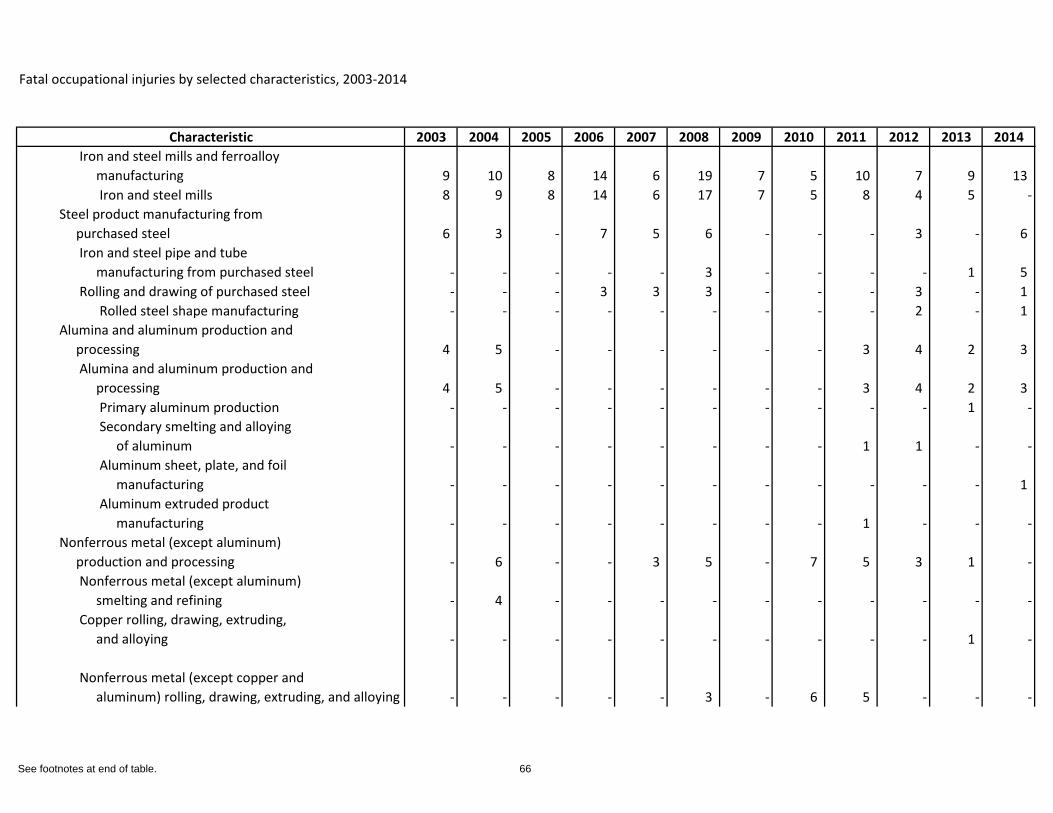
Fatal occupational injuries by selected characteristics, 2003-2014
Characteristic 2003 2004 2005 2006 2007 2008 2009 2010 2011 2012 2013 2014Iron and steel mills and ferroalloy manufacturing 9 10 8 14 6 19 7 5 10 7 9 13
Iron and steel mills 8 9 8 14 6 17 7 5 8 4 5 -Steel product manufacturing from purchased steel 6 3 - 7 5 6 - - - 3 - 6
Iron and steel pipe and tube manufacturing from purchased steel - - - - - 3 - - - - 1 5 Rolling and drawing of purchased steel - - - 3 3 3 - - - 3 - 1
Rolled steel shape manufacturing - - - - - - - - - 2 - 1 Alumina and aluminum production and processing 4 5 - - - - - - 3 4 2 3
Alumina and aluminum production and processing 4 5 - - - - - - 3 4 2 3
Primary aluminum production - - - - - - - - - - 1 -Secondary smelting and alloying of aluminum - - - - - - - - 1 1 - -Aluminum sheet, plate, and foil manufacturing - - - - - - - - - - - 1 Aluminum extruded product manufacturing - - - - - - - - 1 - - -
Nonferrous metal (except aluminum) production and processing - 6 - - 3 5 - 7 5 3 1 -
Nonferrous metal (except aluminum) smelting and refining - 4 - - - - - - - - - -Copper rolling, drawing, extruding, and alloying - - - - - - - - - - 1 -
Nonferrous metal (except copper and aluminum) rolling, drawing, extruding, and alloying - - - - - 3 - 6 5 - - -
See footnotes at end of table. 66
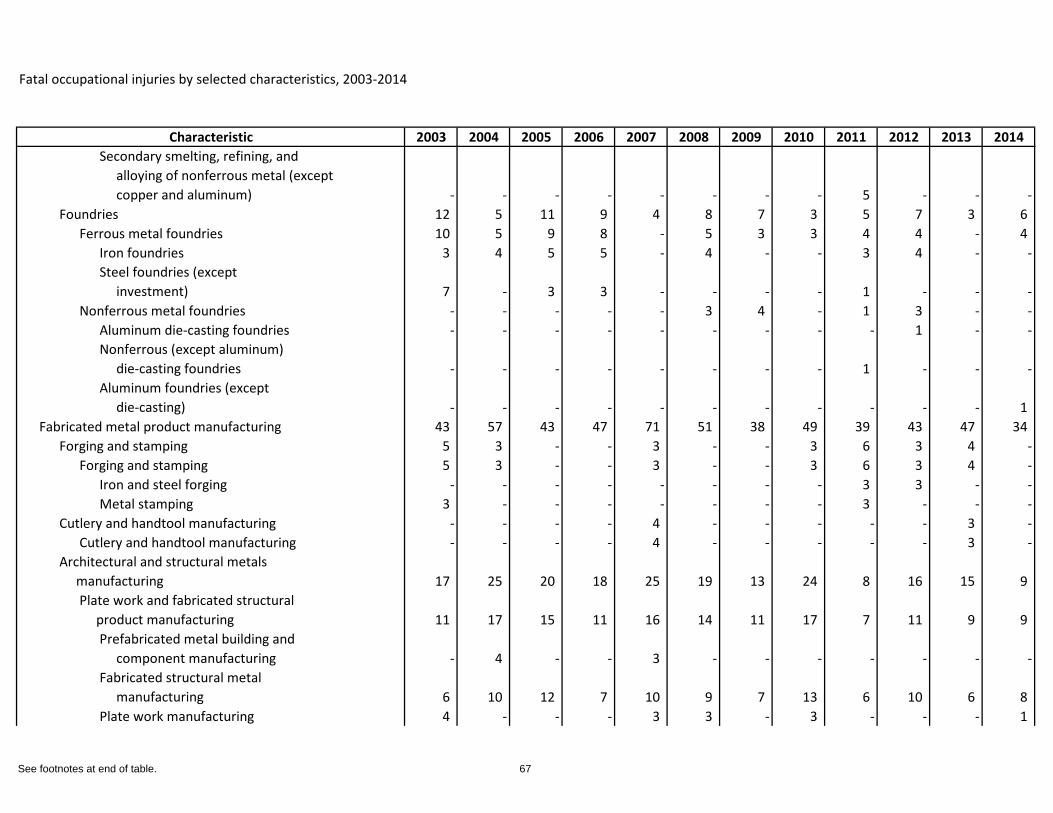
Fatal occupational injuries by selected characteristics, 2003-2014
Characteristic 2003 2004 2005 2006 2007 2008 2009 2010 2011 2012 2013 2014Secondary smelting, refining, and alloying of nonferrous metal (except copper and aluminum) - - - - - - - - 5 - - -
Foundries 12 5 11 9 4 8 7 3 5 7 3 6 Ferrous metal foundries 10 5 9 8 - 5 3 3 4 4 - 4
Iron foundries 3 4 5 5 - 4 - - 3 4 - -Steel foundries (except investment) 7 - 3 3 - - - - 1 - - -
Nonferrous metal foundries - - - - - 3 4 - 1 3 - -Aluminum die-casting foundries - - - - - - - - - 1 - -Nonferrous (except aluminum) die-casting foundries - - - - - - - - 1 - - -Aluminum foundries (except die-casting) - - - - - - - - - - - 1
Fabricated metal product manufacturing 43 57 43 47 71 51 38 49 39 43 47 34 Forging and stamping 5 3 - - 3 - - 3 6 3 4 -
Forging and stamping 5 3 - - 3 - - 3 6 3 4 -Iron and steel forging - - - - - - - - 3 3 - -Metal stamping 3 - - - - - - - 3 - - -
Cutlery and handtool manufacturing - - - - 4 - - - - - 3 -Cutlery and handtool manufacturing - - - - 4 - - - - - 3 -
Architectural and structural metals manufacturing 17 25 20 18 25 19 13 24 8 16 15 9
Plate work and fabricated structural product manufacturing 11 17 15 11 16 14 11 17 7 11 9 9
Prefabricated metal building and component manufacturing - 4 - - 3 - - - - - - -Fabricated structural metal manufacturing 6 10 12 7 10 9 7 13 6 10 6 8 Plate work manufacturing 4 - - - 3 3 - 3 - - - 1
See footnotes at end of table. 67
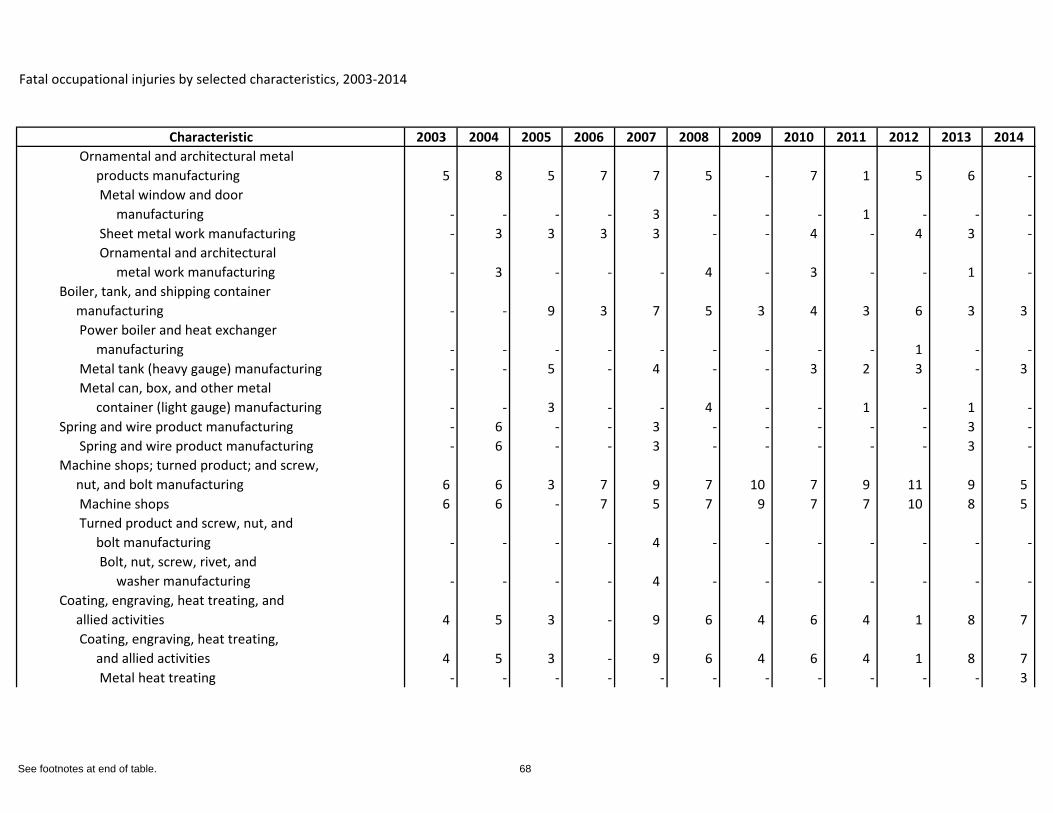
Fatal occupational injuries by selected characteristics, 2003-2014
Characteristic 2003 2004 2005 2006 2007 2008 2009 2010 2011 2012 2013 2014Ornamental and architectural metal products manufacturing 5 8 5 7 7 5 - 7 1 5 6 -
Metal window and door manufacturing - - - - 3 - - - 1 - - -Sheet metal work manufacturing - 3 3 3 3 - - 4 - 4 3 -Ornamental and architectural metal work manufacturing - 3 - - - 4 - 3 - - 1 -
Boiler, tank, and shipping container manufacturing - - 9 3 7 5 3 4 3 6 3 3
Power boiler and heat exchanger manufacturing - - - - - - - - - 1 - -Metal tank (heavy gauge) manufacturing - - 5 - 4 - - 3 2 3 - 3 Metal can, box, and other metal container (light gauge) manufacturing - - 3 - - 4 - - 1 - 1 -
Spring and wire product manufacturing - 6 - - 3 - - - - - 3 -Spring and wire product manufacturing - 6 - - 3 - - - - - 3 -
Machine shops; turned product; and screw, nut, and bolt manufacturing 6 6 3 7 9 7 10 7 9 11 9 5
Machine shops 6 6 - 7 5 7 9 7 7 10 8 5 Turned product and screw, nut, and bolt manufacturing - - - - 4 - - - - - - -
Bolt, nut, screw, rivet, and washer manufacturing - - - - 4 - - - - - - -
Coating, engraving, heat treating, and allied activities 4 5 3 - 9 6 4 6 4 1 8 7
Coating, engraving, heat treating, and allied activities 4 5 3 - 9 6 4 6 4 1 8 7
Metal heat treating - - - - - - - - - - - 3
See footnotes at end of table. 68
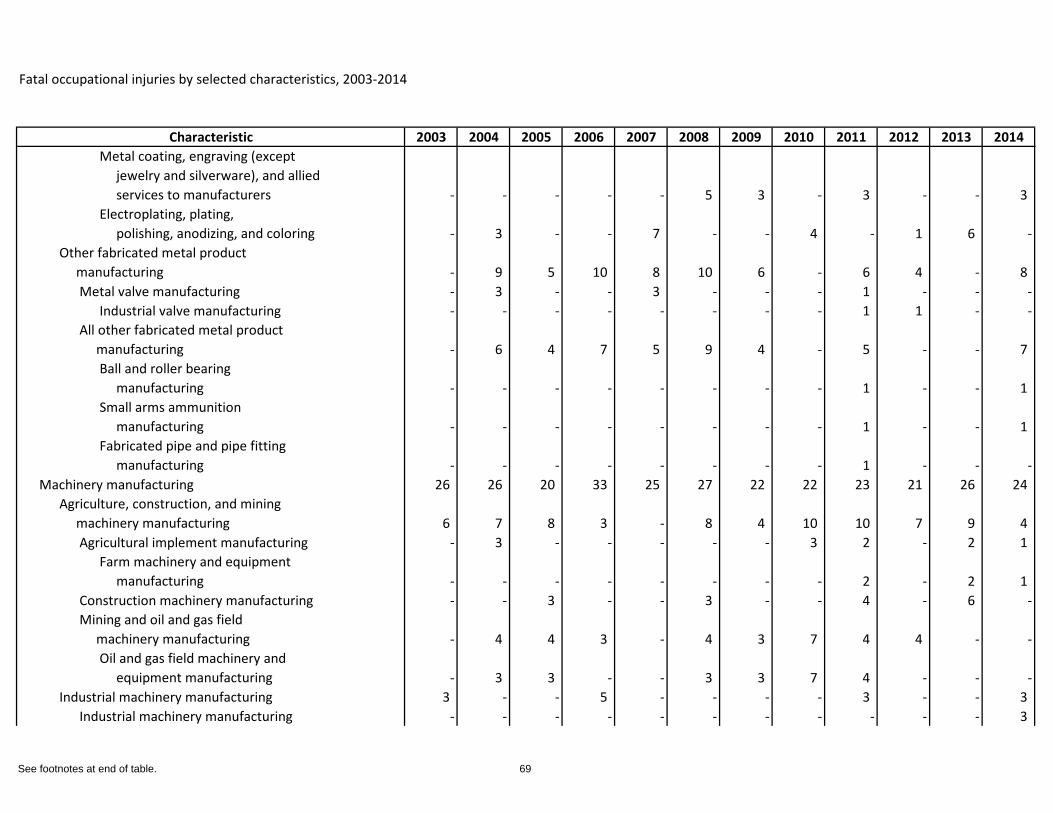
Fatal occupational injuries by selected characteristics, 2003-2014
Characteristic 2003 2004 2005 2006 2007 2008 2009 2010 2011 2012 2013 2014Metal coating, engraving (except jewelry and silverware), and allied services to manufacturers - - - - - 5 3 - 3 - - 3 Electroplating, plating, polishing, anodizing, and coloring - 3 - - 7 - - 4 - 1 6 -
Other fabricated metal product manufacturing - 9 5 10 8 10 6 - 6 4 - 8
Metal valve manufacturing - 3 - - 3 - - - 1 - - -Industrial valve manufacturing - - - - - - - - 1 1 - -
All other fabricated metal product manufacturing - 6 4 7 5 9 4 - 5 - - 7
Ball and roller bearing manufacturing - - - - - - - - 1 - - 1 Small arms ammunition manufacturing - - - - - - - - 1 - - 1 Fabricated pipe and pipe fitting manufacturing - - - - - - - - 1 - - -
Machinery manufacturing 26 26 20 33 25 27 22 22 23 21 26 24 Agriculture, construction, and mining machinery manufacturing 6 7 8 3 - 8 4 10 10 7 9 4
Agricultural implement manufacturing - 3 - - - - - 3 2 - 2 1 Farm machinery and equipment manufacturing - - - - - - - - 2 - 2 1
Construction machinery manufacturing - - 3 - - 3 - - 4 - 6 -Mining and oil and gas field machinery manufacturing - 4 4 3 - 4 3 7 4 4 - -
Oil and gas field machinery and equipment manufacturing - 3 3 - - 3 3 7 4 - - -
Industrial machinery manufacturing 3 - - 5 - - - - 3 - - 3 Industrial machinery manufacturing - - - - - - - - - - - 3
See footnotes at end of table. 69
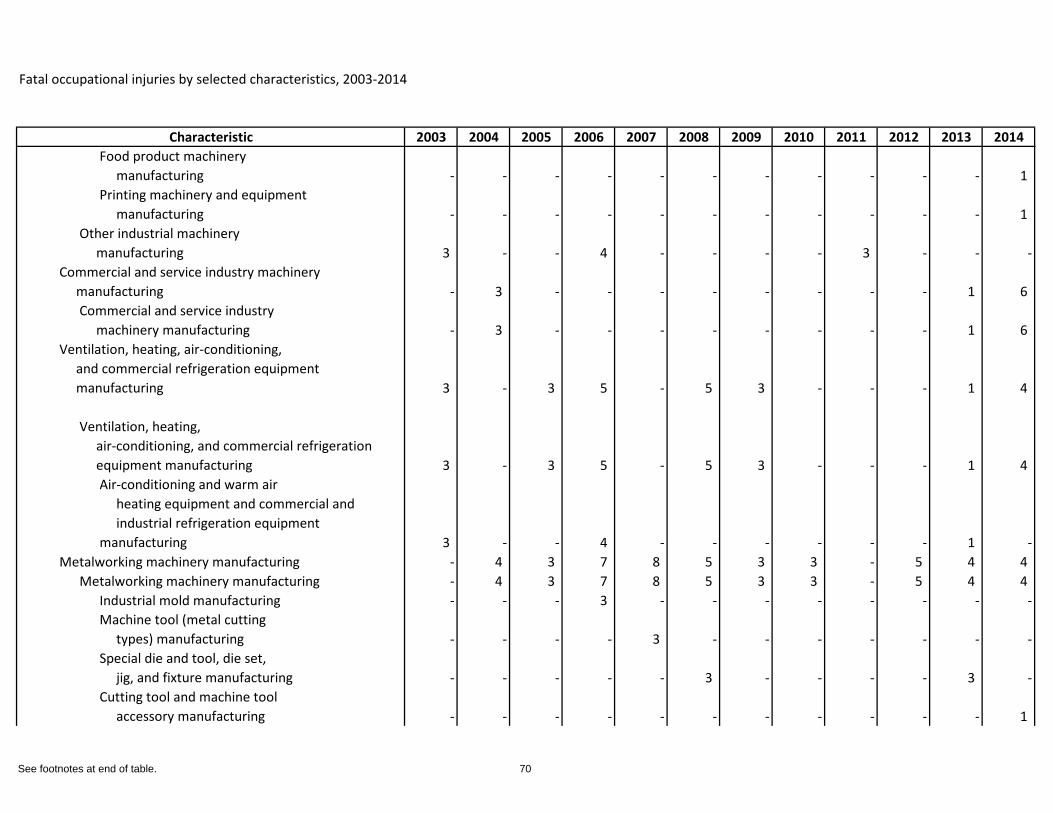
Fatal occupational injuries by selected characteristics, 2003-2014
Characteristic 2003 2004 2005 2006 2007 2008 2009 2010 2011 2012 2013 2014Food product machinery manufacturing - - - - - - - - - - - 1 Printing machinery and equipment manufacturing - - - - - - - - - - - 1
Other industrial machinery manufacturing 3 - - 4 - - - - 3 - - -
Commercial and service industry machinery manufacturing - 3 - - - - - - - - 1 6
Commercial and service industry machinery manufacturing - 3 - - - - - - - - 1 6
Ventilation, heating, air-conditioning, and commercial refrigeration equipment manufacturing 3 - 3 5 - 5 3 - - - 1 4
Ventilation, heating, air-conditioning, and commercial refrigeration equipment manufacturing 3 - 3 5 - 5 3 - - - 1 4
Air-conditioning and warm air heating equipment and commercial and industrial refrigeration equipment manufacturing 3 - - 4 - - - - - - 1 -
Metalworking machinery manufacturing - 4 3 7 8 5 3 3 - 5 4 4 Metalworking machinery manufacturing - 4 3 7 8 5 3 3 - 5 4 4
Industrial mold manufacturing - - - 3 - - - - - - - -Machine tool (metal cutting types) manufacturing - - - - 3 - - - - - - -Special die and tool, die set, jig, and fixture manufacturing - - - - - 3 - - - - 3 -Cutting tool and machine tool accessory manufacturing - - - - - - - - - - - 1
See footnotes at end of table. 70
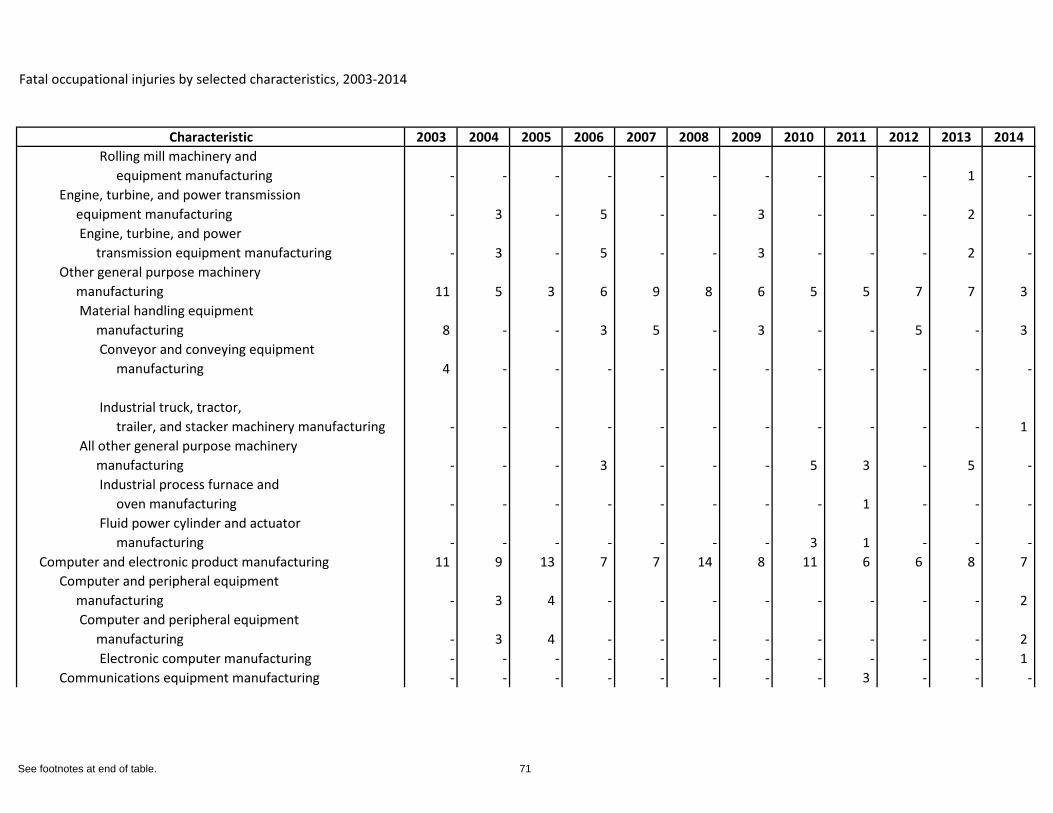
Fatal occupational injuries by selected characteristics, 2003-2014
Characteristic 2003 2004 2005 2006 2007 2008 2009 2010 2011 2012 2013 2014Rolling mill machinery and equipment manufacturing - - - - - - - - - - 1 -
Engine, turbine, and power transmission equipment manufacturing - 3 - 5 - - 3 - - - 2 -
Engine, turbine, and power transmission equipment manufacturing - 3 - 5 - - 3 - - - 2 -
Other general purpose machinery manufacturing 11 5 3 6 9 8 6 5 5 7 7 3
Material handling equipment manufacturing 8 - - 3 5 - 3 - - 5 - 3
Conveyor and conveying equipment manufacturing 4 - - - - - - - - - - -
Industrial truck, tractor, trailer, and stacker machinery manufacturing - - - - - - - - - - - 1
All other general purpose machinery manufacturing - - - 3 - - - 5 3 - 5 -
Industrial process furnace and oven manufacturing - - - - - - - - 1 - - -Fluid power cylinder and actuator manufacturing - - - - - - - 3 1 - - -
Computer and electronic product manufacturing 11 9 13 7 7 14 8 11 6 6 8 7 Computer and peripheral equipment manufacturing - 3 4 - - - - - - - - 2
Computer and peripheral equipment manufacturing - 3 4 - - - - - - - - 2
Electronic computer manufacturing - - - - - - - - - - - 1 Communications equipment manufacturing - - - - - - - - 3 - - -
See footnotes at end of table. 71
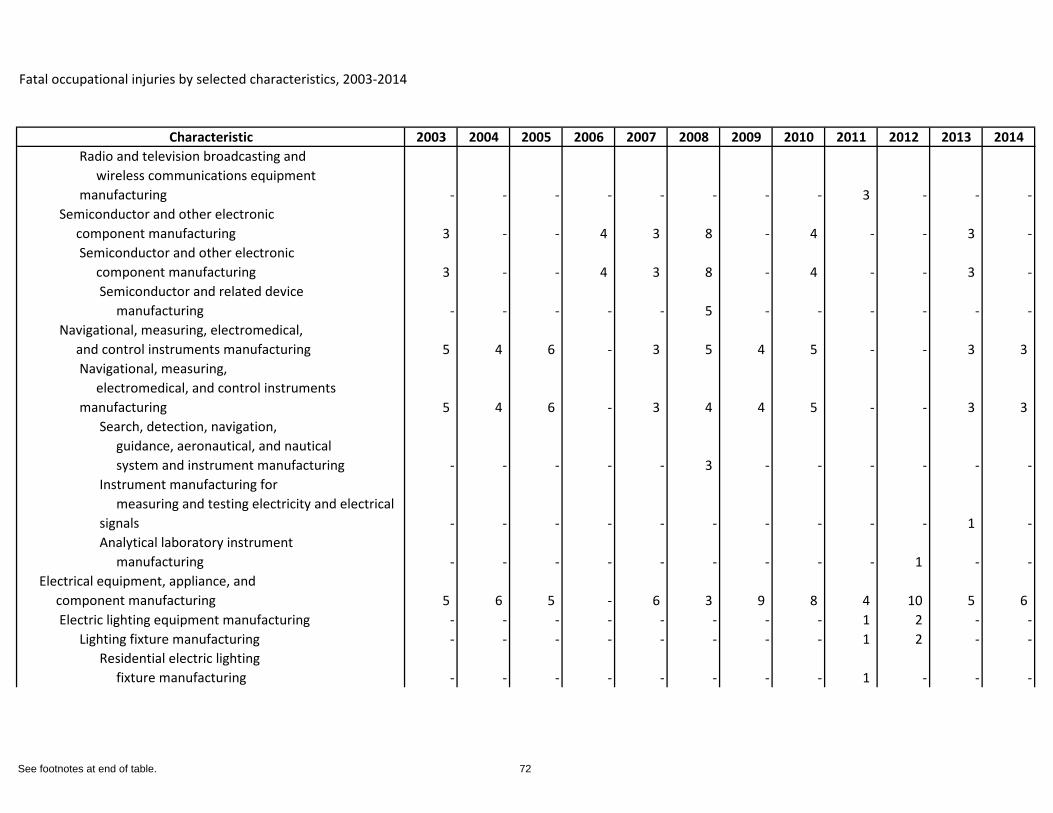
Fatal occupational injuries by selected characteristics, 2003-2014
Characteristic 2003 2004 2005 2006 2007 2008 2009 2010 2011 2012 2013 2014Radio and television broadcasting and wireless communications equipment manufacturing - - - - - - - - 3 - - -
Semiconductor and other electronic component manufacturing 3 - - 4 3 8 - 4 - - 3 -
Semiconductor and other electronic component manufacturing 3 - - 4 3 8 - 4 - - 3 -
Semiconductor and related device manufacturing - - - - - 5 - - - - - -
Navigational, measuring, electromedical, and control instruments manufacturing 5 4 6 - 3 5 4 5 - - 3 3
Navigational, measuring, electromedical, and control instruments manufacturing 5 4 6 - 3 4 4 5 - - 3 3
Search, detection, navigation, guidance, aeronautical, and nautical system and instrument manufacturing - - - - - 3 - - - - - -Instrument manufacturing for measuring and testing electricity and electrical signals - - - - - - - - - - 1 -Analytical laboratory instrument manufacturing - - - - - - - - - 1 - -
Electrical equipment, appliance, and component manufacturing 5 6 5 - 6 3 9 8 4 10 5 6
Electric lighting equipment manufacturing - - - - - - - - 1 2 - -Lighting fixture manufacturing - - - - - - - - 1 2 - -
Residential electric lighting fixture manufacturing - - - - - - - - 1 - - -
See footnotes at end of table. 72
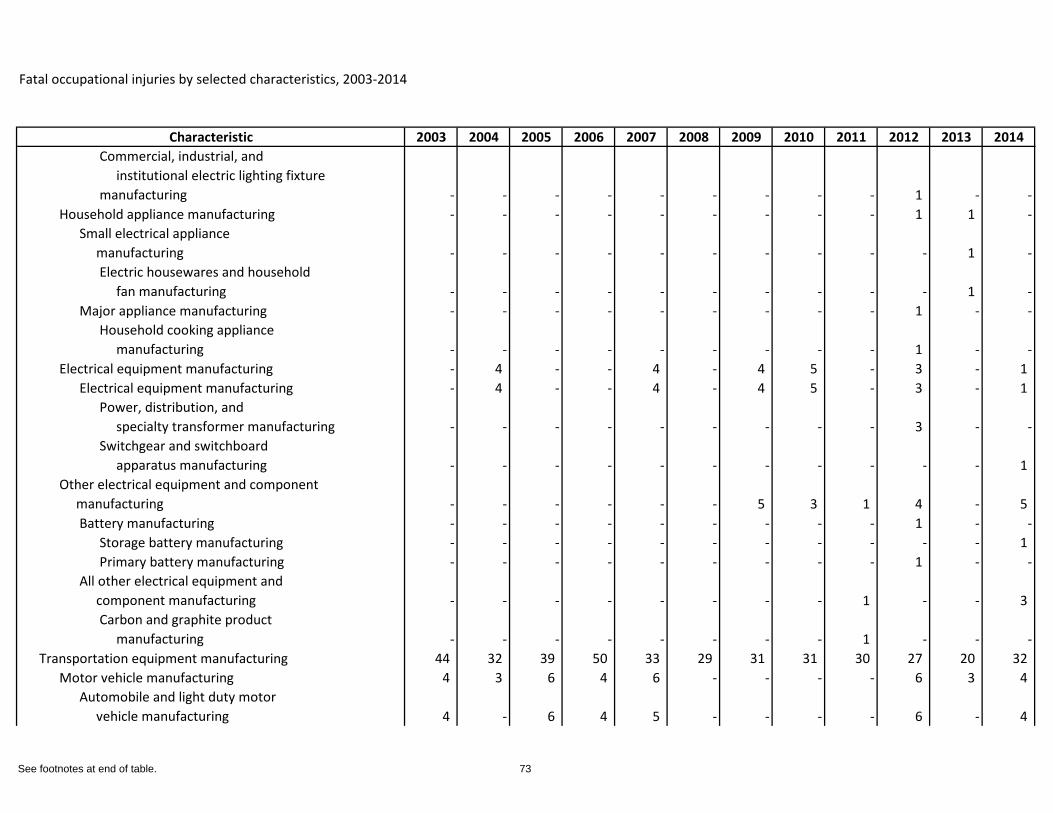
Fatal occupational injuries by selected characteristics, 2003-2014
Characteristic 2003 2004 2005 2006 2007 2008 2009 2010 2011 2012 2013 2014Commercial, industrial, and institutional electric lighting fixture manufacturing - - - - - - - - - 1 - -
Household appliance manufacturing - - - - - - - - - 1 1 -Small electrical appliance manufacturing - - - - - - - - - - 1 -
Electric housewares and household fan manufacturing - - - - - - - - - - 1 -
Major appliance manufacturing - - - - - - - - - 1 - -Household cooking appliance manufacturing - - - - - - - - - 1 - -
Electrical equipment manufacturing - 4 - - 4 - 4 5 - 3 - 1 Electrical equipment manufacturing - 4 - - 4 - 4 5 - 3 - 1
Power, distribution, and specialty transformer manufacturing - - - - - - - - - 3 - -Switchgear and switchboard apparatus manufacturing - - - - - - - - - - - 1
Other electrical equipment and component manufacturing - - - - - - 5 3 1 4 - 5
Battery manufacturing - - - - - - - - - 1 - -Storage battery manufacturing - - - - - - - - - - - 1 Primary battery manufacturing - - - - - - - - - 1 - -
All other electrical equipment and component manufacturing - - - - - - - - 1 - - 3
Carbon and graphite product manufacturing - - - - - - - - 1 - - -
Transportation equipment manufacturing 44 32 39 50 33 29 31 31 30 27 20 32 Motor vehicle manufacturing 4 3 6 4 6 - - - - 6 3 4
Automobile and light duty motor vehicle manufacturing 4 - 6 4 5 - - - - 6 - 4
See footnotes at end of table. 73
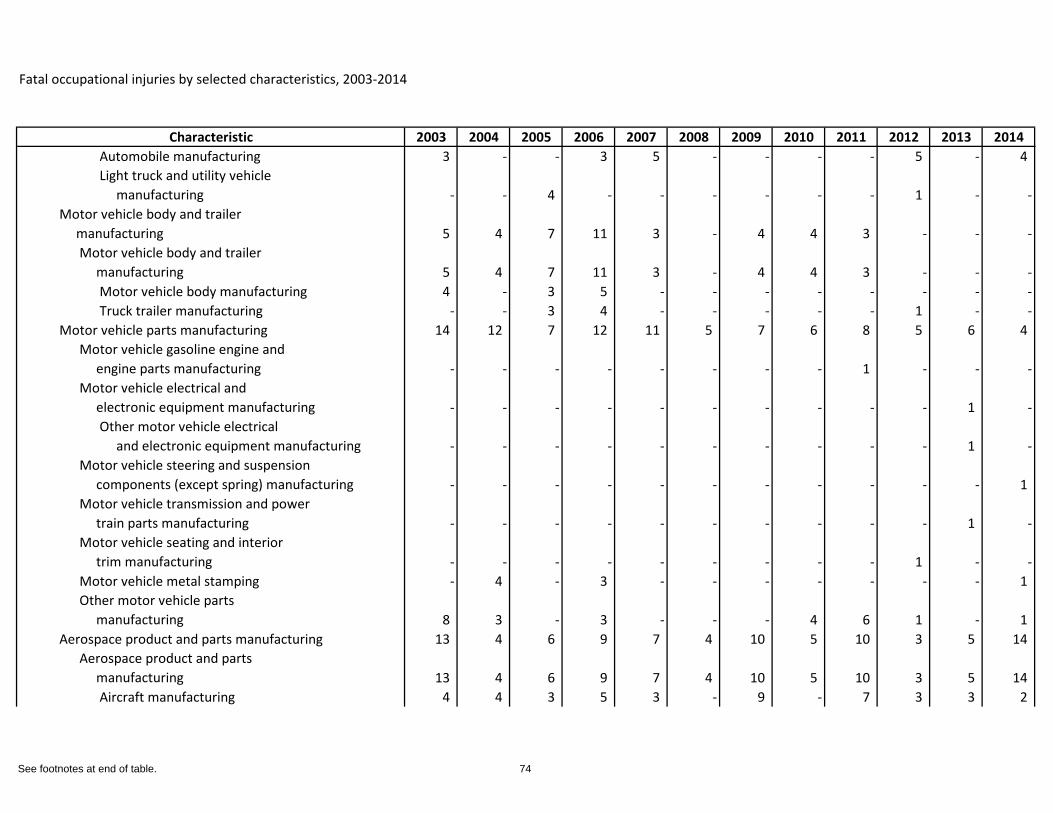
Fatal occupational injuries by selected characteristics, 2003-2014
Characteristic 2003 2004 2005 2006 2007 2008 2009 2010 2011 2012 2013 2014Automobile manufacturing 3 - - 3 5 - - - - 5 - 4 Light truck and utility vehicle manufacturing - - 4 - - - - - - 1 - -
Motor vehicle body and trailer manufacturing 5 4 7 11 3 - 4 4 3 - - -
Motor vehicle body and trailer manufacturing 5 4 7 11 3 - 4 4 3 - - -
Motor vehicle body manufacturing 4 - 3 5 - - - - - - - -Truck trailer manufacturing - - 3 4 - - - - - 1 - -
Motor vehicle parts manufacturing 14 12 7 12 11 5 7 6 8 5 6 4 Motor vehicle gasoline engine and engine parts manufacturing - - - - - - - - 1 - - -Motor vehicle electrical and electronic equipment manufacturing - - - - - - - - - - 1 -
Other motor vehicle electrical and electronic equipment manufacturing - - - - - - - - - - 1 -
Motor vehicle steering and suspension components (except spring) manufacturing - - - - - - - - - - - 1 Motor vehicle transmission and power train parts manufacturing - - - - - - - - - - 1 -Motor vehicle seating and interior trim manufacturing - - - - - - - - - 1 - -Motor vehicle metal stamping - 4 - 3 - - - - - - - 1 Other motor vehicle parts manufacturing 8 3 - 3 - - - 4 6 1 - 1
Aerospace product and parts manufacturing 13 4 6 9 7 4 10 5 10 3 5 14 Aerospace product and parts manufacturing 13 4 6 9 7 4 10 5 10 3 5 14
Aircraft manufacturing 4 4 3 5 3 - 9 - 7 3 3 2
See footnotes at end of table. 74
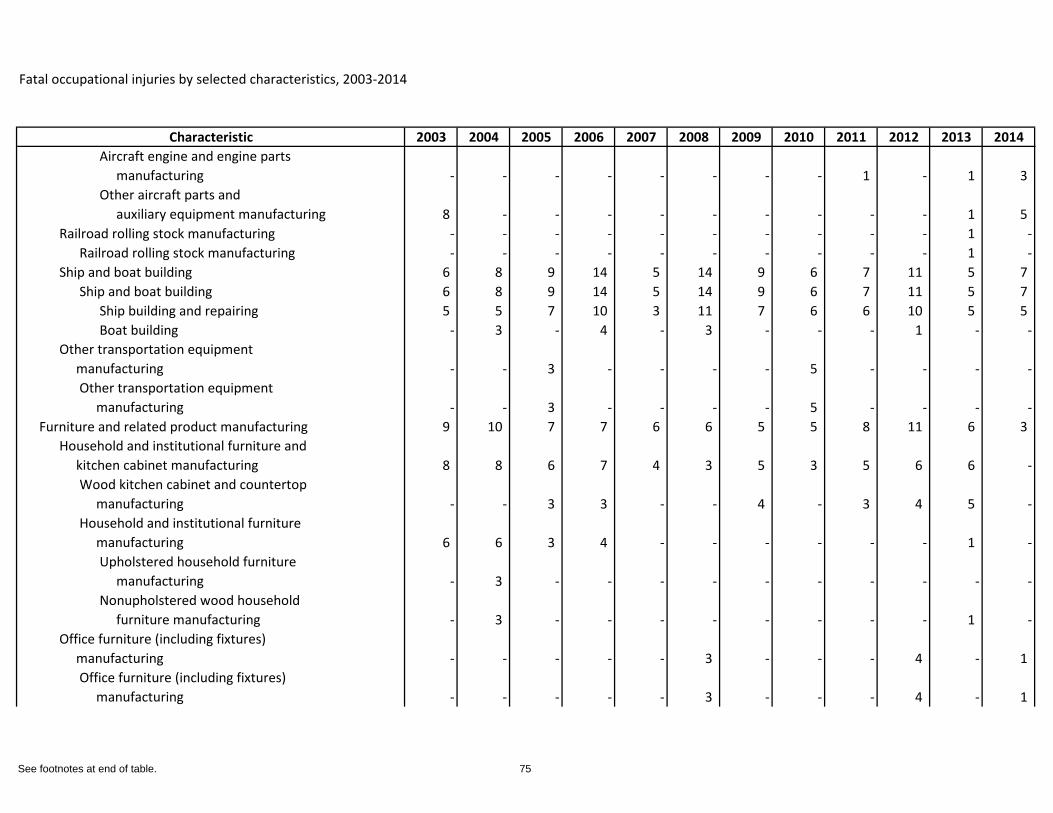
Fatal occupational injuries by selected characteristics, 2003-2014
Characteristic 2003 2004 2005 2006 2007 2008 2009 2010 2011 2012 2013 2014Aircraft engine and engine parts manufacturing - - - - - - - - 1 - 1 3 Other aircraft parts and auxiliary equipment manufacturing 8 - - - - - - - - - 1 5
Railroad rolling stock manufacturing - - - - - - - - - - 1 -Railroad rolling stock manufacturing - - - - - - - - - - 1 -
Ship and boat building 6 8 9 14 5 14 9 6 7 11 5 7 Ship and boat building 6 8 9 14 5 14 9 6 7 11 5 7
Ship building and repairing 5 5 7 10 3 11 7 6 6 10 5 5 Boat building - 3 - 4 - 3 - - - 1 - -
Other transportation equipment manufacturing - - 3 - - - - 5 - - - -
Other transportation equipment manufacturing - - 3 - - - - 5 - - - -
Furniture and related product manufacturing 9 10 7 7 6 6 5 5 8 11 6 3 Household and institutional furniture and kitchen cabinet manufacturing 8 8 6 7 4 3 5 3 5 6 6 -
Wood kitchen cabinet and countertop manufacturing - - 3 3 - - 4 - 3 4 5 -Household and institutional furniture manufacturing 6 6 3 4 - - - - - - 1 -
Upholstered household furniture manufacturing - 3 - - - - - - - - - -Nonupholstered wood household furniture manufacturing - 3 - - - - - - - - 1 -
Office furniture (including fixtures) manufacturing - - - - - 3 - - - 4 - 1
Office furniture (including fixtures) manufacturing - - - - - 3 - - - 4 - 1
See footnotes at end of table. 75
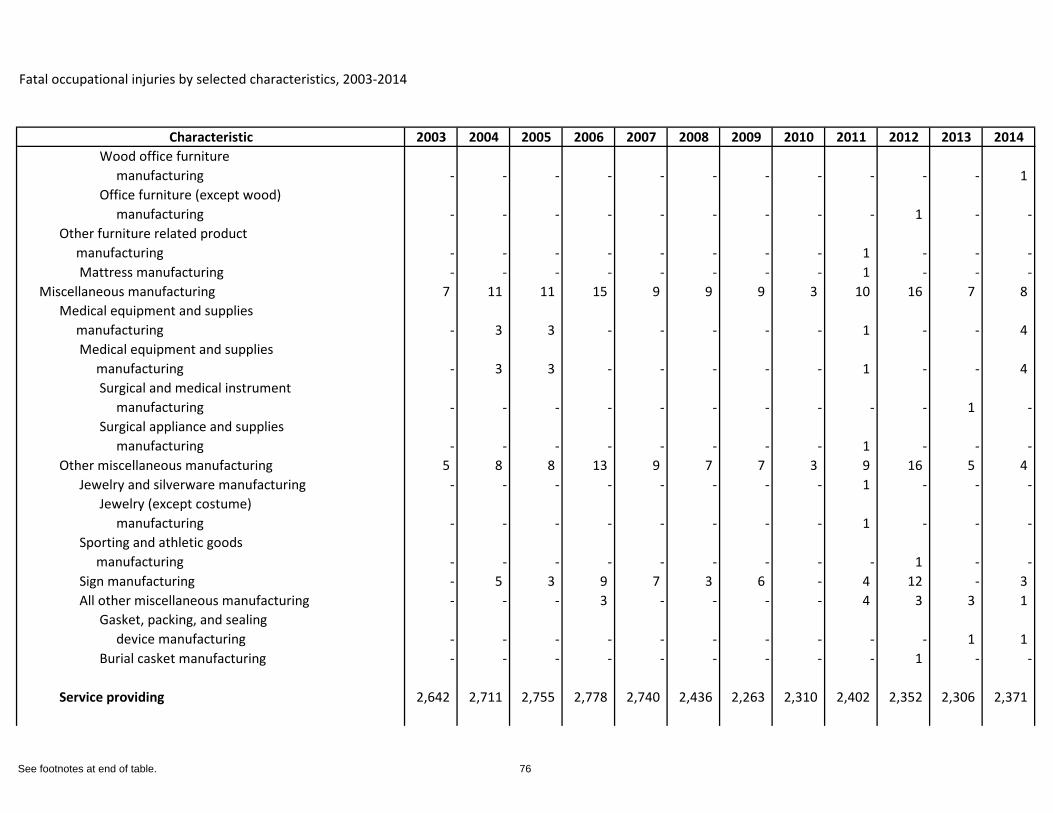
Fatal occupational injuries by selected characteristics, 2003-2014
Characteristic 2003 2004 2005 2006 2007 2008 2009 2010 2011 2012 2013 2014Wood office furniture manufacturing - - - - - - - - - - - 1 Office furniture (except wood) manufacturing - - - - - - - - - 1 - -
Other furniture related product manufacturing - - - - - - - - 1 - - -
Mattress manufacturing - - - - - - - - 1 - - -Miscellaneous manufacturing 7 11 11 15 9 9 9 3 10 16 7 8
Medical equipment and supplies manufacturing - 3 3 - - - - - 1 - - 4
Medical equipment and supplies manufacturing - 3 3 - - - - - 1 - - 4
Surgical and medical instrument manufacturing - - - - - - - - - - 1 -Surgical appliance and supplies manufacturing - - - - - - - - 1 - - -
Other miscellaneous manufacturing 5 8 8 13 9 7 7 3 9 16 5 4 Jewelry and silverware manufacturing - - - - - - - - 1 - - -
Jewelry (except costume) manufacturing - - - - - - - - 1 - - -
Sporting and athletic goods manufacturing - - - - - - - - - 1 - -Sign manufacturing - 5 3 9 7 3 6 - 4 12 - 3 All other miscellaneous manufacturing - - - 3 - - - - 4 3 3 1
Gasket, packing, and sealing device manufacturing - - - - - - - - - - 1 1 Burial casket manufacturing - - - - - - - - - 1 - -
Service providing 2,642 2,711 2,755 2,778 2,740 2,436 2,263 2,310 2,402 2,352 2,306 2,371
See footnotes at end of table. 76
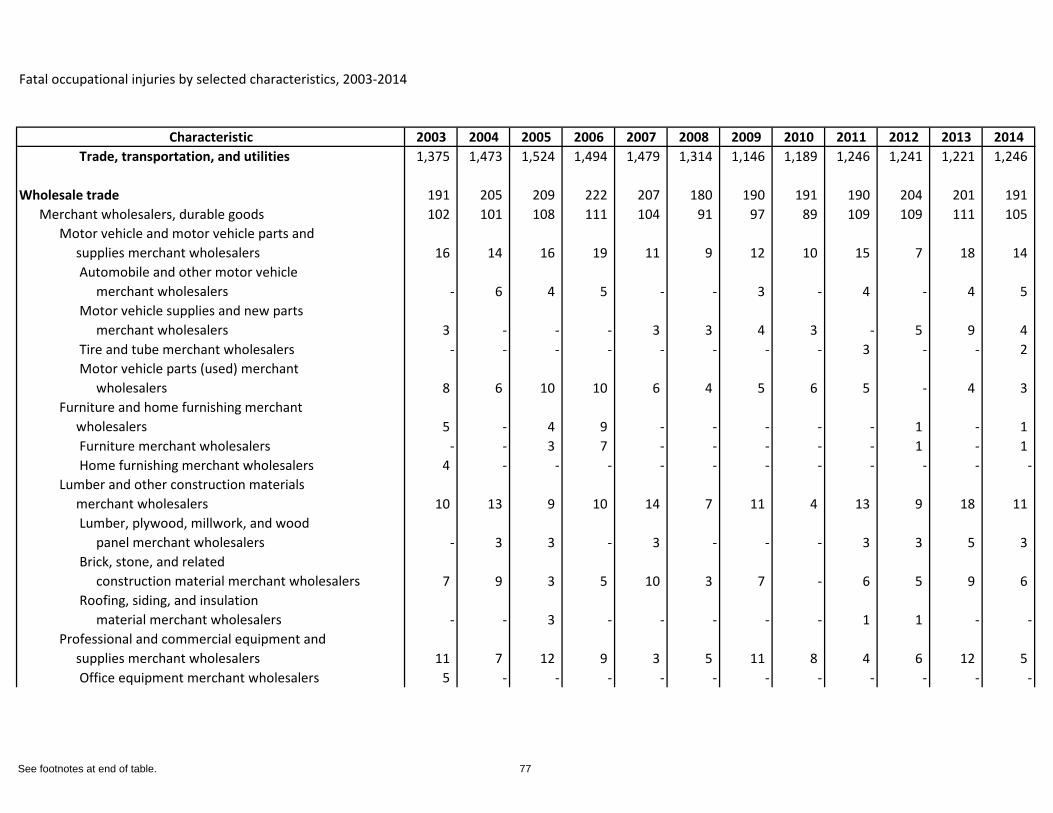
Fatal occupational injuries by selected characteristics, 2003-2014
Characteristic 2003 2004 2005 2006 2007 2008 2009 2010 2011 2012 2013 2014Trade, transportation, and utilities 1,375 1,473 1,524 1,494 1,479 1,314 1,146 1,189 1,246 1,241 1,221 1,246
Wholesale trade 191 205 209 222 207 180 190 191 190 204 201 191 Merchant wholesalers, durable goods 102 101 108 111 104 91 97 89 109 109 111 105
Motor vehicle and motor vehicle parts and supplies merchant wholesalers 16 14 16 19 11 9 12 10 15 7 18 14
Automobile and other motor vehicle merchant wholesalers - 6 4 5 - - 3 - 4 - 4 5 Motor vehicle supplies and new parts merchant wholesalers 3 - - - 3 3 4 3 - 5 9 4 Tire and tube merchant wholesalers - - - - - - - - 3 - - 2 Motor vehicle parts (used) merchant wholesalers 8 6 10 10 6 4 5 6 5 - 4 3
Furniture and home furnishing merchant wholesalers 5 - 4 9 - - - - - 1 - 1
Furniture merchant wholesalers - - 3 7 - - - - - 1 - 1 Home furnishing merchant wholesalers 4 - - - - - - - - - - -
Lumber and other construction materials merchant wholesalers 10 13 9 10 14 7 11 4 13 9 18 11
Lumber, plywood, millwork, and wood panel merchant wholesalers - 3 3 - 3 - - - 3 3 5 3 Brick, stone, and related construction material merchant wholesalers 7 9 3 5 10 3 7 - 6 5 9 6 Roofing, siding, and insulation material merchant wholesalers - - 3 - - - - - 1 1 - -
Professional and commercial equipment and supplies merchant wholesalers 11 7 12 9 3 5 11 8 4 6 12 5
Office equipment merchant wholesalers 5 - - - - - - - - - - -
See footnotes at end of table. 77
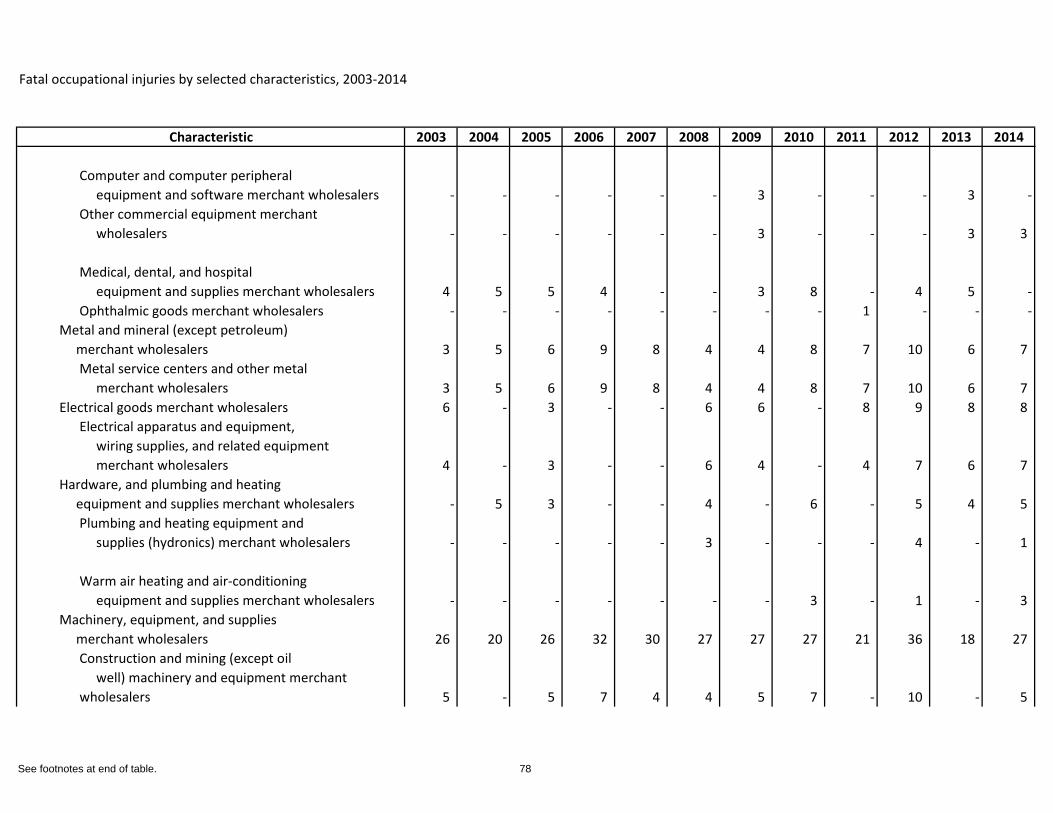
Fatal occupational injuries by selected characteristics, 2003-2014
Characteristic 2003 2004 2005 2006 2007 2008 2009 2010 2011 2012 2013 2014
Computer and computer peripheral equipment and software merchant wholesalers - - - - - - 3 - - - 3 -Other commercial equipment merchant wholesalers - - - - - - 3 - - - 3 3
Medical, dental, and hospital equipment and supplies merchant wholesalers 4 5 5 4 - - 3 8 - 4 5 -Ophthalmic goods merchant wholesalers - - - - - - - - 1 - - -
Metal and mineral (except petroleum) merchant wholesalers 3 5 6 9 8 4 4 8 7 10 6 7
Metal service centers and other metal merchant wholesalers 3 5 6 9 8 4 4 8 7 10 6 7
Electrical goods merchant wholesalers 6 - 3 - - 6 6 - 8 9 8 8 Electrical apparatus and equipment, wiring supplies, and related equipment merchant wholesalers 4 - 3 - - 6 4 - 4 7 6 7
Hardware, and plumbing and heating equipment and supplies merchant wholesalers - 5 3 - - 4 - 6 - 5 4 5
Plumbing and heating equipment and supplies (hydronics) merchant wholesalers - - - - - 3 - - - 4 - 1
Warm air heating and air-conditioning equipment and supplies merchant wholesalers - - - - - - - 3 - 1 - 3
Machinery, equipment, and supplies merchant wholesalers 26 20 26 32 30 27 27 27 21 36 18 27
Construction and mining (except oil well) machinery and equipment merchant wholesalers 5 - 5 7 4 4 5 7 - 10 - 5
See footnotes at end of table. 78
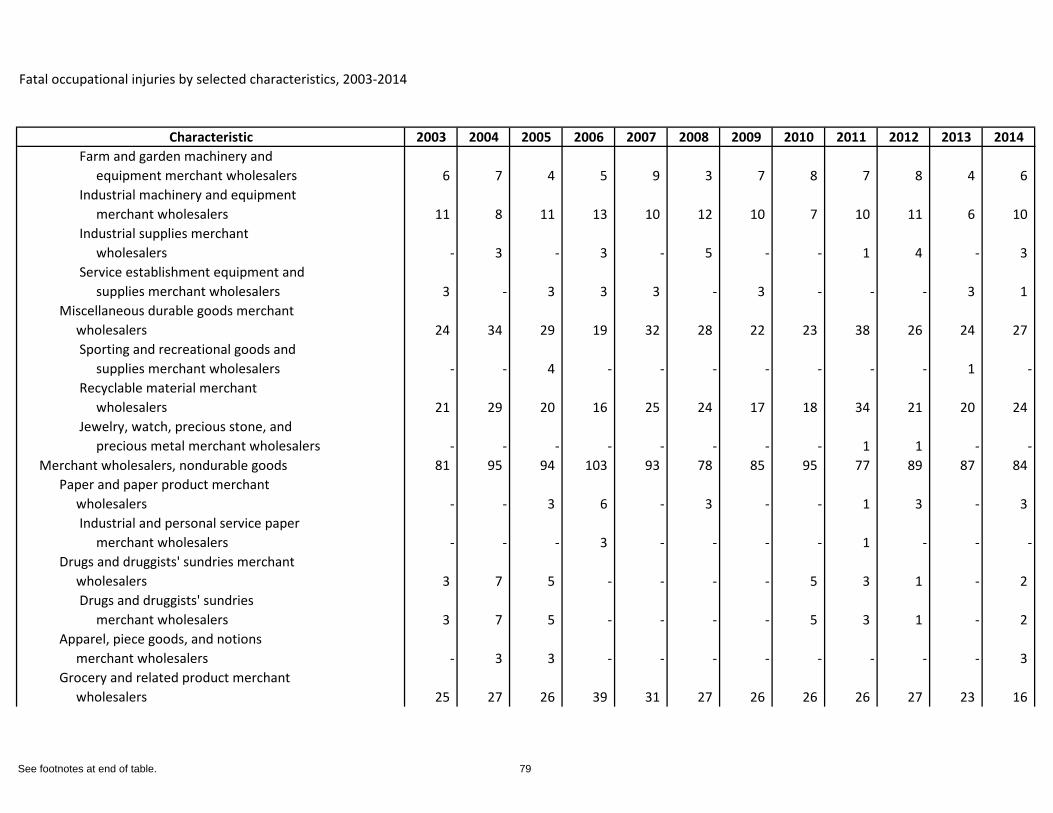
Fatal occupational injuries by selected characteristics, 2003-2014
Characteristic 2003 2004 2005 2006 2007 2008 2009 2010 2011 2012 2013 2014Farm and garden machinery and equipment merchant wholesalers 6 7 4 5 9 3 7 8 7 8 4 6 Industrial machinery and equipment merchant wholesalers 11 8 11 13 10 12 10 7 10 11 6 10 Industrial supplies merchant wholesalers - 3 - 3 - 5 - - 1 4 - 3 Service establishment equipment and supplies merchant wholesalers 3 - 3 3 3 - 3 - - - 3 1
Miscellaneous durable goods merchant wholesalers 24 34 29 19 32 28 22 23 38 26 24 27
Sporting and recreational goods and supplies merchant wholesalers - - 4 - - - - - - - 1 -Recyclable material merchant wholesalers 21 29 20 16 25 24 17 18 34 21 20 24 Jewelry, watch, precious stone, and precious metal merchant wholesalers - - - - - - - - 1 1 - -
Merchant wholesalers, nondurable goods 81 95 94 103 93 78 85 95 77 89 87 84 Paper and paper product merchant wholesalers - - 3 6 - 3 - - 1 3 - 3
Industrial and personal service paper merchant wholesalers - - - 3 - - - - 1 - - -
Drugs and druggists' sundries merchant wholesalers 3 7 5 - - - - 5 3 1 - 2
Drugs and druggists' sundries merchant wholesalers 3 7 5 - - - - 5 3 1 - 2
Apparel, piece goods, and notions merchant wholesalers - 3 3 - - - - - - - - 3 Grocery and related product merchant wholesalers 25 27 26 39 31 27 26 26 26 27 23 16
See footnotes at end of table. 79
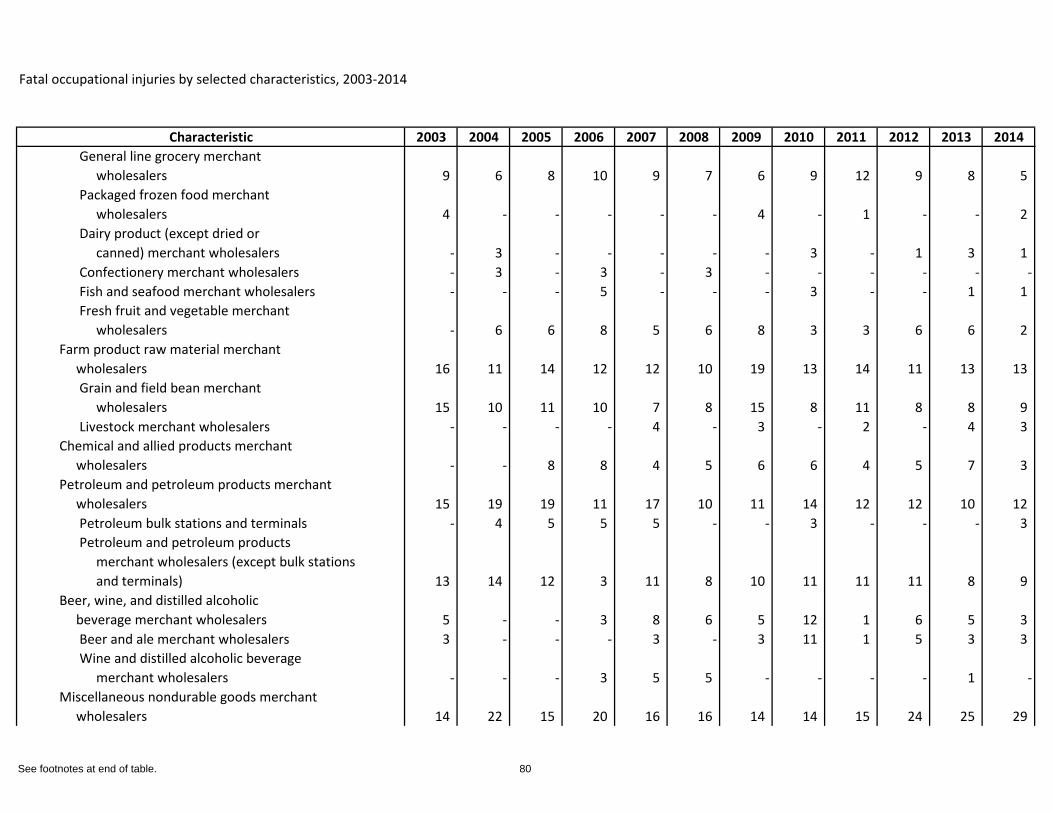
Fatal occupational injuries by selected characteristics, 2003-2014
Characteristic 2003 2004 2005 2006 2007 2008 2009 2010 2011 2012 2013 2014General line grocery merchant wholesalers 9 6 8 10 9 7 6 9 12 9 8 5 Packaged frozen food merchant wholesalers 4 - - - - - 4 - 1 - - 2 Dairy product (except dried or canned) merchant wholesalers - 3 - - - - - 3 - 1 3 1 Confectionery merchant wholesalers - 3 - 3 - 3 - - - - - -Fish and seafood merchant wholesalers - - - 5 - - - 3 - - 1 1 Fresh fruit and vegetable merchant wholesalers - 6 6 8 5 6 8 3 3 6 6 2
Farm product raw material merchant wholesalers 16 11 14 12 12 10 19 13 14 11 13 13
Grain and field bean merchant wholesalers 15 10 11 10 7 8 15 8 11 8 8 9 Livestock merchant wholesalers - - - - 4 - 3 - 2 - 4 3
Chemical and allied products merchant wholesalers - - 8 8 4 5 6 6 4 5 7 3 Petroleum and petroleum products merchant wholesalers 15 19 19 11 17 10 11 14 12 12 10 12
Petroleum bulk stations and terminals - 4 5 5 5 - - 3 - - - 3 Petroleum and petroleum products merchant wholesalers (except bulk stations and terminals) 13 14 12 3 11 8 10 11 11 11 8 9
Beer, wine, and distilled alcoholic beverage merchant wholesalers 5 - - 3 8 6 5 12 1 6 5 3
Beer and ale merchant wholesalers 3 - - - 3 - 3 11 1 5 3 3 Wine and distilled alcoholic beverage merchant wholesalers - - - 3 5 5 - - - - 1 -
Miscellaneous nondurable goods merchant wholesalers 14 22 15 20 16 16 14 14 15 24 25 29
See footnotes at end of table. 80
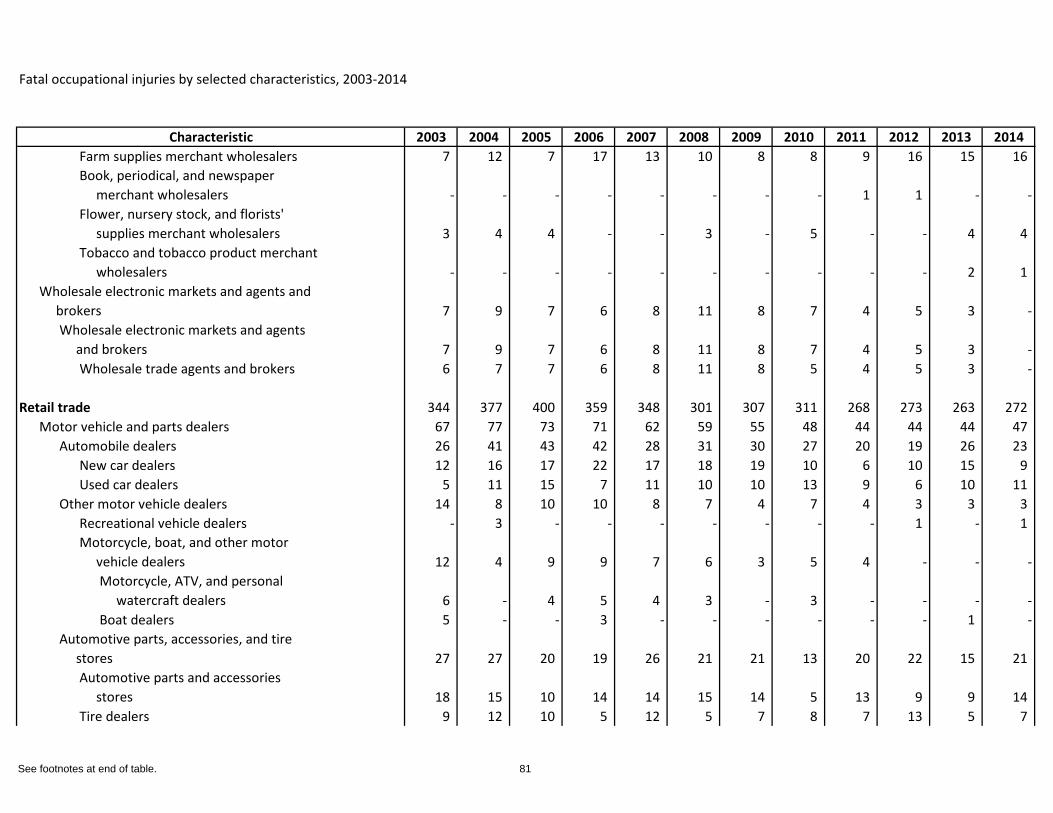
Fatal occupational injuries by selected characteristics, 2003-2014
Characteristic 2003 2004 2005 2006 2007 2008 2009 2010 2011 2012 2013 2014Farm supplies merchant wholesalers 7 12 7 17 13 10 8 8 9 16 15 16 Book, periodical, and newspaper merchant wholesalers - - - - - - - - 1 1 - -Flower, nursery stock, and florists' supplies merchant wholesalers 3 4 4 - - 3 - 5 - - 4 4 Tobacco and tobacco product merchant wholesalers - - - - - - - - - - 2 1
Wholesale electronic markets and agents and brokers 7 9 7 6 8 11 8 7 4 5 3 -
Wholesale electronic markets and agents and brokers 7 9 7 6 8 11 8 7 4 5 3 -
Wholesale trade agents and brokers 6 7 7 6 8 11 8 5 4 5 3 -
Retail trade 344 377 400 359 348 301 307 311 268 273 263 272 Motor vehicle and parts dealers 67 77 73 71 62 59 55 48 44 44 44 47
Automobile dealers 26 41 43 42 28 31 30 27 20 19 26 23 New car dealers 12 16 17 22 17 18 19 10 6 10 15 9 Used car dealers 5 11 15 7 11 10 10 13 9 6 10 11
Other motor vehicle dealers 14 8 10 10 8 7 4 7 4 3 3 3 Recreational vehicle dealers - 3 - - - - - - - 1 - 1 Motorcycle, boat, and other motor vehicle dealers 12 4 9 9 7 6 3 5 4 - - -
Motorcycle, ATV, and personal watercraft dealers 6 - 4 5 4 3 - 3 - - - -Boat dealers 5 - - 3 - - - - - - 1 -
Automotive parts, accessories, and tire stores 27 27 20 19 26 21 21 13 20 22 15 21
Automotive parts and accessories stores 18 15 10 14 14 15 14 5 13 9 9 14 Tire dealers 9 12 10 5 12 5 7 8 7 13 5 7
See footnotes at end of table. 81
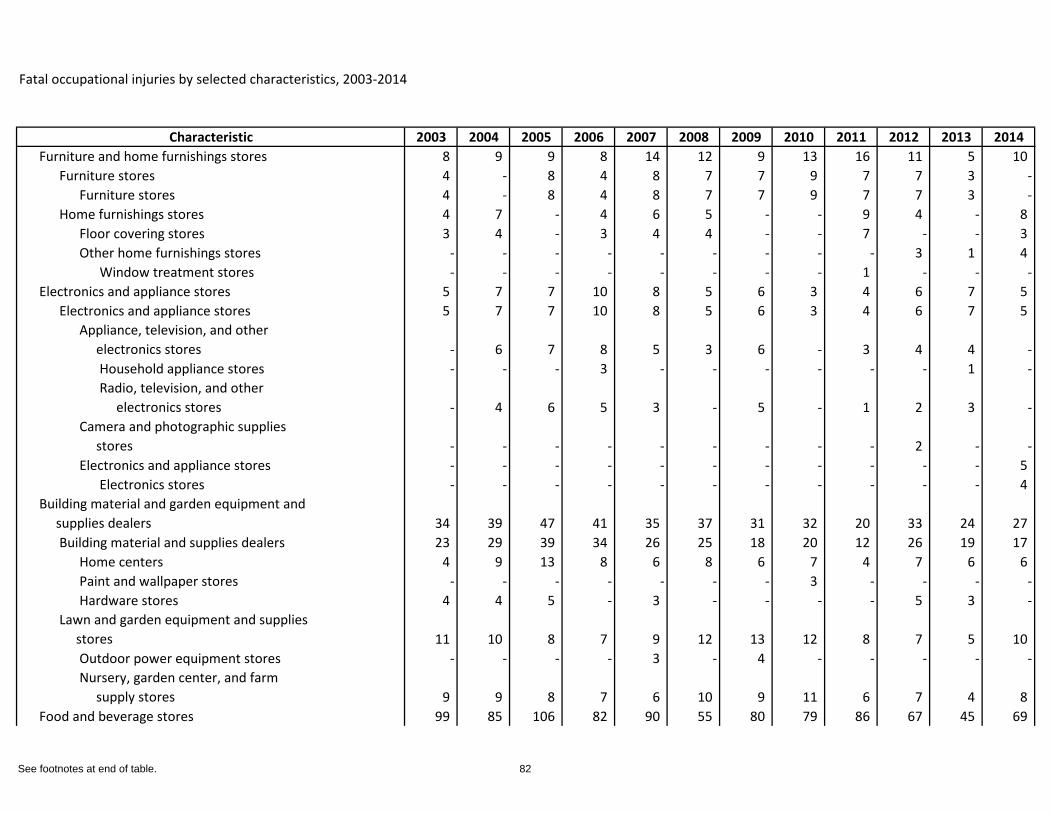
Fatal occupational injuries by selected characteristics, 2003-2014
Characteristic 2003 2004 2005 2006 2007 2008 2009 2010 2011 2012 2013 2014Furniture and home furnishings stores 8 9 9 8 14 12 9 13 16 11 5 10
Furniture stores 4 - 8 4 8 7 7 9 7 7 3 -Furniture stores 4 - 8 4 8 7 7 9 7 7 3 -
Home furnishings stores 4 7 - 4 6 5 - - 9 4 - 8 Floor covering stores 3 4 - 3 4 4 - - 7 - - 3 Other home furnishings stores - - - - - - - - - 3 1 4
Window treatment stores - - - - - - - - 1 - - -Electronics and appliance stores 5 7 7 10 8 5 6 3 4 6 7 5
Electronics and appliance stores 5 7 7 10 8 5 6 3 4 6 7 5 Appliance, television, and other electronics stores - 6 7 8 5 3 6 - 3 4 4 -
Household appliance stores - - - 3 - - - - - - 1 -Radio, television, and other electronics stores - 4 6 5 3 - 5 - 1 2 3 -
Camera and photographic supplies stores - - - - - - - - - 2 - -Electronics and appliance stores - - - - - - - - - - - 5
Electronics stores - - - - - - - - - - - 4 Building material and garden equipment and supplies dealers 34 39 47 41 35 37 31 32 20 33 24 27
Building material and supplies dealers 23 29 39 34 26 25 18 20 12 26 19 17 Home centers 4 9 13 8 6 8 6 7 4 7 6 6 Paint and wallpaper stores - - - - - - - 3 - - - -Hardware stores 4 4 5 - 3 - - - - 5 3 -
Lawn and garden equipment and supplies stores 11 10 8 7 9 12 13 12 8 7 5 10
Outdoor power equipment stores - - - - 3 - 4 - - - - -Nursery, garden center, and farm supply stores 9 9 8 7 6 10 9 11 6 7 4 8
Food and beverage stores 99 85 106 82 90 55 80 79 86 67 45 69
See footnotes at end of table. 82
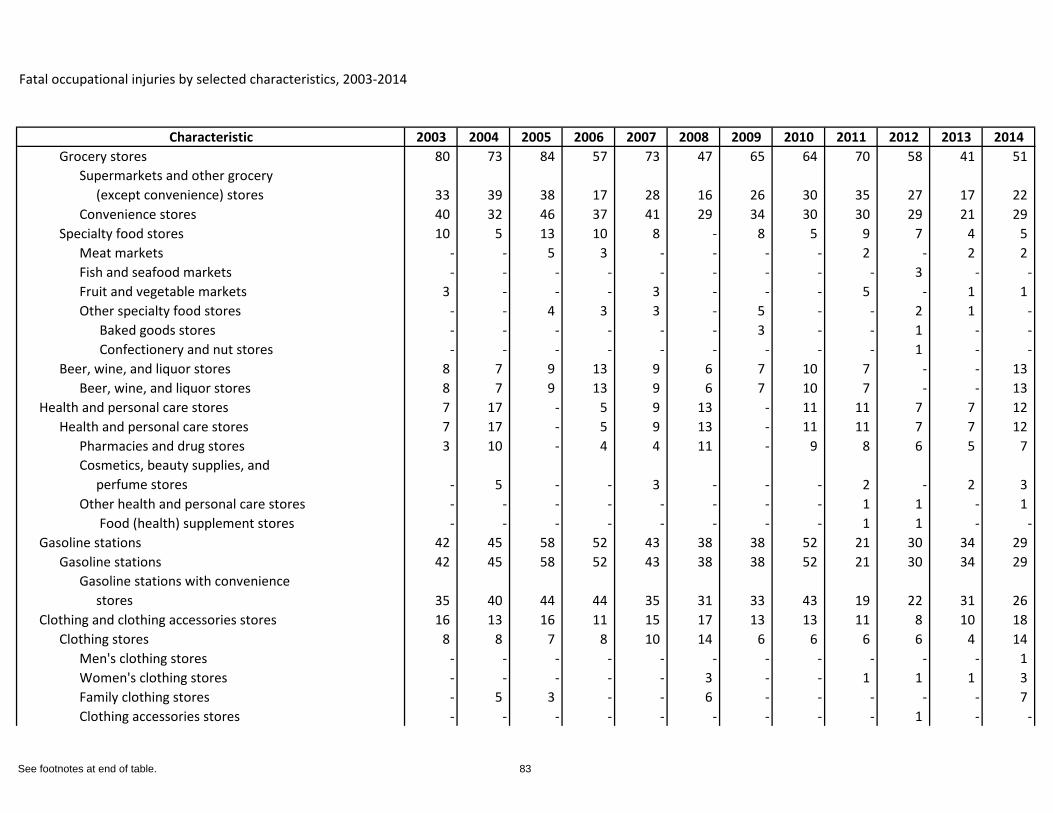
Fatal occupational injuries by selected characteristics, 2003-2014
Characteristic 2003 2004 2005 2006 2007 2008 2009 2010 2011 2012 2013 2014Grocery stores 80 73 84 57 73 47 65 64 70 58 41 51
Supermarkets and other grocery (except convenience) stores 33 39 38 17 28 16 26 30 35 27 17 22 Convenience stores 40 32 46 37 41 29 34 30 30 29 21 29
Specialty food stores 10 5 13 10 8 - 8 5 9 7 4 5 Meat markets - - 5 3 - - - - 2 - 2 2 Fish and seafood markets - - - - - - - - - 3 - -Fruit and vegetable markets 3 - - - 3 - - - 5 - 1 1 Other specialty food stores - - 4 3 3 - 5 - - 2 1 -
Baked goods stores - - - - - - 3 - - 1 - -Confectionery and nut stores - - - - - - - - - 1 - -
Beer, wine, and liquor stores 8 7 9 13 9 6 7 10 7 - - 13 Beer, wine, and liquor stores 8 7 9 13 9 6 7 10 7 - - 13
Health and personal care stores 7 17 - 5 9 13 - 11 11 7 7 12 Health and personal care stores 7 17 - 5 9 13 - 11 11 7 7 12
Pharmacies and drug stores 3 10 - 4 4 11 - 9 8 6 5 7 Cosmetics, beauty supplies, and perfume stores - 5 - - 3 - - - 2 - 2 3 Other health and personal care stores - - - - - - - - 1 1 - 1
Food (health) supplement stores - - - - - - - - 1 1 - -Gasoline stations 42 45 58 52 43 38 38 52 21 30 34 29
Gasoline stations 42 45 58 52 43 38 38 52 21 30 34 29 Gasoline stations with convenience stores 35 40 44 44 35 31 33 43 19 22 31 26
Clothing and clothing accessories stores 16 13 16 11 15 17 13 13 11 8 10 18 Clothing stores 8 8 7 8 10 14 6 6 6 6 4 14
Men's clothing stores - - - - - - - - - - - 1 Women's clothing stores - - - - - 3 - - 1 1 1 3 Family clothing stores - 5 3 - - 6 - - - - - 7 Clothing accessories stores - - - - - - - - - 1 - -
See footnotes at end of table. 83
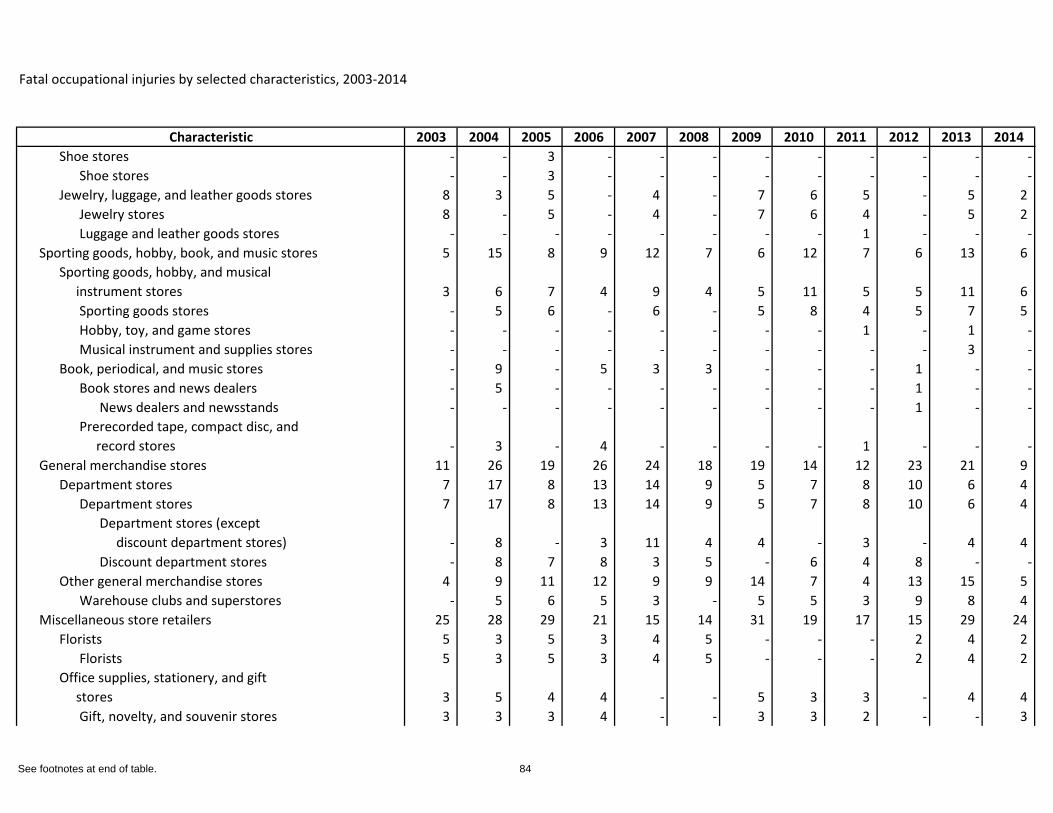
Fatal occupational injuries by selected characteristics, 2003-2014
Characteristic 2003 2004 2005 2006 2007 2008 2009 2010 2011 2012 2013 2014Shoe stores - - 3 - - - - - - - - -
Shoe stores - - 3 - - - - - - - - -Jewelry, luggage, and leather goods stores 8 3 5 - 4 - 7 6 5 - 5 2
Jewelry stores 8 - 5 - 4 - 7 6 4 - 5 2 Luggage and leather goods stores - - - - - - - - 1 - - -
Sporting goods, hobby, book, and music stores 5 15 8 9 12 7 6 12 7 6 13 6 Sporting goods, hobby, and musical instrument stores 3 6 7 4 9 4 5 11 5 5 11 6
Sporting goods stores - 5 6 - 6 - 5 8 4 5 7 5 Hobby, toy, and game stores - - - - - - - - 1 - 1 -Musical instrument and supplies stores - - - - - - - - - - 3 -
Book, periodical, and music stores - 9 - 5 3 3 - - - 1 - -Book stores and news dealers - 5 - - - - - - - 1 - -
News dealers and newsstands - - - - - - - - - 1 - -Prerecorded tape, compact disc, and record stores - 3 - 4 - - - - 1 - - -
General merchandise stores 11 26 19 26 24 18 19 14 12 23 21 9 Department stores 7 17 8 13 14 9 5 7 8 10 6 4
Department stores 7 17 8 13 14 9 5 7 8 10 6 4 Department stores (except discount department stores) - 8 - 3 11 4 4 - 3 - 4 4 Discount department stores - 8 7 8 3 5 - 6 4 8 - -
Other general merchandise stores 4 9 11 12 9 9 14 7 4 13 15 5 Warehouse clubs and superstores - 5 6 5 3 - 5 5 3 9 8 4
Miscellaneous store retailers 25 28 29 21 15 14 31 19 17 15 29 24 Florists 5 3 5 3 4 5 - - - 2 4 2
Florists 5 3 5 3 4 5 - - - 2 4 2 Office supplies, stationery, and gift stores 3 5 4 4 - - 5 3 3 - 4 4
Gift, novelty, and souvenir stores 3 3 3 4 - - 3 3 2 - - 3
See footnotes at end of table. 84
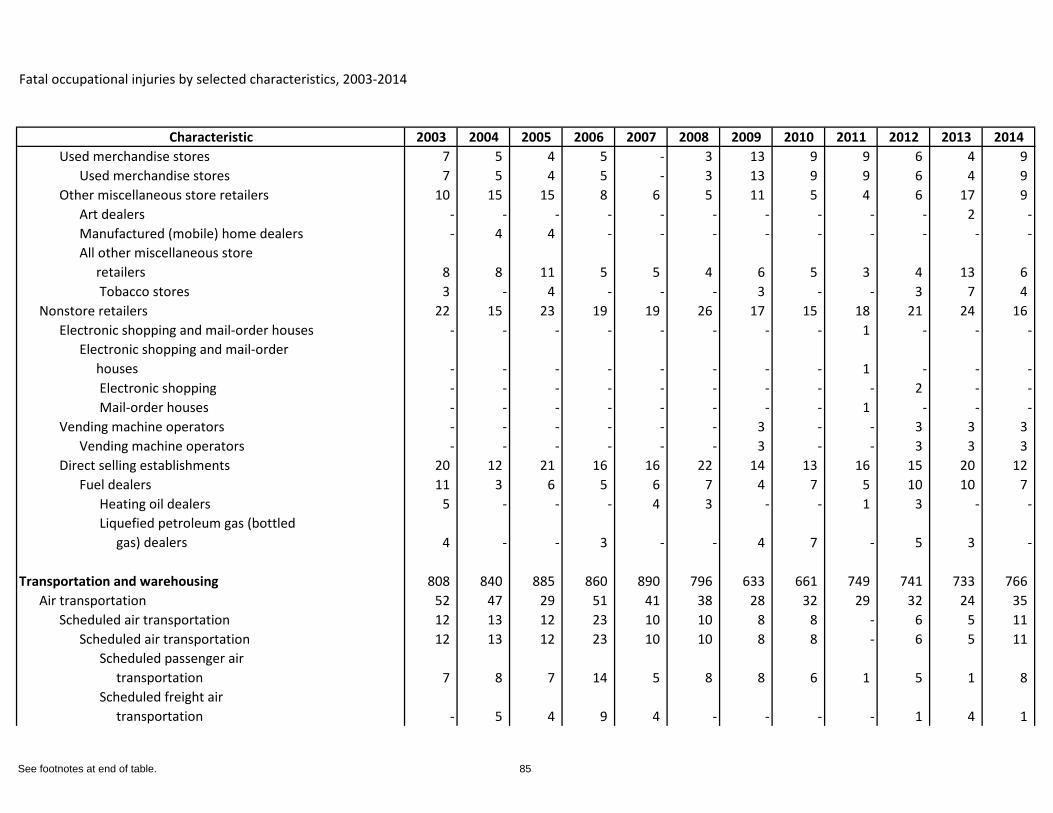
Fatal occupational injuries by selected characteristics, 2003-2014
Characteristic 2003 2004 2005 2006 2007 2008 2009 2010 2011 2012 2013 2014Used merchandise stores 7 5 4 5 - 3 13 9 9 6 4 9
Used merchandise stores 7 5 4 5 - 3 13 9 9 6 4 9 Other miscellaneous store retailers 10 15 15 8 6 5 11 5 4 6 17 9
Art dealers - - - - - - - - - - 2 -Manufactured (mobile) home dealers - 4 4 - - - - - - - - -All other miscellaneous store retailers 8 8 11 5 5 4 6 5 3 4 13 6
Tobacco stores 3 - 4 - - - 3 - - 3 7 4 Nonstore retailers 22 15 23 19 19 26 17 15 18 21 24 16
Electronic shopping and mail-order houses - - - - - - - - 1 - - -Electronic shopping and mail-order houses - - - - - - - - 1 - - -
Electronic shopping - - - - - - - - - 2 - -Mail-order houses - - - - - - - - 1 - - -
Vending machine operators - - - - - - 3 - - 3 3 3 Vending machine operators - - - - - - 3 - - 3 3 3
Direct selling establishments 20 12 21 16 16 22 14 13 16 15 20 12 Fuel dealers 11 3 6 5 6 7 4 7 5 10 10 7
Heating oil dealers 5 - - - 4 3 - - 1 3 - -Liquefied petroleum gas (bottled gas) dealers 4 - - 3 - - 4 7 - 5 3 -
Transportation and warehousing 808 840 885 860 890 796 633 661 749 741 733 766 Air transportation 52 47 29 51 41 38 28 32 29 32 24 35
Scheduled air transportation 12 13 12 23 10 10 8 8 - 6 5 11 Scheduled air transportation 12 13 12 23 10 10 8 8 - 6 5 11
Scheduled passenger air transportation 7 8 7 14 5 8 8 6 1 5 1 8 Scheduled freight air transportation - 5 4 9 4 - - - - 1 4 1
See footnotes at end of table. 85
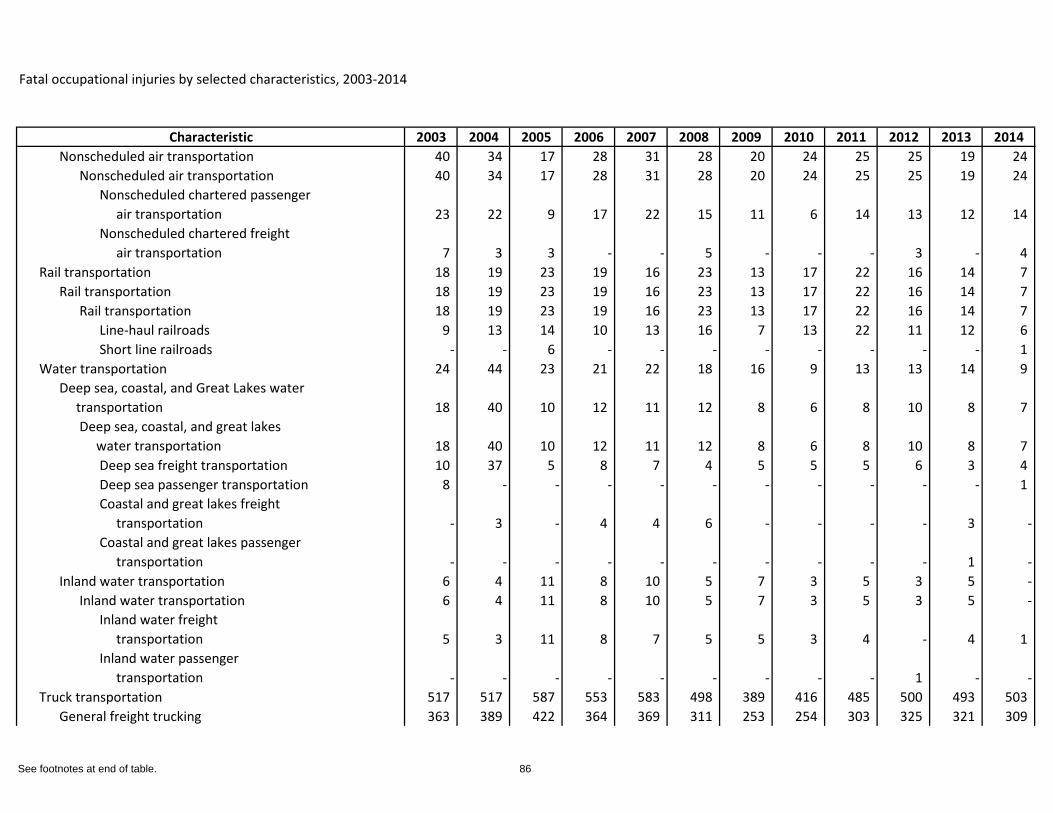
Fatal occupational injuries by selected characteristics, 2003-2014
Characteristic 2003 2004 2005 2006 2007 2008 2009 2010 2011 2012 2013 2014Nonscheduled air transportation 40 34 17 28 31 28 20 24 25 25 19 24
Nonscheduled air transportation 40 34 17 28 31 28 20 24 25 25 19 24 Nonscheduled chartered passenger air transportation 23 22 9 17 22 15 11 6 14 13 12 14 Nonscheduled chartered freight air transportation 7 3 3 - - 5 - - - 3 - 4
Rail transportation 18 19 23 19 16 23 13 17 22 16 14 7 Rail transportation 18 19 23 19 16 23 13 17 22 16 14 7
Rail transportation 18 19 23 19 16 23 13 17 22 16 14 7 Line-haul railroads 9 13 14 10 13 16 7 13 22 11 12 6 Short line railroads - - 6 - - - - - - - - 1
Water transportation 24 44 23 21 22 18 16 9 13 13 14 9 Deep sea, coastal, and Great Lakes water transportation 18 40 10 12 11 12 8 6 8 10 8 7
Deep sea, coastal, and great lakes water transportation 18 40 10 12 11 12 8 6 8 10 8 7
Deep sea freight transportation 10 37 5 8 7 4 5 5 5 6 3 4 Deep sea passenger transportation 8 - - - - - - - - - - 1 Coastal and great lakes freight transportation - 3 - 4 4 6 - - - - 3 -Coastal and great lakes passenger transportation - - - - - - - - - - 1 -
Inland water transportation 6 4 11 8 10 5 7 3 5 3 5 -Inland water transportation 6 4 11 8 10 5 7 3 5 3 5 -
Inland water freight transportation 5 3 11 8 7 5 5 3 4 - 4 1 Inland water passenger transportation - - - - - - - - - 1 - -
Truck transportation 517 517 587 553 583 498 389 416 485 500 493 503 General freight trucking 363 389 422 364 369 311 253 254 303 325 321 309
See footnotes at end of table. 86
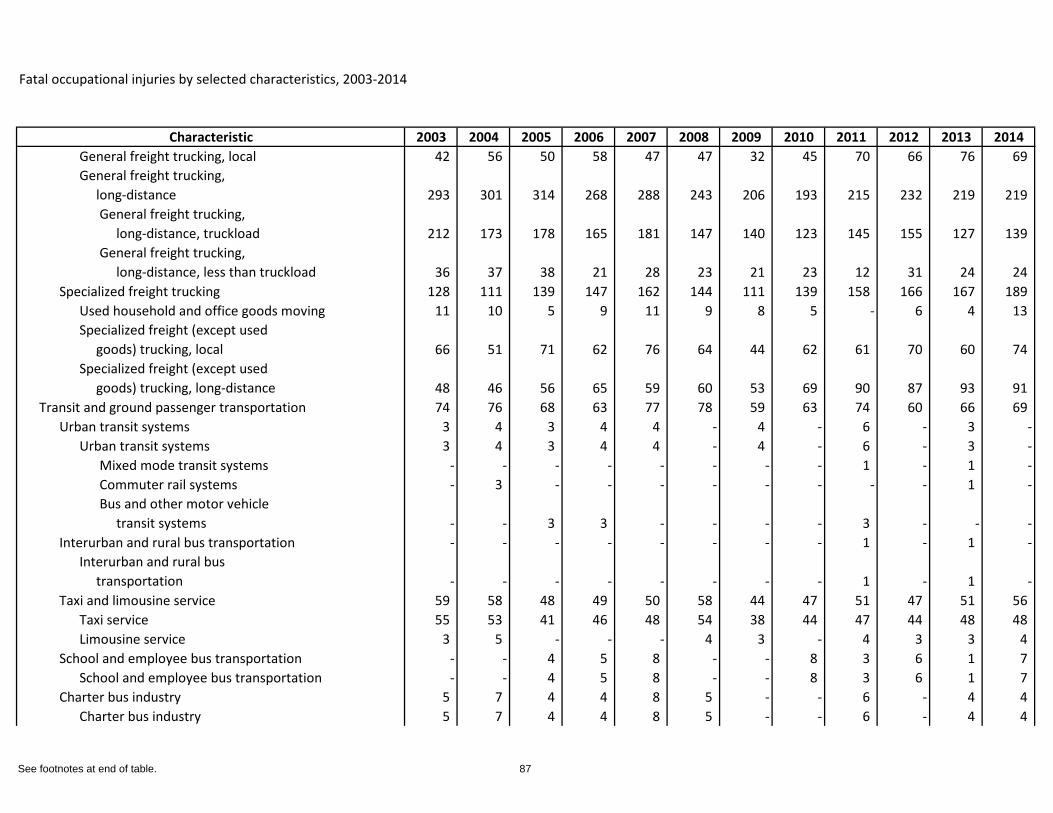
Fatal occupational injuries by selected characteristics, 2003-2014
Characteristic 2003 2004 2005 2006 2007 2008 2009 2010 2011 2012 2013 2014General freight trucking, local 42 56 50 58 47 47 32 45 70 66 76 69 General freight trucking, long-distance 293 301 314 268 288 243 206 193 215 232 219 219
General freight trucking, long-distance, truckload 212 173 178 165 181 147 140 123 145 155 127 139 General freight trucking, long-distance, less than truckload 36 37 38 21 28 23 21 23 12 31 24 24
Specialized freight trucking 128 111 139 147 162 144 111 139 158 166 167 189 Used household and office goods moving 11 10 5 9 11 9 8 5 - 6 4 13 Specialized freight (except used goods) trucking, local 66 51 71 62 76 64 44 62 61 70 60 74 Specialized freight (except used goods) trucking, long-distance 48 46 56 65 59 60 53 69 90 87 93 91
Transit and ground passenger transportation 74 76 68 63 77 78 59 63 74 60 66 69 Urban transit systems 3 4 3 4 4 - 4 - 6 - 3 -
Urban transit systems 3 4 3 4 4 - 4 - 6 - 3 -Mixed mode transit systems - - - - - - - - 1 - 1 -Commuter rail systems - 3 - - - - - - - - 1 -Bus and other motor vehicle transit systems - - 3 3 - - - - 3 - - -
Interurban and rural bus transportation - - - - - - - - 1 - 1 -Interurban and rural bus transportation - - - - - - - - 1 - 1 -
Taxi and limousine service 59 58 48 49 50 58 44 47 51 47 51 56 Taxi service 55 53 41 46 48 54 38 44 47 44 48 48 Limousine service 3 5 - - - 4 3 - 4 3 3 4
School and employee bus transportation - - 4 5 8 - - 8 3 6 1 7 School and employee bus transportation - - 4 5 8 - - 8 3 6 1 7
Charter bus industry 5 7 4 4 8 5 - - 6 - 4 4 Charter bus industry 5 7 4 4 8 5 - - 6 - 4 4
See footnotes at end of table. 87
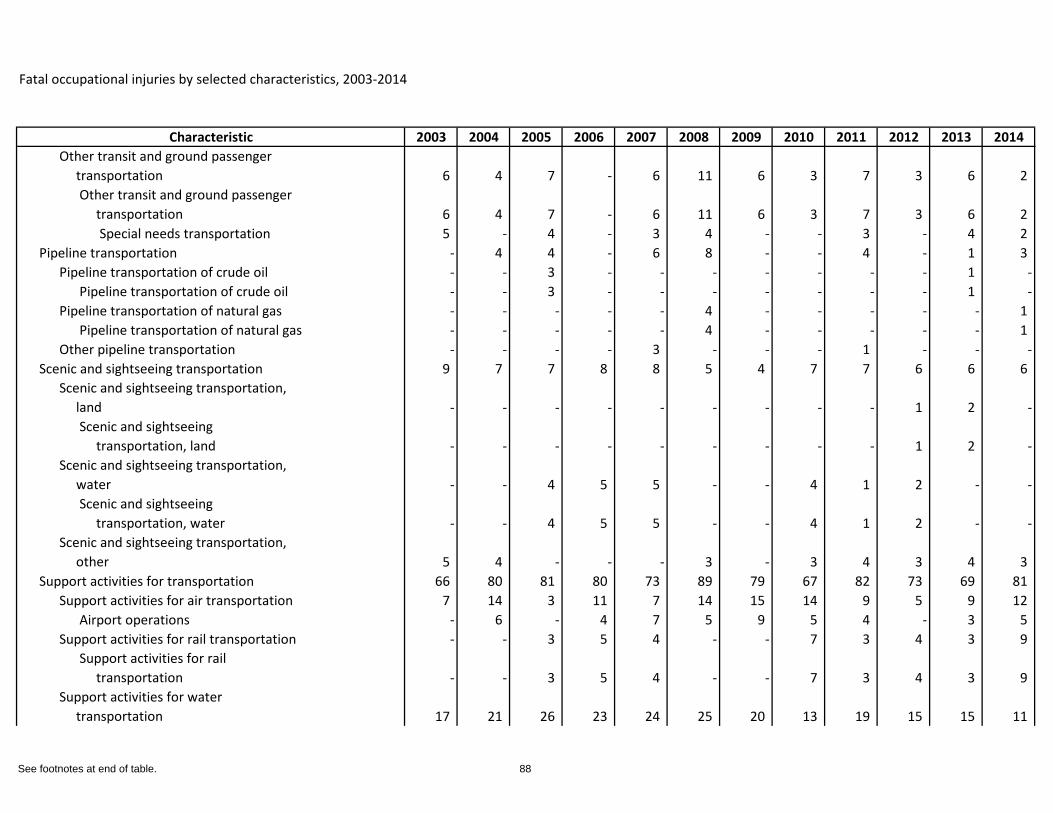
Fatal occupational injuries by selected characteristics, 2003-2014
Characteristic 2003 2004 2005 2006 2007 2008 2009 2010 2011 2012 2013 2014Other transit and ground passenger transportation 6 4 7 - 6 11 6 3 7 3 6 2
Other transit and ground passenger transportation 6 4 7 - 6 11 6 3 7 3 6 2
Special needs transportation 5 - 4 - 3 4 - - 3 - 4 2 Pipeline transportation - 4 4 - 6 8 - - 4 - 1 3
Pipeline transportation of crude oil - - 3 - - - - - - - 1 -Pipeline transportation of crude oil - - 3 - - - - - - - 1 -
Pipeline transportation of natural gas - - - - - 4 - - - - - 1 Pipeline transportation of natural gas - - - - - 4 - - - - - 1
Other pipeline transportation - - - - 3 - - - 1 - - -Scenic and sightseeing transportation 9 7 7 8 8 5 4 7 7 6 6 6
Scenic and sightseeing transportation, land - - - - - - - - - 1 2 -
Scenic and sightseeing transportation, land - - - - - - - - - 1 2 -
Scenic and sightseeing transportation, water - - 4 5 5 - - 4 1 2 - -
Scenic and sightseeing transportation, water - - 4 5 5 - - 4 1 2 - -
Scenic and sightseeing transportation, other 5 4 - - - 3 - 3 4 3 4 3
Support activities for transportation 66 80 81 80 73 89 79 67 82 73 69 81 Support activities for air transportation 7 14 3 11 7 14 15 14 9 5 9 12
Airport operations - 6 - 4 7 5 9 5 4 - 3 5 Support activities for rail transportation - - 3 5 4 - - 7 3 4 3 9
Support activities for rail transportation - - 3 5 4 - - 7 3 4 3 9
Support activities for water transportation 17 21 26 23 24 25 20 13 19 15 15 11
See footnotes at end of table. 88
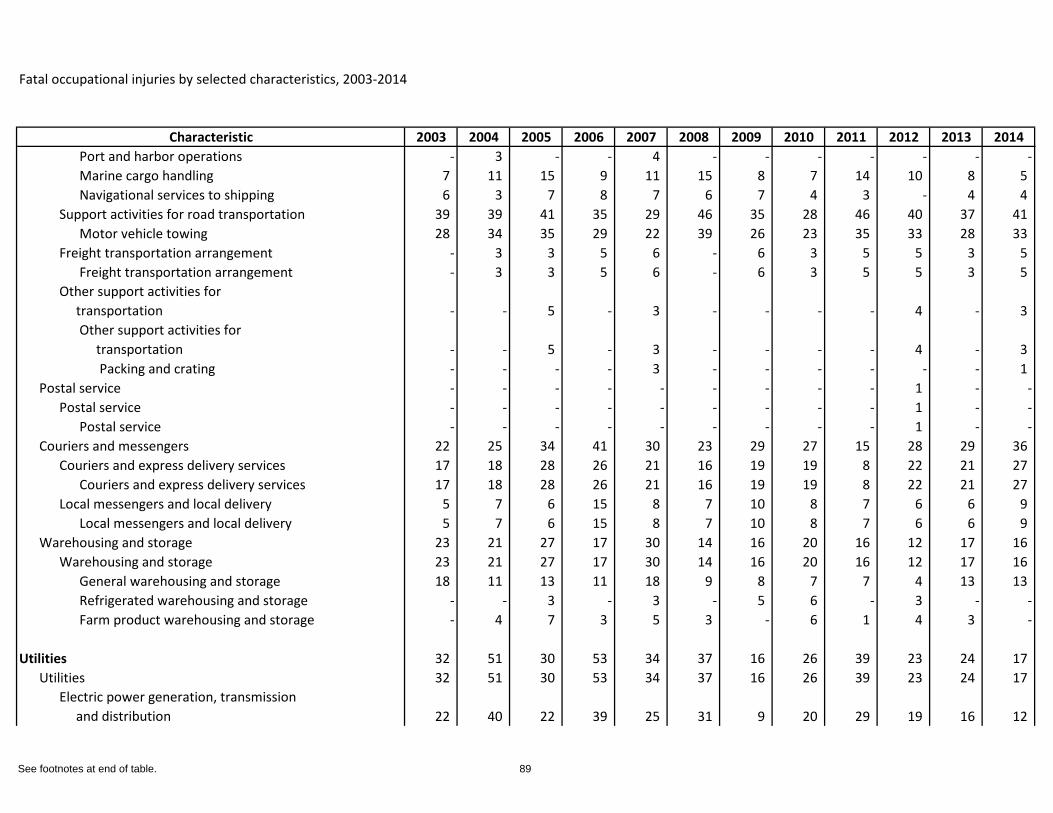
Fatal occupational injuries by selected characteristics, 2003-2014
Characteristic 2003 2004 2005 2006 2007 2008 2009 2010 2011 2012 2013 2014Port and harbor operations - 3 - - 4 - - - - - - -Marine cargo handling 7 11 15 9 11 15 8 7 14 10 8 5 Navigational services to shipping 6 3 7 8 7 6 7 4 3 - 4 4
Support activities for road transportation 39 39 41 35 29 46 35 28 46 40 37 41 Motor vehicle towing 28 34 35 29 22 39 26 23 35 33 28 33
Freight transportation arrangement - 3 3 5 6 - 6 3 5 5 3 5 Freight transportation arrangement - 3 3 5 6 - 6 3 5 5 3 5
Other support activities for transportation - - 5 - 3 - - - - 4 - 3
Other support activities for transportation - - 5 - 3 - - - - 4 - 3
Packing and crating - - - - 3 - - - - - - 1 Postal service - - - - - - - - - 1 - -
Postal service - - - - - - - - - 1 - -Postal service - - - - - - - - - 1 - -
Couriers and messengers 22 25 34 41 30 23 29 27 15 28 29 36 Couriers and express delivery services 17 18 28 26 21 16 19 19 8 22 21 27
Couriers and express delivery services 17 18 28 26 21 16 19 19 8 22 21 27 Local messengers and local delivery 5 7 6 15 8 7 10 8 7 6 6 9
Local messengers and local delivery 5 7 6 15 8 7 10 8 7 6 6 9 Warehousing and storage 23 21 27 17 30 14 16 20 16 12 17 16
Warehousing and storage 23 21 27 17 30 14 16 20 16 12 17 16 General warehousing and storage 18 11 13 11 18 9 8 7 7 4 13 13 Refrigerated warehousing and storage - - 3 - 3 - 5 6 - 3 - -Farm product warehousing and storage - 4 7 3 5 3 - 6 1 4 3 -
Utilities 32 51 30 53 34 37 16 26 39 23 24 17 Utilities 32 51 30 53 34 37 16 26 39 23 24 17
Electric power generation, transmission and distribution 22 40 22 39 25 31 9 20 29 19 16 12
See footnotes at end of table. 89
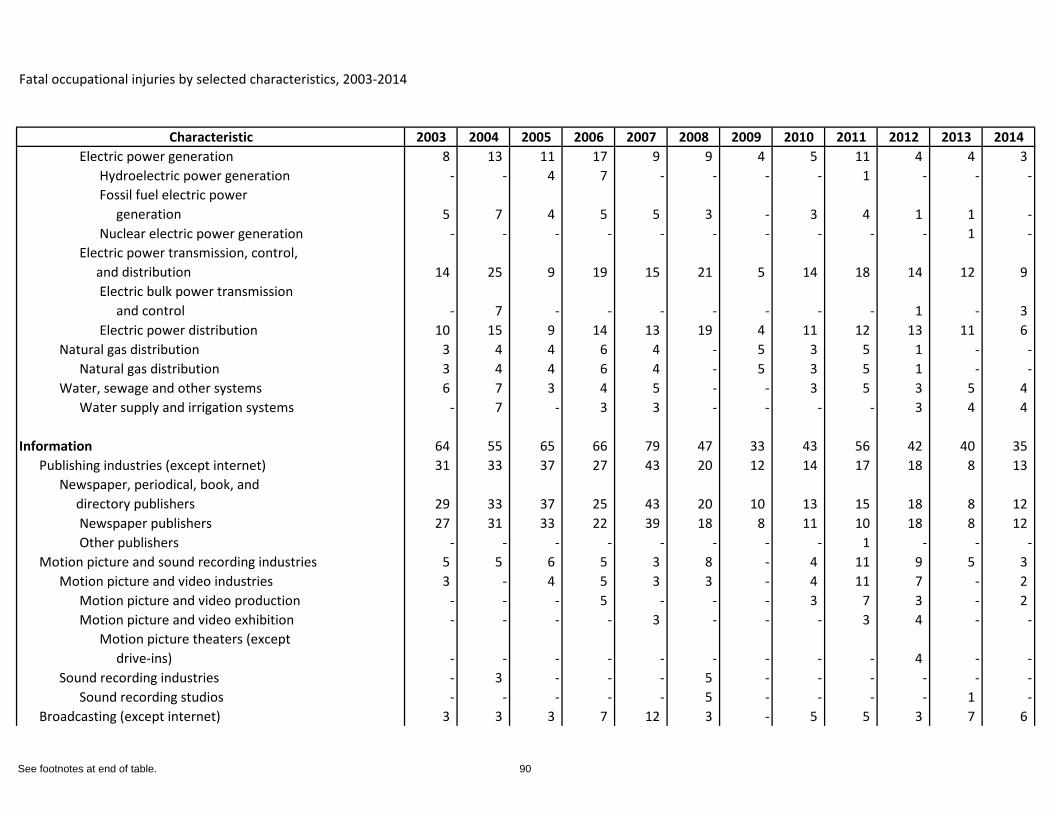
Fatal occupational injuries by selected characteristics, 2003-2014
Characteristic 2003 2004 2005 2006 2007 2008 2009 2010 2011 2012 2013 2014Electric power generation 8 13 11 17 9 9 4 5 11 4 4 3
Hydroelectric power generation - - 4 7 - - - - 1 - - -Fossil fuel electric power generation 5 7 4 5 5 3 - 3 4 1 1 -Nuclear electric power generation - - - - - - - - - - 1 -
Electric power transmission, control, and distribution 14 25 9 19 15 21 5 14 18 14 12 9
Electric bulk power transmission and control - 7 - - - - - - - 1 - 3 Electric power distribution 10 15 9 14 13 19 4 11 12 13 11 6
Natural gas distribution 3 4 4 6 4 - 5 3 5 1 - -Natural gas distribution 3 4 4 6 4 - 5 3 5 1 - -
Water, sewage and other systems 6 7 3 4 5 - - 3 5 3 5 4 Water supply and irrigation systems - 7 - 3 3 - - - - 3 4 4
Information 64 55 65 66 79 47 33 43 56 42 40 35 Publishing industries (except internet) 31 33 37 27 43 20 12 14 17 18 8 13
Newspaper, periodical, book, and directory publishers 29 33 37 25 43 20 10 13 15 18 8 12
Newspaper publishers 27 31 33 22 39 18 8 11 10 18 8 12 Other publishers - - - - - - - - 1 - - -
Motion picture and sound recording industries 5 5 6 5 3 8 - 4 11 9 5 3 Motion picture and video industries 3 - 4 5 3 3 - 4 11 7 - 2
Motion picture and video production - - - 5 - - - 3 7 3 - 2 Motion picture and video exhibition - - - - 3 - - - 3 4 - -
Motion picture theaters (except drive-ins) - - - - - - - - - 4 - -
Sound recording industries - 3 - - - 5 - - - - - -Sound recording studios - - - - - 5 - - - - 1 -
Broadcasting (except internet) 3 3 3 7 12 3 - 5 5 3 7 6
See footnotes at end of table. 90
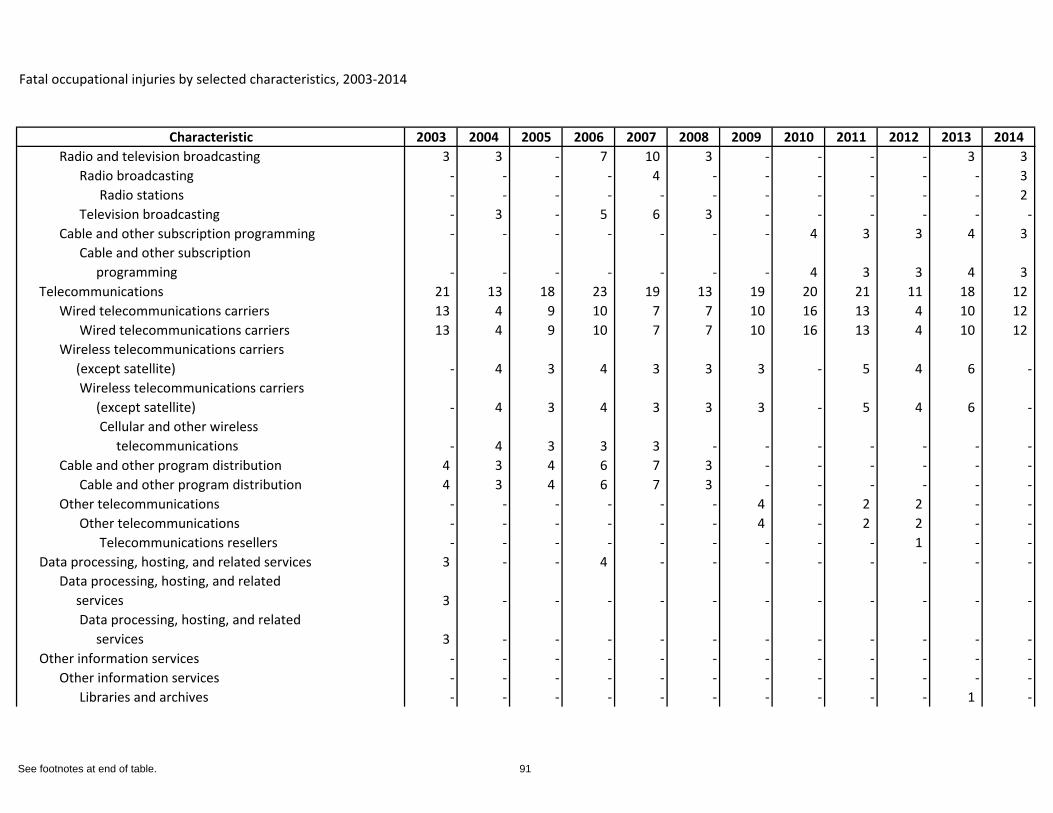
Fatal occupational injuries by selected characteristics, 2003-2014
Characteristic 2003 2004 2005 2006 2007 2008 2009 2010 2011 2012 2013 2014Radio and television broadcasting 3 3 - 7 10 3 - - - - 3 3
Radio broadcasting - - - - 4 - - - - - - 3 Radio stations - - - - - - - - - - - 2
Television broadcasting - 3 - 5 6 3 - - - - - -Cable and other subscription programming - - - - - - - 4 3 3 4 3
Cable and other subscription programming - - - - - - - 4 3 3 4 3
Telecommunications 21 13 18 23 19 13 19 20 21 11 18 12 Wired telecommunications carriers 13 4 9 10 7 7 10 16 13 4 10 12
Wired telecommunications carriers 13 4 9 10 7 7 10 16 13 4 10 12 Wireless telecommunications carriers (except satellite) - 4 3 4 3 3 3 - 5 4 6 -
Wireless telecommunications carriers (except satellite) - 4 3 4 3 3 3 - 5 4 6 -
Cellular and other wireless telecommunications - 4 3 3 3 - - - - - - -
Cable and other program distribution 4 3 4 6 7 3 - - - - - -Cable and other program distribution 4 3 4 6 7 3 - - - - - -
Other telecommunications - - - - - - 4 - 2 2 - -Other telecommunications - - - - - - 4 - 2 2 - -
Telecommunications resellers - - - - - - - - - 1 - -Data processing, hosting, and related services 3 - - 4 - - - - - - - -
Data processing, hosting, and related services 3 - - - - - - - - - - -
Data processing, hosting, and related services 3 - - - - - - - - - - -
Other information services - - - - - - - - - - - -Other information services - - - - - - - - - - - -
Libraries and archives - - - - - - - - - - 1 -
See footnotes at end of table. 91
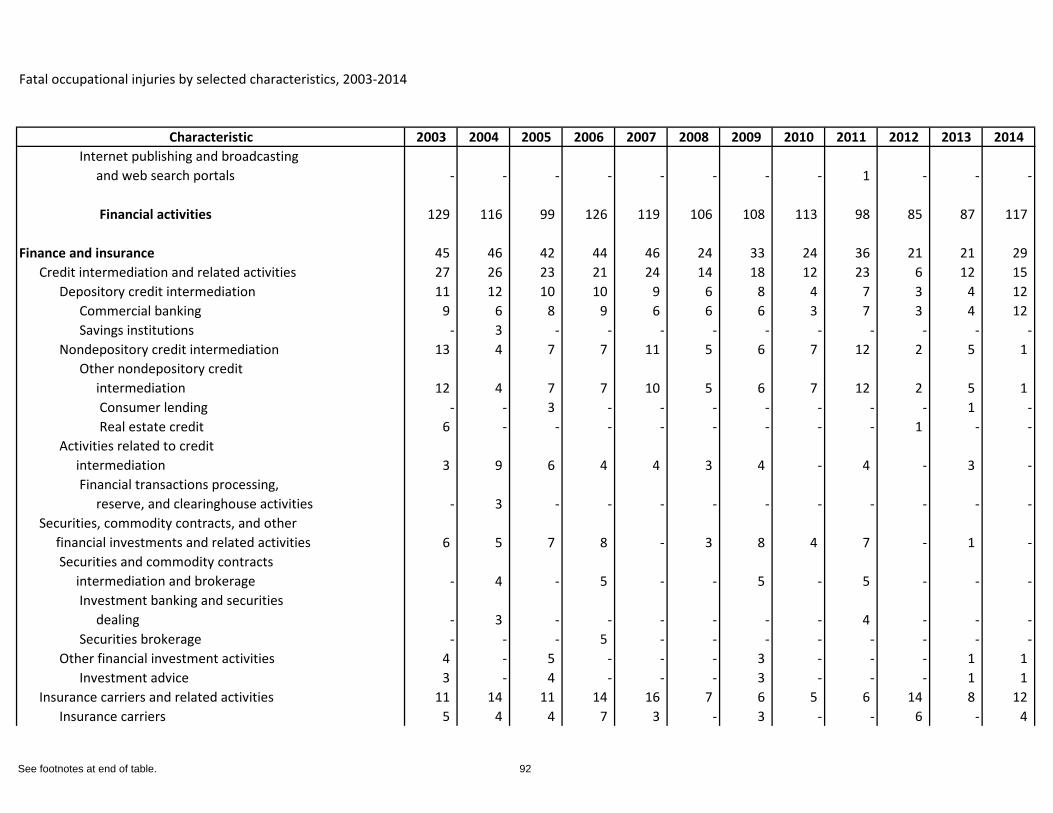
Fatal occupational injuries by selected characteristics, 2003-2014
Characteristic 2003 2004 2005 2006 2007 2008 2009 2010 2011 2012 2013 2014Internet publishing and broadcasting and web search portals - - - - - - - - 1 - - -
Financial activities 129 116 99 126 119 106 108 113 98 85 87 117
Finance and insurance 45 46 42 44 46 24 33 24 36 21 21 29 Credit intermediation and related activities 27 26 23 21 24 14 18 12 23 6 12 15
Depository credit intermediation 11 12 10 10 9 6 8 4 7 3 4 12 Commercial banking 9 6 8 9 6 6 6 3 7 3 4 12 Savings institutions - 3 - - - - - - - - - -
Nondepository credit intermediation 13 4 7 7 11 5 6 7 12 2 5 1 Other nondepository credit intermediation 12 4 7 7 10 5 6 7 12 2 5 1
Consumer lending - - 3 - - - - - - - 1 -Real estate credit 6 - - - - - - - - 1 - -
Activities related to credit intermediation 3 9 6 4 4 3 4 - 4 - 3 -
Financial transactions processing, reserve, and clearinghouse activities - 3 - - - - - - - - - -
Securities, commodity contracts, and other financial investments and related activities 6 5 7 8 - 3 8 4 7 - 1 -
Securities and commodity contracts intermediation and brokerage - 4 - 5 - - 5 - 5 - - -
Investment banking and securities dealing - 3 - - - - - - 4 - - -Securities brokerage - - - 5 - - - - - - - -
Other financial investment activities 4 - 5 - - - 3 - - - 1 1 Investment advice 3 - 4 - - - 3 - - - 1 1
Insurance carriers and related activities 11 14 11 14 16 7 6 5 6 14 8 12 Insurance carriers 5 4 4 7 3 - 3 - - 6 - 4
See footnotes at end of table. 92
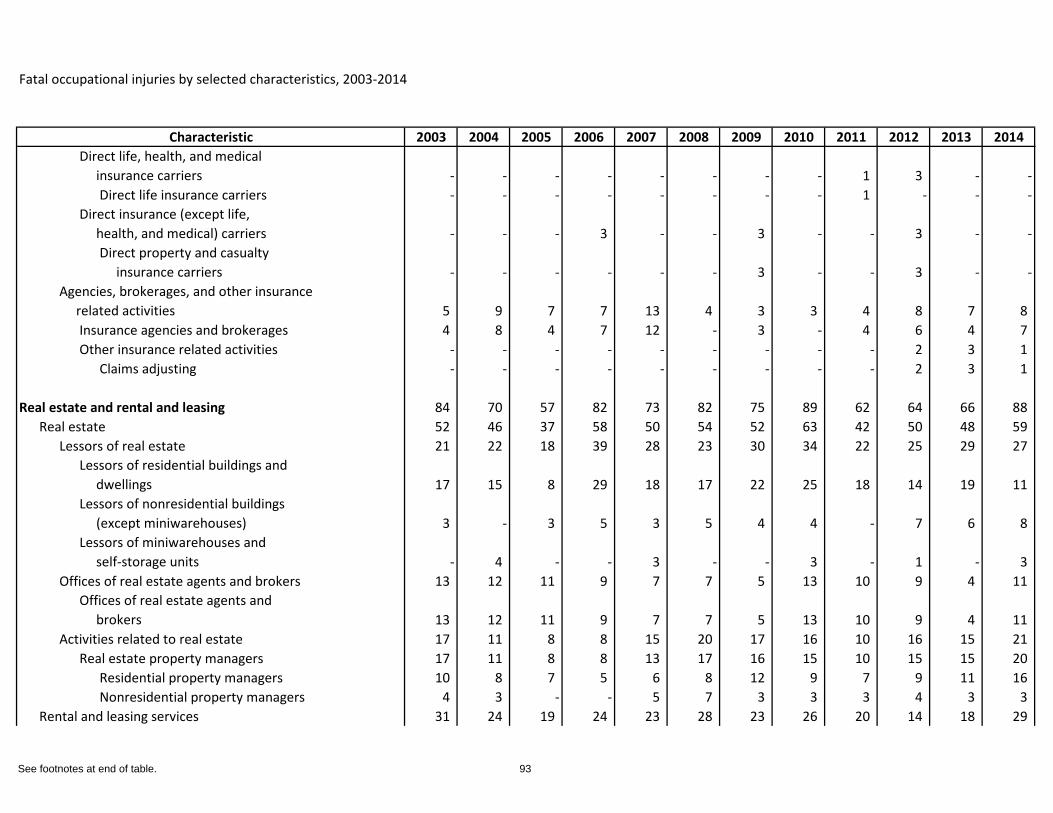
Fatal occupational injuries by selected characteristics, 2003-2014
Characteristic 2003 2004 2005 2006 2007 2008 2009 2010 2011 2012 2013 2014Direct life, health, and medical insurance carriers - - - - - - - - 1 3 - -
Direct life insurance carriers - - - - - - - - 1 - - -Direct insurance (except life, health, and medical) carriers - - - 3 - - 3 - - 3 - -
Direct property and casualty insurance carriers - - - - - - 3 - - 3 - -
Agencies, brokerages, and other insurance related activities 5 9 7 7 13 4 3 3 4 8 7 8
Insurance agencies and brokerages 4 8 4 7 12 - 3 - 4 6 4 7 Other insurance related activities - - - - - - - - - 2 3 1
Claims adjusting - - - - - - - - - 2 3 1
Real estate and rental and leasing 84 70 57 82 73 82 75 89 62 64 66 88 Real estate 52 46 37 58 50 54 52 63 42 50 48 59
Lessors of real estate 21 22 18 39 28 23 30 34 22 25 29 27 Lessors of residential buildings and dwellings 17 15 8 29 18 17 22 25 18 14 19 11 Lessors of nonresidential buildings (except miniwarehouses) 3 - 3 5 3 5 4 4 - 7 6 8 Lessors of miniwarehouses and self-storage units - 4 - - 3 - - 3 - 1 - 3
Offices of real estate agents and brokers 13 12 11 9 7 7 5 13 10 9 4 11 Offices of real estate agents and brokers 13 12 11 9 7 7 5 13 10 9 4 11
Activities related to real estate 17 11 8 8 15 20 17 16 10 16 15 21 Real estate property managers 17 11 8 8 13 17 16 15 10 15 15 20
Residential property managers 10 8 7 5 6 8 12 9 7 9 11 16 Nonresidential property managers 4 3 - - 5 7 3 3 3 4 3 3
Rental and leasing services 31 24 19 24 23 28 23 26 20 14 18 29
See footnotes at end of table. 93
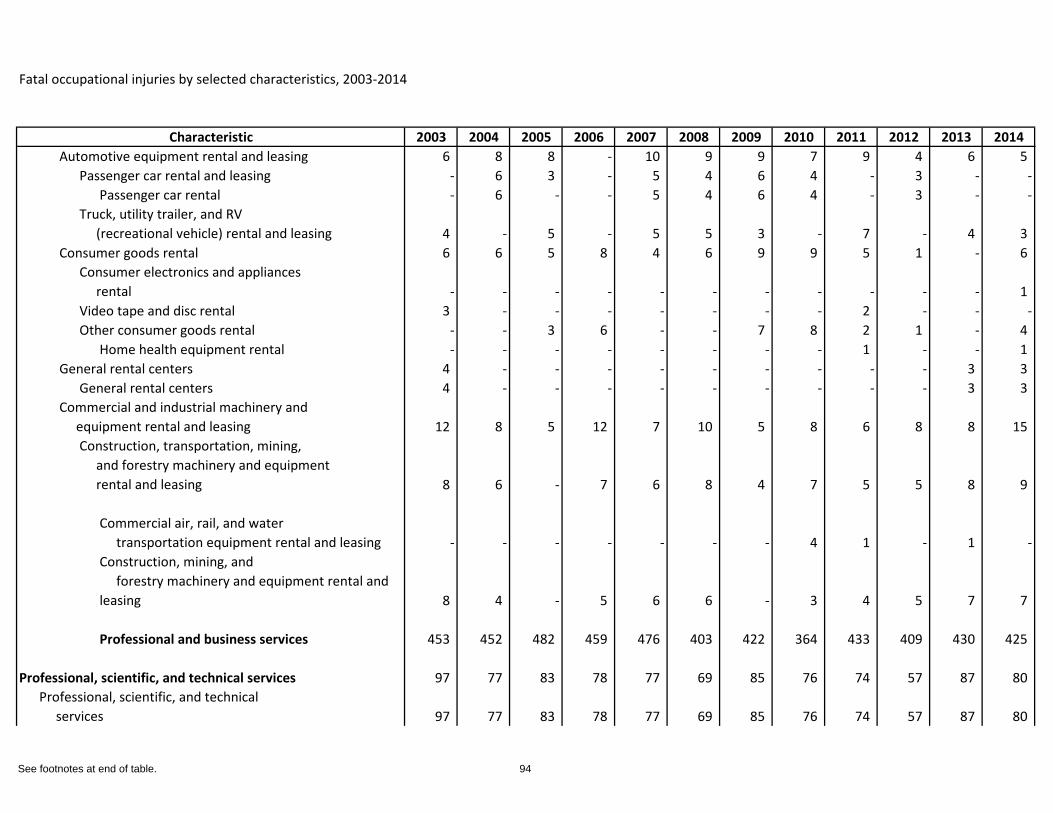
Fatal occupational injuries by selected characteristics, 2003-2014
Characteristic 2003 2004 2005 2006 2007 2008 2009 2010 2011 2012 2013 2014Automotive equipment rental and leasing 6 8 8 - 10 9 9 7 9 4 6 5
Passenger car rental and leasing - 6 3 - 5 4 6 4 - 3 - -Passenger car rental - 6 - - 5 4 6 4 - 3 - -
Truck, utility trailer, and RV (recreational vehicle) rental and leasing 4 - 5 - 5 5 3 - 7 - 4 3
Consumer goods rental 6 6 5 8 4 6 9 9 5 1 - 6 Consumer electronics and appliances rental - - - - - - - - - - - 1 Video tape and disc rental 3 - - - - - - - 2 - - -Other consumer goods rental - - 3 6 - - 7 8 2 1 - 4
Home health equipment rental - - - - - - - - 1 - - 1 General rental centers 4 - - - - - - - - - 3 3
General rental centers 4 - - - - - - - - - 3 3 Commercial and industrial machinery and equipment rental and leasing 12 8 5 12 7 10 5 8 6 8 8 15
Construction, transportation, mining, and forestry machinery and equipment rental and leasing 8 6 - 7 6 8 4 7 5 5 8 9
Commercial air, rail, and water transportation equipment rental and leasing - - - - - - - 4 1 - 1 -Construction, mining, and forestry machinery and equipment rental and leasing 8 4 - 5 6 6 - 3 4 5 7 7
Professional and business services 453 452 482 459 476 403 422 364 433 409 430 425
Professional, scientific, and technical services 97 77 83 78 77 69 85 76 74 57 87 80 Professional, scientific, and technical services 97 77 83 78 77 69 85 76 74 57 87 80
See footnotes at end of table. 94
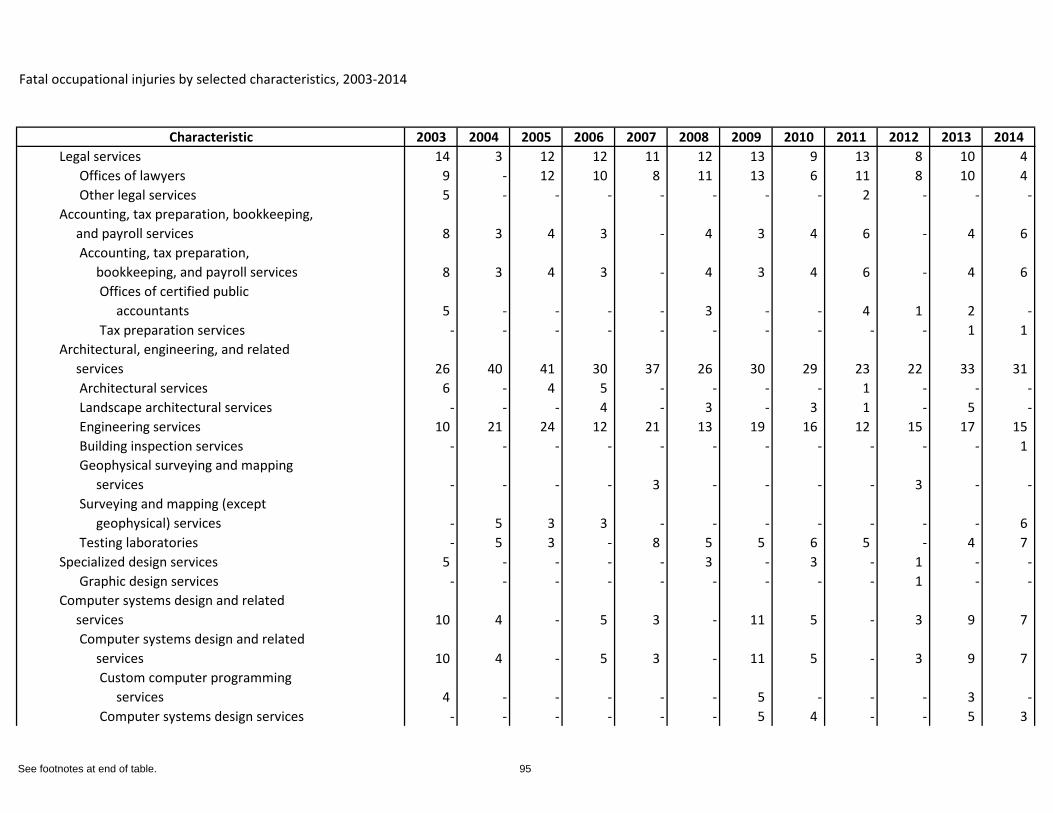
Fatal occupational injuries by selected characteristics, 2003-2014
Characteristic 2003 2004 2005 2006 2007 2008 2009 2010 2011 2012 2013 2014Legal services 14 3 12 12 11 12 13 9 13 8 10 4
Offices of lawyers 9 - 12 10 8 11 13 6 11 8 10 4 Other legal services 5 - - - - - - - 2 - - -
Accounting, tax preparation, bookkeeping, and payroll services 8 3 4 3 - 4 3 4 6 - 4 6
Accounting, tax preparation, bookkeeping, and payroll services 8 3 4 3 - 4 3 4 6 - 4 6
Offices of certified public accountants 5 - - - - 3 - - 4 1 2 -Tax preparation services - - - - - - - - - - 1 1
Architectural, engineering, and related services 26 40 41 30 37 26 30 29 23 22 33 31
Architectural services 6 - 4 5 - - - - 1 - - -Landscape architectural services - - - 4 - 3 - 3 1 - 5 -Engineering services 10 21 24 12 21 13 19 16 12 15 17 15 Building inspection services - - - - - - - - - - - 1 Geophysical surveying and mapping services - - - - 3 - - - - 3 - -Surveying and mapping (except geophysical) services - 5 3 3 - - - - - - - 6 Testing laboratories - 5 3 - 8 5 5 6 5 - 4 7
Specialized design services 5 - - - - 3 - 3 - 1 - -Graphic design services - - - - - - - - - 1 - -
Computer systems design and related services 10 4 - 5 3 - 11 5 - 3 9 7
Computer systems design and related services 10 4 - 5 3 - 11 5 - 3 9 7
Custom computer programming services 4 - - - - - 5 - - - 3 -Computer systems design services - - - - - - 5 4 - - 5 3
See footnotes at end of table. 95
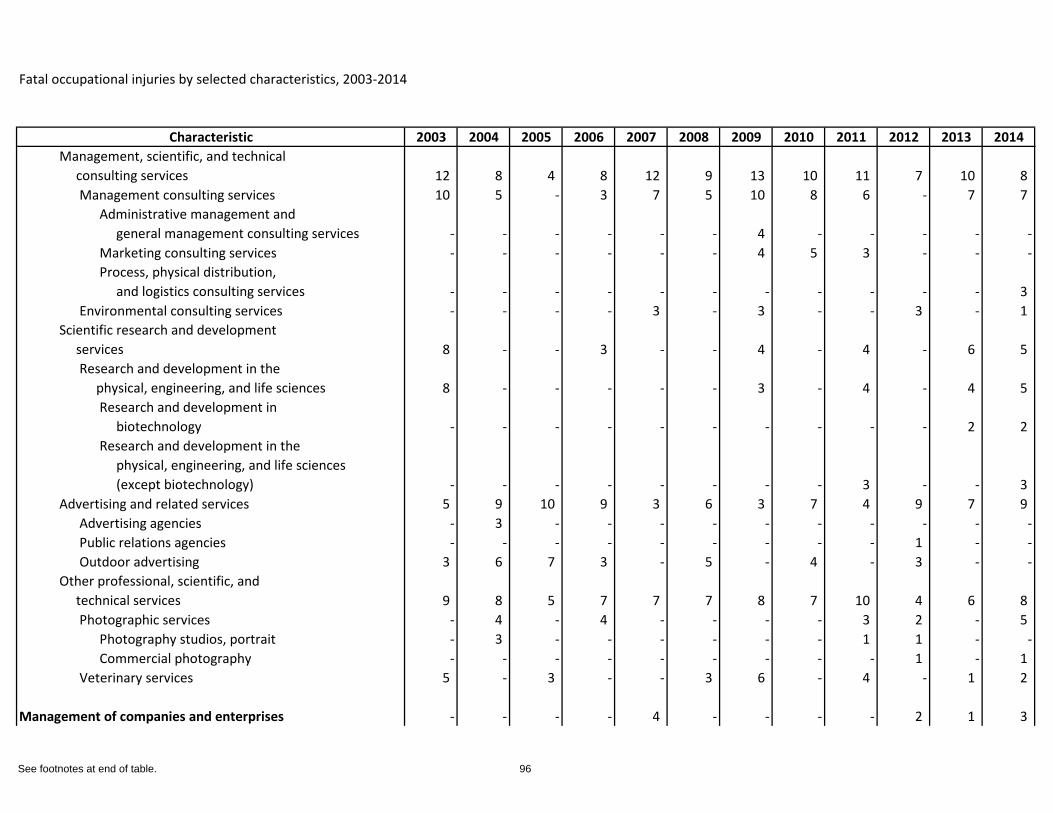
Fatal occupational injuries by selected characteristics, 2003-2014
Characteristic 2003 2004 2005 2006 2007 2008 2009 2010 2011 2012 2013 2014Management, scientific, and technical consulting services 12 8 4 8 12 9 13 10 11 7 10 8
Management consulting services 10 5 - 3 7 5 10 8 6 - 7 7 Administrative management and general management consulting services - - - - - - 4 - - - - -Marketing consulting services - - - - - - 4 5 3 - - -Process, physical distribution, and logistics consulting services - - - - - - - - - - - 3
Environmental consulting services - - - - 3 - 3 - - 3 - 1 Scientific research and development services 8 - - 3 - - 4 - 4 - 6 5
Research and development in the physical, engineering, and life sciences 8 - - - - - 3 - 4 - 4 5
Research and development in biotechnology - - - - - - - - - - 2 2 Research and development in the physical, engineering, and life sciences (except biotechnology) - - - - - - - - 3 - - 3
Advertising and related services 5 9 10 9 3 6 3 7 4 9 7 9 Advertising agencies - 3 - - - - - - - - - -Public relations agencies - - - - - - - - - 1 - -Outdoor advertising 3 6 7 3 - 5 - 4 - 3 - -
Other professional, scientific, and technical services 9 8 5 7 7 7 8 7 10 4 6 8
Photographic services - 4 - 4 - - - - 3 2 - 5 Photography studios, portrait - 3 - - - - - - 1 1 - -Commercial photography - - - - - - - - - 1 - 1
Veterinary services 5 - 3 - - 3 6 - 4 - 1 2
Management of companies and enterprises - - - - 4 - - - - 2 1 3
See footnotes at end of table. 96
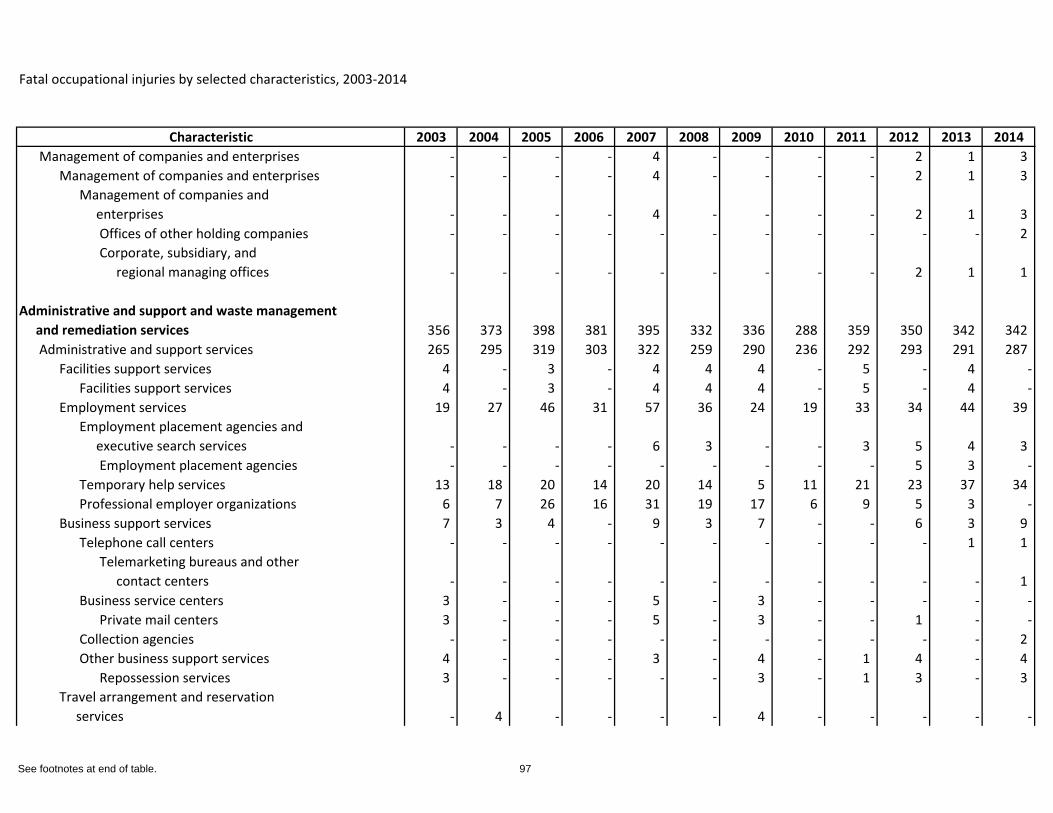
Fatal occupational injuries by selected characteristics, 2003-2014
Characteristic 2003 2004 2005 2006 2007 2008 2009 2010 2011 2012 2013 2014Management of companies and enterprises - - - - 4 - - - - 2 1 3
Management of companies and enterprises - - - - 4 - - - - 2 1 3 Management of companies and enterprises - - - - 4 - - - - 2 1 3
Offices of other holding companies - - - - - - - - - - - 2 Corporate, subsidiary, and regional managing offices - - - - - - - - - 2 1 1
Administrative and support and waste management and remediation services 356 373 398 381 395 332 336 288 359 350 342 342
Administrative and support services 265 295 319 303 322 259 290 236 292 293 291 287 Facilities support services 4 - 3 - 4 4 4 - 5 - 4 -
Facilities support services 4 - 3 - 4 4 4 - 5 - 4 -Employment services 19 27 46 31 57 36 24 19 33 34 44 39
Employment placement agencies and executive search services - - - - 6 3 - - 3 5 4 3
Employment placement agencies - - - - - - - - - 5 3 -Temporary help services 13 18 20 14 20 14 5 11 21 23 37 34 Professional employer organizations 6 7 26 16 31 19 17 6 9 5 3 -
Business support services 7 3 4 - 9 3 7 - - 6 3 9 Telephone call centers - - - - - - - - - - 1 1
Telemarketing bureaus and other contact centers - - - - - - - - - - - 1
Business service centers 3 - - - 5 - 3 - - - - -Private mail centers 3 - - - 5 - 3 - - 1 - -
Collection agencies - - - - - - - - - - - 2 Other business support services 4 - - - 3 - 4 - 1 4 - 4
Repossession services 3 - - - - - 3 - 1 3 - 3 Travel arrangement and reservation services - 4 - - - - 4 - - - - -
See footnotes at end of table. 97
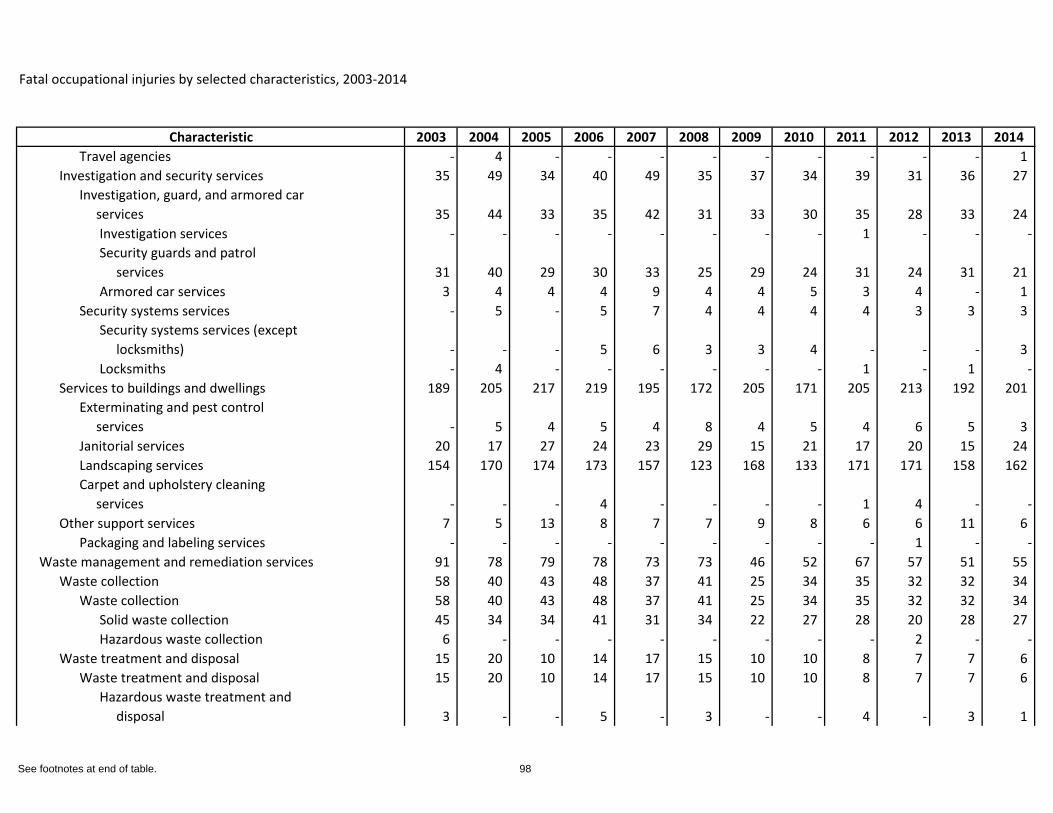
Fatal occupational injuries by selected characteristics, 2003-2014
Characteristic 2003 2004 2005 2006 2007 2008 2009 2010 2011 2012 2013 2014Travel agencies - 4 - - - - - - - - - 1
Investigation and security services 35 49 34 40 49 35 37 34 39 31 36 27 Investigation, guard, and armored car services 35 44 33 35 42 31 33 30 35 28 33 24
Investigation services - - - - - - - - 1 - - -Security guards and patrol services 31 40 29 30 33 25 29 24 31 24 31 21 Armored car services 3 4 4 4 9 4 4 5 3 4 - 1
Security systems services - 5 - 5 7 4 4 4 4 3 3 3 Security systems services (except locksmiths) - - - 5 6 3 3 4 - - - 3 Locksmiths - 4 - - - - - - 1 - 1 -
Services to buildings and dwellings 189 205 217 219 195 172 205 171 205 213 192 201 Exterminating and pest control services - 5 4 5 4 8 4 5 4 6 5 3 Janitorial services 20 17 27 24 23 29 15 21 17 20 15 24 Landscaping services 154 170 174 173 157 123 168 133 171 171 158 162 Carpet and upholstery cleaning services - - - 4 - - - - 1 4 - -
Other support services 7 5 13 8 7 7 9 8 6 6 11 6 Packaging and labeling services - - - - - - - - - 1 - -
Waste management and remediation services 91 78 79 78 73 73 46 52 67 57 51 55 Waste collection 58 40 43 48 37 41 25 34 35 32 32 34
Waste collection 58 40 43 48 37 41 25 34 35 32 32 34 Solid waste collection 45 34 34 41 31 34 22 27 28 20 28 27 Hazardous waste collection 6 - - - - - - - - 2 - -
Waste treatment and disposal 15 20 10 14 17 15 10 10 8 7 7 6 Waste treatment and disposal 15 20 10 14 17 15 10 10 8 7 7 6
Hazardous waste treatment and disposal 3 - - 5 - 3 - - 4 - 3 1
See footnotes at end of table. 98
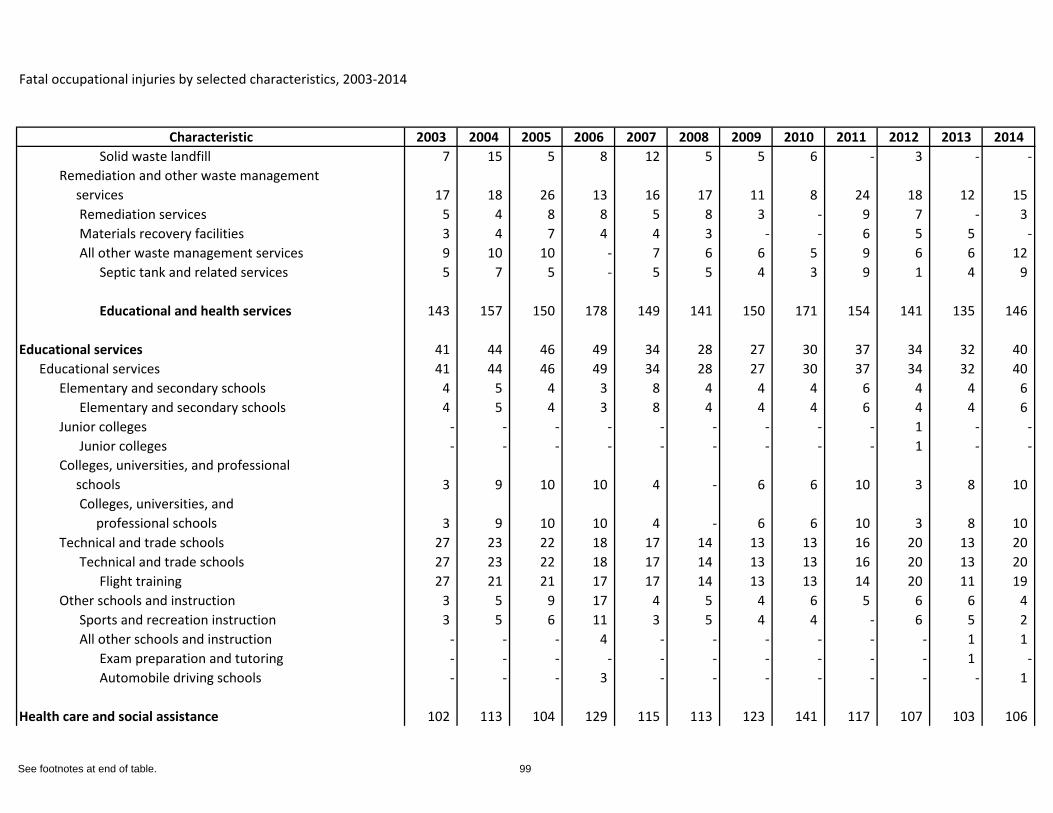
Fatal occupational injuries by selected characteristics, 2003-2014
Characteristic 2003 2004 2005 2006 2007 2008 2009 2010 2011 2012 2013 2014Solid waste landfill 7 15 5 8 12 5 5 6 - 3 - -
Remediation and other waste management services 17 18 26 13 16 17 11 8 24 18 12 15
Remediation services 5 4 8 8 5 8 3 - 9 7 - 3 Materials recovery facilities 3 4 7 4 4 3 - - 6 5 5 -All other waste management services 9 10 10 - 7 6 6 5 9 6 6 12
Septic tank and related services 5 7 5 - 5 5 4 3 9 1 4 9
Educational and health services 143 157 150 178 149 141 150 171 154 141 135 146
Educational services 41 44 46 49 34 28 27 30 37 34 32 40 Educational services 41 44 46 49 34 28 27 30 37 34 32 40
Elementary and secondary schools 4 5 4 3 8 4 4 4 6 4 4 6 Elementary and secondary schools 4 5 4 3 8 4 4 4 6 4 4 6
Junior colleges - - - - - - - - - 1 - -Junior colleges - - - - - - - - - 1 - -
Colleges, universities, and professional schools 3 9 10 10 4 - 6 6 10 3 8 10
Colleges, universities, and professional schools 3 9 10 10 4 - 6 6 10 3 8 10
Technical and trade schools 27 23 22 18 17 14 13 13 16 20 13 20 Technical and trade schools 27 23 22 18 17 14 13 13 16 20 13 20
Flight training 27 21 21 17 17 14 13 13 14 20 11 19 Other schools and instruction 3 5 9 17 4 5 4 6 5 6 6 4
Sports and recreation instruction 3 5 6 11 3 5 4 4 - 6 5 2 All other schools and instruction - - - 4 - - - - - - 1 1
Exam preparation and tutoring - - - - - - - - - - 1 -Automobile driving schools - - - 3 - - - - - - - 1
Health care and social assistance 102 113 104 129 115 113 123 141 117 107 103 106
See footnotes at end of table. 99
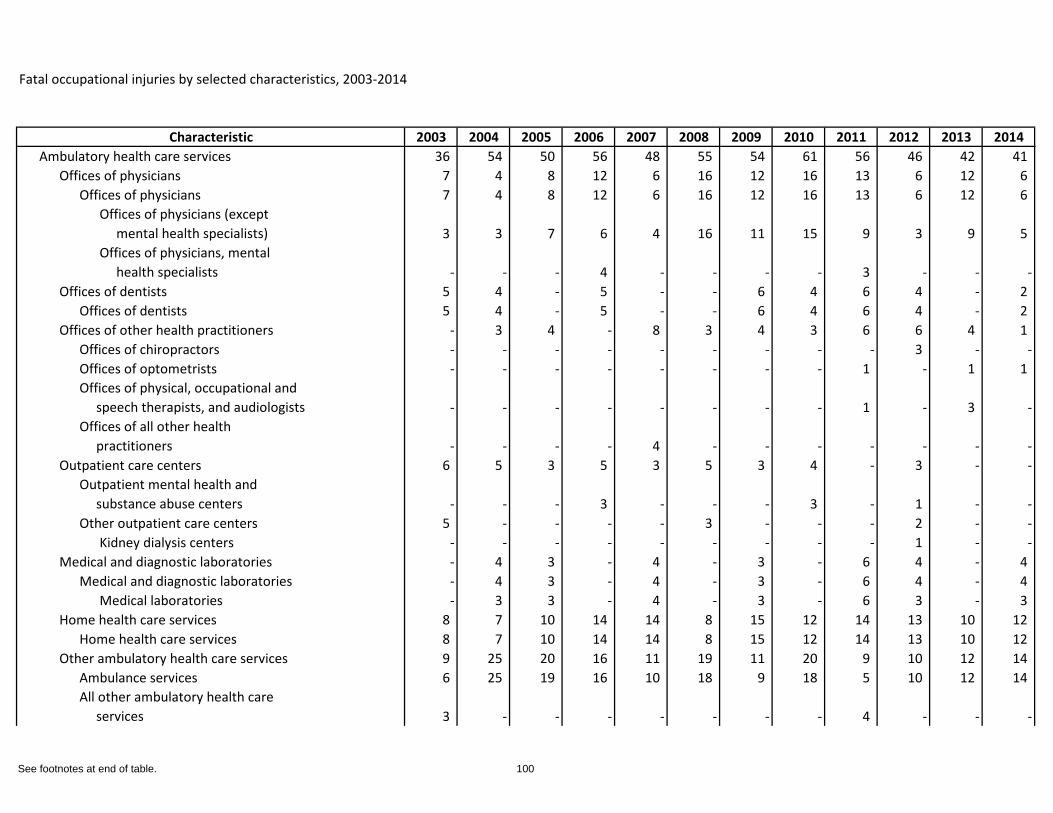
Fatal occupational injuries by selected characteristics, 2003-2014
Characteristic 2003 2004 2005 2006 2007 2008 2009 2010 2011 2012 2013 2014Ambulatory health care services 36 54 50 56 48 55 54 61 56 46 42 41
Offices of physicians 7 4 8 12 6 16 12 16 13 6 12 6 Offices of physicians 7 4 8 12 6 16 12 16 13 6 12 6
Offices of physicians (except mental health specialists) 3 3 7 6 4 16 11 15 9 3 9 5 Offices of physicians, mental health specialists - - - 4 - - - - 3 - - -
Offices of dentists 5 4 - 5 - - 6 4 6 4 - 2 Offices of dentists 5 4 - 5 - - 6 4 6 4 - 2
Offices of other health practitioners - 3 4 - 8 3 4 3 6 6 4 1 Offices of chiropractors - - - - - - - - - 3 - -Offices of optometrists - - - - - - - - 1 - 1 1 Offices of physical, occupational and speech therapists, and audiologists - - - - - - - - 1 - 3 -Offices of all other health practitioners - - - - 4 - - - - - - -
Outpatient care centers 6 5 3 5 3 5 3 4 - 3 - -Outpatient mental health and substance abuse centers - - - 3 - - - 3 - 1 - -Other outpatient care centers 5 - - - - 3 - - - 2 - -
Kidney dialysis centers - - - - - - - - - 1 - -Medical and diagnostic laboratories - 4 3 - 4 - 3 - 6 4 - 4
Medical and diagnostic laboratories - 4 3 - 4 - 3 - 6 4 - 4 Medical laboratories - 3 3 - 4 - 3 - 6 3 - 3
Home health care services 8 7 10 14 14 8 15 12 14 13 10 12 Home health care services 8 7 10 14 14 8 15 12 14 13 10 12
Other ambulatory health care services 9 25 20 16 11 19 11 20 9 10 12 14 Ambulance services 6 25 19 16 10 18 9 18 5 10 12 14 All other ambulatory health care services 3 - - - - - - - 4 - - -
See footnotes at end of table. 100
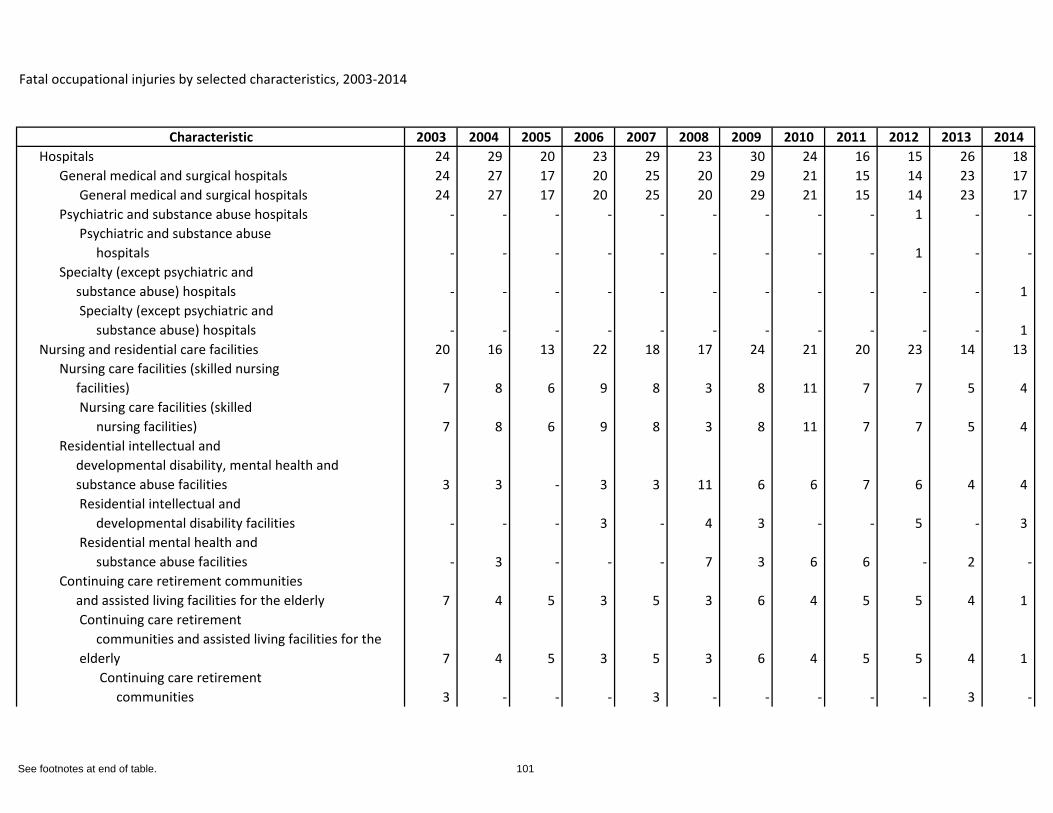
Fatal occupational injuries by selected characteristics, 2003-2014
Characteristic 2003 2004 2005 2006 2007 2008 2009 2010 2011 2012 2013 2014Hospitals 24 29 20 23 29 23 30 24 16 15 26 18
General medical and surgical hospitals 24 27 17 20 25 20 29 21 15 14 23 17 General medical and surgical hospitals 24 27 17 20 25 20 29 21 15 14 23 17
Psychiatric and substance abuse hospitals - - - - - - - - - 1 - -Psychiatric and substance abuse hospitals - - - - - - - - - 1 - -
Specialty (except psychiatric and substance abuse) hospitals - - - - - - - - - - - 1
Specialty (except psychiatric and substance abuse) hospitals - - - - - - - - - - - 1
Nursing and residential care facilities 20 16 13 22 18 17 24 21 20 23 14 13 Nursing care facilities (skilled nursing facilities) 7 8 6 9 8 3 8 11 7 7 5 4
Nursing care facilities (skilled nursing facilities) 7 8 6 9 8 3 8 11 7 7 5 4
Residential intellectual and developmental disability, mental health and substance abuse facilities 3 3 - 3 3 11 6 6 7 6 4 4
Residential intellectual and developmental disability facilities - - - 3 - 4 3 - - 5 - 3 Residential mental health and substance abuse facilities - 3 - - - 7 3 6 6 - 2 -
Continuing care retirement communities and assisted living facilities for the elderly 7 4 5 3 5 3 6 4 5 5 4 1
Continuing care retirement communities and assisted living facilities for the elderly 7 4 5 3 5 3 6 4 5 5 4 1
Continuing care retirement communities 3 - - - 3 - - - - - 3 -
See footnotes at end of table. 101
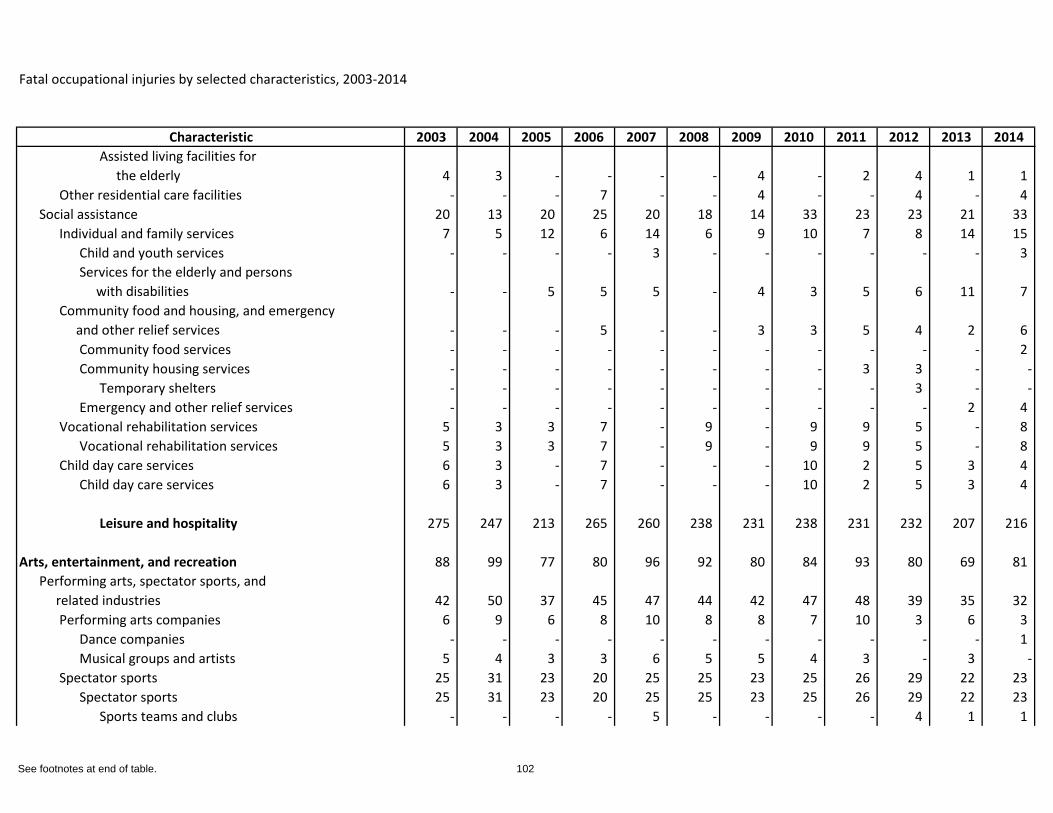
Fatal occupational injuries by selected characteristics, 2003-2014
Characteristic 2003 2004 2005 2006 2007 2008 2009 2010 2011 2012 2013 2014Assisted living facilities for the elderly 4 3 - - - - 4 - 2 4 1 1
Other residential care facilities - - - 7 - - 4 - - 4 - 4 Social assistance 20 13 20 25 20 18 14 33 23 23 21 33
Individual and family services 7 5 12 6 14 6 9 10 7 8 14 15 Child and youth services - - - - 3 - - - - - - 3 Services for the elderly and persons with disabilities - - 5 5 5 - 4 3 5 6 11 7
Community food and housing, and emergency and other relief services - - - 5 - - 3 3 5 4 2 6
Community food services - - - - - - - - - - - 2 Community housing services - - - - - - - - 3 3 - -
Temporary shelters - - - - - - - - - 3 - -Emergency and other relief services - - - - - - - - - - 2 4
Vocational rehabilitation services 5 3 3 7 - 9 - 9 9 5 - 8 Vocational rehabilitation services 5 3 3 7 - 9 - 9 9 5 - 8
Child day care services 6 3 - 7 - - - 10 2 5 3 4 Child day care services 6 3 - 7 - - - 10 2 5 3 4
Leisure and hospitality 275 247 213 265 260 238 231 238 231 232 207 216
Arts, entertainment, and recreation 88 99 77 80 96 92 80 84 93 80 69 81 Performing arts, spectator sports, and related industries 42 50 37 45 47 44 42 47 48 39 35 32
Performing arts companies 6 9 6 8 10 8 8 7 10 3 6 3 Dance companies - - - - - - - - - - - 1 Musical groups and artists 5 4 3 3 6 5 5 4 3 - 3 -
Spectator sports 25 31 23 20 25 25 23 25 26 29 22 23 Spectator sports 25 31 23 20 25 25 23 25 26 29 22 23
Sports teams and clubs - - - - 5 - - - - 4 1 1
See footnotes at end of table. 102
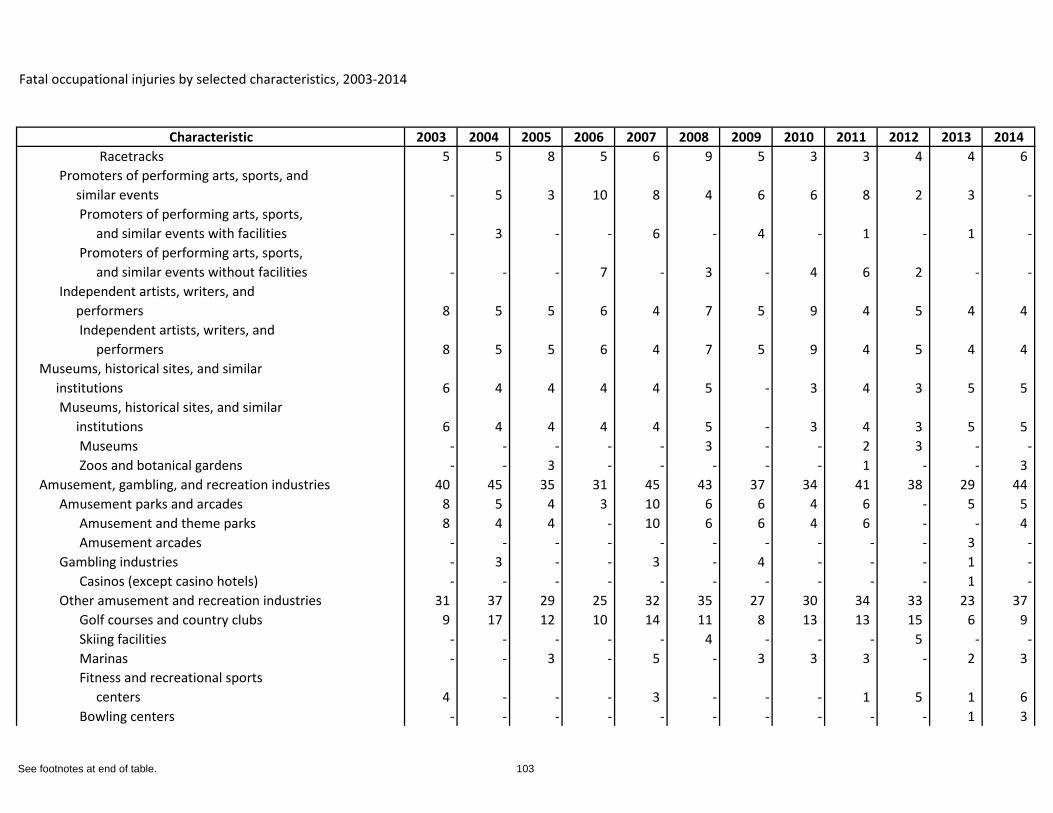
Fatal occupational injuries by selected characteristics, 2003-2014
Characteristic 2003 2004 2005 2006 2007 2008 2009 2010 2011 2012 2013 2014Racetracks 5 5 8 5 6 9 5 3 3 4 4 6
Promoters of performing arts, sports, and similar events - 5 3 10 8 4 6 6 8 2 3 -
Promoters of performing arts, sports, and similar events with facilities - 3 - - 6 - 4 - 1 - 1 -Promoters of performing arts, sports, and similar events without facilities - - - 7 - 3 - 4 6 2 - -
Independent artists, writers, and performers 8 5 5 6 4 7 5 9 4 5 4 4
Independent artists, writers, and performers 8 5 5 6 4 7 5 9 4 5 4 4
Museums, historical sites, and similar institutions 6 4 4 4 4 5 - 3 4 3 5 5
Museums, historical sites, and similar institutions 6 4 4 4 4 5 - 3 4 3 5 5
Museums - - - - - 3 - - 2 3 - -Zoos and botanical gardens - - 3 - - - - - 1 - - 3
Amusement, gambling, and recreation industries 40 45 35 31 45 43 37 34 41 38 29 44 Amusement parks and arcades 8 5 4 3 10 6 6 4 6 - 5 5
Amusement and theme parks 8 4 4 - 10 6 6 4 6 - - 4 Amusement arcades - - - - - - - - - - 3 -
Gambling industries - 3 - - 3 - 4 - - - 1 -Casinos (except casino hotels) - - - - - - - - - - 1 -
Other amusement and recreation industries 31 37 29 25 32 35 27 30 34 33 23 37 Golf courses and country clubs 9 17 12 10 14 11 8 13 13 15 6 9 Skiing facilities - - - - - 4 - - - 5 - -Marinas - - 3 - 5 - 3 3 3 - 2 3 Fitness and recreational sports centers 4 - - - 3 - - - 1 5 1 6 Bowling centers - - - - - - - - - - 1 3
See footnotes at end of table. 103
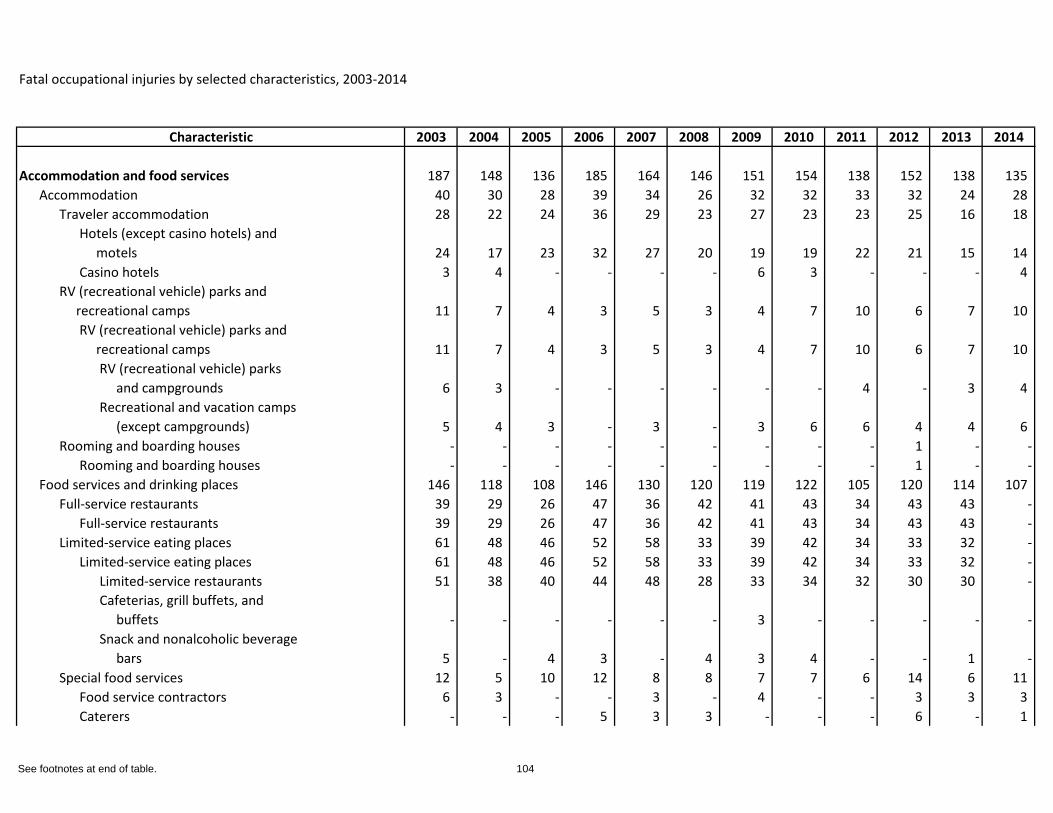
Fatal occupational injuries by selected characteristics, 2003-2014
Characteristic 2003 2004 2005 2006 2007 2008 2009 2010 2011 2012 2013 2014
Accommodation and food services 187 148 136 185 164 146 151 154 138 152 138 135 Accommodation 40 30 28 39 34 26 32 32 33 32 24 28
Traveler accommodation 28 22 24 36 29 23 27 23 23 25 16 18 Hotels (except casino hotels) and motels 24 17 23 32 27 20 19 19 22 21 15 14 Casino hotels 3 4 - - - - 6 3 - - - 4
RV (recreational vehicle) parks and recreational camps 11 7 4 3 5 3 4 7 10 6 7 10
RV (recreational vehicle) parks and recreational camps 11 7 4 3 5 3 4 7 10 6 7 10
RV (recreational vehicle) parks and campgrounds 6 3 - - - - - - 4 - 3 4 Recreational and vacation camps (except campgrounds) 5 4 3 - 3 - 3 6 6 4 4 6
Rooming and boarding houses - - - - - - - - - 1 - -Rooming and boarding houses - - - - - - - - - 1 - -
Food services and drinking places 146 118 108 146 130 120 119 122 105 120 114 107 Full-service restaurants 39 29 26 47 36 42 41 43 34 43 43 -
Full-service restaurants 39 29 26 47 36 42 41 43 34 43 43 -Limited-service eating places 61 48 46 52 58 33 39 42 34 33 32 -
Limited-service eating places 61 48 46 52 58 33 39 42 34 33 32 -Limited-service restaurants 51 38 40 44 48 28 33 34 32 30 30 -Cafeterias, grill buffets, and buffets - - - - - - 3 - - - - -Snack and nonalcoholic beverage bars 5 - 4 3 - 4 3 4 - - 1 -
Special food services 12 5 10 12 8 8 7 7 6 14 6 11 Food service contractors 6 3 - - 3 - 4 - - 3 3 3 Caterers - - - 5 3 3 - - - 6 - 1
See footnotes at end of table. 104
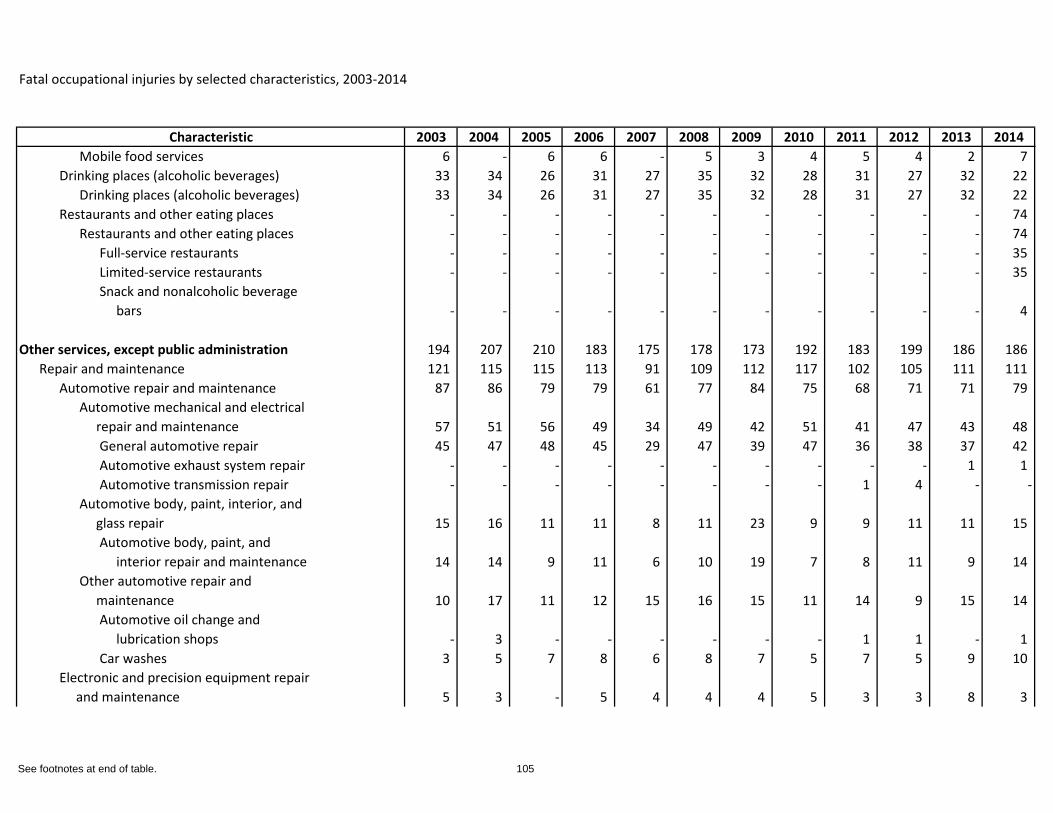
Fatal occupational injuries by selected characteristics, 2003-2014
Characteristic 2003 2004 2005 2006 2007 2008 2009 2010 2011 2012 2013 2014Mobile food services 6 - 6 6 - 5 3 4 5 4 2 7
Drinking places (alcoholic beverages) 33 34 26 31 27 35 32 28 31 27 32 22 Drinking places (alcoholic beverages) 33 34 26 31 27 35 32 28 31 27 32 22
Restaurants and other eating places - - - - - - - - - - - 74 Restaurants and other eating places - - - - - - - - - - - 74
Full-service restaurants - - - - - - - - - - - 35 Limited-service restaurants - - - - - - - - - - - 35 Snack and nonalcoholic beverage bars - - - - - - - - - - - 4
Other services, except public administration 194 207 210 183 175 178 173 192 183 199 186 186 Repair and maintenance 121 115 115 113 91 109 112 117 102 105 111 111
Automotive repair and maintenance 87 86 79 79 61 77 84 75 68 71 71 79 Automotive mechanical and electrical repair and maintenance 57 51 56 49 34 49 42 51 41 47 43 48
General automotive repair 45 47 48 45 29 47 39 47 36 38 37 42 Automotive exhaust system repair - - - - - - - - - - 1 1 Automotive transmission repair - - - - - - - - 1 4 - -
Automotive body, paint, interior, and glass repair 15 16 11 11 8 11 23 9 9 11 11 15
Automotive body, paint, and interior repair and maintenance 14 14 9 11 6 10 19 7 8 11 9 14
Other automotive repair and maintenance 10 17 11 12 15 16 15 11 14 9 15 14
Automotive oil change and lubrication shops - 3 - - - - - - 1 1 - 1 Car washes 3 5 7 8 6 8 7 5 7 5 9 10
Electronic and precision equipment repair and maintenance 5 3 - 5 4 4 4 5 3 3 8 3
See footnotes at end of table. 105
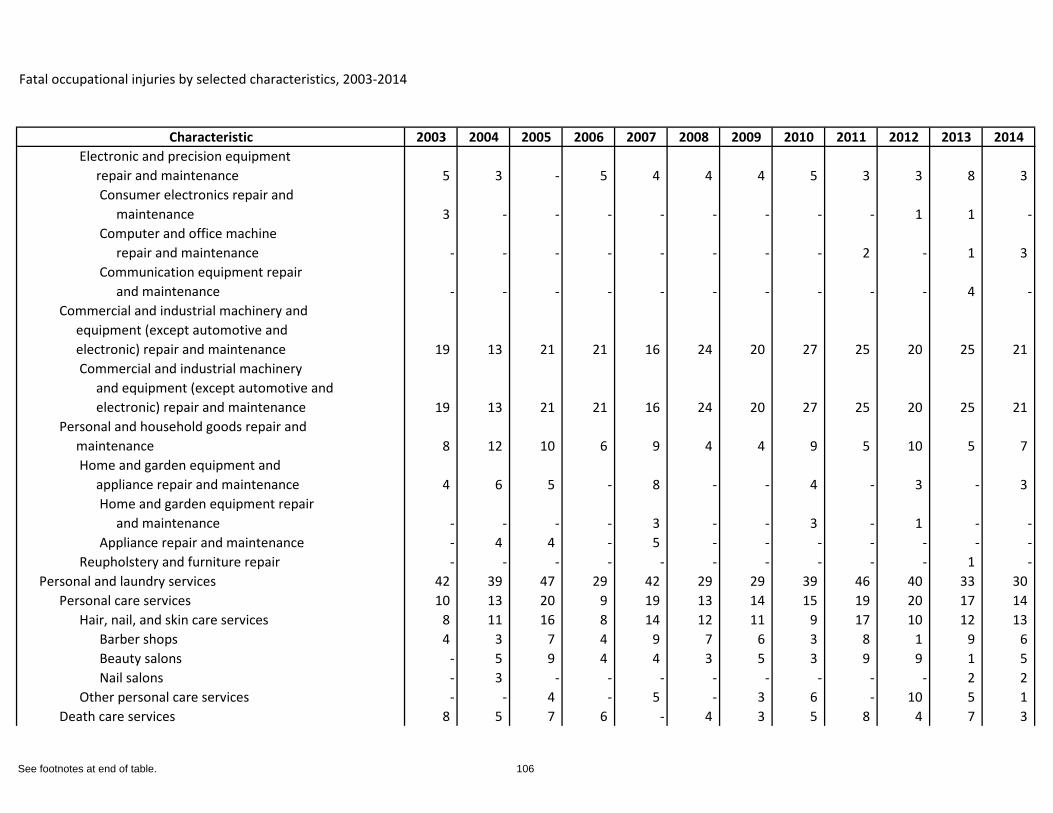
Fatal occupational injuries by selected characteristics, 2003-2014
Characteristic 2003 2004 2005 2006 2007 2008 2009 2010 2011 2012 2013 2014Electronic and precision equipment repair and maintenance 5 3 - 5 4 4 4 5 3 3 8 3
Consumer electronics repair and maintenance 3 - - - - - - - - 1 1 -Computer and office machine repair and maintenance - - - - - - - - 2 - 1 3 Communication equipment repair and maintenance - - - - - - - - - - 4 -
Commercial and industrial machinery and equipment (except automotive and electronic) repair and maintenance 19 13 21 21 16 24 20 27 25 20 25 21
Commercial and industrial machinery and equipment (except automotive and electronic) repair and maintenance 19 13 21 21 16 24 20 27 25 20 25 21
Personal and household goods repair and maintenance 8 12 10 6 9 4 4 9 5 10 5 7
Home and garden equipment and appliance repair and maintenance 4 6 5 - 8 - - 4 - 3 - 3
Home and garden equipment repair and maintenance - - - - 3 - - 3 - 1 - -Appliance repair and maintenance - 4 4 - 5 - - - - - - -
Reupholstery and furniture repair - - - - - - - - - - 1 -Personal and laundry services 42 39 47 29 42 29 29 39 46 40 33 30
Personal care services 10 13 20 9 19 13 14 15 19 20 17 14 Hair, nail, and skin care services 8 11 16 8 14 12 11 9 17 10 12 13
Barber shops 4 3 7 4 9 7 6 3 8 1 9 6 Beauty salons - 5 9 4 4 3 5 3 9 9 1 5 Nail salons - 3 - - - - - - - - 2 2
Other personal care services - - 4 - 5 - 3 6 - 10 5 1 Death care services 8 5 7 6 - 4 3 5 8 4 7 3
See footnotes at end of table. 106
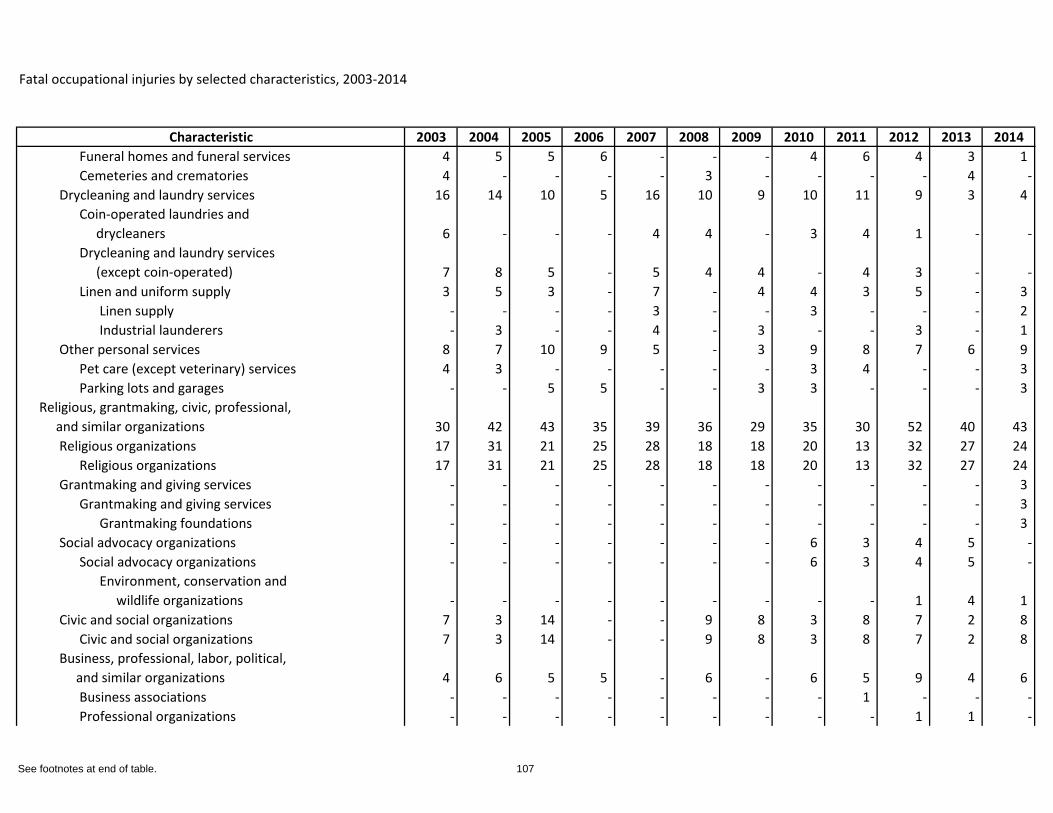
Fatal occupational injuries by selected characteristics, 2003-2014
Characteristic 2003 2004 2005 2006 2007 2008 2009 2010 2011 2012 2013 2014Funeral homes and funeral services 4 5 5 6 - - - 4 6 4 3 1 Cemeteries and crematories 4 - - - - 3 - - - - 4 -
Drycleaning and laundry services 16 14 10 5 16 10 9 10 11 9 3 4 Coin-operated laundries and drycleaners 6 - - - 4 4 - 3 4 1 - -Drycleaning and laundry services (except coin-operated) 7 8 5 - 5 4 4 - 4 3 - -Linen and uniform supply 3 5 3 - 7 - 4 4 3 5 - 3
Linen supply - - - - 3 - - 3 - - - 2 Industrial launderers - 3 - - 4 - 3 - - 3 - 1
Other personal services 8 7 10 9 5 - 3 9 8 7 6 9 Pet care (except veterinary) services 4 3 - - - - - 3 4 - - 3 Parking lots and garages - - 5 5 - - 3 3 - - - 3
Religious, grantmaking, civic, professional, and similar organizations 30 42 43 35 39 36 29 35 30 52 40 43
Religious organizations 17 31 21 25 28 18 18 20 13 32 27 24 Religious organizations 17 31 21 25 28 18 18 20 13 32 27 24
Grantmaking and giving services - - - - - - - - - - - 3 Grantmaking and giving services - - - - - - - - - - - 3
Grantmaking foundations - - - - - - - - - - - 3 Social advocacy organizations - - - - - - - 6 3 4 5 -
Social advocacy organizations - - - - - - - 6 3 4 5 -Environment, conservation and wildlife organizations - - - - - - - - - 1 4 1
Civic and social organizations 7 3 14 - - 9 8 3 8 7 2 8 Civic and social organizations 7 3 14 - - 9 8 3 8 7 2 8
Business, professional, labor, political, and similar organizations 4 6 5 5 - 6 - 6 5 9 4 6
Business associations - - - - - - - - 1 - - -Professional organizations - - - - - - - - - 1 1 -
See footnotes at end of table. 107
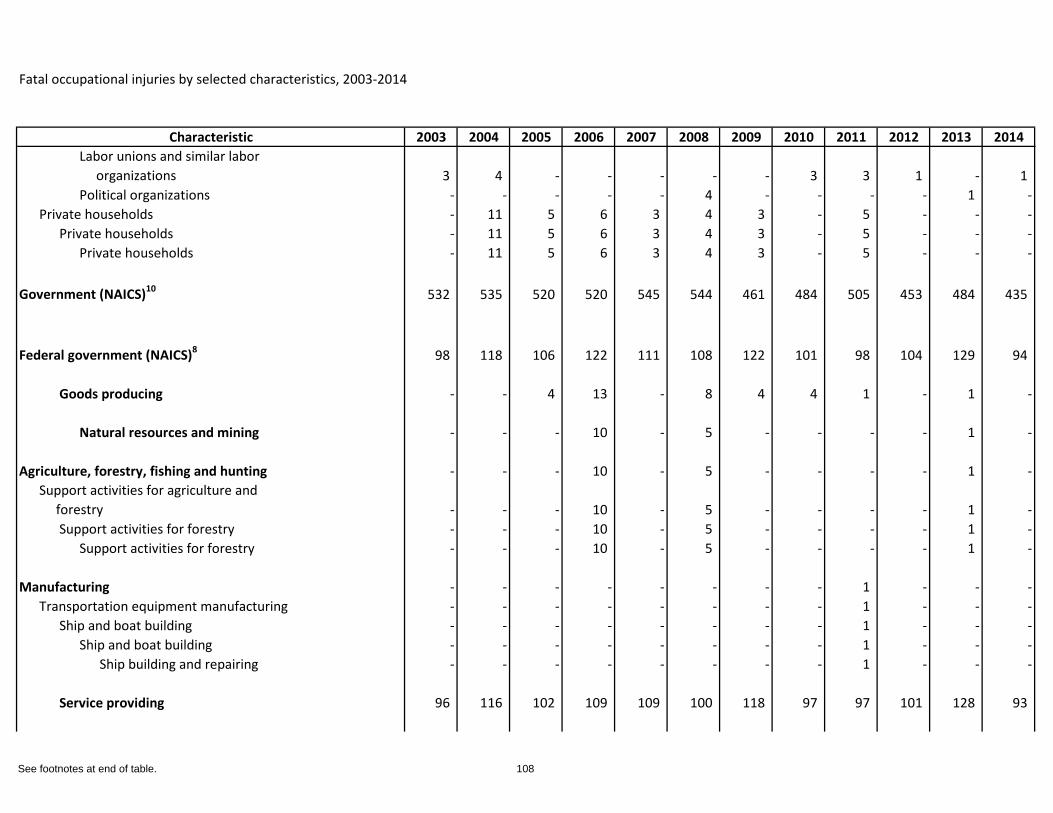
Fatal occupational injuries by selected characteristics, 2003-2014
Characteristic 2003 2004 2005 2006 2007 2008 2009 2010 2011 2012 2013 2014Labor unions and similar labor organizations 3 4 - - - - - 3 3 1 - 1 Political organizations - - - - - 4 - - - - 1 -
Private households - 11 5 6 3 4 3 - 5 - - -Private households - 11 5 6 3 4 3 - 5 - - -
Private households - 11 5 6 3 4 3 - 5 - - -
Government (NAICS)10 532 535 520 520 545 544 461 484 505 453 484 435
Federal government (NAICS)8 98 118 106 122 111 108 122 101 98 104 129 94
Goods producing - - 4 13 - 8 4 4 1 - 1 -
Natural resources and mining - - - 10 - 5 - - - - 1 -
Agriculture, forestry, fishing and hunting - - - 10 - 5 - - - - 1 -Support activities for agriculture and forestry - - - 10 - 5 - - - - 1 -
Support activities for forestry - - - 10 - 5 - - - - 1 -Support activities for forestry - - - 10 - 5 - - - - 1 -
Manufacturing - - - - - - - - 1 - - -Transportation equipment manufacturing - - - - - - - - 1 - - -
Ship and boat building - - - - - - - - 1 - - -Ship and boat building - - - - - - - - 1 - - -
Ship building and repairing - - - - - - - - 1 - - -
Service providing 96 116 102 109 109 100 118 97 97 101 128 93
See footnotes at end of table. 108
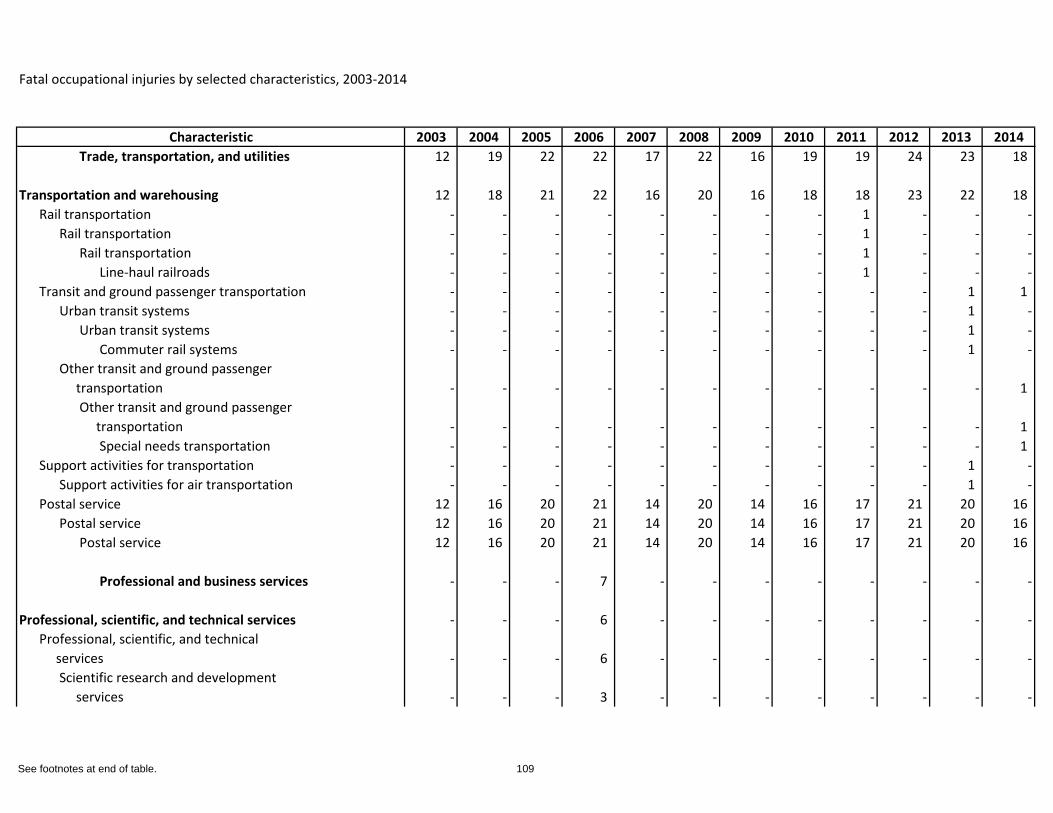
Fatal occupational injuries by selected characteristics, 2003-2014
Characteristic 2003 2004 2005 2006 2007 2008 2009 2010 2011 2012 2013 2014Trade, transportation, and utilities 12 19 22 22 17 22 16 19 19 24 23 18
Transportation and warehousing 12 18 21 22 16 20 16 18 18 23 22 18 Rail transportation - - - - - - - - 1 - - -
Rail transportation - - - - - - - - 1 - - -Rail transportation - - - - - - - - 1 - - -
Line-haul railroads - - - - - - - - 1 - - -Transit and ground passenger transportation - - - - - - - - - - 1 1
Urban transit systems - - - - - - - - - - 1 -Urban transit systems - - - - - - - - - - 1 -
Commuter rail systems - - - - - - - - - - 1 -Other transit and ground passenger transportation - - - - - - - - - - - 1
Other transit and ground passenger transportation - - - - - - - - - - - 1
Special needs transportation - - - - - - - - - - - 1 Support activities for transportation - - - - - - - - - - 1 -
Support activities for air transportation - - - - - - - - - - 1 -Postal service 12 16 20 21 14 20 14 16 17 21 20 16
Postal service 12 16 20 21 14 20 14 16 17 21 20 16 Postal service 12 16 20 21 14 20 14 16 17 21 20 16
Professional and business services - - - 7 - - - - - - - -
Professional, scientific, and technical services - - - 6 - - - - - - - -Professional, scientific, and technical services - - - 6 - - - - - - - -
Scientific research and development services - - - 3 - - - - - - - -
See footnotes at end of table. 109
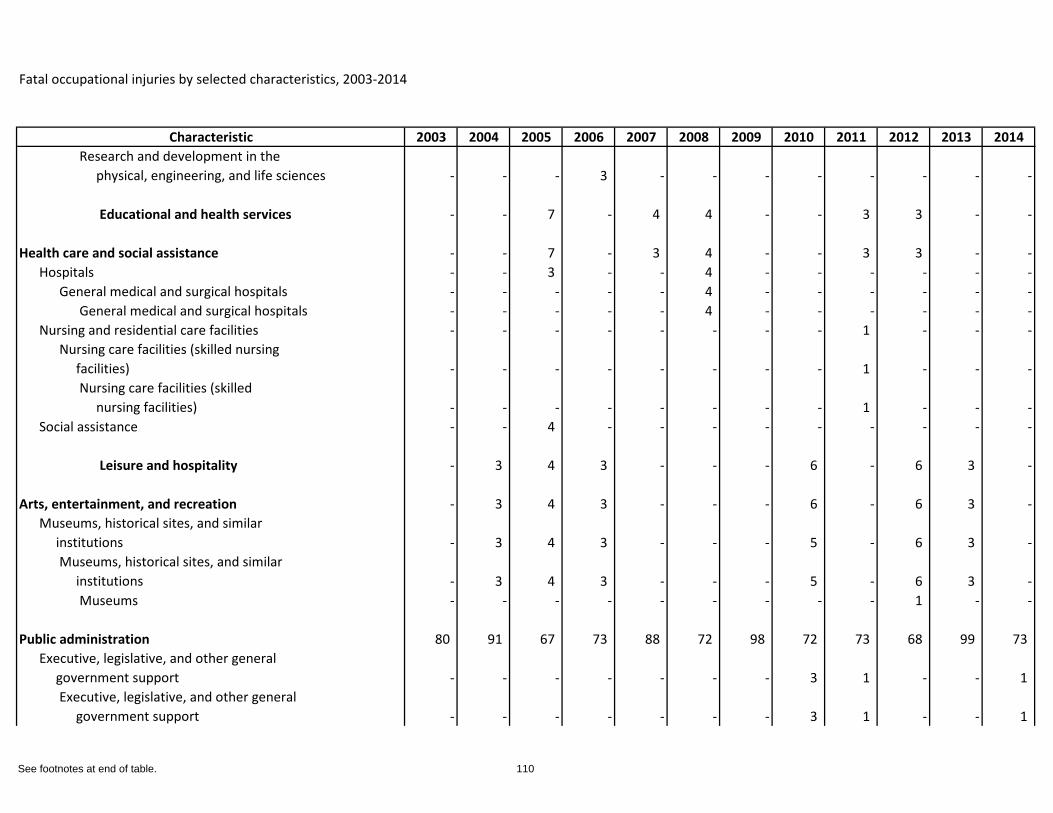
Fatal occupational injuries by selected characteristics, 2003-2014
Characteristic 2003 2004 2005 2006 2007 2008 2009 2010 2011 2012 2013 2014Research and development in the physical, engineering, and life sciences - - - 3 - - - - - - - -
Educational and health services - - 7 - 4 4 - - 3 3 - -
Health care and social assistance - - 7 - 3 4 - - 3 3 - -Hospitals - - 3 - - 4 - - - - - -
General medical and surgical hospitals - - - - - 4 - - - - - -General medical and surgical hospitals - - - - - 4 - - - - - -
Nursing and residential care facilities - - - - - - - - 1 - - -Nursing care facilities (skilled nursing facilities) - - - - - - - - 1 - - -
Nursing care facilities (skilled nursing facilities) - - - - - - - - 1 - - -
Social assistance - - 4 - - - - - - - - -
Leisure and hospitality - 3 4 3 - - - 6 - 6 3 -
Arts, entertainment, and recreation - 3 4 3 - - - 6 - 6 3 -Museums, historical sites, and similar institutions - 3 4 3 - - - 5 - 6 3 -
Museums, historical sites, and similar institutions - 3 4 3 - - - 5 - 6 3 -
Museums - - - - - - - - - 1 - -
Public administration 80 91 67 73 88 72 98 72 73 68 99 73 Executive, legislative, and other general government support - - - - - - - 3 1 - - 1
Executive, legislative, and other general government support - - - - - - - 3 1 - - 1
See footnotes at end of table. 110
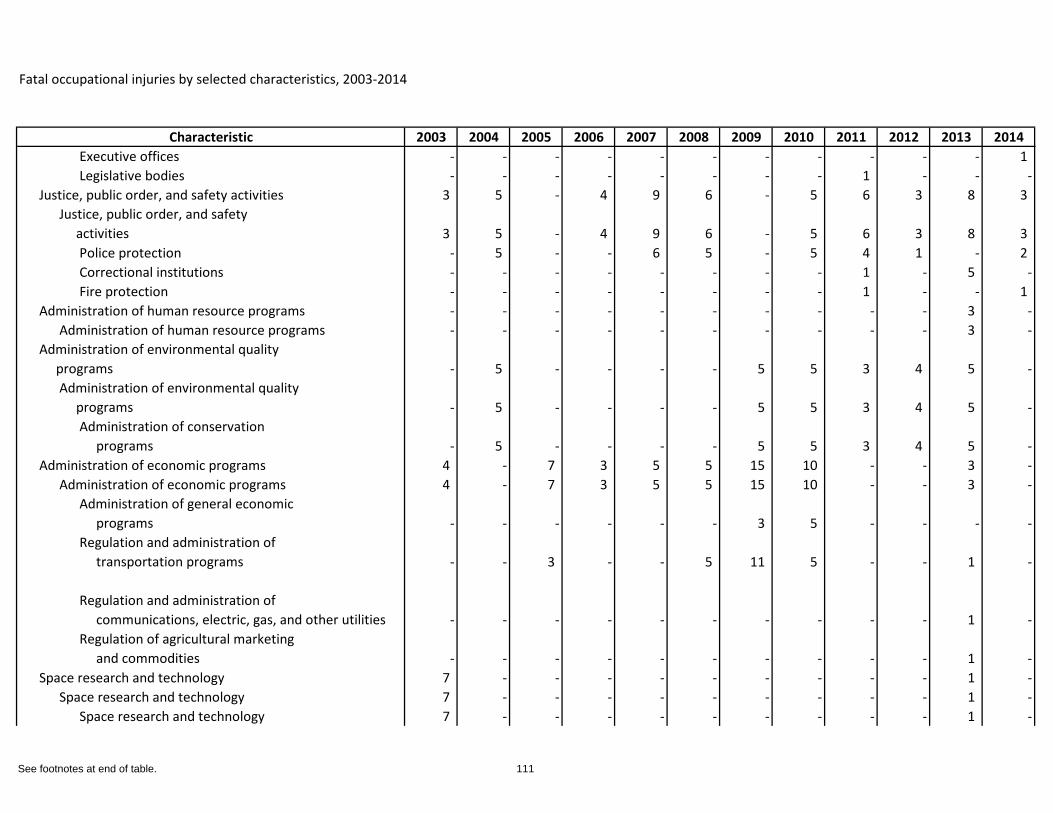
Fatal occupational injuries by selected characteristics, 2003-2014
Characteristic 2003 2004 2005 2006 2007 2008 2009 2010 2011 2012 2013 2014Executive offices - - - - - - - - - - - 1 Legislative bodies - - - - - - - - 1 - - -
Justice, public order, and safety activities 3 5 - 4 9 6 - 5 6 3 8 3 Justice, public order, and safety activities 3 5 - 4 9 6 - 5 6 3 8 3
Police protection - 5 - - 6 5 - 5 4 1 - 2 Correctional institutions - - - - - - - - 1 - 5 -Fire protection - - - - - - - - 1 - - 1
Administration of human resource programs - - - - - - - - - - 3 -Administration of human resource programs - - - - - - - - - - 3 -
Administration of environmental quality programs - 5 - - - - 5 5 3 4 5 -
Administration of environmental quality programs - 5 - - - - 5 5 3 4 5 -
Administration of conservation programs - 5 - - - - 5 5 3 4 5 -
Administration of economic programs 4 - 7 3 5 5 15 10 - - 3 -Administration of economic programs 4 - 7 3 5 5 15 10 - - 3 -
Administration of general economic programs - - - - - - 3 5 - - - -Regulation and administration of transportation programs - - 3 - - 5 11 5 - - 1 -
Regulation and administration of communications, electric, gas, and other utilities - - - - - - - - - - 1 -Regulation of agricultural marketing and commodities - - - - - - - - - - 1 -
Space research and technology 7 - - - - - - - - - 1 -Space research and technology 7 - - - - - - - - - 1 -
Space research and technology 7 - - - - - - - - - 1 -
See footnotes at end of table. 111
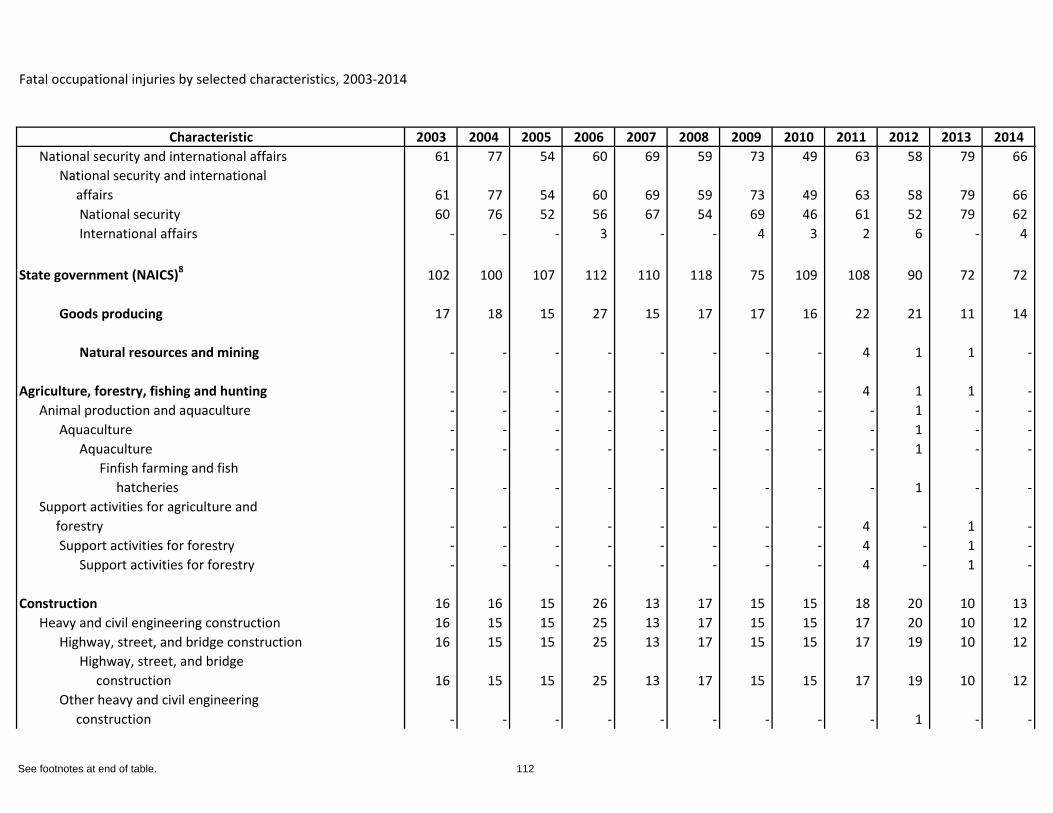
Fatal occupational injuries by selected characteristics, 2003-2014
Characteristic 2003 2004 2005 2006 2007 2008 2009 2010 2011 2012 2013 2014National security and international affairs 61 77 54 60 69 59 73 49 63 58 79 66
National security and international affairs 61 77 54 60 69 59 73 49 63 58 79 66
National security 60 76 52 56 67 54 69 46 61 52 79 62 International affairs - - - 3 - - 4 3 2 6 - 4
State government (NAICS)8 102 100 107 112 110 118 75 109 108 90 72 72
Goods producing 17 18 15 27 15 17 17 16 22 21 11 14
Natural resources and mining - - - - - - - - 4 1 1 -
Agriculture, forestry, fishing and hunting - - - - - - - - 4 1 1 -Animal production and aquaculture - - - - - - - - - 1 - -
Aquaculture - - - - - - - - - 1 - -Aquaculture - - - - - - - - - 1 - -
Finfish farming and fish hatcheries - - - - - - - - - 1 - -
Support activities for agriculture and forestry - - - - - - - - 4 - 1 -
Support activities for forestry - - - - - - - - 4 - 1 -Support activities for forestry - - - - - - - - 4 - 1 -
Construction 16 16 15 26 13 17 15 15 18 20 10 13 Heavy and civil engineering construction 16 15 15 25 13 17 15 15 17 20 10 12
Highway, street, and bridge construction 16 15 15 25 13 17 15 15 17 19 10 12 Highway, street, and bridge construction 16 15 15 25 13 17 15 15 17 19 10 12
Other heavy and civil engineering construction - - - - - - - - - 1 - -
See footnotes at end of table. 112
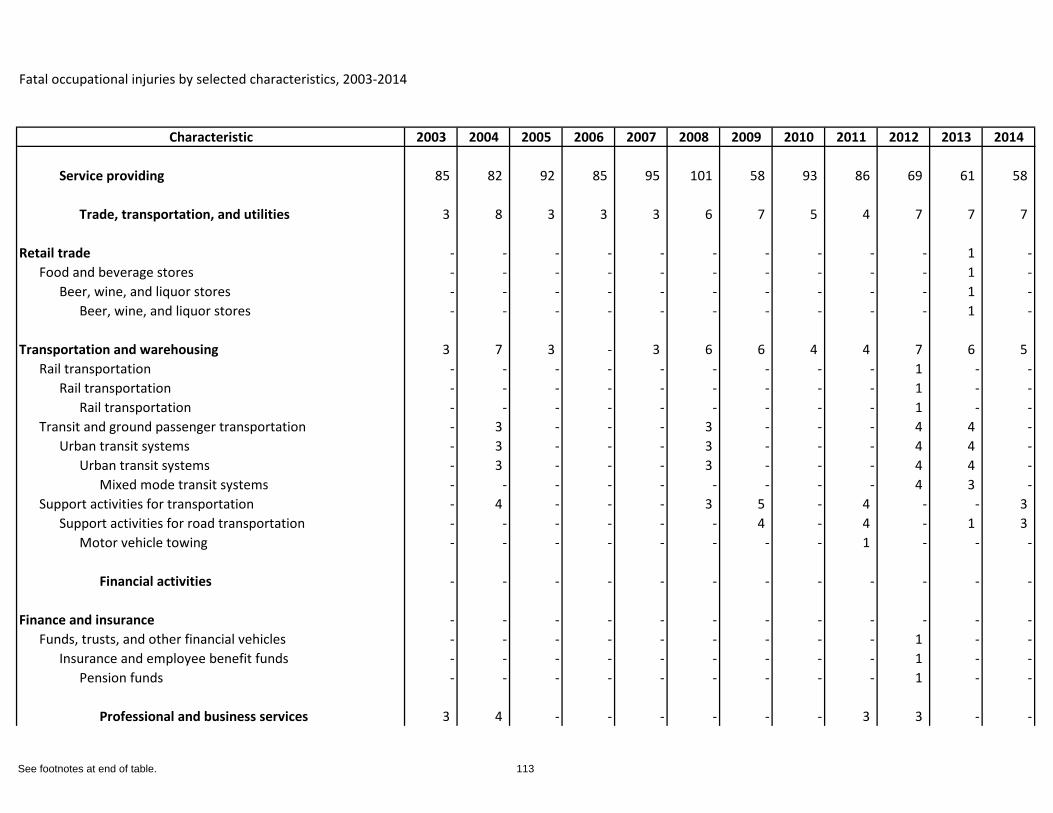
Fatal occupational injuries by selected characteristics, 2003-2014
Characteristic 2003 2004 2005 2006 2007 2008 2009 2010 2011 2012 2013 2014
Service providing 85 82 92 85 95 101 58 93 86 69 61 58
Trade, transportation, and utilities 3 8 3 3 3 6 7 5 4 7 7 7
Retail trade - - - - - - - - - - 1 -Food and beverage stores - - - - - - - - - - 1 -
Beer, wine, and liquor stores - - - - - - - - - - 1 -Beer, wine, and liquor stores - - - - - - - - - - 1 -
Transportation and warehousing 3 7 3 - 3 6 6 4 4 7 6 5 Rail transportation - - - - - - - - - 1 - -
Rail transportation - - - - - - - - - 1 - -Rail transportation - - - - - - - - - 1 - -
Transit and ground passenger transportation - 3 - - - 3 - - - 4 4 -Urban transit systems - 3 - - - 3 - - - 4 4 -
Urban transit systems - 3 - - - 3 - - - 4 4 -Mixed mode transit systems - - - - - - - - - 4 3 -
Support activities for transportation - 4 - - - 3 5 - 4 - - 3 Support activities for road transportation - - - - - - 4 - 4 - 1 3
Motor vehicle towing - - - - - - - - 1 - - -
Financial activities - - - - - - - - - - - -
Finance and insurance - - - - - - - - - - - -Funds, trusts, and other financial vehicles - - - - - - - - - 1 - -
Insurance and employee benefit funds - - - - - - - - - 1 - -Pension funds - - - - - - - - - 1 - -
Professional and business services 3 4 - - - - - - 3 3 - -
See footnotes at end of table. 113
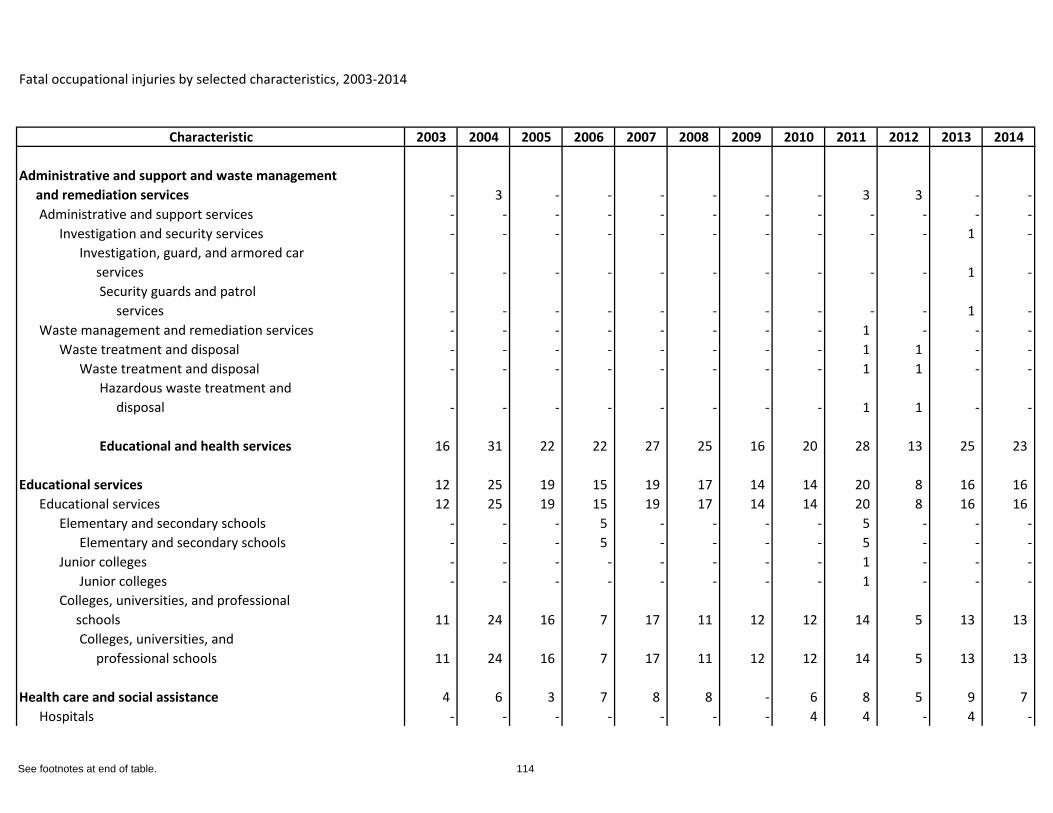
Fatal occupational injuries by selected characteristics, 2003-2014
Characteristic 2003 2004 2005 2006 2007 2008 2009 2010 2011 2012 2013 2014
Administrative and support and waste management and remediation services - 3 - - - - - - 3 3 - -
Administrative and support services - - - - - - - - - - - -Investigation and security services - - - - - - - - - - 1 -
Investigation, guard, and armored car services - - - - - - - - - - 1 -
Security guards and patrol services - - - - - - - - - - 1 -
Waste management and remediation services - - - - - - - - 1 - - -Waste treatment and disposal - - - - - - - - 1 1 - -
Waste treatment and disposal - - - - - - - - 1 1 - -Hazardous waste treatment and disposal - - - - - - - - 1 1 - -
Educational and health services 16 31 22 22 27 25 16 20 28 13 25 23
Educational services 12 25 19 15 19 17 14 14 20 8 16 16 Educational services 12 25 19 15 19 17 14 14 20 8 16 16
Elementary and secondary schools - - - 5 - - - - 5 - - -Elementary and secondary schools - - - 5 - - - - 5 - - -
Junior colleges - - - - - - - - 1 - - -Junior colleges - - - - - - - - 1 - - -
Colleges, universities, and professional schools 11 24 16 7 17 11 12 12 14 5 13 13
Colleges, universities, and professional schools 11 24 16 7 17 11 12 12 14 5 13 13
Health care and social assistance 4 6 3 7 8 8 - 6 8 5 9 7 Hospitals - - - - - - - 4 4 - 4 -
See footnotes at end of table. 114
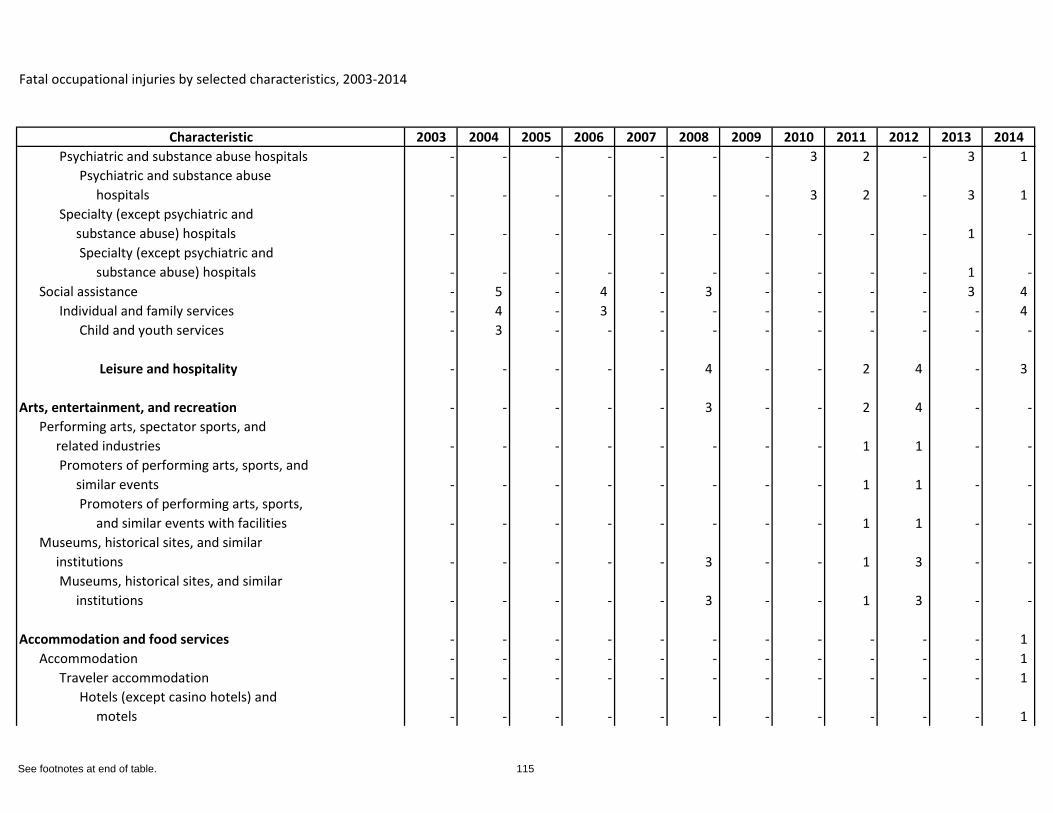
Fatal occupational injuries by selected characteristics, 2003-2014
Characteristic 2003 2004 2005 2006 2007 2008 2009 2010 2011 2012 2013 2014Psychiatric and substance abuse hospitals - - - - - - - 3 2 - 3 1
Psychiatric and substance abuse hospitals - - - - - - - 3 2 - 3 1
Specialty (except psychiatric and substance abuse) hospitals - - - - - - - - - - 1 -
Specialty (except psychiatric and substance abuse) hospitals - - - - - - - - - - 1 -
Social assistance - 5 - 4 - 3 - - - - 3 4 Individual and family services - 4 - 3 - - - - - - - 4
Child and youth services - 3 - - - - - - - - - -
Leisure and hospitality - - - - - 4 - - 2 4 - 3
Arts, entertainment, and recreation - - - - - 3 - - 2 4 - -Performing arts, spectator sports, and related industries - - - - - - - - 1 1 - -
Promoters of performing arts, sports, and similar events - - - - - - - - 1 1 - -
Promoters of performing arts, sports, and similar events with facilities - - - - - - - - 1 1 - -
Museums, historical sites, and similar institutions - - - - - 3 - - 1 3 - -
Museums, historical sites, and similar institutions - - - - - 3 - - 1 3 - -
Accommodation and food services - - - - - - - - - - - 1 Accommodation - - - - - - - - - - - 1
Traveler accommodation - - - - - - - - - - - 1 Hotels (except casino hotels) and motels - - - - - - - - - - - 1
See footnotes at end of table. 115
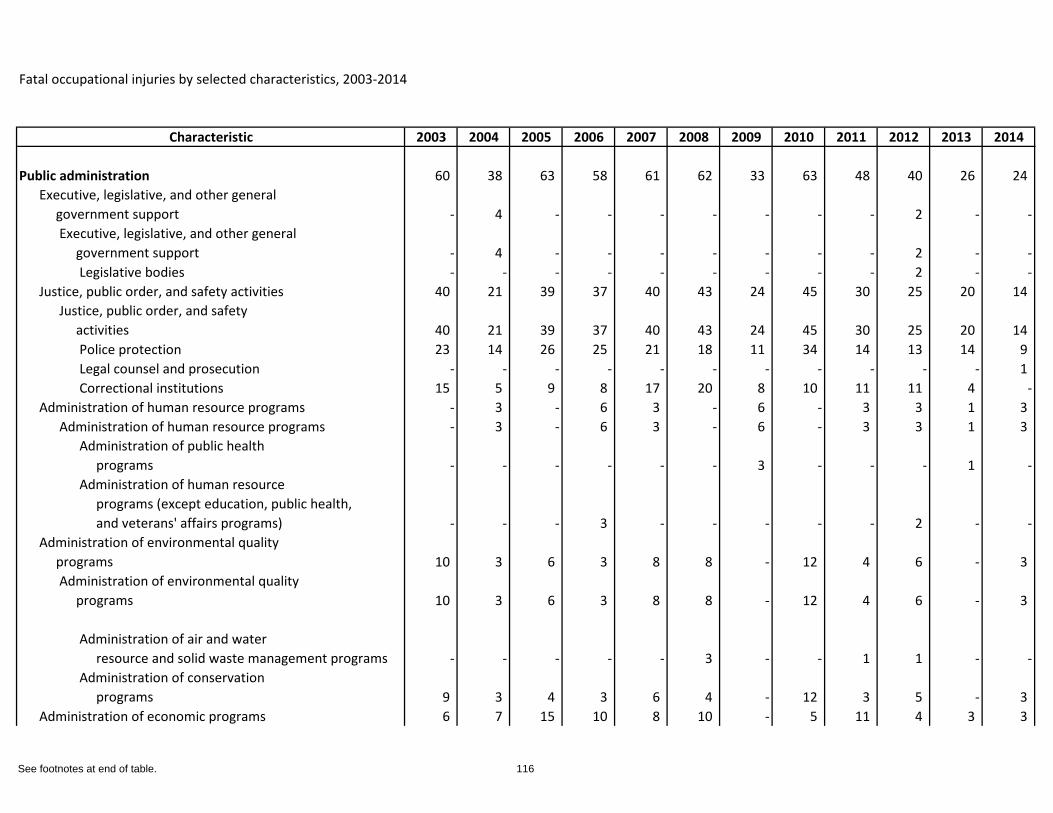
Fatal occupational injuries by selected characteristics, 2003-2014
Characteristic 2003 2004 2005 2006 2007 2008 2009 2010 2011 2012 2013 2014
Public administration 60 38 63 58 61 62 33 63 48 40 26 24 Executive, legislative, and other general government support - 4 - - - - - - - 2 - -
Executive, legislative, and other general government support - 4 - - - - - - - 2 - -
Legislative bodies - - - - - - - - - 2 - -Justice, public order, and safety activities 40 21 39 37 40 43 24 45 30 25 20 14
Justice, public order, and safety activities 40 21 39 37 40 43 24 45 30 25 20 14
Police protection 23 14 26 25 21 18 11 34 14 13 14 9 Legal counsel and prosecution - - - - - - - - - - - 1 Correctional institutions 15 5 9 8 17 20 8 10 11 11 4 -
Administration of human resource programs - 3 - 6 3 - 6 - 3 3 1 3 Administration of human resource programs - 3 - 6 3 - 6 - 3 3 1 3
Administration of public health programs - - - - - - 3 - - - 1 -Administration of human resource programs (except education, public health, and veterans' affairs programs) - - - 3 - - - - - 2 - -
Administration of environmental quality programs 10 3 6 3 8 8 - 12 4 6 - 3
Administration of environmental quality programs 10 3 6 3 8 8 - 12 4 6 - 3
Administration of air and water resource and solid waste management programs - - - - - 3 - - 1 1 - -Administration of conservation programs 9 3 4 3 6 4 - 12 3 5 - 3
Administration of economic programs 6 7 15 10 8 10 - 5 11 4 3 3
See footnotes at end of table. 116
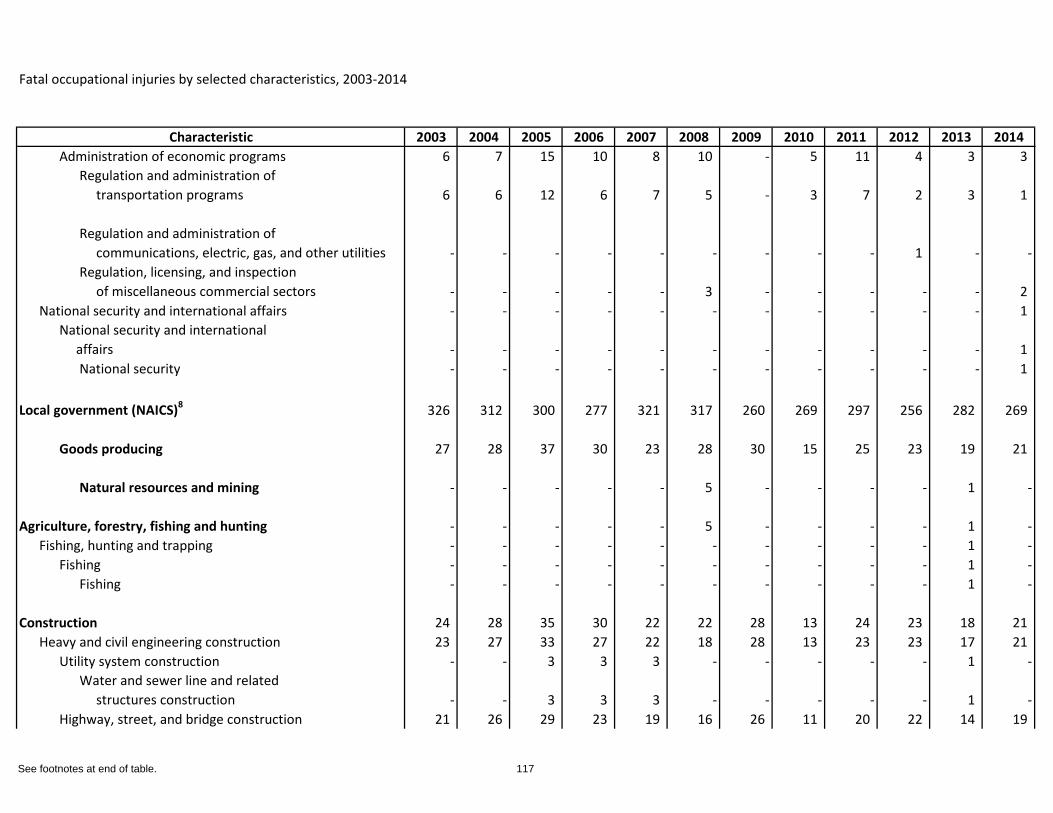
Fatal occupational injuries by selected characteristics, 2003-2014
Characteristic 2003 2004 2005 2006 2007 2008 2009 2010 2011 2012 2013 2014Administration of economic programs 6 7 15 10 8 10 - 5 11 4 3 3
Regulation and administration of transportation programs 6 6 12 6 7 5 - 3 7 2 3 1
Regulation and administration of communications, electric, gas, and other utilities - - - - - - - - - 1 - -Regulation, licensing, and inspection of miscellaneous commercial sectors - - - - - 3 - - - - - 2
National security and international affairs - - - - - - - - - - - 1 National security and international affairs - - - - - - - - - - - 1
National security - - - - - - - - - - - 1
Local government (NAICS)8 326 312 300 277 321 317 260 269 297 256 282 269
Goods producing 27 28 37 30 23 28 30 15 25 23 19 21
Natural resources and mining - - - - - 5 - - - - 1 -
Agriculture, forestry, fishing and hunting - - - - - 5 - - - - 1 -Fishing, hunting and trapping - - - - - - - - - - 1 -
Fishing - - - - - - - - - - 1 -Fishing - - - - - - - - - - 1 -
Construction 24 28 35 30 22 22 28 13 24 23 18 21 Heavy and civil engineering construction 23 27 33 27 22 18 28 13 23 23 17 21
Utility system construction - - 3 3 3 - - - - - 1 -Water and sewer line and related structures construction - - 3 3 3 - - - - - 1 -
Highway, street, and bridge construction 21 26 29 23 19 16 26 11 20 22 14 19
See footnotes at end of table. 117
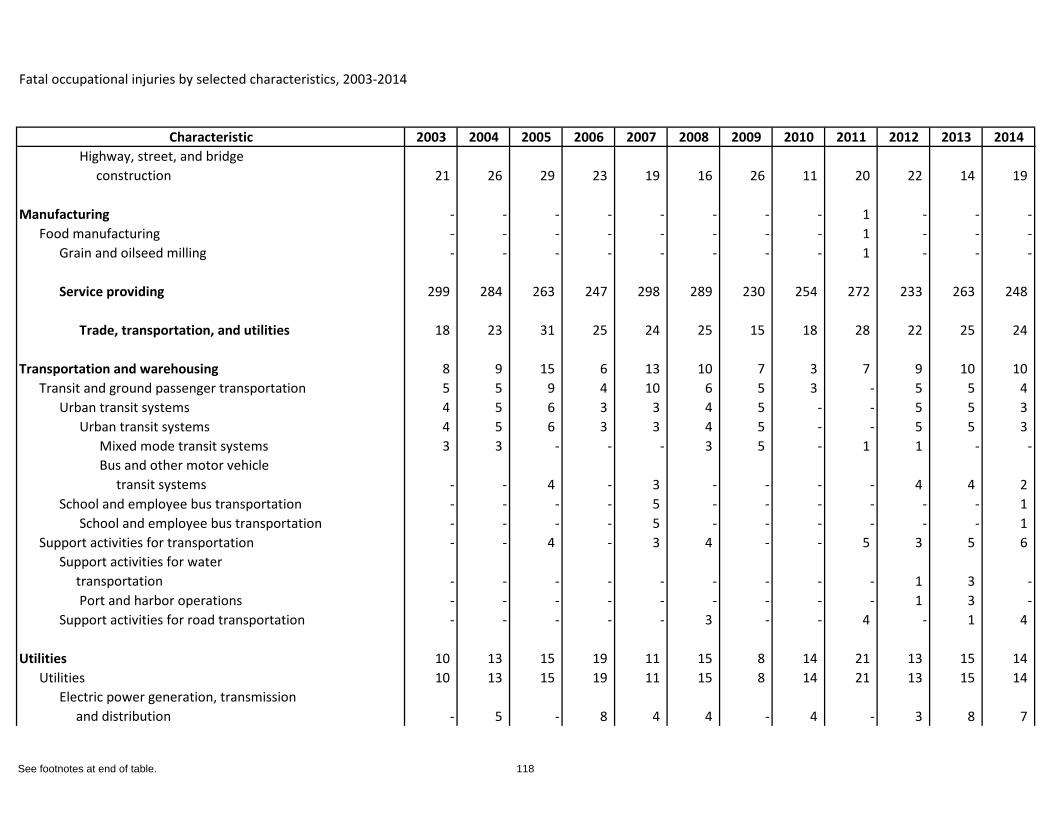
Fatal occupational injuries by selected characteristics, 2003-2014
Characteristic 2003 2004 2005 2006 2007 2008 2009 2010 2011 2012 2013 2014Highway, street, and bridge construction 21 26 29 23 19 16 26 11 20 22 14 19
Manufacturing - - - - - - - - 1 - - -Food manufacturing - - - - - - - - 1 - - -
Grain and oilseed milling - - - - - - - - 1 - - -
Service providing 299 284 263 247 298 289 230 254 272 233 263 248
Trade, transportation, and utilities 18 23 31 25 24 25 15 18 28 22 25 24
Transportation and warehousing 8 9 15 6 13 10 7 3 7 9 10 10 Transit and ground passenger transportation 5 5 9 4 10 6 5 3 - 5 5 4
Urban transit systems 4 5 6 3 3 4 5 - - 5 5 3 Urban transit systems 4 5 6 3 3 4 5 - - 5 5 3
Mixed mode transit systems 3 3 - - - 3 5 - 1 1 - -Bus and other motor vehicle transit systems - - 4 - 3 - - - - 4 4 2
School and employee bus transportation - - - - 5 - - - - - - 1 School and employee bus transportation - - - - 5 - - - - - - 1
Support activities for transportation - - 4 - 3 4 - - 5 3 5 6 Support activities for water transportation - - - - - - - - - 1 3 -
Port and harbor operations - - - - - - - - - 1 3 -Support activities for road transportation - - - - - 3 - - 4 - 1 4
Utilities 10 13 15 19 11 15 8 14 21 13 15 14 Utilities 10 13 15 19 11 15 8 14 21 13 15 14
Electric power generation, transmission and distribution - 5 - 8 4 4 - 4 - 3 8 7
See footnotes at end of table. 118
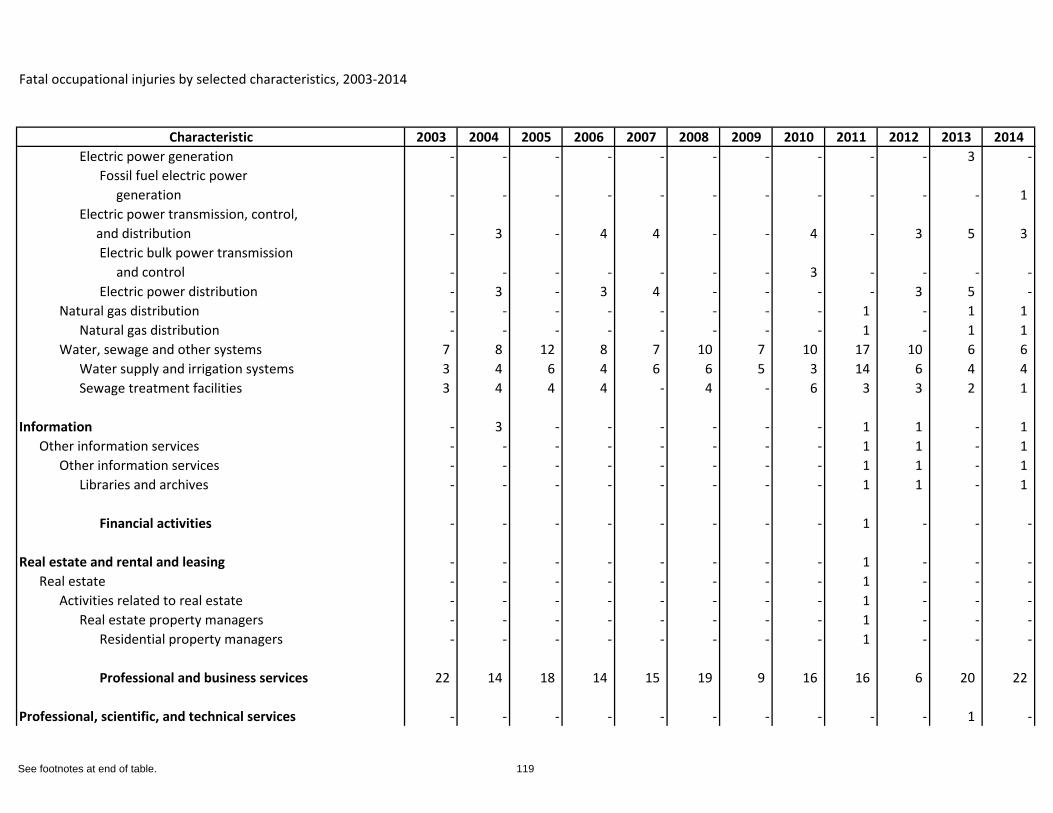
Fatal occupational injuries by selected characteristics, 2003-2014
Characteristic 2003 2004 2005 2006 2007 2008 2009 2010 2011 2012 2013 2014Electric power generation - - - - - - - - - - 3 -
Fossil fuel electric power generation - - - - - - - - - - - 1
Electric power transmission, control, and distribution - 3 - 4 4 - - 4 - 3 5 3
Electric bulk power transmission and control - - - - - - - 3 - - - -Electric power distribution - 3 - 3 4 - - - - 3 5 -
Natural gas distribution - - - - - - - - 1 - 1 1 Natural gas distribution - - - - - - - - 1 - 1 1
Water, sewage and other systems 7 8 12 8 7 10 7 10 17 10 6 6 Water supply and irrigation systems 3 4 6 4 6 6 5 3 14 6 4 4 Sewage treatment facilities 3 4 4 4 - 4 - 6 3 3 2 1
Information - 3 - - - - - - 1 1 - 1 Other information services - - - - - - - - 1 1 - 1
Other information services - - - - - - - - 1 1 - 1 Libraries and archives - - - - - - - - 1 1 - 1
Financial activities - - - - - - - - 1 - - -
Real estate and rental and leasing - - - - - - - - 1 - - -Real estate - - - - - - - - 1 - - -
Activities related to real estate - - - - - - - - 1 - - -Real estate property managers - - - - - - - - 1 - - -
Residential property managers - - - - - - - - 1 - - -
Professional and business services 22 14 18 14 15 19 9 16 16 6 20 22
Professional, scientific, and technical services - - - - - - - - - - 1 -
See footnotes at end of table. 119
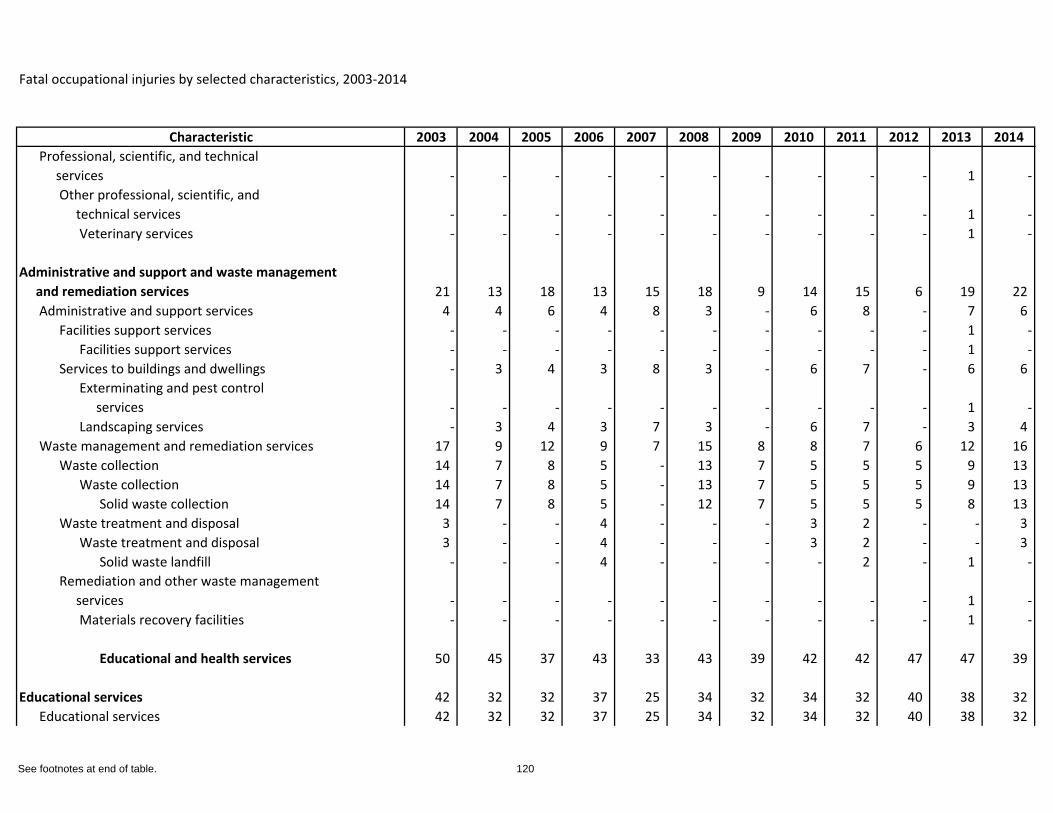
Fatal occupational injuries by selected characteristics, 2003-2014
Characteristic 2003 2004 2005 2006 2007 2008 2009 2010 2011 2012 2013 2014Professional, scientific, and technical services - - - - - - - - - - 1 -
Other professional, scientific, and technical services - - - - - - - - - - 1 -
Veterinary services - - - - - - - - - - 1 -
Administrative and support and waste management and remediation services 21 13 18 13 15 18 9 14 15 6 19 22
Administrative and support services 4 4 6 4 8 3 - 6 8 - 7 6 Facilities support services - - - - - - - - - - 1 -
Facilities support services - - - - - - - - - - 1 -Services to buildings and dwellings - 3 4 3 8 3 - 6 7 - 6 6
Exterminating and pest control services - - - - - - - - - - 1 -Landscaping services - 3 4 3 7 3 - 6 7 - 3 4
Waste management and remediation services 17 9 12 9 7 15 8 8 7 6 12 16 Waste collection 14 7 8 5 - 13 7 5 5 5 9 13
Waste collection 14 7 8 5 - 13 7 5 5 5 9 13 Solid waste collection 14 7 8 5 - 12 7 5 5 5 8 13
Waste treatment and disposal 3 - - 4 - - - 3 2 - - 3 Waste treatment and disposal 3 - - 4 - - - 3 2 - - 3
Solid waste landfill - - - 4 - - - - 2 - 1 -Remediation and other waste management services - - - - - - - - - - 1 -
Materials recovery facilities - - - - - - - - - - 1 -
Educational and health services 50 45 37 43 33 43 39 42 42 47 47 39
Educational services 42 32 32 37 25 34 32 34 32 40 38 32 Educational services 42 32 32 37 25 34 32 34 32 40 38 32
See footnotes at end of table. 120
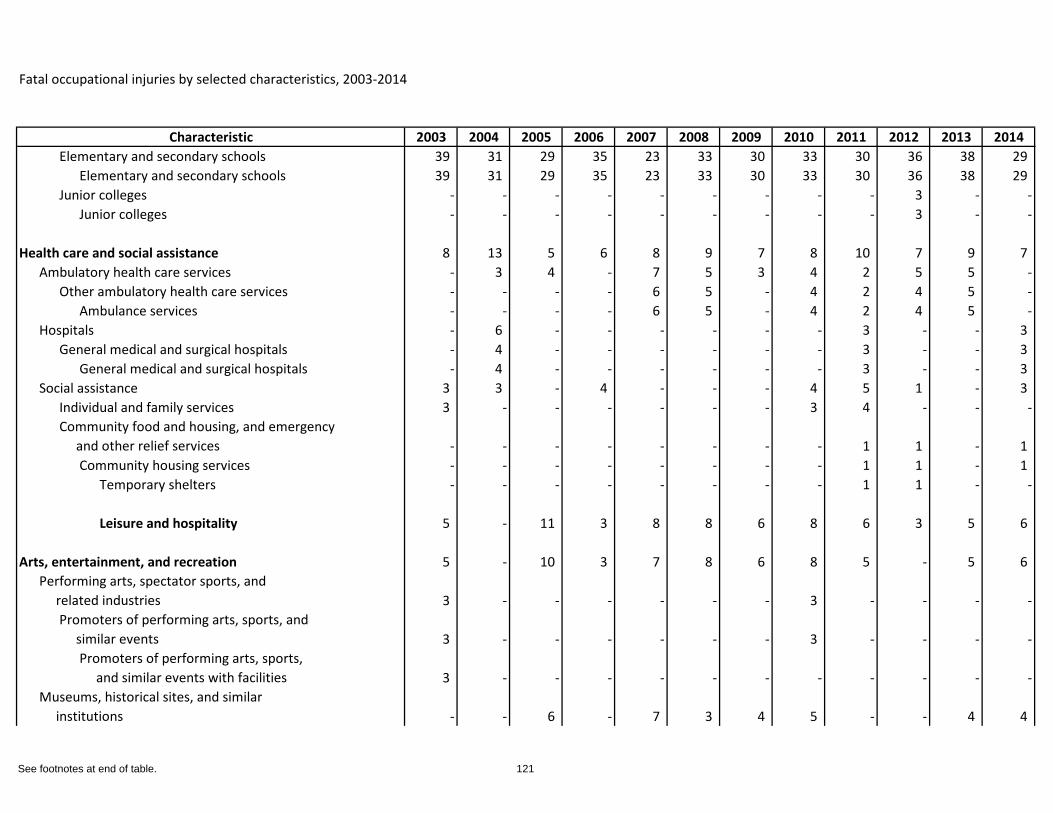
Fatal occupational injuries by selected characteristics, 2003-2014
Characteristic 2003 2004 2005 2006 2007 2008 2009 2010 2011 2012 2013 2014Elementary and secondary schools 39 31 29 35 23 33 30 33 30 36 38 29
Elementary and secondary schools 39 31 29 35 23 33 30 33 30 36 38 29 Junior colleges - - - - - - - - - 3 - -
Junior colleges - - - - - - - - - 3 - -
Health care and social assistance 8 13 5 6 8 9 7 8 10 7 9 7 Ambulatory health care services - 3 4 - 7 5 3 4 2 5 5 -
Other ambulatory health care services - - - - 6 5 - 4 2 4 5 -Ambulance services - - - - 6 5 - 4 2 4 5 -
Hospitals - 6 - - - - - - 3 - - 3 General medical and surgical hospitals - 4 - - - - - - 3 - - 3
General medical and surgical hospitals - 4 - - - - - - 3 - - 3 Social assistance 3 3 - 4 - - - 4 5 1 - 3
Individual and family services 3 - - - - - - 3 4 - - -Community food and housing, and emergency and other relief services - - - - - - - - 1 1 - 1
Community housing services - - - - - - - - 1 1 - 1 Temporary shelters - - - - - - - - 1 1 - -
Leisure and hospitality 5 - 11 3 8 8 6 8 6 3 5 6
Arts, entertainment, and recreation 5 - 10 3 7 8 6 8 5 - 5 6 Performing arts, spectator sports, and related industries 3 - - - - - - 3 - - - -
Promoters of performing arts, sports, and similar events 3 - - - - - - 3 - - - -
Promoters of performing arts, sports, and similar events with facilities 3 - - - - - - - - - - -
Museums, historical sites, and similar institutions - - 6 - 7 3 4 5 - - 4 4
See footnotes at end of table. 121
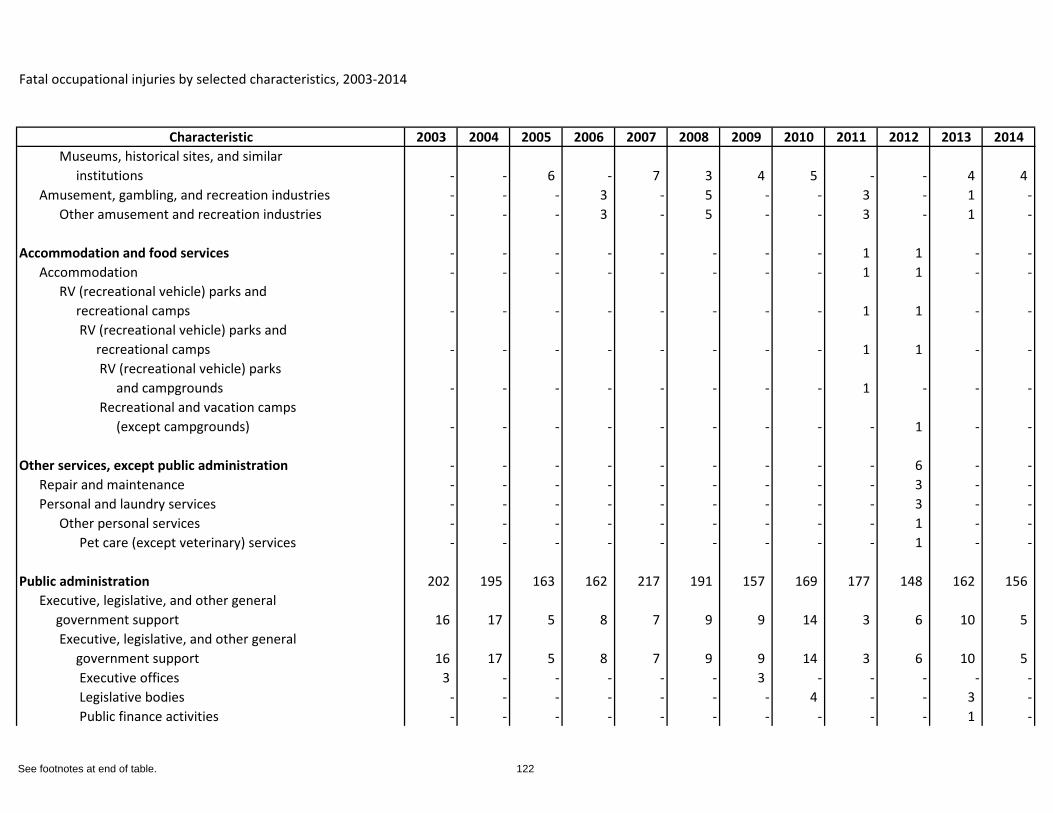
Fatal occupational injuries by selected characteristics, 2003-2014
Characteristic 2003 2004 2005 2006 2007 2008 2009 2010 2011 2012 2013 2014Museums, historical sites, and similar institutions - - 6 - 7 3 4 5 - - 4 4
Amusement, gambling, and recreation industries - - - 3 - 5 - - 3 - 1 -Other amusement and recreation industries - - - 3 - 5 - - 3 - 1 -
Accommodation and food services - - - - - - - - 1 1 - -Accommodation - - - - - - - - 1 1 - -
RV (recreational vehicle) parks and recreational camps - - - - - - - - 1 1 - -
RV (recreational vehicle) parks and recreational camps - - - - - - - - 1 1 - -
RV (recreational vehicle) parks and campgrounds - - - - - - - - 1 - - -Recreational and vacation camps (except campgrounds) - - - - - - - - - 1 - -
Other services, except public administration - - - - - - - - - 6 - -Repair and maintenance - - - - - - - - - 3 - -Personal and laundry services - - - - - - - - - 3 - -
Other personal services - - - - - - - - - 1 - -Pet care (except veterinary) services - - - - - - - - - 1 - -
Public administration 202 195 163 162 217 191 157 169 177 148 162 156 Executive, legislative, and other general government support 16 17 5 8 7 9 9 14 3 6 10 5
Executive, legislative, and other general government support 16 17 5 8 7 9 9 14 3 6 10 5
Executive offices 3 - - - - - 3 - - - - -Legislative bodies - - - - - - - 4 - - 3 -Public finance activities - - - - - - - - - - 1 -
See footnotes at end of table. 122
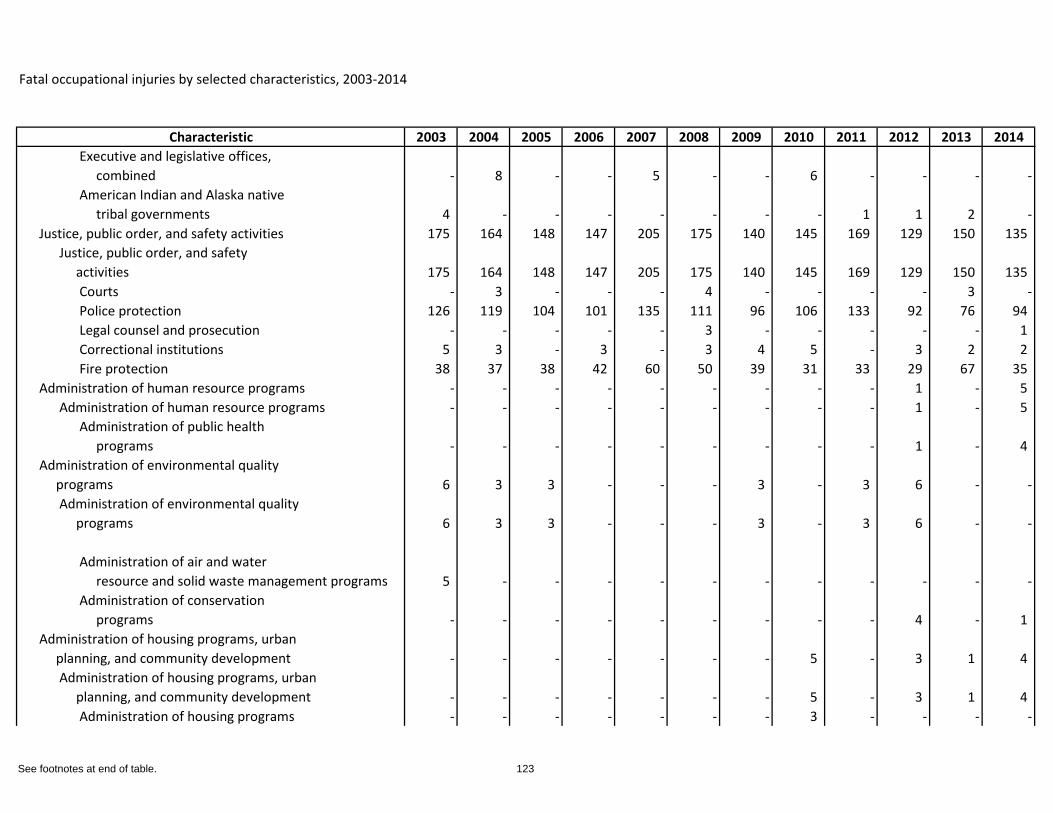
Fatal occupational injuries by selected characteristics, 2003-2014
Characteristic 2003 2004 2005 2006 2007 2008 2009 2010 2011 2012 2013 2014Executive and legislative offices, combined - 8 - - 5 - - 6 - - - -American Indian and Alaska native tribal governments 4 - - - - - - - 1 1 2 -
Justice, public order, and safety activities 175 164 148 147 205 175 140 145 169 129 150 135 Justice, public order, and safety activities 175 164 148 147 205 175 140 145 169 129 150 135
Courts - 3 - - - 4 - - - - 3 -Police protection 126 119 104 101 135 111 96 106 133 92 76 94 Legal counsel and prosecution - - - - - 3 - - - - - 1 Correctional institutions 5 3 - 3 - 3 4 5 - 3 2 2 Fire protection 38 37 38 42 60 50 39 31 33 29 67 35
Administration of human resource programs - - - - - - - - - 1 - 5 Administration of human resource programs - - - - - - - - - 1 - 5
Administration of public health programs - - - - - - - - - 1 - 4
Administration of environmental quality programs 6 3 3 - - - 3 - 3 6 - -
Administration of environmental quality programs 6 3 3 - - - 3 - 3 6 - -
Administration of air and water resource and solid waste management programs 5 - - - - - - - - - - -Administration of conservation programs - - - - - - - - - 4 - 1
Administration of housing programs, urban planning, and community development - - - - - - - 5 - 3 1 4
Administration of housing programs, urban planning, and community development - - - - - - - 5 - 3 1 4
Administration of housing programs - - - - - - - 3 - - - -
See footnotes at end of table. 123
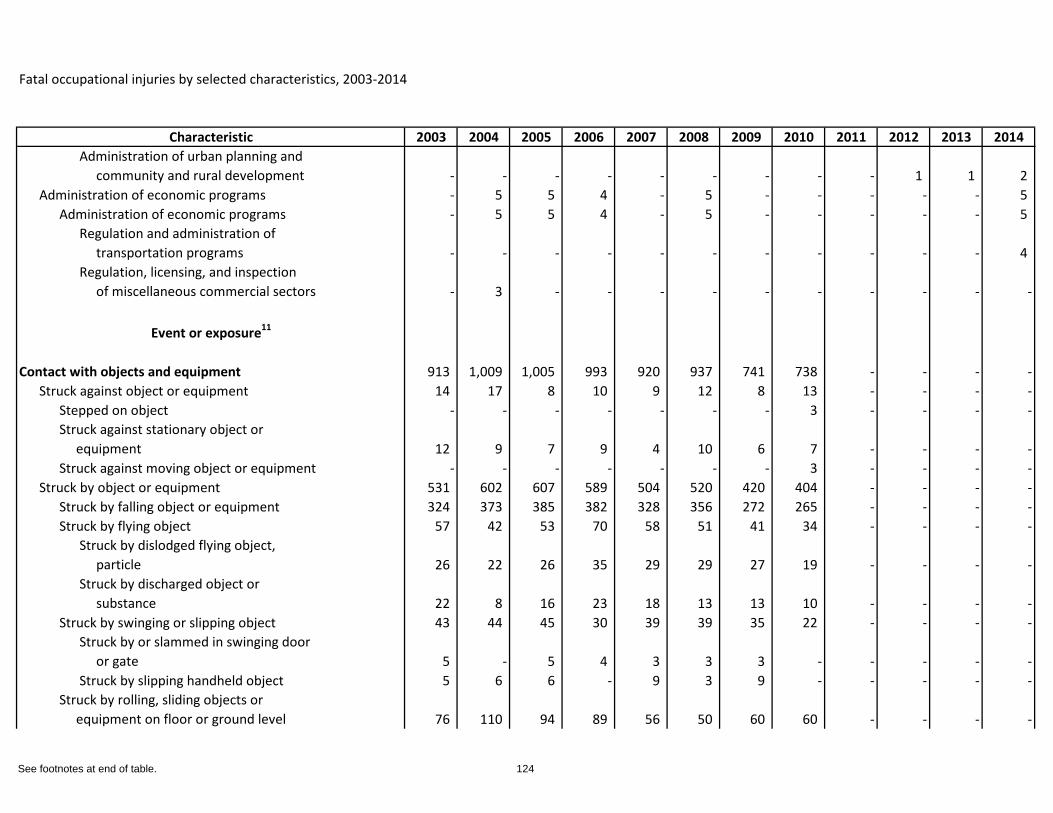
Fatal occupational injuries by selected characteristics, 2003-2014
Characteristic 2003 2004 2005 2006 2007 2008 2009 2010 2011 2012 2013 2014Administration of urban planning and community and rural development - - - - - - - - - 1 1 2
Administration of economic programs - 5 5 4 - 5 - - - - - 5 Administration of economic programs - 5 5 4 - 5 - - - - - 5
Regulation and administration of transportation programs - - - - - - - - - - - 4 Regulation, licensing, and inspection of miscellaneous commercial sectors - 3 - - - - - - - - - -
Event or exposure11
Contact with objects and equipment 913 1,009 1,005 993 920 937 741 738 - - - -Struck against object or equipment 14 17 8 10 9 12 8 13 - - - -
Stepped on object - - - - - - - 3 - - - -Struck against stationary object or equipment 12 9 7 9 4 10 6 7 - - - -Struck against moving object or equipment - - - - - - - 3 - - - -
Struck by object or equipment 531 602 607 589 504 520 420 404 - - - -Struck by falling object or equipment 324 373 385 382 328 356 272 265 - - - -Struck by flying object 57 42 53 70 58 51 41 34 - - - -
Struck by dislodged flying object, particle 26 22 26 35 29 29 27 19 - - - -Struck by discharged object or substance 22 8 16 23 18 13 13 10 - - - -
Struck by swinging or slipping object 43 44 45 30 39 39 35 22 - - - -Struck by or slammed in swinging door or gate 5 - 5 4 3 3 3 - - - - -Struck by slipping handheld object 5 6 6 - 9 3 9 - - - - -
Struck by rolling, sliding objects or equipment on floor or ground level 76 110 94 89 56 50 60 60 - - - -
See footnotes at end of table. 124
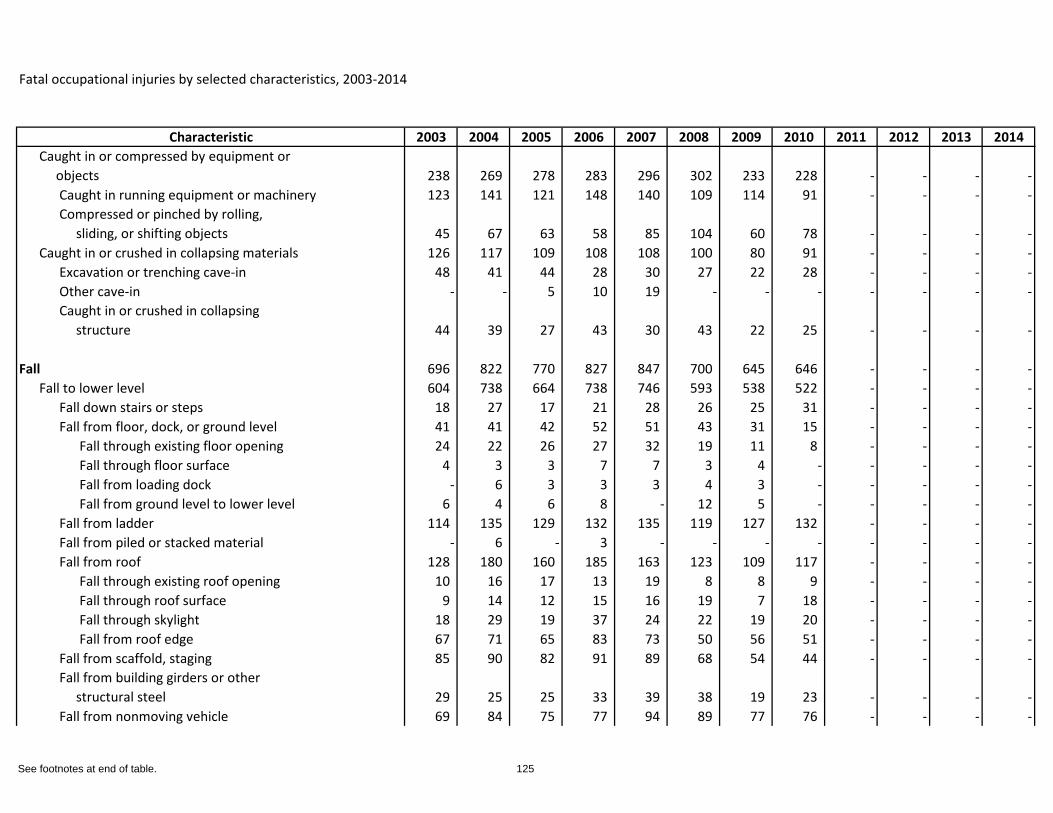
Fatal occupational injuries by selected characteristics, 2003-2014
Characteristic 2003 2004 2005 2006 2007 2008 2009 2010 2011 2012 2013 2014Caught in or compressed by equipment or objects 238 269 278 283 296 302 233 228 - - - -
Caught in running equipment or machinery 123 141 121 148 140 109 114 91 - - - -Compressed or pinched by rolling, sliding, or shifting objects 45 67 63 58 85 104 60 78 - - - -
Caught in or crushed in collapsing materials 126 117 109 108 108 100 80 91 - - - -Excavation or trenching cave-in 48 41 44 28 30 27 22 28 - - - -Other cave-in - - 5 10 19 - - - - - - -Caught in or crushed in collapsing structure 44 39 27 43 30 43 22 25 - - - -
Fall 696 822 770 827 847 700 645 646 - - - -Fall to lower level 604 738 664 738 746 593 538 522 - - - -
Fall down stairs or steps 18 27 17 21 28 26 25 31 - - - -Fall from floor, dock, or ground level 41 41 42 52 51 43 31 15 - - - -
Fall through existing floor opening 24 22 26 27 32 19 11 8 - - - -Fall through floor surface 4 3 3 7 7 3 4 - - - - -Fall from loading dock - 6 3 3 3 4 3 - - - - -Fall from ground level to lower level 6 4 6 8 - 12 5 - - - - -
Fall from ladder 114 135 129 132 135 119 127 132 - - - -Fall from piled or stacked material - 6 - 3 - - - - - - - -Fall from roof 128 180 160 185 163 123 109 117 - - - -
Fall through existing roof opening 10 16 17 13 19 8 8 9 - - - -Fall through roof surface 9 14 12 15 16 19 7 18 - - - -Fall through skylight 18 29 19 37 24 22 19 20 - - - -Fall from roof edge 67 71 65 83 73 50 56 51 - - - -
Fall from scaffold, staging 85 90 82 91 89 68 54 44 - - - -Fall from building girders or other structural steel 29 25 25 33 39 38 19 23 - - - -Fall from nonmoving vehicle 69 84 75 77 94 89 77 76 - - - -
See footnotes at end of table. 125
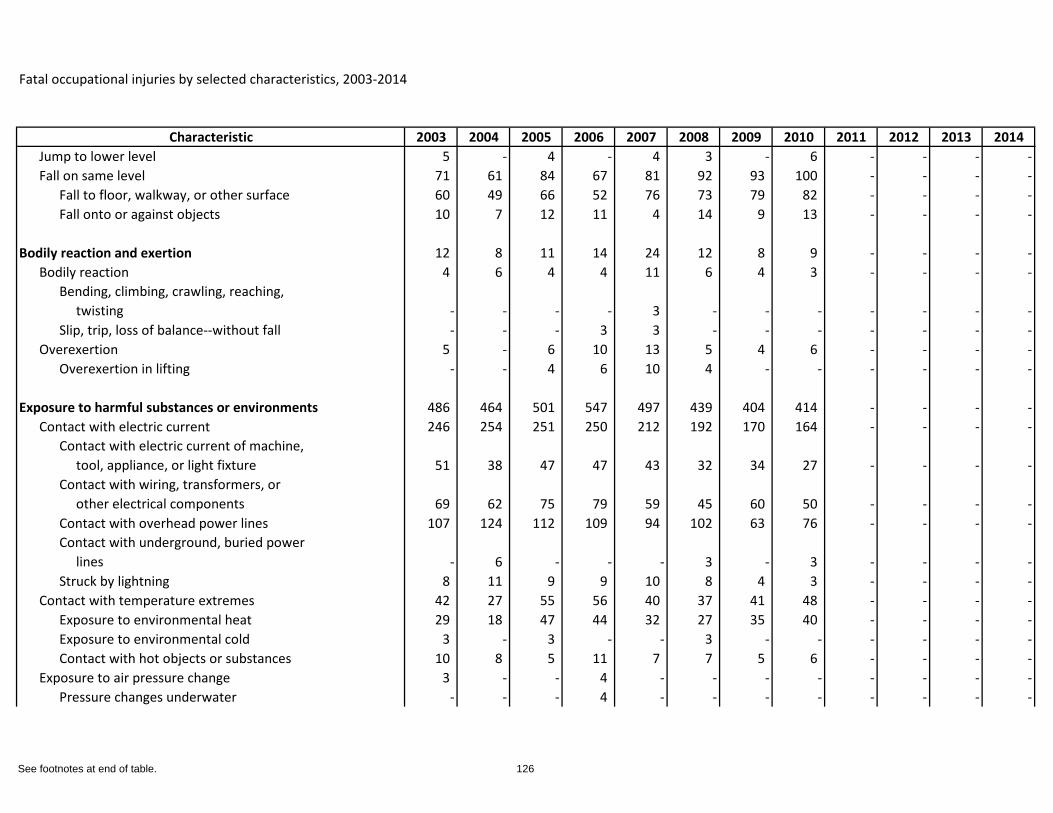
Fatal occupational injuries by selected characteristics, 2003-2014
Characteristic 2003 2004 2005 2006 2007 2008 2009 2010 2011 2012 2013 2014Jump to lower level 5 - 4 - 4 3 - 6 - - - -Fall on same level 71 61 84 67 81 92 93 100 - - - -
Fall to floor, walkway, or other surface 60 49 66 52 76 73 79 82 - - - -Fall onto or against objects 10 7 12 11 4 14 9 13 - - - -
Bodily reaction and exertion 12 8 11 14 24 12 8 9 - - - -Bodily reaction 4 6 4 4 11 6 4 3 - - - -
Bending, climbing, crawling, reaching, twisting - - - - 3 - - - - - - -Slip, trip, loss of balance--without fall - - - 3 3 - - - - - - -
Overexertion 5 - 6 10 13 5 4 6 - - - -Overexertion in lifting - - 4 6 10 4 - - - - - -
Exposure to harmful substances or environments 486 464 501 547 497 439 404 414 - - - -Contact with electric current 246 254 251 250 212 192 170 164 - - - -
Contact with electric current of machine, tool, appliance, or light fixture 51 38 47 47 43 32 34 27 - - - -Contact with wiring, transformers, or other electrical components 69 62 75 79 59 45 60 50 - - - -Contact with overhead power lines 107 124 112 109 94 102 63 76 - - - -Contact with underground, buried power lines - 6 - - - 3 - 3 - - - -Struck by lightning 8 11 9 9 10 8 4 3 - - - -
Contact with temperature extremes 42 27 55 56 40 37 41 48 - - - -Exposure to environmental heat 29 18 47 44 32 27 35 40 - - - -Exposure to environmental cold 3 - 3 - - 3 - - - - - -Contact with hot objects or substances 10 8 5 11 7 7 5 6 - - - -
Exposure to air pressure change 3 - - 4 - - - - - - - -Pressure changes underwater - - - 4 - - - - - - - -
See footnotes at end of table. 126
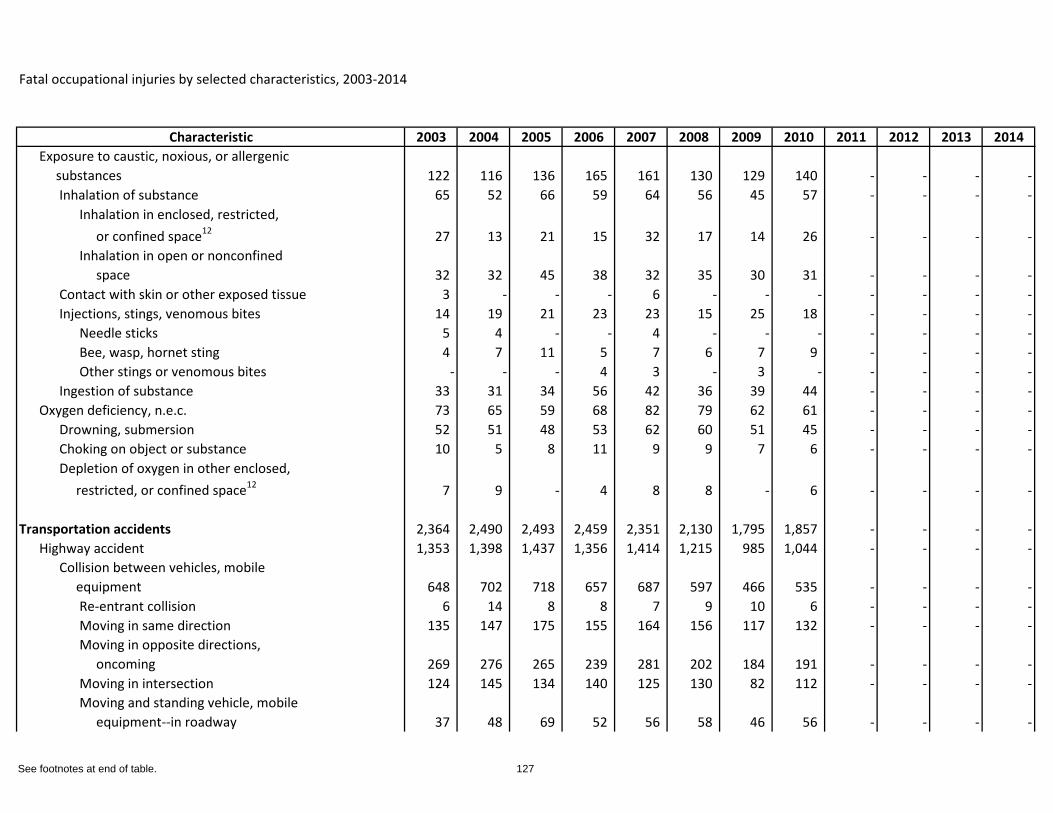
Fatal occupational injuries by selected characteristics, 2003-2014
Characteristic 2003 2004 2005 2006 2007 2008 2009 2010 2011 2012 2013 2014Exposure to caustic, noxious, or allergenic substances 122 116 136 165 161 130 129 140 - - - -
Inhalation of substance 65 52 66 59 64 56 45 57 - - - -Inhalation in enclosed, restricted, or confined space12 27 13 21 15 32 17 14 26 - - - -Inhalation in open or nonconfined space 32 32 45 38 32 35 30 31 - - - -
Contact with skin or other exposed tissue 3 - - - 6 - - - - - - -Injections, stings, venomous bites 14 19 21 23 23 15 25 18 - - - -
Needle sticks 5 4 - - 4 - - - - - - -Bee, wasp, hornet sting 4 7 11 5 7 6 7 9 - - - -Other stings or venomous bites - - - 4 3 - 3 - - - - -
Ingestion of substance 33 31 34 56 42 36 39 44 - - - -Oxygen deficiency, n.e.c. 73 65 59 68 82 79 62 61 - - - -
Drowning, submersion 52 51 48 53 62 60 51 45 - - - -Choking on object or substance 10 5 8 11 9 9 7 6 - - - -Depletion of oxygen in other enclosed, restricted, or confined space12 7 9 - 4 8 8 - 6 - - - -
Transportation accidents 2,364 2,490 2,493 2,459 2,351 2,130 1,795 1,857 - - - -Highway accident 1,353 1,398 1,437 1,356 1,414 1,215 985 1,044 - - - -
Collision between vehicles, mobile equipment 648 702 718 657 687 597 466 535 - - - -
Re-entrant collision 6 14 8 8 7 9 10 6 - - - -Moving in same direction 135 147 175 155 164 156 117 132 - - - -Moving in opposite directions, oncoming 269 276 265 239 281 202 184 191 - - - -Moving in intersection 124 145 134 140 125 130 82 112 - - - -Moving and standing vehicle, mobile equipment--in roadway 37 48 69 52 56 58 46 56 - - - -
See footnotes at end of table. 127
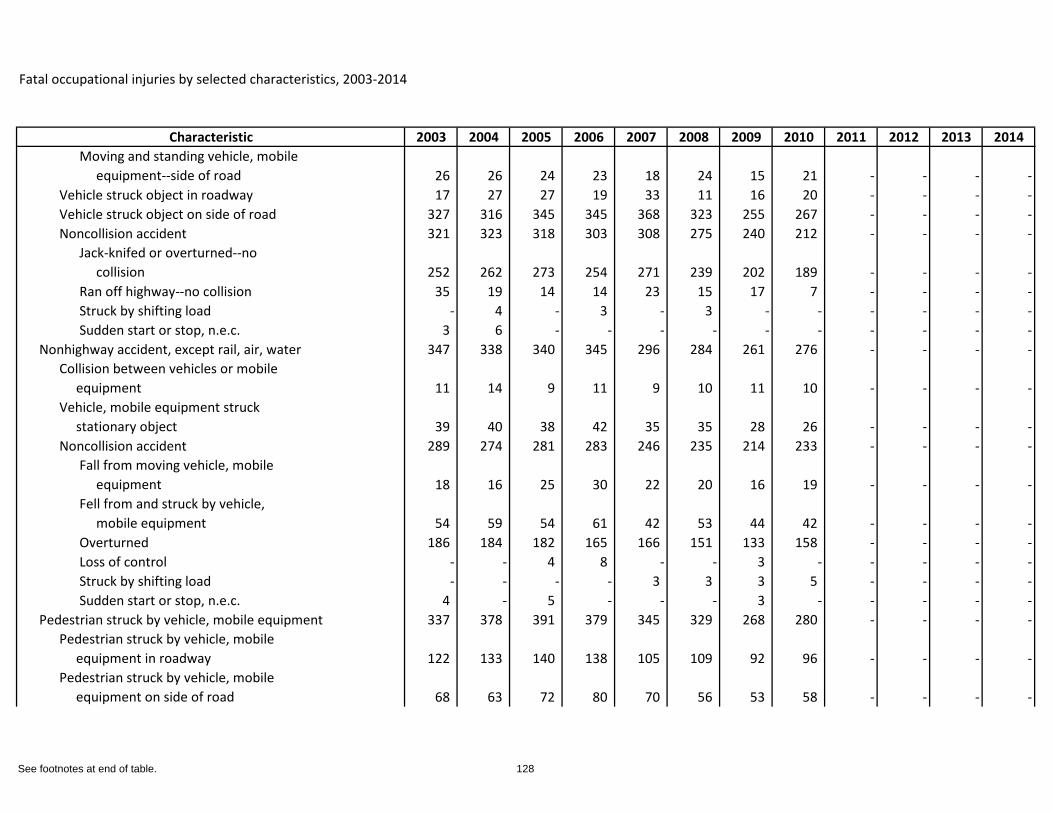
Fatal occupational injuries by selected characteristics, 2003-2014
Characteristic 2003 2004 2005 2006 2007 2008 2009 2010 2011 2012 2013 2014Moving and standing vehicle, mobile equipment--side of road 26 26 24 23 18 24 15 21 - - - -
Vehicle struck object in roadway 17 27 27 19 33 11 16 20 - - - -Vehicle struck object on side of road 327 316 345 345 368 323 255 267 - - - -Noncollision accident 321 323 318 303 308 275 240 212 - - - -
Jack-knifed or overturned--no collision 252 262 273 254 271 239 202 189 - - - -Ran off highway--no collision 35 19 14 14 23 15 17 7 - - - -Struck by shifting load - 4 - 3 - 3 - - - - - -Sudden start or stop, n.e.c. 3 6 - - - - - - - - - -
Nonhighway accident, except rail, air, water 347 338 340 345 296 284 261 276 - - - -Collision between vehicles or mobile equipment 11 14 9 11 9 10 11 10 - - - -Vehicle, mobile equipment struck stationary object 39 40 38 42 35 35 28 26 - - - -Noncollision accident 289 274 281 283 246 235 214 233 - - - -
Fall from moving vehicle, mobile equipment 18 16 25 30 22 20 16 19 - - - -Fell from and struck by vehicle, mobile equipment 54 59 54 61 42 53 44 42 - - - -Overturned 186 184 182 165 166 151 133 158 - - - -Loss of control - - 4 8 - - 3 - - - - -Struck by shifting load - - - - 3 3 3 5 - - - -Sudden start or stop, n.e.c. 4 - 5 - - - 3 - - - - -
Pedestrian struck by vehicle, mobile equipment 337 378 391 379 345 329 268 280 - - - -Pedestrian struck by vehicle, mobile equipment in roadway 122 133 140 138 105 109 92 96 - - - -Pedestrian struck by vehicle, mobile equipment on side of road 68 63 72 80 70 56 53 58 - - - -
See footnotes at end of table. 128
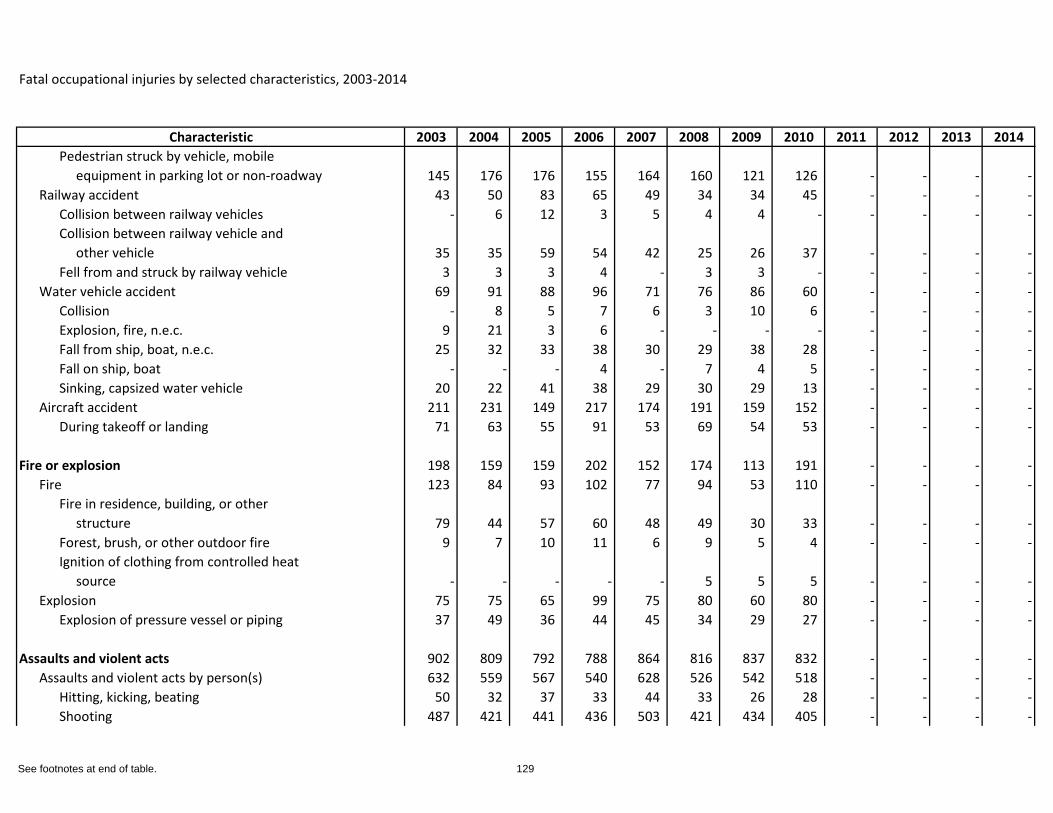
Fatal occupational injuries by selected characteristics, 2003-2014
Characteristic 2003 2004 2005 2006 2007 2008 2009 2010 2011 2012 2013 2014Pedestrian struck by vehicle, mobile equipment in parking lot or non-roadway 145 176 176 155 164 160 121 126 - - - -
Railway accident 43 50 83 65 49 34 34 45 - - - -Collision between railway vehicles - 6 12 3 5 4 4 - - - - -Collision between railway vehicle and other vehicle 35 35 59 54 42 25 26 37 - - - -Fell from and struck by railway vehicle 3 3 3 4 - 3 3 - - - - -
Water vehicle accident 69 91 88 96 71 76 86 60 - - - -Collision - 8 5 7 6 3 10 6 - - - -Explosion, fire, n.e.c. 9 21 3 6 - - - - - - - -Fall from ship, boat, n.e.c. 25 32 33 38 30 29 38 28 - - - -Fall on ship, boat - - - 4 - 7 4 5 - - - -Sinking, capsized water vehicle 20 22 41 38 29 30 29 13 - - - -
Aircraft accident 211 231 149 217 174 191 159 152 - - - -During takeoff or landing 71 63 55 91 53 69 54 53 - - - -
Fire or explosion 198 159 159 202 152 174 113 191 - - - -Fire 123 84 93 102 77 94 53 110 - - - -
Fire in residence, building, or other structure 79 44 57 60 48 49 30 33 - - - -Forest, brush, or other outdoor fire 9 7 10 11 6 9 5 4 - - - -Ignition of clothing from controlled heat source - - - - - 5 5 5 - - - -
Explosion 75 75 65 99 75 80 60 80 - - - -Explosion of pressure vessel or piping 37 49 36 44 45 34 29 27 - - - -
Assaults and violent acts 902 809 792 788 864 816 837 832 - - - -Assaults and violent acts by person(s) 632 559 567 540 628 526 542 518 - - - -
Hitting, kicking, beating 50 32 37 33 44 33 26 28 - - - -Shooting 487 421 441 436 503 421 434 405 - - - -
See footnotes at end of table. 129
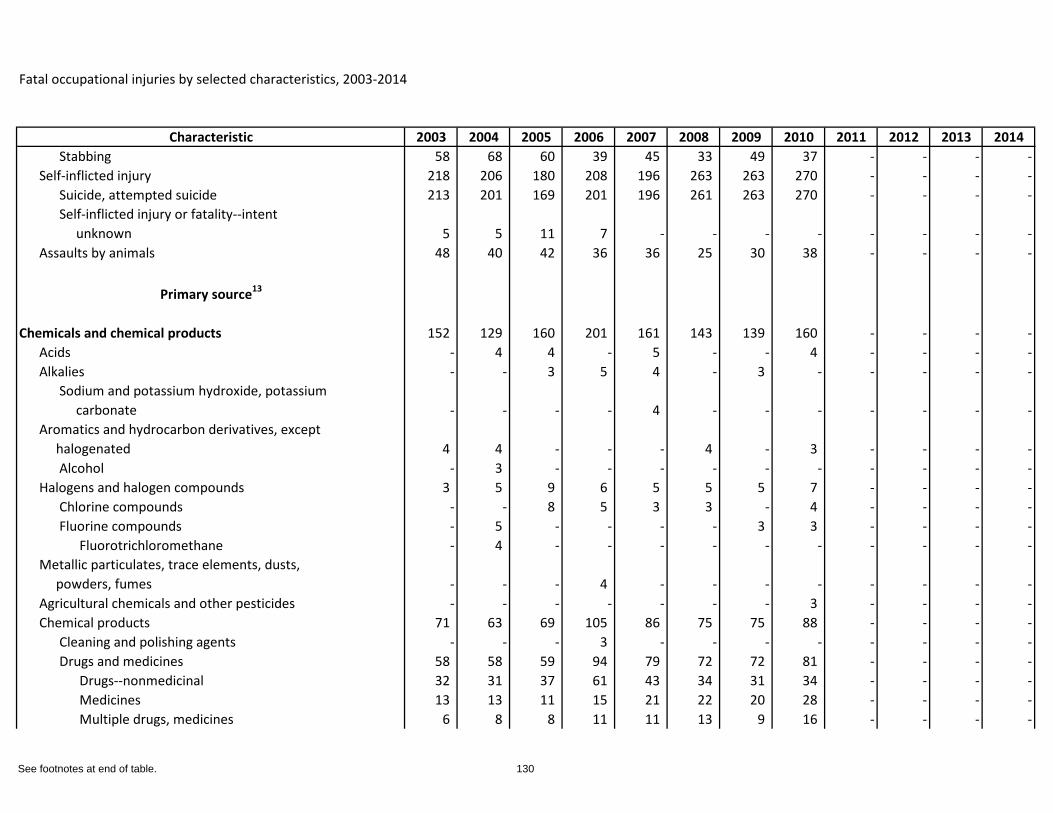
Fatal occupational injuries by selected characteristics, 2003-2014
Characteristic 2003 2004 2005 2006 2007 2008 2009 2010 2011 2012 2013 2014Stabbing 58 68 60 39 45 33 49 37 - - - -
Self-inflicted injury 218 206 180 208 196 263 263 270 - - - -Suicide, attempted suicide 213 201 169 201 196 261 263 270 - - - -Self-inflicted injury or fatality--intent unknown 5 5 11 7 - - - - - - - -
Assaults by animals 48 40 42 36 36 25 30 38 - - - -
Primary source13
Chemicals and chemical products 152 129 160 201 161 143 139 160 - - - -Acids - 4 4 - 5 - - 4 - - - -Alkalies - - 3 5 4 - 3 - - - - -
Sodium and potassium hydroxide, potassium carbonate - - - - 4 - - - - - - -
Aromatics and hydrocarbon derivatives, except halogenated 4 4 - - - 4 - 3 - - - -
Alcohol - 3 - - - - - - - - - -Halogens and halogen compounds 3 5 9 6 5 5 5 7 - - - -
Chlorine compounds - - 8 5 3 3 - 4 - - - -Fluorine compounds - 5 - - - - 3 3 - - - -
Fluorotrichloromethane - 4 - - - - - - - - - -Metallic particulates, trace elements, dusts, powders, fumes - - - 4 - - - - - - - -Agricultural chemicals and other pesticides - - - - - - - 3 - - - -Chemical products 71 63 69 105 86 75 75 88 - - - -
Cleaning and polishing agents - - - 3 - - - - - - - -Drugs and medicines 58 58 59 94 79 72 72 81 - - - -
Drugs--nonmedicinal 32 31 37 61 43 34 31 34 - - - -Medicines 13 13 11 15 21 22 20 28 - - - -Multiple drugs, medicines 6 8 8 11 11 13 9 16 - - - -
See footnotes at end of table. 130
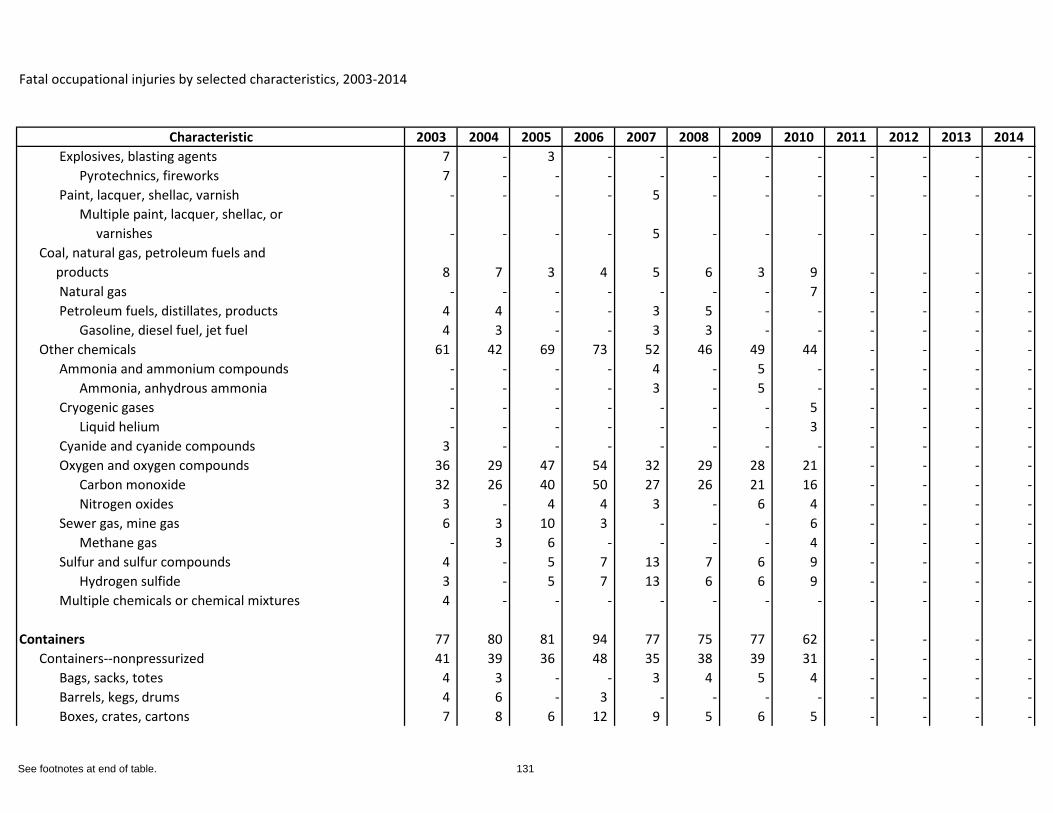
Fatal occupational injuries by selected characteristics, 2003-2014
Characteristic 2003 2004 2005 2006 2007 2008 2009 2010 2011 2012 2013 2014Explosives, blasting agents 7 - 3 - - - - - - - - -
Pyrotechnics, fireworks 7 - - - - - - - - - - -Paint, lacquer, shellac, varnish - - - - 5 - - - - - - -
Multiple paint, lacquer, shellac, or varnishes - - - - 5 - - - - - - -
Coal, natural gas, petroleum fuels and products 8 7 3 4 5 6 3 9 - - - -
Natural gas - - - - - - - 7 - - - -Petroleum fuels, distillates, products 4 4 - - 3 5 - - - - - -
Gasoline, diesel fuel, jet fuel 4 3 - - 3 3 - - - - - -Other chemicals 61 42 69 73 52 46 49 44 - - - -
Ammonia and ammonium compounds - - - - 4 - 5 - - - - -Ammonia, anhydrous ammonia - - - - 3 - 5 - - - - -
Cryogenic gases - - - - - - - 5 - - - -Liquid helium - - - - - - - 3 - - - -
Cyanide and cyanide compounds 3 - - - - - - - - - - -Oxygen and oxygen compounds 36 29 47 54 32 29 28 21 - - - -
Carbon monoxide 32 26 40 50 27 26 21 16 - - - -Nitrogen oxides 3 - 4 4 3 - 6 4 - - - -
Sewer gas, mine gas 6 3 10 3 - - - 6 - - - -Methane gas - 3 6 - - - - 4 - - - -
Sulfur and sulfur compounds 4 - 5 7 13 7 6 9 - - - -Hydrogen sulfide 3 - 5 7 13 6 6 9 - - - -
Multiple chemicals or chemical mixtures 4 - - - - - - - - - - -
Containers 77 80 81 94 77 75 77 62 - - - -Containers--nonpressurized 41 39 36 48 35 38 39 31 - - - -
Bags, sacks, totes 4 3 - - 3 4 5 4 - - - -Barrels, kegs, drums 4 6 - 3 - - - - - - - -Boxes, crates, cartons 7 8 6 12 9 5 6 5 - - - -
See footnotes at end of table. 131
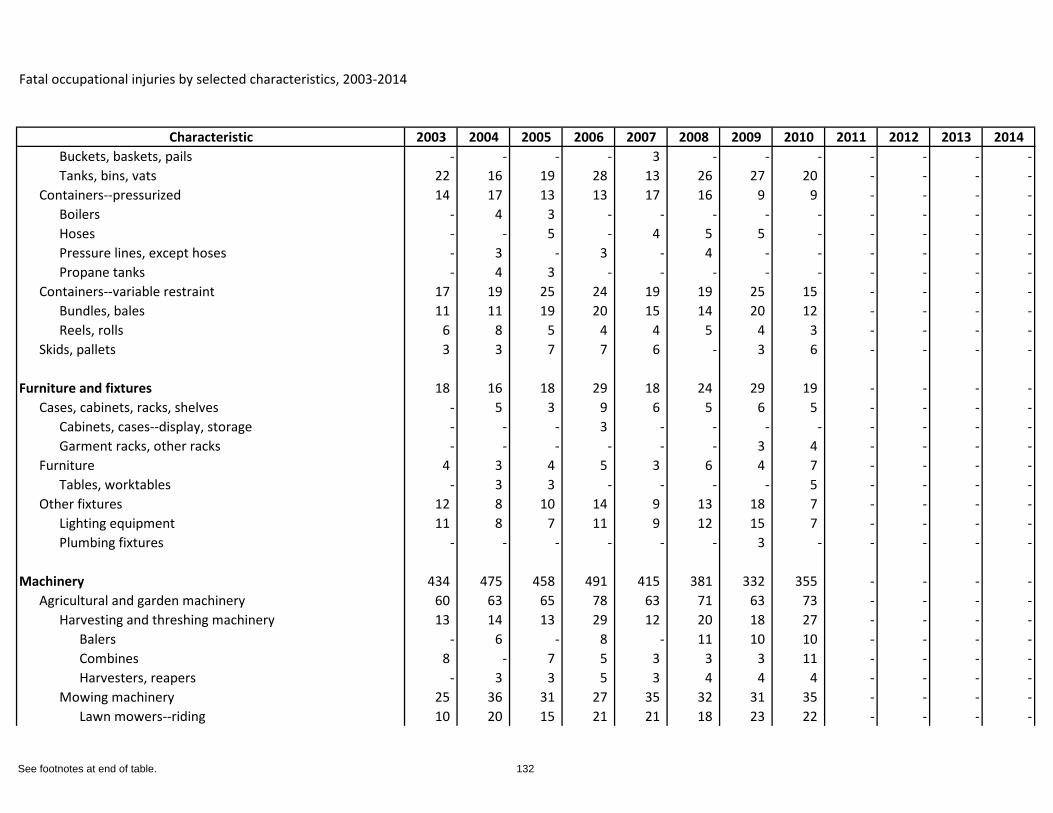
Fatal occupational injuries by selected characteristics, 2003-2014
Characteristic 2003 2004 2005 2006 2007 2008 2009 2010 2011 2012 2013 2014Buckets, baskets, pails - - - - 3 - - - - - - -Tanks, bins, vats 22 16 19 28 13 26 27 20 - - - -
Containers--pressurized 14 17 13 13 17 16 9 9 - - - -Boilers - 4 3 - - - - - - - - -Hoses - - 5 - 4 5 5 - - - - -Pressure lines, except hoses - 3 - 3 - 4 - - - - - -Propane tanks - 4 3 - - - - - - - - -
Containers--variable restraint 17 19 25 24 19 19 25 15 - - - -Bundles, bales 11 11 19 20 15 14 20 12 - - - -Reels, rolls 6 8 5 4 4 5 4 3 - - - -
Skids, pallets 3 3 7 7 6 - 3 6 - - - -
Furniture and fixtures 18 16 18 29 18 24 29 19 - - - -Cases, cabinets, racks, shelves - 5 3 9 6 5 6 5 - - - -
Cabinets, cases--display, storage - - - 3 - - - - - - - -Garment racks, other racks - - - - - - 3 4 - - - -
Furniture 4 3 4 5 3 6 4 7 - - - -Tables, worktables - 3 3 - - - - 5 - - - -
Other fixtures 12 8 10 14 9 13 18 7 - - - -Lighting equipment 11 8 7 11 9 12 15 7 - - - -Plumbing fixtures - - - - - - 3 - - - - -
Machinery 434 475 458 491 415 381 332 355 - - - -Agricultural and garden machinery 60 63 65 78 63 71 63 73 - - - -
Harvesting and threshing machinery 13 14 13 29 12 20 18 27 - - - -Balers - 6 - 8 - 11 10 10 - - - -Combines 8 - 7 5 3 3 3 11 - - - -Harvesters, reapers - 3 3 5 3 4 4 4 - - - -
Mowing machinery 25 36 31 27 35 32 31 35 - - - -Lawn mowers--riding 10 20 15 21 21 18 23 22 - - - -
See footnotes at end of table. 132
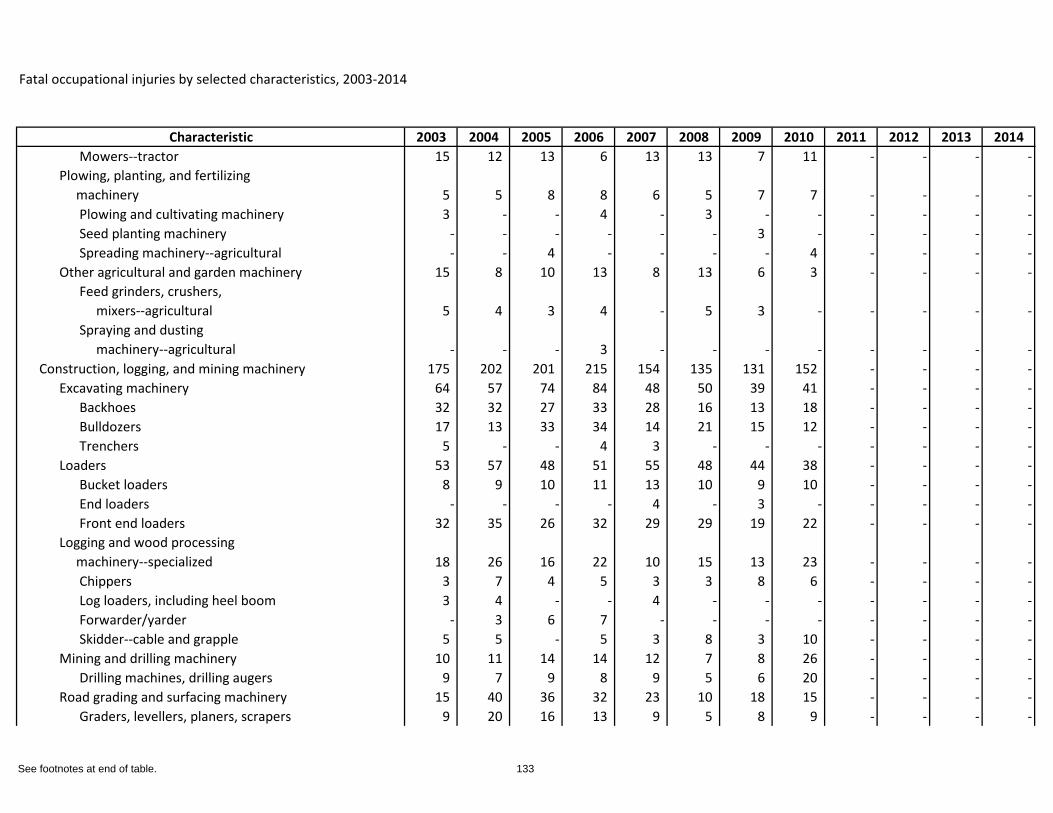
Fatal occupational injuries by selected characteristics, 2003-2014
Characteristic 2003 2004 2005 2006 2007 2008 2009 2010 2011 2012 2013 2014Mowers--tractor 15 12 13 6 13 13 7 11 - - - -
Plowing, planting, and fertilizing machinery 5 5 8 8 6 5 7 7 - - - -
Plowing and cultivating machinery 3 - - 4 - 3 - - - - - -Seed planting machinery - - - - - - 3 - - - - -Spreading machinery--agricultural - - 4 - - - - 4 - - - -
Other agricultural and garden machinery 15 8 10 13 8 13 6 3 - - - -Feed grinders, crushers, mixers--agricultural 5 4 3 4 - 5 3 - - - - -Spraying and dusting machinery--agricultural - - - 3 - - - - - - - -
Construction, logging, and mining machinery 175 202 201 215 154 135 131 152 - - - -Excavating machinery 64 57 74 84 48 50 39 41 - - - -
Backhoes 32 32 27 33 28 16 13 18 - - - -Bulldozers 17 13 33 34 14 21 15 12 - - - -Trenchers 5 - - 4 3 - - - - - - -
Loaders 53 57 48 51 55 48 44 38 - - - -Bucket loaders 8 9 10 11 13 10 9 10 - - - -End loaders - - - - 4 - 3 - - - - -Front end loaders 32 35 26 32 29 29 19 22 - - - -
Logging and wood processing machinery--specialized 18 26 16 22 10 15 13 23 - - - -
Chippers 3 7 4 5 3 3 8 6 - - - -Log loaders, including heel boom 3 4 - - 4 - - - - - - -Forwarder/yarder - 3 6 7 - - - - - - - -Skidder--cable and grapple 5 5 - 5 3 8 3 10 - - - -
Mining and drilling machinery 10 11 14 14 12 7 8 26 - - - -Drilling machines, drilling augers 9 7 9 8 9 5 6 20 - - - -
Road grading and surfacing machinery 15 40 36 32 23 10 18 15 - - - -Graders, levellers, planers, scrapers 9 20 16 13 9 5 8 9 - - - -
See footnotes at end of table. 133
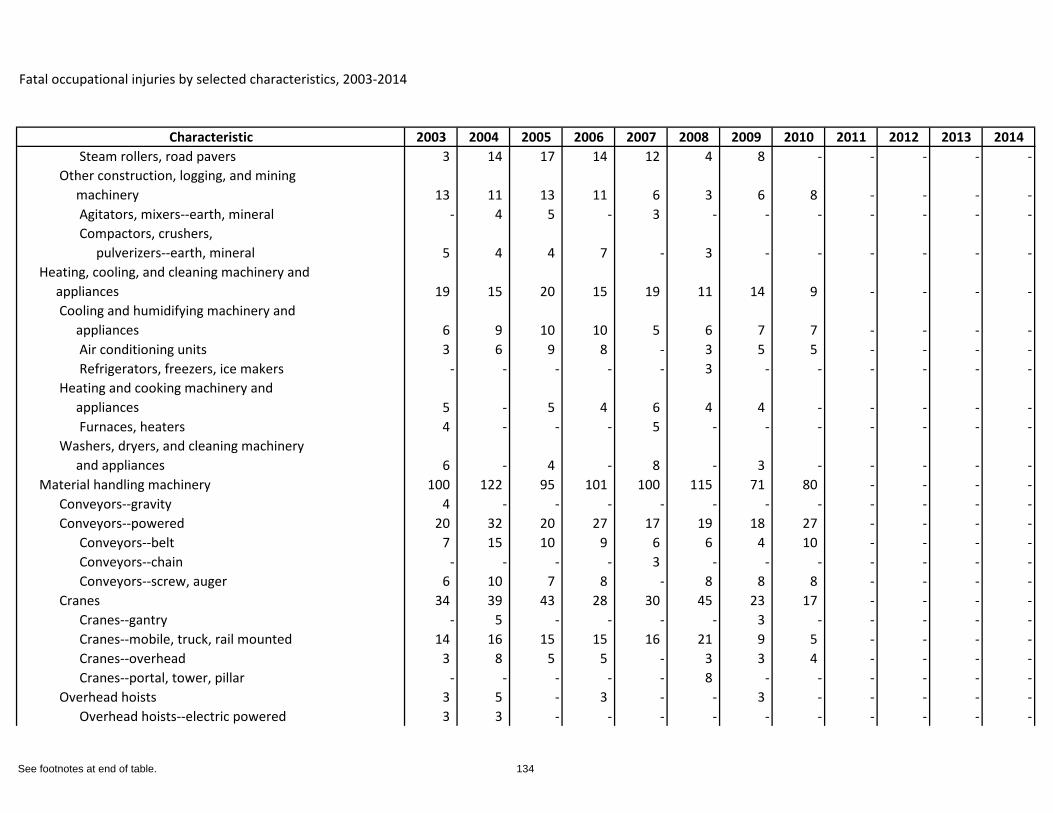
Fatal occupational injuries by selected characteristics, 2003-2014
Characteristic 2003 2004 2005 2006 2007 2008 2009 2010 2011 2012 2013 2014Steam rollers, road pavers 3 14 17 14 12 4 8 - - - - -
Other construction, logging, and mining machinery 13 11 13 11 6 3 6 8 - - - -
Agitators, mixers--earth, mineral - 4 5 - 3 - - - - - - -Compactors, crushers, pulverizers--earth, mineral 5 4 4 7 - 3 - - - - - -
Heating, cooling, and cleaning machinery and appliances 19 15 20 15 19 11 14 9 - - - -
Cooling and humidifying machinery and appliances 6 9 10 10 5 6 7 7 - - - -
Air conditioning units 3 6 9 8 - 3 5 5 - - - -Refrigerators, freezers, ice makers - - - - - 3 - - - - - -
Heating and cooking machinery and appliances 5 - 5 4 6 4 4 - - - - -
Furnaces, heaters 4 - - - 5 - - - - - - -Washers, dryers, and cleaning machinery and appliances 6 - 4 - 8 - 3 - - - - -
Material handling machinery 100 122 95 101 100 115 71 80 - - - -Conveyors--gravity 4 - - - - - - - - - - -Conveyors--powered 20 32 20 27 17 19 18 27 - - - -
Conveyors--belt 7 15 10 9 6 6 4 10 - - - -Conveyors--chain - - - - 3 - - - - - - -Conveyors--screw, auger 6 10 7 8 - 8 8 8 - - - -
Cranes 34 39 43 28 30 45 23 17 - - - -Cranes--gantry - 5 - - - - 3 - - - - -Cranes--mobile, truck, rail mounted 14 16 15 15 16 21 9 5 - - - -Cranes--overhead 3 8 5 5 - 3 3 4 - - - -Cranes--portal, tower, pillar - - - - - 8 - - - - - -
Overhead hoists 3 5 - 3 - - 3 - - - - -Overhead hoists--electric powered 3 3 - - - - - - - - - -
See footnotes at end of table. 134
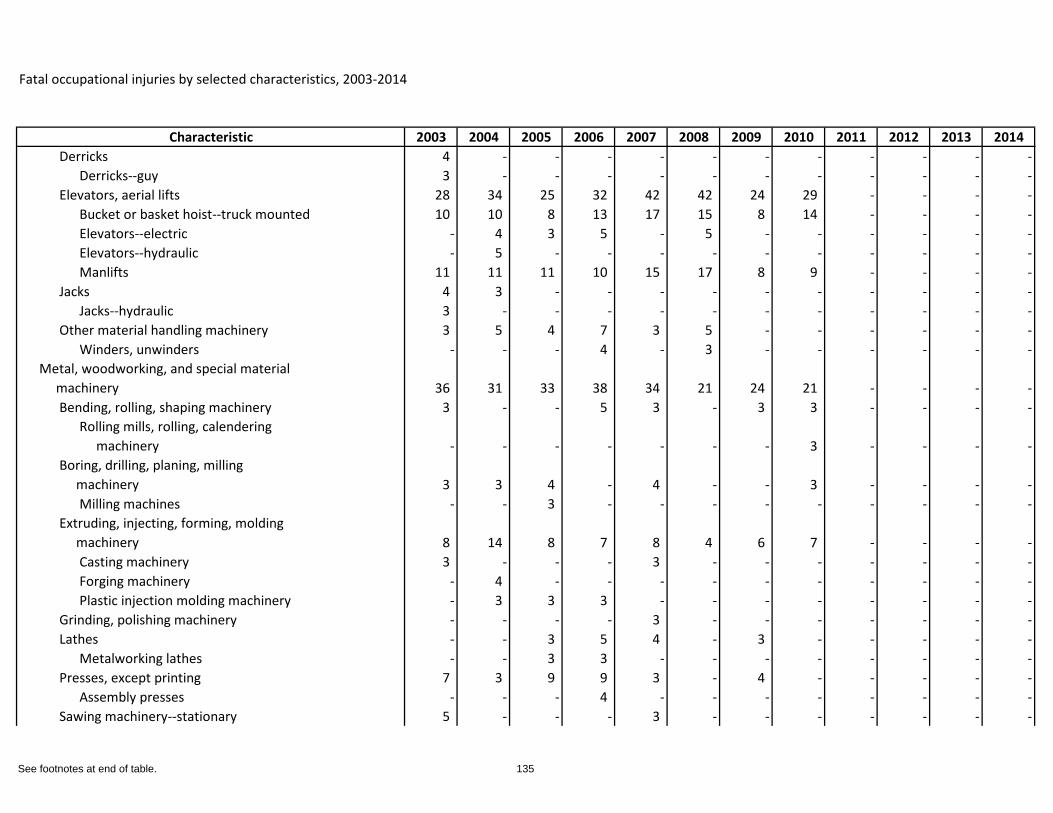
Fatal occupational injuries by selected characteristics, 2003-2014
Characteristic 2003 2004 2005 2006 2007 2008 2009 2010 2011 2012 2013 2014Derricks 4 - - - - - - - - - - -
Derricks--guy 3 - - - - - - - - - - -Elevators, aerial lifts 28 34 25 32 42 42 24 29 - - - -
Bucket or basket hoist--truck mounted 10 10 8 13 17 15 8 14 - - - -Elevators--electric - 4 3 5 - 5 - - - - - -Elevators--hydraulic - 5 - - - - - - - - - -Manlifts 11 11 11 10 15 17 8 9 - - - -
Jacks 4 3 - - - - - - - - - -Jacks--hydraulic 3 - - - - - - - - - - -
Other material handling machinery 3 5 4 7 3 5 - - - - - -Winders, unwinders - - - 4 - 3 - - - - - -
Metal, woodworking, and special material machinery 36 31 33 38 34 21 24 21 - - - -
Bending, rolling, shaping machinery 3 - - 5 3 - 3 3 - - - -Rolling mills, rolling, calendering machinery - - - - - - - 3 - - - -
Boring, drilling, planing, milling machinery 3 3 4 - 4 - - 3 - - - -
Milling machines - - 3 - - - - - - - - -Extruding, injecting, forming, molding machinery 8 14 8 7 8 4 6 7 - - - -
Casting machinery 3 - - - 3 - - - - - - -Forging machinery - 4 - - - - - - - - - -Plastic injection molding machinery - 3 3 3 - - - - - - - -
Grinding, polishing machinery - - - - 3 - - - - - - -Lathes - - 3 5 4 - 3 - - - - -
Metalworking lathes - - 3 3 - - - - - - - -Presses, except printing 7 3 9 9 3 - 4 - - - - -
Assembly presses - - - 4 - - - - - - - -Sawing machinery--stationary 5 - - - 3 - - - - - - -
See footnotes at end of table. 135
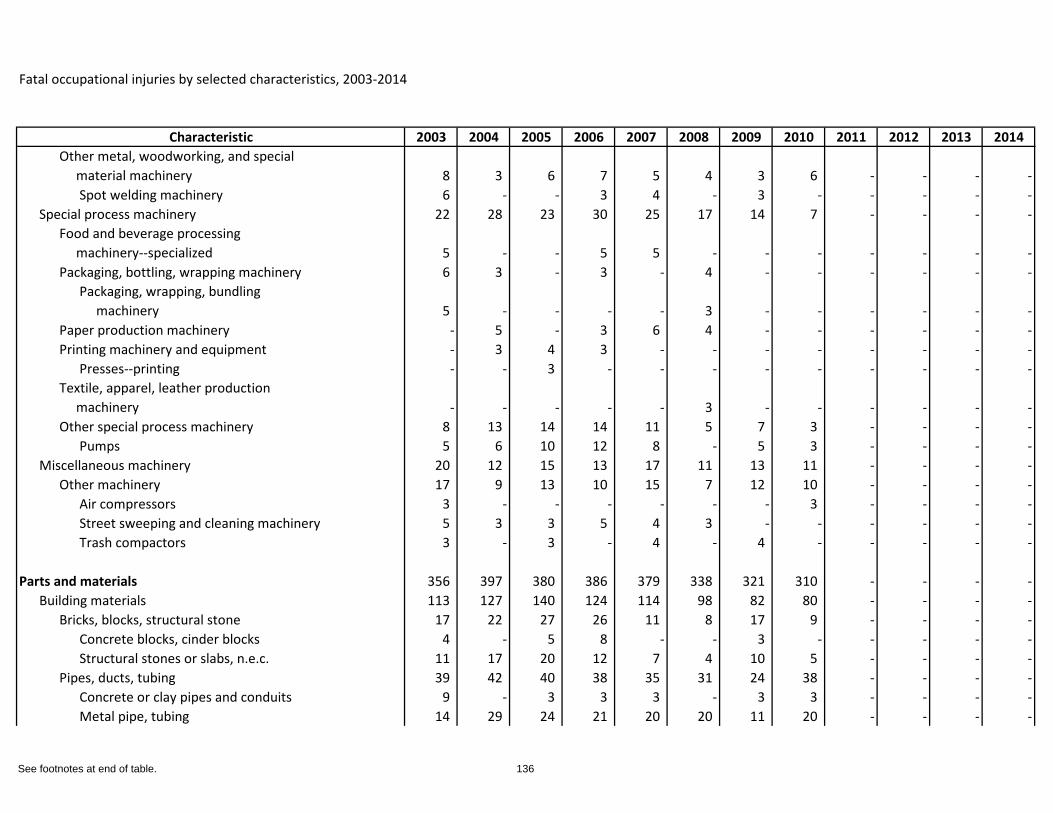
Fatal occupational injuries by selected characteristics, 2003-2014
Characteristic 2003 2004 2005 2006 2007 2008 2009 2010 2011 2012 2013 2014Other metal, woodworking, and special material machinery 8 3 6 7 5 4 3 6 - - - -
Spot welding machinery 6 - - 3 4 - 3 - - - - -Special process machinery 22 28 23 30 25 17 14 7 - - - -
Food and beverage processing machinery--specialized 5 - - 5 5 - - - - - - -Packaging, bottling, wrapping machinery 6 3 - 3 - 4 - - - - - -
Packaging, wrapping, bundling machinery 5 - - - - 3 - - - - - -
Paper production machinery - 5 - 3 6 4 - - - - - -Printing machinery and equipment - 3 4 3 - - - - - - - -
Presses--printing - - 3 - - - - - - - - -Textile, apparel, leather production machinery - - - - - 3 - - - - - -Other special process machinery 8 13 14 14 11 5 7 3 - - - -
Pumps 5 6 10 12 8 - 5 3 - - - -Miscellaneous machinery 20 12 15 13 17 11 13 11 - - - -
Other machinery 17 9 13 10 15 7 12 10 - - - -Air compressors 3 - - - - - - 3 - - - -Street sweeping and cleaning machinery 5 3 3 5 4 3 - - - - - -Trash compactors 3 - 3 - 4 - 4 - - - - -
Parts and materials 356 397 380 386 379 338 321 310 - - - -Building materials 113 127 140 124 114 98 82 80 - - - -
Bricks, blocks, structural stone 17 22 27 26 11 8 17 9 - - - -Concrete blocks, cinder blocks 4 - 5 8 - - 3 - - - - -Structural stones or slabs, n.e.c. 11 17 20 12 7 4 10 5 - - - -
Pipes, ducts, tubing 39 42 40 38 35 31 24 38 - - - -Concrete or clay pipes and conduits 9 - 3 3 3 - 3 3 - - - -Metal pipe, tubing 14 29 24 21 20 20 11 20 - - - -
See footnotes at end of table. 136
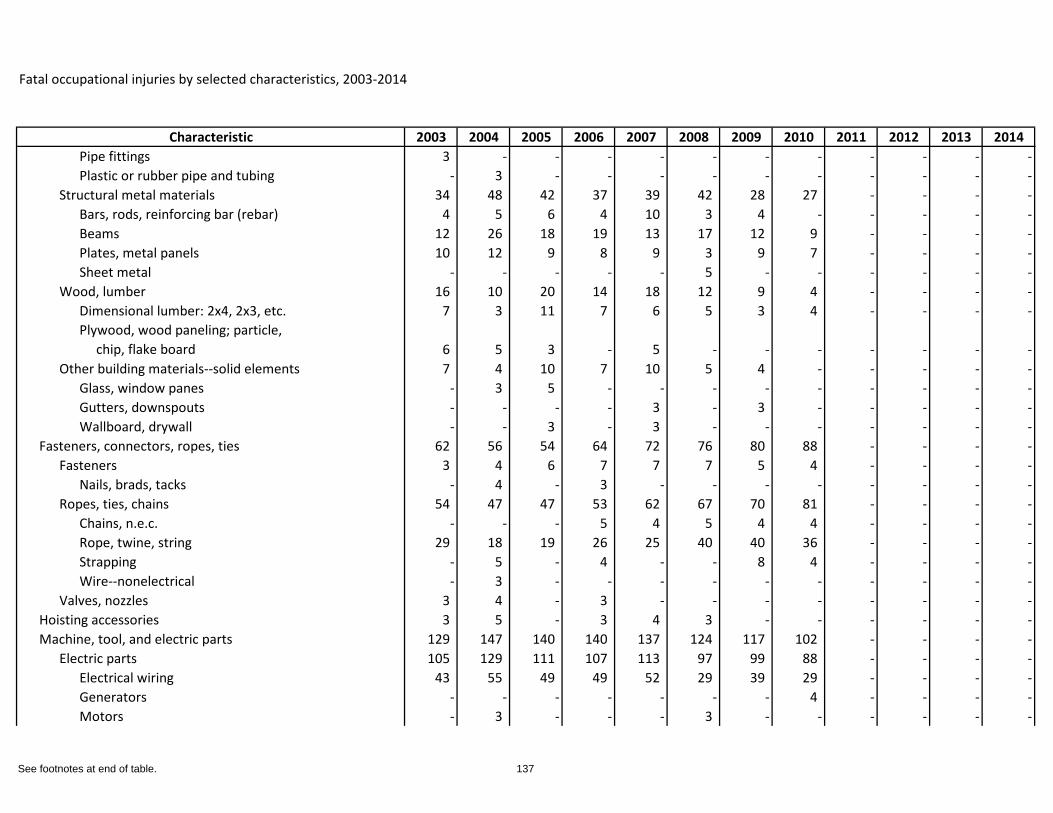
Fatal occupational injuries by selected characteristics, 2003-2014
Characteristic 2003 2004 2005 2006 2007 2008 2009 2010 2011 2012 2013 2014Pipe fittings 3 - - - - - - - - - - -Plastic or rubber pipe and tubing - 3 - - - - - - - - - -
Structural metal materials 34 48 42 37 39 42 28 27 - - - -Bars, rods, reinforcing bar (rebar) 4 5 6 4 10 3 4 - - - - -Beams 12 26 18 19 13 17 12 9 - - - -Plates, metal panels 10 12 9 8 9 3 9 7 - - - -Sheet metal - - - - - 5 - - - - - -
Wood, lumber 16 10 20 14 18 12 9 4 - - - -Dimensional lumber: 2x4, 2x3, etc. 7 3 11 7 6 5 3 4 - - - -Plywood, wood paneling; particle, chip, flake board 6 5 3 - 5 - - - - - - -
Other building materials--solid elements 7 4 10 7 10 5 4 - - - - -Glass, window panes - 3 5 - - - - - - - - -Gutters, downspouts - - - - 3 - 3 - - - - -Wallboard, drywall - - 3 - 3 - - - - - - -
Fasteners, connectors, ropes, ties 62 56 54 64 72 76 80 88 - - - -Fasteners 3 4 6 7 7 7 5 4 - - - -
Nails, brads, tacks - 4 - 3 - - - - - - - -Ropes, ties, chains 54 47 47 53 62 67 70 81 - - - -
Chains, n.e.c. - - - 5 4 5 4 4 - - - -Rope, twine, string 29 18 19 26 25 40 40 36 - - - -Strapping - 5 - 4 - - 8 4 - - - -Wire--nonelectrical - 3 - - - - - - - - - -
Valves, nozzles 3 4 - 3 - - - - - - - -Hoisting accessories 3 5 - 3 4 3 - - - - - -Machine, tool, and electric parts 129 147 140 140 137 124 117 102 - - - -
Electric parts 105 129 111 107 113 97 99 88 - - - -Electrical wiring 43 55 49 49 52 29 39 29 - - - -Generators - - - - - - - 4 - - - -Motors - 3 - - - 3 - - - - - -
See footnotes at end of table. 137
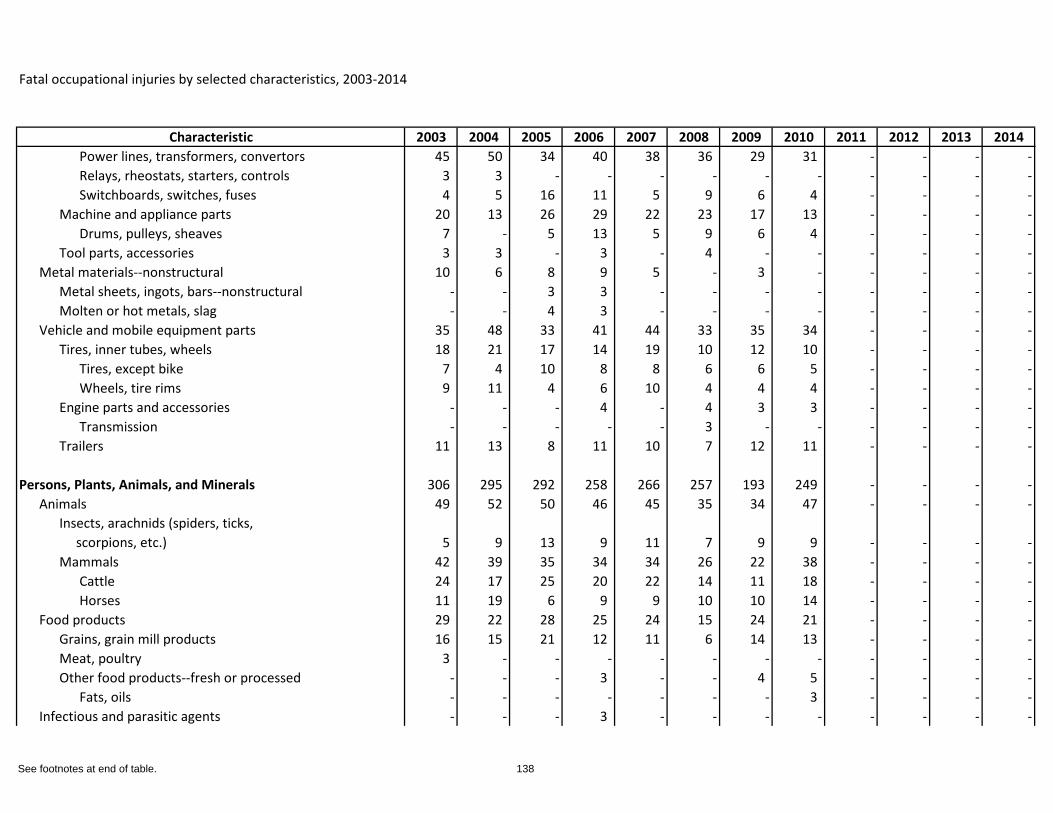
Fatal occupational injuries by selected characteristics, 2003-2014
Characteristic 2003 2004 2005 2006 2007 2008 2009 2010 2011 2012 2013 2014Power lines, transformers, convertors 45 50 34 40 38 36 29 31 - - - -Relays, rheostats, starters, controls 3 3 - - - - - - - - - -Switchboards, switches, fuses 4 5 16 11 5 9 6 4 - - - -
Machine and appliance parts 20 13 26 29 22 23 17 13 - - - -Drums, pulleys, sheaves 7 - 5 13 5 9 6 4 - - - -
Tool parts, accessories 3 3 - 3 - 4 - - - - - -Metal materials--nonstructural 10 6 8 9 5 - 3 - - - - -
Metal sheets, ingots, bars--nonstructural - - 3 3 - - - - - - - -Molten or hot metals, slag - - 4 3 - - - - - - - -
Vehicle and mobile equipment parts 35 48 33 41 44 33 35 34 - - - -Tires, inner tubes, wheels 18 21 17 14 19 10 12 10 - - - -
Tires, except bike 7 4 10 8 8 6 6 5 - - - -Wheels, tire rims 9 11 4 6 10 4 4 4 - - - -
Engine parts and accessories - - - 4 - 4 3 3 - - - -Transmission - - - - - 3 - - - - - -
Trailers 11 13 8 11 10 7 12 11 - - - -
Persons, Plants, Animals, and Minerals 306 295 292 258 266 257 193 249 - - - -Animals 49 52 50 46 45 35 34 47 - - - -
Insects, arachnids (spiders, ticks, scorpions, etc.) 5 9 13 9 11 7 9 9 - - - -Mammals 42 39 35 34 34 26 22 38 - - - -
Cattle 24 17 25 20 22 14 11 18 - - - -Horses 11 19 6 9 9 10 10 14 - - - -
Food products 29 22 28 25 24 15 24 21 - - - -Grains, grain mill products 16 15 21 12 11 6 14 13 - - - -Meat, poultry 3 - - - - - - - - - - -Other food products--fresh or processed - - - 3 - - 4 5 - - - -
Fats, oils - - - - - - - 3 - - - -Infectious and parasitic agents - - - 3 - - - - - - - -
See footnotes at end of table. 138
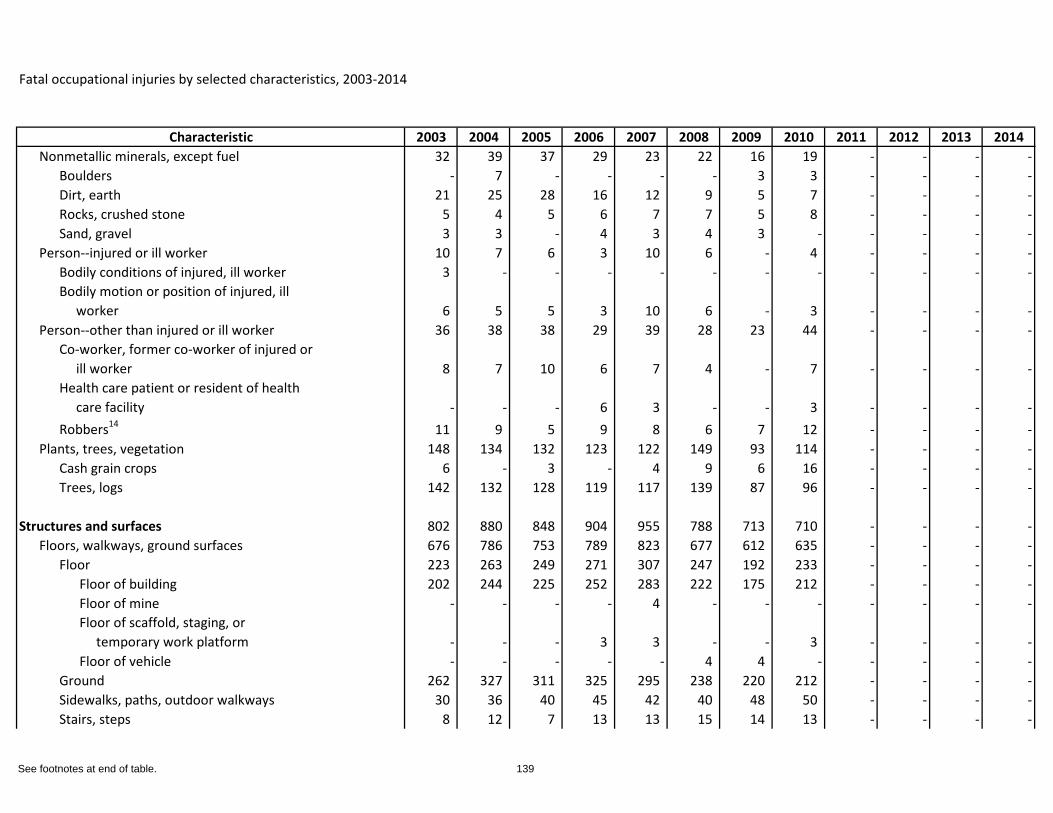
Fatal occupational injuries by selected characteristics, 2003-2014
Characteristic 2003 2004 2005 2006 2007 2008 2009 2010 2011 2012 2013 2014Nonmetallic minerals, except fuel 32 39 37 29 23 22 16 19 - - - -
Boulders - 7 - - - - 3 3 - - - -Dirt, earth 21 25 28 16 12 9 5 7 - - - -Rocks, crushed stone 5 4 5 6 7 7 5 8 - - - -Sand, gravel 3 3 - 4 3 4 3 - - - - -
Person--injured or ill worker 10 7 6 3 10 6 - 4 - - - -Bodily conditions of injured, ill worker 3 - - - - - - - - - - -Bodily motion or position of injured, ill worker 6 5 5 3 10 6 - 3 - - - -
Person--other than injured or ill worker 36 38 38 29 39 28 23 44 - - - -Co-worker, former co-worker of injured or ill worker 8 7 10 6 7 4 - 7 - - - -Health care patient or resident of health care facility - - - 6 3 - - 3 - - - -Robbers14 11 9 5 9 8 6 7 12 - - - -
Plants, trees, vegetation 148 134 132 123 122 149 93 114 - - - -Cash grain crops 6 - 3 - 4 9 6 16 - - - -Trees, logs 142 132 128 119 117 139 87 96 - - - -
Structures and surfaces 802 880 848 904 955 788 713 710 - - - -Floors, walkways, ground surfaces 676 786 753 789 823 677 612 635 - - - -
Floor 223 263 249 271 307 247 192 233 - - - -Floor of building 202 244 225 252 283 222 175 212 - - - -Floor of mine - - - - 4 - - - - - - -Floor of scaffold, staging, or temporary work platform - - - 3 3 - - 3 - - - -Floor of vehicle - - - - - 4 4 - - - - -
Ground 262 327 311 325 295 238 220 212 - - - -Sidewalks, paths, outdoor walkways 30 36 40 45 42 40 48 50 - - - -Stairs, steps 8 12 7 13 13 15 14 13 - - - -
See footnotes at end of table. 139
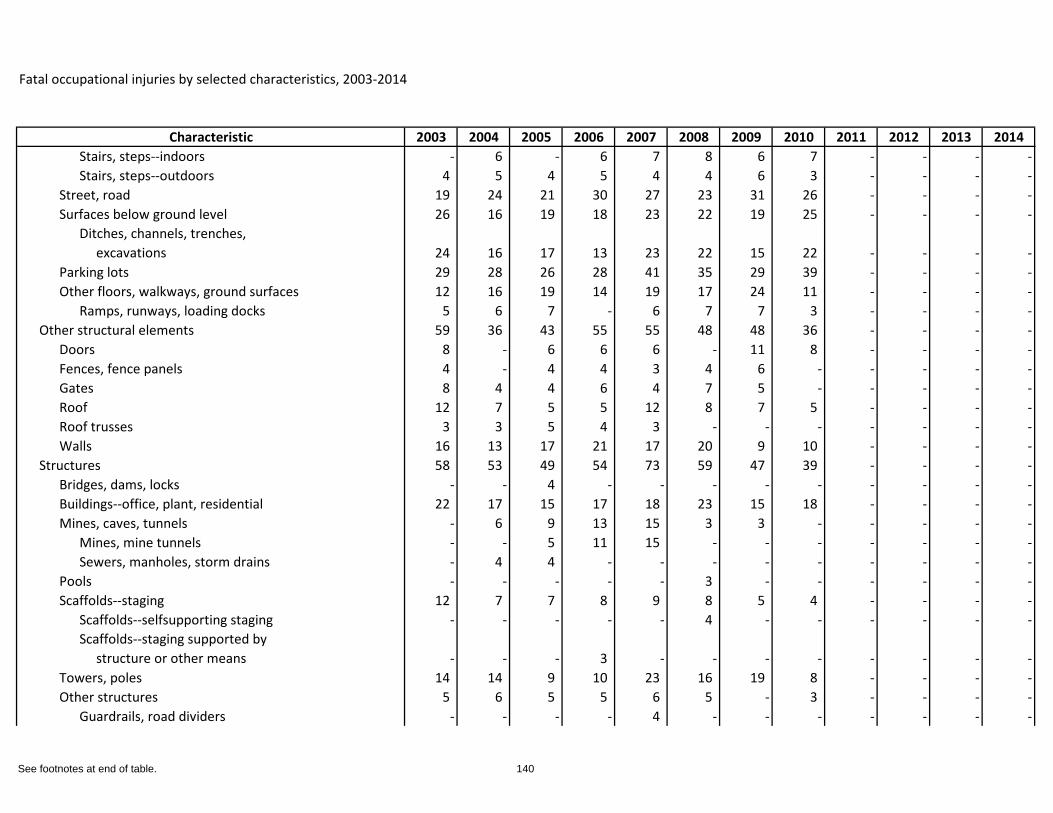
Fatal occupational injuries by selected characteristics, 2003-2014
Characteristic 2003 2004 2005 2006 2007 2008 2009 2010 2011 2012 2013 2014Stairs, steps--indoors - 6 - 6 7 8 6 7 - - - -Stairs, steps--outdoors 4 5 4 5 4 4 6 3 - - - -
Street, road 19 24 21 30 27 23 31 26 - - - -Surfaces below ground level 26 16 19 18 23 22 19 25 - - - -
Ditches, channels, trenches, excavations 24 16 17 13 23 22 15 22 - - - -
Parking lots 29 28 26 28 41 35 29 39 - - - -Other floors, walkways, ground surfaces 12 16 19 14 19 17 24 11 - - - -
Ramps, runways, loading docks 5 6 7 - 6 7 7 3 - - - -Other structural elements 59 36 43 55 55 48 48 36 - - - -
Doors 8 - 6 6 6 - 11 8 - - - -Fences, fence panels 4 - 4 4 3 4 6 - - - - -Gates 8 4 4 6 4 7 5 - - - - -Roof 12 7 5 5 12 8 7 5 - - - -Roof trusses 3 3 5 4 3 - - - - - - -Walls 16 13 17 21 17 20 9 10 - - - -
Structures 58 53 49 54 73 59 47 39 - - - -Bridges, dams, locks - - 4 - - - - - - - - -Buildings--office, plant, residential 22 17 15 17 18 23 15 18 - - - -Mines, caves, tunnels - 6 9 13 15 3 3 - - - - -
Mines, mine tunnels - - 5 11 15 - - - - - - -Sewers, manholes, storm drains - 4 4 - - - - - - - - -
Pools - - - - - 3 - - - - - -Scaffolds--staging 12 7 7 8 9 8 5 4 - - - -
Scaffolds--selfsupporting staging - - - - - 4 - - - - - -Scaffolds--staging supported by structure or other means - - - 3 - - - - - - - -
Towers, poles 14 14 9 10 23 16 19 8 - - - -Other structures 5 6 5 5 6 5 - 3 - - - -
Guardrails, road dividers - - - - 4 - - - - - - -
See footnotes at end of table. 140
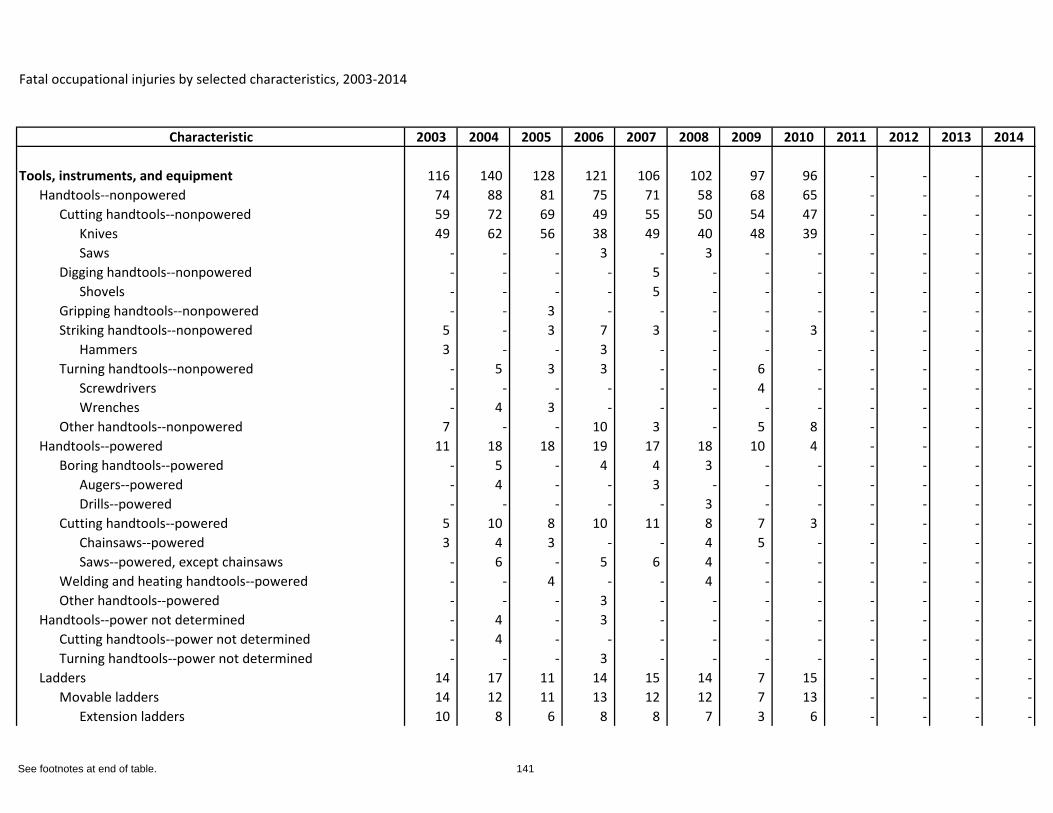
Fatal occupational injuries by selected characteristics, 2003-2014
Characteristic 2003 2004 2005 2006 2007 2008 2009 2010 2011 2012 2013 2014
Tools, instruments, and equipment 116 140 128 121 106 102 97 96 - - - -Handtools--nonpowered 74 88 81 75 71 58 68 65 - - - -
Cutting handtools--nonpowered 59 72 69 49 55 50 54 47 - - - -Knives 49 62 56 38 49 40 48 39 - - - -Saws - - - 3 - 3 - - - - - -
Digging handtools--nonpowered - - - - 5 - - - - - - -Shovels - - - - 5 - - - - - - -
Gripping handtools--nonpowered - - 3 - - - - - - - - -Striking handtools--nonpowered 5 - 3 7 3 - - 3 - - - -
Hammers 3 - - 3 - - - - - - - -Turning handtools--nonpowered - 5 3 3 - - 6 - - - - -
Screwdrivers - - - - - - 4 - - - - -Wrenches - 4 3 - - - - - - - - -
Other handtools--nonpowered 7 - - 10 3 - 5 8 - - - -Handtools--powered 11 18 18 19 17 18 10 4 - - - -
Boring handtools--powered - 5 - 4 4 3 - - - - - -Augers--powered - 4 - - 3 - - - - - - -Drills--powered - - - - - 3 - - - - - -
Cutting handtools--powered 5 10 8 10 11 8 7 3 - - - -Chainsaws--powered 3 4 3 - - 4 5 - - - - -Saws--powered, except chainsaws - 6 - 5 6 4 - - - - - -
Welding and heating handtools--powered - - 4 - - 4 - - - - - -Other handtools--powered - - - 3 - - - - - - - -
Handtools--power not determined - 4 - 3 - - - - - - - -Cutting handtools--power not determined - 4 - - - - - - - - - -Turning handtools--power not determined - - - 3 - - - - - - - -
Ladders 14 17 11 14 15 14 7 15 - - - -Movable ladders 14 12 11 13 12 12 7 13 - - - -
Extension ladders 10 8 6 8 8 7 3 6 - - - -
See footnotes at end of table. 141
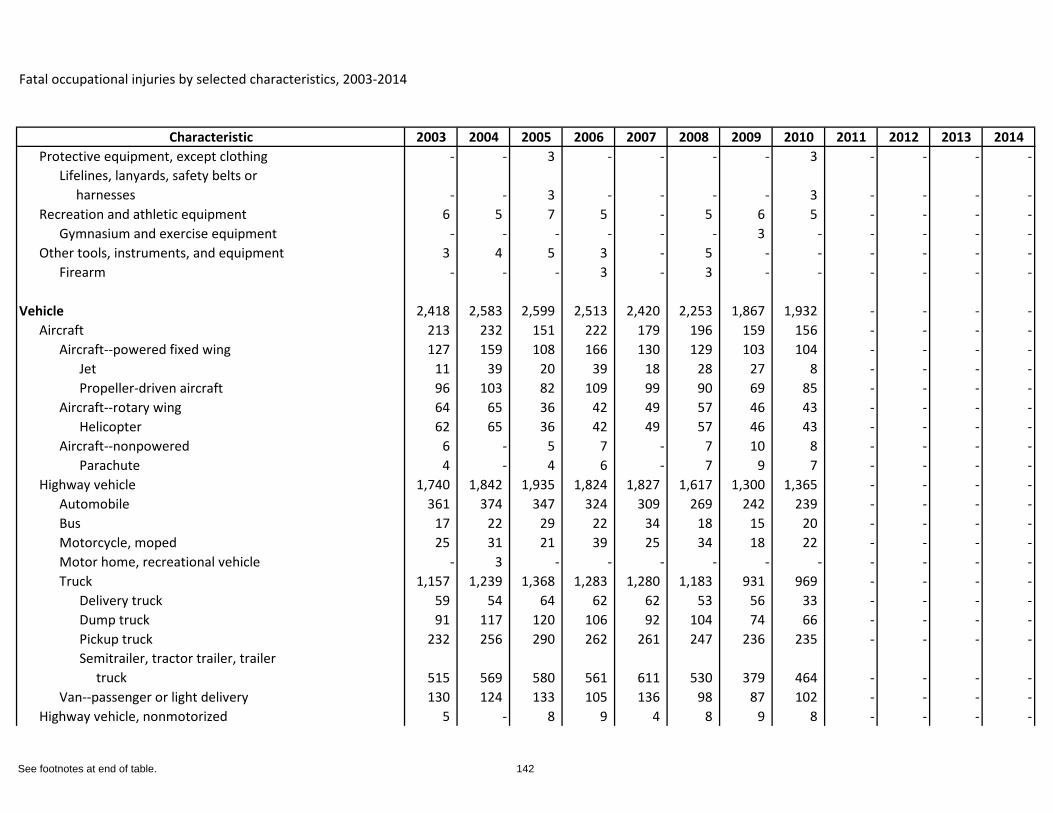
Fatal occupational injuries by selected characteristics, 2003-2014
Characteristic 2003 2004 2005 2006 2007 2008 2009 2010 2011 2012 2013 2014Protective equipment, except clothing - - 3 - - - - 3 - - - -
Lifelines, lanyards, safety belts or harnesses - - 3 - - - - 3 - - - -
Recreation and athletic equipment 6 5 7 5 - 5 6 5 - - - -Gymnasium and exercise equipment - - - - - - 3 - - - - -
Other tools, instruments, and equipment 3 4 5 3 - 5 - - - - - -Firearm - - - 3 - 3 - - - - - -
Vehicle 2,418 2,583 2,599 2,513 2,420 2,253 1,867 1,932 - - - -Aircraft 213 232 151 222 179 196 159 156 - - - -
Aircraft--powered fixed wing 127 159 108 166 130 129 103 104 - - - -Jet 11 39 20 39 18 28 27 8 - - - -Propeller-driven aircraft 96 103 82 109 99 90 69 85 - - - -
Aircraft--rotary wing 64 65 36 42 49 57 46 43 - - - -Helicopter 62 65 36 42 49 57 46 43 - - - -
Aircraft--nonpowered 6 - 5 7 - 7 10 8 - - - -Parachute 4 - 4 6 - 7 9 7 - - - -
Highway vehicle 1,740 1,842 1,935 1,824 1,827 1,617 1,300 1,365 - - - -Automobile 361 374 347 324 309 269 242 239 - - - -Bus 17 22 29 22 34 18 15 20 - - - -Motorcycle, moped 25 31 21 39 25 34 18 22 - - - -Motor home, recreational vehicle - 3 - - - - - - - - - -Truck 1,157 1,239 1,368 1,283 1,280 1,183 931 969 - - - -
Delivery truck 59 54 64 62 62 53 56 33 - - - -Dump truck 91 117 120 106 92 104 74 66 - - - -Pickup truck 232 256 290 262 261 247 236 235 - - - -Semitrailer, tractor trailer, trailer truck 515 569 580 561 611 530 379 464 - - - -
Van--passenger or light delivery 130 124 133 105 136 98 87 102 - - - -Highway vehicle, nonmotorized 5 - 8 9 4 8 9 8 - - - -
See footnotes at end of table. 142
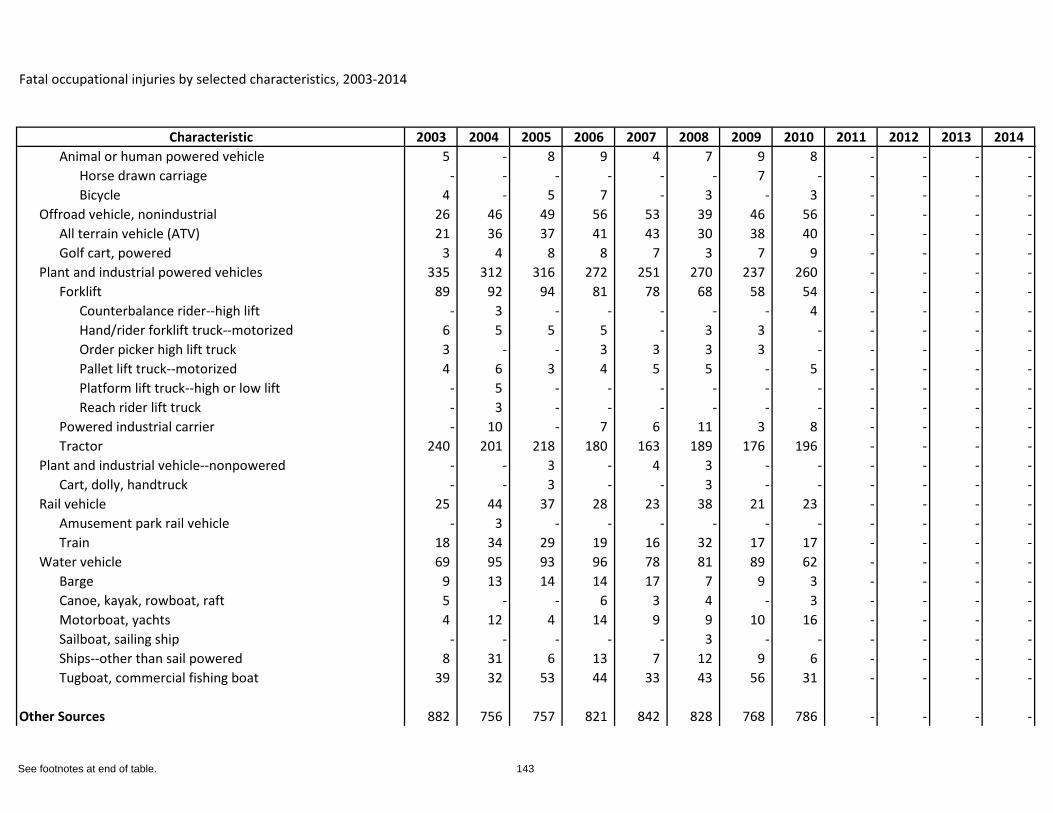
Fatal occupational injuries by selected characteristics, 2003-2014
Characteristic 2003 2004 2005 2006 2007 2008 2009 2010 2011 2012 2013 2014Animal or human powered vehicle 5 - 8 9 4 7 9 8 - - - -
Horse drawn carriage - - - - - - 7 - - - - -Bicycle 4 - 5 7 - 3 - 3 - - - -
Offroad vehicle, nonindustrial 26 46 49 56 53 39 46 56 - - - -All terrain vehicle (ATV) 21 36 37 41 43 30 38 40 - - - -Golf cart, powered 3 4 8 8 7 3 7 9 - - - -
Plant and industrial powered vehicles 335 312 316 272 251 270 237 260 - - - -Forklift 89 92 94 81 78 68 58 54 - - - -
Counterbalance rider--high lift - 3 - - - - - 4 - - - -Hand/rider forklift truck--motorized 6 5 5 5 - 3 3 - - - - -Order picker high lift truck 3 - - 3 3 3 3 - - - - -Pallet lift truck--motorized 4 6 3 4 5 5 - 5 - - - -Platform lift truck--high or low lift - 5 - - - - - - - - - -Reach rider lift truck - 3 - - - - - - - - - -
Powered industrial carrier - 10 - 7 6 11 3 8 - - - -Tractor 240 201 218 180 163 189 176 196 - - - -
Plant and industrial vehicle--nonpowered - - 3 - 4 3 - - - - - -Cart, dolly, handtruck - - 3 - - 3 - - - - - -
Rail vehicle 25 44 37 28 23 38 21 23 - - - -Amusement park rail vehicle - 3 - - - - - - - - - -Train 18 34 29 19 16 32 17 17 - - - -
Water vehicle 69 95 93 96 78 81 89 62 - - - -Barge 9 13 14 14 17 7 9 3 - - - -Canoe, kayak, rowboat, raft 5 - - 6 3 4 - 3 - - - -Motorboat, yachts 4 12 4 14 9 9 10 16 - - - -Sailboat, sailing ship - - - - - 3 - - - - - -Ships--other than sail powered 8 31 6 13 7 12 9 6 - - - -Tugboat, commercial fishing boat 39 32 53 44 33 43 56 31 - - - -
Other Sources 882 756 757 821 842 828 768 786 - - - -
See footnotes at end of table. 143
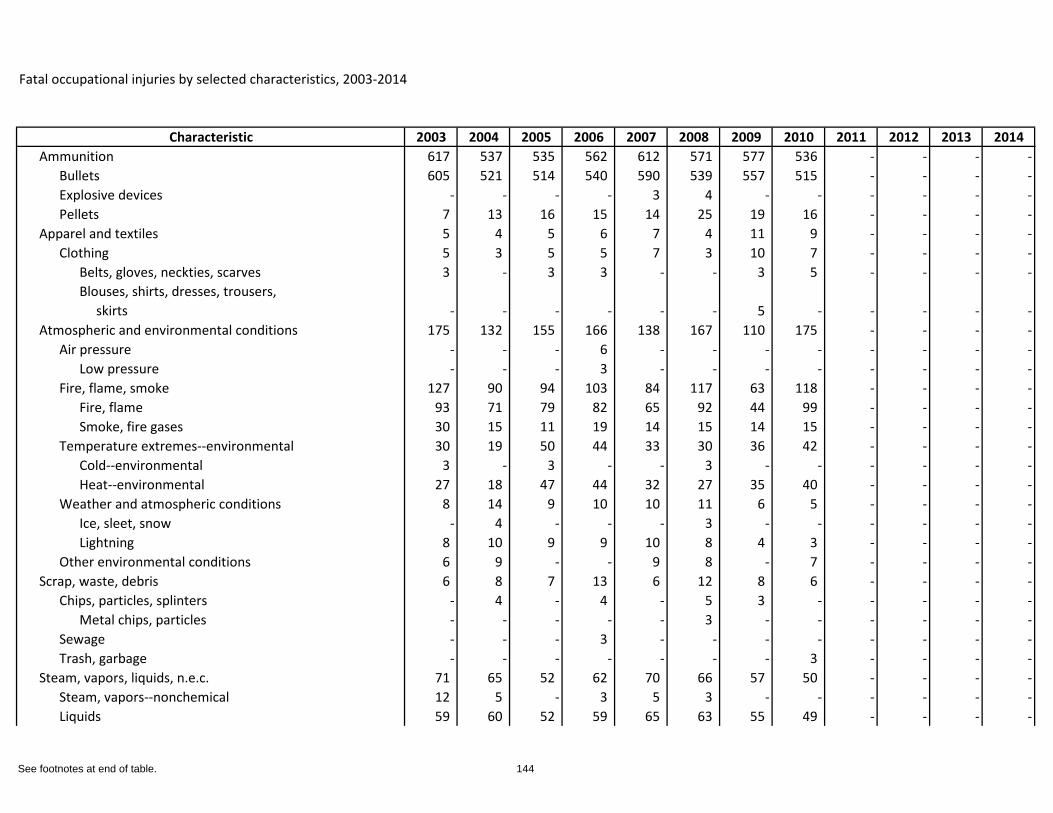
Fatal occupational injuries by selected characteristics, 2003-2014
Characteristic 2003 2004 2005 2006 2007 2008 2009 2010 2011 2012 2013 2014Ammunition 617 537 535 562 612 571 577 536 - - - -
Bullets 605 521 514 540 590 539 557 515 - - - -Explosive devices - - - - 3 4 - - - - - -Pellets 7 13 16 15 14 25 19 16 - - - -
Apparel and textiles 5 4 5 6 7 4 11 9 - - - -Clothing 5 3 5 5 7 3 10 7 - - - -
Belts, gloves, neckties, scarves 3 - 3 3 - - 3 5 - - - -Blouses, shirts, dresses, trousers, skirts - - - - - - 5 - - - - -
Atmospheric and environmental conditions 175 132 155 166 138 167 110 175 - - - -Air pressure - - - 6 - - - - - - - -
Low pressure - - - 3 - - - - - - - -Fire, flame, smoke 127 90 94 103 84 117 63 118 - - - -
Fire, flame 93 71 79 82 65 92 44 99 - - - -Smoke, fire gases 30 15 11 19 14 15 14 15 - - - -
Temperature extremes--environmental 30 19 50 44 33 30 36 42 - - - -Cold--environmental 3 - 3 - - 3 - - - - - -Heat--environmental 27 18 47 44 32 27 35 40 - - - -
Weather and atmospheric conditions 8 14 9 10 10 11 6 5 - - - -Ice, sleet, snow - 4 - - - 3 - - - - - -Lightning 8 10 9 9 10 8 4 3 - - - -
Other environmental conditions 6 9 - - 9 8 - 7 - - - -Scrap, waste, debris 6 8 7 13 6 12 8 6 - - - -
Chips, particles, splinters - 4 - 4 - 5 3 - - - - -Metal chips, particles - - - - - 3 - - - - - -
Sewage - - - 3 - - - - - - - -Trash, garbage - - - - - - - 3 - - - -
Steam, vapors, liquids, n.e.c. 71 65 52 62 70 66 57 50 - - - -Steam, vapors--nonchemical 12 5 - 3 5 3 - - - - - -Liquids 59 60 52 59 65 63 55 49 - - - -
See footnotes at end of table. 144
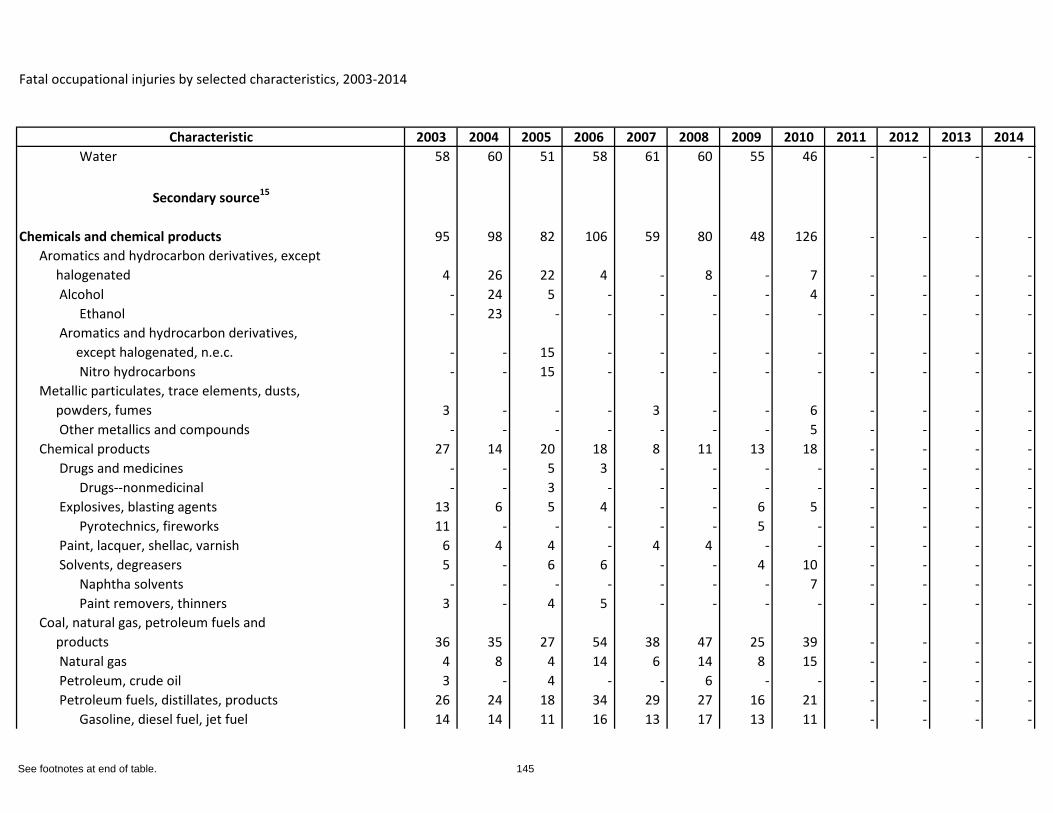
Fatal occupational injuries by selected characteristics, 2003-2014
Characteristic 2003 2004 2005 2006 2007 2008 2009 2010 2011 2012 2013 2014Water 58 60 51 58 61 60 55 46 - - - -
Secondary source15
Chemicals and chemical products 95 98 82 106 59 80 48 126 - - - -Aromatics and hydrocarbon derivatives, except halogenated 4 26 22 4 - 8 - 7 - - - -
Alcohol - 24 5 - - - - 4 - - - -Ethanol - 23 - - - - - - - - - -
Aromatics and hydrocarbon derivatives, except halogenated, n.e.c. - - 15 - - - - - - - - -
Nitro hydrocarbons - - 15 - - - - - - - - -Metallic particulates, trace elements, dusts, powders, fumes 3 - - - 3 - - 6 - - - -
Other metallics and compounds - - - - - - - 5 - - - -Chemical products 27 14 20 18 8 11 13 18 - - - -
Drugs and medicines - - 5 3 - - - - - - - -Drugs--nonmedicinal - - 3 - - - - - - - - -
Explosives, blasting agents 13 6 5 4 - - 6 5 - - - -Pyrotechnics, fireworks 11 - - - - - 5 - - - - -
Paint, lacquer, shellac, varnish 6 4 4 - 4 4 - - - - - -Solvents, degreasers 5 - 6 6 - - 4 10 - - - -
Naphtha solvents - - - - - - - 7 - - - -Paint removers, thinners 3 - 4 5 - - - - - - - -
Coal, natural gas, petroleum fuels and products 36 35 27 54 38 47 25 39 - - - -
Natural gas 4 8 4 14 6 14 8 15 - - - -Petroleum, crude oil 3 - 4 - - 6 - - - - - -Petroleum fuels, distillates, products 26 24 18 34 29 27 16 21 - - - -
Gasoline, diesel fuel, jet fuel 14 14 11 16 13 17 13 11 - - - -
See footnotes at end of table. 145
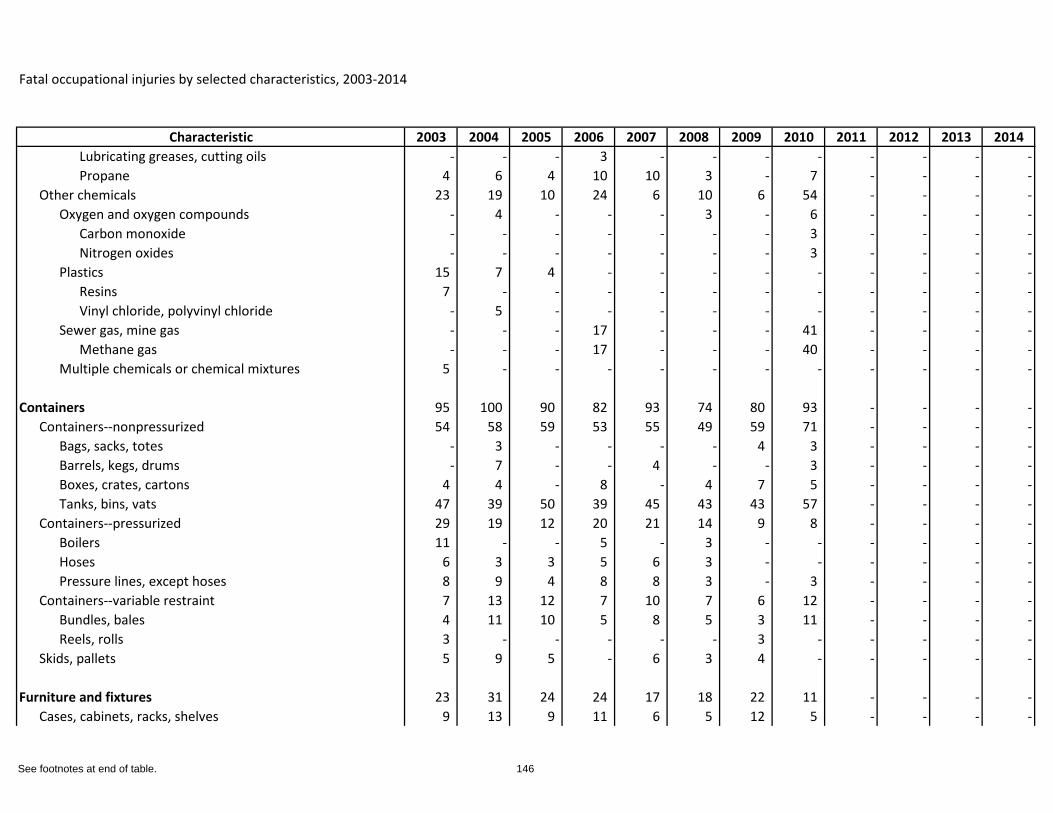
Fatal occupational injuries by selected characteristics, 2003-2014
Characteristic 2003 2004 2005 2006 2007 2008 2009 2010 2011 2012 2013 2014Lubricating greases, cutting oils - - - 3 - - - - - - - -Propane 4 6 4 10 10 3 - 7 - - - -
Other chemicals 23 19 10 24 6 10 6 54 - - - -Oxygen and oxygen compounds - 4 - - - 3 - 6 - - - -
Carbon monoxide - - - - - - - 3 - - - -Nitrogen oxides - - - - - - - 3 - - - -
Plastics 15 7 4 - - - - - - - - -Resins 7 - - - - - - - - - - -Vinyl chloride, polyvinyl chloride - 5 - - - - - - - - - -
Sewer gas, mine gas - - - 17 - - - 41 - - - -Methane gas - - - 17 - - - 40 - - - -
Multiple chemicals or chemical mixtures 5 - - - - - - - - - - -
Containers 95 100 90 82 93 74 80 93 - - - -Containers--nonpressurized 54 58 59 53 55 49 59 71 - - - -
Bags, sacks, totes - 3 - - - - 4 3 - - - -Barrels, kegs, drums - 7 - - 4 - - 3 - - - -Boxes, crates, cartons 4 4 - 8 - 4 7 5 - - - -Tanks, bins, vats 47 39 50 39 45 43 43 57 - - - -
Containers--pressurized 29 19 12 20 21 14 9 8 - - - -Boilers 11 - - 5 - 3 - - - - - -Hoses 6 3 3 5 6 3 - - - - - -Pressure lines, except hoses 8 9 4 8 8 3 - 3 - - - -
Containers--variable restraint 7 13 12 7 10 7 6 12 - - - -Bundles, bales 4 11 10 5 8 5 3 11 - - - -Reels, rolls 3 - - - - - 3 - - - - -
Skids, pallets 5 9 5 - 6 3 4 - - - - -
Furniture and fixtures 23 31 24 24 17 18 22 11 - - - -Cases, cabinets, racks, shelves 9 13 9 11 6 5 12 5 - - - -
See footnotes at end of table. 146
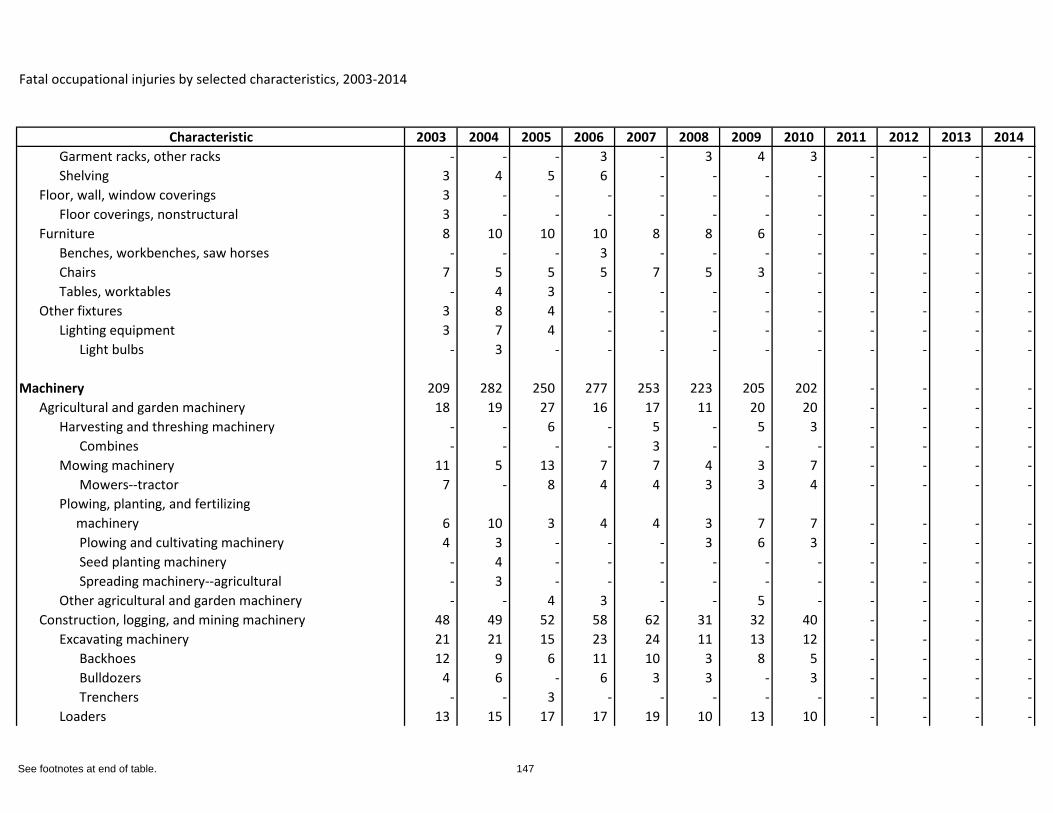
Fatal occupational injuries by selected characteristics, 2003-2014
Characteristic 2003 2004 2005 2006 2007 2008 2009 2010 2011 2012 2013 2014Garment racks, other racks - - - 3 - 3 4 3 - - - -Shelving 3 4 5 6 - - - - - - - -
Floor, wall, window coverings 3 - - - - - - - - - - -Floor coverings, nonstructural 3 - - - - - - - - - - -
Furniture 8 10 10 10 8 8 6 - - - - -Benches, workbenches, saw horses - - - 3 - - - - - - - -Chairs 7 5 5 5 7 5 3 - - - - -Tables, worktables - 4 3 - - - - - - - - -
Other fixtures 3 8 4 - - - - - - - - -Lighting equipment 3 7 4 - - - - - - - - -
Light bulbs - 3 - - - - - - - - - -
Machinery 209 282 250 277 253 223 205 202 - - - -Agricultural and garden machinery 18 19 27 16 17 11 20 20 - - - -
Harvesting and threshing machinery - - 6 - 5 - 5 3 - - - -Combines - - - - 3 - - - - - - -
Mowing machinery 11 5 13 7 7 4 3 7 - - - -Mowers--tractor 7 - 8 4 4 3 3 4 - - - -
Plowing, planting, and fertilizing machinery 6 10 3 4 4 3 7 7 - - - -
Plowing and cultivating machinery 4 3 - - - 3 6 3 - - - -Seed planting machinery - 4 - - - - - - - - - -Spreading machinery--agricultural - 3 - - - - - - - - - -
Other agricultural and garden machinery - - 4 3 - - 5 - - - - -Construction, logging, and mining machinery 48 49 52 58 62 31 32 40 - - - -
Excavating machinery 21 21 15 23 24 11 13 12 - - - -Backhoes 12 9 6 11 10 3 8 5 - - - -Bulldozers 4 6 - 6 3 3 - 3 - - - -Trenchers - - 3 - - - - - - - - -
Loaders 13 15 17 17 19 10 13 10 - - - -
See footnotes at end of table. 147
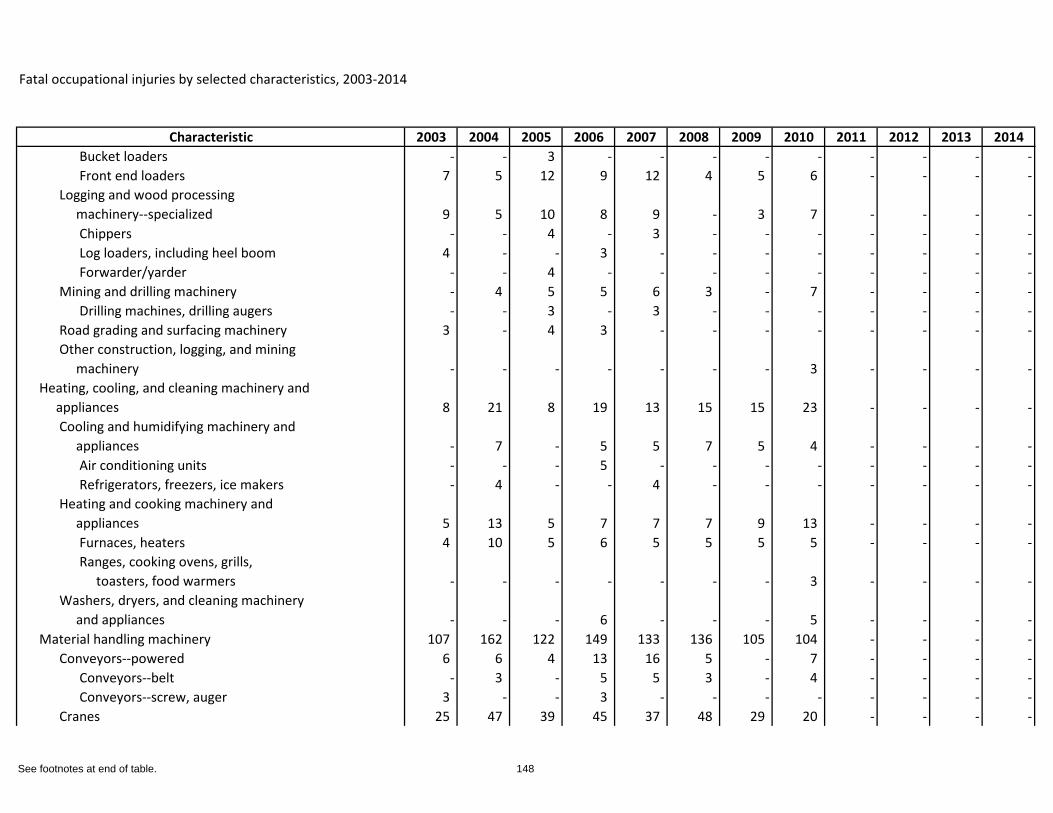
Fatal occupational injuries by selected characteristics, 2003-2014
Characteristic 2003 2004 2005 2006 2007 2008 2009 2010 2011 2012 2013 2014Bucket loaders - - 3 - - - - - - - - -Front end loaders 7 5 12 9 12 4 5 6 - - - -
Logging and wood processing machinery--specialized 9 5 10 8 9 - 3 7 - - - -
Chippers - - 4 - 3 - - - - - - -Log loaders, including heel boom 4 - - 3 - - - - - - - -Forwarder/yarder - - 4 - - - - - - - - -
Mining and drilling machinery - 4 5 5 6 3 - 7 - - - -Drilling machines, drilling augers - - 3 - 3 - - - - - - -
Road grading and surfacing machinery 3 - 4 3 - - - - - - - -Other construction, logging, and mining machinery - - - - - - - 3 - - - -
Heating, cooling, and cleaning machinery and appliances 8 21 8 19 13 15 15 23 - - - -
Cooling and humidifying machinery and appliances - 7 - 5 5 7 5 4 - - - -
Air conditioning units - - - 5 - - - - - - - -Refrigerators, freezers, ice makers - 4 - - 4 - - - - - - -
Heating and cooking machinery and appliances 5 13 5 7 7 7 9 13 - - - -
Furnaces, heaters 4 10 5 6 5 5 5 5 - - - -Ranges, cooking ovens, grills, toasters, food warmers - - - - - - - 3 - - - -
Washers, dryers, and cleaning machinery and appliances - - - 6 - - - 5 - - - -
Material handling machinery 107 162 122 149 133 136 105 104 - - - -Conveyors--powered 6 6 4 13 16 5 - 7 - - - -
Conveyors--belt - 3 - 5 5 3 - 4 - - - -Conveyors--screw, auger 3 - - 3 - - - - - - - -
Cranes 25 47 39 45 37 48 29 20 - - - -
See footnotes at end of table. 148
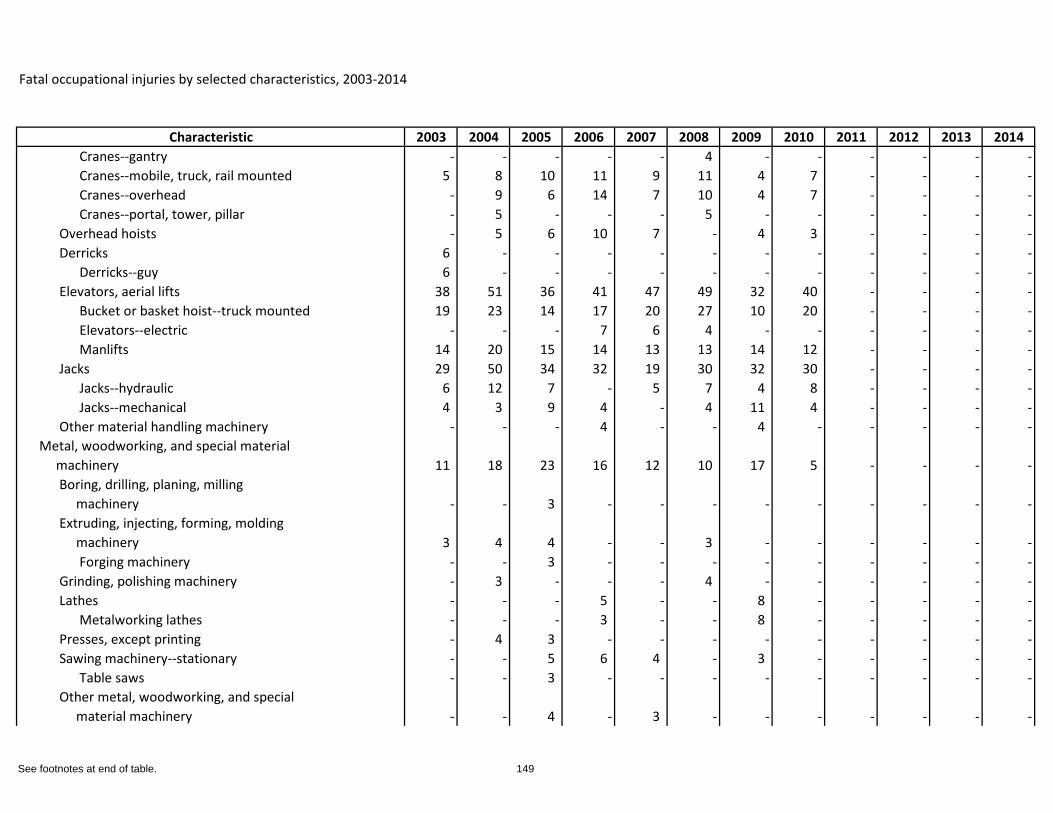
Fatal occupational injuries by selected characteristics, 2003-2014
Characteristic 2003 2004 2005 2006 2007 2008 2009 2010 2011 2012 2013 2014Cranes--gantry - - - - - 4 - - - - - -Cranes--mobile, truck, rail mounted 5 8 10 11 9 11 4 7 - - - -Cranes--overhead - 9 6 14 7 10 4 7 - - - -Cranes--portal, tower, pillar - 5 - - - 5 - - - - - -
Overhead hoists - 5 6 10 7 - 4 3 - - - -Derricks 6 - - - - - - - - - - -
Derricks--guy 6 - - - - - - - - - - -Elevators, aerial lifts 38 51 36 41 47 49 32 40 - - - -
Bucket or basket hoist--truck mounted 19 23 14 17 20 27 10 20 - - - -Elevators--electric - - - 7 6 4 - - - - - -Manlifts 14 20 15 14 13 13 14 12 - - - -
Jacks 29 50 34 32 19 30 32 30 - - - -Jacks--hydraulic 6 12 7 - 5 7 4 8 - - - -Jacks--mechanical 4 3 9 4 - 4 11 4 - - - -
Other material handling machinery - - - 4 - - 4 - - - - -Metal, woodworking, and special material machinery 11 18 23 16 12 10 17 5 - - - -
Boring, drilling, planing, milling machinery - - 3 - - - - - - - - -Extruding, injecting, forming, molding machinery 3 4 4 - - 3 - - - - - -
Forging machinery - - 3 - - - - - - - - -Grinding, polishing machinery - 3 - - - 4 - - - - - -Lathes - - - 5 - - 8 - - - - -
Metalworking lathes - - - 3 - - 8 - - - - -Presses, except printing - 4 3 - - - - - - - - -Sawing machinery--stationary - - 5 6 4 - 3 - - - - -
Table saws - - 3 - - - - - - - - -Other metal, woodworking, and special material machinery - - 4 - 3 - - - - - - -
See footnotes at end of table. 149
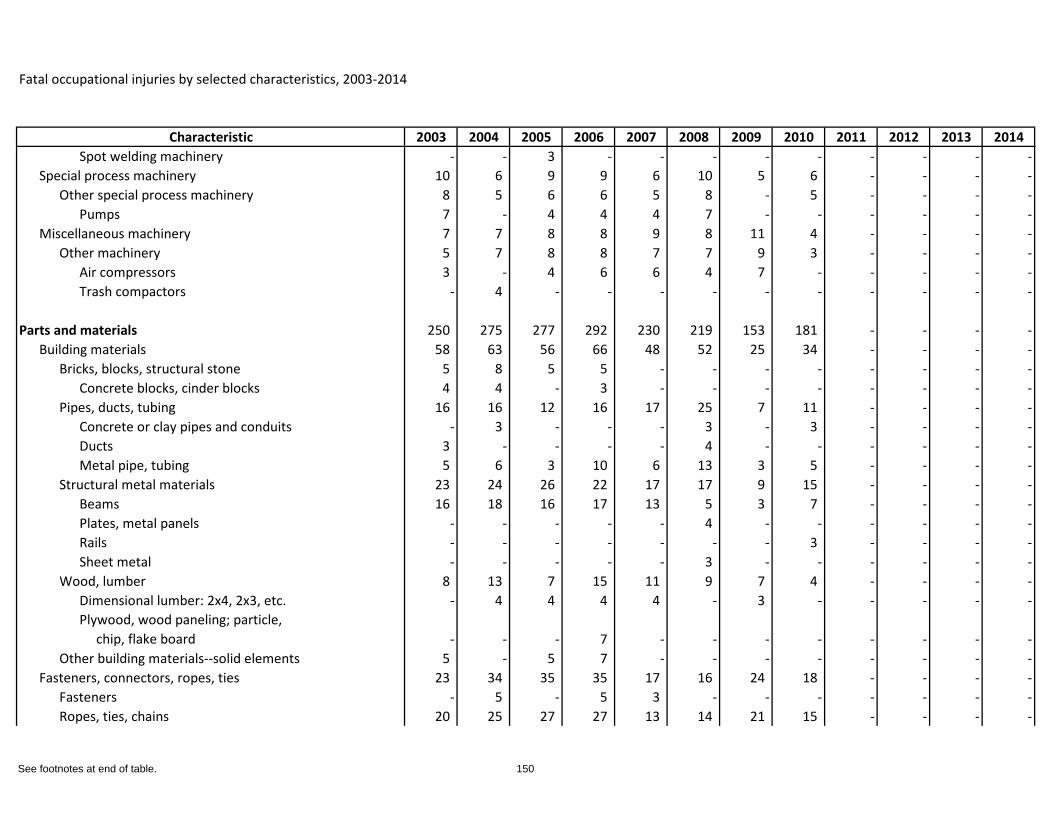
Fatal occupational injuries by selected characteristics, 2003-2014
Characteristic 2003 2004 2005 2006 2007 2008 2009 2010 2011 2012 2013 2014Spot welding machinery - - 3 - - - - - - - - -
Special process machinery 10 6 9 9 6 10 5 6 - - - -Other special process machinery 8 5 6 6 5 8 - 5 - - - -
Pumps 7 - 4 4 4 7 - - - - - -Miscellaneous machinery 7 7 8 8 9 8 11 4 - - - -
Other machinery 5 7 8 8 7 7 9 3 - - - -Air compressors 3 - 4 6 6 4 7 - - - - -Trash compactors - 4 - - - - - - - - - -
Parts and materials 250 275 277 292 230 219 153 181 - - - -Building materials 58 63 56 66 48 52 25 34 - - - -
Bricks, blocks, structural stone 5 8 5 5 - - - - - - - -Concrete blocks, cinder blocks 4 4 - 3 - - - - - - - -
Pipes, ducts, tubing 16 16 12 16 17 25 7 11 - - - -Concrete or clay pipes and conduits - 3 - - - 3 - 3 - - - -Ducts 3 - - - - 4 - - - - - -Metal pipe, tubing 5 6 3 10 6 13 3 5 - - - -
Structural metal materials 23 24 26 22 17 17 9 15 - - - -Beams 16 18 16 17 13 5 3 7 - - - -Plates, metal panels - - - - - 4 - - - - - -Rails - - - - - - - 3 - - - -Sheet metal - - - - - 3 - - - - - -
Wood, lumber 8 13 7 15 11 9 7 4 - - - -Dimensional lumber: 2x4, 2x3, etc. - 4 4 4 4 - 3 - - - - -Plywood, wood paneling; particle, chip, flake board - - - 7 - - - - - - - -
Other building materials--solid elements 5 - 5 7 - - - - - - - -Fasteners, connectors, ropes, ties 23 34 35 35 17 16 24 18 - - - -
Fasteners - 5 - 5 3 - - - - - - -Ropes, ties, chains 20 25 27 27 13 14 21 15 - - - -
See footnotes at end of table. 150
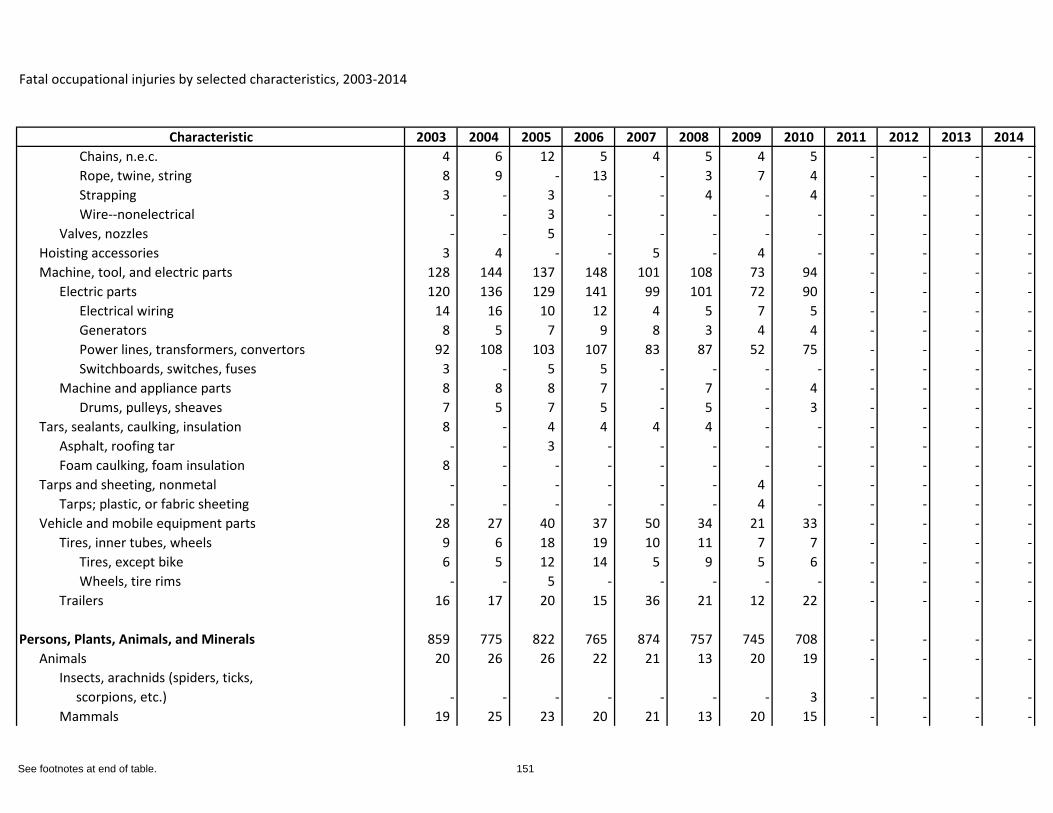
Fatal occupational injuries by selected characteristics, 2003-2014
Characteristic 2003 2004 2005 2006 2007 2008 2009 2010 2011 2012 2013 2014Chains, n.e.c. 4 6 12 5 4 5 4 5 - - - -Rope, twine, string 8 9 - 13 - 3 7 4 - - - -Strapping 3 - 3 - - 4 - 4 - - - -Wire--nonelectrical - - 3 - - - - - - - - -
Valves, nozzles - - 5 - - - - - - - - -Hoisting accessories 3 4 - - 5 - 4 - - - - -Machine, tool, and electric parts 128 144 137 148 101 108 73 94 - - - -
Electric parts 120 136 129 141 99 101 72 90 - - - -Electrical wiring 14 16 10 12 4 5 7 5 - - - -Generators 8 5 7 9 8 3 4 4 - - - -Power lines, transformers, convertors 92 108 103 107 83 87 52 75 - - - -Switchboards, switches, fuses 3 - 5 5 - - - - - - - -
Machine and appliance parts 8 8 8 7 - 7 - 4 - - - -Drums, pulleys, sheaves 7 5 7 5 - 5 - 3 - - - -
Tars, sealants, caulking, insulation 8 - 4 4 4 4 - - - - - -Asphalt, roofing tar - - 3 - - - - - - - - -Foam caulking, foam insulation 8 - - - - - - - - - - -
Tarps and sheeting, nonmetal - - - - - - 4 - - - - -Tarps; plastic, or fabric sheeting - - - - - - 4 - - - - -
Vehicle and mobile equipment parts 28 27 40 37 50 34 21 33 - - - -Tires, inner tubes, wheels 9 6 18 19 10 11 7 7 - - - -
Tires, except bike 6 5 12 14 5 9 5 6 - - - -Wheels, tire rims - - 5 - - - - - - - - -
Trailers 16 17 20 15 36 21 12 22 - - - -
Persons, Plants, Animals, and Minerals 859 775 822 765 874 757 745 708 - - - -Animals 20 26 26 22 21 13 20 19 - - - -
Insects, arachnids (spiders, ticks, scorpions, etc.) - - - - - - - 3 - - - -Mammals 19 25 23 20 21 13 20 15 - - - -
See footnotes at end of table. 151
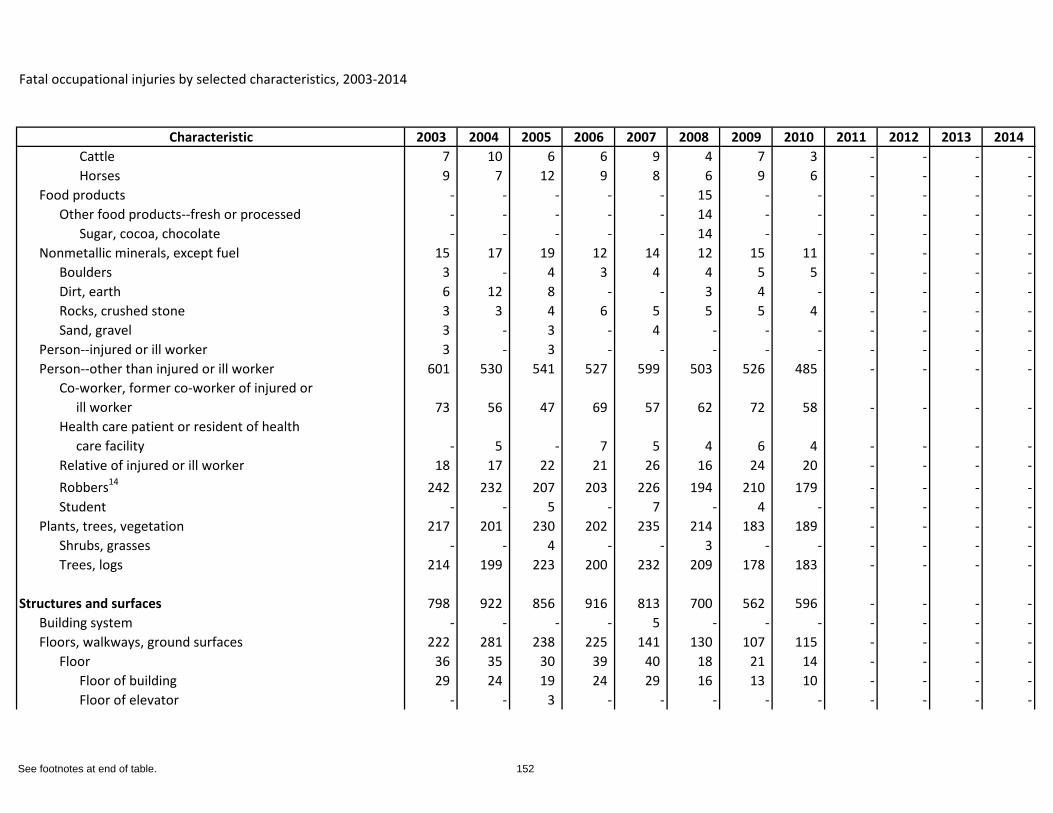
Fatal occupational injuries by selected characteristics, 2003-2014
Characteristic 2003 2004 2005 2006 2007 2008 2009 2010 2011 2012 2013 2014Cattle 7 10 6 6 9 4 7 3 - - - -Horses 9 7 12 9 8 6 9 6 - - - -
Food products - - - - - 15 - - - - - -Other food products--fresh or processed - - - - - 14 - - - - - -
Sugar, cocoa, chocolate - - - - - 14 - - - - - -Nonmetallic minerals, except fuel 15 17 19 12 14 12 15 11 - - - -
Boulders 3 - 4 3 4 4 5 5 - - - -Dirt, earth 6 12 8 - - 3 4 - - - - -Rocks, crushed stone 3 3 4 6 5 5 5 4 - - - -Sand, gravel 3 - 3 - 4 - - - - - - -
Person--injured or ill worker 3 - 3 - - - - - - - - -Person--other than injured or ill worker 601 530 541 527 599 503 526 485 - - - -
Co-worker, former co-worker of injured or ill worker 73 56 47 69 57 62 72 58 - - - -Health care patient or resident of health care facility - 5 - 7 5 4 6 4 - - - -Relative of injured or ill worker 18 17 22 21 26 16 24 20 - - - -Robbers14 242 232 207 203 226 194 210 179 - - - -Student - - 5 - 7 - 4 - - - - -
Plants, trees, vegetation 217 201 230 202 235 214 183 189 - - - -Shrubs, grasses - - 4 - - 3 - - - - - -Trees, logs 214 199 223 200 232 209 178 183 - - - -
Structures and surfaces 798 922 856 916 813 700 562 596 - - - -Building system - - - - 5 - - - - - - -Floors, walkways, ground surfaces 222 281 238 225 141 130 107 115 - - - -
Floor 36 35 30 39 40 18 21 14 - - - -Floor of building 29 24 19 24 29 16 13 10 - - - -Floor of elevator - - 3 - - - - - - - - -
See footnotes at end of table. 152
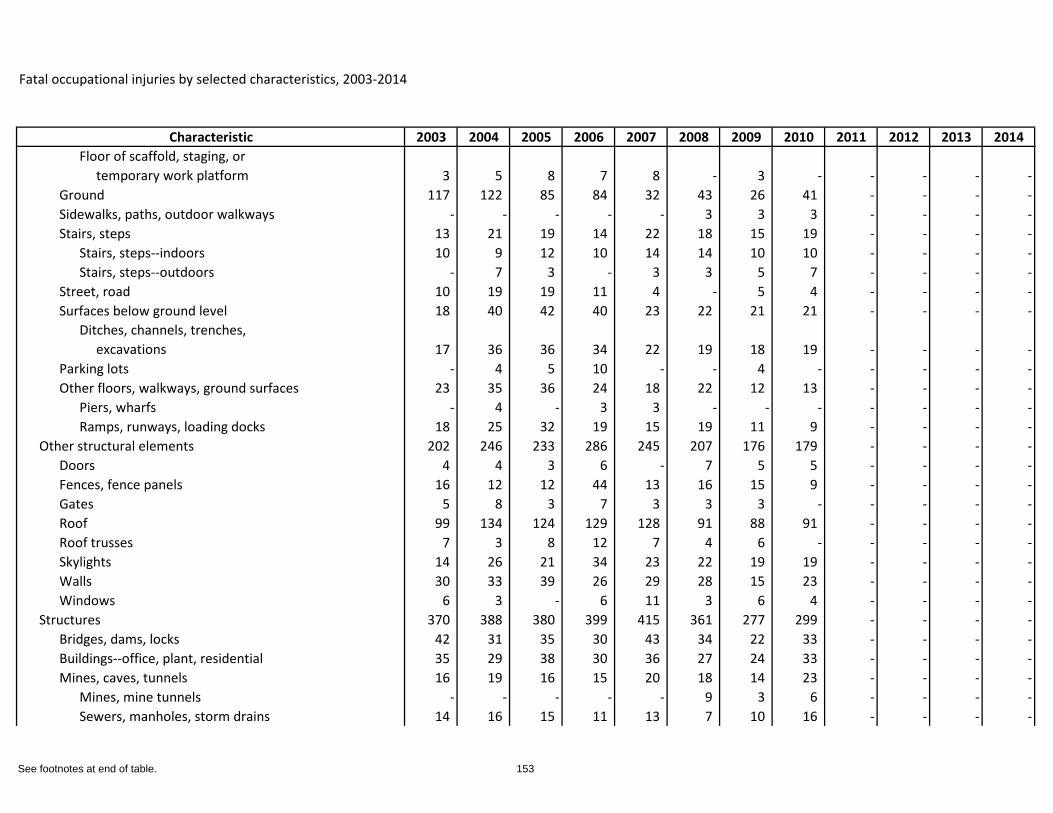
Fatal occupational injuries by selected characteristics, 2003-2014
Characteristic 2003 2004 2005 2006 2007 2008 2009 2010 2011 2012 2013 2014Floor of scaffold, staging, or temporary work platform 3 5 8 7 8 - 3 - - - - -
Ground 117 122 85 84 32 43 26 41 - - - -Sidewalks, paths, outdoor walkways - - - - - 3 3 3 - - - -Stairs, steps 13 21 19 14 22 18 15 19 - - - -
Stairs, steps--indoors 10 9 12 10 14 14 10 10 - - - -Stairs, steps--outdoors - 7 3 - 3 3 5 7 - - - -
Street, road 10 19 19 11 4 - 5 4 - - - -Surfaces below ground level 18 40 42 40 23 22 21 21 - - - -
Ditches, channels, trenches, excavations 17 36 36 34 22 19 18 19 - - - -
Parking lots - 4 5 10 - - 4 - - - - -Other floors, walkways, ground surfaces 23 35 36 24 18 22 12 13 - - - -
Piers, wharfs - 4 - 3 3 - - - - - - -Ramps, runways, loading docks 18 25 32 19 15 19 11 9 - - - -
Other structural elements 202 246 233 286 245 207 176 179 - - - -Doors 4 4 3 6 - 7 5 5 - - - -Fences, fence panels 16 12 12 44 13 16 15 9 - - - -Gates 5 8 3 7 3 3 3 - - - - -Roof 99 134 124 129 128 91 88 91 - - - -Roof trusses 7 3 8 12 7 4 6 - - - - -Skylights 14 26 21 34 23 22 19 19 - - - -Walls 30 33 39 26 29 28 15 23 - - - -Windows 6 3 - 6 11 3 6 4 - - - -
Structures 370 388 380 399 415 361 277 299 - - - -Bridges, dams, locks 42 31 35 30 43 34 22 33 - - - -Buildings--office, plant, residential 35 29 38 30 36 27 24 33 - - - -Mines, caves, tunnels 16 19 16 15 20 18 14 23 - - - -
Mines, mine tunnels - - - - - 9 3 6 - - - -Sewers, manholes, storm drains 14 16 15 11 13 7 10 16 - - - -
See footnotes at end of table. 153
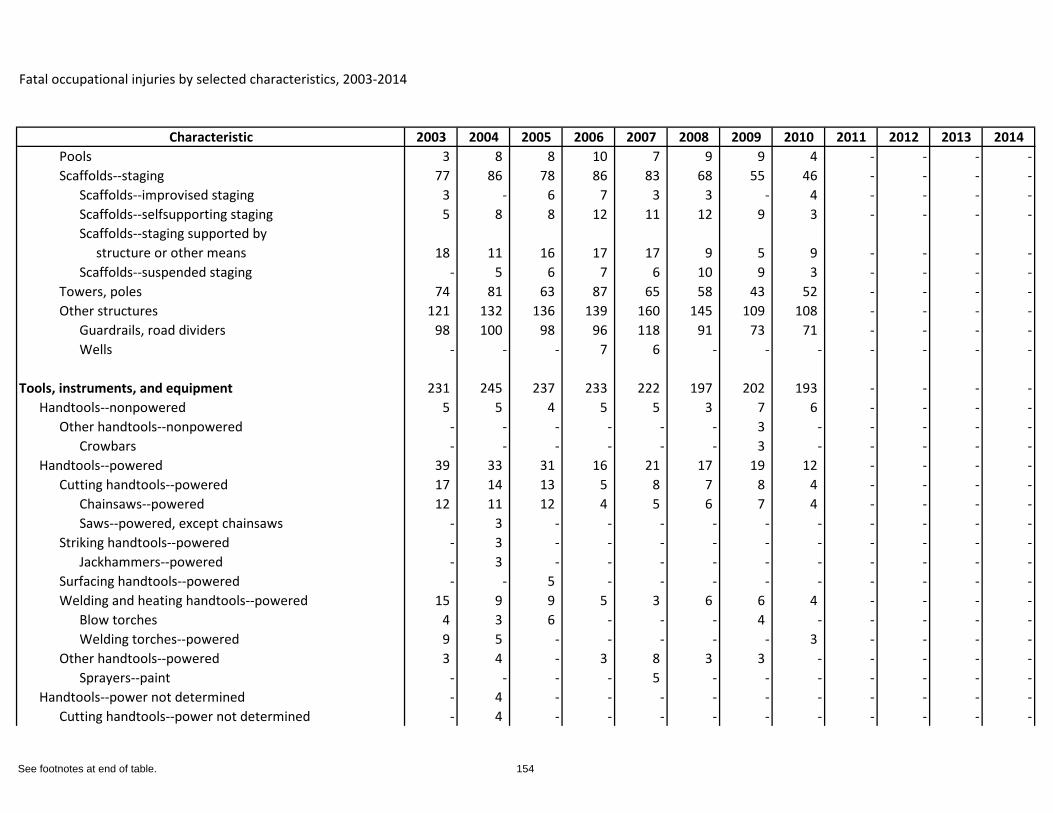
Fatal occupational injuries by selected characteristics, 2003-2014
Characteristic 2003 2004 2005 2006 2007 2008 2009 2010 2011 2012 2013 2014Pools 3 8 8 10 7 9 9 4 - - - -Scaffolds--staging 77 86 78 86 83 68 55 46 - - - -
Scaffolds--improvised staging 3 - 6 7 3 3 - 4 - - - -Scaffolds--selfsupporting staging 5 8 8 12 11 12 9 3 - - - -Scaffolds--staging supported by structure or other means 18 11 16 17 17 9 5 9 - - - -Scaffolds--suspended staging - 5 6 7 6 10 9 3 - - - -
Towers, poles 74 81 63 87 65 58 43 52 - - - -Other structures 121 132 136 139 160 145 109 108 - - - -
Guardrails, road dividers 98 100 98 96 118 91 73 71 - - - -Wells - - - 7 6 - - - - - - -
Tools, instruments, and equipment 231 245 237 233 222 197 202 193 - - - -Handtools--nonpowered 5 5 4 5 5 3 7 6 - - - -
Other handtools--nonpowered - - - - - - 3 - - - - -Crowbars - - - - - - 3 - - - - -
Handtools--powered 39 33 31 16 21 17 19 12 - - - -Cutting handtools--powered 17 14 13 5 8 7 8 4 - - - -
Chainsaws--powered 12 11 12 4 5 6 7 4 - - - -Saws--powered, except chainsaws - 3 - - - - - - - - - -
Striking handtools--powered - 3 - - - - - - - - - -Jackhammers--powered - 3 - - - - - - - - - -
Surfacing handtools--powered - - 5 - - - - - - - - -Welding and heating handtools--powered 15 9 9 5 3 6 6 4 - - - -
Blow torches 4 3 6 - - - 4 - - - - -Welding torches--powered 9 5 - - - - - 3 - - - -
Other handtools--powered 3 4 - 3 8 3 3 - - - - -Sprayers--paint - - - - 5 - - - - - - -
Handtools--power not determined - 4 - - - - - - - - - -Cutting handtools--power not determined - 4 - - - - - - - - - -
See footnotes at end of table. 154
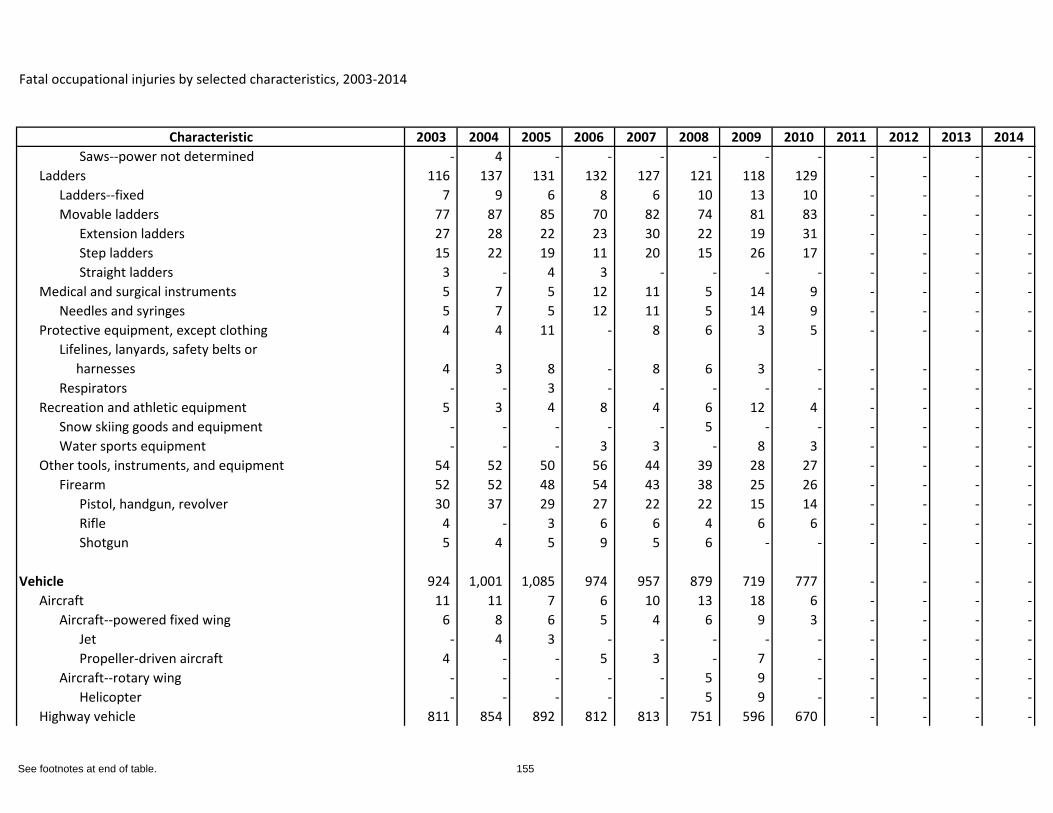
Fatal occupational injuries by selected characteristics, 2003-2014
Characteristic 2003 2004 2005 2006 2007 2008 2009 2010 2011 2012 2013 2014Saws--power not determined - 4 - - - - - - - - - -
Ladders 116 137 131 132 127 121 118 129 - - - -Ladders--fixed 7 9 6 8 6 10 13 10 - - - -Movable ladders 77 87 85 70 82 74 81 83 - - - -
Extension ladders 27 28 22 23 30 22 19 31 - - - -Step ladders 15 22 19 11 20 15 26 17 - - - -Straight ladders 3 - 4 3 - - - - - - - -
Medical and surgical instruments 5 7 5 12 11 5 14 9 - - - -Needles and syringes 5 7 5 12 11 5 14 9 - - - -
Protective equipment, except clothing 4 4 11 - 8 6 3 5 - - - -Lifelines, lanyards, safety belts or harnesses 4 3 8 - 8 6 3 - - - - -Respirators - - 3 - - - - - - - - -
Recreation and athletic equipment 5 3 4 8 4 6 12 4 - - - -Snow skiing goods and equipment - - - - - 5 - - - - - -Water sports equipment - - - 3 3 - 8 3 - - - -
Other tools, instruments, and equipment 54 52 50 56 44 39 28 27 - - - -Firearm 52 52 48 54 43 38 25 26 - - - -
Pistol, handgun, revolver 30 37 29 27 22 22 15 14 - - - -Rifle 4 - 3 6 6 4 6 6 - - - -Shotgun 5 4 5 9 5 6 - - - - - -
Vehicle 924 1,001 1,085 974 957 879 719 777 - - - -Aircraft 11 11 7 6 10 13 18 6 - - - -
Aircraft--powered fixed wing 6 8 6 5 4 6 9 3 - - - -Jet - 4 3 - - - - - - - - -Propeller-driven aircraft 4 - - 5 3 - 7 - - - - -
Aircraft--rotary wing - - - - - 5 9 - - - - -Helicopter - - - - - 5 9 - - - - -
Highway vehicle 811 854 892 812 813 751 596 670 - - - -
See footnotes at end of table. 155
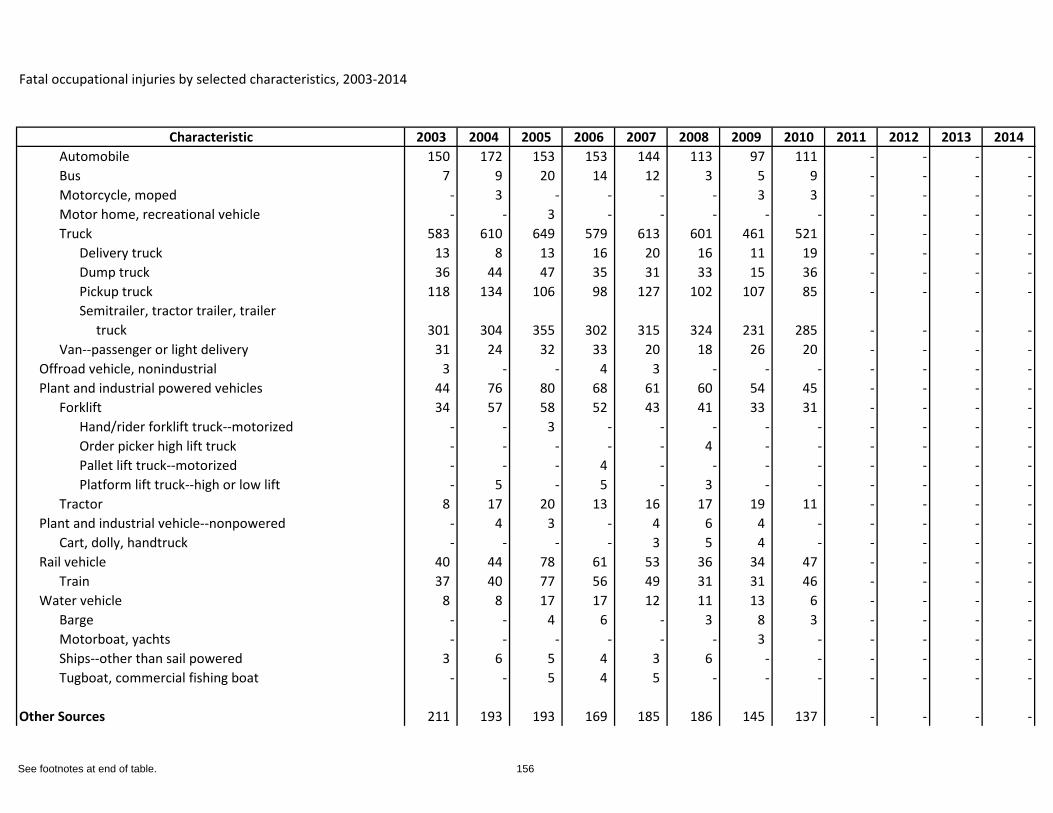
Fatal occupational injuries by selected characteristics, 2003-2014
Characteristic 2003 2004 2005 2006 2007 2008 2009 2010 2011 2012 2013 2014Automobile 150 172 153 153 144 113 97 111 - - - -Bus 7 9 20 14 12 3 5 9 - - - -Motorcycle, moped - 3 - - - - 3 3 - - - -Motor home, recreational vehicle - - 3 - - - - - - - - -Truck 583 610 649 579 613 601 461 521 - - - -
Delivery truck 13 8 13 16 20 16 11 19 - - - -Dump truck 36 44 47 35 31 33 15 36 - - - -Pickup truck 118 134 106 98 127 102 107 85 - - - -Semitrailer, tractor trailer, trailer truck 301 304 355 302 315 324 231 285 - - - -
Van--passenger or light delivery 31 24 32 33 20 18 26 20 - - - -Offroad vehicle, nonindustrial 3 - - 4 3 - - - - - - -Plant and industrial powered vehicles 44 76 80 68 61 60 54 45 - - - -
Forklift 34 57 58 52 43 41 33 31 - - - -Hand/rider forklift truck--motorized - - 3 - - - - - - - - -Order picker high lift truck - - - - - 4 - - - - - -Pallet lift truck--motorized - - - 4 - - - - - - - -Platform lift truck--high or low lift - 5 - 5 - 3 - - - - - -
Tractor 8 17 20 13 16 17 19 11 - - - -Plant and industrial vehicle--nonpowered - 4 3 - 4 6 4 - - - - -
Cart, dolly, handtruck - - - - 3 5 4 - - - - -Rail vehicle 40 44 78 61 53 36 34 47 - - - -
Train 37 40 77 56 49 31 31 46 - - - -Water vehicle 8 8 17 17 12 11 13 6 - - - -
Barge - - 4 6 - 3 8 3 - - - -Motorboat, yachts - - - - - - 3 - - - - -Ships--other than sail powered 3 6 5 4 3 6 - - - - - -Tugboat, commercial fishing boat - - 5 4 5 - - - - - - -
Other Sources 211 193 193 169 185 186 145 137 - - - -
See footnotes at end of table. 156
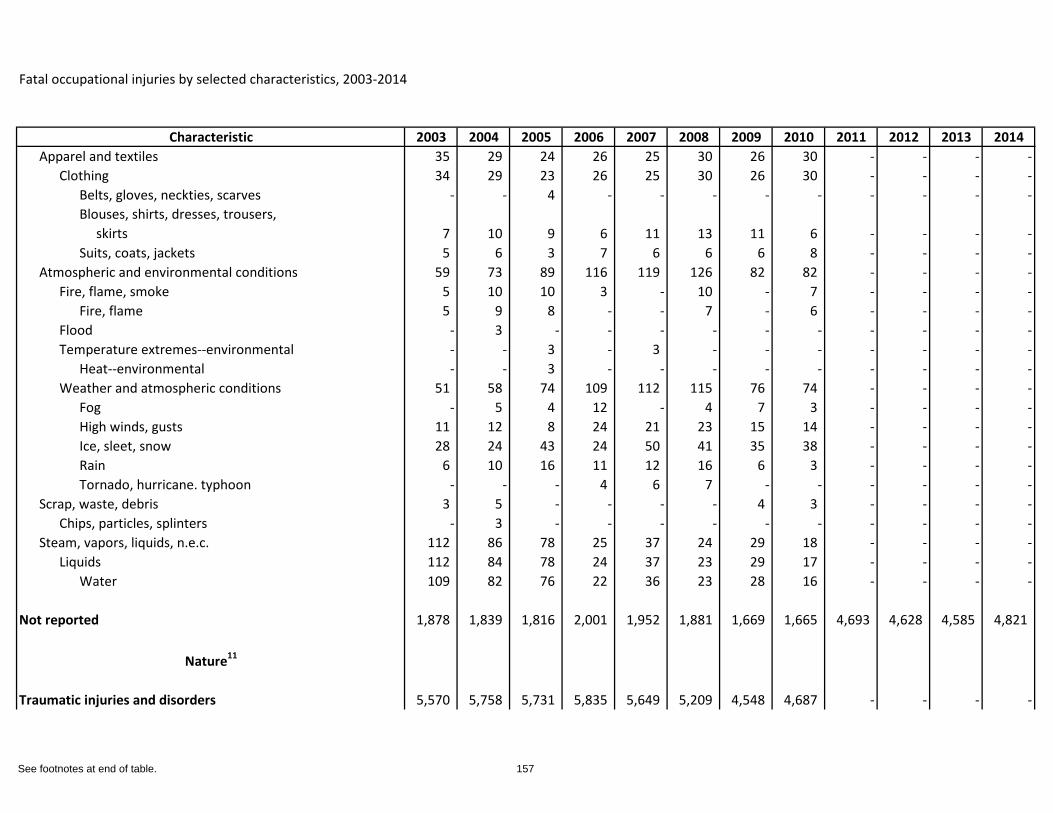
Fatal occupational injuries by selected characteristics, 2003-2014
Characteristic 2003 2004 2005 2006 2007 2008 2009 2010 2011 2012 2013 2014Apparel and textiles 35 29 24 26 25 30 26 30 - - - -
Clothing 34 29 23 26 25 30 26 30 - - - -Belts, gloves, neckties, scarves - - 4 - - - - - - - - -Blouses, shirts, dresses, trousers, skirts 7 10 9 6 11 13 11 6 - - - -Suits, coats, jackets 5 6 3 7 6 6 6 8 - - - -
Atmospheric and environmental conditions 59 73 89 116 119 126 82 82 - - - -Fire, flame, smoke 5 10 10 3 - 10 - 7 - - - -
Fire, flame 5 9 8 - - 7 - 6 - - - -Flood - 3 - - - - - - - - - -Temperature extremes--environmental - - 3 - 3 - - - - - - -
Heat--environmental - - 3 - - - - - - - - -Weather and atmospheric conditions 51 58 74 109 112 115 76 74 - - - -
Fog - 5 4 12 - 4 7 3 - - - -High winds, gusts 11 12 8 24 21 23 15 14 - - - -Ice, sleet, snow 28 24 43 24 50 41 35 38 - - - -Rain 6 10 16 11 12 16 6 3 - - - -Tornado, hurricane. typhoon - - - 4 6 7 - - - - - -
Scrap, waste, debris 3 5 - - - - 4 3 - - - -Chips, particles, splinters - 3 - - - - - - - - - -
Steam, vapors, liquids, n.e.c. 112 86 78 25 37 24 29 18 - - - -Liquids 112 84 78 24 37 23 29 17 - - - -
Water 109 82 76 22 36 23 28 16 - - - -
Not reported 1,878 1,839 1,816 2,001 1,952 1,881 1,669 1,665 4,693 4,628 4,585 4,821
Nature11
Traumatic injuries and disorders 5,570 5,758 5,731 5,835 5,649 5,209 4,548 4,687 - - - -
See footnotes at end of table. 157
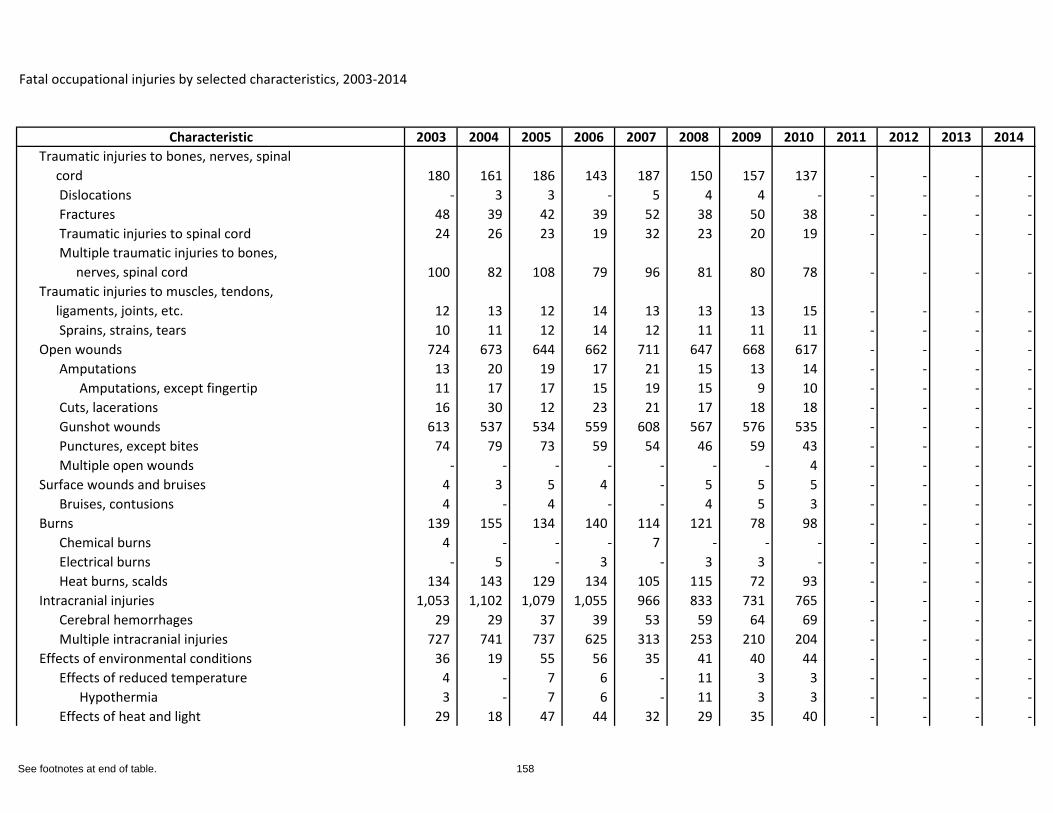
Fatal occupational injuries by selected characteristics, 2003-2014
Characteristic 2003 2004 2005 2006 2007 2008 2009 2010 2011 2012 2013 2014Traumatic injuries to bones, nerves, spinal cord 180 161 186 143 187 150 157 137 - - - -
Dislocations - 3 3 - 5 4 4 - - - - -Fractures 48 39 42 39 52 38 50 38 - - - -Traumatic injuries to spinal cord 24 26 23 19 32 23 20 19 - - - -Multiple traumatic injuries to bones, nerves, spinal cord 100 82 108 79 96 81 80 78 - - - -
Traumatic injuries to muscles, tendons, ligaments, joints, etc. 12 13 12 14 13 13 13 15 - - - -
Sprains, strains, tears 10 11 12 14 12 11 11 11 - - - -Open wounds 724 673 644 662 711 647 668 617 - - - -
Amputations 13 20 19 17 21 15 13 14 - - - -Amputations, except fingertip 11 17 17 15 19 15 9 10 - - - -
Cuts, lacerations 16 30 12 23 21 17 18 18 - - - -Gunshot wounds 613 537 534 559 608 567 576 535 - - - -Punctures, except bites 74 79 73 59 54 46 59 43 - - - -Multiple open wounds - - - - - - - 4 - - - -
Surface wounds and bruises 4 3 5 4 - 5 5 5 - - - -Bruises, contusions 4 - 4 - - 4 5 3 - - - -
Burns 139 155 134 140 114 121 78 98 - - - -Chemical burns 4 - - - 7 - - - - - - -Electrical burns - 5 - 3 - 3 3 - - - - -Heat burns, scalds 134 143 129 134 105 115 72 93 - - - -
Intracranial injuries 1,053 1,102 1,079 1,055 966 833 731 765 - - - -Cerebral hemorrhages 29 29 37 39 53 59 64 69 - - - -Multiple intracranial injuries 727 741 737 625 313 253 210 204 - - - -
Effects of environmental conditions 36 19 55 56 35 41 40 44 - - - -Effects of reduced temperature 4 - 7 6 - 11 3 3 - - - -
Hypothermia 3 - 7 6 - 11 3 3 - - - -Effects of heat and light 29 18 47 44 32 29 35 40 - - - -
See footnotes at end of table. 158
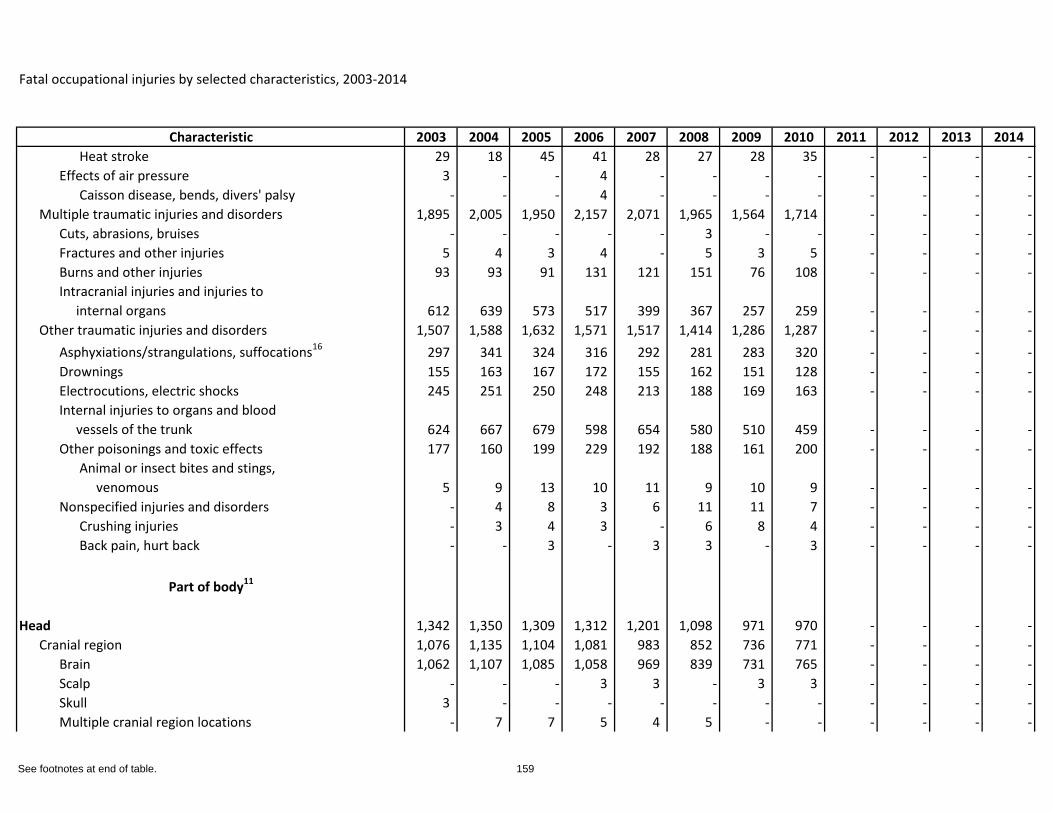
Fatal occupational injuries by selected characteristics, 2003-2014
Characteristic 2003 2004 2005 2006 2007 2008 2009 2010 2011 2012 2013 2014Heat stroke 29 18 45 41 28 27 28 35 - - - -
Effects of air pressure 3 - - 4 - - - - - - - -Caisson disease, bends, divers' palsy - - - 4 - - - - - - - -
Multiple traumatic injuries and disorders 1,895 2,005 1,950 2,157 2,071 1,965 1,564 1,714 - - - -Cuts, abrasions, bruises - - - - - 3 - - - - - -Fractures and other injuries 5 4 3 4 - 5 3 5 - - - -Burns and other injuries 93 93 91 131 121 151 76 108 - - - -Intracranial injuries and injuries to internal organs 612 639 573 517 399 367 257 259 - - - -
Other traumatic injuries and disorders 1,507 1,588 1,632 1,571 1,517 1,414 1,286 1,287 - - - -Asphyxiations/strangulations, suffocations16 297 341 324 316 292 281 283 320 - - - -Drownings 155 163 167 172 155 162 151 128 - - - -Electrocutions, electric shocks 245 251 250 248 213 188 169 163 - - - -Internal injuries to organs and blood vessels of the trunk 624 667 679 598 654 580 510 459 - - - -Other poisonings and toxic effects 177 160 199 229 192 188 161 200 - - - -
Animal or insect bites and stings, venomous 5 9 13 10 11 9 10 9 - - - -
Nonspecified injuries and disorders - 4 8 3 6 11 11 7 - - - -Crushing injuries - 3 4 3 - 6 8 4 - - - -Back pain, hurt back - - 3 - 3 3 - 3 - - - -
Part of body11
Head 1,342 1,350 1,309 1,312 1,201 1,098 971 970 - - - -Cranial region 1,076 1,135 1,104 1,081 983 852 736 771 - - - -
Brain 1,062 1,107 1,085 1,058 969 839 731 765 - - - -Scalp - - - 3 3 - 3 3 - - - -Skull 3 - - - - - - - - - - -Multiple cranial region locations - 7 7 5 4 5 - - - - - -
See footnotes at end of table. 159
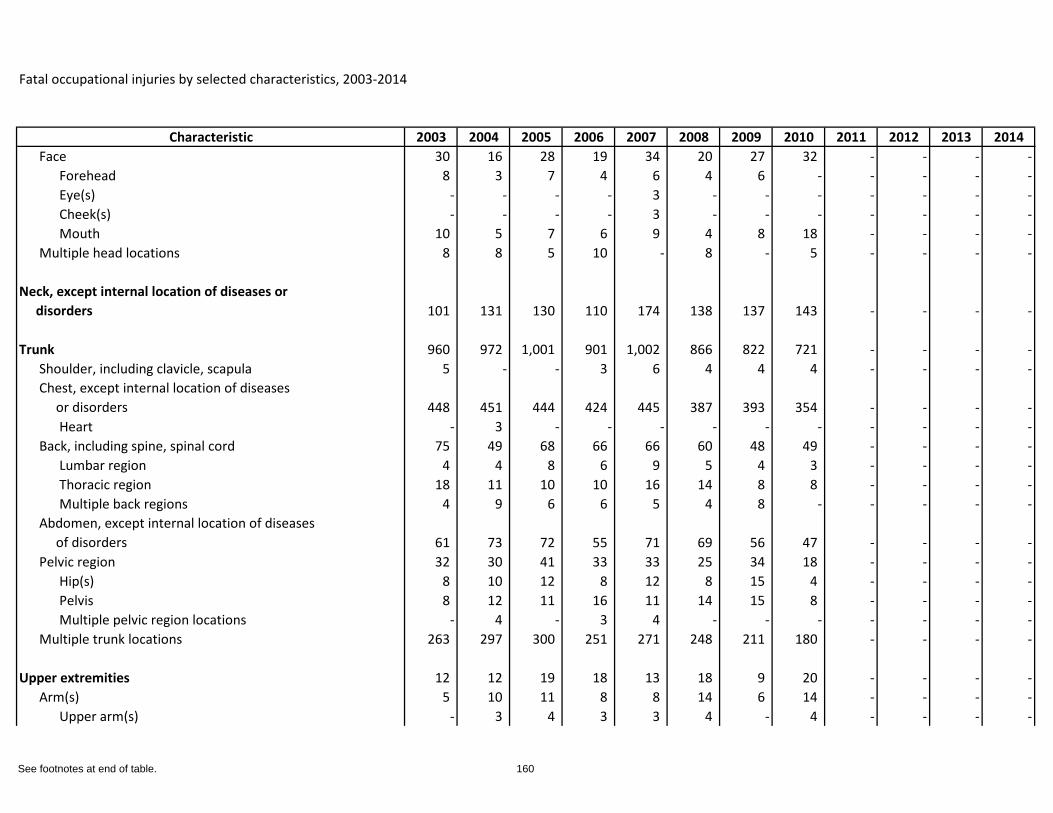
Fatal occupational injuries by selected characteristics, 2003-2014
Characteristic 2003 2004 2005 2006 2007 2008 2009 2010 2011 2012 2013 2014Face 30 16 28 19 34 20 27 32 - - - -
Forehead 8 3 7 4 6 4 6 - - - - -Eye(s) - - - - 3 - - - - - - -Cheek(s) - - - - 3 - - - - - - -Mouth 10 5 7 6 9 4 8 18 - - - -
Multiple head locations 8 8 5 10 - 8 - 5 - - - -
Neck, except internal location of diseases or disorders 101 131 130 110 174 138 137 143 - - - -
Trunk 960 972 1,001 901 1,002 866 822 721 - - - -Shoulder, including clavicle, scapula 5 - - 3 6 4 4 4 - - - -Chest, except internal location of diseases or disorders 448 451 444 424 445 387 393 354 - - - -
Heart - 3 - - - - - - - - - -Back, including spine, spinal cord 75 49 68 66 66 60 48 49 - - - -
Lumbar region 4 4 8 6 9 5 4 3 - - - -Thoracic region 18 11 10 10 16 14 8 8 - - - -Multiple back regions 4 9 6 6 5 4 8 - - - - -
Abdomen, except internal location of diseases of disorders 61 73 72 55 71 69 56 47 - - - -Pelvic region 32 30 41 33 33 25 34 18 - - - -
Hip(s) 8 10 12 8 12 8 15 4 - - - -Pelvis 8 12 11 16 11 14 15 8 - - - -Multiple pelvic region locations - 4 - 3 4 - - - - - - -
Multiple trunk locations 263 297 300 251 271 248 211 180 - - - -
Upper extremities 12 12 19 18 13 18 9 20 - - - -Arm(s) 5 10 11 8 8 14 6 14 - - - -
Upper arm(s) - 3 4 3 3 4 - 4 - - - -
See footnotes at end of table. 160
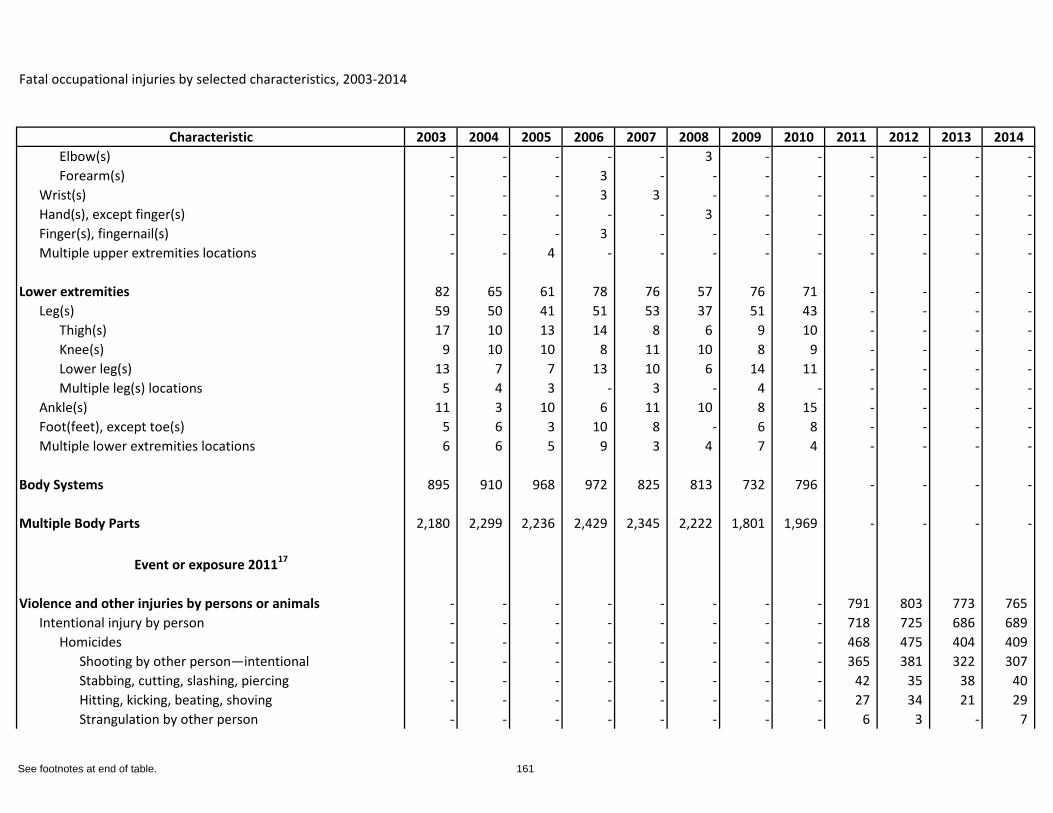
Fatal occupational injuries by selected characteristics, 2003-2014
Characteristic 2003 2004 2005 2006 2007 2008 2009 2010 2011 2012 2013 2014Elbow(s) - - - - - 3 - - - - - -Forearm(s) - - - 3 - - - - - - - -
Wrist(s) - - - 3 3 - - - - - - -Hand(s), except finger(s) - - - - - 3 - - - - - -Finger(s), fingernail(s) - - - 3 - - - - - - - -Multiple upper extremities locations - - 4 - - - - - - - - -
Lower extremities 82 65 61 78 76 57 76 71 - - - -Leg(s) 59 50 41 51 53 37 51 43 - - - -
Thigh(s) 17 10 13 14 8 6 9 10 - - - -Knee(s) 9 10 10 8 11 10 8 9 - - - -Lower leg(s) 13 7 7 13 10 6 14 11 - - - -Multiple leg(s) locations 5 4 3 - 3 - 4 - - - - -
Ankle(s) 11 3 10 6 11 10 8 15 - - - -Foot(feet), except toe(s) 5 6 3 10 8 - 6 8 - - - -Multiple lower extremities locations 6 6 5 9 3 4 7 4 - - - -
Body Systems 895 910 968 972 825 813 732 796 - - - -
Multiple Body Parts 2,180 2,299 2,236 2,429 2,345 2,222 1,801 1,969 - - - -
Event or exposure 201117
Violence and other injuries by persons or animals - - - - - - - - 791 803 773 765 Intentional injury by person - - - - - - - - 718 725 686 689
Homicides - - - - - - - - 468 475 404 409 Shooting by other person—intentional - - - - - - - - 365 381 322 307 Stabbing, cutting, slashing, piercing - - - - - - - - 42 35 38 40 Hitting, kicking, beating, shoving - - - - - - - - 27 34 21 29 Strangulation by other person - - - - - - - - 6 3 - 7
See footnotes at end of table. 161
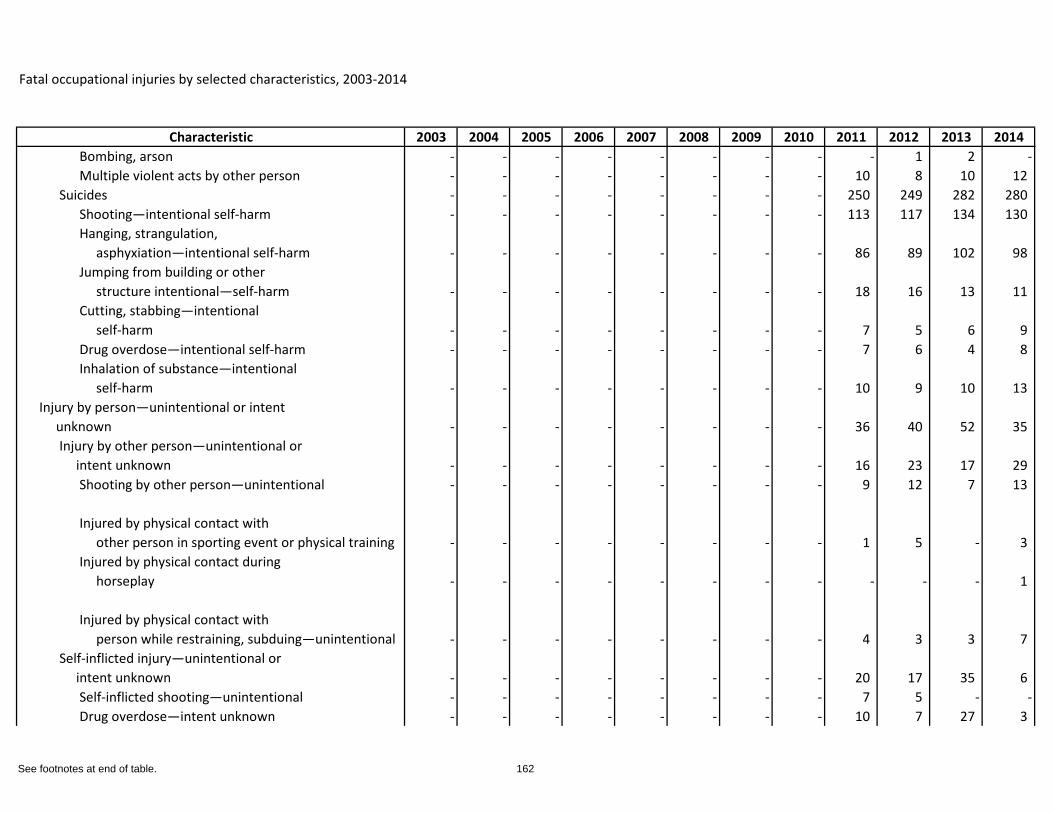
Fatal occupational injuries by selected characteristics, 2003-2014
Characteristic 2003 2004 2005 2006 2007 2008 2009 2010 2011 2012 2013 2014Bombing, arson - - - - - - - - - 1 2 -Multiple violent acts by other person - - - - - - - - 10 8 10 12
Suicides - - - - - - - - 250 249 282 280 Shooting—intentional self-harm - - - - - - - - 113 117 134 130 Hanging, strangulation, asphyxiation—intentional self-harm - - - - - - - - 86 89 102 98 Jumping from building or other structure intentional—self-harm - - - - - - - - 18 16 13 11 Cutting, stabbing—intentional self-harm - - - - - - - - 7 5 6 9 Drug overdose—intentional self-harm - - - - - - - - 7 6 4 8 Inhalation of substance—intentional self-harm - - - - - - - - 10 9 10 13
Injury by person—unintentional or intent unknown - - - - - - - - 36 40 52 35
Injury by other person—unintentional or intent unknown - - - - - - - - 16 23 17 29
Shooting by other person—unintentional - - - - - - - - 9 12 7 13
Injured by physical contact with other person in sporting event or physical training - - - - - - - - 1 5 - 3 Injured by physical contact during horseplay - - - - - - - - - - - 1
Injured by physical contact with person while restraining, subduing—unintentional - - - - - - - - 4 3 3 7
Self-inflicted injury—unintentional or intent unknown - - - - - - - - 20 17 35 6
Self-inflicted shooting—unintentional - - - - - - - - 7 5 - -Drug overdose—intent unknown - - - - - - - - 10 7 27 3
See footnotes at end of table. 162
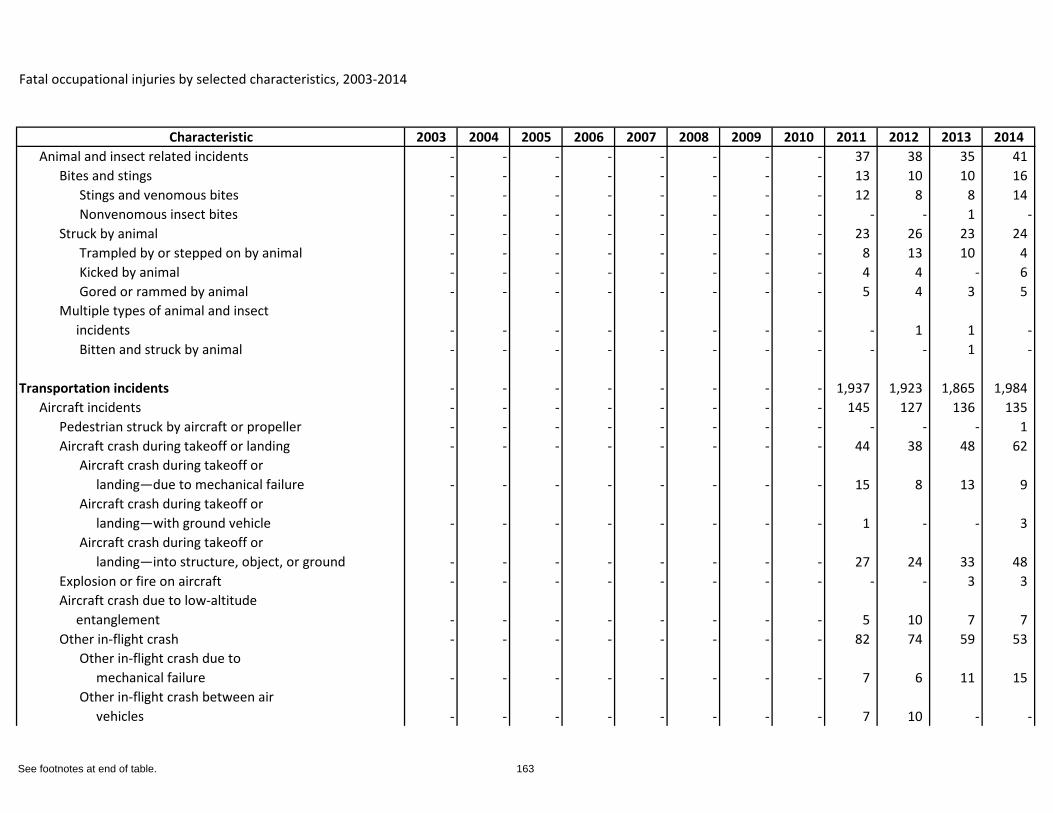
Fatal occupational injuries by selected characteristics, 2003-2014
Characteristic 2003 2004 2005 2006 2007 2008 2009 2010 2011 2012 2013 2014Animal and insect related incidents - - - - - - - - 37 38 35 41
Bites and stings - - - - - - - - 13 10 10 16 Stings and venomous bites - - - - - - - - 12 8 8 14 Nonvenomous insect bites - - - - - - - - - - 1 -
Struck by animal - - - - - - - - 23 26 23 24 Trampled by or stepped on by animal - - - - - - - - 8 13 10 4 Kicked by animal - - - - - - - - 4 4 - 6 Gored or rammed by animal - - - - - - - - 5 4 3 5
Multiple types of animal and insect incidents - - - - - - - - - 1 1 -
Bitten and struck by animal - - - - - - - - - - 1 -
Transportation incidents - - - - - - - - 1,937 1,923 1,865 1,984 Aircraft incidents - - - - - - - - 145 127 136 135
Pedestrian struck by aircraft or propeller - - - - - - - - - - - 1 Aircraft crash during takeoff or landing - - - - - - - - 44 38 48 62
Aircraft crash during takeoff or landing—due to mechanical failure - - - - - - - - 15 8 13 9 Aircraft crash during takeoff or landing—with ground vehicle - - - - - - - - 1 - - 3 Aircraft crash during takeoff or landing—into structure, object, or ground - - - - - - - - 27 24 33 48
Explosion or fire on aircraft - - - - - - - - - - 3 3 Aircraft crash due to low-altitude entanglement - - - - - - - - 5 10 7 7 Other in-flight crash - - - - - - - - 82 74 59 53
Other in-flight crash due to mechanical failure - - - - - - - - 7 6 11 15 Other in-flight crash between air vehicles - - - - - - - - 7 10 - -
See footnotes at end of table. 163
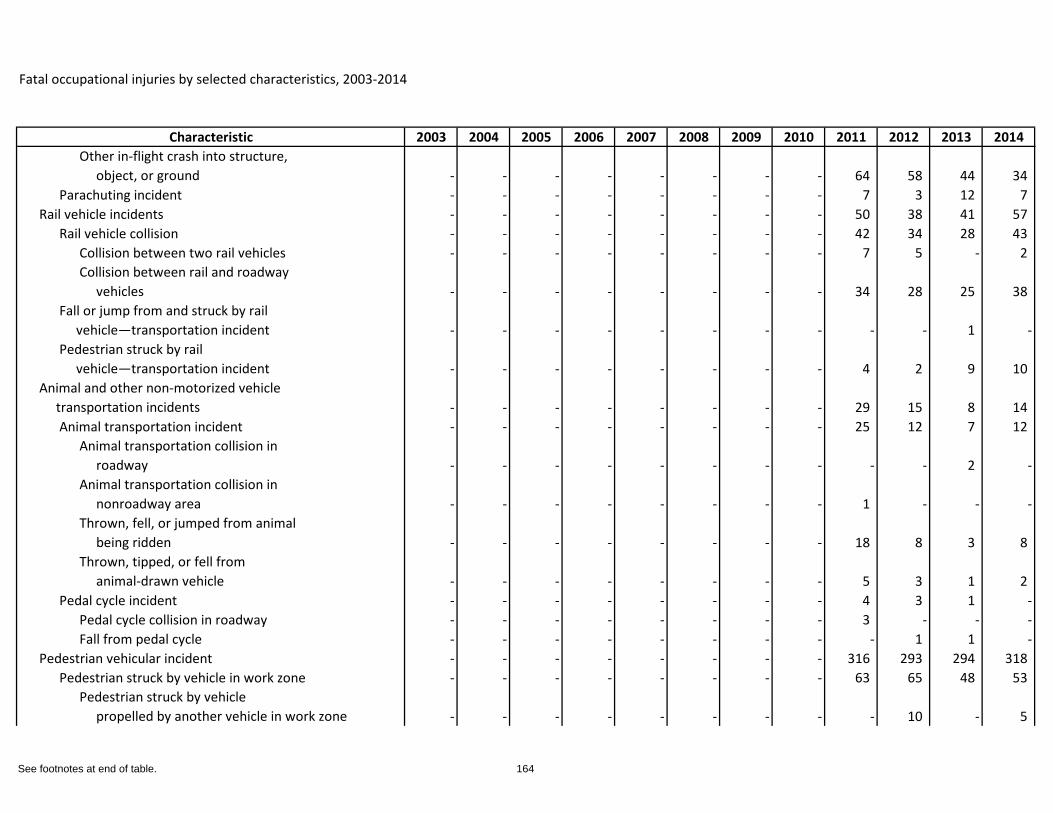
Fatal occupational injuries by selected characteristics, 2003-2014
Characteristic 2003 2004 2005 2006 2007 2008 2009 2010 2011 2012 2013 2014Other in-flight crash into structure, object, or ground - - - - - - - - 64 58 44 34
Parachuting incident - - - - - - - - 7 3 12 7 Rail vehicle incidents - - - - - - - - 50 38 41 57
Rail vehicle collision - - - - - - - - 42 34 28 43 Collision between two rail vehicles - - - - - - - - 7 5 - 2 Collision between rail and roadway vehicles - - - - - - - - 34 28 25 38
Fall or jump from and struck by rail vehicle—transportation incident - - - - - - - - - - 1 -Pedestrian struck by rail vehicle—transportation incident - - - - - - - - 4 2 9 10
Animal and other non-motorized vehicle transportation incidents - - - - - - - - 29 15 8 14
Animal transportation incident - - - - - - - - 25 12 7 12 Animal transportation collision in roadway - - - - - - - - - - 2 -Animal transportation collision in nonroadway area - - - - - - - - 1 - - -Thrown, fell, or jumped from animal being ridden - - - - - - - - 18 8 3 8 Thrown, tipped, or fell from animal-drawn vehicle - - - - - - - - 5 3 1 2
Pedal cycle incident - - - - - - - - 4 3 1 -Pedal cycle collision in roadway - - - - - - - - 3 - - -Fall from pedal cycle - - - - - - - - - 1 1 -
Pedestrian vehicular incident - - - - - - - - 316 293 294 318 Pedestrian struck by vehicle in work zone - - - - - - - - 63 65 48 53
Pedestrian struck by vehicle propelled by another vehicle in work zone - - - - - - - - - 10 - 5
See footnotes at end of table. 164
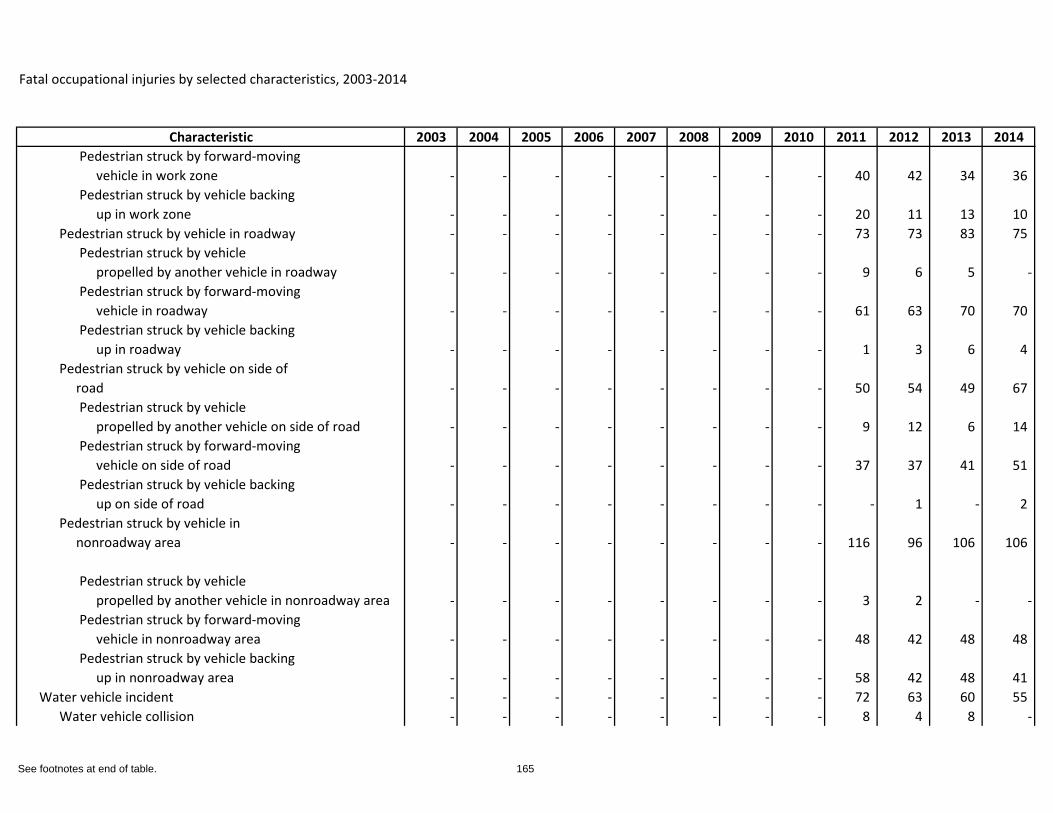
Fatal occupational injuries by selected characteristics, 2003-2014
Characteristic 2003 2004 2005 2006 2007 2008 2009 2010 2011 2012 2013 2014Pedestrian struck by forward-moving vehicle in work zone - - - - - - - - 40 42 34 36 Pedestrian struck by vehicle backing up in work zone - - - - - - - - 20 11 13 10
Pedestrian struck by vehicle in roadway - - - - - - - - 73 73 83 75 Pedestrian struck by vehicle propelled by another vehicle in roadway - - - - - - - - 9 6 5 -Pedestrian struck by forward-moving vehicle in roadway - - - - - - - - 61 63 70 70 Pedestrian struck by vehicle backing up in roadway - - - - - - - - 1 3 6 4
Pedestrian struck by vehicle on side of road - - - - - - - - 50 54 49 67
Pedestrian struck by vehicle propelled by another vehicle on side of road - - - - - - - - 9 12 6 14 Pedestrian struck by forward-moving vehicle on side of road - - - - - - - - 37 37 41 51 Pedestrian struck by vehicle backing up on side of road - - - - - - - - - 1 - 2
Pedestrian struck by vehicle in nonroadway area - - - - - - - - 116 96 106 106
Pedestrian struck by vehicle propelled by another vehicle in nonroadway area - - - - - - - - 3 2 - -Pedestrian struck by forward-moving vehicle in nonroadway area - - - - - - - - 48 42 48 48 Pedestrian struck by vehicle backing up in nonroadway area - - - - - - - - 58 42 48 41
Water vehicle incident - - - - - - - - 72 63 60 55 Water vehicle collision - - - - - - - - 8 4 8 -
See footnotes at end of table. 165
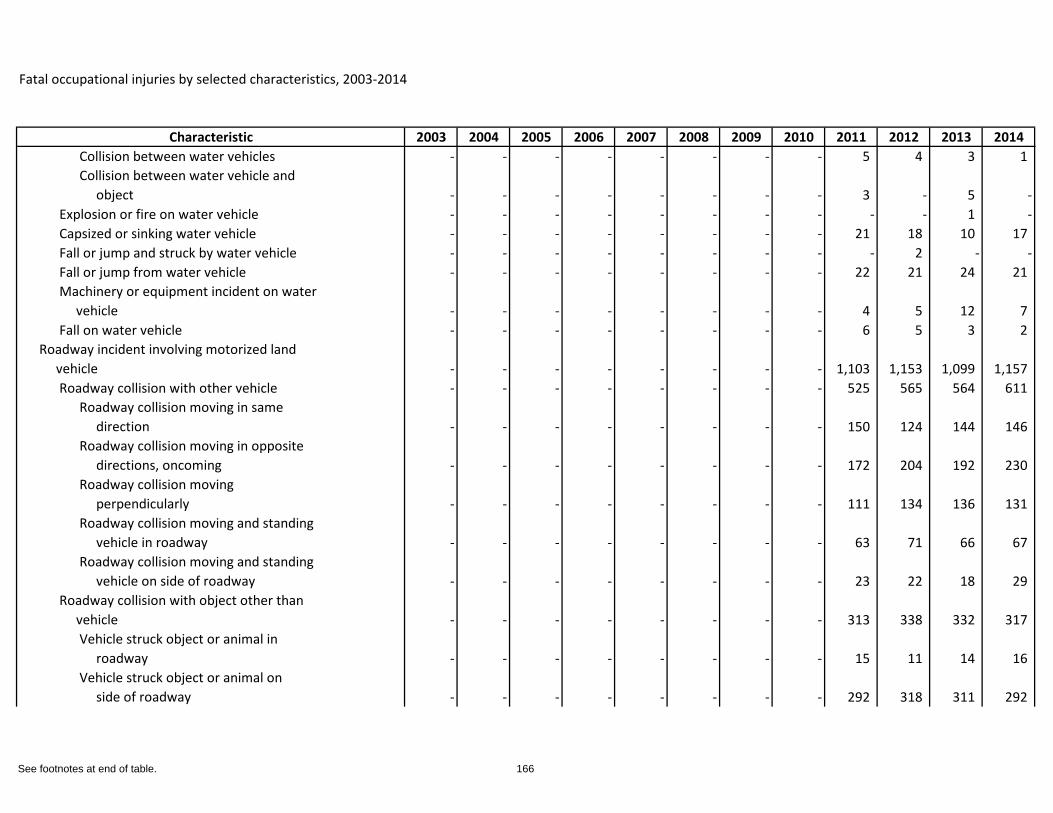
Fatal occupational injuries by selected characteristics, 2003-2014
Characteristic 2003 2004 2005 2006 2007 2008 2009 2010 2011 2012 2013 2014Collision between water vehicles - - - - - - - - 5 4 3 1 Collision between water vehicle and object - - - - - - - - 3 - 5 -
Explosion or fire on water vehicle - - - - - - - - - - 1 -Capsized or sinking water vehicle - - - - - - - - 21 18 10 17 Fall or jump and struck by water vehicle - - - - - - - - - 2 - -Fall or jump from water vehicle - - - - - - - - 22 21 24 21 Machinery or equipment incident on water vehicle - - - - - - - - 4 5 12 7 Fall on water vehicle - - - - - - - - 6 5 3 2
Roadway incident involving motorized land vehicle - - - - - - - - 1,103 1,153 1,099 1,157
Roadway collision with other vehicle - - - - - - - - 525 565 564 611 Roadway collision moving in same direction - - - - - - - - 150 124 144 146 Roadway collision moving in opposite directions, oncoming - - - - - - - - 172 204 192 230 Roadway collision moving perpendicularly - - - - - - - - 111 134 136 131 Roadway collision moving and standing vehicle in roadway - - - - - - - - 63 71 66 67 Roadway collision moving and standing vehicle on side of roadway - - - - - - - - 23 22 18 29
Roadway collision with object other than vehicle - - - - - - - - 313 338 332 317
Vehicle struck object or animal in roadway - - - - - - - - 15 11 14 16 Vehicle struck object or animal on side of roadway - - - - - - - - 292 318 311 292
See footnotes at end of table. 166
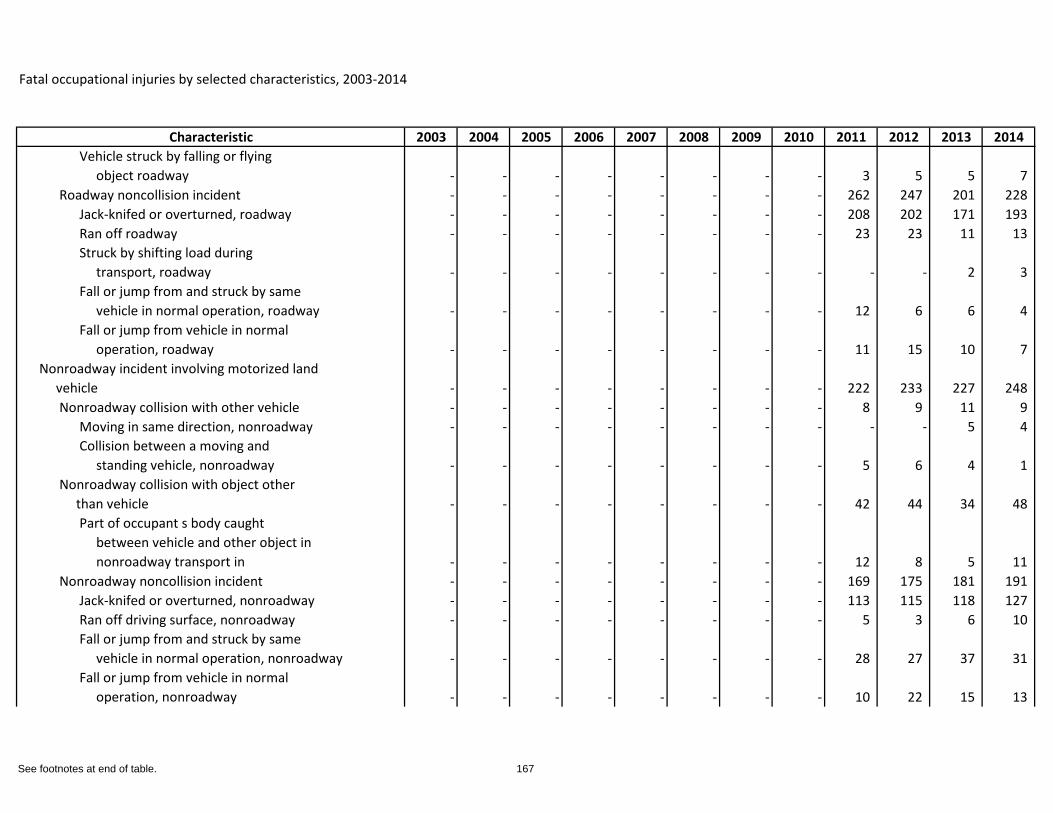
Fatal occupational injuries by selected characteristics, 2003-2014
Characteristic 2003 2004 2005 2006 2007 2008 2009 2010 2011 2012 2013 2014Vehicle struck by falling or flying object roadway - - - - - - - - 3 5 5 7
Roadway noncollision incident - - - - - - - - 262 247 201 228 Jack-knifed or overturned, roadway - - - - - - - - 208 202 171 193 Ran off roadway - - - - - - - - 23 23 11 13 Struck by shifting load during transport, roadway - - - - - - - - - - 2 3 Fall or jump from and struck by same vehicle in normal operation, roadway - - - - - - - - 12 6 6 4 Fall or jump from vehicle in normal operation, roadway - - - - - - - - 11 15 10 7
Nonroadway incident involving motorized land vehicle - - - - - - - - 222 233 227 248
Nonroadway collision with other vehicle - - - - - - - - 8 9 11 9 Moving in same direction, nonroadway - - - - - - - - - - 5 4 Collision between a moving and standing vehicle, nonroadway - - - - - - - - 5 6 4 1
Nonroadway collision with object other than vehicle - - - - - - - - 42 44 34 48
Part of occupant s body caught between vehicle and other object in nonroadway transport in - - - - - - - - 12 8 5 11
Nonroadway noncollision incident - - - - - - - - 169 175 181 191 Jack-knifed or overturned, nonroadway - - - - - - - - 113 115 118 127 Ran off driving surface, nonroadway - - - - - - - - 5 3 6 10 Fall or jump from and struck by same vehicle in normal operation, nonroadway - - - - - - - - 28 27 37 31 Fall or jump from vehicle in normal operation, nonroadway - - - - - - - - 10 22 15 13
See footnotes at end of table. 167
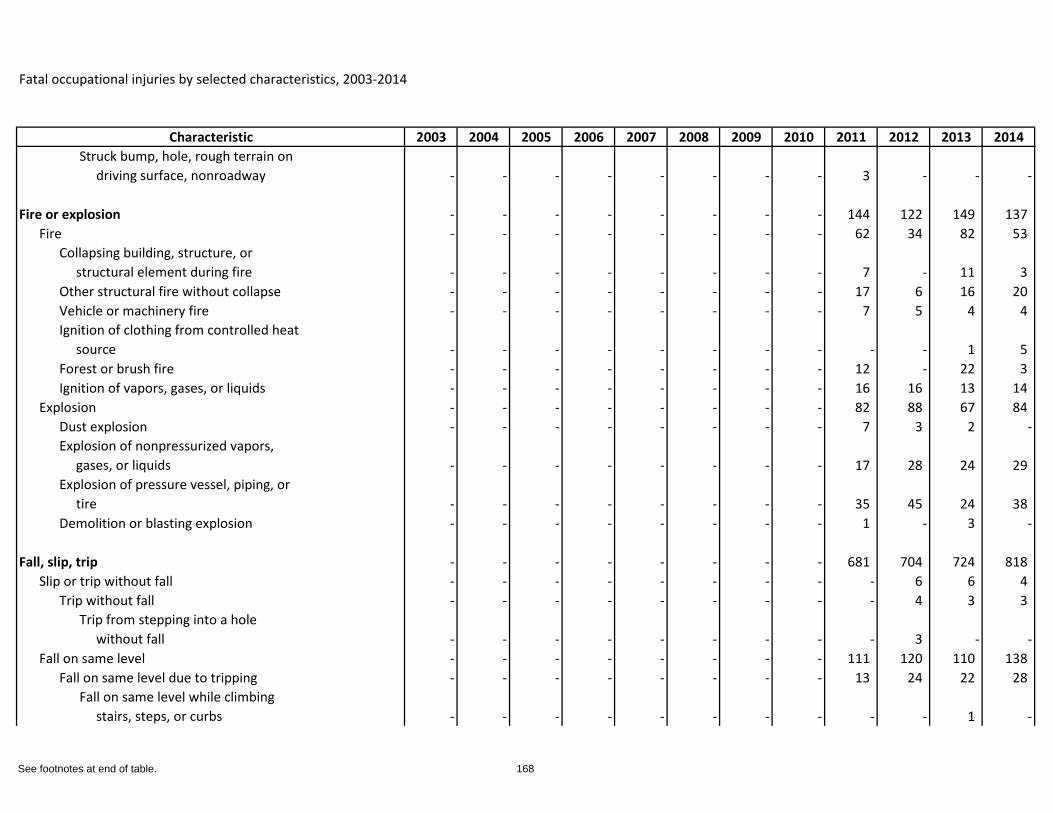
Fatal occupational injuries by selected characteristics, 2003-2014
Characteristic 2003 2004 2005 2006 2007 2008 2009 2010 2011 2012 2013 2014Struck bump, hole, rough terrain on driving surface, nonroadway - - - - - - - - 3 - - -
Fire or explosion - - - - - - - - 144 122 149 137 Fire - - - - - - - - 62 34 82 53
Collapsing building, structure, or structural element during fire - - - - - - - - 7 - 11 3 Other structural fire without collapse - - - - - - - - 17 6 16 20 Vehicle or machinery fire - - - - - - - - 7 5 4 4 Ignition of clothing from controlled heat source - - - - - - - - - - 1 5 Forest or brush fire - - - - - - - - 12 - 22 3 Ignition of vapors, gases, or liquids - - - - - - - - 16 16 13 14
Explosion - - - - - - - - 82 88 67 84 Dust explosion - - - - - - - - 7 3 2 -Explosion of nonpressurized vapors, gases, or liquids - - - - - - - - 17 28 24 29 Explosion of pressure vessel, piping, or tire - - - - - - - - 35 45 24 38 Demolition or blasting explosion - - - - - - - - 1 - 3 -
Fall, slip, trip - - - - - - - - 681 704 724 818 Slip or trip without fall - - - - - - - - - 6 6 4
Trip without fall - - - - - - - - - 4 3 3 Trip from stepping into a hole without fall - - - - - - - - - 3 - -
Fall on same level - - - - - - - - 111 120 110 138 Fall on same level due to tripping - - - - - - - - 13 24 22 28
Fall on same level while climbing stairs, steps, or curbs - - - - - - - - - - 1 -
See footnotes at end of table. 168
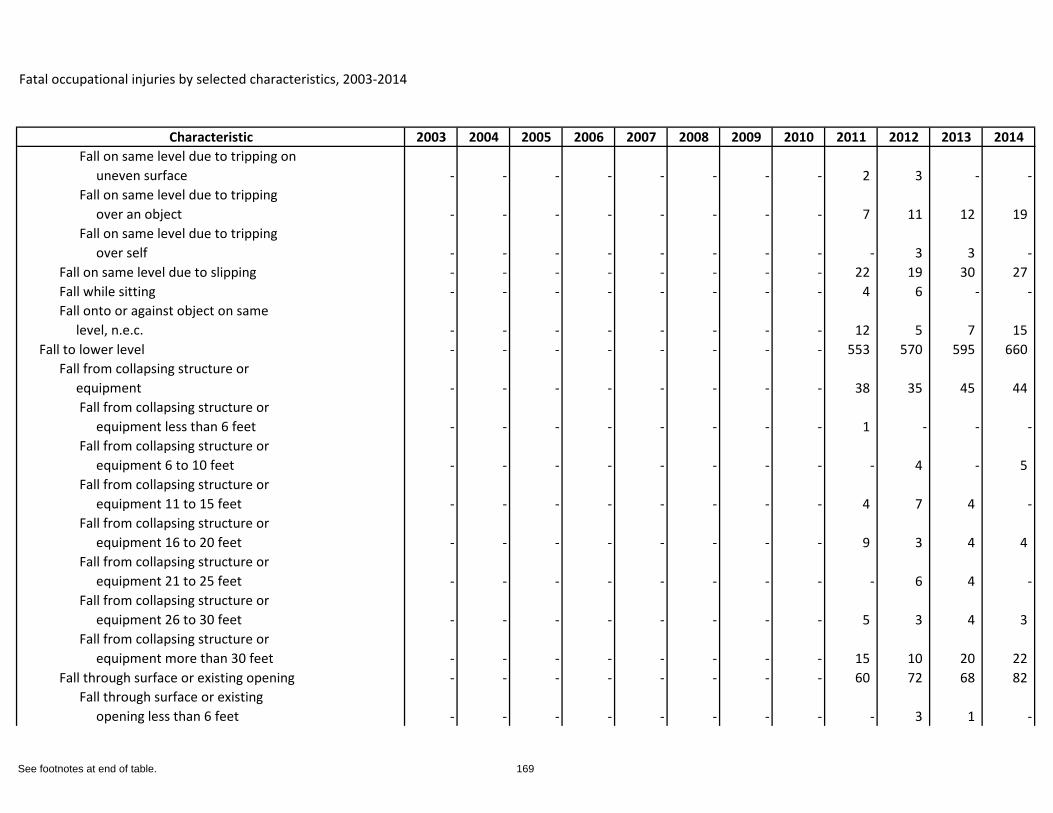
Fatal occupational injuries by selected characteristics, 2003-2014
Characteristic 2003 2004 2005 2006 2007 2008 2009 2010 2011 2012 2013 2014Fall on same level due to tripping on uneven surface - - - - - - - - 2 3 - -Fall on same level due to tripping over an object - - - - - - - - 7 11 12 19 Fall on same level due to tripping over self - - - - - - - - - 3 3 -
Fall on same level due to slipping - - - - - - - - 22 19 30 27 Fall while sitting - - - - - - - - 4 6 - -Fall onto or against object on same level, n.e.c. - - - - - - - - 12 5 7 15
Fall to lower level - - - - - - - - 553 570 595 660 Fall from collapsing structure or equipment - - - - - - - - 38 35 45 44
Fall from collapsing structure or equipment less than 6 feet - - - - - - - - 1 - - -Fall from collapsing structure or equipment 6 to 10 feet - - - - - - - - - 4 - 5 Fall from collapsing structure or equipment 11 to 15 feet - - - - - - - - 4 7 4 -Fall from collapsing structure or equipment 16 to 20 feet - - - - - - - - 9 3 4 4 Fall from collapsing structure or equipment 21 to 25 feet - - - - - - - - - 6 4 -Fall from collapsing structure or equipment 26 to 30 feet - - - - - - - - 5 3 4 3 Fall from collapsing structure or equipment more than 30 feet - - - - - - - - 15 10 20 22
Fall through surface or existing opening - - - - - - - - 60 72 68 82 Fall through surface or existing opening less than 6 feet - - - - - - - - - 3 1 -
See footnotes at end of table. 169
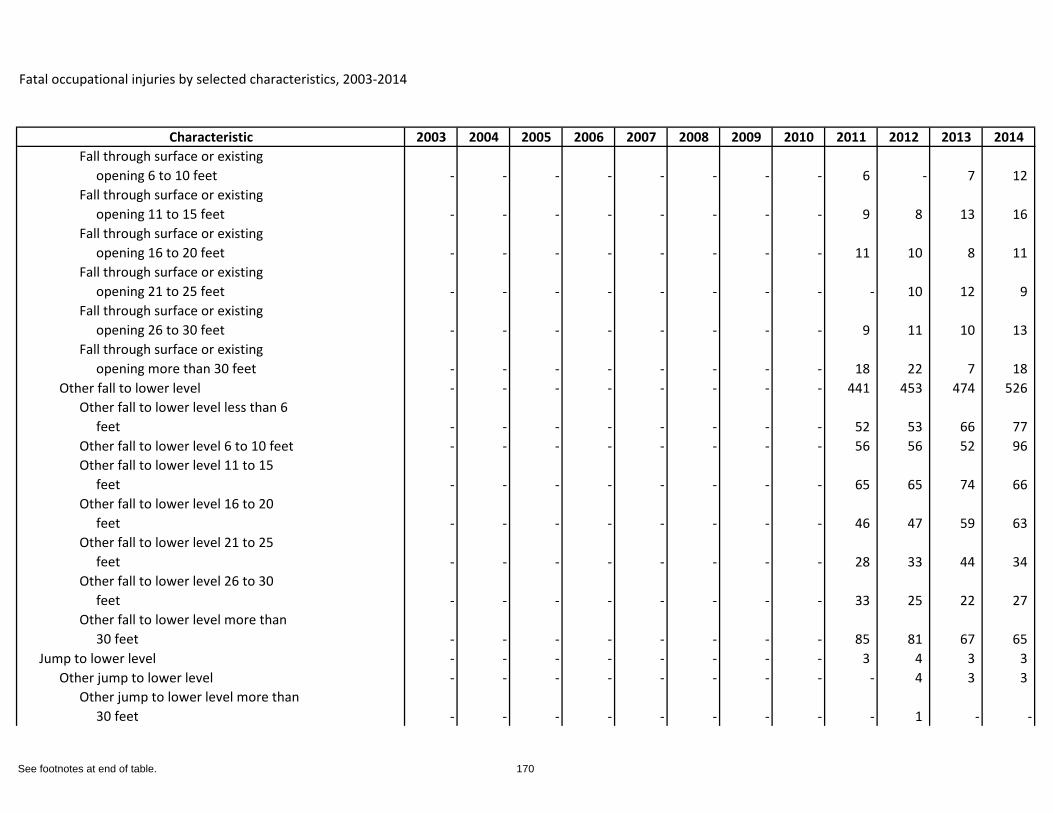
Fatal occupational injuries by selected characteristics, 2003-2014
Characteristic 2003 2004 2005 2006 2007 2008 2009 2010 2011 2012 2013 2014Fall through surface or existing opening 6 to 10 feet - - - - - - - - 6 - 7 12 Fall through surface or existing opening 11 to 15 feet - - - - - - - - 9 8 13 16 Fall through surface or existing opening 16 to 20 feet - - - - - - - - 11 10 8 11 Fall through surface or existing opening 21 to 25 feet - - - - - - - - - 10 12 9 Fall through surface or existing opening 26 to 30 feet - - - - - - - - 9 11 10 13 Fall through surface or existing opening more than 30 feet - - - - - - - - 18 22 7 18
Other fall to lower level - - - - - - - - 441 453 474 526 Other fall to lower level less than 6 feet - - - - - - - - 52 53 66 77 Other fall to lower level 6 to 10 feet - - - - - - - - 56 56 52 96 Other fall to lower level 11 to 15 feet - - - - - - - - 65 65 74 66 Other fall to lower level 16 to 20 feet - - - - - - - - 46 47 59 63 Other fall to lower level 21 to 25 feet - - - - - - - - 28 33 44 34 Other fall to lower level 26 to 30 feet - - - - - - - - 33 25 22 27 Other fall to lower level more than 30 feet - - - - - - - - 85 81 67 65
Jump to lower level - - - - - - - - 3 4 3 3 Other jump to lower level - - - - - - - - - 4 3 3
Other jump to lower level more than 30 feet - - - - - - - - - 1 - -
See footnotes at end of table. 170
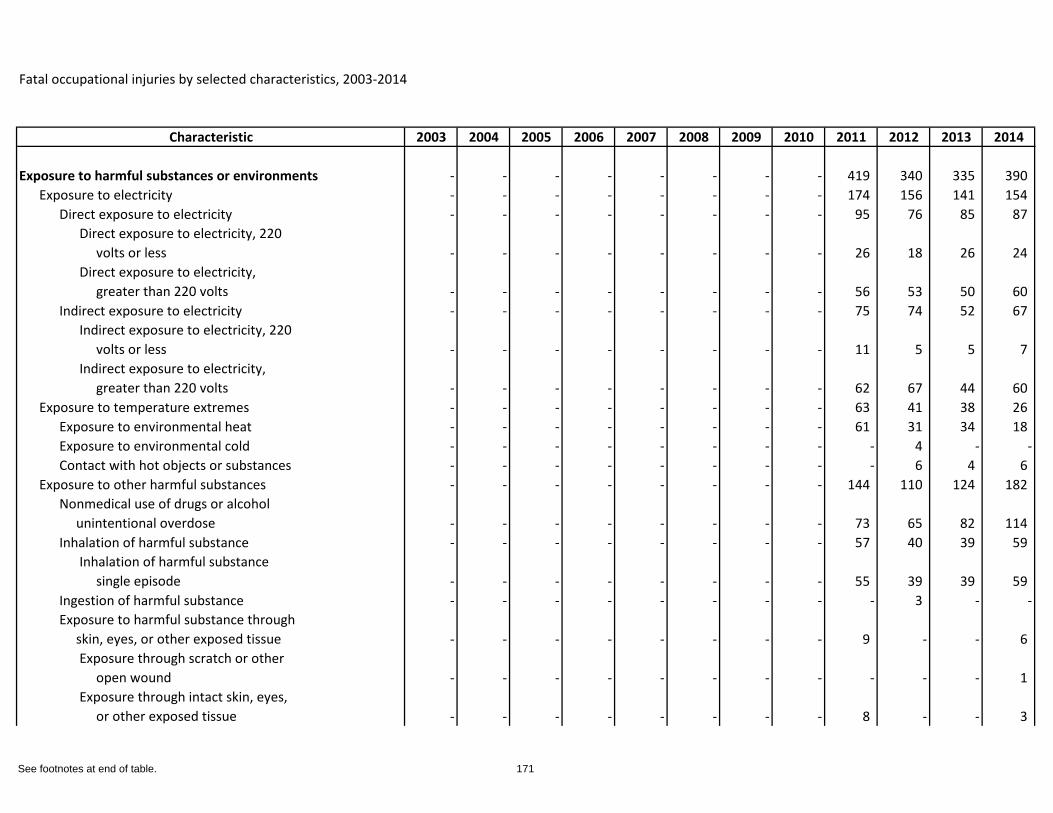
Fatal occupational injuries by selected characteristics, 2003-2014
Characteristic 2003 2004 2005 2006 2007 2008 2009 2010 2011 2012 2013 2014
Exposure to harmful substances or environments - - - - - - - - 419 340 335 390 Exposure to electricity - - - - - - - - 174 156 141 154
Direct exposure to electricity - - - - - - - - 95 76 85 87 Direct exposure to electricity, 220 volts or less - - - - - - - - 26 18 26 24 Direct exposure to electricity, greater than 220 volts - - - - - - - - 56 53 50 60
Indirect exposure to electricity - - - - - - - - 75 74 52 67 Indirect exposure to electricity, 220 volts or less - - - - - - - - 11 5 5 7 Indirect exposure to electricity, greater than 220 volts - - - - - - - - 62 67 44 60
Exposure to temperature extremes - - - - - - - - 63 41 38 26 Exposure to environmental heat - - - - - - - - 61 31 34 18 Exposure to environmental cold - - - - - - - - - 4 - -Contact with hot objects or substances - - - - - - - - - 6 4 6
Exposure to other harmful substances - - - - - - - - 144 110 124 182 Nonmedical use of drugs or alcohol unintentional overdose - - - - - - - - 73 65 82 114 Inhalation of harmful substance - - - - - - - - 57 40 39 59
Inhalation of harmful substance single episode - - - - - - - - 55 39 39 59
Ingestion of harmful substance - - - - - - - - - 3 - -Exposure to harmful substance through skin, eyes, or other exposed tissue - - - - - - - - 9 - - 6
Exposure through scratch or other open wound - - - - - - - - - - - 1 Exposure through intact skin, eyes, or other exposed tissue - - - - - - - - 8 - - 3
See footnotes at end of table. 171
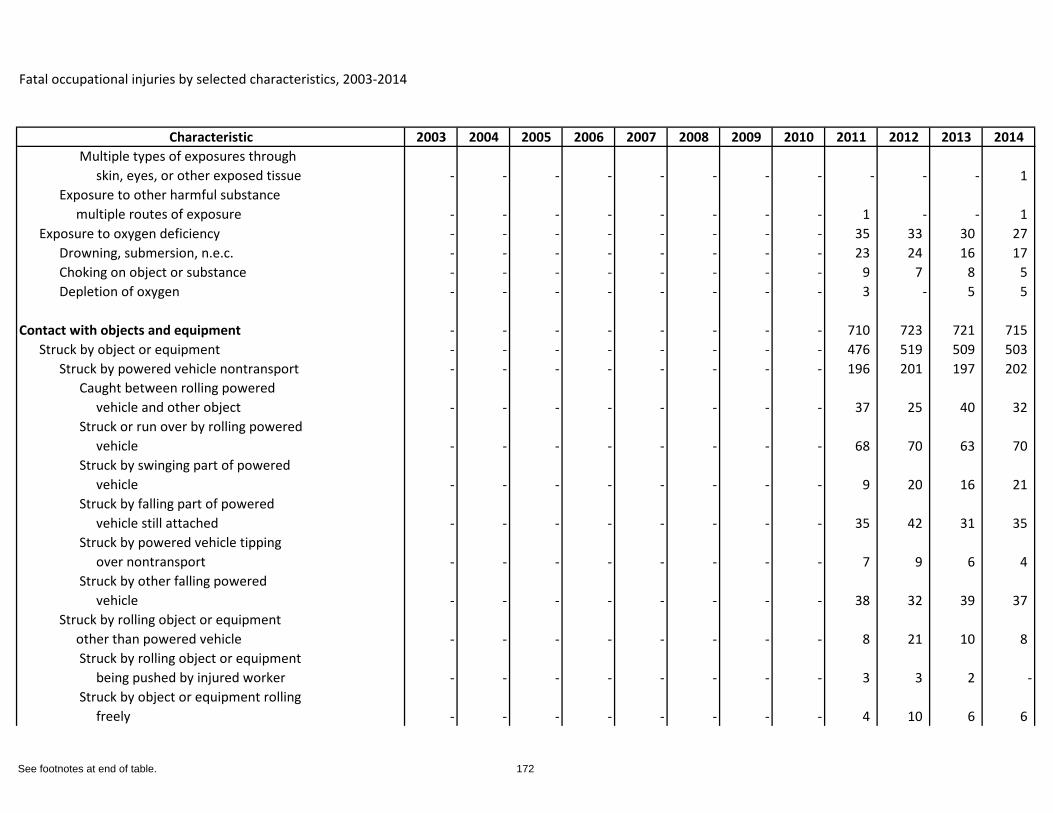
Fatal occupational injuries by selected characteristics, 2003-2014
Characteristic 2003 2004 2005 2006 2007 2008 2009 2010 2011 2012 2013 2014Multiple types of exposures through skin, eyes, or other exposed tissue - - - - - - - - - - - 1
Exposure to other harmful substance multiple routes of exposure - - - - - - - - 1 - - 1
Exposure to oxygen deficiency - - - - - - - - 35 33 30 27 Drowning, submersion, n.e.c. - - - - - - - - 23 24 16 17 Choking on object or substance - - - - - - - - 9 7 8 5 Depletion of oxygen - - - - - - - - 3 - 5 5
Contact with objects and equipment - - - - - - - - 710 723 721 715 Struck by object or equipment - - - - - - - - 476 519 509 503
Struck by powered vehicle nontransport - - - - - - - - 196 201 197 202 Caught between rolling powered vehicle and other object - - - - - - - - 37 25 40 32 Struck or run over by rolling powered vehicle - - - - - - - - 68 70 63 70 Struck by swinging part of powered vehicle - - - - - - - - 9 20 16 21 Struck by falling part of powered vehicle still attached - - - - - - - - 35 42 31 35 Struck by powered vehicle tipping over nontransport - - - - - - - - 7 9 6 4 Struck by other falling powered vehicle - - - - - - - - 38 32 39 37
Struck by rolling object or equipment other than powered vehicle - - - - - - - - 8 21 10 8
Struck by rolling object or equipment being pushed by injured worker - - - - - - - - 3 3 2 -Struck by object or equipment rolling freely - - - - - - - - 4 10 6 6
See footnotes at end of table. 172
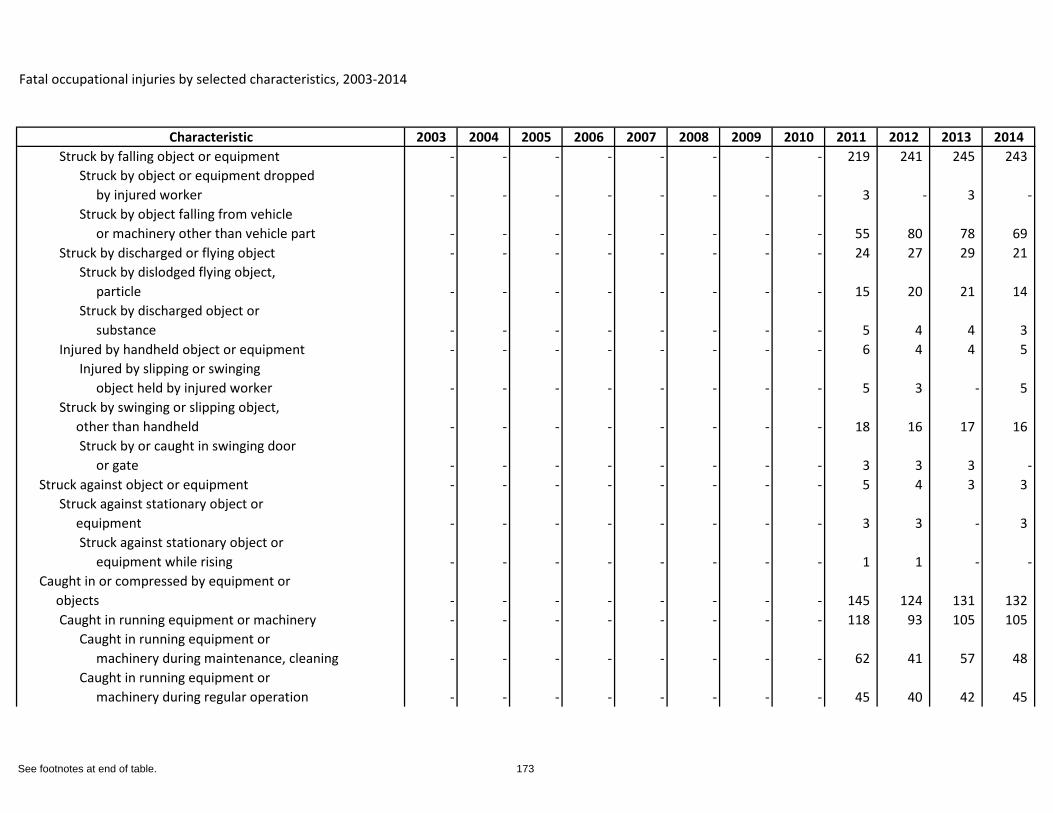
Fatal occupational injuries by selected characteristics, 2003-2014
Characteristic 2003 2004 2005 2006 2007 2008 2009 2010 2011 2012 2013 2014Struck by falling object or equipment - - - - - - - - 219 241 245 243
Struck by object or equipment dropped by injured worker - - - - - - - - 3 - 3 -Struck by object falling from vehicle or machinery other than vehicle part - - - - - - - - 55 80 78 69
Struck by discharged or flying object - - - - - - - - 24 27 29 21 Struck by dislodged flying object, particle - - - - - - - - 15 20 21 14 Struck by discharged object or substance - - - - - - - - 5 4 4 3
Injured by handheld object or equipment - - - - - - - - 6 4 4 5 Injured by slipping or swinging object held by injured worker - - - - - - - - 5 3 - 5
Struck by swinging or slipping object, other than handheld - - - - - - - - 18 16 17 16
Struck by or caught in swinging door or gate - - - - - - - - 3 3 3 -
Struck against object or equipment - - - - - - - - 5 4 3 3 Struck against stationary object or equipment - - - - - - - - 3 3 - 3
Struck against stationary object or equipment while rising - - - - - - - - 1 1 - -
Caught in or compressed by equipment or objects - - - - - - - - 145 124 131 132
Caught in running equipment or machinery - - - - - - - - 118 93 105 105 Caught in running equipment or machinery during maintenance, cleaning - - - - - - - - 62 41 57 48 Caught in running equipment or machinery during regular operation - - - - - - - - 45 40 42 45
See footnotes at end of table. 173
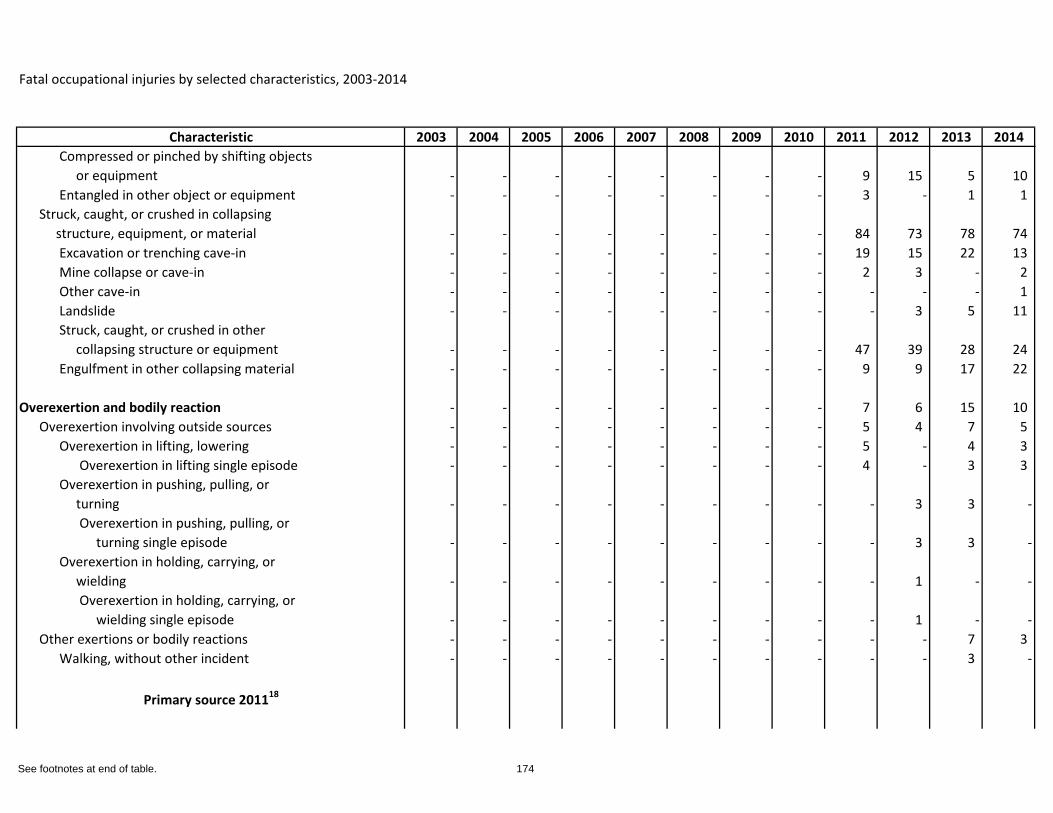
Fatal occupational injuries by selected characteristics, 2003-2014
Characteristic 2003 2004 2005 2006 2007 2008 2009 2010 2011 2012 2013 2014Compressed or pinched by shifting objects or equipment - - - - - - - - 9 15 5 10 Entangled in other object or equipment - - - - - - - - 3 - 1 1
Struck, caught, or crushed in collapsing structure, equipment, or material - - - - - - - - 84 73 78 74
Excavation or trenching cave-in - - - - - - - - 19 15 22 13 Mine collapse or cave-in - - - - - - - - 2 3 - 2 Other cave-in - - - - - - - - - - - 1 Landslide - - - - - - - - - 3 5 11 Struck, caught, or crushed in other collapsing structure or equipment - - - - - - - - 47 39 28 24 Engulfment in other collapsing material - - - - - - - - 9 9 17 22
Overexertion and bodily reaction - - - - - - - - 7 6 15 10 Overexertion involving outside sources - - - - - - - - 5 4 7 5
Overexertion in lifting, lowering - - - - - - - - 5 - 4 3 Overexertion in lifting single episode - - - - - - - - 4 - 3 3
Overexertion in pushing, pulling, or turning - - - - - - - - - 3 3 -
Overexertion in pushing, pulling, or turning single episode - - - - - - - - - 3 3 -
Overexertion in holding, carrying, or wielding - - - - - - - - - 1 - -
Overexertion in holding, carrying, or wielding single episode - - - - - - - - - 1 - -
Other exertions or bodily reactions - - - - - - - - - - 7 3 Walking, without other incident - - - - - - - - - - 3 -
Primary source 201118
See footnotes at end of table. 174
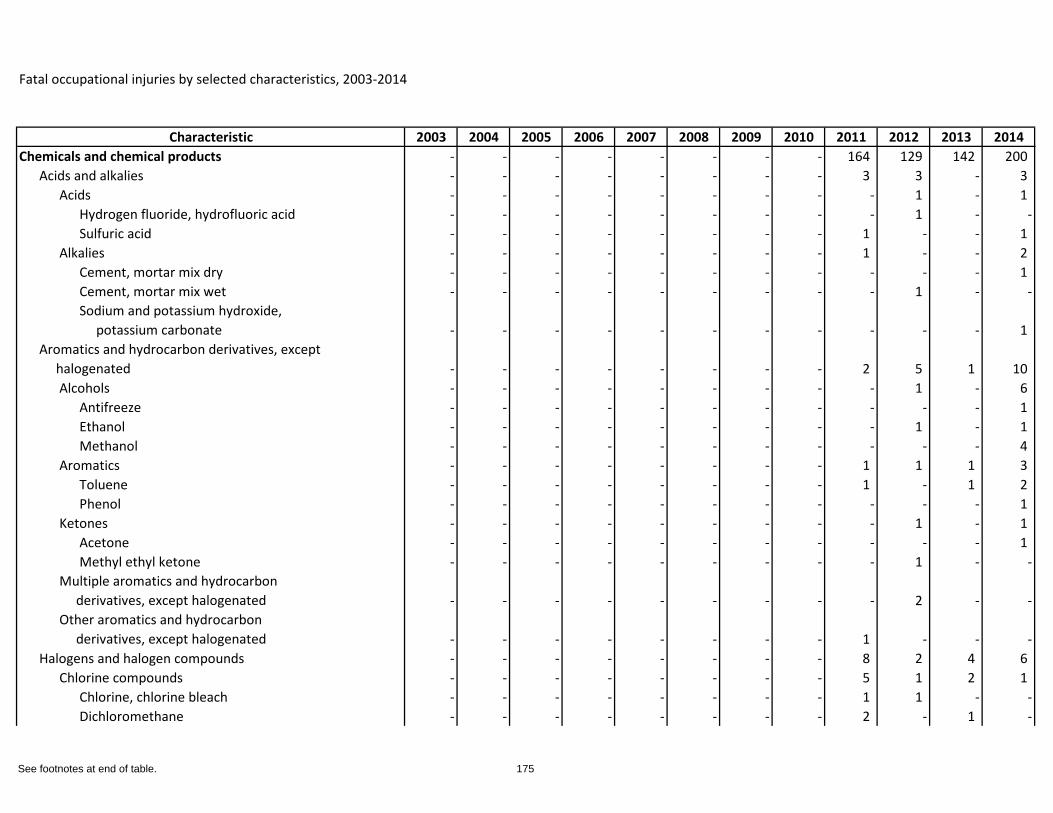
Fatal occupational injuries by selected characteristics, 2003-2014
Characteristic 2003 2004 2005 2006 2007 2008 2009 2010 2011 2012 2013 2014Chemicals and chemical products - - - - - - - - 164 129 142 200
Acids and alkalies - - - - - - - - 3 3 - 3 Acids - - - - - - - - - 1 - 1
Hydrogen fluoride, hydrofluoric acid - - - - - - - - - 1 - -Sulfuric acid - - - - - - - - 1 - - 1
Alkalies - - - - - - - - 1 - - 2 Cement, mortar mix dry - - - - - - - - - - - 1 Cement, mortar mix wet - - - - - - - - - 1 - -Sodium and potassium hydroxide, potassium carbonate - - - - - - - - - - - 1
Aromatics and hydrocarbon derivatives, except halogenated - - - - - - - - 2 5 1 10
Alcohols - - - - - - - - - 1 - 6 Antifreeze - - - - - - - - - - - 1 Ethanol - - - - - - - - - 1 - 1 Methanol - - - - - - - - - - - 4
Aromatics - - - - - - - - 1 1 1 3 Toluene - - - - - - - - 1 - 1 2 Phenol - - - - - - - - - - - 1
Ketones - - - - - - - - - 1 - 1 Acetone - - - - - - - - - - - 1 Methyl ethyl ketone - - - - - - - - - 1 - -
Multiple aromatics and hydrocarbon derivatives, except halogenated - - - - - - - - - 2 - -Other aromatics and hydrocarbon derivatives, except halogenated - - - - - - - - 1 - - -
Halogens and halogen compounds - - - - - - - - 8 2 4 6 Chlorine compounds - - - - - - - - 5 1 2 1
Chlorine, chlorine bleach - - - - - - - - 1 1 - -Dichloromethane - - - - - - - - 2 - 1 -
See footnotes at end of table. 175
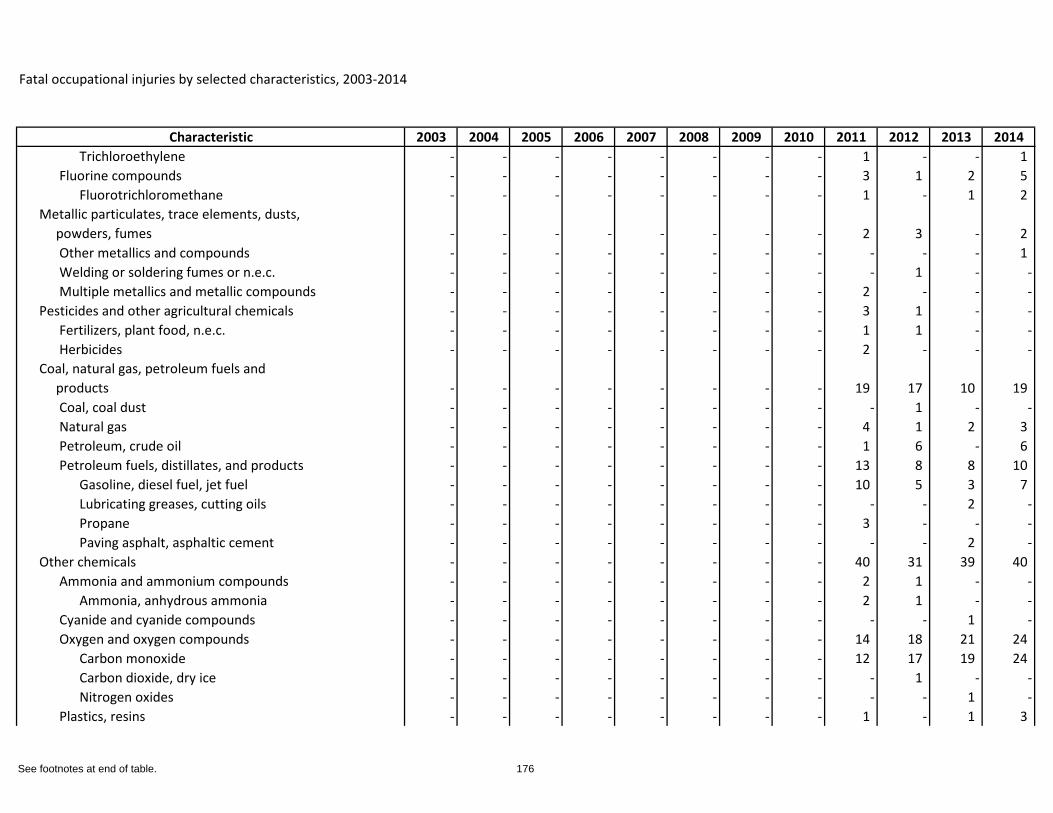
Fatal occupational injuries by selected characteristics, 2003-2014
Characteristic 2003 2004 2005 2006 2007 2008 2009 2010 2011 2012 2013 2014Trichloroethylene - - - - - - - - 1 - - 1
Fluorine compounds - - - - - - - - 3 1 2 5 Fluorotrichloromethane - - - - - - - - 1 - 1 2
Metallic particulates, trace elements, dusts, powders, fumes - - - - - - - - 2 3 - 2
Other metallics and compounds - - - - - - - - - - - 1 Welding or soldering fumes or n.e.c. - - - - - - - - - 1 - -Multiple metallics and metallic compounds - - - - - - - - 2 - - -
Pesticides and other agricultural chemicals - - - - - - - - 3 1 - -Fertilizers, plant food, n.e.c. - - - - - - - - 1 1 - -Herbicides - - - - - - - - 2 - - -
Coal, natural gas, petroleum fuels and products - - - - - - - - 19 17 10 19
Coal, coal dust - - - - - - - - - 1 - -Natural gas - - - - - - - - 4 1 2 3 Petroleum, crude oil - - - - - - - - 1 6 - 6 Petroleum fuels, distillates, and products - - - - - - - - 13 8 8 10
Gasoline, diesel fuel, jet fuel - - - - - - - - 10 5 3 7 Lubricating greases, cutting oils - - - - - - - - - - 2 -Propane - - - - - - - - 3 - - -Paving asphalt, asphaltic cement - - - - - - - - - - 2 -
Other chemicals - - - - - - - - 40 31 39 40 Ammonia and ammonium compounds - - - - - - - - 2 1 - -
Ammonia, anhydrous ammonia - - - - - - - - 2 1 - -Cyanide and cyanide compounds - - - - - - - - - - 1 -Oxygen and oxygen compounds - - - - - - - - 14 18 21 24
Carbon monoxide - - - - - - - - 12 17 19 24 Carbon dioxide, dry ice - - - - - - - - - 1 - -Nitrogen oxides - - - - - - - - - - 1 -
Plastics, resins - - - - - - - - 1 - 1 3
See footnotes at end of table. 176
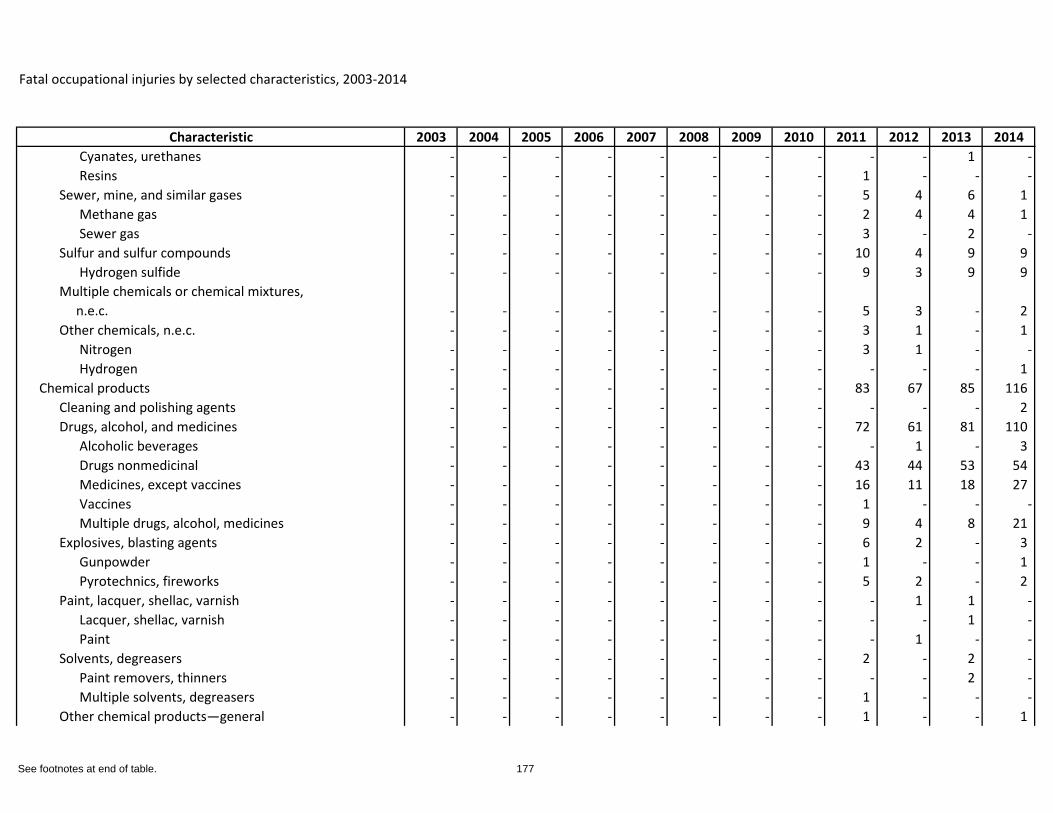
Fatal occupational injuries by selected characteristics, 2003-2014
Characteristic 2003 2004 2005 2006 2007 2008 2009 2010 2011 2012 2013 2014Cyanates, urethanes - - - - - - - - - - 1 -Resins - - - - - - - - 1 - - -
Sewer, mine, and similar gases - - - - - - - - 5 4 6 1 Methane gas - - - - - - - - 2 4 4 1 Sewer gas - - - - - - - - 3 - 2 -
Sulfur and sulfur compounds - - - - - - - - 10 4 9 9 Hydrogen sulfide - - - - - - - - 9 3 9 9
Multiple chemicals or chemical mixtures, n.e.c. - - - - - - - - 5 3 - 2 Other chemicals, n.e.c. - - - - - - - - 3 1 - 1
Nitrogen - - - - - - - - 3 1 - -Hydrogen - - - - - - - - - - - 1
Chemical products - - - - - - - - 83 67 85 116 Cleaning and polishing agents - - - - - - - - - - - 2 Drugs, alcohol, and medicines - - - - - - - - 72 61 81 110
Alcoholic beverages - - - - - - - - - 1 - 3 Drugs nonmedicinal - - - - - - - - 43 44 53 54 Medicines, except vaccines - - - - - - - - 16 11 18 27 Vaccines - - - - - - - - 1 - - -Multiple drugs, alcohol, medicines - - - - - - - - 9 4 8 21
Explosives, blasting agents - - - - - - - - 6 2 - 3 Gunpowder - - - - - - - - 1 - - 1 Pyrotechnics, fireworks - - - - - - - - 5 2 - 2
Paint, lacquer, shellac, varnish - - - - - - - - - 1 1 -Lacquer, shellac, varnish - - - - - - - - - - 1 -Paint - - - - - - - - - 1 - -
Solvents, degreasers - - - - - - - - 2 - 2 -Paint removers, thinners - - - - - - - - - - 2 -Multiple solvents, degreasers - - - - - - - - 1 - - -
Other chemical products—general - - - - - - - - 1 - - 1
See footnotes at end of table. 177
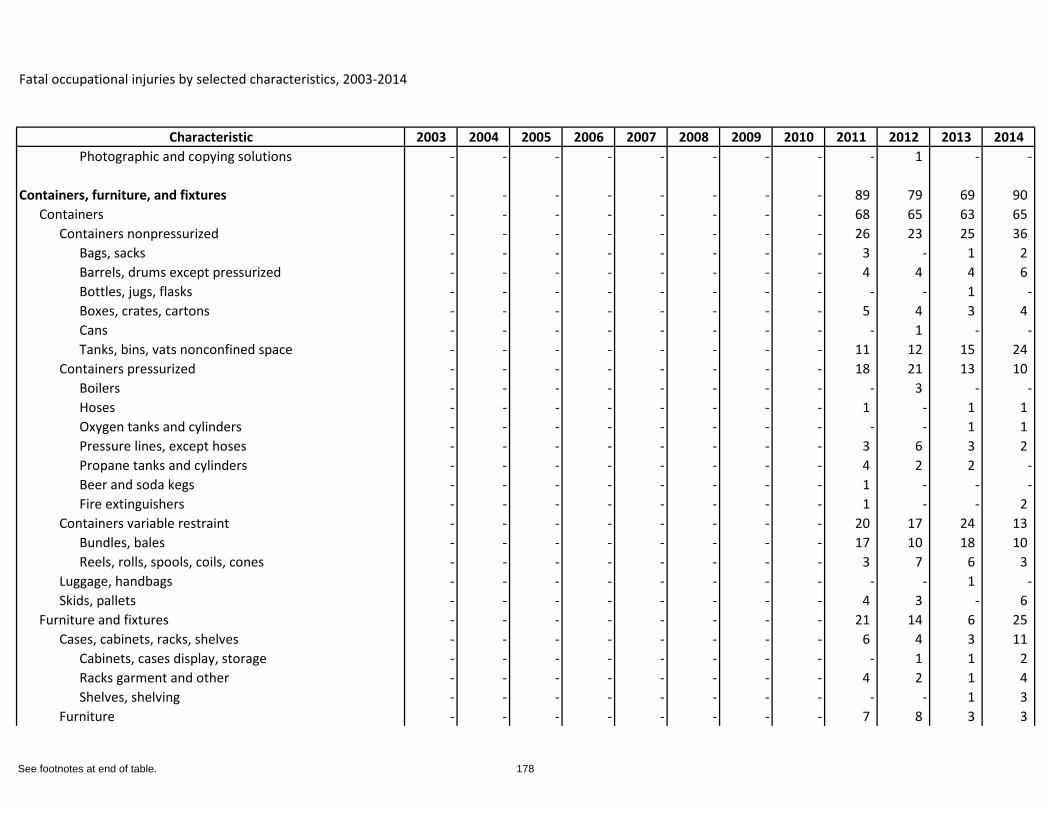
Fatal occupational injuries by selected characteristics, 2003-2014
Characteristic 2003 2004 2005 2006 2007 2008 2009 2010 2011 2012 2013 2014Photographic and copying solutions - - - - - - - - - 1 - -
Containers, furniture, and fixtures - - - - - - - - 89 79 69 90 Containers - - - - - - - - 68 65 63 65
Containers nonpressurized - - - - - - - - 26 23 25 36 Bags, sacks - - - - - - - - 3 - 1 2 Barrels, drums except pressurized - - - - - - - - 4 4 4 6 Bottles, jugs, flasks - - - - - - - - - - 1 -Boxes, crates, cartons - - - - - - - - 5 4 3 4 Cans - - - - - - - - - 1 - -Tanks, bins, vats nonconfined space - - - - - - - - 11 12 15 24
Containers pressurized - - - - - - - - 18 21 13 10 Boilers - - - - - - - - - 3 - -Hoses - - - - - - - - 1 - 1 1 Oxygen tanks and cylinders - - - - - - - - - - 1 1 Pressure lines, except hoses - - - - - - - - 3 6 3 2 Propane tanks and cylinders - - - - - - - - 4 2 2 -Beer and soda kegs - - - - - - - - 1 - - -Fire extinguishers - - - - - - - - 1 - - 2
Containers variable restraint - - - - - - - - 20 17 24 13 Bundles, bales - - - - - - - - 17 10 18 10 Reels, rolls, spools, coils, cones - - - - - - - - 3 7 6 3
Luggage, handbags - - - - - - - - - - 1 -Skids, pallets - - - - - - - - 4 3 - 6
Furniture and fixtures - - - - - - - - 21 14 6 25 Cases, cabinets, racks, shelves - - - - - - - - 6 4 3 11
Cabinets, cases display, storage - - - - - - - - - 1 1 2 Racks garment and other - - - - - - - - 4 2 1 4 Shelves, shelving - - - - - - - - - - 1 3
Furniture - - - - - - - - 7 8 3 3
See footnotes at end of table. 178
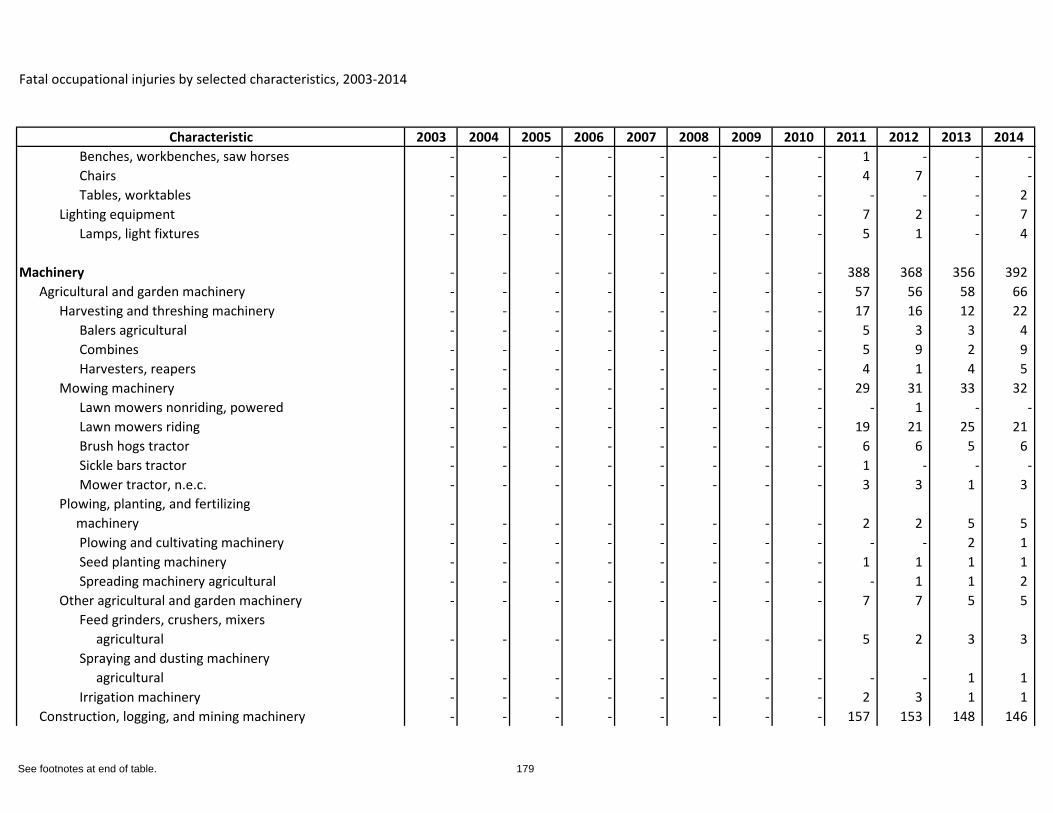
Fatal occupational injuries by selected characteristics, 2003-2014
Characteristic 2003 2004 2005 2006 2007 2008 2009 2010 2011 2012 2013 2014Benches, workbenches, saw horses - - - - - - - - 1 - - -Chairs - - - - - - - - 4 7 - -Tables, worktables - - - - - - - - - - - 2
Lighting equipment - - - - - - - - 7 2 - 7 Lamps, light fixtures - - - - - - - - 5 1 - 4
Machinery - - - - - - - - 388 368 356 392 Agricultural and garden machinery - - - - - - - - 57 56 58 66
Harvesting and threshing machinery - - - - - - - - 17 16 12 22 Balers agricultural - - - - - - - - 5 3 3 4 Combines - - - - - - - - 5 9 2 9 Harvesters, reapers - - - - - - - - 4 1 4 5
Mowing machinery - - - - - - - - 29 31 33 32 Lawn mowers nonriding, powered - - - - - - - - - 1 - -Lawn mowers riding - - - - - - - - 19 21 25 21 Brush hogs tractor - - - - - - - - 6 6 5 6 Sickle bars tractor - - - - - - - - 1 - - -Mower tractor, n.e.c. - - - - - - - - 3 3 1 3
Plowing, planting, and fertilizing machinery - - - - - - - - 2 2 5 5
Plowing and cultivating machinery - - - - - - - - - - 2 1 Seed planting machinery - - - - - - - - 1 1 1 1 Spreading machinery agricultural - - - - - - - - - 1 1 2
Other agricultural and garden machinery - - - - - - - - 7 7 5 5 Feed grinders, crushers, mixers agricultural - - - - - - - - 5 2 3 3 Spraying and dusting machinery agricultural - - - - - - - - - - 1 1 Irrigation machinery - - - - - - - - 2 3 1 1
Construction, logging, and mining machinery - - - - - - - - 157 153 148 146
See footnotes at end of table. 179
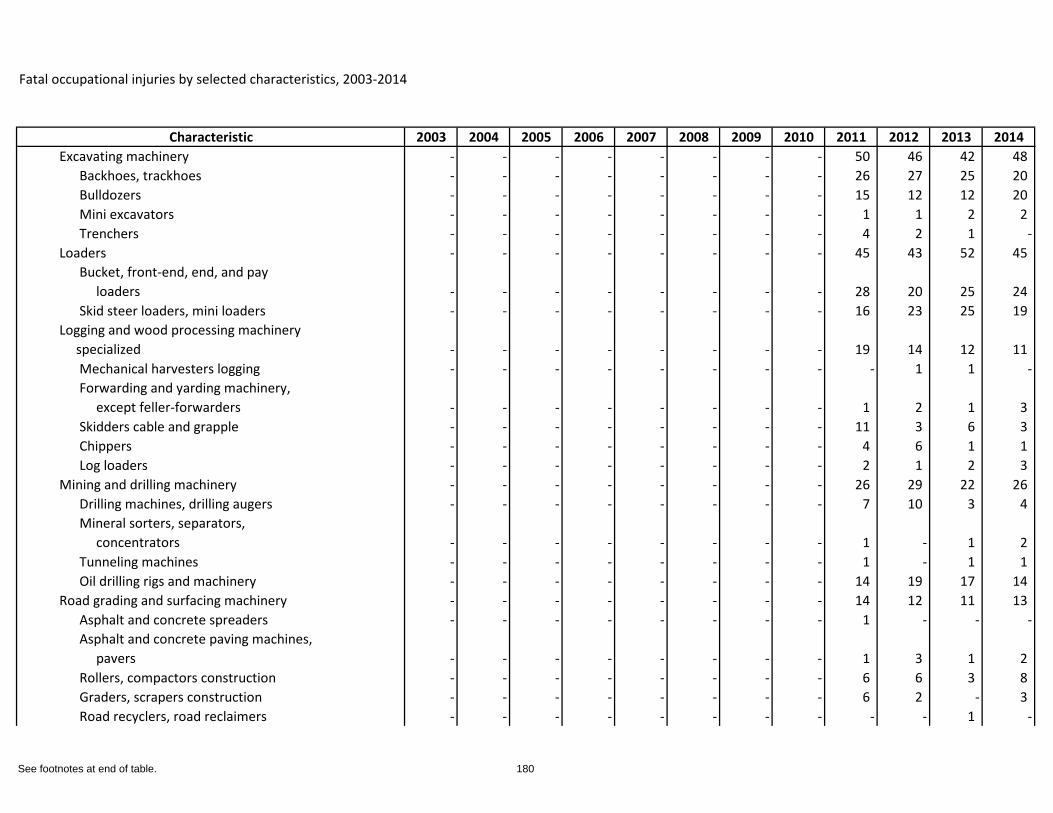
Fatal occupational injuries by selected characteristics, 2003-2014
Characteristic 2003 2004 2005 2006 2007 2008 2009 2010 2011 2012 2013 2014Excavating machinery - - - - - - - - 50 46 42 48
Backhoes, trackhoes - - - - - - - - 26 27 25 20 Bulldozers - - - - - - - - 15 12 12 20 Mini excavators - - - - - - - - 1 1 2 2 Trenchers - - - - - - - - 4 2 1 -
Loaders - - - - - - - - 45 43 52 45 Bucket, front-end, end, and pay loaders - - - - - - - - 28 20 25 24 Skid steer loaders, mini loaders - - - - - - - - 16 23 25 19
Logging and wood processing machinery specialized - - - - - - - - 19 14 12 11
Mechanical harvesters logging - - - - - - - - - 1 1 -Forwarding and yarding machinery, except feller-forwarders - - - - - - - - 1 2 1 3 Skidders cable and grapple - - - - - - - - 11 3 6 3 Chippers - - - - - - - - 4 6 1 1 Log loaders - - - - - - - - 2 1 2 3
Mining and drilling machinery - - - - - - - - 26 29 22 26 Drilling machines, drilling augers - - - - - - - - 7 10 3 4 Mineral sorters, separators, concentrators - - - - - - - - 1 - 1 2 Tunneling machines - - - - - - - - 1 - 1 1 Oil drilling rigs and machinery - - - - - - - - 14 19 17 14
Road grading and surfacing machinery - - - - - - - - 14 12 11 13 Asphalt and concrete spreaders - - - - - - - - 1 - - -Asphalt and concrete paving machines, pavers - - - - - - - - 1 3 1 2 Rollers, compactors construction - - - - - - - - 6 6 3 8 Graders, scrapers construction - - - - - - - - 6 2 - 3 Road recyclers, road reclaimers - - - - - - - - - - 1 -
See footnotes at end of table. 180
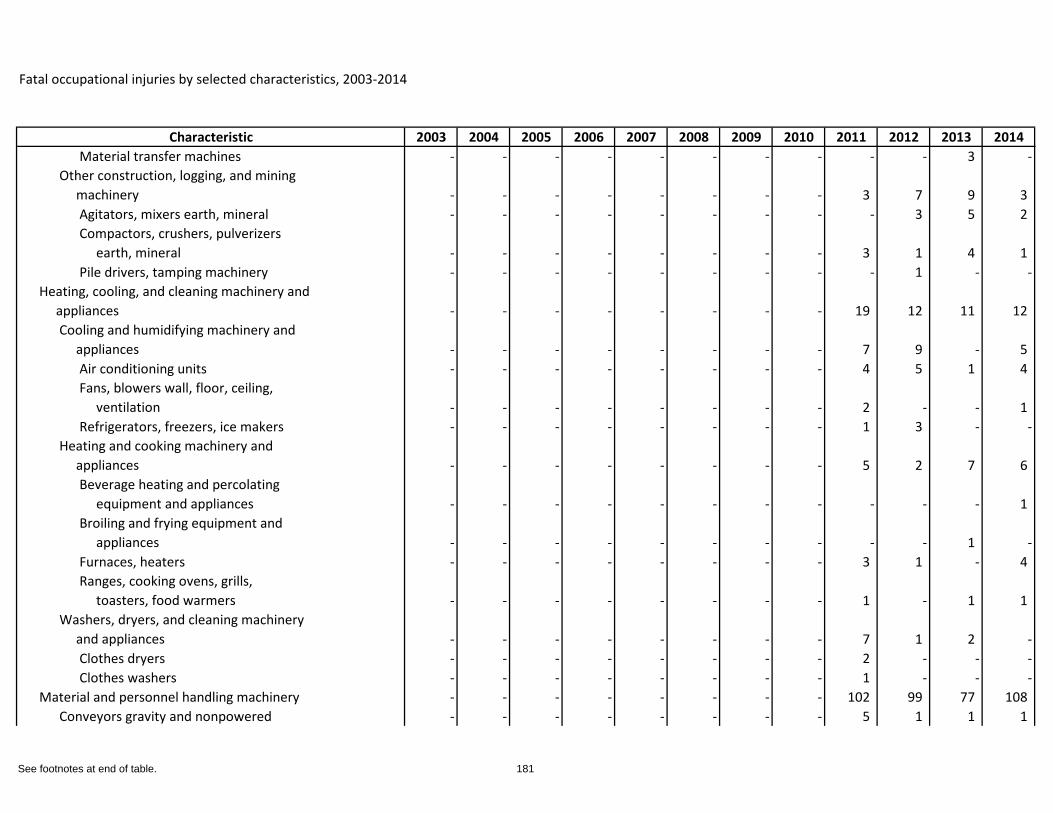
Fatal occupational injuries by selected characteristics, 2003-2014
Characteristic 2003 2004 2005 2006 2007 2008 2009 2010 2011 2012 2013 2014Material transfer machines - - - - - - - - - - 3 -
Other construction, logging, and mining machinery - - - - - - - - 3 7 9 3
Agitators, mixers earth, mineral - - - - - - - - - 3 5 2 Compactors, crushers, pulverizers earth, mineral - - - - - - - - 3 1 4 1 Pile drivers, tamping machinery - - - - - - - - - 1 - -
Heating, cooling, and cleaning machinery and appliances - - - - - - - - 19 12 11 12
Cooling and humidifying machinery and appliances - - - - - - - - 7 9 - 5
Air conditioning units - - - - - - - - 4 5 1 4 Fans, blowers wall, floor, ceiling, ventilation - - - - - - - - 2 - - 1 Refrigerators, freezers, ice makers - - - - - - - - 1 3 - -
Heating and cooking machinery and appliances - - - - - - - - 5 2 7 6
Beverage heating and percolating equipment and appliances - - - - - - - - - - - 1 Broiling and frying equipment and appliances - - - - - - - - - - 1 -Furnaces, heaters - - - - - - - - 3 1 - 4 Ranges, cooking ovens, grills, toasters, food warmers - - - - - - - - 1 - 1 1
Washers, dryers, and cleaning machinery and appliances - - - - - - - - 7 1 2 -
Clothes dryers - - - - - - - - 2 - - -Clothes washers - - - - - - - - 1 - - -
Material and personnel handling machinery - - - - - - - - 102 99 77 108 Conveyors gravity and nonpowered - - - - - - - - 5 1 1 1
See footnotes at end of table. 181
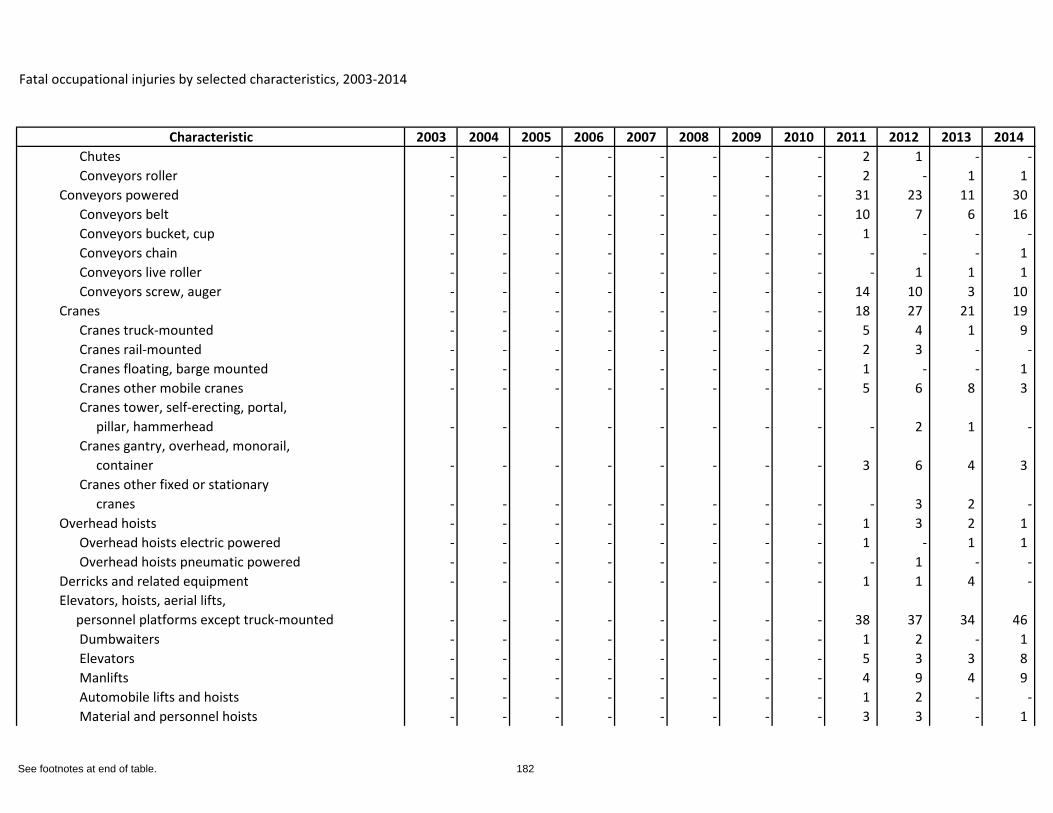
Fatal occupational injuries by selected characteristics, 2003-2014
Characteristic 2003 2004 2005 2006 2007 2008 2009 2010 2011 2012 2013 2014Chutes - - - - - - - - 2 1 - -Conveyors roller - - - - - - - - 2 - 1 1
Conveyors powered - - - - - - - - 31 23 11 30 Conveyors belt - - - - - - - - 10 7 6 16 Conveyors bucket, cup - - - - - - - - 1 - - -Conveyors chain - - - - - - - - - - - 1 Conveyors live roller - - - - - - - - - 1 1 1 Conveyors screw, auger - - - - - - - - 14 10 3 10
Cranes - - - - - - - - 18 27 21 19 Cranes truck-mounted - - - - - - - - 5 4 1 9 Cranes rail-mounted - - - - - - - - 2 3 - -Cranes floating, barge mounted - - - - - - - - 1 - - 1 Cranes other mobile cranes - - - - - - - - 5 6 8 3 Cranes tower, self-erecting, portal, pillar, hammerhead - - - - - - - - - 2 1 -Cranes gantry, overhead, monorail, container - - - - - - - - 3 6 4 3 Cranes other fixed or stationary cranes - - - - - - - - - 3 2 -
Overhead hoists - - - - - - - - 1 3 2 1 Overhead hoists electric powered - - - - - - - - 1 - 1 1 Overhead hoists pneumatic powered - - - - - - - - - 1 - -
Derricks and related equipment - - - - - - - - 1 1 4 -Elevators, hoists, aerial lifts, personnel platforms except truck-mounted - - - - - - - - 38 37 34 46
Dumbwaiters - - - - - - - - 1 2 - 1 Elevators - - - - - - - - 5 3 3 8 Manlifts - - - - - - - - 4 9 4 9 Automobile lifts and hoists - - - - - - - - 1 2 - -Material and personnel hoists - - - - - - - - 3 3 - 1
See footnotes at end of table. 182
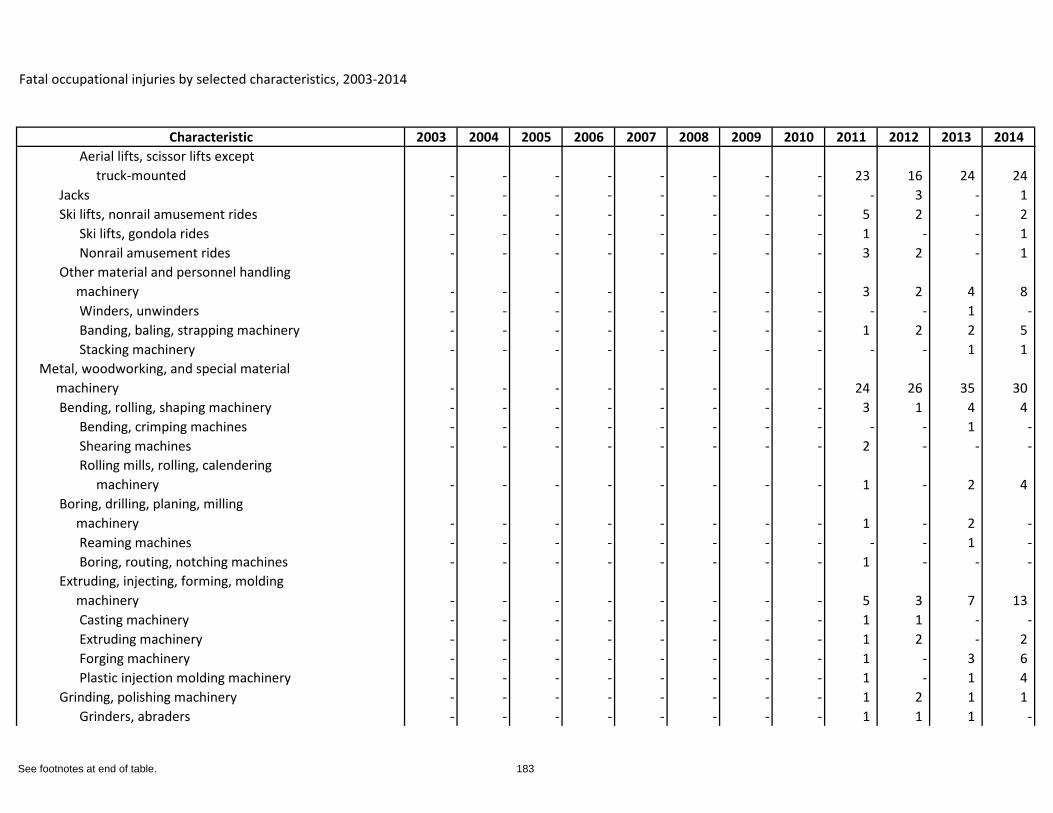
Fatal occupational injuries by selected characteristics, 2003-2014
Characteristic 2003 2004 2005 2006 2007 2008 2009 2010 2011 2012 2013 2014Aerial lifts, scissor lifts except truck-mounted - - - - - - - - 23 16 24 24
Jacks - - - - - - - - - 3 - 1 Ski lifts, nonrail amusement rides - - - - - - - - 5 2 - 2
Ski lifts, gondola rides - - - - - - - - 1 - - 1 Nonrail amusement rides - - - - - - - - 3 2 - 1
Other material and personnel handling machinery - - - - - - - - 3 2 4 8
Winders, unwinders - - - - - - - - - - 1 -Banding, baling, strapping machinery - - - - - - - - 1 2 2 5 Stacking machinery - - - - - - - - - - 1 1
Metal, woodworking, and special material machinery - - - - - - - - 24 26 35 30
Bending, rolling, shaping machinery - - - - - - - - 3 1 4 4 Bending, crimping machines - - - - - - - - - - 1 -Shearing machines - - - - - - - - 2 - - -Rolling mills, rolling, calendering machinery - - - - - - - - 1 - 2 4
Boring, drilling, planing, milling machinery - - - - - - - - 1 - 2 -
Reaming machines - - - - - - - - - - 1 -Boring, routing, notching machines - - - - - - - - 1 - - -
Extruding, injecting, forming, molding machinery - - - - - - - - 5 3 7 13
Casting machinery - - - - - - - - 1 1 - -Extruding machinery - - - - - - - - 1 2 - 2 Forging machinery - - - - - - - - 1 - 3 6 Plastic injection molding machinery - - - - - - - - 1 - 1 4
Grinding, polishing machinery - - - - - - - - 1 2 1 1 Grinders, abraders - - - - - - - - 1 1 1 -
See footnotes at end of table. 183
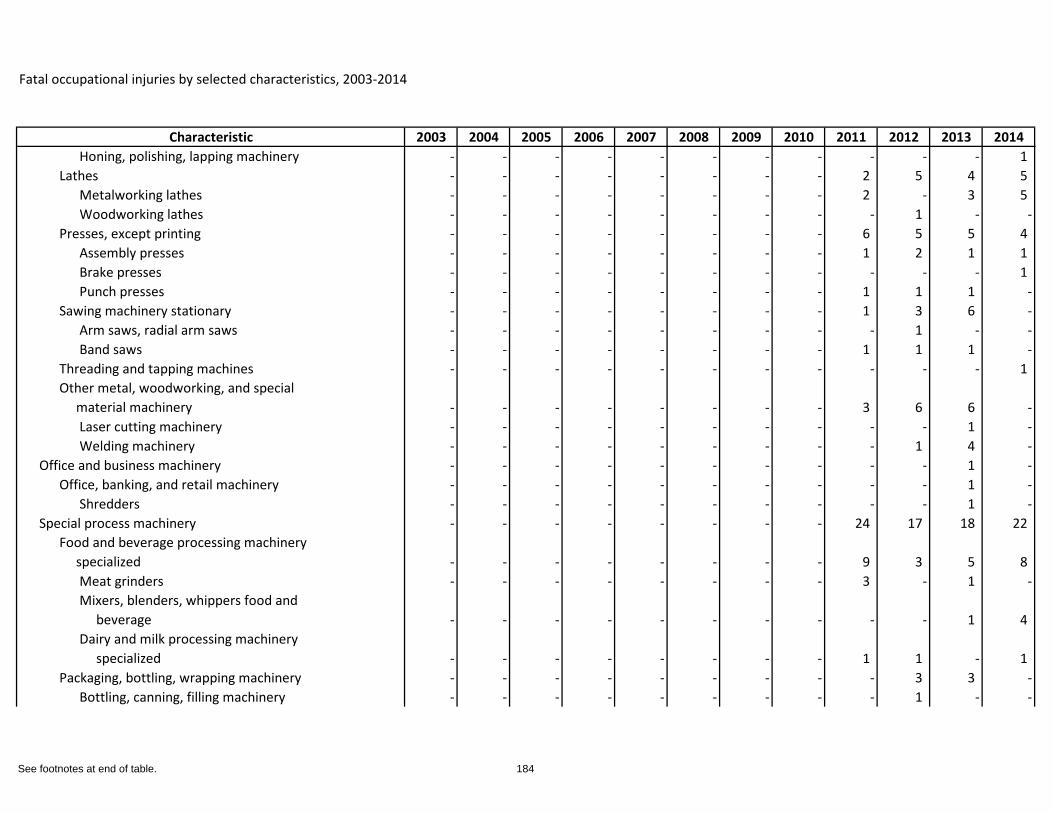
Fatal occupational injuries by selected characteristics, 2003-2014
Characteristic 2003 2004 2005 2006 2007 2008 2009 2010 2011 2012 2013 2014Honing, polishing, lapping machinery - - - - - - - - - - - 1
Lathes - - - - - - - - 2 5 4 5 Metalworking lathes - - - - - - - - 2 - 3 5 Woodworking lathes - - - - - - - - - 1 - -
Presses, except printing - - - - - - - - 6 5 5 4 Assembly presses - - - - - - - - 1 2 1 1 Brake presses - - - - - - - - - - - 1 Punch presses - - - - - - - - 1 1 1 -
Sawing machinery stationary - - - - - - - - 1 3 6 -Arm saws, radial arm saws - - - - - - - - - 1 - -Band saws - - - - - - - - 1 1 1 -
Threading and tapping machines - - - - - - - - - - - 1 Other metal, woodworking, and special material machinery - - - - - - - - 3 6 6 -
Laser cutting machinery - - - - - - - - - - 1 -Welding machinery - - - - - - - - - 1 4 -
Office and business machinery - - - - - - - - - - 1 -Office, banking, and retail machinery - - - - - - - - - - 1 -
Shredders - - - - - - - - - - 1 -Special process machinery - - - - - - - - 24 17 18 22
Food and beverage processing machinery specialized - - - - - - - - 9 3 5 8
Meat grinders - - - - - - - - 3 - 1 -Mixers, blenders, whippers food and beverage - - - - - - - - - - 1 4 Dairy and milk processing machinery specialized - - - - - - - - 1 1 - 1
Packaging, bottling, wrapping machinery - - - - - - - - - 3 3 -Bottling, canning, filling machinery - - - - - - - - - 1 - -
See footnotes at end of table. 184
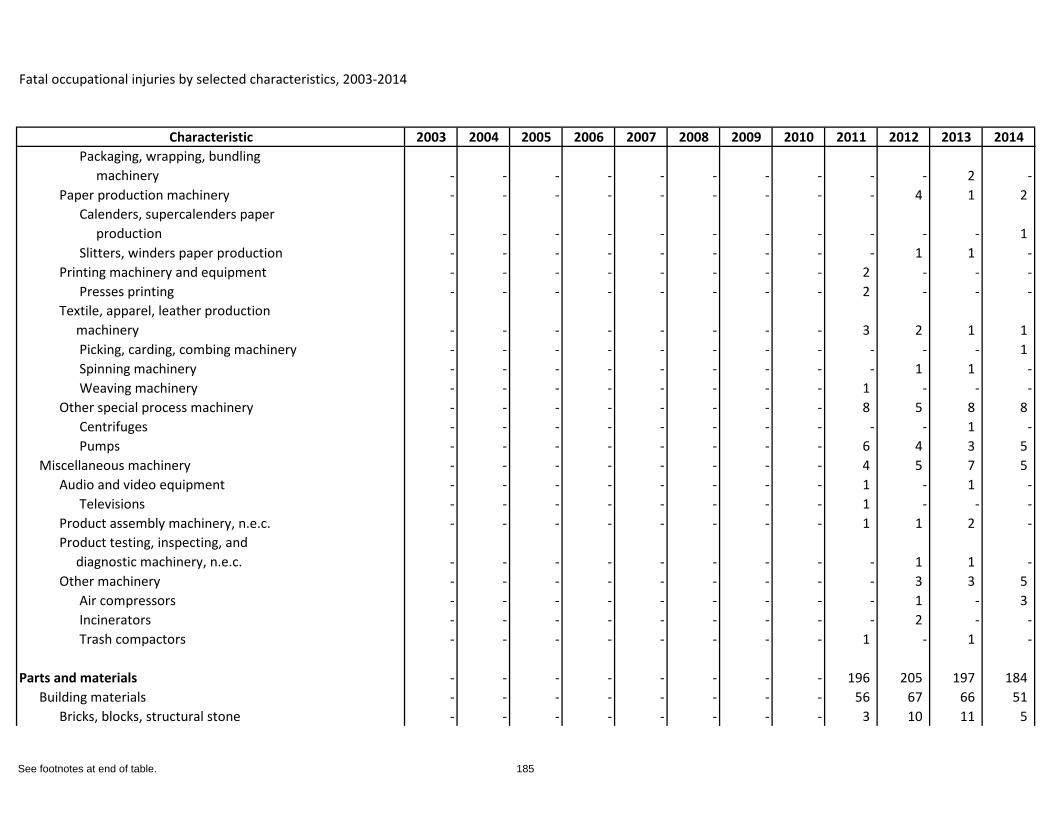
Fatal occupational injuries by selected characteristics, 2003-2014
Characteristic 2003 2004 2005 2006 2007 2008 2009 2010 2011 2012 2013 2014Packaging, wrapping, bundling machinery - - - - - - - - - - 2 -
Paper production machinery - - - - - - - - - 4 1 2 Calenders, supercalenders paper production - - - - - - - - - - - 1 Slitters, winders paper production - - - - - - - - - 1 1 -
Printing machinery and equipment - - - - - - - - 2 - - -Presses printing - - - - - - - - 2 - - -
Textile, apparel, leather production machinery - - - - - - - - 3 2 1 1
Picking, carding, combing machinery - - - - - - - - - - - 1 Spinning machinery - - - - - - - - - 1 1 -Weaving machinery - - - - - - - - 1 - - -
Other special process machinery - - - - - - - - 8 5 8 8 Centrifuges - - - - - - - - - - 1 -Pumps - - - - - - - - 6 4 3 5
Miscellaneous machinery - - - - - - - - 4 5 7 5 Audio and video equipment - - - - - - - - 1 - 1 -
Televisions - - - - - - - - 1 - - -Product assembly machinery, n.e.c. - - - - - - - - 1 1 2 -Product testing, inspecting, and diagnostic machinery, n.e.c. - - - - - - - - - 1 1 -Other machinery - - - - - - - - - 3 3 5
Air compressors - - - - - - - - - 1 - 3 Incinerators - - - - - - - - - 2 - -Trash compactors - - - - - - - - 1 - 1 -
Parts and materials - - - - - - - - 196 205 197 184 Building materials - - - - - - - - 56 67 66 51
Bricks, blocks, structural stone - - - - - - - - 3 10 11 5
See footnotes at end of table. 185
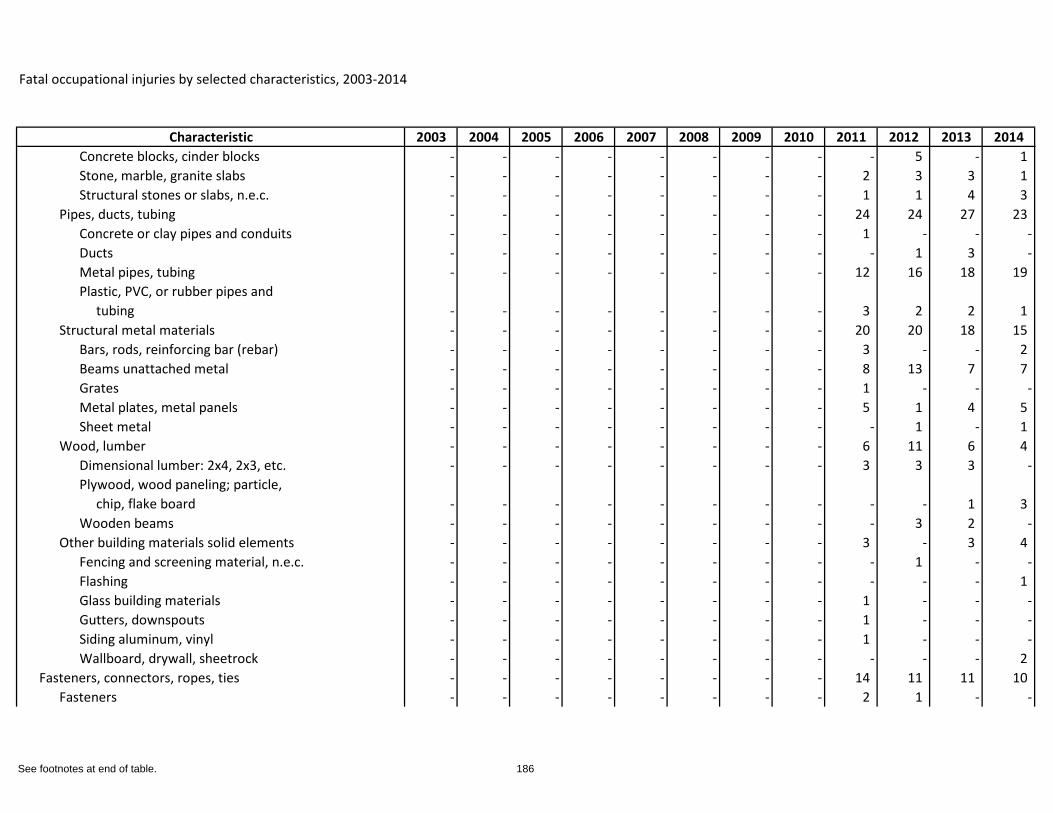
Fatal occupational injuries by selected characteristics, 2003-2014
Characteristic 2003 2004 2005 2006 2007 2008 2009 2010 2011 2012 2013 2014Concrete blocks, cinder blocks - - - - - - - - - 5 - 1 Stone, marble, granite slabs - - - - - - - - 2 3 3 1 Structural stones or slabs, n.e.c. - - - - - - - - 1 1 4 3
Pipes, ducts, tubing - - - - - - - - 24 24 27 23 Concrete or clay pipes and conduits - - - - - - - - 1 - - -Ducts - - - - - - - - - 1 3 -Metal pipes, tubing - - - - - - - - 12 16 18 19 Plastic, PVC, or rubber pipes and tubing - - - - - - - - 3 2 2 1
Structural metal materials - - - - - - - - 20 20 18 15 Bars, rods, reinforcing bar (rebar) - - - - - - - - 3 - - 2 Beams unattached metal - - - - - - - - 8 13 7 7 Grates - - - - - - - - 1 - - -Metal plates, metal panels - - - - - - - - 5 1 4 5 Sheet metal - - - - - - - - - 1 - 1
Wood, lumber - - - - - - - - 6 11 6 4 Dimensional lumber: 2x4, 2x3, etc. - - - - - - - - 3 3 3 -Plywood, wood paneling; particle, chip, flake board - - - - - - - - - - 1 3 Wooden beams - - - - - - - - - 3 2 -
Other building materials solid elements - - - - - - - - 3 - 3 4 Fencing and screening material, n.e.c. - - - - - - - - - 1 - -Flashing - - - - - - - - - - - 1 Glass building materials - - - - - - - - 1 - - -Gutters, downspouts - - - - - - - - 1 - - -Siding aluminum, vinyl - - - - - - - - 1 - - -Wallboard, drywall, sheetrock - - - - - - - - - - - 2
Fasteners, connectors, ropes, ties - - - - - - - - 14 11 11 10 Fasteners - - - - - - - - 2 1 - -
See footnotes at end of table. 186
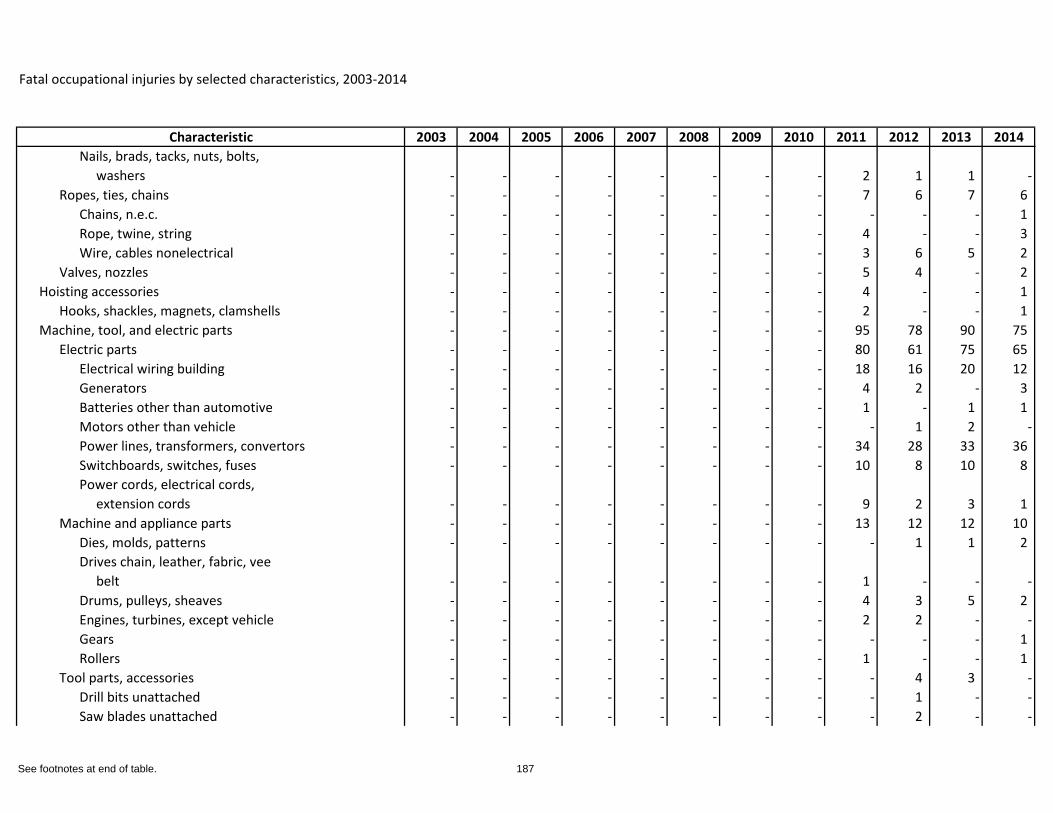
Fatal occupational injuries by selected characteristics, 2003-2014
Characteristic 2003 2004 2005 2006 2007 2008 2009 2010 2011 2012 2013 2014Nails, brads, tacks, nuts, bolts, washers - - - - - - - - 2 1 1 -
Ropes, ties, chains - - - - - - - - 7 6 7 6 Chains, n.e.c. - - - - - - - - - - - 1 Rope, twine, string - - - - - - - - 4 - - 3 Wire, cables nonelectrical - - - - - - - - 3 6 5 2
Valves, nozzles - - - - - - - - 5 4 - 2 Hoisting accessories - - - - - - - - 4 - - 1
Hooks, shackles, magnets, clamshells - - - - - - - - 2 - - 1 Machine, tool, and electric parts - - - - - - - - 95 78 90 75
Electric parts - - - - - - - - 80 61 75 65 Electrical wiring building - - - - - - - - 18 16 20 12 Generators - - - - - - - - 4 2 - 3 Batteries other than automotive - - - - - - - - 1 - 1 1 Motors other than vehicle - - - - - - - - - 1 2 -Power lines, transformers, convertors - - - - - - - - 34 28 33 36 Switchboards, switches, fuses - - - - - - - - 10 8 10 8 Power cords, electrical cords, extension cords - - - - - - - - 9 2 3 1
Machine and appliance parts - - - - - - - - 13 12 12 10 Dies, molds, patterns - - - - - - - - - 1 1 2 Drives chain, leather, fabric, vee belt - - - - - - - - 1 - - -Drums, pulleys, sheaves - - - - - - - - 4 3 5 2 Engines, turbines, except vehicle - - - - - - - - 2 2 - -Gears - - - - - - - - - - - 1 Rollers - - - - - - - - 1 - - 1
Tool parts, accessories - - - - - - - - - 4 3 -Drill bits unattached - - - - - - - - - 1 - -Saw blades unattached - - - - - - - - - 2 - -
See footnotes at end of table. 187
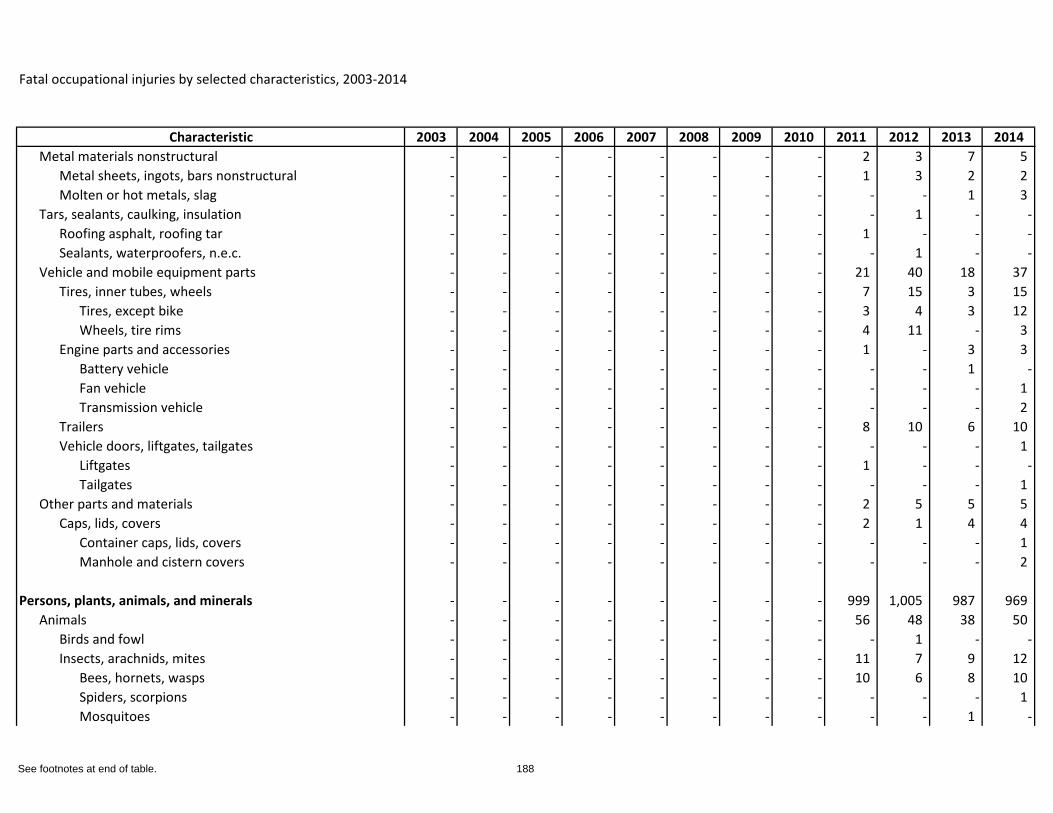
Fatal occupational injuries by selected characteristics, 2003-2014
Characteristic 2003 2004 2005 2006 2007 2008 2009 2010 2011 2012 2013 2014Metal materials nonstructural - - - - - - - - 2 3 7 5
Metal sheets, ingots, bars nonstructural - - - - - - - - 1 3 2 2 Molten or hot metals, slag - - - - - - - - - - 1 3
Tars, sealants, caulking, insulation - - - - - - - - - 1 - -Roofing asphalt, roofing tar - - - - - - - - 1 - - -Sealants, waterproofers, n.e.c. - - - - - - - - - 1 - -
Vehicle and mobile equipment parts - - - - - - - - 21 40 18 37 Tires, inner tubes, wheels - - - - - - - - 7 15 3 15
Tires, except bike - - - - - - - - 3 4 3 12 Wheels, tire rims - - - - - - - - 4 11 - 3
Engine parts and accessories - - - - - - - - 1 - 3 3 Battery vehicle - - - - - - - - - - 1 -Fan vehicle - - - - - - - - - - - 1 Transmission vehicle - - - - - - - - - - - 2
Trailers - - - - - - - - 8 10 6 10 Vehicle doors, liftgates, tailgates - - - - - - - - - - - 1
Liftgates - - - - - - - - 1 - - -Tailgates - - - - - - - - - - - 1
Other parts and materials - - - - - - - - 2 5 5 5 Caps, lids, covers - - - - - - - - 2 1 4 4
Container caps, lids, covers - - - - - - - - - - - 1 Manhole and cistern covers - - - - - - - - - - - 2
Persons, plants, animals, and minerals - - - - - - - - 999 1,005 987 969 Animals - - - - - - - - 56 48 38 50
Birds and fowl - - - - - - - - - 1 - -Insects, arachnids, mites - - - - - - - - 11 7 9 12
Bees, hornets, wasps - - - - - - - - 10 6 8 10 Spiders, scorpions - - - - - - - - - - - 1 Mosquitoes - - - - - - - - - - 1 -
See footnotes at end of table. 188
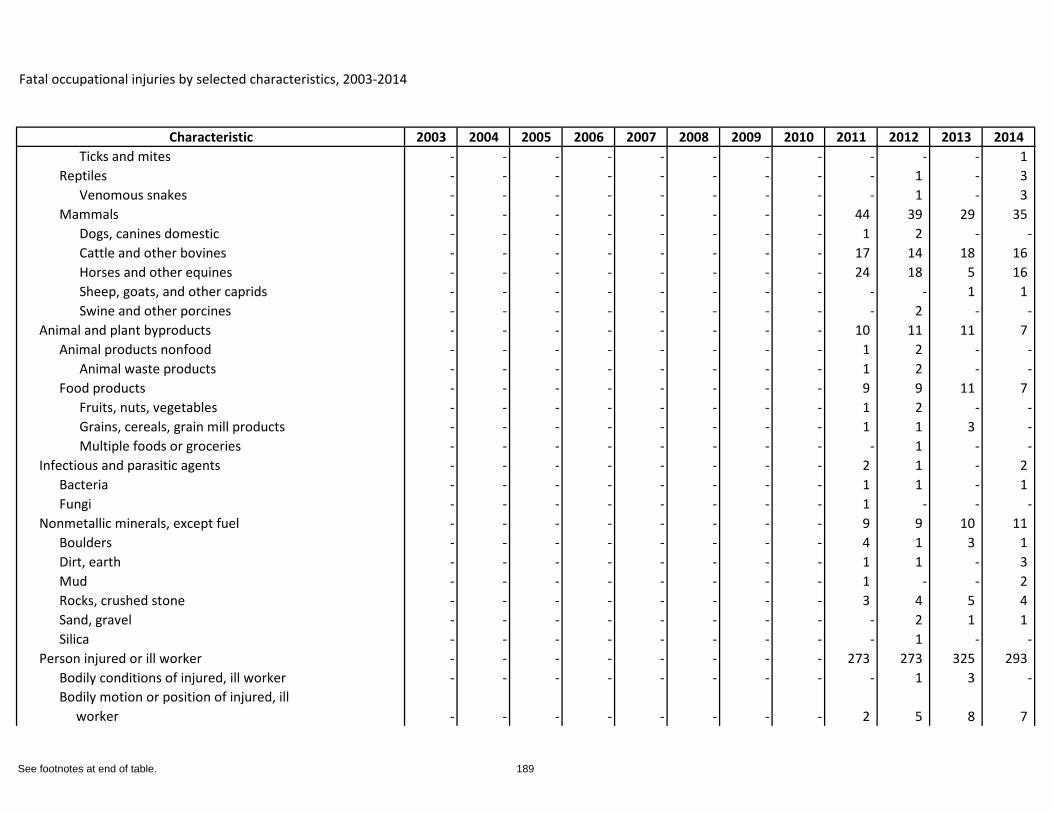
Fatal occupational injuries by selected characteristics, 2003-2014
Characteristic 2003 2004 2005 2006 2007 2008 2009 2010 2011 2012 2013 2014Ticks and mites - - - - - - - - - - - 1
Reptiles - - - - - - - - - 1 - 3 Venomous snakes - - - - - - - - - 1 - 3
Mammals - - - - - - - - 44 39 29 35 Dogs, canines domestic - - - - - - - - 1 2 - -Cattle and other bovines - - - - - - - - 17 14 18 16 Horses and other equines - - - - - - - - 24 18 5 16 Sheep, goats, and other caprids - - - - - - - - - - 1 1 Swine and other porcines - - - - - - - - - 2 - -
Animal and plant byproducts - - - - - - - - 10 11 11 7 Animal products nonfood - - - - - - - - 1 2 - -
Animal waste products - - - - - - - - 1 2 - -Food products - - - - - - - - 9 9 11 7
Fruits, nuts, vegetables - - - - - - - - 1 2 - -Grains, cereals, grain mill products - - - - - - - - 1 1 3 -Multiple foods or groceries - - - - - - - - - 1 - -
Infectious and parasitic agents - - - - - - - - 2 1 - 2 Bacteria - - - - - - - - 1 1 - 1 Fungi - - - - - - - - 1 - - -
Nonmetallic minerals, except fuel - - - - - - - - 9 9 10 11 Boulders - - - - - - - - 4 1 3 1 Dirt, earth - - - - - - - - 1 1 - 3 Mud - - - - - - - - 1 - - 2 Rocks, crushed stone - - - - - - - - 3 4 5 4 Sand, gravel - - - - - - - - - 2 1 1 Silica - - - - - - - - - 1 - -
Person injured or ill worker - - - - - - - - 273 273 325 293 Bodily conditions of injured, ill worker - - - - - - - - - 1 3 -Bodily motion or position of injured, ill worker - - - - - - - - 2 5 8 7
See footnotes at end of table. 189
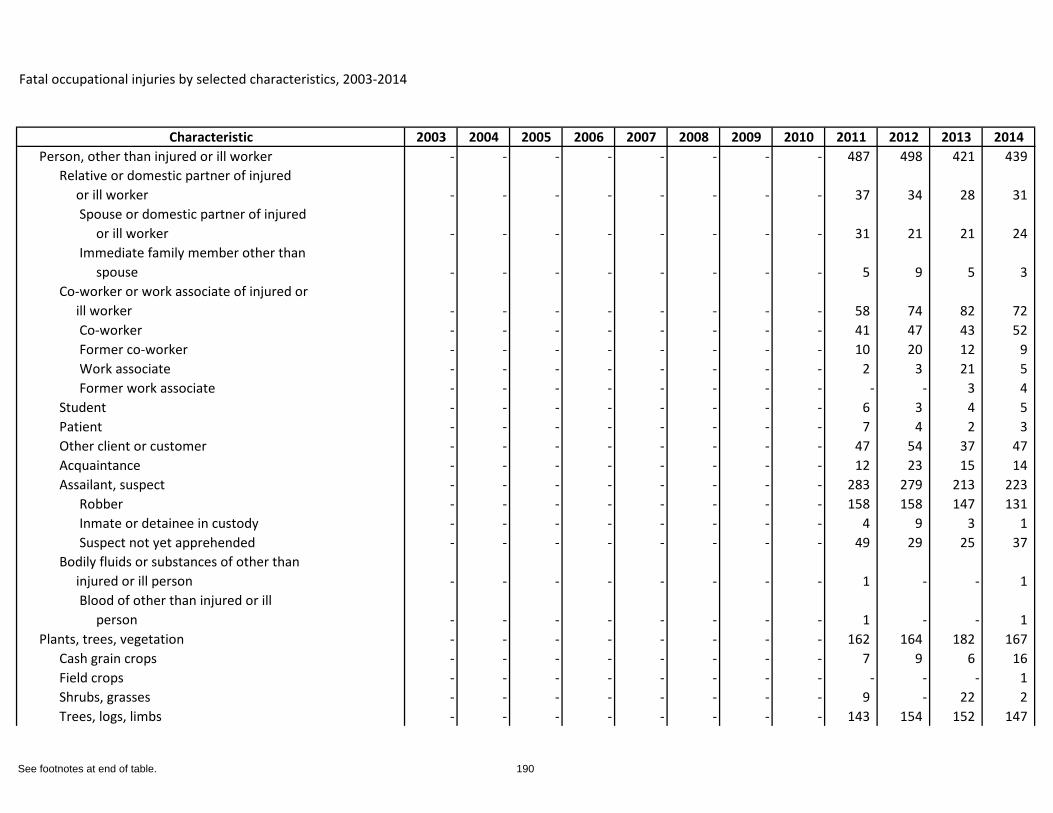
Fatal occupational injuries by selected characteristics, 2003-2014
Characteristic 2003 2004 2005 2006 2007 2008 2009 2010 2011 2012 2013 2014Person, other than injured or ill worker - - - - - - - - 487 498 421 439
Relative or domestic partner of injured or ill worker - - - - - - - - 37 34 28 31
Spouse or domestic partner of injured or ill worker - - - - - - - - 31 21 21 24 Immediate family member other than spouse - - - - - - - - 5 9 5 3
Co-worker or work associate of injured or ill worker - - - - - - - - 58 74 82 72
Co-worker - - - - - - - - 41 47 43 52 Former co-worker - - - - - - - - 10 20 12 9 Work associate - - - - - - - - 2 3 21 5 Former work associate - - - - - - - - - - 3 4
Student - - - - - - - - 6 3 4 5 Patient - - - - - - - - 7 4 2 3 Other client or customer - - - - - - - - 47 54 37 47 Acquaintance - - - - - - - - 12 23 15 14 Assailant, suspect - - - - - - - - 283 279 213 223
Robber - - - - - - - - 158 158 147 131 Inmate or detainee in custody - - - - - - - - 4 9 3 1 Suspect not yet apprehended - - - - - - - - 49 29 25 37
Bodily fluids or substances of other than injured or ill person - - - - - - - - 1 - - 1
Blood of other than injured or ill person - - - - - - - - 1 - - 1
Plants, trees, vegetation - - - - - - - - 162 164 182 167 Cash grain crops - - - - - - - - 7 9 6 16 Field crops - - - - - - - - - - - 1 Shrubs, grasses - - - - - - - - 9 - 22 2 Trees, logs, limbs - - - - - - - - 143 154 152 147
See footnotes at end of table. 190
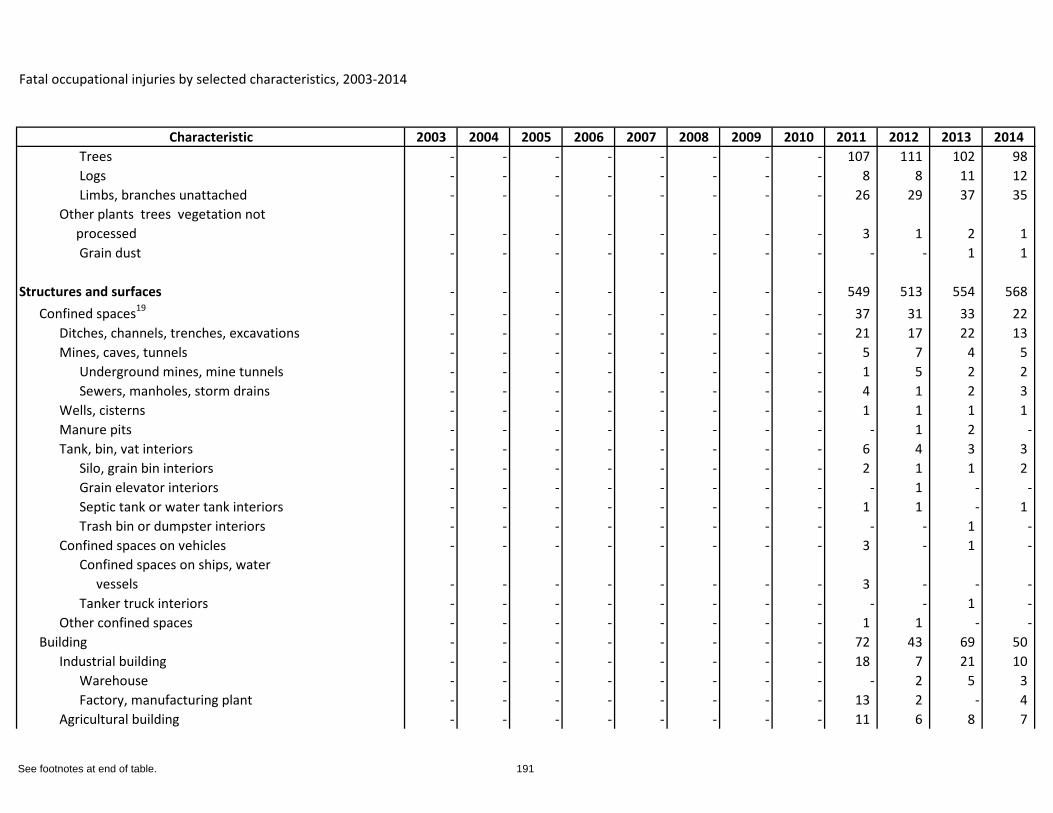
Fatal occupational injuries by selected characteristics, 2003-2014
Characteristic 2003 2004 2005 2006 2007 2008 2009 2010 2011 2012 2013 2014Trees - - - - - - - - 107 111 102 98 Logs - - - - - - - - 8 8 11 12 Limbs, branches unattached - - - - - - - - 26 29 37 35
Other plants trees vegetation not processed - - - - - - - - 3 1 2 1
Grain dust - - - - - - - - - - 1 1
Structures and surfaces - - - - - - - - 549 513 554 568 Confined spaces19 - - - - - - - - 37 31 33 22
Ditches, channels, trenches, excavations - - - - - - - - 21 17 22 13 Mines, caves, tunnels - - - - - - - - 5 7 4 5
Underground mines, mine tunnels - - - - - - - - 1 5 2 2 Sewers, manholes, storm drains - - - - - - - - 4 1 2 3
Wells, cisterns - - - - - - - - 1 1 1 1 Manure pits - - - - - - - - - 1 2 -Tank, bin, vat interiors - - - - - - - - 6 4 3 3
Silo, grain bin interiors - - - - - - - - 2 1 1 2 Grain elevator interiors - - - - - - - - - 1 - -Septic tank or water tank interiors - - - - - - - - 1 1 - 1 Trash bin or dumpster interiors - - - - - - - - - - 1 -
Confined spaces on vehicles - - - - - - - - 3 - 1 -Confined spaces on ships, water vessels - - - - - - - - 3 - - -Tanker truck interiors - - - - - - - - - - 1 -
Other confined spaces - - - - - - - - 1 1 - -Building - - - - - - - - 72 43 69 50
Industrial building - - - - - - - - 18 7 21 10 Warehouse - - - - - - - - - 2 5 3 Factory, manufacturing plant - - - - - - - - 13 2 - 4
Agricultural building - - - - - - - - 11 6 8 7
See footnotes at end of table. 191
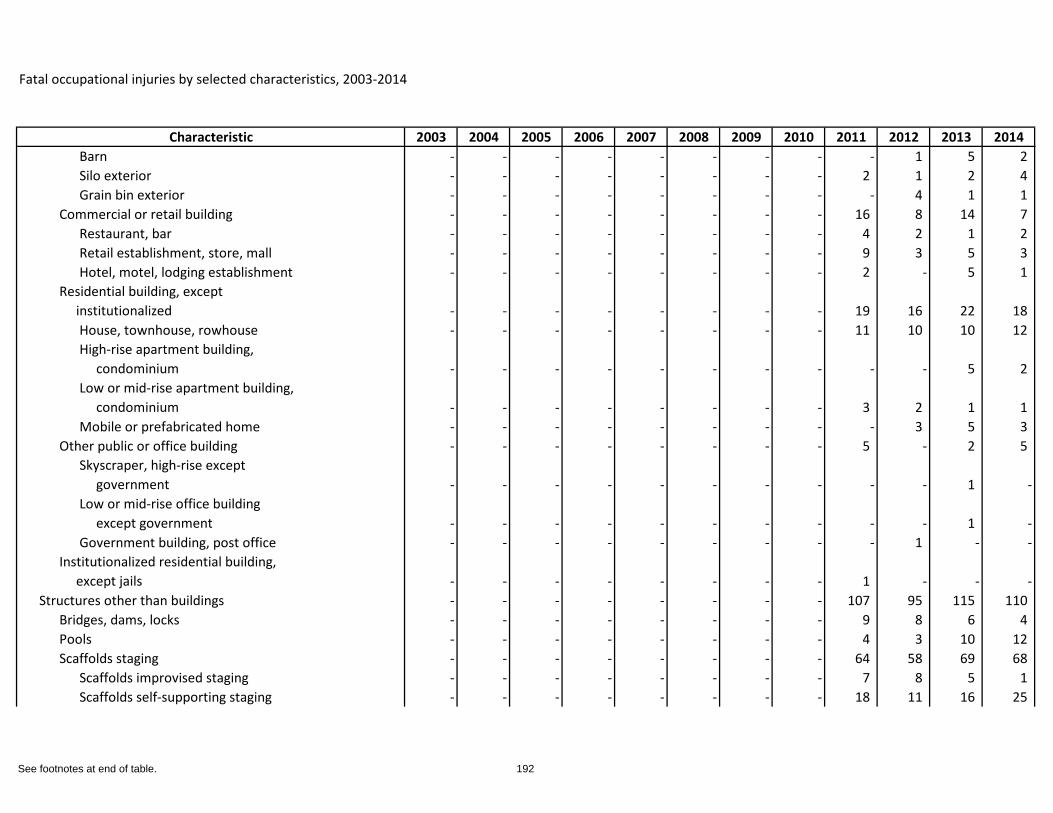
Fatal occupational injuries by selected characteristics, 2003-2014
Characteristic 2003 2004 2005 2006 2007 2008 2009 2010 2011 2012 2013 2014Barn - - - - - - - - - 1 5 2 Silo exterior - - - - - - - - 2 1 2 4 Grain bin exterior - - - - - - - - - 4 1 1
Commercial or retail building - - - - - - - - 16 8 14 7 Restaurant, bar - - - - - - - - 4 2 1 2 Retail establishment, store, mall - - - - - - - - 9 3 5 3 Hotel, motel, lodging establishment - - - - - - - - 2 - 5 1
Residential building, except institutionalized - - - - - - - - 19 16 22 18
House, townhouse, rowhouse - - - - - - - - 11 10 10 12 High-rise apartment building, condominium - - - - - - - - - - 5 2 Low or mid-rise apartment building, condominium - - - - - - - - 3 2 1 1 Mobile or prefabricated home - - - - - - - - - 3 5 3
Other public or office building - - - - - - - - 5 - 2 5 Skyscraper, high-rise except government - - - - - - - - - - 1 -Low or mid-rise office building except government - - - - - - - - - - 1 -Government building, post office - - - - - - - - - 1 - -
Institutionalized residential building, except jails - - - - - - - - 1 - - -
Structures other than buildings - - - - - - - - 107 95 115 110 Bridges, dams, locks - - - - - - - - 9 8 6 4 Pools - - - - - - - - 4 3 10 12 Scaffolds staging - - - - - - - - 64 58 69 68
Scaffolds improvised staging - - - - - - - - 7 8 5 1 Scaffolds self-supporting staging - - - - - - - - 18 11 16 25
See footnotes at end of table. 192
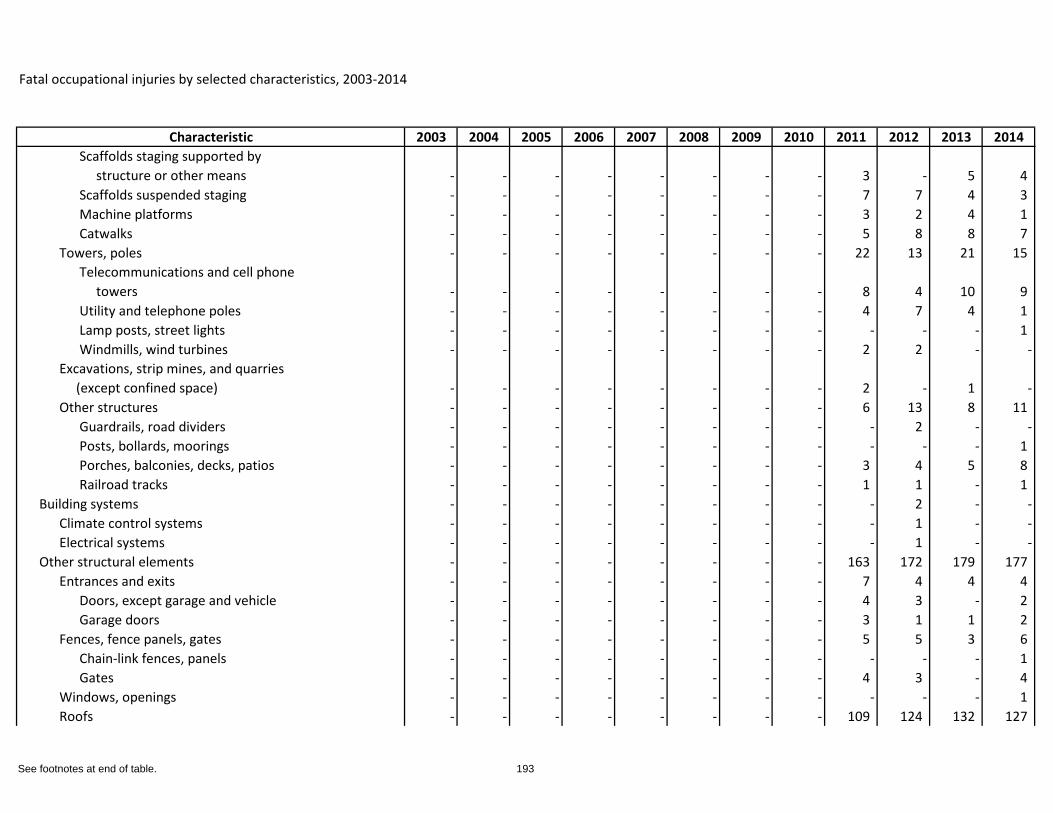
Fatal occupational injuries by selected characteristics, 2003-2014
Characteristic 2003 2004 2005 2006 2007 2008 2009 2010 2011 2012 2013 2014Scaffolds staging supported by structure or other means - - - - - - - - 3 - 5 4 Scaffolds suspended staging - - - - - - - - 7 7 4 3 Machine platforms - - - - - - - - 3 2 4 1 Catwalks - - - - - - - - 5 8 8 7
Towers, poles - - - - - - - - 22 13 21 15 Telecommunications and cell phone towers - - - - - - - - 8 4 10 9 Utility and telephone poles - - - - - - - - 4 7 4 1 Lamp posts, street lights - - - - - - - - - - - 1 Windmills, wind turbines - - - - - - - - 2 2 - -
Excavations, strip mines, and quarries (except confined space) - - - - - - - - 2 - 1 -Other structures - - - - - - - - 6 13 8 11
Guardrails, road dividers - - - - - - - - - 2 - -Posts, bollards, moorings - - - - - - - - - - - 1 Porches, balconies, decks, patios - - - - - - - - 3 4 5 8 Railroad tracks - - - - - - - - 1 1 - 1
Building systems - - - - - - - - - 2 - -Climate control systems - - - - - - - - - 1 - -Electrical systems - - - - - - - - - 1 - -
Other structural elements - - - - - - - - 163 172 179 177 Entrances and exits - - - - - - - - 7 4 4 4
Doors, except garage and vehicle - - - - - - - - 4 3 - 2 Garage doors - - - - - - - - 3 1 1 2
Fences, fence panels, gates - - - - - - - - 5 5 3 6 Chain-link fences, panels - - - - - - - - - - - 1 Gates - - - - - - - - 4 3 - 4
Windows, openings - - - - - - - - - - - 1 Roofs - - - - - - - - 109 124 132 127
See footnotes at end of table. 193
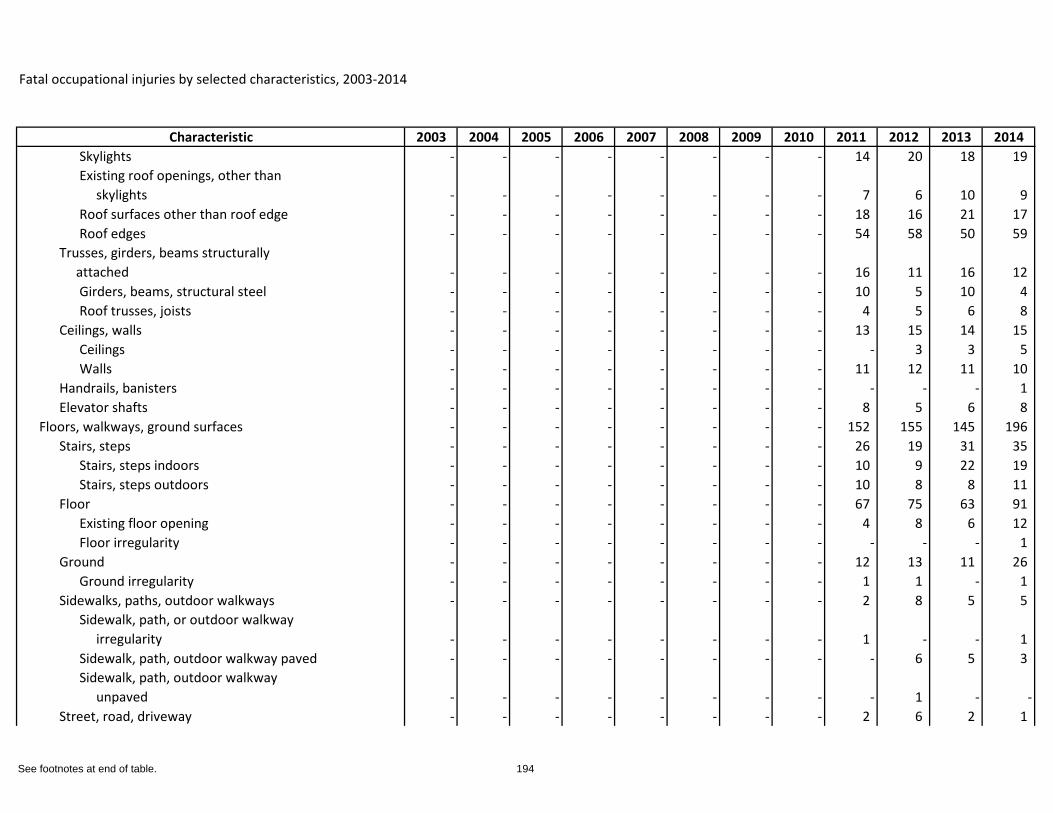
Fatal occupational injuries by selected characteristics, 2003-2014
Characteristic 2003 2004 2005 2006 2007 2008 2009 2010 2011 2012 2013 2014Skylights - - - - - - - - 14 20 18 19 Existing roof openings, other than skylights - - - - - - - - 7 6 10 9 Roof surfaces other than roof edge - - - - - - - - 18 16 21 17 Roof edges - - - - - - - - 54 58 50 59
Trusses, girders, beams structurally attached - - - - - - - - 16 11 16 12
Girders, beams, structural steel - - - - - - - - 10 5 10 4 Roof trusses, joists - - - - - - - - 4 5 6 8
Ceilings, walls - - - - - - - - 13 15 14 15 Ceilings - - - - - - - - - 3 3 5 Walls - - - - - - - - 11 12 11 10
Handrails, banisters - - - - - - - - - - - 1 Elevator shafts - - - - - - - - 8 5 6 8
Floors, walkways, ground surfaces - - - - - - - - 152 155 145 196 Stairs, steps - - - - - - - - 26 19 31 35
Stairs, steps indoors - - - - - - - - 10 9 22 19 Stairs, steps outdoors - - - - - - - - 10 8 8 11
Floor - - - - - - - - 67 75 63 91 Existing floor opening - - - - - - - - 4 8 6 12 Floor irregularity - - - - - - - - - - - 1
Ground - - - - - - - - 12 13 11 26 Ground irregularity - - - - - - - - 1 1 - 1
Sidewalks, paths, outdoor walkways - - - - - - - - 2 8 5 5 Sidewalk, path, or outdoor walkway irregularity - - - - - - - - 1 - - 1 Sidewalk, path, outdoor walkway paved - - - - - - - - - 6 5 3 Sidewalk, path, outdoor walkway unpaved - - - - - - - - - 1 - -
Street, road, driveway - - - - - - - - 2 6 2 1
See footnotes at end of table. 194
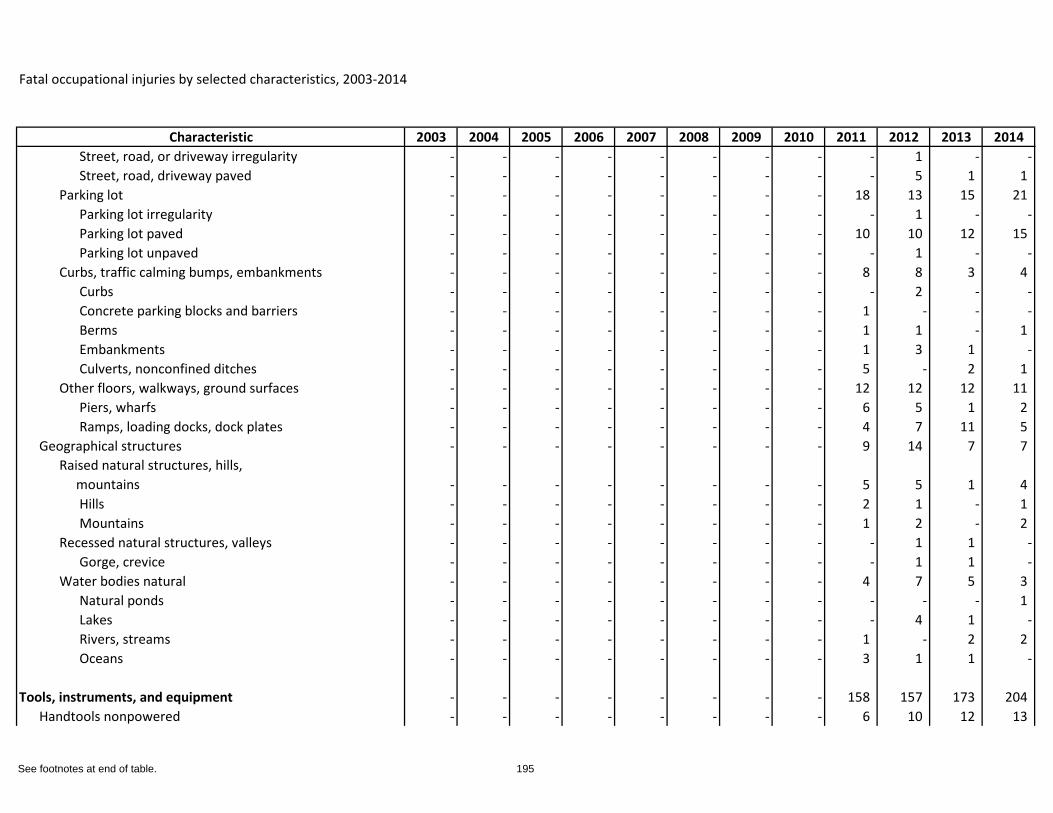
Fatal occupational injuries by selected characteristics, 2003-2014
Characteristic 2003 2004 2005 2006 2007 2008 2009 2010 2011 2012 2013 2014Street, road, or driveway irregularity - - - - - - - - - 1 - -Street, road, driveway paved - - - - - - - - - 5 1 1
Parking lot - - - - - - - - 18 13 15 21 Parking lot irregularity - - - - - - - - - 1 - -Parking lot paved - - - - - - - - 10 10 12 15 Parking lot unpaved - - - - - - - - - 1 - -
Curbs, traffic calming bumps, embankments - - - - - - - - 8 8 3 4 Curbs - - - - - - - - - 2 - -Concrete parking blocks and barriers - - - - - - - - 1 - - -Berms - - - - - - - - 1 1 - 1 Embankments - - - - - - - - 1 3 1 -Culverts, nonconfined ditches - - - - - - - - 5 - 2 1
Other floors, walkways, ground surfaces - - - - - - - - 12 12 12 11 Piers, wharfs - - - - - - - - 6 5 1 2 Ramps, loading docks, dock plates - - - - - - - - 4 7 11 5
Geographical structures - - - - - - - - 9 14 7 7 Raised natural structures, hills, mountains - - - - - - - - 5 5 1 4
Hills - - - - - - - - 2 1 - 1 Mountains - - - - - - - - 1 2 - 2
Recessed natural structures, valleys - - - - - - - - - 1 1 -Gorge, crevice - - - - - - - - - 1 1 -
Water bodies natural - - - - - - - - 4 7 5 3 Natural ponds - - - - - - - - - - - 1 Lakes - - - - - - - - - 4 1 -Rivers, streams - - - - - - - - 1 - 2 2 Oceans - - - - - - - - 3 1 1 -
Tools, instruments, and equipment - - - - - - - - 158 157 173 204 Handtools nonpowered - - - - - - - - 6 10 12 13
See footnotes at end of table. 195
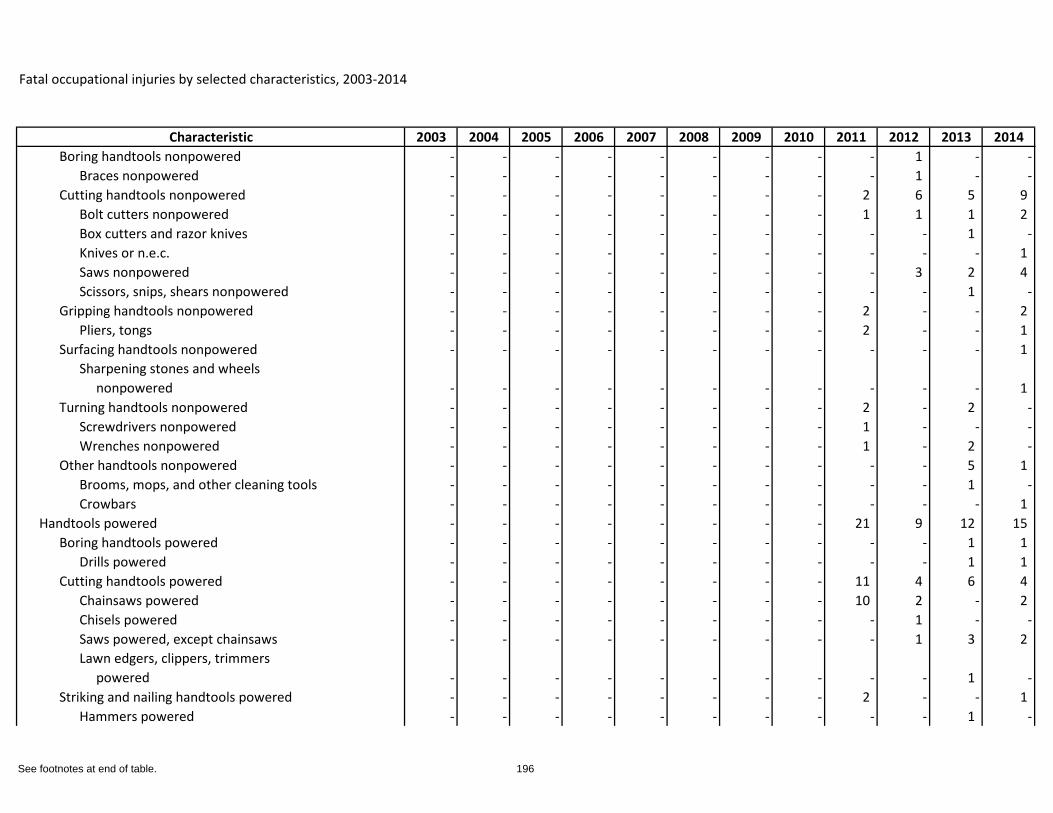
Fatal occupational injuries by selected characteristics, 2003-2014
Characteristic 2003 2004 2005 2006 2007 2008 2009 2010 2011 2012 2013 2014Boring handtools nonpowered - - - - - - - - - 1 - -
Braces nonpowered - - - - - - - - - 1 - -Cutting handtools nonpowered - - - - - - - - 2 6 5 9
Bolt cutters nonpowered - - - - - - - - 1 1 1 2 Box cutters and razor knives - - - - - - - - - - 1 -Knives or n.e.c. - - - - - - - - - - - 1 Saws nonpowered - - - - - - - - - 3 2 4 Scissors, snips, shears nonpowered - - - - - - - - - - 1 -
Gripping handtools nonpowered - - - - - - - - 2 - - 2 Pliers, tongs - - - - - - - - 2 - - 1
Surfacing handtools nonpowered - - - - - - - - - - - 1 Sharpening stones and wheels nonpowered - - - - - - - - - - - 1
Turning handtools nonpowered - - - - - - - - 2 - 2 -Screwdrivers nonpowered - - - - - - - - 1 - - -Wrenches nonpowered - - - - - - - - 1 - 2 -
Other handtools nonpowered - - - - - - - - - - 5 1 Brooms, mops, and other cleaning tools - - - - - - - - - - 1 -Crowbars - - - - - - - - - - - 1
Handtools powered - - - - - - - - 21 9 12 15 Boring handtools powered - - - - - - - - - - 1 1
Drills powered - - - - - - - - - - 1 1 Cutting handtools powered - - - - - - - - 11 4 6 4
Chainsaws powered - - - - - - - - 10 2 - 2 Chisels powered - - - - - - - - - 1 - -Saws powered, except chainsaws - - - - - - - - - 1 3 2 Lawn edgers, clippers, trimmers powered - - - - - - - - - - 1 -
Striking and nailing handtools powered - - - - - - - - 2 - - 1 Hammers powered - - - - - - - - - - 1 -
See footnotes at end of table. 196
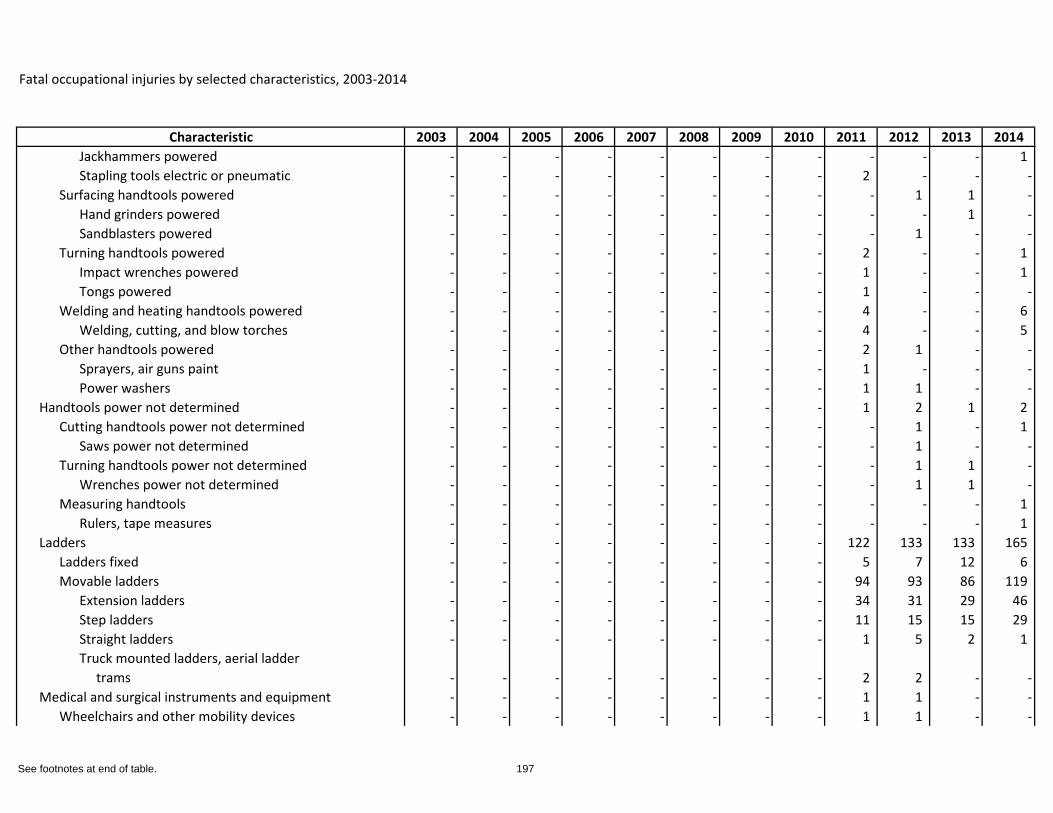
Fatal occupational injuries by selected characteristics, 2003-2014
Characteristic 2003 2004 2005 2006 2007 2008 2009 2010 2011 2012 2013 2014Jackhammers powered - - - - - - - - - - - 1 Stapling tools electric or pneumatic - - - - - - - - 2 - - -
Surfacing handtools powered - - - - - - - - - 1 1 -Hand grinders powered - - - - - - - - - - 1 -Sandblasters powered - - - - - - - - - 1 - -
Turning handtools powered - - - - - - - - 2 - - 1 Impact wrenches powered - - - - - - - - 1 - - 1 Tongs powered - - - - - - - - 1 - - -
Welding and heating handtools powered - - - - - - - - 4 - - 6 Welding, cutting, and blow torches - - - - - - - - 4 - - 5
Other handtools powered - - - - - - - - 2 1 - -Sprayers, air guns paint - - - - - - - - 1 - - -Power washers - - - - - - - - 1 1 - -
Handtools power not determined - - - - - - - - 1 2 1 2 Cutting handtools power not determined - - - - - - - - - 1 - 1
Saws power not determined - - - - - - - - - 1 - -Turning handtools power not determined - - - - - - - - - 1 1 -
Wrenches power not determined - - - - - - - - - 1 1 -Measuring handtools - - - - - - - - - - - 1
Rulers, tape measures - - - - - - - - - - - 1 Ladders - - - - - - - - 122 133 133 165
Ladders fixed - - - - - - - - 5 7 12 6 Movable ladders - - - - - - - - 94 93 86 119
Extension ladders - - - - - - - - 34 31 29 46 Step ladders - - - - - - - - 11 15 15 29 Straight ladders - - - - - - - - 1 5 2 1 Truck mounted ladders, aerial ladder trams - - - - - - - - 2 2 - -
Medical and surgical instruments and equipment - - - - - - - - 1 1 - -Wheelchairs and other mobility devices - - - - - - - - 1 1 - -
See footnotes at end of table. 197
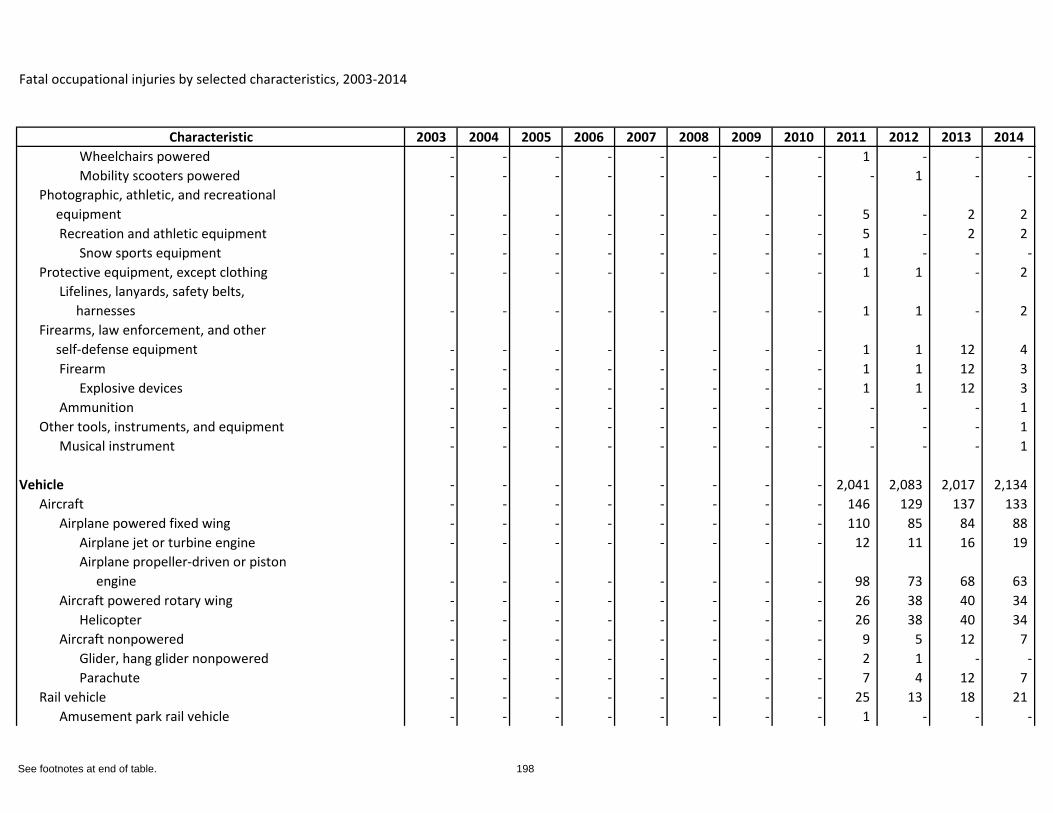
Fatal occupational injuries by selected characteristics, 2003-2014
Characteristic 2003 2004 2005 2006 2007 2008 2009 2010 2011 2012 2013 2014Wheelchairs powered - - - - - - - - 1 - - -Mobility scooters powered - - - - - - - - - 1 - -
Photographic, athletic, and recreational equipment - - - - - - - - 5 - 2 2
Recreation and athletic equipment - - - - - - - - 5 - 2 2 Snow sports equipment - - - - - - - - 1 - - -
Protective equipment, except clothing - - - - - - - - 1 1 - 2 Lifelines, lanyards, safety belts, harnesses - - - - - - - - 1 1 - 2
Firearms, law enforcement, and other self-defense equipment - - - - - - - - 1 1 12 4
Firearm - - - - - - - - 1 1 12 3 Explosive devices - - - - - - - - 1 1 12 3
Ammunition - - - - - - - - - - - 1 Other tools, instruments, and equipment - - - - - - - - - - - 1
Musical instrument - - - - - - - - - - - 1
Vehicle - - - - - - - - 2,041 2,083 2,017 2,134 Aircraft - - - - - - - - 146 129 137 133
Airplane powered fixed wing - - - - - - - - 110 85 84 88 Airplane jet or turbine engine - - - - - - - - 12 11 16 19 Airplane propeller-driven or piston engine - - - - - - - - 98 73 68 63
Aircraft powered rotary wing - - - - - - - - 26 38 40 34 Helicopter - - - - - - - - 26 38 40 34
Aircraft nonpowered - - - - - - - - 9 5 12 7 Glider, hang glider nonpowered - - - - - - - - 2 1 - -Parachute - - - - - - - - 7 4 12 7
Rail vehicle - - - - - - - - 25 13 18 21 Amusement park rail vehicle - - - - - - - - 1 - - -
See footnotes at end of table. 198
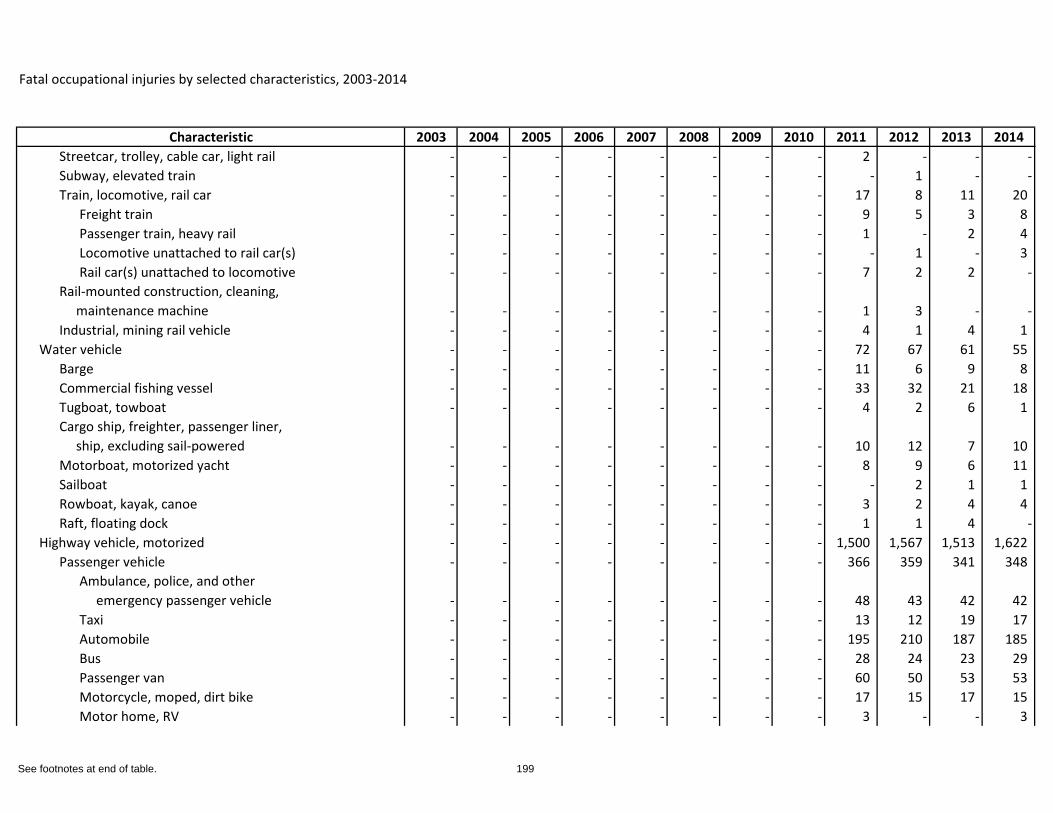
Fatal occupational injuries by selected characteristics, 2003-2014
Characteristic 2003 2004 2005 2006 2007 2008 2009 2010 2011 2012 2013 2014Streetcar, trolley, cable car, light rail - - - - - - - - 2 - - -Subway, elevated train - - - - - - - - - 1 - -Train, locomotive, rail car - - - - - - - - 17 8 11 20
Freight train - - - - - - - - 9 5 3 8 Passenger train, heavy rail - - - - - - - - 1 - 2 4 Locomotive unattached to rail car(s) - - - - - - - - - 1 - 3 Rail car(s) unattached to locomotive - - - - - - - - 7 2 2 -
Rail-mounted construction, cleaning, maintenance machine - - - - - - - - 1 3 - -Industrial, mining rail vehicle - - - - - - - - 4 1 4 1
Water vehicle - - - - - - - - 72 67 61 55 Barge - - - - - - - - 11 6 9 8 Commercial fishing vessel - - - - - - - - 33 32 21 18 Tugboat, towboat - - - - - - - - 4 2 6 1 Cargo ship, freighter, passenger liner, ship, excluding sail-powered - - - - - - - - 10 12 7 10 Motorboat, motorized yacht - - - - - - - - 8 9 6 11 Sailboat - - - - - - - - - 2 1 1 Rowboat, kayak, canoe - - - - - - - - 3 2 4 4 Raft, floating dock - - - - - - - - 1 1 4 -
Highway vehicle, motorized - - - - - - - - 1,500 1,567 1,513 1,622 Passenger vehicle - - - - - - - - 366 359 341 348
Ambulance, police, and other emergency passenger vehicle - - - - - - - - 48 43 42 42 Taxi - - - - - - - - 13 12 19 17 Automobile - - - - - - - - 195 210 187 185 Bus - - - - - - - - 28 24 23 29 Passenger van - - - - - - - - 60 50 53 53 Motorcycle, moped, dirt bike - - - - - - - - 17 15 17 15 Motor home, RV - - - - - - - - 3 - - 3
See footnotes at end of table. 199
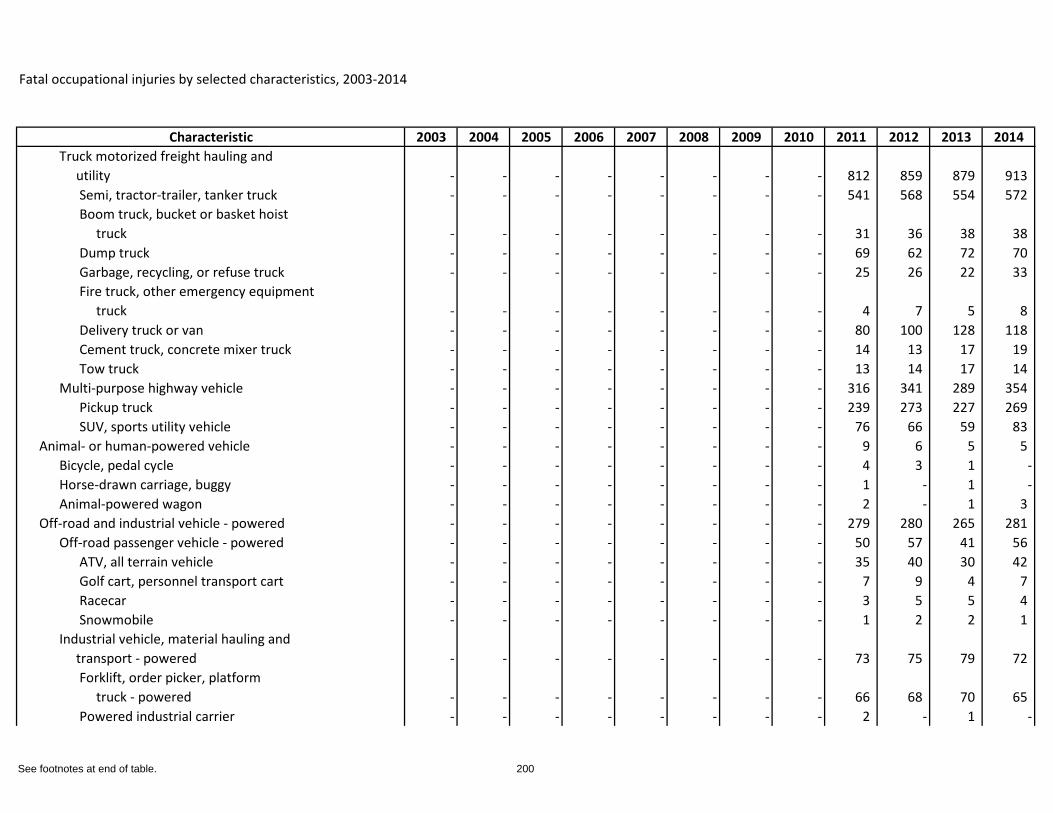
Fatal occupational injuries by selected characteristics, 2003-2014
Characteristic 2003 2004 2005 2006 2007 2008 2009 2010 2011 2012 2013 2014Truck motorized freight hauling and utility - - - - - - - - 812 859 879 913
Semi, tractor-trailer, tanker truck - - - - - - - - 541 568 554 572 Boom truck, bucket or basket hoist truck - - - - - - - - 31 36 38 38 Dump truck - - - - - - - - 69 62 72 70 Garbage, recycling, or refuse truck - - - - - - - - 25 26 22 33 Fire truck, other emergency equipment truck - - - - - - - - 4 7 5 8 Delivery truck or van - - - - - - - - 80 100 128 118 Cement truck, concrete mixer truck - - - - - - - - 14 13 17 19 Tow truck - - - - - - - - 13 14 17 14
Multi-purpose highway vehicle - - - - - - - - 316 341 289 354 Pickup truck - - - - - - - - 239 273 227 269 SUV, sports utility vehicle - - - - - - - - 76 66 59 83
Animal- or human-powered vehicle - - - - - - - - 9 6 5 5 Bicycle, pedal cycle - - - - - - - - 4 3 1 -Horse-drawn carriage, buggy - - - - - - - - 1 - 1 -Animal-powered wagon - - - - - - - - 2 - 1 3
Off-road and industrial vehicle - powered - - - - - - - - 279 280 265 281 Off-road passenger vehicle - powered - - - - - - - - 50 57 41 56
ATV, all terrain vehicle - - - - - - - - 35 40 30 42 Golf cart, personnel transport cart - - - - - - - - 7 9 4 7 Racecar - - - - - - - - 3 5 5 4 Snowmobile - - - - - - - - 1 2 2 1
Industrial vehicle, material hauling and transport - powered - - - - - - - - 73 75 79 72
Forklift, order picker, platform truck - powered - - - - - - - - 66 68 70 65 Powered industrial carrier - - - - - - - - 2 - 1 -
See footnotes at end of table. 200
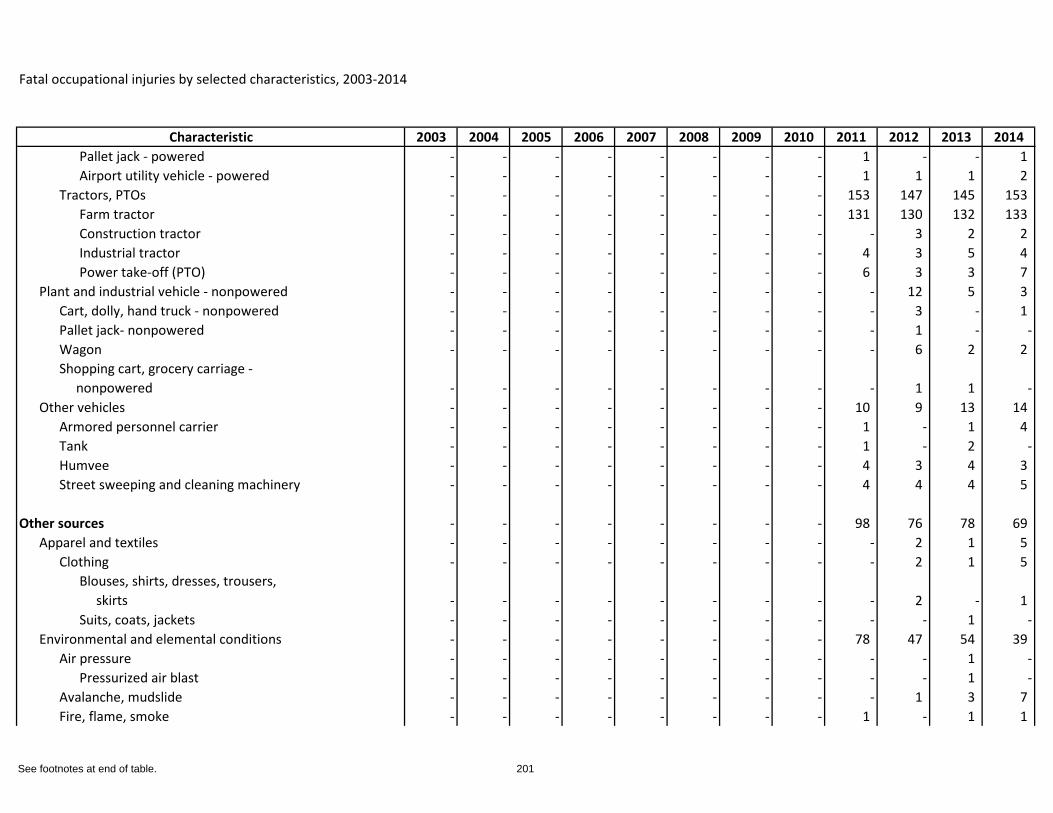
Fatal occupational injuries by selected characteristics, 2003-2014
Characteristic 2003 2004 2005 2006 2007 2008 2009 2010 2011 2012 2013 2014Pallet jack - powered - - - - - - - - 1 - - 1 Airport utility vehicle - powered - - - - - - - - 1 1 1 2
Tractors, PTOs - - - - - - - - 153 147 145 153 Farm tractor - - - - - - - - 131 130 132 133 Construction tractor - - - - - - - - - 3 2 2 Industrial tractor - - - - - - - - 4 3 5 4 Power take-off (PTO) - - - - - - - - 6 3 3 7
Plant and industrial vehicle - nonpowered - - - - - - - - - 12 5 3 Cart, dolly, hand truck - nonpowered - - - - - - - - - 3 - 1 Pallet jack- nonpowered - - - - - - - - - 1 - -Wagon - - - - - - - - - 6 2 2 Shopping cart, grocery carriage - nonpowered - - - - - - - - - 1 1 -
Other vehicles - - - - - - - - 10 9 13 14 Armored personnel carrier - - - - - - - - 1 - 1 4 Tank - - - - - - - - 1 - 2 -Humvee - - - - - - - - 4 3 4 3 Street sweeping and cleaning machinery - - - - - - - - 4 4 4 5
Other sources - - - - - - - - 98 76 78 69 Apparel and textiles - - - - - - - - - 2 1 5
Clothing - - - - - - - - - 2 1 5 Blouses, shirts, dresses, trousers, skirts - - - - - - - - - 2 - 1 Suits, coats, jackets - - - - - - - - - - 1 -
Environmental and elemental conditions - - - - - - - - 78 47 54 39 Air pressure - - - - - - - - - - 1 -
Pressurized air blast - - - - - - - - - - 1 -Avalanche, mudslide - - - - - - - - - 1 3 7 Fire, flame, smoke - - - - - - - - 1 - 1 1
See footnotes at end of table. 201
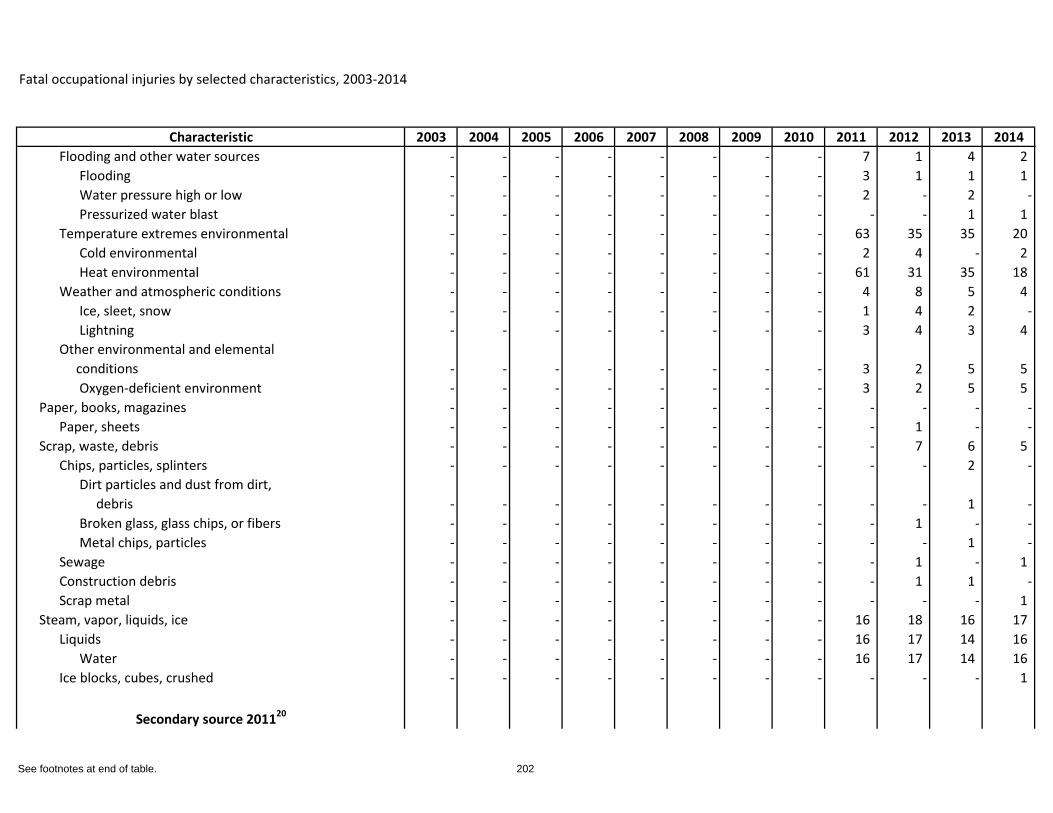
Fatal occupational injuries by selected characteristics, 2003-2014
Characteristic 2003 2004 2005 2006 2007 2008 2009 2010 2011 2012 2013 2014Flooding and other water sources - - - - - - - - 7 1 4 2
Flooding - - - - - - - - 3 1 1 1 Water pressure high or low - - - - - - - - 2 - 2 -Pressurized water blast - - - - - - - - - - 1 1
Temperature extremes environmental - - - - - - - - 63 35 35 20 Cold environmental - - - - - - - - 2 4 - 2 Heat environmental - - - - - - - - 61 31 35 18
Weather and atmospheric conditions - - - - - - - - 4 8 5 4 Ice, sleet, snow - - - - - - - - 1 4 2 -Lightning - - - - - - - - 3 4 3 4
Other environmental and elemental conditions - - - - - - - - 3 2 5 5
Oxygen-deficient environment - - - - - - - - 3 2 5 5 Paper, books, magazines - - - - - - - - - - - -
Paper, sheets - - - - - - - - - 1 - -Scrap, waste, debris - - - - - - - - - 7 6 5
Chips, particles, splinters - - - - - - - - - - 2 -Dirt particles and dust from dirt, debris - - - - - - - - - - 1 -Broken glass, glass chips, or fibers - - - - - - - - - 1 - -Metal chips, particles - - - - - - - - - - 1 -
Sewage - - - - - - - - - 1 - 1 Construction debris - - - - - - - - - 1 1 -Scrap metal - - - - - - - - - - - 1
Steam, vapor, liquids, ice - - - - - - - - 16 18 16 17 Liquids - - - - - - - - 16 17 14 16
Water - - - - - - - - 16 17 14 16 Ice blocks, cubes, crushed - - - - - - - - - - - 1
Secondary source 201120
See footnotes at end of table. 202
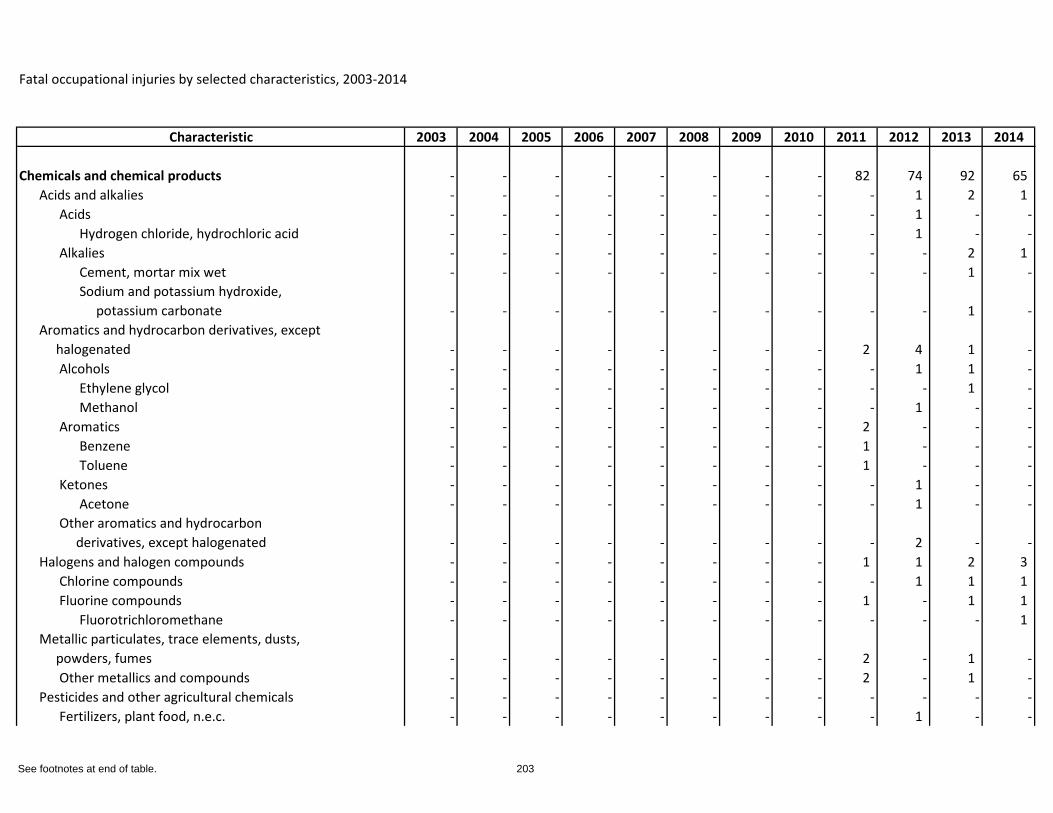
Fatal occupational injuries by selected characteristics, 2003-2014
Characteristic 2003 2004 2005 2006 2007 2008 2009 2010 2011 2012 2013 2014
Chemicals and chemical products - - - - - - - - 82 74 92 65 Acids and alkalies - - - - - - - - - 1 2 1
Acids - - - - - - - - - 1 - -Hydrogen chloride, hydrochloric acid - - - - - - - - - 1 - -
Alkalies - - - - - - - - - - 2 1 Cement, mortar mix wet - - - - - - - - - - 1 -Sodium and potassium hydroxide, potassium carbonate - - - - - - - - - - 1 -
Aromatics and hydrocarbon derivatives, except halogenated - - - - - - - - 2 4 1 -
Alcohols - - - - - - - - - 1 1 -Ethylene glycol - - - - - - - - - - 1 -Methanol - - - - - - - - - 1 - -
Aromatics - - - - - - - - 2 - - -Benzene - - - - - - - - 1 - - -Toluene - - - - - - - - 1 - - -
Ketones - - - - - - - - - 1 - -Acetone - - - - - - - - - 1 - -
Other aromatics and hydrocarbon derivatives, except halogenated - - - - - - - - - 2 - -
Halogens and halogen compounds - - - - - - - - 1 1 2 3 Chlorine compounds - - - - - - - - - 1 1 1 Fluorine compounds - - - - - - - - 1 - 1 1
Fluorotrichloromethane - - - - - - - - - - - 1 Metallic particulates, trace elements, dusts, powders, fumes - - - - - - - - 2 - 1 -
Other metallics and compounds - - - - - - - - 2 - 1 -Pesticides and other agricultural chemicals - - - - - - - - - - - -
Fertilizers, plant food, n.e.c. - - - - - - - - - 1 - -
See footnotes at end of table. 203
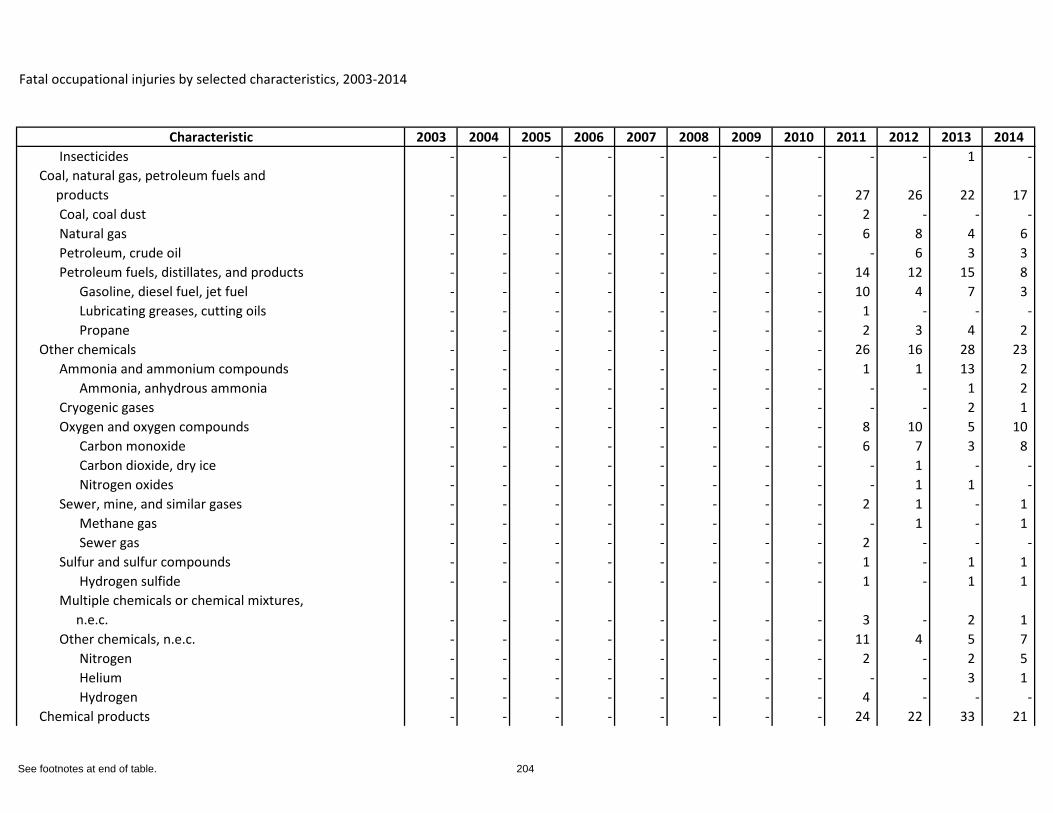
Fatal occupational injuries by selected characteristics, 2003-2014
Characteristic 2003 2004 2005 2006 2007 2008 2009 2010 2011 2012 2013 2014Insecticides - - - - - - - - - - 1 -
Coal, natural gas, petroleum fuels and products - - - - - - - - 27 26 22 17
Coal, coal dust - - - - - - - - 2 - - -Natural gas - - - - - - - - 6 8 4 6 Petroleum, crude oil - - - - - - - - - 6 3 3 Petroleum fuels, distillates, and products - - - - - - - - 14 12 15 8
Gasoline, diesel fuel, jet fuel - - - - - - - - 10 4 7 3 Lubricating greases, cutting oils - - - - - - - - 1 - - -Propane - - - - - - - - 2 3 4 2
Other chemicals - - - - - - - - 26 16 28 23 Ammonia and ammonium compounds - - - - - - - - 1 1 13 2
Ammonia, anhydrous ammonia - - - - - - - - - - 1 2 Cryogenic gases - - - - - - - - - - 2 1 Oxygen and oxygen compounds - - - - - - - - 8 10 5 10
Carbon monoxide - - - - - - - - 6 7 3 8 Carbon dioxide, dry ice - - - - - - - - - 1 - -Nitrogen oxides - - - - - - - - - 1 1 -
Sewer, mine, and similar gases - - - - - - - - 2 1 - 1 Methane gas - - - - - - - - - 1 - 1 Sewer gas - - - - - - - - 2 - - -
Sulfur and sulfur compounds - - - - - - - - 1 - 1 1 Hydrogen sulfide - - - - - - - - 1 - 1 1
Multiple chemicals or chemical mixtures, n.e.c. - - - - - - - - 3 - 2 1 Other chemicals, n.e.c. - - - - - - - - 11 4 5 7
Nitrogen - - - - - - - - 2 - 2 5 Helium - - - - - - - - - - 3 1 Hydrogen - - - - - - - - 4 - - -
Chemical products - - - - - - - - 24 22 33 21
See footnotes at end of table. 204
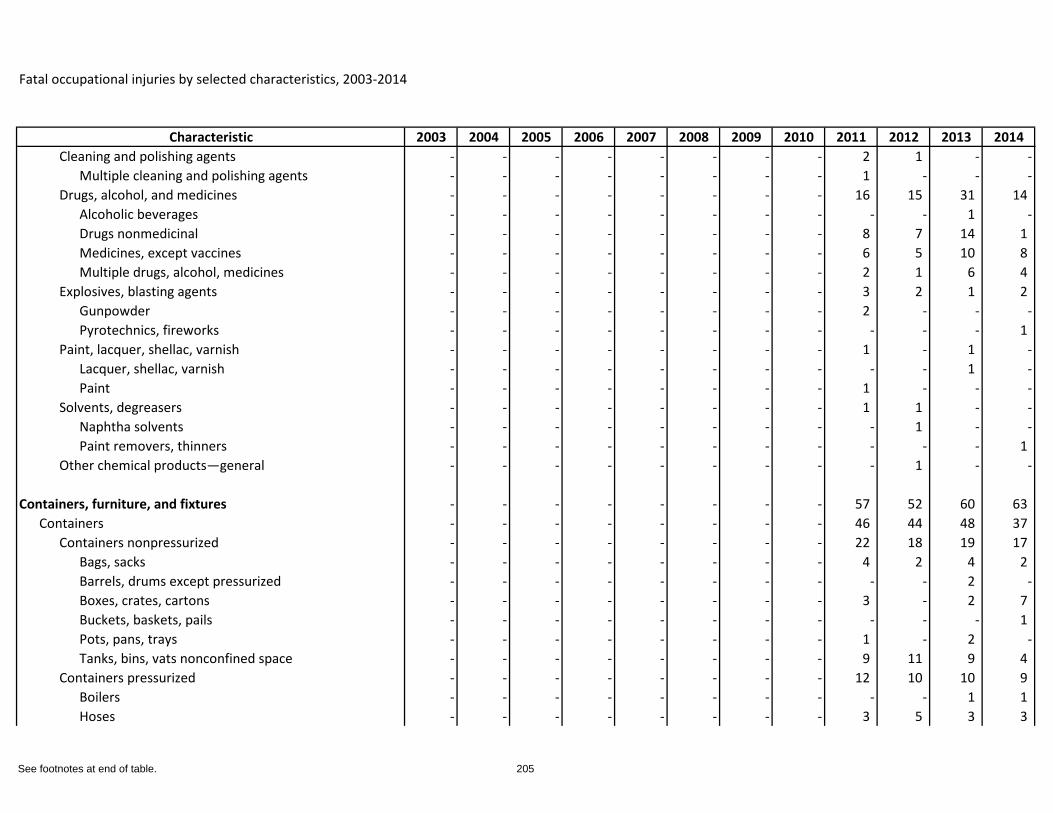
Fatal occupational injuries by selected characteristics, 2003-2014
Characteristic 2003 2004 2005 2006 2007 2008 2009 2010 2011 2012 2013 2014Cleaning and polishing agents - - - - - - - - 2 1 - -
Multiple cleaning and polishing agents - - - - - - - - 1 - - -Drugs, alcohol, and medicines - - - - - - - - 16 15 31 14
Alcoholic beverages - - - - - - - - - - 1 -Drugs nonmedicinal - - - - - - - - 8 7 14 1 Medicines, except vaccines - - - - - - - - 6 5 10 8 Multiple drugs, alcohol, medicines - - - - - - - - 2 1 6 4
Explosives, blasting agents - - - - - - - - 3 2 1 2 Gunpowder - - - - - - - - 2 - - -Pyrotechnics, fireworks - - - - - - - - - - - 1
Paint, lacquer, shellac, varnish - - - - - - - - 1 - 1 -Lacquer, shellac, varnish - - - - - - - - - - 1 -Paint - - - - - - - - 1 - - -
Solvents, degreasers - - - - - - - - 1 1 - -Naphtha solvents - - - - - - - - - 1 - -Paint removers, thinners - - - - - - - - - - - 1
Other chemical products—general - - - - - - - - - 1 - -
Containers, furniture, and fixtures - - - - - - - - 57 52 60 63 Containers - - - - - - - - 46 44 48 37
Containers nonpressurized - - - - - - - - 22 18 19 17 Bags, sacks - - - - - - - - 4 2 4 2 Barrels, drums except pressurized - - - - - - - - - - 2 -Boxes, crates, cartons - - - - - - - - 3 - 2 7 Buckets, baskets, pails - - - - - - - - - - - 1 Pots, pans, trays - - - - - - - - 1 - 2 -Tanks, bins, vats nonconfined space - - - - - - - - 9 11 9 4
Containers pressurized - - - - - - - - 12 10 10 9 Boilers - - - - - - - - - - 1 1 Hoses - - - - - - - - 3 5 3 3
See footnotes at end of table. 205
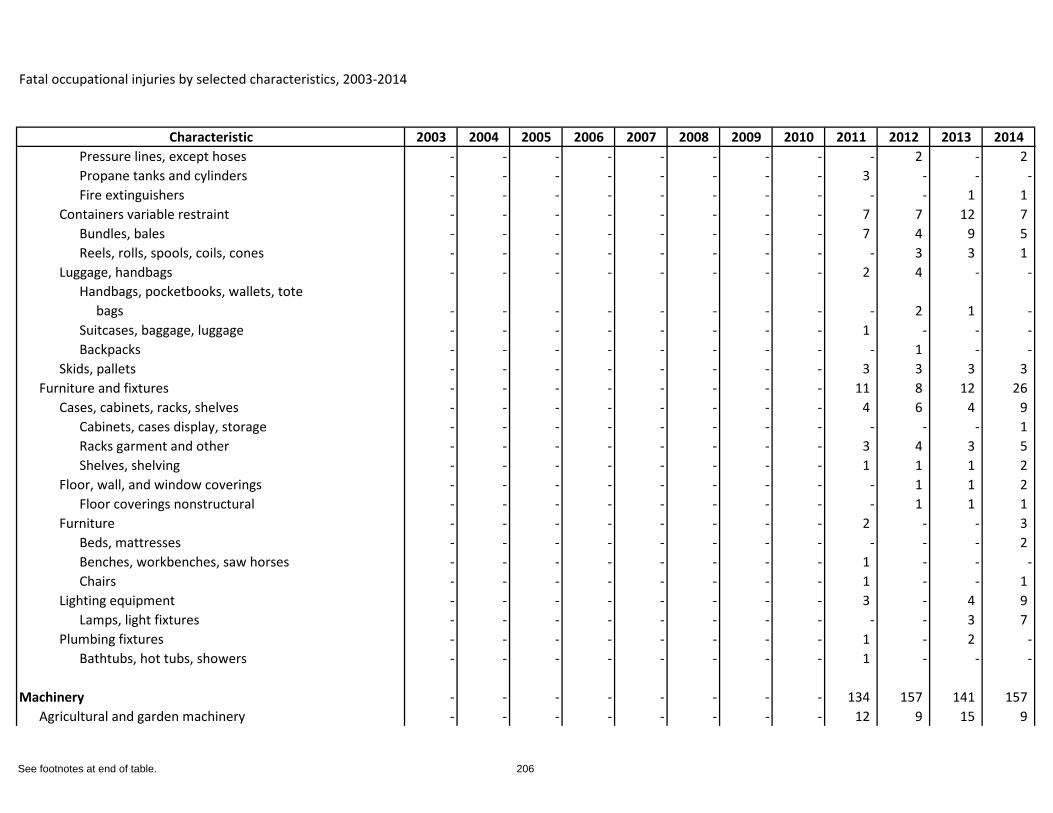
Fatal occupational injuries by selected characteristics, 2003-2014
Characteristic 2003 2004 2005 2006 2007 2008 2009 2010 2011 2012 2013 2014Pressure lines, except hoses - - - - - - - - - 2 - 2 Propane tanks and cylinders - - - - - - - - 3 - - -Fire extinguishers - - - - - - - - - - 1 1
Containers variable restraint - - - - - - - - 7 7 12 7 Bundles, bales - - - - - - - - 7 4 9 5 Reels, rolls, spools, coils, cones - - - - - - - - - 3 3 1
Luggage, handbags - - - - - - - - 2 4 - -Handbags, pocketbooks, wallets, tote bags - - - - - - - - - 2 1 -Suitcases, baggage, luggage - - - - - - - - 1 - - -Backpacks - - - - - - - - - 1 - -
Skids, pallets - - - - - - - - 3 3 3 3 Furniture and fixtures - - - - - - - - 11 8 12 26
Cases, cabinets, racks, shelves - - - - - - - - 4 6 4 9 Cabinets, cases display, storage - - - - - - - - - - - 1 Racks garment and other - - - - - - - - 3 4 3 5 Shelves, shelving - - - - - - - - 1 1 1 2
Floor, wall, and window coverings - - - - - - - - - 1 1 2 Floor coverings nonstructural - - - - - - - - - 1 1 1
Furniture - - - - - - - - 2 - - 3 Beds, mattresses - - - - - - - - - - - 2 Benches, workbenches, saw horses - - - - - - - - 1 - - -Chairs - - - - - - - - 1 - - 1
Lighting equipment - - - - - - - - 3 - 4 9 Lamps, light fixtures - - - - - - - - - - 3 7
Plumbing fixtures - - - - - - - - 1 - 2 -Bathtubs, hot tubs, showers - - - - - - - - 1 - - -
Machinery - - - - - - - - 134 157 141 157 Agricultural and garden machinery - - - - - - - - 12 9 15 9
See footnotes at end of table. 206
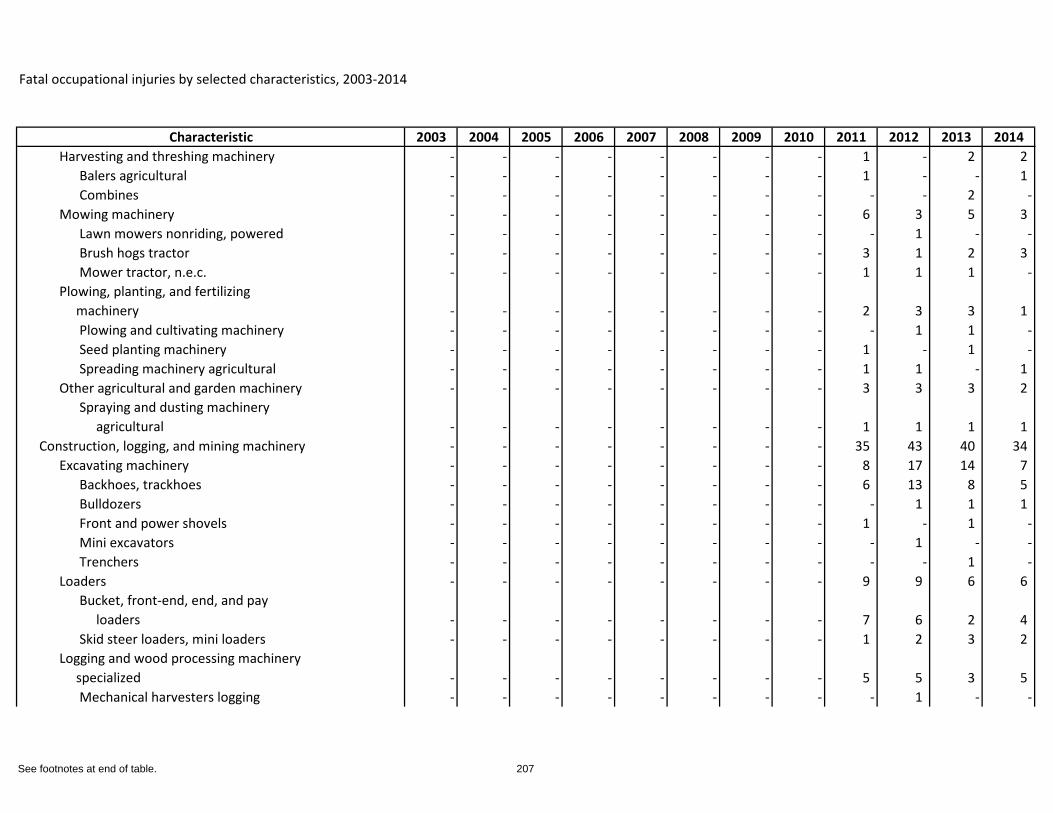
Fatal occupational injuries by selected characteristics, 2003-2014
Characteristic 2003 2004 2005 2006 2007 2008 2009 2010 2011 2012 2013 2014Harvesting and threshing machinery - - - - - - - - 1 - 2 2
Balers agricultural - - - - - - - - 1 - - 1 Combines - - - - - - - - - - 2 -
Mowing machinery - - - - - - - - 6 3 5 3 Lawn mowers nonriding, powered - - - - - - - - - 1 - -Brush hogs tractor - - - - - - - - 3 1 2 3 Mower tractor, n.e.c. - - - - - - - - 1 1 1 -
Plowing, planting, and fertilizing machinery - - - - - - - - 2 3 3 1
Plowing and cultivating machinery - - - - - - - - - 1 1 -Seed planting machinery - - - - - - - - 1 - 1 -Spreading machinery agricultural - - - - - - - - 1 1 - 1
Other agricultural and garden machinery - - - - - - - - 3 3 3 2 Spraying and dusting machinery agricultural - - - - - - - - 1 1 1 1
Construction, logging, and mining machinery - - - - - - - - 35 43 40 34 Excavating machinery - - - - - - - - 8 17 14 7
Backhoes, trackhoes - - - - - - - - 6 13 8 5 Bulldozers - - - - - - - - - 1 1 1 Front and power shovels - - - - - - - - 1 - 1 -Mini excavators - - - - - - - - - 1 - -Trenchers - - - - - - - - - - 1 -
Loaders - - - - - - - - 9 9 6 6 Bucket, front-end, end, and pay loaders - - - - - - - - 7 6 2 4 Skid steer loaders, mini loaders - - - - - - - - 1 2 3 2
Logging and wood processing machinery specialized - - - - - - - - 5 5 3 5
Mechanical harvesters logging - - - - - - - - - 1 - -
See footnotes at end of table. 207
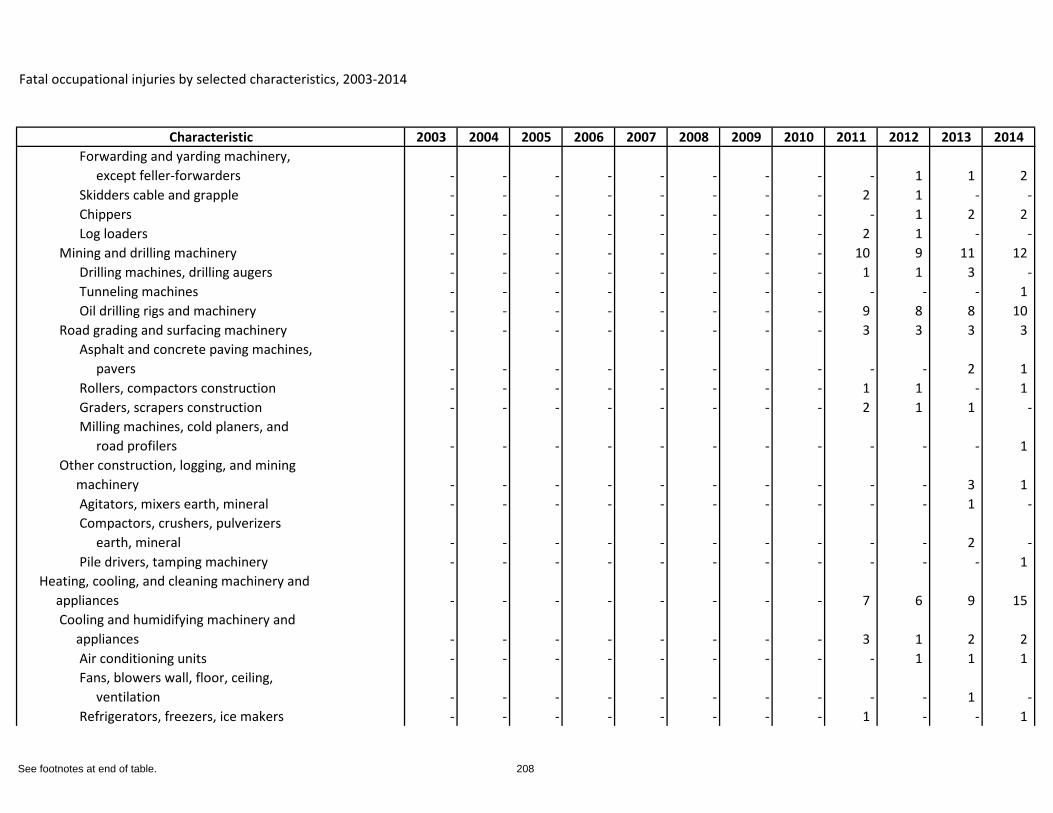
Fatal occupational injuries by selected characteristics, 2003-2014
Characteristic 2003 2004 2005 2006 2007 2008 2009 2010 2011 2012 2013 2014Forwarding and yarding machinery, except feller-forwarders - - - - - - - - - 1 1 2 Skidders cable and grapple - - - - - - - - 2 1 - -Chippers - - - - - - - - - 1 2 2 Log loaders - - - - - - - - 2 1 - -
Mining and drilling machinery - - - - - - - - 10 9 11 12 Drilling machines, drilling augers - - - - - - - - 1 1 3 -Tunneling machines - - - - - - - - - - - 1 Oil drilling rigs and machinery - - - - - - - - 9 8 8 10
Road grading and surfacing machinery - - - - - - - - 3 3 3 3 Asphalt and concrete paving machines, pavers - - - - - - - - - - 2 1 Rollers, compactors construction - - - - - - - - 1 1 - 1 Graders, scrapers construction - - - - - - - - 2 1 1 -Milling machines, cold planers, and road profilers - - - - - - - - - - - 1
Other construction, logging, and mining machinery - - - - - - - - - - 3 1
Agitators, mixers earth, mineral - - - - - - - - - - 1 -Compactors, crushers, pulverizers earth, mineral - - - - - - - - - - 2 -Pile drivers, tamping machinery - - - - - - - - - - - 1
Heating, cooling, and cleaning machinery and appliances - - - - - - - - 7 6 9 15
Cooling and humidifying machinery and appliances - - - - - - - - 3 1 2 2
Air conditioning units - - - - - - - - - 1 1 1 Fans, blowers wall, floor, ceiling, ventilation - - - - - - - - - - 1 -Refrigerators, freezers, ice makers - - - - - - - - 1 - - 1
See footnotes at end of table. 208
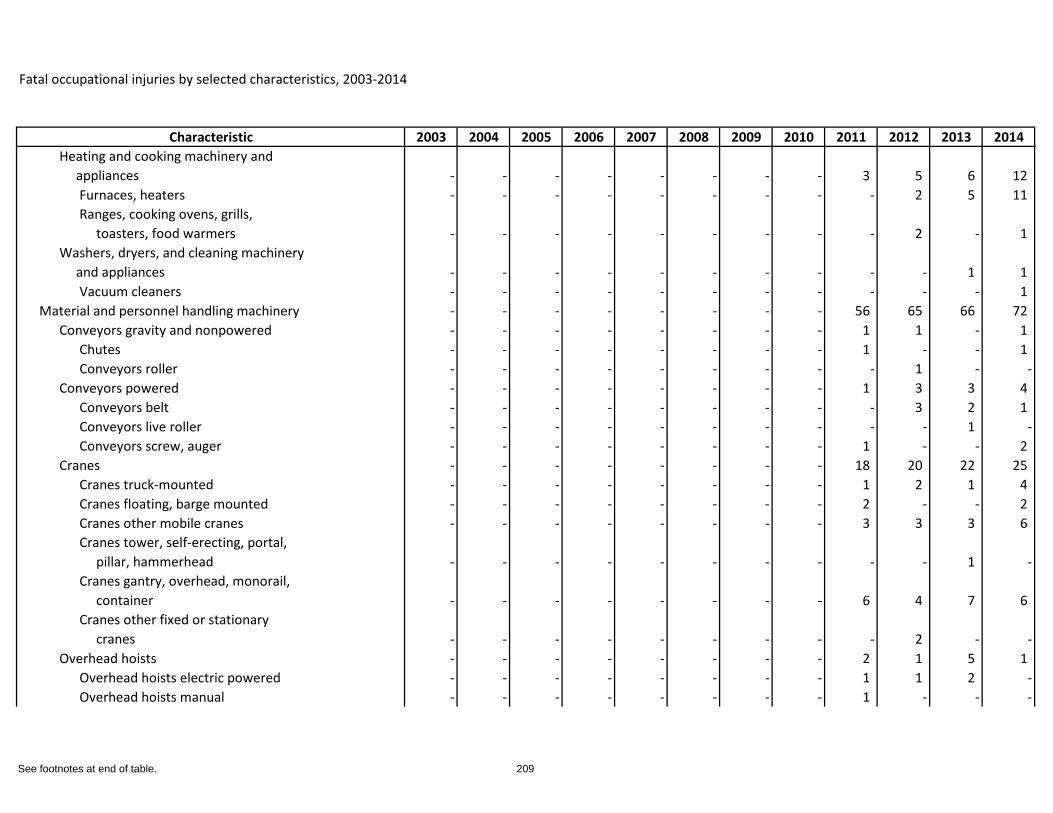
Fatal occupational injuries by selected characteristics, 2003-2014
Characteristic 2003 2004 2005 2006 2007 2008 2009 2010 2011 2012 2013 2014Heating and cooking machinery and appliances - - - - - - - - 3 5 6 12
Furnaces, heaters - - - - - - - - - 2 5 11 Ranges, cooking ovens, grills, toasters, food warmers - - - - - - - - - 2 - 1
Washers, dryers, and cleaning machinery and appliances - - - - - - - - - - 1 1
Vacuum cleaners - - - - - - - - - - - 1 Material and personnel handling machinery - - - - - - - - 56 65 66 72
Conveyors gravity and nonpowered - - - - - - - - 1 1 - 1 Chutes - - - - - - - - 1 - - 1 Conveyors roller - - - - - - - - - 1 - -
Conveyors powered - - - - - - - - 1 3 3 4 Conveyors belt - - - - - - - - - 3 2 1 Conveyors live roller - - - - - - - - - - 1 -Conveyors screw, auger - - - - - - - - 1 - - 2
Cranes - - - - - - - - 18 20 22 25 Cranes truck-mounted - - - - - - - - 1 2 1 4 Cranes floating, barge mounted - - - - - - - - 2 - - 2 Cranes other mobile cranes - - - - - - - - 3 3 3 6 Cranes tower, self-erecting, portal, pillar, hammerhead - - - - - - - - - - 1 -Cranes gantry, overhead, monorail, container - - - - - - - - 6 4 7 6 Cranes other fixed or stationary cranes - - - - - - - - - 2 - -
Overhead hoists - - - - - - - - 2 1 5 1 Overhead hoists electric powered - - - - - - - - 1 1 2 -Overhead hoists manual - - - - - - - - 1 - - -
See footnotes at end of table. 209
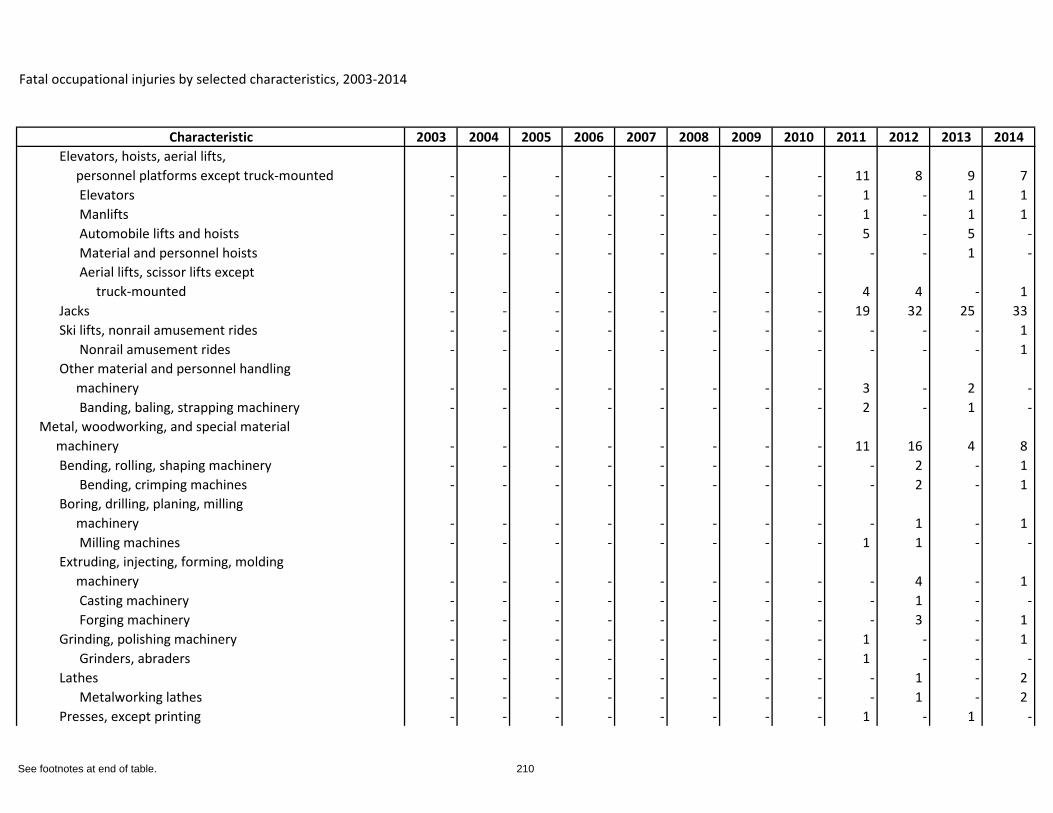
Fatal occupational injuries by selected characteristics, 2003-2014
Characteristic 2003 2004 2005 2006 2007 2008 2009 2010 2011 2012 2013 2014Elevators, hoists, aerial lifts, personnel platforms except truck-mounted - - - - - - - - 11 8 9 7
Elevators - - - - - - - - 1 - 1 1 Manlifts - - - - - - - - 1 - 1 1 Automobile lifts and hoists - - - - - - - - 5 - 5 -Material and personnel hoists - - - - - - - - - - 1 -Aerial lifts, scissor lifts except truck-mounted - - - - - - - - 4 4 - 1
Jacks - - - - - - - - 19 32 25 33 Ski lifts, nonrail amusement rides - - - - - - - - - - - 1
Nonrail amusement rides - - - - - - - - - - - 1 Other material and personnel handling machinery - - - - - - - - 3 - 2 -
Banding, baling, strapping machinery - - - - - - - - 2 - 1 -Metal, woodworking, and special material machinery - - - - - - - - 11 16 4 8
Bending, rolling, shaping machinery - - - - - - - - - 2 - 1 Bending, crimping machines - - - - - - - - - 2 - 1
Boring, drilling, planing, milling machinery - - - - - - - - - 1 - 1
Milling machines - - - - - - - - 1 1 - -Extruding, injecting, forming, molding machinery - - - - - - - - - 4 - 1
Casting machinery - - - - - - - - - 1 - -Forging machinery - - - - - - - - - 3 - 1
Grinding, polishing machinery - - - - - - - - 1 - - 1 Grinders, abraders - - - - - - - - 1 - - -
Lathes - - - - - - - - - 1 - 2 Metalworking lathes - - - - - - - - - 1 - 2
Presses, except printing - - - - - - - - 1 - 1 -
See footnotes at end of table. 210
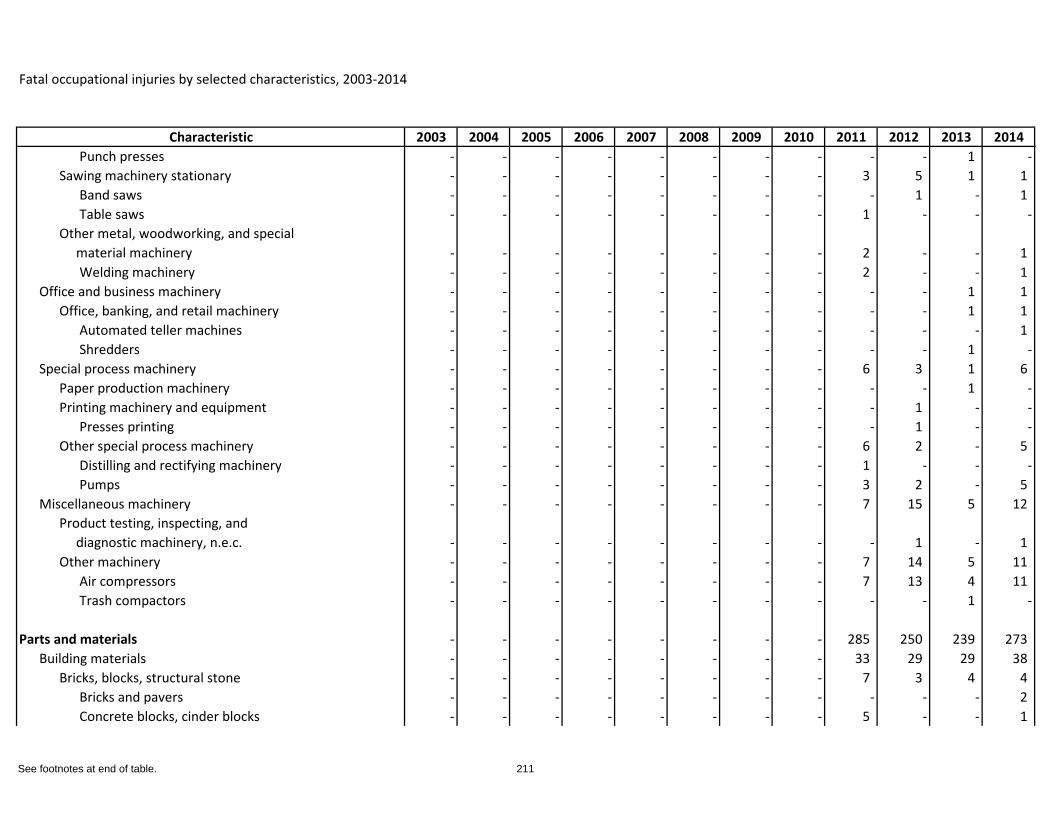
Fatal occupational injuries by selected characteristics, 2003-2014
Characteristic 2003 2004 2005 2006 2007 2008 2009 2010 2011 2012 2013 2014Punch presses - - - - - - - - - - 1 -
Sawing machinery stationary - - - - - - - - 3 5 1 1 Band saws - - - - - - - - - 1 - 1 Table saws - - - - - - - - 1 - - -
Other metal, woodworking, and special material machinery - - - - - - - - 2 - - 1
Welding machinery - - - - - - - - 2 - - 1 Office and business machinery - - - - - - - - - - 1 1
Office, banking, and retail machinery - - - - - - - - - - 1 1 Automated teller machines - - - - - - - - - - - 1 Shredders - - - - - - - - - - 1 -
Special process machinery - - - - - - - - 6 3 1 6 Paper production machinery - - - - - - - - - - 1 -Printing machinery and equipment - - - - - - - - - 1 - -
Presses printing - - - - - - - - - 1 - -Other special process machinery - - - - - - - - 6 2 - 5
Distilling and rectifying machinery - - - - - - - - 1 - - -Pumps - - - - - - - - 3 2 - 5
Miscellaneous machinery - - - - - - - - 7 15 5 12 Product testing, inspecting, and diagnostic machinery, n.e.c. - - - - - - - - - 1 - 1 Other machinery - - - - - - - - 7 14 5 11
Air compressors - - - - - - - - 7 13 4 11 Trash compactors - - - - - - - - - - 1 -
Parts and materials - - - - - - - - 285 250 239 273 Building materials - - - - - - - - 33 29 29 38
Bricks, blocks, structural stone - - - - - - - - 7 3 4 4 Bricks and pavers - - - - - - - - - - - 2 Concrete blocks, cinder blocks - - - - - - - - 5 - - 1
See footnotes at end of table. 211
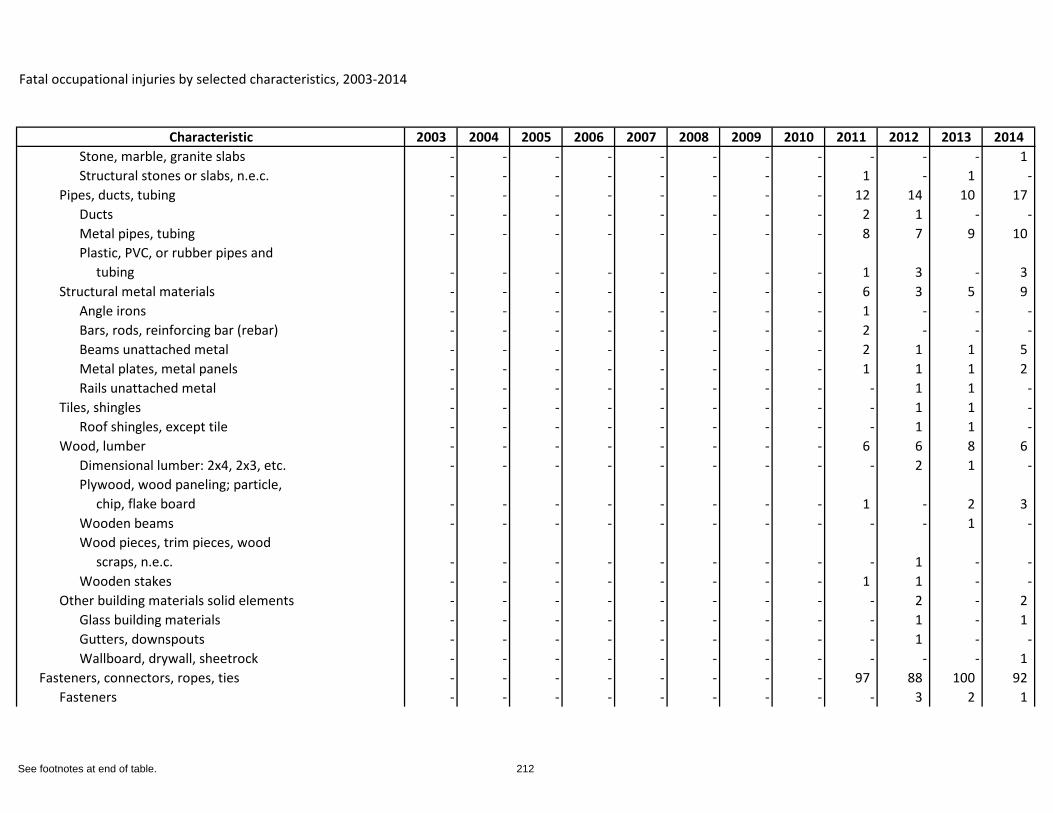
Fatal occupational injuries by selected characteristics, 2003-2014
Characteristic 2003 2004 2005 2006 2007 2008 2009 2010 2011 2012 2013 2014Stone, marble, granite slabs - - - - - - - - - - - 1 Structural stones or slabs, n.e.c. - - - - - - - - 1 - 1 -
Pipes, ducts, tubing - - - - - - - - 12 14 10 17 Ducts - - - - - - - - 2 1 - -Metal pipes, tubing - - - - - - - - 8 7 9 10 Plastic, PVC, or rubber pipes and tubing - - - - - - - - 1 3 - 3
Structural metal materials - - - - - - - - 6 3 5 9 Angle irons - - - - - - - - 1 - - -Bars, rods, reinforcing bar (rebar) - - - - - - - - 2 - - -Beams unattached metal - - - - - - - - 2 1 1 5 Metal plates, metal panels - - - - - - - - 1 1 1 2 Rails unattached metal - - - - - - - - - 1 1 -
Tiles, shingles - - - - - - - - - 1 1 -Roof shingles, except tile - - - - - - - - - 1 1 -
Wood, lumber - - - - - - - - 6 6 8 6 Dimensional lumber: 2x4, 2x3, etc. - - - - - - - - - 2 1 -Plywood, wood paneling; particle, chip, flake board - - - - - - - - 1 - 2 3 Wooden beams - - - - - - - - - - 1 -Wood pieces, trim pieces, wood scraps, n.e.c. - - - - - - - - - 1 - -Wooden stakes - - - - - - - - 1 1 - -
Other building materials solid elements - - - - - - - - - 2 - 2 Glass building materials - - - - - - - - - 1 - 1 Gutters, downspouts - - - - - - - - - 1 - -Wallboard, drywall, sheetrock - - - - - - - - - - - 1
Fasteners, connectors, ropes, ties - - - - - - - - 97 88 100 92 Fasteners - - - - - - - - - 3 2 1
See footnotes at end of table. 212
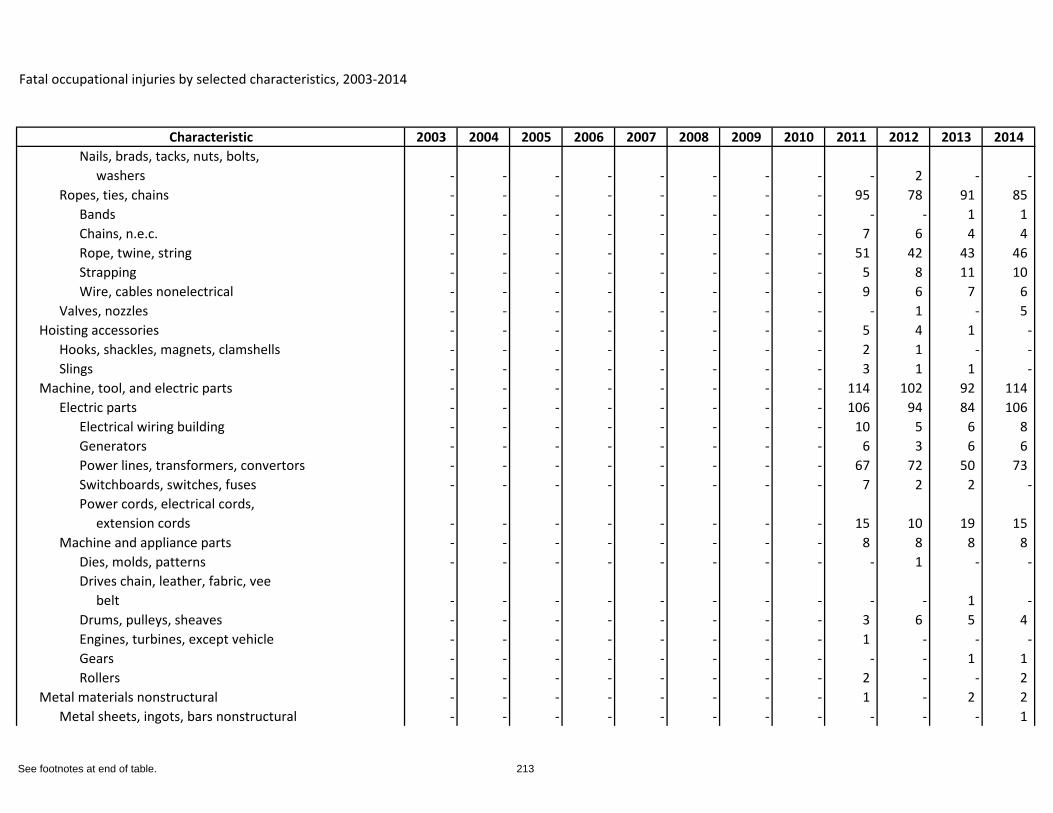
Fatal occupational injuries by selected characteristics, 2003-2014
Characteristic 2003 2004 2005 2006 2007 2008 2009 2010 2011 2012 2013 2014Nails, brads, tacks, nuts, bolts, washers - - - - - - - - - 2 - -
Ropes, ties, chains - - - - - - - - 95 78 91 85 Bands - - - - - - - - - - 1 1 Chains, n.e.c. - - - - - - - - 7 6 4 4 Rope, twine, string - - - - - - - - 51 42 43 46 Strapping - - - - - - - - 5 8 11 10 Wire, cables nonelectrical - - - - - - - - 9 6 7 6
Valves, nozzles - - - - - - - - - 1 - 5 Hoisting accessories - - - - - - - - 5 4 1 -
Hooks, shackles, magnets, clamshells - - - - - - - - 2 1 - -Slings - - - - - - - - 3 1 1 -
Machine, tool, and electric parts - - - - - - - - 114 102 92 114 Electric parts - - - - - - - - 106 94 84 106
Electrical wiring building - - - - - - - - 10 5 6 8 Generators - - - - - - - - 6 3 6 6 Power lines, transformers, convertors - - - - - - - - 67 72 50 73 Switchboards, switches, fuses - - - - - - - - 7 2 2 -Power cords, electrical cords, extension cords - - - - - - - - 15 10 19 15
Machine and appliance parts - - - - - - - - 8 8 8 8 Dies, molds, patterns - - - - - - - - - 1 - -Drives chain, leather, fabric, vee belt - - - - - - - - - - 1 -Drums, pulleys, sheaves - - - - - - - - 3 6 5 4 Engines, turbines, except vehicle - - - - - - - - 1 - - -Gears - - - - - - - - - - 1 1 Rollers - - - - - - - - 2 - - 2
Metal materials nonstructural - - - - - - - - 1 - 2 2 Metal sheets, ingots, bars nonstructural - - - - - - - - - - - 1
See footnotes at end of table. 213
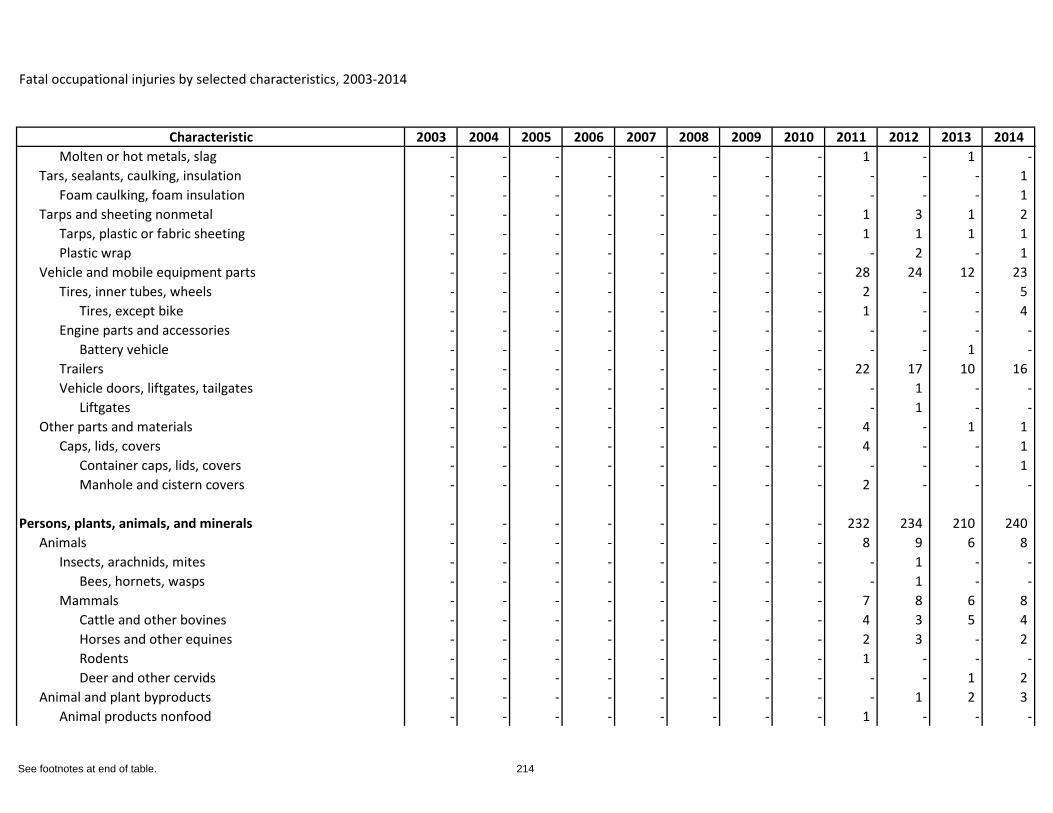
Fatal occupational injuries by selected characteristics, 2003-2014
Characteristic 2003 2004 2005 2006 2007 2008 2009 2010 2011 2012 2013 2014Molten or hot metals, slag - - - - - - - - 1 - 1 -
Tars, sealants, caulking, insulation - - - - - - - - - - - 1 Foam caulking, foam insulation - - - - - - - - - - - 1
Tarps and sheeting nonmetal - - - - - - - - 1 3 1 2 Tarps, plastic or fabric sheeting - - - - - - - - 1 1 1 1 Plastic wrap - - - - - - - - - 2 - 1
Vehicle and mobile equipment parts - - - - - - - - 28 24 12 23 Tires, inner tubes, wheels - - - - - - - - 2 - - 5
Tires, except bike - - - - - - - - 1 - - 4 Engine parts and accessories - - - - - - - - - - - -
Battery vehicle - - - - - - - - - - 1 -Trailers - - - - - - - - 22 17 10 16 Vehicle doors, liftgates, tailgates - - - - - - - - - 1 - -
Liftgates - - - - - - - - - 1 - -Other parts and materials - - - - - - - - 4 - 1 1
Caps, lids, covers - - - - - - - - 4 - - 1 Container caps, lids, covers - - - - - - - - - - - 1 Manhole and cistern covers - - - - - - - - 2 - - -
Persons, plants, animals, and minerals - - - - - - - - 232 234 210 240 Animals - - - - - - - - 8 9 6 8
Insects, arachnids, mites - - - - - - - - - 1 - -Bees, hornets, wasps - - - - - - - - - 1 - -
Mammals - - - - - - - - 7 8 6 8 Cattle and other bovines - - - - - - - - 4 3 5 4 Horses and other equines - - - - - - - - 2 3 - 2 Rodents - - - - - - - - 1 - - -Deer and other cervids - - - - - - - - - - 1 2
Animal and plant byproducts - - - - - - - - - 1 2 3 Animal products nonfood - - - - - - - - 1 - - -
See footnotes at end of table. 214
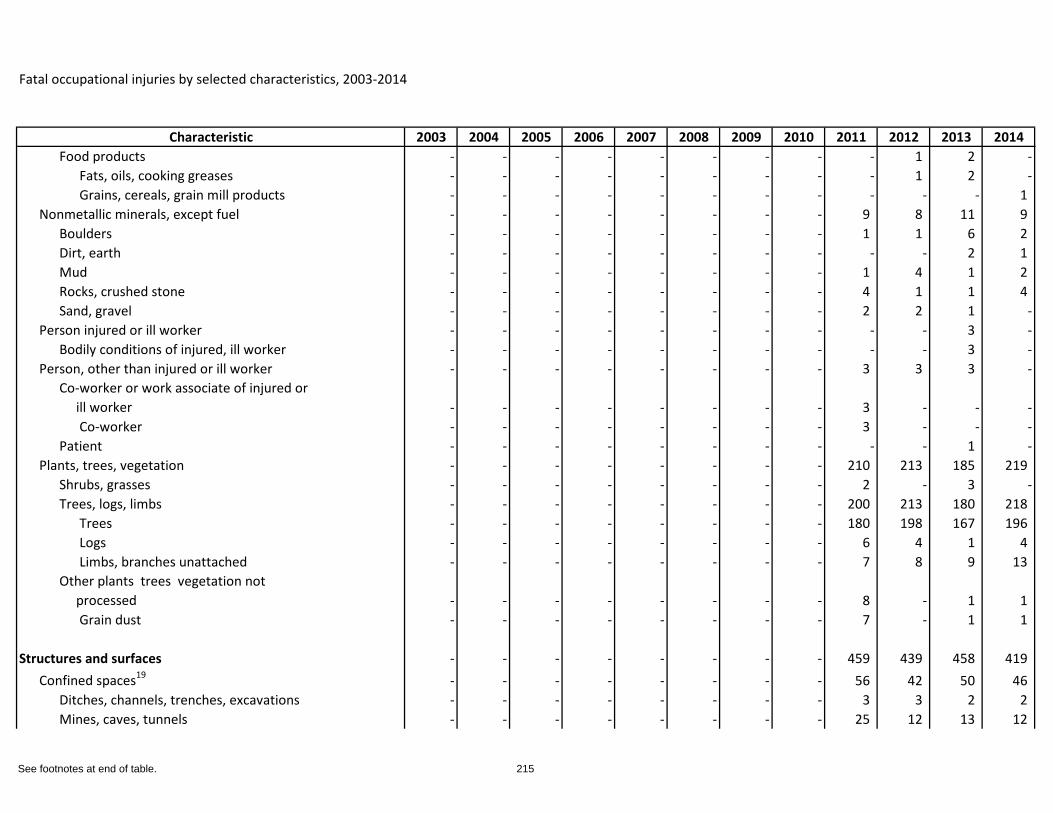
Fatal occupational injuries by selected characteristics, 2003-2014
Characteristic 2003 2004 2005 2006 2007 2008 2009 2010 2011 2012 2013 2014Food products - - - - - - - - - 1 2 -
Fats, oils, cooking greases - - - - - - - - - 1 2 -Grains, cereals, grain mill products - - - - - - - - - - - 1
Nonmetallic minerals, except fuel - - - - - - - - 9 8 11 9 Boulders - - - - - - - - 1 1 6 2 Dirt, earth - - - - - - - - - - 2 1 Mud - - - - - - - - 1 4 1 2 Rocks, crushed stone - - - - - - - - 4 1 1 4 Sand, gravel - - - - - - - - 2 2 1 -
Person injured or ill worker - - - - - - - - - - 3 -Bodily conditions of injured, ill worker - - - - - - - - - - 3 -
Person, other than injured or ill worker - - - - - - - - 3 3 3 -Co-worker or work associate of injured or ill worker - - - - - - - - 3 - - -
Co-worker - - - - - - - - 3 - - -Patient - - - - - - - - - - 1 -
Plants, trees, vegetation - - - - - - - - 210 213 185 219 Shrubs, grasses - - - - - - - - 2 - 3 -Trees, logs, limbs - - - - - - - - 200 213 180 218
Trees - - - - - - - - 180 198 167 196 Logs - - - - - - - - 6 4 1 4 Limbs, branches unattached - - - - - - - - 7 8 9 13
Other plants trees vegetation not processed - - - - - - - - 8 - 1 1
Grain dust - - - - - - - - 7 - 1 1
Structures and surfaces - - - - - - - - 459 439 458 419 Confined spaces19 - - - - - - - - 56 42 50 46
Ditches, channels, trenches, excavations - - - - - - - - 3 3 2 2 Mines, caves, tunnels - - - - - - - - 25 12 13 12
See footnotes at end of table. 215
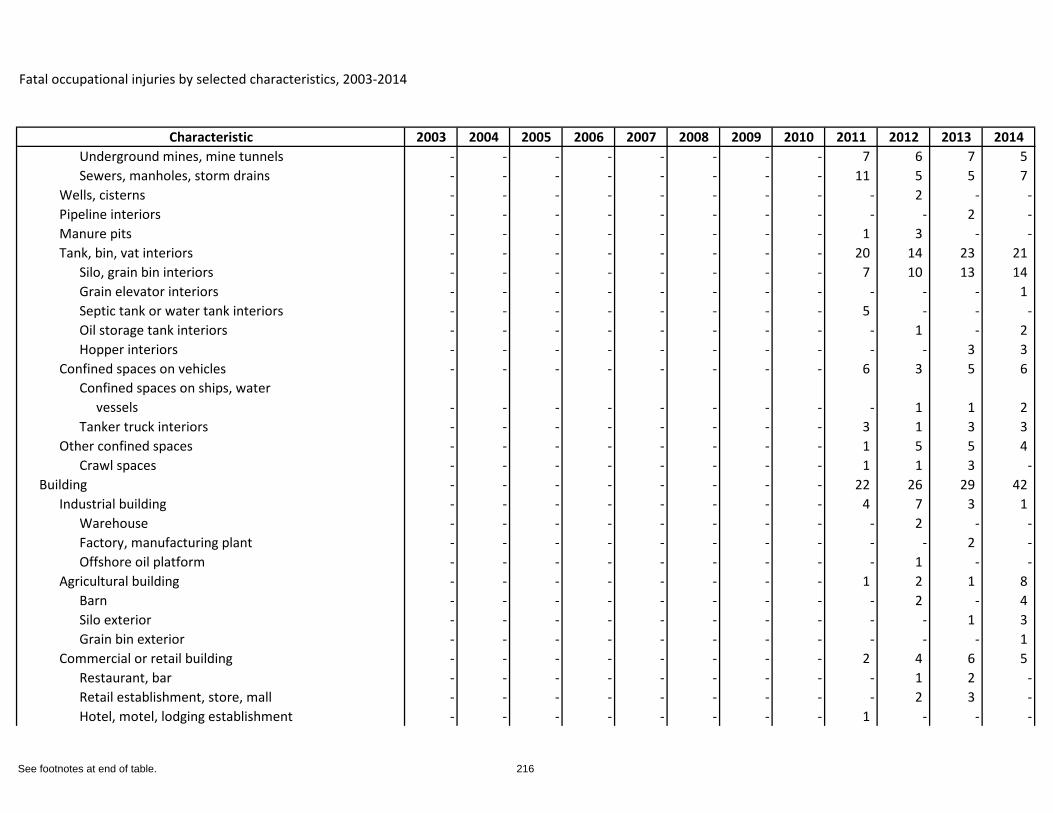
Fatal occupational injuries by selected characteristics, 2003-2014
Characteristic 2003 2004 2005 2006 2007 2008 2009 2010 2011 2012 2013 2014Underground mines, mine tunnels - - - - - - - - 7 6 7 5 Sewers, manholes, storm drains - - - - - - - - 11 5 5 7
Wells, cisterns - - - - - - - - - 2 - -Pipeline interiors - - - - - - - - - - 2 -Manure pits - - - - - - - - 1 3 - -Tank, bin, vat interiors - - - - - - - - 20 14 23 21
Silo, grain bin interiors - - - - - - - - 7 10 13 14 Grain elevator interiors - - - - - - - - - - - 1 Septic tank or water tank interiors - - - - - - - - 5 - - -Oil storage tank interiors - - - - - - - - - 1 - 2 Hopper interiors - - - - - - - - - - 3 3
Confined spaces on vehicles - - - - - - - - 6 3 5 6 Confined spaces on ships, water vessels - - - - - - - - - 1 1 2 Tanker truck interiors - - - - - - - - 3 1 3 3
Other confined spaces - - - - - - - - 1 5 5 4 Crawl spaces - - - - - - - - 1 1 3 -
Building - - - - - - - - 22 26 29 42 Industrial building - - - - - - - - 4 7 3 1
Warehouse - - - - - - - - - 2 - -Factory, manufacturing plant - - - - - - - - - - 2 -Offshore oil platform - - - - - - - - - 1 - -
Agricultural building - - - - - - - - 1 2 1 8 Barn - - - - - - - - - 2 - 4 Silo exterior - - - - - - - - - - 1 3 Grain bin exterior - - - - - - - - - - - 1
Commercial or retail building - - - - - - - - 2 4 6 5 Restaurant, bar - - - - - - - - - 1 2 -Retail establishment, store, mall - - - - - - - - - 2 3 -Hotel, motel, lodging establishment - - - - - - - - 1 - - -
See footnotes at end of table. 216
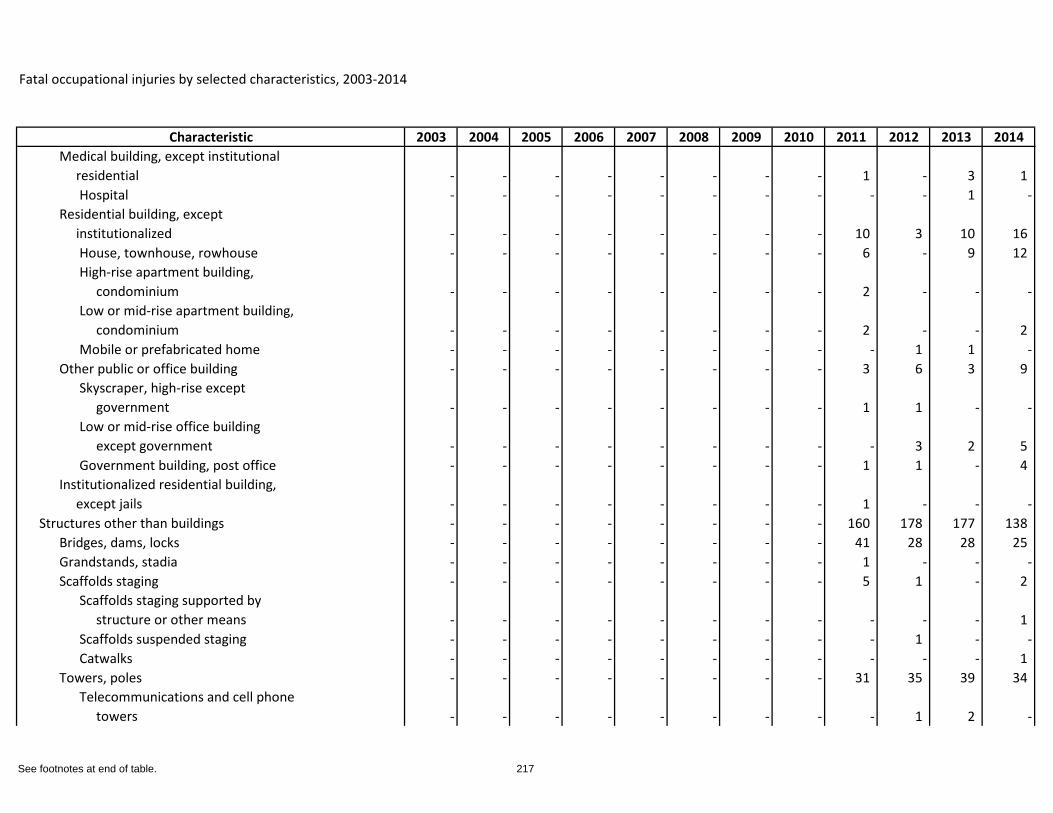
Fatal occupational injuries by selected characteristics, 2003-2014
Characteristic 2003 2004 2005 2006 2007 2008 2009 2010 2011 2012 2013 2014Medical building, except institutional residential - - - - - - - - 1 - 3 1
Hospital - - - - - - - - - - 1 -Residential building, except institutionalized - - - - - - - - 10 3 10 16
House, townhouse, rowhouse - - - - - - - - 6 - 9 12 High-rise apartment building, condominium - - - - - - - - 2 - - -Low or mid-rise apartment building, condominium - - - - - - - - 2 - - 2 Mobile or prefabricated home - - - - - - - - - 1 1 -
Other public or office building - - - - - - - - 3 6 3 9 Skyscraper, high-rise except government - - - - - - - - 1 1 - -Low or mid-rise office building except government - - - - - - - - - 3 2 5 Government building, post office - - - - - - - - 1 1 - 4
Institutionalized residential building, except jails - - - - - - - - 1 - - -
Structures other than buildings - - - - - - - - 160 178 177 138 Bridges, dams, locks - - - - - - - - 41 28 28 25 Grandstands, stadia - - - - - - - - 1 - - -Scaffolds staging - - - - - - - - 5 1 - 2
Scaffolds staging supported by structure or other means - - - - - - - - - - - 1 Scaffolds suspended staging - - - - - - - - - 1 - -Catwalks - - - - - - - - - - - 1
Towers, poles - - - - - - - - 31 35 39 34 Telecommunications and cell phone towers - - - - - - - - - 1 2 -
See footnotes at end of table. 217
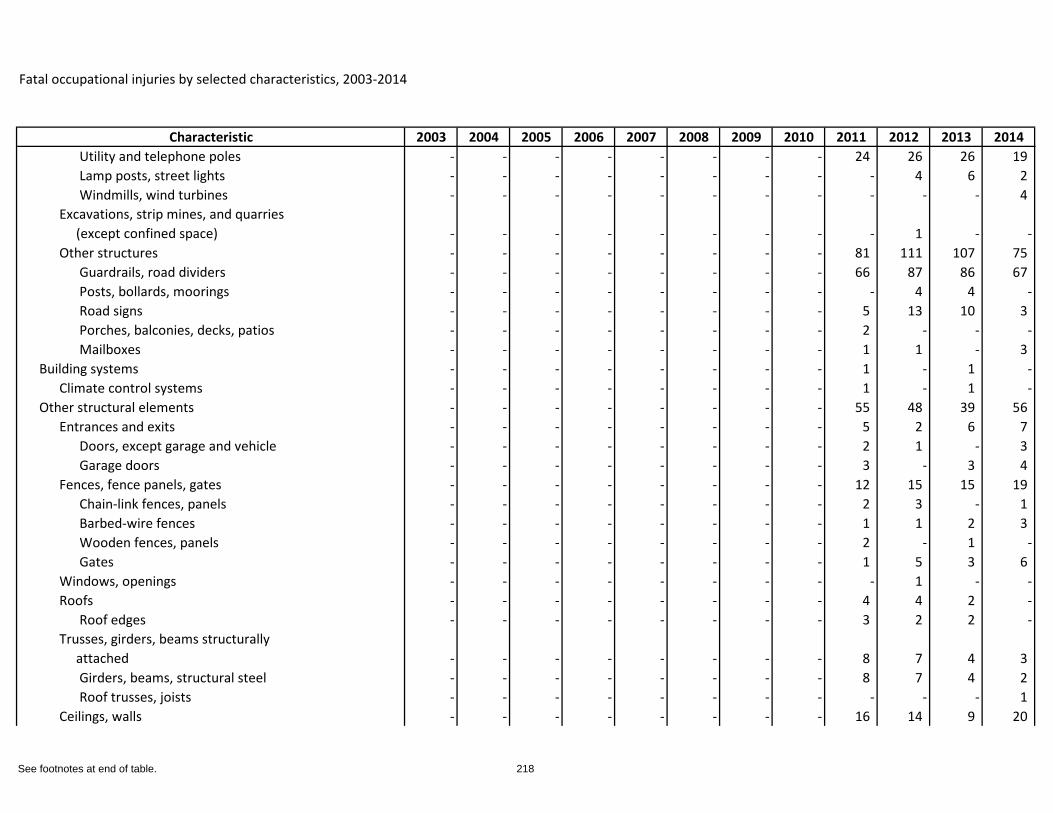
Fatal occupational injuries by selected characteristics, 2003-2014
Characteristic 2003 2004 2005 2006 2007 2008 2009 2010 2011 2012 2013 2014Utility and telephone poles - - - - - - - - 24 26 26 19 Lamp posts, street lights - - - - - - - - - 4 6 2 Windmills, wind turbines - - - - - - - - - - - 4
Excavations, strip mines, and quarries (except confined space) - - - - - - - - - 1 - -Other structures - - - - - - - - 81 111 107 75
Guardrails, road dividers - - - - - - - - 66 87 86 67 Posts, bollards, moorings - - - - - - - - - 4 4 -Road signs - - - - - - - - 5 13 10 3 Porches, balconies, decks, patios - - - - - - - - 2 - - -Mailboxes - - - - - - - - 1 1 - 3
Building systems - - - - - - - - 1 - 1 -Climate control systems - - - - - - - - 1 - 1 -
Other structural elements - - - - - - - - 55 48 39 56 Entrances and exits - - - - - - - - 5 2 6 7
Doors, except garage and vehicle - - - - - - - - 2 1 - 3 Garage doors - - - - - - - - 3 - 3 4
Fences, fence panels, gates - - - - - - - - 12 15 15 19 Chain-link fences, panels - - - - - - - - 2 3 - 1 Barbed-wire fences - - - - - - - - 1 1 2 3 Wooden fences, panels - - - - - - - - 2 - 1 -Gates - - - - - - - - 1 5 3 6
Windows, openings - - - - - - - - - 1 - -Roofs - - - - - - - - 4 4 2 -
Roof edges - - - - - - - - 3 2 2 -Trusses, girders, beams structurally attached - - - - - - - - 8 7 4 3
Girders, beams, structural steel - - - - - - - - 8 7 4 2 Roof trusses, joists - - - - - - - - - - - 1
Ceilings, walls - - - - - - - - 16 14 9 20
See footnotes at end of table. 218
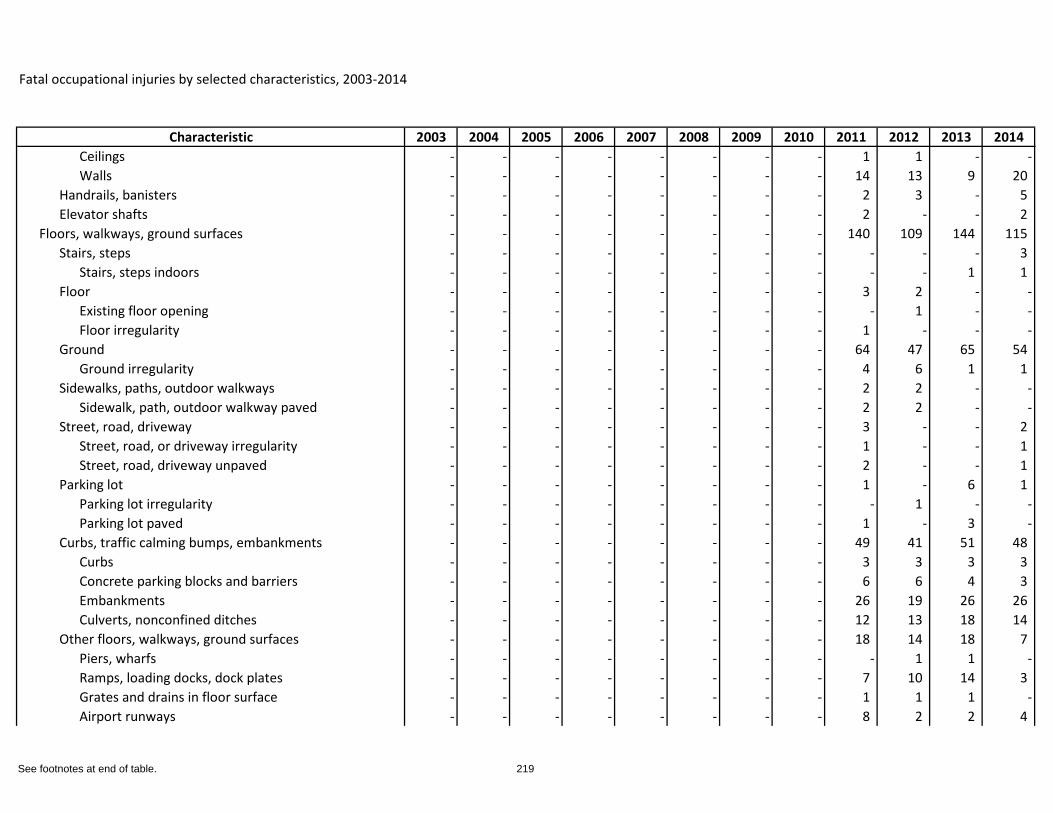
Fatal occupational injuries by selected characteristics, 2003-2014
Characteristic 2003 2004 2005 2006 2007 2008 2009 2010 2011 2012 2013 2014Ceilings - - - - - - - - 1 1 - -Walls - - - - - - - - 14 13 9 20
Handrails, banisters - - - - - - - - 2 3 - 5 Elevator shafts - - - - - - - - 2 - - 2
Floors, walkways, ground surfaces - - - - - - - - 140 109 144 115 Stairs, steps - - - - - - - - - - - 3
Stairs, steps indoors - - - - - - - - - - 1 1 Floor - - - - - - - - 3 2 - -
Existing floor opening - - - - - - - - - 1 - -Floor irregularity - - - - - - - - 1 - - -
Ground - - - - - - - - 64 47 65 54 Ground irregularity - - - - - - - - 4 6 1 1
Sidewalks, paths, outdoor walkways - - - - - - - - 2 2 - -Sidewalk, path, outdoor walkway paved - - - - - - - - 2 2 - -
Street, road, driveway - - - - - - - - 3 - - 2 Street, road, or driveway irregularity - - - - - - - - 1 - - 1 Street, road, driveway unpaved - - - - - - - - 2 - - 1
Parking lot - - - - - - - - 1 - 6 1 Parking lot irregularity - - - - - - - - - 1 - -Parking lot paved - - - - - - - - 1 - 3 -
Curbs, traffic calming bumps, embankments - - - - - - - - 49 41 51 48 Curbs - - - - - - - - 3 3 3 3 Concrete parking blocks and barriers - - - - - - - - 6 6 4 3 Embankments - - - - - - - - 26 19 26 26 Culverts, nonconfined ditches - - - - - - - - 12 13 18 14
Other floors, walkways, ground surfaces - - - - - - - - 18 14 18 7 Piers, wharfs - - - - - - - - - 1 1 -Ramps, loading docks, dock plates - - - - - - - - 7 10 14 3 Grates and drains in floor surface - - - - - - - - 1 1 1 -Airport runways - - - - - - - - 8 2 2 4
See footnotes at end of table. 219
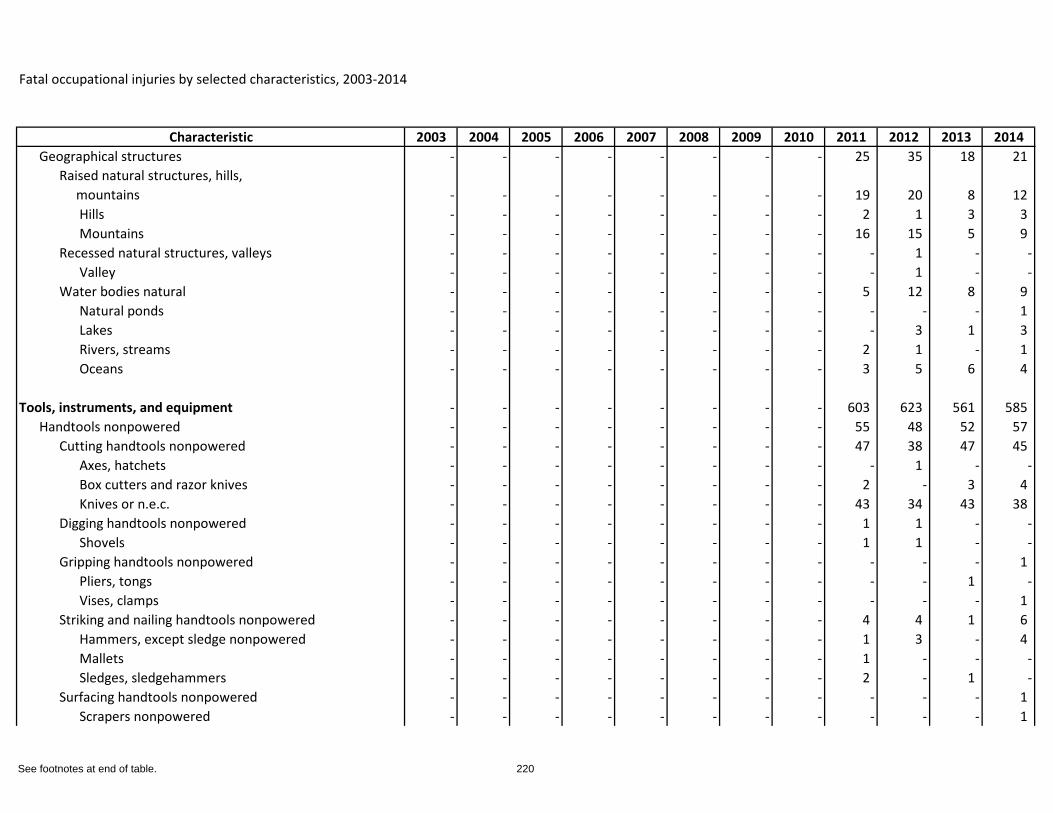
Fatal occupational injuries by selected characteristics, 2003-2014
Characteristic 2003 2004 2005 2006 2007 2008 2009 2010 2011 2012 2013 2014Geographical structures - - - - - - - - 25 35 18 21
Raised natural structures, hills, mountains - - - - - - - - 19 20 8 12
Hills - - - - - - - - 2 1 3 3 Mountains - - - - - - - - 16 15 5 9
Recessed natural structures, valleys - - - - - - - - - 1 - -Valley - - - - - - - - - 1 - -
Water bodies natural - - - - - - - - 5 12 8 9 Natural ponds - - - - - - - - - - - 1 Lakes - - - - - - - - - 3 1 3 Rivers, streams - - - - - - - - 2 1 - 1 Oceans - - - - - - - - 3 5 6 4
Tools, instruments, and equipment - - - - - - - - 603 623 561 585 Handtools nonpowered - - - - - - - - 55 48 52 57
Cutting handtools nonpowered - - - - - - - - 47 38 47 45 Axes, hatchets - - - - - - - - - 1 - -Box cutters and razor knives - - - - - - - - 2 - 3 4 Knives or n.e.c. - - - - - - - - 43 34 43 38
Digging handtools nonpowered - - - - - - - - 1 1 - -Shovels - - - - - - - - 1 1 - -
Gripping handtools nonpowered - - - - - - - - - - - 1 Pliers, tongs - - - - - - - - - - 1 -Vises, clamps - - - - - - - - - - - 1
Striking and nailing handtools nonpowered - - - - - - - - 4 4 1 6 Hammers, except sledge nonpowered - - - - - - - - 1 3 - 4 Mallets - - - - - - - - 1 - - -Sledges, sledgehammers - - - - - - - - 2 - 1 -
Surfacing handtools nonpowered - - - - - - - - - - - 1 Scrapers nonpowered - - - - - - - - - - - 1
See footnotes at end of table. 220
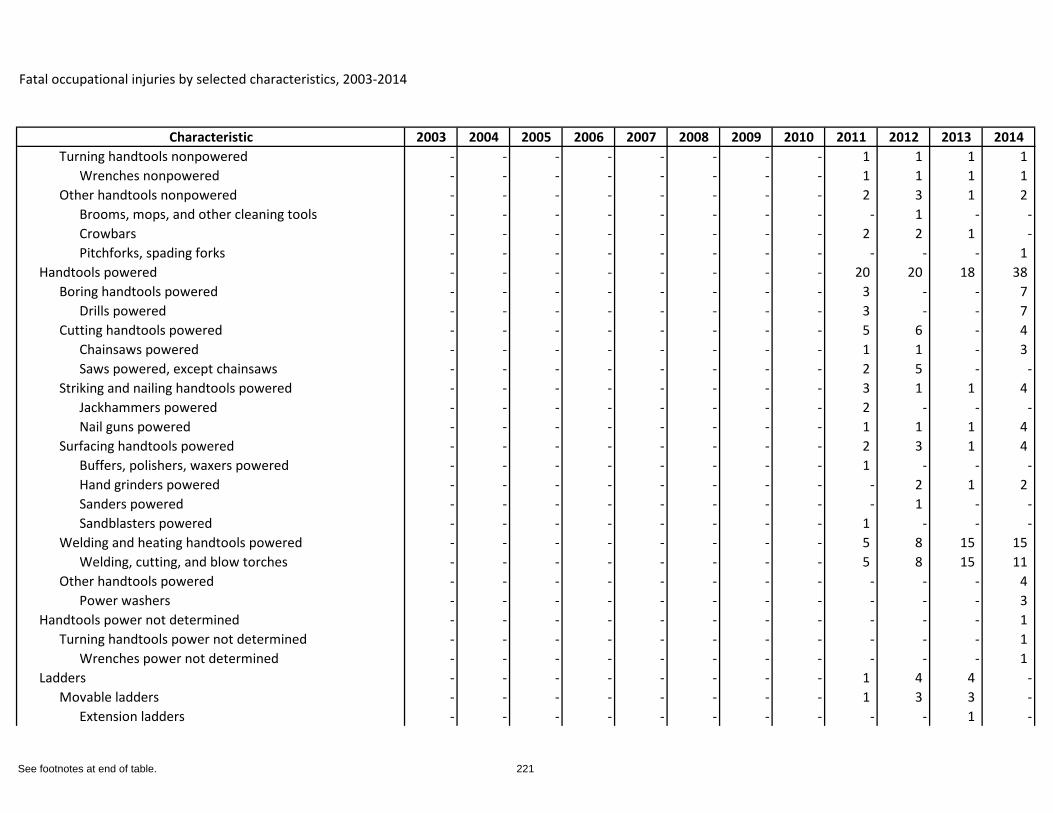
Fatal occupational injuries by selected characteristics, 2003-2014
Characteristic 2003 2004 2005 2006 2007 2008 2009 2010 2011 2012 2013 2014Turning handtools nonpowered - - - - - - - - 1 1 1 1
Wrenches nonpowered - - - - - - - - 1 1 1 1 Other handtools nonpowered - - - - - - - - 2 3 1 2
Brooms, mops, and other cleaning tools - - - - - - - - - 1 - -Crowbars - - - - - - - - 2 2 1 -Pitchforks, spading forks - - - - - - - - - - - 1
Handtools powered - - - - - - - - 20 20 18 38 Boring handtools powered - - - - - - - - 3 - - 7
Drills powered - - - - - - - - 3 - - 7 Cutting handtools powered - - - - - - - - 5 6 - 4
Chainsaws powered - - - - - - - - 1 1 - 3 Saws powered, except chainsaws - - - - - - - - 2 5 - -
Striking and nailing handtools powered - - - - - - - - 3 1 1 4 Jackhammers powered - - - - - - - - 2 - - -Nail guns powered - - - - - - - - 1 1 1 4
Surfacing handtools powered - - - - - - - - 2 3 1 4 Buffers, polishers, waxers powered - - - - - - - - 1 - - -Hand grinders powered - - - - - - - - - 2 1 2 Sanders powered - - - - - - - - - 1 - -Sandblasters powered - - - - - - - - 1 - - -
Welding and heating handtools powered - - - - - - - - 5 8 15 15 Welding, cutting, and blow torches - - - - - - - - 5 8 15 11
Other handtools powered - - - - - - - - - - - 4 Power washers - - - - - - - - - - - 3
Handtools power not determined - - - - - - - - - - - 1 Turning handtools power not determined - - - - - - - - - - - 1
Wrenches power not determined - - - - - - - - - - - 1 Ladders - - - - - - - - 1 4 4 -
Movable ladders - - - - - - - - 1 3 3 -Extension ladders - - - - - - - - - - 1 -
See footnotes at end of table. 221
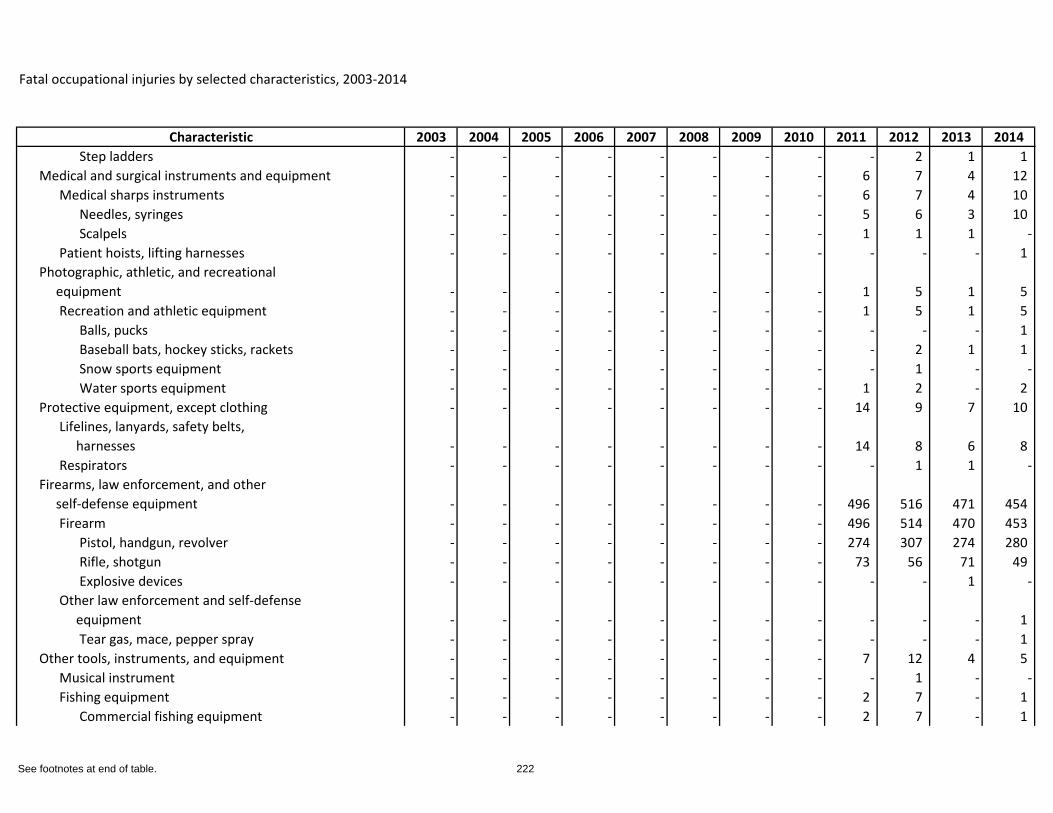
Fatal occupational injuries by selected characteristics, 2003-2014
Characteristic 2003 2004 2005 2006 2007 2008 2009 2010 2011 2012 2013 2014Step ladders - - - - - - - - - 2 1 1
Medical and surgical instruments and equipment - - - - - - - - 6 7 4 12 Medical sharps instruments - - - - - - - - 6 7 4 10
Needles, syringes - - - - - - - - 5 6 3 10 Scalpels - - - - - - - - 1 1 1 -
Patient hoists, lifting harnesses - - - - - - - - - - - 1 Photographic, athletic, and recreational equipment - - - - - - - - 1 5 1 5
Recreation and athletic equipment - - - - - - - - 1 5 1 5 Balls, pucks - - - - - - - - - - - 1 Baseball bats, hockey sticks, rackets - - - - - - - - - 2 1 1 Snow sports equipment - - - - - - - - - 1 - -Water sports equipment - - - - - - - - 1 2 - 2
Protective equipment, except clothing - - - - - - - - 14 9 7 10 Lifelines, lanyards, safety belts, harnesses - - - - - - - - 14 8 6 8 Respirators - - - - - - - - - 1 1 -
Firearms, law enforcement, and other self-defense equipment - - - - - - - - 496 516 471 454
Firearm - - - - - - - - 496 514 470 453 Pistol, handgun, revolver - - - - - - - - 274 307 274 280 Rifle, shotgun - - - - - - - - 73 56 71 49 Explosive devices - - - - - - - - - - 1 -
Other law enforcement and self-defense equipment - - - - - - - - - - - 1
Tear gas, mace, pepper spray - - - - - - - - - - - 1 Other tools, instruments, and equipment - - - - - - - - 7 12 4 5
Musical instrument - - - - - - - - - 1 - -Fishing equipment - - - - - - - - 2 7 - 1
Commercial fishing equipment - - - - - - - - 2 7 - 1
See footnotes at end of table. 222
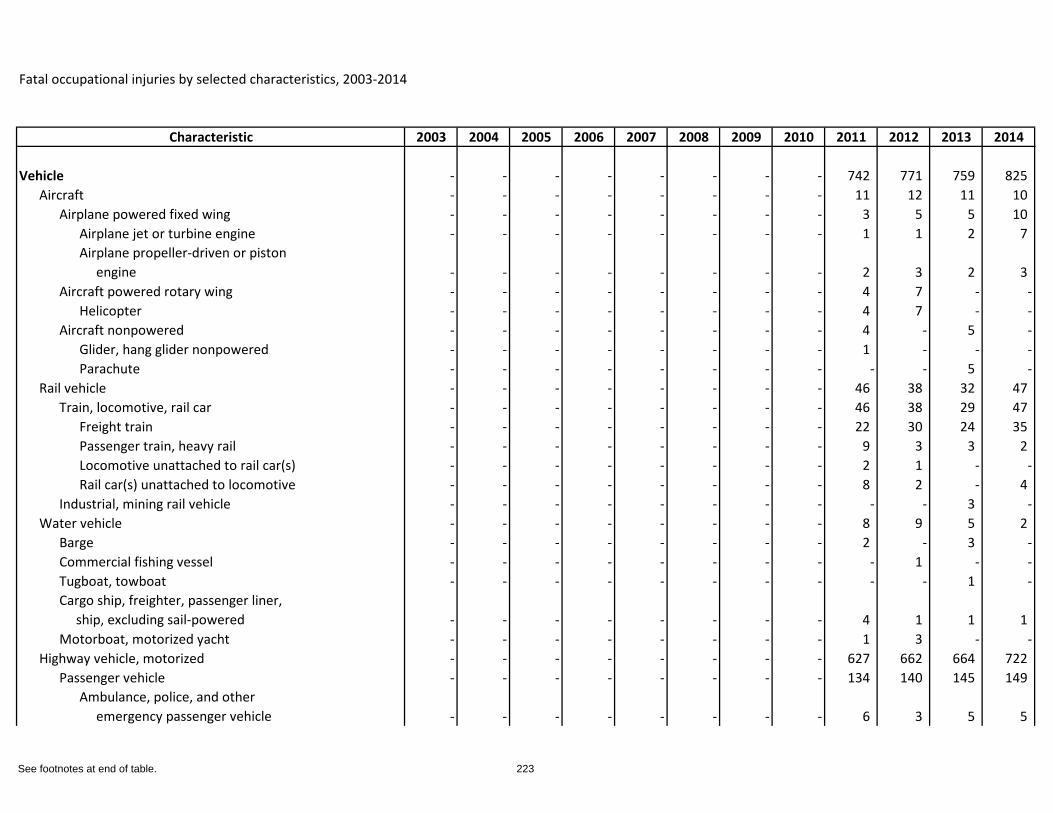
Fatal occupational injuries by selected characteristics, 2003-2014
Characteristic 2003 2004 2005 2006 2007 2008 2009 2010 2011 2012 2013 2014
Vehicle - - - - - - - - 742 771 759 825 Aircraft - - - - - - - - 11 12 11 10
Airplane powered fixed wing - - - - - - - - 3 5 5 10 Airplane jet or turbine engine - - - - - - - - 1 1 2 7 Airplane propeller-driven or piston engine - - - - - - - - 2 3 2 3
Aircraft powered rotary wing - - - - - - - - 4 7 - -Helicopter - - - - - - - - 4 7 - -
Aircraft nonpowered - - - - - - - - 4 - 5 -Glider, hang glider nonpowered - - - - - - - - 1 - - -Parachute - - - - - - - - - - 5 -
Rail vehicle - - - - - - - - 46 38 32 47 Train, locomotive, rail car - - - - - - - - 46 38 29 47
Freight train - - - - - - - - 22 30 24 35 Passenger train, heavy rail - - - - - - - - 9 3 3 2 Locomotive unattached to rail car(s) - - - - - - - - 2 1 - -Rail car(s) unattached to locomotive - - - - - - - - 8 2 - 4
Industrial, mining rail vehicle - - - - - - - - - - 3 -Water vehicle - - - - - - - - 8 9 5 2
Barge - - - - - - - - 2 - 3 -Commercial fishing vessel - - - - - - - - - 1 - -Tugboat, towboat - - - - - - - - - - 1 -Cargo ship, freighter, passenger liner, ship, excluding sail-powered - - - - - - - - 4 1 1 1 Motorboat, motorized yacht - - - - - - - - 1 3 - -
Highway vehicle, motorized - - - - - - - - 627 662 664 722 Passenger vehicle - - - - - - - - 134 140 145 149
Ambulance, police, and other emergency passenger vehicle - - - - - - - - 6 3 5 5
See footnotes at end of table. 223
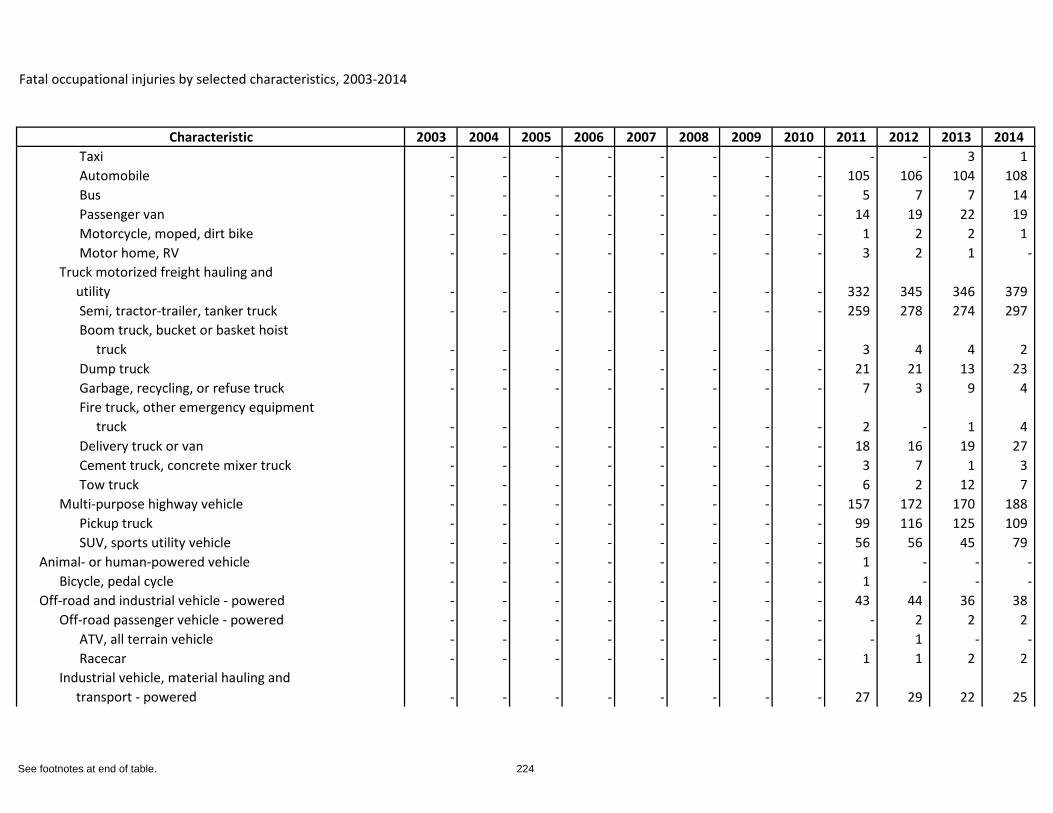
Fatal occupational injuries by selected characteristics, 2003-2014
Characteristic 2003 2004 2005 2006 2007 2008 2009 2010 2011 2012 2013 2014Taxi - - - - - - - - - - 3 1 Automobile - - - - - - - - 105 106 104 108 Bus - - - - - - - - 5 7 7 14 Passenger van - - - - - - - - 14 19 22 19 Motorcycle, moped, dirt bike - - - - - - - - 1 2 2 1 Motor home, RV - - - - - - - - 3 2 1 -
Truck motorized freight hauling and utility - - - - - - - - 332 345 346 379
Semi, tractor-trailer, tanker truck - - - - - - - - 259 278 274 297 Boom truck, bucket or basket hoist truck - - - - - - - - 3 4 4 2 Dump truck - - - - - - - - 21 21 13 23 Garbage, recycling, or refuse truck - - - - - - - - 7 3 9 4 Fire truck, other emergency equipment truck - - - - - - - - 2 - 1 4 Delivery truck or van - - - - - - - - 18 16 19 27 Cement truck, concrete mixer truck - - - - - - - - 3 7 1 3 Tow truck - - - - - - - - 6 2 12 7
Multi-purpose highway vehicle - - - - - - - - 157 172 170 188 Pickup truck - - - - - - - - 99 116 125 109 SUV, sports utility vehicle - - - - - - - - 56 56 45 79
Animal- or human-powered vehicle - - - - - - - - 1 - - -Bicycle, pedal cycle - - - - - - - - 1 - - -
Off-road and industrial vehicle - powered - - - - - - - - 43 44 36 38 Off-road passenger vehicle - powered - - - - - - - - - 2 2 2
ATV, all terrain vehicle - - - - - - - - - 1 - -Racecar - - - - - - - - 1 1 2 2
Industrial vehicle, material hauling and transport - powered - - - - - - - - 27 29 22 25
See footnotes at end of table. 224
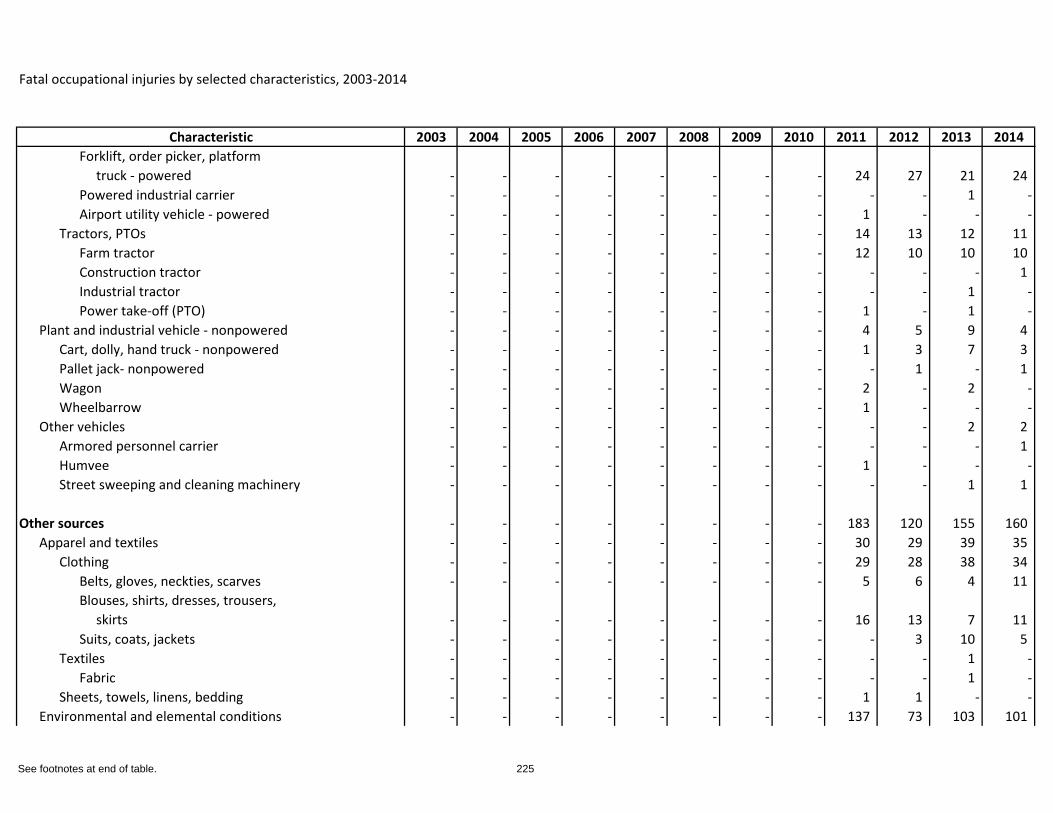
Fatal occupational injuries by selected characteristics, 2003-2014
Characteristic 2003 2004 2005 2006 2007 2008 2009 2010 2011 2012 2013 2014Forklift, order picker, platform truck - powered - - - - - - - - 24 27 21 24 Powered industrial carrier - - - - - - - - - - 1 -Airport utility vehicle - powered - - - - - - - - 1 - - -
Tractors, PTOs - - - - - - - - 14 13 12 11 Farm tractor - - - - - - - - 12 10 10 10 Construction tractor - - - - - - - - - - - 1 Industrial tractor - - - - - - - - - - 1 -Power take-off (PTO) - - - - - - - - 1 - 1 -
Plant and industrial vehicle - nonpowered - - - - - - - - 4 5 9 4 Cart, dolly, hand truck - nonpowered - - - - - - - - 1 3 7 3 Pallet jack- nonpowered - - - - - - - - - 1 - 1 Wagon - - - - - - - - 2 - 2 -Wheelbarrow - - - - - - - - 1 - - -
Other vehicles - - - - - - - - - - 2 2 Armored personnel carrier - - - - - - - - - - - 1 Humvee - - - - - - - - 1 - - -Street sweeping and cleaning machinery - - - - - - - - - - 1 1
Other sources - - - - - - - - 183 120 155 160 Apparel and textiles - - - - - - - - 30 29 39 35
Clothing - - - - - - - - 29 28 38 34 Belts, gloves, neckties, scarves - - - - - - - - 5 6 4 11 Blouses, shirts, dresses, trousers, skirts - - - - - - - - 16 13 7 11 Suits, coats, jackets - - - - - - - - - 3 10 5
Textiles - - - - - - - - - - 1 -Fabric - - - - - - - - - - 1 -
Sheets, towels, linens, bedding - - - - - - - - 1 1 - -Environmental and elemental conditions - - - - - - - - 137 73 103 101
See footnotes at end of table. 225
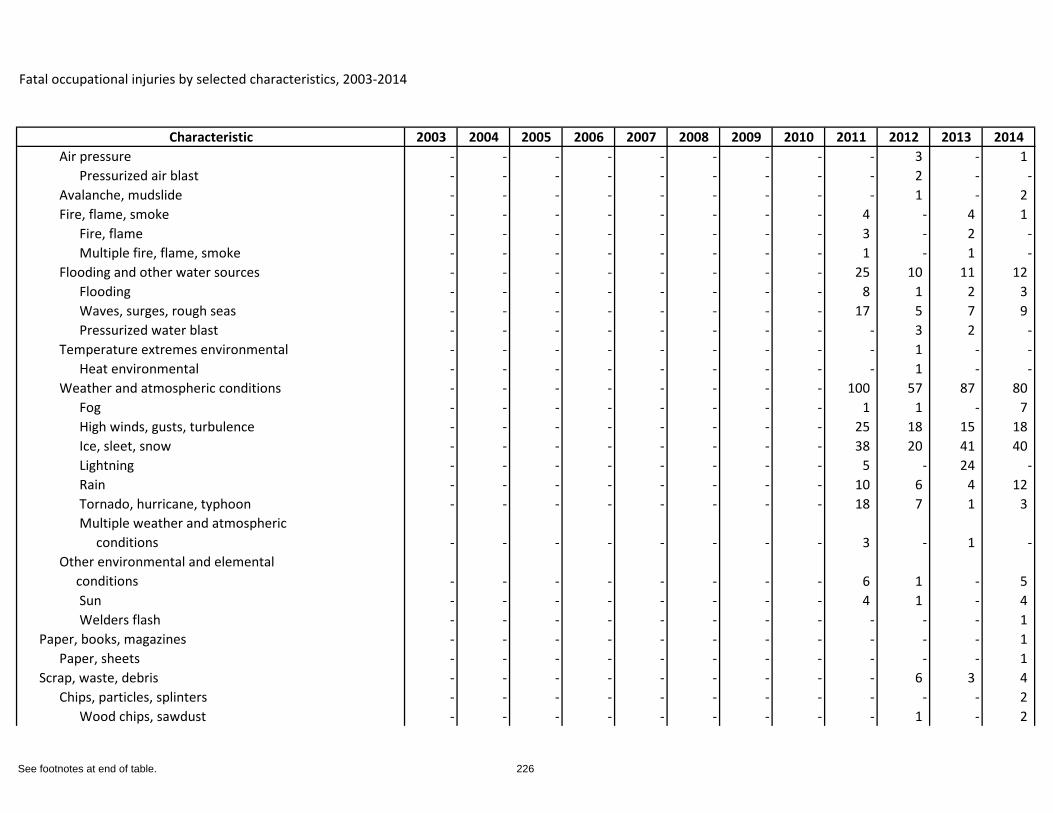
Fatal occupational injuries by selected characteristics, 2003-2014
Characteristic 2003 2004 2005 2006 2007 2008 2009 2010 2011 2012 2013 2014Air pressure - - - - - - - - - 3 - 1
Pressurized air blast - - - - - - - - - 2 - -Avalanche, mudslide - - - - - - - - - 1 - 2 Fire, flame, smoke - - - - - - - - 4 - 4 1
Fire, flame - - - - - - - - 3 - 2 -Multiple fire, flame, smoke - - - - - - - - 1 - 1 -
Flooding and other water sources - - - - - - - - 25 10 11 12 Flooding - - - - - - - - 8 1 2 3 Waves, surges, rough seas - - - - - - - - 17 5 7 9 Pressurized water blast - - - - - - - - - 3 2 -
Temperature extremes environmental - - - - - - - - - 1 - -Heat environmental - - - - - - - - - 1 - -
Weather and atmospheric conditions - - - - - - - - 100 57 87 80 Fog - - - - - - - - 1 1 - 7 High winds, gusts, turbulence - - - - - - - - 25 18 15 18 Ice, sleet, snow - - - - - - - - 38 20 41 40 Lightning - - - - - - - - 5 - 24 -Rain - - - - - - - - 10 6 4 12 Tornado, hurricane, typhoon - - - - - - - - 18 7 1 3 Multiple weather and atmospheric conditions - - - - - - - - 3 - 1 -
Other environmental and elemental conditions - - - - - - - - 6 1 - 5
Sun - - - - - - - - 4 1 - 4 Welders flash - - - - - - - - - - - 1
Paper, books, magazines - - - - - - - - - - - 1 Paper, sheets - - - - - - - - - - - 1
Scrap, waste, debris - - - - - - - - - 6 3 4 Chips, particles, splinters - - - - - - - - - - - 2
Wood chips, sawdust - - - - - - - - - 1 - 2
See footnotes at end of table. 226
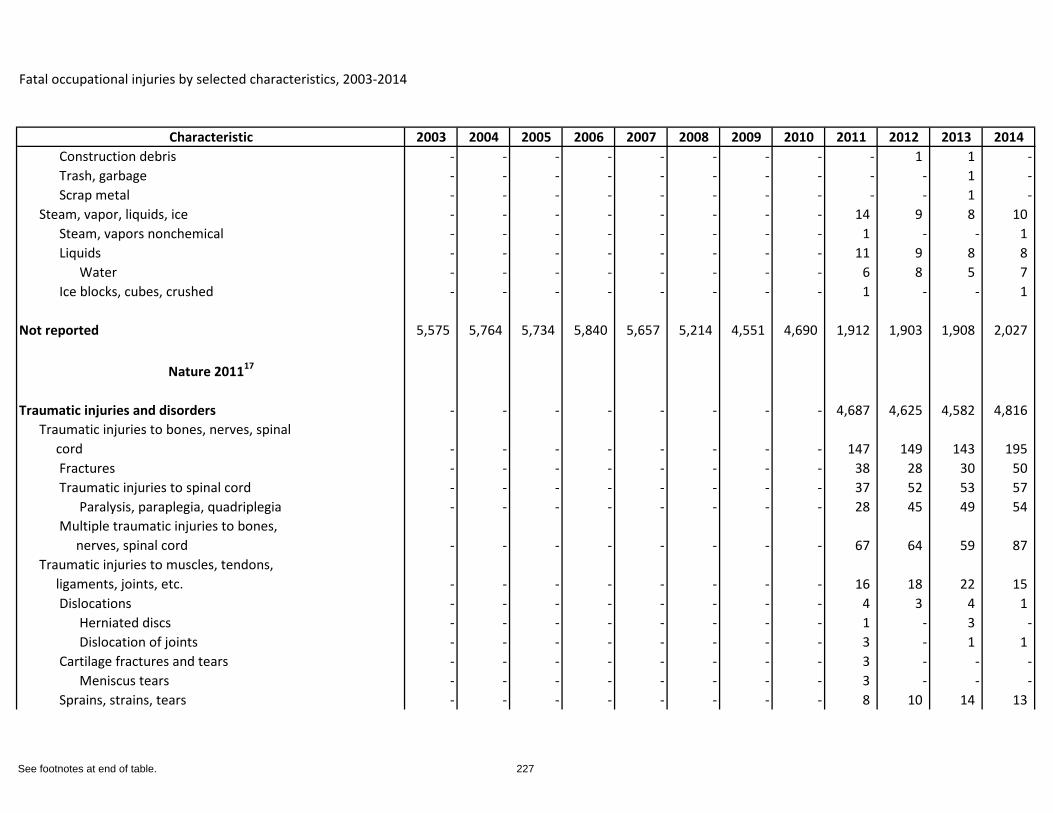
Fatal occupational injuries by selected characteristics, 2003-2014
Characteristic 2003 2004 2005 2006 2007 2008 2009 2010 2011 2012 2013 2014Construction debris - - - - - - - - - 1 1 -Trash, garbage - - - - - - - - - - 1 -Scrap metal - - - - - - - - - - 1 -
Steam, vapor, liquids, ice - - - - - - - - 14 9 8 10 Steam, vapors nonchemical - - - - - - - - 1 - - 1 Liquids - - - - - - - - 11 9 8 8
Water - - - - - - - - 6 8 5 7 Ice blocks, cubes, crushed - - - - - - - - 1 - - 1
Not reported 5,575 5,764 5,734 5,840 5,657 5,214 4,551 4,690 1,912 1,903 1,908 2,027
Nature 201117
Traumatic injuries and disorders - - - - - - - - 4,687 4,625 4,582 4,816 Traumatic injuries to bones, nerves, spinal cord - - - - - - - - 147 149 143 195
Fractures - - - - - - - - 38 28 30 50 Traumatic injuries to spinal cord - - - - - - - - 37 52 53 57
Paralysis, paraplegia, quadriplegia - - - - - - - - 28 45 49 54 Multiple traumatic injuries to bones, nerves, spinal cord - - - - - - - - 67 64 59 87
Traumatic injuries to muscles, tendons, ligaments, joints, etc. - - - - - - - - 16 18 22 15
Dislocations - - - - - - - - 4 3 4 1 Herniated discs - - - - - - - - 1 - 3 -Dislocation of joints - - - - - - - - 3 - 1 1
Cartilage fractures and tears - - - - - - - - 3 - - -Meniscus tears - - - - - - - - 3 - - -
Sprains, strains, tears - - - - - - - - 8 10 14 13
See footnotes at end of table. 227
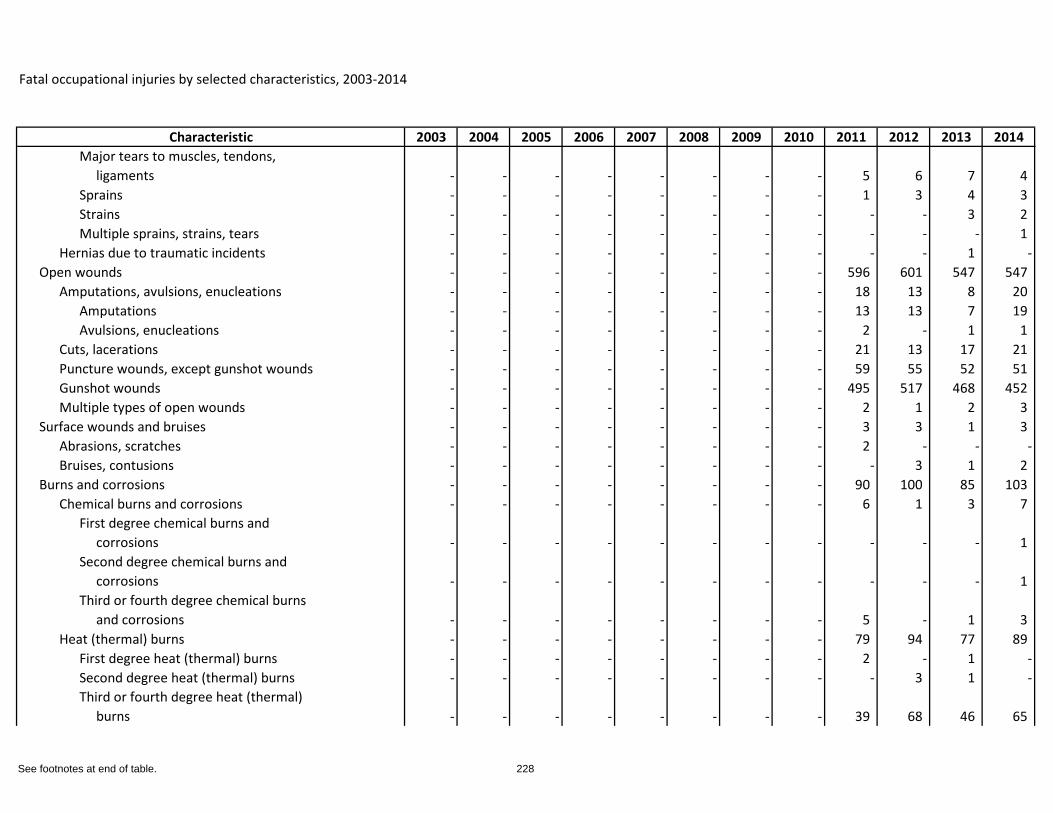
Fatal occupational injuries by selected characteristics, 2003-2014
Characteristic 2003 2004 2005 2006 2007 2008 2009 2010 2011 2012 2013 2014Major tears to muscles, tendons, ligaments - - - - - - - - 5 6 7 4 Sprains - - - - - - - - 1 3 4 3 Strains - - - - - - - - - - 3 2 Multiple sprains, strains, tears - - - - - - - - - - - 1
Hernias due to traumatic incidents - - - - - - - - - - 1 -Open wounds - - - - - - - - 596 601 547 547
Amputations, avulsions, enucleations - - - - - - - - 18 13 8 20 Amputations - - - - - - - - 13 13 7 19 Avulsions, enucleations - - - - - - - - 2 - 1 1
Cuts, lacerations - - - - - - - - 21 13 17 21 Puncture wounds, except gunshot wounds - - - - - - - - 59 55 52 51 Gunshot wounds - - - - - - - - 495 517 468 452 Multiple types of open wounds - - - - - - - - 2 1 2 3
Surface wounds and bruises - - - - - - - - 3 3 1 3 Abrasions, scratches - - - - - - - - 2 - - -Bruises, contusions - - - - - - - - - 3 1 2
Burns and corrosions - - - - - - - - 90 100 85 103 Chemical burns and corrosions - - - - - - - - 6 1 3 7
First degree chemical burns and corrosions - - - - - - - - - - - 1 Second degree chemical burns and corrosions - - - - - - - - - - - 1 Third or fourth degree chemical burns and corrosions - - - - - - - - 5 - 1 3
Heat (thermal) burns - - - - - - - - 79 94 77 89 First degree heat (thermal) burns - - - - - - - - 2 - 1 -Second degree heat (thermal) burns - - - - - - - - - 3 1 -Third or fourth degree heat (thermal) burns - - - - - - - - 39 68 46 65
See footnotes at end of table. 228
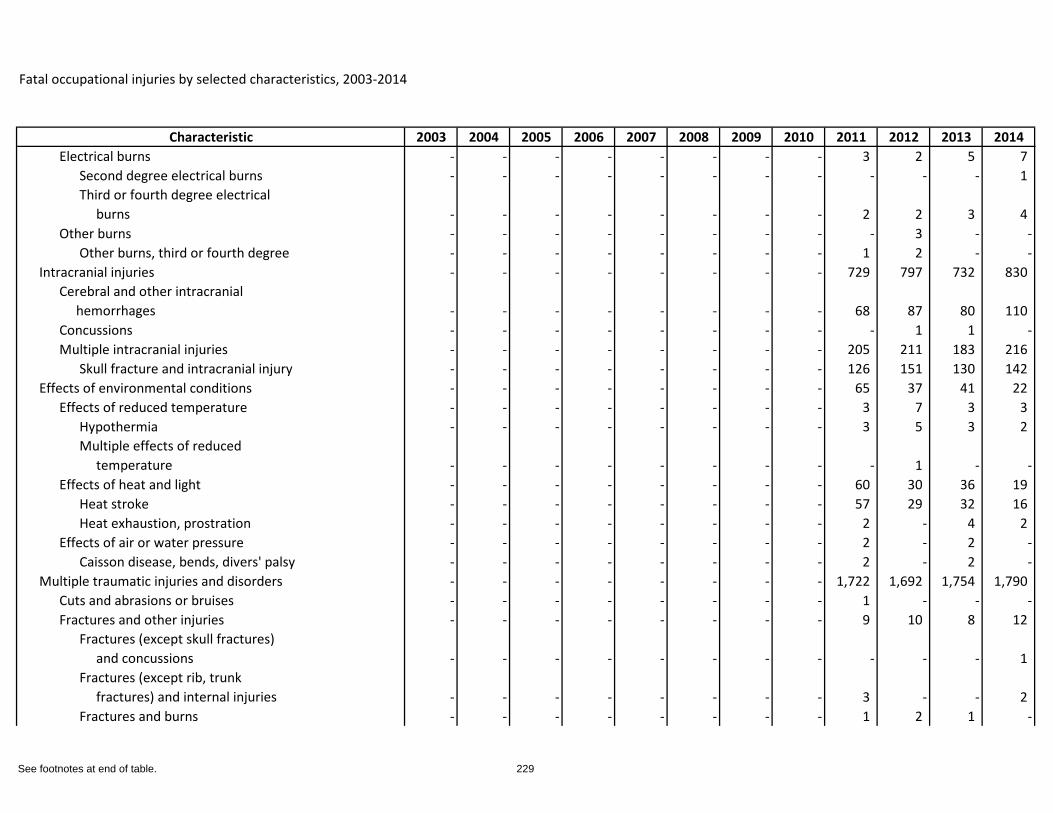
Fatal occupational injuries by selected characteristics, 2003-2014
Characteristic 2003 2004 2005 2006 2007 2008 2009 2010 2011 2012 2013 2014Electrical burns - - - - - - - - 3 2 5 7
Second degree electrical burns - - - - - - - - - - - 1 Third or fourth degree electrical burns - - - - - - - - 2 2 3 4
Other burns - - - - - - - - - 3 - -Other burns, third or fourth degree - - - - - - - - 1 2 - -
Intracranial injuries - - - - - - - - 729 797 732 830 Cerebral and other intracranial hemorrhages - - - - - - - - 68 87 80 110 Concussions - - - - - - - - - 1 1 -Multiple intracranial injuries - - - - - - - - 205 211 183 216
Skull fracture and intracranial injury - - - - - - - - 126 151 130 142 Effects of environmental conditions - - - - - - - - 65 37 41 22
Effects of reduced temperature - - - - - - - - 3 7 3 3 Hypothermia - - - - - - - - 3 5 3 2 Multiple effects of reduced temperature - - - - - - - - - 1 - -
Effects of heat and light - - - - - - - - 60 30 36 19 Heat stroke - - - - - - - - 57 29 32 16 Heat exhaustion, prostration - - - - - - - - 2 - 4 2
Effects of air or water pressure - - - - - - - - 2 - 2 -Caisson disease, bends, divers' palsy - - - - - - - - 2 - 2 -
Multiple traumatic injuries and disorders - - - - - - - - 1,722 1,692 1,754 1,790 Cuts and abrasions or bruises - - - - - - - - 1 - - -Fractures and other injuries - - - - - - - - 9 10 8 12
Fractures (except skull fractures) and concussions - - - - - - - - - - - 1 Fractures (except rib, trunk fractures) and internal injuries - - - - - - - - 3 - - 2 Fractures and burns - - - - - - - - 1 2 1 -
See footnotes at end of table. 229
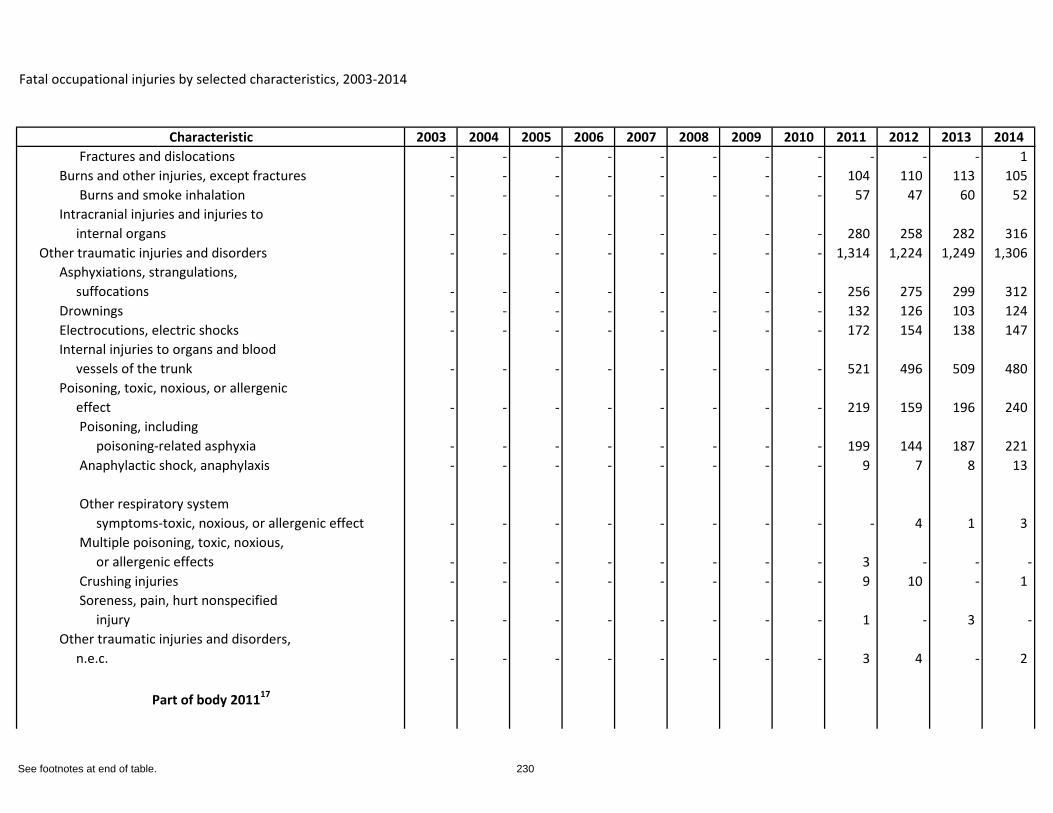
Fatal occupational injuries by selected characteristics, 2003-2014
Characteristic 2003 2004 2005 2006 2007 2008 2009 2010 2011 2012 2013 2014Fractures and dislocations - - - - - - - - - - - 1
Burns and other injuries, except fractures - - - - - - - - 104 110 113 105 Burns and smoke inhalation - - - - - - - - 57 47 60 52
Intracranial injuries and injuries to internal organs - - - - - - - - 280 258 282 316
Other traumatic injuries and disorders - - - - - - - - 1,314 1,224 1,249 1,306 Asphyxiations, strangulations, suffocations - - - - - - - - 256 275 299 312 Drownings - - - - - - - - 132 126 103 124 Electrocutions, electric shocks - - - - - - - - 172 154 138 147 Internal injuries to organs and blood vessels of the trunk - - - - - - - - 521 496 509 480 Poisoning, toxic, noxious, or allergenic effect - - - - - - - - 219 159 196 240
Poisoning, including poisoning-related asphyxia - - - - - - - - 199 144 187 221 Anaphylactic shock, anaphylaxis - - - - - - - - 9 7 8 13
Other respiratory system symptoms-toxic, noxious, or allergenic effect - - - - - - - - - 4 1 3 Multiple poisoning, toxic, noxious, or allergenic effects - - - - - - - - 3 - - -Crushing injuries - - - - - - - - 9 10 - 1 Soreness, pain, hurt nonspecified injury - - - - - - - - 1 - 3 -
Other traumatic injuries and disorders, n.e.c. - - - - - - - - 3 4 - 2
Part of body 201117
See footnotes at end of table. 230
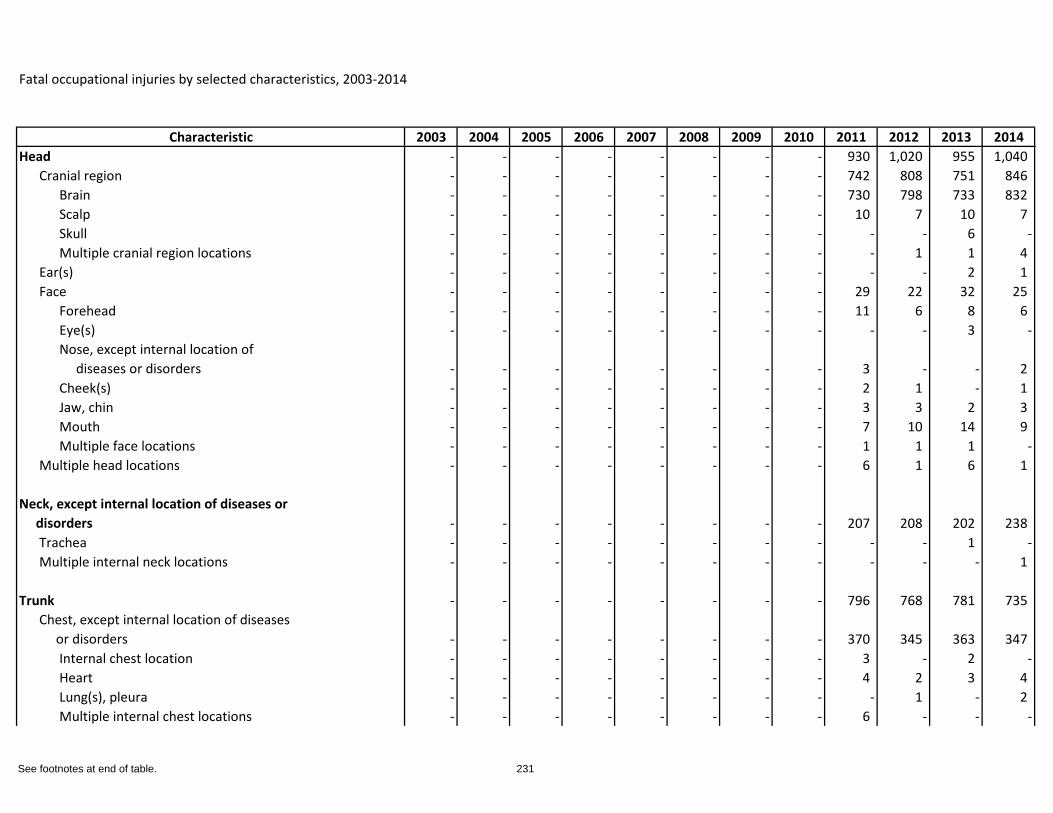
Fatal occupational injuries by selected characteristics, 2003-2014
Characteristic 2003 2004 2005 2006 2007 2008 2009 2010 2011 2012 2013 2014Head - - - - - - - - 930 1,020 955 1,040
Cranial region - - - - - - - - 742 808 751 846 Brain - - - - - - - - 730 798 733 832 Scalp - - - - - - - - 10 7 10 7 Skull - - - - - - - - - - 6 -Multiple cranial region locations - - - - - - - - - 1 1 4
Ear(s) - - - - - - - - - - 2 1 Face - - - - - - - - 29 22 32 25
Forehead - - - - - - - - 11 6 8 6 Eye(s) - - - - - - - - - - 3 -Nose, except internal location of diseases or disorders - - - - - - - - 3 - - 2 Cheek(s) - - - - - - - - 2 1 - 1 Jaw, chin - - - - - - - - 3 3 2 3 Mouth - - - - - - - - 7 10 14 9 Multiple face locations - - - - - - - - 1 1 1 -
Multiple head locations - - - - - - - - 6 1 6 1
Neck, except internal location of diseases or disorders - - - - - - - - 207 208 202 238
Trachea - - - - - - - - - - 1 -Multiple internal neck locations - - - - - - - - - - - 1
Trunk - - - - - - - - 796 768 781 735 Chest, except internal location of diseases or disorders - - - - - - - - 370 345 363 347
Internal chest location - - - - - - - - 3 - 2 -Heart - - - - - - - - 4 2 3 4 Lung(s), pleura - - - - - - - - - 1 - 2 Multiple internal chest locations - - - - - - - - 6 - - -
See footnotes at end of table. 231
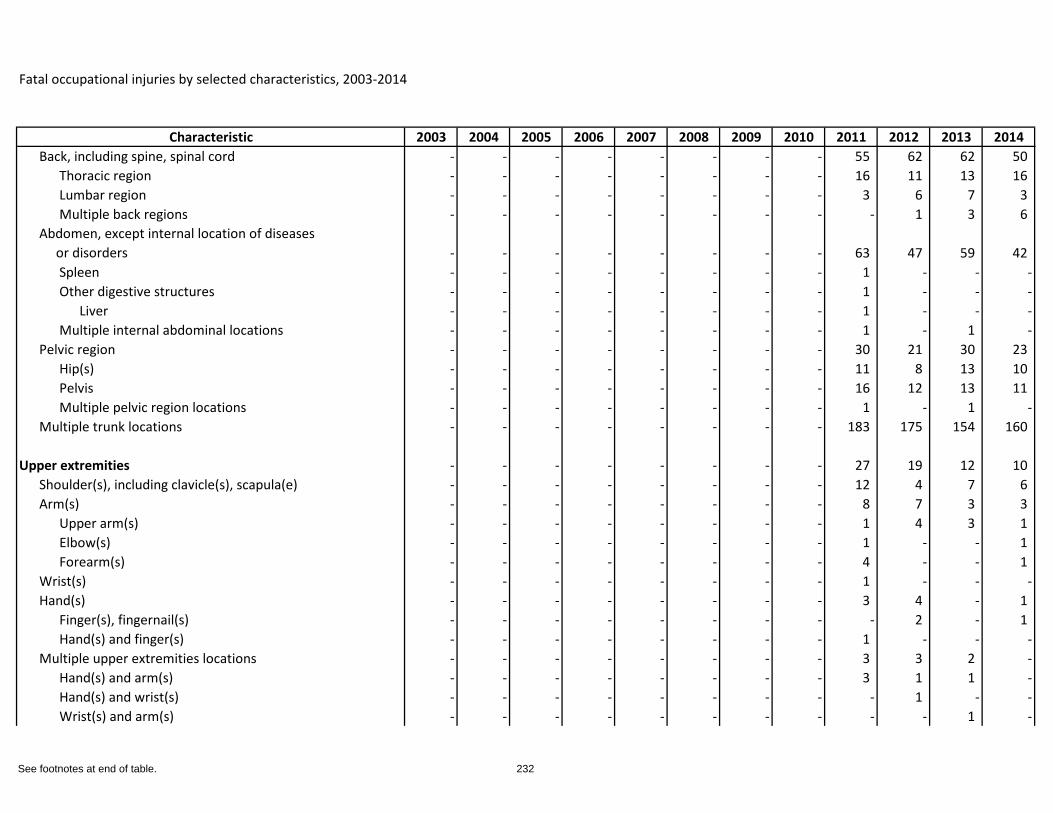
Fatal occupational injuries by selected characteristics, 2003-2014
Characteristic 2003 2004 2005 2006 2007 2008 2009 2010 2011 2012 2013 2014Back, including spine, spinal cord - - - - - - - - 55 62 62 50
Thoracic region - - - - - - - - 16 11 13 16 Lumbar region - - - - - - - - 3 6 7 3 Multiple back regions - - - - - - - - - 1 3 6
Abdomen, except internal location of diseases or disorders - - - - - - - - 63 47 59 42
Spleen - - - - - - - - 1 - - -Other digestive structures - - - - - - - - 1 - - -
Liver - - - - - - - - 1 - - -Multiple internal abdominal locations - - - - - - - - 1 - 1 -
Pelvic region - - - - - - - - 30 21 30 23 Hip(s) - - - - - - - - 11 8 13 10 Pelvis - - - - - - - - 16 12 13 11 Multiple pelvic region locations - - - - - - - - 1 - 1 -
Multiple trunk locations - - - - - - - - 183 175 154 160
Upper extremities - - - - - - - - 27 19 12 10 Shoulder(s), including clavicle(s), scapula(e) - - - - - - - - 12 4 7 6 Arm(s) - - - - - - - - 8 7 3 3
Upper arm(s) - - - - - - - - 1 4 3 1 Elbow(s) - - - - - - - - 1 - - 1 Forearm(s) - - - - - - - - 4 - - 1
Wrist(s) - - - - - - - - 1 - - -Hand(s) - - - - - - - - 3 4 - 1
Finger(s), fingernail(s) - - - - - - - - - 2 - 1 Hand(s) and finger(s) - - - - - - - - 1 - - -
Multiple upper extremities locations - - - - - - - - 3 3 2 -Hand(s) and arm(s) - - - - - - - - 3 1 1 -Hand(s) and wrist(s) - - - - - - - - - 1 - -Wrist(s) and arm(s) - - - - - - - - - - 1 -
See footnotes at end of table. 232
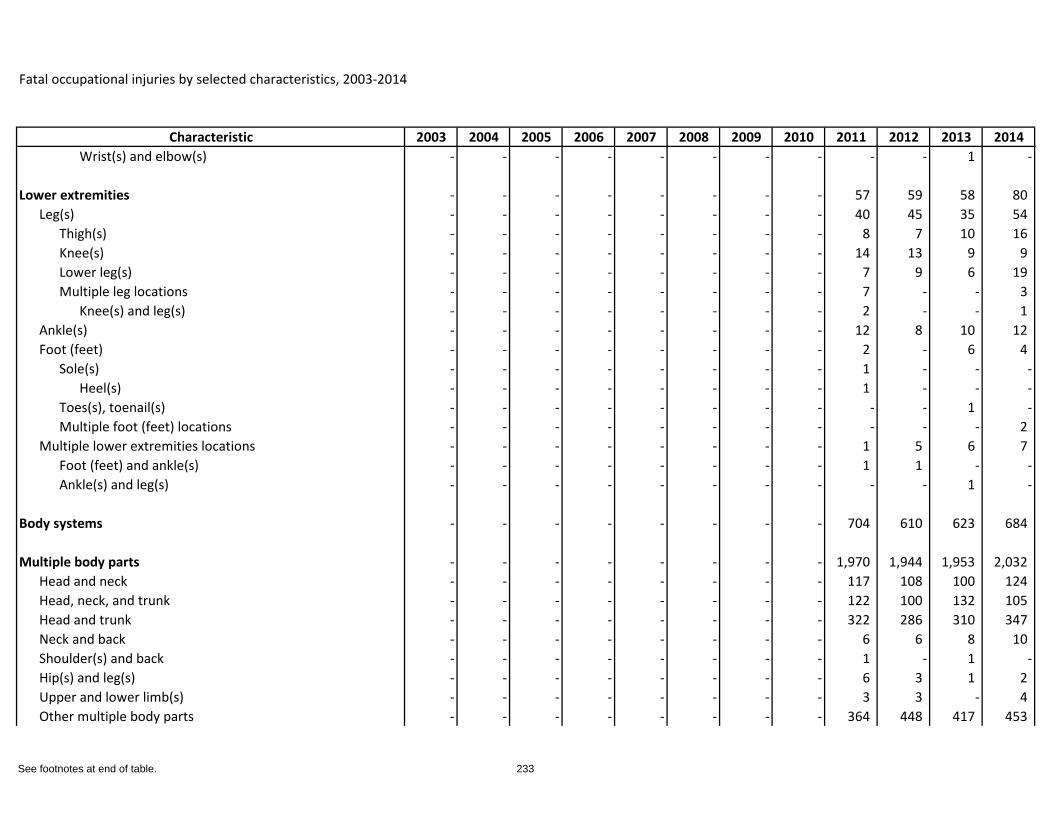
Fatal occupational injuries by selected characteristics, 2003-2014
Characteristic 2003 2004 2005 2006 2007 2008 2009 2010 2011 2012 2013 2014Wrist(s) and elbow(s) - - - - - - - - - - 1 -
Lower extremities - - - - - - - - 57 59 58 80 Leg(s) - - - - - - - - 40 45 35 54
Thigh(s) - - - - - - - - 8 7 10 16 Knee(s) - - - - - - - - 14 13 9 9 Lower leg(s) - - - - - - - - 7 9 6 19 Multiple leg locations - - - - - - - - 7 - - 3
Knee(s) and leg(s) - - - - - - - - 2 - - 1 Ankle(s) - - - - - - - - 12 8 10 12 Foot (feet) - - - - - - - - 2 - 6 4
Sole(s) - - - - - - - - 1 - - -Heel(s) - - - - - - - - 1 - - -
Toes(s), toenail(s) - - - - - - - - - - 1 -Multiple foot (feet) locations - - - - - - - - - - - 2
Multiple lower extremities locations - - - - - - - - 1 5 6 7 Foot (feet) and ankle(s) - - - - - - - - 1 1 - -Ankle(s) and leg(s) - - - - - - - - - - 1 -
Body systems - - - - - - - - 704 610 623 684
Multiple body parts - - - - - - - - 1,970 1,944 1,953 2,032 Head and neck - - - - - - - - 117 108 100 124 Head, neck, and trunk - - - - - - - - 122 100 132 105 Head and trunk - - - - - - - - 322 286 310 347 Neck and back - - - - - - - - 6 6 8 10 Shoulder(s) and back - - - - - - - - 1 - 1 -Hip(s) and leg(s) - - - - - - - - 6 3 1 2 Upper and lower limb(s) - - - - - - - - 3 3 - 4 Other multiple body parts - - - - - - - - 364 448 417 453
See footnotes at end of table. 233
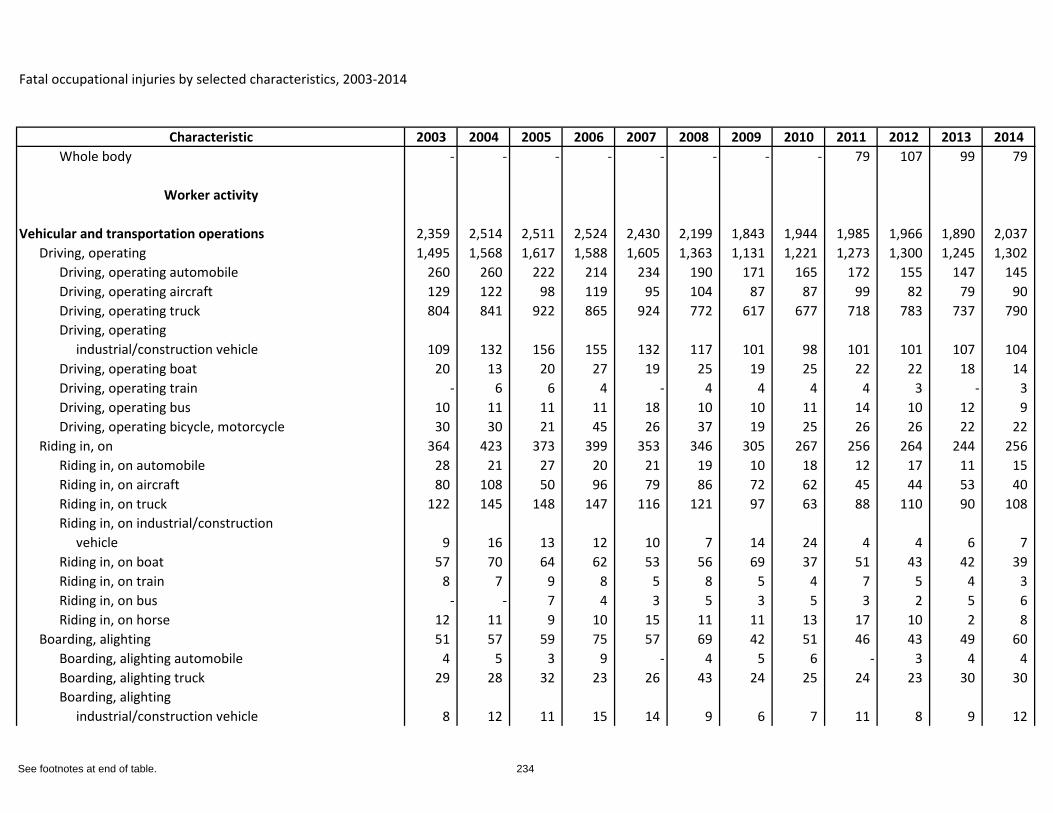
Fatal occupational injuries by selected characteristics, 2003-2014
Characteristic 2003 2004 2005 2006 2007 2008 2009 2010 2011 2012 2013 2014Whole body - - - - - - - - 79 107 99 79
Worker activity
Vehicular and transportation operations 2,359 2,514 2,511 2,524 2,430 2,199 1,843 1,944 1,985 1,966 1,890 2,037 Driving, operating 1,495 1,568 1,617 1,588 1,605 1,363 1,131 1,221 1,273 1,300 1,245 1,302
Driving, operating automobile 260 260 222 214 234 190 171 165 172 155 147 145 Driving, operating aircraft 129 122 98 119 95 104 87 87 99 82 79 90 Driving, operating truck 804 841 922 865 924 772 617 677 718 783 737 790 Driving, operating industrial/construction vehicle 109 132 156 155 132 117 101 98 101 101 107 104 Driving, operating boat 20 13 20 27 19 25 19 25 22 22 18 14 Driving, operating train - 6 6 4 - 4 4 4 4 3 - 3 Driving, operating bus 10 11 11 11 18 10 10 11 14 10 12 9 Driving, operating bicycle, motorcycle 30 30 21 45 26 37 19 25 26 26 22 22
Riding in, on 364 423 373 399 353 346 305 267 256 264 244 256 Riding in, on automobile 28 21 27 20 21 19 10 18 12 17 11 15 Riding in, on aircraft 80 108 50 96 79 86 72 62 45 44 53 40 Riding in, on truck 122 145 148 147 116 121 97 63 88 110 90 108 Riding in, on industrial/construction vehicle 9 16 13 12 10 7 14 24 4 4 6 7 Riding in, on boat 57 70 64 62 53 56 69 37 51 43 42 39 Riding in, on train 8 7 9 8 5 8 5 4 7 5 4 3 Riding in, on bus - - 7 4 3 5 3 5 3 2 5 6 Riding in, on horse 12 11 9 10 15 11 11 13 17 10 2 8
Boarding, alighting 51 57 59 75 57 69 42 51 46 43 49 60 Boarding, alighting automobile 4 5 3 9 - 4 5 6 - 3 4 4 Boarding, alighting truck 29 28 32 23 26 43 24 25 24 23 30 30 Boarding, alighting industrial/construction vehicle 8 12 11 15 14 9 6 7 11 8 9 12
See footnotes at end of table. 234
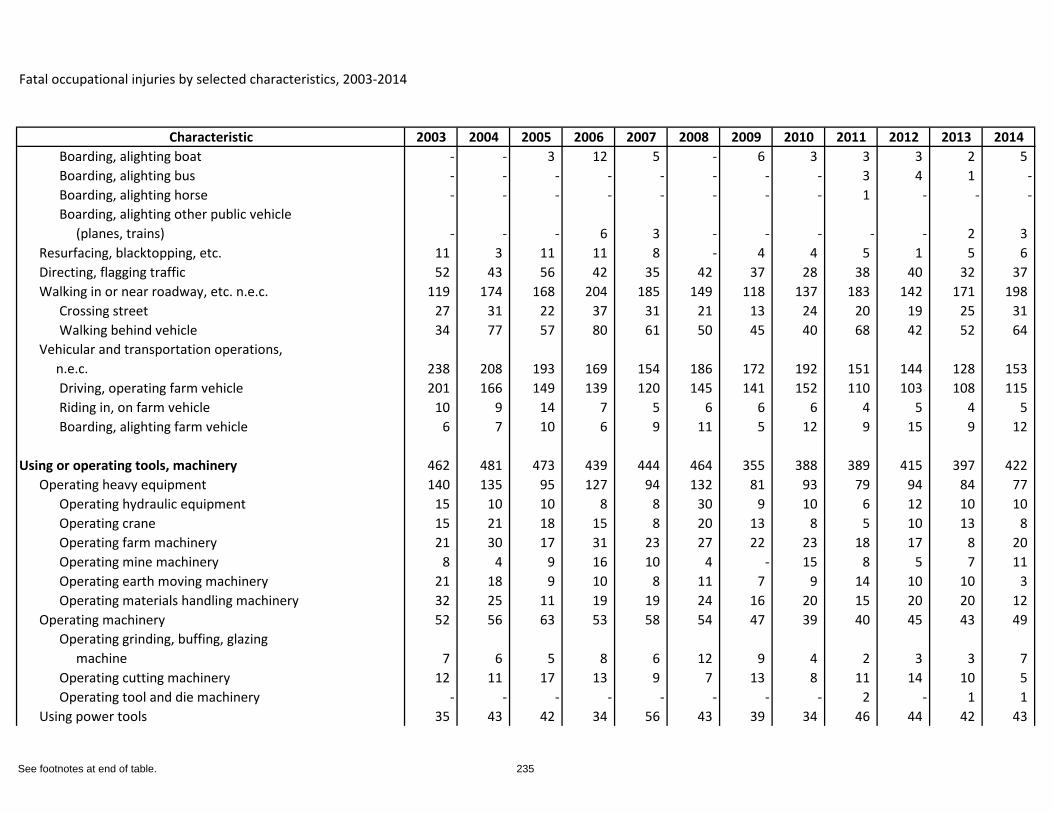
Fatal occupational injuries by selected characteristics, 2003-2014
Characteristic 2003 2004 2005 2006 2007 2008 2009 2010 2011 2012 2013 2014Boarding, alighting boat - - 3 12 5 - 6 3 3 3 2 5 Boarding, alighting bus - - - - - - - - 3 4 1 -Boarding, alighting horse - - - - - - - - 1 - - -Boarding, alighting other public vehicle (planes, trains) - - - 6 3 - - - - - 2 3
Resurfacing, blacktopping, etc. 11 3 11 11 8 - 4 4 5 1 5 6 Directing, flagging traffic 52 43 56 42 35 42 37 28 38 40 32 37 Walking in or near roadway, etc. n.e.c. 119 174 168 204 185 149 118 137 183 142 171 198
Crossing street 27 31 22 37 31 21 13 24 20 19 25 31 Walking behind vehicle 34 77 57 80 61 50 45 40 68 42 52 64
Vehicular and transportation operations, n.e.c. 238 208 193 169 154 186 172 192 151 144 128 153
Driving, operating farm vehicle 201 166 149 139 120 145 141 152 110 103 108 115 Riding in, on farm vehicle 10 9 14 7 5 6 6 6 4 5 4 5 Boarding, alighting farm vehicle 6 7 10 6 9 11 5 12 9 15 9 12
Using or operating tools, machinery 462 481 473 439 444 464 355 388 389 415 397 422 Operating heavy equipment 140 135 95 127 94 132 81 93 79 94 84 77
Operating hydraulic equipment 15 10 10 8 8 30 9 10 6 12 10 10 Operating crane 15 21 18 15 8 20 13 8 5 10 13 8 Operating farm machinery 21 30 17 31 23 27 22 23 18 17 8 20 Operating mine machinery 8 4 9 16 10 4 - 15 8 5 7 11 Operating earth moving machinery 21 18 9 10 8 11 7 9 14 10 10 3 Operating materials handling machinery 32 25 11 19 19 24 16 20 15 20 20 12
Operating machinery 52 56 63 53 58 54 47 39 40 45 43 49 Operating grinding, buffing, glazing machine 7 6 5 8 6 12 9 4 2 3 3 7 Operating cutting machinery 12 11 17 13 9 7 13 8 11 14 10 5 Operating tool and die machinery - - - - - - - - 2 - 1 1
Using power tools 35 43 42 34 56 43 39 34 46 44 42 43
See footnotes at end of table. 235
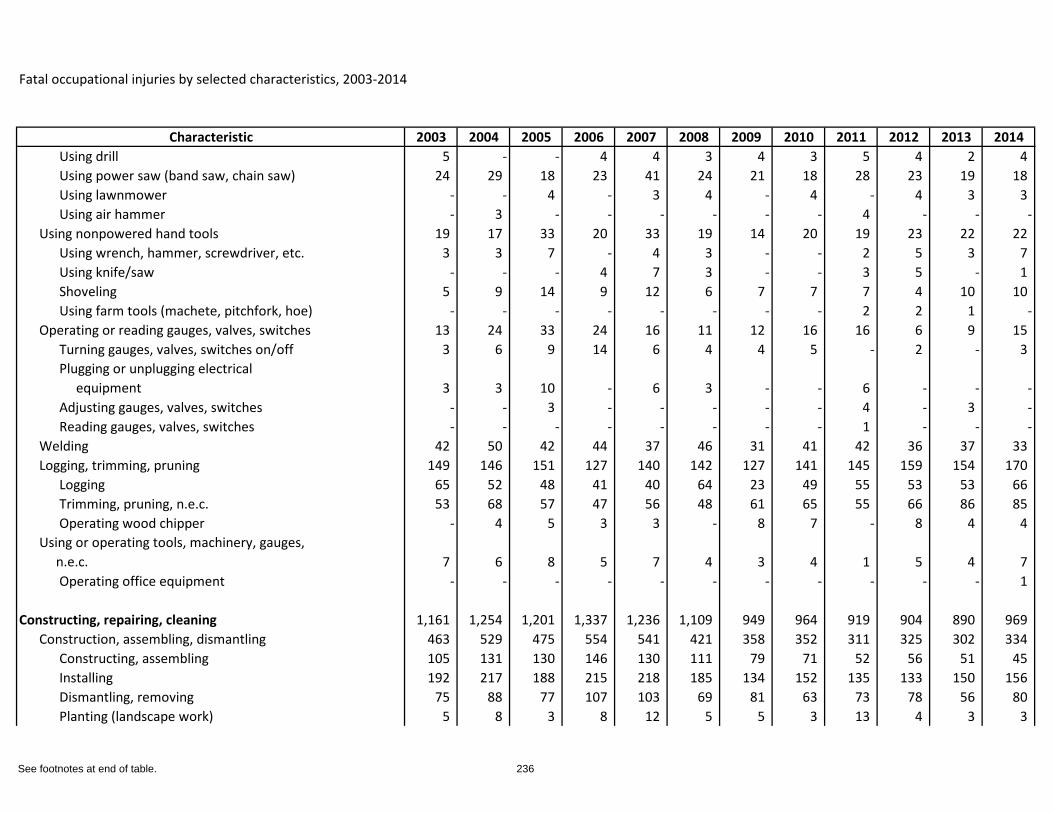
Fatal occupational injuries by selected characteristics, 2003-2014
Characteristic 2003 2004 2005 2006 2007 2008 2009 2010 2011 2012 2013 2014Using drill 5 - - 4 4 3 4 3 5 4 2 4 Using power saw (band saw, chain saw) 24 29 18 23 41 24 21 18 28 23 19 18 Using lawnmower - - 4 - 3 4 - 4 - 4 3 3 Using air hammer - 3 - - - - - - 4 - - -
Using nonpowered hand tools 19 17 33 20 33 19 14 20 19 23 22 22 Using wrench, hammer, screwdriver, etc. 3 3 7 - 4 3 - - 2 5 3 7 Using knife/saw - - - 4 7 3 - - 3 5 - 1 Shoveling 5 9 14 9 12 6 7 7 7 4 10 10 Using farm tools (machete, pitchfork, hoe) - - - - - - - - 2 2 1 -
Operating or reading gauges, valves, switches 13 24 33 24 16 11 12 16 16 6 9 15 Turning gauges, valves, switches on/off 3 6 9 14 6 4 4 5 - 2 - 3 Plugging or unplugging electrical equipment 3 3 10 - 6 3 - - 6 - - -Adjusting gauges, valves, switches - - 3 - - - - - 4 - 3 -Reading gauges, valves, switches - - - - - - - - 1 - - -
Welding 42 50 42 44 37 46 31 41 42 36 37 33 Logging, trimming, pruning 149 146 151 127 140 142 127 141 145 159 154 170
Logging 65 52 48 41 40 64 23 49 55 53 53 66 Trimming, pruning, n.e.c. 53 68 57 47 56 48 61 65 55 66 86 85 Operating wood chipper - 4 5 3 3 - 8 7 - 8 4 4
Using or operating tools, machinery, gauges, n.e.c. 7 6 8 5 7 4 3 4 1 5 4 7
Operating office equipment - - - - - - - - - - - 1
Constructing, repairing, cleaning 1,161 1,254 1,201 1,337 1,236 1,109 949 964 919 904 890 969 Construction, assembling, dismantling 463 529 475 554 541 421 358 352 311 325 302 334
Constructing, assembling 105 131 130 146 130 111 79 71 52 56 51 45 Installing 192 217 188 215 218 185 134 152 135 133 150 156 Dismantling, removing 75 88 77 107 103 69 81 63 73 78 56 80 Planting (landscape work) 5 8 3 8 12 5 5 3 13 4 3 3
See footnotes at end of table. 236
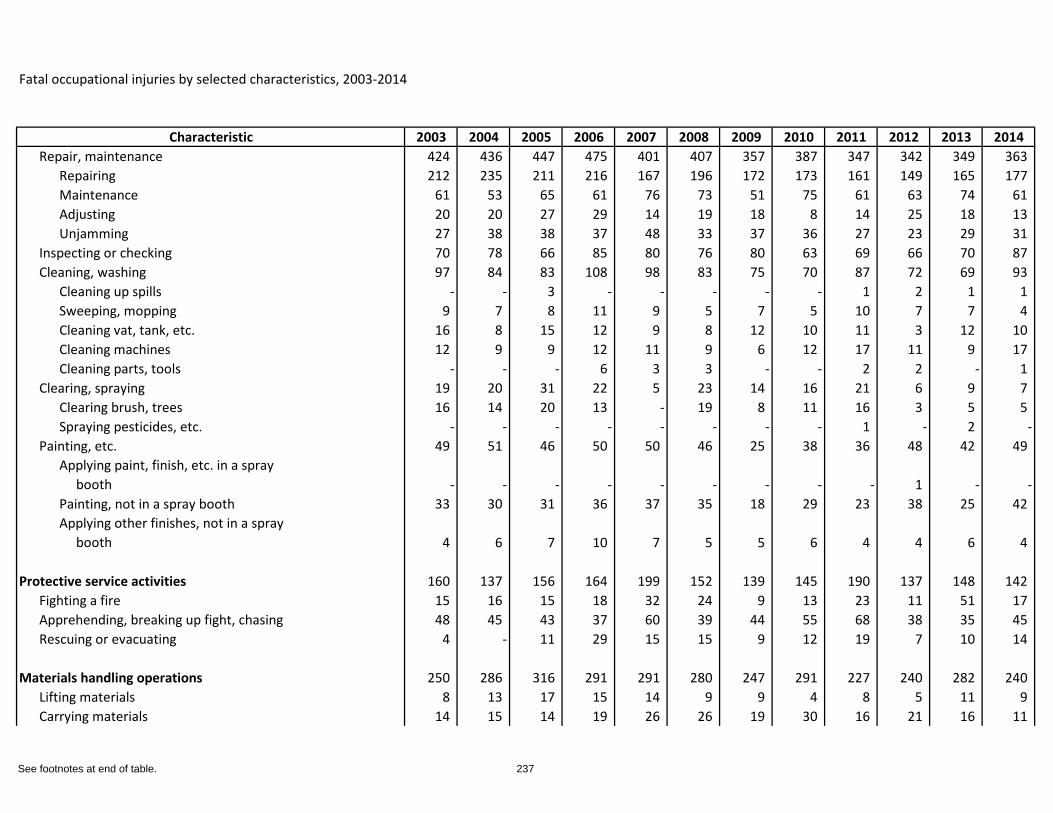
Fatal occupational injuries by selected characteristics, 2003-2014
Characteristic 2003 2004 2005 2006 2007 2008 2009 2010 2011 2012 2013 2014Repair, maintenance 424 436 447 475 401 407 357 387 347 342 349 363
Repairing 212 235 211 216 167 196 172 173 161 149 165 177 Maintenance 61 53 65 61 76 73 51 75 61 63 74 61 Adjusting 20 20 27 29 14 19 18 8 14 25 18 13 Unjamming 27 38 38 37 48 33 37 36 27 23 29 31
Inspecting or checking 70 78 66 85 80 76 80 63 69 66 70 87 Cleaning, washing 97 84 83 108 98 83 75 70 87 72 69 93
Cleaning up spills - - 3 - - - - - 1 2 1 1 Sweeping, mopping 9 7 8 11 9 5 7 5 10 7 7 4 Cleaning vat, tank, etc. 16 8 15 12 9 8 12 10 11 3 12 10 Cleaning machines 12 9 9 12 11 9 6 12 17 11 9 17 Cleaning parts, tools - - - 6 3 3 - - 2 2 - 1
Clearing, spraying 19 20 31 22 5 23 14 16 21 6 9 7 Clearing brush, trees 16 14 20 13 - 19 8 11 16 3 5 5 Spraying pesticides, etc. - - - - - - - - 1 - 2 -
Painting, etc. 49 51 46 50 50 46 25 38 36 48 42 49 Applying paint, finish, etc. in a spray booth - - - - - - - - - 1 - -Painting, not in a spray booth 33 30 31 36 37 35 18 29 23 38 25 42 Applying other finishes, not in a spray booth 4 6 7 10 7 5 5 6 4 4 6 4
Protective service activities 160 137 156 164 199 152 139 145 190 137 148 142 Fighting a fire 15 16 15 18 32 24 9 13 23 11 51 17 Apprehending, breaking up fight, chasing 48 45 43 37 60 39 44 55 68 38 35 45 Rescuing or evacuating 4 - 11 29 15 15 9 12 19 7 10 14
Materials handling operations 250 286 316 291 291 280 247 291 227 240 282 240 Lifting materials 8 13 17 15 14 9 9 4 8 5 11 9 Carrying materials 14 15 14 19 26 26 19 30 16 21 16 11
See footnotes at end of table. 237
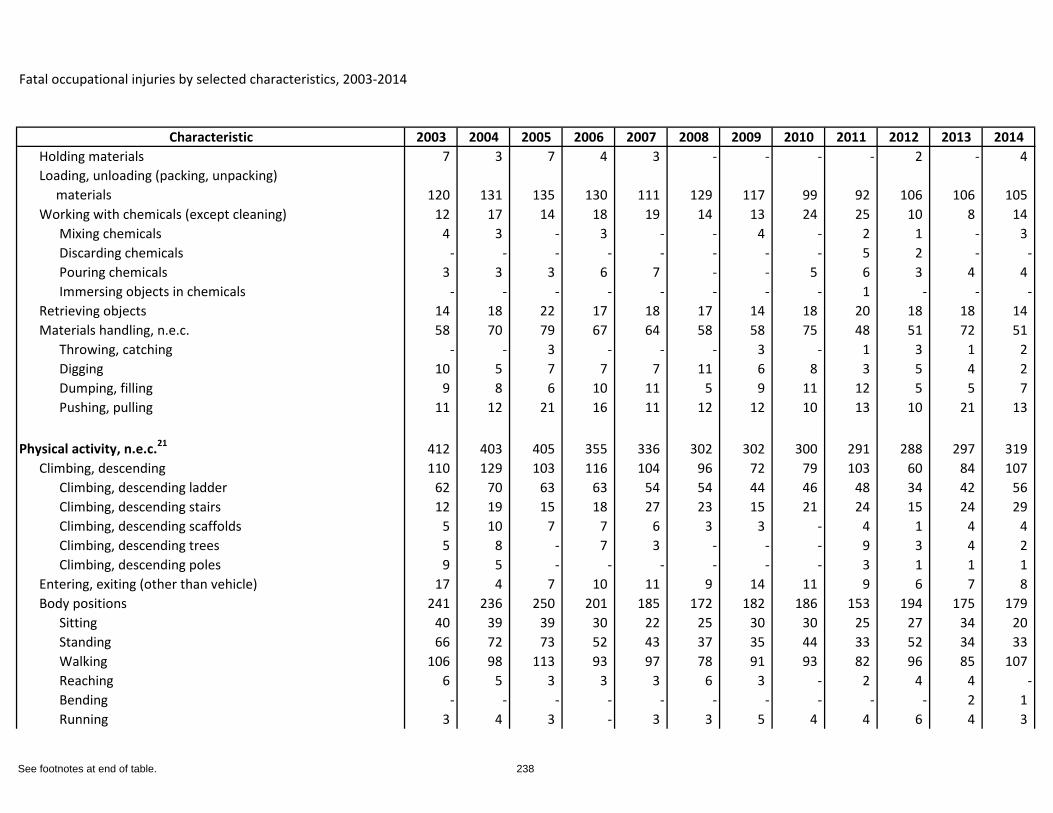
Fatal occupational injuries by selected characteristics, 2003-2014
Characteristic 2003 2004 2005 2006 2007 2008 2009 2010 2011 2012 2013 2014Holding materials 7 3 7 4 3 - - - - 2 - 4 Loading, unloading (packing, unpacking) materials 120 131 135 130 111 129 117 99 92 106 106 105 Working with chemicals (except cleaning) 12 17 14 18 19 14 13 24 25 10 8 14
Mixing chemicals 4 3 - 3 - - 4 - 2 1 - 3 Discarding chemicals - - - - - - - - 5 2 - -Pouring chemicals 3 3 3 6 7 - - 5 6 3 4 4 Immersing objects in chemicals - - - - - - - - 1 - - -
Retrieving objects 14 18 22 17 18 17 14 18 20 18 18 14 Materials handling, n.e.c. 58 70 79 67 64 58 58 75 48 51 72 51
Throwing, catching - - 3 - - - 3 - 1 3 1 2 Digging 10 5 7 7 7 11 6 8 3 5 4 2 Dumping, filling 9 8 6 10 11 5 9 11 12 5 5 7 Pushing, pulling 11 12 21 16 11 12 12 10 13 10 21 13
Physical activity, n.e.c.21 412 403 405 355 336 302 302 300 291 288 297 319 Climbing, descending 110 129 103 116 104 96 72 79 103 60 84 107
Climbing, descending ladder 62 70 63 63 54 54 44 46 48 34 42 56 Climbing, descending stairs 12 19 15 18 27 23 15 21 24 15 24 29 Climbing, descending scaffolds 5 10 7 7 6 3 3 - 4 1 4 4 Climbing, descending trees 5 8 - 7 3 - - - 9 3 4 2 Climbing, descending poles 9 5 - - - - - - 3 1 1 1
Entering, exiting (other than vehicle) 17 4 7 10 11 9 14 11 9 6 7 8 Body positions 241 236 250 201 185 172 182 186 153 194 175 179
Sitting 40 39 39 30 22 25 30 30 25 27 34 20 Standing 66 72 73 52 43 37 35 44 33 52 34 33 Walking 106 98 113 93 97 78 91 93 82 96 85 107 Reaching 6 5 3 3 3 6 3 - 2 4 4 -Bending - - - - - - - - - - 2 1 Running 3 4 3 - 3 3 5 4 4 6 4 3
See footnotes at end of table. 238
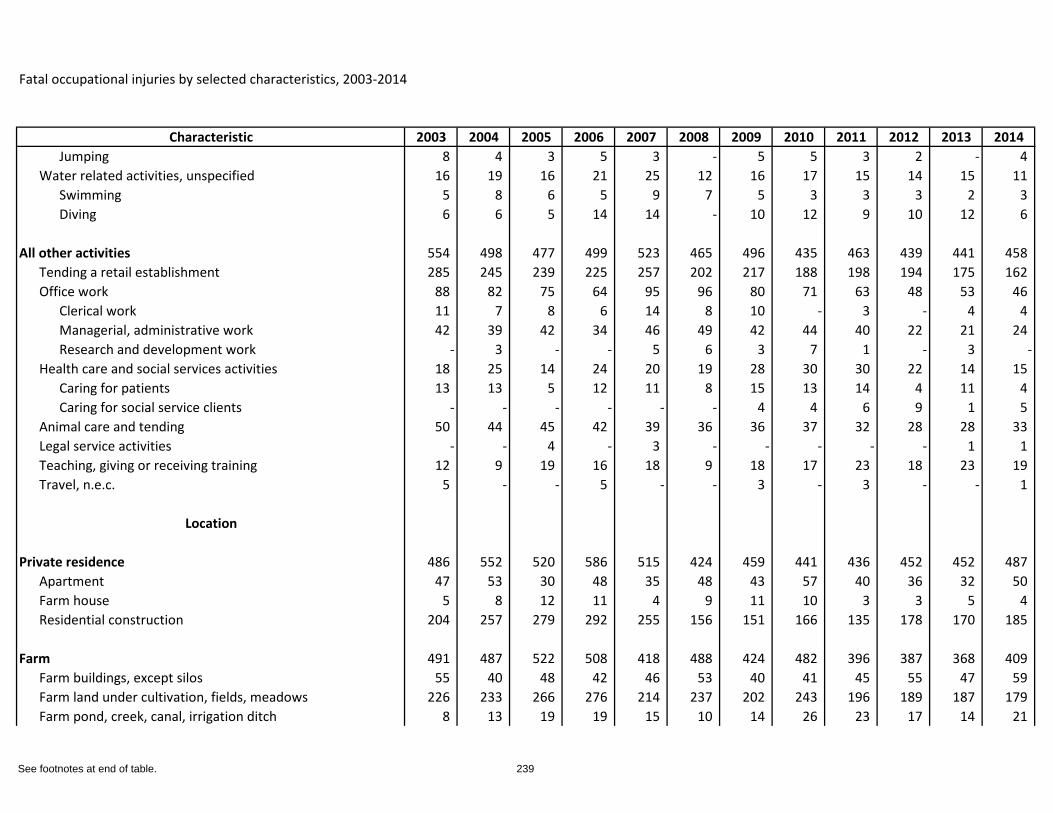
Fatal occupational injuries by selected characteristics, 2003-2014
Characteristic 2003 2004 2005 2006 2007 2008 2009 2010 2011 2012 2013 2014Jumping 8 4 3 5 3 - 5 5 3 2 - 4
Water related activities, unspecified 16 19 16 21 25 12 16 17 15 14 15 11 Swimming 5 8 6 5 9 7 5 3 3 3 2 3 Diving 6 6 5 14 14 - 10 12 9 10 12 6
All other activities 554 498 477 499 523 465 496 435 463 439 441 458 Tending a retail establishment 285 245 239 225 257 202 217 188 198 194 175 162 Office work 88 82 75 64 95 96 80 71 63 48 53 46
Clerical work 11 7 8 6 14 8 10 - 3 - 4 4 Managerial, administrative work 42 39 42 34 46 49 42 44 40 22 21 24 Research and development work - 3 - - 5 6 3 7 1 - 3 -
Health care and social services activities 18 25 14 24 20 19 28 30 30 22 14 15 Caring for patients 13 13 5 12 11 8 15 13 14 4 11 4 Caring for social service clients - - - - - - 4 4 6 9 1 5
Animal care and tending 50 44 45 42 39 36 36 37 32 28 28 33 Legal service activities - - 4 - 3 - - - - - 1 1 Teaching, giving or receiving training 12 9 19 16 18 9 18 17 23 18 23 19 Travel, n.e.c. 5 - - 5 - - 3 - 3 - - 1
Location
Private residence 486 552 520 586 515 424 459 441 436 452 452 487 Apartment 47 53 30 48 35 48 43 57 40 36 32 50 Farm house 5 8 12 11 4 9 11 10 3 3 5 4 Residential construction 204 257 279 292 255 156 151 166 135 178 170 185
Farm 491 487 522 508 418 488 424 482 396 387 368 409 Farm buildings, except silos 55 40 48 42 46 53 40 41 45 55 47 59 Farm land under cultivation, fields, meadows 226 233 266 276 214 237 202 243 196 189 187 179 Farm pond, creek, canal, irrigation ditch 8 13 19 19 15 10 14 26 23 17 14 21
See footnotes at end of table. 239
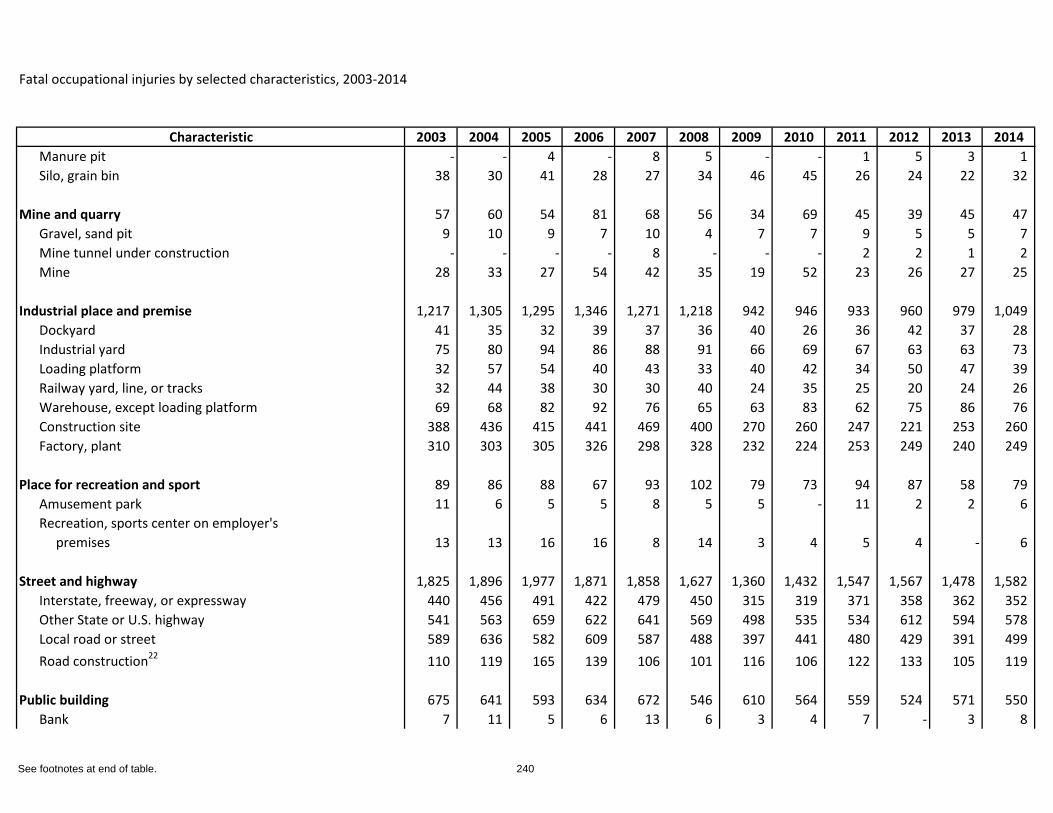
Fatal occupational injuries by selected characteristics, 2003-2014
Characteristic 2003 2004 2005 2006 2007 2008 2009 2010 2011 2012 2013 2014Manure pit - - 4 - 8 5 - - 1 5 3 1 Silo, grain bin 38 30 41 28 27 34 46 45 26 24 22 32
Mine and quarry 57 60 54 81 68 56 34 69 45 39 45 47 Gravel, sand pit 9 10 9 7 10 4 7 7 9 5 5 7 Mine tunnel under construction - - - - 8 - - - 2 2 1 2 Mine 28 33 27 54 42 35 19 52 23 26 27 25
Industrial place and premise 1,217 1,305 1,295 1,346 1,271 1,218 942 946 933 960 979 1,049 Dockyard 41 35 32 39 37 36 40 26 36 42 37 28 Industrial yard 75 80 94 86 88 91 66 69 67 63 63 73 Loading platform 32 57 54 40 43 33 40 42 34 50 47 39 Railway yard, line, or tracks 32 44 38 30 30 40 24 35 25 20 24 26 Warehouse, except loading platform 69 68 82 92 76 65 63 83 62 75 86 76 Construction site 388 436 415 441 469 400 270 260 247 221 253 260 Factory, plant 310 303 305 326 298 328 232 224 253 249 240 249
Place for recreation and sport 89 86 88 67 93 102 79 73 94 87 58 79 Amusement park 11 6 5 5 8 5 5 - 11 2 2 6 Recreation, sports center on employer's premises 13 13 16 16 8 14 3 4 5 4 - 6
Street and highway 1,825 1,896 1,977 1,871 1,858 1,627 1,360 1,432 1,547 1,567 1,478 1,582 Interstate, freeway, or expressway 440 456 491 422 479 450 315 319 371 358 362 352 Other State or U.S. highway 541 563 659 622 641 569 498 535 534 612 594 578 Local road or street 589 636 582 609 587 488 397 441 480 429 391 499 Road construction22 110 119 165 139 106 101 116 106 122 133 105 119
Public building 675 641 593 634 672 546 610 564 559 524 571 550 Bank 7 11 5 6 13 6 3 4 7 - 3 8
See footnotes at end of table. 240
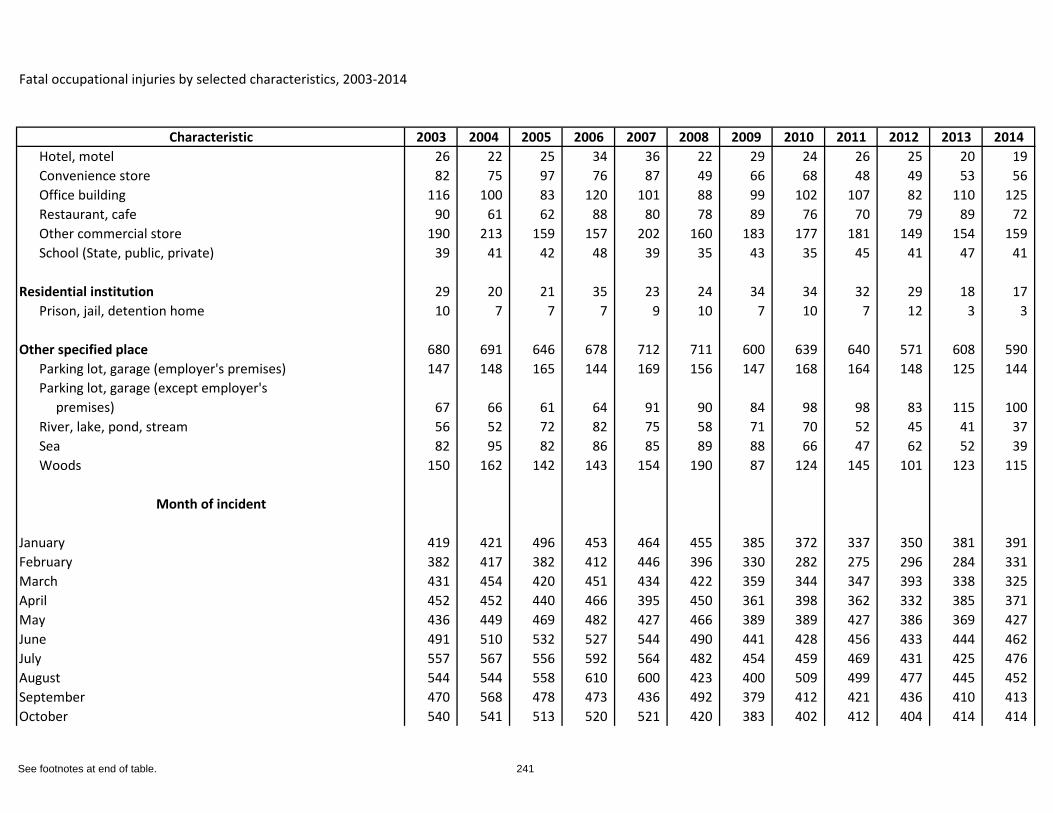
Fatal occupational injuries by selected characteristics, 2003-2014
Characteristic 2003 2004 2005 2006 2007 2008 2009 2010 2011 2012 2013 2014Hotel, motel 26 22 25 34 36 22 29 24 26 25 20 19 Convenience store 82 75 97 76 87 49 66 68 48 49 53 56 Office building 116 100 83 120 101 88 99 102 107 82 110 125 Restaurant, cafe 90 61 62 88 80 78 89 76 70 79 89 72 Other commercial store 190 213 159 157 202 160 183 177 181 149 154 159 School (State, public, private) 39 41 42 48 39 35 43 35 45 41 47 41
Residential institution 29 20 21 35 23 24 34 34 32 29 18 17 Prison, jail, detention home 10 7 7 7 9 10 7 10 7 12 3 3
Other specified place 680 691 646 678 712 711 600 639 640 571 608 590 Parking lot, garage (employer's premises) 147 148 165 144 169 156 147 168 164 148 125 144 Parking lot, garage (except employer's premises) 67 66 61 64 91 90 84 98 98 83 115 100 River, lake, pond, stream 56 52 72 82 75 58 71 70 52 45 41 37 Sea 82 95 82 86 85 89 88 66 47 62 52 39 Woods 150 162 142 143 154 190 87 124 145 101 123 115
Month of incident
January 419 421 496 453 464 455 385 372 337 350 381 391 February 382 417 382 412 446 396 330 282 275 296 284 331 March 431 454 420 451 434 422 359 344 347 393 338 325 April 452 452 440 466 395 450 361 398 362 332 385 371 May 436 449 469 482 427 466 389 389 427 386 369 427 June 491 510 532 527 544 490 441 428 456 433 444 462 July 557 567 556 592 564 482 454 459 469 431 425 476 August 544 544 558 610 600 423 400 509 499 477 445 452 September 470 568 478 473 436 492 379 412 421 436 410 413 October 540 541 513 520 521 420 383 402 412 404 414 414
See footnotes at end of table. 241
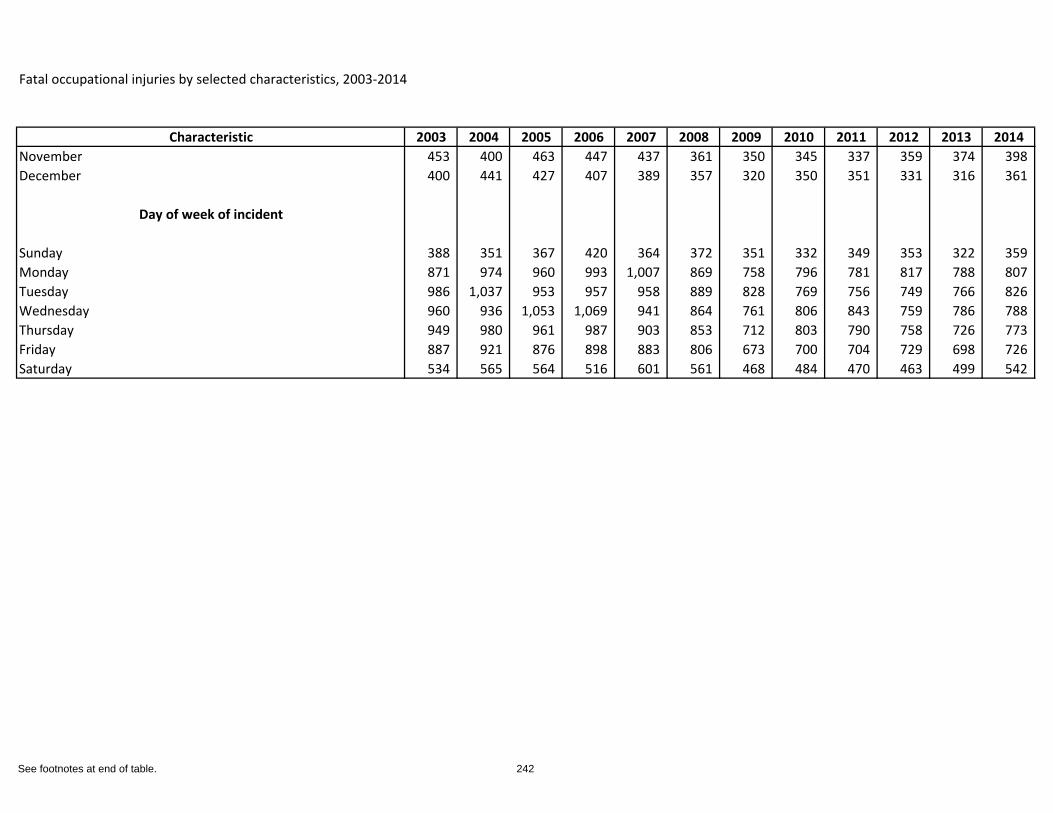
Fatal occupational injuries by selected characteristics, 2003-2014
Characteristic 2003 2004 2005 2006 2007 2008 2009 2010 2011 2012 2013 2014November 453 400 463 447 437 361 350 345 337 359 374 398 December 400 441 427 407 389 357 320 350 351 331 316 361
Day of week of incident
Sunday 388 351 367 420 364 372 351 332 349 353 322 359 Monday 871 974 960 993 1,007 869 758 796 781 817 788 807 Tuesday 986 1,037 953 957 958 889 828 769 756 749 766 826 Wednesday 960 936 1,053 1,069 941 864 761 806 843 759 786 788 Thursday 949 980 961 987 903 853 712 803 790 758 726 773 Friday 887 921 876 898 883 806 673 700 704 729 698 726 Saturday 534 565 564 516 601 561 468 484 470 463 499 542
See footnotes at end of table. 242
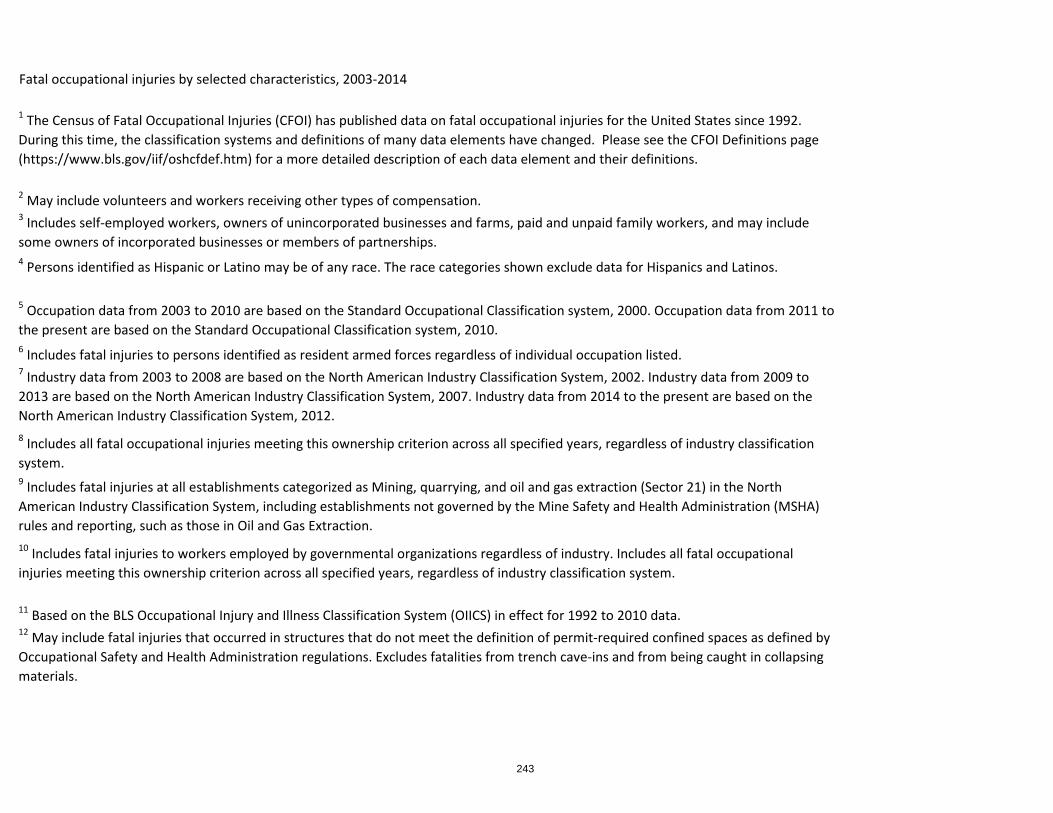
Fatal occupational injuries by selected characteristics, 2003-2014
1 The Census of Fatal Occupational Injuries (CFOI) has published data on fatal occupational injuries for the United States since 1992. During this time, the classification systems and definitions of many data elements have changed. Please see the CFOI Definitions page (https://www.bls.gov/iif/oshcfdef.htm) for a more detailed description of each data element and their definitions.
2 May include volunteers and workers receiving other types of compensation.3 Includes self-employed workers, owners of unincorporated businesses and farms, paid and unpaid family workers, and may include some owners of incorporated businesses or members of partnerships.4 Persons identified as Hispanic or Latino may be of any race. The race categories shown exclude data for Hispanics and Latinos.
5 Occupation data from 2003 to 2010 are based on the Standard Occupational Classification system, 2000. Occupation data from 2011 to the present are based on the Standard Occupational Classification system, 2010.6 Includes fatal injuries to persons identified as resident armed forces regardless of individual occupation listed.7 Industry data from 2003 to 2008 are based on the North American Industry Classification System, 2002. Industry data from 2009 to 2013 are based on the North American Industry Classification System, 2007. Industry data from 2014 to the present are based on the North American Industry Classification System, 2012.8 Includes all fatal occupational injuries meeting this ownership criterion across all specified years, regardless of industry classification system.9 Includes fatal injuries at all establishments categorized as Mining, quarrying, and oil and gas extraction (Sector 21) in the North American Industry Classification System, including establishments not governed by the Mine Safety and Health Administration (MSHA) rules and reporting, such as those in Oil and Gas Extraction.10 Includes fatal injuries to workers employed by governmental organizations regardless of industry. Includes all fatal occupational injuries meeting this ownership criterion across all specified years, regardless of industry classification system.
11 Based on the BLS Occupational Injury and Illness Classification System (OIICS) in effect for 1992 to 2010 data.12 May include fatal injuries that occurred in structures that do not meet the definition of permit-required confined spaces as defined by Occupational Safety and Health Administration regulations. Excludes fatalities from trench cave-ins and from being caught in collapsing materials.
243
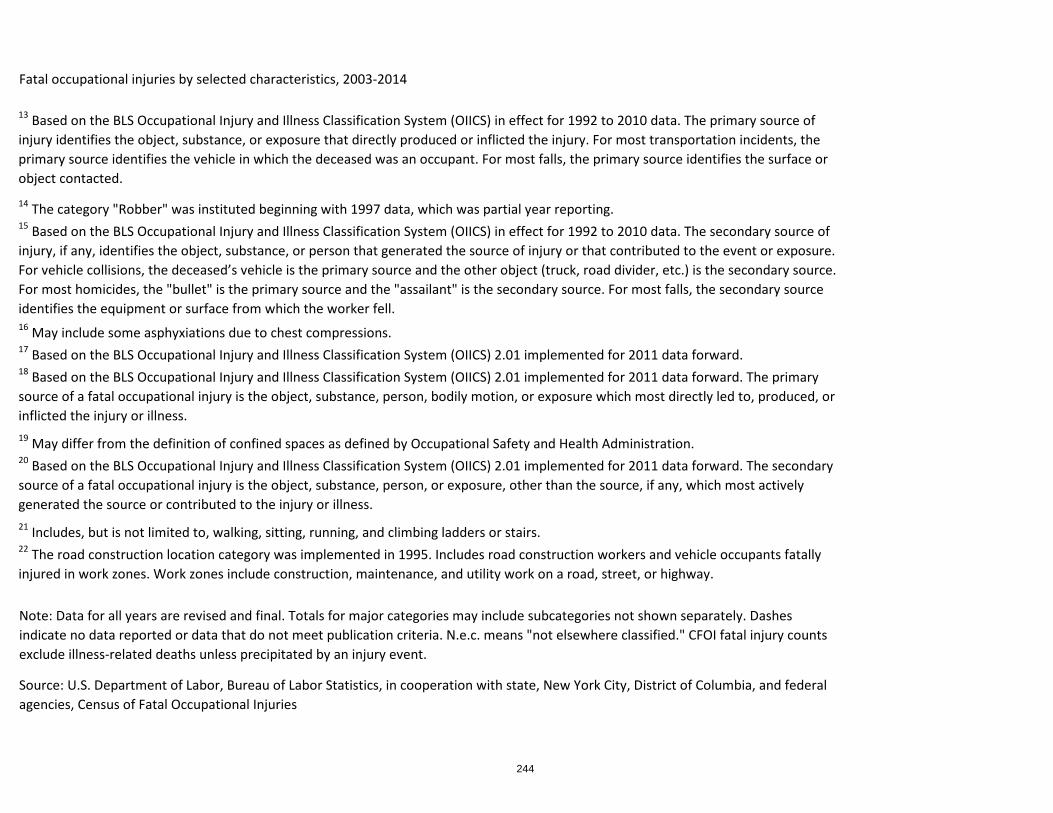
Fatal occupational injuries by selected characteristics, 2003-2014
13 Based on the BLS Occupational Injury and Illness Classification System (OIICS) in effect for 1992 to 2010 data. The primary source of injury identifies the object, substance, or exposure that directly produced or inflicted the injury. For most transportation incidents, the primary source identifies the vehicle in which the deceased was an occupant. For most falls, the primary source identifies the surface or object contacted.
14 The category "Robber" was instituted beginning with 1997 data, which was partial year reporting.15 Based on the BLS Occupational Injury and Illness Classification System (OIICS) in effect for 1992 to 2010 data. The secondary source of injury, if any, identifies the object, substance, or person that generated the source of injury or that contributed to the event or exposure. For vehicle collisions, the deceased’s vehicle is the primary source and the other object (truck, road divider, etc.) is the secondary source. For most homicides, the "bullet" is the primary source and the "assailant" is the secondary source. For most falls, the secondary source identifies the equipment or surface from which the worker fell.16 May include some asphyxiations due to chest compressions.17 Based on the BLS Occupational Injury and Illness Classification System (OIICS) 2.01 implemented for 2011 data forward.18 Based on the BLS Occupational Injury and Illness Classification System (OIICS) 2.01 implemented for 2011 data forward. The primary source of a fatal occupational injury is the object, substance, person, bodily motion, or exposure which most directly led to, produced, or inflicted the injury or illness.19 May differ from the definition of confined spaces as defined by Occupational Safety and Health Administration.20 Based on the BLS Occupational Injury and Illness Classification System (OIICS) 2.01 implemented for 2011 data forward. The secondary source of a fatal occupational injury is the object, substance, person, or exposure, other than the source, if any, which most actively generated the source or contributed to the injury or illness.21 Includes, but is not limited to, walking, sitting, running, and climbing ladders or stairs.22 The road construction location category was implemented in 1995. Includes road construction workers and vehicle occupants fatally injured in work zones. Work zones include construction, maintenance, and utility work on a road, street, or highway.
Note: Data for all years are revised and final. Totals for major categories may include subcategories not shown separately. Dashes indicate no data reported or data that do not meet publication criteria. N.e.c. means "not elsewhere classified." CFOI fatal injury counts exclude illness-related deaths unless precipitated by an injury event.
Source: U.S. Department of Labor, Bureau of Labor Statistics, in cooperation with state, New York City, District of Columbia, and federal agencies, Census of Fatal Occupational Injuries
244


![The Institutional Worker...The Hospital, Sospital, Juno June 15, 1918.] THE INSTITUTIONAL WORKER Being a Special Supplement to "The Hospital OUR BUREAU OF INFORMATION. URGENT NOTICE](https://img.pdfslide.net/doc/110x75/5fe059b23db6df2d83062cec/the-institutional-worker-the-hospital-sospital-juno-june-15-1918-the-institutional.jpg)