Embed Size (px)
Citation preview
Veterinarni Medicina, 56, 2011 (1): 35–47 Original Paper
35
Altered Na+/K+-ATPase expression plays a role in rumen epithelium adaptation in sheep fed hay ad libitum or a mixed hay/concentrate diet
J. Kuzinski1, R. Zitnan2, T. Viergutz3, J. Legath4, M. Schweigel1
1Research Unit Nutritional Physiology “Oskar Kellner”, Leibniz Institute for Farm Animal Biology (FBN), Dummerstorf, Germany
2Animal Production Research Centre Nitra, Institute of Nutrition, Division Kosice, Slovak Republic
3Research Unit Reproductive Biology, Leibniz Institute for Farm Animal Biology (FBN), Dummerstorf, Germany
4University of Veterinary Medicine and Pharmacy, Kosice, Slovak Republic
ABSTRACT: In this study we investigated rumen papillae morphology and the localization and expression of the Na+/K+-ATPase in eight sheep fed hay ad libitum (h) or hay ad libitum plus additional concentrate (h/c). Four sheep were provided with the ad libitum h-diet for the complete three-week experimental period. The second group of four sheep received the h-diet for only one week and was fed the mixed hay/concentrate (h/c) diet for another two weeks. The amount of concentrate supplement was stepwise increased from 150 to 1000 g/day and given in two meals. Following slaughter rumen papillae from the atrium ruminis (AR), the rumen ventralis (RV) and the ventral blind sac (BSV) were fixed and examined for morphological changes and Na+/K+-ATPase localization by morphometric methods and immunohistochemistry. Ruminal epithelial cells (REC) originating from the strata basale to granu-losum were also isolated. Cellular Na+/K+-ATPase expression (mRNA and protein) and differentiation state were determined by RT-PCR, Western blot, and flow cytometry. Compared with data from h-fed sheep, morphometric analysis revealed an increased length and width of rumen papillae in h/c-fed sheep, resulting in a marked 41% and 62% increase in rumen papillae surface in AR and RV, respectively. The rumen mucosa of h/c-fed sheep was char-acterized by a predominant stratum corneum (42 ± 0.7 µm vs. 28 ± 0.5 µm), but the thickness of the metabolically active cell layers remained unchanged. REC suspensions from sheep fed the h/c diet generally contained more cells (7.30 ± 0.83 vs. 3.49 ± 0.52 × 10⁷/ml; P < 0.001) and an increased proportion of REC positive for basal cytokeratin and for the differentiation marker cytokeratin 10 (P < 0.05). Cellular (cell membrane) and epithelial (stratum basale to stratum granulosum) Na+/K+-ATPase localization was similar between rumen regions and was not changed by concentrate feeding. After two weeks on the h/c-diet, a 96% increase in the absolute number of Na+/K+-ATPase-positive REC (6.56 ± 0.84 vs. 3.35 ± 0.51 × 10⁷/ml; P = 0.003) and a 61% elevation (P = 0.043) in Na+/K+-ATPase protein expression in REC from the upper third of the suprabasal cell layers were found. Moreover, a two-fold (P = 0.001) elevation in cell membrane surface area accompanied by a reduction (1.19 × 10⁻⁷ ± 1.72 × 10⁻⁹ arbitrary units (AU)/cm2 vs. 1.73 × 10⁻⁷ ± 8.16 × 10⁻⁹ AU/cm2 in the h-group; P < 0.001) in specific Na+/K+-ATPase fluorescence per cm2 of cell membrane surface area was observed after h/c-feeding. Na+/K+-ATPase α subunit mRNA expression was also reduced (P < 0.0001) from 0.154 ± 0.013 to 0.057 ± 0.004 pg per pg S18 mRNA control in the h/c-compared with the h-group. Thus, the h/c-diet led to a rapid increase in REC number and total cell membrane surface area in metabolically active and resorptive cell layers and was accompanied by a reduction in Na+/K+-ATPase mRNA expression and abundance per cell membrane surface area.
Keywords: sheep; rumen epithelial cells; transport protein; ruminal mucosa morphology; metabolizable energy
This study was supported by the DFG – Deutsche Forschungsgemeinschaft (Grant No. SCHW 642/5-2).
Original Paper Veterinarni Medicina, 56, 2011 (1): 35–47
36
In ruminants, the forestomach, particularly the rumen, is responsible for a larger part of nutri-ent and electrolyte absorption. About 65% to 85% of the short-chain fatty acids (SCFA) produced by intraruminal carbohydrate fermentation are absorbed across the rumen epithelium which is also known to be the main site of Na+ and Mg2+ uptake (Dobson, 1959; Pfeffer and Rahman, 1974; Remond et al., 1995). The transport capacity of the rumen epithelium for these substrates is known to increase markedly with higher levels of metabo-lizable energy (ME) intake and feeding of high-concentrate rations (Gaebel et al., 1987; Sehested et al., 1997; Uppal et al., 2003; Shen et al., 2004; Etschmann et al., 2009). Higher transport rates are thought to result from well-described morpholog-ical transformations (Dirksen et al., 1984) leading to a size increase in the rumen epithelium papillae and consequently to an enlargement of the avail-able absorptive surface area (Liebich et al., 1987; Shen et al., 2004). In addition, early functional adaptation processes involving the altered activity and/or expression of cellular transport proteins have been described (Storeheier et al., 2003; Uppal et al., 2003; Shen et al., 2004; Etschmann et al., 2009). In accordance with a specific role for ac-tive transport proteins in rumen epithelial adapta-tion, a significant enhancement of Na+/K+-ATPase activity by concentrate feeding has been found (Kristensen et al., 1995; McLeod and Baldwin, 2000). The Na+/K+-ATPase is a key transport element required for the establishment of elec-trochemical gradients driving cellular transport and substrate flow across epithelia (Zouzoulas et al., 2005). The Na+-motive force generated by the Na+/K+-ATPase is essential for the absorption of sodium (Ferreira et al., 1966; Harrison et al., 1975) and is indirectly related to SCFA transport via the Na+/H+ exchanger (NHE) (Sehested et al., 1996). In addition, the enzyme is involved in basic proc-esses such as cell maintenance and proliferation (Burke et al., 1991). In the rumen epithelium, a Na+/K+-ATPase is expressed at extremely high lev-els (Kristensen et al., 1995; Hansen 1998; Graham and Simmons, 2005; Albrecht et al., 2008). Its ac-
tivity accounts for ~22–25% of rumen O2 and, con-sequently, ATP utilization (Kelly et al., 1993).
We hypothesize that feed-induced changes in Na+/K+-ATPase expression and/or activity are a major component of the functional adaptation of the rumen epithelium to a high-energy diet. Therefore, using isolated rumen epithelial cells (REC), we have analyzed the mRNA and protein expression of ruminal Na+/K+-ATPase in sheep fed hay ad libitum only or a mixed hay/concentrate diet for two weeks. In addition, the cellular and epithelial localization of the Na+/K+-ATPase and the feed-induced morphological alterations in the epithelium were monitored in three rumen regions (AR, RV, BSV) by immunohistochemistry and mor-phometric analysis.
MATERIAL AND METHODS
Materials
Trypsin, glutamine, antibiotics (penicillin-strep-tomycin), fetal calf serum (FCS) and Dulbecco’s phosphate-buffered saline (DPBS) were purchased from PAN Biotech (Aidenbach, Germany). All chemicals for Western blot analysis were purchased from Carl Roth (Karlsruhe, Germany).
Antibodies
The monoclonal mouse antibody used in this study is specific for the α subunit of sheep Na+/K+-ATPase (M7-PB-E9, Affinity Bioreagents) and has been shown to detect the sheep protein specifically (Albrecht et al., 2008). Mouse monoclonal anti-cy-tokeratin 10 [DE-K10] and anti-basal cell cytokera-tin [RCK103] antibodies were obtained from abcam (Cambridge, UK). Relevant secondary antibodies conjugated to Alexa Fluor 488 (Invitrogen) or FITC (Abcam, Cambridge, UK) were used for flow cy-tometry and immunohistochemistry, respectively. For Western analysis of Na+/K+-ATPase expression, we employed a horseradish peroxidase (HRP)-
List of abbreviations: AR = atrium ruminis, AU = arbitrary units, BSV = ventral blind sac; h = diet hay ad libitum diet, h/c = diet hay ad libitum plus additional concentrate, ME = metabolizable energy, PBS = phosphate-buffered saline, REC = rumen epithelial cells, RV = rumen ventralis, SCFA = short chain fatty acids, SC = stratum corneum, SB = stratum basale, SG = stratum granulosum
Veterinarni Medicina, 56, 2011 (1): 35–47 Original Paper
37
conjugated antibody (ECLTM sheep Anti-mouse) obtained from Amersham Bioscience.
Animals and experimental design
Eight six month-old male castrated lambs were fed meadow hay ad libitum for one week. Thereafter, the animals were divided into two groups of four sheep. The control group received meadow hay ad libitum for another two weeks (h), and the second group was fed with a mixed meadow hay ad libi-tum/concentrate (h/c) diet over the same time pe-riod. The amount of the concentrate was stepwise increased from 150–1000 g/day and was given in two meals at 7 am and 2 pm. The chemical composi-tion of the concentrate is shown in Table 1. Water was available ad libitum.
Sample preparation
Tissue preparation. Samples were excised from the rumen of sheep within 10 min of slaughter. Tissue pieces of at least 100 cm2 each were taken from three regions, viz., (1) the AR, (2) the RV and (3) the BSV, and washed three to five times in ice-cold divalent-free phosphate-buffered saline (PBS) containing penicillin-streptomycin. Then, after one wash in the same solution without antibiotics tis-sue pieces (1 cm2 surface) from all three areas were
fixed for morphometric and immunohistochemical studies. The remaining tissue was transferred to fresh ice-cold divalent-free PBS with penicillin-streptomycin, transported to the laboratory, and stored for one hour at – 4 °C before the preparation of rumen epithelial cells (REC).
Isolation of REC. Rumen papillae were removed by scissors and then washed three times in divalent-free PBS with antibiotics and once in antibiotic-free PBS without Ca/Mg. Thereafter, REC were prepared by fractional trypsination as described by Galfi et al. (1980). The composition of the cell fractions was evaluated by light microscopy, and fractions one and two (mostly consisting of cells from the SC were discarded. In order to investigate the existence of functionally different cell types in the rumen epi-thelium, three groups consisting of (1) fractions 3 to 5 = G1, (2) fractions 6 to 8 = G2, and (3) fractions 9 and 10 = G3 were collected. Some REC from each group were used to extract total protein or RNA. The samples were stored at –80 °C until analysis by Western blot and quantitative reverse transcrip-tion polymerase chain reaction (qRT-PCR). Some REC were fixed with methanol for flow-cytometric analysis of Na+/K+-ATPase, basal cell cytokeratin and cytokeratin 10 abundance.
Light microscopy and morphometry of rumen papillae
Samples from AR, RV, and BSV were fixed in a 4% neutral formaldehyde solution. After rinsing with water, samples were dehydrated in a graded series of ethanol (30%, 50%, 70%, 90%, and absolute etha-nol), cleared with benzene and saturated with and embedded in paraffin. Sections of 5 µm thickness were taken from 30 papillae and stained with hae-matoxylin/eosin. The length and width of the pa-pillae were determined by the computer-operated Image C picture analysis system (Imtronic GmbH, Berlin, Germany) and the IMES analysis program, using a colour video camera (SONY 3 CCD, Sony Electronics Inc., Tokyo, Japan) and a light micro-scope (Axiolab, Carl Zeiss Jena, Germany). The number of papillae per cm2 mucosa was estimated using a video camera equipped with a picture analy-sis system. The total surface of papillae per cm2 mucosa was determined as length × width × 2, mul-tiplied by the number of papillae/cm2 (Hofmann and Schnorr, 1982). In addition, the widths of the ruminal mucosa and of the SC were measured.
Table 1. Metabolizable energy content (in MJ/kg dry matter, DM) and chemical composition of the concen-trate mixture* fed to those sheep receiving the mixed hay/concentrate diet for 14 days
Metabolizable energy (MJ/kg DM) 10.2 Nutrient composition (% DM)Crude protein 16 Crude fat 3.2 Crude fiber 9.5 Crude ash 9.5Minerals (% DM)Calcium 1.5Phosphorus 0.5Sodium 0.4
*Concentrate mixture: 15% sugar beet slices, 15% oat, 15% wheat bran, 12% wheat gluten food meal, 10% barley malt germs, 10% rape expeller, 8% corn, 6% sugar beet molas-ses, 4.5% soybean solvent extracted oil meal, 3.2% CaCO3, 0.8% NaCl
Original Paper Veterinarni Medicina, 56, 2011 (1): 35–47
38
Immunohistochemistry
Rumen papillae were fixed in 4% paraformal-dehyde in PBS overnight, washed in PBS, frozen in liquid nitrogen, and cryosectioned on a Leica CM3050 S (Leica, Bensheim, Germany). Sections (6 µm) were washed three times with PBS, permea-bilized by incubation for 20 min in PBS containing 0.1% Triton X-100, and blocked with 10% rabbit serum in PBS + Triton X-100 for 15 min (all at room temperature). Subsequently, sections were incu-bated overnight at 4 °C with primary antibody (di-luted 1 : 50 with 2% serum in PBS + Triton X-100) in a humidity chamber. After being washed three times in PBS, sections were incubated for 45 min at room temperature in the dark with an appropriate secondary antibody labelled with Alexa Fluor 488 (Molecular Probes, Eugene, OR), diluted 1 : 500 in PBS + Triton X-100. Nuclei were usually coun-terstained with 1 µg/ml propidium iodide in PBS. Sections were covered with MobiGLOW mounting medium (MoBiTec, Göttingen, Germany) and ap-propriate cover-slips. Sections incubated with goat serum in PBS + Triton X-100 instead of primary an-tibody were used as negative controls and showed no unspecific binding of secondary antibodies in rumen epithelial cells.
Immunofluorescence was detected using a Nikon Microphot SA fluorescence microscope (Nikon Instruments Europe B.V., Netherlands) and an image analysis system equipped with CELL^F im-age analysis software and a CC-12 high resolution colour camera (OSIS, Münster, Germany).
Detection of the Na+/K+-ATPase mRNA transcript by qRT-PCR
Total RNA was isolated by a standard proce-dure (Total RNA isolation kit from Macherey & Nagel, Düren, Germany following the manufac-turer’s protocol). The concentration and quality of the extracted RNA were measured by using a NanoDrop ND-1000 Spectrophotometer (Peqlab Biotechnology GmbH, Erlangen, Germany). The ratios of absorbance at 260 and 280 nm of all preparations were approximately 2.0. The integ-rity of RNA was checked by denaturing agarose gel electrophoresis and ethidium bromide stain-ing. The iScriptTM cDNA Synthesis Kit (Bio-Rad Laboratories GmbH, Munich, Germany) was used to synthesize cDNA from 100 ng total RNA from
each sample according to the manufacturer’s in-structions. A negative control, without reverse transcriptase, was processed for each sample to detect possible contamination with genomic DNA or environmental DNA.
The abundance of mRNA for the ribosomal pro-tein S18 (S18) and for the Na+/K+-ATPase α subunit was quantified by qRT-PCR using the iCycler and the iQ-SYBR green supermix (Bio-Rad Laboratories GmbH, Munich, Germany) as described previously (Loehrke et al., 2005; Ulbrich et al., 2006). Briefly, 1 μl aliquots of each RT reaction (1/20 of total) were primed, in each 10 µl PCR, with gene-specific oligonucleotides (final concentration of 0.2µM) for S18 (gi 74268022: 5'- CTT AAA CAG ACA GAA GGA CGT GAA-3' and 5'-CCA CAC ATT ATT TCT TCT TGG ACA-3'; transcript size: 218 bp) and Na+/K+-ATPase α (gi 115305283: 5'-GAG ATT ACC CCC TTC CTG ATA TTT-3' and 5'-TGG ATC ATA CCA ATC TGT CCA TAG-3'; transcript size: 227 bp). The primers were designed to span a corre-sponding intron and to anneal at 60 °C to published cDNA and gene sequences. PCR was performed over 40 cycles for 180 s at 94 °C and 10 s at 94 °C, followed by 30 s at 60 °C and 225 s at 70 °C. The spe-cificity of amplification was determined by melt-ing curve analysis and agarose gel electrophoresis in comparison with an oligonucleotide molecular mass ladder to confirm that the calculated molecu-lar mass of the cDNA corresponded to the pro-duced cDNA. The cDNA structure was checked by sequencing. Each cDNA was quantified in dupli-cate; the average value of each sample value minus the corresponding negative control value was used to calculate the cDNA product corresponding to the abundance of mRNA. The amount of Na+/K+-ATPase α subunit mRNA was normalized against the housekeeping gene S18.
Western blot analysis
For Western blots, total protein from freshly isolated and washed REC was extracted using the M-PER Mammalian Protein Extraction Reagent (Pierce, Bonn, Germany), complemented with Halt™ protease inhibitor cocktail (Pierce, Bonn, Germany). Protein concentrations were determined by means of the Bradford assay (Bio-RAD, Munich, Germany). Protein samples (20 µg) were separated by SDS (12.5%)-polyacrylamide gel electrophoresis and subsequently transferred to polyvinylidene flu-
Veterinarni Medicina, 56, 2011 (1): 35–47 Original Paper
39
oride (PVDF) membranes (GE Healthcare, Munich, Germany). After transfer, membranes were blocked with 3% non-fat dry milk in PBS (pH 7.5) contain-ing 0.05% Tween 20 (PBS-T) for 2 h and washed in PBS-T (1 × 10 min and 2 × 5 min). Thereafter, membranes were incubated at 4 °C with the primary antibody (anti-Na+/K+-ATPase: 1 : 1000 dilution) overnight, washed three times (1 × 15 min, 2 × 5 min) with PBS-T, and incubated for 1 h with HRP-conjugated secondary anti-mouse IgG (1 : 10 000 dilution) antibody. Then, after three washes (1 × 10 min and 2 × 5 min) in PBS-T, membranes were developed with the ECL Western Blotting Substrate (Pierce). For size comparison, the Precision Plus Protein WesternC Standard (161-0376, Bio-RAD) and the Precision Protein StrepTactin-HRP Conjugate (161-0381, Bio-RAD) were used. Density quantification was performed by ImageJ 1.41 soft-ware (National Institutes of Health).
Flow cytometry
Methanol-fixed REC were incubated overnight at 4 °C with anti-Na+/K+-ATPase antibody (10 µg/ml) dissolved in 10mM PBS with 0.2% bovine serum albumin and 1mM EDTA, pH 7.3. After warming to room temperature, cells were washed twice in PBS-EDTA and incubated for 1 h in a 200-fold dilution (4 µg/ml) of Alexa-Fluor 488-conjugated anti-mouse-IgGF(ab’)2 (Molecular Probes, Eugene, OR). The anti-Na+/K+-ATPase antibody was omit-ted from control incubations. After a further two washes in PBS-EDTA, quantitative analysis of cellu-lar fluorescence was carried out by flow cytometry to analyze the cells simultaneously, with regard to size, granularity, and ATPase abundance (portion of protein-expressing cells and relative fluorescence intensity per single cell). Cytokeratin 10 and basal cell cytokeratin abundance was determined in the same way, but the incubation with the specific an-tibodies (7.5 µg/ml) was performed for two hours only, and secondary FITC-conjugated anti-mouse-IgG (4 µg/ml) antibodies were employed.
Flow-cytometric analysis was performed as de-scribed previously (Schweigel et al., 2006). Briefly, an argon-laser-equipped flow cytometer (Coulter-XL, Beckmann, Krefeld, Germany) was used to record emissions of multiple fluorescence (green, orange, red) excited at 488 nm (counting 5000 cells). Particle size was calibrated using standard beads (Coulter). Cells of interest were identified (1) by
establishing a histogram on the basis of cell size and granularity, (2) by establishing a fluorescence histogram, and (3) by projecting the fluorescence onto the size-granularity histogram. Subsequently, the cells were gated, and the portion of fluorescent cells and their fluorescence intensity were auto-matically computed.
Statistical analysis
If not otherwise stated, data are presented as means ± standard error (SE). Significance was de-termined by Student’s t-test or the paired t-test as appropriate. P < 0.05 was considered to be sig-nificant. All statistical calculations were performed using SigmaStat (Jandel Scientific).
RESULTS AND DISCUSSION
Animals
Before starting the two-week experimental pe-riod of differential feeding, sheep from both groups had a mean body weight of 43 ± 2 kg, and no change (0.7 ± 0.9 kg) occurred in the h-group. At the end of the experiment, the mean body weight of h/c-fed sheep was significantly higher when compared with that of the h-fed sheep and showed an increase of 3.0 ± 0.5 kg. As the hay intake per sheep and day was the same in both dietary groups (about 1 kg), this gain resulted from the extra energy supplied via the concentrate supplementation.
Morphology of ruminal mucosa
In agreement with results of other authors (Shen et al., 2004), the length, width, and, thus, surface of the rumen papillae was in the order of AR > RV > BSV in both feeding groups (Table 2). These results were related to the higher post-feeding con-centrations of SCFA and the lower rumen fluid pH values observed in the AR compared with the lower parts (RV, BSV) of the rumen (Martin et al., 1999). Concentrate feeding induced a significant reduction in rumen papillae density. However, morphometric analysis of single papillae from all three regions of the rumen (Table 2) revealed an increased length and width in h/c- compared with h-fed sheep. The observed changes were most prominent in the
Original Paper Veterinarni Medicina, 56, 2011 (1): 35–47
40
AR and RV resulting in a marked 41% and 62% increase, respectively, in papillae surface in these rumen regions of h/c-fed sheep. A 57% to 95% el-evation in rumen papillae size was also found in concentrate-fed sheep (Goodlad, 1981), goats (Shen et al., 2004) and bulls (Shen et al., 2005). Together with other factors, such as lower intraruminal pH values (Gaebel et al., 1987; Brossard et al., 2004) and increased blood flow (Dobson, 1984; Thorlacius, 1972), this strongly supported the passive absorp-tion of non-dissociated SCFA by passive diffusion (Bugaut, 1987; Gaebel et al., 1987; Sehested et al., 2000).
Importantly, with regard to the rumen mucosa (h-group: 142 ± 2 µm; h/c-group: 161 ± 4 µm), the higher epithelial surface area of h/c-fed sheep re-sulted from an increased thickness of the SC only (Table 3). Its width increased from 28 ± 0.5 µm in h-fed sheep to 42 ± 0.7 µm in h/c-fed sheep, and no inter-region differences were observed. Thus, the SC accounted for 19% and 26% of the rumen mucosa in h- and h/c-fed sheep, respectively (Table 3). In accordance with our results, Gaebel et al. (1987) found an increased number of cell layers (12–18 layers) forming the SC in sheep fed 64% or 90% concentrate compared with hay-fed sheep (2–3 layers). These changes also demonstrated the
growing importance of the protective function of the rumen epithelium with respect to concentrate feeding, a function achieved by a higher degree of differentiation and keratinization. One major fac-tor responsible for the initiation of these processes was demonstrated to be the SCFA butyrate (Galfi et al., 1983). In our study, the ruminal butyrate con-centration, as measured by gas chromatography, amounted to 6.8 ± 0.4 mmol/l in h-fed sheep and increased to 17.3 ± 1.2 mmol/l (P < 0.001) in h/c-fed sheep. Butyrate is known to act as a reversible mi-tosis inhibitor, thereby initiating the process of REC differentiation (Galfi et al., 1981). It also induces distinct changes such as the appearance of refrac-tive granules, an increased number of filamen-tous bundles, cell membrane thickening, nucleus degeneration, the formation of keratohyalin-like granules and the accumulation of the enzyme al-kaline phosphatase in the cell membrane (Galfi et al., 1982, 1983, 1991) characteristic of the enhanced keratinization of REC. The thickness of the meta-bolically active cell layers (stratum basale to stra-tum granulosum) was not different between the feeding groups (Table 3). However, in accordance with a higher degree of differentiation, more cells positive for cytokeratin 10 (1.35 ± 0.45 vs. 0.43 ± 0.14 × 10⁷/ml; P < 0.05) were found in REC from
Table 2. Morphometric parameters of rumen papillae in the atrium ruminis, rumen ventralis, and ventral blind sac (mean ± SE; n = 4 per diet)
Atrium ruminis
h diet h/c diet P-value
Length (mm) 3.39 ± 0.21 4.64 ± 0.18 0.001
Width (mm) 1.85 ± 0.07 2.19 ± 0.07 0.008
Density (n/cm2) 58 ± 1 51 ± 1 0.001
Surface (mm2/cm2) 736 ± 65 1038 ± 43 0.003
Rumen ventralis
Length (mm) 2.08 ± 0.20 2.93 ± 0.13 0.005
Width (mm) 1.58 ± 0.08 1.96 ± 0.07 0.006
Density (n/cm2) 62 ± 1 58 ± 1 0.018
Surface (mm2/cm2) 413 ± 56 671 ± 53 0.026
Ventral blind sac
Length (mm) 1.97 ± 0.15 2.42 ±0.13 0.045
Width (mm) 1.49 ± 0.03 1.65 ± 0.04 0.010
Density (n/cm2) 63 ± 0 58 ± 1 ≤ 0.001
Surface (mm2/cm2) 371 ± 35 460 ± 26 0.069
Veterinarni Medicina, 56, 2011 (1): 35–47 Original Paper
41
h/c-fed sheep. Cytokeratin 10 has been shown to be a differentiation marker appearing in cells from the upper stratum spinosum to stratum granulosum (Eckert et al., 1997).
As shown in Table 3, inter-region differences were found between AR and BSV of h/c-fed sheep only. The mucosa width of the BSV was decreased, resulting from the reduced thickness (21%) of the stratum basale to stratum granulosum cell layers in the BSV compared with the AR region.
Compared with controls, REC suspensions from sheep fed the h/c diet generally contained more cells (7.30 ± 0.83 vs. 3.49 ± 0.52 × 10⁷/ml; P < 0.001), showed an elevated protein content (891 ± 76 vs. 287 ± 56 µg/ml; P < 0.001) in the germinative and absorp-tive REC populations (G2, G3) and a decreased RNA-to-protein ratio (0.13 ± 0.01 vs. 0.50 ± 0.05 µg/ml; P < 0.005). This indicates cellular hyperplasia, viz., a higher capacity to synthesize protein and to prolif-erate. Because of this, differentiated cells enter the upper epithelial layers faster (Eckert et al., 1997).
Localization and protein expression of the Na+/K+-ATPase in rumen epithelium
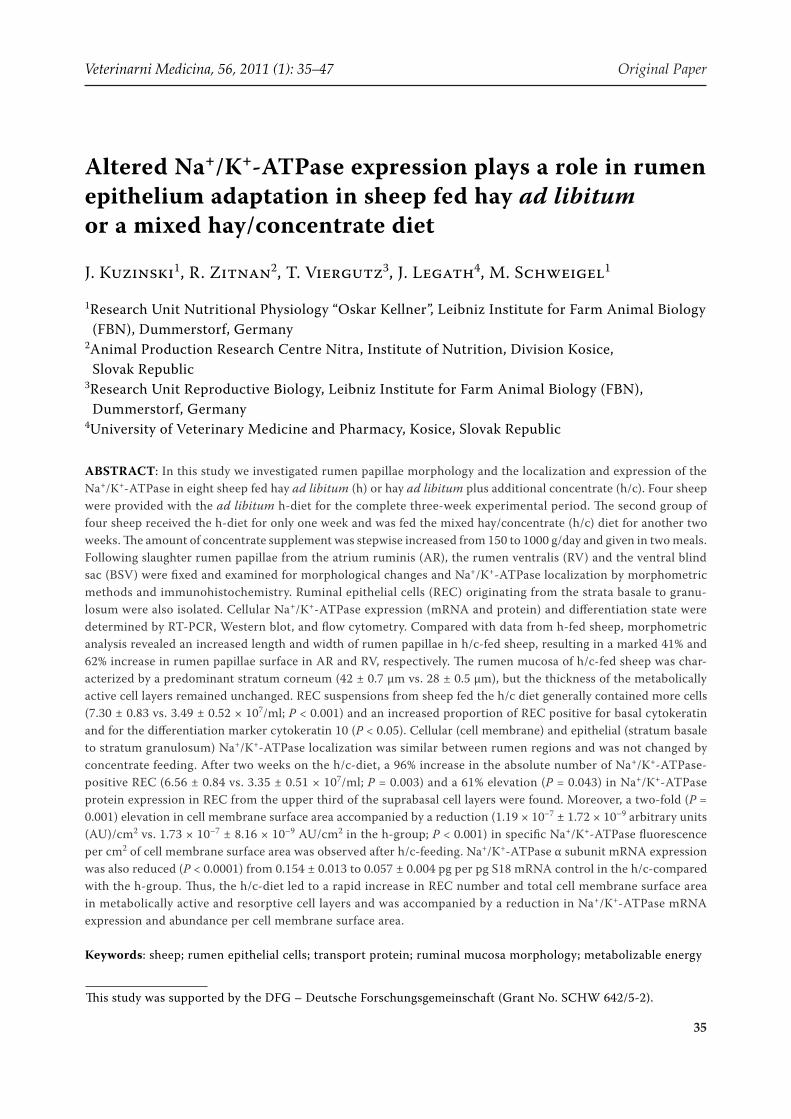
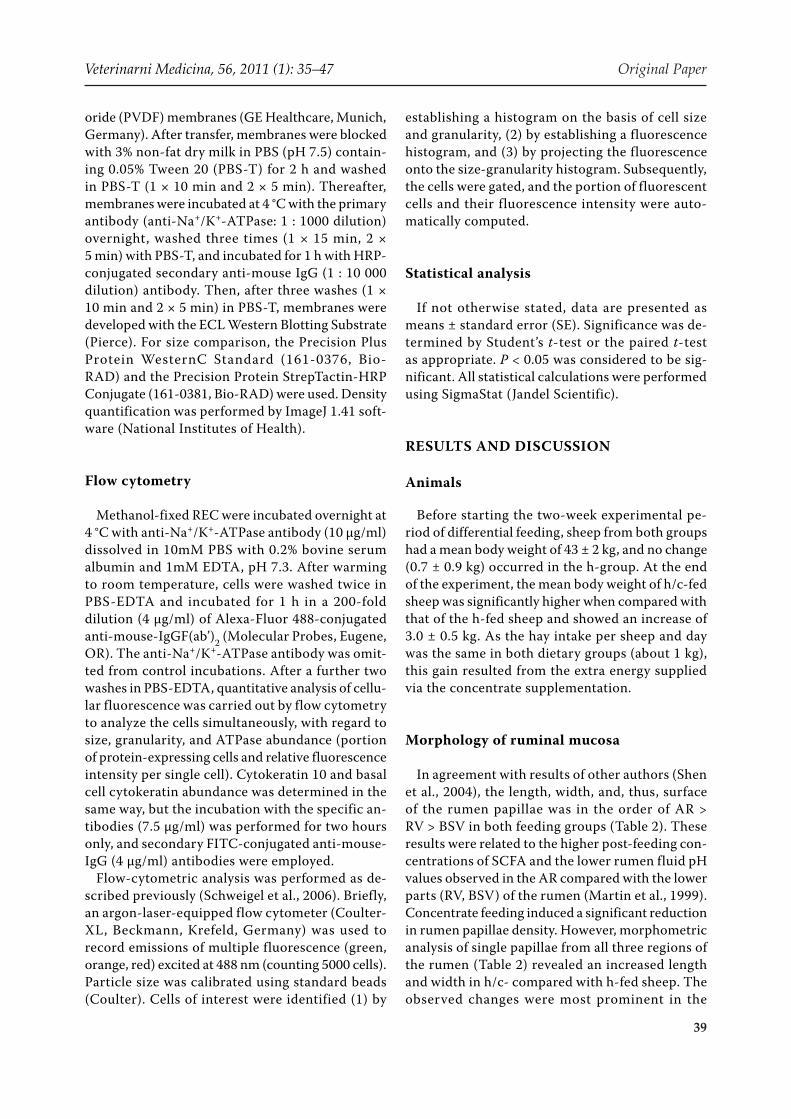
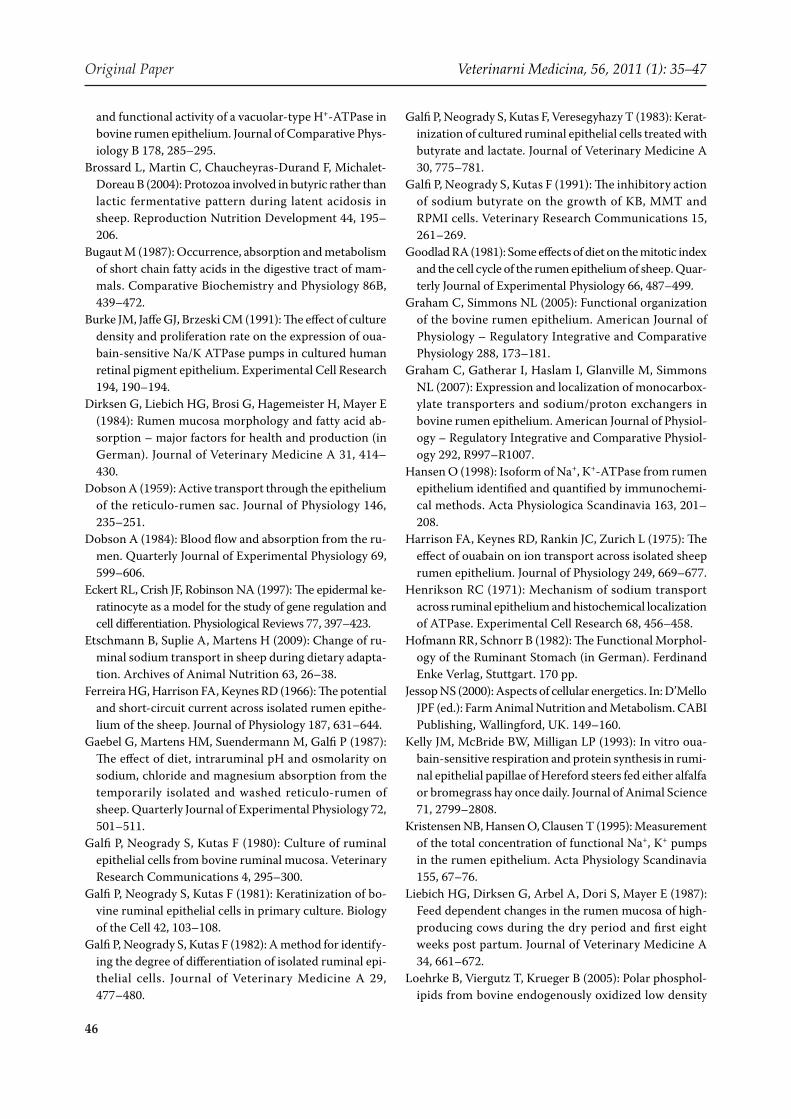
With the exception of the SC, the Na+/K+-ATPase was present in all REC and was strictly localized to the cell membrane (Figure 1). This was in accord-ance with results from studies with bovine rumen epithelium (Graham and Simmons, 2005; Albrecht et al., 2008). Cellular and epithelial Na+/K+-ATPase localization was similar between rumen regions and was not altered by concentrate feeding. As only cornified cells express no Na+/K+-ATPase protein, the pump can be used as a marker to identify cells from the metabolically active cell layers (Figure 1). Using flow cytometry and a a1-subunit-specific anti-sheep Na+/K+-ATPase antibody, the protein was found in 95 ± 1% and 89 ± 3% of REC isolated from h or h/c epithelia. However, as mentioned above, REC suspensions from h/c-fed sheep con-tained many more cells than that from h-fed sheep resulting in a 96% increase in the absolute number
Table 3. Effect of diet on the thickness of rumen mucosa and on the width of various cell layers forming this mucosa (mean ± SE; n = 4 per diet)
Atrium ruminis
h diet h/c diet P-value
Mucosa (µm) 147.25 ± 4.48 174.50 ± 7.98 0.025
SC (µm) 27.75 ± 1.25 43.50 ± 1.71 < 0.001
SB-SG 119.50 ± 4.21 131.00 ± 6.72 0.197
% SC 18.87 ± 0.85 24.97 ± 0.70 0.001
(SB-SG)/SC 4.33 ± 0.22 3.01 ± 0.11 0.002
Rumen ventralis
Mucosa (µm) 140.75 ± 2.56 160.25 ± 5.79 0.022
SC (µm) 29.25 ± 0.85 42.50 ± 3.23 0.007
SB-SG 111.50 ± 1.85 117.75 ± 2.96 0.123
SC (%) 20.77 ± 0.33 26.43 ± 1.10 0.003
(SB-SG)/SC 3.82 ± 0.08 2.80 ± 0.15 < 0.001
Ventral blind sac
Mucosa (µm) 137.25 ± 4.91 149.50 ± 3.97a 0.100
SC (µm) 27.50 ± 0.65 41.00 ± 0.91 < 0.001
SB-SG 109.75 ± 4.61 108.50 ± 3.07a 0.829
SC (%) 20.09 ± 0.65 27.43 ± 0.15a 0.029
(SB-SG)/SC 3.99 ± 0.15 2.65 ± 0.02a 0.029
SC = stratum corneum, SB-SG = stratum basale to stratum granulosumaatrium ruminis vs. ventral blind sac, P < 0.05
Original Paper Veterinarni Medicina, 56, 2011 (1): 35–47
42
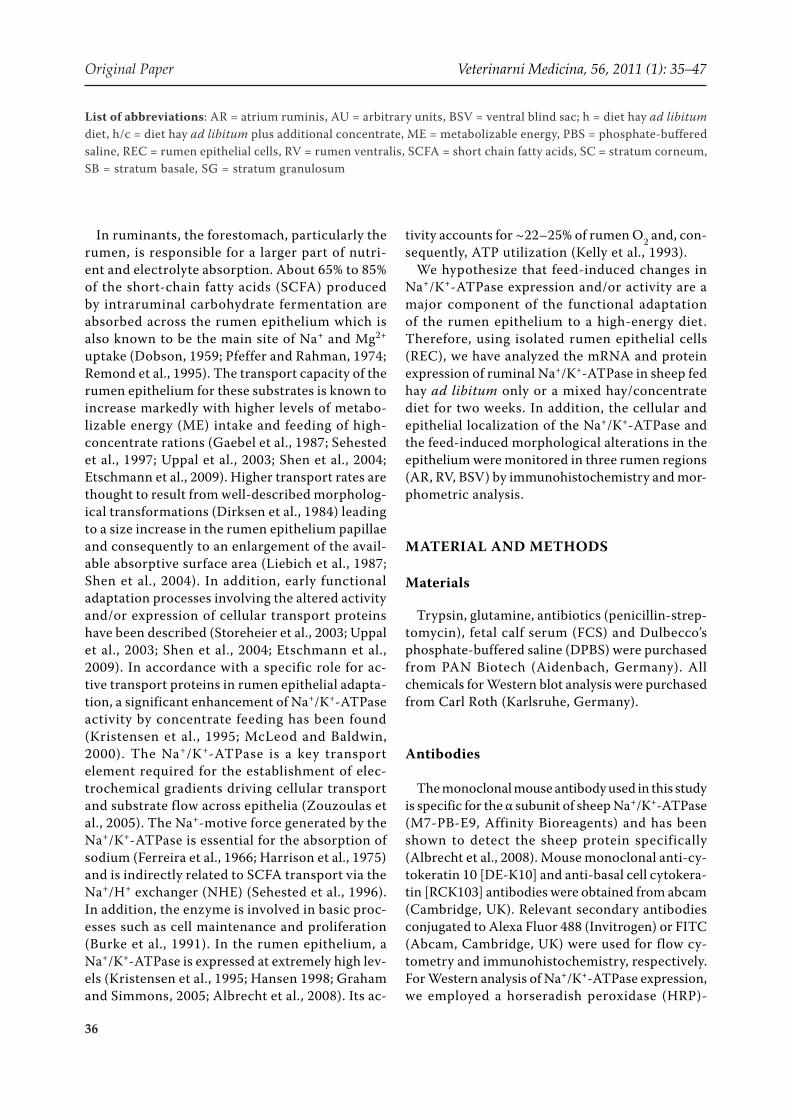
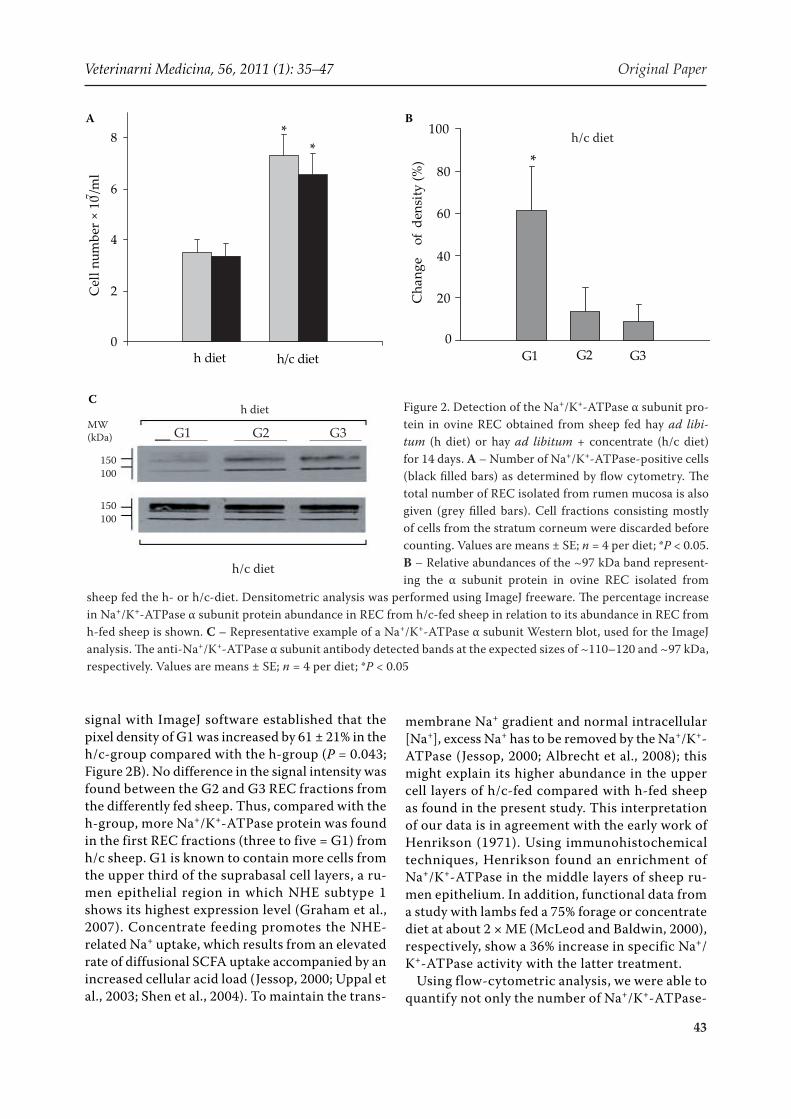
of Na+/K+-ATPase-positive REC (6.56 ± 0.84 vs. 3.35 ± 0.51 × 10⁷/ml; P = 0.003) after concentrate feeding (Figure 2A).
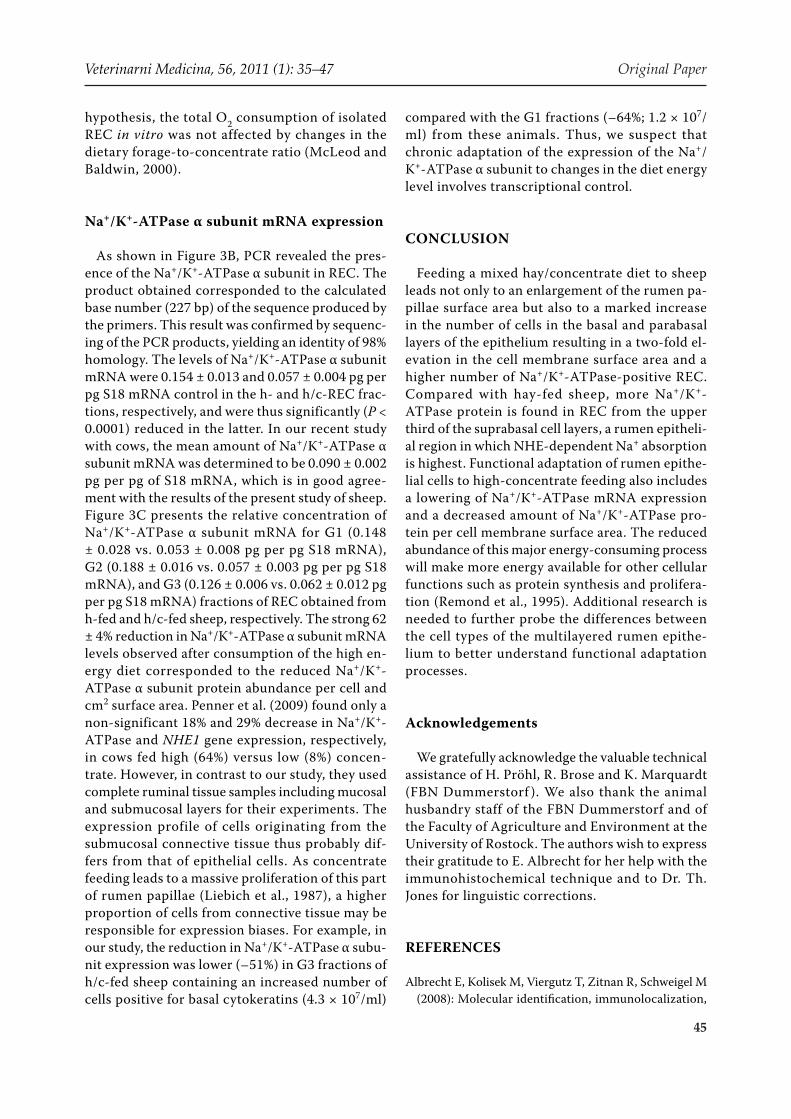
Next, we investigated the expression of the Na+/K+-ATPase protein by Western blotting (Figure 2B). Typical Western blots of whole cell protein ex-tracts derived from G1 to G3 REC fractions from
h- or h/c-fed sheep are presented in Figure 2C. As in bovine rumen tissue (Graham and Simmons, 2005), a major band at about 110–120 kDa together with a smaller one at about 97 kDa represented the a-subunits of the ovine Na+/K+-ATPase protein. Both bands were stronger in G1 of h/c-fed sheep. Indeed, downstream quantification of the 97-kDa
Figure 1. Immunolocalization of the Na+/K+-ATPase α subunit (green) in the atrium ruminis of sheep fed hay ad libi-tum (h diet) or hay ad libitum + concentrate (h/c diet) for 14 days. Cells were co-stained with propidium iodide (red) to label nuclei. With the exception of the stratum corneum (SC), the Na+/K+-ATPase exists in the cell membrane of all REC and thus, can be used to differentiate between cornified and metabolically active cells. Note the predominant SC (area enclosed by white lines) in h/c fed sheep
Veterinarni Medicina, 56, 2011 (1): 35–47 Original Paper
43
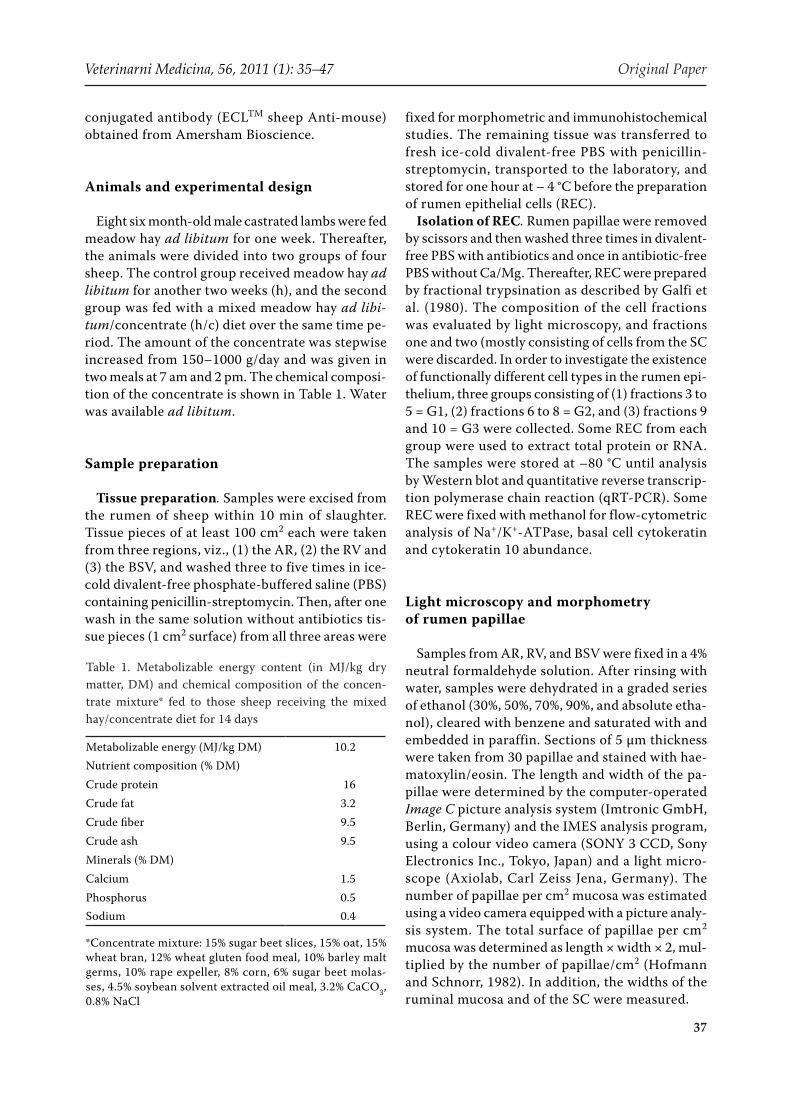
Figure 2. Detection of the Na+/K+-ATPase α subunit pro-tein in ovine REC obtained from sheep fed hay ad libi-tum (h diet) or hay ad libitum + concentrate (h/c diet) for 14 days. A – Number of Na+/K+-ATPase-positive cells (black filled bars) as determined by flow cytometry. The total number of REC isolated from rumen mucosa is also given (grey filled bars). Cell fractions consisting mostly of cells from the stratum corneum were discarded before counting. Values are means ± SE; n = 4 per diet; *P < 0.05. B – Relative abundances of the ~97 kDa band represent-ing the α subunit protein in ovine REC isolated from
sheep fed the h- or h/c-diet. Densitometric analysis was performed using ImageJ freeware. The percentage increase in Na+/K+-ATPase α subunit protein abundance in REC from h/c-fed sheep in relation to its abundance in REC from h-fed sheep is shown. C – Representative example of a Na+/K+-ATPase α subunit Western blot, used for the ImageJ analysis. The anti-Na+/K+-ATPase α subunit antibody detected bands at the expected sizes of ~110–120 and ~97 kDa, respectively. Values are means ± SE; n = 4 per diet; *P < 0.05
signal with ImageJ software established that the pixel density of G1 was increased by 61 ± 21% in the h/c-group compared with the h-group (P = 0.043; Figure 2B). No difference in the signal intensity was found between the G2 and G3 REC fractions from the differently fed sheep. Thus, compared with the h-group, more Na+/K+-ATPase protein was found in the first REC fractions (three to five = G1) from h/c sheep. G1 is known to contain more cells from the upper third of the suprabasal cell layers, a ru-men epithelial region in which NHE subtype 1 shows its highest expression level (Graham et al., 2007). Concentrate feeding promotes the NHE-related Na+ uptake, which results from an elevated rate of diffusional SCFA uptake accompanied by an increased cellular acid load (Jessop, 2000; Uppal et al., 2003; Shen et al., 2004). To maintain the trans-
membrane Na+ gradient and normal intracellular [Na+], excess Na+ has to be removed by the Na+/K+-ATPase (Jessop, 2000; Albrecht et al., 2008); this might explain its higher abundance in the upper cell layers of h/c-fed compared with h-fed sheep as found in the present study. This interpretation of our data is in agreement with the early work of Henrikson (1971). Using immunohistochemical techniques, Henrikson found an enrichment of Na+/K+-ATPase in the middle layers of sheep ru-men epithelium. In addition, functional data from a study with lambs fed a 75% forage or concentrate diet at about 2 × ME (McLeod and Baldwin, 2000), respectively, show a 36% increase in specific Na+/K+-ATPase activity with the latter treatment.
Using flow-cytometric analysis, we were able to quantify not only the number of Na+/K+-ATPase-
**
0
2
4
6
8
h diet h/c diet
Cel
l num
ber
× 10
7 /ml
G1 G2
*
G30
20
40
60
80
100
Cha
nge
of de
nsity
(%)
A B
h/c diet
MW (kDa)
150100
150100
h/c diet
h dietC
G1 G2 G3
Original Paper Veterinarni Medicina, 56, 2011 (1): 35–47
44
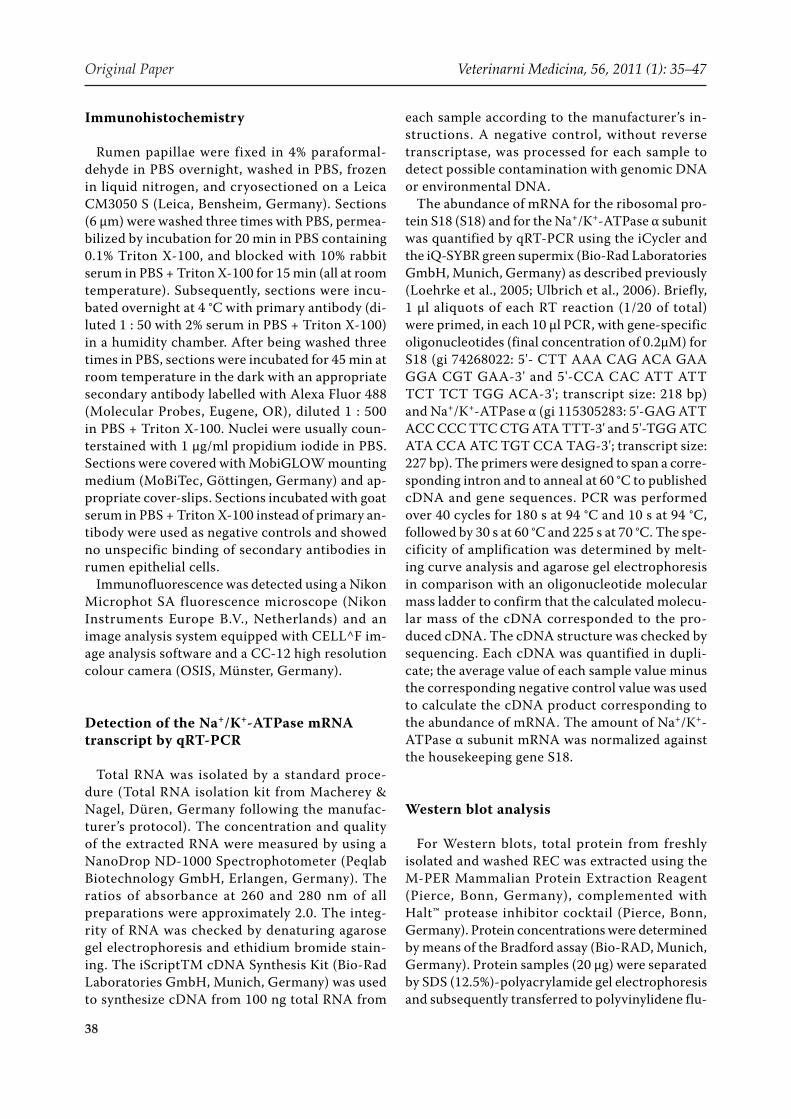
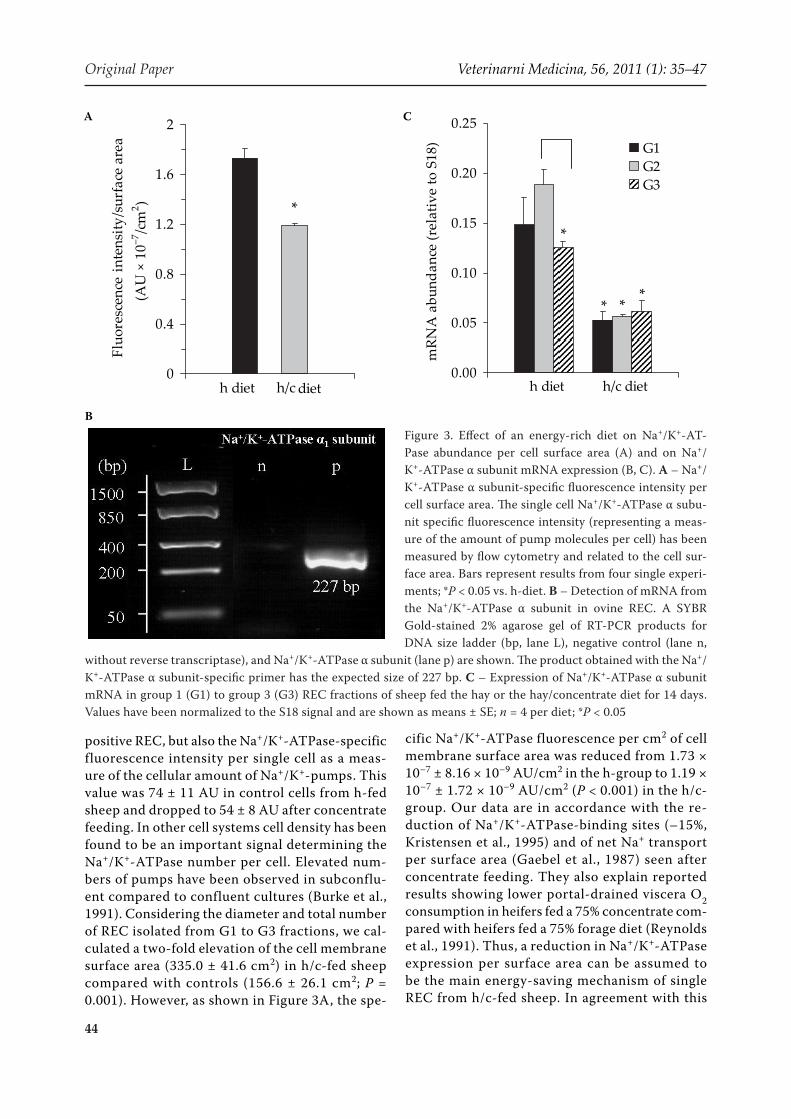
positive REC, but also the Na+/K+-ATPase-specific fluorescence intensity per single cell as a meas-ure of the cellular amount of Na+/K+-pumps. This value was 74 ± 11 AU in control cells from h-fed sheep and dropped to 54 ± 8 AU after concentrate feeding. In other cell systems cell density has been found to be an important signal determining the Na+/K+-ATPase number per cell. Elevated num-bers of pumps have been observed in subconflu-ent compared to confluent cultures (Burke et al., 1991). Considering the diameter and total number of REC isolated from G1 to G3 fractions, we cal-culated a two-fold elevation of the cell membrane surface area (335.0 ± 41.6 cm2) in h/c-fed sheep compared with controls (156.6 ± 26.1 cm2; P = 0.001). However, as shown in Figure 3A, the spe-
cific Na+/K+-ATPase fluorescence per cm2 of cell membrane surface area was reduced from 1.73 × 10⁻⁷ ± 8.16 × 10⁻⁹ AU/cm2 in the h-group to 1.19 × 10⁻⁷ ± 1.72 × 10⁻⁹ AU/cm2 (P < 0.001) in the h/c-group. Our data are in accordance with the re-duction of Na+/K+-ATPase-binding sites (–15%, Kristensen et al., 1995) and of net Na+ transport per surface area (Gaebel et al., 1987) seen after concentrate feeding. They also explain reported results showing lower portal-drained viscera O2 consumption in heifers fed a 75% concentrate com-pared with heifers fed a 75% forage diet (Reynolds et al., 1991). Thus, a reduction in Na+/K+-ATPase expression per surface area can be assumed to be the main energy-saving mechanism of single REC from h/c-fed sheep. In agreement with this
h diet h/c diet
*
0
0.4
0.8
1.2
1.6
2Fl
uore
scen
ce in
tens
ity/s
urfa
ce a
rea
(AU
× 1
0–7/c
m2 )
*
* **
0.00
0.05
0.10
0.15
0.20
0.25
h
diet
h/c
diet
G1G2G3
mR
NA
ab
unda
nce
(r
elat
ive
to S
18)
Figure 3. Effect of an energy-rich diet on Na+/K+-AT-Pase abundance per cell surface area (A) and on Na+/K+-ATPase α subunit mRNA expression (B, C). A – Na+/K+-ATPase α subunit-specific fluorescence intensity per cell surface area. The single cell Na+/K+-ATPase α subu-nit specific fluorescence intensity (representing a meas-ure of the amount of pump molecules per cell) has been measured by flow cytometry and related to the cell sur-face area. Bars represent results from four single experi-ments; *P < 0.05 vs. h-diet. B – Detection of mRNA from the Na+/K+-ATPase α subunit in ovine REC. A SYBR Gold-stained 2% agarose gel of RT-PCR products for DNA size ladder (bp, lane L), negative control (lane n,
without reverse transcriptase), and Na+/K+-ATPase α subunit (lane p) are shown. The product obtained with the Na+/K+-ATPase α subunit-specific primer has the expected size of 227 bp. C – Expression of Na+/K+-ATPase α subunit mRNA in group 1 (G1) to group 3 (G3) REC fractions of sheep fed the hay or the hay/concentrate diet for 14 days. Values have been normalized to the S18 signal and are shown as means ± SE; n = 4 per diet; *P < 0.05
A C
B
Veterinarni Medicina, 56, 2011 (1): 35–47 Original Paper
45
hypothesis, the total O2 consumption of isolated REC in vitro was not affected by changes in the dietary forage-to-concentrate ratio (McLeod and Baldwin, 2000).
Na+/K+-ATPase α subunit mRNA expression
As shown in Figure 3B, PCR revealed the pres-ence of the Na+/K+-ATPase α subunit in REC. The product obtained corresponded to the calculated base number (227 bp) of the sequence produced by the primers. This result was confirmed by sequenc-ing of the PCR products, yielding an identity of 98% homology. The levels of Na+/K+-ATPase α subunit mRNA were 0.154 ± 0.013 and 0.057 ± 0.004 pg per pg S18 mRNA control in the h- and h/c-REC frac-tions, respectively, and were thus significantly (P < 0.0001) reduced in the latter. In our recent study with cows, the mean amount of Na+/K+-ATPase α subunit mRNA was determined to be 0.090 ± 0.002 pg per pg of S18 mRNA, which is in good agree-ment with the results of the present study of sheep. Figure 3C presents the relative concentration of Na+/K+-ATPase α subunit mRNA for G1 (0.148 ± 0.028 vs. 0.053 ± 0.008 pg per pg S18 mRNA), G2 (0.188 ± 0.016 vs. 0.057 ± 0.003 pg per pg S18 mRNA), and G3 (0.126 ± 0.006 vs. 0.062 ± 0.012 pg per pg S18 mRNA) fractions of REC obtained from h-fed and h/c-fed sheep, respectively. The strong 62 ± 4% reduction in Na+/K+-ATPase α subunit mRNA levels observed after consumption of the high en-ergy diet corresponded to the reduced Na+/K+-ATPase α subunit protein abundance per cell and cm2 surface area. Penner et al. (2009) found only a non-significant 18% and 29% decrease in Na+/K+-ATPase and NHE1 gene expression, respectively, in cows fed high (64%) versus low (8%) concen-trate. However, in contrast to our study, they used complete ruminal tissue samples including mucosal and submucosal layers for their experiments. The expression profile of cells originating from the submucosal connective tissue thus probably dif-fers from that of epithelial cells. As concentrate feeding leads to a massive proliferation of this part of rumen papillae (Liebich et al., 1987), a higher proportion of cells from connective tissue may be responsible for expression biases. For example, in our study, the reduction in Na+/K+-ATPase α subu-nit expression was lower (–51%) in G3 fractions of h/c-fed sheep containing an increased number of cells positive for basal cytokeratins (4.3 × 10⁷/ml)
compared with the G1 fractions (–64%; 1.2 × 10⁷/ml) from these animals. Thus, we suspect that chronic adaptation of the expression of the Na+/K+-ATPase α subunit to changes in the diet energy level involves transcriptional control.
CONCLUSION
Feeding a mixed hay/concentrate diet to sheep leads not only to an enlargement of the rumen pa-pillae surface area but also to a marked increase in the number of cells in the basal and parabasal layers of the epithelium resulting in a two-fold el-evation in the cell membrane surface area and a higher number of Na+/K+-ATPase-positive REC. Compared with hay-fed sheep, more Na+/K+-ATPase protein is found in REC from the upper third of the suprabasal cell layers, a rumen epitheli-al region in which NHE-dependent Na+ absorption is highest. Functional adaptation of rumen epithe-lial cells to high-concentrate feeding also includes a lowering of Na+/K+-ATPase mRNA expression and a decreased amount of Na+/K+-ATPase pro-tein per cell membrane surface area. The reduced abundance of this major energy-consuming process will make more energy available for other cellular functions such as protein synthesis and prolifera-tion (Remond et al., 1995). Additional research is needed to further probe the differences between the cell types of the multilayered rumen epithe-lium to better understand functional adaptation processes.
Acknowledgements
We gratefully acknowledge the valuable technical assistance of H. Pröhl, R. Brose and K. Marquardt (FBN Dummerstorf ). We also thank the animal husbandry staff of the FBN Dummerstorf and of the Faculty of Agriculture and Environment at the University of Rostock. The authors wish to express their gratitude to E. Albrecht for her help with the immunohistochemical technique and to Dr. Th. Jones for linguistic corrections.
REFERENCES
Albrecht E, Kolisek M, Viergutz T, Zitnan R, Schweigel M (2008): Molecular identification, immunolocalization,
Original Paper Veterinarni Medicina, 56, 2011 (1): 35–47
46
and functional activity of a vacuolar-type H+-ATPase in bovine rumen epithelium. Journal of Comparative Phys-iology B 178, 285–295.
Brossard L, Martin C, Chaucheyras-Durand F, Michalet-Doreau B (2004): Protozoa involved in butyric rather than lactic fermentative pattern during latent acidosis in sheep. Reproduction Nutrition Development 44, 195–206.
Bugaut M (1987): Occurrence, absorption and metabolism of short chain fatty acids in the digestive tract of mam-mals. Comparative Biochemistry and Physiology 86B, 439–472.
Burke JM, Jaffe GJ, Brzeski CM (1991): The effect of culture density and proliferation rate on the expression of oua-bain-sensitive Na/K ATPase pumps in cultured human retinal pigment epithelium. Experimental Cell Research 194, 190–194.
Dirksen G, Liebich HG, Brosi G, Hagemeister H, Mayer E (1984): Rumen mucosa morphology and fatty acid ab-sorption – major factors for health and production (in German). Journal of Veterinary Medicine A 31, 414–430.
Dobson A (1959): Active transport through the epithelium of the reticulo-rumen sac. Journal of Physiology 146, 235–251.
Dobson A (1984): Blood flow and absorption from the ru-men. Quarterly Journal of Experimental Physiology 69, 599–606.
Eckert RL, Crish JF, Robinson NA (1997): The epidermal ke-ratinocyte as a model for the study of gene regulation and cell differentiation. Physiological Reviews 77, 397–423.
Etschmann B, Suplie A, Martens H (2009): Change of ru-minal sodium transport in sheep during dietary adapta-tion. Archives of Animal Nutrition 63, 26–38.
Ferreira HG, Harrison FA, Keynes RD (1966): The potential and short-circuit current across isolated rumen epithe-lium of the sheep. Journal of Physiology 187, 631–644.
Gaebel G, Martens HM, Suendermann M, Galfi P (1987): The effect of diet, intraruminal pH and osmolarity on sodium, chloride and magnesium absorption from the temporarily isolated and washed reticulo-rumen of sheep. Quarterly Journal of Experimental Physiology 72, 501–511.
Galfi P, Neogrady S, Kutas F (1980): Culture of ruminal epithelial cells from bovine ruminal mucosa. Veterinary Research Communications 4, 295–300.
Galfi P, Neogrady S, Kutas F (1981): Keratinization of bo-vine ruminal epithelial cells in primary culture. Biology of the Cell 42, 103–108.
Galfi P, Neogrady S, Kutas F (1982): A method for identify-ing the degree of differentiation of isolated ruminal epi-thelial cells. Journal of Veterinary Medicine A 29, 477–480.
Galfi P, Neogrady S, Kutas F, Veresegyhazy T (1983): Kerat-inization of cultured ruminal epithelial cells treated with butyrate and lactate. Journal of Veterinary Medicine A 30, 775–781.
Galfi P, Neogrady S, Kutas F (1991): The inhibitory action of sodium butyrate on the growth of KB, MMT and RPMI cells. Veterinary Research Communications 15, 261–269.
Goodlad RA (1981): Some effects of diet on the mitotic index and the cell cycle of the rumen epithelium of sheep. Quar-terly Journal of Experimental Physiology 66, 487–499.
Graham C, Simmons NL (2005): Functional organization of the bovine rumen epithelium. American Journal of Physiology – Regulatory Integrative and Comparative Physiology 288, 173–181.
Graham C, Gatherar I, Haslam I, Glanville M, Simmons NL (2007): Expression and localization of monocarbox-ylate transporters and sodium/proton exchangers in bovine rumen epithelium. American Journal of Physiol-ogy – Regulatory Integrative and Comparative Physiol-ogy 292, R997–R1007.
Hansen O (1998): Isoform of Na+, K+-ATPase from rumen epithelium identified and quantified by immunochemi-cal methods. Acta Physiologica Scandinavia 163, 201–208.
Harrison FA, Keynes RD, Rankin JC, Zurich L (1975): The effect of ouabain on ion transport across isolated sheep rumen epithelium. Journal of Physiology 249, 669–677.
Henrikson RC (1971): Mechanism of sodium transport across ruminal epithelium and histochemical localization of ATPase. Experimental Cell Research 68, 456–458.
Hofmann RR, Schnorr B (1982): The Functional Morphol-ogy of the Ruminant Stomach (in German). Ferdinand Enke Verlag, Stuttgart. 170 pp.
Jessop NS (2000): Aspects of cellular energetics. In: D’Mello JPF (ed.): Farm Animal Nutrition and Metabolism. CABI Publishing, Wallingford, UK. 149–160.
Kelly JM, McBride BW, Milligan LP (1993): In vitro oua-bain-sensitive respiration and protein synthesis in rumi-nal epithelial papillae of Hereford steers fed either alfalfa or bromegrass hay once daily. Journal of Animal Science 71, 2799–2808.
Kristensen NB, Hansen O, Clausen T (1995): Measurement of the total concentration of functional Na+, K+ pumps in the rumen epithelium. Acta Physiology Scandinavia 155, 67–76.
Liebich HG, Dirksen G, Arbel A, Dori S, Mayer E (1987): Feed dependent changes in the rumen mucosa of high-producing cows during the dry period and first eight weeks post partum. Journal of Veterinary Medicine A 34, 661–672.
Loehrke B, Viergutz T, Krueger B (2005): Polar phosphol-ipids from bovine endogenously oxidized low density
Veterinarni Medicina, 56, 2011 (1): 35–47 Original Paper
47
lipoprotein interfere with follicular thecal function. Jour-nal of Molecular Endocrinology 35, 531–545.
Martin C, Devillard E, Michalet-Doreau B (1999): Influence of sampling site on concentrations and carbohydrate-degrading enzyme activities of protozoa and bacteria in the rumen. Journal of Animal Science 77, 979–987.
McLeod KR, Baldwin RL (2000): Effects of diet forage:concentrate ratio and metabolizable energy intake on visceral organ growth and in vitro oxidative capacity of gut tissues in sheep. Journal of Animal Science 78, 760–770.
Penner GB, Taniguchi M, Guan LL, Beauchemin KA, Oba M (2009): Effect of dietary forage to concentrate ratio on volatile fatty acid absorption and the expression of genes related to volatile fatty acid absorption and me-tabolism in ruminal tissue. Journal of Dairy Science 92, 2767–2781.
Pfeffer E, Rahman KA (1974): Investigations on the locali-zation of magnesium absorption in ruminants (in Ger-man). Zeitschrift für Tierphysiologie, Tierernährung und Futtermittelkunde 33, 209–213.
Remond D, Ortigues I, Jouany JP (1995): Energy substrates for the rumen epithelium. Proceedings of the Nutrition Society 54, 95–105.
Reynolds CK, Tyrrell HF, Reynolds PJ (1991): Effect of diet forage-to-concentrate ratio and intake on energy me-tabolism in growing beef heifers: Whole body energy and nitrogen balance and visceral heat production. Journal of Nutrition 121, 994–1003.
Schweigel M, Park HS, Etschmann B, Martens H (2006): Characterization of the Na+-dependent Mg2+ transport in sheep ruminal epithelial cells. American Journal of Physiology – Gastrointestinal and Liver Physiology 290, G56–G65.
Sehested J, Diernaes L, Moller PD, Skadhauge E (1996): Trans-port of sodium across the isolated bovine rumen epithe-lium: interaction with short chain fatty acids, chloride and bicarbonate. Experimental Physiology 81, 79–94.
Sehested J, Basse A, Andersen JB, Diernaes L, Moller PD, Skadhauge E, Aaes O (1997): Feed-induced changes in transport across the rumen epithelium. Comparative Biochemistry and Physiology A 118, 385–386.
Sehested J, Andersen JB, Aaes O, Kristensen JB, Diernaes L, Moller PD, Skadhauge E (2000): Feed-induced changes in the transport of butyrate, sodium and chloride ions across the isolated bovine rumen epithelium. Acta Ag-ricultura Scandinavia A 50, 47–55.
Shen Z, Seyfert HM, Loehrke B, Schneider F, Zitnan R, Chudy A, Kuhla S, Hammon H, Blum JW, Martens H, Hagemeister H, Voigt J (2004): An energy-rich diet causes rumen papillae proliferation associated with more IGF type 1 receptors and increased plasma IGF-1 concentra-tions in young goats. Journal of Nutrition 134, 11–17.
Shen Z, Kuhla S, Zitnan R, Seyfert HM, Schneider F, Hage-meister H, Chudy A, Loehrke B, Blum JW, Hammon H, Voigt J (2005): Intraruminal infusion of n-butyric acid induces an increase of ruminal papillae size independent of IGF-1 system in castrated bulls. Archives of Animal Nutrition 59, 213–225.
Storeheier PV, Sehested J, Dieraes L, Sundset MA, Math-iesen SD (2003): Effects of seasonal changes in food qual-ity and food intake on the transport of sodium and butyrate across ruminal epithelium of reindeer. Journal of Comparative Physiology B 173, 391–399.
Thorlacius SO (1972): Effect of steam-volatile fatty acids and carbon dioxide on blood content of rumen papillae of the cow. American Journal of Veterinary Research 33, 427–430.
Ulbrich SE, Rehfeld S, Bauersachs S, Wolf E, Rottmayer R, Hiendleder S, Vermehren M, Sinowatz F, Meyer HHD, Ein-spanier R (2006): Region-specific expression of nitric oxide synthases in the bovine oviduct during the oestrous cycle and in vitro. Journal of Endocrinology 188, 205–213.
Uppal SK, Wolf K, Khara SS, Martens H (2003): Modulation of Na+ transport across isolated rumen epithelium by short chain fatty acids in hay- and concentrate-fed sheep. Journal of Animal Physiology and Animal Nutrition 87, 380–388.
Zouzoulas A, Dunham PB, Blostein R (2005): The effect of the gamma modulator on Na/K pump activity of intact mammalian cells. Journal of Membrane Biology 204, 49–56.
Received: 2010–07–19Accepted after corrections: 2010–12–13
Corresponding Author:
Dr. Monika Roentgen, Research Unit Nutritional Physiology “Oskar Kellner”, Leibniz Institute for Farm Animal Biology (FBN), Wilhelm-Stahl-Allee 2, D-18196 Dummerstorf, GermanyTel. +49 38208 68682, E-mail: [email protected]