Embed Size (px)
Citation preview

Alternative Energy Development Plan (AEDP) 2015
Yaowateera Achawangkul, Ph.D.
Department of Alternative Energy Development and Efficiency
Thailand Integrated Energy Blueprint4th June 2015
1
2
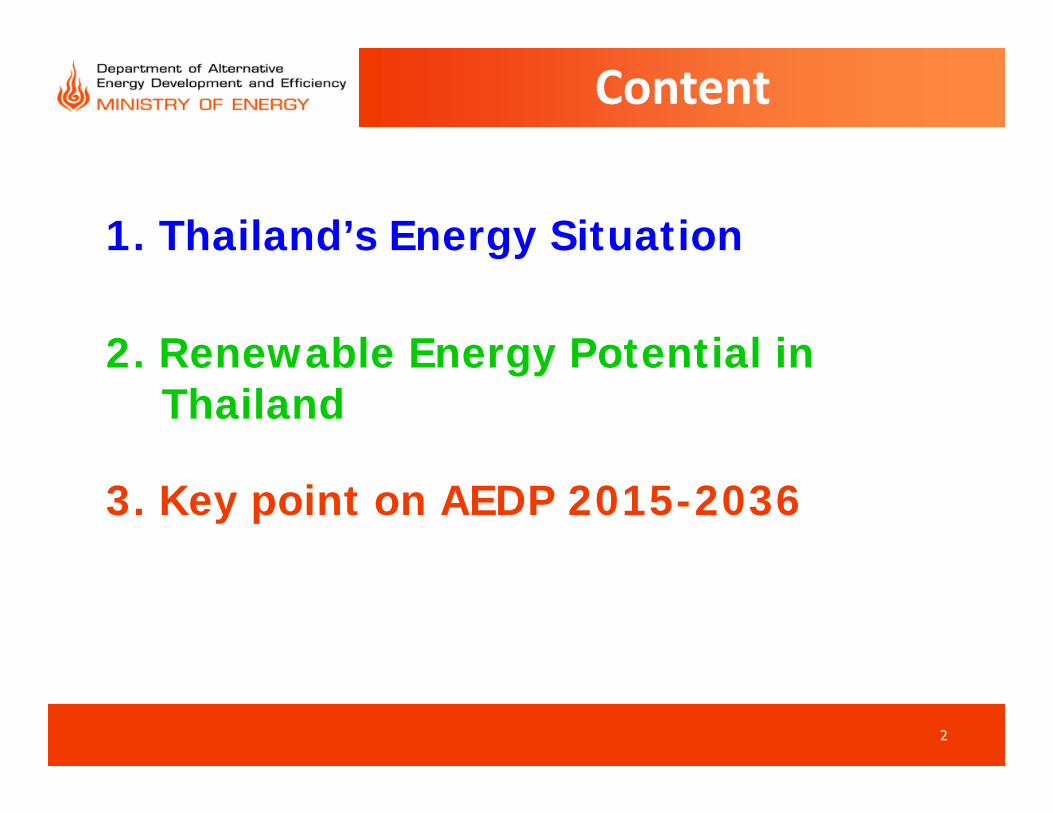
Content
1. Thailand’s Energy Situation
2. Renewable Energy Potential in Thailand
3. Key point on AEDP 2015-2036

Thailand’s Energy Situation
3
4
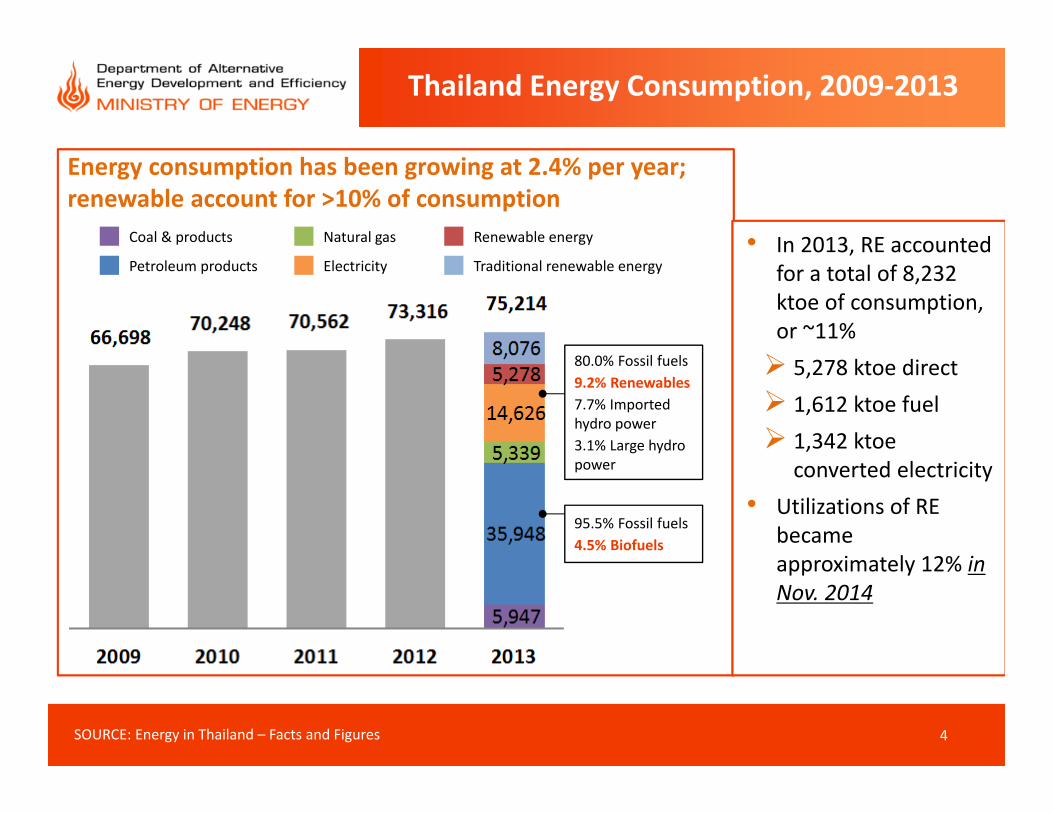
Thailand Energy Consumption, 2009‐2013
• In 2013, RE accounted for a total of 8,232 ktoe of consumption, or ~11% 5,278 ktoe direct 1,612 ktoe fuel 1,342 ktoe
converted electricity• Utilizations of RE
became approximately 12% in Nov. 2014
Coal & products
Petroleum products
Natural gas
Electricity
Renewable energy
Traditional renewable energy
95.5% Fossil fuels4.5% Biofuels
80.0% Fossil fuels9.2% Renewables7.7% Imported hydro power3.1% Large hydro power
SOURCE: Energy in Thailand – Facts and Figures
Energy consumption has been growing at 2.4% per year; renewable account for >10% of consumption
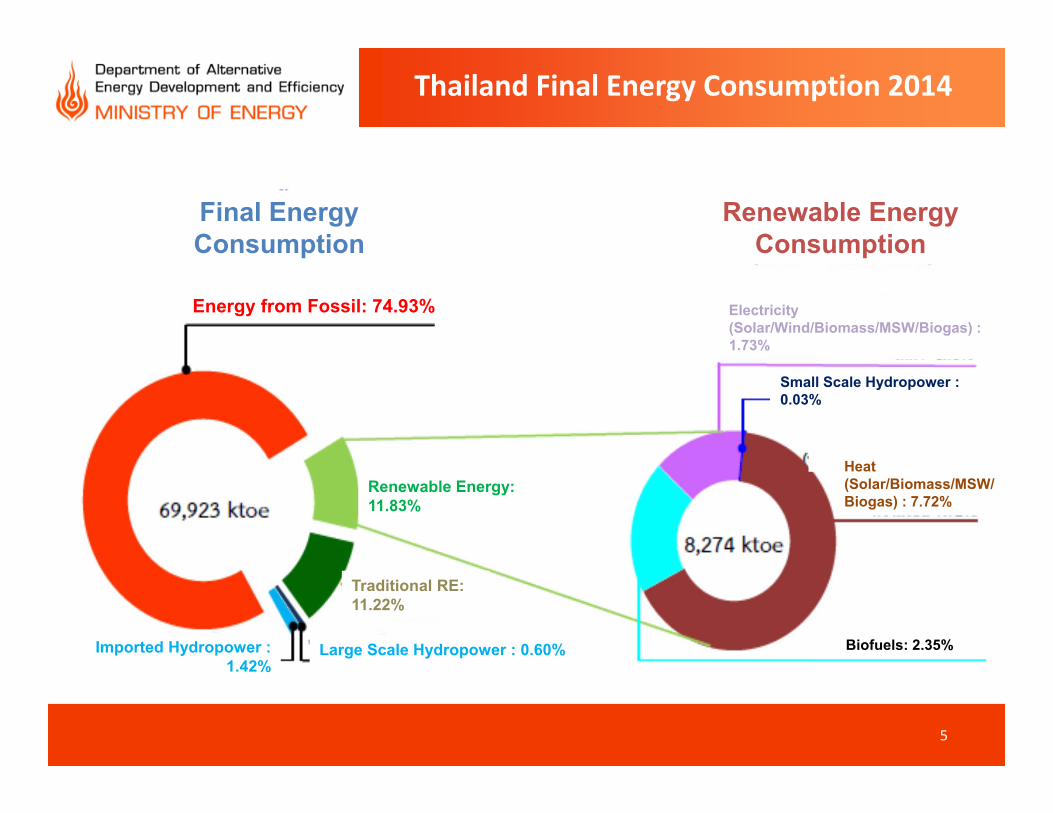
Thailand Final Energy Consumption 2014
Final Energy Consumption
Renewable Energy Consumption
Energy from Fossil: 74.93%
Renewable Energy: 11.83%
Traditional RE: 11.22%
Imported Hydropower : 1.42%
Large Scale Hydropower : 0.60%
Electricity (Solar/Wind/Biomass/MSW/Biogas) : 1.73%
Small Scale Hydropower : 0.03%
Heat (Solar/Biomass/MSW/Biogas) : 7.72%
Biofuels: 2.35%
5
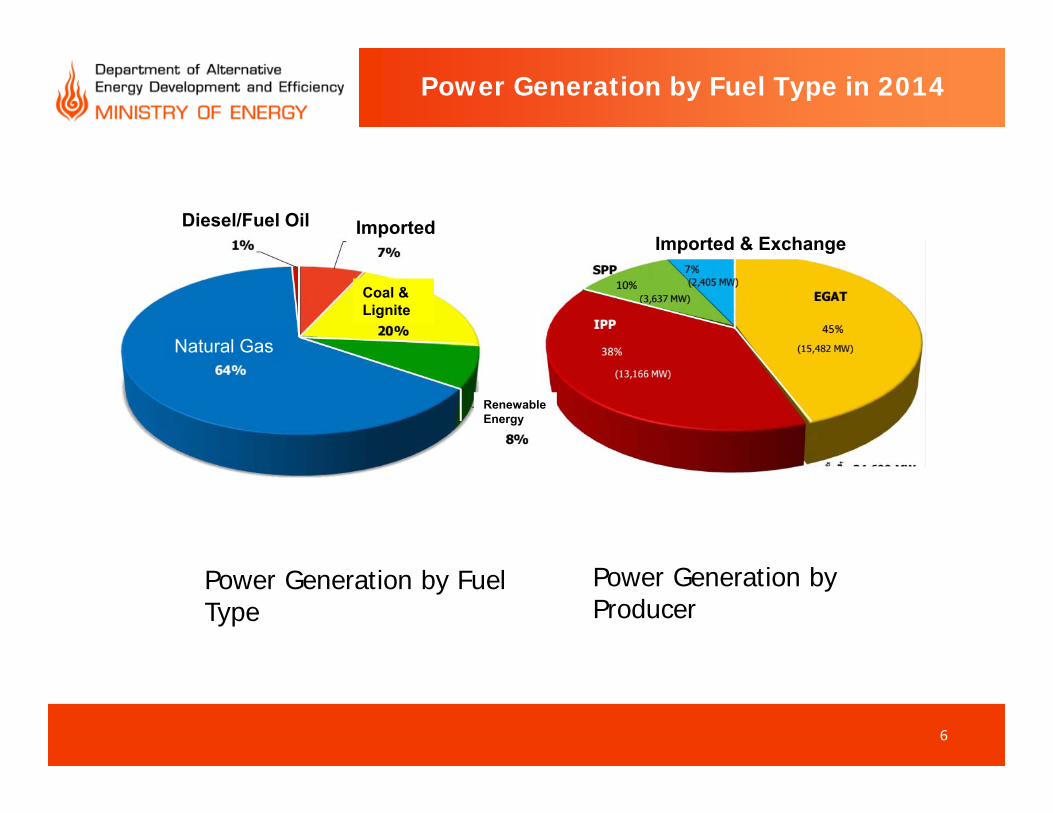
Power Generation by Fuel Type in 2014
Power Generation by Fuel Type
Power Generation by Producer
Natural Gas
Diesel/Fuel Oil Imported
Renewable Energy
Coal & Lignite
Imported & Exchange
6
7
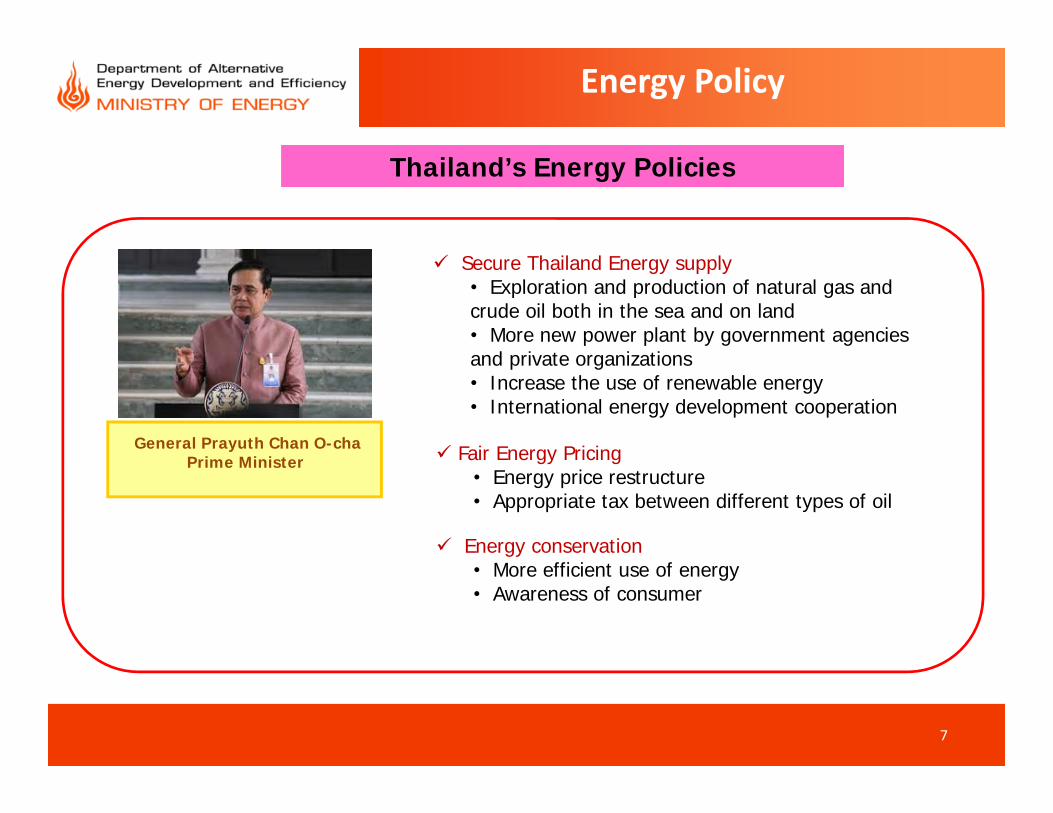
Energy Policy
Thailand’s Energy Policies
General Prayuth Chan O-chaPrime Minister
Secure Thailand Energy supply• Exploration and production of natural gas and crude oil both in the sea and on land• More new power plant by government agencies and private organizations • Increase the use of renewable energy• International energy development cooperation
Fair Energy Pricing• Energy price restructure• Appropriate tax between different types of oil
Energy conservation• More efficient use of energy • Awareness of consumer

Renewable Energy Potential in Thailand
8
9
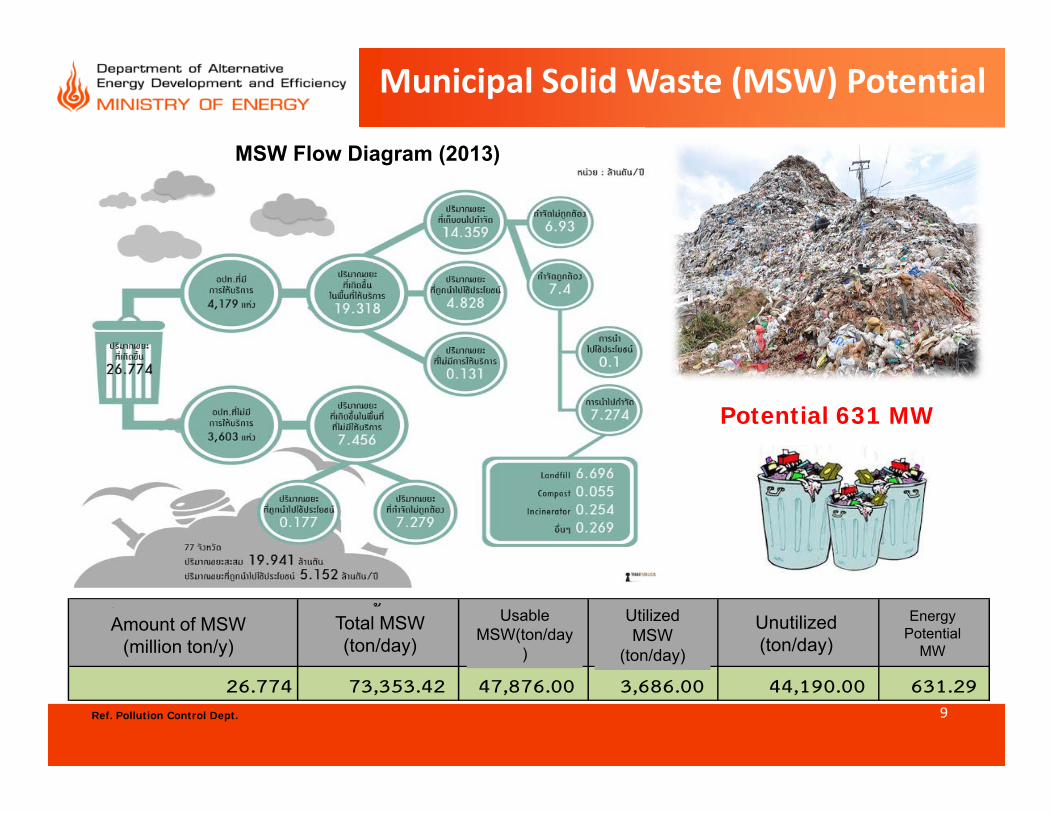
Municipal Solid Waste (MSW) Potential
ข้อมูลปริมาณขยะ ขยะทัง้หมด นําไปใช้ได้ ใช้ไปแล้ว คงเหลือ กําลังผลิต
ของ คพ. (ล้านตัน/ปี) (ตัน/วัน) (ตัน/วัน) (ตัน/วัน) (ตัน/วัน) (MW)
26.774 73,353.42 47,876.00 3,686.00 44,190.00 631.29
Potential 631 MW
Ref. Pollution Control Dept.
MSW Flow Diagram (2013)
Amount of MSW (million ton/y)
Total MSW (ton/day)
Utilized MSW
(ton/day)
Usable MSW(ton/day
)
Unutilized (ton/day)
Energy Potential
MW
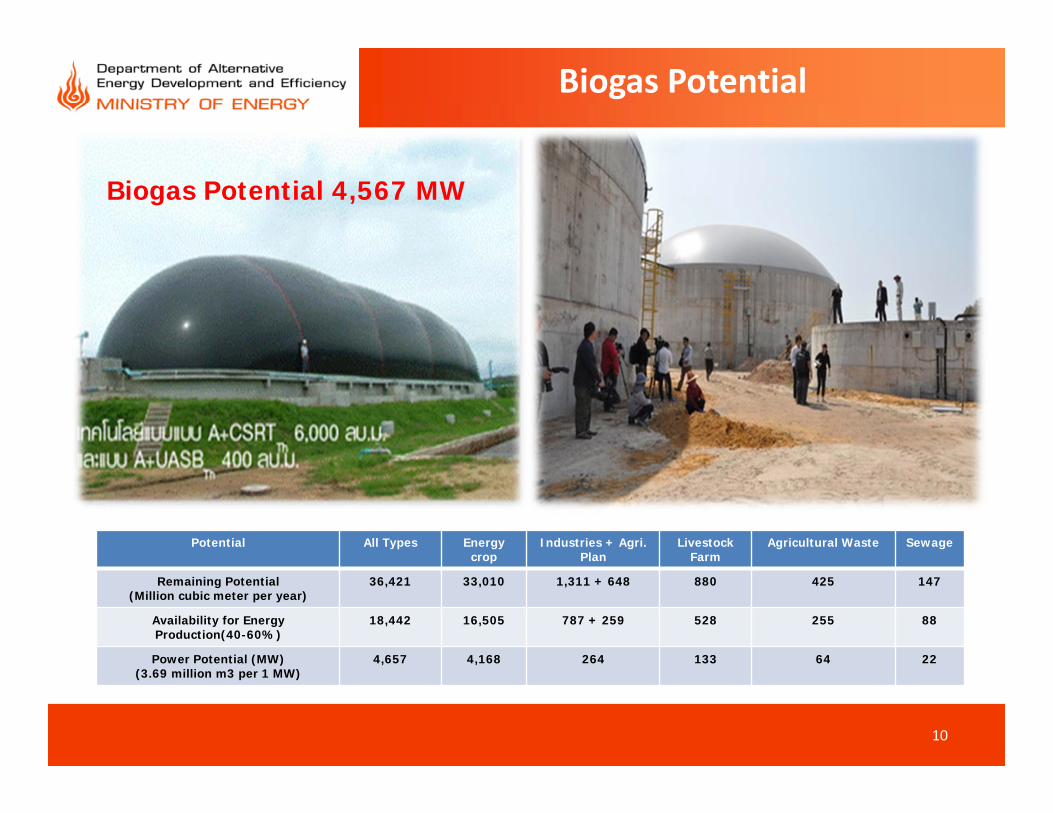
Biogas Potential
Biogas Potential 4,567 MW
Potential All Types Energy crop
Industries + Agri. Plan
Livestock Farm
Agricultural Waste Sewage
Remaining Potential(Million cubic meter per year)
36,421 33,010 1,311 + 648 880 425 147
Availability for Energy Production(40-60%)
18,442 16,505 787 + 259 528 255 88
Power Potential (MW)(3.69 million m3 per 1 MW)
4,657 4,168 264 133 64 22
10
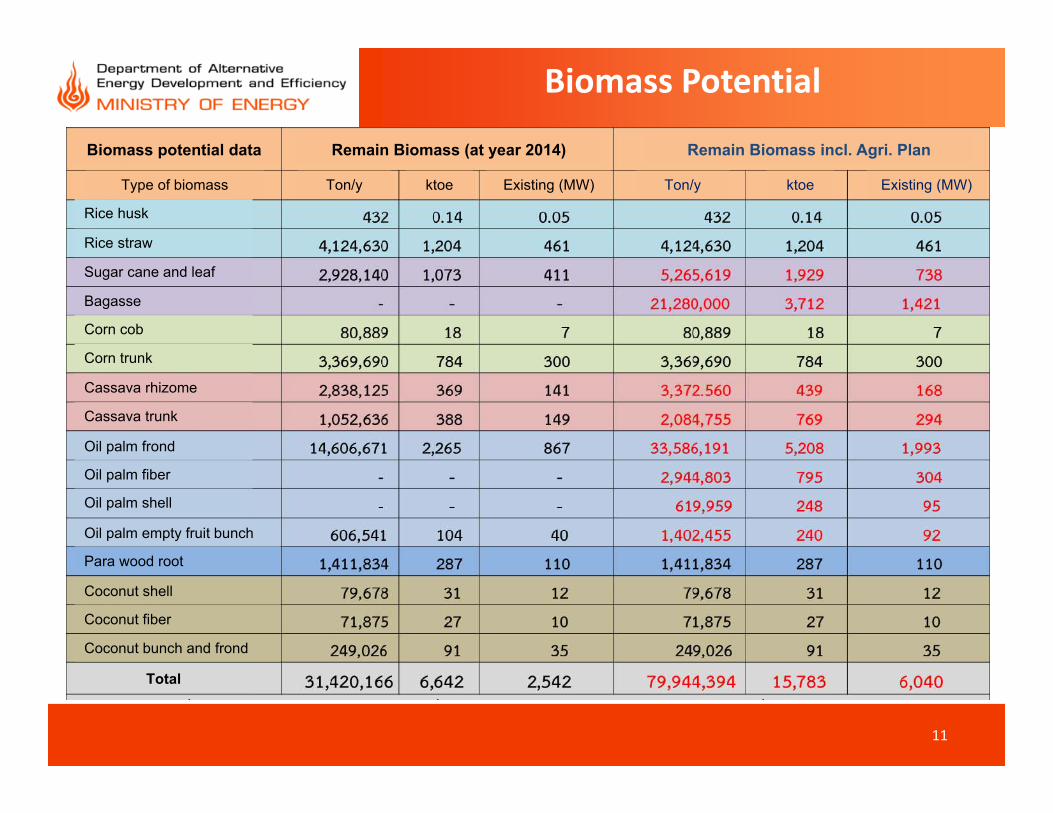
Biomass Potential
Biomass potential data Remain Biomass (at year 2014) Remain Biomass incl. Agri. Plan
Type of biomass Ton/y Existing (MW)ktoe Ton/y ktoe Existing (MW)
Rice husk
Rice straw
Sugar cane and leaf
Bagasse
Corn cob
Corn trunk
Cassava rhizome
Cassava trunk
Oil palm frond
Oil palm fiber
Oil palm shell
Oil palm empty fruit bunch
Para wood root
Coconut shell
Coconut fiber
Coconut bunch and frond
Total
11
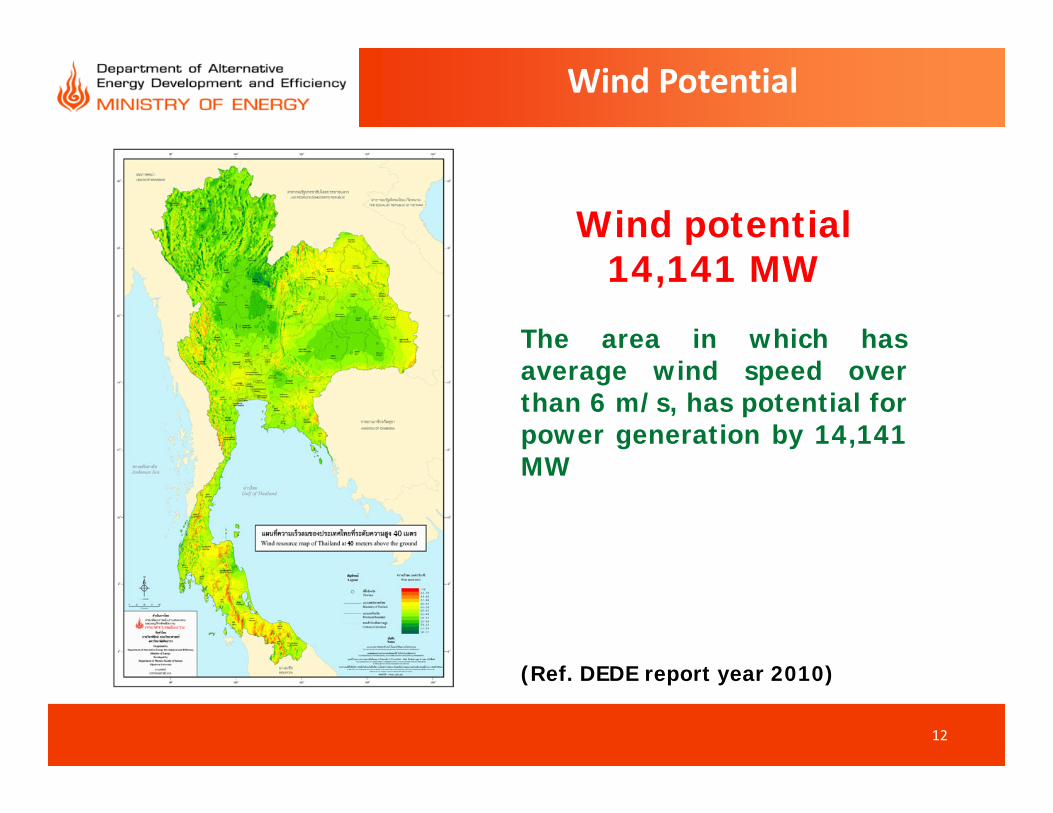
Wind Potential
Wind potential 14,141 MW
The area in which has average wind speed over than 6 m/s, has potential for power generation by 14,141 MW
(Ref. DEDE report year 2010)
12
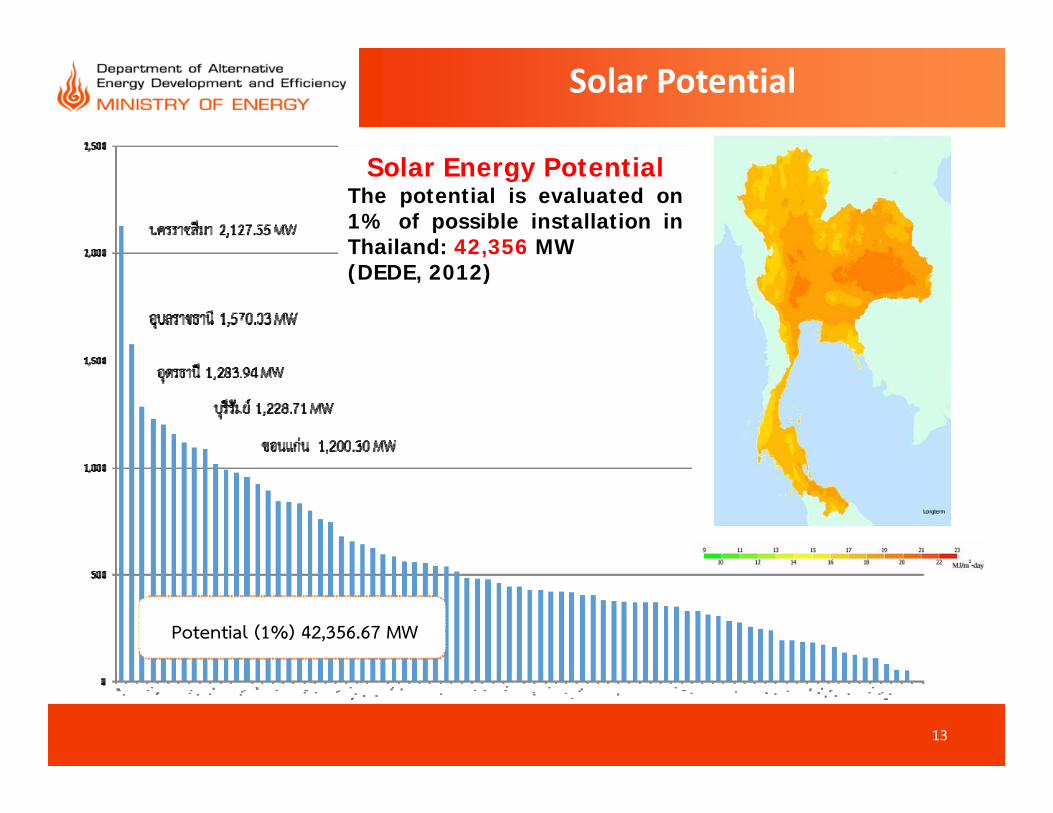
Solar Potential
Solar Energy PotentialThe potential is evaluated on 1% of possible installation in Thailand: 42,356 MW(DEDE, 2012)
Potential (1%) 42,356.67 MW
13
Key point on AEDP 2015-2036
14
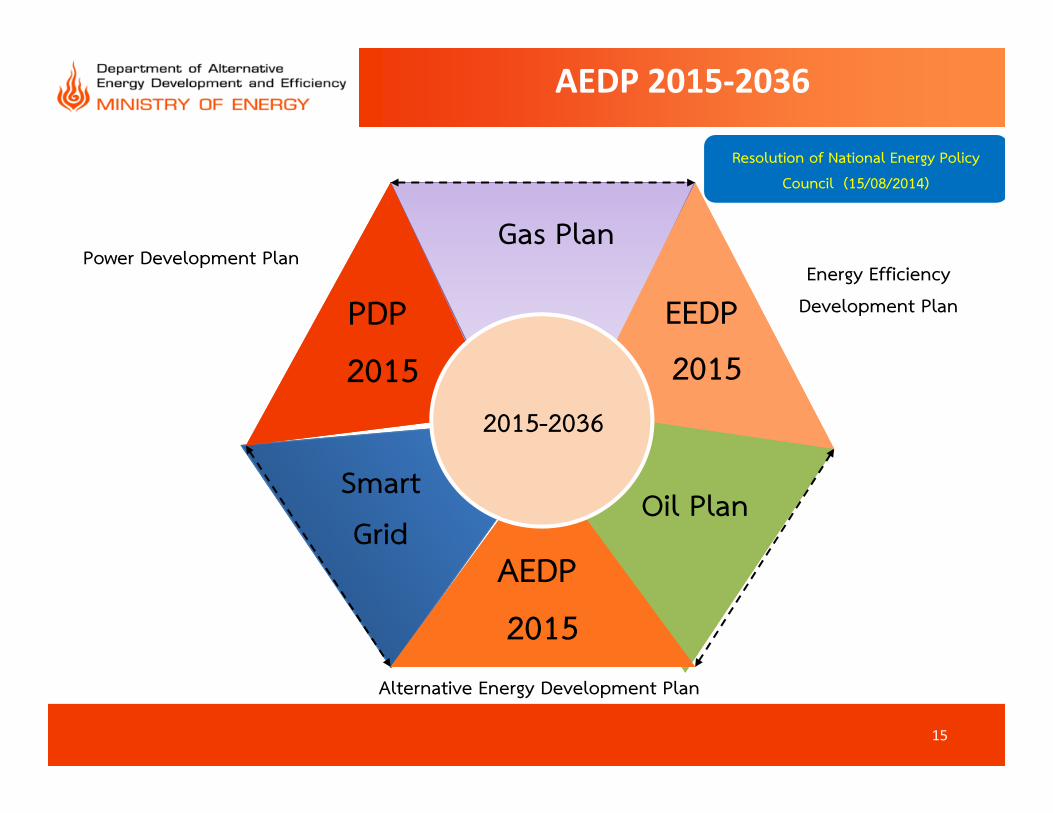
AEDP 2015‐2036
15
PDP
2015
EEDP
2015
AEDP
2015
Power Development Plan
2015-2036
Energy Efficiency
Development Plan
Alternative Energy Development Plan
Resolution of National Energy Policy
Council (15/08/2014)
Smart
Grid Oil Plan
Gas Plan
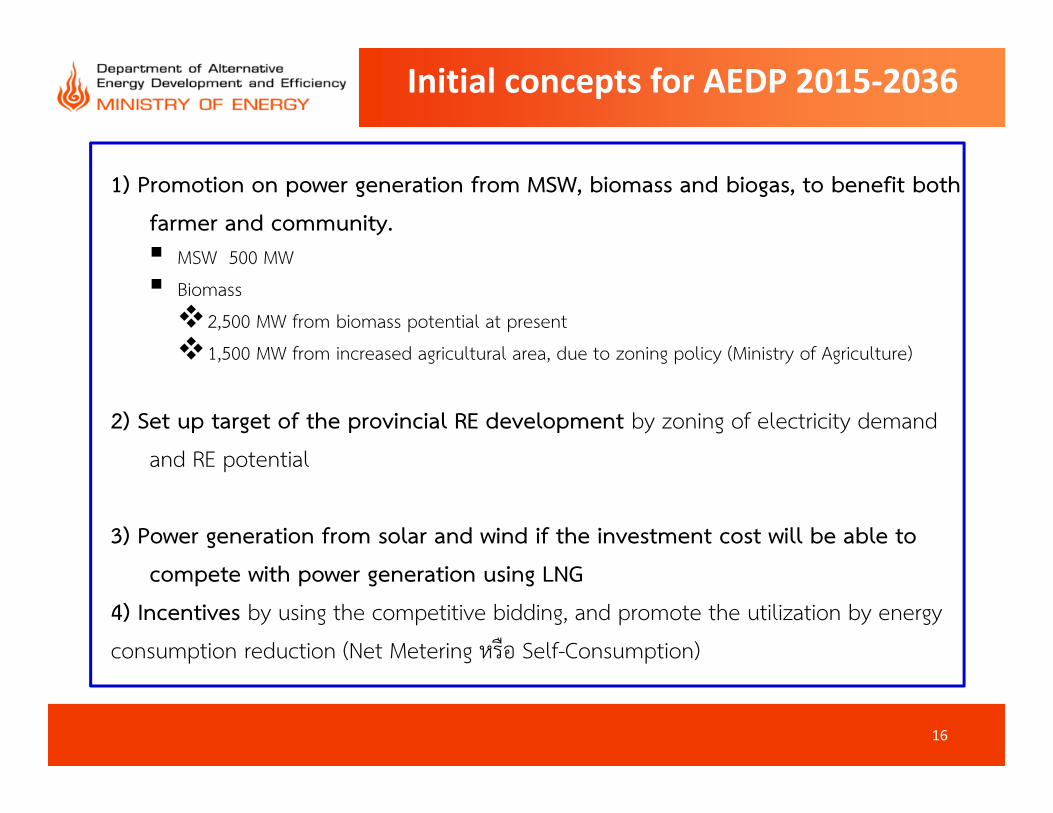
Initial concepts for AEDP 2015‐2036
1) Promotion on power generation from MSW, biomass and biogas, to benefit both
farmer and community. MSW 500 MW
Biomass
2,500 MW from biomass potential at present
1,500 MW from increased agricultural area, due to zoning policy (Ministry of Agriculture)
2) Set up target of the provincial RE development by zoning of electricity demand
and RE potential
3) Power generation from solar and wind if the investment cost will be able to
compete with power generation using LNG
4) Incentives by using the competitive bidding, and promote the utilization by energy
consumption reduction (Net Metering หรือ Self-Consumption)
16
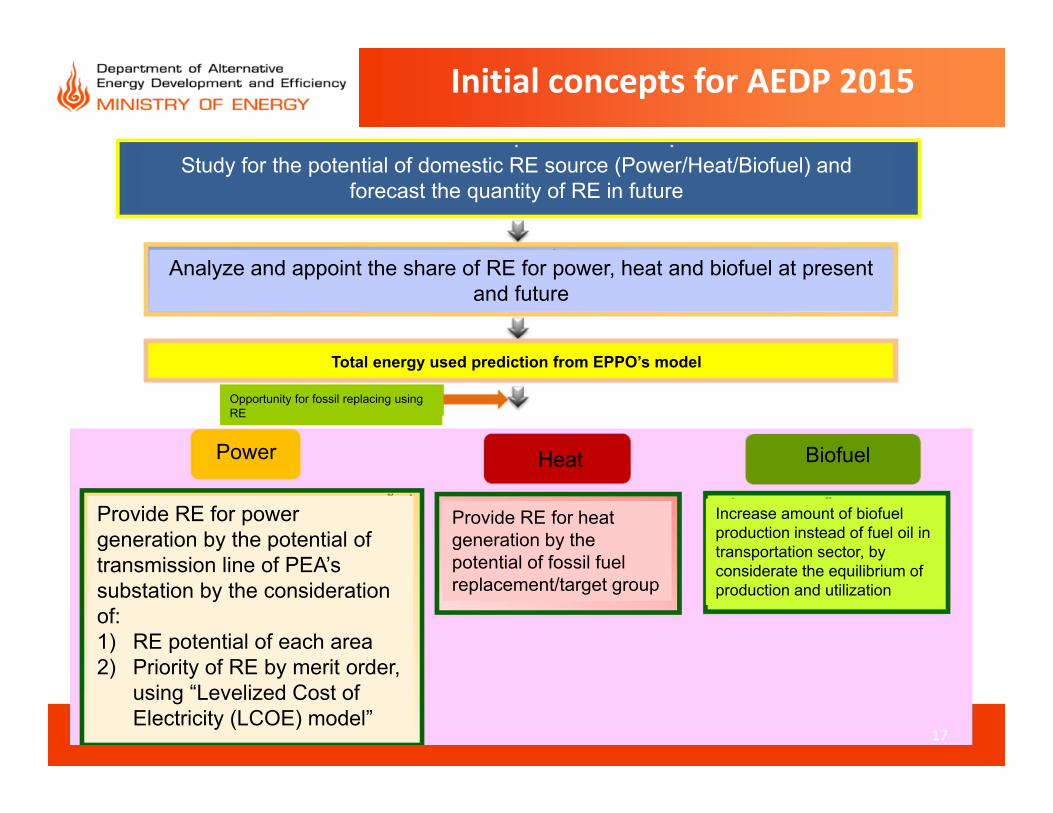
Initial concepts for AEDP 2015
Study for the potential of domestic RE source (Power/Heat/Biofuel) and forecast the quantity of RE in future
Analyze and appoint the share of RE for power, heat and biofuel at present and future
Total energy used prediction from EPPO’s model
Power Heat Biofuel
Provide RE for power generation by the potential of transmission line of PEA’s substation by the consideration of: 1) RE potential of each area2) Priority of RE by merit order,
using “Levelized Cost of Electricity (LCOE) model”
Provide RE for heat generation by the potential of fossil fuel replacement/target group
Increase amount of biofuel production instead of fuel oil in transportation sector, by considerate the equilibrium of production and utilization
17
Opportunity for fossil replacing using RE
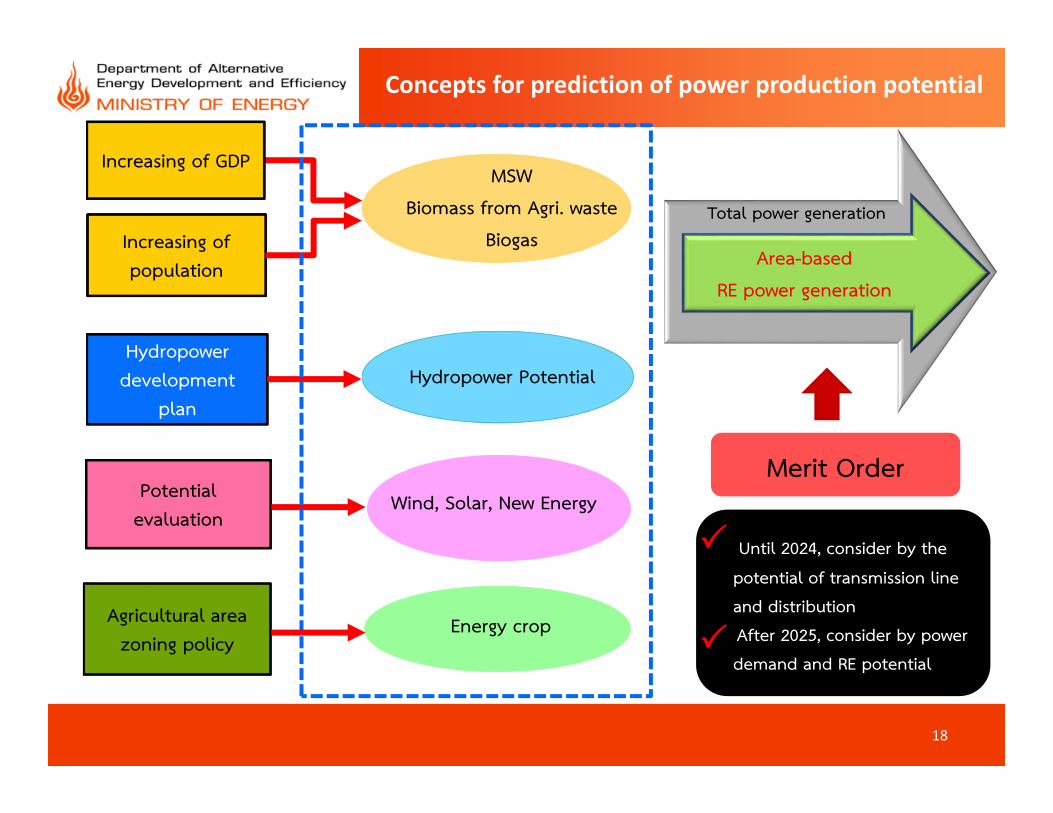
Concepts for prediction of power production potential
18
Area-based
RE power generation
Total power generation
Increasing of population
Hydropower development
plan
Wind, Solar, New EnergyPotential evaluation
Energy crop Energy cropAgricultural area zoning policy
Merit Order
Until 2024, consider by the
potential of transmission line
and distribution
After 2025, consider by power
demand and RE potential
Increasing of GDPMSW
Biomass from Agri. waste
Biogas
Hydropower Potential
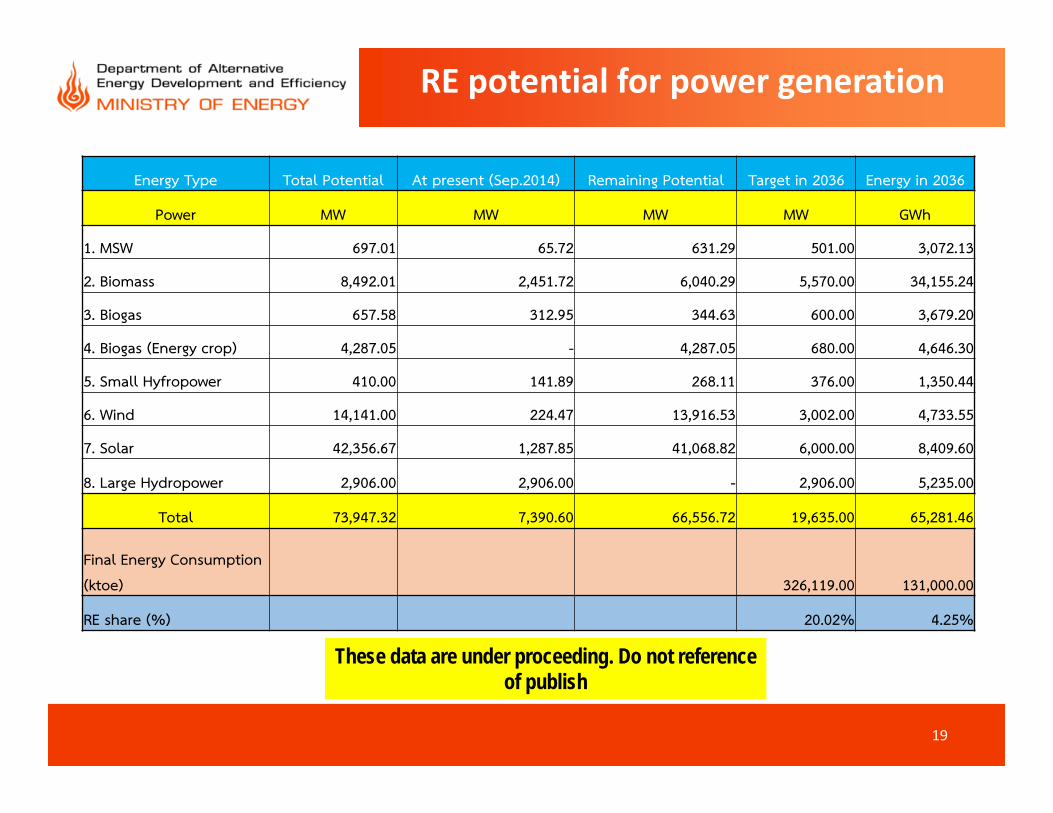
RE potential for power generation
19
These data are under proceeding. Do not reference of publish
Energy Type Total Potential At present (Sep.2014) Remaining Potential Target in 2036 Energy in 2036
Power MW MW MW MW GWh
1. MSW 697.01 65.72 631.29 501.00 3,072.13
2. Biomass 8,492.01 2,451.72 6,040.29 5,570.00 34,155.24
3. Biogas 657.58 312.95 344.63 600.00 3,679.20
4. Biogas (Energy crop) 4,287.05 - 4,287.05 680.00 4,646.30
5. Small Hyfropower 410.00 141.89 268.11 376.00 1,350.44
6. Wind 14,141.00 224.47 13,916.53 3,002.00 4,733.55
7. Solar 42,356.67 1,287.85 41,068.82 6,000.00 8,409.60
8. Large Hydropower 2,906.00 2,906.00 - 2,906.00 5,235.00
Total 73,947.32 7,390.60 66,556.72 19,635.00 65,281.46
Final Energy Consumption
(ktoe) 326,119.00 131,000.00
RE share (%) 20.02% 4.25%
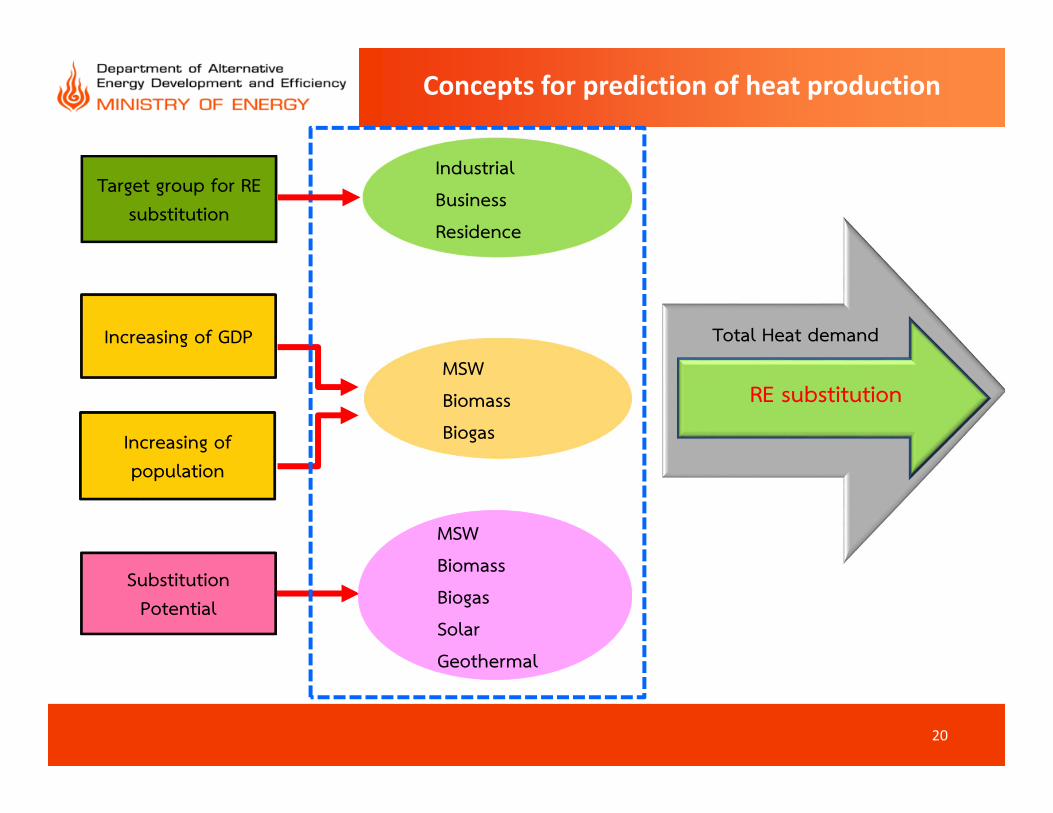
Concepts for prediction of heat production
RE substitution
Total Heat demandIncreasing of GDP
Increasing of population
Substitution Potential
MSW
Biomass
Biogas
MSW
Biomass
Biogas
Solar
Geothermal
Target group for RE substitution
Industrial
Business
Residence
20
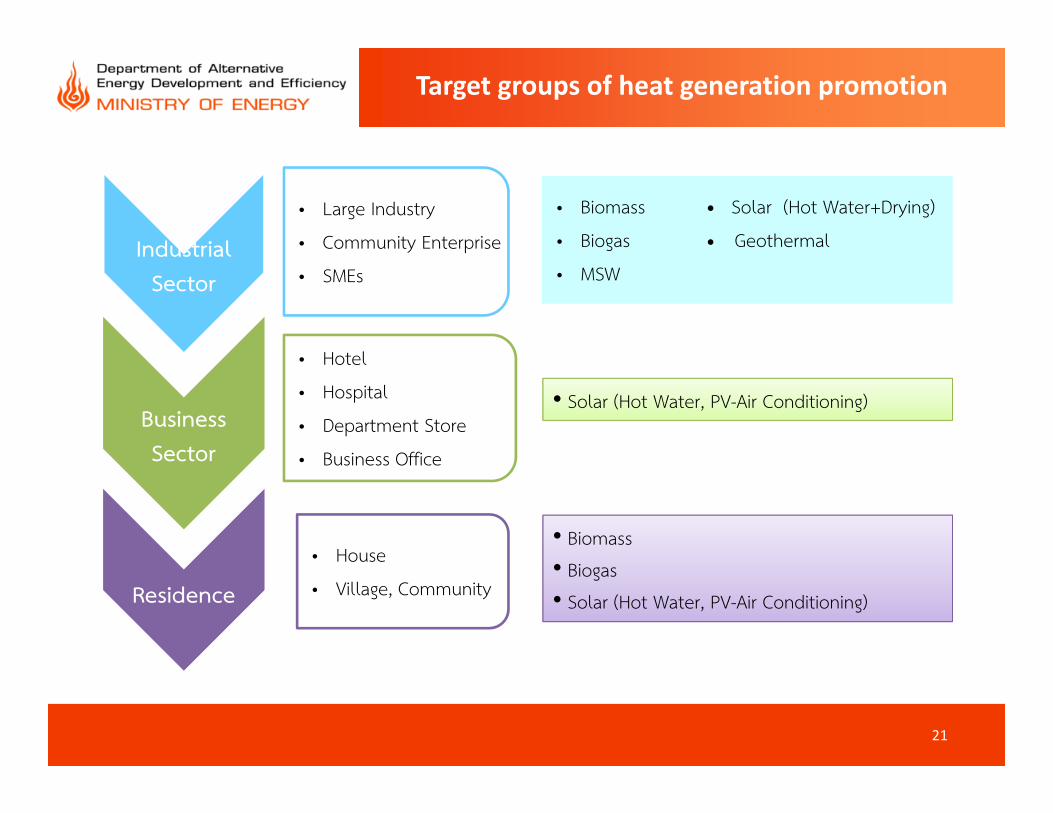
Target groups of heat generation promotion
• Hotel
• Hospital
• Department Store
• Business Office
• Large Industry
• Community Enterprise
• SMEs
• House
• Village, Community
Industrial Sector
Business Sector
Residence
• Biomass Solar (Hot Water+Drying)
• Biogas Geothermal
• MSW
• Biomass Solar (Hot Water+Drying)
• Biogas Geothermal
• MSW
• Solar (Hot Water, PV-Air Conditioning)
• Biomass
• Biogas
• Solar (Hot Water, PV-Air Conditioning)
21
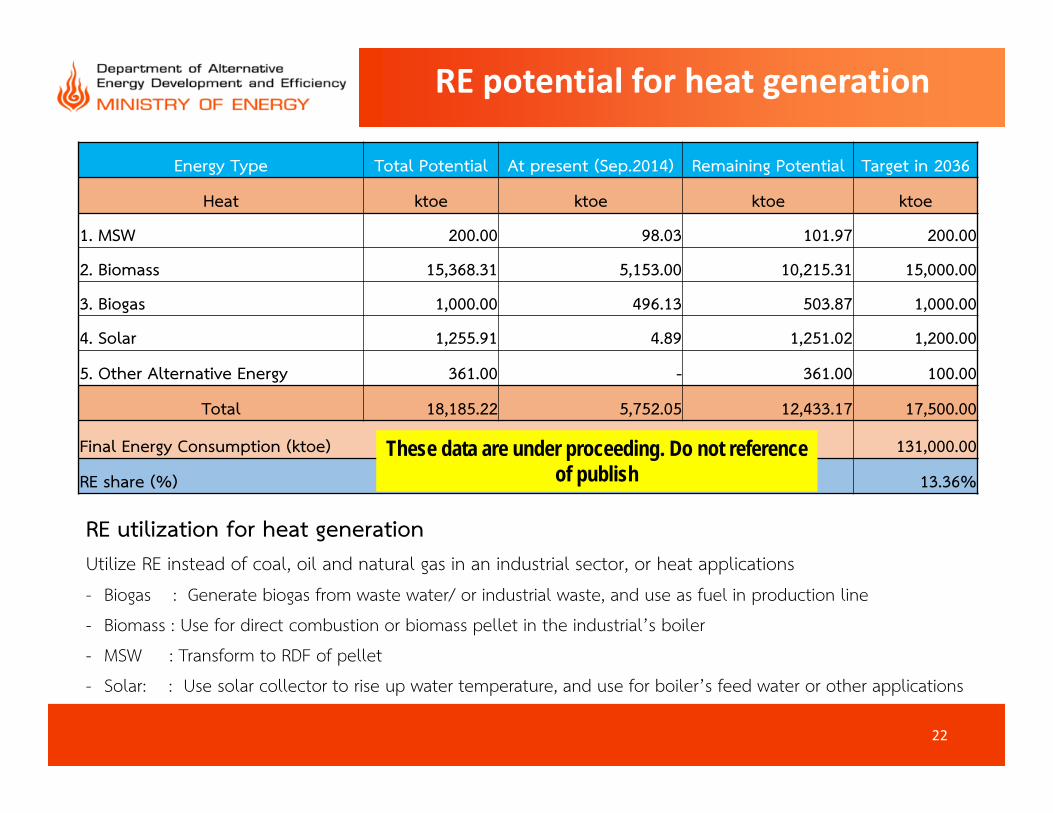
RE potential for heat generation
22
Energy Type Total Potential At present (Sep.2014) Remaining Potential Target in 2036
Heat ktoe ktoe ktoe ktoe
1. MSW 200.00 98.03 101.97 200.00
2. Biomass 15,368.31 5,153.00 10,215.31 15,000.00
3. Biogas 1,000.00 496.13 503.87 1,000.00
4. Solar 1,255.91 4.89 1,251.02 1,200.00
5. Other Alternative Energy 361.00 - 361.00 100.00
Total 18,185.22 5,752.05 12,433.17 17,500.00
Final Energy Consumption (ktoe) 131,000.00
RE share (%) 13.36%
These data are under proceeding. Do not reference of publish
RE utilization for heat generationUtilize RE instead of coal, oil and natural gas in an industrial sector, or heat applications- Biogas : Generate biogas from waste water/ or industrial waste, and use as fuel in production line
- Biomass : Use for direct combustion or biomass pellet in the industrial’s boiler
- MSW : Transform to RDF of pellet
- Solar: : Use solar collector to rise up water temperature, and use for boiler’s feed water or other applications
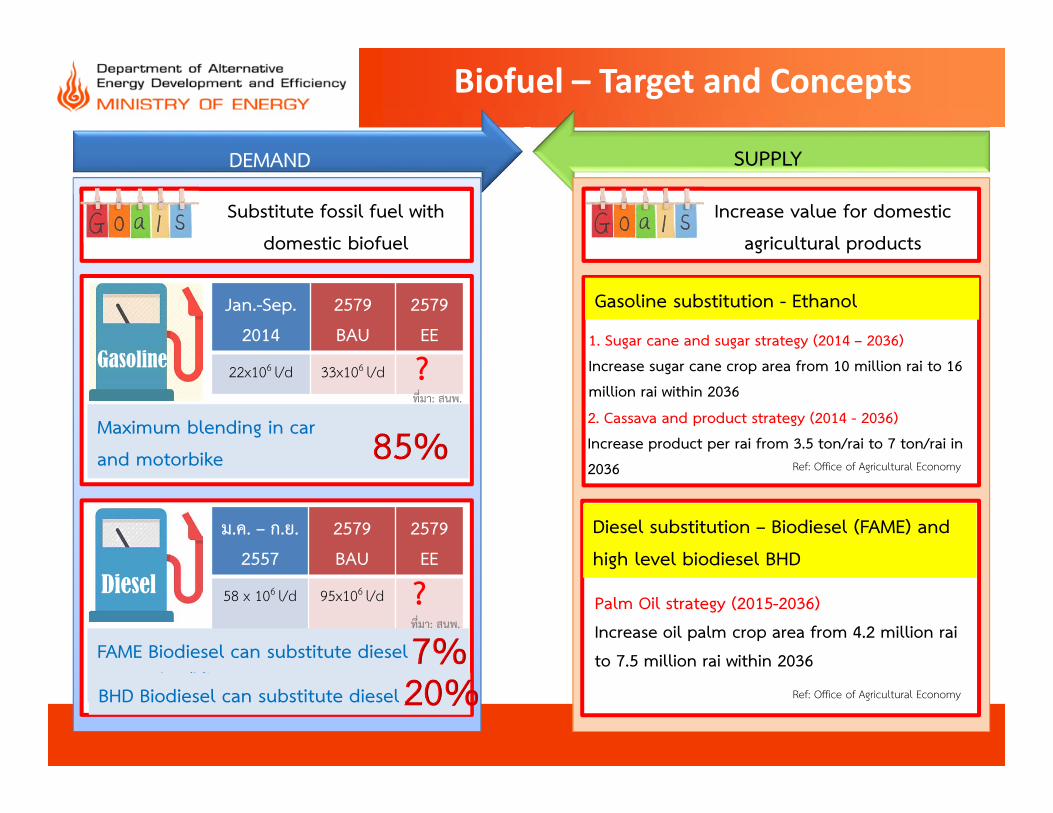
Biofuel – Target and Concepts
SUPPLYDEMAND SUPPLY
Substitute fossil fuel with
domestic biofuel
Increase value for domestic
agricultural products
Diesel
Gasoline
Jan.-Sep.
2014
2579
BAU
2579
EE
22x106 l/d 33x106 l/d
ม.ค. – ก.ย.
2557
2579
BAU
2579
EE
58 x 106 l/d 95x106 l/d
Maximum blending in car
and motorbike
FAME Biodiesel can substitute diesel
ทดแทนดีเซลได้สูงสุดBHD Biodiesel can substitute diesel
1. Sugar cane and sugar strategy (2014 – 2036)
Increase sugar cane crop area from 10 million rai to 16
million rai within 2036
Gasoline substitution - Ethanol
2. Cassava and product strategy (2014 - 2036)
Increase product per rai from 3.5 ton/rai to 7 ton/rai in
2036
ที่มา: สนพ.
ที่มา: สนพ.
Diesel substitution – Biodiesel (FAME) and
high level biodiesel BHD
Palm Oil strategy (2015-2036)
Increase oil palm crop area from 4.2 million rai
to 7.5 million rai within 2036
?
?
Ref: Office of Agricultural Economy
Ref: Office of Agricultural Economy

Promotion guidelines
24
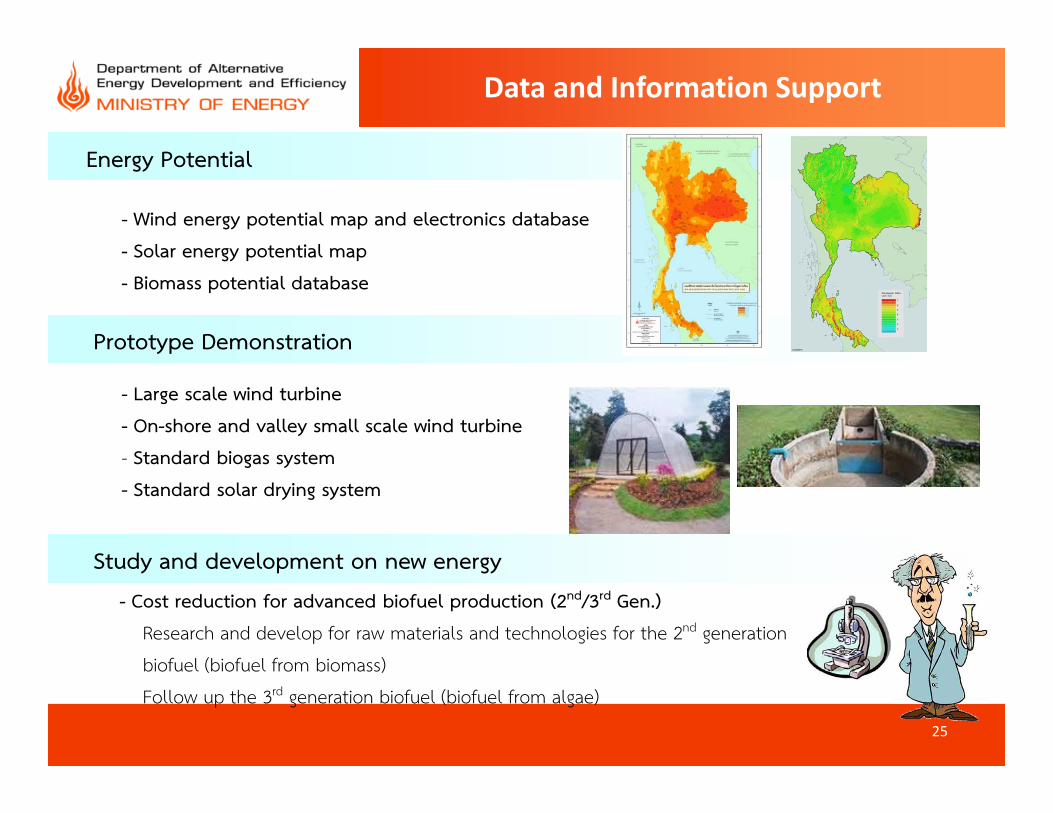
Data and Information Support
25
Energy Potential
- Wind energy potential map and electronics database
- Solar energy potential map
- Biomass potential database
Prototype Demonstration
- Large scale wind turbine
- On-shore and valley small scale wind turbine
- Standard biogas system
- Standard solar drying system
- Cost reduction for advanced biofuel production (2nd/3rd Gen.)
Research and develop for raw materials and technologies for the 2nd generation
biofuel (biofuel from biomass)
Follow up the 3rd generation biofuel (biofuel from algae)
Study and development on new energy
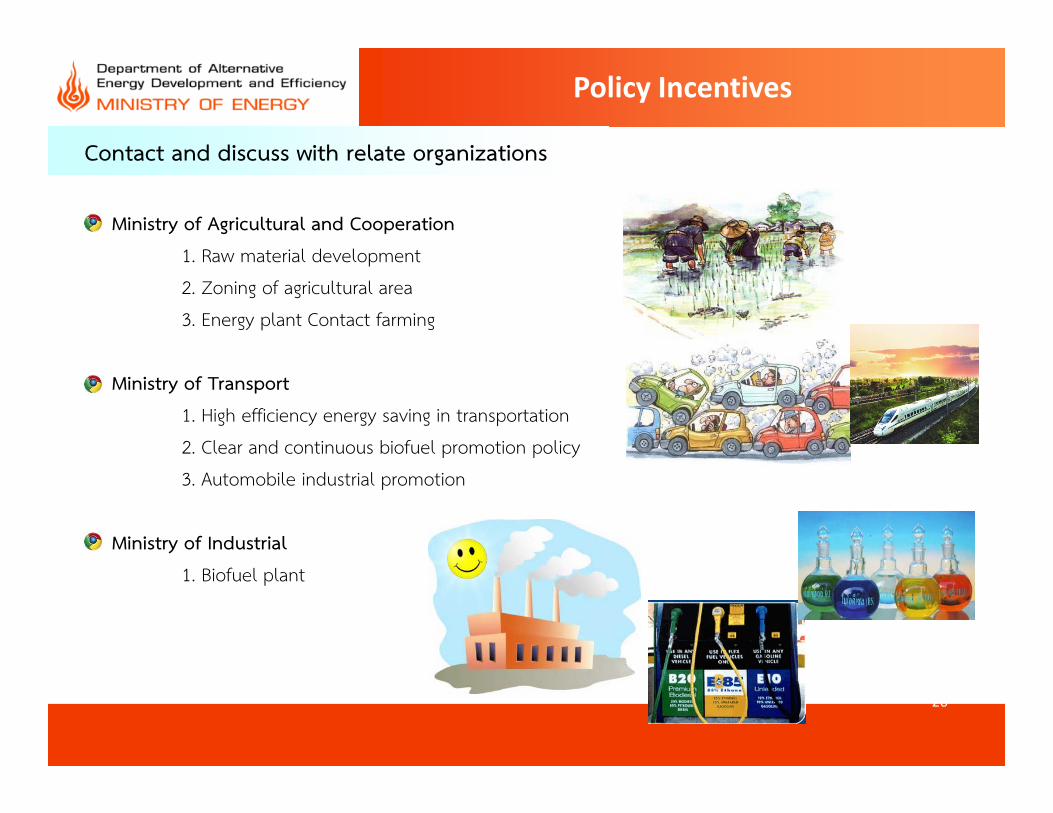
Policy Incentives
26
Ministry of Agricultural and Cooperation
1. Raw material development
2. Zoning of agricultural area
3. Energy plant Contact farming
Ministry of Transport
1. High efficiency energy saving in transportation
2. Clear and continuous biofuel promotion policy
3. Automobile industrial promotion
Ministry of Industrial
1. Biofuel plant
Contact and discuss with relate organizations
Thank you for Your attention
27