Embed Size (px)
Citation preview
Ambient Insight
Premium Report
The 2013-2018 Worldwide Digital English Language Learning Market
Five Major Catalysts Driving a Surge in Revenues in All Seven Regions
“We Put Research into Practice”
www.ambientinsight.com
Market Analysis by: Sam S. Adkins, Chief Research Officer
Published: August 2014
To learn more about our research services, email:
Ambient Insight Copyright Policy: All rights reserved. All media and research data published by Ambient Insight are protected by copyright. Unauthorized use of Ambient Insight research without prior permission is prohibited. Ambient Insight research products provide valuable financial data only to the individual purchaser or the purchasing organization. Purchasers may not modify or repurpose the information and financial data in our research in any manner. Specific distribution rights are provided based on the license model granted at time of purchase. Quoting Ambient Insight Research: Permission is required to use quotes, tables, diagrams, or charts from Ambient Insight research in press releases, promotional material, external presentations, or commercial publications. Permission from Ambient Insight is required to reproduce or distribute in entirety any table, paragraph, section, or report.
Ambient Insight’s The 2013-2018 Worldwide Market for Digital English Language Learning Products. Premium Edition
For more information about this research, email: [email protected] 2
Table of Contents
List of Tables ...................................................................... 6
List of Figures ................................................................... 13
Executive Overview ........................................................... 15
The Big Picture ......................................................................... 19
The Five Major Catalysts ............................................................ 20
Large-scale Digitization Initiatives in the Academic Segments .................21
New English Language Learning Educational Policies ..............................23
Consumer Demand for Mobile Digital Language Learning ........................25
The Proliferation of Mobile Learning Value Added Services (VAS) .............26
Strong Demand for Specialized Forms of English ...................................28
Secondary Catalysts ................................................................. 30
Leading Indicators: Private Investment Patterns ....................................30
Government-funded Online English ESL Programs ..................................33
Private Language Schools Go Digital ....................................................35
What You Will Find in This Report ............................................... 38
Who Are the Buyers? .........................................................................39
What Are They Buying? ......................................................................40
Related Research ...................................................................... 43
2013-2018 Worldwide Forecast and Analysis......................... 44
Worldwide Demand-Side by Seven Regions ...........................................44
Worldwide Supply-Side by Five Product Types .......................................44
Africa Demand-Side Analysis by Sixteen Countries ........................ 45
Algeria ....................................................................................................... 48
Angola ........................................................................................................ 51
Ethiopia ...................................................................................................... 54
Ghana ........................................................................................................ 57
Kenya ........................................................................................................ 60
Morocco ...................................................................................................... 62
Mozambique ................................................................................................ 64
Nigeria ....................................................................................................... 66
Rwanda ...................................................................................................... 70
Senegal ...................................................................................................... 72
South Africa ................................................................................................ 74
Tanzania ..................................................................................................... 79
Tunisia ....................................................................................................... 81
Uganda....................................................................................................... 83
Zambia ....................................................................................................... 85
Zimbabwe ................................................................................................... 87
Ambient Insight’s The 2013-2018 Worldwide Market for Digital English Language Learning Products. Premium Edition
For more information about this research, email: [email protected] 3
Africa Supply-Side Analysis by Five Product Types .................................89
Asia Demand-Side Analysis by Twenty Countries .......................... 91
Australia ..................................................................................................... 96
Bangladesh ................................................................................................. 97
Cambodia ................................................................................................... 98
China (including Hong Kong and Macao) ......................................................... 99 Emphasis on Digital English in the PreK-12 Schools .................................................... 101 Digital English Expands in the Tertiary System ........................................................... 104 All Roads Lead to Mobile: The Consumer Demand ....................................................... 106 High Demand for Vocational English .......................................................................... 110
India ........................................................................................................ 112
Indonesia ................................................................................................. 117
Japan ....................................................................................................... 119
Laos ......................................................................................................... 124
Malaysia ................................................................................................... 125
Mongolia ................................................................................................... 128
Nepal ....................................................................................................... 131
New Zealand ............................................................................................. 134
Pakistan ................................................................................................... 136
The Philippines .......................................................................................... 137
Singapore ................................................................................................. 139
South Korea .............................................................................................. 141
Sri Lanka .................................................................................................. 144
Taiwan ..................................................................................................... 146
Thailand ................................................................................................... 148
Vietnam .................................................................................................... 149
Asia Supply-side Analysis by Five Product Types .................................. 153
Supply-side Analysis for China by Five Product Types ..................................... 156
Eastern Europe Demand-Side Analysis by Nine Countries ............ 157
Azerbaijan ................................................................................................ 159
Belarus ..................................................................................................... 161
Bosnia and Herzegovina ............................................................................. 163
Georgia .................................................................................................... 165
Kazakhstan ............................................................................................... 167
Moldova .................................................................................................... 170
The Russian Federation .............................................................................. 172
Serbia ...................................................................................................... 175
Ukraine .................................................................................................... 177
Eastern Europe Supply-Side Analysis by Five Product Types .................. 180
Latin America Demand-Side Analysis by Fifteen Countries ........... 183
Argentina .................................................................................................. 189
Bolivia ...................................................................................................... 191
Brazil ....................................................................................................... 193 Brazil Consumers.................................................................................................... 194
Ambient Insight’s The 2013-2018 Worldwide Market for Digital English Language Learning Products. Premium Edition
For more information about this research, email: [email protected] 4
Brazil Corporations & Businesses .............................................................................. 198 Brazil PreK-12 Academic .......................................................................................... 200 Brazil Higher Education ........................................................................................... 202 Brazil Federal Government ....................................................................................... 203 Brazil State/Municipal Government ........................................................................... 204
Chile ........................................................................................................ 206
Colombia .................................................................................................. 209
Costa Rica ................................................................................................ 211
Dominican Republic .................................................................................... 212
Ecuador .................................................................................................... 213
Guatemala ................................................................................................ 215
Mexico ...................................................................................................... 217
Panama .................................................................................................... 220
Paraguay .................................................................................................. 221
Peru ......................................................................................................... 223
Uruguay ................................................................................................... 225
Venezuela ................................................................................................. 227
Latin America Supply-Side Analysis by Five Product Types .................... 230
Brazil Supply-Side Analysis ......................................................................... 232
Middle East Demand-Side Analysis by Twelve Countries .............. 233
Bahrain .................................................................................................... 239
Egypt ....................................................................................................... 241
Israel ....................................................................................................... 243
Jordan ...................................................................................................... 246
Kuwait ...................................................................................................... 248
Lebanon ................................................................................................... 250
Oman ....................................................................................................... 252
Qatar ....................................................................................................... 253
Saudi Arabia ............................................................................................. 255
Turkey...................................................................................................... 259 Turkey Demand-Side Analysis by Five Buying Segments ............................................. 259 Turkey Consumers .................................................................................................. 260 Turkey Corporations and Businesses ......................................................................... 260 Turkey PreK-12 Academic ........................................................................................ 261 Turkey Higher Education ......................................................................................... 263 Turkey Government ................................................................................................ 264
The United Arab Emirates (UAE) .................................................................. 264
Yemen ...................................................................................................... 268
Middle East Supply-Side Analysis by Five Product Types ....................... 269
Turkey Supply-Side Analysis by Four Product Types ....................................... 271
North America Forecast for Canada and the US .......................... 273
The United States (US) ............................................................................... 275 US PreK-12 ............................................................................................................ 276 US Higher Education ............................................................................................... 278 US Consumers ....................................................................................................... 279
Ambient Insight’s The 2013-2018 Worldwide Market for Digital English Language Learning Products. Premium Edition
For more information about this research, email: [email protected] 5
US Consumer Expenditures on Four Other Digital Languages ....................................... 280 US Federal, State, and Local Governments ................................................................ 281 US Corporations ..................................................................................................... 282
Canada ..................................................................................................... 284 Canada PreK-12 ..................................................................................................... 285 Canada Higher Education ......................................................................................... 287 Canada Consumers ................................................................................................. 288 Canada Federal, Province, and Local Governments ..................................................... 289 Canada Corporations ............................................................................................... 290
North America Supply-side Analysis by Five Product Types ................... 291
Western Europe Demand-Side Analysis by Twenty-Four Countries 296
Austria ..................................................................................................... 302
Belgium .................................................................................................... 303
Bulgaria .................................................................................................... 305
Croatia ..................................................................................................... 307
The Czech Republic .................................................................................... 308
Denmark .................................................................................................. 310
Finland ..................................................................................................... 312
France ...................................................................................................... 315
Germany .................................................................................................. 317
Greece ..................................................................................................... 320
Hungary ................................................................................................... 322
Ireland ..................................................................................................... 324
Italy ......................................................................................................... 326
Lithuania .................................................................................................. 328
The Netherlands ........................................................................................ 329
Norway ..................................................................................................... 332
Poland ...................................................................................................... 333
Portugal .................................................................................................... 336
Romania ................................................................................................... 337
Slovakia ................................................................................................... 339
Spain ....................................................................................................... 341
Sweden .................................................................................................... 345
Switzerland ............................................................................................... 347
The United Kingdom (UK) ........................................................................... 349
Western Europe Supply-Side Analysis by Five Product Types ................. 351
Index of Suppliers ........................................................... 352
Ambient Insight’s The 2013-2018 Worldwide Market for Digital English Language Learning Products. Premium Edition
For more information about this research, email: [email protected] 6
List of Tables
Table 1 – 98 Countries Analyzed in this Report by Region ...........................15
Table 2 - Top Fifteen Digital English Language Learning Buying Countries for 2013 and 2018 ...................................................................17
Table 3 – 2011 to First Half of 2014 Private Investments Made to Digital English Language Learning Suppliers ..............................................31
Table 4 - 2013-2018 Revenue Forecasts for Digital English Language
Learning by Seven Regions (in US$ Millions) .............................................44
Table 5 - 2013-2018 Worldwide Revenue Forecasts for Digital English Language Learning by Five Product Types (in US$ Millions) .........................45
Table 6 - 2013-2018 Revenue Forecasts for Digital English Language Learning by Sixteen Countries in Africa (in $US Millions) .............................47
Table 7 - 2013-2018 Revenue Forecasts for Digital English Language
Learning Products in Algeria (in US$ Millions) ............................................48
Table 8 - 2013-2018 Revenue Forecasts for Digital English Language Learning Products in Angola (in US$ Millions) ............................................51
Table 9 - 2013-2018 Revenue Forecasts for Digital English Language Learning Products in Ethiopia (in US$ Millions) ...........................................54
Table 10 - 2013-2018 Revenue Forecasts for Digital English Language Learning Products in Ghana (in US$ Millions) .............................................58
Table 11 - 2013-2018 Revenue Forecasts for Digital English Language Learning Products in Kenya (in US$ Millions) .............................................60
Table 12 - 2013-2018 Revenue Forecasts for Digital English Language Learning Products in Morocco (in US$ Millions) ..........................................62
Table 13 - 2013-2018 Revenue Forecasts for Digital English Language Learning Products in Mozambique (in US$ Millions) ....................................64
Table 14 - 2013-2018 Revenue Forecasts for Digital English Language Learning Products in Nigeria (in US$ Millions) ............................................66
Table 15 - 2013-2018 Revenue Forecasts for Digital English Language
Learning Products in Rwanda (in US$ Millions) ...........................................70
Table 16- 2013-2018 Revenue Forecasts for Digital English Language Learning Products in Senegal (in US$ Millions) ...........................................72
Table 17 - 2013-2018 Revenue Forecasts for Digital English Language Learning Products in South Africa (in US$ Millions) .....................................74
Table 18 - 2013-2018 Revenue Forecasts for Digital English Language
Learning Products in Tanzania (in US$ Millions) .........................................79
Table 19 - 2013-2018 Revenue Forecasts for Digital English Language Learning Products in Tunisia (in US$ Millions) ............................................81
Ambient Insight’s The 2013-2018 Worldwide Market for Digital English Language Learning Products. Premium Edition
For more information about this research, email: [email protected] 7
Table 20 - 2013-2018 Revenue Forecasts for Digital English Language Learning Products in Uganda (in US$ Millions) ...........................................83
Table 21 - 2013-2018 Revenue Forecasts for Digital English Language Learning Products in Zambia (in US$ Millions) ...........................................85
Table 22 - 2013-2018 Revenue Forecasts for Digital English Language
Learning Products in Zimbabwe (in US$ Millions) .......................................87
Table 23 - 2013-2018 Africa Revenue Forecasts for Digital English Language Learning by Five Product Types (in US$ Millions) .........................90
Table 24 - 2013-2018 Revenue Forecasts for Digital English Language Learning by Twenty Countries in Asia (in US$ Millions) ...............................95
Table 25 - 2013-2018 Revenue Forecasts for Digital English Language
Learning Products in Australia (in US$ Millions) ..........................................96
Table 26 -2013-2018 Revenue Forecasts for Digital English Language Learning Products in Bangladesh (in US$ Millions) ......................................97
Table 27 - 2013-2018 Revenue Forecasts for Digital English Language Learning Products in Cambodia (in US$ Millions) ........................................98
Table 28 - 2013-2018 Revenue Forecasts for Digital English Language Learning Products in China (in US$ Millions) ............................................ 100
Table 29 - 2013-2018 China Revenue Forecasts for Digital English Language Learning Products by Six Buyer Segments (in US$ Millions) ........ 100
Table 30 - 2013-2018 China Revenue Forecasts for Digital English
Language Learning Products by PreK-12 Buyers (in US$ Millions) ............... 102
Table 31 - 2013-2018 China PreK-12 Revenue Forecasts for Digital Language Learning Products by Five Age Groups From 3-17 Years Old (in $US Millions) .................................................................................. 102
Table 32 - 2013-2018 China Revenue Forecasts for Digital English Language Learning Products by Higher Education Buyers (in US$ Millions) .............................................................................................. 105
Table 33 - 2013-2018 China Revenue Forecasts for Digital English Language Learning Products by Consumers (in US$ Millions) ..................... 106
Table 34 - 2013-2018 China Consumer Revenue Forecasts for Digital Language Learning Products by Five Age Groups From 3-17 Years Old
(in $US Millions) .................................................................................. 108
Table 35 - 2013-2018 China Revenue Forecasts for Digital English Language Learning Products by Corporations (in US$ Millions) ................... 110
Table 36 - 2013-2018 China Revenue Forecasts for Digital English Language Learning Products by Government Agencies (in US$ Millions) ...... 110
Table 37 - 2013-2018 Revenue Forecasts for Digital English Language Learning Products in India (in US$ Millions) ............................................. 112
Table 38 - 2013-2018 Revenue Forecasts for Digital English Language Learning Products in Indonesia (in US$ Millions) ...................................... 117
Ambient Insight’s The 2013-2018 Worldwide Market for Digital English Language Learning Products. Premium Edition
For more information about this research, email: [email protected] 8
Table 39 - 2013-2018 Revenue Forecasts for Digital English Language Learning Products in Japan (in US$ Millions) ............................................ 120
Table 40 - 2013-2018 Revenue Forecasts for Digital English Language Learning Products in Laos (in US$ Millions) .............................................. 124
Table 41 - 2013-2018 Revenue Forecasts for Digital English Language
Learning Products in Malaysia (in US$ Millions) ........................................ 125
Table 42 - 2013-2018 Revenue Forecasts for Digital English Language Learning Products in Mongolia (in US$ Millions) ........................................ 128
Table 43 - 2013-2018 Revenue Forecasts for Digital English Language Learning Products in Nepal (in US$ Millions) ............................................ 132
Table 44 - 2013-2018 Revenue Forecasts for Digital English Language
Learning Products in New Zealand (in US$ Millions) .................................. 134
Table 45 - 2013-2018 Revenue Forecasts for Digital English Language Learning Products in Pakistan (in US$ Millions) ........................................ 136
Table 46 - 2013-2018 Revenue Forecasts for Digital English Language Learning Products in the Philippines (in US$ Millions) ................................ 137
Table 47 - 2013-2018 Revenue Forecasts for Digital English Language Learning Products in Singapore (in US$ Millions) ...................................... 139
Table 48 - 2013-2018 Revenue Forecasts for Digital English Language Learning Products in South Korea (in US$ Millions) ................................... 141
Table 49 - 2013-2018 Revenue Forecasts for Digital English Language
Learning Products in Sri Lanka (in US$ Millions) ....................................... 144
Table 50 - 2013-2018 Revenue Forecasts for Digital English Language Learning Products in Taiwan (in US$ Millions) .......................................... 146
Table 51 - 2013-2018 Revenue Forecasts for Digital English Language Learning Products in Thailand (in US$ Millions) ........................................ 148
Table 52 - 2013-2018 Revenue Forecasts for Digital English Language Learning Products in Vietnam (in US$ Millions) ........................................ 150
Table 53 - 2013-2018 Asia Revenue Forecasts for Digital English Language Learning by Five Product Types (in US$ Millions) ....................... 154
Table 54 - 2013-2018 China Revenue Forecasts for Digital Language Learning by Five Product Types (in US$ Millions) ...................................... 156
Table 55 - 2013-2018 Revenue Forecasts for Digital English Language Learning by Nine Countries in Eastern Europe (in $US Millions) .................. 159
Table 56 - 2013-2018 Revenue Forecasts for Digital English Language Learning Products in Azerbaijan (in US$ Millions) ..................................... 159
Table 57 - 2013-2018 Revenue Forecasts for Digital English Language
Learning Products in Belarus (in US$ Millions) .......................................... 161
Table 58 - 2013-2018 Revenue Forecasts for Digital English Language Learning Products in Bosnia and Herzegovina (in US$ Millions) .................. 163
Ambient Insight’s The 2013-2018 Worldwide Market for Digital English Language Learning Products. Premium Edition
For more information about this research, email: [email protected] 9
Table 59 - 2013-2018 Revenue Forecasts for Digital English Language Learning Products in Georgia (in US$ Millions) ......................................... 165
Table 60 - 2013-2018 Revenue Forecasts for Digital English Language Learning Products in Kazakhstan (in US$ Millions) .................................... 167
Table 61 - 2013-2018 Revenue Forecasts for Digital English Language
Learning Products in Moldova (in US$ Millions) ........................................ 170
Table 62 - 2013-2018 Revenue Forecasts for Digital English Language Learning Products in the Russian Federation (in US$ Millions) .................... 172
Table 63 - 2013-2018 Revenue Forecasts for Digital English Language Learning Products in Serbia (in US$ Millions) ........................................... 175
Table 64 - 2013-2018 Revenue Forecasts for Digital English Language
Learning Products in Ukraine (in US$ Millions) ......................................... 177
Table 65—2013-2018 Eastern Europe Revenue Forecasts for Digital English Language Learning by Five Product Types (in US$ Millions) ............ 181
Table 66 - 2013-2018 Revenue Forecasts for Digital English Language Learning by Top Buying Countries in Latin America (in US$ Millions)........... 188
Table 67—2013-2018 Revenue Forecasts for Digital English Language Learning Products in Argentina (in US$ Millions) ...................................... 189
Table 68—2013-2018 Revenue Forecasts for Digital English Language Learning Products in Bolivia (in US$ Millions) ........................................... 191
Table 69—2013-2018 Revenue Forecasts for Digital English Language
Learning Products in Brazil (in US$ Millions) ............................................ 193
Table 70 - 2013-2018 Brazil Revenue Forecasts for Digital English Language Learning Products by Six Buyer Segments (in US$ Millions) ........ 194
Table 71 - 2013-2018 Brazil Revenue Forecasts for Digital English Language Learning Products by Consumers (in US$ Millions) ..................... 195
Table 72 - 2013-2018 Brazil Revenue Forecasts for Digital English Language Learning Products by Corporations (in US$ Millions) ................... 198
Table 73 - 2013-2018 Brazil Revenue Forecasts for Digital English Language Learning Products by PreK-12 Buyers (in US$ Millions) ............... 200
Table 74 - 2013-2018 Brazil Revenue Forecasts for Digital English Language Learning Products by Higher Education Buyers (in US$
Millions) .............................................................................................. 202
Table 75 - 2013-2018 Brazil Revenue Forecasts for Digital English
Language Learning Products by Federal Government Agencies (in US$ Millions) .............................................................................................. 203
Table 76 - 2013-2018 Brazil Revenue Forecasts for Digital English Language Learning Products by State and Local Government Agencies (in US$ Millions .................................................................................... 205
Table 77—2013-2018 Revenue Forecasts for Digital English Language Learning Products in Chile (in US$ Millions) ............................................. 206
Ambient Insight’s The 2013-2018 Worldwide Market for Digital English Language Learning Products. Premium Edition
For more information about this research, email: [email protected] 10
Table 78—2013-2018 Revenue Forecasts for Digital English Language Learning Products in Colombia (in US$ Millions) ....................................... 209
Table 79—2013-2018 Revenue Forecasts for Digital English Language Learning Products in Costa Rica (in US$ Millions) ..................................... 211
Table 80—2013-2018 Revenue Forecasts for Digital English Language
Learning Products in the Dominican Republic (in US$ Millions) ................... 212
Table 81—2013-2018 Revenue Forecasts for Digital English Language Learning Products in the Dominican Republic (in US$ Millions) ................... 213
Table 82—2013-2018 Revenue Forecasts for Digital English Language Learning Products in Guatemala (in US$ Millions) ..................................... 215
Table 83—2013-2018 Revenue Forecasts for Digital English Language
Learning Products in Mexico (in US$ Millions) .......................................... 217
Table 84—2013-2018 Revenue Forecasts for Digital English Language Learning Products in Panama (in US$ Millions) ......................................... 220
Table 85—2013-2018 Revenue Forecasts for Digital English Language Learning Products in Paraguay (in US$ Millions) ....................................... 221
Table 86—2013-2018 Revenue Forecasts for Digital English Language Learning Products in Peru (in US$ Millions) .............................................. 223
Table 87—2013-2018 Revenue Forecasts for Digital English Language Learning Products in Uruguay (in US$ Millions) ........................................ 225
Table 88—2013-2018 Revenue Forecasts for Digital English Language
Learning Products in Venezuela (in US$ Millions) ...................................... 227
Table 89—2013-2018 Latin America Revenue Forecasts for Digital English Language Learning by Five Product Types (in US$ Millions) ............ 231
Table 90 - 2013-2018 Brazil Revenue Forecasts for Digital Language Learning by Five Product Types (in US$ Millions) ...................................... 232
Table 91 - 2013-2018 Revenue Forecasts for Digital English Language Learning by Top Buying Countries in the Middle East (in $US Millions) ........ 238
Table 92 - 2013-2018 Revenue Forecasts for Digital English Language Learning Products in Bahrain (in US$ Millions) ......................................... 239
Table 93 - 2013-2018 Revenue Forecasts for Digital English Language Learning Products in Egypt (in US$ Millions) ............................................ 241
Table 94 - 2013-2018 Revenue Forecasts for Digital English Language Learning Products in Israel (in US$ Millions) ............................................ 243
Table 95 - 2013-2018 Revenue Forecasts for Digital English Language Learning Products in Jordan (in US$ Millions) ........................................... 246
Table 96 - 2013-2018 Revenue Forecasts for Digital English Language
Learning Products in Kuwait (in US$ Millions) .......................................... 248
Table 97 - 2013-2018 Revenue Forecasts for Digital English Language Learning Products in Lebanon (in US$ Millions) ........................................ 250
Ambient Insight’s The 2013-2018 Worldwide Market for Digital English Language Learning Products. Premium Edition
For more information about this research, email: [email protected] 11
Table 98 - 2013-2018 Revenue Forecasts for Digital English Language Learning Products in Oman (in US$ Millions) ............................................ 252
Table 99- 2013-2018 Revenue Forecasts for Digital English Language Learning Products in Qatar (in US$ Millions) ............................................ 253
Table 100 - 2013-2018 Revenue Forecasts for Digital English Language
Learning Products in Saudi Arabia (in US$ Millions) .................................. 255
Table 101 - 2013-2018 Revenue Forecasts for Digital English Language Learning Products in Turkey (in US$ Millions) .......................................... 259
Table 102 - 2013-2018 Turkey Revenue Forecasts for Digital English Language Learning Products by Five Buyer Segments (in US$ Millions) ....... 259
Table 103 - 2013-2018 Revenue Forecasts for Digital English Language
Learning Products in the UAE (in US$ Millions) ......................................... 264
Table 104 - 2013-2018 Revenue Forecasts for Digital English Language Learning Products in Yemen (in US$ Millions) .......................................... 268
Table 105—2013-2018 Middle East Revenue Forecasts for Digital English Language Learning by Five Product Types (in US$ Millions) ............ 271
Table 106 - 2013-2018 Turkey Revenue Forecasts for Digital English Language Learning by Four Product Types (in US$ Millions) ....................... 272
Table 107 - 2013-2018 North America Digital English Language Learning Revenue Forecasts for the US and Canada (in US $ Millions) ........ 274
Table 108 - 2013-2018 North America Revenue Forecasts for Digital
English Language Learning by Five Buyer Segments (in US$ Millions) ......... 275
Table 109 - 2013-2018 US Revenue Forecasts for Digital English Language Learning by Five Buyer Segments (in US$ Millions) .................... 275
Table 110 - 2013-2018 Canada Revenue Forecasts for Digital English Language Learning by Five Buyer Segments (in US$ Millions) .................... 284
Table 111 - 2013-2018 North America Revenue Forecasts for Digital English Language Learning by Four Product Types (in US$ Millions) ............ 292
Table 112 - 2013-2018 North America Revenue Forecasts for Self-paced eLearning Digital English Language Learning Products by Five Buyer Segments (in US$ Millions) .......................................................... 293
Table 113 - 2013-2018 North America Revenue Forecasts for
Collaboration-based Learning Digital English Language Learning Products by Five Buyer Segments (in US$ Millions) .................................. 293
Table 114 - 2013-2018 North America Revenue Forecasts for Digital Reference-ware Digital English Language Learning Products by Five Buyer Segments (in US$ Millions) .......................................................... 294
Table 115 - 2013-2018 North America Revenue Forecasts for Mobile Learning Apps & Edugames Digital English Language Learning Products
by Five Buyer Segments (in US$ Millions) ............................................... 294
Ambient Insight’s The 2013-2018 Worldwide Market for Digital English Language Learning Products. Premium Edition
For more information about this research, email: [email protected] 12
Table 116 - 2013-2018 Revenue Forecasts for Digital English Language Learning by Twenty-Four Buying Countries in Western Europe (in US$ Millions) .............................................................................................. 301
Table 117 - 2013-2018 Revenue Forecasts for Digital English Language Learning Products in Austria (in US$ Millions) .......................................... 302
Table 118 - 2013-2018 Revenue Forecasts for Digital English Language Learning Products in Belgium (in US$ Millions) ......................................... 303
Table 119 - 2013-2018 Revenue Forecasts for Digital English Language Learning Products in Bulgaria (in US$ Millions) ........................................ 305
Table 120 - 2013-2018 Revenue Forecasts for Digital English Language Learning Products in Croatia (in US$ Millions) .......................................... 307
Table 121 - 2013-2018 Revenue Forecasts for Digital English Language
Learning Products in the Czech Republic (in US$ Millions) ......................... 309
Table 122 - 2013-2018 Revenue Forecasts for Digital English Language Learning Products in Denmark (in US$ Millions) ....................................... 311
Table 123 - 2013-2018 Revenue Forecasts for Digital English Language Learning Products in Finland (in US$ Millions) .......................................... 312
Table 124 - 2013-2018 Revenue Forecasts for Digital English Language Learning Products in France (in US$ Millions) ........................................... 315
Table 125 - 2013-2018 Revenue Forecasts for Digital English Language Learning Products in Germany (in US$ Millions) ....................................... 317
Table 126 - 2013-2018 Revenue Forecasts for Digital English Language Learning Products in Greece (in US$ Millions) .......................................... 320
Table 127 - 2013-2018 Revenue Forecasts for Digital English Language Learning Products in Hungary (in US$ Millions) ........................................ 322
Table 128 - 2013-2018 Revenue Forecasts for Digital English Language Learning Products in Ireland (in US$ Millions) .......................................... 324
Table 129 - 2013-2018 Revenue Forecasts for Digital English Language
Learning Products in Italy (in US$ Millions) .............................................. 326
Table 130 - 2013-2018 Revenue Forecasts for Digital English Language Learning Products in Lithuania (in US$ Millions) ....................................... 328
Table 131 - 2013-2018 Revenue Forecasts for Digital English Language
Learning Products in the Netherlands (in US$ Millions) .............................. 330
Table 132 - 2013-2018 Revenue Forecasts for Digital English Language
Learning Products in Norway (in US$ Millions) ......................................... 332
Table 133 - 2013-2018 Revenue Forecasts for Digital English Language Learning Products in Poland (in US$ Millions) ........................................... 333
Table 134 - 2013-2018 Revenue Forecasts for Digital English Language Learning Products in Portugal (in US$ Millions) ........................................ 336
Table 135 - 2013-2018 Revenue Forecasts for Digital English Language Learning Products in Romania (in US$ Millions) ........................................ 337
Ambient Insight’s The 2013-2018 Worldwide Market for Digital English Language Learning Products. Premium Edition
For more information about this research, email: [email protected] 13
Table 136 - 2013-2018 Revenue Forecasts for Digital English Language Learning Products in Slovakia (in US$ Millions) ........................................ 339
Table 137 - 2013-2018 Revenue Forecasts for Digital English Language Learning Products in Spain (in US$ Millions) ............................................ 342
Table 138 - 2013-2018 Revenue Forecasts for Digital English Language
Learning Products in Sweden (in US$ Millions) ......................................... 345
Table 139 - 2013-2018 Revenue Forecasts for Digital English Language Learning Products in Switzerland (in US$ Millions) .................................... 347
Table 140 - 2013-2018 Revenue Forecasts for Digital English Language Learning Products in the United Kingdom (in US$ Millions) ........................ 349
Table 141—2013-2018 Western Europe Revenue Forecasts for Digital
English Language Learning by Five Product Types (in US$ Millions) ............ 351
List of Figures
Figure 1 - 2013-2018 Worldwide Digital English Language Learning Five-year Growth Rates in by Region ........................................................16
Figure 2 - 2013-2018 Top Fifteen Worldwide Digital English Language Learning Five-year Growth Rates by Country .............................................18
Figure 3 – The 2013 Global Language Learning Industry (in $US
Billions) ................................................................................................19
Figure 4 - Primary Catalysts in the Worldwide 2013-2018 Digital English Language Learning Market ...........................................................20
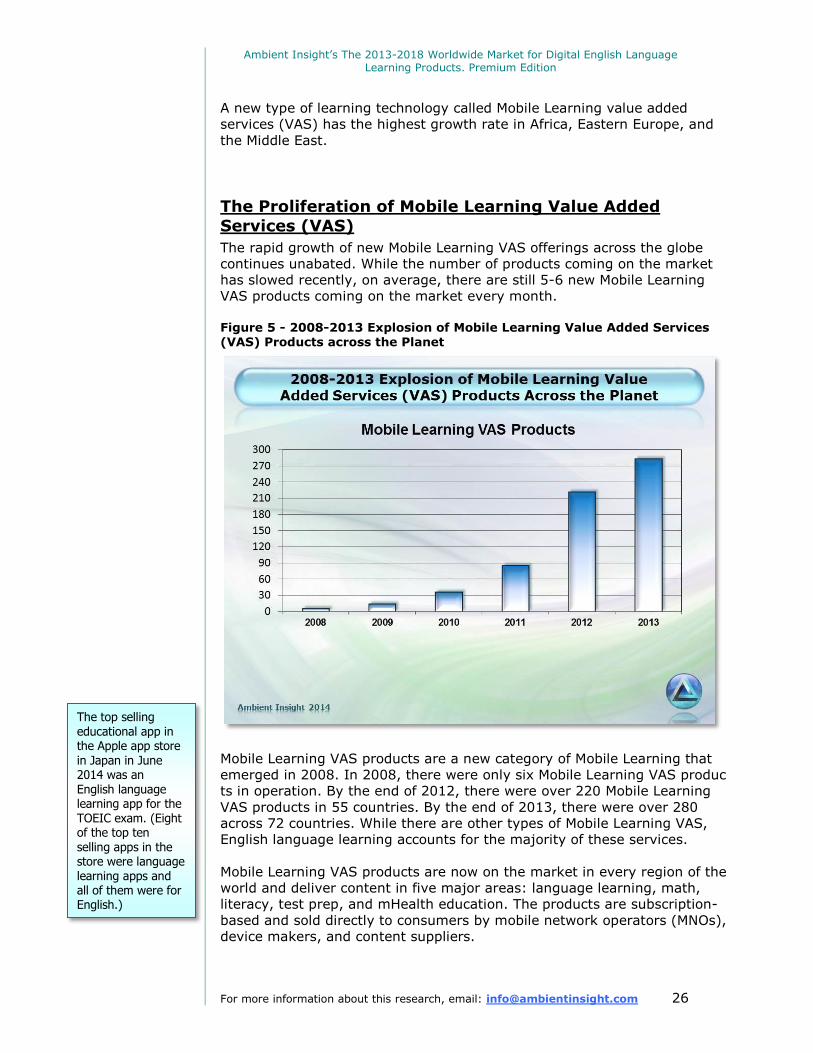
Figure 5 - 2008-2013 Explosion of Mobile Learning Value Added Services (VAS) Products across the Planet .................................................26
Figure 6 - 2013-2018 Worldwide Digital English Language Learning
Five-year Growth Rates by Five Product Types ...........................................41
Figure 7 - 2013-2018 Top Digital English Language Learning Five-year Growth Rates in Africa by Country ............................................................46
Figure 8 - Primary Catalysts Driving the 2013-2018 Digital English Language Learning Market in Africa ..........................................................47
Figure 9 - 2013-2018 Digital English Language Learning Five-year
Growth Rates in Africa by Five Product Types ............................................89
Figure 10 - 2013-2018 Top Ten Digital English Language Learning Five-year Growth Rates in Asia by Country .......................................................92
Figure 11 - Primary Catalysts Driving the 2013-2018 Digital English Language Learning Market in Asia ............................................................92
Figure 12 - 2013-2018 Digital English Language Learning Five-year Growth Rates in Asia by Five Product Types............................................. 153
Ambient Insight’s The 2013-2018 Worldwide Market for Digital English Language Learning Products. Premium Edition
For more information about this research, email: [email protected] 14
Figure 13 - 2013-2018 Top Digital English Language Learning Five-year Growth Rates in Eastern Europe by Country ............................................ 157
Figure 14 - Primary Catalysts Driving the 2013-2018 Digital English Language Learning Market in Eastern Europe........................................... 158
Figure 15 - 2013-2018 Digital English Language Learning Five-year
Growth Rates in Eastern Europe by Five Product Types ............................. 180
Figure 16 - Primary Catalysts in the 2013-2018 Digital English Language Learning Market in Latin America ............................................. 183
Figure 17 - 2013-2018 Top Digital English Language Learning Five-year Growth Rates in Latin America by Country............................................... 185
Figure 18 - 2013-2018 Digital English Language Learning Five-year
Growth Rates in Latin America by Six Buyer Segments ............................. 186
Figure 19 - 2013-2018 Digital English Language Learning Five-year Growth Rates in Latin America by Five Product Types ............................... 230
Figure 20 - 2013-2018 Top Digital English Language Learning Five-year Growth Rates in the Middle East by Country ............................................ 233
Figure 21 - Primary Catalysts in the 2013-2018 Digital English Language Learning Market in the Middle East .......................................... 235
Figure 22 - 2013-2018 Digital English Language Learning Five-year Growth Rates in the Middle East by Five Product Types ............................. 270
Figure 23 - 2013-2018 Digital English Language Learning Five-year
Growth Rates in Turkey by Four Product Types ........................................ 272
Figure 24 – Primary Catalysts in the 2013-2018 Digital English Language Learning Market in North America ............................................ 273
Figure 25 – 2013-2018 US Revenue Forecasts for Digital English Language Learning Products by Five Buyer Segments (in US$ Millions) ....... 276
Figure 26 – 2013-2018 Canada Revenue Forecasts for Digital English Language Learning Products by Five Buyer Segments (in US$ Millions) ....... 285
Figure 27 - 2013-2018 Top Digital English Language Learning Five-year Growth Rates in Western Europe by Country ........................................... 296
Figure 28 - Primary Catalysts Driving the 2013-2018 Digital English Language Learning Market in Western Europe.......................................... 297
“We Put Research into Practice”
www.ambientinsight.com
Ambient Insight’s The 2013-2018 Worldwide Market for Digital English Language Learning Products. Premium Edition
For more information about this research, email: [email protected] 15
Executive Overview The global market for digital English language learning products reached
$1.8 billion in 2013. The worldwide five-year compound annual growth rate
(CAGR) is 11.1% and revenues will surge to $3.1 billion by 2018.
Ambient Insight has revised our international forecasts for digital
English language learning products significantly upward from
previous forecasts. Revenues will more than double over the
forecast period in 51 of the 98 countries analyzed in this report.
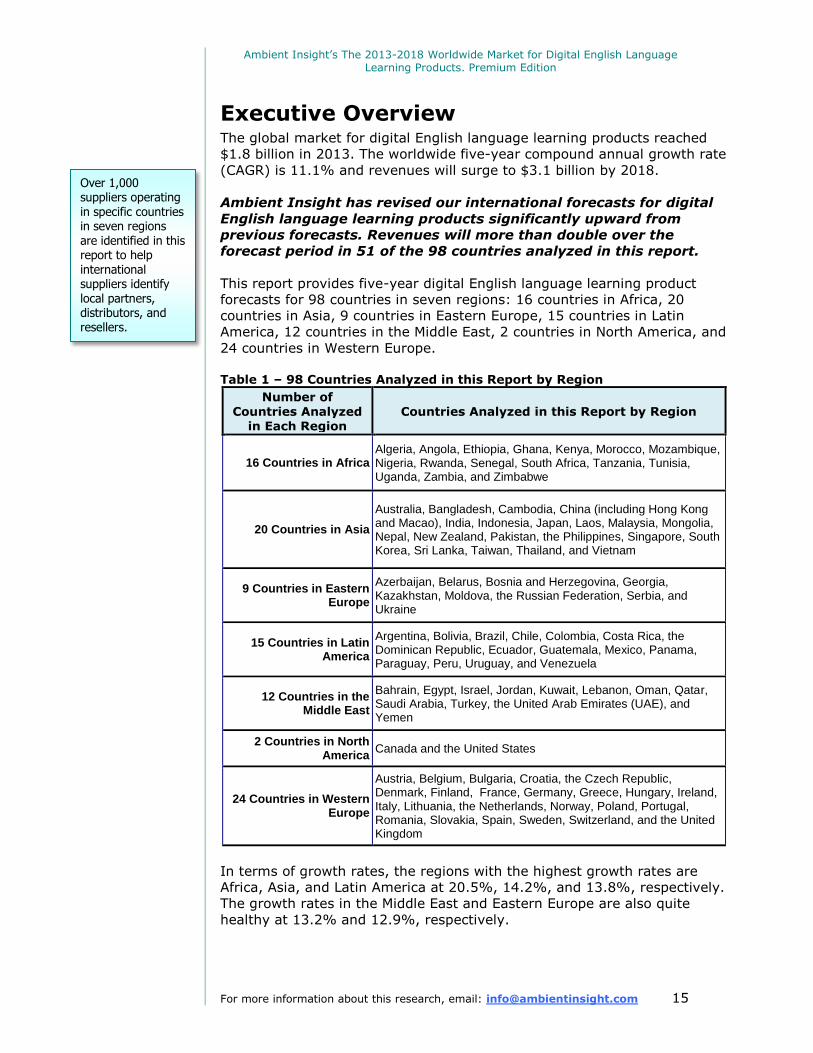
This report provides five-year digital English language learning product
forecasts for 98 countries in seven regions: 16 countries in Africa, 20
countries in Asia, 9 countries in Eastern Europe, 15 countries in Latin
America, 12 countries in the Middle East, 2 countries in North America, and
24 countries in Western Europe.
Table 1 – 98 Countries Analyzed in this Report by Region
Number of Countries Analyzed
in Each Region Countries Analyzed in this Report by Region
16 Countries in Africa Algeria, Angola, Ethiopia, Ghana, Kenya, Morocco, Mozambique, Nigeria, Rwanda, Senegal, South Africa, Tanzania, Tunisia, Uganda, Zambia, and Zimbabwe
20 Countries in Asia
Australia, Bangladesh, Cambodia, China (including Hong Kong and Macao), India, Indonesia, Japan, Laos, Malaysia, Mongolia, Nepal, New Zealand, Pakistan, the Philippines, Singapore, South Korea, Sri Lanka, Taiwan, Thailand, and Vietnam
9 Countries in Eastern Europe
Azerbaijan, Belarus, Bosnia and Herzegovina, Georgia, Kazakhstan, Moldova, the Russian Federation, Serbia, and Ukraine
15 Countries in Latin America
Argentina, Bolivia, Brazil, Chile, Colombia, Costa Rica, the Dominican Republic, Ecuador, Guatemala, Mexico, Panama, Paraguay, Peru, Uruguay, and Venezuela
12 Countries in the Middle East
Bahrain, Egypt, Israel, Jordan, Kuwait, Lebanon, Oman, Qatar, Saudi Arabia, Turkey, the United Arab Emirates (UAE), and Yemen
2 Countries in North America
Canada and the United States
24 Countries in Western Europe
Austria, Belgium, Bulgaria, Croatia, the Czech Republic, Denmark, Finland, France, Germany, Greece, Hungary, Ireland, Italy, Lithuania, the Netherlands, Norway, Poland, Portugal, Romania, Slovakia, Spain, Sweden, Switzerland, and the United Kingdom
In terms of growth rates, the regions with the highest growth rates are
Africa, Asia, and Latin America at 20.5%, 14.2%, and 13.8%, respectively.
The growth rates in the Middle East and Eastern Europe are also quite
healthy at 13.2% and 12.9%, respectively.
Over 1,000 suppliers operating in specific countries in seven regions are identified in this report to help international suppliers identify local partners, distributors, and resellers.
Ambient Insight’s The 2013-2018 Worldwide Market for Digital English Language Learning Products. Premium Edition
For more information about this research, email: [email protected] 16
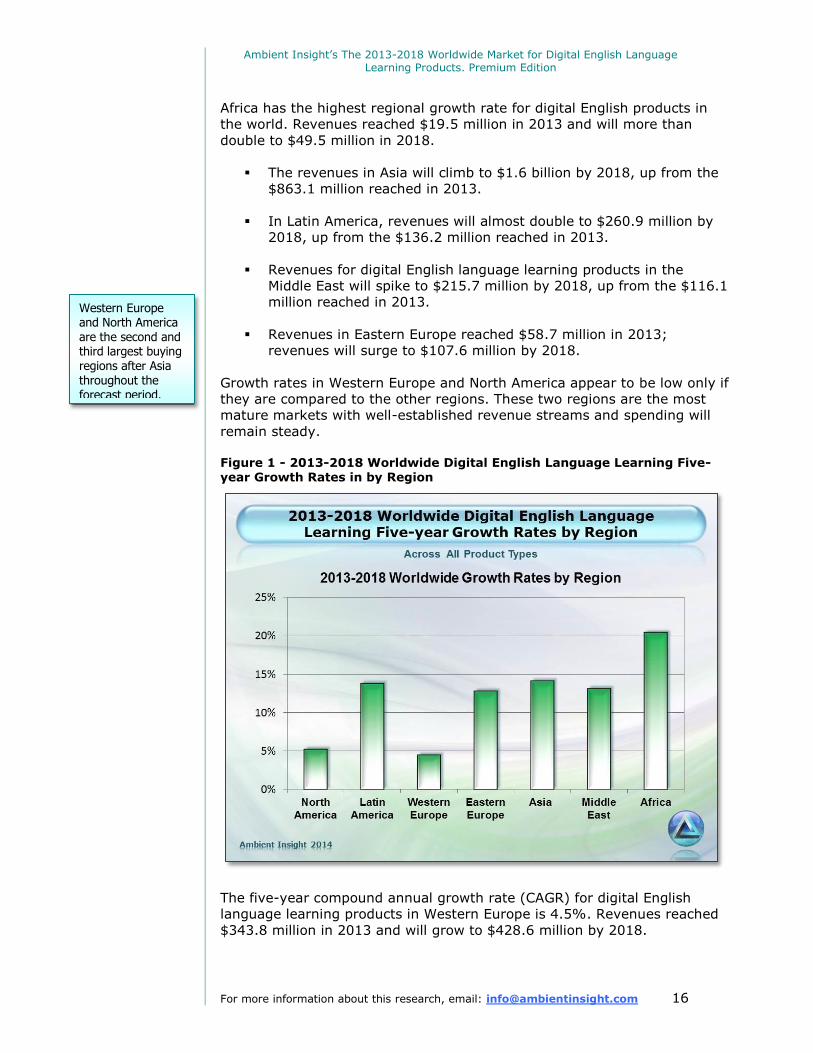
Africa has the highest regional growth rate for digital English products in
the world. Revenues reached $19.5 million in 2013 and will more than
double to $49.5 million in 2018.
The revenues in Asia will climb to $1.6 billion by 2018, up from the
$863.1 million reached in 2013.
In Latin America, revenues will almost double to $260.9 million by
2018, up from the $136.2 million reached in 2013.
Revenues for digital English language learning products in the
Middle East will spike to $215.7 million by 2018, up from the $116.1
million reached in 2013.
Revenues in Eastern Europe reached $58.7 million in 2013;
revenues will surge to $107.6 million by 2018.
Growth rates in Western Europe and North America appear to be low only if
they are compared to the other regions. These two regions are the most
mature markets with well-established revenue streams and spending will
remain steady.
Figure 1 - 2013-2018 Worldwide Digital English Language Learning Five-year Growth Rates in by Region
The five-year compound annual growth rate (CAGR) for digital English
language learning products in Western Europe is 4.5%. Revenues reached
$343.8 million in 2013 and will grow to $428.6 million by 2018.
Western Europe and North America are the second and third largest buying regions after Asia throughout the forecast period.
Ambient Insight’s The 2013-2018 Worldwide Market for Digital English Language Learning Products. Premium Edition
For more information about this research, email: [email protected] 17
The growth rate for digital English language learning products in North
America is 5.3%. Revenues reached $318.1 million in 2013 and will spike
to $410.9 million by 2018.
In November 2013, Cambridge University Press reported in their annual
financial report that "Nearly 90 per cent of the Press’ sales were from
outside the UK, and as growth slows in some Western European and the
North American markets, opportunities in Latin America, the Middle East,
Africa and Asia are increasing. Sales to schools in South Africa grew
hugely, linked to the new curriculum, and China, Mexico, Turkey and Saudi
Arabia all saw significant sales successes."
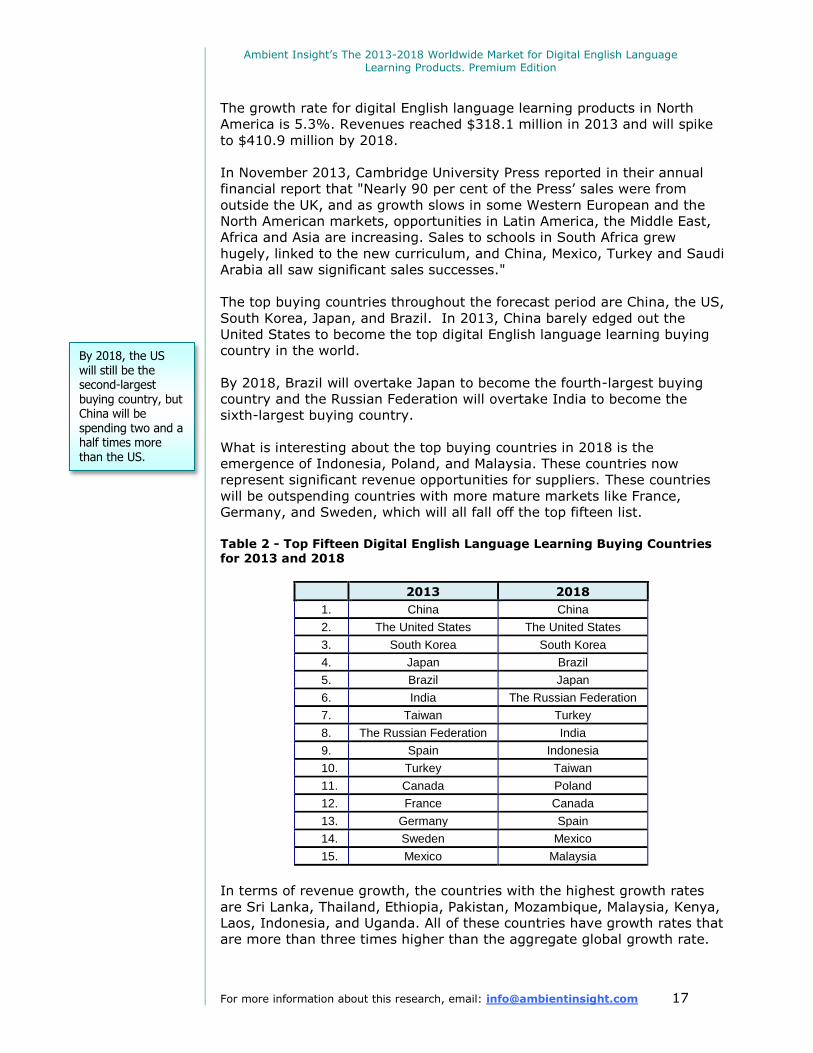
The top buying countries throughout the forecast period are China, the US,
South Korea, Japan, and Brazil. In 2013, China barely edged out the
United States to become the top digital English language learning buying
country in the world.
By 2018, Brazil will overtake Japan to become the fourth-largest buying
country and the Russian Federation will overtake India to become the
sixth-largest buying country.
What is interesting about the top buying countries in 2018 is the
emergence of Indonesia, Poland, and Malaysia. These countries now
represent significant revenue opportunities for suppliers. These countries
will be outspending countries with more mature markets like France,
Germany, and Sweden, which will all fall off the top fifteen list.
Table 2 - Top Fifteen Digital English Language Learning Buying Countries for 2013 and 2018
2013 2018
1. China China
2. The United States The United States
3. South Korea South Korea
4. Japan Brazil
5. Brazil Japan
6. India The Russian Federation
7. Taiwan Turkey
8. The Russian Federation India
9. Spain Indonesia
10. Turkey Taiwan
11. Canada Poland
12. France Canada
13. Germany Spain
14. Sweden Mexico
15. Mexico Malaysia
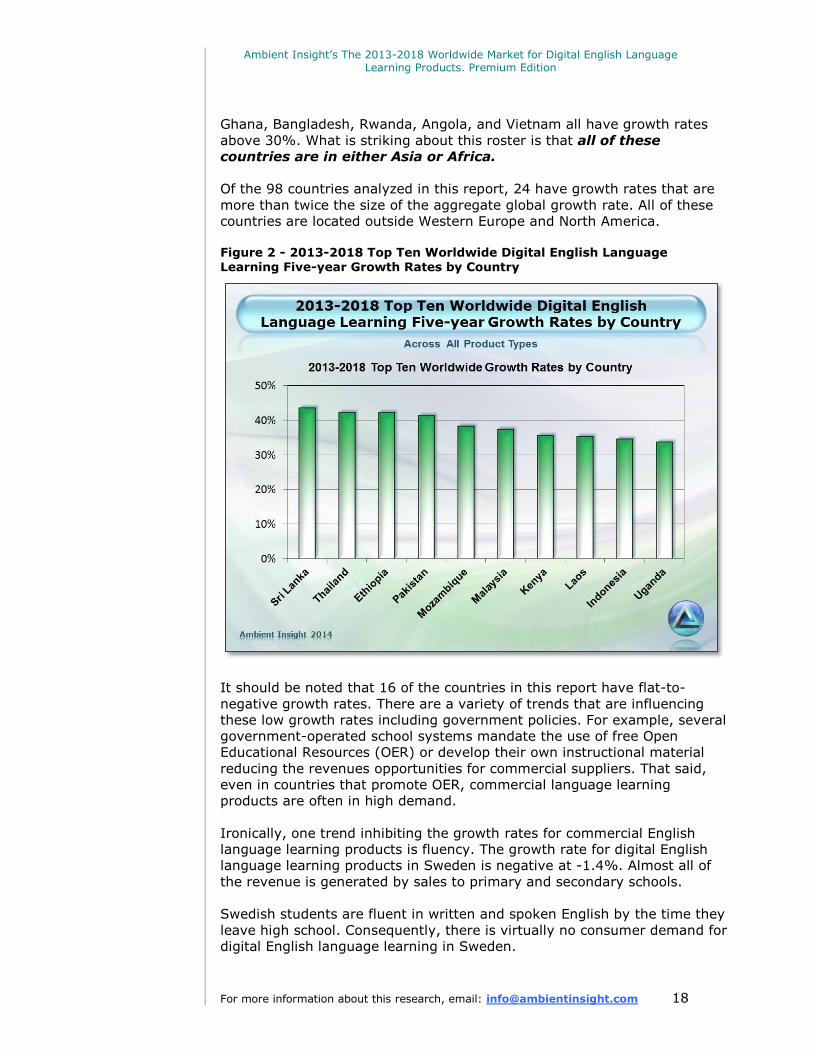
In terms of revenue growth, the countries with the highest growth rates
are Sri Lanka, Thailand, Ethiopia, Pakistan, Mozambique, Malaysia, Kenya,
Laos, Indonesia, and Uganda. All of these countries have growth rates that
are more than three times higher than the aggregate global growth rate.
By 2018, the US will still be the second-largest buying country, but China will be spending two and a half times more than the US.
Ambient Insight’s The 2013-2018 Worldwide Market for Digital English Language Learning Products. Premium Edition
For more information about this research, email: [email protected] 18
Ghana, Bangladesh, Rwanda, Angola, and Vietnam all have growth rates
above 30%. What is striking about this roster is that all of these
countries are in either Asia or Africa.
Of the 98 countries analyzed in this report, 24 have growth rates that are
more than twice the size of the aggregate global growth rate. All of these
countries are located outside Western Europe and North America.
Figure 2 - 2013-2018 Top Ten Worldwide Digital English Language Learning Five-year Growth Rates by Country
It should be noted that 16 of the countries in this report have flat-to-
negative growth rates. There are a variety of trends that are influencing
these low growth rates including government policies. For example, several
government-operated school systems mandate the use of free Open
Educational Resources (OER) or develop their own instructional material
reducing the revenues opportunities for commercial suppliers. That said,
even in countries that promote OER, commercial language learning
products are often in high demand.
Ironically, one trend inhibiting the growth rates for commercial English
language learning products is fluency. The growth rate for digital English
language learning products in Sweden is negative at -1.4%. Almost all of
the revenue is generated by sales to primary and secondary schools.
Swedish students are fluent in written and spoken English by the time they
leave high school. Consequently, there is virtually no consumer demand for
digital English language learning in Sweden.
Ambient Insight’s The 2013-2018 Worldwide Market for Digital English Language Learning Products. Premium Edition
For more information about this research, email: [email protected] 19
The market conditions are similar in the Netherlands, Denmark, Finland,
and Norway. In all of these countries, there is significant spending in the
PreK-12 segments, but very little in the consumer segments.
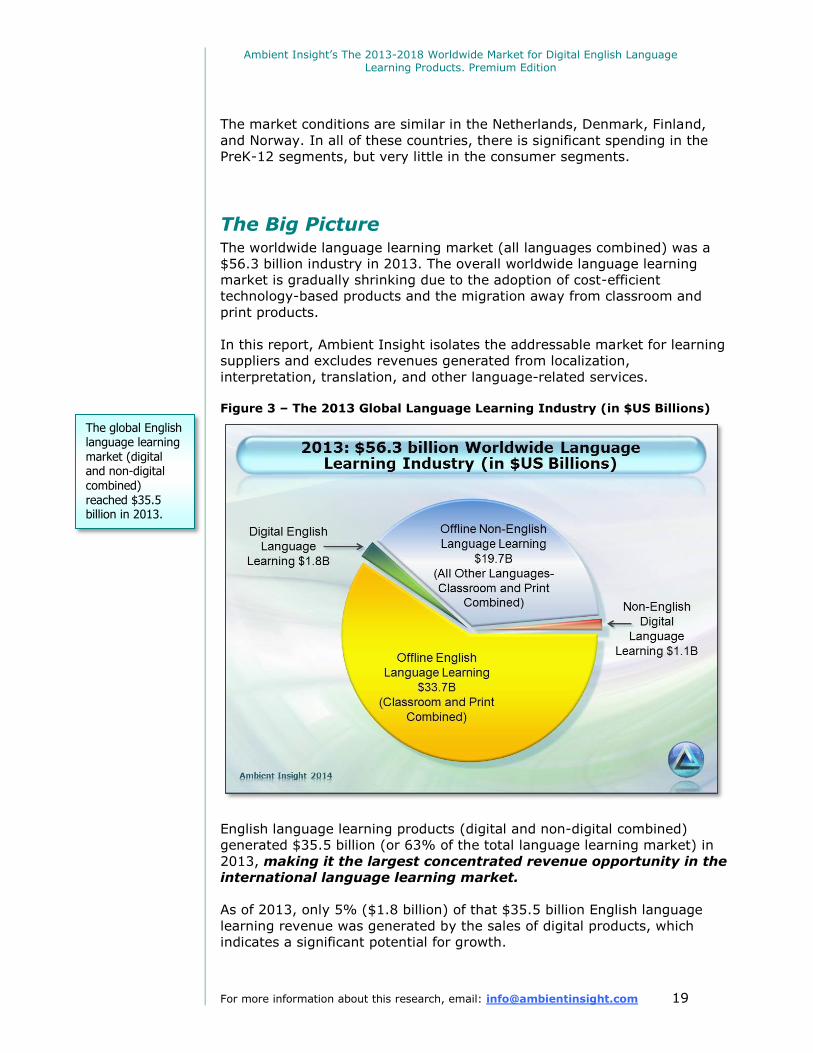
The Big Picture The worldwide language learning market (all languages combined) was a
$56.3 billion industry in 2013. The overall worldwide language learning
market is gradually shrinking due to the adoption of cost-efficient
technology-based products and the migration away from classroom and
print products.
In this report, Ambient Insight isolates the addressable market for learning
suppliers and excludes revenues generated from localization,
interpretation, translation, and other language-related services.
Figure 3 – The 2013 Global Language Learning Industry (in $US Billions)
English language learning products (digital and non-digital combined)
generated $35.5 billion (or 63% of the total language learning market) in
2013, making it the largest concentrated revenue opportunity in the
international language learning market.
As of 2013, only 5% ($1.8 billion) of that $35.5 billion English language
learning revenue was generated by the sales of digital products, which
indicates a significant potential for growth.
The global English language learning market (digital and non-digital combined) reached $35.5 billion in 2013.
Ambient Insight’s The 2013-2018 Worldwide Market for Digital English Language Learning Products. Premium Edition
For more information about this research, email: [email protected] 20
The current digital English language learning revenues are heavily
concentrated in five learning product types: Self-paced eLearning
(courseware), Digital Reference-ware (eTextbooks, video, audio),
Collaboration-based Learning (live online classes and live online tutoring),
Mobile Learning apps and edugames, and Mobile Learning value added
services (VAS). A five-year breakout for these products is provided for each
of the seven regions analyzed in this report.
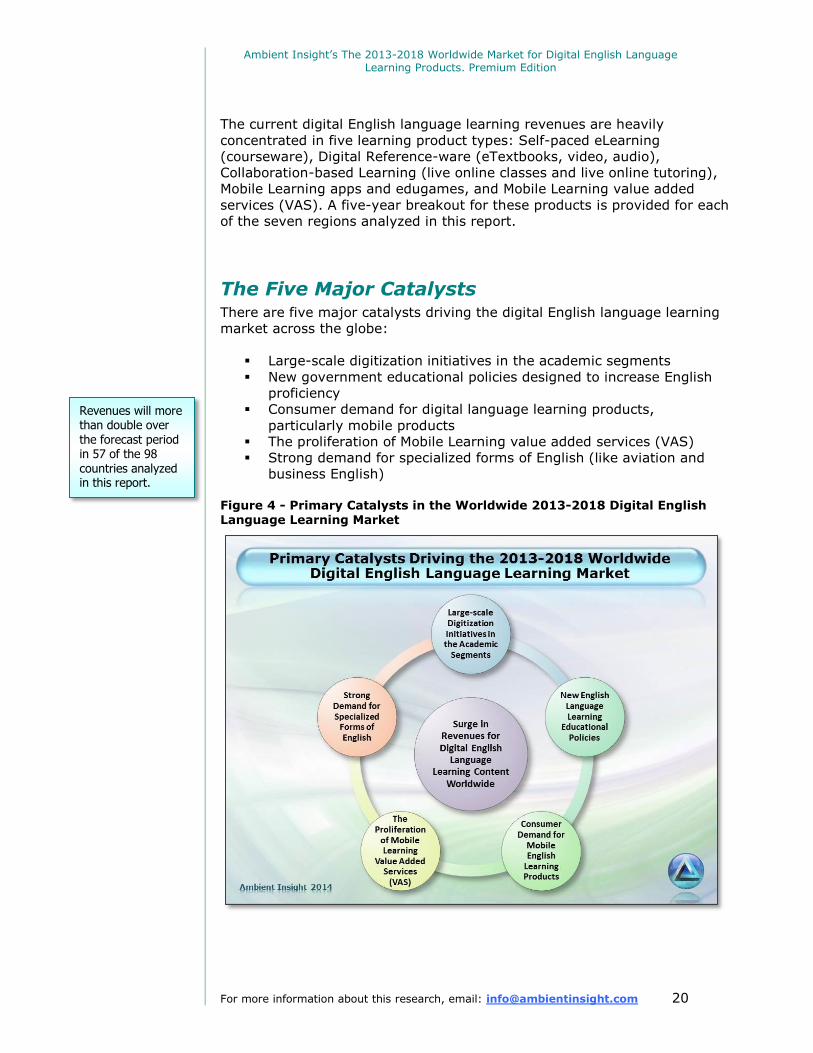
The Five Major Catalysts There are five major catalysts driving the digital English language learning
market across the globe:
Large-scale digitization initiatives in the academic segments
New government educational policies designed to increase English
proficiency
Consumer demand for digital language learning products,
particularly mobile products
The proliferation of Mobile Learning value added services (VAS)
Strong demand for specialized forms of English (like aviation and
business English)
Figure 4 - Primary Catalysts in the Worldwide 2013-2018 Digital English Language Learning Market
Revenues will more than double over the forecast period in 57 of the 98 countries analyzed in this report.
Ambient Insight’s The 2013-2018 Worldwide Market for Digital English Language Learning Products. Premium Edition
For more information about this research, email: [email protected] 21
An analysis of these catalysts is provided for all the countries included in
this report. Not all of these catalysts are present in every. Moreover, in
some countries, these trends can be inhibitors. Government education
policies are not always favorable to suppliers.
For example, the Hungarian government nationalized the primary textbook
industry in late 2013. The government is now the sole developer and
distributor of print textbooks in the state-run primary schools. The law
takes effect in September 2014 and it is still unclear how this will impact
the digital content suppliers.
Some countries and regions have other catalysts that are unique to the
area. A detailed overview of the catalysts for each region is provided in the
free abstracts for all seven regional digital English language reports
published by Ambient Insight.
Large-scale Digitization Initiatives in the Academic Segments
Large-scale digitization of educational content is now underway across the
globe. Governments and private school chains are spending a substantial
amount of money annually on digital content, live online tutoring, and
custom content services. The conversion of print-based English language
learning content is part of this digitization wave.
As schools migrate to digital content, a massive amount of commercial,
open source, and indigenous print-based English language learning content
is being ported to interactive digital formats. Large-scale national
deployments of tablets in the academic segments began in the developed
economies several years ago and more recently in developing economies.
Tablet deployment is often an integral component in digitization initiatives.
In April 2011, the Kazakhstan government announced a $1 billion
multi-year project to implement digital learning in the school
system, which includes a massive content digitization effort. The
government stated that "95% of subjects will be digitalized." In
March 2013, the Kazakh Education Minister was quoted in the press
saying "this is a large-scale project that will cover more than five
million people."
Between 2008 and 2013, Uruguay had distributed over one million
computing devices to students and became the first country in
the world to reach a one-to-one student-to-computer ratio.
In June 2013, the Kenyan government announced a four-year $622
million project to provide computing devices to every primary and
secondary student in the country. There are just under 10 million
school children in Kenya. In July 2013, the government indicated
that a "significant" amount of those devices would be tablets.
India's Aakash project could be considered a national effort since the federal government subsidizes the educational tablets, even though the states buy the devices.
Ambient Insight’s The 2013-2018 Worldwide Market for Digital English Language Learning Products. Premium Edition
For more information about this research, email: [email protected] 22
There are over 50 million primary and secondary students in Brazil. In both
public and private schools (sistemas), at least one foreign language is
mandatory in grades 6-9. According to the government's Census of Basic
Education, 47.4% of these schools offer English as the primary foreign
language. The National Fund for Educational Development (FNDE) in Brazil
has been working with Amazon to "convert print books to digital and then
wirelessly distribute them to teachers."
In May 2014, Amazon reported that the Brazil's Ministry of Education and
Amazon are in the process of digitizing and distributing over 200 textbooks.
The Brazilian eBook retailer Saraiva has a similar deal with the
government.
Brazil's federal government spends over $500 million a year (over a third
of the entire Brazilian publishing industry) on textbooks for schools and
announced that they will begin buying digital content in 2015. The
government estimates that they will have 80 million copies of digital
textbooks delivered to 7 million students by 2015, which is still only 12% of
the entire PreK-12 population.
The goal in Brazil is to have all books and instructional content in the high
schools in digital formats by 2017. In late 2013, the Brazilian government
said that over 460,000 tablets would be distributed in 2014, starting with
teachers.
So far, the largest national deployments of tablets in the schools in Asia are
in South Korea, Thailand, Malaysia, and Singapore. Each of these countries
are deploying the tablets differently, usually starting the process at specific
grade levels.
Suppliers need to track digitization efforts on an ongoing basis. Digitization
in the public schools systems is a policy-driven decision and conditions can
change literally overnight. In July 2011, the government in Thailand
announced that they would give every child in grades 1-6 a tablet starting
in the 2012 school year. Additionally, over 5 million children in the higher
grades were slated to get netbooks. About 1.6 million tablets had been
distributed by early 2014.
In June 2014, a new government came into power in Thailand and
announced that they would not continue the tablet program. Instead, they
revised the educational policy to shift the tablet funding to other types of
learning technology.
The Russian government announced in 2011 that they would equip 14
million schoolchildren with tablets within three years. A Russian company
called Rusnano signed a $700 million contract with UK-based Plastic Logic
to build a production facility in Zelenograd. In August 2013, Rusnano
abandoned the project after incurring losses of over $100 million.
The use of digital technology correlates directly to the demand for digital
English language learning products. According to Denmark's Ministry of
Children and Education, OECD's PISA (Programme for International Student
Ambient Insight’s The 2013-2018 Worldwide Market for Digital English Language Learning Products. Premium Edition
For more information about this research, email: [email protected] 23
Assessment) "ranked Denmark as the number one country in the
world using computers for foreign language instruction."
In March 2014, Ireland-based Onwards Learning signed distribution
agreement with eol.cn, a national education portal backed by the Chinese
Ministry of Education. EOL will distribute Onwards Learning's digital English
language learning content on the portal. "EOL serves the online educational
information and advisory needs of students, parents, teachers and the
country’s education service providers, achieving average daily unique page
views of over 45 million."
New English Language Learning Educational Policies
Governments around the world are implementing new educational policies
in an effort to increase English proficiency. More than half of the 98
countries analyzed in this report have issued new English instruction
educational policies in the last three years.
The policies usually include mandates to increase the amount of time spent
on English learning and/or to introduce English in earlier grades. Some new
policies have even changed the main language of instruction to English.
The educational policies surrounding the teaching of English are identified
for every country in this report.
In 2011, the Slovak government passed a law making English language
learning compulsory starting in the third grade. The law went into effect in
the 2013-2014 school year. English language learning begins in first grade
in Croatian schools and becomes mandatory by the fourth grade until the
end of high school. Students can opt to take a second foreign language
starting in fifth grade (usually French, German, or Italian).
Even in countries where students are allowed to select another language as
their first foreign language, English is still the most popular choice.
According to the Czech government, "the overwhelming majority of Czech
school children choose English as their first foreign language."
In May 2013, the government in Georgia announced that "English is now
officially the country’s main foreign language by choice." The Ministry of
Education reported that 73% of secondary students selected English as
their first foreign language. Russian was the second most popular choice at
17%, followed by German at 7%, and French at 3%.
In December 2013, the President of Kazakhstan called on all Kazakhs to
learn three languages: Kazakh, Russian, and English. He stated in the
press that "We need the English language to enter the global arena." The
Kazakhstan government has a formal Trinity of Languages program, "which
envisages all school graduates able to communicate equally well in Kazakh,
Russian, and English."
Several countries have recently designated English as the official language
of instruction in the schools.
English is an elective in Belgian secondary schools and students can take other languages instead. According to the Belgian government, over 90% of the students choose English.
Ambient Insight’s The 2013-2018 Worldwide Market for Digital English Language Learning Products. Premium Edition
For more information about this research, email: [email protected] 24
In late 2008, Rwanda declared English as the official language of
instruction in the schools. Before this, French was the official
language used in the schools. In November 2012, the government
stated in the press that the "greater part of the school-going
population will have functional English by 2015."
South Sudan is the newest recognized country on the planet having
broken away from Sudan in 2011. It declared English as the official
language, even though very few people speak English in the new
country.
In 2011, the Ministry of Education and Training in Vietnam made
English language learning compulsory starting in fourth grade and
started introducing students to English in the third grade. The
Vietnamese government's goal is to have all students in primary
and secondary schools proficient in English by 2020.
In the presence of mandates like these, it should be no surprise that there
is now a significant shortage of English language teachers in several
countries, and this is a catalyst for technology-based products and
services. The shortage of teachers is driving the demand for both self-
paced products and live online tutoring by native English-speaking teachers
based outside the respective countries.
In February 2013, the Turkish Ministry of Education announced a deal with
US-based DynEd (and their domestic reseller FuturePrints) to procure
digital English language learning content starting with grades 4 through 12.
The government stated in the press that "When fully implemented, 13
million Turkish public education students will study English with DynEd."
DynEd already had a major presence in the country with content in over
34,500 schools.
In June 2013, the Yemeni government announced a deal with UK-based
Training Connect to provide live online English language learning courses
via Skype to the schools starting in the 2014 school year. In the initial
rollout of the program, students will get two hours of instruction a week.
The Uruguay government announced their Ceibal en Inglés program in
2012, which funds live digital English lessons that are streamed to public
schools via web conferencing technology. Ceibal en Inglés announced a
partnership with the British Council in early 2013 to provide instructors for
the live online classes. The goal is to have 4,800 online classes a week
reaching 90% (495,000) of the students in Uruguay by 2015.
Educational policies that impact English language learning are not limited
to the PreK-12 segments. In many countries of the world, the government
plays a significant role in higher education, particularly in regard to
programs in general and the language of instruction in particular. Federal
and state/provincial agencies operate the higher education systems in
several of the countries analyzed in this report.
For example, French is currently the language of instruction in higher
education institutions in Morocco. This was the country's official education
Ambient Insight’s The 2013-2018 Worldwide Market for Digital English Language Learning Products. Premium Edition
For more information about this research, email: [email protected] 25
policy until recently. In June 2014, the government announced a plan to
transition to English as the language of instruction starting with medical
and engineering programs.
Consumer Demand for Mobile Digital Language Learning
Perhaps the most important long-term catalyst for digital English language
learning across the planet is the consumer demand for mobile educational
apps. Consumers will be significant buyers by the end of the forecast
period driven largely by the demand for mobile educational apps in general
and language learning apps in particular.
Consumers in many countries will be outspending the government agencies
in many countries by the end of the forecast period due to the rapid rollout
of mobile broadband across the world, the availability of very low-cost
smartphones and tablets, and the boom in demand for educational apps.
For example, the largest buyers of digital English language learning
products in China in 2013 were the government-run schools, followed by
the private language learning schools. By 2018, consumers will be the top
buyers in China.
Consumers are already the top buying segment in Azerbaijan, Bosnia,
Bulgaria, Croatia, the Czech Republic, Greece, Hungary, Italy, Lithuania,
India, Indonesia, Japan, Mongolia, Nepal, New Zealand, Singapore, South
Korea, and in the United States.
English language learning apps rank consistently in the top-ten paid Mobile
Learning apps in all the countries in Asia, including New Zealand and
Australia. Consumer spending on mobile-based English language learning
products represents significant new revenues for suppliers.
Consumers in Australia are avid buyers of English language learning mobile
edugames for children. As of June 2014, three of the top ten selling apps in
Google's Play Store in Australia were English language learning edugames
for young children.
The type of English learning content in the apps is different in each
country. Bestsellers in some countries are edugames designed for young
children. In other countries, test prep apps for standardized English exams
or business English apps dominate.
Mobile Learning apps and edugames are primarily purchased by
consumers; primary and secondary school systems are starting to become
significant buyers as they migrate to tablets.
Mobile English language learning apps have the highest global growth rate
across all regions out of the five product types analyzed in this report.
Mobile digital English language products have the highest growth rates in
Asia, Latin America, North America, and Western Europe.
English language learning apps consistently rank in the top ten bestselling educational apps in almost every country in the world, including
English-speaking countries.
Ambient Insight’s The 2013-2018 Worldwide Market for Digital English Language Learning Products. Premium Edition
For more information about this research, email: [email protected] 26
A new type of learning technology called Mobile Learning value added
services (VAS) has the highest growth rate in Africa, Eastern Europe, and
the Middle East.
The Proliferation of Mobile Learning Value Added
Services (VAS)
The rapid growth of new Mobile Learning VAS offerings across the globe
continues unabated. While the number of products coming on the market
has slowed recently, on average, there are still 5-6 new Mobile Learning
VAS products coming on the market every month.
Figure 5 - 2008-2013 Explosion of Mobile Learning Value Added Services (VAS) Products across the Planet
Mobile Learning VAS products are a new category of Mobile Learning that
emerged in 2008. In 2008, there were only six Mobile Learning VAS produc
ts in operation. By the end of 2012, there were over 220 Mobile Learning
VAS products in 55 countries. By the end of 2013, there were over 280
across 72 countries. While there are other types of Mobile Learning VAS,
English language learning accounts for the majority of these services.
Mobile Learning VAS products are now on the market in every region of the
world and deliver content in five major areas: language learning, math,
literacy, test prep, and mHealth education. The products are subscription-
based and sold directly to consumers by mobile network operators (MNOs),
device makers, and content suppliers.
The top selling educational app in the Apple app store
in Japan in June 2014 was an English language learning app for the TOEIC exam. (Eight of the top ten selling apps in the store were language learning apps and all of them were for English.)
Ambient Insight’s The 2013-2018 Worldwide Market for Digital English Language Learning Products. Premium Edition
For more information about this research, email: [email protected] 27
Mobile Learning VAS content is usually delivered via audio, Short Message
Service (SMS), or Interactive Voice Response (IVR). Many products are
subsidized by NGOs and governments agencies; even then, they depend on
commercial third-party suppliers for content.
The top revenue-generating Mobile Learning VAS is English
language learning and a breakout of that revenue for each region is
included in this report. By the end of 2013, there were 76 English-
related Mobile Learning VAS products in the world. Eighteen new offerings
came on the market in July 2014 alone.
The MNOs initially launched Mobile Learning VAS products in developing
economies in 2008 and are now expanding into the developed economies.
Mobile Learning VAS products are now also found in Australia, South Korea,
the UK, New Zealand, Taiwan, the US, Italy, Ireland, Germany, Finland,
Spain, and Japan.
The MNOs are now major Mobile Learning suppliers in Asia, Latin America,
and Africa. The Mobile Learning VAS offerings in developing economies
have relatively low subscription prices, yet have millions of customers.
Consequently, the revenues are quite high. This is a classic "rags to riches"
story with suppliers across the planet collectively generating
hundreds of millions of dollars in new revenue in just the last two
years.
The revenues for Mobile Learning VAS products are split between the MNOs
and the content suppliers. The MNOs depend on third-party commercial
suppliers for content, custom content development services, tools, and
platforms. They often pay subject matter experts to provide tutoring to
subscribers, so the revenue opportunities for suppliers are significant
across the supply chain.
By the end of 2013, there were 34 commercial Mobile Learning VAS
products on the market across Latin America; 13 of them were in Brazil.
Kantoo and Urban Planet Mobile are major digital English language learning
content suppliers to the MNOs in the region.
In March 2013, the telecom Zain launched the Cloud Campus Mobile
Learning VAS in Kuwait with content from UAE-based Hamdan Bin
Mohammed e-University (HBMeU). The content catalog had 1,950 Mobile
Learning apps at launch; this is the largest collection of Mobile Learning
content sold via subscription in the world. The collection includes over
600 digital English language learning apps.
MTN, Safaricom, and Airtel opetrate dozens of Mobile Learning VAS
products in Africa using digital English content from suppliers like US-based
Urban Planet Mobile. Tigo launched a new Mobile Learning VAS product
called EduMe English in Rwanda in July 2014. Urban Planet Mobile
announced in July 2014 that they had new deals with MNOs across Africa
including Ghana, Kenya, Morocco, Nigeria, Rwanda, Tanzania, South Africa,
and Uganda. Airtel signed a deal in mid-2014 to distribute Urban Planet
Mobile's digital English language learning products in 17 African countries.
Asia accounts for the majority of Mobile Learning VAS revenues throughout the forecast period, but it is not the fastest growing region. Africa has the highest growth rate in the world for Mobile Learning VAS.
Ambient Insight’s The 2013-2018 Worldwide Market for Digital English Language Learning Products. Premium Edition
For more information about this research, email: [email protected] 28
Mobile Learning VAS products are not on the market in some countries.
There are no operational English language Mobile Learning VAS products on
the market in Turkey. The detailed supply-side analysis for Turkey in this
report only includes four product types.
Strong Demand for Specialized Forms of English
The demand for specialized forms of English known as vocational English is
also a catalyst for the worldwide digital English language learning market.
These products are mostly purchased by corporate buyers, but government
agencies and individuals buy them as well.
Vocational English products include aviation, business, hospitality, finance,
law, medical, transportation, tourism, oil & gas, information technology,
and engineering English. The demand for particular forms of vocational
English varies by country and that is analyzed for each of the countries in
this report.
According to the World Travel and Tourism Council, global tourism and
hospitality industry employed 8.7% of the world's workforce. They estimate
that this will reach 10% by 2013. Large scale tourism English product sales
are usually sparked by international sporting events. In March 2014,
Education First (EF) announced that the Brazilian government had
designated them as the "official supplier of language training services for
the Rio 2016 Olympic and Paralympic Games."
EF will deliver English language training to "110,000 Rio 2016 staff as well
as to over 900,000 candidates for the Olympic volunteer program,
contractors, and school children in Brazil. In total, more than 1,000,000
people will be trained, making this the world's largest language
training program in progress."
Tokyo was selected for the 2020 Olympics. It is likely that Japan will
replicate the buying behaviors of Brazil and the Russian Federation (the
Sochi games) and spend a great deal of money on English training for
hospitality, public safety, and tourism personnel.
There are dozens of global suppliers that specialize in online business
English including Englishtown, goFLUENT, inlingua, and GlobalEnglish
(owned by Pearson). The mainstream language organizations like Berlitz,
Wall Street English (also owned by Pearson), and the British Council also
offer online business English courses. Rosetta Stone launched their
Advanced English for Business in February 2014.
Some suppliers offer highly-specialized forms of English language learning
such as English for accounting, engineering, human resources, real estate,
sales, and logistics. There is even a form of English learning called
automotive English.
There is a healthy demand for so-called oil and gas English in the energy-
rich countries of the world. GlobalEnglish has a multi-year contract with
Private language schools are defined as corporate buyers by Ambient Insight and the larger chains often license commercial content
on a large scale.
Ambient Insight’s The 2013-2018 Worldwide Market for Digital English Language Learning Products. Premium Edition
For more information about this research, email: [email protected] 29
Saudi Aramco to provide online English courses, "to thousands of
employees." A Saudi Aramco manager commented, "We are a global
energy company, and fluency in English, the language of the oil and gas
industry, is essential for communication within the company and with our
business partners around the world."
English is the bridge language of the energy sector in Angola and the oil
companies and the government are actively involved in increasing the
English proficiency of workers in the industry. In June 2013, an agreement
to increase English proficiency in the country was signed by the oil firm BP
Angola, the British Council, and the Higher Institute of Education Sciences
(ISCED).
An interesting digital English product is UK-based Immerse Learning's
English for Oil and Gas simulation developed for the Kazakhstan oil
company Tengizchevroil. It is a virtual environment with live participants
interacting and speaking to each other via avatars. "While students are
learning English, they walk around a virtual version of the equipment, such
as an offshore platform or tanker, that they are being trained to work on."
There is a very specialized form of English known as Academic English.
Academic English is intended not only to increase proficiency but also
designed to teach the cognitive skills required to be successful in English-
speaking higher education institutions. It is taught to students attending
domestic universities with a high number of English-only programs and
taught to students who intend to enroll in English-speaking institutions
outside the country.
Ed2Go is a division of Cengage Learning and offers live online Academic
English classes taught by teachers from community colleges. The average
cost of a six-week class is $99, which is very low for this type of product.
"We've served more than one million students, making the ed2go network
the world's single largest provider of online learning opportunities. These
high volumes help us keep our prices well below industry standards."
In contrast, the UCLA Extension offers online Academic English classes for
up to $525 for a course that runs for six weeks. The English Language
Institute (ELI) at Florida International University (FIU) in Miami sells their
ten-week online Academic English class for $550.
The most common form of specialized English offered by Canadian higher
education institutions is Academic English. The University of British
Columbia offers their self-paced Academic English courses free, but charges
$280 for their live online instructor-led Academic English courses.
Almost all of the countries analyzed in this report are member states of the
International Civil Aviation Organization (ICAO), which is a UN agency that
works with "global industry and aviation organizations to develop
international Standards and Recommended Practices (SARPs) which are
then used by States when they develop their legally-binding national civil
aviation regulations."
It should be noted that online Aviation English courses are available all over the world and buyers in any given country often purchase courses from suppliers outside the country.
Ambient Insight’s The 2013-2018 Worldwide Market for Digital English Language Learning Products. Premium Edition
For more information about this research, email: [email protected] 30
ICAO's Aviation English Language Test Service (AELTS) is the world's
aviation English certification body and recognizes three tests: the RMIT
English Language Test for Aviation (for pilots), the Test of English
Language Level for Controllers and Pilots (TELLCAP), and the English
Language Proficiency for Aeronautical Communication (ELPAC).
RMIT offers their test prep material in both print textbooks and online
courses. The TELLCAP and ELPAC are interesting exams that are delivered
by a live "examiner" and the exams are essentially conversation-based
assessments, which include ad hoc role play. The test taker must verbally
demonstrate English proficiency during a live interaction with the examiner.
There are global suppliers of aviation English. Macmillan sells four
packaged ICAO-compliant digital Aviation English language courses that are
purchased by individuals and training companies all over the world.
Carnegie Speech was spun out by Carnegie Mellon University and sells four
subscription-based ICAO-compliant online courses in a series called Climb
Level 4.
One of the most successful global online aviation English suppliers is US-
based DynEd. They have direct agreements with aviation buyers and
various resellers across the globe. They sell aviation English software in
Cambodia, Morocco, Tunisia, Cambodia, Vietnam, Mongolia, the UAE,
Kazakhstan, the US, and China. In China, DynEd's Aviation English courses
are used by China Airbus, Air China, and BeiHang Flight College.
There are regional suppliers of digital vocational English products. In
November 2013, the European Medical Students Association (EMSA)
announced a deal with Poland-based MedPharm to provide a 15% discount
on MedPharm's online Medical English product to all EMSA members across
Europe. The course is relatively expensive at the equivalent of $790 for 12
modules; the 15% discount reduces the price by $118.50.
Secondary Catalysts There are three important secondary catalysts driving the global digital
English language learning market:
The recent increase in private investments made to digital English
language learning suppliers
The expenditures made by governments on digital English as a
Second Language (ESL) programs
The steady adoption of digital products in the private English
language learning industry.
Leading Indicators: Private Investment Patterns
Ambient Insight considers learning technology investment patterns to be
leading indicators. One very clear pattern that has emerged since 2010 is
the investor interest in English language learning firms.
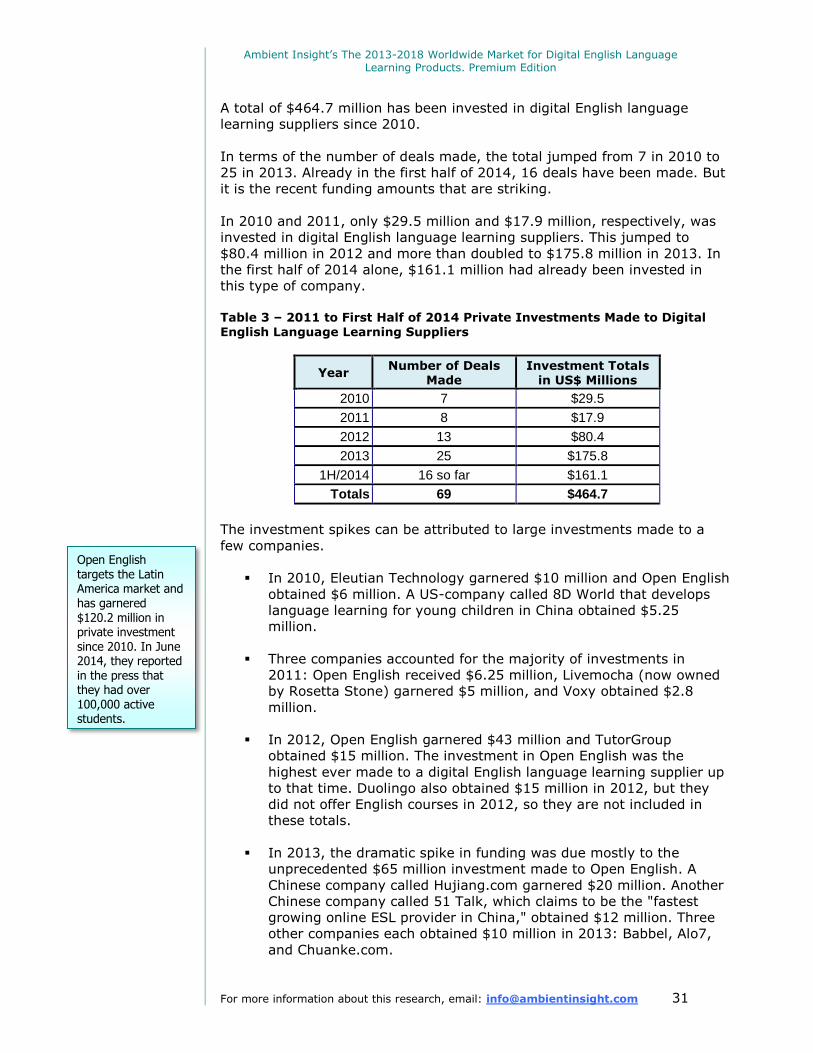
Ambient Insight’s The 2013-2018 Worldwide Market for Digital English Language Learning Products. Premium Edition
For more information about this research, email: [email protected] 31
A total of $464.7 million has been invested in digital English language
learning suppliers since 2010.
In terms of the number of deals made, the total jumped from 7 in 2010 to
25 in 2013. Already in the first half of 2014, 16 deals have been made. But
it is the recent funding amounts that are striking.
In 2010 and 2011, only $29.5 million and $17.9 million, respectively, was
invested in digital English language learning suppliers. This jumped to
$80.4 million in 2012 and more than doubled to $175.8 million in 2013. In
the first half of 2014 alone, $161.1 million had already been invested in
this type of company.
Table 3 – 2011 to First Half of 2014 Private Investments Made to Digital
English Language Learning Suppliers
Year Number of Deals
Made Investment Totals
in US$ Millions
2010 7 $29.5
2011 8 $17.9
2012 13 $80.4
2013 25 $175.8
1H/2014 16 so far $161.1
Totals 69 $464.7
The investment spikes can be attributed to large investments made to a
few companies.
In 2010, Eleutian Technology garnered $10 million and Open English
obtained $6 million. A US-company called 8D World that develops
language learning for young children in China obtained $5.25
million.
Three companies accounted for the majority of investments in
2011: Open English received $6.25 million, Livemocha (now owned
by Rosetta Stone) garnered $5 million, and Voxy obtained $2.8
million.
In 2012, Open English garnered $43 million and TutorGroup
obtained $15 million. The investment in Open English was the
highest ever made to a digital English language learning supplier up
to that time. Duolingo also obtained $15 million in 2012, but they
did not offer English courses in 2012, so they are not included in
these totals.
In 2013, the dramatic spike in funding was due mostly to the
unprecedented $65 million investment made to Open English. A
Chinese company called Hujiang.com garnered $20 million. Another
Chinese company called 51 Talk, which claims to be the "fastest
growing online ESL provider in China," obtained $12 million. Three
other companies each obtained $10 million in 2013: Babbel, Alo7,
and Chuanke.com.
Open English targets the Latin America market and has garnered $120.2 million in private investment since 2010. In June 2014, they reported in the press that they had over 100,000 active students.
Ambient Insight’s The 2013-2018 Worldwide Market for Digital English Language Learning Products. Premium Edition
For more information about this research, email: [email protected] 32
In May 2014, Oxford University Press (UOP) announced a distribution
agreement with Hujiang. The first product being sold on the platform is an
online course called Hujiang International Business English, which is an
adaptation of UOP's Business Result product. Hujiang reported that they
had 3 million active paying members and 70 million registered members
"made up primarily of young, white-collar workers, many who work for
foreign-owned enterprises".
Both Babbel and Chuanke offer other languages than English, but English is
the top language in demand. In June 2013, Babbel issued a press release
saying "English is the most popular language learned with the Babbel app:
The app for learning English represents approximately one third of the apps
downloaded. It is followed by the apps for learning Spanish and French."
The investment total for the first half of 2014 was on par with the total for
the entire year before. This is due to the breathtaking investment made to
TutorGroup. TutorGroup bills itself as the "largest English-language
learning institution in the world" and obtained $15 million in their first
round of funding in 2012. They garnered an astounding $100 million in
private investment in February 2014.
TutorGroup started in China and has expanded across the globe. "With
more than 2,000 teachers in 30 countries and 60 cities around the world,
TutorGroup provides real-time interactive language learning through
millions of class sessions annually." In October 2013, they reported that
their sales grew by 300% compared to the previous year.
Investments above $50 million were not uncommon in the early days of
the learning technology industry. However, since the 2000 recession,
investments over $50 million are quite rare. Investments of $100 million or
more were made to two learning technology companies in 1999, but only
three companies have received that level of funding since: K12, Inc. at
$125 million in 2011, lynda.com at $103 million in 2013, and now
TutorGroup at $100 million in 2014.
Investors are funding companies with novel and innovative products. Four
examples are Carnegie Speech, SpeakingPal, Alo7, and Cambridge WoWo.
Carnegie Speech was spun out from Carnegie Mellon. They obtained
$3.4 million in funding in 2012. They have garnered $12.6 million in
funding so far. They have developed built digital English language
learning products that incorporate speech recognition and artificial
intelligence. "Using state-of-the-art speech recognition and artificial
intelligence technologies licensed from Carnegie Mellon University,
Carnegie Speech enables cost-effective, scalable and personalized
spoken language instruction that maximizes training effectiveness
and minimizes training time." They also sell an aviation English
product called Climb 4.
SpeakingPal received $1 million in funding in May 2014. They also
incorporates speech recognition into their software. They sell mobile
digital English language learning apps that use a virtual tutor that
The startup community site called AngelList identifies 216 language learning startups that have launched since 2011. Almost all of them specialize in English language learning.
Ambient Insight’s The 2013-2018 Worldwide Market for Digital English Language Learning Products. Premium Edition
For more information about this research, email: [email protected] 33
interacts with the user. "English Tutor is a unique mobile learning
system that brings speech recognition capabilities to the mobile
phone, creating a new learning experience. The teaching content
contains a range of dialogs, interactive exercises, role playing, and
language activities."
Qualcomm and two other firms invested $10 million in the Chinese
supplier Alo7 and claims that "Alo7 is a world first: a virtual
environment designed specifically to teach Chinese children
authentic English. Children learn English and many other skills while
traveling around the Alo7 world."
Qualcomm also invested in a Chinese company called Cambridge
WoWo in early 2014. The company uses speech recognition and an
intelligent virtual tutor to teach preschool children English. The
technology was developed by Cambridge University and MIT.
Another interesting pattern is the interest in suppliers that serve the
Chinese market. This only started in earnest in 2013 and $183.6 million
has been invested in 17 online English language learning suppliers in China
from 2013 through the first half of 2014. This trend is likely to continue.
According to an April 2014 article in The China Times, over 1,000 new
online education companies opened for business in China in 2013 alone.
"Chinese internet giants Baidu, Tencent and Alibaba have begun building
their respective online learning platforms and have proactively invested in
e-learning companies or products in the meantime."
A November 2013 consumer survey by Nielson and Sina in China found
that 39% of consumers in China take online classes. "The most popular
category is technical and vocational training, the second is English
learning, and the third K-12 education."
According to China-based Internet consultants iResearch Group, "There's
an increasing number of Internet users in China. More of them are getting
used to online classes and the number of online learners in China is
expected to grow from 67.2 million in 2013 to 120 million in 2017."
Clearly, the market conditions are favorable for digital English language
learning suppliers in China. That said, doing business in China can be
challenging for a foreign firm. An analysis of those challenges and how
suppliers are overcoming them is included in this report.
Government-funded Online English ESL Programs
It should come as no surprise that the largest government expenditures on
English as a Second Language (ESL) programs are in the English-speaking
countries including Australia, Canada, Ireland, the UK, and the US. As they
migrate to online formats, they hire commercial suppliers to develop the
new digital programs.
Ambient Insight’s The 2013-2018 Worldwide Market for Digital English Language Learning Products. Premium Edition
For more information about this research, email: [email protected] 34
In February 2012, the Australian federal government announced a
three-year trial project called Virtual English Tuition for Migrants
that "empower them to engage with the broader Australian
community, enhancing their English acquisition in an Australian
cultural context." The virtual product is called AMEP (Adult Migrant
English Program) Virtual and was launched in July 2013. It was built
by Navitas, a for-profit education provider in Australia.
States also fund ESL programs in Australia. New South Wales
(NSW) offers online courses free to qualified immigrants, but
charges a fee (the equivalent of $90) for other people wanting to
learn English online. NSW also licenses the courses to academic
institutions for the equivalent of $800 per course.
Government-funded ESL programs are subject to policy decisions and
programs can be cut or eliminated altogether. The New Zealand
government used to provide free classroom-based English classes for
immigrants, but a new immigration policy in New Zealand requires
applicants with poor English skills to "pre-pay for language lessons."
Government-funded ESL programs are not all designed for immigrants.
Many governments fund ESL programs for employees. While most of this
training is still delivered in classrooms, governments are transitioning to
online formats. The Canada School of Public Service no longer offers
classroom-based English training but does offer 26 online ESL courses to
government employees.
The US federal government spends over $565 million a year on adult
English language learning. Combined, state and local governments spend
an additional $1.6 billion a year on adult ESL education. The federal
government funds the Adult Education State Grant Program administered
by the individual states. The program reaches 1.1 million English language
learners a year, mostly through classroom instruction. The agencies are
just starting to migrate to digital ESL.
The US Department of Education (ED), Office of Vocational and Adult
Education, and the Division of Adult Education and Literacy (DAEL) funded
a site with digital ESL courses and apps called U.S.A. Learns. The content is
now owned by the Sacramento County Office of Education. Interestingly,
while the online courses are free, the mobile apps are sold for 99 cents.
The US State Department hired a commercial supplier to develop their
Trace Word English language learning game. The edugame was developed
by the US Department of State’s Bureau of Educational and Cultural Affairs
(ECA) and the SuperGroup Creative Omnimedia, a multimedia company
based in Atlanta. The digital edugame was formally launched in November
2012. It is distributed in countries across the world but is also designed to
help ESL learners in the US.
Governments also fund ESL programs in other countries. The US State Department has a Regional English Language Offices (RELO) across the planet. They offer a range of online English language learning resources.
Ambient Insight’s The 2013-2018 Worldwide Market for Digital English Language Learning Products. Premium Edition
For more information about this research, email: [email protected] 35
Private Language Schools Go Digital
Private language schools are categorized as business buyers in this report.
There are thriving private English language learning industries in the
majority of countries analyzed in this report. All of the English-speaking
countries have a large number of private language schools that cater to
foreign students. To date, the vast majority of instruction is delivered in
classrooms and usually supplemented by language learning labs.
Private language schools are gradually shifting to online delivery as a way
to increase margins. Self-paced products generate the highest profit
margins. A research firm called Skrivanek surveyed 100 language schools
in Prague and found that 70% were offering online classes. "Companies are
interested in elearning for three reasons: to save money and time and
increase the intensity of the lessons."
Salaries paid to teachers who deliver live online classes and live tutoring
sessions are often on par with salaries paid to physical classroom teachers,
but the margin is still higher since maintenance of physical classrooms and
equipment is not required.
The presence of large private language school ecosystems is a catalyst for
digital English learning as the private schools transition to online delivery.
The quickest way to get to market is to resell commercial products.
Macmillan, Cambridge University Press, and Oxford University Press have
very large installed bases in the global private school industry.
Macmillan Education has a digital language learning portal called Macmillan
English Campus. One of their largest customers is Cultura Inglesa São
Paulo (CISP) in Brazil, "one of the world’s largest and most prestigious
language schools. Over 50,000 students now use a customized edition of
the Macmillan English Campus called the Cultura e-Campus."
The major suppliers are now going direct to consumers with online
language schools. In March 2013, Macmillan launched their online language
school in Brazil called EnglishUp. EnglishUp is a division of Macmillan Digital
Education and "is an online English language learning school for adults and
young professionals who lead busy lives but are motivated to speak fluent
English to achieve their personal or professional goals."
There is a reason Macmillan launched their first EnglishUp site in Brazil. By
the end of 2013, over 2.8 million people (from children to adults) were
taking English lessons in Brazil. Private English language learning is a $3.1
billion industry according to the Brazilian Franchising Association. Brazil
had over 70 brands and 6,215 branches of private English language schools
by the end of 2013.
Pearson now owns the largest private language learning chains in Brazil.
Pearson acquired Grupo Multi in late 2013 for $720 million. Grupo Multi
operates four chains of English schools and is "the largest provider of
private language schools in Brazil serving over 800,000 students across
more than 2,600 franchised schools. In August 2014, Pearson reported in
their mid-year financial statement that they had begun "planning to
English is even popular in Francophone countries. Castle is a language learning school in Algiers and reported in the press that, "65% or our students apply for enrollment in English, 30% in French, and the
remaining 5% is divided between the German and Spanish."
Ambient Insight’s The 2013-2018 Worldwide Market for Digital English Language Learning Products. Premium Edition
For more information about this research, email: [email protected] 36
integrate Multi’s products and expertise with Pearson’s world leading
educational technology and pedagogy."
Despite a relatively recent meltdown in the private language school
industry in Japan, the English language learning industry in Japan is still a
$1.2 billion industry. In any given year, there are over 13 million people in
Japan studying English. Each year, 5.4 million people in Japan take a
standard English proficiency exam such as the ETS Test of English for
International Communication (TOEIC) exam.
Private language schools in Japan are called eikaiwa, which translates as
"conversation schools." According to Japan–based Benesse (parent
company of Berlitz), 21% of all five year olds in the country are enrolled in
an eikaiwa. Benesse is the largest provider of digital English products in
Japan.
The largest (and fastest growing) online English language learning school in
Japan is a company called RareJob. In January 2014, they reported in the
press that they had over 200,000 Japanese students taking English in
2013, almost three times the 70,000 they had in 2012. They have over
3,200 online instructors from all over the world, and on average, taught
12,000 25-minute lessons a day in 2013. RareJob obtained $3.3 million in
private investment in 2013 and went public in June 2014.
Nagase is a for-profit Japanese education provider and operates 110
private English language schools under their Toshin Kids English School
brand. They licensed the digital Sesame Street English content from
Sesame Street in 2010 in a ten-year $30 million contract. They are the sole
reseller of Sesame Street English in Japan (Berlitz was the sole licensee
prior to this).
The private language school market is a $450 million industry in Russia.
There are over 200 language schools operating in Moscow alone. All the
major digital English language learning suppliers compete in the Russian
Federation including EF's English First, Berlitz, and Pearson's Wall Street
English.
Some of the bigger Russian chains have large numbers of students. EF
English First has 38 English schools in the Russian Federation and has
1,300 employees and trainers. Denis’ School, a Russian-based language
school chain, licenses Edusoft's vocational English courses for their 155,000
students.
According to Statistics Canada, language learning is a $770 million industry
in Canada. There are over 500 language schools in Canada; 54% of the
schools are private. 64% of all the schools target foreign students. Two of
the largest digital ESL suppliers serving the Canadian private school
industry are Montreal-based English Computerized Learning (ECL) and NAS
Software. Toronto-based NAS Software claims to be "one of the largest ESL
software distributors across Canada" and is a reseller of over 40 third-party
ESL products.
Nagase acquired half of US-based Eleutian Technology's assets in April 2014. Eleutian provides live online English tutoring to organizational
buyers in Asia. Nagase was their largest client in Japan prior to the acquisition.
Ambient Insight’s The 2013-2018 Worldwide Market for Digital English Language Learning Products. Premium Edition
For more information about this research, email: [email protected] 37
Marketing English in Ireland (MEI) is an association of 54 English language
schools in Ireland. The MEI members annually serve over 200,000 visiting
language students from all over the world. The Irish government estimated
that the classroom-based English language learning industry generated
over $400 million in 2013.
The Irish government immigration site provides a link to the Advisory
Council for English Language Schools (ACELS), which oversees (and
inspects) private English language schools in Ireland. As of May 2014,
there were 109 private English language schools recognized by ACELS.
Berlitz and several other online suppliers are recognized by ACELS.
Of course, China is the largest revenue opportunity for suppliers. According
to China's Ministry of Education's National Education Development
Statistical Bulletin, English language learning was a $4.9 billion industry in
China by the end of 2013, and growing, on average, by 12-15% a year.
There are over 50,000 English language schools in China and over 90% are
private institutes.
The private language schools are heavily concentrated in economically
developed areas, such as Beijing, Shanghai, Guangzhou, Shenzhen,
Chongqing, and Wuhan. Disney, Pearson, Education First (EF), and New
Oriental Education combined account for 25% of the private English
language learning revenues in China. EF has 120 private language schools
in China.
What is interesting about the Chinese private language school industry is
that many of the largest suppliers are online private schools. According to
ChinaVenture Investment Consulting Group, 32% of all online education
companies in China provide preschool education and 27% are dedicated
language learning companies.
New Oriental Education claims to be the largest provider of "private
educational services" in China with a catalog of courses including language
learning courses. In 2013, they reported that revenues for "online
children’s English classes are rising 35% a year." They had 8.8 million
registered students of all ages as of early 2014 and report that "English is
by far the most popular language we teach."
In August 2013, Alibaba's Taobao (sometimes called China's eBay)
launched their new online education portal called Taobao Tongxue
(Classmates). In April 2014, Taobao Tongxue's chief executive stated in the
press that their most popular online courses were "English language
training, followed by marketing management, tutoring for middle and
elementary school students, literal sciences, and vocational exams."
Products for very young children are in high demand in China. There are
over 150,000 preschools in China and 74% are private schools. A preschool
in China enrolls children from 3-5 years old and is often simply referred to
as a kindergarten. As of the end of 2013, there were 42 million children
enrolled in preschools in China.
The private schools in China are now a significant reseller channel for commercial digital English language learning suppliers.
Ambient Insight’s The 2013-2018 Worldwide Market for Digital English Language Learning Products. Premium Edition
For more information about this research, email: [email protected] 38
Teaching English is a core tenet in the majority of the private preschools in
China. The large private preschool chains in China often license commercial
digital English content.
In March 2012, McGraw-Hill announced a ten-year licensing deal with
Beijing-based Oriental Baby Care, which operates over 450 preschools in
180 cities in China. By mid-2014, Oriental Baby Care had over 570
preschools in the country. "Through the partnership, Chinese children ages
2-6 will for the first time have access to McGraw-Hill Education's digital
learning solutions through a specially designed international curricula that
will enhance the English language skills of some of China's youngest
learners."
This report provides a breakout in two tables of the forecasts for both
consumer and PreK-12 spending in China on digital English language
learning products used by five age groups, or cohorts:
3-5 years old (referred to as Kindergarten in China)
6-7 years old (first and second grade)
8-11 years old (third, fourth, fifth, and sixth grades)
12-14 years old (seventh, eight, and ninth grades)
15-17 years old (tenth, eleventh, and twelfth grades)
The cohort analysis for China provided in this section unveils significant
differences between consumer and PreK-12 spending for these cohorts. A
breakout by the five age cohorts is provided in the consumer section of the
China section of this report. A breakout by five grade levels in China from
kindergarten to high school is provided in the PreK-12 section.
What You Will Find in This Report There are seven regional sections in this report. Each regional section
includes a demand-side analysis by country and a supply-side analysis. The
supply-side analysis in each regional section contains five-year forecasts
for five types of digital English language learning products for all of the
countries in that region combined. Country supply-side analysis is only
provided for Brazil, Canada, China, Turkey, and the United States in this
report.
The country sections for Brazil, Canada, China, Turkey, and the United
States also include a five-year breakout by six buyer segments:
consumers, corporations & businesses, PreK-12 school systems, higher
education institutions, federal government agencies, and
local/provincial/state government agencies.
This report includes a worldwide demand-side analysis by the seven
regions and a worldwide supply-side analysis by five product types. This
gives digital English language learning suppliers an overview of the global
revenue opportunities.
This report does not include revenues for custom content development
services. Standardized English exam and proficiency test revenues are not
All revenue forecasts in this report are in US Dollars (US$) based on currency exchange rates as of July 2014.
Ambient Insight’s The 2013-2018 Worldwide Market for Digital English Language Learning Products. Premium Edition
For more information about this research, email: [email protected] 39
included in the forecasts in this report. Revenues for online courses for test
prep are included.
Ambient Insight only provides forecasts for expenditures on the actual
instructional product and not for peripheral revenues like installation,
integration, certificates, support, professional development, or for ads,
merchandise, or tokens in freemium products.
This report only includes revenues for digital English as a Second Language
(ESL) and English as a Foreign Language (EFL) products. It does not
include early childhood reading, writing, and literacy products designed for
children that already speak English.
Who Are the Buyers?
The six major buying segments for digital English language learning
products are consumers, corporations & businesses, PreK-12 school
systems, higher education institutions, federal government agencies, and
state/provincial/local government agencies.
In general, the top buyers are the government-operated school systems
and, increasingly, consumers. This is not true in every country and
corporate buyers outspend consumers in some countries.
Consumers are becoming a significant revenue opportunity for suppliers,
due in large part to the booming mobile markets in almost every country in
the world.
Federal and municipal government agencies purchase digital English
language learning products for their employees, military personnel, and
diplomatic staffs. Government agencies often fund tourism English classes
and online courses in their efforts to support the tourism industry.
Higher education institutions buy commercial English language learning
products from education publishers and language learning lab suppliers.
Higher education institutions in many countries tend to create their own
instructional content, but it is often cheaper to buy commercial products.
Corporations are strong buyers of specialized forms of English, particularly
business English. The large multinational corporations represent the
biggest revenue opportunities for suppliers. In May 2013, a Rosetta Stone
executive state in the press that, "Growth in corporate language training is
the biggest trend we've seen in the last three years. In 2009, Rosetta
Stone's corporate clients were limited to a small percentage of Fortune
1000 companies, but today it's one of the company's fastest growing
segments."
It should be noted that many NGOs and foreign government agencies fund
digital English language learning initiatives in many countries. Several
technology companies such as Microsoft, Intel, and Samsung also fund
digital education efforts, which include English language learning
components.
Academic English is relatively complex to develop and it is cheaper for the institutions to buy commercial products rather than develop their own material.
Ambient Insight’s The 2013-2018 Worldwide Market for Digital English Language Learning Products. Premium Edition
For more information about this research, email: [email protected] 40
The first thing a supplier has to do before entering a country is to
understand the language usage patterns in that country. The language
usage patterns are analyzed for every country in this report. This provides
suppliers with a quantifiable demographic (and potential customer base)
for their products. Even in countries where English is an official language, it
is often the first language of very few people.
For example, English is one of three official languages of Zimbabwe, but
only 3% of the population speaks it as a first language. The official
language of Zambia is English; it is the first language of only 4% of the
Zambian population. There are at least 73 other languages spoken in
Zambia.
English is the primary language of instruction in South Africa, although
students have the option of taking classes in different languages. According
to a February 2012 survey published by the Department of Basic
Education, "over 60% of pupils in South African schools choose English for
learning, despite the fact that only 7% of pupils speak English as their
home language. Out of the country’s 12.3 million pupils (in both private
and public schools) only 851,536 speak English at home, yet 7.6 million
pupils choose English as their preferred language of learning."
This report also analyzes the percentages of non-native English speakers in
English-speaking countries. This demographic is quite large in countries like
the US, the UK, Australia, Ireland, and Canada.
The presence of large numbers of non-native speakers correlates directly to
the demand for English language learning products in the early grades in
the school systems and the demand for adult ESL products.
For example, over 532,000 people migrated to the UK in 2013, mostly from
European countries hard hit by the economic slowdown such as Spain,
Portugal, Italy, Greece, and Poland. According to the UK government, as of
February 2014, one in nine UK schools has a majority of students who do
not speak English as a first language. By the end of 2013, there were 1.1
million primary and secondary students taking English in the UK.
What Are They Buying?
Buying behavior is quite different in most countries of the world. The
unique patterns are analyzed for each of the 98 countries in this report.The
current digital English language learning revenues are concentrated in five
learning technology product types:
Self-paced eLearning (courseware)
Collaboration-based Learning (live online classes and live online
tutoring)
Digital Reference-ware (eTextbooks, audio, video)
Mobile Learning apps and edugames
Mobile Learning value added services (VAS)
Many commercial content suppliers have distribution agreements with local resellers. These resellers are potential partners
for any commercial supplier that wants to enter a specific market.
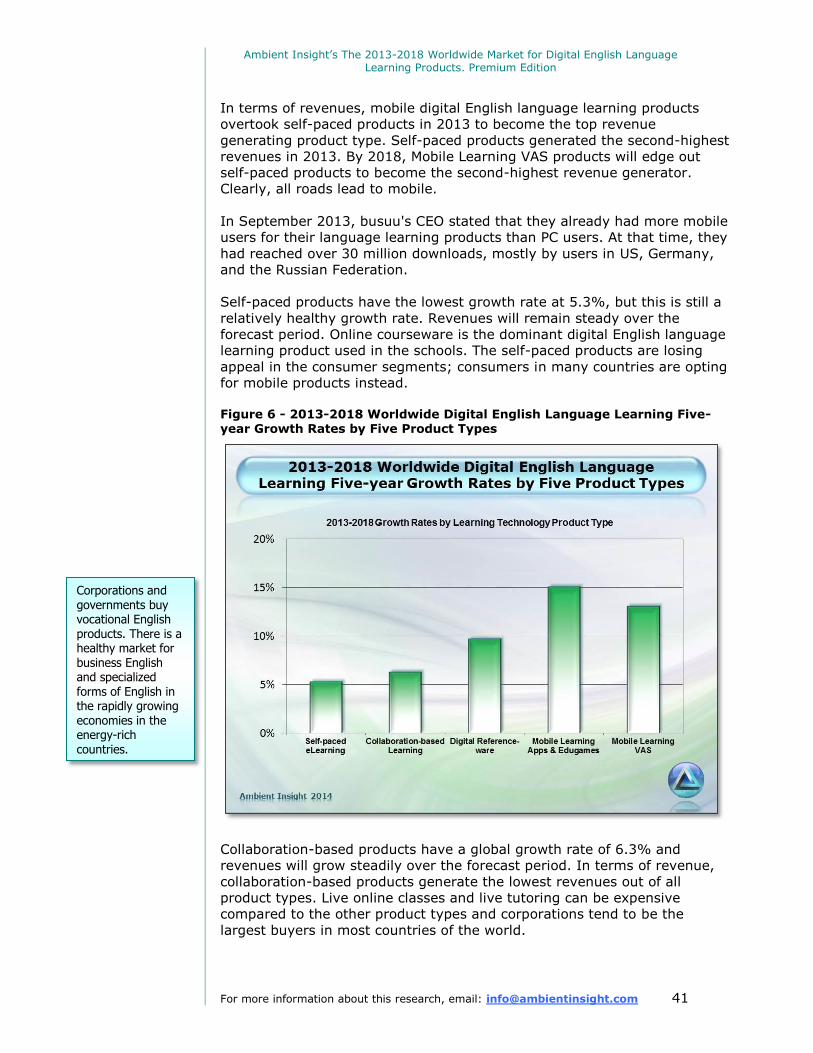
Ambient Insight’s The 2013-2018 Worldwide Market for Digital English Language Learning Products. Premium Edition
For more information about this research, email: [email protected] 41
In terms of revenues, mobile digital English language learning products
overtook self-paced products in 2013 to become the top revenue
generating product type. Self-paced products generated the second-highest
revenues in 2013. By 2018, Mobile Learning VAS products will edge out
self-paced products to become the second-highest revenue generator.
Clearly, all roads lead to mobile.
In September 2013, busuu's CEO stated that they already had more mobile
users for their language learning products than PC users. At that time, they
had reached over 30 million downloads, mostly by users in US, Germany,
and the Russian Federation.
Self-paced products have the lowest growth rate at 5.3%, but this is still a
relatively healthy growth rate. Revenues will remain steady over the
forecast period. Online courseware is the dominant digital English language
learning product used in the schools. The self-paced products are losing
appeal in the consumer segments; consumers in many countries are opting
for mobile products instead.
Figure 6 - 2013-2018 Worldwide Digital English Language Learning Five-year Growth Rates by Five Product Types
Collaboration-based products have a global growth rate of 6.3% and
revenues will grow steadily over the forecast period. In terms of revenue,
collaboration-based products generate the lowest revenues out of all
product types. Live online classes and live tutoring can be expensive
compared to the other product types and corporations tend to be the
largest buyers in most countries of the world.
Corporations and governments buy vocational English products. There is a healthy market for business English and specialized forms of English in the rapidly growing economies in the energy-rich countries.
Ambient Insight’s The 2013-2018 Worldwide Market for Digital English Language Learning Products. Premium Edition
For more information about this research, email: [email protected] 42
Several government-operated school systems across the planet purchase
live English courses in their efforts to mitigate teacher shortages and to
increase the pace of achieving their national English proficiency goals.
An interesting product bundle is Ireland-based Onwards Learning's
LearnOnEnglish (LoE), which is actually a collection of over 100 third-party
products from over 300 digital English suppliers. The LoE catalog includes
"software apps, courseware and learning path systems, tutor services,
assessment tools, and accreditation programmes." The company has
massive distribution agreements in China with government-backed
educational portals and vocational schools and is actively seeking new
content partners.
The private language schools buy language learning labs and use the
software as supplemental content used in tandem with their classroom
instruction. The language learning lab suppliers often partner with
commercial language learning suppliers for the content in their labs.
Finland-based Sanako is the world's largest language lab supplier with over
40,000 installations across more than 100 countries. In early 2013, Sanako
announced an agreement with Oxford University Press "to resell digitised
content from the English for Life series to both existing Sanako customers
and new customers of digital software labs." The bundle is called English
for Life, powered by Sanako.
Other major language learning lab suppliers include US-based
Linguatronics, Germany-based TLS Communication, and US-based SANS,
which sells the Sony Virtuoso Language Lab. "SANS is the developer and
exclusive licensor of Sony Language Learning Software."
Aptech is an India-based training company best known for their IT training.
In 2009, they launched their English Express brand and began offering
English classes in the training centers across the globe. In July 2014,
Aptech announced that they had selected SANS' language learning lab for
use in the English Learning Academies, which are franchises located
primarily in developing countries.
Pearson has a dedicated division called Pearson English and is one of the
largest digital English suppliers. Their financial statements provide a good
snapshot of the global market. In August 2014, Pearson reported in their
mid-year financial statement that "Improvements have been made to
MyEnglishLab, our digital English language course, to increase the efficacy
and scalability of the platform. Registered users for MyEnglishLab digital
products grew 10% to almost 300,000. "
Financial statements from global suppliers like Macmillan, Santillana,
Sanoma, Oxford University Press, Rosetta Stone, McGraw Hill, Cambridge
University Press, Houghton Mifflin Harcourt, Benesse (parent company of
Berlitz), and many other also provide insight into global, regional, and
country buying behavior. For example, Sanoma has been reporting on the
impact of the dramatic budgets cuts in the Hungarian education system for
several years. In 2013, they sold off their educational publishing assets in
Hungary and exited the country completely.
The telecoms are major players in the learning technology industry across the planet and now compete directly in the consumer digital English language learning market with English Mobile Learning VAS products.
Ambient Insight’s The 2013-2018 Worldwide Market for Digital English Language Learning Products. Premium Edition
For more information about this research, email: [email protected] 43
Commercial English language learning products are purchased by
government-operated school systems even in countries where the
government develops and publishes their own textbooks. The government-
operated schools systems primarily buy self-paced and digital reference
(eTextbooks) English language learning content.
The global growth rate for English-related Digital Reference-ware products
is 9.7%. The majority of these products are eTextbooks being sold to
accommodate digitization efforts in the school systems. Reference-based
exam prep products for standardized English exams and matriculation
requirements are also in high demand in many countries analyzed in this
report.
The aggregate global growth rate for Mobile Learning VAS products is
13.1%, second only to mobile apps. While English-related Mobile Learning
VAS products continue to be in high demand in developing economies
(often on a massive scale) they are increasingly gaining adoption in the
developed economies. The demand for VAS products is a significant
revenue opportunity for content suppliers, regardless of their physical
location. US-based Urban Planet Mobile provides mobile digital English
language content to MNOs across the planet.
Related Research Buyers of this report may also benefit by the following Ambient Insight
market research:
The 2012-2017 Worldwide Mobile Learning Market
The 2013-2018 Worldwide Market for Self-paced eLearning
Ambient Insight’s 2014 Learning Technology Research Taxonomy
Link to Free Abstracts for the Seven Regional Digital English Reports
“We Put Research into Practice”
www.ambientinsight.com


![Untitled-1 [kachhiproperties.com]...PLOT 10 12 13 14 15 16 17 18 19 20 21 22 23 24 25 26 27 28 29 30 TYPE OF PLOT SQ. FT. PREMIUM PREMIUM PREMIUM PREMIUM PREMIUM PREMIUM PREMIUM PREMIUM](https://img.pdfslide.net/doc/110x75/60d9385783220366c70105ab/untitled-1-plot-10-12-13-14-15-16-17-18-19-20-21-22-23-24-25-26-27-28-29.jpg)