Embed Size (px)
Citation preview
American Sociological Review 1 –28© American Sociological Association 2015DOI: 10.1177/0003122415574328http://asr.sagepub.com
After many decades of sustained focus on the origins of social movements, scholars have recently begun serious investigation into their consequences. We advance this growing body of scholarship by examining the outcome of protest campaigns to desegregate public accommodations during the civil rights move-ment. Segregation at lunch counters, restau-rants, movie theaters, hotels, and other public accommodations defined the Jim Crow South. As the first region-wide attack on Jim Crow, the sit-ins have been a central and influential case in movement studies. However, most prior scholarship focuses on the origins and diffusion of this protest (Andrews and Biggs 2006; Biggs 2006; Killian 1984; McAdam
1983; Morris 1981; Oberschall 1989; Polletta 1998). Why did some cities desegregate their lunch counters while others resisted change? Most importantly, to what extent did the pro-test campaigns contribute to desegregation?
We argue that protest is likely to generate change by threatening established actors and by enlisting the support of bystanders. This view
574328 ASRXXX10.1177/0003122415574328American Sociological ReviewBiggs and Andrews2015
aUniversity of OxfordbUniversity of North Carolina
Corresponding Author:Michael Biggs, Department of Sociology, University of Oxford, Manor Road Building, Oxford, OX1 3UQ, United Kingdom E-mail: [email protected]
Protest Campaigns and Movement Success: Desegregating the U.S. South in the Early 1960s
Michael Biggsa and Kenneth T. Andrewsb
AbstractCan protest bring about social change? Although scholarship on the consequences of social movements has grown dramatically, our understanding of protest influence is limited; several recent studies have failed to detect any positive effect. We investigate sit-in protest by black college students in the U.S. South in 1960, which targeted segregated lunch counters. An original dataset of 334 cities enables us to assess the effect of protest while considering the factors that generate protest itself—including local movement infrastructure, supportive political environments, and favorable economic conditions. We find that sit-in protest greatly increased the probability of desegregation, as did protest in nearby cities. Over time, desegregation in one city raised the probability of desegregation nearby. In addition, desegregation tended to occur where opposition was weak, political conditions were favorable, and the movement’s constituency had economic leverage.
Keywordssocial movements, protest, desegregation, civil rights, race and ethnic relations
2 American Sociological Review
accords with a long tradition of social move-ment theory that conceptualizes protest as “pol-itics by other means” (Piven and Cloward 1977; Schwartz 1976; Tilly 1978; Wilson 1961) as well as more recent theoretical accounts of protest influence (Andrews 2001; King and Pearce 2010; Luders 2006). Given how central this insight is to social movement theory, research supporting the claim is surprisingly sparse. Skeptics contend that protest is unlikely to matter because the costs to targets are trivial relative to other factors (e.g., Burstein and Sausner 2005; Giugni 2007).
We assess the influence of protest while considering the factors that generate protest itself. Specifically, we examine whether local movement infrastructure, supportive political environments, and favorable economic condi-tions account for the apparent influence of protest. Unlike most prior studies, we con-sider whether protest in neighboring cities influences the likelihood of success, and whether success itself diffuses as elites adapt to new norms and preempt further protest. We show that protest was a powerful source of change, and we identify organizational, polit-ical, and economic factors that increased the probability of desegregation.
JIM CROW, BLACK PROTEST, AND DESEGREGATIONJim Crow segregation emerged in the late-nineteenth and early-twentieth centuries as a durable and powerful institution for subordi-nating black southerners. Litwack (1998:233) argues that Jim Crow is distinguished by its “thoroughness” that circumscribed “every conceivable situation in which whites and blacks might come into social contact: from public transportation to public parks, from the workplace to hospitals, asylums, and orphan-ages, from the homes for the aged, the blind, deaf, and dumb, to the prisons, from saloons to churches.” Southern states and cities enacted Jim Crow laws, but segregation extended well beyond legal mandates and was sustained through daily routines in all spheres of life.
Jim Crow segregation solved a distinc-tively urban problem where “contacts between the races were inevitably more casual, because people jostled together much more haphaz-ardly, the rules governing those contacts were defined all the more thoroughly” (Cell 1982:133). As such, segregation emerged in its earliest and most elaborate forms in newly industrializing cities like Birmingham, Char-lotte, and Atlanta (Cell 1982; Rabinowitz 1978; Woodward 1974). In this way, segrega-tion differed from other major institutional mechanisms for maintaining racial inequality. For example, electoral disfranchisement was secured through violence, fraud, and new bar-riers to voting such as poll taxes and literacy tests in areas with large black populations (Kousser 1974). Sharecropping (or the crop lien system) emerged as the dominant way of organizing agricultural labor in the rural South. By contrast, “urban progressive reformers” promoted segregation as a way to guarantee orderly, harmonious, and hierarchi-cal relations between blacks and whites in cities (Tuck 2011:94).
As a system of oppression, segregation subjected all black southerners to “the daili-ness of . . . terror” (Chafe, Gavins, and Korstad 2003:xxx). As John Williams wrote, “Nothing is quite as humiliating . . . so mur-derously angering as to know that because you are black you may have to walk a half mile farther than whites just to urinate; that because you are black you have to receive your food through a window in the back of a restaurant or sit in a garbage-littered yard to eat” (Sitkoff 2008:88). Certainly, some black southerners came into greater contact with whites than others, but the pervasive-ness of Jim Crow guaranteed that all people were affected regardless of age or social class.
Travel for work, shopping, or recreation increased the risks of humiliation and ritual deference—if not violence. Blacks used com-plex strategies to negotiate and sometimes resist segregation (Chafe et al. 2003; Litwack 1998). For example, parents were torn between shielding their children from Jim
Biggs and Andrews 3
Crow or tutoring them in the forms of social deference required to minimize conflict with whites. Ralph Thompson recalled growing up in Memphis during the 1930s and 1940s where his “mother would always tell us to drink water before we left home. So we didn’t get caught into drinking water out” (Chafe et al. 2003:5). Roy Wilkins, executive secre-tary of the National Association for the Advancement of Colored People (NAACP), framed the dilemma starkly when testifying before Congress:
How far do you drive each day? Where, and under what conditions can you and your family eat? Where can they use a rest room? Can you stop driving after a reasonable day behind the wheel or must you drive until you reach a city where relatives or friends will accommodate you and yours for the night? (Sitkoff 2008:76).
John Lewis—who later played a leading role in the Nashville sit-ins—recalled family trips organized by the “distances between service stations where it would be safe for us to stop” (Lewis and D’Orso 1998:50). For many dec-ades, Jim Crow segregation persisted despite everyday resistance and sporadic challenges dating back at least to turn-of-the-century protest of segregation in street cars (Meier and Rudwick 1975).
Given how deeply rooted segregation was in the South, the collapse of Jim Crow consti-tutes a surprising and important social trans-formation. Scholars have documented the gains and setbacks in electoral politics, school desegregation, and social policies (Andrews 2004; Button 1989; Santoro 2002), but there has been much less attention to the desegre-gation of public accommodations. This is surprising because the challenges to segrega-tion became the center of mass participation in the movement in the 1950s and early 1960s (Wright 2013). Consider the iconic events and campaigns of the southern movement, such as the Montgomery bus boycott (1955 to 1956), the sit-ins (1960), the Freedom Rides (1961), the Albany campaign (1962), and the
Birmingham campaign (1963). These events were all coordinated assaults on segregation in public accommodations.
Sit-ins and the Challenge to Segregation in Public Accommodations
Characterized as a “movement of move-ments,” the civil rights struggle encompassed numerous campaigns, organizations, and lead-ers pursuing a wide range of goals and targets (Isaac 2008). Challenging segregation was a central objective of local movements across the South. Reports in the New York Times show the centrality of desegregation in the early 1960s.1 The desegregation of neighbor-hoods, schools, and public or commercial facilities was the primary claim at 71 percent of protest events in 1960 and 78 percent in 1961.2 Although scholars have focused on the relationship between movements and political authorities, businesses were a target of collec-tive action for roughly half of the civil rights events occurring in the South in 1960 and 1961. By contrast, school desegregation relied on litigation, and electoral barriers were chal-lenged using community organizing and voter registration campaigns (Andrews 2004).
The sit-in tactic propelled local challenges to segregation. Developed in the 1940s and 1950s by activists from the Congress of Racial Equality (CORE) and NAACP, the tactic was deployed primarily in border states and in the North until 1960 (Meier and Rud-wick 1975). Sit-ins involved the physical occupation of segregated public spaces, thereby challenging and disrupting the nor-mal operation of business. Lunch counters were the most famous sites of protest, but the tactic was employed against many other tar-gets, including restaurants, libraries, public beaches, churches, and bus stations.
The initiating event for the 1960 protest wave occurred when four students in Greens-boro, North Carolina, began their protest on February 1 (Chafe 1980; Wolff 1970). Protest then spread to nearby cities with large num-bers of black college students. By mid-April,
4 American Sociological Review
sit-in campaigns had been launched in more than 60 cities in every southern state except Mississippi. Thousands of college students with little or no prior activist experience joined the sit-ins or related picket lines, dem-onstrations, and marches (Biggs 2006). Many more black southerners participated by attending mass meetings, contributing to pro-test organizations, or supporting economic boycotts. Sit-in protest launched local cam-paigns that unfolded over many months and led to broad mobilization and protracted negotiations with white leaders.
The sit-ins that swept through the South in the spring of 1960 constituted a major accel-eration of the civil rights struggle and a key turning point. Earlier protest campaigns were typically isolated to one or a small number of cities, and most occurred outside the core southern states (Morris 1981). This changed quickly as college students throughout the South became involved in disruptive protest. The 1960 sit-ins are thus credited with revi-talizing the southern civil rights struggle and politicizing college students. Moreover, the sit-ins led to the formation of the Student Nonviolent Coordinating Committee (SNCC), which played a critical role in shaping the civil rights movement (Carson 1981). Ella Baker (1960:4), a lifelong activist who encouraged students to form their own organ-ization, articulated the broader significance of the sit-ins as “bigger than a hamburger” and as “seeking to rid America of the scourge of racial segregation and discrimination.”
Dynamics of Desegregation
Segregation in lunch counters and other pub-lic accommodations rested on “custom and tradition” rather than ordinances and laws (Pollitt 1960:316). National chain stores defended segregation as adherence to local customs and part of being a “good neighbor.” Protesters attempted to bring moral and eco-nomic pressure on local establishments. The initial responses of white business and politi-cal leaders suggest that many expected pro-test would “fizzle” (Thornton 2002:305). However, in May 1960, one white store
manager expressed the emerging view that “the end doesn’t show the slightest inkling of being in sight” (Wright 2013:83).
The Nashville sit-in campaign achieved the earliest victory, desegregating lunch counters on May 11. It was followed by Winston-Salem on May 25 and Greensboro on July 25 (Oppen-heimer 1963; Wolff 1970). However, successes were uneven. Some major cities, such as Mem-phis and Atlanta, resisted desegregation despite ongoing protest and sporadic negotiation between white and black community leaders (Jones and Long 1965; Oppenheimer 1963). Lunch counters in other cities desegregated even without local protest. The Justice Depart-ment tracked desegregation of theaters, restau-rants, hotels, and lunch counters in 560 cities through the early 1960s and found substantial increases in cities with at least one desegre-gated facility (Oberschall 1973).
Historical accounts of desegregation indi-cate that protracted negotiations preceded suc-cess (Jacoway and Colburn 1982; Jones and Long 1965; Oppenheimer 1966). Protest pre-sented a collective action problem for local businesses. Typically, protesters targeted all of the downtown lunch counters in chains and local establishments. In Atlanta and Jackson-ville, for example, demonstrators were simul-taneously dispatched to lunch counters at multiple establishments (Bartley 2000; Garrow 1989). Protest placed pressure on the business community as a whole. Although this pressure was felt most directly by the national chains because of their visibility, business managers were reluctant to act in isolation. In Austin, for example, managers of Woolworths and Kress would not desegregate unless locally owned stores joined them, so they could not be sin-gled out as “Yankee Merchants” (Breihan 1960). The coordination of multiple businesses was usually secured by a formal committee that negotiated a desegregation plan. In Nash-ville, for example, six stores desegregated their lunch counters simultaneously on a trial basis and without prior media coverage (Wynn 1991). Similarly, nine establishments in Dur-ham complied with desegregation following significant pressure from local economic and political leaders (Greene 2005).
Biggs and Andrews 5
Given the strategic dilemma faced by local businesses, it is not surprising that civic and political leaders played an important role. Although desegregation campaigns targeted economic actors and negotiation typically included business leaders (Jones and Long 1965), mayors and city council members played prominent roles in seeking resolutions to local conflicts. In many cities, political leaders called for a “cooling off ” period and established committees to investigate possi-ble solutions (Barksdale 1986; Chafe 1980). In Albany, the city commission blocked local businesses’ attempts to concede to movement demands (Flanders 1988). Political leaders facilitated desegregation in some cities, but thwarted it in others.
Established leaders of the NAACP and civic and ministerial associations were central to this negotiation process. By contrast, stu-dents and militant adult leaders were not directly involved in most cities (Chafe 1980). The established leaders could play an impor-tant role when they had prior lines of com-munication with white business, political, and civic leaders.
In summary, the 1960 sit-ins initiated ongoing conflicts in cities throughout the South. The sit-ins challenged segregation in public accommodations—an institution that imposed severe constraints on the daily behavior of black southerners. Activists organized broader campaigns around the sit-ins that entailed mass meetings, picket lines, boycotts, and related movement activity. Pro-test spurred activity among supporters, oppo-nents, and bystanders in the white community. The impact of this protest on successful desegregation is less certain. Next, we exam-ine the broader debates regarding the impact of protest.
DOES PROTEST MATTER?The question of whether and, if so, how movements matter has become a central area of scholarship. Beginning in the 1970s, schol-ars debated the relative importance of disrup-tion and formal organization and whether the
apparent influence of movements was spuri-ous (Gamson 1990; Giugni 1998; Goldstone 1980; Piven and Cloward 1977). In the inter-vening years, movement scholars have devel-oped a much broader literature to gauge movement consequences. Amenta and col-leagues (2010) provide one key indicator of this growth by identifying 38 articles on the political consequences of movements pub-lished in five leading sociology journals between 2003 and 2009.
Some scholars hold that protest can secure gains by imposing costs on targets. In the case of the sit-ins, much like strikes, the primary logic is clear. By disrupting normal opera-tions, protesters may damage a target’s eco-nomic viability. This can occur by preventing a business from producing or selling goods or services, or by dissuading customers from buying. Recently, Luders (2006, 2010) has developed an economic opportunity argument in which success depends on the vulnerability of targets to the costs movements impose. Applying this perspective to local civil rights campaigns, Luders argues that desegregation can be explained by considering the combina-tion of “concession” and “disruption” costs faced by business actors in a community. Movements must alter economic actors’ cal-culations by making the costs of disruption outweigh the costs of concessions—as when whites refuse to patronize a store that deseg-regates. Protest may also influence targets by undermining the reputation of a particular company, a local business sector, or a larger industry (King and Pearce 2010).
Skeptics argue that protest is largely incon-sequential. Burstein and Sausner (2005:413) note that collective action, including protest, is rare and therefore “has no impact on policy because there is so little of it.” Instead, they argue that political parties and public opinion exert much greater influence on policy. In his study of ecology, anti-nuclear, and peace pro-tests, Giugni (2007:54) takes a different route to the same conclusion, arguing that because movements are “minority actors that have lit-tle power . . . [t]he source of policy change would lie elsewhere.” In short, this view
6 American Sociological Review
holds that protest is unlikely to impose mean-ingful costs on targets. Even worse, Amenta (2014:17) argues that “mass disruption is frequently counterproductive to winning pol-icy concessions.”
Where does research stand on the question of protest influence? With the growth of event databases, many scholars have tackled the question of movement influence by aggregat-ing protest within a country or state to esti-mate outcomes, such as adopting legislation, in the subsequent year (Agnone 2007; Burstein and Freudenburg 1978; Giugni 2007; Olzak and Ryo 2007; Santoro 2002). Among the studies in this tradition, most indicate that protest has no direct effect. Studying the link between environmental protest and policy-making, Olzak and Soule (2009:219) argue that “institutional tactics rather than disruptive ones . . . assist movements in gaining an audi-ence in Congress.” McAdam and Su (2002) find that large and disruptive anti-war demon-strations encouraged congressional attention but had a negative impact on pro-peace voting on the Vietnam War. Santoro (2002, 2008), however, finds that black protest spurred the adoption of more comprehensive fair employ-ment and voting rights policies.
The vast majority of scholarship on move-ment consequences examines policy change at the state level, but scholars have begun to assess the impact of protest on firms and other targets. King and Soule (2007) find that protest demonstrations reduce stock price returns over a window of weeks (see also Bartley and Child 2011). Similarly, Vasi and King (2012) show that environmental activ-ism can jeopardize stakeholders’ perceptions of a firm and indirectly influence a firm’s broader financial performance. Such research shows that protest can inflict costs, but this work does not identify whether these costs are sufficient to induce firms to make real concessions. In one of the few studies of the ultimate consequences of disruptive action, Jacobson and Royer (2011) find that violence at abortion clinics reduces abortion rates in the area surrounding the clinic, although this effect is short-lived and displaced by increased abortion rates in nearby areas.
We avoid a limitation in many studies of protest influence by disaggregating data to the local level and tracing its impact over time. The more conventional practice of aggregat-ing protest may obscure our ability to discern the influence of protest. For example, protest in a legislator’s district may influence her vot-ing patterns but be irrelevant to the behavior of the broader legislative body. Studies of strike influence are a prime example of the strategy we adopt, because the immediate out-come can be assessed and it is clear whether workers gained concessions (e.g., Biggs 2002; Currie and Ferrie 2000; Geraghty and Wise-man 2008). Our study is an important advance in this tradition of disaggregating protest because we assess direct and indirect links from protest to target response. In addition, most recent research focuses on characteris-tics of movement organizations (e.g., organi-zational density, membership, and funds) rather than protest (Amenta, Caren, and Olasky 2005; Burstein and Linton 2002; Uba 2009). Two-thirds of the studies reviewed by Amenta and colleagues (2010) focus on organizational determinants of movement influence without considering protest activity. And, most of the studies that examine protest influence fail to include measures of move-ment organizations (for exceptions, see Isaac, McDonald, and Lukasik 2006; Olzak and Soule 2009). Thus, our understanding of pro-test influence is uncertain.
Taken together, past scholarship indicates that protest rarely has direct effects on targets. We contribute to this core area of research by providing a rigorous test of the influence of protest while accounting for alternative expla-nations.3 Although many scholars argue that protest matters when activists impose eco-nomic and reputational costs on targets, there is little evidence supporting this claim. Skep-tics contend that protest influence must be gauged alongside the other factors that encourage protest or desegregation indepen-dently. Here, we focus on movement infra-structure, political opportunity, and economic opportunity perspectives as the most central, plausible, and well-developed theoretical accounts of movement success.
Biggs and Andrews 7
TOWARD A SYNTHETIC MODEL OF PROTEST INFLUENCEWe argue that protest is likely to generate change through disruption by threatening established actors and by enlisting the support of bystanders. Alongside this core argument, we advance five interrelated claims about the conditions that favor movement success. Broadly, scholars have emphasized organiza-tional, political, and economic factors that shape the outcomes of social movements. Building on and extending these approaches, we argue that desegregation would be most likely where formal movement organizations were stronger, political conditions were favor-able, movement opposition was weaker, and the economic power of a movement’s con-stituency was greater. In addition, we also argue that protest influence could spread beyond the direct targets, as nearby busi-nesses adopted a movement’s preferred changes to preempt further protest and con-form to new norms. We explain the theoreti-cal foundations for these expectations.
First, building on the insights of move-ment infrastructure arguments, we expect pre-existing movement organizations to have a positive impact on success. Proponents of movement infrastructure highlight the impor-tance of leadership, organizational strength, and tactical diversity to the accomplishment of movement goals (Andrews 2004; Gamson 1990; Ganz 2000; Morris 1993; Olzak and Ryo 2007). In this line of thinking, disruptive protest generates pressure, but formal organi-zations and leaders must negotiate with authorities to secure movement gains. In the context of broader campaigns, organizational diversity allows for specialization, where some organizations play a primary role in protest while others are more central to nego-tiation and bargaining (Lind and Stepan-Norris 2011; Staggenborg and Lecomte 2009).
Second, scholars have identified factors beyond the movement that influence the like-lihood of success. Political opportunity theo-rists argue that the conditions that facilitate
movement emergence may account for their apparent influence (Kitschelt 1986). More specifically, this tradition holds that elite allies, political access, and weak or minimal opposition is necessary for movement success (McAdam 1982; Tarrow 1998). Amenta and colleagues (2005) argue that movement influ-ence is indirect and requires the intervention or assistance of state actors. Movements will succeed when they find champions or alter the calculations of political authorities. Given that desegregation followed from prior coor-dination among a city’s political, economic, and civic leaders, we expect that city-level measures of economic and political character-istics will help explain why desegregation was achieved in some cities and not others.
Third, strong counter-movements may reduce the likelihood of successful outcomes. Counter-movements may attempt to suppress movement protest or alter the calculations of economic targets (Andrews 2002; Meyer and Staggenborg 1996). For example, Luders (2010) argues that militant segregationists reduced the likelihood of desegregation because economic targets feared retaliatory boycotts by white customers. In her analysis of same-sex marriage bans, Soule (2004b) finds that conservative supporters of bans tended to prevail over gay and lesbian move-ment organizations in influencing legislative outcomes. Historical accounts of desegrega-tion indicate that political institutions and actors shaped the response to protest. Police could arrest demonstrators, counter-demonstrators, or neither. There was significant variation in the political power and organization of white moderates and militant segregationists (Black 1976; Thornton 1991).
Fourth, successful outcomes are more likely where economic targets are more vul-nerable to protest or where a movement’s constituency has greater economic power. We build on recent scholarship investigating the relationship between social movements and economic outcomes (Haveman, Rao, and Paruchuri 2007; King and Pearce 2010; King and Soule 2007; Schneiberg, King, and Smith 2008). The key insight emerging from this
8 American Sociological Review
scholarship is that the responsiveness of eco-nomic targets varies depending on firm and market characteristics, including embedded-ness in inter-firm relations (Schurman and Munro 2009; Weber, Rao, and Thomas 2009). Thus, firms will be unlikely to act in isolation and will be influenced by the behavior of peers in their broader field (Bartley and Child 2011). This line of argument dovetails with a longer tradition of scholarship on strike suc-cess (Griffin, Wallace, and Rubin 1986; Korpi and Shalev 1980; Schwartz 1976).
In terms of economic factors, Luders (2010:9) argues that “sectoral variation in the target vulnerability affects a movement’s overall prospects for success against eco-nomic targets.” Some types of economic actors were much more vulnerable to the disruption costs of protest, such as downtown businesses, sectors that depended on black customers, and affiliates of national compa-nies whose reputations could be harmed out-side the South. Other economic actors were less vulnerable, including agriculture and manufacturing sectors. Accounts of local desegregation lend support to this perspective by focusing on the varying responses of white business leaders to civil rights protest (Eskew 1997; Jacoway and Colburn 1982).
Finally, we consider the spatial diffusion of protest influence. Protest campaigns emerge and spread through diffusion pro-cesses with strong spatial clustering (Soule 2004a). Protest in one city may influence outcomes in that city and have indirect influ-ence elsewhere. In a study of French coal miners, Cohn (1993) finds that failed strikes, under some circumstances, increased average wages in the same département. More recently, scholars have assessed the spatial structure of protest more systematically. For example, Ingram, Yue, and Rao (2010) exam-ine the siting of Wal-Mart stores between 1998 and 2005. They find that Wal-Mart was less likely to open a proposed store when protesters had successfully blocked a store opening in a nearby city. They also find that proposed stores in isolated areas were more likely to open despite protest, because there
was little threat that protest would spread (see also Steil and Vasi 2014; Vasi and Strang 2009).
Elites and authorities learn from and are inspired by one another, just like protesters. Businesses may be reluctant to change if neighboring cities have not. This might help explain why lunch counters were desegre-gated in some cities—such as Orlando and Fredericksburg—with minimal protest and weak movement organizations, where protest occurred in neighboring cities. Conversely, lunch counters were not desegregated in other cities—such as Little Rock and Tallahassee—with strong organizations and considerable protest, which were geographically isolated from other hubs of movement activity. Thus, we consider whether protest increased the likelihood of desegregation and whether pro-test or success occurring nearby increased desegregation.
DATAWe examine the impact of protest on the desegregation of lunch counters in 1960 and 1961, controlling for factors—movement organizations, political opportunities, and economic characteristics—that could influ-ence both protest and desegregation. Using archival sources and the 1960 Census, we investigate 334 cities in the 11 states of the former Confederacy, along with Maryland, Kentucky, and West Virginia.4 The unit of observation is an urban place having at least 10,000 people and 1,000 non-whites; only a handful of smaller places had sit-ins.5 Data are deposited with the Inter-university Con-sortium of Political and Social Research.
Outcome
The outcome is the desegregation of lunch counters. Lunch counters were pervasive throughout the South at department and dime stores.6 These stores blatantly discriminated against black customers by inviting them to shop while prohibiting them from sitting down to eat. At the same time, because the
Biggs and Andrews 9
stores depended partly on black customers, they were vulnerable to economic pressure. Lunch counters were therefore desegregated before other commercial venues. In May 1963, the Department of Justice counted 204 cities as having desegregated at least one lunch counter. By comparison, hotels or motels had been desegregated in 163 cities, restaurants in 141, and theaters in 109 (Ober-schall 1973).
Desegregation was documented by CORE. Six reports from August 1960 to December 1961 listed “cities where lunch counters of drug, variety, or department stores have opened since February 1, 1960” (CORE 1960–1961). By the end of 1961, the list included 90 of our 334 cities (as well as a few smaller towns). As a check on these data, we use a similar tabulation by the Southern Regional Council (SRC), a leadership organi-zation that promoted interracial cooperation. In September 1961, it listed “cities in which at least one establishment has desegregated its eating facilities” (SRC 1961). This list includes 74 of our cities (as well as smaller towns). SRC and CORE agree on the classifi-cation of 92 percent of our cities. We rely primarily on CORE because it enables us to trace change over time, but SRC is valuable for confirmation.
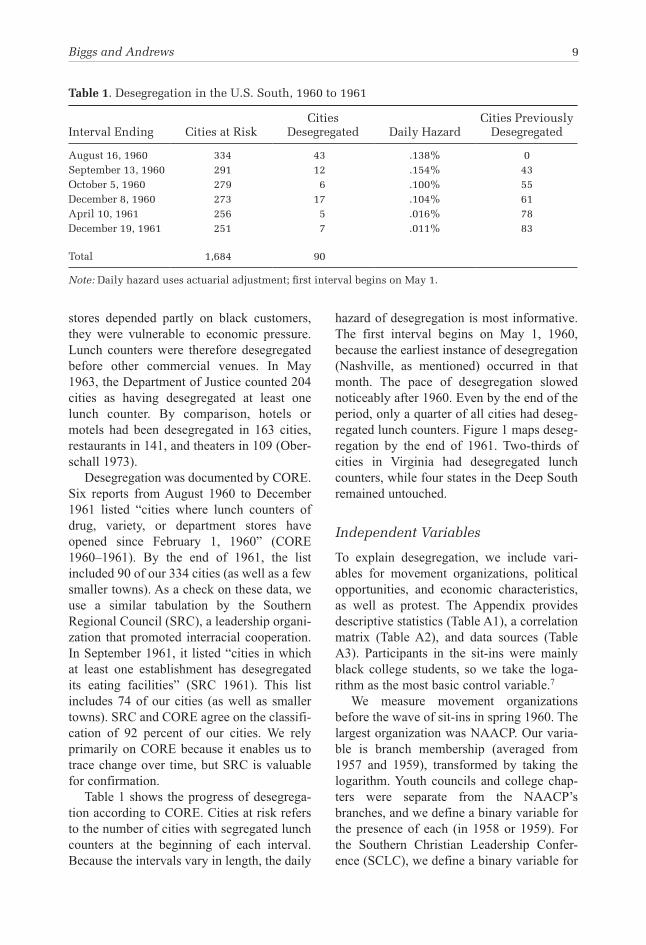
Table 1 shows the progress of desegrega-tion according to CORE. Cities at risk refers to the number of cities with segregated lunch counters at the beginning of each interval. Because the intervals vary in length, the daily
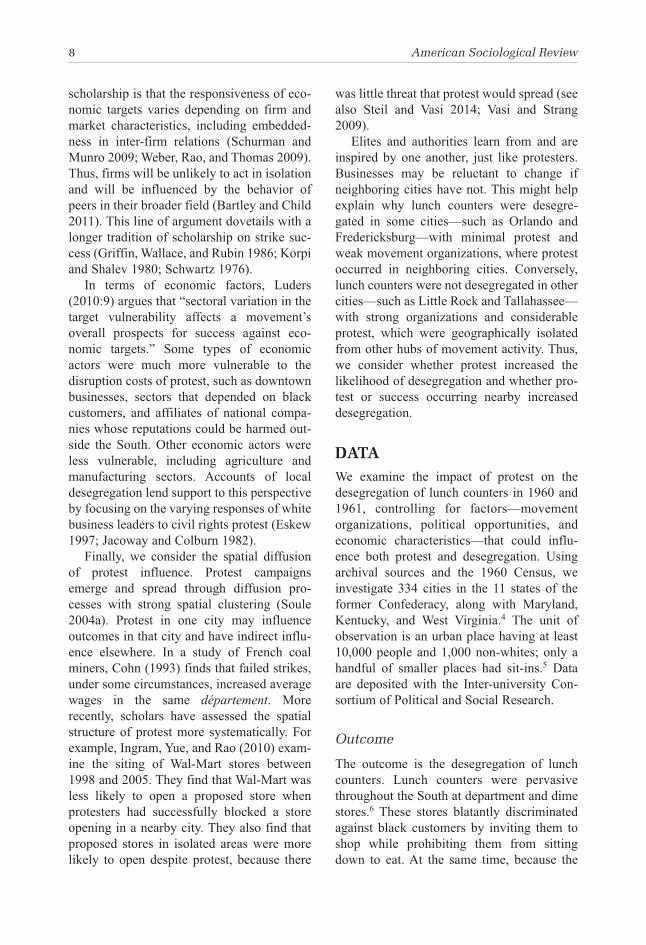
hazard of desegregation is most informative. The first interval begins on May 1, 1960, because the earliest instance of desegregation (Nashville, as mentioned) occurred in that month. The pace of desegregation slowed noticeably after 1960. Even by the end of the period, only a quarter of all cities had deseg-regated lunch counters. Figure 1 maps deseg-regation by the end of 1961. Two-thirds of cities in Virginia had desegregated lunch counters, while four states in the Deep South remained untouched.
Independent Variables
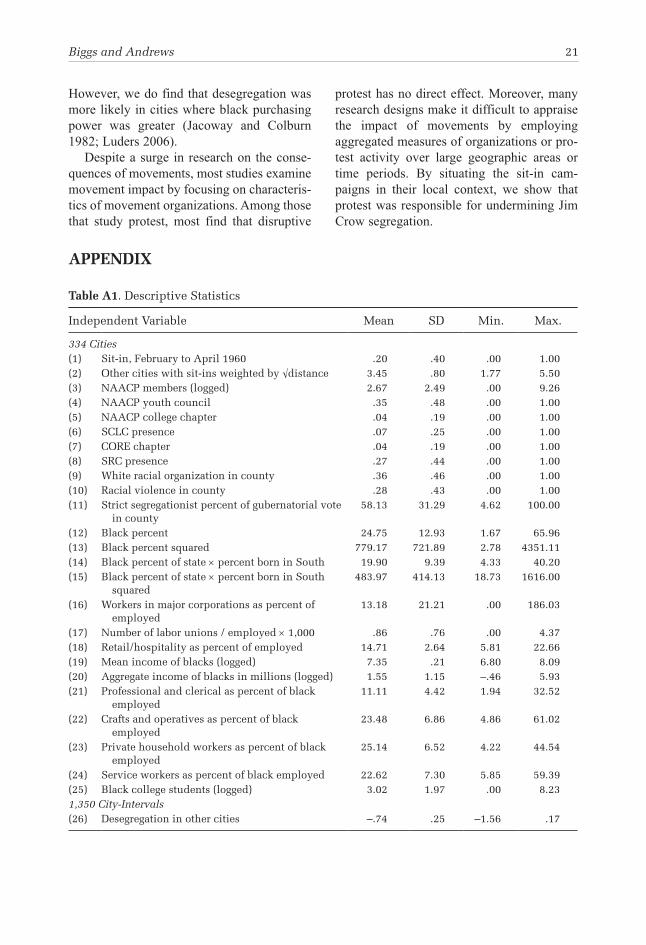
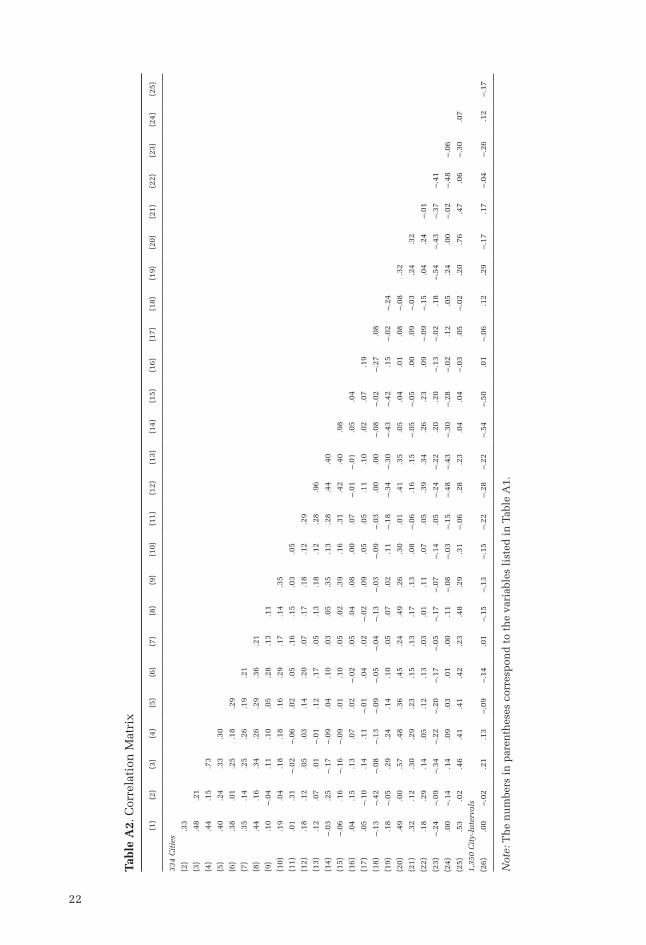
To explain desegregation, we include vari-ables for movement organizations, political opportunities, and economic characteristics, as well as protest. The Appendix provides descriptive statistics (Table A1), a correlation matrix (Table A2), and data sources (Table A3). Participants in the sit-ins were mainly black college students, so we take the loga-rithm as the most basic control variable.7
We measure movement organizations before the wave of sit-ins in spring 1960. The largest organization was NAACP. Our varia-ble is branch membership (averaged from 1957 and 1959), transformed by taking the logarithm. Youth councils and college chap-ters were separate from the NAACP’s branches, and we define a binary variable for the presence of each (in 1958 or 1959). For the Southern Christian Leadership Confer-ence (SCLC), we define a binary variable for
Table 1. Desegregation in the U.S. South, 1960 to 1961
Interval Ending Cities at RiskCities
Desegregated Daily HazardCities Previously
Desegregated
August 16, 1960 334 43 .138% 0September 13, 1960 291 12 .154% 43October 5, 1960 279 6 .100% 55December 8, 1960 273 17 .104% 61April 10, 1961 256 5 .016% 78December 19, 1961 251 7 .011% 83
Total 1,684 90
Note: Daily hazard uses actuarial adjustment; first interval begins on May 1.
10 American Sociological Review
the presence of an affiliated organization or member of the executive board (in February 1960). For CORE, we code the presence of a chapter that had applied to affiliate with the national organization (by the beginning of 1960).
Five variables capture political opportuni-ties at the local level. 8 We code a binary vari-able for the presence of affiliates of the SRC (in 1955), which indicates allies among the white political elite. The remaining variables measure the inverse of political opportunities, and so are expected to reduce the probability of desegregation. The classic proxy for white supremacy is the percentage of blacks in the population. As Key (1949 :5) observed, “the hard core of the political South . . . is made up of these counties and sections of the southern states in which Negroes constitute a substan-tial proportion of the population” (see also Matthews and Prothro 1966 ). We measure this percentage at the city level. Three further variables are available only at the county level; our 334 cities belong to 282 distinct counties. We measure public support for seg-regation by the percentage of the county’s electorate voting for strict segregationist can-didates for governor in the most recent elec-tion. A binary variable is coded for the presence of white racial organizations, like the White Citizens’ Councils ( Matthews and Prothro 1966 ). We also code a binary variable
for the occurrence of any racial violence between 1955 and 1959, as reported by the American Friends Service Committee (1959) . These three county-level variables—segrega-tionist vote, white racial organization, and racial violence—are not available for the three border states (containing 9 percent of cities), so we substitute the mean.
Beyond the locality, political opportunities also varied at the state level. Andrews and Biggs (2006) find that sit-ins were far less likely in the Deep South—Alabama, Georgia, Louisiana, Mississippi, and South Carolina—even after controlling for city characteristics. Instead of this geographic dichotomy, we construct a more informative proxy variable. Following Key’s (1949) observation, we start with the percentage of blacks in a state. We multiply this percentage by the percentage of the population born in the South, thus adjust-ing for the substantial in-migration of non-southerners to Florida and Maryland ( Black and Black 1987 ). The product (rescaled 0 to 100) ranges from West Virginia (4) to Missis-sippi (40); it is strongly associated with the dichotomy between Deep and Upper South (eta 2 = .71). One alternative would be to measure public opinion among whites at the state level, but survey questions were answered by too few respondents to construct a reliable indicator. 9 Another option would be to measure the rate of lynching from 1889 to
Figure 1. Sit-ins and Desegregation in the U.S. South, December 1961
Biggs and Andrews 11
1918 (Durso and Jacobs 2013), but its asso-ciation with the geographic dichotomy is even weaker (eta2 = .13).
We measure a city’s economic characteris-tics by three variables. Two are proxies for economic opportunity, meaning vulnerability to protest. Measuring economic opportunity at the city level is appropriate here, because protesters targeted downtown business dis-tricts and businesses coordinated their response.10 We measure integration into the national economy by the percentage of the city’s workers employed in manufacturing plants of the 1,000 largest industrial corpora-tions. Dependence on the retail sector is measured by the percentage of workers employed in eating, drinking, and other retail establishments. Both variables are expected to increase the probability of desegregation. The strength of organized labor is measured by the number of local labor unions (divided by workers), although without clear theoreti-cal expectation. Given the racist practices of many unions, this could conceivably hinder desegregation (James 1988; Wright 2013).
We capture the economic characteristics of the city’s black community with two key vari-ables. One is (logged) aggregate annual income, measuring total purchasing power. (This is very highly correlated with [logged] black population, which is therefore omitted from the model.) The other variable is mean annual income, which provides a measure of economic prosperity. Both variables are expected to increase the probability of deseg-regation. (One might consider entering aggre-gate black income as a proportion of total income, but this is very highly correlated with percentage black.) Aside from income, differ-ent positions in the labor force offered more or less independence from white control. Four variables capture the percentage of blacks employed in the major occupational groups: professional and clerical (13 percent overall), crafts and operatives (26 percent), private household (21 percent), and other service workers (23 percent); the reference category is laborers (17 percent). Private household workers—including servants working for
white families—are expected to have the least autonomy, and so this percentage is expected to reduce the probability of desegregation.
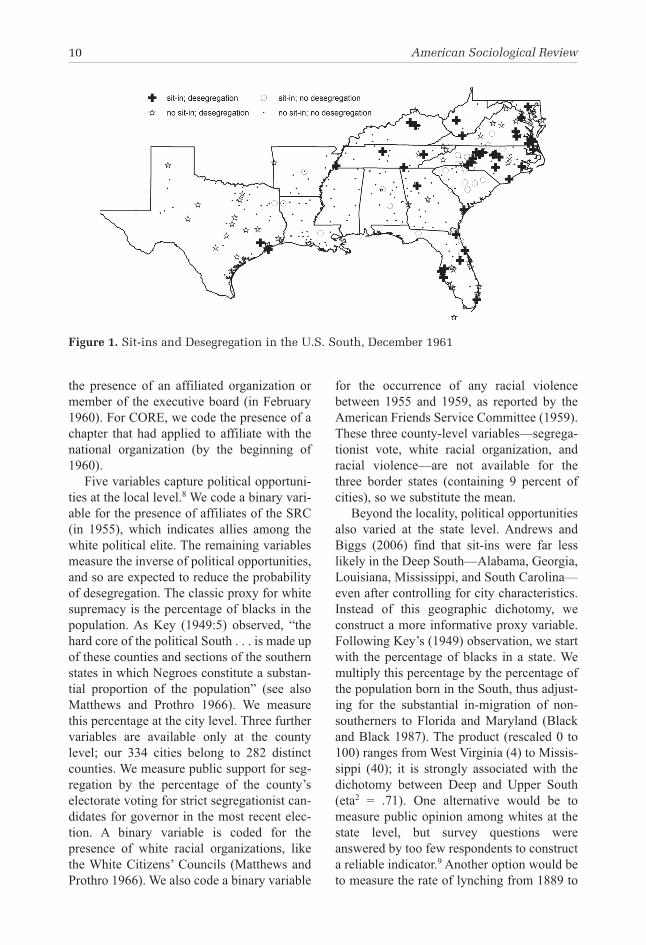
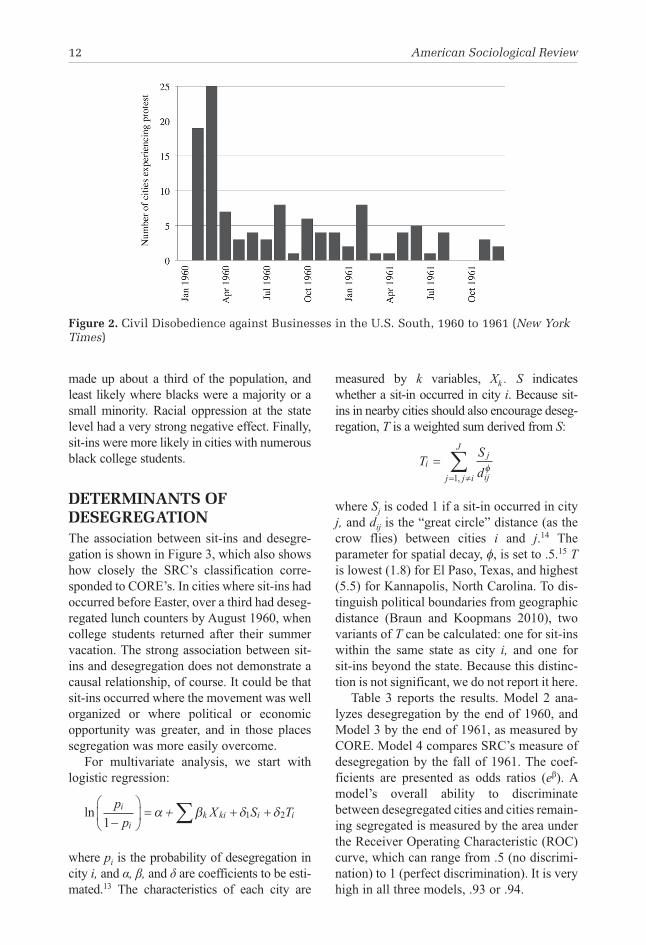
To investigate the effect of protest on desegregation, we measure whether a sit-in—the physical occupation of space from which blacks were excluded—occurred between February 1 and April 14, 1960. The period begins with the first sit-in at Greensboro; it ends on the day before the Easter conference of student activists at Shaw University, which eventually led to the founding of SNCC. Sit-ins were usually accompanied by other forms of protest such as picketing, boycotts, and demonstrations. The period ends before any southern city desegregated its lunch counters, ensuring a clear separation between the meas-ures of protest and outcome. In these 10 weeks, sit-ins took place in 66 out of the 334 cities. Sit-ins continued after Easter, of course, but at a much lower rate. The trajec-tory can be traced in the New York Times, focusing on protest for the rights of African Americans, targeted against businesses, tak-ing the form of civil disobedience, and occur-ring in the South. Figure 2 shows the number of cities in each month experiencing such protest.11 The peak in February and March 1960 is salient. The New York Times reported only a subset of the sit-in campaigns, missing 32 of the 66 cities with sit-ins before Easter. We thus prefer the geographically compre-hensive, albeit chronologically truncated, measure of protest.
As a preliminary step, we examine the determinants of sit-ins, replicating Andrews and Biggs (2006:764, Model 2) with additional economic and political variables.12 This will allow readers to compare the factors that shaped protest with the factors that shaped desegrega-tion. Model 1 in Table 2 reports the results for cross-sectional variables. Sit-ins were more likely to occur where there was an NAACP col-lege chapter or a CORE chapter. Membership of regular NAACP branches had no effect. Two aspects of political opportunities mattered at the local level. Sit-ins were more likely where fewer voters supported strict segregation. And sit-ins were most likely in cities where blacks
12 American Sociological Review
made up about a third of the population, and least likely where blacks were a majority or a small minority. Racial oppression at the state level had a very strong negative effect. Finally, sit-ins were more likely in cities with numerous black college students.
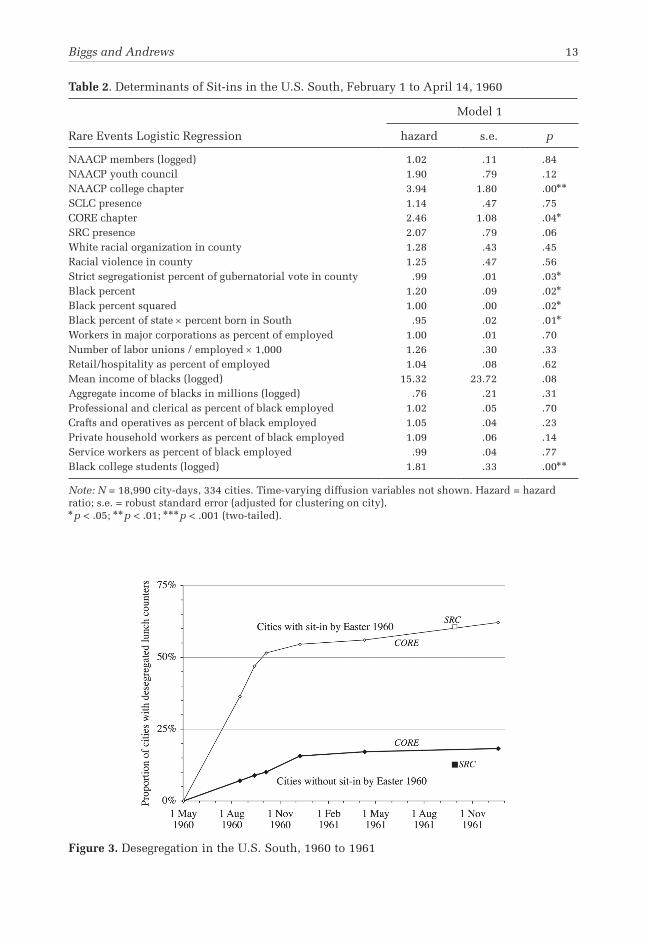
DETERMINANTS OF DESEGREGATIONThe association between sit-ins and desegre-gation is shown in Figure 3, which also shows how closely the SRC’s classification corre-sponded to CORE’s. In cities where sit-ins had occurred before Easter, over a third had deseg-regated lunch counters by August 1960, when college students returned after their summer vacation. The strong association between sit-ins and desegregation does not demonstrate a causal relationship, of course. It could be that sit-ins occurred where the movement was well organized or where political or economic opportunity was greater, and in those places segregation was more easily overcome.
For multivariate analysis, we start with logistic regression:
lnpp
X S Ti
ik ki i i
11 2
−⎛
⎝⎜
⎞
⎠⎟ = + +∑α + β δ δ
where pi is the probability of desegregation in city i, and α, β, and δ are coefficients to be esti-mated.13 The characteristics of each city are
measured by k variables, Xk . S indicates whether a sit-in occurred in city i. Because sit-ins in nearby cities should also encourage deseg-regation, T is a weighted sum derived from S:
TS
di
j
ijj j i
J
== ≠∑ φ1,
where Sj is coded 1 if a sit-in occurred in city j, and dij is the “great circle” distance (as the crow flies) between cities i and j.14 The parameter for spatial decay, I, is set to .5.15 T is lowest (1.8) for El Paso, Texas, and highest (5.5) for Kannapolis, North Carolina. To dis-tinguish political boundaries from geographic distance (Braun and Koopmans 2010), two variants of T can be calculated: one for sit-ins within the same state as city i, and one for sit-ins beyond the state. Because this distinc-tion is not significant, we do not report it here.
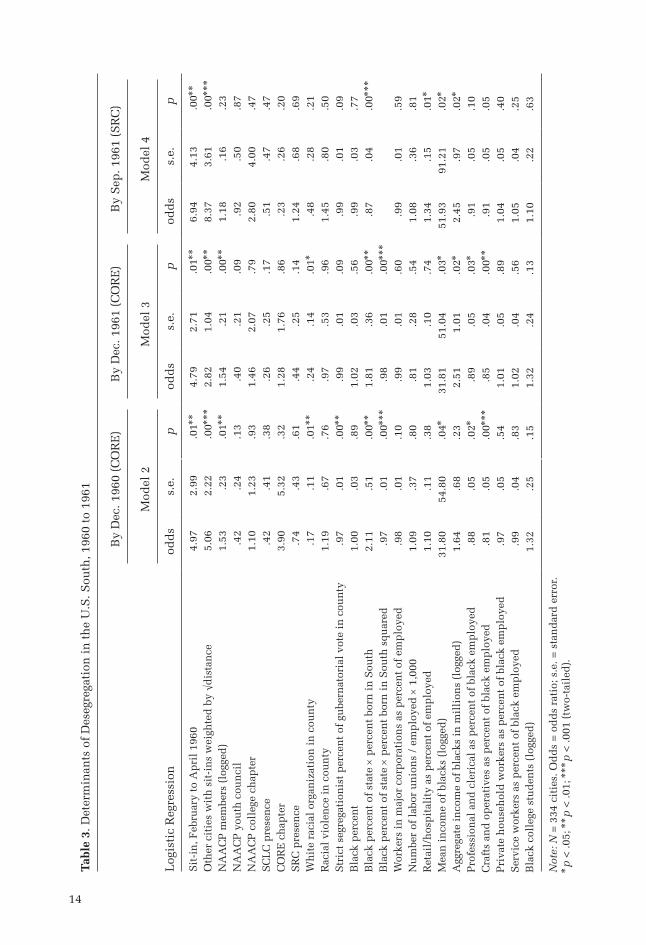
Table 3 reports the results. Model 2 ana-lyzes desegregation by the end of 1960, and Model 3 by the end of 1961, as measured by CORE. Model 4 compares SRC’s measure of desegregation by the fall of 1961. The coef-ficients are presented as odds ratios (eβ). A model’s overall ability to discriminate between desegregated cities and cities remain-ing segregated is measured by the area under the Receiver Operating Characteristic (ROC) curve, which can range from .5 (no discrimi-nation) to 1 (perfect discrimination). It is very high in all three models, .93 or .94.
Figure 2. Civil Disobedience against Businesses in the U.S. South, 1960 to 1961 (New York Times)
Biggs and Andrews 13
Table 2. Determinants of Sit-ins in the U.S. South, February 1 to April 14, 1960
Model 1
Rare Events Logistic Regression hazard s.e. p
NAACP members (logged) 1.02 .11 .84NAACP youth council 1.90 .79 .12NAACP college chapter 3.94 1.80 .00
SCLC presence 1.14 .47 .75CORE chapter 2.46 1.08 .04
SRC presence 2.07 .79 .06White racial organization in county 1.28 .43 .45Racial violence in county 1.25 .47 .56Strict segregationist percent of gubernatorial vote in county .99 .01 .03
Black percent 1.20 .09 .02
Black percent squared 1.00 .00 .02
Black percent of state u percent born in South .95 .02 .01
Workers in major corporations as percent of employed 1.00 .01 .70Number of labor unions / employed u 1,000 1.26 .30 .33Retail/hospitality as percent of employed 1.04 .08 .62Mean income of blacks (logged) 15.32 23.72 .08Aggregate income of blacks in millions (logged) .76 .21 .31Professional and clerical as percent of black employed 1.02 .05 .70Crafts and operatives as percent of black employed 1.05 .04 .23Private household workers as percent of black employed 1.09 .06 .14Service workers as percent of black employed .99 .04 .77Black college students (logged) 1.81 .33 .00
Note: N = 18,990 city-days, 334 cities. Time-varying diffusion variables not shown. Hazard = hazard ratio; s.e. = robust standard error (adjusted for clustering on city). p < .05; p < .01; p < .001 (two-tailed).
Figure 3. Desegregation in the U.S. South, 1960 to 1961
14
Tabl
e 3.
Det
erm
inan
ts o
f Des
egre
gati
on in
the
U.S
. Sou
th, 1
960
to 1
961
Logi
stic
Reg
ress
ion
By
Dec
. 196
0 (C
OR
E)B
y D
ec. 1
961
(CO
RE)
By
Sep.
196
1 (S
RC
)
Mod
el 2
Mod
el 3
Mod
el 4
odds
s.e.
pod
dss.
e.p
odds
s.e.
p
Sit-
in, F
ebru
ary
to A
pril
196
04.
972.
99.0
1
4.79
2.71
.01
6.94
4.13
.00
Oth
er c
itie
s w
ith
sit-
ins
wei
ghte
d by
√di
stan
ce5.
062.
22.0
0
2.82
1.04
.00
8.37
3.61
.00
NA
AC
P m
embe
rs (l
ogge
d)1.
53.2
3.0
1
1.54
.21
.00
1.18
.16
.23
NA
AC
P yo
uth
coun
cil
.42
.24
.13
.40
.21
.09
.92
.50
.87
NA
AC
P co
lleg
e ch
apte
r1.
101.
23.9
31.
462.
07.7
92.
804.
00.4
7SC
LC p
rese
nce
.42
.41
.38
.26
.25
.17
.51
.47
.47
CO
RE
chap
ter
3.90
5.32
.32
1.28
1.76
.86
.23
.26
.20
SRC
pre
senc
e.7
4.4
3.6
1.4
4.2
5.1
41.
24.6
8.6
9W
hite
rac
ial o
rgan
izat
ion
in c
ount
y.1
7.1
1.0
1
.24
.14
.01
.48
.28
.21
Rac
ial v
iole
nce
in c
ount
y1.
19.6
7.7
6.9
7.5
3.9
61.
45.8
0.5
0St
rict
seg
rega
tion
ist p
erce
nt o
f gub
erna
tori
al v
ote
in c
ount
y.9
7.0
1.0
0
.99
.01
.09
.99
.01
.09
Bla
ck p
erce
nt1.
00.0
3.8
91.
02.0
3.5
6.9
9.0
3.7
7B
lack
per
cent
of s
tate
u p
erce
nt b
orn
in S
outh
2.11
.51
.00
1.81
.36
.00
.87
.04
.00
Bla
ck p
erce
nt o
f sta
te u
per
cent
bor
n in
Sou
th s
quar
ed.9
7.0
1.0
0
.98
.01
.00
Wor
kers
in m
ajor
cor
pora
tion
s as
per
cent
of e
mpl
oyed
.98
.01
.10
.99
.01
.60
.99
.01
.59
Num
ber
of la
bor
unio
ns /
em
ploy
ed u
1,0
001.
09.3
7.8
0.8
1.2
8.5
41.
08.3
6.8
1R
etai
l/ho
spit
alit
y as
per
cent
of e
mpl
oyed
1.10
.11
.38
1.03
.10
.74
1.34
.15
.01
Mea
n in
com
e of
bla
cks
(log
ged)
31.8
054
.80
.04
31.8
151
.04
.03
51.9
391
.21
.02
Agg
rega
te in
com
e of
bla
cks
in m
illi
ons
(log
ged)
1.64
.68
.23
2.51
1.01
.02
2.45
.97
.02
Prof
essi
onal
and
cle
rica
l as
perc
ent o
f bla
ck e
mpl
oyed
.88
.05
.02
.89
.05
.03
.91
.05
.10
Cra
fts
and
oper
ativ
es a
s pe
rcen
t of b
lack
em
ploy
ed.8
1.0
5.0
0
.85
.04
.00
.91
.05
.05
Priv
ate
hous
ehol
d w
orke
rs a
s pe
rcen
t of b
lack
em
ploy
ed.9
7.0
5.5
41.
01.0
5.8
91.
04.0
5.4
0Se
rvic
e w
orke
rs a
s pe
rcen
t of b
lack
em
ploy
ed.9
9.0
4.8
31.
02.0
4.5
61.
05.0
4.2
5B
lack
col
lege
stu
dent
s (l
ogge
d)1.
32.2
5.1
51.
32.2
4.1
31.
10.2
2.6
3
Not
e: N
= 3
34 c
itie
s. O
dds
= od
ds r
atio
; s.e
. = s
tand
ard
erro
r. p
< .0
5; p
< .0
1;
p <
.001
(tw
o-ta
iled
).
Biggs and Andrews 15
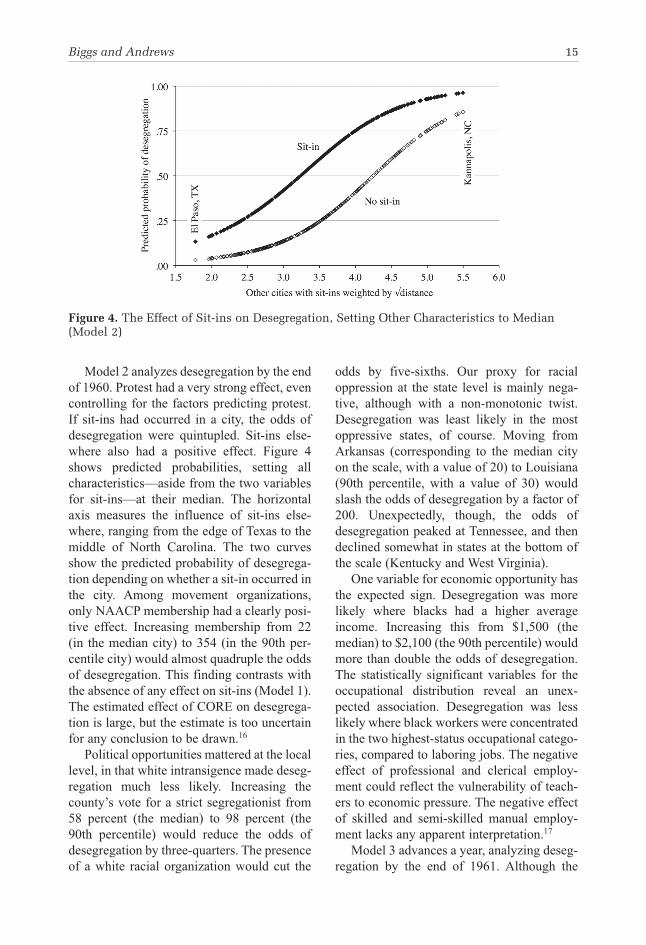
Model 2 analyzes desegregation by the end of 1960. Protest had a very strong effect, even controlling for the factors predicting protest. If sit-ins had occurred in a city, the odds of desegregation were quintupled. Sit-ins else-where also had a positive effect. Figure 4 shows predicted probabilities, setting all characteristics—aside from the two variables for sit-ins—at their median. The horizontal axis measures the influence of sit-ins else-where, ranging from the edge of Texas to the middle of North Carolina. The two curves show the predicted probability of desegrega-tion depending on whether a sit-in occurred in the city. Among movement organizations, only NAACP membership had a clearly posi-tive effect. Increasing membership from 22 (in the median city) to 354 (in the 90th per-centile city) would almost quadruple the odds of desegregation. This finding contrasts with the absence of any effect on sit-ins (Model 1). The estimated effect of CORE on desegrega-tion is large, but the estimate is too uncertain for any conclusion to be drawn.16
Political opportunities mattered at the local level, in that white intransigence made deseg-regation much less likely. Increasing the county’s vote for a strict segregationist from 58 percent (the median) to 98 percent (the 90th percentile) would reduce the odds of desegregation by three-quarters. The presence of a white racial organization would cut the
odds by five-sixths. Our proxy for racial oppression at the state level is mainly nega-tive, although with a non-monotonic twist. Desegregation was least likely in the most oppressive states, of course. Moving from Arkansas (corresponding to the median city on the scale, with a value of 20) to Louisiana (90th percentile, with a value of 30) would slash the odds of desegregation by a factor of 200. Unexpectedly, though, the odds of desegregation peaked at Tennessee, and then declined somewhat in states at the bottom of the scale (Kentucky and West Virginia).
One variable for economic opportunity has the expected sign. Desegregation was more likely where blacks had a higher average income. Increasing this from $1,500 (the median) to $2,100 (the 90th percentile) would more than double the odds of desegregation. The statistically significant variables for the occupational distribution reveal an unex-pected association. Desegregation was less likely where black workers were concentrated in the two highest-status occupational catego-ries, compared to laboring jobs. The negative effect of professional and clerical employ-ment could reflect the vulnerability of teach-ers to economic pressure. The negative effect of skilled and semi-skilled manual employ-ment lacks any apparent interpretation.17
Model 3 advances a year, analyzing deseg-regation by the end of 1961. Although the
Figure 4. The Effect of Sit-ins on Desegregation, Setting Other Characteristics to Median (Model 2)
16 American Sociological Review
effect of sit-ins in spring 1960 might be expected to diminish with the passage of time, it remains strongly positive. The occur-rence of sit-ins almost quintupled the odds of desegregation. Sit-ins in other cities, though, had less effect than in Model 2. There are two major differences from Model 2. The nega-tive effect of votes for strict segregation diminished and is no longer statistically sig-nificant. The probability of desegregation increased with aggregate black income. Rais-ing this figure from $4 million (the median) to $22 million (the 90th percentile) would almost quintuple the odds.
Model 4 compares SRC’s tabulation of desegregation. The estimated effects of sit-ins—in the city and in other cities—are even greater than in Model 3. Our scale of racial oppression now has a straightforward nega-tive effect, without the non-monotonic twist found in Models 2 and 3. This reflects the fact that SRC recorded seven more desegregated cities in Kentucky than did CORE. Some variables are no longer statistically signifi-cant: NAACP membership, white racial organization, and the two occupational varia-bles. Conversely, the percentage of employ-ment in the retail and hospitality sector is now statistically significant. Increasing this per-centage from 14.5 percent (the median) to 18.1 percent (the 90th percentile) would almost triple the odds of desegregation. The magni-tude of this estimated effect appears implausi-bly large.
One potential objection to these findings is that differences among states are not com-pletely captured by our demographic proxy for racial oppression. This objection can be addressed by including a separate intercept for each state, thus explaining only the varia-tion among cities within each state. States where no desegregation occurred must be omitted completely: six states in Model 2 (N = 215) and four in Models 3 and 4 (N = 247). This severe test eliminates the significance of the effect of sit-ins elsewhere, hardly surpris-ing as 90 percent of the variation in this vari-able comes from differences among states. This severe test does not, however, diminish the effect of the occurrence of sit-ins in the
city: the odds ratios are, respectively, 4.3 ( p = .02), 4.3 ( p = .02), and 7.7 ( p = .002) (see Table S2 in the online supplement).
Another potential objection to the findings is that they are unduly influenced by a single observation. After all, the number of success-ful outcomes (ranging from 78 to 90) is mod-est, and the total number of observations is not large. This objection can be addressed by jackknife standard errors, calculated by repli-cating the model 334 times, dropping a single observation every time. Jackknife standard errors, averaged over replications, are inflated, and thus provide a more conservative test of statistical significance. The effects for sit-ins remain statistically significant, as do almost all the effects discussed earlier (see Table S3 in the online supplement). The average income of blacks, however, is no longer sta-tistically significant at the .05 level.
A final potential objection is that the find-ings for sit-ins are sensitive to the selection of other independent variables in the analysis (Young 2009). This objection can be addressed by replicating the models, dropping each independent variable in turn (see Table S4 in the online supplement). In Model 2, the esti-mated odds ratio for sit-ins in the city falls to 2.8 when the percentage of craftspeople and operatives is dropped; this is just outside con-ventional statistical significance ( p = .058). Otherwise the results for sit-ins, both in the city and elsewhere, prove remarkably robust.
In summary, we find strong evidence that disruptive protest did make a difference. These findings are derived from two different sources of data (CORE and SRC) and prove robust against potential objections. Sit-ins helped bring about desegregation, not just in the city where they happened but also in sur-rounding cities. This demonstrated impact is remarkable given the inclusion of variables predicting the occurrence of sit-ins.
DIFFUSION OF DESEGREGATIONThus far we have treated desegregation in each city as independent of prior desegrega-tion in other cities. Theoretically we expect
Biggs and Andrews 17
desegregation to have diffused across cities. Testing this requires event-history analysis. Such analysis is possible using CORE’s tabu-lations (see Table 1). Analysis is handicapped by imprecise dating: we observe only the interval within which the event occurred, intervals are few, and their lengths are unequal. The first interval, when 43 cities desegregated, poses an insuperable problem: the effect of prior desegregation cannot be estimated. Excluding the first interval means dropping nearly half the desegregation events. This leaves 1,350 (= 1,684 – 334) city-intervals at risk of desegregation.
We estimate the hazard of desegregation, hip, for city i within interval p, where p ranges from 2 to 6. With intervals of unequal length, a Cox proportional-hazards model can be estimated by complementary log-log regres-sion (Rabe-Hesketh and Skrondal 2008):
To absorb changes in the baseline hazard, we estimate a separate intercept (α2, …, α6) for each interval. Binary variables P2, …, P6 identify the interval, thus P2p is coded 1 if p = 2 and 0 otherwise. The characteristics of each city are measured by cross-sectional variables described earlier, Xk, S, and T.
Prior desegregation elsewhere is measured by E, which varies by city-interval. This vari-able is derived from the sum of cities previ-ously desegregated, offset by the inertial force exerted by cities maintaining segregation:
ED
d
D
dip
j p
ijj j i
Jj p
ijj j i
J
=⎛
⎝⎜⎜
⎞
⎠⎟⎟−
−⎛
⎝⎜⎜
⎞−
= ≠
−
= ≠∑ ∑,
,
,
,
1
1
1
1
1φ φ
⎠⎠⎟⎟
where Dj,p–1 is 1 if city j’s lunch counters were desegregated by the end of the preceding interval, otherwise 0.18 Model fit is maxi-mized by setting spatial decay I to 1. E is lowest (–1.0) for Augusta, Georgia in the second interval, and highest (.2) for South Norfolk, Virginia in the sixth interval. As with sit-ins in other cities (T ), a variant of E can be calculated to distinguish the effect of
desegregation within the same state. This dis-tinction, however, is not significant.
Given the sparse data (in one interval, desegregation occurred in only five cities), estimation requires the assumption of propor-tional hazards. The assumption can be tested by entering interaction terms between a vari-able and the period variables P3 to P6. The effects of sit-ins in the city (S) and of sit-ins elsewhere (T ) do not change significantly across intervals (for each variable, the inter-action terms tested jointly are not statistically significant at the .05 level). The effect of prior desegregation (E ) does, however, change sig-nificantly in the final interval ( p = .003). We therefore enter two terms derived from this variable: (1–P6) E and P6 E.
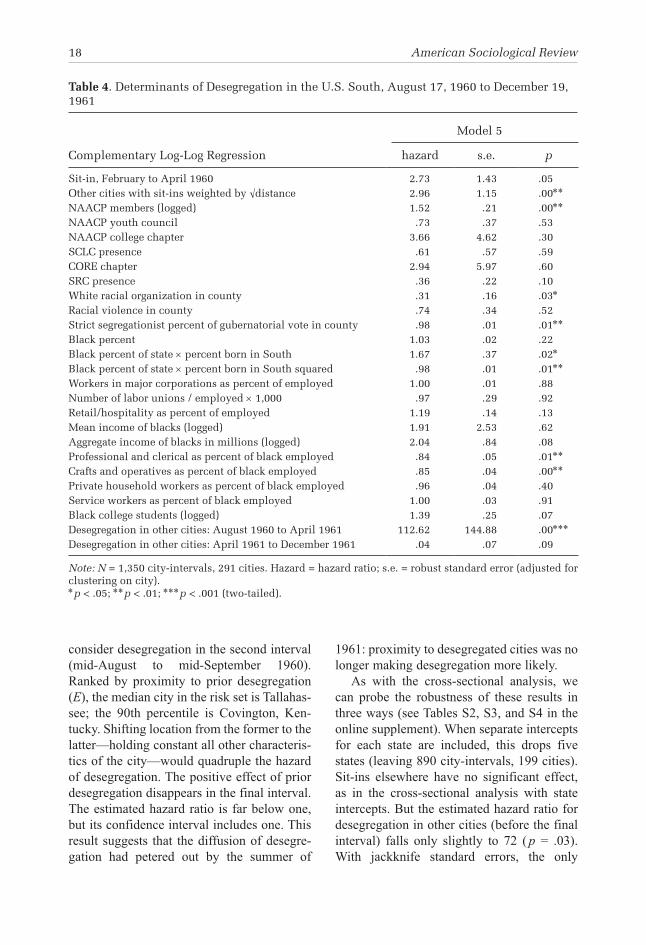
Model 5 in Table 4 shows the results. It should be emphasized that this analysis is restricted to cities where desegregation had not occurred by mid-August 1960. Observa-tions for the same city at different intervals are not independent, of course, and so robust standard errors are estimated with clustering by city.19 The exponentiated coefficients (eβ) are interpreted as hazard ratios in continuous time, as normal for the Cox proportional-hazards model.20 The area under the ROC curve is .93, showing that the model is very good at discriminating between city-intervals with desegregation and those without.
The results for cross-sectional variables are similar to those in Model 2. The estimated hazard ratio for the occurrence of sit-ins in a city falls just short of conventional statistical significance ( p = .053). This reflects the fact that cities with sit-ins were more likely to undergo desegregation during the first inter-val—which is excluded from Model 5—than in subsequent intervals, and so the effect is estimated from relatively few cities.21
Most importantly, these results demon-strate the diffusion of desegregation. Before April 1961, prior desegregation in nearby cit-ies increased the hazard of desegregation. This result is not due to desegregation becom-ing more likely over time; in fact, it became less likely (see Table 1 and Figure 3). To illustrate the magnitude of this effect,
hP P
X S T Eip
p p
k ki i i ip
= − −+ +
+ + + +
⎛
⎝⎜⎜
⎞
⎠⎟⎟
⎛
∑1
2 6 6
1 2 3
exp expα α2 !
β δ δ δ⎝⎝⎜⎜
⎞
⎠⎟⎟
18 American Sociological Review
consider desegregation in the second interval (mid-August to mid-September 1960). Ranked by proximity to prior desegregation (E), the median city in the risk set is Tallahas-see; the 90th percentile is Covington, Ken-tucky. Shifting location from the former to the latter—holding constant all other characteris-tics of the city—would quadruple the hazard of desegregation. The positive effect of prior desegregation disappears in the final interval. The estimated hazard ratio is far below one, but its confidence interval includes one. This result suggests that the diffusion of desegre-gation had petered out by the summer of
1961: proximity to desegregated cities was no longer making desegregation more likely.
As with the cross-sectional analysis, we can probe the robustness of these results in three ways (see Tables S2, S3, and S4 in the online supplement). When separate intercepts for each state are included, this drops five states (leaving 890 city-intervals, 199 cities). Sit-ins elsewhere have no significant effect, as in the cross-sectional analysis with state intercepts. But the estimated hazard ratio for desegregation in other cities (before the final interval) falls only slightly to 72 ( p = .03). With jackknife standard errors, the only
Table 4. Determinants of Desegregation in the U.S. South, August 17, 1960 to December 19, 1961
Complementary Log-Log Regression
Model 5
hazard s.e. p
Sit-in, February to April 1960 2.73 1.43 .05Other cities with sit-ins weighted by √distance 2.96 1.15 .00
NAACP members (logged) 1.52 .21 .00
NAACP youth council .73 .37 .53NAACP college chapter 3.66 4.62 .30SCLC presence .61 .57 .59CORE chapter 2.94 5.97 .60SRC presence .36 .22 .10White racial organization in county .31 .16 .03
Racial violence in county .74 .34 .52Strict segregationist percent of gubernatorial vote in county .98 .01 .01
Black percent 1.03 .02 .22Black percent of state u percent born in South 1.67 .37 .02
Black percent of state u percent born in South squared .98 .01 .01
Workers in major corporations as percent of employed 1.00 .01 .88Number of labor unions / employed u 1,000 .97 .29 .92Retail/hospitality as percent of employed 1.19 .14 .13Mean income of blacks (logged) 1.91 2.53 .62Aggregate income of blacks in millions (logged) 2.04 .84 .08Professional and clerical as percent of black employed .84 .05 .01
Crafts and operatives as percent of black employed .85 .04 .00
Private household workers as percent of black employed .96 .04 .40Service workers as percent of black employed 1.00 .03 .91Black college students (logged) 1.39 .25 .07Desegregation in other cities: August 1960 to April 1961 112.62 144.88 .00
Desegregation in other cities: April 1961 to December 1961 .04 .07 .09
Note: N = 1,350 city-intervals, 291 cities. Hazard = hazard ratio; s.e. = robust standard error (adjusted for clustering on city). p < .05; p < .01; p < .001 (two-tailed).
Biggs and Andrews 19
variable to lose statistical significance is our proxy for racial oppression at the state level (and its squared term). When successive inde-pendent variables are omitted, the hazard ratio for desegregation remains large and highly statistically significant.
DISCUSSION AND CONCLUSIONSThe campaigns to desegregate lunch counters provide an ideal opportunity to evaluate the impact of protest. The 1960 sit-ins are histori-cally important given their centrality to the broader civil rights struggle. Exploiting varia-tion in outcomes across 334 cities, we assess the effect of protest by controlling for the factors that explain variation in the incidence of protest. These analyses demonstrate that sit-in protest greatly increased the probability of desegregation, as did protest in nearby cit-ies. Over time, desegregation became more likely if nearby cities had already desegre-gated. Our analyses also show that desegrega-tion was more likely where opposition was weak, political conditions were favorable, and the movement’s constituency had greater economic leverage.
Three limitations should be acknowledged, pointing toward future directions for research. First, our measure of protest is restricted in time, to the spring of 1960, and as a binary variable it does not capture variation in partici-pation or intensity. This temporal restriction has an advantage, because protest is causally prior to desegregation. The disadvantage is that our analysis does not capture the effect of protest that occurred after Easter 1960. Subse-quent protest may help to account for the diffu-sion of desegregation over time. Testing this will require more detailed catalogs of protest events. Second, scholars have shifted to more complex measures of movement outcomes that differentiate among stages of the policy pro-cess and the scope or comprehensiveness of policies (Amenta et al. 2005; Andrews 2001; Santoro 2008; Soule and King 2006). In our case, we are limited to a single indicator of movement impact. Arguably, theories may
have greater leverage differentiating among more refined measures of the breadth of deseg-regation. Third, scholars have begun to docu-ment the process through which movement effects occur, leading to new insights regarding the interactions between movements and tar-gets (Ganz 2000; McCammon et al. 2008). Our analyses suggest that case studies of cities without protest would be especially informa-tive; ironically, these are the cases that scholars of social movements have ignored. Such case studies will enable us to trace the indirect influence of protest and institutional change occurring elsewhere. For example, economic actors may have desegregated to preempt the occurrence of protest locally. Subsequent work on the desegregation process will be able to specify the pathways through which move-ment actors and their targets shaped outcomes.
Despite these limitations, our analysis demonstrates that protest can bring about social change, even controlling for antecedent conditions. How general is this finding? Desegregation of public accommodations has three important characteristics that define the scope conditions of our analysis and theoreti-cal claims. First, activists targeted economic actors rather than political ones. Second, the targets of protest were vulnerable to direct action. Stores were located in the center of downtown business districts, so protest could dissuade blacks from patronizing the stores while also discouraging whites (even those who favored segregation) from shopping in the midst of conflict. These businesses already depended partly on black customers. Disrup-tive protest will have less of an effect when it has low visibility and targets are not depend-ent on a movement’s constituency. Third, the sit-ins unfolded as a wave of protest that dif-fused rapidly throughout the South. Local protest campaigns that occur in isolation or in smaller clusters may fail to generate the kind of leverage observed here. Taken together, these characteristics capture many important social movements, and future research should examine how these conditions alter the capac-ity of protest to generate change.
20 American Sociological Review
Scholars, activists, and many others draw lessons about the efficacy of protest from the civil rights movement. Unfortunately, most attention centers on a handful of well-studied campaigns, charismatic leaders, and major federal policies. Scholars have paid particular attention to the links between celebrated cam-paigns in Birmingham and Selma as catalysts for the 1964 Civil Rights Act and 1965 Voting Rights Act, respectively (Garrow 1978). Pro-test was far more diffuse and a large share targeted local businesses rather than federal policymakers (Andrews and Gaby forthcom-ing). Our analysis demonstrates the critical impact of local protest across numerous cities well before passage of the 1964 Civil Rights Act. In this way, the effects of the civil rights movement followed a trajectory like other major social movements—including suffrage, old age assistance, and prohibition—in which local victories were ultimately consolidated in national legislation (Amenta 2006; Andrews and Seguin forthcoming; McCam-mon et al. 2001; Szymanski 2003).22
We find that movement success diffused to nearby cities over time even in the absence of protest in a city. This pattern challenges the conventional practice of examining the charac-teristics of movement activity in isolation from what is occurring in other locales. Scholars should pay increasing attention to spatial pro-cesses in studies of movement consequences, and this task will be aided by GIS data and spatial analysis tools (Downey 2006). Taken together, the impact of protest and the spatial diffusion of movement success underscore our call for spatially and temporally disaggregat-ing the analysis of movement consequences. Moreover, our analysis confirms the advan-tages of building datasets on a large number of campaigns alongside relevant measures of social, political, and economic contexts.
Our findings regarding the impact of pro-test campaigns are robust in that we include measures for a city’s movement infrastructure, political opportunity, and economic character-istics. Movement infrastructure arguments focus on organizational and strategic capacity of movements. By comparison, theories of
political and economic opportunity focus on exogenous factors that may enhance or dimin-ish a movement’s likelihood of success. Com-paring across 334 southern cities, we find support for a key aspect of the movement infrastructure argument. Specifically, our analyses show that protest organizations like CORE, operating as activist cadres, facilitated the spread of protest while established, mem-bership organizations were important for securing movement gains. Although scholars have suggested that a tactical division of labor occurs in movements, this study provides an important test of and support for this claim. We also find that some political and economic characteristics of a community mattered. We show that white segregationist organizations have a negative impact on the likelihood of desegregation. The measures of political opportunity that capture the most central ideas in the theory—elite allies and political access points—are not significant.
Comparing across all southern cities, rather than a select subset, allows us to pro-vide a firmer empirical foundation for some of the claims that have been made about the impact of civil rights protest while challeng-ing other claims. We confirm that disruptive protest secured significant victories as many observers have claimed. Our findings regard-ing spatial diffusion are more novel, although consistent with Wright’s (2013:93) argument that business owners resisted desegregation not out of ideological commitment but because they “harbored fears of being under-cut by still-segregated rivals in competition for affluent white customers.” News that businesses were desegregating in nearby cit-ies, with minimal economic harm, would have aided the spread of desegregation. Con-sistent with Morris’s (1993) account of the Birmingham campaign, we find that local protest was crucial in securing favorable out-comes, and we find some evidence to support Morris’s claim that the strength of local movement organizations mattered for these outcomes. Our analysis finds no evidence that cities with stronger ties to the national econ-omy were more likely to desegregate.
Biggs and Andrews 21
However, we do find that desegregation was more likely in cities where black purchasing power was greater (Jacoway and Colburn 1982; Luders 2006).
Despite a surge in research on the conse-quences of movements, most studies examine movement impact by focusing on characteris-tics of movement organizations. Among those that study protest, most find that disruptive
protest has no direct effect. Moreover, many research designs make it difficult to appraise the impact of movements by employing aggregated measures of organizations or pro-test activity over large geographic areas or time periods. By situating the sit-in cam-paigns in their local context, we show that protest was responsible for undermining Jim Crow segregation.
APPENDIX
Table A1. Descriptive Statistics
Independent Variable Mean SD Min. Max.
334 Cities (1) Sit-in, February to April 1960 .20 .40 .00 1.00(2) Other cities with sit-ins weighted by √distance 3.45 .80 1.77 5.50(3) NAACP members (logged) 2.67 2.49 .00 9.26(4) NAACP youth council .35 .48 .00 1.00(5) NAACP college chapter .04 .19 .00 1.00(6) SCLC presence .07 .25 .00 1.00(7) CORE chapter .04 .19 .00 1.00(8) SRC presence .27 .44 .00 1.00(9) White racial organization in county .36 .46 .00 1.00(10) Racial violence in county .28 .43 .00 1.00(11) Strict segregationist percent of gubernatorial vote
in county58.13 31.29 4.62 100.00
(12) Black percent 24.75 12.93 1.67 65.96(13) Black percent squared 779.17 721.89 2.78 4351.11(14) Black percent of state u percent born in South 19.90 9.39 4.33 40.20(15) Black percent of state u percent born in South
squared483.97 414.13 18.73 1616.00
(16) Workers in major corporations as percent of employed
13.18 21.21 .00 186.03
(17) Number of labor unions / employed u 1,000 .86 .76 .00 4.37(18) Retail/hospitality as percent of employed 14.71 2.64 5.81 22.66(19) Mean income of blacks (logged) 7.35 .21 6.80 8.09(20) Aggregate income of blacks in millions (logged) 1.55 1.15 –.46 5.93(21) Professional and clerical as percent of black
employed11.11 4.42 1.94 32.52
(22) Crafts and operatives as percent of black employed
23.48 6.86 4.86 61.02
(23) Private household workers as percent of black employed
25.14 6.52 4.22 44.54
(24) Service workers as percent of black employed 22.62 7.30 5.85 59.39(25) Black college students (logged) 3.02 1.97 .00 8.231,350 City-Intervals (26) Desegregation in other cities –.74 .25 –1.56 .17
22
Tabl
e A
2. C
orre
lati
on M
atri
x
(1)
(2)
(3)
(4)
(5)
(6)
(7)
(8)
(9)
(10)
(11)
(12)
(13)
(14)
(15)
(16)
(17)
(18)
(19)
(20)
(21)
(22)
(23)
(24)
(25)
334
Cit
ies
(2
).3
3
(3)
.48
.21
(4
).4
4.1
5.7
3
(5)
.40
.24
.33
.30
(6
).3
8.0
1.2
5.1
8.2
9
(7)
.35
.14
.25
.26
.19
.21
(8
).4
4.1
6.3
4.2
6.2
9.3
6.2
1
(9)
.10
–.04
.11
.10
.05
.28
.13
.11
(1
0).1
9.0
4.1
8.1
8.1
6.2
9.1
7.1
4.3
5
(11)
.01
.31
–.02
–.06
.02
.05
.16
.15
.03
.05
(1
2).1
8.1
2.0
5.0
3.1
4.2
0.0
7.1
7.1
8.1
2.2
9
(13)
.12
.07
.01
–.01
.12
.17
.05
.13
.18
.12
.28
.96
(1
4)–.
03.2
5–.
17–.
09.0
4.1
0.0
3.0
5.3
5.1
3.2
8.4
4.4
0
(15)
–.06
.16
–.16
–.09
.01
.10
.05
.02
.39
.16
.31
.42
.40
.98
(1
6).0
4.1
5.1
3.0
7.0
2–.
02.0
5.0
4.0
8.0
0.0
7–.
01–.
01.0
5.0
4
(17)
.05
–.10
.14
.11
–.01
.04
.02
–.02
.09
.05
.05
.11
.10
.02
.07
.19
(1
8)–.
13–.
42–.
08–.
13–.
09–.
05–.
04–.
13–.
03–.
09–.
03.0
0.0
0–.
08–.
02–.
27.0
8
(19)
.18
–.05
.29
.24
.14
.10
.05
.07
.02
.11
–.18
–.34
–.30
–.43
–.42
.15
–.02
–.24
(2
0).4
9.0
0.5
7.4
8.3
6.4
5.2
4.4
9.2
6.3
0.0
1.4
1.3
5.0
5.0
4.0
1.0
8–.
08.3
2
(21)
.32
.12
.30
.29
.23
.15
.13
.17
.13
.08
–.06
.16
.15
–.05
–.05
.00
.09
–.03
.24
.32
(2
2).1
8.2
9.1
4.0
5.1
2.1
3.0
3.0
1.1
1.0
7.0
5.3
9.3
4.2
6.2
3.0
9–.
09–.
15.0
4.2
4–.
01
(23)
–.24
–.09
–.34
–.22
–.20
–.17
–.05
–.17
–.07
–.14
.05
–.24
–.22
.20
.20
–.13
–.02
.18
–.54
–.43
–.37
–.41
(2
4).0
0–.
14.1
4.0
9.0
3.0
1.0
0.1
1–.
08–.
03–.
15–.
48–.
43–.
30–.
28–.
02.1
2.0
5.2
4.0
0–.
02–.
48–.
06
(25)
.53
.02
.46
.41
.41
.42
.23
.48
.29
.31
–.06
.28
.23
.04
.04
–.03
.05
–.02
.20
.76
.47
.06
–.30
.07
1,
350
Cit
y-In
terv
als
(2
6).0
0–.
02.2
1.1
3–.
09–.
14.0
1–.
15–.
13–.
15–.
22–.
28–.
22–.
54–.
50.0
1–.
06.1
2.2
9–.
17.1
7–.
04–.
26.1
2–.
17
Not
e: T
he n
umbe
rs in
par
enth
eses
cor
resp
ond
to th
e va
riab
les
list
ed in
Tab
le A
1.
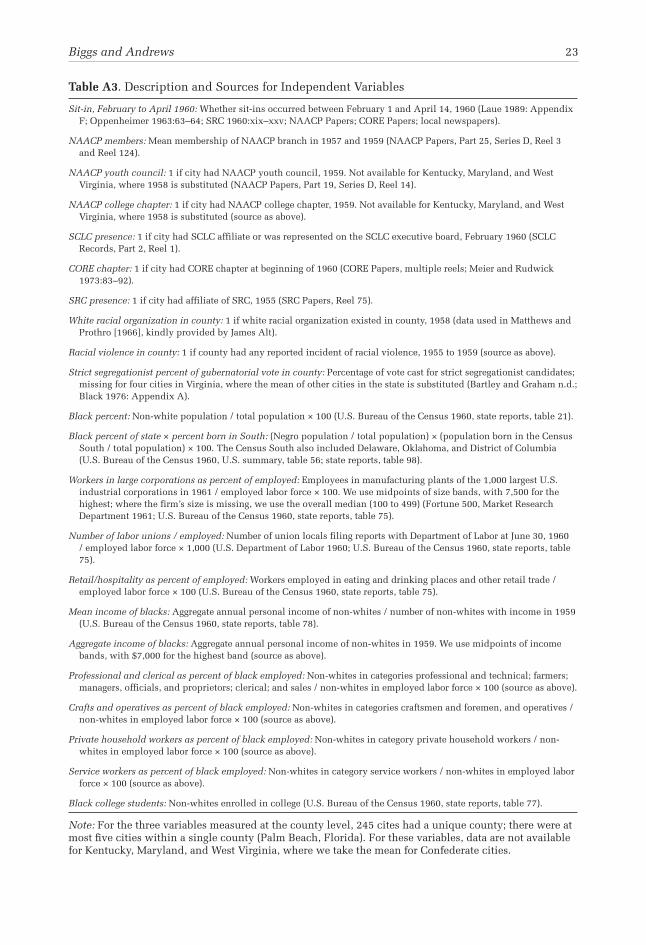
Biggs and Andrews 23
Table A3. Description and Sources for Independent Variables
Sit-in, February to April 1960: Whether sit-ins occurred between February 1 and April 14, 1960 (Laue 1989: Appendix F; Oppenheimer 1963:63–64; SRC 1960:xix–xxv; NAACP Papers; CORE Papers; local newspapers).
NAACP members: Mean membership of NAACP branch in 1957 and 1959 (NAACP Papers, Part 25, Series D, Reel 3 and Reel 124).
NAACP youth council: 1 if city had NAACP youth council, 1959. Not available for Kentucky, Maryland, and West Virginia, where 1958 is substituted (NAACP Papers, Part 19, Series D, Reel 14).
NAACP college chapter: 1 if city had NAACP college chapter, 1959. Not available for Kentucky, Maryland, and West Virginia, where 1958 is substituted (source as above).
SCLC presence: 1 if city had SCLC affiliate or was represented on the SCLC executive board, February 1960 (SCLC Records, Part 2, Reel 1).
CORE chapter: 1 if city had CORE chapter at beginning of 1960 (CORE Papers, multiple reels; Meier and Rudwick 1973:83–92).
SRC presence: 1 if city had affiliate of SRC, 1955 (SRC Papers, Reel 75).
White racial organization in county: 1 if white racial organization existed in county, 1958 (data used in Matthews and Prothro [1966], kindly provided by James Alt).
Racial violence in county: 1 if county had any reported incident of racial violence, 1955 to 1959 (source as above).
Strict segregationist percent of gubernatorial vote in county: Percentage of vote cast for strict segregationist candidates; missing for four cities in Virginia, where the mean of other cities in the state is substituted (Bartley and Graham n.d.; Black 1976: Appendix A).
Black percent: Non-white population / total population × 100 (U.S. Bureau of the Census 1960, state reports, table 21).
Black percent of state × percent born in South: (Negro population / total population) × (population born in the Census South / total population) × 100. The Census South also included Delaware, Oklahoma, and District of Columbia (U.S. Bureau of the Census 1960, U.S. summary, table 56; state reports, table 98).
Workers in large corporations as percent of employed: Employees in manufacturing plants of the 1,000 largest U.S. industrial corporations in 1961 / employed labor force × 100. We use midpoints of size bands, with 7,500 for the highest; where the firm’s size is missing, we use the overall median (100 to 499) (Fortune 500, Market Research Department 1961; U.S. Bureau of the Census 1960, state reports, table 75).
Number of labor unions / employed: Number of union locals filing reports with Department of Labor at June 30, 1960 / employed labor force × 1,000 (U.S. Department of Labor 1960; U.S. Bureau of the Census 1960, state reports, table 75).
Retail/hospitality as percent of employed: Workers employed in eating and drinking places and other retail trade / employed labor force × 100 (U.S. Bureau of the Census 1960, state reports, table 75).
Mean income of blacks: Aggregate annual personal income of non-whites / number of non-whites with income in 1959 (U.S. Bureau of the Census 1960, state reports, table 78).
Aggregate income of blacks: Aggregate annual personal income of non-whites in 1959. We use midpoints of income bands, with $7,000 for the highest band (source as above).
Professional and clerical as percent of black employed: Non-whites in categories professional and technical; farmers; managers, officials, and proprietors; clerical; and sales / non-whites in employed labor force × 100 (source as above).
Crafts and operatives as percent of black employed: Non-whites in categories craftsmen and foremen, and operatives / non-whites in employed labor force × 100 (source as above).
Private household workers as percent of black employed: Non-whites in category private household workers / non-whites in employed labor force × 100 (source as above).
Service workers as percent of black employed: Non-whites in category service workers / non-whites in employed labor force × 100 (source as above).
Black college students: Non-whites enrolled in college (U.S. Bureau of the Census 1960, state reports, table 77).
Note: For the three variables measured at the county level, 245 cites had a unique county; there were at most five cities within a single county (Palm Beach, Florida). For these variables, data are not available for Kentucky, Maryland, and West Virginia, where we take the mean for Confederate cities.
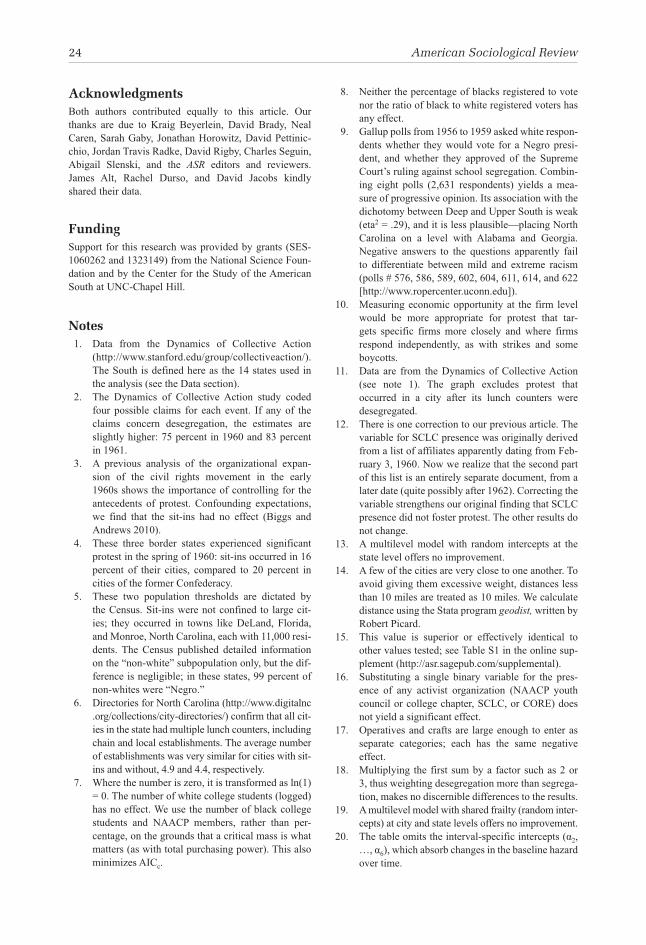
24 American Sociological Review
AcknowledgmentsBoth authors contributed equally to this article. Our thanks are due to Kraig Beyerlein, David Brady, Neal Caren, Sarah Gaby, Jonathan Horowitz, David Pettinic-chio, Jordan Travis Radke, David Rigby, Charles Seguin, Abigail Slenski, and the ASR editors and reviewers. James Alt, Rachel Durso, and David Jacobs kindly shared their data.
FundingSupport for this research was provided by grants (SES-1060262 and 1323149) from the National Science Foun-dation and by the Center for the Study of the American South at UNC-Chapel Hill.
Notes 1. Data from the Dynamics of Collective Action
(http://www.stanford.edu/group/collectiveaction/). The South is defined here as the 14 states used in the analysis (see the Data section).
2. The Dynamics of Collective Action study coded four possible claims for each event. If any of the claims concern desegregation, the estimates are slightly higher: 75 percent in 1960 and 83 percent in 1961.
3. A previous analysis of the organizational expan-sion of the civil rights movement in the early 1960s shows the importance of controlling for the antecedents of protest. Confounding expectations, we find that the sit-ins had no effect (Biggs and Andrews 2010).
4. These three border states experienced significant protest in the spring of 1960: sit-ins occurred in 16 percent of their cities, compared to 20 percent in cities of the former Confederacy.
5. These two population thresholds are dictated by the Census. Sit-ins were not confined to large cit-ies; they occurred in towns like DeLand, Florida, and Monroe, North Carolina, each with 11,000 resi-dents. The Census published detailed information on the “non-white” subpopulation only, but the dif-ference is negligible; in these states, 99 percent of non-whites were “Negro.”
6. Directories for North Carolina (http://www.digitalnc .org/collections/city-directories/) confirm that all cit-ies in the state had multiple lunch counters, including chain and local establishments. The average number of establishments was very similar for cities with sit-ins and without, 4.9 and 4.4, respectively.
7. Where the number is zero, it is transformed as ln(1) = 0. The number of white college students (logged) has no effect. We use the number of black college students and NAACP members, rather than per-centage, on the grounds that a critical mass is what matters (as with total purchasing power). This also minimizes AICc.
8. Neither the percentage of blacks registered to vote nor the ratio of black to white registered voters has any effect.
9. Gallup polls from 1956 to 1959 asked white respon-dents whether they would vote for a Negro presi-dent, and whether they approved of the Supreme Court’s ruling against school segregation. Combin-ing eight polls (2,631 respondents) yields a mea-sure of progressive opinion. Its association with the dichotomy between Deep and Upper South is weak (eta2 = .29), and it is less plausible—placing North Carolina on a level with Alabama and Georgia. Negative answers to the questions apparently fail to differentiate between mild and extreme racism (polls # 576, 586, 589, 602, 604, 611, 614, and 622 [http://www.ropercenter.uconn.edu]).
10. Measuring economic opportunity at the firm level would be more appropriate for protest that tar-gets specific firms more closely and where firms respond independently, as with strikes and some boycotts.
11. Data are from the Dynamics of Collective Action (see note 1). The graph excludes protest that occurred in a city after its lunch counters were desegregated.
12. There is one correction to our previous article. The variable for SCLC presence was originally derived from a list of affiliates apparently dating from Feb-ruary 3, 1960. Now we realize that the second part of this list is an entirely separate document, from a later date (quite possibly after 1962). Correcting the variable strengthens our original finding that SCLC presence did not foster protest. The other results do not change.
13. A multilevel model with random intercepts at the state level offers no improvement.
14. A few of the cities are very close to one another. To avoid giving them excessive weight, distances less than 10 miles are treated as 10 miles. We calculate distance using the Stata program geodist, written by Robert Picard.
15. This value is superior or effectively identical to other values tested; see Table S1 in the online sup-plement (http://asr.sagepub.com/supplemental).
16. Substituting a single binary variable for the pres-ence of any activist organization (NAACP youth council or college chapter, SCLC, or CORE) does not yield a significant effect.
17. Operatives and crafts are large enough to enter as separate categories; each has the same negative effect.
18. Multiplying the first sum by a factor such as 2 or 3, thus weighting desegregation more than segrega-tion, makes no discernible differences to the results.
19. A multilevel model with shared frailty (random inter-cepts) at city and state levels offers no improvement.
20. The table omits the interval-specific intercepts (α2, …, α6), which absorb changes in the baseline hazard over time.
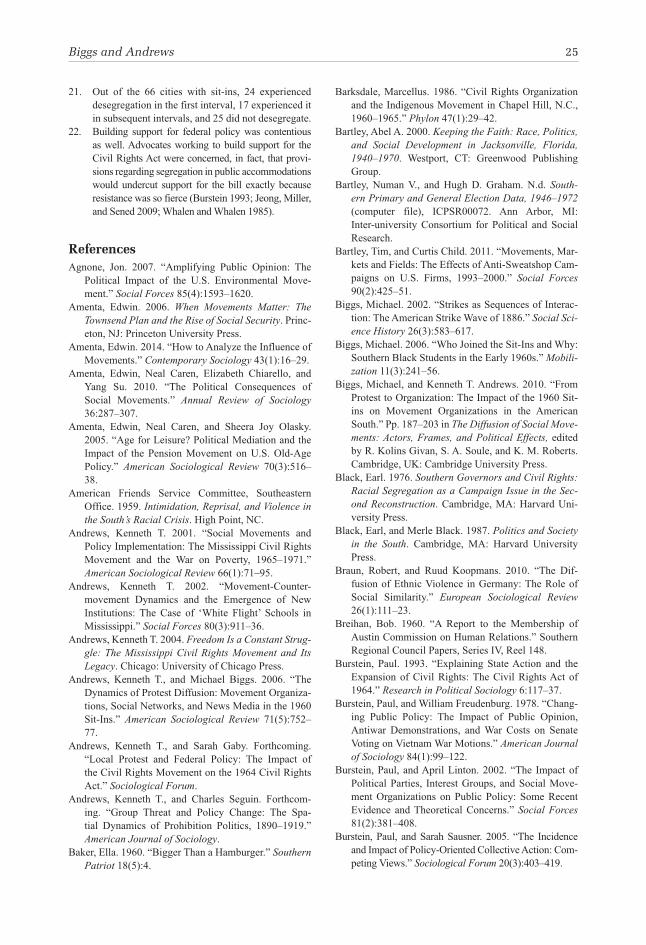
Biggs and Andrews 25
21. Out of the 66 cities with sit-ins, 24 experienced desegregation in the first interval, 17 experienced it in subsequent intervals, and 25 did not desegregate.
22. Building support for federal policy was contentious as well. Advocates working to build support for the Civil Rights Act were concerned, in fact, that provi-sions regarding segregation in public accommodations would undercut support for the bill exactly because resistance was so fierce (Burstein 1993; Jeong, Miller, and Sened 2009; Whalen and Whalen 1985).
ReferencesAgnone, Jon. 2007. “Amplifying Public Opinion: The
Political Impact of the U.S. Environmental Move-ment.” Social Forces 85(4):1593–1620.
Amenta, Edwin. 2006. When Movements Matter: The Townsend Plan and the Rise of Social Security. Princ-eton, NJ: Princeton University Press.
Amenta, Edwin. 2014. “How to Analyze the Influence of Movements.” Contemporary Sociology 43(1):16–29.
Amenta, Edwin, Neal Caren, Elizabeth Chiarello, and Yang Su. 2010. “The Political Consequences of Social Movements.” Annual Review of Sociology 36:287–307.
Amenta, Edwin, Neal Caren, and Sheera Joy Olasky. 2005. “Age for Leisure? Political Mediation and the Impact of the Pension Movement on U.S. Old-Age Policy.” American Sociological Review 70(3):516–38.
American Friends Service Committee, Southeastern Office. 1959. Intimidation, Reprisal, and Violence in the South’s Racial Crisis. High Point, NC.
Andrews, Kenneth T. 2001. “Social Movements and Policy Implementation: The Mississippi Civil Rights Movement and the War on Poverty, 1965–1971.” American Sociological Review 66(1):71–95.
Andrews, Kenneth T. 2002. “Movement-Counter-movement Dynamics and the Emergence of New Institutions: The Case of ‘White Flight’ Schools in Mississippi.” Social Forces 80(3):911–36.
Andrews, Kenneth T. 2004. Freedom Is a Constant Strug-gle: The Mississippi Civil Rights Movement and Its Legacy. Chicago: University of Chicago Press.
Andrews, Kenneth T., and Michael Biggs. 2006. “The Dynamics of Protest Diffusion: Movement Organiza-tions, Social Networks, and News Media in the 1960 Sit-Ins.” American Sociological Review 71(5):752–77.
Andrews, Kenneth T., and Sarah Gaby. Forthcoming. “Local Protest and Federal Policy: The Impact of the Civil Rights Movement on the 1964 Civil Rights Act.” Sociological Forum.
Andrews, Kenneth T., and Charles Seguin. Forthcom-ing. “Group Threat and Policy Change: The Spa-tial Dynamics of Prohibition Politics, 1890–1919.” American Journal of Sociology.
Baker, Ella. 1960. “Bigger Than a Hamburger.” Southern Patriot 18(5):4.
Barksdale, Marcellus. 1986. “Civil Rights Organization and the Indigenous Movement in Chapel Hill, N.C., 1960–1965.” Phylon 47(1):29–42.
Bartley, Abel A. 2000. Keeping the Faith: Race, Politics, and Social Development in Jacksonville, Florida, 1940–1970. Westport, CT: Greenwood Publishing Group.
Bartley, Numan V., and Hugh D. Graham. N.d. South-ern Primary and General Election Data, 1946–1972 (computer file), ICPSR00072. Ann Arbor, MI: Inter-university Consortium for Political and Social Research.
Bartley, Tim, and Curtis Child. 2011. “Movements, Mar-kets and Fields: The Effects of Anti-Sweatshop Cam-paigns on U.S. Firms, 1993–2000.” Social Forces 90(2):425–51.
Biggs, Michael. 2002. “Strikes as Sequences of Interac-tion: The American Strike Wave of 1886.” Social Sci-ence History 26(3):583–617.
Biggs, Michael. 2006. “Who Joined the Sit-Ins and Why: Southern Black Students in the Early 1960s.” Mobili-zation 11(3):241–56.
Biggs, Michael, and Kenneth T. Andrews. 2010. “From Protest to Organization: The Impact of the 1960 Sit-ins on Movement Organizations in the American South.” Pp. 187–203 in The Diffusion of Social Move-ments: Actors, Frames, and Political Effects, edited by R. Kolins Givan, S. A. Soule, and K. M. Roberts. Cambridge, UK: Cambridge University Press.
Black, Earl. 1976. Southern Governors and Civil Rights: Racial Segregation as a Campaign Issue in the Sec-ond Reconstruction. Cambridge, MA: Harvard Uni-versity Press.
Black, Earl, and Merle Black. 1987. Politics and Society in the South. Cambridge, MA: Harvard University Press.
Braun, Robert, and Ruud Koopmans. 2010. “The Dif-fusion of Ethnic Violence in Germany: The Role of Social Similarity.” European Sociological Review 26(1):111–23.
Breihan, Bob. 1960. “A Report to the Membership of Austin Commission on Human Relations.” Southern Regional Council Papers, Series IV, Reel 148.
Burstein, Paul. 1993. “Explaining State Action and the Expansion of Civil Rights: The Civil Rights Act of 1964.” Research in Political Sociology 6:117–37.
Burstein, Paul, and William Freudenburg. 1978. “Chang-ing Public Policy: The Impact of Public Opinion, Antiwar Demonstrations, and War Costs on Senate Voting on Vietnam War Motions.” American Journal of Sociology 84(1):99–122.
Burstein, Paul, and April Linton. 2002. “The Impact of Political Parties, Interest Groups, and Social Move-ment Organizations on Public Policy: Some Recent Evidence and Theoretical Concerns.” Social Forces 81(2):381–408.
Burstein, Paul, and Sarah Sausner. 2005. “The Incidence and Impact of Policy-Oriented Collective Action: Com-peting Views.” Sociological Forum 20(3):403–419.
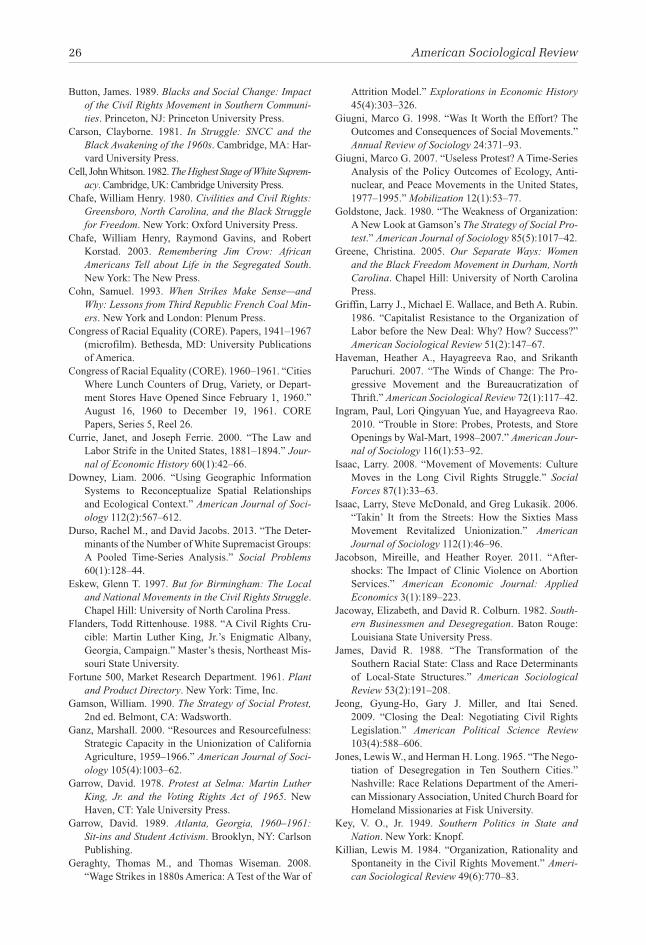
26 American Sociological Review
Button, James. 1989. Blacks and Social Change: Impact of the Civil Rights Movement in Southern Communi-ties. Princeton, NJ: Princeton University Press.
Carson, Clayborne. 1981. In Struggle: SNCC and the Black Awakening of the 1960s. Cambridge, MA: Har-vard University Press.
Cell, John Whitson. 1982. The Highest Stage of White Suprem-acy. Cambridge, UK: Cambridge University Press.
Chafe, William Henry. 1980. Civilities and Civil Rights: Greensboro, North Carolina, and the Black Struggle for Freedom. New York: Oxford University Press.
Chafe, William Henry, Raymond Gavins, and Robert Korstad. 2003. Remembering Jim Crow: African Americans Tell about Life in the Segregated South. New York: The New Press.
Cohn, Samuel. 1993. When Strikes Make Sense—and Why: Lessons from Third Republic French Coal Min-ers. New York and London: Plenum Press.
Congress of Racial Equality (CORE). Papers, 1941–1967 (microfilm). Bethesda, MD: University Publications of America.
Congress of Racial Equality (CORE). 1960–1961. “Cities Where Lunch Counters of Drug, Variety, or Depart-ment Stores Have Opened Since February 1, 1960.” August 16, 1960 to December 19, 1961. CORE Papers, Series 5, Reel 26.
Currie, Janet, and Joseph Ferrie. 2000. “The Law and Labor Strife in the United States, 1881–1894.” Jour-nal of Economic History 60(1):42–66.
Downey, Liam. 2006. “Using Geographic Information Systems to Reconceptualize Spatial Relationships and Ecological Context.” American Journal of Soci-ology 112(2):567–612.
Durso, Rachel M., and David Jacobs. 2013. “The Deter-minants of the Number of White Supremacist Groups: A Pooled Time-Series Analysis.” Social Problems 60(1):128–44.
Eskew, Glenn T. 1997. But for Birmingham: The Local and National Movements in the Civil Rights Struggle. Chapel Hill: University of North Carolina Press.
Flanders, Todd Rittenhouse. 1988. “A Civil Rights Cru-cible: Martin Luther King, Jr.’s Enigmatic Albany, Georgia, Campaign.” Master’s thesis, Northeast Mis-souri State University.
Fortune 500, Market Research Department. 1961. Plant and Product Directory. New York: Time, Inc.
Gamson, William. 1990. The Strategy of Social Protest, 2nd ed. Belmont, CA: Wadsworth.
Ganz, Marshall. 2000. “Resources and Resourcefulness: Strategic Capacity in the Unionization of California Agriculture, 1959–1966.” American Journal of Soci-ology 105(4):1003–62.
Garrow, David. 1978. Protest at Selma: Martin Luther King, Jr. and the Voting Rights Act of 1965. New Haven, CT: Yale University Press.
Garrow, David. 1989. Atlanta, Georgia, 1960–1961: Sit-ins and Student Activism. Brooklyn, NY: Carlson Publishing.
Geraghty, Thomas M., and Thomas Wiseman. 2008. “Wage Strikes in 1880s America: A Test of the War of
Attrition Model.” Explorations in Economic History 45(4):303–326.
Giugni, Marco G. 1998. “Was It Worth the Effort? The Outcomes and Consequences of Social Movements.” Annual Review of Sociology 24:371–93.
Giugni, Marco G. 2007. “Useless Protest? A Time-Series Analysis of the Policy Outcomes of Ecology, Anti-nuclear, and Peace Movements in the United States, 1977–1995.” Mobilization 12(1):53–77.
Goldstone, Jack. 1980. “The Weakness of Organization: A New Look at Gamson’s The Strategy of Social Pro-test.” American Journal of Sociology 85(5):1017–42.
Greene, Christina. 2005. Our Separate Ways: Women and the Black Freedom Movement in Durham, North Carolina. Chapel Hill: University of North Carolina Press.
Griffin, Larry J., Michael E. Wallace, and Beth A. Rubin. 1986. “Capitalist Resistance to the Organization of Labor before the New Deal: Why? How? Success?” American Sociological Review 51(2):147–67.
Haveman, Heather A., Hayagreeva Rao, and Srikanth Paruchuri. 2007. “The Winds of Change: The Pro-gressive Movement and the Bureaucratization of Thrift.” American Sociological Review 72(1):117–42.
Ingram, Paul, Lori Qingyuan Yue, and Hayagreeva Rao. 2010. “Trouble in Store: Probes, Protests, and Store Openings by Wal-Mart, 1998–2007.” American Jour-nal of Sociology 116(1):53–92.
Isaac, Larry. 2008. “Movement of Movements: Culture Moves in the Long Civil Rights Struggle.” Social Forces 87(1):33–63.
Isaac, Larry, Steve McDonald, and Greg Lukasik. 2006. “Takin’ It from the Streets: How the Sixties Mass Movement Revitalized Unionization.” American Journal of Sociology 112(1):46–96.
Jacobson, Mireille, and Heather Royer. 2011. “After-shocks: The Impact of Clinic Violence on Abortion Services.” American Economic Journal: Applied Economics 3(1):189–223.
Jacoway, Elizabeth, and David R. Colburn. 1982. South-ern Businessmen and Desegregation. Baton Rouge: Louisiana State University Press.
James, David R. 1988. “The Transformation of the Southern Racial State: Class and Race Determinants of Local-State Structures.” American Sociological Review 53(2):191–208.
Jeong, Gyung-Ho, Gary J. Miller, and Itai Sened. 2009. “Closing the Deal: Negotiating Civil Rights Legislation.” American Political Science Review 103(4):588–606.
Jones, Lewis W., and Herman H. Long. 1965. “The Nego-tiation of Desegregation in Ten Southern Cities.” Nashville: Race Relations Department of the Ameri-can Missionary Association, United Church Board for Homeland Missionaries at Fisk University.
Key, V. O., Jr. 1949. Southern Politics in State and Nation. New York: Knopf.
Killian, Lewis M. 1984. “Organization, Rationality and Spontaneity in the Civil Rights Movement.” Ameri-can Sociological Review 49(6):770–83.
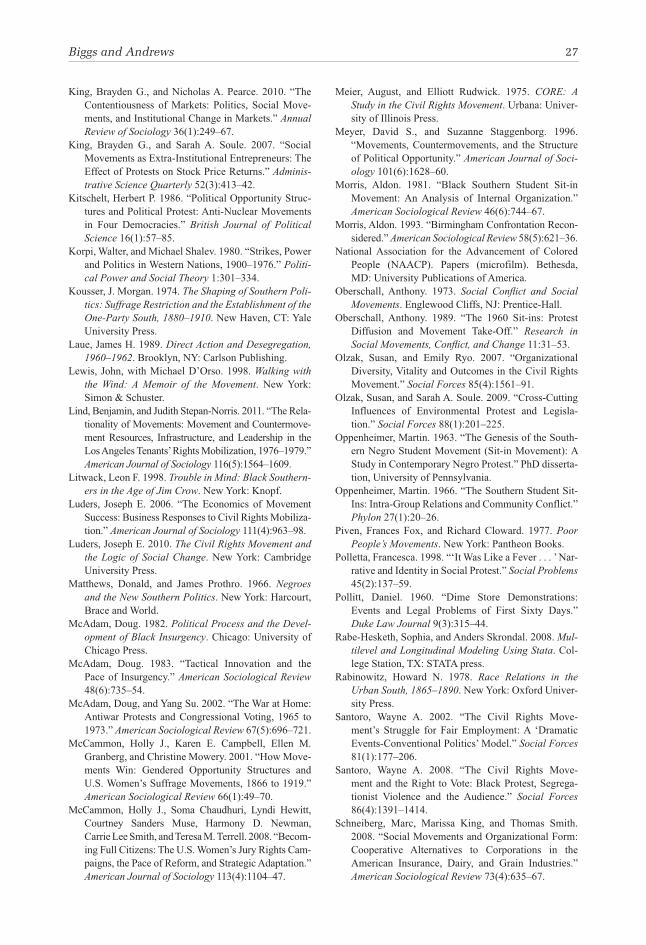
Biggs and Andrews 27
King, Brayden G., and Nicholas A. Pearce. 2010. “The Contentiousness of Markets: Politics, Social Move-ments, and Institutional Change in Markets.” Annual Review of Sociology 36(1):249–67.
King, Brayden G., and Sarah A. Soule. 2007. “Social Movements as Extra-Institutional Entrepreneurs: The Effect of Protests on Stock Price Returns.” Adminis-trative Science Quarterly 52(3):413–42.
Kitschelt, Herbert P. 1986. “Political Opportunity Struc-tures and Political Protest: Anti-Nuclear Movements in Four Democracies.” British Journal of Political Science 16(1):57–85.
Korpi, Walter, and Michael Shalev. 1980. “Strikes, Power and Politics in Western Nations, 1900–1976.” Politi-cal Power and Social Theory 1:301–334.
Kousser, J. Morgan. 1974. The Shaping of Southern Poli-tics: Suffrage Restriction and the Establishment of the One-Party South, 1880–1910. New Haven, CT: Yale University Press.
Laue, James H. 1989. Direct Action and Desegregation, 1960–1962. Brooklyn, NY: Carlson Publishing.
Lewis, John, with Michael D’Orso. 1998. Walking with the Wind: A Memoir of the Movement. New York: Simon & Schuster.
Lind, Benjamin, and Judith Stepan-Norris. 2011. “The Rela-tionality of Movements: Movement and Countermove-ment Resources, Infrastructure, and Leadership in the Los Angeles Tenants’ Rights Mobilization, 1976–1979.” American Journal of Sociology 116(5):1564–1609.
Litwack, Leon F. 1998. Trouble in Mind: Black Southern-ers in the Age of Jim Crow. New York: Knopf.
Luders, Joseph E. 2006. “The Economics of Movement Success: Business Responses to Civil Rights Mobiliza-tion.” American Journal of Sociology 111(4):963–98.
Luders, Joseph E. 2010. The Civil Rights Movement and the Logic of Social Change. New York: Cambridge University Press.
Matthews, Donald, and James Prothro. 1966. Negroes and the New Southern Politics. New York: Harcourt, Brace and World.
McAdam, Doug. 1982. Political Process and the Devel-opment of Black Insurgency. Chicago: University of Chicago Press.
McAdam, Doug. 1983. “Tactical Innovation and the Pace of Insurgency.” American Sociological Review 48(6):735–54.
McAdam, Doug, and Yang Su. 2002. “The War at Home: Antiwar Protests and Congressional Voting, 1965 to 1973.” American Sociological Review 67(5):696–721.
McCammon, Holly J., Karen E. Campbell, Ellen M. Granberg, and Christine Mowery. 2001. “How Move-ments Win: Gendered Opportunity Structures and U.S. Women’s Suffrage Movements, 1866 to 1919.” American Sociological Review 66(1):49–70.
McCammon, Holly J., Soma Chaudhuri, Lyndi Hewitt, Courtney Sanders Muse, Harmony D. Newman, Carrie Lee Smith, and Teresa M. Terrell. 2008. “Becom-ing Full Citizens: The U.S. Women’s Jury Rights Cam-paigns, the Pace of Reform, and Strategic Adaptation.” American Journal of Sociology 113(4):1104–47.
Meier, August, and Elliott Rudwick. 1975. CORE: A Study in the Civil Rights Movement. Urbana: Univer-sity of Illinois Press.
Meyer, David S., and Suzanne Staggenborg. 1996. “Movements, Countermovements, and the Structure of Political Opportunity.” American Journal of Soci-ology 101(6):1628–60.
Morris, Aldon. 1981. “Black Southern Student Sit-in Movement: An Analysis of Internal Organization.” American Sociological Review 46(6):744–67.
Morris, Aldon. 1993. “Birmingham Confrontation Recon-sidered.” American Sociological Review 58(5):621–36.
National Association for the Advancement of Colored People (NAACP). Papers (microfilm). Bethesda, MD: University Publications of America.
Oberschall, Anthony. 1973. Social Conflict and Social Movements. Englewood Cliffs, NJ: Prentice-Hall.
Oberschall, Anthony. 1989. “The 1960 Sit-ins: Protest Diffusion and Movement Take-Off.” Research in Social Movements, Conflict, and Change 11:31–53.
Olzak, Susan, and Emily Ryo. 2007. “Organizational Diversity, Vitality and Outcomes in the Civil Rights Movement.” Social Forces 85(4):1561–91.
Olzak, Susan, and Sarah A. Soule. 2009. “Cross-Cutting Influences of Environmental Protest and Legisla-tion.” Social Forces 88(1):201–225.
Oppenheimer, Martin. 1963. “The Genesis of the South-ern Negro Student Movement (Sit-in Movement): A Study in Contemporary Negro Protest.” PhD disserta-tion, University of Pennsylvania.
Oppenheimer, Martin. 1966. “The Southern Student Sit-Ins: Intra-Group Relations and Community Conflict.” Phylon 27(1):20–26.
Piven, Frances Fox, and Richard Cloward. 1977. Poor People’s Movements. New York: Pantheon Books.
Polletta, Francesca. 1998. “‘It Was Like a Fever . . . ’ Nar-rative and Identity in Social Protest.” Social Problems 45(2):137–59.
Pollitt, Daniel. 1960. “Dime Store Demonstrations: Events and Legal Problems of First Sixty Days.” Duke Law Journal 9(3):315–44.
Rabe-Hesketh, Sophia, and Anders Skrondal. 2008. Mul-tilevel and Longitudinal Modeling Using Stata. Col-lege Station, TX: STATA press.
Rabinowitz, Howard N. 1978. Race Relations in the Urban South, 1865–1890. New York: Oxford Univer-sity Press.
Santoro, Wayne A. 2002. “The Civil Rights Move-ment’s Struggle for Fair Employment: A ‘Dramatic Events-Conventional Politics’ Model.” Social Forces 81(1):177–206.
Santoro, Wayne A. 2008. “The Civil Rights Move-ment and the Right to Vote: Black Protest, Segrega-tionist Violence and the Audience.” Social Forces 86(4):1391–1414.
Schneiberg, Marc, Marissa King, and Thomas Smith. 2008. “Social Movements and Organizational Form: Cooperative Alternatives to Corporations in the American Insurance, Dairy, and Grain Industries.” American Sociological Review 73(4):635–67.
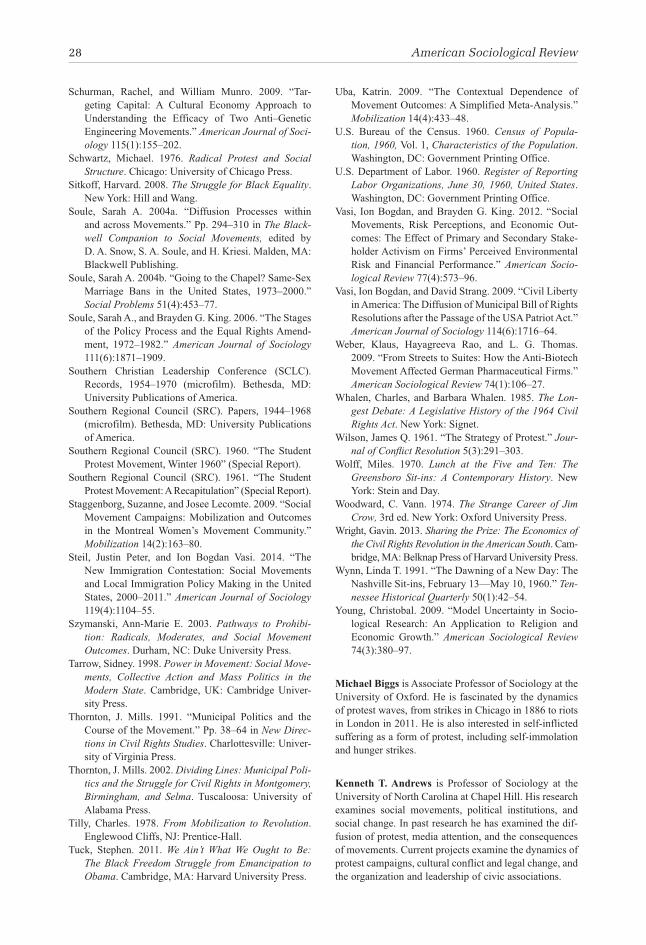
28 American Sociological Review
Schurman, Rachel, and William Munro. 2009. “Tar-geting Capital: A Cultural Economy Approach to Understanding the Efficacy of Two Anti–Genetic Engineering Movements.” American Journal of Soci-ology 115(1):155–202.
Schwartz, Michael. 1976. Radical Protest and Social Structure. Chicago: University of Chicago Press.
Sitkoff, Harvard. 2008. The Struggle for Black Equality. New York: Hill and Wang.
Soule, Sarah A. 2004a. “Diffusion Processes within and across Movements.” Pp. 294–310 in The Black-well Companion to Social Movements, edited by D. A. Snow, S. A. Soule, and H. Kriesi. Malden, MA: Blackwell Publishing.
Soule, Sarah A. 2004b. “Going to the Chapel? Same-Sex Marriage Bans in the United States, 1973–2000.” Social Problems 51(4):453–77.
Soule, Sarah A., and Brayden G. King. 2006. “The Stages of the Policy Process and the Equal Rights Amend-ment, 1972–1982.” American Journal of Sociology 111(6):1871–1909.
Southern Christian Leadership Conference (SCLC). Records, 1954–1970 (microfilm). Bethesda, MD: University Publications of America.
Southern Regional Council (SRC). Papers, 1944–1968 (microfilm). Bethesda, MD: University Publications of America.
Southern Regional Council (SRC). 1960. “The Student Protest Movement, Winter 1960” (Special Report).
Southern Regional Council (SRC). 1961. “The Student Protest Movement: A Recapitulation” (Special Report).
Staggenborg, Suzanne, and Josee Lecomte. 2009. “Social Movement Campaigns: Mobilization and Outcomes in the Montreal Women’s Movement Community.” Mobilization 14(2):163–80.
Steil, Justin Peter, and Ion Bogdan Vasi. 2014. “The New Immigration Contestation: Social Movements and Local Immigration Policy Making in the United States, 2000–2011.” American Journal of Sociology 119(4):1104–55.
Szymanski, Ann-Marie E. 2003. Pathways to Prohibi-tion: Radicals, Moderates, and Social Movement Outcomes. Durham, NC: Duke University Press.
Tarrow, Sidney. 1998. Power in Movement: Social Move-ments, Collective Action and Mass Politics in the Modern State. Cambridge, UK: Cambridge Univer-sity Press.
Thornton, J. Mills. 1991. “Municipal Politics and the Course of the Movement.” Pp. 38–64 in New Direc-tions in Civil Rights Studies. Charlottesville: Univer-sity of Virginia Press.
Thornton, J. Mills. 2002. Dividing Lines: Municipal Poli-tics and the Struggle for Civil Rights in Montgomery, Birmingham, and Selma. Tuscaloosa: University of Alabama Press.
Tilly, Charles. 1978. From Mobilization to Revolution. Englewood Cliffs, NJ: Prentice-Hall.
Tuck, Stephen. 2011. We Ain’t What We Ought to Be: The Black Freedom Struggle from Emancipation to Obama. Cambridge, MA: Harvard University Press.
Uba, Katrin. 2009. “The Contextual Dependence of Movement Outcomes: A Simplified Meta-Analysis.” Mobilization 14(4):433–48.
U.S. Bureau of the Census. 1960. Census of Popula-tion, 1960, Vol. 1, Characteristics of the Population. Washington, DC: Government Printing Office.
U.S. Department of Labor. 1960. Register of Reporting Labor Organizations, June 30, 1960, United States. Washington, DC: Government Printing Office.
Vasi, Ion Bogdan, and Brayden G. King. 2012. “Social Movements, Risk Perceptions, and Economic Out-comes: The Effect of Primary and Secondary Stake-holder Activism on Firms’ Perceived Environmental Risk and Financial Performance.” American Socio-logical Review 77(4):573–96.
Vasi, Ion Bogdan, and David Strang. 2009. “Civil Liberty in America: The Diffusion of Municipal Bill of Rights Resolutions after the Passage of the USA Patriot Act.” American Journal of Sociology 114(6):1716–64.
Weber, Klaus, Hayagreeva Rao, and L. G. Thomas. 2009. “From Streets to Suites: How the Anti-Biotech Movement Affected German Pharmaceutical Firms.” American Sociological Review 74(1):106–27.
Whalen, Charles, and Barbara Whalen. 1985. The Lon-gest Debate: A Legislative History of the 1964 Civil Rights Act. New York: Signet.
Wilson, James Q. 1961. “The Strategy of Protest.” Jour-nal of Conflict Resolution 5(3):291–303.
Wolff, Miles. 1970. Lunch at the Five and Ten: The Greensboro Sit-ins: A Contemporary History. New York: Stein and Day.
Woodward, C. Vann. 1974. The Strange Career of Jim Crow, 3rd ed. New York: Oxford University Press.
Wright, Gavin. 2013. Sharing the Prize: The Economics of the Civil Rights Revolution in the American South. Cam-bridge, MA: Belknap Press of Harvard University Press.
Wynn, Linda T. 1991. “The Dawning of a New Day: The Nashville Sit-ins, February 13—May 10, 1960.” Ten-nessee Historical Quarterly 50(1):42–54.
Young, Christobal. 2009. “Model Uncertainty in Socio-logical Research: An Application to Religion and Economic Growth.” American Sociological Review 74(3):380–97.
Michael Biggs is Associate Professor of Sociology at the University of Oxford. He is fascinated by the dynamics of protest waves, from strikes in Chicago in 1886 to riots in London in 2011. He is also interested in self-inflicted suffering as a form of protest, including self-immolation and hunger strikes.
Kenneth T. Andrews is Professor of Sociology at the University of North Carolina at Chapel Hill. His research examines social movements, political institutions, and social change. In past research he has examined the dif-fusion of protest, media attention, and the consequences of movements. Current projects examine the dynamics of protest campaigns, cultural conflict and legal change, and the organization and leadership of civic associations.