Embed Size (px)
Citation preview
U S C E N S U S B U R E A UHelping You Make Informed Decisions
U.S.Department of CommerceEconomics and Statistics Administration
U.S. CENSUS BUREAU
P20-553
America’s Families and LivingArrangements: 2003Population Characteristics
Issued November 2004
CurrentPopulationReports
By Jason Fields
INTRODUCTION
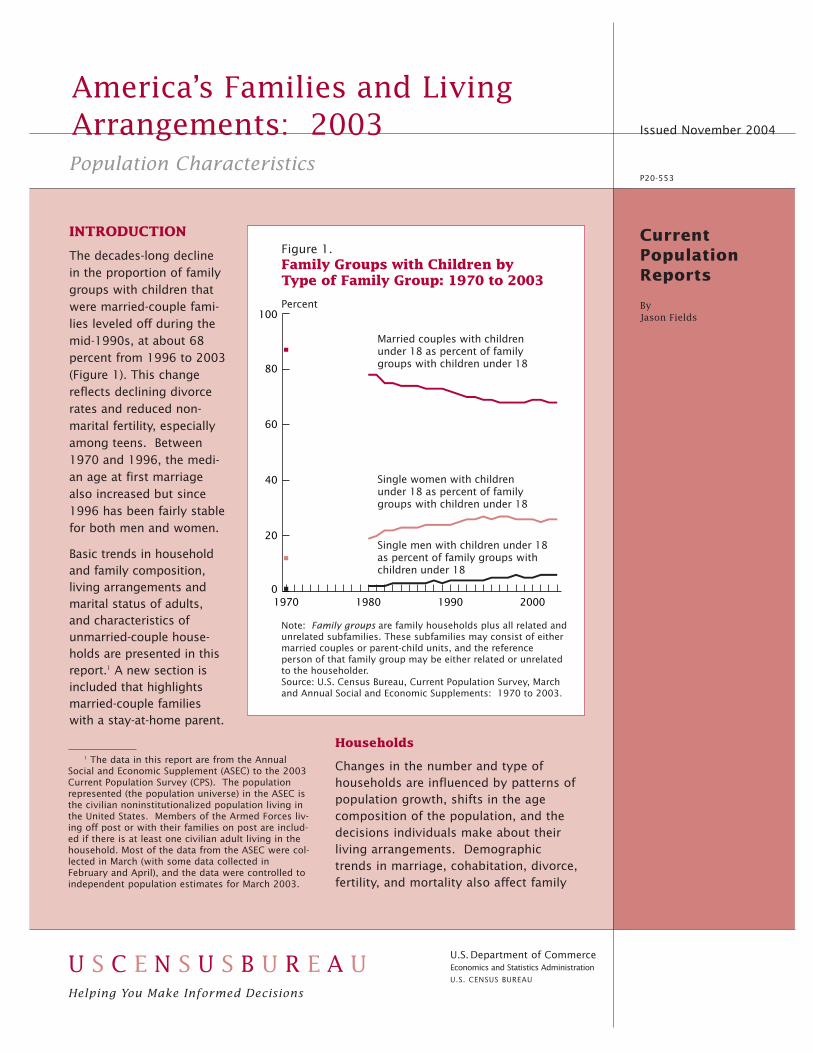
The decades-long declinein the proportion of familygroups with children thatwere married-couple fami-lies leveled off during themid-1990s, at about 68percent from 1996 to 2003(Figure 1). This changereflects declining divorcerates and reduced non-marital fertility, especiallyamong teens. Between1970 and 1996, the medi-an age at first marriagealso increased but since1996 has been fairly stablefor both men and women.
Basic trends in householdand family composition,living arrangements andmarital status of adults,and characteristics ofunmarried-couple house-holds are presented in thisreport.1 A new section isincluded that highlightsmarried-couple familieswith a stay-at-home parent.
1 The data in this report are from the AnnualSocial and Economic Supplement (ASEC) to the 2003Current Population Survey (CPS). The populationrepresented (the population universe) in the ASEC isthe civilian noninstitutionalized population living inthe United States. Members of the Armed Forces liv-ing off post or with their families on post are includ-ed if there is at least one civilian adult living in thehousehold. Most of the data from the ASEC were col-lected in March (with some data collected inFebruary and April), and the data were controlled toindependent population estimates for March 2003.
Households
Changes in the number and type ofhouseholds are influenced by patterns ofpopulation growth, shifts in the agecomposition of the population, and thedecisions individuals make about theirliving arrangements. Demographictrends in marriage, cohabitation, divorce,fertility, and mortality also affect family
Figure 1.Family Groups with Children by Type of Family Group: 1970 to 2003
0
20
40
60
80
100
2000199019801970
Percent
Married couples with children under 18 as percent of family groups with children under 18
Single women with children under 18 as percent of family groups with children under 18
Single men with children under 18 as percent of family groups with children under 18
Note: Family groups are family households plus all related and unrelated subfamilies. These subfamilies may consist of either married couples or parent-child units, and the reference person of that family group may be either related or unrelated to the householder.Source: U.S. Census Bureau, Current Population Survey, March and Annual Social and Economic Supplements: 1970 to 2003.
2 U.S. Census Bureau
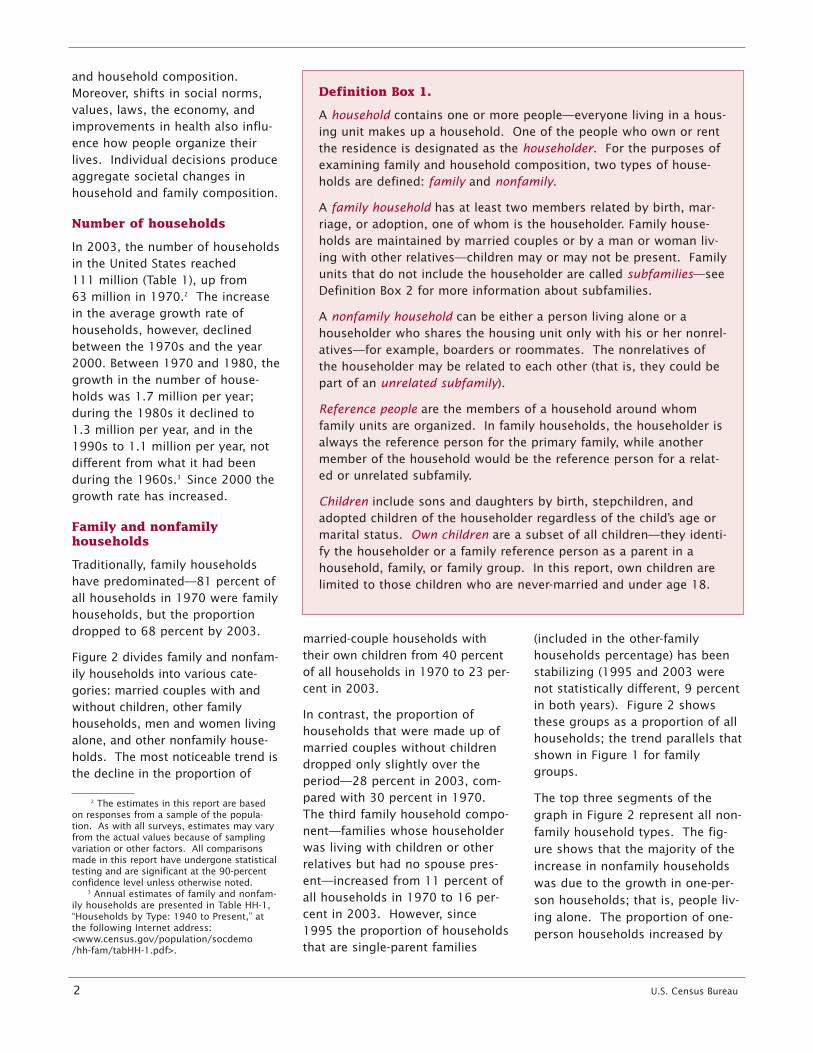
and household composition.Moreover, shifts in social norms,values, laws, the economy, andimprovements in health also influ-ence how people organize theirlives. Individual decisions produceaggregate societal changes inhousehold and family composition.
Number of households
In 2003, the number of householdsin the United States reached 111 million (Table 1), up from 63 million in 1970.2 The increasein the average growth rate ofhouseholds, however, declinedbetween the 1970s and the year2000. Between 1970 and 1980, thegrowth in the number of house-holds was 1.7 million per year;during the 1980s it declined to 1.3 million per year, and in the1990s to 1.1 million per year, notdifferent from what it had beenduring the 1960s.3 Since 2000 thegrowth rate has increased.
Family and nonfamilyhouseholds
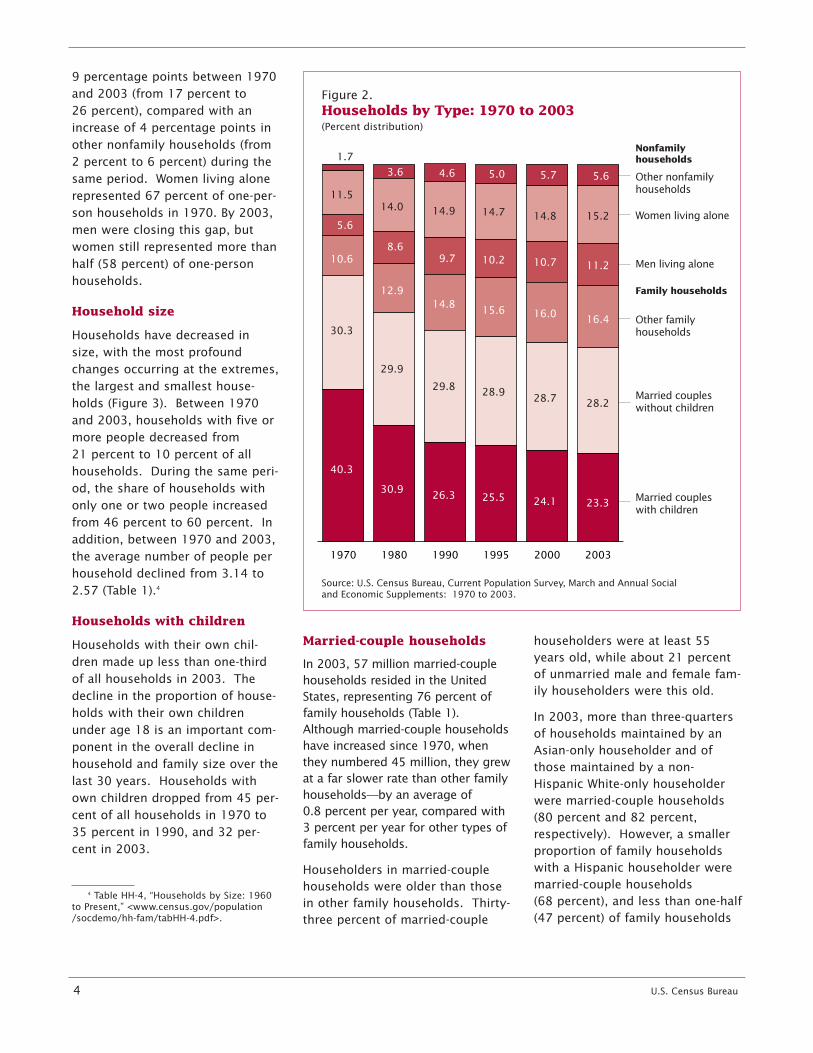
Traditionally, family householdshave predominated—81 percent ofall households in 1970 were familyhouseholds, but the proportiondropped to 68 percent by 2003.
Figure 2 divides family and nonfam-ily households into various cate-gories: married couples with andwithout children, other familyhouseholds, men and women livingalone, and other nonfamily house-holds. The most noticeable trend isthe decline in the proportion of
2 The estimates in this report are basedon responses from a sample of the popula-tion. As with all surveys, estimates may varyfrom the actual values because of samplingvariation or other factors. All comparisonsmade in this report have undergone statisticaltesting and are significant at the 90-percentconfidence level unless otherwise noted.
3 Annual estimates of family and nonfam-ily households are presented in Table HH-1,“Households by Type: 1940 to Present,” atthe following Internet address: <www.census.gov/population/socdemo/hh-fam/tabHH-1.pdf>.
married-couple households with (included in the other-familytheir own children from 40 percent households percentage) has beenof all households in 1970 to 23 per- stabilizing (1995 and 2003 werecent in 2003. not statistically different, 9 percent
in both years). Figure 2 showsIn contrast, the proportion of
these groups as a proportion of allhouseholds that were made up of
households; the trend parallels thatmarried couples without children
shown in Figure 1 for familydropped only slightly over the
groups. period—28 percent in 2003, com-pared with 30 percent in 1970. The top three segments of theThe third family household compo- graph in Figure 2 represent all non-nent—families whose householder family household types. The fig-was living with children or other ure shows that the majority of therelatives but had no spouse pres- increase in nonfamily householdsent—increased from 11 percent of was due to the growth in one-per-all households in 1970 to 16 per- son households; that is, people liv-cent in 2003. However, since ing alone. The proportion of one-1995 the proportion of households person households increased by that are single-parent families
Definition Box 1.
A household contains one or more people—everyone living in a hous-ing unit makes up a household. One of the people who own or rentthe residence is designated as the householder. For the purposes ofexamining family and household composition, two types of house-holds are defined: family and nonfamily.
A family household has at least two members related by birth, mar-riage, or adoption, one of whom is the householder. Family house-holds are maintained by married couples or by a man or woman liv-ing with other relatives—children may or may not be present. Familyunits that do not include the householder are called subfamilies—seeDefinition Box 2 for more information about subfamilies.
A nonfamily household can be either a person living alone or ahouseholder who shares the housing unit only with his or her nonrel-atives—for example, boarders or roommates. The nonrelatives ofthe householder may be related to each other (that is, they could bepart of an unrelated subfamily).
Reference people are the members of a household around whomfamily units are organized. In family households, the householder isalways the reference person for the primary family, while anothermember of the household would be the reference person for a relat-ed or unrelated subfamily.
Children include sons and daughters by birth, stepchildren, andadopted children of the householder regardless of the child’s age ormarital status. Own children are a subset of all children—they identi-fy the householder or a family reference person as a parent in ahousehold, family, or family group. In this report, own children arelimited to those children who are never-married and under age 18.
U.S. Census Bureau 3
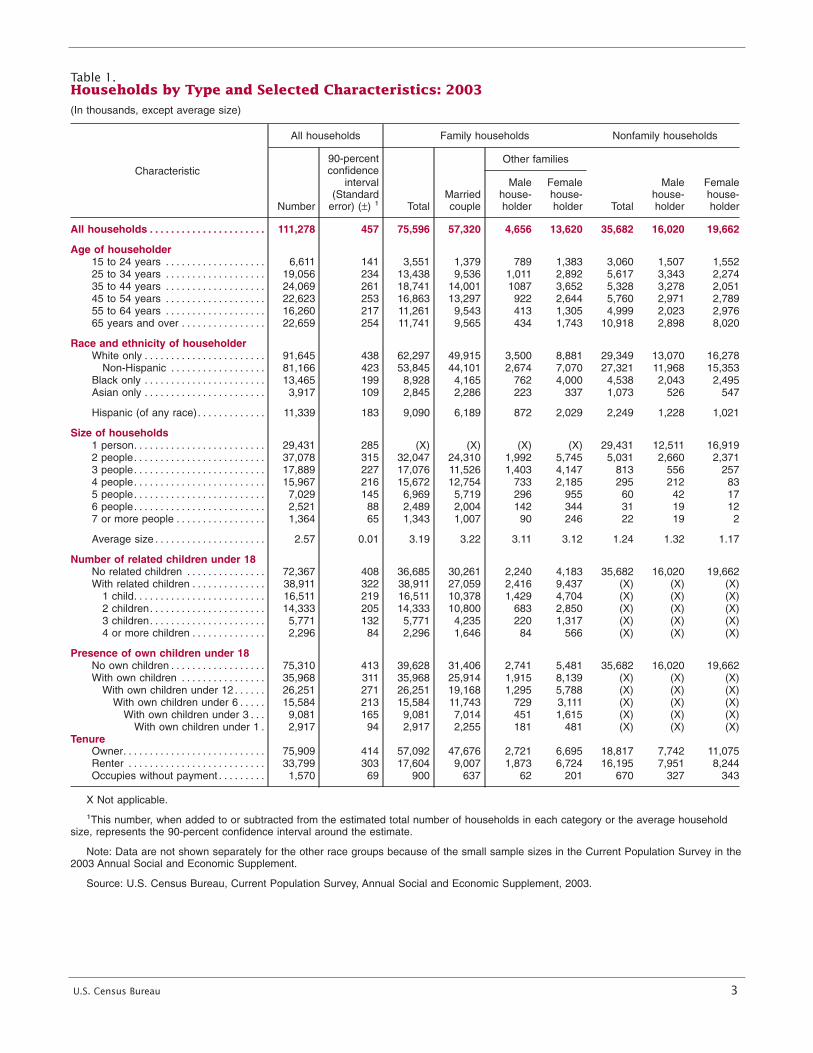
Table 1.Households by Type and Selected Characteristics: 2003(In thousands, except average size)
Characteristic
All households Family households Nonfamily households
Number
90-percentconfidence
interval(Standard
error) (±) 1 TotalMarriedcouple
Other families
Total
Malehouse-holder
Femalehouse-holder
Malehouse-holder
Femalehouse-holder
All households . . . . . . . . . . . . . . . . . . . . . .
Age of householder
111,278 457 75,596 57,320 4,656 13,620 35,682 16,020 19,662
15 to 24 years . . . . . . . . . . . . . . . . . . . 6,611 141 3,551 1,379 789 1,383 3,060 1,507 1,55225 to 34 years . . . . . . . . . . . . . . . . . . . 19,056 234 13,438 9,536 1,011 2,892 5,617 3,343 2,27435 to 44 years . . . . . . . . . . . . . . . . . . . 24,069 261 18,741 14,001 1087 3,652 5,328 3,278 2,05145 to 54 years . . . . . . . . . . . . . . . . . . . 22,623 253 16,863 13,297 922 2,644 5,760 2,971 2,78955 to 64 years . . . . . . . . . . . . . . . . . . . 16,260 217 11,261 9,543 413 1,305 4,999 2,023 2,97665 years and over . . . . . . . . . . . . . . . .
Race and ethnicity of householder
22,659 254 11,741 9,565 434 1,743 10,918 2,898 8,020
White only . . . . . . . . . . . . . . . . . . . . . . . 91,645 438 62,297 49,915 3,500 8,881 29,349 13,070 16,278Non-Hispanic . . . . . . . . . . . . . . . . . . 81,166 423 53,845 44,101 2,674 7,070 27,321 11,968 15,353
Black only . . . . . . . . . . . . . . . . . . . . . . . 13,465 199 8,928 4,165 762 4,000 4,538 2,043 2,495Asian only . . . . . . . . . . . . . . . . . . . . . . . 3,917 109 2,845 2,286 223 337 1,073 526 547
Hispanic (of any race). . . . . . . . . . . . .
Size of households
11,339 183 9,090 6,189 872 2,029 2,249 1,228 1,021
1 person. . . . . . . . . . . . . . . . . . . . . . . . . 29,431 285 (X) (X) (X) (X) 29,431 12,511 16,9192 people. . . . . . . . . . . . . . . . . . . . . . . . . 37,078 315 32,047 24,310 1,992 5,745 5,031 2,660 2,3713 people. . . . . . . . . . . . . . . . . . . . . . . . . 17,889 227 17,076 11,526 1,403 4,147 813 556 2574 people. . . . . . . . . . . . . . . . . . . . . . . . . 15,967 216 15,672 12,754 733 2,185 295 212 835 people. . . . . . . . . . . . . . . . . . . . . . . . . 7,029 145 6,969 5,719 296 955 60 42 176 people. . . . . . . . . . . . . . . . . . . . . . . . . 2,521 88 2,489 2,004 142 344 31 19 127 or more people . . . . . . . . . . . . . . . . . 1,364 65 1,343 1,007 90 246 22 19 2
Average size . . . . . . . . . . . . . . . . . . . . .
Number of related children under 18
2.57 0.01 3.19 3.22 3.11 3.12 1.24 1.32 1.17
No related children . . . . . . . . . . . . . . . 72,367 408 36,685 30,261 2,240 4,183 35,682 16,020 19,662With related children . . . . . . . . . . . . . . 38,911 322 38,911 27,059 2,416 9,437 (X) (X) (X)
1 child. . . . . . . . . . . . . . . . . . . . . . . . . 16,511 219 16,511 10,378 1,429 4,704 (X) (X) (X)2 children. . . . . . . . . . . . . . . . . . . . . . 14,333 205 14,333 10,800 683 2,850 (X) (X) (X)3 children. . . . . . . . . . . . . . . . . . . . . . 5,771 132 5,771 4,235 220 1,317 (X) (X) (X)4 or more children . . . . . . . . . . . . . .
Presence of own children under 18
2,296 84 2,296 1,646 84 566 (X) (X) (X)
No own children . . . . . . . . . . . . . . . . . . 75,310 413 39,628 31,406 2,741 5,481 35,682 16,020 19,662With own children . . . . . . . . . . . . . . . . 35,968 311 35,968 25,914 1,915 8,139 (X) (X) (X)
With own children under 12 . . . . . . 26,251 271 26,251 19,168 1,295 5,788 (X) (X) (X)With own children under 6 . . . . . 15,584 213 15,584 11,743 729 3,111 (X) (X) (X)
With own children under 3 . . . 9,081 165 9,081 7,014 451 1,615 (X) (X) (X)With own children under 1 .
Tenure2,917 94 2,917 2,255 181 481 (X) (X) (X)
Owner. . . . . . . . . . . . . . . . . . . . . . . . . . . 75,909 414 57,092 47,676 2,721 6,695 18,817 7,742 11,075Renter . . . . . . . . . . . . . . . . . . . . . . . . . . 33,799 303 17,604 9,007 1,873 6,724 16,195 7,951 8,244Occupies without payment . . . . . . . . . 1,570 69 900 637 62 201 670 327 343
X Not applicable.
1This number, when added to or subtracted from the estimated total number of households in each category or the average householdsize, represents the 90-percent confidence interval around the estimate.
Note: Data are not shown separately for the other race groups because of the small sample sizes in the Current Population Survey in the2003 Annual Social and Economic Supplement.
Source: U.S. Census Bureau, Current Population Survey, Annual Social and Economic Supplement, 2003.
4 U.S. Census Bureau
9 percentage points between 1970and 2003 (from 17 percent to 26 percent), compared with anincrease of 4 percentage points inother nonfamily households (from2 percent to 6 percent) during thesame period. Women living alonerepresented 67 percent of one-per-son households in 1970. By 2003,men were closing this gap, butwomen still represented more thanhalf (58 percent) of one-personhouseholds.
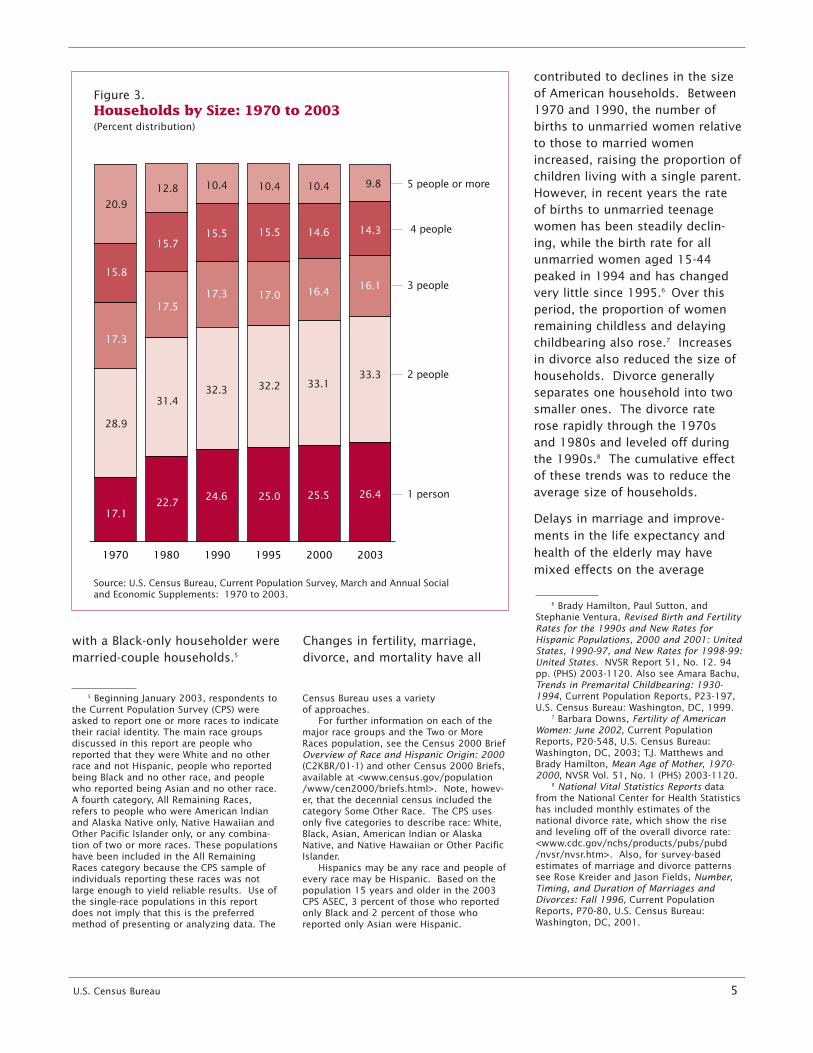
Household size
Households have decreased insize, with the most profoundchanges occurring at the extremes,the largest and smallest house-holds (Figure 3). Between 1970and 2003, households with five ormore people decreased from 21 percent to 10 percent of allhouseholds. During the same peri-od, the share of households withonly one or two people increasedfrom 46 percent to 60 percent. Inaddition, between 1970 and 2003,the average number of people perhousehold declined from 3.14 to2.57 (Table 1).4
Households with children
Households with their own chil-dren made up less than one-thirdof all households in 2003. Thedecline in the proportion of house-holds with their own childrenunder age 18 is an important com-ponent in the overall decline inhousehold and family size over thelast 30 years. Households withown children dropped from 45 per-cent of all households in 1970 to35 percent in 1990, and 32 per-cent in 2003.
4 Table HH-4, “Households by Size: 1960to Present,” <www.census.gov/population/socdemo/hh-fam/tabHH-4.pdf>.
Married-couple households householders were at least 55years old, while about 21 percentIn 2003, 57 million married-coupleof unmarried male and female fam-households resided in the Unitedily householders were this old. States, representing 76 percent of
family households (Table 1). In 2003, more than three-quartersAlthough married-couple households of households maintained by anhave increased since 1970, when Asian-only householder and ofthey numbered 45 million, they grew those maintained by a non-at a far slower rate than other family Hispanic White-only householderhouseholds—by an average of were married-couple households0.8 percent per year, compared with (80 percent and 82 percent,3 percent per year for other types of respectively). However, a smallerfamily households. proportion of family households
Householders in married-couple with a Hispanic householder were
households were older than those married-couple households
in other family households. Thirty- (68 percent), and less than one-half
three percent of married-couple (47 percent) of family households
Figure 2.Households by Type: 1970 to 2003
Source: U.S. Census Bureau, Current Population Survey, March and Annual Social and Economic Supplements: 1970 to 2003.
(Percent distribution)
200320001995199019801970
Men living alone
40.3
30.9 26.3 25.5 24.1 23.3
30.3
29.9
29.8 28.9 28.7 28.2
10.6
12.9 14.8 15.6 16.0 16.4
5.6
8.6 9.7 10.2 10.7 11.2
11.5 14.0 14.9 14.7 14.8 15.2
1.7 3.6 4.6 5.0 5.7 5.6
Nonfamily households
Family households
Other family households
Married couples without children
Married couples with children
Other nonfamily households
Women living alone
U.S. Census Bureau 5
with a Black-only householder weremarried-couple households.5
5 Beginning January 2003, respondents tothe Current Population Survey (CPS) wereasked to report one or more races to indicatetheir racial identity. The main race groupsdiscussed in this report are people whoreported that they were White and no otherrace and not Hispanic, people who reportedbeing Black and no other race, and peoplewho reported being Asian and no other race.A fourth category, All Remaining Races,refers to people who were American Indianand Alaska Native only, Native Hawaiian andOther Pacific Islander only, or any combina-tion of two or more races. These populationshave been included in the All RemainingRaces category because the CPS sample ofindividuals reporting these races was notlarge enough to yield reliable results. Use ofthe single-race populations in this reportdoes not imply that this is the preferredmethod of presenting or analyzing data. The
Changes in fertility, marriage,divorce, and mortality have all
Census Bureau uses a variety of approaches.
For further information on each of themajor race groups and the Two or MoreRaces population, see the Census 2000 BriefOverview of Race and Hispanic Origin: 2000(C2KBR/01-1) and other Census 2000 Briefs,available at <www.census.gov/population/www/cen2000/briefs.html>. Note, howev-er, that the decennial census included thecategory Some Other Race. The CPS usesonly five categories to describe race: White,Black, Asian, American Indian or AlaskaNative, and Native Hawaiian or Other PacificIslander.
Hispanics may be any race and people ofevery race may be Hispanic. Based on thepopulation 15 years and older in the 2003CPS ASEC, 3 percent of those who reportedonly Black and 2 percent of those whoreported only Asian were Hispanic.
contributed to declines in the sizeof American households. Between1970 and 1990, the number ofbirths to unmarried women relativeto those to married womenincreased, raising the proportion ofchildren living with a single parent.However, in recent years the rateof births to unmarried teenagewomen has been steadily declin-ing, while the birth rate for allunmarried women aged 15-44peaked in 1994 and has changedvery little since 1995.6 Over thisperiod, the proportion of womenremaining childless and delayingchildbearing also rose.7 Increasesin divorce also reduced the size ofhouseholds. Divorce generallyseparates one household into twosmaller ones. The divorce raterose rapidly through the 1970sand 1980s and leveled off duringthe 1990s.8 The cumulative effectof these trends was to reduce theaverage size of households.
Delays in marriage and improve-ments in the life expectancy andhealth of the elderly may havemixed effects on the average
6 Brady Hamilton, Paul Sutton, andStephanie Ventura, Revised Birth and FertilityRates for the 1990s and New Rates forHispanic Populations, 2000 and 2001: UnitedStates, 1990-97, and New Rates for 1998-99:United States. NVSR Report 51, No. 12. 94pp. (PHS) 2003-1120. Also see Amara Bachu,Trends in Premarital Childbearing: 1930-1994, Current Population Reports, P23-197,U.S. Census Bureau: Washington, DC, 1999.
7 Barbara Downs, Fertility of AmericanWomen: June 2002, Current PopulationReports, P20-548, U.S. Census Bureau:Washington, DC, 2003; T.J. Matthews andBrady Hamilton, Mean Age of Mother, 1970-2000, NVSR Vol. 51, No. 1 (PHS) 2003-1120.
8 National Vital Statistics Reports datafrom the National Center for Health Statisticshas included monthly estimates of thenational divorce rate, which show the riseand leveling off of the overall divorce rate:<www.cdc.gov/nchs/products/pubs/pubd/nvsr/nvsr.htm>. Also, for survey-basedestimates of marriage and divorce patternssee Rose Kreider and Jason Fields, Number,Timing, and Duration of Marriages andDivorces: Fall 1996, Current PopulationReports, P70-80, U.S. Census Bureau:Washington, DC, 2001.
Figure 3.Households by Size: 1970 to 2003
Source: U.S. Census Bureau, Current Population Survey, March and Annual Social and Economic Supplements: 1970 to 2003.
(Percent distribution)
200320001995199019801970
5 people or more
1 person
2 people
3 people
4 people
9.8
17.1
28.9
17.3
15.8
20.9
22.7
31.4
17.5
15.7
12.8
24.6
32.3
17.3
15.5
10.4
25.0
32.2
17.0
15.5
10.4
25.5
33.1
16.4
14.6
10.4
26.4
33.3
16.1
14.3
6 U.S. Census Bureau
household size. Delays in mar-riage may increase the number ofone-person households if youngadults live independently forlonger periods, but it may alsoincrease the size of other house-holds if young adults either returnto or stay in their parents’ house-holds or live with roommates forlonger periods before marrying.Better health status of the elderlycould increase the number of mar-ried couples, if both men andwomen live longer, or couldincrease the number of one-personhouseholds, as survivors may liveindependently for longer periodsof time.
Families and family groups
The family is a vital institution inAmerican society. Families areoften the first and frequently thelast source of support for individu-als. To measure the demographicchanges and characteristics of fami-lies, the Census Bureau developedtwo different conceptual universes,family households and familygroups. Family households areidentified by members who arerelated to the householder. Familyunits (by marriage or parenthood)in the household that do not direct-ly include the householder arecalled subfamilies, and they can beeither related to the householder ornot. An example of a related sub-family is a child and that child’sspouse living in the child’s parents’household. Married couples or par-ents and children who are not relat-ed to the householder would beunrelated subfamilies. The count offamily units regardless of whetherthe householder is in that “family” isa count of “family groups.” In2003, there were 76 million familyhouseholds and 79 million familygroups (Table 2). The additionalfamily groups were largely relatedsubfamilies (3 million), with
525,000 additional unrelatedsubfamilies.
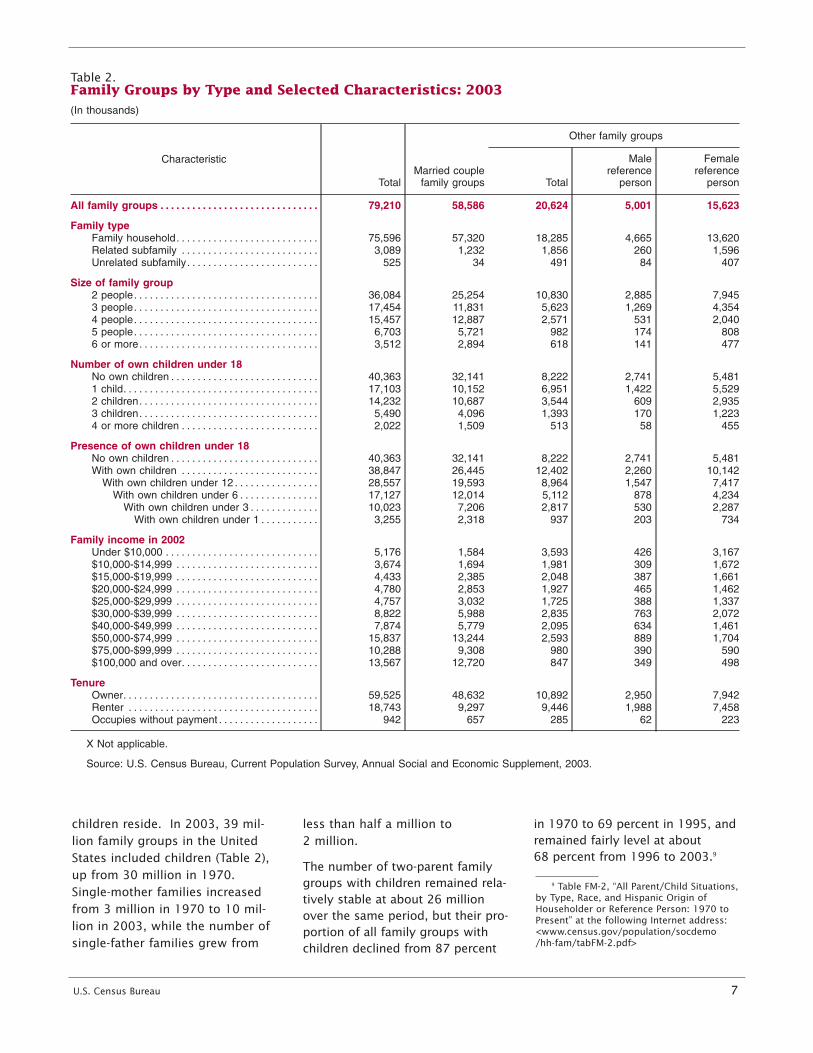
In 2003, 49 percent of the 79 mil-lion family groups in the UnitedStates included own children—45 percent of married-couple fami-ly groups and 60 percent of non-married-couple family groupsincluded an own child under age18 (Table 2). As was the case withhouseholds, much of the change inthe composition of family groupsoccurred among larger families.For example, among family groupswith children, the percentage withfour or more children decreasedfrom 17 percent in 1970, to 8 per-cent in 1980, to 5 percent in 1990and in 2003. In 2003, 33 percentof married-couple family groupsand 31 percent of those with amale reference person includedown children under 12, while 48 percent of family groups with afemale reference person includedown children under 12.
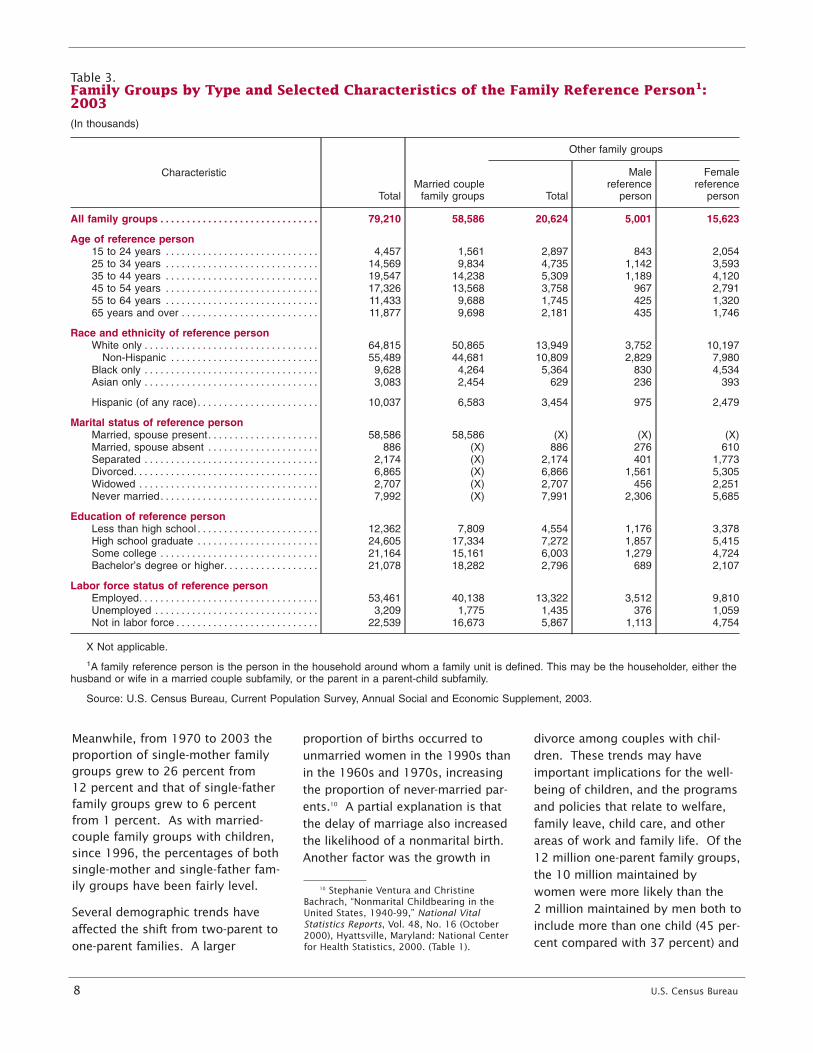
Reference people in married-couplefamily groups also had higher lev-els of completed education thaneither male or female referencepeople in other family groups. In2003, 31 percent of the referencepeople in married-couple familygroups had graduated from
college, and 57 percent hadattended college, compared with14 percent and 43 percent, respec-tively, for the reference people inother family groups (Table 3).Reference people in married-couplefamily groups and male-maintainedfamily groups were more likely tobe employed (69 percent and 70 percent, respectively) thanthose in family groups maintainedby women (63 percent). Thirty-onepercent of reference people inmale-maintained family groups and34 percent of reference people infemale-maintained family groupswere divorced; another 46 percentin male-maintained, and 36 percentin female-maintained, familygroups were never married.
Most married-couple family groups(83 percent) lived in householdsthat were owned or being boughtby the householder (Table 2). Muchsmaller proportions of other typesof family groups lived in house-holds that were owned or beingbought by the householder (59 per-cent and 51 percent, respectively).
One-parent family groups
Another way of looking at familychange is to examine the maritalstatus of the parents with whom
Definition Box 2.
Households can contain more than one married-couple or single-parentfamily, and nonfamily households can contain families that are notrelated to the householder. In 1970, the Census Bureau developed theconcept of the family group to count all of these types of families.
Family groups are family households plus all related and unrelatedsubfamilies. These subfamilies may consist of either married cou-ples or parent-child units. The reference person of the subfamilygroup may be either related or unrelated to the householder, and ifunrelated, live in either a family or nonfamily household. An individ-ual may be counted in two different family groups. For example, awoman may be the daughter of a householder and also the motherof her own daughter living in the household, which would constitutea related mother-child subfamily.
U.S. Census Bureau 7
children reside. In 2003, 39 mil- less than half a million to lion family groups in the United 2 million. States included children (Table 2),
The number of two-parent familyup from 30 million in 1970.
groups with children remained rela-Single-mother families increased
tively stable at about 26 millionfrom 3 million in 1970 to 10 mil- over the same period, but their pro-lion in 2003, while the number of portion of all family groups withsingle-father families grew from children declined from 87 percent
in 1970 to 69 percent in 1995, andremained fairly level at about 68 percent from 1996 to 2003.9
9 Table FM-2, “All Parent/Child Situations,by Type, Race, and Hispanic Origin ofHouseholder or Reference Person: 1970 toPresent” at the following Internet address:<www.census.gov/population/socdemo/hh-fam/tabFM-2.pdf>
Table 2.Family Groups by Type and Selected Characteristics: 2003(In thousands)
Characteristic
TotalMarried couple
family groups
Other family groups
Total
Malereference
person
Femalereference
person
All family groups . . . . . . . . . . . . . . . . . . . . . . . . . . . . . .
Family type
79,210 58,586 20,624 5,001 15,623
Family household. . . . . . . . . . . . . . . . . . . . . . . . . . . 75,596 57,320 18,285 4,665 13,620Related subfamily . . . . . . . . . . . . . . . . . . . . . . . . . . 3,089 1,232 1,856 260 1,596Unrelated subfamily. . . . . . . . . . . . . . . . . . . . . . . . .
Size of family group
525 34 491 84 407
2 people. . . . . . . . . . . . . . . . . . . . . . . . . . . . . . . . . . . 36,084 25,254 10,830 2,885 7,9453 people. . . . . . . . . . . . . . . . . . . . . . . . . . . . . . . . . . . 17,454 11,831 5,623 1,269 4,3544 people. . . . . . . . . . . . . . . . . . . . . . . . . . . . . . . . . . . 15,457 12,887 2,571 531 2,0405 people. . . . . . . . . . . . . . . . . . . . . . . . . . . . . . . . . . . 6,703 5,721 982 174 8086 or more. . . . . . . . . . . . . . . . . . . . . . . . . . . . . . . . . .
Number of own children under 18
3,512 2,894 618 141 477
No own children . . . . . . . . . . . . . . . . . . . . . . . . . . . . 40,363 32,141 8,222 2,741 5,4811 child. . . . . . . . . . . . . . . . . . . . . . . . . . . . . . . . . . . . . 17,103 10,152 6,951 1,422 5,5292 children. . . . . . . . . . . . . . . . . . . . . . . . . . . . . . . . . . 14,232 10,687 3,544 609 2,9353 children. . . . . . . . . . . . . . . . . . . . . . . . . . . . . . . . . . 5,490 4,096 1,393 170 1,2234 or more children . . . . . . . . . . . . . . . . . . . . . . . . . .
Presence of own children under 18
2,022 1,509 513 58 455
No own children . . . . . . . . . . . . . . . . . . . . . . . . . . . . 40,363 32,141 8,222 2,741 5,481With own children . . . . . . . . . . . . . . . . . . . . . . . . . . 38,847 26,445 12,402 2,260 10,142
With own children under 12 . . . . . . . . . . . . . . . . 28,557 19,593 8,964 1,547 7,417With own children under 6 . . . . . . . . . . . . . . . 17,127 12,014 5,112 878 4,234
With own children under 3 . . . . . . . . . . . . . 10,023 7,206 2,817 530 2,287With own children under 1 . . . . . . . . . . .
Family income in 2002
3,255 2,318 937 203 734
Under $10,000 . . . . . . . . . . . . . . . . . . . . . . . . . . . . . 5,176 1,584 3,593 426 3,167$10,000-$14,999 . . . . . . . . . . . . . . . . . . . . . . . . . . . 3,674 1,694 1,981 309 1,672$15,000-$19,999 . . . . . . . . . . . . . . . . . . . . . . . . . . . 4,433 2,385 2,048 387 1,661$20,000-$24,999 . . . . . . . . . . . . . . . . . . . . . . . . . . . 4,780 2,853 1,927 465 1,462$25,000-$29,999 . . . . . . . . . . . . . . . . . . . . . . . . . . . 4,757 3,032 1,725 388 1,337$30,000-$39,999 . . . . . . . . . . . . . . . . . . . . . . . . . . . 8,822 5,988 2,835 763 2,072$40,000-$49,999 . . . . . . . . . . . . . . . . . . . . . . . . . . . 7,874 5,779 2,095 634 1,461$50,000-$74,999 . . . . . . . . . . . . . . . . . . . . . . . . . . . 15,837 13,244 2,593 889 1,704$75,000-$99,999 . . . . . . . . . . . . . . . . . . . . . . . . . . . 10,288 9,308 980 390 590$100,000 and over. . . . . . . . . . . . . . . . . . . . . . . . . .
Tenure
13,567 12,720 847 349 498
Owner. . . . . . . . . . . . . . . . . . . . . . . . . . . . . . . . . . . . . 59,525 48,632 10,892 2,950 7,942Renter . . . . . . . . . . . . . . . . . . . . . . . . . . . . . . . . . . . . 18,743 9,297 9,446 1,988 7,458Occupies without payment . . . . . . . . . . . . . . . . . . . 942 657 285 62 223
X Not applicable.
Source: U.S. Census Bureau, Current Population Survey, Annual Social and Economic Supplement, 2003.
8 U.S. Census Bureau
Meanwhile, from 1970 to 2003 theproportion of single-mother familygroups grew to 26 percent from 12 percent and that of single-fatherfamily groups grew to 6 percentfrom 1 percent. As with married-couple family groups with children,since 1996, the percentages of bothsingle-mother and single-father fam-ily groups have been fairly level.
Several demographic trends haveaffected the shift from two-parent toone-parent families. A larger
proportion of births occurred tounmarried women in the 1990s thanin the 1960s and 1970s, increasingthe proportion of never-married par-ents.10 A partial explanation is thatthe delay of marriage also increasedthe likelihood of a nonmarital birth.Another factor was the growth in
10 Stephanie Ventura and ChristineBachrach, “Nonmarital Childbearing in theUnited States, 1940-99,” National VitalStatistics Reports, Vol. 48, No. 16 (October2000), Hyattsville, Maryland: National Centerfor Health Statistics, 2000. (Table 1).
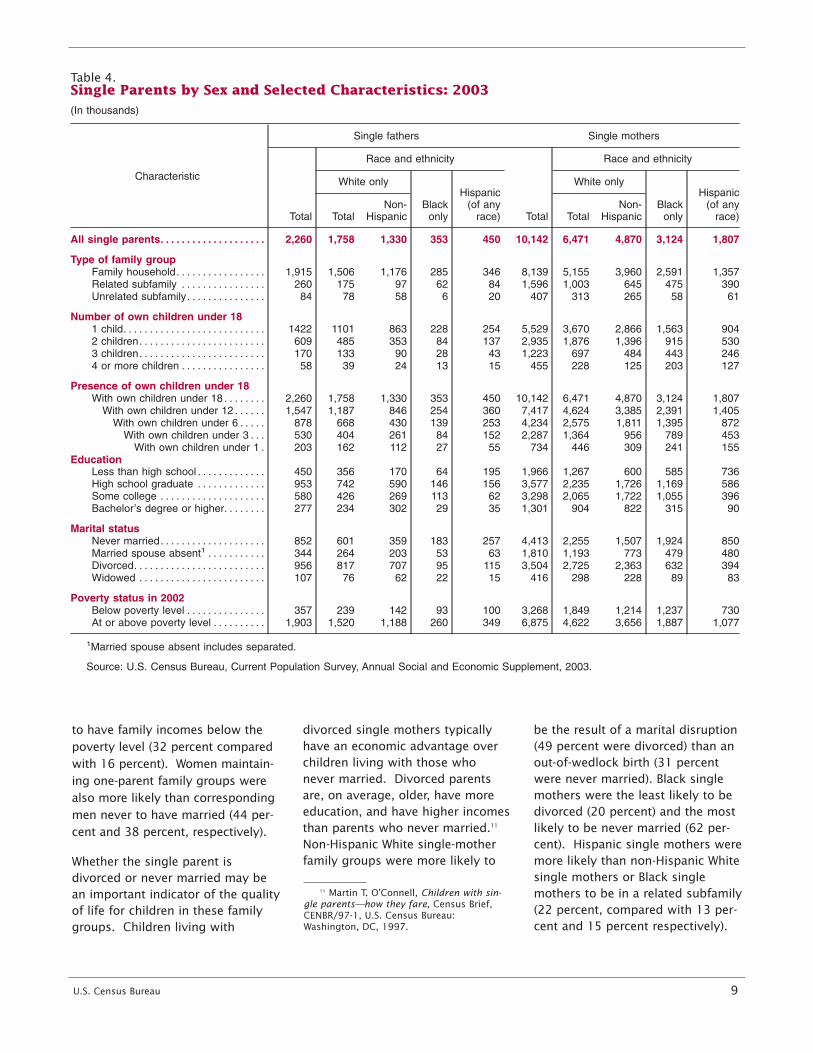
divorce among couples with chil-dren. These trends may haveimportant implications for the well-being of children, and the programsand policies that relate to welfare,family leave, child care, and otherareas of work and family life. Of the 12 million one-parent family groups,the 10 million maintained bywomen were more likely than the 2 million maintained by men both toinclude more than one child (45 per-cent compared with 37 percent) and
Table 3.Family Groups by Type and Selected Characteristics of the Family Reference Person1:2003(In thousands)
Characteristic
TotalMarried couple
family groups
Other family groups
Total
Malereference
person
Femalereference
person
All family groups . . . . . . . . . . . . . . . . . . . . . . . . . . . . . .
Age of reference person
79,210 58,586 20,624 5,001 15,623
15 to 24 years . . . . . . . . . . . . . . . . . . . . . . . . . . . . . 4,457 1,561 2,897 843 2,05425 to 34 years . . . . . . . . . . . . . . . . . . . . . . . . . . . . . 14,569 9,834 4,735 1,142 3,59335 to 44 years . . . . . . . . . . . . . . . . . . . . . . . . . . . . . 19,547 14,238 5,309 1,189 4,12045 to 54 years . . . . . . . . . . . . . . . . . . . . . . . . . . . . . 17,326 13,568 3,758 967 2,79155 to 64 years . . . . . . . . . . . . . . . . . . . . . . . . . . . . . 11,433 9,688 1,745 425 1,32065 years and over . . . . . . . . . . . . . . . . . . . . . . . . . .
Race and ethnicity of reference person
11,877 9,698 2,181 435 1,746
White only . . . . . . . . . . . . . . . . . . . . . . . . . . . . . . . . . 64,815 50,865 13,949 3,752 10,197Non-Hispanic . . . . . . . . . . . . . . . . . . . . . . . . . . . . 55,489 44,681 10,809 2,829 7,980
Black only . . . . . . . . . . . . . . . . . . . . . . . . . . . . . . . . . 9,628 4,264 5,364 830 4,534Asian only . . . . . . . . . . . . . . . . . . . . . . . . . . . . . . . . . 3,083 2,454 629 236 393
Hispanic (of any race). . . . . . . . . . . . . . . . . . . . . . .
Marital status of reference person
10,037 6,583 3,454 975 2,479
Married, spouse present. . . . . . . . . . . . . . . . . . . . . 58,586 58,586 (X) (X) (X)Married, spouse absent . . . . . . . . . . . . . . . . . . . . . 886 (X) 886 276 610Separated . . . . . . . . . . . . . . . . . . . . . . . . . . . . . . . . . 2,174 (X) 2,174 401 1,773Divorced. . . . . . . . . . . . . . . . . . . . . . . . . . . . . . . . . . . 6,865 (X) 6,866 1,561 5,305Widowed . . . . . . . . . . . . . . . . . . . . . . . . . . . . . . . . . . 2,707 (X) 2,707 456 2,251Never married. . . . . . . . . . . . . . . . . . . . . . . . . . . . . .
Education of reference person
7,992 (X) 7,991 2,306 5,685
Less than high school . . . . . . . . . . . . . . . . . . . . . . . 12,362 7,809 4,554 1,176 3,378High school graduate . . . . . . . . . . . . . . . . . . . . . . . 24,605 17,334 7,272 1,857 5,415Some college . . . . . . . . . . . . . . . . . . . . . . . . . . . . . . 21,164 15,161 6,003 1,279 4,724Bachelor’s degree or higher. . . . . . . . . . . . . . . . . .
Labor force status of reference person
21,078 18,282 2,796 689 2,107
Employed. . . . . . . . . . . . . . . . . . . . . . . . . . . . . . . . . . 53,461 40,138 13,322 3,512 9,810Unemployed . . . . . . . . . . . . . . . . . . . . . . . . . . . . . . . 3,209 1,775 1,435 376 1,059Not in labor force . . . . . . . . . . . . . . . . . . . . . . . . . . . 22,539 16,673 5,867 1,113 4,754
X Not applicable.
1A family reference person is the person in the household around whom a family unit is defined. This may be the householder, either thehusband or wife in a married couple subfamily, or the parent in a parent-child subfamily.
Source: U.S. Census Bureau, Current Population Survey, Annual Social and Economic Supplement, 2003.
U.S. Census Bureau 9
to have family incomes below thepoverty level (32 percent comparedwith 16 percent). Women maintain-ing one-parent family groups werealso more likely than correspondingmen never to have married (44 per-cent and 38 percent, respectively).
Whether the single parent isdivorced or never married may bean important indicator of the qualityof life for children in these familygroups. Children living with
divorced single mothers typicallyhave an economic advantage overchildren living with those whonever married. Divorced parentsare, on average, older, have moreeducation, and have higher incomesthan parents who never married.11
Non-Hispanic White single-motherfamily groups were more likely to
11 Martin T. O’Connell, Children with sin-gle parents—how they fare, Census Brief,CENBR/97-1, U.S. Census Bureau:Washington, DC, 1997.
be the result of a marital disruption(49 percent were divorced) than anout-of-wedlock birth (31 percentwere never married). Black singlemothers were the least likely to bedivorced (20 percent) and the mostlikely to be never married (62 per-cent). Hispanic single mothers weremore likely than non-Hispanic Whitesingle mothers or Black singlemothers to be in a related subfamily (22 percent, compared with 13 per-cent and 15 percent respectively).
Table 4.Single Parents by Sex and Selected Characteristics: 2003(In thousands)
Single fathers Single mothers
Race and ethnicity Race and ethnicity
Characteristic
Total
White only
Blackonly
Hispanic(of any
race) Total
White only
Blackonly
Hispanic(of any
race)TotalNon-
Hispanic TotalNon-
Hispanic
All single parents. . . . . . . . . . . . . . . . . . . .
Type of family group
2,260 1,758 1,330 353 450 10,142 6,471 4,870 3,124 1,807
Family household. . . . . . . . . . . . . . . . . 1,915 1,506 1,176 285 346 8,139 5,155 3,960 2,591 1,357Related subfamily . . . . . . . . . . . . . . . . 260 175 97 62 84 1,596 1,003 645 475 390Unrelated subfamily. . . . . . . . . . . . . . .
Number of own children under 18
84 78 58 6 20 407 313 265 58 61
1 child. . . . . . . . . . . . . . . . . . . . . . . . . . . 1422 1101 863 228 254 5,529 3,670 2,866 1,563 9042 children. . . . . . . . . . . . . . . . . . . . . . . . 609 485 353 84 137 2,935 1,876 1,396 915 5303 children. . . . . . . . . . . . . . . . . . . . . . . . 170 133 90 28 43 1,223 697 484 443 2464 or more children . . . . . . . . . . . . . . . .
Presence of own children under 18
58 39 24 13 15 455 228 125 203 127
With own children under 18 . . . . . . . . 2,260 1,758 1,330 353 450 10,142 6,471 4,870 3,124 1,807With own children under 12 . . . . . . 1,547 1,187 846 254 360 7,417 4,624 3,385 2,391 1,405
With own children under 6 . . . . . 878 668 430 139 253 4,234 2,575 1,811 1,395 872With own children under 3 . . . 530 404 261 84 152 2,287 1,364 956 789 453
With own children under 1 .Education
203 162 112 27 55 734 446 309 241 155
Less than high school . . . . . . . . . . . . . 450 356 170 64 195 1,966 1,267 600 585 736High school graduate . . . . . . . . . . . . . 953 742 590 146 156 3,577 2,235 1,726 1,169 586Some college . . . . . . . . . . . . . . . . . . . . 580 426 269 113 62 3,298 2,065 1,722 1,055 396Bachelor’s degree or higher. . . . . . . .
Marital status
277 234 302 29 35 1,301 904 822 315 90
Never married. . . . . . . . . . . . . . . . . . . . 852 601 359 183 257 4,413 2,255 1,507 1,924 850Married spouse absent1 . . . . . . . . . . . 344 264 203 53 63 1,810 1,193 773 479 480Divorced. . . . . . . . . . . . . . . . . . . . . . . . . 956 817 707 95 115 3,504 2,725 2,363 632 394Widowed . . . . . . . . . . . . . . . . . . . . . . . .
Poverty status in 2002
107 76 62 22 15 416 298 228 89 83
Below poverty level . . . . . . . . . . . . . . . 357 239 142 93 100 3,268 1,849 1,214 1,237 730At or above poverty level . . . . . . . . . . 1,903 1,520 1,188 260 349 6,875 4,622 3,656 1,887 1,077
1Married spouse absent includes separated.
Source: U.S. Census Bureau, Current Population Survey, Annual Social and Economic Supplement, 2003.
10 U.S. Census Bureau
Table 5.Married-Couple Family Groups With Stay-At-Home Parents: 2003(In thousands)
CharacteristicMothers Fathers
Number Percent Number Percent
All married-couple family groups with children under 15 years old . . . . . . . .
Labor force participation last year and stay-at-home parent families
23,209 100.0 23,209 100.0
In labor force 1 or more weeks last year . . . . . . . . . . . . . . . . . . . . . . . . . . . . . . . 16,371 70.5 22,199 95.6Out of labor force all 52 weeks last year . . . . . . . . . . . . . . . . . . . . . . . . . . . . . . .
Primary reason out of the labor force6,838 29.5 1,009 4.3
Ill/disabled . . . . . . . . . . . . . . . . . . . . . . . . . . . . . . . . . . . . . . . . . . . . . . . . . . . . . . 335 1.4 455 2.0Retired . . . . . . . . . . . . . . . . . . . . . . . . . . . . . . . . . . . . . . . . . . . . . . . . . . . . . . . . . 80 0.3 108 0.5Going to school . . . . . . . . . . . . . . . . . . . . . . . . . . . . . . . . . . . . . . . . . . . . . . . . . 227 1.0 90 0.4Could not find work . . . . . . . . . . . . . . . . . . . . . . . . . . . . . . . . . . . . . . . . . . . . . . 105 0.5 111 0.5Other . . . . . . . . . . . . . . . . . . . . . . . . . . . . . . . . . . . . . . . . . . . . . . . . . . . . . . . . . . 54 0.2 88 0.4To care for home and family . . . . . . . . . . . . . . . . . . . . . . . . . . . . . . . . . . . . . . 6,036 26.0 157 0.7
Spouse in labor force all 52 weeks last year . . . . . . . . . . . . . . . . . . . . 5,388 23.2 98 0.4
Stay-at-home family groups. . . . . . . . . . . . . . . . . . . . . . . . . . . . . . . . . . . . .
Type of family group
5,388 100.0 98 100.0
Family household . . . . . . . . . . . . . . . . . . . . . . . . . . . . . . . . . . . . . . . . . . . 5,276 97.9 94 95.9Related subfamily . . . . . . . . . . . . . . . . . . . . . . . . . . . . . . . . . . . . . . . . . . . 110 2.0 5 5.1Unrelated subfamily . . . . . . . . . . . . . . . . . . . . . . . . . . . . . . . . . . . . . . . . .
Number of own children under 15
2 0.0 - 0.0
1 child . . . . . . . . . . . . . . . . . . . . . . . . . . . . . . . . . . . . . . . . . . . . . . . . . . . . . 1,648 30.6 36 36.72 children . . . . . . . . . . . . . . . . . . . . . . . . . . . . . . . . . . . . . . . . . . . . . . . . . . 2,226 41.3 50 51.03 children . . . . . . . . . . . . . . . . . . . . . . . . . . . . . . . . . . . . . . . . . . . . . . . . . . 1,063 19.7 6 6.14 or more children . . . . . . . . . . . . . . . . . . . . . . . . . . . . . . . . . . . . . . . . . . .
Presence of children
451 8.4 6 6.1
With own children under 15. . . . . . . . . . . . . . . . . . . . . . . . . . . . . . . . . . . 5,388 100.0 98 100.0With own children under 12. . . . . . . . . . . . . . . . . . . . . . . . . . . . . . . . . 4,883 90.6 85 86.7
With own children under 6. . . . . . . . . . . . . . . . . . . . . . . . . . . . . . . . 3,491 64.8 50 51.0With own children under 3. . . . . . . . . . . . . . . . . . . . . . . . . . . . . . 2,254 41.8 28 28.6
With own children under 1. . . . . . . . . . . . . . . . . . . . . . . . . . . .
Age of stay-at-home parent
724 13.4 7 7.1
15 to 24 years . . . . . . . . . . . . . . . . . . . . . . . . . . . . . . . . . . . . . . . . . . . . . . 287 5.3 4 4.125 to 34 years . . . . . . . . . . . . . . . . . . . . . . . . . . . . . . . . . . . . . . . . . . . . . . 1,795 33.3 25 25.535 to 44 years . . . . . . . . . . . . . . . . . . . . . . . . . . . . . . . . . . . . . . . . . . . . . . 2,379 44.2 46 46.945 to 54 years . . . . . . . . . . . . . . . . . . . . . . . . . . . . . . . . . . . . . . . . . . . . . . 818 15.2 19 19.455 to 64 years . . . . . . . . . . . . . . . . . . . . . . . . . . . . . . . . . . . . . . . . . . . . . . 97 1.8 4 4.165 years and over . . . . . . . . . . . . . . . . . . . . . . . . . . . . . . . . . . . . . . . . . . .
Family income in 2002
12 0.2 - 0.0
Under $10,000 . . . . . . . . . . . . . . . . . . . . . . . . . . . . . . . . . . . . . . . . . . . . . . 126 2.3 6 6.1$10,000-$14,999 . . . . . . . . . . . . . . . . . . . . . . . . . . . . . . . . . . . . . . . . . . . . 229 4.3 3 3.1$15,000-$19,999 . . . . . . . . . . . . . . . . . . . . . . . . . . . . . . . . . . . . . . . . . . . . 318 5.9 3 3.1$20,000-$24,999 . . . . . . . . . . . . . . . . . . . . . . . . . . . . . . . . . . . . . . . . . . . . 396 7.3 11 11.2$25,000-$29,999 . . . . . . . . . . . . . . . . . . . . . . . . . . . . . . . . . . . . . . . . . . . . 416 7.7 8 8.2$30,000-$39,999 . . . . . . . . . . . . . . . . . . . . . . . . . . . . . . . . . . . . . . . . . . . . 650 12.1 17 17.3$40,000-$49,999 . . . . . . . . . . . . . . . . . . . . . . . . . . . . . . . . . . . . . . . . . . . . 508 9.4 11 11.2$50,000-$74,999 . . . . . . . . . . . . . . . . . . . . . . . . . . . . . . . . . . . . . . . . . . . . 1,043 19.4 14 14.3$75,000-$99,999 . . . . . . . . . . . . . . . . . . . . . . . . . . . . . . . . . . . . . . . . . . . . 613 11.4 17 17.3$100,000 and over . . . . . . . . . . . . . . . . . . . . . . . . . . . . . . . . . . . . . . . . . .
Poverty status in 2002
1,089 20.2 9 9.2
Below poverty level . . . . . . . . . . . . . . . . . . . . . . . . . . . . . . . . . . . . . . . . . . 668 12.4 13 13.3At or above poverty level . . . . . . . . . . . . . . . . . . . . . . . . . . . . . . . . . . . . . 4,720 87.6 85 86.7
- Represents zero or rounds to zero.
Source: U.S. Census Bureau, Current Population Survey, Annual Social and Economic Supplement, 2003.
U.S. Census Bureau 11
Stay-at-home parent family groups
Recently, much interest hasfocused on married couples withchildren and a “stay-at-home” par-ent. This term typically describesa family where the father or themother stays home to care for thechildren while the other spouse isemployed. A 1993 estimate of
2 million stay-at-home fathers, afigure that has been widely publi-cized, was based on the number offathers providing the primary carefor their children under 15 yearsold while their spouses were atwork.12 This number, however,
12 See the following Web site for links tomedia reports and information on stay-at-home dads: <www.slowlane.com>.
included 1.6 million fathers whoactually were employed.13
In this report, estimates of thenumber of stay-at-home mothersand fathers caring for childrenunder 15 are based not on the par-ents’ activities as childcareproviders but rather on the pri-mary reason they were not in thelabor force for the previous 52 weeks. The labor-force-basedmeasure is an item asked on theAnnual Social and EconomicSupplement (ASEC) to the CurrentPopulation Survey (CPS) and allowsconsistent measures of stay-at-home parent families over time.
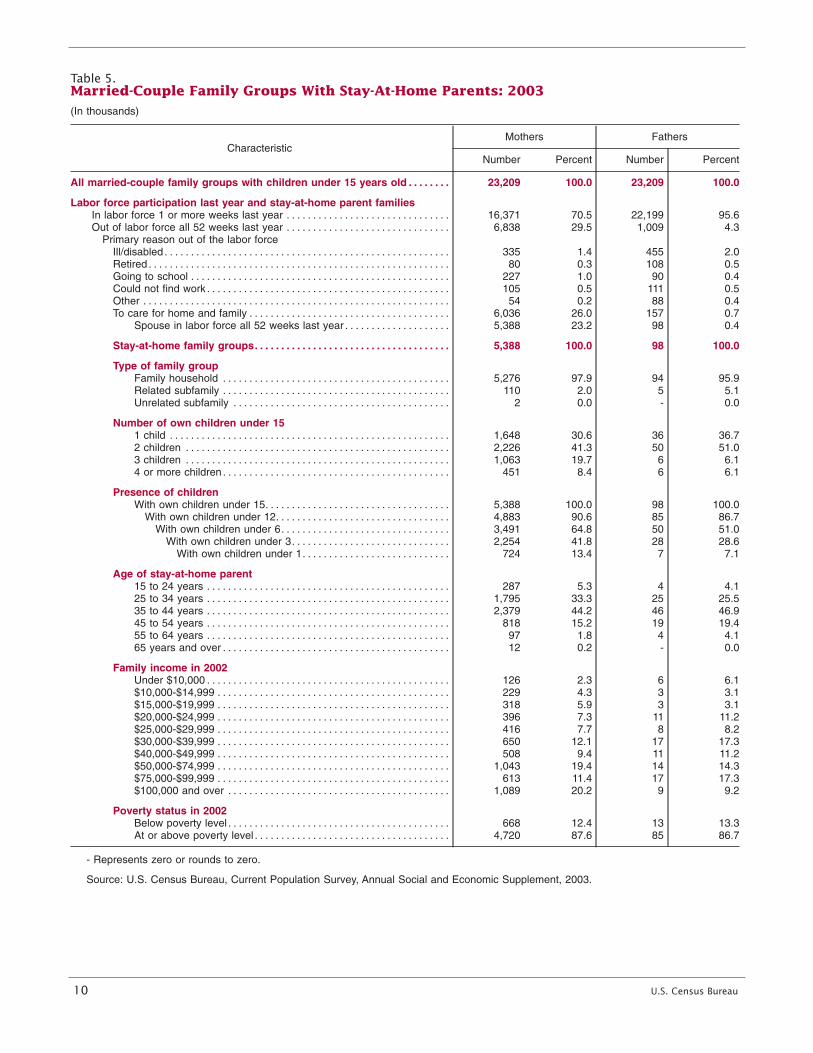
In 2003, 23 million married-couplefamily groups included childrenunder 15 years old. Table 5 showshow many had mothers or fathersout of the labor force for the pre-ceding 52 weeks and the primaryreason. Most parents in these mar-ried-couple families participated inthe labor force for at least oneweek of the prior year (71 percentof mothers and 96 percent offathers). However, 7 million moth-ers and 1 million fathers were outof the labor force all year.
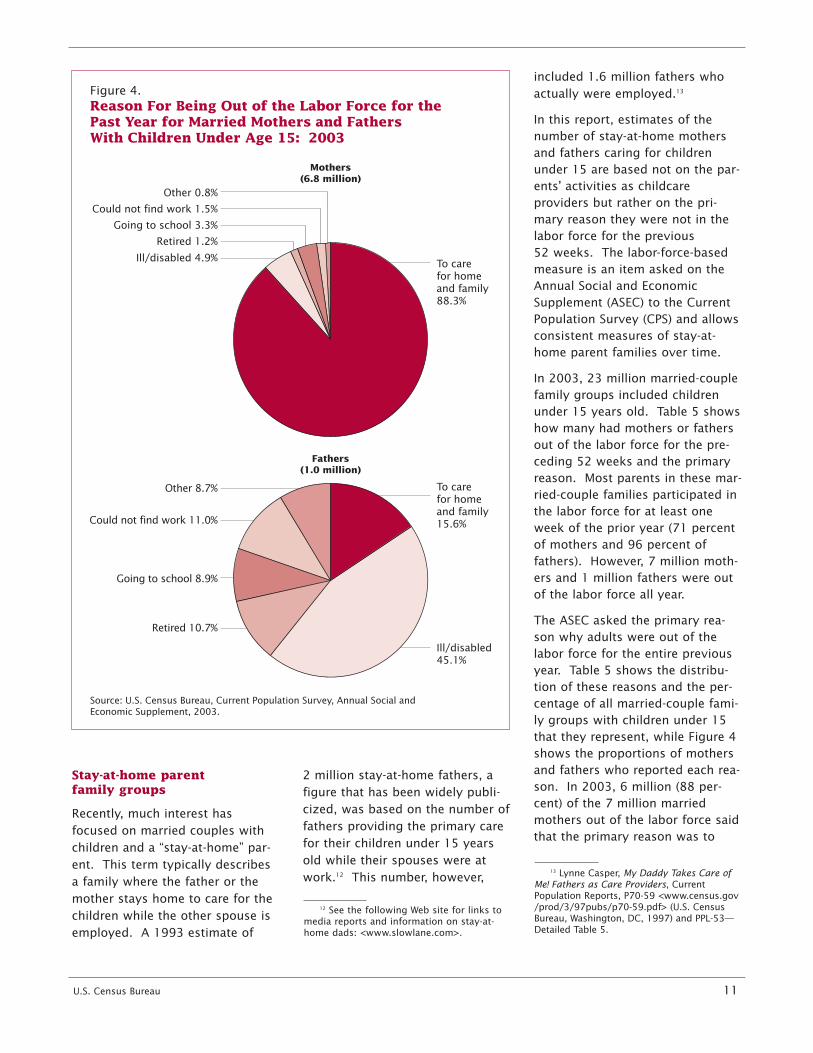
The ASEC asked the primary rea-son why adults were out of thelabor force for the entire previousyear. Table 5 shows the distribu-tion of these reasons and the per-centage of all married-couple fami-ly groups with children under 15that they represent, while Figure 4shows the proportions of mothersand fathers who reported each rea-son. In 2003, 6 million (88 per-cent) of the 7 million marriedmothers out of the labor force saidthat the primary reason was to
13 Lynne Casper, My Daddy Takes Care ofMe! Fathers as Care Providers, CurrentPopulation Reports, P70-59 <www.census.gov/prod/3/97pubs/p70-59.pdf> (U.S. CensusBureau, Washington, DC, 1997) and PPL-53—Detailed Table 5.
Figure 4.Reason For Being Out of the Labor Force for the Past Year for Married Mothers and Fathers With Children Under Age 15: 2003
Source: U.S. Census Bureau, Current Population Survey, Annual Social and Economic Supplement, 2003.
Mothers(6.8 million)
Fathers(1.0 million)
To care for home and family 88.3%
Ill/disabled 4.9%
Retired 1.2%
Going to school 3.3%
Could not find work 1.5%
Other 0.8%
To care for home and family 15.6%
Ill/disabled 45.1%
Retired 10.7%
Going to school 8.9%
Could not find work 11.0%
Other 8.7%
12 U.S. Census Bureau
care for home and family. About mothers were also more often The postponement of marriage160,000 (16 percent) of the 1 mil- under 35 years old than stay-at- since 1970 has led to a substantiallion fathers out of the labor force home fathers, 39 percent and increase in the percentage ofall year gave this reason, while 30 percent, respectively. young, never-married adults. The45 percent reported being ill proportion of women 20 to 24or disabled. MARITAL STATUS OF years old who had never married
INDIVIDUALS more than doubled between 1970Focusing on the mothers and
One reason that the proportion of and 2003—from 36 percent to fathers who responded that they
nonfamily households increased 75 percent (Table 6). The increasewere out of the labor force to care
since 1970 is postponement of was relatively greater for women 30for home and family helps to bet-
marriage, as reflected in the rise in to 34 years old, more than tripling,ter define stay-at-home parents.
the age of first marriage. In 1970, from 6 percent to 23 percent.Of the 6 million families with
the median age at first marriage Changes were also dramatic formothers out of the labor force car-
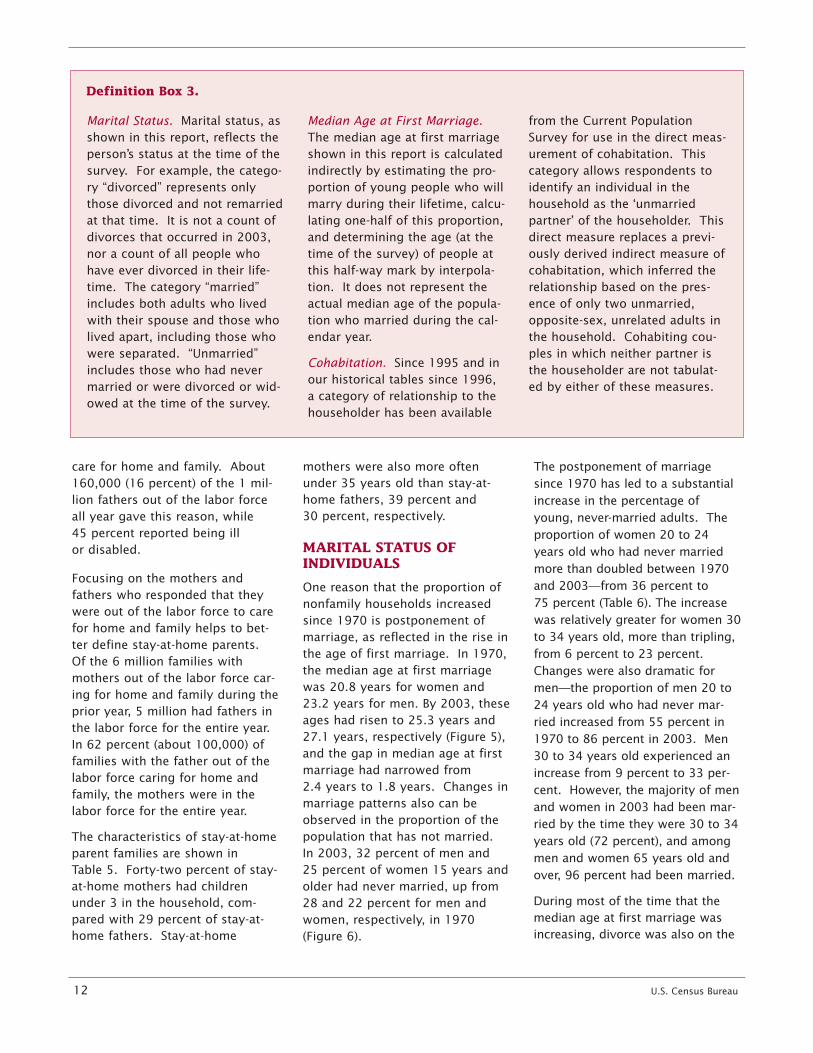
was 20.8 years for women and men—the proportion of men 20 toing for home and family during the23.2 years for men. By 2003, these 24 years old who had never mar-prior year, 5 million had fathers inages had risen to 25.3 years and ried increased from 55 percent inthe labor force for the entire year.27.1 years, respectively (Figure 5), 1970 to 86 percent in 2003. MenIn 62 percent (about 100,000) ofand the gap in median age at first 30 to 34 years old experienced anfamilies with the father out of themarriage had narrowed from increase from 9 percent to 33 per-labor force caring for home and2.4 years to 1.8 years. Changes in cent. However, the majority of menfamily, the mothers were in themarriage patterns also can be and women in 2003 had been mar-labor force for the entire year. observed in the proportion of the ried by the time they were 30 to 34
The characteristics of stay-at-home population that has not married. years old (72 percent), and amongparent families are shown in In 2003, 32 percent of men and men and women 65 years old andTable 5. Forty-two percent of stay- 25 percent of women 15 years and over, 96 percent had been married.at-home mothers had children older had never married, up fromunder 3 in the household, com- 28 and 22 percent for men and During most of the time that the
pared with 29 percent of stay-at- women, respectively, in 1970 median age at first marriage was
home fathers. Stay-at-home (Figure 6). increasing, divorce was also on the
Definition Box 3.
Marital Status. Marital status, as Median Age at First Marriage. from the Current Populationshown in this report, reflects the The median age at first marriage Survey for use in the direct meas-person’s status at the time of the shown in this report is calculated urement of cohabitation. Thissurvey. For example, the catego- indirectly by estimating the pro- category allows respondents tory “divorced” represents only portion of young people who will identify an individual in thethose divorced and not remarried marry during their lifetime, calcu- household as the ‘unmarriedat that time. It is not a count of lating one-half of this proportion, partner’ of the householder. Thisdivorces that occurred in 2003, and determining the age (at the direct measure replaces a previ-nor a count of all people who time of the survey) of people at ously derived indirect measure ofhave ever divorced in their life- this half-way mark by interpola- cohabitation, which inferred thetime. The category “married” tion. It does not represent the relationship based on the pres-includes both adults who lived actual median age of the popula- ence of only two unmarried,with their spouse and those who tion who married during the cal- opposite-sex, unrelated adults inlived apart, including those who endar year. the household. Cohabiting cou-were separated. “Unmarried” ples in which neither partner is
Cohabitation. Since 1995 and inincludes those who had never the householder are not tabulat-
our historical tables since 1996,married or were divorced or wid- ed by either of these measures.
a category of relationship to theowed at the time of the survey.
householder has been available
U.S. Census Bureau 13
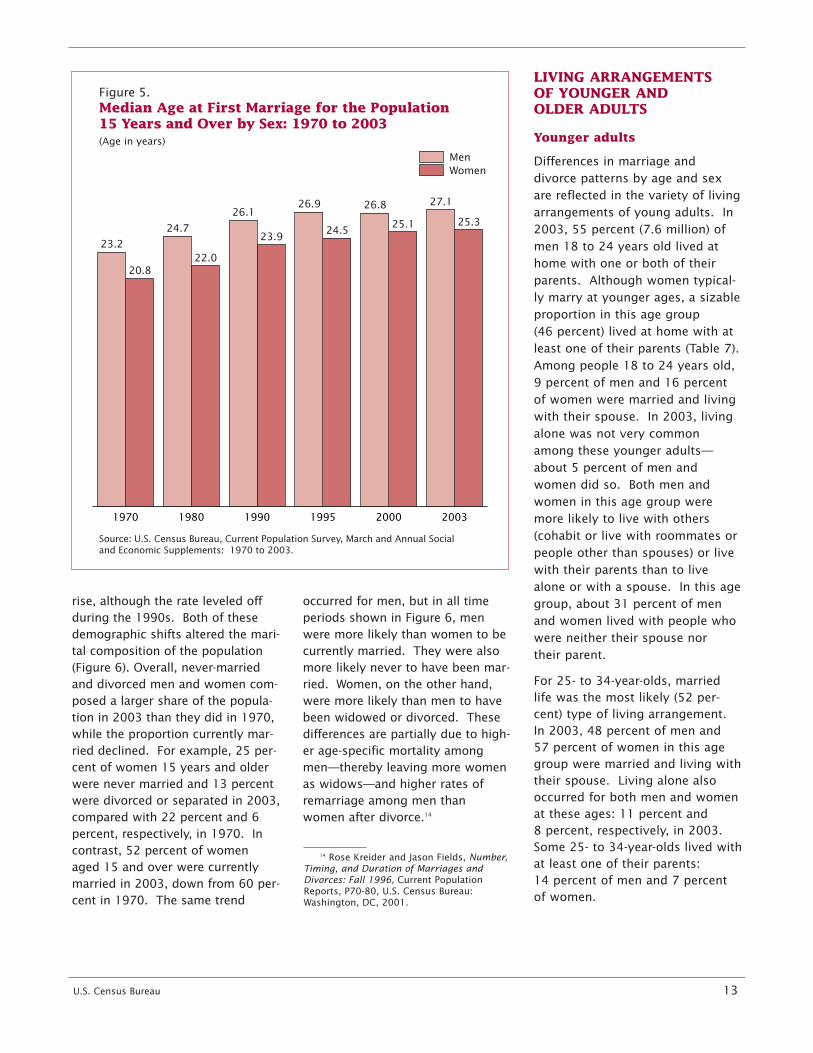
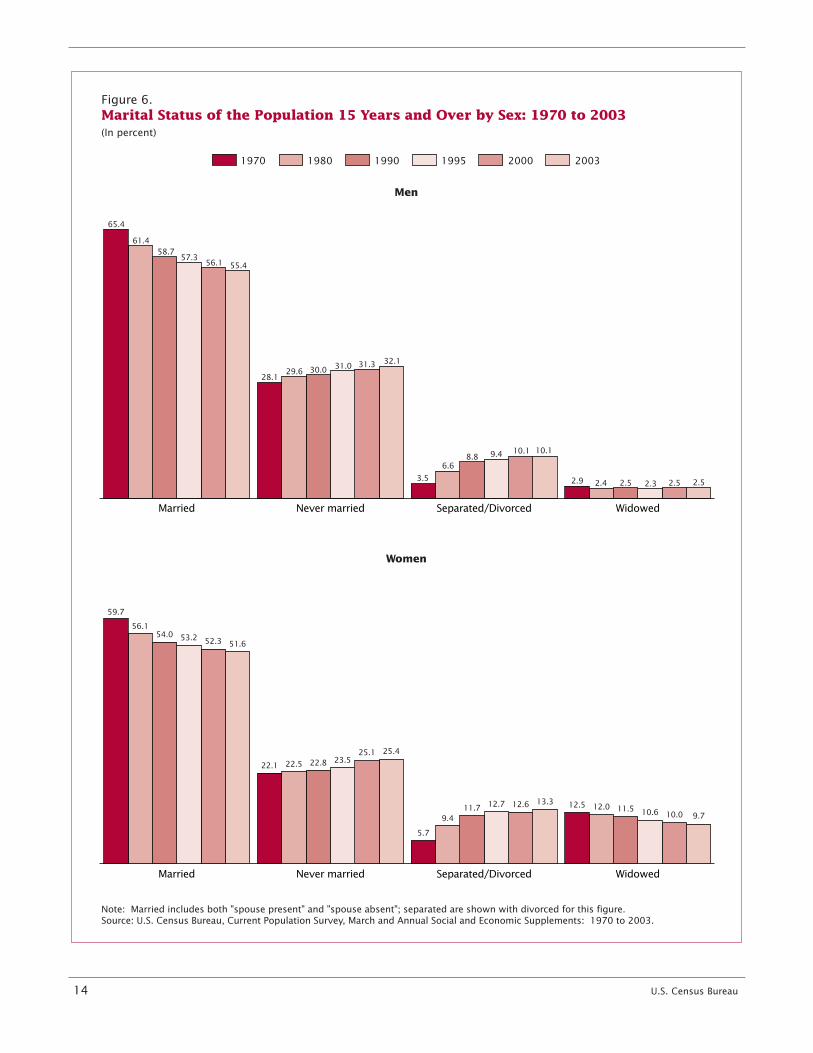
rise, although the rate leveled offduring the 1990s. Both of thesedemographic shifts altered the mari-tal composition of the population(Figure 6). Overall, never-marriedand divorced men and women com-posed a larger share of the popula-tion in 2003 than they did in 1970,while the proportion currently mar-ried declined. For example, 25 per-cent of women 15 years and olderwere never married and 13 percentwere divorced or separated in 2003,compared with 22 percent and 6percent, respectively, in 1970. Incontrast, 52 percent of womenaged 15 and over were currentlymarried in 2003, down from 60 per-cent in 1970. The same trend
occurred for men, but in all timeperiods shown in Figure 6, menwere more likely than women to becurrently married. They were alsomore likely never to have been mar-ried. Women, on the other hand,were more likely than men to havebeen widowed or divorced. Thesedifferences are partially due to high-er age-specific mortality amongmen—thereby leaving more womenas widows—and higher rates ofremarriage among men thanwomen after divorce.14
14 Rose Kreider and Jason Fields, Number,Timing, and Duration of Marriages andDivorces: Fall 1996, Current PopulationReports, P70-80, U.S. Census Bureau:Washington, DC, 2001.
LIVING ARRANGEMENTS OF YOUNGER AND OLDER ADULTS
Younger adults
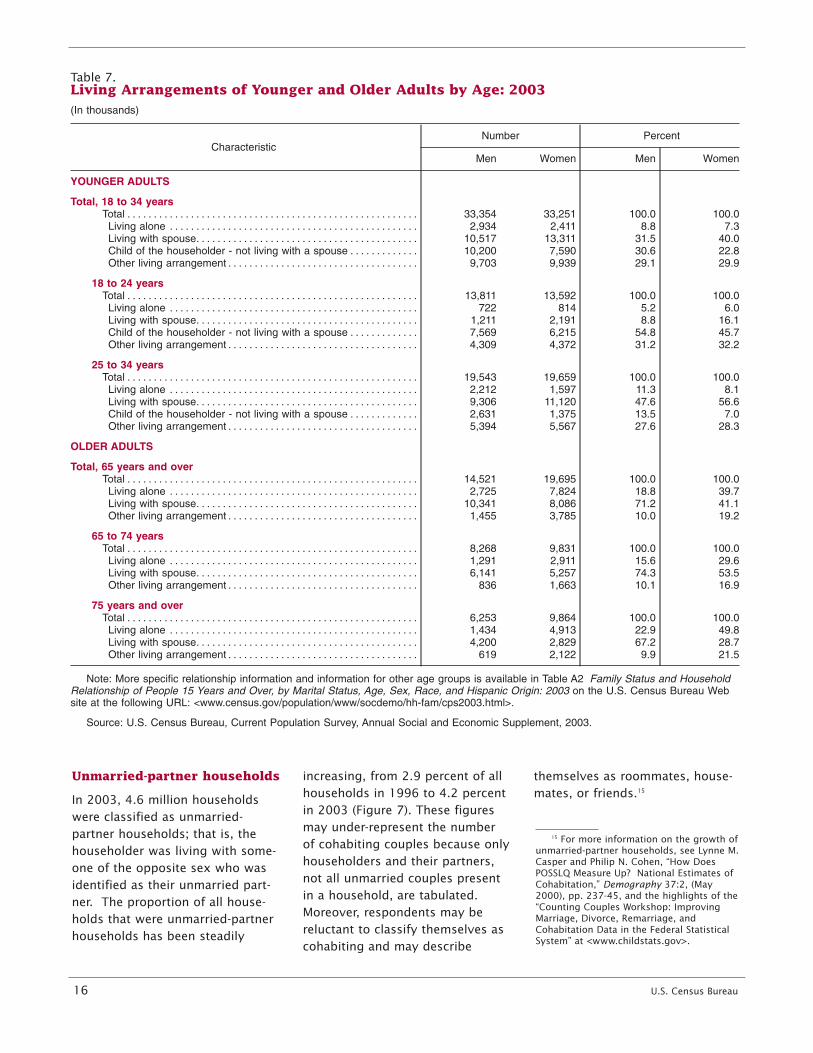
Differences in marriage anddivorce patterns by age and sexare reflected in the variety of livingarrangements of young adults. In2003, 55 percent (7.6 million) ofmen 18 to 24 years old lived athome with one or both of theirparents. Although women typical-ly marry at younger ages, a sizableproportion in this age group (46 percent) lived at home with atleast one of their parents (Table 7).Among people 18 to 24 years old,9 percent of men and 16 percentof women were married and livingwith their spouse. In 2003, livingalone was not very commonamong these younger adults—about 5 percent of men andwomen did so. Both men andwomen in this age group weremore likely to live with others(cohabit or live with roommates orpeople other than spouses) or livewith their parents than to livealone or with a spouse. In this agegroup, about 31 percent of menand women lived with people whowere neither their spouse nor their parent.
For 25- to 34-year-olds, marriedlife was the most likely (52 per-cent) type of living arrangement.In 2003, 48 percent of men and 57 percent of women in this agegroup were married and living withtheir spouse. Living alone alsooccurred for both men and womenat these ages: 11 percent and 8 percent, respectively, in 2003.Some 25- to 34-year-olds lived withat least one of their parents: 14 percent of men and 7 percentof women.
Figure 5.Median Age at First Marriage for the Population 15 Years and Over by Sex: 1970 to 2003
Source: U.S. Census Bureau, Current Population Survey, March and Annual Social and Economic Supplements: 1970 to 2003.
(Age in years)
200320001995199019801970
MenWomen
20.822.0
23.924.5
25.1 25.3
23.2
24.7
26.126.9 26.8 27.1
14 U.S. Census Bureau
Figure 6.Marital Status of the Population 15 Years and Over by Sex: 1970 to 2003
Note: Married includes both "spouse present" and "spouse absent"; separated are shown with divorced for this figure.Source: U.S. Census Bureau, Current Population Survey, March and Annual Social and Economic Supplements: 1970 to 2003.
(In percent)
1970 1980 1990 1995 2000 2003
WidowedSeparated/DivorcedNever marriedMarried
WidowedSeparated/DivorcedNever marriedMarried
Men
Women
55.4
32.1
10.1
2.5
56.1
31.3
10.1
2.5
57.3
31.0
9.4
2.3
58.7
30.0
8.8
2.5
61.4
29.6
6.6
2.4
65.4
28.1
3.5 2.9
51.6
25.4
13.3
9.7
52.3
25.1
12.610.0
53.2
23.5
12.710.6
54.0
22.8
11.7 11.5
56.1
22.5
9.412.0
59.7
22.1
5.7
12.5
U.S. Census Bureau 15
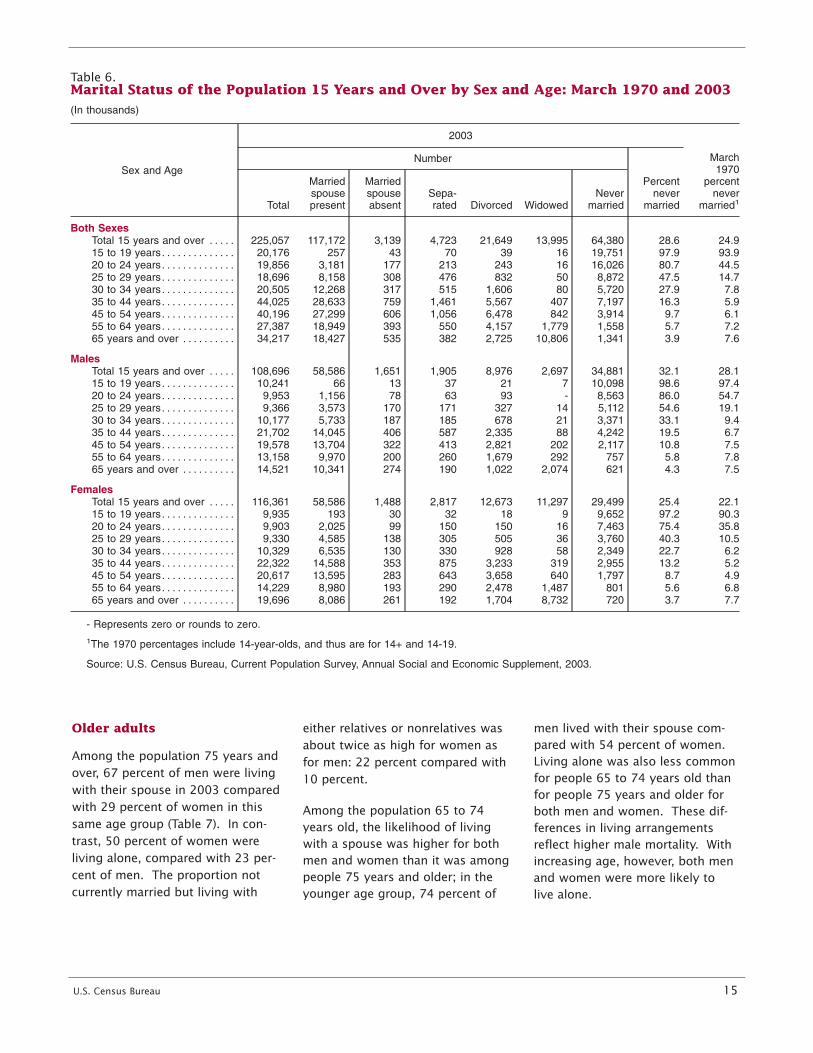
Older adults either relatives or nonrelatives was men lived with their spouse com-about twice as high for women as pared with 54 percent of women.
Among the population 75 years and for men: 22 percent compared with Living alone was also less commonover, 67 percent of men were living 10 percent. for people 65 to 74 years old thanwith their spouse in 2003 compared for people 75 years and older forwith 29 percent of women in this Among the population 65 to 74 both men and women. These dif-same age group (Table 7). In con- years old, the likelihood of living ferences in living arrangementstrast, 50 percent of women were with a spouse was higher for both reflect higher male mortality. Withliving alone, compared with 23 per- men and women than it was among increasing age, however, both mencent of men. The proportion not people 75 years and older; in the and women were more likely to currently married but living with younger age group, 74 percent of live alone.
Table 6.Marital Status of the Population 15 Years and Over by Sex and Age: March 1970 and 2003(In thousands)
Sex and Age
2003
March1970
percentnever
married1
Number
Percentnever
marriedTotal
Marriedspousepresent
Marriedspouseabsent
Sepa-rated Divorced Widowed
Nevermarried
Both SexesTotal 15 years and over . . . . . 225,057 117,172 3,139 4,723 21,649 13,995 64,380 28.6 24.915 to 19 years. . . . . . . . . . . . . . 20,176 257 43 70 39 16 19,751 97.9 93.920 to 24 years. . . . . . . . . . . . . . 19,856 3,181 177 213 243 16 16,026 80.7 44.525 to 29 years. . . . . . . . . . . . . . 18,696 8,158 308 476 832 50 8,872 47.5 14.730 to 34 years. . . . . . . . . . . . . . 20,505 12,268 317 515 1,606 80 5,720 27.9 7.835 to 44 years. . . . . . . . . . . . . . 44,025 28,633 759 1,461 5,567 407 7,197 16.3 5.945 to 54 years. . . . . . . . . . . . . . 40,196 27,299 606 1,056 6,478 842 3,914 9.7 6.155 to 64 years. . . . . . . . . . . . . . 27,387 18,949 393 550 4,157 1,779 1,558 5.7 7.265 years and over . . . . . . . . . . 34,217 18,427 535 382 2,725 10,806 1,341 3.9 7.6
MalesTotal 15 years and over . . . . . 108,696 58,586 1,651 1,905 8,976 2,697 34,881 32.1 28.115 to 19 years. . . . . . . . . . . . . . 10,241 66 13 37 21 7 10,098 98.6 97.420 to 24 years. . . . . . . . . . . . . . 9,953 1,156 78 63 93 - 8,563 86.0 54.725 to 29 years. . . . . . . . . . . . . . 9,366 3,573 170 171 327 14 5,112 54.6 19.130 to 34 years. . . . . . . . . . . . . . 10,177 5,733 187 185 678 21 3,371 33.1 9.435 to 44 years. . . . . . . . . . . . . . 21,702 14,045 406 587 2,335 88 4,242 19.5 6.745 to 54 years. . . . . . . . . . . . . . 19,578 13,704 322 413 2,821 202 2,117 10.8 7.555 to 64 years. . . . . . . . . . . . . . 13,158 9,970 200 260 1,679 292 757 5.8 7.865 years and over . . . . . . . . . . 14,521 10,341 274 190 1,022 2,074 621 4.3 7.5
FemalesTotal 15 years and over . . . . . 116,361 58,586 1,488 2,817 12,673 11,297 29,499 25.4 22.115 to 19 years. . . . . . . . . . . . . . 9,935 193 30 32 18 9 9,652 97.2 90.320 to 24 years. . . . . . . . . . . . . . 9,903 2,025 99 150 150 16 7,463 75.4 35.825 to 29 years. . . . . . . . . . . . . . 9,330 4,585 138 305 505 36 3,760 40.3 10.530 to 34 years. . . . . . . . . . . . . . 10,329 6,535 130 330 928 58 2,349 22.7 6.235 to 44 years. . . . . . . . . . . . . . 22,322 14,588 353 875 3,233 319 2,955 13.2 5.245 to 54 years. . . . . . . . . . . . . . 20,617 13,595 283 643 3,658 640 1,797 8.7 4.955 to 64 years. . . . . . . . . . . . . . 14,229 8,980 193 290 2,478 1,487 801 5.6 6.865 years and over . . . . . . . . . . 19,696 8,086 261 192 1,704 8,732 720 3.7 7.7
- Represents zero or rounds to zero.
1The 1970 percentages include 14-year-olds, and thus are for 14+ and 14-19.
Source: U.S. Census Bureau, Current Population Survey, Annual Social and Economic Supplement, 2003.
16 U.S. Census Bureau
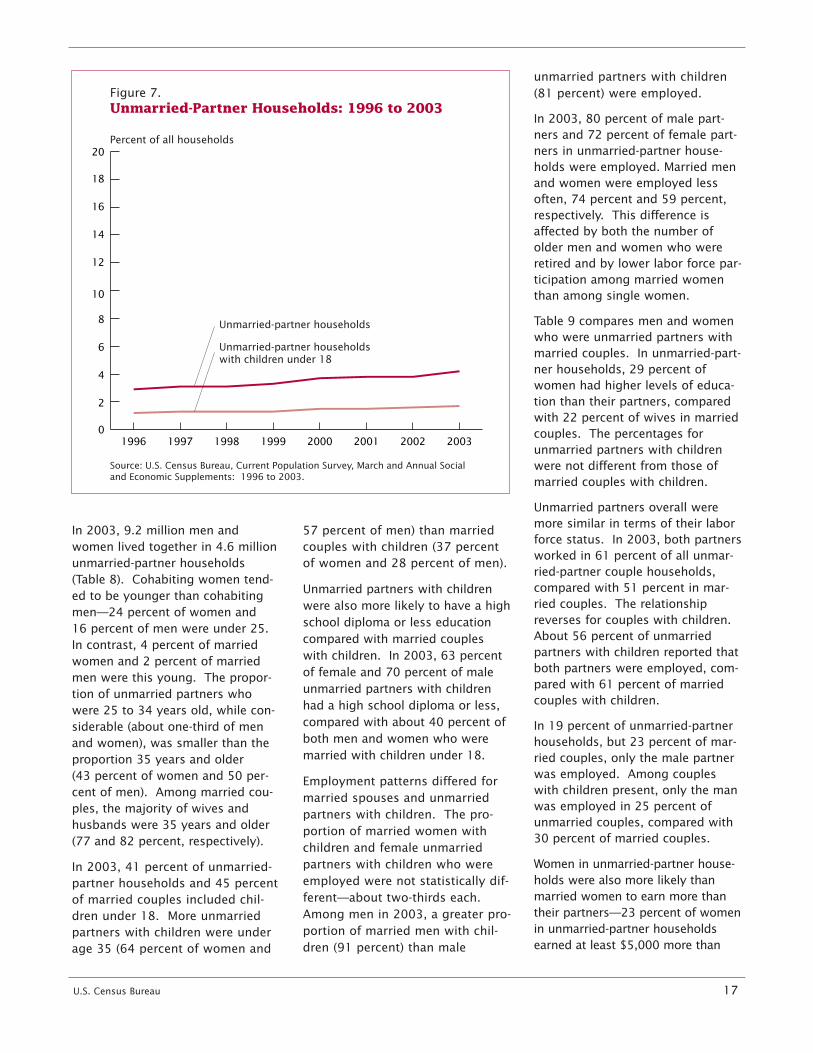
Unmarried-partner households increasing, from 2.9 percent of allhouseholds in 1996 to 4.2 percentIn 2003, 4.6 million householdsin 2003 (Figure 7). These figureswere classified as unmarried-may under-represent the numberpartner households; that is, theof cohabiting couples because onlyhouseholder was living with some-householders and their partners,one of the opposite sex who wasnot all unmarried couples presentidentified as their unmarried part-in a household, are tabulated.ner. The proportion of all house-Moreover, respondents may beholds that were unmarried-partnerreluctant to classify themselves ashouseholds has been steadilycohabiting and may describe
themselves as roommates, house-mates, or friends.15
15 For more information on the growth ofunmarried-partner households, see Lynne M.Casper and Philip N. Cohen, “How DoesPOSSLQ Measure Up? National Estimates ofCohabitation,” Demography 37:2, (May2000), pp. 237-45, and the highlights of the“Counting Couples Workshop: ImprovingMarriage, Divorce, Remarriage, andCohabitation Data in the Federal StatisticalSystem” at <www.childstats.gov>.
Table 7.Living Arrangements of Younger and Older Adults by Age: 2003(In thousands)
CharacteristicNumber Percent
Men Women Men Women
YOUNGER ADULTS
Total, 18 to 34 yearsTotal . . . . . . . . . . . . . . . . . . . . . . . . . . . . . . . . . . . . . . . . . . . . . . . . . . . . . . . 33,354 33,251 100.0 100.0
Living alone . . . . . . . . . . . . . . . . . . . . . . . . . . . . . . . . . . . . . . . . . . . . . . . 2,934 2,411 8.8 7.3Living with spouse. . . . . . . . . . . . . . . . . . . . . . . . . . . . . . . . . . . . . . . . . . 10,517 13,311 31.5 40.0Child of the householder - not living with a spouse . . . . . . . . . . . . . 10,200 7,590 30.6 22.8Other living arrangement . . . . . . . . . . . . . . . . . . . . . . . . . . . . . . . . . . . .
18 to 24 years
9,703 9,939 29.1 29.9
Total . . . . . . . . . . . . . . . . . . . . . . . . . . . . . . . . . . . . . . . . . . . . . . . . . . . . . . . 13,811 13,592 100.0 100.0Living alone . . . . . . . . . . . . . . . . . . . . . . . . . . . . . . . . . . . . . . . . . . . . . . . 722 814 5.2 6.0Living with spouse. . . . . . . . . . . . . . . . . . . . . . . . . . . . . . . . . . . . . . . . . . 1,211 2,191 8.8 16.1Child of the householder - not living with a spouse . . . . . . . . . . . . . 7,569 6,215 54.8 45.7Other living arrangement . . . . . . . . . . . . . . . . . . . . . . . . . . . . . . . . . . . .
25 to 34 years
4,309 4,372 31.2 32.2
Total . . . . . . . . . . . . . . . . . . . . . . . . . . . . . . . . . . . . . . . . . . . . . . . . . . . . . . . 19,543 19,659 100.0 100.0Living alone . . . . . . . . . . . . . . . . . . . . . . . . . . . . . . . . . . . . . . . . . . . . . . . 2,212 1,597 11.3 8.1Living with spouse. . . . . . . . . . . . . . . . . . . . . . . . . . . . . . . . . . . . . . . . . . 9,306 11,120 47.6 56.6Child of the householder - not living with a spouse . . . . . . . . . . . . . 2,631 1,375 13.5 7.0Other living arrangement . . . . . . . . . . . . . . . . . . . . . . . . . . . . . . . . . . . .
OLDER ADULTS
Total, 65 years and over
5,394 5,567 27.6 28.3
Total . . . . . . . . . . . . . . . . . . . . . . . . . . . . . . . . . . . . . . . . . . . . . . . . . . . . . . . 14,521 19,695 100.0 100.0Living alone . . . . . . . . . . . . . . . . . . . . . . . . . . . . . . . . . . . . . . . . . . . . . . . 2,725 7,824 18.8 39.7Living with spouse. . . . . . . . . . . . . . . . . . . . . . . . . . . . . . . . . . . . . . . . . . 10,341 8,086 71.2 41.1Other living arrangement . . . . . . . . . . . . . . . . . . . . . . . . . . . . . . . . . . . .
65 to 74 years
1,455 3,785 10.0 19.2
Total . . . . . . . . . . . . . . . . . . . . . . . . . . . . . . . . . . . . . . . . . . . . . . . . . . . . . . . 8,268 9,831 100.0 100.0Living alone . . . . . . . . . . . . . . . . . . . . . . . . . . . . . . . . . . . . . . . . . . . . . . . 1,291 2,911 15.6 29.6Living with spouse. . . . . . . . . . . . . . . . . . . . . . . . . . . . . . . . . . . . . . . . . . 6,141 5,257 74.3 53.5Other living arrangement . . . . . . . . . . . . . . . . . . . . . . . . . . . . . . . . . . . .
75 years and over
836 1,663 10.1 16.9
Total . . . . . . . . . . . . . . . . . . . . . . . . . . . . . . . . . . . . . . . . . . . . . . . . . . . . . . . 6,253 9,864 100.0 100.0Living alone . . . . . . . . . . . . . . . . . . . . . . . . . . . . . . . . . . . . . . . . . . . . . . . 1,434 4,913 22.9 49.8Living with spouse. . . . . . . . . . . . . . . . . . . . . . . . . . . . . . . . . . . . . . . . . . 4,200 2,829 67.2 28.7Other living arrangement . . . . . . . . . . . . . . . . . . . . . . . . . . . . . . . . . . . . 619 2,122 9.9 21.5
Note: More specific relationship information and information for other age groups is available in Table A2 Family Status and HouseholdRelationship of People 15 Years and Over, by Marital Status, Age, Sex, Race, and Hispanic Origin: 2003 on the U.S. Census Bureau Website at the following URL: <www.census.gov/population/www/socdemo/hh-fam/cps2003.html>.
Source: U.S. Census Bureau, Current Population Survey, Annual Social and Economic Supplement, 2003.
U.S. Census Bureau 17
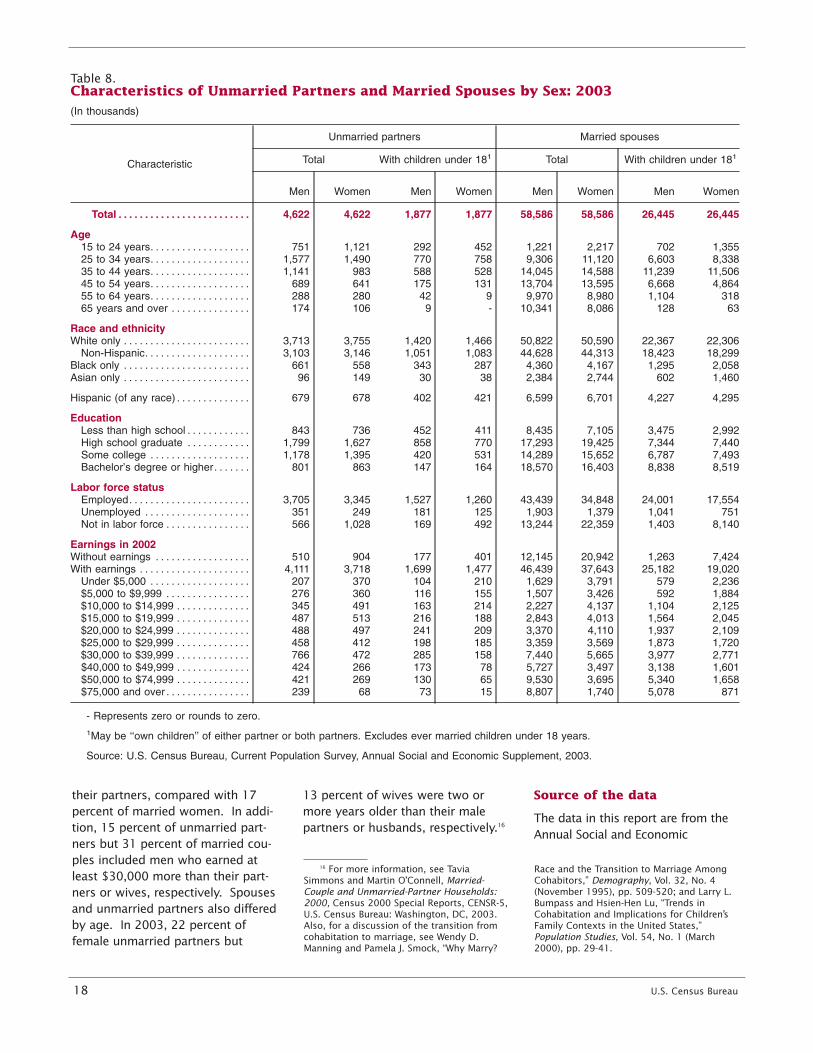
In 2003, 9.2 million men and 57 percent of men) than marriedwomen lived together in 4.6 million couples with children (37 percentunmarried-partner households of women and 28 percent of men). (Table 8). Cohabiting women tend-
Unmarried partners with childrened to be younger than cohabitingwere also more likely to have a highmen—24 percent of women and school diploma or less education16 percent of men were under 25.compared with married couplesIn contrast, 4 percent of marriedwith children. In 2003, 63 percentwomen and 2 percent of marriedof female and 70 percent of malemen were this young. The propor-unmarried partners with childrention of unmarried partners whohad a high school diploma or less,were 25 to 34 years old, while con-compared with about 40 percent ofsiderable (about one-third of menboth men and women who wereand women), was smaller than themarried with children under 18. proportion 35 years and older
(43 percent of women and 50 per- Employment patterns differed forcent of men). Among married cou- married spouses and unmarriedples, the majority of wives and partners with children. The pro-husbands were 35 years and older portion of married women with(77 and 82 percent, respectively). children and female unmarried
In 2003, 41 percent of unmarried- partners with children who were
partner households and 45 percent employed were not statistically dif-
of married couples included chil- ferent—about two-thirds each.
dren under 18. More unmarried Among men in 2003, a greater pro-
partners with children were under portion of married men with chil-
age 35 (64 percent of women and dren (91 percent) than male
unmarried partners with children(81 percent) were employed.
In 2003, 80 percent of male part-ners and 72 percent of female part-ners in unmarried-partner house-holds were employed. Married menand women were employed lessoften, 74 percent and 59 percent,respectively. This difference isaffected by both the number ofolder men and women who wereretired and by lower labor force par-ticipation among married womenthan among single women.
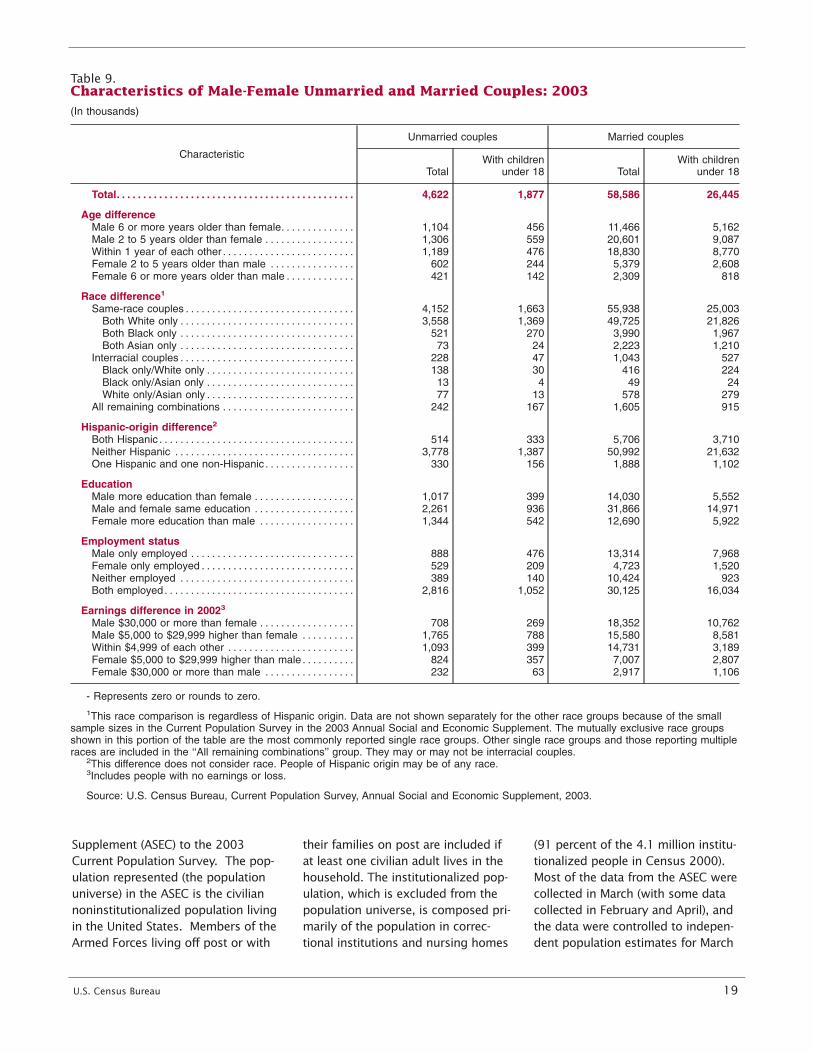
Table 9 compares men and womenwho were unmarried partners withmarried couples. In unmarried-part-ner households, 29 percent ofwomen had higher levels of educa-tion than their partners, comparedwith 22 percent of wives in marriedcouples. The percentages forunmarried partners with childrenwere not different from those ofmarried couples with children.
Unmarried partners overall weremore similar in terms of their laborforce status. In 2003, both partnersworked in 61 percent of all unmar-ried-partner couple households,compared with 51 percent in mar-ried couples. The relationshipreverses for couples with children.About 56 percent of unmarriedpartners with children reported thatboth partners were employed, com-pared with 61 percent of marriedcouples with children.
In 19 percent of unmarried-partnerhouseholds, but 23 percent of mar-ried couples, only the male partnerwas employed. Among coupleswith children present, only the manwas employed in 25 percent ofunmarried couples, compared with30 percent of married couples.
Women in unmarried-partner house-holds were also more likely thanmarried women to earn more thantheir partners—23 percent of womenin unmarried-partner householdsearned at least $5,000 more than
Figure 7.Unmarried-Partner Households: 1996 to 2003
Source: U.S. Census Bureau, Current Population Survey, March and Annual Social and Economic Supplements: 1996 to 2003.
0
2
4
6
8
10
12
14
16
18
20
20032002200120001999199819971996
Percent of all households
Unmarried-partner households
Unmarried-partner households with children under 18
18 U.S. Census Bureau
their partners, compared with 17percent of married women. In addi-tion, 15 percent of unmarried part-ners but 31 percent of married cou-ples included men who earned atleast $30,000 more than their part-ners or wives, respectively. Spousesand unmarried partners also differedby age. In 2003, 22 percent offemale unmarried partners but
13 percent of wives were two ormore years older than their malepartners or husbands, respectively.16
16 For more information, see TaviaSimmons and Martin O’Connell, Married-Couple and Unmarried-Partner Households:2000, Census 2000 Special Reports, CENSR-5U.S. Census Bureau: Washington, DC, 2003.Also, for a discussion of the transition fromcohabitation to marriage, see Wendy D.Manning and Pamela J. Smock, “Why Marry?
,
Source of the data
The data in this report are from theAnnual Social and Economic
Race and the Transition to Marriage AmongCohabitors,” Demography, Vol. 32, No. 4(November 1995), pp. 509-520; and Larry L.Bumpass and Hsien-Hen Lu, “Trends inCohabitation and Implications for Children’sFamily Contexts in the United States,”Population Studies, Vol. 54, No. 1 (March2000), pp. 29-41.
Table 8.Characteristics of Unmarried Partners and Married Spouses by Sex: 2003(In thousands)
Characteristic
Unmarried partners Married spouses
Total With children under 181 Total With children under 181
Men Women Men Women Men Women Men Women
Total . . . . . . . . . . . . . . . . . . . . . . . . .
Age
4,622 4,622 1,877 1,877 58,586 58,586 26,445 26,445
15 to 24 years. . . . . . . . . . . . . . . . . . . 751 1,121 292 452 1,221 2,217 702 1,35525 to 34 years. . . . . . . . . . . . . . . . . . . 1,577 1,490 770 758 9,306 11,120 6,603 8,33835 to 44 years. . . . . . . . . . . . . . . . . . . 1,141 983 588 528 14,045 14,588 11,239 11,50645 to 54 years. . . . . . . . . . . . . . . . . . . 689 641 175 131 13,704 13,595 6,668 4,86455 to 64 years. . . . . . . . . . . . . . . . . . . 288 280 42 9 9,970 8,980 1,104 31865 years and over . . . . . . . . . . . . . . .
Race and ethnicity
174 106 9 - 10,341 8,086 128 63
White only . . . . . . . . . . . . . . . . . . . . . . . . 3,713 3,755 1,420 1,466 50,822 50,590 22,367 22,306Non-Hispanic. . . . . . . . . . . . . . . . . . . . 3,103 3,146 1,051 1,083 44,628 44,313 18,423 18,299
Black only . . . . . . . . . . . . . . . . . . . . . . . . 661 558 343 287 4,360 4,167 1,295 2,058Asian only . . . . . . . . . . . . . . . . . . . . . . . . 96 149 30 38 2,384 2,744 602 1,460
Hispanic (of any race) . . . . . . . . . . . . . .
Education
679 678 402 421 6,599 6,701 4,227 4,295
Less than high school . . . . . . . . . . . . 843 736 452 411 8,435 7,105 3,475 2,992High school graduate . . . . . . . . . . . . 1,799 1,627 858 770 17,293 19,425 7,344 7,440Some college . . . . . . . . . . . . . . . . . . . 1,178 1,395 420 531 14,289 15,652 6,787 7,493Bachelor’s degree or higher. . . . . . .
Labor force status
801 863 147 164 18,570 16,403 8,838 8,519
Employed. . . . . . . . . . . . . . . . . . . . . . . 3,705 3,345 1,527 1,260 43,439 34,848 24,001 17,554Unemployed . . . . . . . . . . . . . . . . . . . . 351 249 181 125 1,903 1,379 1,041 751Not in labor force . . . . . . . . . . . . . . . .
Earnings in 2002
566 1,028 169 492 13,244 22,359 1,403 8,140
Without earnings . . . . . . . . . . . . . . . . . . 510 904 177 401 12,145 20,942 1,263 7,424With earnings . . . . . . . . . . . . . . . . . . . . . 4,111 3,718 1,699 1,477 46,439 37,643 25,182 19,020
Under $5,000 . . . . . . . . . . . . . . . . . . . 207 370 104 210 1,629 3,791 579 2,236$5,000 to $9,999 . . . . . . . . . . . . . . . . 276 360 116 155 1,507 3,426 592 1,884$10,000 to $14,999 . . . . . . . . . . . . . . 345 491 163 214 2,227 4,137 1,104 2,125$15,000 to $19,999 . . . . . . . . . . . . . . 487 513 216 188 2,843 4,013 1,564 2,045$20,000 to $24,999 . . . . . . . . . . . . . . 488 497 241 209 3,370 4,110 1,937 2,109$25,000 to $29,999 . . . . . . . . . . . . . . 458 412 198 185 3,359 3,569 1,873 1,720$30,000 to $39,999 . . . . . . . . . . . . . . 766 472 285 158 7,440 5,665 3,977 2,771$40,000 to $49,999 . . . . . . . . . . . . . . 424 266 173 78 5,727 3,497 3,138 1,601$50,000 to $74,999 . . . . . . . . . . . . . . 421 269 130 65 9,530 3,695 5,340 1,658$75,000 and over . . . . . . . . . . . . . . . . 239 68 73 15 8,807 1,740 5,078 871
- Represents zero or rounds to zero.
1May be ‘‘own children’’ of either partner or both partners. Excludes ever married children under 18 years.
Source: U.S. Census Bureau, Current Population Survey, Annual Social and Economic Supplement, 2003.
U.S. Census Bureau 19
Supplement (ASEC) to the 2003 their families on post are included if (91 percent of the 4.1 million institu-Current Population Survey. The pop- at least one civilian adult lives in the tionalized people in Census 2000).ulation represented (the population household. The institutionalized pop- Most of the data from the ASEC wereuniverse) in the ASEC is the civilian ulation, which is excluded from the collected in March (with some datanoninstitutionalized population living population universe, is composed pri- collected in February and April), andin the United States. Members of the marily of the population in correc- the data were controlled to indepen-Armed Forces living off post or with tional institutions and nursing homes dent population estimates for March
Table 9.Characteristics of Male-Female Unmarried and Married Couples: 2003(In thousands)
Characteristic
Unmarried couples Married couples
TotalWith children
under 18 TotalWith children
under 18
Total. . . . . . . . . . . . . . . . . . . . . . . . . . . . . . . . . . . . . . . . . . . . .
Age difference
4,622 1,877 58,586 26,445
Male 6 or more years older than female. . . . . . . . . . . . . . 1,104 456 11,466 5,162Male 2 to 5 years older than female . . . . . . . . . . . . . . . . . 1,306 559 20,601 9,087Within 1 year of each other . . . . . . . . . . . . . . . . . . . . . . . . . 1,189 476 18,830 8,770Female 2 to 5 years older than male . . . . . . . . . . . . . . . . 602 244 5,379 2,608Female 6 or more years older than male . . . . . . . . . . . . .
Race difference1
421 142 2,309 818
Same-race couples . . . . . . . . . . . . . . . . . . . . . . . . . . . . . . . . 4,152 1,663 55,938 25,003Both White only . . . . . . . . . . . . . . . . . . . . . . . . . . . . . . . . . 3,558 1,369 49,725 21,826Both Black only . . . . . . . . . . . . . . . . . . . . . . . . . . . . . . . . . 521 270 3,990 1,967Both Asian only . . . . . . . . . . . . . . . . . . . . . . . . . . . . . . . . . 73 24 2,223 1,210
Interracial couples . . . . . . . . . . . . . . . . . . . . . . . . . . . . . . . . . 228 47 1,043 527Black only/White only . . . . . . . . . . . . . . . . . . . . . . . . . . . . 138 30 416 224Black only/Asian only . . . . . . . . . . . . . . . . . . . . . . . . . . . . 13 4 49 24White only/Asian only . . . . . . . . . . . . . . . . . . . . . . . . . . . . 77 13 578 279
All remaining combinations . . . . . . . . . . . . . . . . . . . . . . . . .
Hispanic-origin difference2
242 167 1,605 915
Both Hispanic . . . . . . . . . . . . . . . . . . . . . . . . . . . . . . . . . . . . . 514 333 5,706 3,710Neither Hispanic . . . . . . . . . . . . . . . . . . . . . . . . . . . . . . . . . . 3,778 1,387 50,992 21,632One Hispanic and one non-Hispanic . . . . . . . . . . . . . . . . .
Education
330 156 1,888 1,102
Male more education than female . . . . . . . . . . . . . . . . . . . 1,017 399 14,030 5,552Male and female same education . . . . . . . . . . . . . . . . . . . 2,261 936 31,866 14,971Female more education than male . . . . . . . . . . . . . . . . . .
Employment status
1,344 542 12,690 5,922
Male only employed . . . . . . . . . . . . . . . . . . . . . . . . . . . . . . . 888 476 13,314 7,968Female only employed . . . . . . . . . . . . . . . . . . . . . . . . . . . . . 529 209 4,723 1,520Neither employed . . . . . . . . . . . . . . . . . . . . . . . . . . . . . . . . . 389 140 10,424 923Both employed . . . . . . . . . . . . . . . . . . . . . . . . . . . . . . . . . . . .
Earnings difference in 20023
2,816 1,052 30,125 16,034
Male $30,000 or more than female . . . . . . . . . . . . . . . . . . 708 269 18,352 10,762Male $5,000 to $29,999 higher than female . . . . . . . . . . 1,765 788 15,580 8,581Within $4,999 of each other . . . . . . . . . . . . . . . . . . . . . . . . 1,093 399 14,731 3,189Female $5,000 to $29,999 higher than male . . . . . . . . . . 824 357 7,007 2,807Female $30,000 or more than male . . . . . . . . . . . . . . . . . 232 63 2,917 1,106
- Represents zero or rounds to zero.
1This race comparison is regardless of Hispanic origin. Data are not shown separately for the other race groups because of the smallsample sizes in the Current Population Survey in the 2003 Annual Social and Economic Supplement. The mutually exclusive race groupsshown in this portion of the table are the most commonly reported single race groups. Other single race groups and those reporting multipleraces are included in the ‘‘All remaining combinations’’ group. They may or may not be interracial couples.
2This difference does not consider race. People of Hispanic origin may be of any race.3Includes people with no earnings or loss.
Source: U.S. Census Bureau, Current Population Survey, Annual Social and Economic Supplement, 2003.
2003. For annual time series from estimation whereby sample esti- site, click on Subjects A-Z, select ‘F,’the CPS, data collected in the 2003 mates are adjusted to independent then select ‘Families.’ From theASEC may be compared with data estimates of the national popula- ‘Families’ page, select ‘2003 CPS’ andcollected in the March Supplement to tion by age, race, sex, and then choose from the list of options.the CPS in prior years. Hispanic origin. This weighting
partially corrects for bias due to SUGGESTED CITATIONAccuracy of the estimates undercoverage, but biases may still Fields, Jason. 2003. America’s
be present when people who areStatistics from surveys are subject Families and Living Arrangements:missed by the survey differ fromto sampling and nonsampling error. 2003. Current Population Reports,those interviewed in ways otherAll comparisons presented in this P20-553. U.S. Census Bureau,than age, race, sex, and Hispanicreport have taken sampling error Washington, DC.origin. How this weighting proce-into account and are significant atdure affects other variables in thethe 90-percent confidence level. CONTACTSsurvey is not precisely known. AllThis means the 90-percent confi-
Statistical Information Staff:of these considerations affect com-dence interval for the [email protected], 301-763-2422parisons across different surveysbetween the estimates being com-
or data sources.pared does not include zero. Jason Fields:Nonsampling errors in surveys may [email protected], For further information on statisticalbe attributed to a variety of 301-763-2416standards and the computation andsources, such as how the survey is use of standard errors, go to Fertility and Family Statisticsdesigned, how respondents inter- <www.census.gov/apsd/techdoc Branch, 301-763-2416pret questions, how able and will- /cps/cpsmar03.pdf> or contact Janaing respondents are to provide cor- Shepherd of the Census Bureau’s USER COMMENTSrect answers, and how accurately Demographic Statistical Methodsthe answers are coded and classi- The Census Bureau welcomes theDivision on the Internet atfied. The Census Bureau employs comments and advice of data and<dsmd.source.and.accuracy@quality control procedures through- report users. If you have any sug-census.gov>.out the production process includ- gestions or comments, pleaseing the overall design of surveys, MORE INFORMATION write to:the wording of questions, review of
Detailed tables from the 2003 Chief, Population Divisionthe work of interviewers and
Annual Social and Economic U.S. Census Bureaucoders, and statistical review of
Supplement to the CPS are available Washington, DC 20233reports to minimize these errors.
on the Internet at the Census or send e-mail to:The Current Population Survey Bureau’s World Wide Web site [email protected] procedure uses ratio <www.census.gov>. Once on the
U.S. Department of CommerceEconomics and Statistics AdministrationU.S. CENSUS BUREAU
Washington, DC 20233
OFFICIAL BUSINESS
Penalty for Private Use $300
FIRST-CLASS MAILPOSTAGE & FEES PAIDU.S. Census Bureau
Permit No. G-58