Embed Size (px)
Citation preview
AmeriCorps Alumni Outcomes
Summary Report
October 2015
This report is in the public domain. Authorization to reproduce it in whole or in part is granted. Upon request, this
material will be made available in alternative formats for people with disabilities.
AmeriCorps Alumni Outcomes Summary Report
October 2015
Authors Gina Cardazone
Adam Farrar
Rebecca Frazier
Susan Gabbard
Trish Hernandez
Stacey Houston
Jaslean La Taillade
Peter Lovegrove
Donald Pratt
Nicole Vicinanza
Joseph Willey
JBS International, Inc.
Aguirre Division
555 Airport Blvd, Suite 400
Burlingame, CA 94010-2002
Prepared For Diana Epstein, Ph.D
Office of Research and Evaluation
Corporation for National and Community Service
Acknowledgements The authors would like to acknowledge and thank Dr. Diana Epstein for sharing her knowledge and for providing
comments and suggestions that improved this paper. In addition, the authors thank all the alumni who participated in
the survey.
AMERICORPS ALUMNI OUTCOMES SUMMARY REPORT AMERICORPS
September 2015
nationalservice.gov ii
Executive Summary and Key Findings ................................................................................................................... 1
Research Methods ................................................................................................................................................... 1
Research Question One: Influence of National Service on Key Outcomes ..................................................... 2
Research Question Two: Variation in Key Outcomes by Focus Areas, Programs, and Experience ............ 4
Research Question Three: Variation in Key Outcomes by Life Stage .............................................................. 4
Conclusions and Recommendations .................................................................................................................... 5
Chapter 1: Introduction .............................................................................................................................................. 6
Attainment of Career-oriented Soft Skills ........................................................................................................... 6
Career Pathways ..................................................................................................................................................... 7
Sense of Community .............................................................................................................................................. 7
Civic Engagement ................................................................................................................................................... 7
Chapter 2: Research Methods ................................................................................................................................... 8
Questionnaire Development ................................................................................................................................. 8
Sampling .................................................................................................................................................................. 8
Survey Administration........................................................................................................................................... 9
Quality of Contact Information........................................................................................................................... 10
Quality of the Data ............................................................................................................................................... 12
Partial Completion of Surveys and Item Response Analysis ..................................................................... 12
Nonresponse Bias Analysis ............................................................................................................................. 13
Weights .............................................................................................................................................................. 13
Data Analysis ........................................................................................................................................................ 14
Treatment of Missing Data .............................................................................................................................. 14
Descriptive Statistics – Means and Proportions ........................................................................................... 14
Scales and Scale Construction ......................................................................................................................... 14
Regression Analysis.......................................................................................................................................... 14
Study Limitations ................................................................................................................................................. 15
Lack of Counterfactual ..................................................................................................................................... 15
Chapter 3: Alumni Demographics, Life Stages, and Service Experiences ........................................................ 16
Gender ................................................................................................................................................................ 16
Race/Ethnicity.................................................................................................................................................... 16
Education ........................................................................................................................................................... 16
Marital Status .................................................................................................................................................... 17
Military Service ................................................................................................................................................. 18
Pre-service Welfare or Public Assistance Usage ........................................................................................... 18
Age ...................................................................................................................................................................... 19
AMERICORPS ALUMNI OUTCOMES SUMMARY REPORT AMERICORPS
nationalservice.gov iii
Parenting ............................................................................................................................................................ 20
Activities Prior to Service ................................................................................................................................ 21
AmeriCorps Service Experience Highlights ................................................................................................. 21
Year Starting AmeriCorps Service .................................................................................................................. 22
Full-time, Part-time, and Other Service Terms ............................................................................................. 22
Service Programs .............................................................................................................................................. 22
Strength of Association with AmeriCorps, Programs, Organizations, and Sites .................................... 23
Focus Areas ........................................................................................................................................................ 23
Quality of Service Experience ......................................................................................................................... 24
Chapter 4: Alumni Outcomes ................................................................................................................................. 29
Outcomes for Career-oriented Soft Skills .......................................................................................................... 31
Cultural Competency ....................................................................................................................................... 31
Self-efficacy ........................................................................................................................................................ 32
Career-specific Skills ........................................................................................................................................ 33
AmeriCorps Helpfulness in Building Skills .................................................................................................. 35
Outcomes for Career Pathways .......................................................................................................................... 36
AmeriCorps as a Worthwhile and Defining Experience for Furthering Career-related Goals .............. 37
Fit with Career Pathway .................................................................................................................................. 39
Staying in the Community .............................................................................................................................. 40
Education Award Use ...................................................................................................................................... 41
Alumni Post-service Career Pathways .......................................................................................................... 42
Outcomes for Sense of Community ................................................................................................................... 45
Trust in Neighbors ............................................................................................................................................ 45
Confidence in Corporations, Media, and Public Schools ............................................................................ 46
Attachment to Community ............................................................................................................................. 48
Outcomes for Civic Engagement ........................................................................................................................ 49
Frequency of Civic Engagement ..................................................................................................................... 49
AmeriCorps Influence on Civic Engagement ............................................................................................... 50
Frequency of Engagement in Political Discourse ......................................................................................... 51
Boycotting .......................................................................................................................................................... 52
Voting ................................................................................................................................................................. 53
Civic Self-efficacy .............................................................................................................................................. 55
Chapter 5: Answers to Research Questions .......................................................................................................... 57
Research Question One: Influence of Service Participation on Outcomes. ................................................... 57
Developing Career-Oriented Soft Skills ........................................................................................................ 57
AMERICORPS ALUMNI OUTCOMES SUMMARY REPORT AMERICORPS
nationalservice.gov iv
Service Participation and Alumni Career Pathways .................................................................................... 58
Developing and Maintaining a Sense of Community.................................................................................. 58
Developing and Maintaining Civic Engagement ......................................................................................... 58
Research Question Two: Influence of Serve America Act Focus Areas and Service Programs on
Outcomes. .............................................................................................................................................................. 59
Focus Area Differences .................................................................................................................................... 59
Service Program Differences ........................................................................................................................... 60
Program Experience Differences .................................................................................................................... 61
Research Question Three: Influence of Life Stage on Outcomes. ................................................................... 63
Alumni Demographics ..................................................................................................................................... 63
Life stage ............................................................................................................................................................ 64
Pre-service Skill Levels ..................................................................................................................................... 64
Chapter 6: Conclusions and Recommendations ................................................................................................... 66
Survey and Survey Administration ................................................................................................................... 66
Recommendations and Next Steps ..................................................................................................................... 66
Appendix A: The Survey ......................................................................................................................................... 68
Appendix B: Raw Frequencies ................................................................................................................................ 84
Appendix C: Weighted Frequencies .................................................................................................................... 123
Appendix D: Regression Results .......................................................................................................................... 162
Table of Tables and Figures
Table 1: Key Outcome Definitions and Measures .................................................................................................. 2
Table 2: Sampling Universe for AmeriCorps Alumni Assessment ...................................................................... 9
Figure 1: Survey Administration Process .............................................................................................................. 11
Table 3: Response Rates by Year, Program, and Cohort. .................................................................................... 12
Figure 2: Gender ....................................................................................................................................................... 16
Figure 3: Education ................................................................................................................................................... 17
Figure 4: Current Marital Status ............................................................................................................................. 18
Figure 5: Public Assistance Usage .......................................................................................................................... 19
Figure 6: Age during the First Term of Service .................................................................................................... 20
Figure 7: Parent or Caregiver During the First Term of Service and at the Time of the Survey .................... 21
Figure 8: Focus Areas ............................................................................................................................................... 24
Figure 9: Percent of Alumni Satisfied or Very Satisfied with Service Experience ........................................... 25
Figure 10: Would Recommend AmeriCorps to a Friend or Family Member Interested in Joining .............. 26
Figure 11: Average Percent Agreeing or Strongly Agreeing with Positive Service Experiences................... 28
Figure 12: Average Percent Agreeing or Strongly Agreeing with Negative Service Experiences................. 28
AMERICORPS ALUMNI OUTCOMES SUMMARY REPORT AMERICORPS
nationalservice.gov v
Figure 13: Alumni Cultural Competency .............................................................................................................. 32
Figure 14: Average Percent of Alumni Reporting Agreement with Self-efficacy Items ................................. 33
Figure 15: Career-specific Skills: Interacting with Others ................................................................................... 34
Figure 16: Career-specific Skills: Self-Management ............................................................................................. 35
Figure 17: AmeriCorps Helped Build Career-specific Skills............................................................................... 36
Figure 18: Average Percent Agreeing or Strongly Agreeing with AmeriCorps as a Worthwhile Experience
in Furthering Goals and Endeavors ....................................................................................................................... 37
Figure 19: Average Percent Agreeing or Strongly Agreeing with AmeriCorps as a Defining Personal and
Professional Experience ........................................................................................................................................... 39
Figure 20: Career Path .............................................................................................................................................. 40
Figure 21: Staying in the Community .................................................................................................................... 41
Figure 22: Alumni Career Pathways over Time ................................................................................................... 42
Table 4: Factors Predicting Alumni Careers.......................................................................................................... 43
Figure 24: People Alumni Trust in Their Neighborhoods .................................................................................. 46
Figure 25: Confidence in Institutions ..................................................................................................................... 47
Figure 26: Average Percent Agreeing or Strongly Agreeing with Attachment to Community ..................... 49
Figure 27: Average Percent of Alumni Reporting Civic Engagement in the Last 12 Months ........................ 50
Figure 28: Average Percent of Alumni Reporting Change in Likelihood of Civic Engagement ................... 51
Figure 29: Average Percent of Alumni Reporting Engaging in Political Discourse in the Last 12 Months . 52
Figure 30: Average Percent of Alumni Reporting Boycotting a Product or Service in the Last 12 Months . 53
Figure 31: Average Percent of Alumni Reporting Registering and Voting in the Last Presidential Election
..................................................................................................................................................................................... 54
Figure 32: Average Percent of Alumni Reporting Voting in the Last 12 Months ............................................ 55
Figure 33: Average Percent Reporting Ability to Address a Community Problem ........................................ 56

AMERICORPS ALUMNI OUTCOMES SUMMARY REPORT AMERICORPS
September, 2015
nationalservice.gov 1
Executive Summary and Key Findings Do national service experiences encourage AmeriCorps members to stay civically engaged and pursue
service-oriented careers? This question is central to this report, which examines survey results for former
members of the AmeriCorps State and National (ASN) program, the AmeriCorps National Civilian
Community Corps (NCCC) program, and the AmeriCorps VISTA program.
The purpose of this study was to understand and document long-term outcomes for AmeriCorps alumni,
particularly in four outcome areas: development of career-oriented soft skills, career pathways, sense of
community, and civic engagement. By comparing results for cohorts of AmeriCorps alumni who
completed their service in 2012, 2009, and 2004 (two, five, and 10 years before the survey project began),
the study also identified outcomes at different life stages.
The study addressed the following three research questions:
In what ways does participating in a national service program influence members’ a)
development of career-oriented soft skills, b) career pathways, c) sense of community, and d)
civic engagement?
In what ways, if any, do member outcomes vary by the six Serve America Act focus areas
(disaster services, economic opportunity, education, environmental stewardship, healthy futures,
and veterans and military families), and by the particular type of service programs (ASN, NCCC,
VISTA) and program experiences?
In what ways, if any, do member outcomes vary by life stage?
Research Methods An online survey was fielded using the Dillman (2000) approach,1 which involved sending alumni a pre-
survey announcement, an email invitation, and a series of phased reminders delivered by email, phone,
and mail. Alumni who did not respond online were offered the option to complete the survey by
telephone or mail back a paper survey. The survey drew largely on the exit survey AmeriCorps
administers to all members at the completion of their service, and was modified and pilot tested prior to
widespread administration. The questionnaire items asked about demographics, life stage information,
AmeriCorps service experience, development of career-oriented soft skills, career pathways, sense of
community, civic engagement, AmeriCorps branding, service focus area, and willingness to participate in
a follow-up survey.
The sampling frame consisted of all eligible alumni in the AmeriCorps Data Warehouse, an
administrative data system that contains records of all members who enrolled for a term of service.
Eligible alumni were full-time, half-time, and reduced half-time former AmeriCorps members from ASN,
NCCC, and VISTA, whose most recent service experience ended in 2012, 2009, or 2004. Analysis of the
data showed that there were 85,777 alumni who met the survey’s eligibility criteria. JBS drew separate
equal probability samples from each sampling stratum. Ultimately, 7,199 sample members were
contacted, from which 1,468 alumni provided usable survey results, for an overall response rate of 20
percent. Response rates varied by sampling stratum, program, and alumni year.
Nonresponse bias analysis was conducted to determine if nonresponse was random or biased due to
1 Dillman, D. A. (2000). Mail and Internet surveys: The tailored design method (2nd ed.). New York, NY: John
Wiley and Sons.
AMERICORPS ALUMNI OUTCOMES SUMMARY REPORT AMERICORPS
nationalservice.gov 2
systematic differences in characteristics between respondents and non-respondents.2 Among the variables
examined, the relative bias was as low as three percent of the sample mean for age and 2009 alumni but
was 23 percent for VISTA alumni and 2012 alumni, 24 percent for alumni who used their education
award and 27 percent for ASN alumni. Two steps were taken to adjust for nonresponse: 1) nonresponse
weights were applied to each sampling cohort to correct for nonresponse bias across programs and years,
2) regression analyses were used for assessing outcomes, which held constant the effect of demographic
and service characteristics.
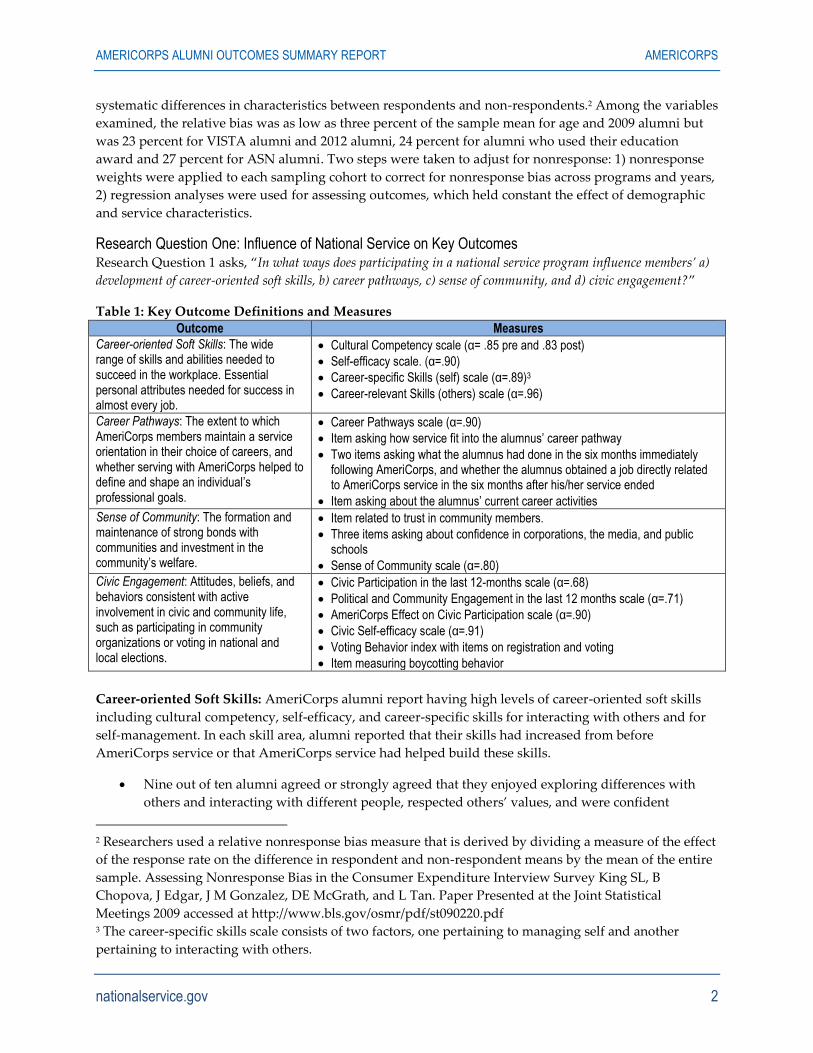
Research Question One: Influence of National Service on Key Outcomes Research Question 1 asks, “In what ways does participating in a national service program influence members’ a)
development of career-oriented soft skills, b) career pathways, c) sense of community, and d) civic engagement?”
Table 1: Key Outcome Definitions and Measures
Outcome Measures
Career-oriented Soft Skills: The wide range of skills and abilities needed to succeed in the workplace. Essential personal attributes needed for success in almost every job.
Cultural Competency scale (α= .85 pre and .83 post)
Self-efficacy scale. (α=.90)
Career-specific Skills (self) scale (α=.89)3
Career-relevant Skills (others) scale (α=.96)
Career Pathways: The extent to which AmeriCorps members maintain a service orientation in their choice of careers, and whether serving with AmeriCorps helped to define and shape an individual’s professional goals.
Career Pathways scale (α=.90)
Item asking how service fit into the alumnus’ career pathway
Two items asking what the alumnus had done in the six months immediately following AmeriCorps, and whether the alumnus obtained a job directly related to AmeriCorps service in the six months after his/her service ended
Item asking about the alumnus’ current career activities
Sense of Community: The formation and maintenance of strong bonds with communities and investment in the community’s welfare.
Item related to trust in community members.
Three items asking about confidence in corporations, the media, and public schools
Sense of Community scale (α=.80)
Civic Engagement: Attitudes, beliefs, and behaviors consistent with active involvement in civic and community life, such as participating in community organizations or voting in national and local elections.
Civic Participation in the last 12-months scale (α=.68)
Political and Community Engagement in the last 12 months scale (α=.71)
AmeriCorps Effect on Civic Participation scale (α=.90)
Civic Self-efficacy scale (α=.91)
Voting Behavior index with items on registration and voting
Item measuring boycotting behavior
Career-oriented Soft Skills: AmeriCorps alumni report having high levels of career-oriented soft skills
including cultural competency, self-efficacy, and career-specific skills for interacting with others and for
self-management. In each skill area, alumni reported that their skills had increased from before
AmeriCorps service or that AmeriCorps service had helped build these skills.
Nine out of ten alumni agreed or strongly agreed that they enjoyed exploring differences with
others and interacting with different people, respected others’ values, and were confident
2 Researchers used a relative nonresponse bias measure that is derived by dividing a measure of the effect
of the response rate on the difference in respondent and non-respondent means by the mean of the entire
sample. Assessing Nonresponse Bias in the Consumer Expenditure Interview Survey King SL, B
Chopova, J Edgar, J M Gonzalez, DE McGrath, and L Tan. Paper Presented at the Joint Statistical
Meetings 2009 accessed at http://www.bls.gov/osmr/pdf/st090220.pdf 3 The career-specific skills scale consists of two factors, one pertaining to managing self and another
pertaining to interacting with others.
AMERICORPS ALUMNI OUTCOMES SUMMARY REPORT AMERICORPS
nationalservice.gov 3
interacting with diverse people. Alumni showed gains in all these areas compared to before
service, with the largest gains in confidence interacting with diverse people.
Nine out of ten alumni agreed or strongly agreed that they could solve difficult problems, persist
when opposed, accomplish goals, handle unexpected events and unforeseen situations, remain
calm, cope with difficulties, and identify multiple solutions. Alumni rated their current skills as
higher than at pre-service, with the greatest gains being in their abilities to deal with unexpected
events and unforeseen situations.
Most alumni rated themselves as having good or excellent career-specific skills, including written
and oral communication, teamwork, collaboration with diverse individuals, professional
conduct, independence, planning, time management, prioritization, conflict management,
adaptability, persistence, and goal orientation. On average, 85 percent of alumni reported good or
excellent skills in interacting with others and 95 percent reported good or excellent skills in self-
management. On average, alumni said that AmeriCorps helped somewhat or a great deal in
building their skills in interacting with others (85 percent) and in self-management (95 percent).
Career Pathways: While there was some diversity in career pathways, most alumni were students prior
to AmeriCorps (63 percent), and of those who were engaged in education six months prior to
AmeriCorps, analysis shows that 44 percent were working in the government or nonprofit sector six
months after AmeriCorps and 56 percent are working in the government or nonprofit sector now.
Other alumni attended school after AmeriCorps, furthering their education goals. At the time of the
survey, more than half of alumni reported working in the nonprofit (33 percent) or government sector (25
percent). Following service, approximately one quarter of participants (27 percent) obtained a job directly
connected to the organization or agency in which they served. Fifteen percent are currently in a position
related to their service. A majority of alumni (80 percent) indicated their service experience was
worthwhile in furthering their careers. Most alumni responded that AmeriCorps service either aligned
with their existing career path or directed them towards a service-related field, with 34 percent indicating
that their career path turned in the direction of service-related work following AmeriCorps. After service,
43 percent of alumni stayed in their community of service.
Sense of Community: Overall, alumni reported having a strong sense of community, with an average of
82 percent of alumni agreeing that they felt a strong personal attachment to their community, were aware
of community needs, felt an obligation to contribute to their community, planned or were actively
involved in community issues, and voted in elections. Alumni reported a stronger sense of community at
the time of the survey compared to before service, with an average of 22 percent more alumni having
agreed or strongly agreed they were involved in the community. The strongest gains were in alumni who
agreed or strongly agreed that they are aware of the important needs in their community and that they
have a personal attachment to their community. Two thirds of alumni reported that they can trust most
or all of the people in their neighborhood. At the same time, less than half of alumni reported some or a
great deal of confidence in corporations (40 percent), or the media (42 percent), while a large majority (83
percent) reported some or a great deal of confidence in public schools.
Civic Engagement: AmeriCorps alumni reported high levels of civic engagement and civic self-efficacy
and indicated that their AmeriCorps experience influenced their civic engagement. Almost 80 percent of
alumni indicated that they definitely or probably had civic self-efficacy, defined as the ability to deal with
community problems by taking a range of actions that include creating a plan to address an issue, getting
others involved, organizing and running a meeting, identifying individuals or groups who could help, or
contacting an elected official. More than half of alumni noted that their service experience had made them
more likely to engage in civic activities such as volunteering for or donating money to a cause they cared
AMERICORPS ALUMNI OUTCOMES SUMMARY REPORT AMERICORPS
nationalservice.gov 4
about. Almost all alumni (94 percent) are registered to vote and 89 percent reported voting in the last
presidential election.
Research Question Two: Variation in Key Outcomes by Focus Areas, Programs, and Experience Research Question 2 asks, “In what ways, if any, do member outcomes vary by the six Serve America Act focus
areas (disaster services, economic opportunity, education, environmental stewardship, healthy futures, and veterans
and military families), and by the particular type of service programs (ASN, NCCC, VISTA) and program
experiences?”
Overall, there were no strong patterns between outcomes and service area focus or service program.
Generally, in each outcome area, small numbers of service focus areas or program cohorts were
significantly associated with a few outcomes. Similarly, no set of focus areas or service program cohorts
was significantly related to all of the outcome areas or to all of the outcomes within an outcome area.
Service experience variables were more often significantly related to outcomes. To measure the effect of
program experience on outcomes, the survey asked alumni about several aspects of their service
experience: how many terms they had served, in which programs they served, whether their final service
term was full-time, whether they had completed it, and whether they had used their education award.
Alumni also responded to questions about satisfaction with their AmeriCorps experience, as well as
questions asking them to rate several aspects of their service experience, which were used to derive a
positive service experience scale and a negative service experience scale. The most consistent association
was between a positive service experience and more positive outcomes in all outcome areas. Other
measures of service experience were significantly related to several outcomes, but there were no
consistent patterns across outcome areas or measures within an outcome area.
Career-oriented soft skills were strongly related to having a positive service experience. Alumni that
reported having a more positive service experience had significantly higher levels of each of the career-
oriented soft skills, including cultural competency, post-AmeriCorps self-efficacy, and career-specific
skills, both for managing self and for interacting with others. A positive service experience also increased
alumni’s likelihood of attributing the gains in their career-specific skills to AmeriCorps, as did alumni’s
greater satisfaction with their service experience.
A positive service experience and greater overall satisfaction with AmeriCorps were also significantly
related to higher career pathways scale scores. Additional variables influencing career pathways included
having multiple terms of service, having a job with an organization related to service both six months
after service and at the time of the survey, and completing the last term of service, which was associated
with greater frequency of alumni listing AmeriCorps on their resume and with currently having a job
with an organization associated with the alumni’s service.
As with career-oriented soft skills and career pathways, the most consistent predictor of sense of
community and civic participation outcomes was having a positive service experience. A more positive
service experience was significantly related to increased sense of community post-AmeriCorps, trust in
neighbors, trust in corporations, trust in the media, attributing changes in civic engagement to
AmeriCorps service, increased discussion and thinking on civic issues, and increased likelihood of
boycotting a service or product.
Research Question Three: Variation in Key Outcomes by Life Stage Research Question 3 asks, “In what ways, if any, do member outcomes vary by life stage?” The answer to this
research question focuses on alumni’s personal characteristics obtained from survey questions about
AMERICORPS ALUMNI OUTCOMES SUMMARY REPORT AMERICORPS
nationalservice.gov 5
demographics, life stages, and the skills and abilities that alumni brought to their AmeriCorps service.
In general, demographics, life stage, and pre-service skills had little effect on most alumni outcomes.
Demographics had little effect on career-oriented soft skills, sense of community, and civic engagement.
Alumni with less than a four-year degree were more likely to encourage civic engagement among others.
With regard to career pathways, alumni who had less than a four-year degree at the time of the survey
were more likely to be currently unemployed and less likely to be currently working at a public service
job. They were also less likely to be serving in a position at or directly connected to the agency that
sponsored the AmeriCorps program in which they served. Alumni’s life stage did have an effect on self-
efficacy, with those who were unemployed, working in the public sector, at a nonprofit, or at a
government agency, prior to service reporting higher post-service self-efficacy. Alumni’s ratings of their
self-efficacy also decreased with age. Alumni employed in the private sector prior to service were more
likely to be employed in the private sector post-service. Alumni who were older, in school before
AmeriCorps, or parents or caregivers at the time of service were more likely to be currently engaged in
service. Alumni’s post-service sense of community and civic engagement was largely independent of
alumni’s life stage. As expected, alumni’s pre-service skills were significantly associated with their
corresponding post-service levels. Career pathways outcomes were independent of pre-service skills.
Higher pre-service sense of community predicted higher civic engagement, and higher pre-service
cultural competency and self-efficacy predicted higher career-specific skills.
Conclusions and Recommendations Overall, respondents indicated that there were substantial benefits to participation in AmeriCorps
programs, including AmeriCorps State and National, AmeriCorps NCCC, and AmeriCorps VISTA.
Across all alumni, a vast majority stated that they felt they made a contribution to the community (92
percent), gained an understanding of the community they served (93 percent), and were exposed to new
ideas and ways of seeing the world (87 percent). Due to participation in AmeriCorps, a majority of
respondents stated that they were more likely to volunteer and to participate in community
organizations. In terms of the impact of service on alumni’s careers, respondents reported that
participation in AmeriCorps helped them figure out the next steps of their career and increased their
ability to work with others and to respond to unexpected challenges. In open-ended responses,
AmeriCorps participants stated that their experience helped them to define their values, made them more
likely to pursue a career in service, and had a positive impact on their life even after their term of service
ended. Positive outcomes, on the whole, were largely consistent across AmeriCorps participants and
independent of their service programs, focus areas, or personal characteristics. The key consistent driver
of successful outcomes in developing career-oriented soft skills, having a career pathway that led to work
in the government or nonprofit sector, and maintaining a sense of community and civic engagement after
AmeriCorps was a positive service experience. There were also some differences in outcomes related to
other service experience factors, but no strong patterns.
The association between satisfaction and positive service experience with successful later outcomes
provides support for the usefulness of measures of satisfaction and service experience quality in post-
service surveys. Support for an association between satisfaction immediately following service and later
satisfaction and positive outcomes would be strengthened by a longitudinal study following a cohort of
AmeriCorps members. Support for survey findings may also be substantially strengthened by an impact
evaluation using a benchmarking or comparison group that matched alumni on key characteristics.
AMERICORPS ALUMNI OUTCOMES SUMMARY REPORT AMERICORPS
nationalservice.gov 6
Chapter 1: Introduction Do national service experiences encourage AmeriCorps members to stay civically engaged and pursue
service-oriented careers? This question is central to this report, which looks at survey results for former
members of the AmeriCorps State and National program, the AmeriCorps National Civilian Community
Corps program, and the AmeriCorps VISTA program.
Founded by the Corporation for National and Community Service (CNCS) in 1994, the AmeriCorps
initiative consists of three distinct programs:
1. The AmeriCorps State and National program (ASN) provides grants to local and national
organizations and agencies to support recruitment, training, and placement of full-time and part-
time AmeriCorps members who engage in direct service activities, such as after-school tutoring
or homebuilding, and capacity-building activities, such as volunteer recruitment.
2. The AmeriCorps National Civilian Community Corps program (NCCC) organizes full-time
members aged 18–24 years into residential teams based at five campuses located throughout the
United States to conduct service projects focusing mainly on environmental restoration, disaster
services, and education.
3. The AmeriCorps VISTA program (VISTA) provides full-time members to community
organizations to expand local capacity by creating and expanding programs that are intended to
bring individuals and communities out of poverty.
The purpose of this study was to understand and document long-term outcomes for AmeriCorps alumni.
The study sought to understand the extent to which the experience of participating in AmeriCorps
encouraged alumni to maintain a continuing commitment in thought and action to civic engagement, and
whether AmeriCorps service has influenced former members’ career choices, for example, by leading to
careers in public service. The study examined four outcome areas: development of career-oriented soft
skills, career pathways, sense of community, and civic engagement. By comparing results for cohorts of
AmeriCorps alumni who completed their service in 2012, 2009, and 2004 (two, five, and 10 years before
the survey), the study also identified outcomes at different life stages.
The study addressed the following three research questions:
In what ways does participating in a national service program influence members’ a)
development of career-oriented soft skills, b) career pathways, c) sense of community, and d)
civic engagement?
In what ways, if any, do member outcomes vary by the six Serve America Act focus areas
(disaster services, economic opportunity, education, environmental stewardship, healthy futures,
and veterans and military families), and by the particular type of service programs (ASN, NCCC,
VISTA) and program experiences?
In what ways, if any, do member outcomes vary by life stage?
The key outcome areas addressed by these research questions are described below.
Attainment of Career-oriented Soft Skills Attainment of career-oriented soft skills covers the wide range of skills and abilities needed to succeed in
the workplace, including written and oral communication, teamwork, collaboration with diverse
individuals, professional conduct, independence, planning, time management, prioritization, conflict
management, adaptability, persistence, and goal orientation.
AMERICORPS ALUMNI OUTCOMES SUMMARY REPORT AMERICORPS
nationalservice.gov 7
Soft skills are differentiated from skill sets required for specific jobs (also known as hard skills) in that soft
skills are essential personal attributes needed for success in almost every job. AmeriCorps members gain
soft and hard skills through training and service experiences that provide direct experience utilizing new
skills in working with supervisors, teammates, and people in the community.
Career Pathways The career pathways outcome encapsulates the idea that former AmeriCorps members maintain a service
orientation in their choice of careers. This study investigated whether serving with AmeriCorps helped to
define and shape an individual’s professional goals, either by confirming existing goals or by helping to
set new goals, and whether AmeriCorps participation was helpful in advancing those goals. Of particular
interest would be evidence that service opens up new career possibilities for individuals, thus leading
them to pursue a different career path than they might have chosen otherwise, particularly if AmeriCorps
service redirected individuals into a service-related field or profession. The career pathways outcome
recognizes that this effect may occur in the short-term (e.g., by finding a service-oriented job shortly after
completing service) or in the medium and longer term (e.g., by taking a path into non-service work, but
then returning to service work). The career pathways outcome also acknowledges the wide range of
service-oriented careers, including work in the nonprofit, public, and government sectors, and military
service. AmeriCorps helps members to shape their own career path by giving them "real world" service
experiences.
Sense of Community Sense of community posits that individuals with AmeriCorps service experience will tend to form and
maintain stronger bonds with their communities and will have a greater stake in the community’s
welfare. Individuals with a strong sense of community will be more familiar with their neighbors,
demonstrate greater trust in their neighbors, and be more willing to extend a helping hand to others in
need. AmeriCorps seeks to promote a sense of community in members by placing them in organizations
that serve the needs of the community, and by working directly with those in need.
Civic Engagement Civic engagement encompasses attitudes, beliefs, and behaviors consistent with active involvement in
civic and community life. This includes participating in community organizations; voting in national and
local elections; keeping informed about news and public issues; actively promoting safe and clean
neighborhoods; and volunteering for, or donating money or goods to, causes and issues that one cares
about. Civically engaged individuals will tend to keep abreast of social and political issues, and will
express their opinions about these issues in various forums (discussions with friends and family, social
media posts, etc.). In addition to receiving training in effective citizenship4 , the AmeriCorps service
experience is intended to promote an ethic of service directly through service roles and assignments.
The service experiences of former AmeriCorps members were intended to influence them to be more
aware of problems in their communities and enable them to respond more effectively to these problems
by, for example, developing a plan to address a problem, getting others to care about the problem,
engaging in public speaking, and identifying and contacting potential allies to get help in solving the
problem.
The introduction of this report is followed by chapters that include a summary of methods used to collect
and analyze the data, a description of the survey respondents and their AmeriCorps service experiences,
4 http://www.nationalservice.gov/resources/member-and-volunteer-development/americorps-guide-
effective-citizenship-through-americorps

AMERICORPS ALUMNI OUTCOMES SUMMARY REPORT AMERICORPS
nationalservice.gov 8
the findings on alumni outcomes, a summary of the results focusing on the study’s research questions,
and the study’s conclusions.
Chapter 2: Research Methods CNCS contracted with JBS International to administer the AmeriCorps Alumni Outcomes Survey. JBS
fielded the online survey using the Dillman (2000) approach, which involved sending alumni a pre-
survey mail and email announcement, an email invitation and a series of phased reminders delivered by
email, phone, and the United States Postal Service (USPS).5 Alumni who did not respond online were
offered the option to complete the survey by telephone or mail back a paper survey. The remainder of
this chapter summarizes the sampling, survey administration, response rates, nonresponse analysis, and
calculation of analysis weights. A fuller discussion of the survey’s methods is available in a companion
document.
Questionnaire Development The draft survey drew largely on the exit survey AmeriCorps administers to all members at the
completion of their service. JBS and CNCS modified the survey and pilot tested it. The result was a
survey instrument comparable in length to the original survey, deployable by email, phone, and postal
mail, and able to be better understood by different program types and years of AmeriCorps involvement.
Wording changes were kept to a minimum to allow for future comparison with data from AmeriCorps’s
existing exit survey.
The questionnaire items asked about demographics, life stage information, AmeriCorps service
experience, development of career-oriented soft skills, career pathways, sense of community, civic
engagement, AmeriCorps branding, service focus area, and willingness to participate in a follow-up
survey. The survey questions were mostly close-ended multiple choice and forced choice response
options using nominal (e.g., yes/no) or ordinal (e.g., strongly agree/agree/neither agree nor
disagree/disagree/strongly disagree) scaling. Some items included a field for short open-ended responses
(See Appendix A for a copy of the survey).
Sampling For this study, the sampling unit was the former AmeriCorps member (alumnus). The sampling universe
included full-time, half-time, and reduced half-time former AmeriCorps members from ASN, NCCC and
VISTA, whose most recent service experience ended in 2012, 2009, or 2004. These time frames represented
alumni who completed their service two, five, and 10 years prior to the beginning of the study. Alumni of
Education Award only programs were included if one of the alumni’s terms, at some point, was a full-
time, half-time, or reduced half-time term. VISTA alumni who served only a summer term and
individuals who, in the sampled year, had a term with no hours served were excluded.
The sampling design had nine strata, a three-by-three design consisting of three programs and three time
periods: ASN, NCCC, and VISTA alumni completing their last service year in 2012, 2009, and 2004.
The sampling frame consisted of all eligible alumni in the AmeriCorps Data Warehouse, an
administrative data system that contains records of all members who enrolled for a term of service.
Analysis of the data showed that there were 85,777 alumni who met the survey’s eligibility criteria.
5 Dillman, D. A. (2000). Mail and Internet surveys: The tailored design method (2nd ed.). New York, NY: John
Wiley and Sons.
AMERICORPS ALUMNI OUTCOMES SUMMARY REPORT AMERICORPS
nationalservice.gov 9
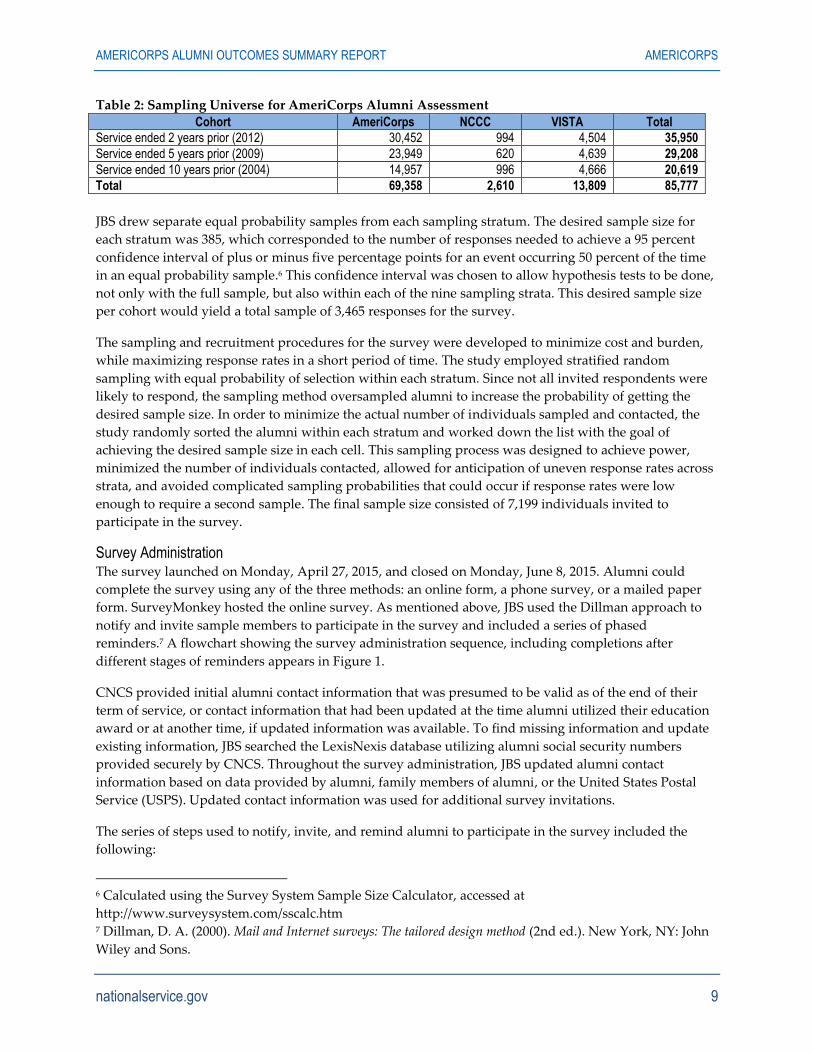
Table 2: Sampling Universe for AmeriCorps Alumni Assessment
Cohort AmeriCorps NCCC VISTA Total
Service ended 2 years prior (2012) 30,452 994 4,504 35,950
Service ended 5 years prior (2009) 23,949 620 4,639 29,208
Service ended 10 years prior (2004) 14,957 996 4,666 20,619
Total 69,358 2,610 13,809 85,777
JBS drew separate equal probability samples from each sampling stratum. The desired sample size for
each stratum was 385, which corresponded to the number of responses needed to achieve a 95 percent
confidence interval of plus or minus five percentage points for an event occurring 50 percent of the time
in an equal probability sample.6 This confidence interval was chosen to allow hypothesis tests to be done,
not only with the full sample, but also within each of the nine sampling strata. This desired sample size
per cohort would yield a total sample of 3,465 responses for the survey.
The sampling and recruitment procedures for the survey were developed to minimize cost and burden,
while maximizing response rates in a short period of time. The study employed stratified random
sampling with equal probability of selection within each stratum. Since not all invited respondents were
likely to respond, the sampling method oversampled alumni to increase the probability of getting the
desired sample size. In order to minimize the actual number of individuals sampled and contacted, the
study randomly sorted the alumni within each stratum and worked down the list with the goal of
achieving the desired sample size in each cell. This sampling process was designed to achieve power,
minimized the number of individuals contacted, allowed for anticipation of uneven response rates across
strata, and avoided complicated sampling probabilities that could occur if response rates were low
enough to require a second sample. The final sample size consisted of 7,199 individuals invited to
participate in the survey.
Survey Administration The survey launched on Monday, April 27, 2015, and closed on Monday, June 8, 2015. Alumni could
complete the survey using any of the three methods: an online form, a phone survey, or a mailed paper
form. SurveyMonkey hosted the online survey. As mentioned above, JBS used the Dillman approach to
notify and invite sample members to participate in the survey and included a series of phased
reminders.7 A flowchart showing the survey administration sequence, including completions after
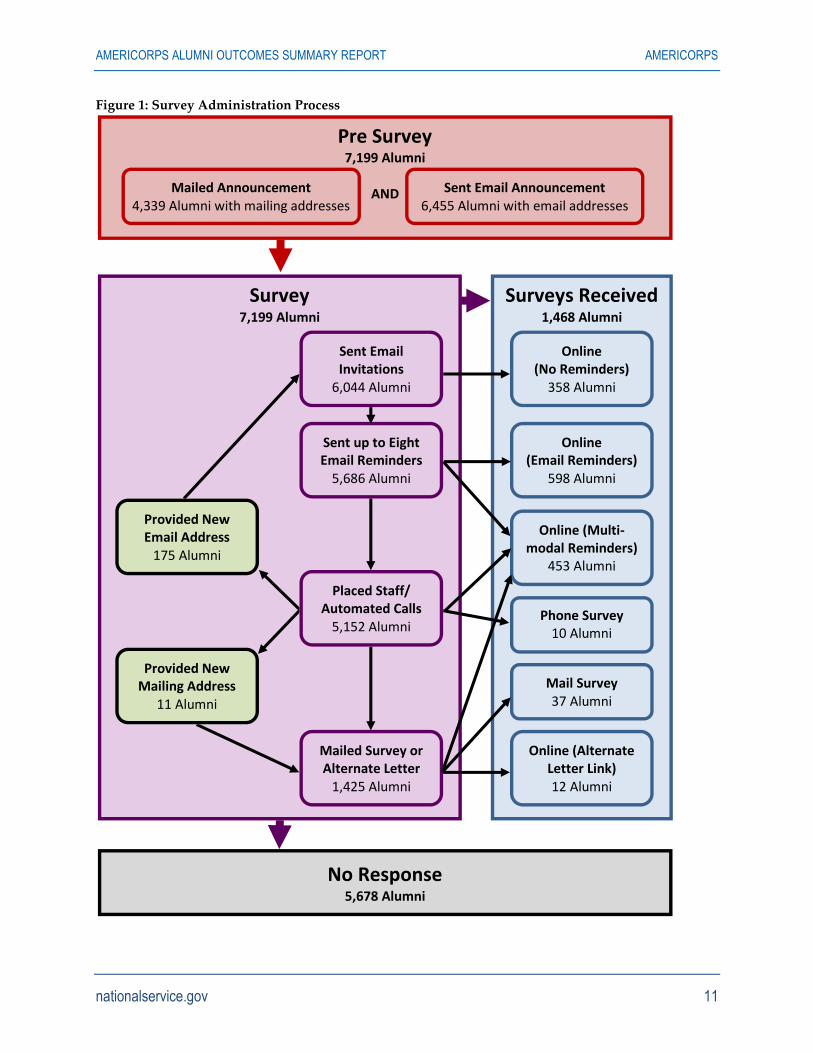
different stages of reminders appears in Figure 1.
CNCS provided initial alumni contact information that was presumed to be valid as of the end of their
term of service, or contact information that had been updated at the time alumni utilized their education
award or at another time, if updated information was available. To find missing information and update
existing information, JBS searched the LexisNexis database utilizing alumni social security numbers
provided securely by CNCS. Throughout the survey administration, JBS updated alumni contact
information based on data provided by alumni, family members of alumni, or the United States Postal
Service (USPS). Updated contact information was used for additional survey invitations.
The series of steps used to notify, invite, and remind alumni to participate in the survey included the
following:
6 Calculated using the Survey System Sample Size Calculator, accessed at
http://www.surveysystem.com/sscalc.htm 7 Dillman, D. A. (2000). Mail and Internet surveys: The tailored design method (2nd ed.). New York, NY: John
Wiley and Sons.
AMERICORPS ALUMNI OUTCOMES SUMMARY REPORT AMERICORPS
nationalservice.gov 10
1. To increase response and obtain more current contact information, JBS mailed a letter (signed by
three AmeriCorps directors) to alumni announcing the survey, inviting them to participate, and
requesting verification of their email address and phone number. The letter included a link to the
AmeriCorps Alumni Survey webpage to further legitimize the survey.
2. CNCS also sent an email via GovDelivery to raise awareness of the survey.
3. Sample members received email invitations that included a personalized survey link (also used
for reminders), incorporated the CNCS logo, and referenced the AmeriCorps Alumni Survey
webpage.
4. Email reminders were sent four, eight, and 12 days following the invitation email. Alumni, who
began the survey but did not complete it, received customized reminders encouraging their
participation. All alumni who had not yet completed the survey received a final email reminder
one day before the survey closed.
5. Alumni who did not complete their survey online within the 14-day reminder period, did not
have a valid email address, or had no known email address, were transferred from the list of
online contacts to those contacted by phone. JBS staff utilized a scripted introduction for the calls
and for voicemail messages left. Calls provided alumni the opportunity to take the survey using
the method of their choosing, to ask questions about the survey, and to provide additional
information.
6. Alumni were moved to a mail contact list if they could not be reached online or by phone, or if
they specifically requested a paper survey.
7. As the end of the survey approached, JBS utilized an automated phone system to twice remind
alumni to participate in the survey. PrecisionPolling, a subsidiary of SurveyMonkey, made
automated phone calls encouraging alumni to complete the survey, either online or by calling a
toll-free number to provide an email address.
Quality of Contact Information The quality of contact information was key to the survey’s ability to obtain survey responses from
alumni. At each step of the process outlined above, JBS recorded information on the outcomes of contact
attempts. The ability to deliver survey information varied by type of contact attempt. Of the 13,256 email
addresses used to contact sample members, the email host returned a message saying that 4,581 (35
percent) were invalid. Survey staff and the automated calling system made 13,024 calls to 6,121 phone
numbers belonging to 5,088 non-responding alumni and 64 alumni who had no email address. Of the
numbers called, 450 (seven percent) were wrong numbers and 4,261 (70 percent) did not answer and had
no voicemail or answering machine.
In the end, JBS was able to find at least one form of working contact information for all but 26
individuals. For these individuals, no working email address, phone number, or postal address could be
found. At the same time, while JBS was able to deliver survey information to almost all sample members,
it was not possible to determine if these contact attempts reached the intended target or whether they
were read or heard.
AMERICORPS ALUMNI OUTCOMES SUMMARY REPORT AMERICORPS
nationalservice.gov 11
Figure 1: Survey Administration Process
Surveys Received 1,468 Alumni
No Response 5,678 Alumni
Survey 7,199 Alumni
Pre Survey 7,199 Alumni
AND Sent Email Announcement
6,455 Alumni with email addresses Mailed Announcement
4,339 Alumni with mailing addresses
Online (Email Reminders)
598 Alumni
Online (No Reminders)
358 Alumni
Phone Survey 10 Alumni
Online (Alternate Letter Link) 12 Alumni
Mail Survey 37 Alumni
Online (Multi-modal Reminders)
453 Alumni
Mailed Survey or Alternate Letter
1,425 Alumni
Provided New Email Address
175 Alumni
Provided New Mailing Address
11 Alumni
Sent up to Eight Email Reminders
5,686 Alumni
Sent Email Invitations
6,044 Alumni
Placed Staff/ Automated Calls
5,152 Alumni

AMERICORPS ALUMNI OUTCOMES SUMMARY REPORT AMERICORPS
nationalservice.gov 12
Out of the total 7,199 sample members, 1,468 alumni provided usable survey results. This included 1,127
completed surveys and 341 partially completed surveys. In terms of nonresponse, less than one percent of
the sample (26 alumni) had no valid contact information, and less than one percent (27 alumni) directly
refused, while most of the sample (5,678 alumni) did not respond to survey requests. Of the 1,468
responses, almost 96 percent completed the survey online, only ten individuals completed the survey
with an interviewer on the phone, and another 49 alumni completed mail surveys, or completed the
survey through a link received by mail (four percent of respondents, total, for these modes combined).
Quality of the Data JBS assessed the quality of the data in several ways, including calculating response rates, analyzing the
effect of questionnaire item nonresponse and survey nonresponse as well as the effect of having multiple
survey response modes.
The response rate for the survey was calculated as the ratio of the number of respondents with completed
or partially completed surveys to the number of eligible respondents sampled.8 Dividing the 1,468 alumni
with usable results by the total sample size of 7,199 resulted in an overall response rate of 20 percent. The
number of eligible respondents was calculated by subtracting from the 7,247 initial sample members the
48 respondents that were identified as deceased through LexisNexis searches.
Response rates varied by sampling stratum, program, and alumni year. See Table 3 below for further
delineation. The overall response rate of 20 percent was lower than desired, however the sample size was
sufficiently large that reporting frequencies with a 95 percent confidence level of plus or minus five
percent for an event occurring 50 percent of the time was possible for the sample as a whole. The
individual cohort sizes were too small to achieve the desired level of precision. However, for most of the
survey items, the alumni year and service program samples were large enough to achieve the desired
precision.
Table 3: Response Rates by Year, Program, and Cohort.
Cohort Total
Sampled Completed
Partially Completed
Refused Not
Reachable No
Response
Total Useable
Responses
Response Rate
ASN 2,964 308 134 6 12 2,504 442 15%
NCCC 1,978 394 104 8 7 1,465 498 25%
VISTA 2,257 425 103 13 7 1,709 528 23%
2 year alumni
2,092 420 106 12 4 1,550 526 25%
5 year alumni
2,291 332 124 6 7 1,822 456 20%
10 year alumni
2,816 375 111 9 15 2,306 486 17%
TOTAL 7,199 1,127 341 27 26 5,678 1,468 20%
Partial Completion of Surveys and Item Response Analysis
Approximately 23 percent of survey responses were partial, with respondents breaking-off partway
through the survey. Any response that included at least one answer at or beyond Item 7 (Education) was
deemed to be sufficiently complete to include in the final analysis. Since the online survey required
8 This method of calculating the response rate is consistent with the OMB recommended formula and the
AAPOR and CASRO endorsed methods.
AMERICORPS ALUMNI OUTCOMES SUMMARY REPORT AMERICORPS
nationalservice.gov 13
answers for all items, respondents (with the exception of those responding by phone or mail) could not
skip any items without being forced to end the survey. The number of missing item responses increased
from one for the first item (skipped by a phone or mail respondent) to 338 for the final required item on
the survey. There were larger jumps in survey breakoff at the beginning of new pages, likely indicating
that respondents either stopped at the end of the prior page, or skipped one or more items on the prior
page and were prevented from moving to the next page due to the requirement that all items on a page
be completed before proceeding to the next page.
JBS tested for possible item-level response bias associated with taking the survey after receiving
reminders and completing the survey in different modalities (online, telephone, or paper). The results of
regression analysis showed that respondents who received reminders, whether they were online or
multimodal reminders, and respondents who took the survey by mail or phone differed little in their
responses from those who took the online survey without reminders.
Nonresponse Bias Analysis
JBS also conducted a nonresponse bias analysis to determine if the nonresponse was random, or if it was
biased due to systematic differences in characteristics between respondents and non-respondents. To
examine nonresponse bias across variables, JBS used a relative nonresponse bias measure that is derived
by dividing a measure of the effect of the response rate on the difference in respondent and non-
respondent means by the mean of the entire sample. Among the variables examined, the relative bias was
as low as three percent of the sample mean for age and 2009 alumni. At the high end, relative bias ranged
from 23 percent to 27 percent for VISTA and ASN members, 2012 alumni, and those using an education
award. Several variables fell in the middle, with relative biases of nine to 15 percent including gender,
NCCC alumni, 2014 alumni, alumni completing their terms of service, and alumni with updated email
addresses.
A logistic regression examined the effects of each variable on response when all other variables tested
were held constant. While age and number of terms of service were not significant, the rest of the
variables examined were. The reasons for nonresponse appeared to be that groups with more out-of-date
contact information, such as those with more years since serving or those who had not used their
education award, were less likely to respond. Education award use, in particular, offers an important
point of contact with CNCS, and members are likely to update their contact information with CNCS
when using their education award. On the other hand, groups that might have had a closer connection to
CNCS, such as alumni from CNCS’ centrally administered programs (VISTA and NCCC), alumni who
completed their terms of service, or served full-time, were more likely to respond.
JBS did two things to adjust for nonresponse bias in the analysis. First, JBS applied nonresponse weights
to each sampling cohort to correct for nonresponse bias across programs and years. To adjust for
nonresponse bias among the analysis variables (gender, alumni completing service, full-term members,
and education award use), JBS used regressions that held constant the effect of these variables when
assessing the outcome variables. No adjustment was made for email updating since it was not an analysis
variable. However, its effect would probably be similar to that for the education award.
Weights
For analysis purposes, the data were weighted using both sampling weights and nonresponse weights.
The sampling weights were calculated as the inverse of the sampling ratios so that each cohort’s weighted
size corresponded to its proportion of the alumni universe. For example, while there were roughly equal
numbers of interviews collected in each program, ASN members received higher weights to reflect their
higher proportion in the sampling universe. To adjust for differential nonresponse rates across cohorts,
AMERICORPS ALUMNI OUTCOMES SUMMARY REPORT AMERICORPS
nationalservice.gov 14
nonresponse weights were calculated as the inverse of the response rate. The sampling weights and
nonresponse weights were multiplied together and the weights were normalized so that the sum of the
weights equaled the number of surveys. This means that the weighted frequencies correspond to a
nationally representative sample of alumni across the sampled cohorts and programs. The raw and
weighted frequencies for the survey items are presented in Appendices B and C.
Data Analysis This section describes the data analysis used to present and summarize the study results. It covers
treatment of missing values, descriptive analysis, regression analysis, and development of scales for
summarizing outcome and service experience data. In conducting both the descriptive and the regression
analysis, JBS used statistical techniques that account for the complex sample design and produce design-
corrected standard errors.
Treatment of Missing Data
In the analysis, list-wise deletion was used to eliminate portions of surveys with missing data for specific
analyses. Given the large size of the dataset and the significant number of analyses being conducted, it
was not feasible to use multiple imputation or other missing data techniques. Thus, the univariate
analysis of each variable includes only those respondents who answered the question. Respondents were
dropped from the multivariate analysis for each outcome item if any of the analysis variables for that
model were missing.
Descriptive Statistics – Means and Proportions
The descriptive statistics included the means and proportions of the survey items. The analysis looked at
all the alumni surveys as a group and at the surveys by program (ASN alumni, NCCC alumni, and
VISTA alumni) as well as by service cohorts (alumni two, five, and 10 years post-service).
One way to measure the accuracy of these survey statistics is to calculate their relative standard errors
(RSE), which measures the ratio of the standard error to the mean. Lower RSEs mean that the estimates
have greater precision, as they have smaller variances relative to their means. In this report, means and
proportions with relative standard errors between 30 and 50 percent are reported with caution, and
estimates that have RSEs greater than 50 are not reported. Appendices B and C show the raw and
weighted percentages for the survey items and identifies those that should be interpreted with caution or
were suppressed. Throughout the report, any results that need to be interpreted with caution are marked
with a footnote.
Scales and Scale Construction
The 2015 AmeriCorps Alumni Survey was designed to measure outcomes associated with AmeriCorps
participation in terms of alumni career-oriented soft skills, career pathways, sense of community and
civic engagement. The survey included multiple items measuring each outcome. In addition, some
outcome-related items asked the respondent to select more than one option, or rate items among a set of
related responses. JBS developed scales and indices that identified and summarized different components
of the outcome measures and that summarized alumni service experiences. To validate the scales, the
internal reliability of each construct was measured by calculating the Cronbach’s Alpha (α) for each of the
scales. All of the scales had high reliability estimates of α = 0.68 or higher (average α = 0.85). The
individual scales are described in the discussion of outcomes in Chapter 4.
Regression Analysis
To better understand the outcomes and to answer the research questions, the analysis used regression
techniques to examine the effects of demographic, life stage, and service-related characteristics on the
outcome variables. The regression results make it possible to present the effect of each characteristic on
AMERICORPS ALUMNI OUTCOMES SUMMARY REPORT AMERICORPS
nationalservice.gov 15
outcomes controlling for the effect of other factors. For example, regressions allow for assessment of the
influence of alumni service experience on outcomes when demographics and life stage variables are held
constant. The characteristics controlled for and/or used to predict the outcomes in the regression analysis
included variables on alumni demographics, life stage, service descriptors, satisfaction with service, and
pre-service self-perception ratings for outcome measures. Two variables in the model, gender and having
updated contact information, were included as controls related to nonresponse bias. The regression
models including the outcome, control, and predictor variables are further explained in Chapter 4.
Study Limitations While every effort was made to ensure that the survey was as representative and valid as possible, there
were some limitations to the study design and implementation. First off, response rates for the survey
both overall and within cohorts were lower than anticipated. They were certainly below the target rate of
80 percent. However, the rate of participation for an online survey was in the range that some might
anticipate for a widely distributed call for participation by members (between 1 and 40 percent9).
Additionally, not all participants who were surveyed provided complete data for the study. Although all
alumni who participated in the study provided some information that was useful for this study, over one-
third of survey takers did not fully complete the survey. It is possible that providing monetary incentives
would improve the response rates for future surveys. Additionally, efforts to keep in touch with alumni
and maintain current contact information should improve future response rates. At times when data
collection does not necessarily have to cover all aspects of the AmeriCorps logic model, constructs from
the survey might be shortened or omitted to reduce the length of the survey instrument to prevent
participant drop-out mid-survey. The list of demographic questions probably could be shortened in the
future. Some of these items demonstrated limited variability for particular items, or for response
categories. Attempts at following up with phone and mail surveys to reduce both non-participation and
survey drop-out were valuable, but it remains questionable as to whether these efforts are cost-effective
enough at boosting response rate.
Reducing the length of the survey, and perhaps providing incentives, may have the added benefit of
reducing satisficing, where respondents give the fastest answer to complete the survey, perhaps by
checking down the columns or picking the top answer listed across the board, or by picking responses
that do not require further elaboration.10 From the survey item response frequencies , it is difficult to
ascertain whether the strongly positive opinions reported in the survey were or were not a function of
satisficing, and so future validation efforts of the AmeriCorps alumni study might investigate the role
that satisficing may play in shaping response patterns across items.
Lack of Counterfactual
While the current study presents promising findings based on AmeriCorps alumni’s self-reported
outcomes, the use of counterfactual or benchmarking groups is necessary to make a plausible assertion
that, all else being equal, AmeriCorps alumni have significantly better outcomes than non-AmeriCorps
alumni.
9 http://www.practicalsurveys.com/respondents/typicalresponserates.php 10 The original survey design called for the use of incentives. The use of incentives was denied by the
Office of Management and Budget during the Paperwork Reduction Act review
AMERICORPS ALUMNI OUTCOMES SUMMARY REPORT AMERICORPS
nationalservice.gov 16
Chapter 3: Alumni Demographics, Life Stages, and Service Experiences The responding alumni represented the breadth of AmeriCorps members, encompassing alumni with
different demographics and life stages, and representing a variety of service experiences. Responding
alumni lived in every state and the District of Columbia, as well as outside the United States. California
had the highest proportion of respondents, with 11 percent of the total.
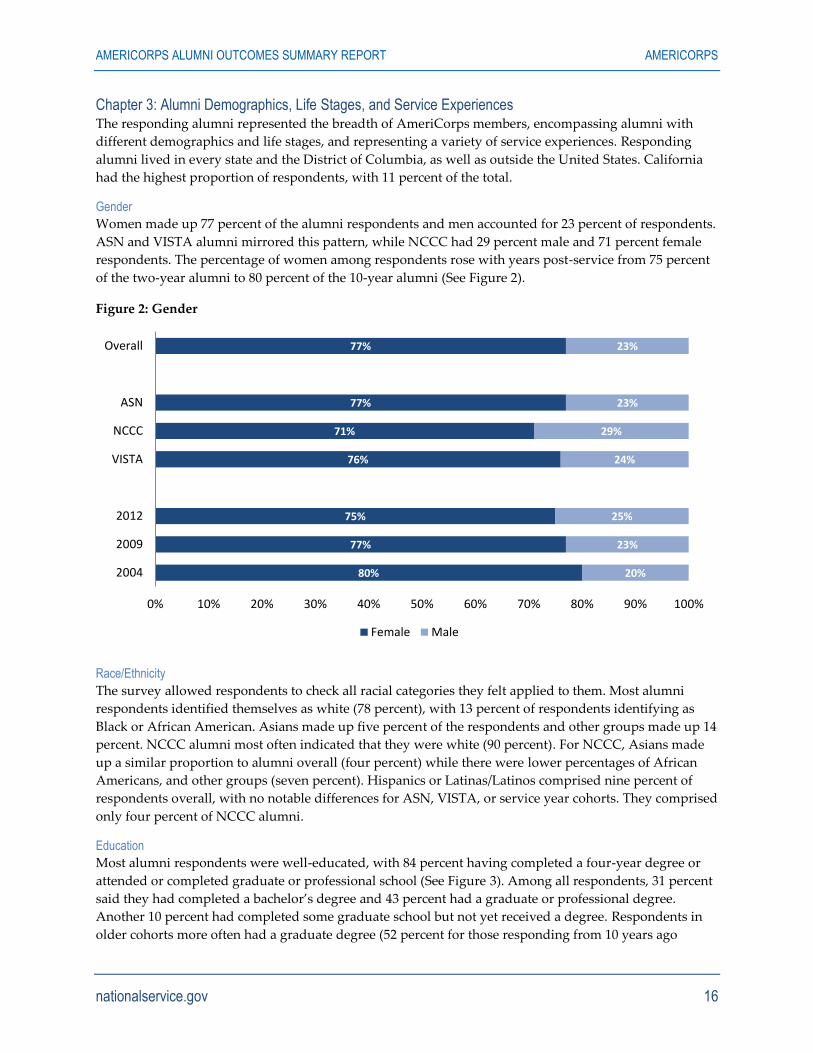
Gender
Women made up 77 percent of the alumni respondents and men accounted for 23 percent of respondents.
ASN and VISTA alumni mirrored this pattern, while NCCC had 29 percent male and 71 percent female
respondents. The percentage of women among respondents rose with years post-service from 75 percent
of the two-year alumni to 80 percent of the 10-year alumni (See Figure 2).
Figure 2: Gender
Race/Ethnicity
The survey allowed respondents to check all racial categories they felt applied to them. Most alumni
respondents identified themselves as white (78 percent), with 13 percent of respondents identifying as
Black or African American. Asians made up five percent of the respondents and other groups made up 14
percent. NCCC alumni most often indicated that they were white (90 percent). For NCCC, Asians made
up a similar proportion to alumni overall (four percent) while there were lower percentages of African
Americans, and other groups (seven percent). Hispanics or Latinas/Latinos comprised nine percent of
respondents overall, with no notable differences for ASN, VISTA, or service year cohorts. They comprised
only four percent of NCCC alumni.
Education
Most alumni respondents were well-educated, with 84 percent having completed a four-year degree or
attended or completed graduate or professional school (See Figure 3). Among all respondents, 31 percent
said they had completed a bachelor’s degree and 43 percent had a graduate or professional degree.
Another 10 percent had completed some graduate school but not yet received a degree. Respondents in
older cohorts more often had a graduate degree (52 percent for those responding from 10 years ago
80%
77%
75%
76%
71%
77%
77%
20%
23%
25%
24%
29%
23%
23%
0% 10% 20% 30% 40% 50% 60% 70% 80% 90% 100%
2004
2009
2012
VISTA
NCCC
ASN
Overall
Female Male

AMERICORPS ALUMNI OUTCOMES SUMMARY REPORT AMERICORPS
nationalservice.gov 17
versus 33 percent for those responding from two years ago). ASN and VISTA alumni were more likely to
have completed graduate or professional degrees (43 and 42 percent respectively), compared to 29
percent of NCCC alumni.
Figure 3: Education
Marital Status
The majority of the alumni respondents (52 percent) had never married (See Figure 4). Forty percent
reported that they were either married (35 percent) or living in a common law marriage or domestic
partnership (5 percent). The remaining eight percent were separated, divorced, or widowed. The
proportion of never married respondents decreased with post-service years dropping from 75 percent
never married for the two-year alumni cohort to 23 percent never married for the 10-year cohort.
19%
18%
13%
15%
21%
16%
16%
81%
82%
87%
85%
79%
84%
84%
0% 10% 20% 30% 40% 50% 60% 70% 80% 90% 100%
2004
2009
2012
VISTA
NCCC
ASN
Overall
Less than a 4-year college degree 4-year college degree or higher
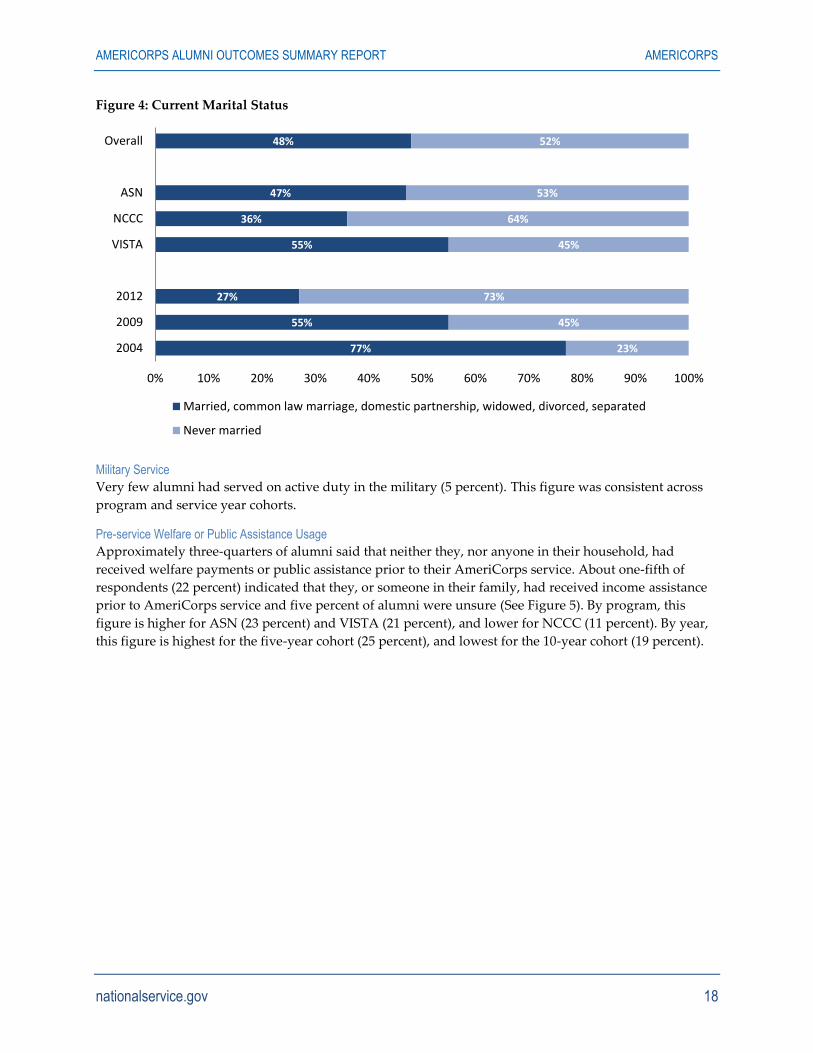
AMERICORPS ALUMNI OUTCOMES SUMMARY REPORT AMERICORPS
nationalservice.gov 18
Figure 4: Current Marital Status
Military Service
Very few alumni had served on active duty in the military (5 percent). This figure was consistent across
program and service year cohorts.
Pre-service Welfare or Public Assistance Usage
Approximately three-quarters of alumni said that neither they, nor anyone in their household, had
received welfare payments or public assistance prior to their AmeriCorps service. About one-fifth of
respondents (22 percent) indicated that they, or someone in their family, had received income assistance
prior to AmeriCorps service and five percent of alumni were unsure (See Figure 5). By program, this
figure is higher for ASN (23 percent) and VISTA (21 percent), and lower for NCCC (11 percent). By year,
this figure is highest for the five-year cohort (25 percent), and lowest for the 10-year cohort (19 percent).
77%
55%
27%
55%
36%
47%
48%
23%
45%
73%
45%
64%
53%
52%
0% 10% 20% 30% 40% 50% 60% 70% 80% 90% 100%
2004
2009
2012
VISTA
NCCC
ASN
Overall
Married, common law marriage, domestic partnership, widowed, divorced, separated
Never married
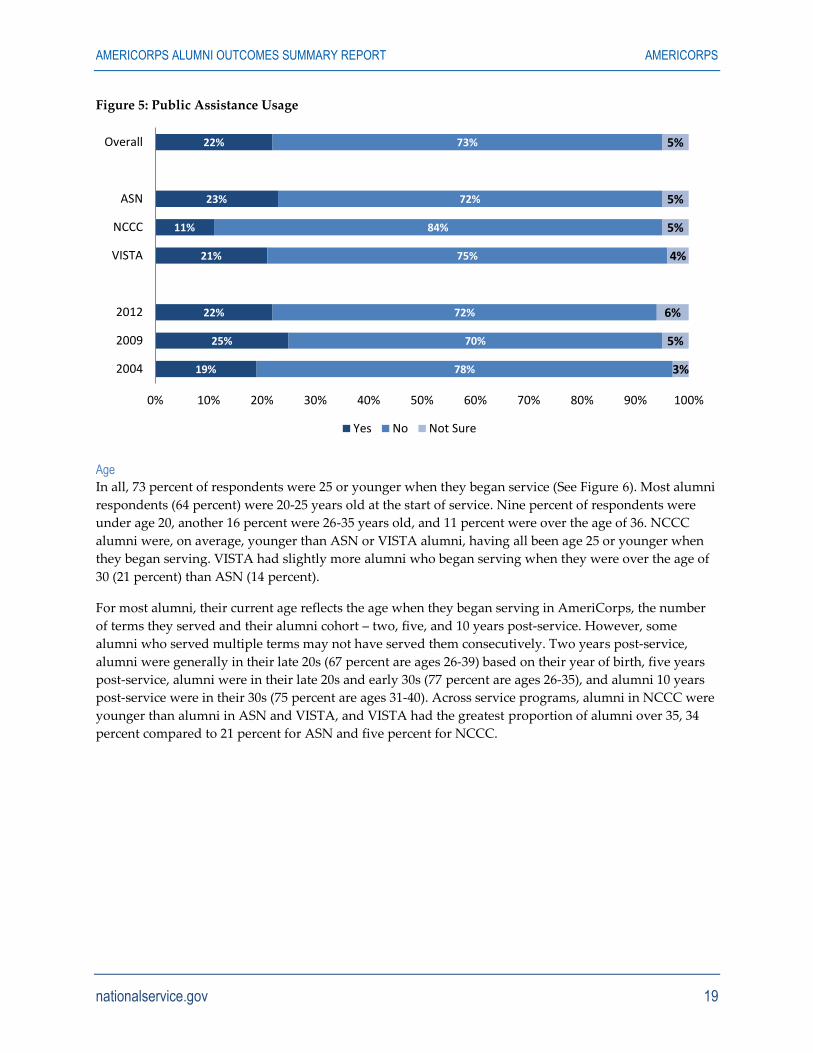
AMERICORPS ALUMNI OUTCOMES SUMMARY REPORT AMERICORPS
nationalservice.gov 19
Figure 5: Public Assistance Usage
Age
In all, 73 percent of respondents were 25 or younger when they began service (See Figure 6). Most alumni
respondents (64 percent) were 20-25 years old at the start of service. Nine percent of respondents were
under age 20, another 16 percent were 26-35 years old, and 11 percent were over the age of 36. NCCC
alumni were, on average, younger than ASN or VISTA alumni, having all been age 25 or younger when
they began serving. VISTA had slightly more alumni who began serving when they were over the age of
30 (21 percent) than ASN (14 percent).
For most alumni, their current age reflects the age when they began serving in AmeriCorps, the number
of terms they served and their alumni cohort – two, five, and 10 years post-service. However, some
alumni who served multiple terms may not have served them consecutively. Two years post-service,
alumni were generally in their late 20s (67 percent are ages 26-39) based on their year of birth, five years
post-service, alumni were in their late 20s and early 30s (77 percent are ages 26-35), and alumni 10 years
post-service were in their 30s (75 percent are ages 31-40). Across service programs, alumni in NCCC were
younger than alumni in ASN and VISTA, and VISTA had the greatest proportion of alumni over 35, 34
percent compared to 21 percent for ASN and five percent for NCCC.
19%
25%
22%
21%
11%
23%
22%
78%
70%
72%
75%
84%
72%
73%
3%
5%
6%
4%
5%
5%
5%
0% 10% 20% 30% 40% 50% 60% 70% 80% 90% 100%
2004
2009
2012
VISTA
NCCC
ASN
Overall
Yes No Not Sure
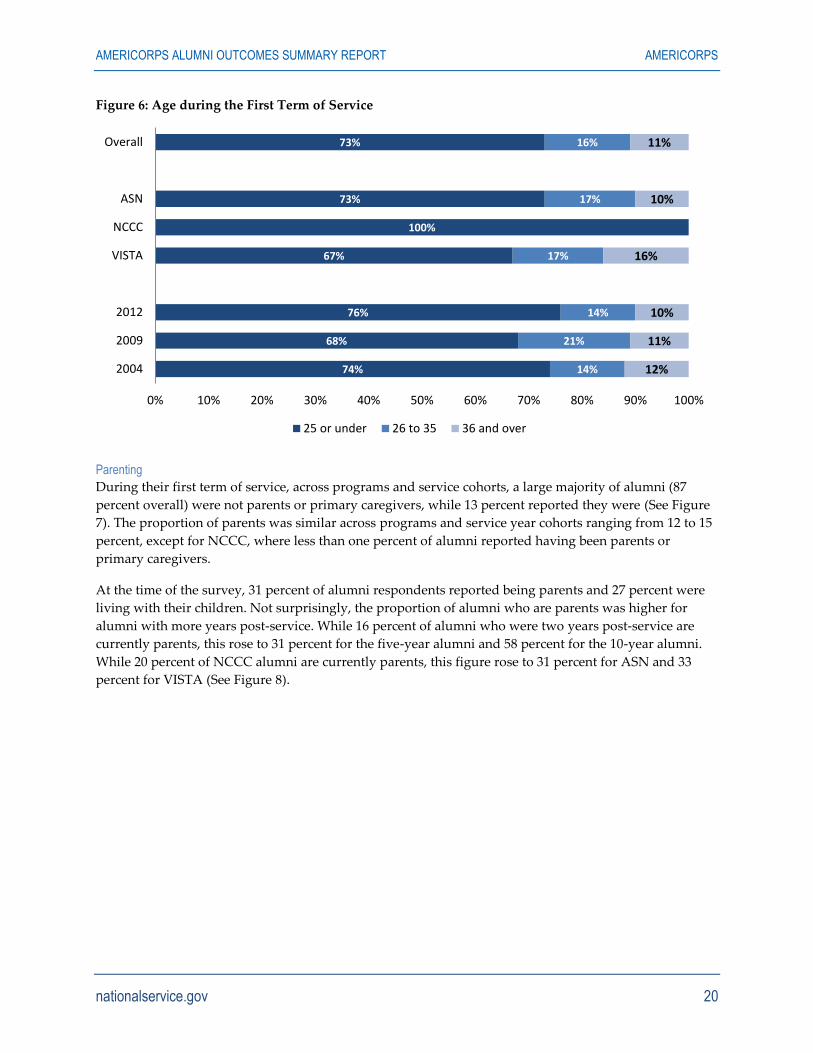
AMERICORPS ALUMNI OUTCOMES SUMMARY REPORT AMERICORPS
nationalservice.gov 20
Figure 6: Age during the First Term of Service
Parenting
During their first term of service, across programs and service cohorts, a large majority of alumni (87
percent overall) were not parents or primary caregivers, while 13 percent reported they were (See Figure
7). The proportion of parents was similar across programs and service year cohorts ranging from 12 to 15
percent, except for NCCC, where less than one percent of alumni reported having been parents or
primary caregivers.
At the time of the survey, 31 percent of alumni respondents reported being parents and 27 percent were
living with their children. Not surprisingly, the proportion of alumni who are parents was higher for
alumni with more years post-service. While 16 percent of alumni who were two years post-service are
currently parents, this rose to 31 percent for the five-year alumni and 58 percent for the 10-year alumni.
While 20 percent of NCCC alumni are currently parents, this figure rose to 31 percent for ASN and 33
percent for VISTA (See Figure 8).
74%
68%
76%
67%
100%
73%
73%
14%
21%
14%
17%
17%
16%
12%
11%
10%
16%
10%
11%
0% 10% 20% 30% 40% 50% 60% 70% 80% 90% 100%
2004
2009
2012
VISTA
NCCC
ASN
Overall
25 or under 26 to 35 36 and over
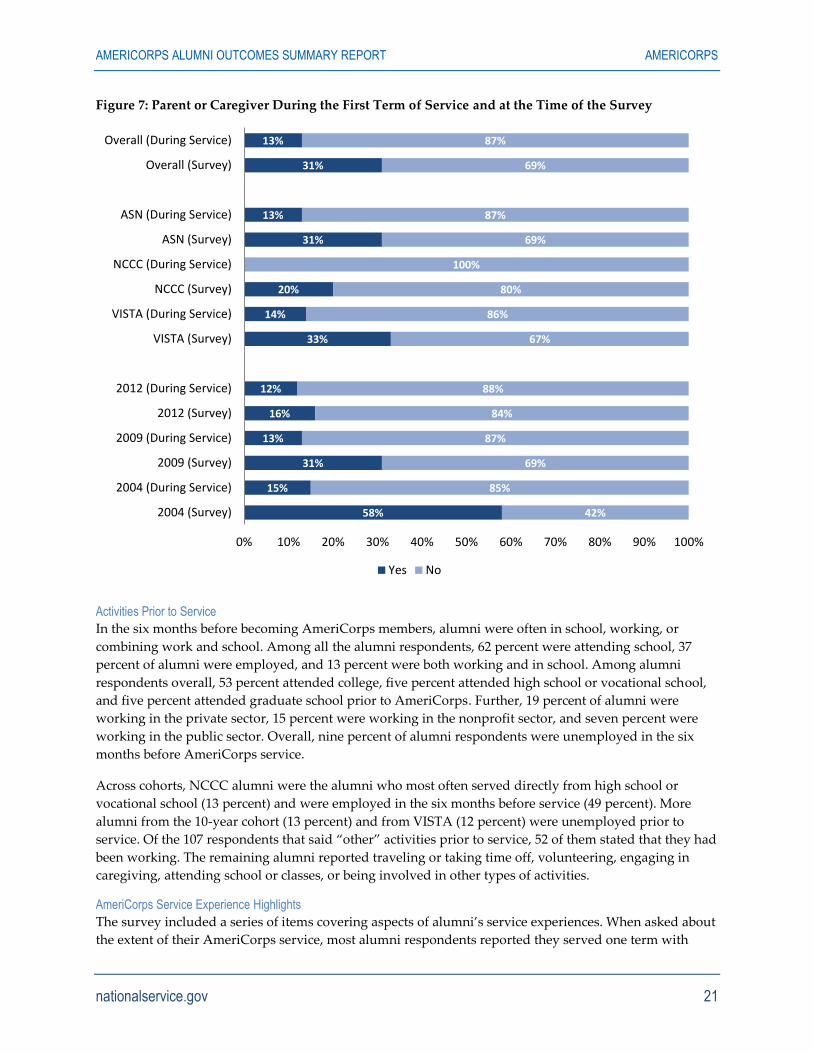
AMERICORPS ALUMNI OUTCOMES SUMMARY REPORT AMERICORPS
nationalservice.gov 21
Figure 7: Parent or Caregiver During the First Term of Service and at the Time of the Survey
Activities Prior to Service
In the six months before becoming AmeriCorps members, alumni were often in school, working, or
combining work and school. Among all the alumni respondents, 62 percent were attending school, 37
percent of alumni were employed, and 13 percent were both working and in school. Among alumni
respondents overall, 53 percent attended college, five percent attended high school or vocational school,
and five percent attended graduate school prior to AmeriCorps. Further, 19 percent of alumni were
working in the private sector, 15 percent were working in the nonprofit sector, and seven percent were
working in the public sector. Overall, nine percent of alumni respondents were unemployed in the six
months before AmeriCorps service.
Across cohorts, NCCC alumni were the alumni who most often served directly from high school or
vocational school (13 percent) and were employed in the six months before service (49 percent). More
alumni from the 10-year cohort (13 percent) and from VISTA (12 percent) were unemployed prior to
service. Of the 107 respondents that said “other” activities prior to service, 52 of them stated that they had
been working. The remaining alumni reported traveling or taking time off, volunteering, engaging in
caregiving, attending school or classes, or being involved in other types of activities.
AmeriCorps Service Experience Highlights
The survey included a series of items covering aspects of alumni’s service experiences. When asked about
the extent of their AmeriCorps service, most alumni respondents reported they served one term with
58%
15%
31%
13%
16%
12%
33%
14%
20%
31%
13%
31%
13%
42%
85%
69%
87%
84%
88%
67%
86%
80%
100%
69%
87%
69%
87%
0% 10% 20% 30% 40% 50% 60% 70% 80% 90% 100%
2004 (Survey)
2004 (During Service)
2009 (Survey)
2009 (During Service)
2012 (Survey)
2012 (During Service)
VISTA (Survey)
VISTA (During Service)
NCCC (Survey)
NCCC (During Service)
ASN (Survey)
ASN (During Service)
Overall (Survey)
Overall (During Service)
Yes No
AMERICORPS ALUMNI OUTCOMES SUMMARY REPORT AMERICORPS
nationalservice.gov 22
AmeriCorps (63 percent), while 33 percent had served two terms, and the remainder had served three or
four terms. ASN alumni (34 percent) and VISTA alumni (32 percent) more often served multiple terms
versus NCCC alumni, where only 23 percent served multiple terms. The number of terms of service was
highest in the more recent alumni cohorts. Forty-five percent of the two-year post-service alumni served
multiple terms, compared to 35 percent for the five-year cohort and 28 percent for the 10-year cohort.
Year Starting AmeriCorps Service
When reviewing the dates alumni began serving in AmeriCorps, most alumni reported service entry
dates fairly near their exit dates, usually completing their service within a three-year window before they
left service. This included alumni with multiple terms of service. For example, among alumni exiting
service in 2012, 89 percent reported beginning service in 2010, 2011, or 2012. A similar pattern of exiting
service, one, two, or three years after entering service was reported by 86 percent of 2010 alumni and 88
percent of 2004 alumni. A smaller percentage, between eight and 11 percent, said that they first served
four or more years before exiting AmeriCorps. A small number of alumni (3-4 percent) that were five-
years and 10-years post-service said they served an additional term (e.g., a reduced part-time term) after
their exit year.
Full-time, Part-time, and Other Service Terms
Across their multiple terms of service, 85 percent of alumni reported that they had served at least one
term of full-time service. Another 17 percent reported that they served at least one part-time term, two
percent reported they served a quarter-time term, and three percent reported they served minimum time.
Among ASN alumni, 82 percent reported serving at least one full-time term versus 99 percent of NCCC
alumni and 96 percent of VISTA alumni. Similarly, more ASN alumni served part-time (20 percent) than
VISTA (6 percent) or NCCC (3 percent). ASN alumni more often served quarter-time or minimum time (5
percent). There were some differences across year cohorts, with alumni two years post-service more often
serving full-time, (89 percent) versus 79 and 84 percent of five-year and 10-year post-service alumni.
Alumni 10 years post-service less often served part-time (13 percent) compared to those two years and
five years post-service (17 percent and 19 percent). Alumni who were five years post-service had the
highest percentage serving minimum time or quarter time (7 percent).
Four-fifths of alumni respondents (79 percent) reported that they only served full-time, 12 percent served
only part-time, a few reported serving only quarter-time or minimum time terms, and six percent
reported serving multiple types of terms. This pattern was similar for ASN. VISTA and NCCC had more
alumni who served only full-time, 92 percent and 97 percent respectively. Across the year cohorts, alumni
that were two years and 10 years post-service reflected the overall pattern, while alumni five years post-
service had 74 percent serving only full-time and 17 percent serving only part-time.
Service Programs
Across their multiple terms, 57 percent of alumni said they had served in ASN, 31 percent in VISTA, and
16 percent in NCCC. Only a few respondents served in NCCC FEMA Corps, which is a newer program.
Alumni sometimes reported serving terms of service in other programs. Among ASN alumni, 18 percent
reported serving in VISTA and 16 percent in NCCC. For NCCC alumni, seven percent reported serving in
ASN and a few reported serving in VISTA or FEMA Corps. And among VISTA alumni, seven percent
reported serving in ASN and a small number in NCCC or NCCC FEMA Corps.
When describing their history of AmeriCorps service, alumni were asked to report the program where
they served. In looking at the three alumni groups, ASN, NCCC, and VISTA, NCCC and VISTA alumni
almost always reported that they had served in their respective programs, with 98 percent and 99 percent
reporting that they had served at least one term in NCCC and VISTA respectively. ASN alumni, on the
AMERICORPS ALUMNI OUTCOMES SUMMARY REPORT AMERICORPS
nationalservice.gov 23
other hand, less often reported that they had served a term in ASN (69 percent).
Alumni who listed ASN for one or more terms of service were asked to identify the name of the program
entity in which they served for each applicable term of service. Of the 423 individual responses, Teach for
America was the single most common response (n=42), followed by City Year (n=30), affiliates of The
Corps Network (n=25), and affiliates of Public Allies (n=11). A large number of responses were too vague
to identify affiliation (n=97). The organizations listed by alumni represented a wide spectrum of service
organizations with emphases in all CNCS focus areas. The names of individual grantees and subgrantees
listed by alumni were also indicative of wide geographic representation at the time of service.
Strength of Association with AmeriCorps, Programs, Organizations, and Sites
Another survey question explored alumni’s identification with AmeriCorps, asking alumni how closely
they associated their AmeriCorps service with AmeriCorps, with a particular service program, with the
agency or nonprofit that ran their program, and with the organization or site where they served.
Overall, 63 percent of alumni said they closely or very closely associated their service with AmeriCorps.
This varied by service program, with 88 percent of NCCC alumni associating closely or very closely with
AmeriCorps, followed by 70 percent of VISTA alumni and 61 percent of ASN alumni. This differed little
by post-service year.
Association with the particular service program (ASN, NCCC, VISTA, or FEMA Corps) was lower
overall, with 40 percent of alumni reporting they closely or very closely associated their service with a
particular service program. This differed by program. Among NCCC alumni, 92 percent closely or very
closely associated service with their program. This dropped to 66 percent for VISTA alumni and 31
percent for ASN alumni. Association with a service program also varied across the alumni year cohorts,
with the 10-year cohort most often saying they associated service closely or very closely with a service
program (51 percent) and two-year and five-year cohorts reporting a lesser proportion (36 percent).
When asked about the agency or nonprofit that operated the program, 65 percent of alumni said they
closely or very closely associated their service with an agency or nonprofit AmeriCorps grantee. This
varied little by post-service year, but did differ by service program. ASN and VISTA alumni more often
associated service closely or very closely with the program operator (66 percent and 64 percent), while 39
percent of NCCC alumni did so.
Among alumni overall, 73 percent closely or very closely associated service with a specific organization
or site where they served. There was little difference in terms of time post-service, however there were
differences by program. ASN alumni and VISTA alumni had their strongest identification at this level,
with 74 and 73 percent saying that they closely or very closely identified their service with the
organization or site where they served, compared to 53 percent of NCCC alumni.
In addition to the response categories above, 52 alumni selected an "other" associational tie. Sixteen of
these respondents provided a short description indicating that they associated their service with the team
they served with (n=9) or with the community or communities where they served (n=7). The most
frequent response (n=11) to this item was some variant of “I don’t understand this question.”
Focus Areas
The alumni respondents served in all of the Serve America Focus Areas. A large majority of alumni (71
percent) reported education-focused service. The next most commonly reported focus areas were capacity
building (18 percent), healthy futures (18 percent), environmental stewardship (17 percent), and economic
opportunity (14 percent). Six percent of alumni said their focus area was disaster services and only a few
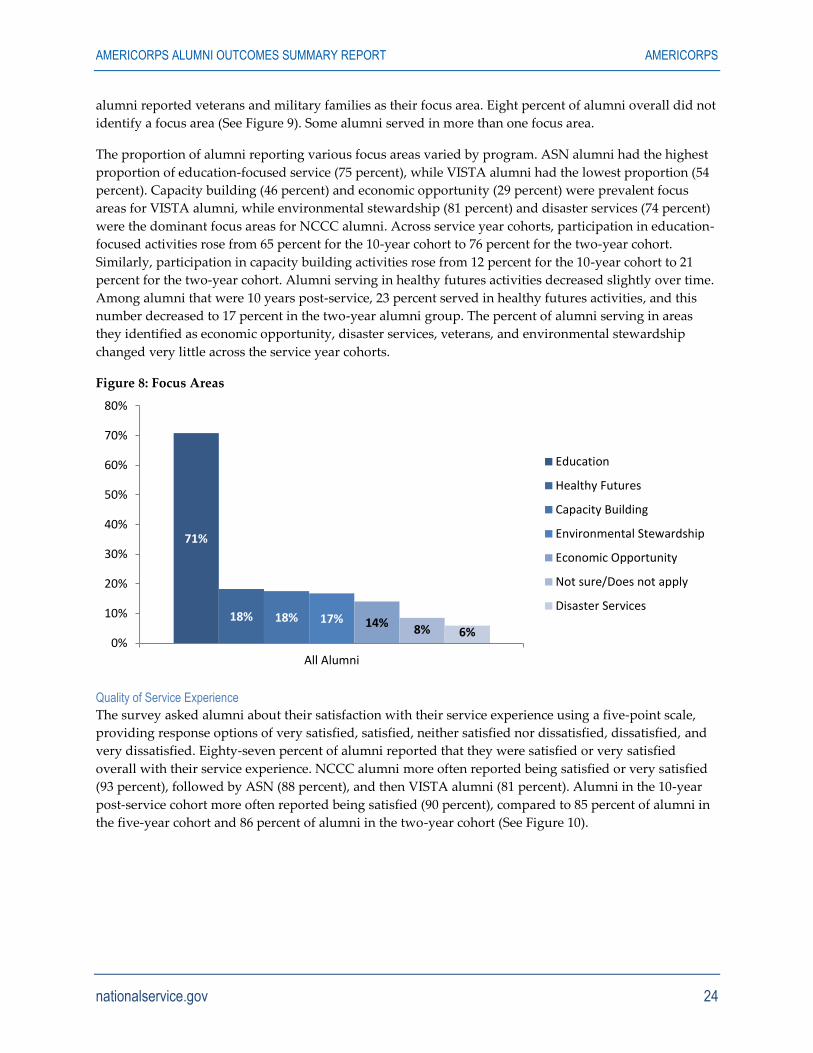
AMERICORPS ALUMNI OUTCOMES SUMMARY REPORT AMERICORPS
nationalservice.gov 24
alumni reported veterans and military families as their focus area. Eight percent of alumni overall did not
identify a focus area (See Figure 9). Some alumni served in more than one focus area.
The proportion of alumni reporting various focus areas varied by program. ASN alumni had the highest
proportion of education-focused service (75 percent), while VISTA alumni had the lowest proportion (54
percent). Capacity building (46 percent) and economic opportunity (29 percent) were prevalent focus
areas for VISTA alumni, while environmental stewardship (81 percent) and disaster services (74 percent)
were the dominant focus areas for NCCC alumni. Across service year cohorts, participation in education-
focused activities rose from 65 percent for the 10-year cohort to 76 percent for the two-year cohort.
Similarly, participation in capacity building activities rose from 12 percent for the 10-year cohort to 21
percent for the two-year cohort. Alumni serving in healthy futures activities decreased slightly over time.
Among alumni that were 10 years post-service, 23 percent served in healthy futures activities, and this
number decreased to 17 percent in the two-year alumni group. The percent of alumni serving in areas
they identified as economic opportunity, disaster services, veterans, and environmental stewardship
changed very little across the service year cohorts.
Figure 8: Focus Areas
Quality of Service Experience
The survey asked alumni about their satisfaction with their service experience using a five-point scale,
providing response options of very satisfied, satisfied, neither satisfied nor dissatisfied, dissatisfied, and
very dissatisfied. Eighty-seven percent of alumni reported that they were satisfied or very satisfied
overall with their service experience. NCCC alumni more often reported being satisfied or very satisfied
(93 percent), followed by ASN (88 percent), and then VISTA alumni (81 percent). Alumni in the 10-year
post-service cohort more often reported being satisfied (90 percent), compared to 85 percent of alumni in
the five-year cohort and 86 percent of alumni in the two-year cohort (See Figure 10).
71%
18% 18% 17% 14%8% 6%
0%
10%
20%
30%
40%
50%
60%
70%
80%
All Alumni
Education
Healthy Futures
Capacity Building
Environmental Stewardship
Economic Opportunity
Not sure/Does not apply
Disaster Services
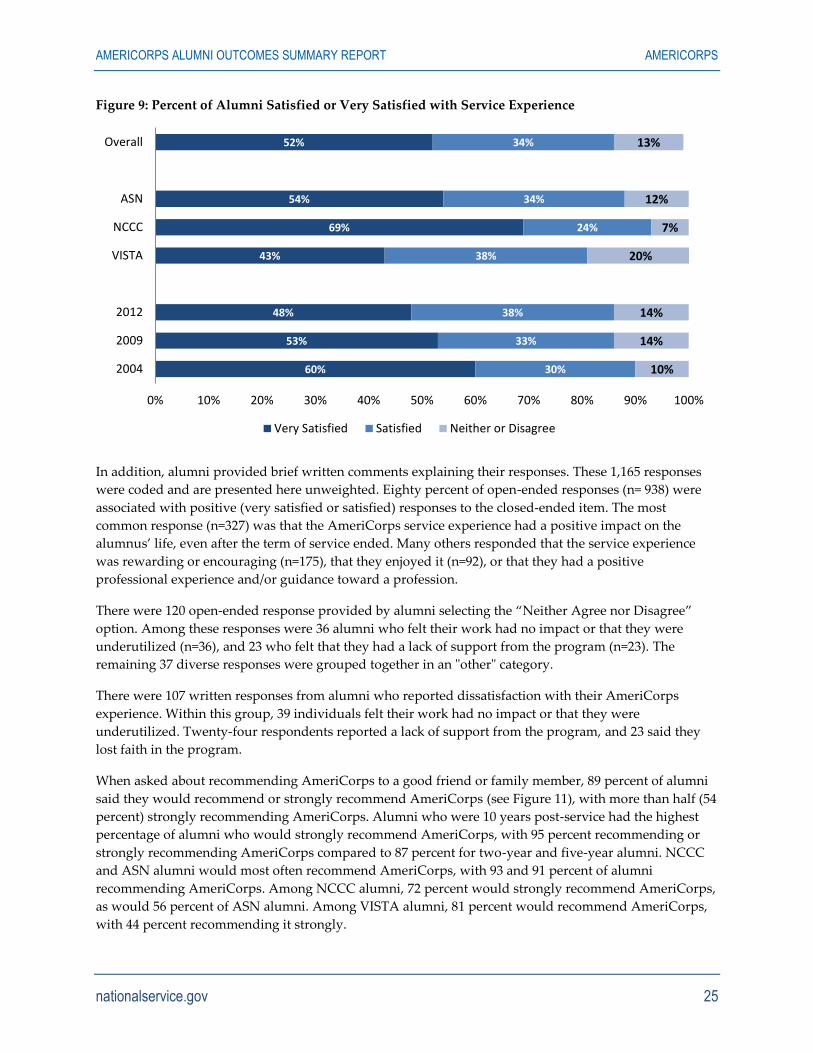
AMERICORPS ALUMNI OUTCOMES SUMMARY REPORT AMERICORPS
nationalservice.gov 25
Figure 9: Percent of Alumni Satisfied or Very Satisfied with Service Experience
In addition, alumni provided brief written comments explaining their responses. These 1,165 responses
were coded and are presented here unweighted. Eighty percent of open-ended responses (n= 938) were
associated with positive (very satisfied or satisfied) responses to the closed-ended item. The most
common response (n=327) was that the AmeriCorps service experience had a positive impact on the
alumnus’ life, even after the term of service ended. Many others responded that the service experience
was rewarding or encouraging (n=175), that they enjoyed it (n=92), or that they had a positive
professional experience and/or guidance toward a profession.
There were 120 open-ended response provided by alumni selecting the “Neither Agree nor Disagree”
option. Among these responses were 36 alumni who felt their work had no impact or that they were
underutilized (n=36), and 23 who felt that they had a lack of support from the program (n=23). The
remaining 37 diverse responses were grouped together in an "other" category.
There were 107 written responses from alumni who reported dissatisfaction with their AmeriCorps
experience. Within this group, 39 individuals felt their work had no impact or that they were
underutilized. Twenty-four respondents reported a lack of support from the program, and 23 said they
lost faith in the program.
When asked about recommending AmeriCorps to a good friend or family member, 89 percent of alumni
said they would recommend or strongly recommend AmeriCorps (see Figure 11), with more than half (54
percent) strongly recommending AmeriCorps. Alumni who were 10 years post-service had the highest
percentage of alumni who would strongly recommend AmeriCorps, with 95 percent recommending or
strongly recommending AmeriCorps compared to 87 percent for two-year and five-year alumni. NCCC
and ASN alumni would most often recommend AmeriCorps, with 93 and 91 percent of alumni
recommending AmeriCorps. Among NCCC alumni, 72 percent would strongly recommend AmeriCorps,
as would 56 percent of ASN alumni. Among VISTA alumni, 81 percent would recommend AmeriCorps,
with 44 percent recommending it strongly.
60%
53%
48%
43%
69%
54%
52%
30%
33%
38%
38%
24%
34%
34%
10%
14%
14%
20%
7%
12%
13%
0% 10% 20% 30% 40% 50% 60% 70% 80% 90% 100%
2004
2009
2012
VISTA
NCCC
ASN
Overall
Very Satisfied Satisfied Neither or Disagree
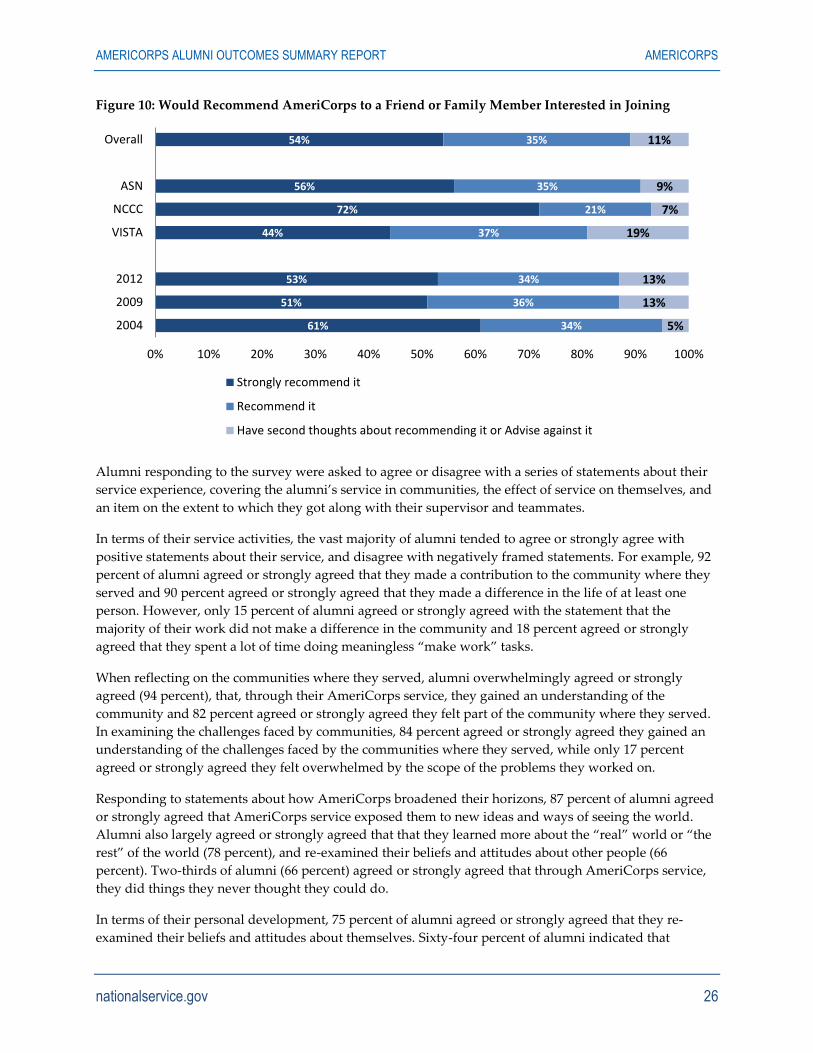
AMERICORPS ALUMNI OUTCOMES SUMMARY REPORT AMERICORPS
nationalservice.gov 26
Figure 10: Would Recommend AmeriCorps to a Friend or Family Member Interested in Joining
Alumni responding to the survey were asked to agree or disagree with a series of statements about their
service experience, covering the alumni’s service in communities, the effect of service on themselves, and
an item on the extent to which they got along with their supervisor and teammates.
In terms of their service activities, the vast majority of alumni tended to agree or strongly agree with
positive statements about their service, and disagree with negatively framed statements. For example, 92
percent of alumni agreed or strongly agreed that they made a contribution to the community where they
served and 90 percent agreed or strongly agreed that they made a difference in the life of at least one
person. However, only 15 percent of alumni agreed or strongly agreed with the statement that the
majority of their work did not make a difference in the community and 18 percent agreed or strongly
agreed that they spent a lot of time doing meaningless “make work” tasks.
When reflecting on the communities where they served, alumni overwhelmingly agreed or strongly
agreed (94 percent), that, through their AmeriCorps service, they gained an understanding of the
community and 82 percent agreed or strongly agreed they felt part of the community where they served.
In examining the challenges faced by communities, 84 percent agreed or strongly agreed they gained an
understanding of the challenges faced by the communities where they served, while only 17 percent
agreed or strongly agreed they felt overwhelmed by the scope of the problems they worked on.
Responding to statements about how AmeriCorps broadened their horizons, 87 percent of alumni agreed
or strongly agreed that AmeriCorps service exposed them to new ideas and ways of seeing the world.
Alumni also largely agreed or strongly agreed that that they learned more about the “real” world or “the
rest” of the world (78 percent), and re-examined their beliefs and attitudes about other people (66
percent). Two-thirds of alumni (66 percent) agreed or strongly agreed that through AmeriCorps service,
they did things they never thought they could do.
In terms of their personal development, 75 percent of alumni agreed or strongly agreed that they re-
examined their beliefs and attitudes about themselves. Sixty-four percent of alumni indicated that
61%
51%
53%
44%
72%
56%
54%
34%
36%
34%
37%
21%
35%
35%
5%
13%
13%
19%
7%
9%
11%
0% 10% 20% 30% 40% 50% 60% 70% 80% 90% 100%
2004
2009
2012
VISTA
NCCC
ASN
Overall
Strongly recommend it
Recommend it
Have second thoughts about recommending it or Advise against it

AMERICORPS ALUMNI OUTCOMES SUMMARY REPORT AMERICORPS
nationalservice.gov 27
AmeriCorps service helped them figure out their next steps in terms of their career/professional goals,
and 56 percent of alumni indicated that service helped them figure out next steps in their educational
goals. Most alumni disagreed or strongly disagreed that they had had issues getting along well with their
supervisor and/or teammates, though 13 percent agreed or strongly agreed.
In general, the service program and alumni year cohorts mirrored the patterns above. Among the
exceptions were that VISTA alumni less often agreed or strongly agreed to statements about the
contribution of their service to the community, with 82 percent agreeing or strongly agreeing compared
to 95 percent overall. NCCC alumni agreed or strongly agreed more often than other groups that service
had broadened their horizons or caused them to examine their beliefs (74 percent versus 63 percent
overall). They also less often agreed or strongly agreed that they felt that they were defeated by the scope
of the problems they worked on or that the majority of their work did not make a difference (7 percent vs
17 percent overall). ASN alumni more often said AmeriCorps helped them figure out their next steps in
terms of education (57 percent versus 49 percent for NCCC and VISTA). They also less often agreed or
strongly agreed that they spent a lot of time doing “make work” tasks compared to NCCC and VISTA
alumni (16 percent for ASN versus 23 percent for NCCC and 24 percent for VISTA). There were few
differences among the service year cohorts. Alumni 10 years post-service less often agreed or strongly
agreed with negative statements about being defeated by problems (10 percent versus 17 percent overall),
doing “make work” (14 percent versus 18 percent overall), their work not making a difference (9 percent
versus 15 percent overall), or not getting along with supervisors and teammates (8 percent versus 13
percent overall).
The 16 individual items in this question were also analyzed as two scales. The Positive Service Experience
scale included items related to the participants’ positive experiences or growth (e.g., “I examined my
beliefs and attitudes about myself” or “I was exposed to new ideas and ways of seeing the world.”). The
Negative Service Experience scale included items that were typically phrased negatively, related to
negative experiences or interactions with others during service (e.g., “I did not get along well with my
supervisor and/or my teammates” or “I felt defeated by the scope of the problems I worked on”). On
average, 78 percent of alumni agreed or strongly agreed with the positive service statements, while only
16 percent agreed or strongly agreed with the negative statements. Agreement with negative statements
decreased over time from 18 percent for the alumni two years post-service to eight percent from alumni
10 years post-service (See Figure 12).
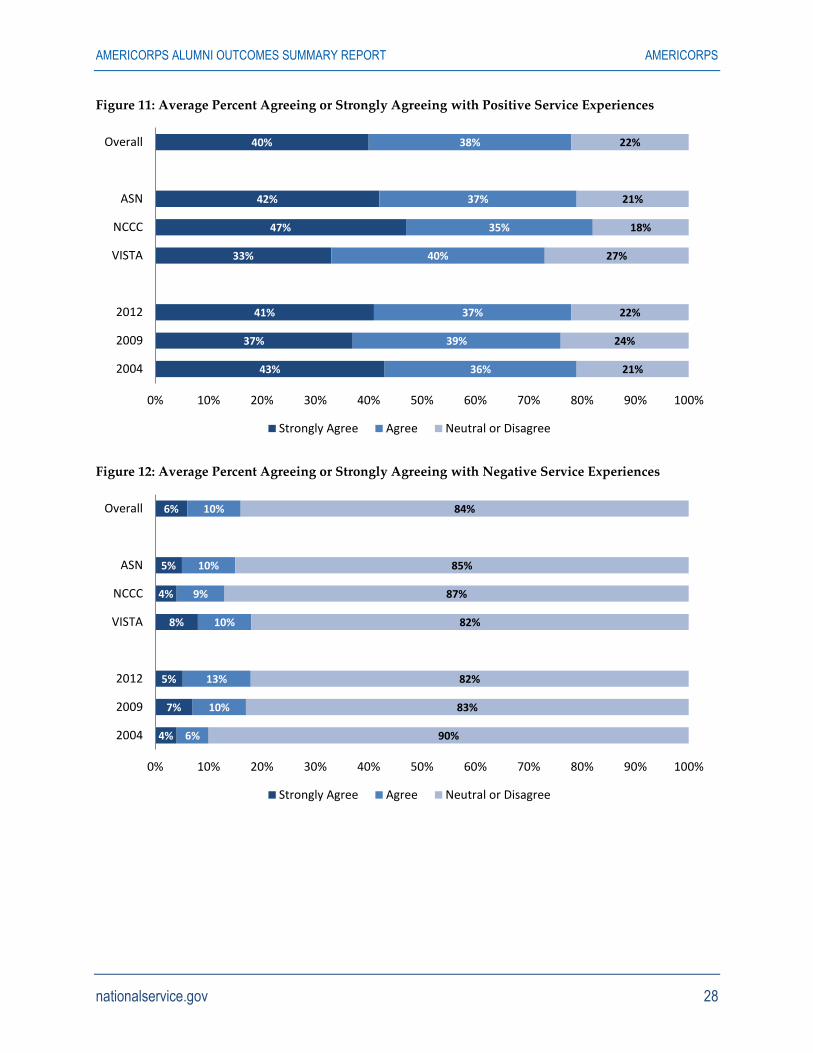
AMERICORPS ALUMNI OUTCOMES SUMMARY REPORT AMERICORPS
nationalservice.gov 28
Figure 11: Average Percent Agreeing or Strongly Agreeing with Positive Service Experiences
Figure 12: Average Percent Agreeing or Strongly Agreeing with Negative Service Experiences
43%
37%
41%
33%
47%
42%
40%
36%
39%
37%
40%
35%
37%
38%
21%
24%
22%
27%
18%
21%
22%
0% 10% 20% 30% 40% 50% 60% 70% 80% 90% 100%
2004
2009
2012
VISTA
NCCC
ASN
Overall
Strongly Agree Agree Neutral or Disagree
4%
7%
5%
8%
4%
5%
6%
6%
10%
13%
10%
9%
10%
10%
90%
83%
82%
82%
87%
85%
84%
0% 10% 20% 30% 40% 50% 60% 70% 80% 90% 100%
2004
2009
2012
VISTA
NCCC
ASN
Overall
Strongly Agree Agree Neutral or Disagree
AMERICORPS ALUMNI OUTCOMES SUMMARY REPORT AMERICORPS
nationalservice.gov 29
Chapter 4: Alumni Outcomes One component of the AmeriCorps service experience is developing member skills through community
service. Members gain skills and develop character in areas that will serve them on the job and in their
personal lives. This chapter documents alumni outcomes in each of the four outcome areas, career-
oriented soft skills, career pathways, sense of community, and civic engagement. For each outcome area,
alumni respondents provided answers to questions measuring different components of the outcome. The
scales, indices, and individual items for each outcome area are listed below and described in further
detail in the study results chapter. The exact wording of each item and the associated response options
for the underlying variables can be found in the full raw and weighted frequency tables in Appendices B
and C.
Career-oriented soft skills:
A Cultural Competency scale, with four items related to abilities and enjoyment of interacting
with people different from themselves. (α= .85 pre and .83 post)
A Self-efficacy scale, with 10 items related to abilities to solve problems and deal with challenges.
(α=.90)
Two factors addressing Career-specific skills scale. (α=.89) The first factor contains five items
related to managing one’s own work, while the second factor contains eight items related to
interacting with others to solve problems.
A Career-relevant Skills scale, with 14 items addressing perceptions of the effect of AmeriCorps
on their career-relevant soft skills. (α=.96)
Career pathways:
A Career Pathways scale that contains five items related to the extent to which AmeriCorps was a
personally and professionally defining experience. (α=.90)
An item asking how AmeriCorps service fit into the alumnus’ career pathway.
An item asking what the alumnus had done in the six months immediately following
AmeriCorps.
An item asking whether the alumnus obtained a job directly related to their AmeriCorps service
in the six months after their service ended.
An item asking about the alumnus’ current career activities.
Sense of community:
An item related to trust in community members.
Three items asking about confidence in corporations, the media, and public schools, respectively.
A Sense of Community scale that contains four items asking about attachment to the community,
awareness of needs, and importance of engagement in the community. (α=.80)
Civic engagement:
A scale measuring Civic Participation in the last 12 months containing four items. (α=.68)
A scale measuring Political and Community Engagement in the last 12 months containing four
items. (α=.71)
An AmeriCorps Effect on Civic Participation scale containing six items related to participation in
community organizations, voting, volunteering, and charitable giving. (α=.90)
A Civic Self-efficacy scale containing eight items related to the ability to address community
problems and organize others to help address problems. (α=.91)
A Voting Behavior index including items on voting registration and behavior.
An individual item measuring boycotting behavior.
AMERICORPS ALUMNI OUTCOMES SUMMARY REPORT AMERICORPS
nationalservice.gov 30
Regression analysis examined the effects of alumni’s service experiences and their characteristics on the
outcome measures listed above. Logistic regression was used for outcomes with dichotomous response
variables (e.g., yes/no) and Ordinary Least Squares regression was used for ordinal responses (e.g.,
strongly agree to strongly disagree).
The models include all of the predictor variables associated with the survey’s research questions. The
same set of predictor variables is used for each outcome to make comparisons easier. To compensate for
having multiple comparisons, results are only reported if they were significant at the p<.01 level. To
account for including all the predictor and control variables, we report the regression’s Adjusted R-
squared. The adjusted R-squared modifies R-squared (the usual measure of the variance explained by a
regression) by accounting for the number of predictors in the model. Additional insignificant variables in
the model do not boost the adjusted R-squared, but can boost R-squared. The full regression results are
presented in Appendix C.
The characteristics controlled for and/or used to predict outcomes in the regression were described in
Chapter 3. The exception was the pre-service self-perceptions of skills in the outcome areas, which are
presented in this chapter. The alumni control and predictor variables are grouped as follows:
Demographic/service factors
Gender
Race
Education
Life stage
Alumnus age in 2015
Activity prior to service – was the alumnus in school, working, engaged in another form of
service, or engaged in some other activity prior to first term of service
Caregiver status – was the alumnus a parent/caregiver during service, or did the alumnus
become a parent/caregiver after service
Pre-service self-perception on outcome scales
Score on pre-service cultural competency scale
Score on pre-service self-efficacy scale
Score on pre-service sense of community scale
Service descriptors
Completion – had the alumnus completed their last term of service
Term type – whether the alumnus served full-time, part-time, quarter-time or reduced time
during the last term of service
Award use – had the alumnus use the education award in any amount
Email update – had the alumnus updated their email address at any point after service
Sampling stratum – in what program and service year cohort did the alumnus serve (e.g., VISTA
from 10 years ago)
Dosage – had the alumnus served a single term or multiple terms with the same program, or
multiple terms with different programs
Service Focus – whether Education, Healthy Futures, Disaster Services, Veterans and Military
Families, Environmental Stewardship, Economic Opportunity, Capacity Building was a main
focus of the alumnus’ service, or whether their service focus was unclear or not applicable
AMERICORPS ALUMNI OUTCOMES SUMMARY REPORT AMERICORPS
nationalservice.gov 31
Service experience
Score on an item related to overall satisfaction with service
Score on a Positive Service Experience scale
Score on a Negative Service Experience scale
Outcomes for Career-oriented Soft Skills AmeriCorps members build their own skills while performing service. The survey asked alumni about
their career-oriented soft skills, including skills related to cultural competency, self-efficacy, and basic
career-specific workplace skills before and after AmeriCorps. The survey also asked alumni to reflect on
the extent to which AmeriCorps helped them build these skills. Overall, alumni reported that they have
strong career-oriented soft skills and that AmeriCorps helped build these skills.
Cultural Competency
The alumni survey included items asking respondents to assess their cultural competency in the areas of
exploring differences with coworkers and/or friends from different cultures or backgrounds, interacting
with people from different cultures and backgrounds, respecting the values of people from different
cultures and backgrounds, and their confidence when interacting with people from different cultures and
backgrounds. Alumni responded using a five-point scale from strongly disagree to strongly agree.
Alumni responded to each statement twice, once to identify their level of agreement before AmeriCorps
and a second time to express their present rating. Figure 13 summarizes alumni responses to the survey
items addressing cultural competency.
Overall, alumni reported that they enjoyed working and interacting with others who were different from
themselves and that they were more comfortable now with diversity than they were prior to AmeriCorps
service. Alumni assessed their current skills as higher in all four areas. The largest gain in cultural
competence (a 19 percentage point increase) was in confidence interacting with people from different
cultures and backgrounds. There were more modest gains on items related to enjoyment of exploring
differences (up 11 percentage points), enjoyment of interacting with different people (up 9 percentage
points), and respecting the values of different people (up 5 percentage points).
Among rating categories, the biggest change was the proportion saying they strongly agreed with a given
statement. For three of the four statements, the proportion of respondents saying they strongly agreed
increased substantially. The highest gain was in the proportion of alumni strongly agreeing that they
were confident interacting with people from different cultures and backgrounds, which nearly doubled,
moving from 29 percent to 56 percent. Similarly, the proportion of alumni saying they strongly agreed
with the statement about respecting others’ values increased from 52 percent to 73 percent. The exception
was the statement about exploring differences with coworkers and/or friends, which showed a larger
gain in those agreeing than in those strongly agreeing. Alumni perceptions of their cultural competency
did not vary substantially by program or year.
The regression results showed significant relationships between the current cultural competency scale
and the quality of alumni’s service experience. Independent of their initial cultural competency, a more
positive AmeriCorps service experience predicted alumni’s greater current cultural competency now. In
addition, alumni who reported greater pre-service cultural competency also reported increases in cultural
competency. The regression analysis showed no significant relationships between the demographic and
life stage variables and alumni’s current cultural competency ratings. There were no differences across
the programs and years. The variables in the regression model explained 46 percent of the variance in
cultural competency scores.
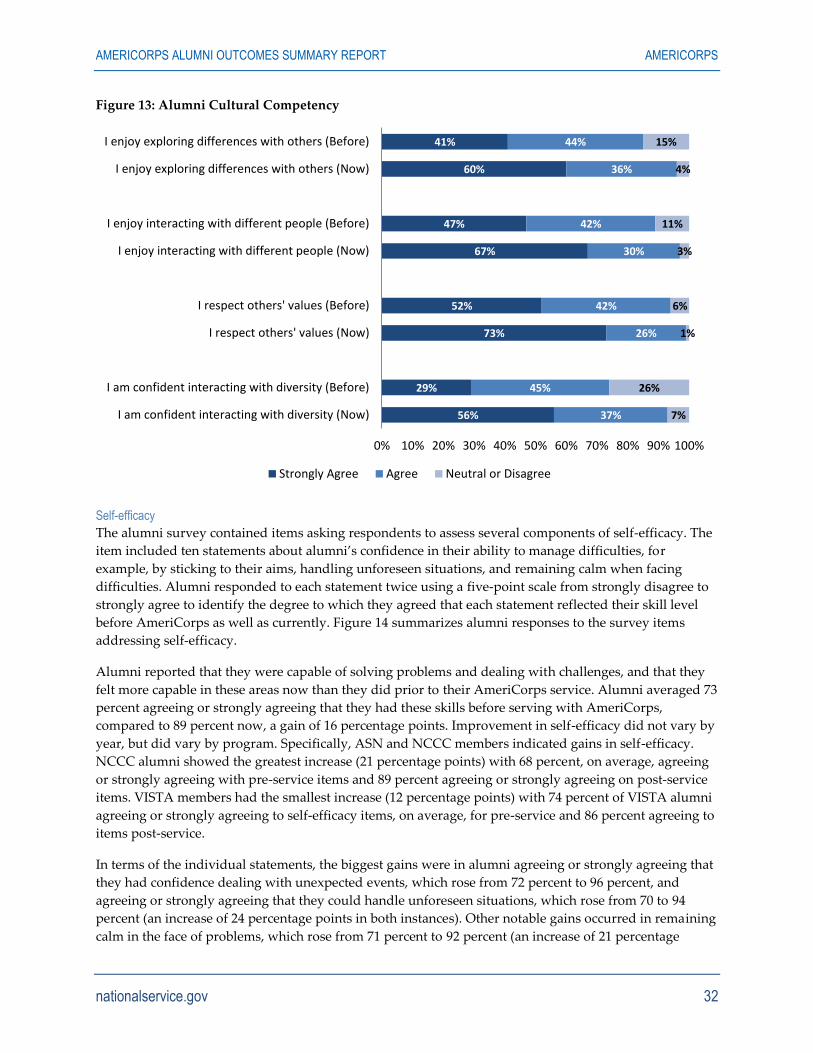
AMERICORPS ALUMNI OUTCOMES SUMMARY REPORT AMERICORPS
nationalservice.gov 32
Figure 13: Alumni Cultural Competency
Self-efficacy
The alumni survey contained items asking respondents to assess several components of self-efficacy. The
item included ten statements about alumni’s confidence in their ability to manage difficulties, for
example, by sticking to their aims, handling unforeseen situations, and remaining calm when facing
difficulties. Alumni responded to each statement twice using a five-point scale from strongly disagree to
strongly agree to identify the degree to which they agreed that each statement reflected their skill level
before AmeriCorps as well as currently. Figure 14 summarizes alumni responses to the survey items
addressing self-efficacy.
Alumni reported that they were capable of solving problems and dealing with challenges, and that they
felt more capable in these areas now than they did prior to their AmeriCorps service. Alumni averaged 73
percent agreeing or strongly agreeing that they had these skills before serving with AmeriCorps,
compared to 89 percent now, a gain of 16 percentage points. Improvement in self-efficacy did not vary by
year, but did vary by program. Specifically, ASN and NCCC members indicated gains in self-efficacy.
NCCC alumni showed the greatest increase (21 percentage points) with 68 percent, on average, agreeing
or strongly agreeing with pre-service items and 89 percent agreeing or strongly agreeing on post-service
items. VISTA members had the smallest increase (12 percentage points) with 74 percent of VISTA alumni
agreeing or strongly agreeing to self-efficacy items, on average, for pre-service and 86 percent agreeing to
items post-service.
In terms of the individual statements, the biggest gains were in alumni agreeing or strongly agreeing that
they had confidence dealing with unexpected events, which rose from 72 percent to 96 percent, and
agreeing or strongly agreeing that they could handle unforeseen situations, which rose from 70 to 94
percent (an increase of 24 percentage points in both instances). Other notable gains occurred in remaining
calm in the face of problems, which rose from 71 percent to 92 percent (an increase of 21 percentage
56%
29%
73%
52%
67%
47%
60%
41%
37%
45%
26%
42%
30%
42%
36%
44%
7%
26%
1%
6%
3%
11%
4%
15%
0% 10% 20% 30% 40% 50% 60% 70% 80% 90% 100%
I am confident interacting with diversity (Now)
I am confident interacting with diversity (Before)
I respect others' values (Now)
I respect others' values (Before)
I enjoy interacting with different people (Now)
I enjoy interacting with different people (Before)
I enjoy exploring differences with others (Now)
I enjoy exploring differences with others (Before)
Strongly Agree Agree Neutral or Disagree
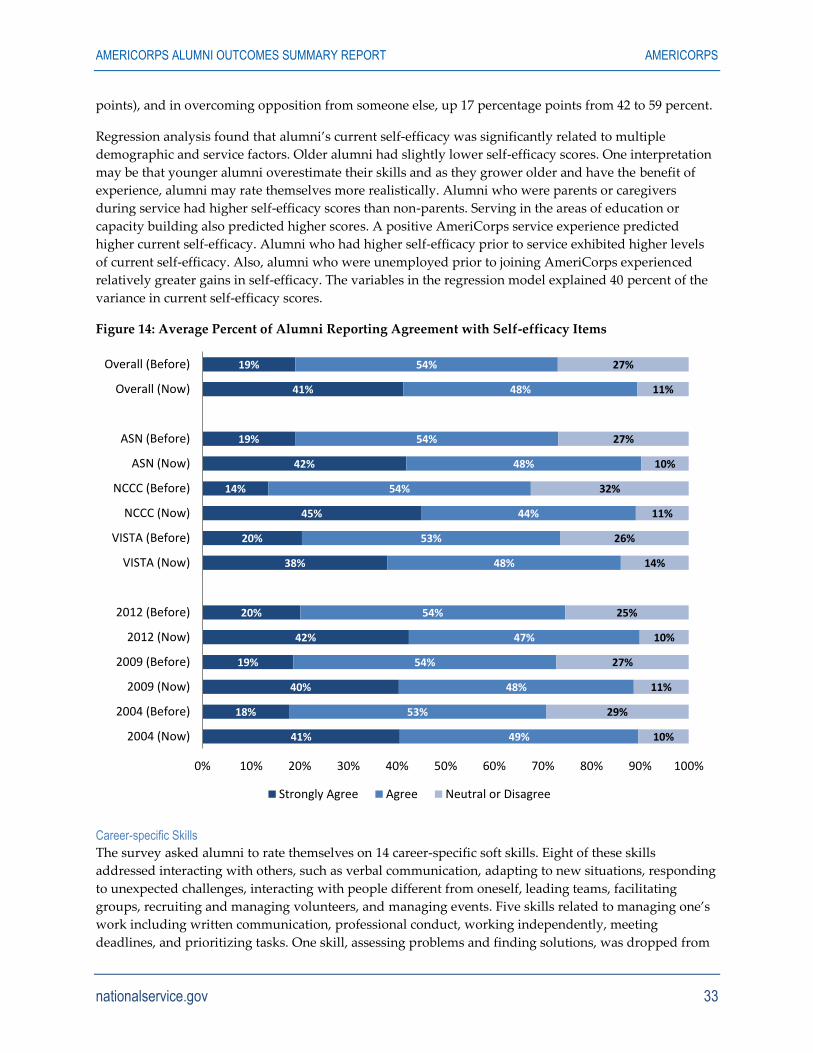
AMERICORPS ALUMNI OUTCOMES SUMMARY REPORT AMERICORPS
nationalservice.gov 33
points), and in overcoming opposition from someone else, up 17 percentage points from 42 to 59 percent.
Regression analysis found that alumni’s current self-efficacy was significantly related to multiple
demographic and service factors. Older alumni had slightly lower self-efficacy scores. One interpretation
may be that younger alumni overestimate their skills and as they grower older and have the benefit of
experience, alumni may rate themselves more realistically. Alumni who were parents or caregivers
during service had higher self-efficacy scores than non-parents. Serving in the areas of education or
capacity building also predicted higher scores. A positive AmeriCorps service experience predicted
higher current self-efficacy. Alumni who had higher self-efficacy prior to service exhibited higher levels
of current self-efficacy. Also, alumni who were unemployed prior to joining AmeriCorps experienced
relatively greater gains in self-efficacy. The variables in the regression model explained 40 percent of the
variance in current self-efficacy scores.
Figure 14: Average Percent of Alumni Reporting Agreement with Self-efficacy Items
Career-specific Skills
The survey asked alumni to rate themselves on 14 career-specific soft skills. Eight of these skills
addressed interacting with others, such as verbal communication, adapting to new situations, responding
to unexpected challenges, interacting with people different from oneself, leading teams, facilitating
groups, recruiting and managing volunteers, and managing events. Five skills related to managing one’s
work including written communication, professional conduct, working independently, meeting
deadlines, and prioritizing tasks. One skill, assessing problems and finding solutions, was dropped from
41%
18%
40%
19%
42%
20%
38%
20%
45%
14%
42%
19%
41%
19%
49%
53%
48%
54%
47%
54%
48%
53%
44%
54%
48%
54%
48%
54%
10%
29%
11%
27%
10%
25%
14%
26%
11%
32%
10%
27%
11%
27%
0% 10% 20% 30% 40% 50% 60% 70% 80% 90% 100%
2004 (Now)
2004 (Before)
2009 (Now)
2009 (Before)
2012 (Now)
2012 (Before)
VISTA (Now)
VISTA (Before)
NCCC (Now)
NCCC (Before)
ASN (Now)
ASN (Before)
Overall (Now)
Overall (Before)
Strongly Agree Agree Neutral or Disagree
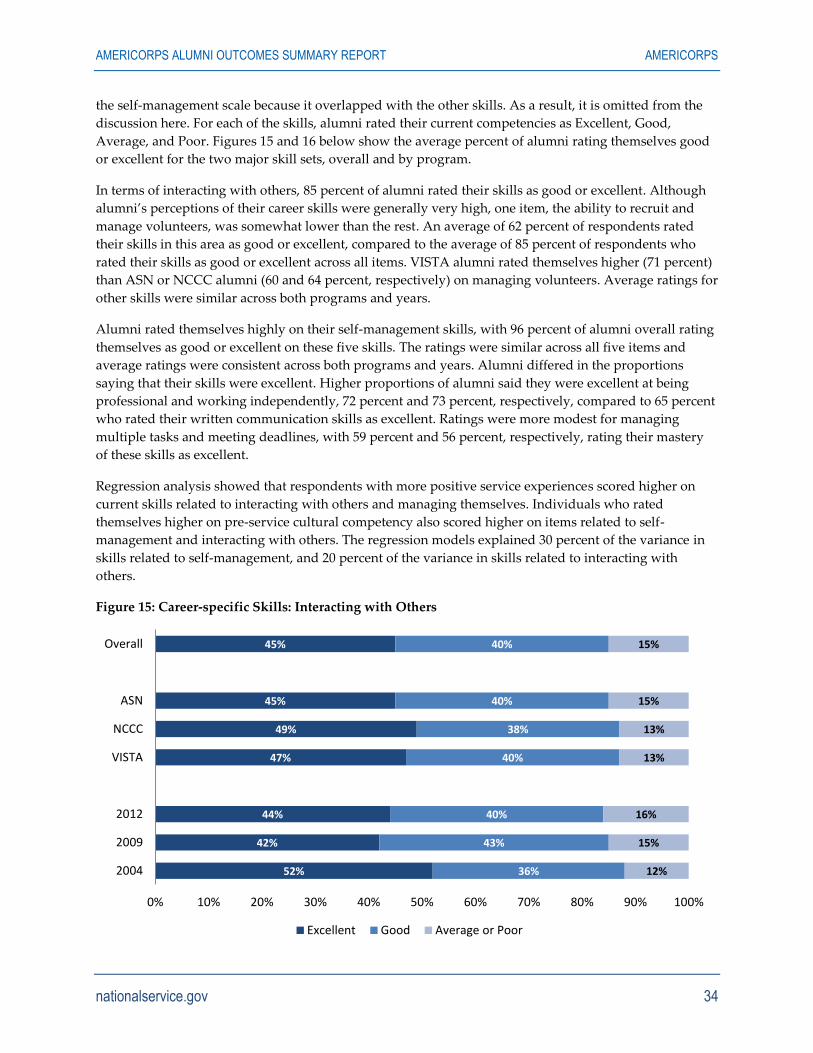
AMERICORPS ALUMNI OUTCOMES SUMMARY REPORT AMERICORPS
nationalservice.gov 34
the self-management scale because it overlapped with the other skills. As a result, it is omitted from the
discussion here. For each of the skills, alumni rated their current competencies as Excellent, Good,
Average, and Poor. Figures 15 and 16 below show the average percent of alumni rating themselves good
or excellent for the two major skill sets, overall and by program.
In terms of interacting with others, 85 percent of alumni rated their skills as good or excellent. Although
alumni’s perceptions of their career skills were generally very high, one item, the ability to recruit and
manage volunteers, was somewhat lower than the rest. An average of 62 percent of respondents rated
their skills in this area as good or excellent, compared to the average of 85 percent of respondents who
rated their skills as good or excellent across all items. VISTA alumni rated themselves higher (71 percent)
than ASN or NCCC alumni (60 and 64 percent, respectively) on managing volunteers. Average ratings for
other skills were similar across both programs and years.
Alumni rated themselves highly on their self-management skills, with 96 percent of alumni overall rating
themselves as good or excellent on these five skills. The ratings were similar across all five items and
average ratings were consistent across both programs and years. Alumni differed in the proportions
saying that their skills were excellent. Higher proportions of alumni said they were excellent at being
professional and working independently, 72 percent and 73 percent, respectively, compared to 65 percent
who rated their written communication skills as excellent. Ratings were more modest for managing
multiple tasks and meeting deadlines, with 59 percent and 56 percent, respectively, rating their mastery
of these skills as excellent.
Regression analysis showed that respondents with more positive service experiences scored higher on
current skills related to interacting with others and managing themselves. Individuals who rated
themselves higher on pre-service cultural competency also scored higher on items related to self-
management and interacting with others. The regression models explained 30 percent of the variance in
skills related to self-management, and 20 percent of the variance in skills related to interacting with
others.
Figure 15: Career-specific Skills: Interacting with Others
52%
42%
44%
47%
49%
45%
45%
36%
43%
40%
40%
38%
40%
40%
12%
15%
16%
13%
13%
15%
15%
0% 10% 20% 30% 40% 50% 60% 70% 80% 90% 100%
2004
2009
2012
VISTA
NCCC
ASN
Overall
Excellent Good Average or Poor
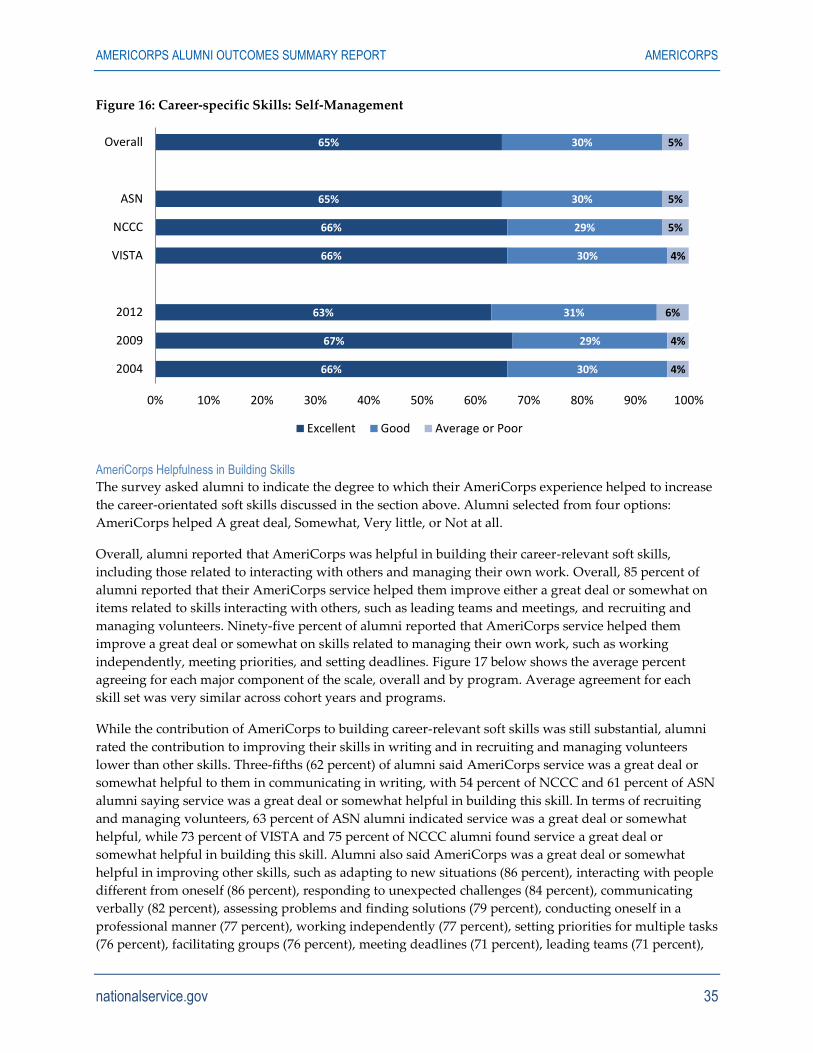
AMERICORPS ALUMNI OUTCOMES SUMMARY REPORT AMERICORPS
nationalservice.gov 35
Figure 16: Career-specific Skills: Self-Management
AmeriCorps Helpfulness in Building Skills
The survey asked alumni to indicate the degree to which their AmeriCorps experience helped to increase
the career-orientated soft skills discussed in the section above. Alumni selected from four options:
AmeriCorps helped A great deal, Somewhat, Very little, or Not at all.
Overall, alumni reported that AmeriCorps was helpful in building their career-relevant soft skills,
including those related to interacting with others and managing their own work. Overall, 85 percent of
alumni reported that their AmeriCorps service helped them improve either a great deal or somewhat on
items related to skills interacting with others, such as leading teams and meetings, and recruiting and
managing volunteers. Ninety-five percent of alumni reported that AmeriCorps service helped them
improve a great deal or somewhat on skills related to managing their own work, such as working
independently, meeting priorities, and setting deadlines. Figure 17 below shows the average percent
agreeing for each major component of the scale, overall and by program. Average agreement for each
skill set was very similar across cohort years and programs.
While the contribution of AmeriCorps to building career-relevant soft skills was still substantial, alumni
rated the contribution to improving their skills in writing and in recruiting and managing volunteers
lower than other skills. Three-fifths (62 percent) of alumni said AmeriCorps service was a great deal or
somewhat helpful to them in communicating in writing, with 54 percent of NCCC and 61 percent of ASN
alumni saying service was a great deal or somewhat helpful in building this skill. In terms of recruiting
and managing volunteers, 63 percent of ASN alumni indicated service was a great deal or somewhat
helpful, while 73 percent of VISTA and 75 percent of NCCC alumni found service a great deal or
somewhat helpful in building this skill. Alumni also said AmeriCorps was a great deal or somewhat
helpful in improving other skills, such as adapting to new situations (86 percent), interacting with people
different from oneself (86 percent), responding to unexpected challenges (84 percent), communicating
verbally (82 percent), assessing problems and finding solutions (79 percent), conducting oneself in a
professional manner (77 percent), working independently (77 percent), setting priorities for multiple tasks
(76 percent), facilitating groups (76 percent), meeting deadlines (71 percent), leading teams (71 percent),
66%
67%
63%
66%
66%
65%
65%
30%
29%
31%
30%
29%
30%
30%
4%
4%
6%
4%
5%
5%
5%
0% 10% 20% 30% 40% 50% 60% 70% 80% 90% 100%
2004
2009
2012
VISTA
NCCC
ASN
Overall
Excellent Good Average or Poor
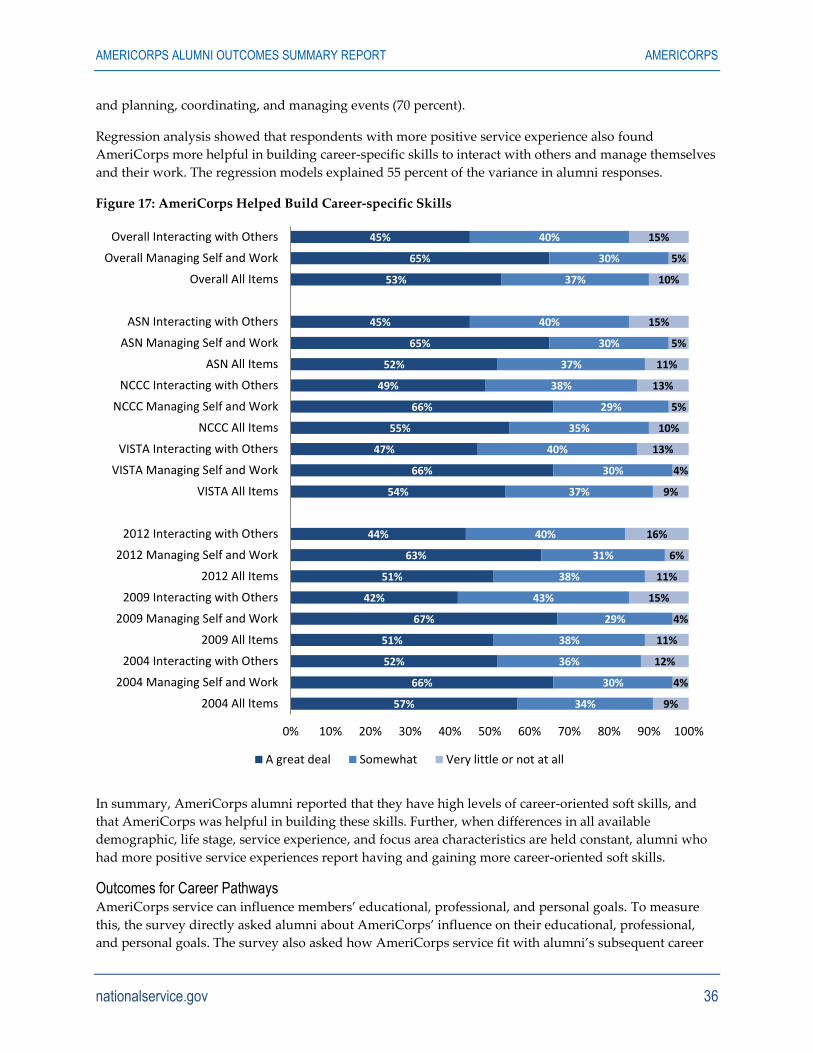
AMERICORPS ALUMNI OUTCOMES SUMMARY REPORT AMERICORPS
nationalservice.gov 36
and planning, coordinating, and managing events (70 percent).
Regression analysis showed that respondents with more positive service experience also found
AmeriCorps more helpful in building career-specific skills to interact with others and manage themselves
and their work. The regression models explained 55 percent of the variance in alumni responses.
Figure 17: AmeriCorps Helped Build Career-specific Skills
In summary, AmeriCorps alumni reported that they have high levels of career-oriented soft skills, and
that AmeriCorps was helpful in building these skills. Further, when differences in all available
demographic, life stage, service experience, and focus area characteristics are held constant, alumni who
had more positive service experiences report having and gaining more career-oriented soft skills.
Outcomes for Career Pathways AmeriCorps service can influence members’ educational, professional, and personal goals. To measure
this, the survey directly asked alumni about AmeriCorps’ influence on their educational, professional,
and personal goals. The survey also asked how AmeriCorps service fit with alumni’s subsequent career
57%
66%
52%
51%
67%
42%
51%
63%
44%
54%
66%
47%
55%
66%
49%
52%
65%
45%
53%
65%
45%
34%
30%
36%
38%
29%
43%
38%
31%
40%
37%
30%
40%
35%
29%
38%
37%
30%
40%
37%
30%
40%
9%
4%
12%
11%
4%
15%
11%
6%
16%
9%
4%
13%
10%
5%
13%
11%
5%
15%
10%
5%
15%
0% 10% 20% 30% 40% 50% 60% 70% 80% 90% 100%
2004 All Items
2004 Managing Self and Work
2004 Interacting with Others
2009 All Items
2009 Managing Self and Work
2009 Interacting with Others
2012 All Items
2012 Managing Self and Work
2012 Interacting with Others
VISTA All Items
VISTA Managing Self and Work
VISTA Interacting with Others
NCCC All Items
NCCC Managing Self and Work
NCCC Interacting with Others
ASN All Items
ASN Managing Self and Work
ASN Interacting with Others
Overall All Items
Overall Managing Self and Work
Overall Interacting with Others
A great deal Somewhat Very little or not at all
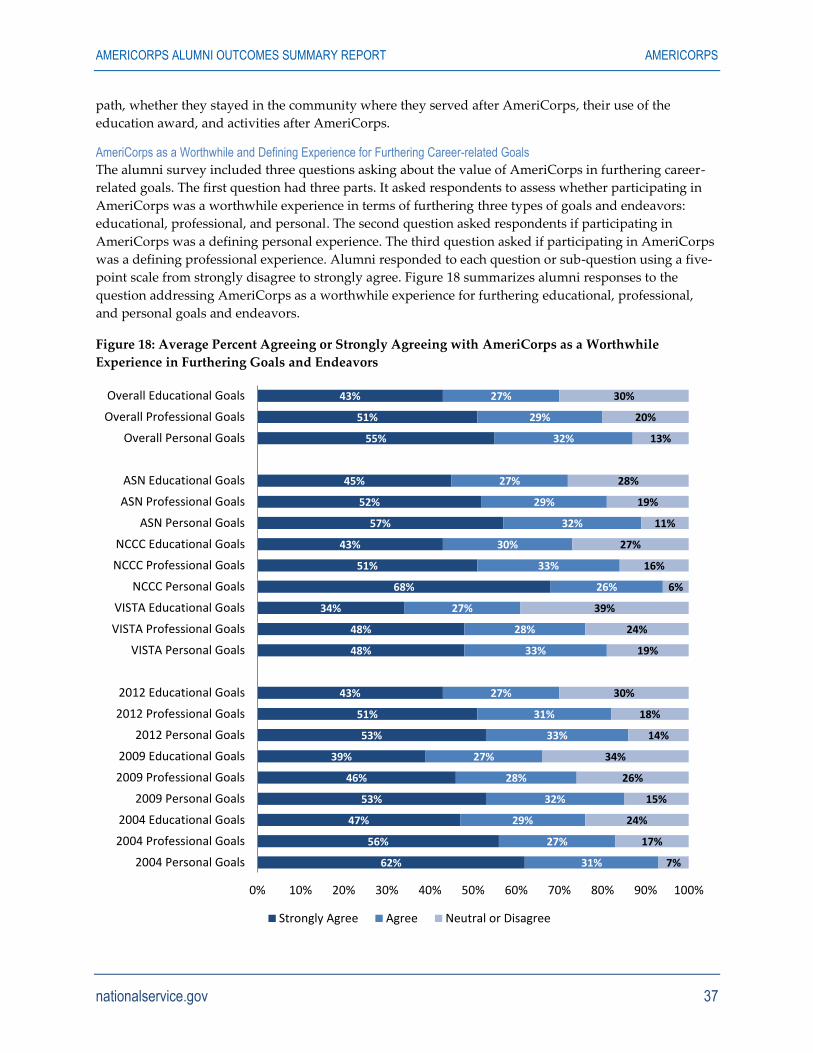
AMERICORPS ALUMNI OUTCOMES SUMMARY REPORT AMERICORPS
nationalservice.gov 37
path, whether they stayed in the community where they served after AmeriCorps, their use of the
education award, and activities after AmeriCorps.
AmeriCorps as a Worthwhile and Defining Experience for Furthering Career-related Goals
The alumni survey included three questions asking about the value of AmeriCorps in furthering career-
related goals. The first question had three parts. It asked respondents to assess whether participating in
AmeriCorps was a worthwhile experience in terms of furthering three types of goals and endeavors:
educational, professional, and personal. The second question asked respondents if participating in
AmeriCorps was a defining personal experience. The third question asked if participating in AmeriCorps
was a defining professional experience. Alumni responded to each question or sub-question using a five-
point scale from strongly disagree to strongly agree. Figure 18 summarizes alumni responses to the
question addressing AmeriCorps as a worthwhile experience for furthering educational, professional,
and personal goals and endeavors.
Figure 18: Average Percent Agreeing or Strongly Agreeing with AmeriCorps as a Worthwhile
Experience in Furthering Goals and Endeavors
62%
56%
47%
53%
46%
39%
53%
51%
43%
48%
48%
34%
68%
51%
43%
57%
52%
45%
55%
51%
43%
31%
27%
29%
32%
28%
27%
33%
31%
27%
33%
28%
27%
26%
33%
30%
32%
29%
27%
32%
29%
27%
7%
17%
24%
15%
26%
34%
14%
18%
30%
19%
24%
39%
6%
16%
27%
11%
19%
28%
13%
20%
30%
0% 10% 20% 30% 40% 50% 60% 70% 80% 90% 100%
2004 Personal Goals
2004 Professional Goals
2004 Educational Goals
2009 Personal Goals
2009 Professional Goals
2009 Educational Goals
2012 Personal Goals
2012 Professional Goals
2012 Educational Goals
VISTA Personal Goals
VISTA Professional Goals
VISTA Educational Goals
NCCC Personal Goals
NCCC Professional Goals
NCCC Educational Goals
ASN Personal Goals
ASN Professional Goals
ASN Educational Goals
Overall Personal Goals
Overall Professional Goals
Overall Educational Goals
Strongly Agree Agree Neutral or Disagree
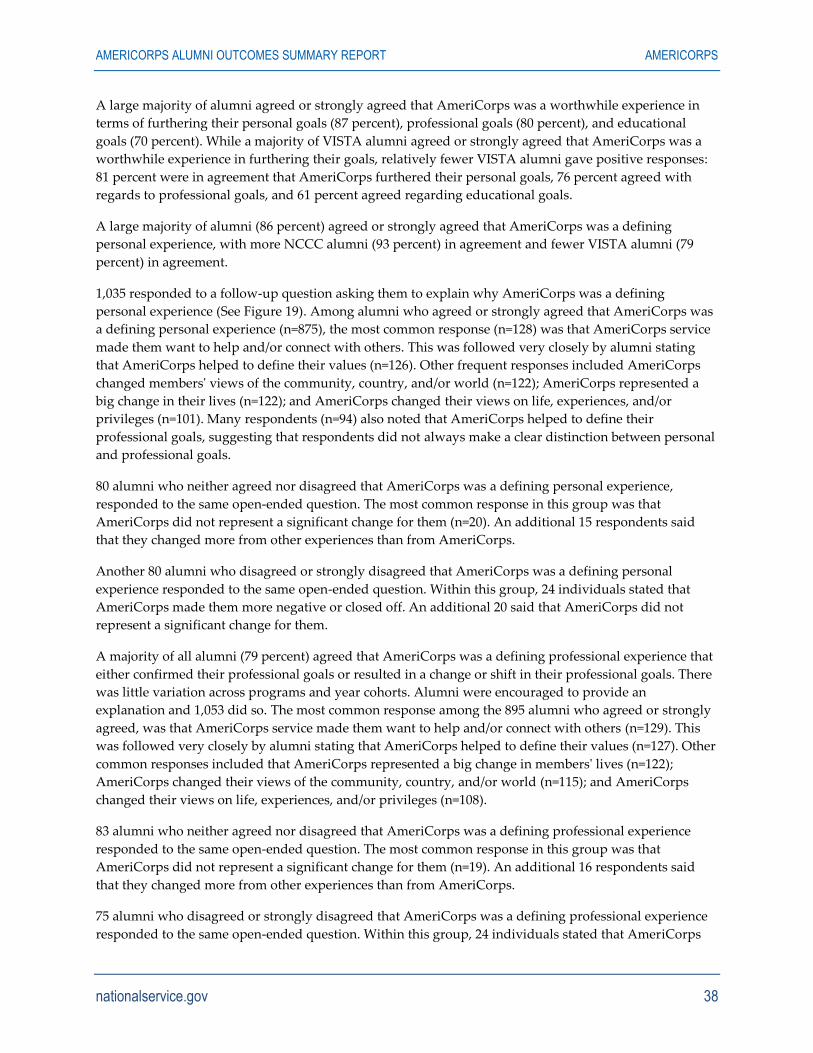
AMERICORPS ALUMNI OUTCOMES SUMMARY REPORT AMERICORPS
nationalservice.gov 38
A large majority of alumni agreed or strongly agreed that AmeriCorps was a worthwhile experience in
terms of furthering their personal goals (87 percent), professional goals (80 percent), and educational
goals (70 percent). While a majority of VISTA alumni agreed or strongly agreed that AmeriCorps was a
worthwhile experience in furthering their goals, relatively fewer VISTA alumni gave positive responses:
81 percent were in agreement that AmeriCorps furthered their personal goals, 76 percent agreed with
regards to professional goals, and 61 percent agreed regarding educational goals.
A large majority of alumni (86 percent) agreed or strongly agreed that AmeriCorps was a defining
personal experience, with more NCCC alumni (93 percent) in agreement and fewer VISTA alumni (79
percent) in agreement.
1,035 responded to a follow-up question asking them to explain why AmeriCorps was a defining
personal experience (See Figure 19). Among alumni who agreed or strongly agreed that AmeriCorps was
a defining personal experience (n=875), the most common response (n=128) was that AmeriCorps service
made them want to help and/or connect with others. This was followed very closely by alumni stating
that AmeriCorps helped to define their values (n=126). Other frequent responses included AmeriCorps
changed members' views of the community, country, and/or world (n=122); AmeriCorps represented a
big change in their lives (n=122); and AmeriCorps changed their views on life, experiences, and/or
privileges (n=101). Many respondents (n=94) also noted that AmeriCorps helped to define their
professional goals, suggesting that respondents did not always make a clear distinction between personal
and professional goals.
80 alumni who neither agreed nor disagreed that AmeriCorps was a defining personal experience,
responded to the same open-ended question. The most common response in this group was that
AmeriCorps did not represent a significant change for them (n=20). An additional 15 respondents said
that they changed more from other experiences than from AmeriCorps.
Another 80 alumni who disagreed or strongly disagreed that AmeriCorps was a defining personal
experience responded to the same open-ended question. Within this group, 24 individuals stated that
AmeriCorps made them more negative or closed off. An additional 20 said that AmeriCorps did not
represent a significant change for them.
A majority of all alumni (79 percent) agreed that AmeriCorps was a defining professional experience that
either confirmed their professional goals or resulted in a change or shift in their professional goals. There
was little variation across programs and year cohorts. Alumni were encouraged to provide an
explanation and 1,053 did so. The most common response among the 895 alumni who agreed or strongly
agreed, was that AmeriCorps service made them want to help and/or connect with others (n=129). This
was followed very closely by alumni stating that AmeriCorps helped to define their values (n=127). Other
common responses included that AmeriCorps represented a big change in members' lives (n=122);
AmeriCorps changed their views of the community, country, and/or world (n=115); and AmeriCorps
changed their views on life, experiences, and/or privileges (n=108).
83 alumni who neither agreed nor disagreed that AmeriCorps was a defining professional experience
responded to the same open-ended question. The most common response in this group was that
AmeriCorps did not represent a significant change for them (n=19). An additional 16 respondents said
that they changed more from other experiences than from AmeriCorps.
75 alumni who disagreed or strongly disagreed that AmeriCorps was a defining professional experience
responded to the same open-ended question. Within this group, 24 individuals stated that AmeriCorps
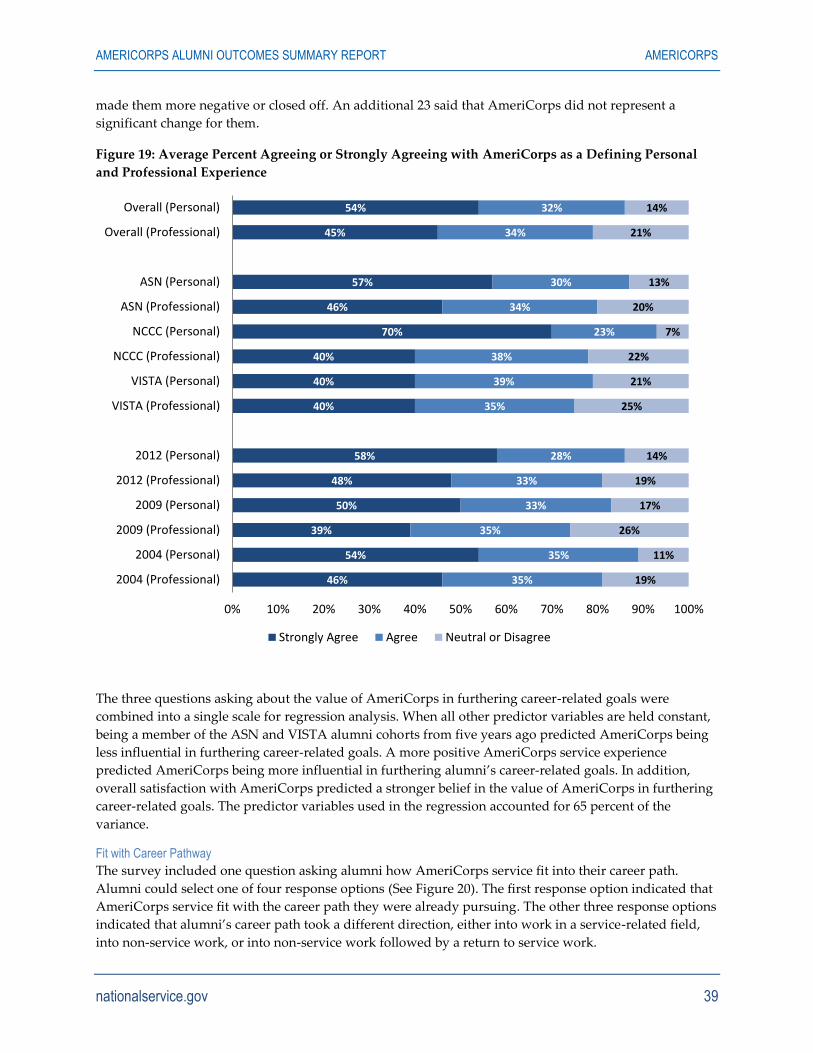
AMERICORPS ALUMNI OUTCOMES SUMMARY REPORT AMERICORPS
nationalservice.gov 39
made them more negative or closed off. An additional 23 said that AmeriCorps did not represent a
significant change for them.
Figure 19: Average Percent Agreeing or Strongly Agreeing with AmeriCorps as a Defining Personal
and Professional Experience
The three questions asking about the value of AmeriCorps in furthering career-related goals were
combined into a single scale for regression analysis. When all other predictor variables are held constant,
being a member of the ASN and VISTA alumni cohorts from five years ago predicted AmeriCorps being
less influential in furthering career-related goals. A more positive AmeriCorps service experience
predicted AmeriCorps being more influential in furthering alumni’s career-related goals. In addition,
overall satisfaction with AmeriCorps predicted a stronger belief in the value of AmeriCorps in furthering
career-related goals. The predictor variables used in the regression accounted for 65 percent of the
variance.
Fit with Career Pathway
The survey included one question asking alumni how AmeriCorps service fit into their career path.
Alumni could select one of four response options (See Figure 20). The first response option indicated that
AmeriCorps service fit with the career path they were already pursuing. The other three response options
indicated that alumni’s career path took a different direction, either into work in a service-related field,
into non-service work, or into non-service work followed by a return to service work.
46%
54%
39%
50%
48%
58%
40%
40%
40%
70%
46%
57%
45%
54%
35%
35%
35%
33%
33%
28%
35%
39%
38%
23%
34%
30%
34%
32%
19%
11%
26%
17%
19%
14%
25%
21%
22%
7%
20%
13%
21%
14%
0% 10% 20% 30% 40% 50% 60% 70% 80% 90% 100%
2004 (Professional)
2004 (Personal)
2009 (Professional)
2009 (Personal)
2012 (Professional)
2012 (Personal)
VISTA (Professional)
VISTA (Personal)
NCCC (Professional)
NCCC (Personal)
ASN (Professional)
ASN (Personal)
Overall (Professional)
Overall (Personal)
Strongly Agree Agree Neutral or Disagree
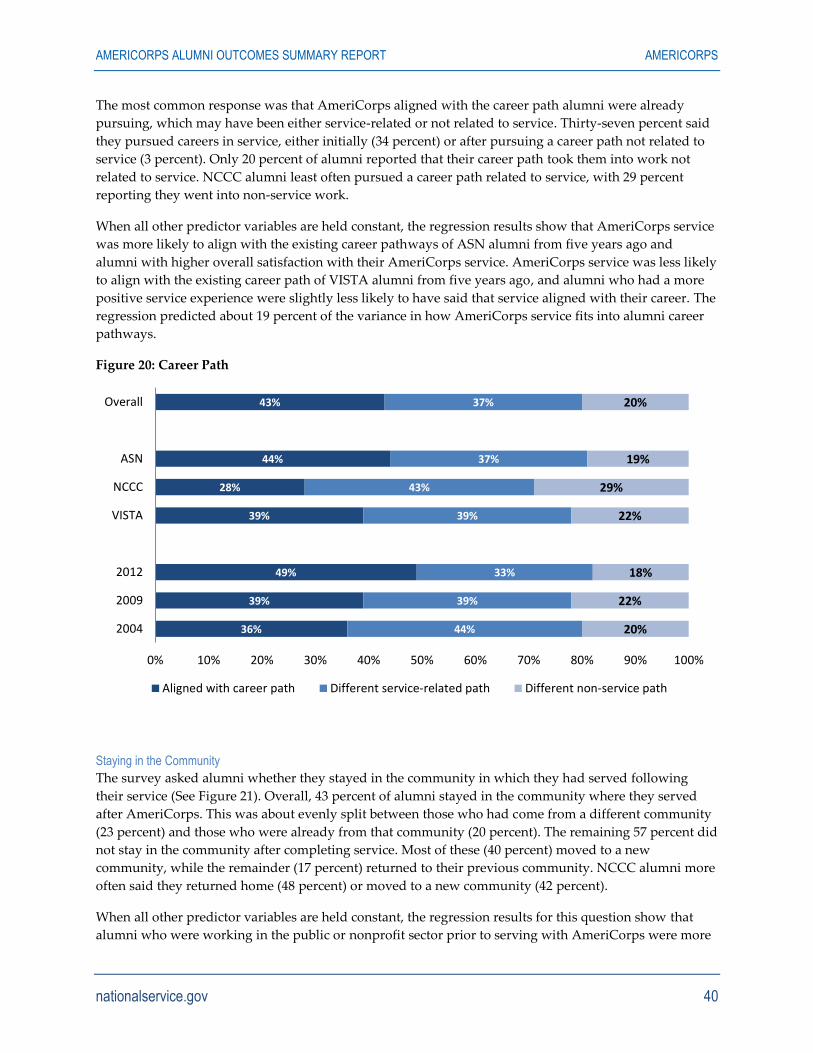
AMERICORPS ALUMNI OUTCOMES SUMMARY REPORT AMERICORPS
nationalservice.gov 40
The most common response was that AmeriCorps aligned with the career path alumni were already
pursuing, which may have been either service-related or not related to service. Thirty-seven percent said
they pursued careers in service, either initially (34 percent) or after pursuing a career path not related to
service (3 percent). Only 20 percent of alumni reported that their career path took them into work not
related to service. NCCC alumni least often pursued a career path related to service, with 29 percent
reporting they went into non-service work.
When all other predictor variables are held constant, the regression results show that AmeriCorps service
was more likely to align with the existing career pathways of ASN alumni from five years ago and
alumni with higher overall satisfaction with their AmeriCorps service. AmeriCorps service was less likely
to align with the existing career path of VISTA alumni from five years ago, and alumni who had a more
positive service experience were slightly less likely to have said that service aligned with their career. The
regression predicted about 19 percent of the variance in how AmeriCorps service fits into alumni career
pathways.
Figure 20: Career Path
Staying in the Community
The survey asked alumni whether they stayed in the community in which they had served following
their service (See Figure 21). Overall, 43 percent of alumni stayed in the community where they served
after AmeriCorps. This was about evenly split between those who had come from a different community
(23 percent) and those who were already from that community (20 percent). The remaining 57 percent did
not stay in the community after completing service. Most of these (40 percent) moved to a new
community, while the remainder (17 percent) returned to their previous community. NCCC alumni more
often said they returned home (48 percent) or moved to a new community (42 percent).
When all other predictor variables are held constant, the regression results for this question show that
alumni who were working in the public or nonprofit sector prior to serving with AmeriCorps were more
36%
39%
49%
39%
28%
44%
43%
44%
39%
33%
39%
43%
37%
37%
20%
22%
18%
22%
29%
19%
20%
0% 10% 20% 30% 40% 50% 60% 70% 80% 90% 100%
2004
2009
2012
VISTA
NCCC
ASN
Overall
Aligned with career path Different service-related path Different non-service path
AMERICORPS ALUMNI OUTCOMES SUMMARY REPORT AMERICORPS
nationalservice.gov 41
likely to stay in the communities in which they had served. The regression predicted about 20 percent of
the variance in whether the alumni stayed in the community in which they served.
Figure 21: Staying in the Community
Education Award Use
The survey asked alumni how they had used their education award. Overall, alumni typically used their
education award to repay student loans (48 percent) or attend graduate school (25 percent). NCCC
members more often used their award to attend college (34 percent versus 14 percent for ASN and 10
percent for VISTA). VISTA alumni more often opted for a post-service stipend in lieu of an education
award (15 percent versus less than 5 percent for ASN and NCCC). More recent alumni used their awards
less often (14 percent versus 7 percent overall). More recent alumni more frequently used their award to
repay student loans (55 percent for two-year alumni versus 39 percent for five-year alumni and 46
percent for 10-year alumni).
When all other predictors, including CNCS records of whether the education award was used, were held
constant, regression analysis showed that alumni who did not have a four-year degree prior to service
were more likely to use their award to pay for school. Alumni were also more likely to use their
education award to pay for school if they reported having had a more positive service experience.
Alumni who reported an unclear or unknown focus area for their AmeriCorps service or who were part
of the ASN two-year cohort were less likely to use their education award to pay for school. Regression
analysis predicted about 40 percent of the variance in using one’s education award to pay for school.
Regression analysis also showed that alumni with less than a four-year degree prior to service and
members of the ASN two-year cohort were less likely to use their education award to pay off loans or
transfer the award to another family member. Regression analysis predicted about 39 percent of the
variance in using one’s education award to pay off loans or transfer to another family member.
Alumni with higher overall satisfaction with AmeriCorps, who reported a positive service experience, or
24%
23%
22%
24%
9%
23%
23%
18%
25%
18%
25%
1%
20%
20%
17%
13%
21%
13%
48%
17%
17%
41%
39%
39%
38%
42%
40%
40%
0% 10% 20% 30% 40% 50% 60% 70% 80% 90% 100%
2004
2009
2012
VISTA
NCCC
ASN
Overall
Yes (not originally from community) Yes (originally from community)
No (moved to previous community) No (moved to new community)
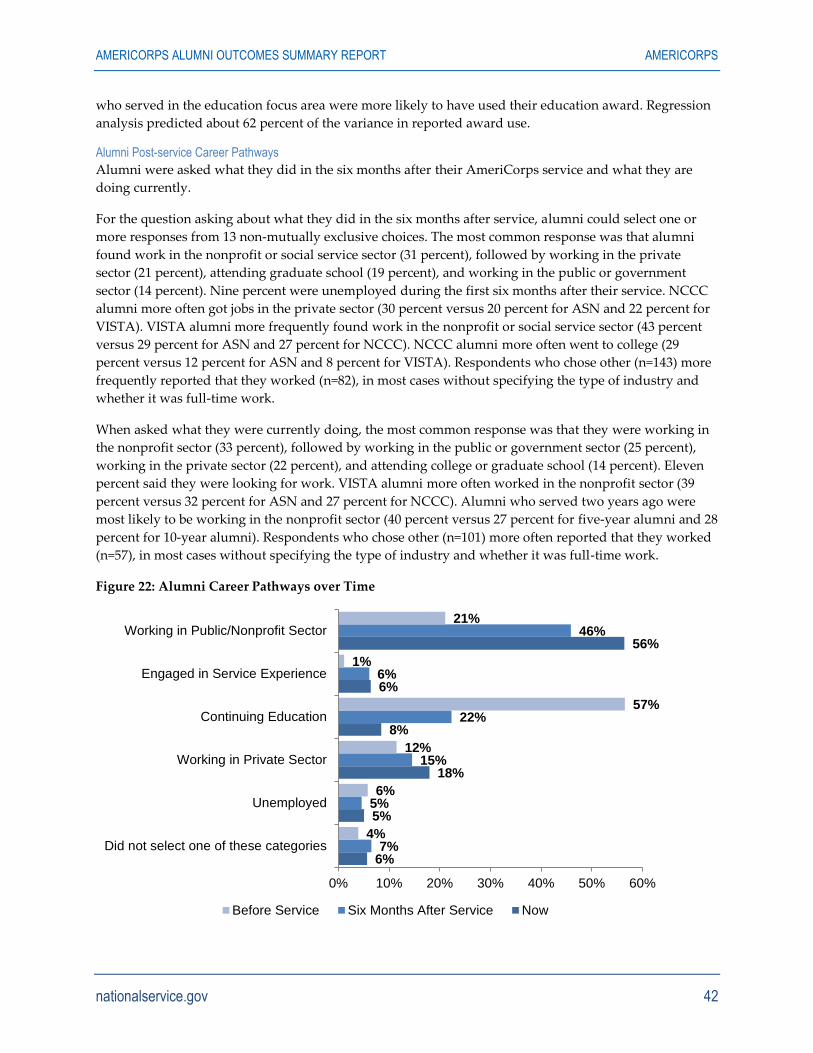
AMERICORPS ALUMNI OUTCOMES SUMMARY REPORT AMERICORPS
nationalservice.gov 42
who served in the education focus area were more likely to have used their education award. Regression
analysis predicted about 62 percent of the variance in reported award use.
Alumni Post-service Career Pathways
Alumni were asked what they did in the six months after their AmeriCorps service and what they are
doing currently.
For the question asking about what they did in the six months after service, alumni could select one or
more responses from 13 non-mutually exclusive choices. The most common response was that alumni
found work in the nonprofit or social service sector (31 percent), followed by working in the private
sector (21 percent), attending graduate school (19 percent), and working in the public or government
sector (14 percent). Nine percent were unemployed during the first six months after their service. NCCC
alumni more often got jobs in the private sector (30 percent versus 20 percent for ASN and 22 percent for
VISTA). VISTA alumni more frequently found work in the nonprofit or social service sector (43 percent
versus 29 percent for ASN and 27 percent for NCCC). NCCC alumni more often went to college (29
percent versus 12 percent for ASN and 8 percent for VISTA). Respondents who chose other (n=143) more
frequently reported that they worked (n=82), in most cases without specifying the type of industry and
whether it was full-time work.
When asked what they were currently doing, the most common response was that they were working in
the nonprofit sector (33 percent), followed by working in the public or government sector (25 percent),
working in the private sector (22 percent), and attending college or graduate school (14 percent). Eleven
percent said they were looking for work. VISTA alumni more often worked in the nonprofit sector (39
percent versus 32 percent for ASN and 27 percent for NCCC). Alumni who served two years ago were
most likely to be working in the nonprofit sector (40 percent versus 27 percent for five-year alumni and 28
percent for 10-year alumni). Respondents who chose other (n=101) more often reported that they worked
(n=57), in most cases without specifying the type of industry and whether it was full-time work.
Figure 22: Alumni Career Pathways over Time
6%
5%
18%
8%
6%
56%
7%
5%
15%
22%
6%
46%
4%
6%
12%
57%
1%
21%
0% 10% 20% 30% 40% 50% 60%
Did not select one of these categories
Unemployed
Working in Private Sector
Continuing Education
Engaged in Service Experience
Working in Public/Nonprofit Sector
Before Service Six Months After Service Now
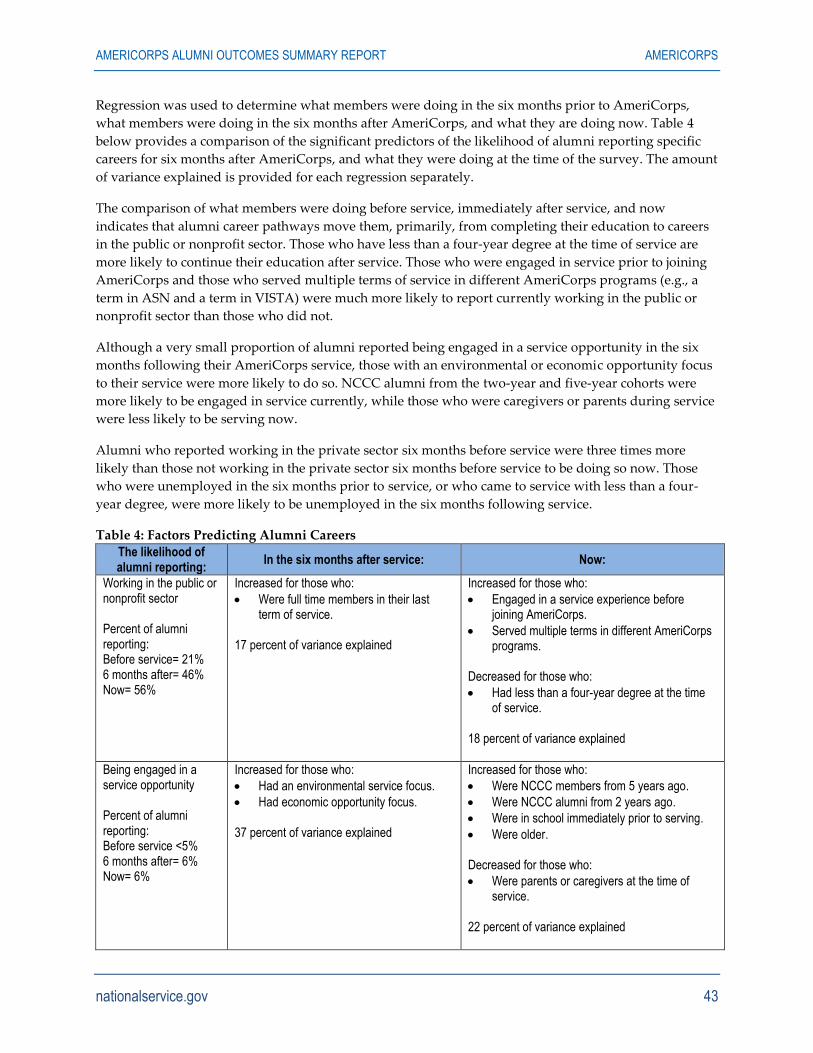
AMERICORPS ALUMNI OUTCOMES SUMMARY REPORT AMERICORPS
nationalservice.gov 43
Regression was used to determine what members were doing in the six months prior to AmeriCorps,
what members were doing in the six months after AmeriCorps, and what they are doing now. Table 4
below provides a comparison of the significant predictors of the likelihood of alumni reporting specific
careers for six months after AmeriCorps, and what they were doing at the time of the survey. The amount
of variance explained is provided for each regression separately.
The comparison of what members were doing before service, immediately after service, and now
indicates that alumni career pathways move them, primarily, from completing their education to careers
in the public or nonprofit sector. Those who have less than a four-year degree at the time of service are
more likely to continue their education after service. Those who were engaged in service prior to joining
AmeriCorps and those who served multiple terms of service in different AmeriCorps programs (e.g., a
term in ASN and a term in VISTA) were much more likely to report currently working in the public or
nonprofit sector than those who did not.
Although a very small proportion of alumni reported being engaged in a service opportunity in the six
months following their AmeriCorps service, those with an environmental or economic opportunity focus
to their service were more likely to do so. NCCC alumni from the two-year and five-year cohorts were
more likely to be engaged in service currently, while those who were caregivers or parents during service
were less likely to be serving now.
Alumni who reported working in the private sector six months before service were three times more
likely than those not working in the private sector six months before service to be doing so now. Those
who were unemployed in the six months prior to service, or who came to service with less than a four-
year degree, were more likely to be unemployed in the six months following service.
Table 4: Factors Predicting Alumni Careers
The likelihood of alumni reporting:
In the six months after service: Now:
Working in the public or nonprofit sector Percent of alumni reporting: Before service= 21% 6 months after= 46% Now= 56%
Increased for those who:
Were full time members in their last term of service.
17 percent of variance explained
Increased for those who:
Engaged in a service experience before joining AmeriCorps.
Served multiple terms in different AmeriCorps programs.
Decreased for those who:
Had less than a four-year degree at the time of service.
18 percent of variance explained
Being engaged in a service opportunity Percent of alumni reporting: Before service <5% 6 months after= 6% Now= 6%
Increased for those who:
Had an environmental service focus.
Had economic opportunity focus. 37 percent of variance explained
Increased for those who:
Were NCCC members from 5 years ago.
Were NCCC alumni from 2 years ago.
Were in school immediately prior to serving.
Were older. Decreased for those who:
Were parents or caregivers at the time of service.
22 percent of variance explained
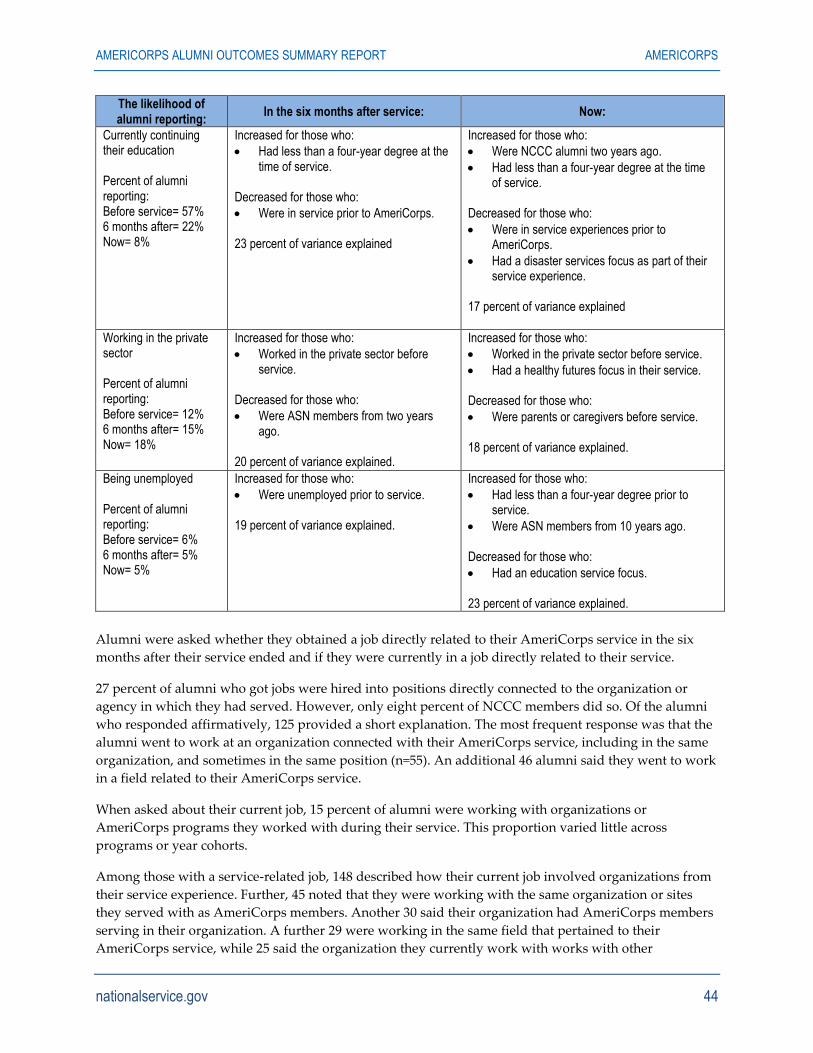
AMERICORPS ALUMNI OUTCOMES SUMMARY REPORT AMERICORPS
nationalservice.gov 44
The likelihood of alumni reporting:
In the six months after service: Now:
Currently continuing their education Percent of alumni reporting: Before service= 57% 6 months after= 22% Now= 8%
Increased for those who:
Had less than a four-year degree at the time of service.
Decreased for those who:
Were in service prior to AmeriCorps. 23 percent of variance explained
Increased for those who:
Were NCCC alumni two years ago.
Had less than a four-year degree at the time of service.
Decreased for those who:
Were in service experiences prior to AmeriCorps.
Had a disaster services focus as part of their service experience.
17 percent of variance explained
Working in the private sector Percent of alumni reporting: Before service= 12% 6 months after= 15% Now= 18%
Increased for those who:
Worked in the private sector before service.
Decreased for those who:
Were ASN members from two years ago.
20 percent of variance explained.
Increased for those who:
Worked in the private sector before service.
Had a healthy futures focus in their service. Decreased for those who:
Were parents or caregivers before service. 18 percent of variance explained.
Being unemployed Percent of alumni reporting: Before service= 6% 6 months after= 5% Now= 5%
Increased for those who:
Were unemployed prior to service. 19 percent of variance explained.
Increased for those who:
Had less than a four-year degree prior to service.
Were ASN members from 10 years ago. Decreased for those who:
Had an education service focus. 23 percent of variance explained.
Alumni were asked whether they obtained a job directly related to their AmeriCorps service in the six
months after their service ended and if they were currently in a job directly related to their service.
27 percent of alumni who got jobs were hired into positions directly connected to the organization or
agency in which they had served. However, only eight percent of NCCC members did so. Of the alumni
who responded affirmatively, 125 provided a short explanation. The most frequent response was that the
alumni went to work at an organization connected with their AmeriCorps service, including in the same
organization, and sometimes in the same position (n=55). An additional 46 alumni said they went to work
in a field related to their AmeriCorps service.
When asked about their current job, 15 percent of alumni were working with organizations or
AmeriCorps programs they worked with during their service. This proportion varied little across
programs or year cohorts.
Among those with a service-related job, 148 described how their current job involved organizations from
their service experience. Further, 45 noted that they were working with the same organization or sites
they served with as AmeriCorps members. Another 30 said their organization had AmeriCorps members
serving in their organization. A further 29 were working in the same field that pertained to their
AmeriCorps service, while 25 said the organization they currently work with works with other
AMERICORPS ALUMNI OUTCOMES SUMMARY REPORT AMERICORPS
nationalservice.gov 45
AmeriCorps programs. The other 20 gave varied responses.
For the six months after service, when all other predictor variables are held constant, the regression
results show that men were more likely than women to get a job directly related to their service position.
Alumni who served multiple terms with the same organization were more likely to get a job directly
related to their service, as were alumni who reported a more positive service experience. Alumni with a
four-year degree or higher were more likely to get a job with their service organization.
Those whose focus area was education were less likely to become employed in a position directly related
to their service. Alumni were more likely to be currently employed in a job related to their service if they
completed their last term of service. The regression explained 28 percent of the variance in whether or not
alumni obtained a job directly related to their AmeriCorps service in the six months after service.
Outcomes for Sense of Community AmeriCorps provides members with opportunities to gain awareness and understanding about their
community, and to develop relationships in communities. The survey asked alumni about their trust in
neighbors, pre-service and post-service attachment to a particular community, sense of obligation
towards their community, and confidence in institutions (corporations, media, and public schools).
Overall, alumni reported they had a strong sense of community bolstered by their time in AmeriCorps.
Trust in Neighbors
Alumni were asked about whether they could trust all, most, some, or none of the people in their
neighborhood, with most alumni responding they could trust “most of the people” (61 percent). Ratings
on this item were generally consistent across programs. Ratings varied across years, with older alumni
reporting greater trust in most or all of the people in their neighborhood (74 percent), as compared to
younger cohorts (66 percent for the two- and five-year cohorts).
Regression analysis found that trust in one’s neighbors was significantly related to multiple demographic
and service factors. Alumni who identified as white/non-minority reported more trust in their neighbors
than those who identified as a racial or ethnic minority. Serving in the area of veterans and military
families predicted greater trust in one’s neighbors. A positive AmeriCorps service experience was also
predictive of greater trust. The variables in the regression model explained 12 percent of the variance in
alumni’s trust in their neighbors, indicating that factors beyond one’s AmeriCorps service experience
may contribute to one’s sense of trust.
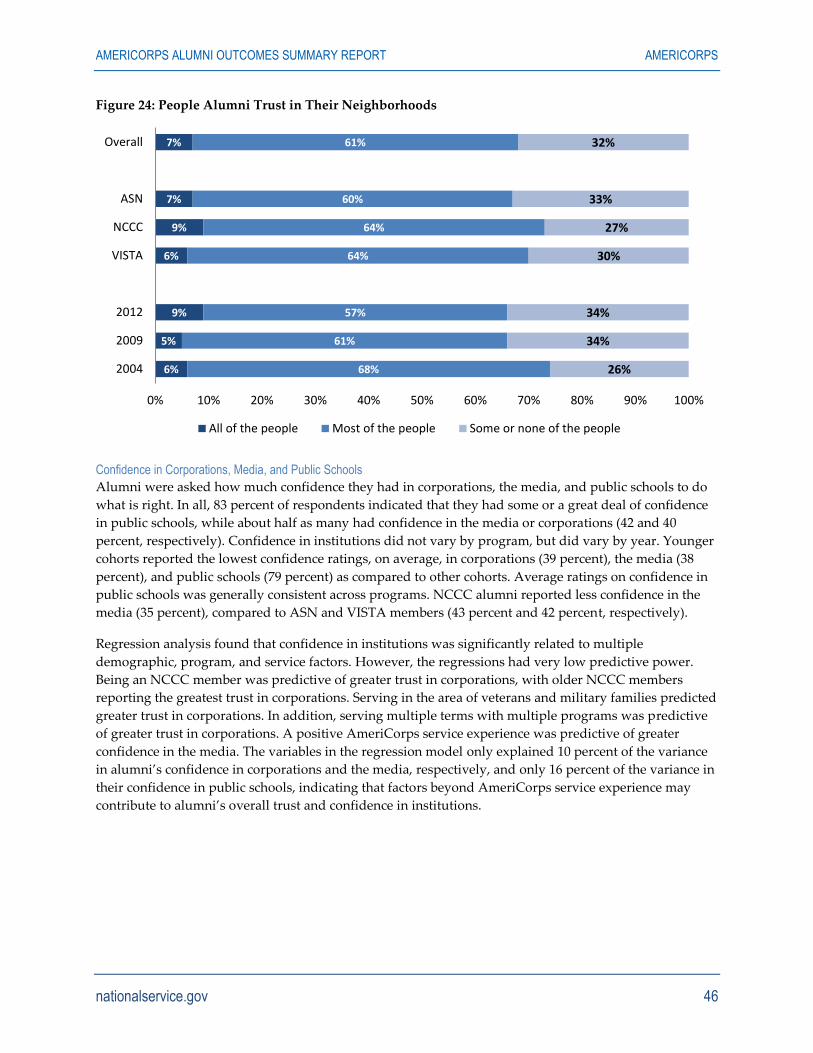
AMERICORPS ALUMNI OUTCOMES SUMMARY REPORT AMERICORPS
nationalservice.gov 46
Figure 24: People Alumni Trust in Their Neighborhoods
Confidence in Corporations, Media, and Public Schools
Alumni were asked how much confidence they had in corporations, the media, and public schools to do
what is right. In all, 83 percent of respondents indicated that they had some or a great deal of confidence
in public schools, while about half as many had confidence in the media or corporations (42 and 40
percent, respectively). Confidence in institutions did not vary by program, but did vary by year. Younger
cohorts reported the lowest confidence ratings, on average, in corporations (39 percent), the media (38
percent), and public schools (79 percent) as compared to other cohorts. Average ratings on confidence in
public schools was generally consistent across programs. NCCC alumni reported less confidence in the
media (35 percent), compared to ASN and VISTA members (43 percent and 42 percent, respectively).
Regression analysis found that confidence in institutions was significantly related to multiple
demographic, program, and service factors. However, the regressions had very low predictive power.
Being an NCCC member was predictive of greater trust in corporations, with older NCCC members
reporting the greatest trust in corporations. Serving in the area of veterans and military families predicted
greater trust in corporations. In addition, serving multiple terms with multiple programs was predictive
of greater trust in corporations. A positive AmeriCorps service experience was predictive of greater
confidence in the media. The variables in the regression model only explained 10 percent of the variance
in alumni’s confidence in corporations and the media, respectively, and only 16 percent of the variance in
their confidence in public schools, indicating that factors beyond AmeriCorps service experience may
contribute to alumni’s overall trust and confidence in institutions.
6%
5%
9%
6%
9%
7%
7%
68%
61%
57%
64%
64%
60%
61%
26%
34%
34%
30%
27%
33%
32%
0% 10% 20% 30% 40% 50% 60% 70% 80% 90% 100%
2004
2009
2012
VISTA
NCCC
ASN
Overall
All of the people Most of the people Some or none of the people
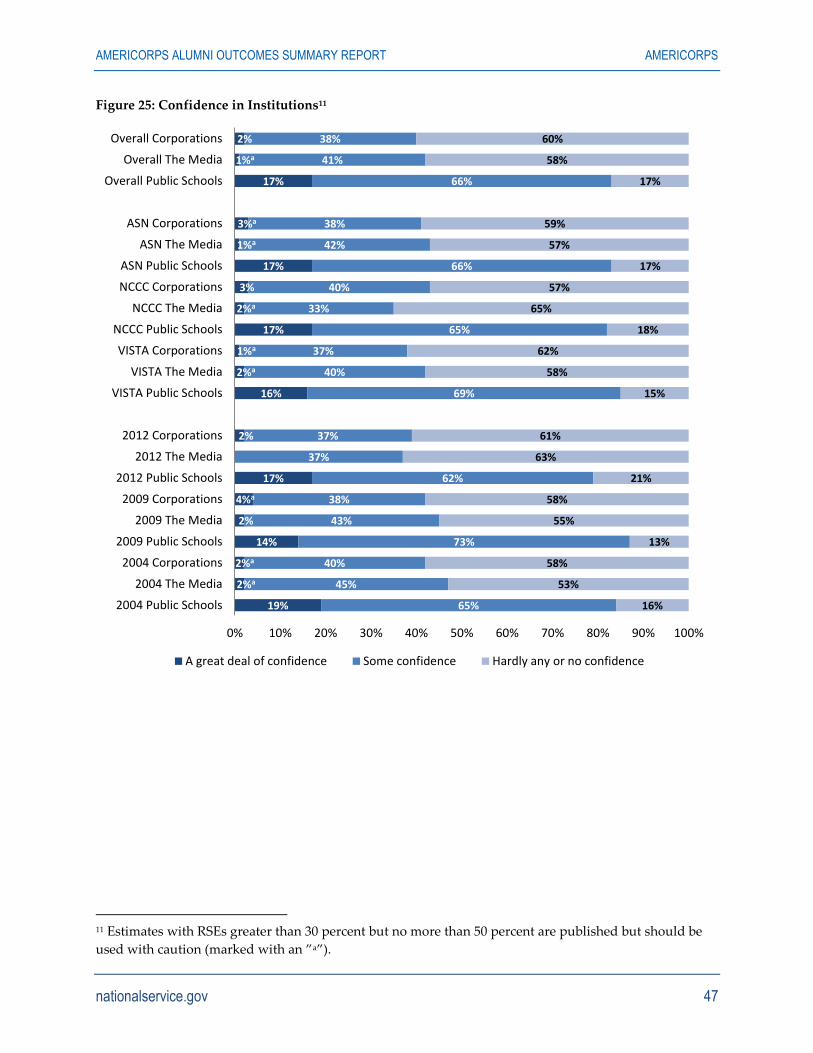
AMERICORPS ALUMNI OUTCOMES SUMMARY REPORT AMERICORPS
nationalservice.gov 47
Figure 25: Confidence in Institutions11
11 Estimates with RSEs greater than 30 percent but no more than 50 percent are published but should be
used with caution (marked with an ”a”).
19%
2%a
2%a
14%
2%
4%a
17%
2%
16%
2%a
1%a
17%
2%a
3%
17%
1%a
3%a
17%
1%a
2%
65%
45%
40%
73%
43%
38%
62%
37%
37%
69%
40%
37%
65%
33%
40%
66%
42%
38%
66%
41%
38%
16%
53%
58%
13%
55%
58%
21%
63%
61%
15%
58%
62%
18%
65%
57%
17%
57%
59%
17%
58%
60%
0% 10% 20% 30% 40% 50% 60% 70% 80% 90% 100%
2004 Public Schools
2004 The Media
2004 Corporations
2009 Public Schools
2009 The Media
2009 Corporations
2012 Public Schools
2012 The Media
2012 Corporations
VISTA Public Schools
VISTA The Media
VISTA Corporations
NCCC Public Schools
NCCC The Media
NCCC Corporations
ASN Public Schools
ASN The Media
ASN Corporations
Overall Public Schools
Overall The Media
Overall Corporations
A great deal of confidence Some confidence Hardly any or no confidence
AMERICORPS ALUMNI OUTCOMES SUMMARY REPORT AMERICORPS
nationalservice.gov 48
Attachment to Community
Overall, alumni reported that they tended to form and maintain strong bonds with their communities. At
the time of the survey, alumni reported having a greater stake in the community’s welfare than they did
prior to their AmeriCorps service. Sixty percent agreed or strongly agreed that they had a strong
attachment to their communities prior to service, compared to 82 percent now, a gain of 22 percentage
points. Increased attachment to one’s communities did not vary by year, but did vary by program.
Specifically, NCCC and ASN alumni indicated the greatest gains in attachment to their communities now
compared to before service. NCCC alumni showed the greatest increase (28 percentage points), with 53
percent agreeing or strongly agreeing with sense of community items pre-service, and 81 percent
agreeing or strongly agreeing on post-service sense of community items. VISTA members had smaller
gains (17 percentage points), with 66 percent of VISTA alumni agreeing or strongly agreeing with sense
of community items, on average, for pre-service, and 83 percent agreeing or strongly agreeing to sense of
community items post-service.
In terms of the individual statements, the biggest gains were in alumni agreeing or strongly agreeing that
they are aware of the important needs in their community, which increased 32 percentage points from 51
percent to 83 percent, and agreeing or strongly agreeing in having a strong and personal attachment to a
particular community, which rose from 47 percent to 76 percent (an increase of 29 percentage points).
Other notable gains occurred in being or planning to become actively involved in issues that positively
affect the community, which rose from 58 percent to 78 percent, and in feeling a personal obligation to
contribute in some way to the community (an increase of 20 percentage points in both instances).
Regression analysis found that having a strong attachment to one’s community was significantly related
to service factors. Having a positive AmeriCorps service experience was predictive of greater attachment
to one’s community. However, using one’s education award was predictive of a lower sense of
community. The variables in the regression model explained 45 percent of the variance in alumni’s
current sense of community scores, indicating that having a positive service experience promoted
alumni’s current strong bonds and attachment with their community.
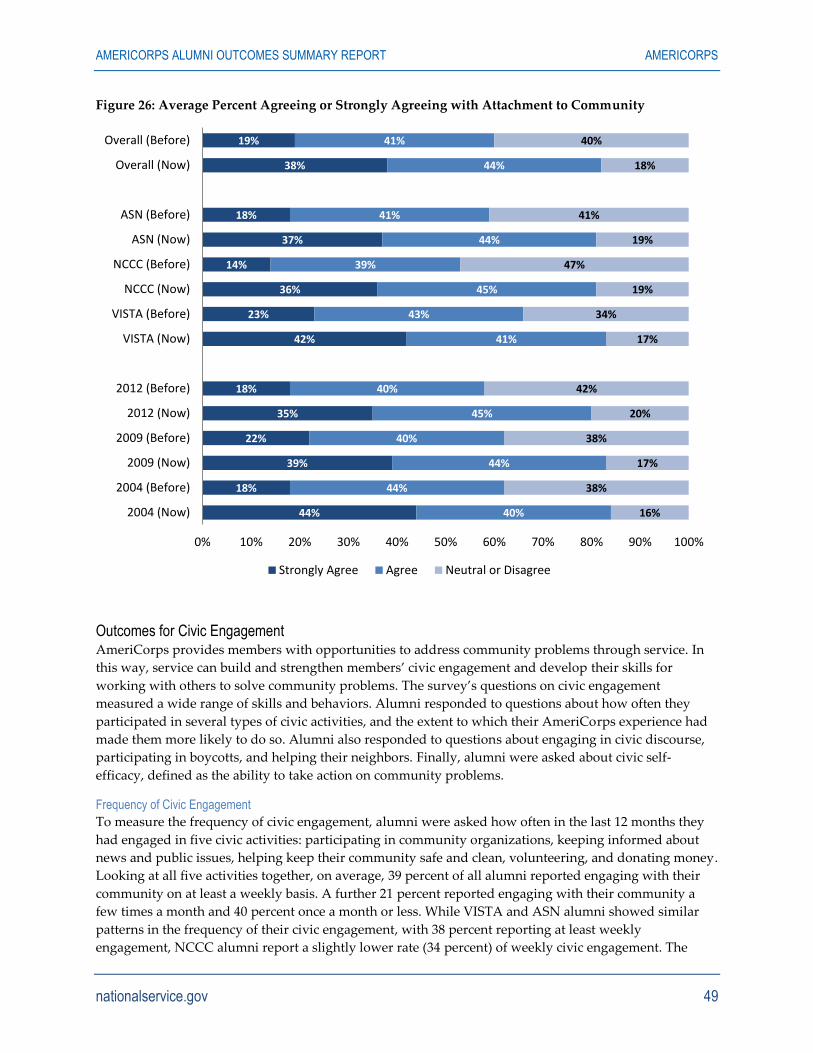
AMERICORPS ALUMNI OUTCOMES SUMMARY REPORT AMERICORPS
nationalservice.gov 49
Figure 26: Average Percent Agreeing or Strongly Agreeing with Attachment to Community
Outcomes for Civic Engagement AmeriCorps provides members with opportunities to address community problems through service. In
this way, service can build and strengthen members’ civic engagement and develop their skills for
working with others to solve community problems. The survey’s questions on civic engagement
measured a wide range of skills and behaviors. Alumni responded to questions about how often they
participated in several types of civic activities, and the extent to which their AmeriCorps experience had
made them more likely to do so. Alumni also responded to questions about engaging in civic discourse,
participating in boycotts, and helping their neighbors. Finally, alumni were asked about civic self-
efficacy, defined as the ability to take action on community problems.
Frequency of Civic Engagement
To measure the frequency of civic engagement, alumni were asked how often in the last 12 months they
had engaged in five civic activities: participating in community organizations, keeping informed about
news and public issues, helping keep their community safe and clean, volunteering, and donating money.
Looking at all five activities together, on average, 39 percent of all alumni reported engaging with their
community on at least a weekly basis. A further 21 percent reported engaging with their community a
few times a month and 40 percent once a month or less. While VISTA and ASN alumni showed similar
patterns in the frequency of their civic engagement, with 38 percent reporting at least weekly
engagement, NCCC alumni report a slightly lower rate (34 percent) of weekly civic engagement. The
44%
18%
39%
22%
35%
18%
42%
23%
36%
14%
37%
18%
38%
19%
40%
44%
44%
40%
45%
40%
41%
43%
45%
39%
44%
41%
44%
41%
16%
38%
17%
38%
20%
42%
17%
34%
19%
47%
19%
41%
18%
40%
0% 10% 20% 30% 40% 50% 60% 70% 80% 90% 100%
2004 (Now)
2004 (Before)
2009 (Now)
2009 (Before)
2012 (Now)
2012 (Before)
VISTA (Now)
VISTA (Before)
NCCC (Now)
NCCC (Before)
ASN (Now)
ASN (Before)
Overall (Now)
Overall (Before)
Strongly Agree Agree Neutral or Disagree
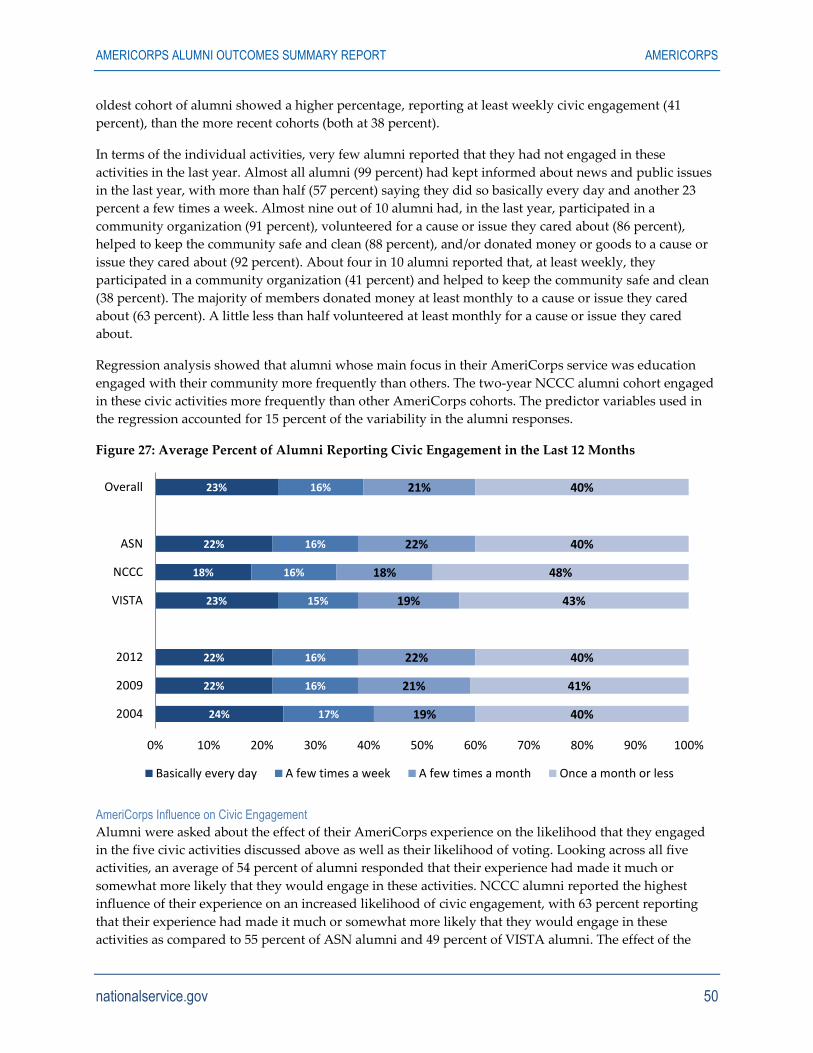
AMERICORPS ALUMNI OUTCOMES SUMMARY REPORT AMERICORPS
nationalservice.gov 50
oldest cohort of alumni showed a higher percentage, reporting at least weekly civic engagement (41
percent), than the more recent cohorts (both at 38 percent).
In terms of the individual activities, very few alumni reported that they had not engaged in these
activities in the last year. Almost all alumni (99 percent) had kept informed about news and public issues
in the last year, with more than half (57 percent) saying they did so basically every day and another 23
percent a few times a week. Almost nine out of 10 alumni had, in the last year, participated in a
community organization (91 percent), volunteered for a cause or issue they cared about (86 percent),
helped to keep the community safe and clean (88 percent), and/or donated money or goods to a cause or
issue they cared about (92 percent). About four in 10 alumni reported that, at least weekly, they
participated in a community organization (41 percent) and helped to keep the community safe and clean
(38 percent). The majority of members donated money at least monthly to a cause or issue they cared
about (63 percent). A little less than half volunteered at least monthly for a cause or issue they cared
about.
Regression analysis showed that alumni whose main focus in their AmeriCorps service was education
engaged with their community more frequently than others. The two-year NCCC alumni cohort engaged
in these civic activities more frequently than other AmeriCorps cohorts. The predictor variables used in
the regression accounted for 15 percent of the variability in the alumni responses.
Figure 27: Average Percent of Alumni Reporting Civic Engagement in the Last 12 Months
AmeriCorps Influence on Civic Engagement
Alumni were asked about the effect of their AmeriCorps experience on the likelihood that they engaged
in the five civic activities discussed above as well as their likelihood of voting. Looking across all five
activities, an average of 54 percent of alumni responded that their experience had made it much or
somewhat more likely that they would engage in these activities. NCCC alumni reported the highest
influence of their experience on an increased likelihood of civic engagement, with 63 percent reporting
that their experience had made it much or somewhat more likely that they would engage in these
activities as compared to 55 percent of ASN alumni and 49 percent of VISTA alumni. The effect of the
24%
22%
22%
23%
18%
22%
23%
17%
16%
16%
15%
16%
16%
16%
19%
21%
22%
19%
18%
22%
21%
40%
41%
40%
43%
48%
40%
40%
0% 10% 20% 30% 40% 50% 60% 70% 80% 90% 100%
2004
2009
2012
VISTA
NCCC
ASN
Overall
Basically every day A few times a week A few times a month Once a month or less
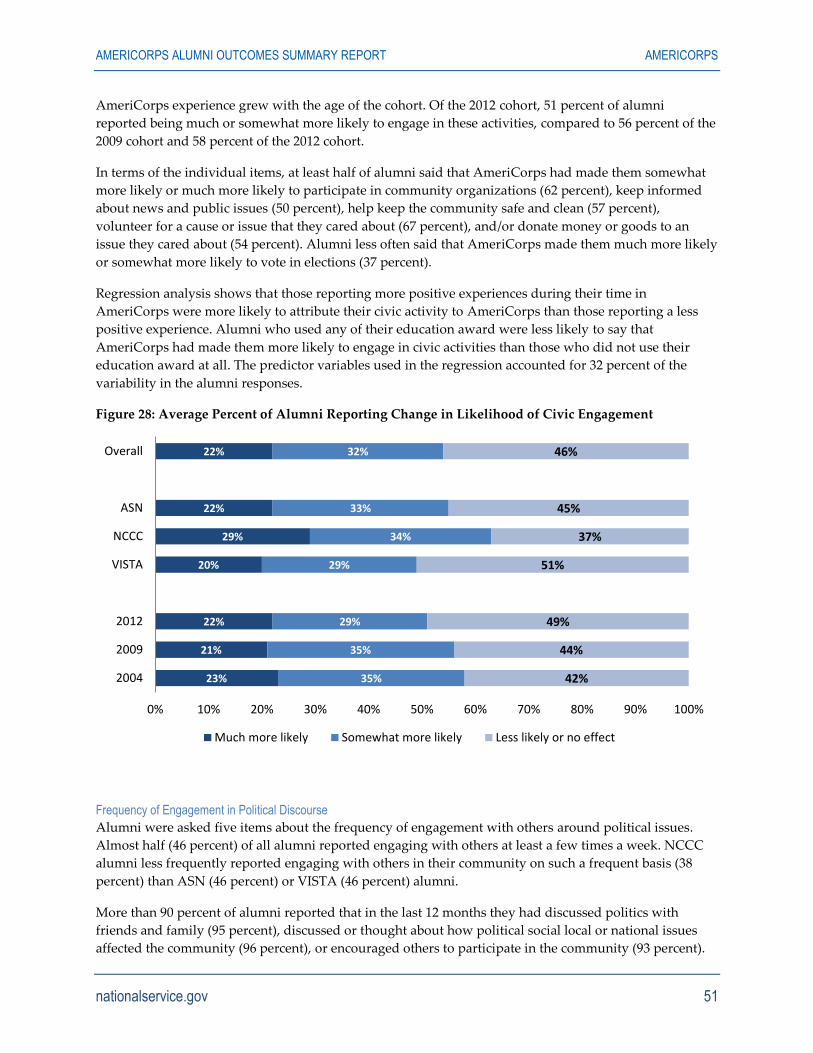
AMERICORPS ALUMNI OUTCOMES SUMMARY REPORT AMERICORPS
nationalservice.gov 51
AmeriCorps experience grew with the age of the cohort. Of the 2012 cohort, 51 percent of alumni
reported being much or somewhat more likely to engage in these activities, compared to 56 percent of the
2009 cohort and 58 percent of the 2012 cohort.
In terms of the individual items, at least half of alumni said that AmeriCorps had made them somewhat
more likely or much more likely to participate in community organizations (62 percent), keep informed
about news and public issues (50 percent), help keep the community safe and clean (57 percent),
volunteer for a cause or issue that they cared about (67 percent), and/or donate money or goods to an
issue they cared about (54 percent). Alumni less often said that AmeriCorps made them much more likely
or somewhat more likely to vote in elections (37 percent).
Regression analysis shows that those reporting more positive experiences during their time in
AmeriCorps were more likely to attribute their civic activity to AmeriCorps than those reporting a less
positive experience. Alumni who used any of their education award were less likely to say that
AmeriCorps had made them more likely to engage in civic activities than those who did not use their
education award at all. The predictor variables used in the regression accounted for 32 percent of the
variability in the alumni responses.
Figure 28: Average Percent of Alumni Reporting Change in Likelihood of Civic Engagement
Frequency of Engagement in Political Discourse
Alumni were asked five items about the frequency of engagement with others around political issues.
Almost half (46 percent) of all alumni reported engaging with others at least a few times a week. NCCC
alumni less frequently reported engaging with others in their community on such a frequent basis (38
percent) than ASN (46 percent) or VISTA (46 percent) alumni.
More than 90 percent of alumni reported that in the last 12 months they had discussed politics with
friends and family (95 percent), discussed or thought about how political social local or national issues
affected the community (96 percent), or encouraged others to participate in the community (93 percent).
23%
21%
22%
20%
29%
22%
22%
35%
35%
29%
29%
34%
33%
32%
42%
44%
49%
51%
37%
45%
46%
0% 10% 20% 30% 40% 50% 60% 70% 80% 90% 100%
2004
2009
2012
VISTA
NCCC
ASN
Overall
Much more likely Somewhat more likely Less likely or no effect
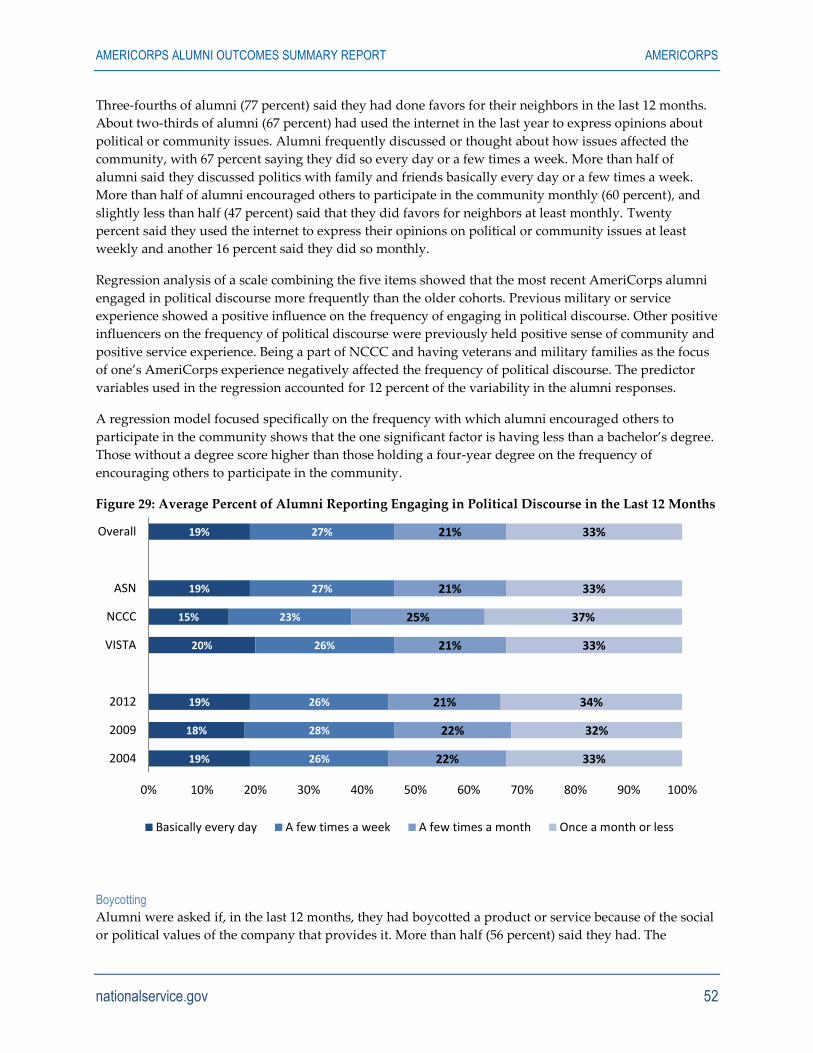
AMERICORPS ALUMNI OUTCOMES SUMMARY REPORT AMERICORPS
nationalservice.gov 52
Three-fourths of alumni (77 percent) said they had done favors for their neighbors in the last 12 months.
About two-thirds of alumni (67 percent) had used the internet in the last year to express opinions about
political or community issues. Alumni frequently discussed or thought about how issues affected the
community, with 67 percent saying they did so every day or a few times a week. More than half of
alumni said they discussed politics with family and friends basically every day or a few times a week.
More than half of alumni encouraged others to participate in the community monthly (60 percent), and
slightly less than half (47 percent) said that they did favors for neighbors at least monthly. Twenty
percent said they used the internet to express their opinions on political or community issues at least
weekly and another 16 percent said they did so monthly.
Regression analysis of a scale combining the five items showed that the most recent AmeriCorps alumni
engaged in political discourse more frequently than the older cohorts. Previous military or service
experience showed a positive influence on the frequency of engaging in political discourse. Other positive
influencers on the frequency of political discourse were previously held positive sense of community and
positive service experience. Being a part of NCCC and having veterans and military families as the focus
of one’s AmeriCorps experience negatively affected the frequency of political discourse. The predictor
variables used in the regression accounted for 12 percent of the variability in the alumni responses.
A regression model focused specifically on the frequency with which alumni encouraged others to
participate in the community shows that the one significant factor is having less than a bachelor’s degree.
Those without a degree score higher than those holding a four-year degree on the frequency of
encouraging others to participate in the community.
Figure 29: Average Percent of Alumni Reporting Engaging in Political Discourse in the Last 12 Months
Boycotting
Alumni were asked if, in the last 12 months, they had boycotted a product or service because of the social
or political values of the company that provides it. More than half (56 percent) said they had. The
19%
18%
19%
20%
15%
19%
19%
26%
28%
26%
26%
23%
27%
27%
22%
22%
21%
21%
25%
21%
21%
33%
32%
34%
33%
37%
33%
33%
0% 10% 20% 30% 40% 50% 60% 70% 80% 90% 100%
2004
2009
2012
VISTA
NCCC
ASN
Overall
Basically every day A few times a week A few times a month Once a month or less
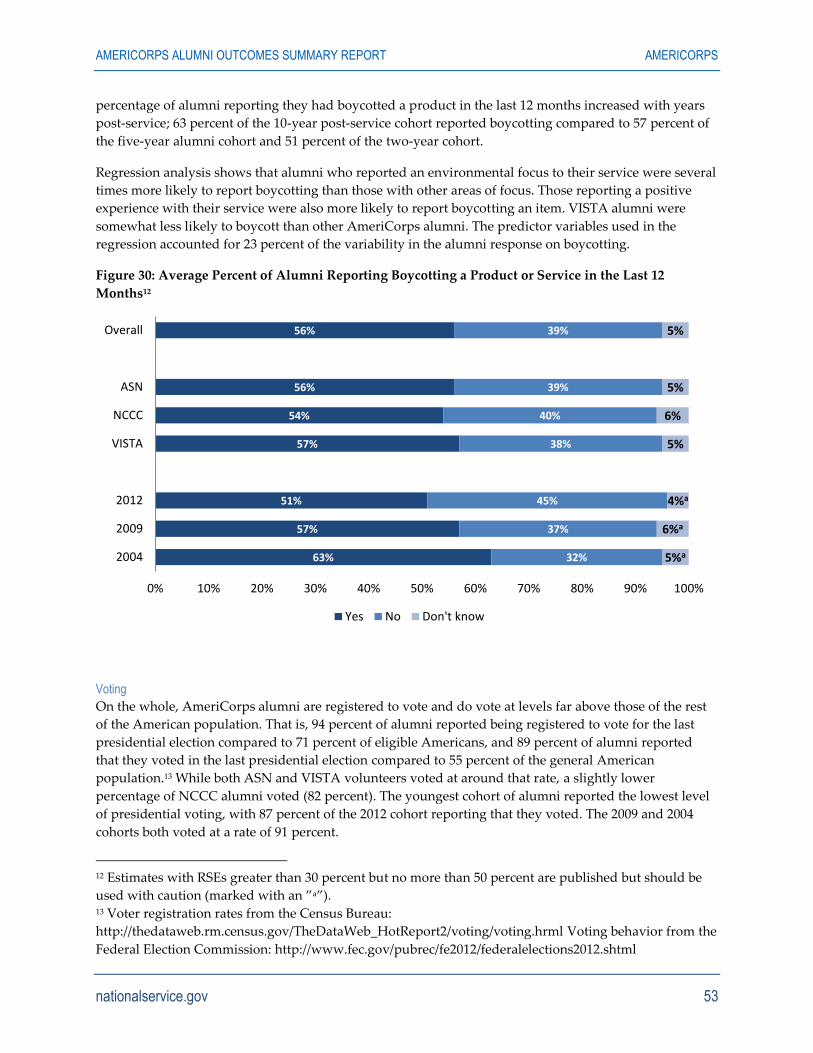
AMERICORPS ALUMNI OUTCOMES SUMMARY REPORT AMERICORPS
nationalservice.gov 53
percentage of alumni reporting they had boycotted a product in the last 12 months increased with years
post-service; 63 percent of the 10-year post-service cohort reported boycotting compared to 57 percent of
the five-year alumni cohort and 51 percent of the two-year cohort.
Regression analysis shows that alumni who reported an environmental focus to their service were several
times more likely to report boycotting than those with other areas of focus. Those reporting a positive
experience with their service were also more likely to report boycotting an item. VISTA alumni were
somewhat less likely to boycott than other AmeriCorps alumni. The predictor variables used in the
regression accounted for 23 percent of the variability in the alumni response on boycotting.
Figure 30: Average Percent of Alumni Reporting Boycotting a Product or Service in the Last 12
Months12
Voting
On the whole, AmeriCorps alumni are registered to vote and do vote at levels far above those of the rest
of the American population. That is, 94 percent of alumni reported being registered to vote for the last
presidential election compared to 71 percent of eligible Americans, and 89 percent of alumni reported
that they voted in the last presidential election compared to 55 percent of the general American
population.13 While both ASN and VISTA volunteers voted at around that rate, a slightly lower
percentage of NCCC alumni voted (82 percent). The youngest cohort of alumni reported the lowest level
of presidential voting, with 87 percent of the 2012 cohort reporting that they voted. The 2009 and 2004
cohorts both voted at a rate of 91 percent.
12 Estimates with RSEs greater than 30 percent but no more than 50 percent are published but should be
used with caution (marked with an ”a”). 13 Voter registration rates from the Census Bureau:
http://thedataweb.rm.census.gov/TheDataWeb_HotReport2/voting/voting.hrml Voting behavior from the
Federal Election Commission: http://www.fec.gov/pubrec/fe2012/federalelections2012.shtml
63%
57%
51%
57%
54%
56%
56%
32%
37%
45%
38%
40%
39%
39%
5%a
6%a
4%a
5%
6%
5%
5%
0% 10% 20% 30% 40% 50% 60% 70% 80% 90% 100%
2004
2009
2012
VISTA
NCCC
ASN
Overall
Yes No Don't know
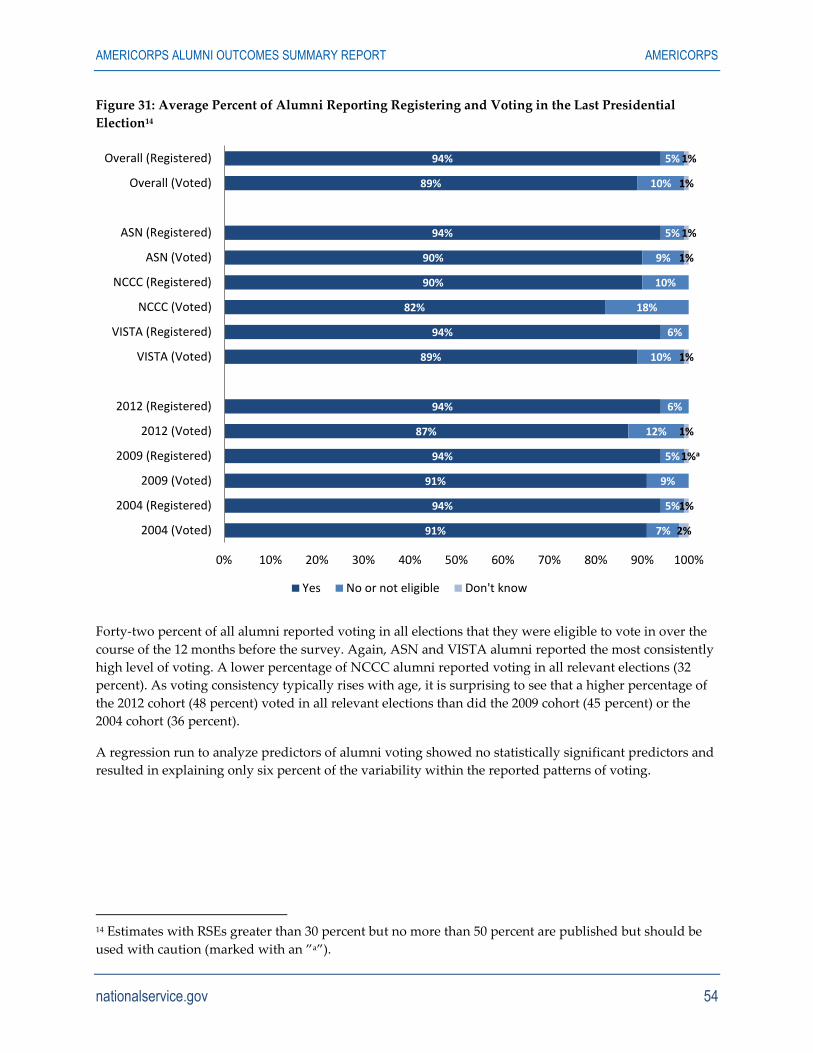
AMERICORPS ALUMNI OUTCOMES SUMMARY REPORT AMERICORPS
nationalservice.gov 54
Figure 31: Average Percent of Alumni Reporting Registering and Voting in the Last Presidential
Election14
Forty-two percent of all alumni reported voting in all elections that they were eligible to vote in over the
course of the 12 months before the survey. Again, ASN and VISTA alumni reported the most consistently
high level of voting. A lower percentage of NCCC alumni reported voting in all relevant elections (32
percent). As voting consistency typically rises with age, it is surprising to see that a higher percentage of
the 2012 cohort (48 percent) voted in all relevant elections than did the 2009 cohort (45 percent) or the
2004 cohort (36 percent).
A regression run to analyze predictors of alumni voting showed no statistically significant predictors and
resulted in explaining only six percent of the variability within the reported patterns of voting.
14 Estimates with RSEs greater than 30 percent but no more than 50 percent are published but should be
used with caution (marked with an ”a”).
91%
94%
91%
94%
87%
94%
89%
94%
82%
90%
90%
94%
89%
94%
7%
5%
9%
5%
12%
6%
10%
6%
18%
10%
9%
5%
10%
5%
2%
1%
1%a
1%
1%
1%
1%
1%
1%
0% 10% 20% 30% 40% 50% 60% 70% 80% 90% 100%
2004 (Voted)
2004 (Registered)
2009 (Voted)
2009 (Registered)
2012 (Voted)
2012 (Registered)
VISTA (Voted)
VISTA (Registered)
NCCC (Voted)
NCCC (Registered)
ASN (Voted)
ASN (Registered)
Overall (Voted)
Overall (Registered)
Yes No or not eligible Don't know
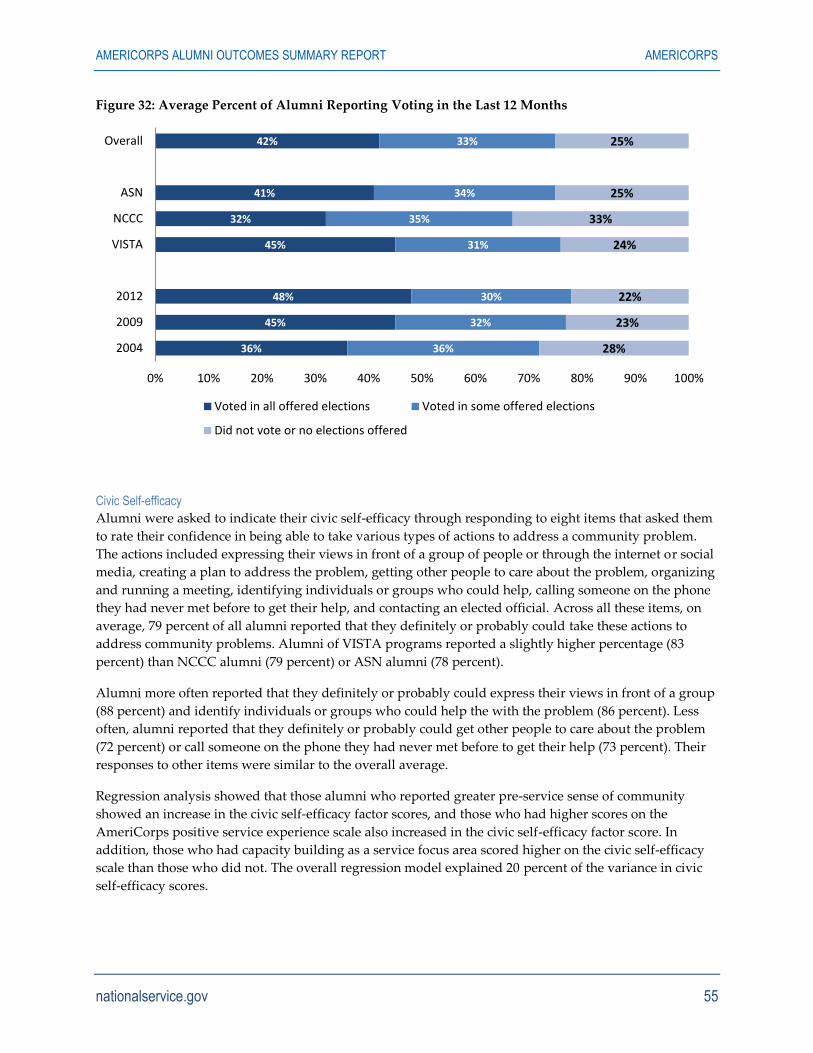
AMERICORPS ALUMNI OUTCOMES SUMMARY REPORT AMERICORPS
nationalservice.gov 55
Figure 32: Average Percent of Alumni Reporting Voting in the Last 12 Months
Civic Self-efficacy
Alumni were asked to indicate their civic self-efficacy through responding to eight items that asked them
to rate their confidence in being able to take various types of actions to address a community problem.
The actions included expressing their views in front of a group of people or through the internet or social
media, creating a plan to address the problem, getting other people to care about the problem, organizing
and running a meeting, identifying individuals or groups who could help, calling someone on the phone
they had never met before to get their help, and contacting an elected official. Across all these items, on
average, 79 percent of all alumni reported that they definitely or probably could take these actions to
address community problems. Alumni of VISTA programs reported a slightly higher percentage (83
percent) than NCCC alumni (79 percent) or ASN alumni (78 percent).
Alumni more often reported that they definitely or probably could express their views in front of a group
(88 percent) and identify individuals or groups who could help the with the problem (86 percent). Less
often, alumni reported that they definitely or probably could get other people to care about the problem
(72 percent) or call someone on the phone they had never met before to get their help (73 percent). Their
responses to other items were similar to the overall average.
Regression analysis showed that those alumni who reported greater pre-service sense of community
showed an increase in the civic self-efficacy factor scores, and those who had higher scores on the
AmeriCorps positive service experience scale also increased in the civic self-efficacy factor score. In
addition, those who had capacity building as a service focus area scored higher on the civic self-efficacy
scale than those who did not. The overall regression model explained 20 percent of the variance in civic
self-efficacy scores.
36%
45%
48%
45%
32%
41%
42%
36%
32%
30%
31%
35%
34%
33%
28%
23%
22%
24%
33%
25%
25%
0% 10% 20% 30% 40% 50% 60% 70% 80% 90% 100%
2004
2009
2012
VISTA
NCCC
ASN
Overall
Voted in all offered elections Voted in some offered elections
Did not vote or no elections offered
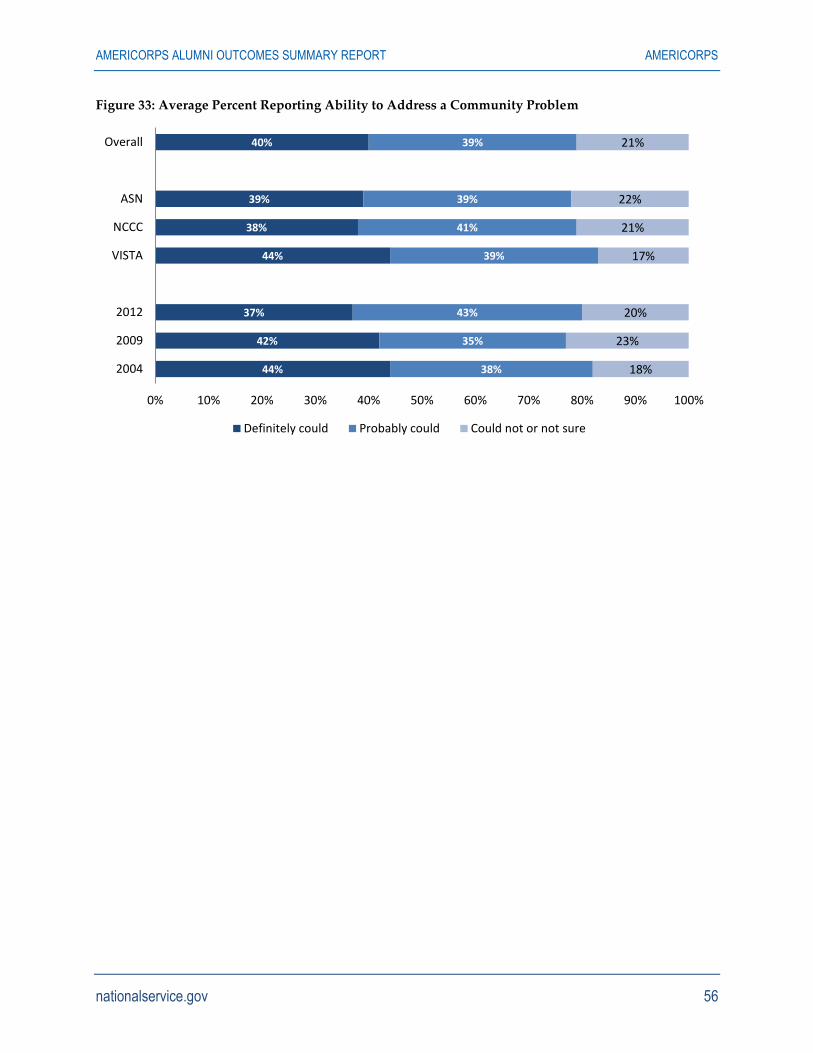
AMERICORPS ALUMNI OUTCOMES SUMMARY REPORT AMERICORPS
nationalservice.gov 56
Figure 33: Average Percent Reporting Ability to Address a Community Problem
44%
42%
37%
44%
38%
39%
40%
38%
35%
43%
39%
41%
39%
39%
18%
23%
20%
17%
21%
22%
21%
0% 10% 20% 30% 40% 50% 60% 70% 80% 90% 100%
2004
2009
2012
VISTA
NCCC
ASN
Overall
Definitely could Probably could Could not or not sure
AMERICORPS ALUMNI OUTCOMES SUMMARY REPORT AMERICORPS
nationalservice.gov 57
Chapter 5: Answers to Research Questions The preceding chapter provided detailed results for the AmeriCorps Alumni Outcome survey organized
by outcome area. This chapter synthesizes previously presented information to address the research
questions.
1. In what ways does participating in a national service program influence members’ a)
development of career-oriented soft skills, b) career pathways, c) sense of community, and
d) civic engagement?
2. In what ways, if any, do member outcomes vary by the six Serve America Act focus areas
(disaster services, economic opportunity, education, environmental stewardship, healthy futures,
and veterans and military families), and by the particular type of service programs (ASN, NCCC,
VISTA) and program experiences?
3. In what ways, if any, do member outcomes vary by life stage?
These research questions, and the data collected to answer them, shed light on the unique value of the
national service experience for AmeriCorps alumni and the enduring effects of participation on the
trajectories of alumni’s lives.
Research Question One: Influence of Service Participation on Outcomes. Research Question 1 asks “In what ways does participating in a national service program influence members’
a) development of career-oriented soft skills, b) career pathways, c) sense of community, and d) civic
engagement?” The answer to this question summarizes results presented above previously on how
national service participation influences outcomes in these four areas.
Developing Career-Oriented Soft Skills
AmeriCorps alumni reported having high levels of career-oriented soft skills, including cultural
competency, self-efficacy, and career-specific skills for interacting with others and for self-management.
In each skill area, alumni noted that their skills had increased from before AmeriCorps service or that
AmeriCorps service had helped build these skills.
Nine out of 10 alumni agreed or strongly agreed that they enjoyed exploring differences with others and
interacting with different people, respected others’ values, and were confident interacting with diverse
people. Alumni showed gains in all these areas compared to before service. The largest gain was in
having confidence in interacting with diverse people.
Alumni also had high levels of self-efficacy. On average, nine out of 10 ten alumni agreed or strongly
agreed that they could solve difficult problems, persist when opposed, accomplish goals, handle
unexpected events and unforeseen situations, remain calm, cope with difficulties, and identify multiple
solutions. Alumni rated their current skills as higher than those pre-service, with the greatest gains being
in their abilities to deal with unexpected events and unforeseen situations.
Most alumni rated themselves as having good or excellent career-specific skills, including written and
oral communication, teamwork, collaboration with diverse individuals, professional conduct,
independence, planning, time management, prioritization, conflict management, adaptability,
persistence, and goal orientation. On average, 85 percent of alumni reported good or excellent skills in
interacting with others and 95 percent reported good or excellent skills in self-management. Alumni
reported that participating in national service helped them build these skills. On average, alumni said
that AmeriCorps helped somewhat or a great deal in building their skills in interacting with others (85
AMERICORPS ALUMNI OUTCOMES SUMMARY REPORT AMERICORPS
nationalservice.gov 58
percent) and in self-management (95 percent).
Service Participation and Alumni Career Pathways
While there was some diversity in career pathways, most alumni were students prior to AmeriCorps (63
percent), and of those where were engaged in education six months prior to AmeriCorps, analysis shows
that 44 percent were working in government or nonprofit sector six months after AmeriCorps. This
proportion rises to 56 percent working in the government or nonprofit sector now. The analysis shows
that a typical career pathway for AmeriCorps alumni is to come to service from education and then to
find work in the government or nonprofit sector after completing service, and this pattern tends to
strengthen over time. Further, it is noted that only 11 percent were both pursuing their education and
working in government or the nonprofit sector in the six months prior to service, so observed pattern is
not substantially accounted for by individuals who worked in government or the nonprofit sector
returning to these fields upon completing their service.
Others had returned to or began work in the private sector. Small numbers of alumni were unemployed
or still continuing their education. Following service, about one quarter of participants (27 percent),
obtained a job directly connected to the organization or agency in which they served. Fifteen percent are
currently in a position related to their service.
Alumni also generally found AmeriCorps to be a defining personal and professional experience. A
majority (80 percent) indicated their service experience was worthwhile in furthering their careers. Most
alumni responded that AmeriCorps service either aligned with their existing career path or directed them
toward a service-related field, with 34 percent indicating that their career path turned in the direction of
service-related work following AmeriCorps. Alumni typically used their education award to repay
student loans or attend graduate school. After service, 43 percent of alumni stayed in their community of
service and 57 percent returned to a home outside the community or moved to a new community.
Developing and Maintaining a Sense of Community
Overall, alumni reported having a strong sense of community. On average, 82 percent of alumni agreed
that they felt a strong personal attachment to their community, were aware of community needs, felt an
obligation to contribute to the community, planned or were actively involved in community issues, and
voted in elections. Alumni reported a stronger sense of community at the time of the survey compared to
before service, with the average being 22 percent more alumni agreeing or strongly agreeing they were
involved in the community. The strongest gains were in alumni agreeing or strongly agreeing that they
are aware of the important needs in their community and that they have a personal attachment to their
community.
Two-thirds of alumni reported that they could trust most or all of the people in their neighborhood. At
the same time, less than half of alumni reported some or a great deal of confidence in corporations (40
percent) or the media (42 percent), while a large majority (83 percent) reported some or a great deal of
confidence in public schools.
Developing and Maintaining Civic Engagement
AmeriCorps alumni reported high levels of civic engagement and civic self-efficacy, and indicated that
their AmeriCorps experience influenced their civic engagement. Almost 80 percent of alumni indicated
that they definitely or probably had civic self-efficacy, the ability to deal with community problems by
taking a range of actions that include creating a plan to address the issue, getting others involved,
organizing and running a meeting, expressing their views in front of others, on the internet or through
social media, identifying individuals or groups who could help, contacting them by phone, and
contacting an elected official.

AMERICORPS ALUMNI OUTCOMES SUMMARY REPORT AMERICORPS
nationalservice.gov 59
More than half of alumni noted that their service experience had made them more likely to engage in
civic activities such as volunteering for or donating money to a cause they cared about. Almost all alumni
(94 percent) were registered to vote and 89 percent reported voting in the last presidential election.
Research Question Two: Influence of Serve America Act Focus Areas and Service Programs on Outcomes. Research Question 2 asks “In what ways, if any, do member outcomes vary by the six Serve America Act focus
areas (disaster services, economic opportunity, education, environmental stewardship, healthy futures, and veterans
and military families), and by the particular type of service programs (ASN, NCCC, VISTA) and program
experiences?” The answer to this question draws on alumni responses to questions asking about their
service focus area, information on alumni’s service program and program year (e.g., ASN two-year
alumni) and alumni’s responses to several survey questions about their service experience. To look at the
independent influence of each of these aspects of service, this discussion presents regression results.
Overall, there were no strong patterns between outcomes and service area focus or service program.
Generally, in each outcome area, small numbers of service focus areas or program cohorts were
significantly associated with a few outcomes. Similarly, there were no set of focus areas or service
program cohorts that were significantly related to all of the outcome areas or to all of the outcomes within
an outcome area.
Service experience variables were more often significantly related to outcomes. The most consistent
association was between a positive service experience and more positive outcomes in all outcome areas.
Other measures of service experience were significantly related to several outcomes, but there were no
consistent patterns across outcome areas or measures within an outcome area.
Focus Area Differences
Relatively few Serve America Act focus areas significantly affected outcomes for alumni’s career-oriented
soft skills, career pathways, sense of community, and civic engagement. Significant relationships are
noted below. In general, each service area was significantly associated with one or two measures of
outcomes, and no service area consistently resulted in higher or lower alumni outcomes across all
outcomes in an outcome area. Further, no service focus area was significantly associated with measures in
all four outcome areas.
Outcomes measuring career-oriented soft skills were mainly independent of service focus. Two service
areas were associated with one outcome; increasing self-efficacy after AmeriCorps. Participants in the
education and capacity building areas reported greater post-service self-efficacy. Further, service focus
had no effect on alumni’s post-service cultural competency or career-orientated skills related to managing
self or interacting with others, nor with whether alumni attributed their skills increase to AmeriCorps
service.
In terms of career pathways, all of the focus areas, except for capacity building, had a significant
relationship with at least one measure of career pathways. At the same time, several outcomes were
independent of service focus area, including staying in the community of service, whether the alumni
thought service aligned with their career pathway, how alumni listed their service on their resumes, and
the career pathways scale, which measured the degree to which alumni found AmeriCorps to be a
worthwhile and defining experience.
There were a few significant relationships between focus areas and career sectors. Three focus areas had
significant relationships with alumni’s careers six months after service. Alumni who served in the
AMERICORPS ALUMNI OUTCOMES SUMMARY REPORT AMERICORPS
nationalservice.gov 60
environmental stewardship and economic opportunity areas were more likely to be engaged in a service
experience, while alumni whose service was with veterans and military families were significantly less
likely to be engaged in a service experience. Three other service focus areas were significantly related to
alumni’s current career pathways. Alumni who served in the education focus area were less likely to be
unemployed at the time of the survey; alumni who served in the healthy futures focus area were more
likely to be currently working in the private sector; and alumni in the disaster services focus area were
less likely to be currently continuing their education. Further, alumni with an education service focus
were less likely to have a position in or directly connected to the agency where they had served.
Alumni in two service focus areas differed significantly in how they used their education awards. Alumni
who served in the education focus area were more likely to have used their education award, and alumni
who were unable to specify a service focus area were less likely to use their education award to pay for
school.
Participation in three focus areas was associated with specific sense of community measures. Alumni
who served in the economic opportunity focus area reported higher scores on the post-AmeriCorps sense
of community scale, and alumni who had served in the veterans and military families focus area showed
greater trust in their neighbors. In terms of trust in institutions, alumni engaged in the service focus area
of veterans and military families had greater trust in corporations, and alumni who reported they were
unsure of their focus area showed lower trust in public schools.
Service in four focus areas was associated with civic engagement outcomes; service in three focus areas
was associated with one civic engagement outcome measure; and service in one focus area was associated
with two civic engagement outcome measures. Alumni who had served in the education area reported
higher scores on the 12-month civic engagement scale, and those in the environmental stewardship focus
area were more likely to have boycotted a product or service. There were two focus areas that were
associated with lower civic engagement. Alumni in the veterans and military families focus area had
lower scores on the measure of discussing and thinking about community issues, and those in the
capacity building focus area had lower scores on the civic self-efficacy scale.
Service Program Differences
To examine the effect of service program and alumni year on outcomes, the alumni cohorts for each
service year and program were included in the regression model. VISTA alumni who were 10 years post-
service served as the reference group for the comparisons among service program and year cohorts.
Overall, there were no strong patterns between outcomes and service program and alumni year cohorts.
There were no sets of program or year cohorts that were significantly related to all of the outcome areas
or to all of the outcomes within an outcome area. While career-oriented soft skills was largely
independent of service program for career pathways, sense of community, and civic engagement, small
numbers of cohorts were associated with some of the outcome measures as detailed below.
Alumni’s post-service career-oriented soft skills appeared independent of their particular service year or
service program. The only significant relationship was that ASN five-year alumni were less likely to
attribute their career-specific skill gains to AmeriCorps service. There was no difference across service
program cohorts in terms of several measures of career-oriented soft skills including cultural competency,
self-efficacy, and the two career specific skills scales measuring self-management and interacting with
others.
The relationship between service program and year cohorts and career pathways differed by outcome

AMERICORPS ALUMNI OUTCOMES SUMMARY REPORT AMERICORPS
nationalservice.gov 61
measure. There were no significant differences across the groups in terms of whether alumni stayed in
their community of service, had a job related to their service organization, or in terms of how they listed
AmeriCorps on their resume. There were some differences among cohorts on the remainder of the
measures. However, there were no strong patterns where particular programs or service years were
associated with numerous outcomes, nor were any of the measures strongly related to several cohorts.
Two of the alumni cohorts differed in their perceptions of how AmeriCorps had affected their career
pathways. Both the ASN five-year alumni and VISTA five-year alumni cohorts had higher scores on the
career pathways scale which measures the degree to which AmeriCorps was a worthwhile and defining
experience. However, these cohorts differed in whether they thought their AmeriCorps service aligned
with their careers. ASN five-year alumni were more likely to report that AmeriCorps aligned with their
career pathway, while VISTA five-year alumni were less likely to report that their AmeriCorps
experience aligned with their career pathway.
Although there was no association between alumni’s service program and year cohorts and career
pathways in the six months after service, there were a few significant differences in their current career
pathways. NCCC alumni two and five years post-service were more likely to currently be engaged in a
service experience; NCCC two-year alumni were also more likely to be continuing their education; and
ASN 10-year alumni were more likely to be unemployed.
Cohorts differed some in terms of education award usage. ASN two-year alumni were less likely to have
used their education award to pay for school, more likely to have used their award to repay student
loans, and more likely not to have used their education award. ASN 10-year alumni also were more likely
not to have used their education award.
In terms of sense of community, only one outcome measure showed a significant relationship with a
service program. All three NCCC cohorts had greater trust in corporations. Alumni did not differ
significantly across service program cohorts on the sense of community scale, or trust in neighbors,
media, and schools.
Community engagement outcomes did vary significantly by service program. NCCC alumni cohorts
differed from other alumni on two measures and a VISTA alumni cohort on another measure. NCCC
alumni two years post-service reported higher twelve-month civic engagement scores, while NCCC five-
year and 10-year alumni scored lower on discussing and thinking about community issues. VISTA two-
year alumni were less likely to boycott a service or product.
Program Experience Differences
To measure the effect of program experience on outcomes, the survey also asked alumni about several
aspects of their service experience: how many terms they had served, in which programs they served,
was their final service term full-time, had they completed it, and had they used their education award.
Alumni also responded to questions about their satisfaction with the AmeriCorps experience. In addition,
the analysis included a positive service experience scale and a negative service experience scale derived
from alumni’s answers to questions asking them to rate several aspect of their service experience.
There were many significant relationships between service experience measures and outcomes. The most
consistent relationship was between greater positive service experiences and higher levels of outcome
measures. Interestingly, a negative service experience was not significantly associated with any of the
outcome measures. Other measures of service experience were significantly related to a few outcomes;
however, there were no consistent patterns. Most outcomes were associated with only one or two
AMERICORPS ALUMNI OUTCOMES SUMMARY REPORT AMERICORPS
nationalservice.gov 62
program experience measures.
Career-oriented soft skills were strongly related to having a positive service experience. Alumni that
reported having more positive service experiences had significantly higher levels of each of the career-
oriented soft skills, including cultural competency, post-AmeriCorps self-efficacy, and career-specific
skills both for managing self and for interacting with others. A positive service experience also increased
alumni’s likelihood of attributing the gains in their career-specific skills to AmeriCorps. Additionally,
alumni who had greater satisfaction with their service experience were also more likely to attribute their
gains in career-specific skills to AmeriCorps. No other measures of service experience had a significant
relationship to career-oriented soft skills measures.
Two aspects of service experience affected scores on the career pathways scale that measured the degree
to which AmeriCorps was a worthwhile and defining experience. A positive service experience and
greater overall satisfaction with AmeriCorps were significantly related to higher career pathways scale
scores.
There was no consistent pattern between alumni’s service experiences and careers six months after
service or currently. Three measures of service experience were related to alumni’s careers six months
after service. Alumni who served multiple terms and who served in multiple programs with different
programs were more likely to be engaged in a service experience six months after AmeriCorps.
Additionally, those alumni who were full-time volunteers during their last term of service were more
likely to be working in the public sector in the six months after AmeriCorps. Similar to alumni’s careers
six months after service, alumni who served multiple terms were more likely to be currently working in
the public sector.
A positive service experience and serving multiple terms of service was significantly associated with
having a job six months after AmeriCorps that involved the organizations and programs alumni worked
with during AmeriCorps. Currently having a job with an organization associated with the alumni’s
service was significantly related to having completed the last term of service and completing multiple
terms of service.
A positive service experience score and being a full-time volunteer during their last term was associated
with a greater frequency of alumni listing AmeriCorps on their resume. Overall satisfaction was also
associated with an increased likelihood of reporting that AmeriCorps aligned with one’s career goals.
In terms of the education award, those with a positive service experience were more likely to have used
their education award and to have used the award to pay for school. Those who completed the last term
of service were also more likely to have used their education award.15
The most consistent predictor of alumni’s sense of community outcomes was having a positive service
experience. A more positive service experience was significantly related to increased sense of community
post-AmeriCorps, trust in neighbors, trust in corporations, and trust in the media, but not trust in public
schools. Four other service measures had a relationship to a single sense of community outcome. Alumni
who had completed their last term of service reported greater trust in public schools and alumni who
were full-time members during their last term of service or had served in multiple AmeriCorps programs
had increased trust in corporations. Alumni who used their education award had a higher sense of
15 However, increased overall satisfaction was associated with a decreased likelihood of using the
education award.
AMERICORPS ALUMNI OUTCOMES SUMMARY REPORT AMERICORPS
nationalservice.gov 63
community post-service.
Similar to other outcome areas, the most frequent predictor of civic engagement outcomes was having a
positive service experience. A positive service experience was significantly related to an increase in
alumni saying changes in civic engagement were related to AmeriCorps, increased discussion and
thinking on civic issues, and increased likelihood of boycotting a service or product. A positive service
experience slightly decreased civic self-efficacy. None of the service experience variables were
significantly related to measures examining civic engagement in the 12 months preceding the survey,
promoting civic engagement in others, or voting.
Research Question Three: Influence of Life Stage on Outcomes. Research Question 3 asks “In what ways, if any, do member outcomes vary by life stage?” The answer to this
research question focuses on alumni’s personal characteristics obtained from survey questions about
demographics, life stage, and the skills and abilities that alumni brought to their AmeriCorps service.
In general, demographics, life stage, and pre-service skills had little effect on most alumni outcomes.
Demographics had little effect on career-oriented soft skills, sense of community, and civic engagement.
However, alumni who currently had less than a four-year degree had differing career pathways from
alumni with other education outcomes. Life stage did affect one measure of career-oriented soft skills,
self-efficacy. In addition, life stage had several significant relationships with alumni’s current and six
months post-service career pathways, but not with other measures of career pathways. Alumni’s post-
service sense of community and civic engagement was largely independent of alumni’s life stage. As
expected, alumni’s pre-service skills were significantly associated with their corresponding post-service
levels. For example, pre-service cultural competency predicted post-service cultural competency. Career
pathway outcomes were independent of pre-service skills. Higher pre-service sense of community
predicted higher civic engagement, and higher pre-service cultural competency and self-efficacy
predicted higher career-specific skills such as self-management or interacting with others.
Alumni Demographics
The analysis for the effect of demographics on alumni outcomes examined three characteristics: gender,
race and ethnicity, and highest education level currently completed. For three of the outcome areas,
alumni outcomes were by and large independent of alumni’s demographics. There were no significant
relationships between demographics and career-oriented soft skills, one significant relationship with civic
engagement and one significant relationship with sense of community. Whites had a higher trust in
community members than non-whites, and those with less than a four-year degree were more likely to
encourage civic engagement among others. Race and gender similarly had little effect on career pathway
outcomes, having one significant relationship each across all the measures. Whites were more likely than
non-whites to list AmeriCorps only as a volunteer experience on their resumes.
One demographic factor was significantly related to several career pathway outcomes. Those alumni who
had less than a four-year degree at the time of the survey were more likely to be currently unemployed
and less likely to be currently working at a public service job. They were also less likely to be serving in a
position at or directly connected to the agency that sponsored the AmeriCorps program in which they
served.
Alumni currently without a four-year degree were more likely to be engaged in continuing education six
months after AmeriCorps and currently. Furthermore, these alumni were more likely have used their
education award to pay for school, and less likely to have used it to repay loans.
AMERICORPS ALUMNI OUTCOMES SUMMARY REPORT AMERICORPS
nationalservice.gov 64
Life stage
The examination of the effect of life stage on alumni outcomes focused on alumni’s age at the time of the
survey, whether they had been a caregiver or parent before AmeriCorps or at the time of the survey, and
their work and educational experience prior to AmeriCorps, including whether prior to service they had
been in school, unemployed, working in the private, government, or nonprofit sector, and whether they
were engaged in a service experience or the military.
Becoming a parent or caregiver after service was not associated with any of the outcome areas; however,
the other life stage variables did have significant relationships with some alumni outcomes. The civic
engagement and sense of community outcomes were mostly independent of alumni’s life stage, with only
one modest but significant relationship between life stage and any of the measures for these outcome
areas. Those engaged in service or in the military prior to service had higher scores on the community
engagement scale post-service, and older alumni had greater trust in the media.
Alumni’s life stage did have an effect on one area of career-oriented soft skills, self-efficacy, but it had no
effect on alumni’s post-service cultural competency, or their career-specific skills in self-management or
interacting with others. Alumni who were unemployed or working in the public sector, at a nonprofit
prior to service reported higher post-service self-efficacy. Conversely, there was a decline in alumni’s
ratings of their self-efficacy as their age increased.
In terms of career pathways, there were no significant relationships between life stage and whether or not
an alumni’s service aligned with their career pathways, how they used their education award, or the
career pathways scale. The single life stage related to increased likelihood of staying in the community
post-service was alumni who were engaged in service prior to their AmeriCorps service.
There were some significant relationships between prior experience and alumni’s career pathways six
months after service. Alumni who had been unemployed prior to service were more likely to be
unemployed in the six months post-service. Similarly, alumni employed in the private sector prior to
service were more likely to be employed in the private sector post-service. Alumni who, prior to their
AmeriCorps service, were engaged in service or the military were more likely to be continuing their
education six months post-service.
Life stage had some effect on alumni’s current career pathways. The most consistent effect of life stage
was in terms of whether or not alumni engaged in service at the time of the survey. Alumni who were
older, in school before AmeriCorps, and parents or caregivers at the time of service were all more likely
to be currently engaged in service.
Pre-service Skill Levels
In addition to their demographics and life stage, entering AmeriCorps members also differed in the skills
and experiences they brought with them when they started service. The survey asked alumni to rate their
pre-service cultural competency, self-efficacy, and sense of community. The influence of pre-service skills
varied by outcome area. In general, pre-service skills related to an outcome area did help predict post-
service skills in the same outcome area. However, the influence of pre-service skills on other outcomes
was mixed. AmeriCorps alumni’s career pathways were independent of all of the pre-service skills
ratings. However, there were a few significant relationships between pre-service skills and the other
outcome areas.
Alumni with a higher pre-service sense of community had higher levels of post-service sense of
community. In addition, a higher sense of community pre-service was also significantly related to higher
civic engagement outcomes. Higher pre-service sense of community predicted higher civic self-efficacy
AMERICORPS ALUMNI OUTCOMES SUMMARY REPORT AMERICORPS
nationalservice.gov 65
and higher political and community engagement. There was no significant relationship between pre-
service sense of community and career-oriented soft skills.
Pre-service self-efficacy and cultural competency affected outcomes in the areas of career-oriented soft-
skills, but not the other outcome areas. As expected, greater pre-service cultural competency predicted
higher post-service cultural competency, and greater pre-service self-efficacy predicted greater post-
service self-efficacy. At the same time, both skills ratings had significantly positive relationships with
career-specific skills. Alumni with greater self-efficacy pre-service were more likely to have higher ratings
for post-service career-specific skills in both the areas of interacting with others and managing oneself.
Pre-service cultural competency was related to higher scores in managing oneself.
AMERICORPS ALUMNI OUTCOMES SUMMARY REPORT AMERICORPS
nationalservice.gov 66
Chapter 6: Conclusions and Recommendations Overall, respondents indicated that there were substantial benefits to participation in AmeriCorps
programs, including AmeriCorps State and National, NCCC, and AmeriCorps VISTA. Across all alumni,
a vast majority stated that they felt they made a contribution to the community (92 percent), gained an
understanding of the community they served (93 percent), and were exposed to new ideas and ways of
seeing the world (87 percent). Due to participation in AmeriCorps, a majority of respondents stated that
they were more likely to volunteer and to participate in community organizations. In terms of the impact
of service on alumni careers, respondents reported that participation in AmeriCorps helped them figure
out the next steps of their career, and increased their ability to work with others and to respond to
unexpected challenges. In open-ended responses, AmeriCorps participants stated that their experience
helped them to define their values, made them more likely to pursue a career in service, and had a
positive impact on their life even after their term ended.
Positive outcomes, on the whole, were largely consistent across AmeriCorps participants and
independent of their service programs, focus areas, or personal characteristics. Though there were
occasional relationships between individual programs or focus areas and specific outcome measures,
there were no patterns among these relationships. Similarly, demographics, life stage, and skills levels
before AmeriCorps rarely had significant relationships with alumni outcomes. The exception was that
alumni who had yet to complete a four-year degree had different career pathways.
The key consistent driver of successful outcomes in developing career-oriented soft skills, having a career
pathway that led to work in the government or nonprofit sector, and increasing alumni’s sense of
community and civic engagement after AmeriCorps was a positive service experience. There were also
some differences in outcomes related to other service experience factors, but no strong patterns.
Survey and Survey Administration Overall, the survey instrument demonstrated sufficient reliability and variability to be useful.
Assessments of the internal reliability of each scale were performed by calculating Cronbach’s alpha; all
scales had high reliability estimates with an average alpha of .85. Principal components factor analysis
was also performed for each scale, and it was determined that the majority of scales consisted of a single
factor, while three scales had a two factor structure. All items had sufficient variability to be used in the
analysis.
Despite challenges in achieving sufficient responses, survey administration was ultimately successful in
yielding a sample size with sufficient power to detect significant differences. The use of sorted lists
ensured that initially low response rates could be supplemented by additional outreach without having
to complicate sampling probabilities by taking multiple samples. Each of the successive email reminders
resulted in an uptick in response. Additional survey modality and reminder methods generally did not
differentially affect responses. Mail and phone follow-ups did not yield substantial increases in response
rates; phone follow-ups were particularly unsuccessful in increasing response rates. There was a high
degree of partial completion, with a number of respondents dropping out at several distinct points in the
survey.
Recommendations and Next Steps Future attempts to use this instrument to survey AmeriCorps alumni may benefit from the following
practices:
Retain the strategy of using randomly sorted lists to prevent the need for resampling
Forgo mail and phone follow-ups to minimize costs, as these do not significantly increase
AMERICORPS ALUMNI OUTCOMES SUMMARY REPORT AMERICORPS
nationalservice.gov 67
response rates
Condense the current survey in order to decrease the likelihood that participants will drop off
Additional forms of analysis may yield more insight into the impact of participant characteristics on
outcomes. By modeling interaction effects between the pre-test score and other selected characteristics,
researchers could examine whether the relationship in pre-test and post-test is different according to
these characteristics.
The association between satisfaction and positive service experience with successful later outcomes
provides support for the usefulness of measures of satisfaction and service experience quality in post-
service surveys. Support for an association between satisfaction immediately following service and later
satisfaction and positive outcomes would be strengthened by a longitudinal study that followed a cohort
of AmeriCorps members. This could be accomplished through the use of unique stable identifiers that are
maintained over time, allowing for surveys from multiple time points and modalities to be connected
without compromising confidentiality.
Support for survey findings may be substantially strengthened by an impact evaluation using a
benchmarking or comparison group. Ideally, a comparison group would consist of alumni of other non-
CNCS sponsored programs that match AmeriCorps alumni on key characteristics. A longitudinal study
using a comparison group may provide particularly strong evidence and insight into the mechanisms by
which AmeriCorps experiences lead to better outcomes, though such a study may be logistically
challenging and/or prohibitively expensive. Future studies may build on the findings of this study and
adopt subsets of the current survey with targeted groups to examine how AmeriCorps service may be
linked with career and civic outcomes among populations of interest, such as formerly incarcerated
youth, veterans, or women and men re-entering the workforce after long periods of unemployment.
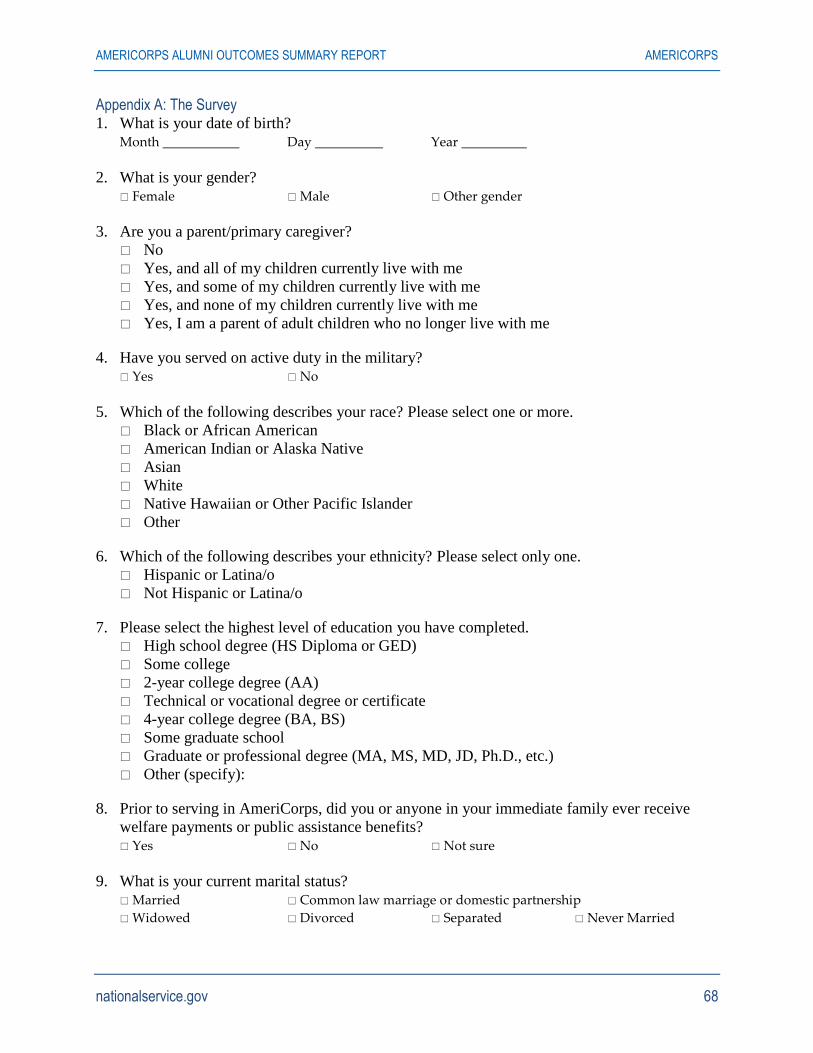
AMERICORPS ALUMNI OUTCOMES SUMMARY REPORT AMERICORPS
nationalservice.gov 68
Appendix A: The Survey 1. What is your date of birth?
Month Day Year
2. What is your gender? Female Male Other gender
3. Are you a parent/primary caregiver?
No
Yes, and all of my children currently live with me
Yes, and some of my children currently live with me
Yes, and none of my children currently live with me
Yes, I am a parent of adult children who no longer live with me
4. Have you served on active duty in the military? Yes No
5. Which of the following describes your race? Please select one or more.
Black or African American
American Indian or Alaska Native
Asian
White
Native Hawaiian or Other Pacific Islander
Other
6. Which of the following describes your ethnicity? Please select only one.
Hispanic or Latina/o
Not Hispanic or Latina/o
7. Please select the highest level of education you have completed.
High school degree (HS Diploma or GED)
Some college
2-year college degree (AA)
Technical or vocational degree or certificate
4-year college degree (BA, BS)
Some graduate school
Graduate or professional degree (MA, MS, MD, JD, Ph.D., etc.)
Other (specify):
8. Prior to serving in AmeriCorps, did you or anyone in your immediate family ever receive
welfare payments or public assistance benefits? Yes No Not sure
9. What is your current marital status? Married Common law marriage or domestic partnership
Widowed Divorced Separated Never Married
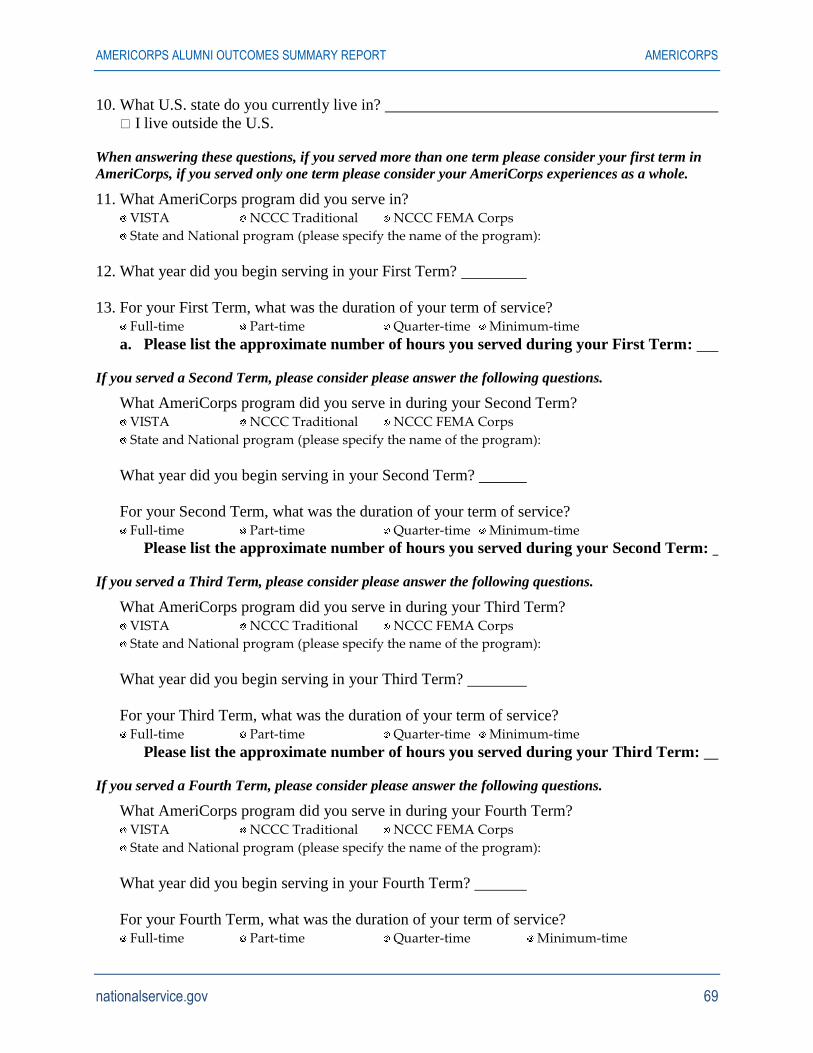
AMERICORPS ALUMNI OUTCOMES SUMMARY REPORT AMERICORPS
nationalservice.gov 69
10. What U.S. state do you currently live in?
I live outside the U.S.
When answering these questions, if you served more than one term please consider your first term in
AmeriCorps, if you served only one term please consider your AmeriCorps experiences as a whole.
11. What AmeriCorps program did you serve in? VISTA NCCC Traditional NCCC FEMA Corps
State and National program (please specify the name of the program):
12. What year did you begin serving in your First Term?
13. For your First Term, what was the duration of your term of service? Full-time Part-time Quarter-time Minimum-time
a. Please list the approximate number of hours you served during your First Term:
If you served a Second Term, please consider please answer the following questions.
What AmeriCorps program did you serve in during your Second Term? VISTA NCCC Traditional NCCC FEMA Corps
State and National program (please specify the name of the program):
What year did you begin serving in your Second Term?
For your Second Term, what was the duration of your term of service? Full-time Part-time Quarter-time Minimum-time
Please list the approximate number of hours you served during your Second Term:
If you served a Third Term, please consider please answer the following questions.
What AmeriCorps program did you serve in during your Third Term? VISTA NCCC Traditional NCCC FEMA Corps
State and National program (please specify the name of the program):
What year did you begin serving in your Third Term?
For your Third Term, what was the duration of your term of service? Full-time Part-time Quarter-time Minimum-time
Please list the approximate number of hours you served during your Third Term:
If you served a Fourth Term, please consider please answer the following questions.
What AmeriCorps program did you serve in during your Fourth Term? VISTA NCCC Traditional NCCC FEMA Corps
State and National program (please specify the name of the program):
What year did you begin serving in your Fourth Term?
For your Fourth Term, what was the duration of your term of service? Full-time Part-time Quarter-time Minimum-time
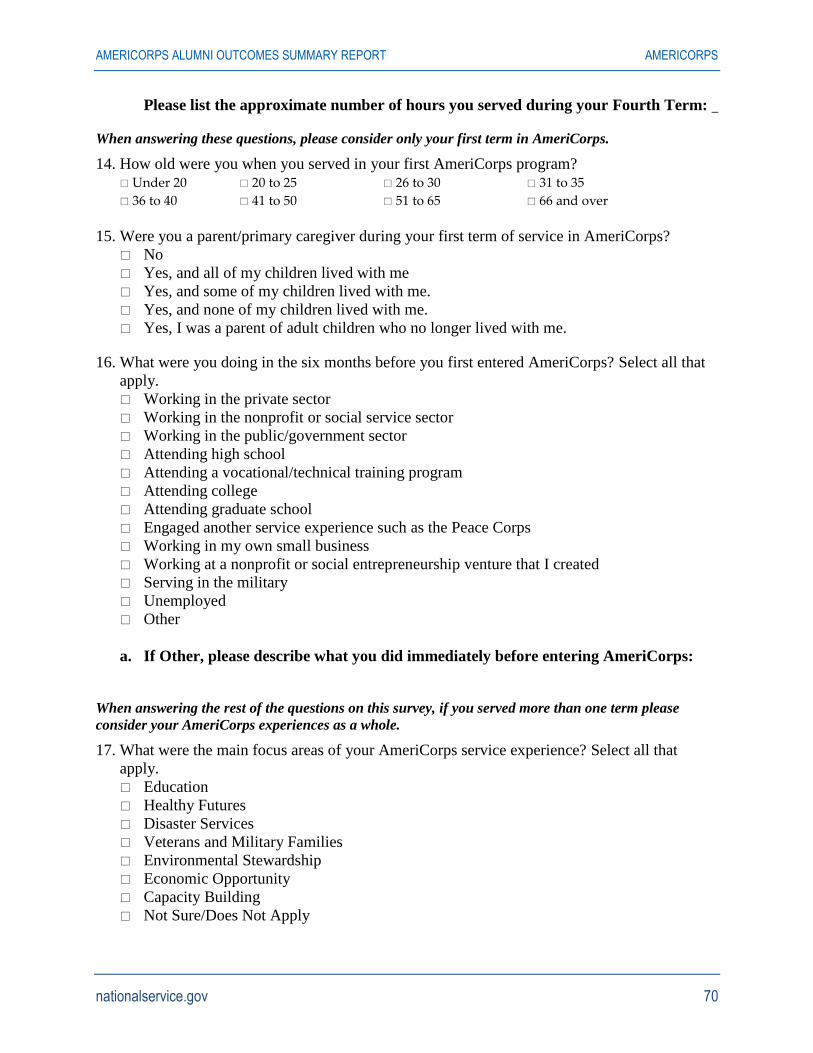
AMERICORPS ALUMNI OUTCOMES SUMMARY REPORT AMERICORPS
nationalservice.gov 70
Please list the approximate number of hours you served during your Fourth Term:
When answering these questions, please consider only your first term in AmeriCorps.
14. How old were you when you served in your first AmeriCorps program? Under 20 20 to 25 26 to 30 31 to 35
36 to 40 41 to 50 51 to 65 66 and over
15. Were you a parent/primary caregiver during your first term of service in AmeriCorps?
No
Yes, and all of my children lived with me
Yes, and some of my children lived with me.
Yes, and none of my children lived with me.
Yes, I was a parent of adult children who no longer lived with me.
16. What were you doing in the six months before you first entered AmeriCorps? Select all that
apply.
Working in the private sector
Working in the nonprofit or social service sector
Working in the public/government sector
Attending high school
Attending a vocational/technical training program
Attending college
Attending graduate school
Engaged another service experience such as the Peace Corps
Working in my own small business
Working at a nonprofit or social entrepreneurship venture that I created
Serving in the military
Unemployed
Other
a. If Other, please describe what you did immediately before entering AmeriCorps:
When answering the rest of the questions on this survey, if you served more than one term please
consider your AmeriCorps experiences as a whole.
17. What were the main focus areas of your AmeriCorps service experience? Select all that
apply.
Education
Healthy Futures
Disaster Services
Veterans and Military Families
Environmental Stewardship
Economic Opportunity
Capacity Building
Not Sure/Does Not Apply
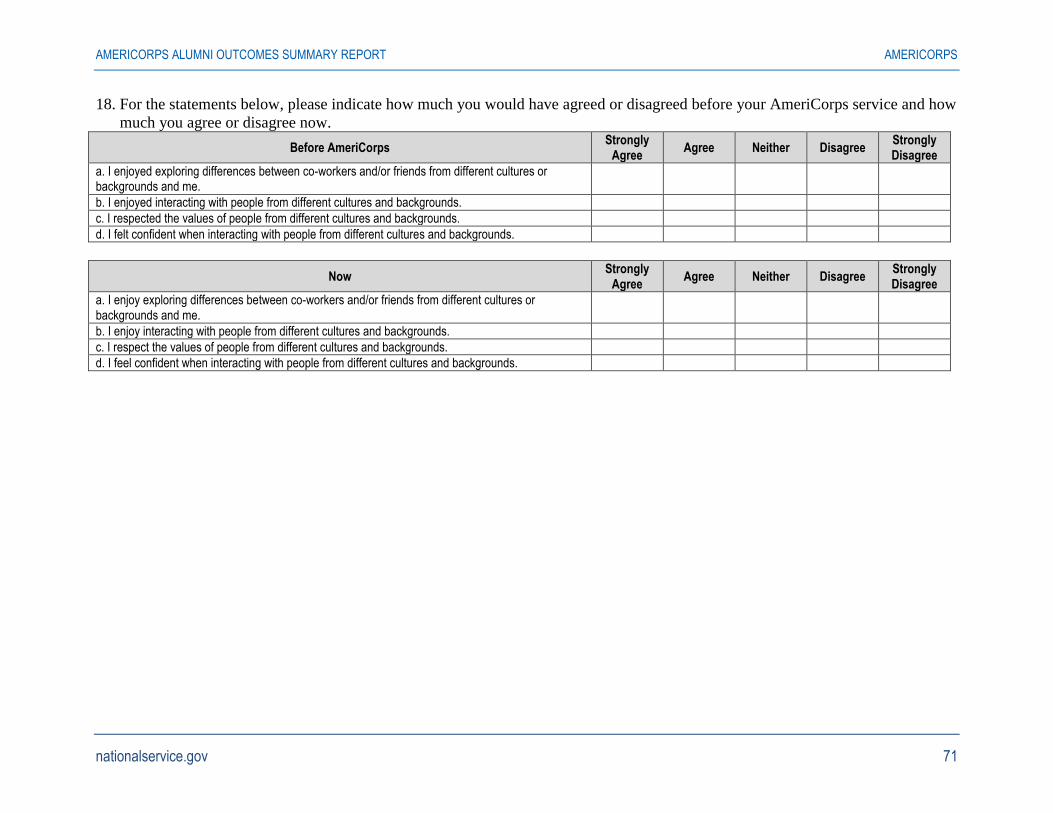
AMERICORPS ALUMNI OUTCOMES SUMMARY REPORT AMERICORPS
nationalservice.gov 71
18. For the statements below, please indicate how much you would have agreed or disagreed before your AmeriCorps service and how
much you agree or disagree now.
Before AmeriCorps Strongly
Agree Agree Neither Disagree
Strongly Disagree
a. I enjoyed exploring differences between co-workers and/or friends from different cultures or backgrounds and me.
b. I enjoyed interacting with people from different cultures and backgrounds.
c. I respected the values of people from different cultures and backgrounds.
d. I felt confident when interacting with people from different cultures and backgrounds.
Now Strongly
Agree Agree Neither Disagree
Strongly Disagree
a. I enjoy exploring differences between co-workers and/or friends from different cultures or backgrounds and me.
b. I enjoy interacting with people from different cultures and backgrounds.
c. I respect the values of people from different cultures and backgrounds.
d. I feel confident when interacting with people from different cultures and backgrounds.
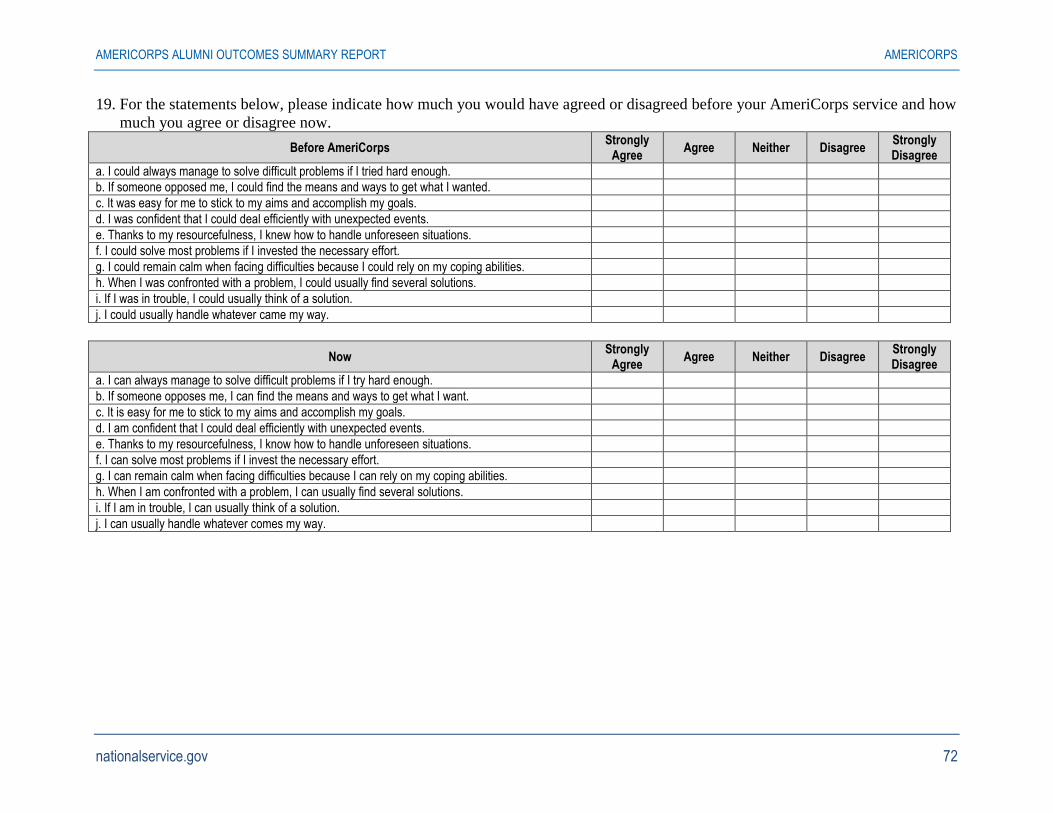
AMERICORPS ALUMNI OUTCOMES SUMMARY REPORT AMERICORPS
nationalservice.gov 72
19. For the statements below, please indicate how much you would have agreed or disagreed before your AmeriCorps service and how
much you agree or disagree now.
Before AmeriCorps Strongly
Agree Agree Neither Disagree
Strongly Disagree
a. I could always manage to solve difficult problems if I tried hard enough.
b. If someone opposed me, I could find the means and ways to get what I wanted.
c. It was easy for me to stick to my aims and accomplish my goals.
d. I was confident that I could deal efficiently with unexpected events.
e. Thanks to my resourcefulness, I knew how to handle unforeseen situations.
f. I could solve most problems if I invested the necessary effort.
g. I could remain calm when facing difficulties because I could rely on my coping abilities.
h. When I was confronted with a problem, I could usually find several solutions.
i. If I was in trouble, I could usually think of a solution.
j. I could usually handle whatever came my way.
Now Strongly
Agree Agree Neither Disagree
Strongly Disagree
a. I can always manage to solve difficult problems if I try hard enough.
b. If someone opposes me, I can find the means and ways to get what I want.
c. It is easy for me to stick to my aims and accomplish my goals.
d. I am confident that I could deal efficiently with unexpected events.
e. Thanks to my resourcefulness, I know how to handle unforeseen situations.
f. I can solve most problems if I invest the necessary effort.
g. I can remain calm when facing difficulties because I can rely on my coping abilities.
h. When I am confronted with a problem, I can usually find several solutions.
i. If I am in trouble, I can usually think of a solution.
j. I can usually handle whatever comes my way.
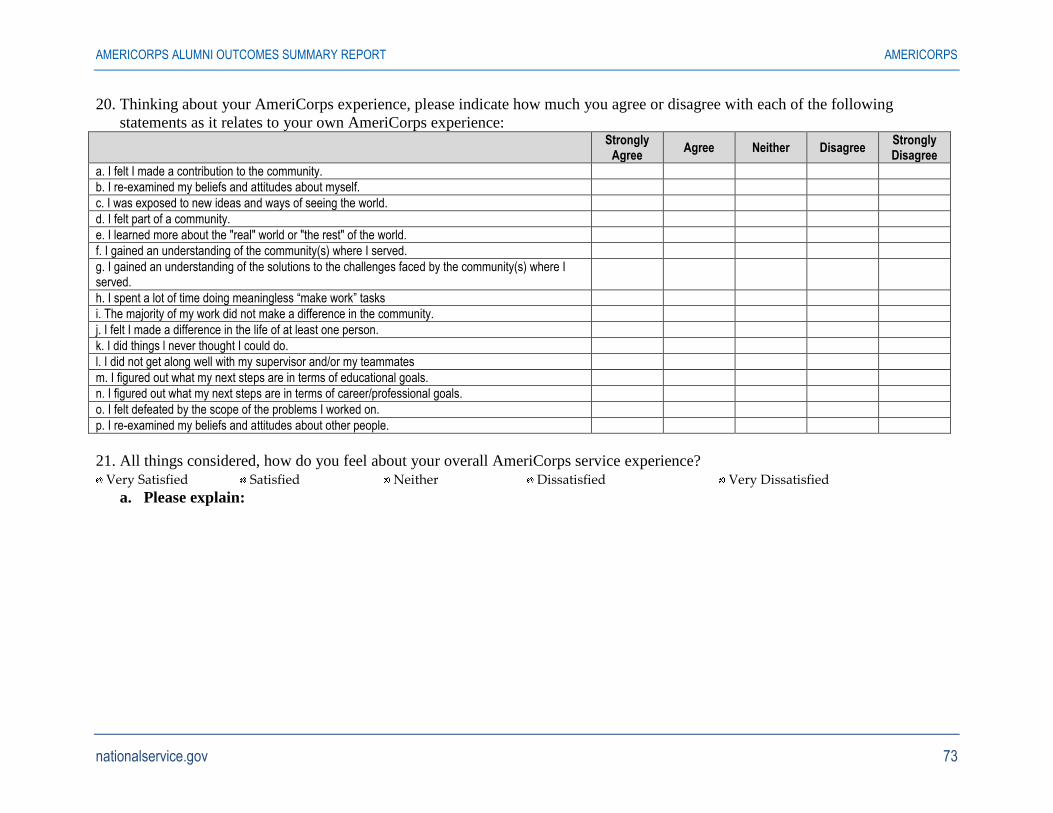
AMERICORPS ALUMNI OUTCOMES SUMMARY REPORT AMERICORPS
nationalservice.gov 73
20. Thinking about your AmeriCorps experience, please indicate how much you agree or disagree with each of the following
statements as it relates to your own AmeriCorps experience:
Strongly
Agree Agree Neither Disagree
Strongly Disagree
a. I felt I made a contribution to the community.
b. I re-examined my beliefs and attitudes about myself.
c. I was exposed to new ideas and ways of seeing the world.
d. I felt part of a community.
e. I learned more about the "real" world or "the rest" of the world.
f. I gained an understanding of the community(s) where I served.
g. I gained an understanding of the solutions to the challenges faced by the community(s) where I served.
h. I spent a lot of time doing meaningless “make work” tasks
i. The majority of my work did not make a difference in the community.
j. I felt I made a difference in the life of at least one person.
k. I did things l never thought I could do.
l. I did not get along well with my supervisor and/or my teammates
m. I figured out what my next steps are in terms of educational goals.
n. I figured out what my next steps are in terms of career/professional goals.
o. I felt defeated by the scope of the problems I worked on.
p. I re-examined my beliefs and attitudes about other people.
21. All things considered, how do you feel about your overall AmeriCorps service experience? Very Satisfied Satisfied Neither Dissatisfied Very Dissatisfied
a. Please explain:
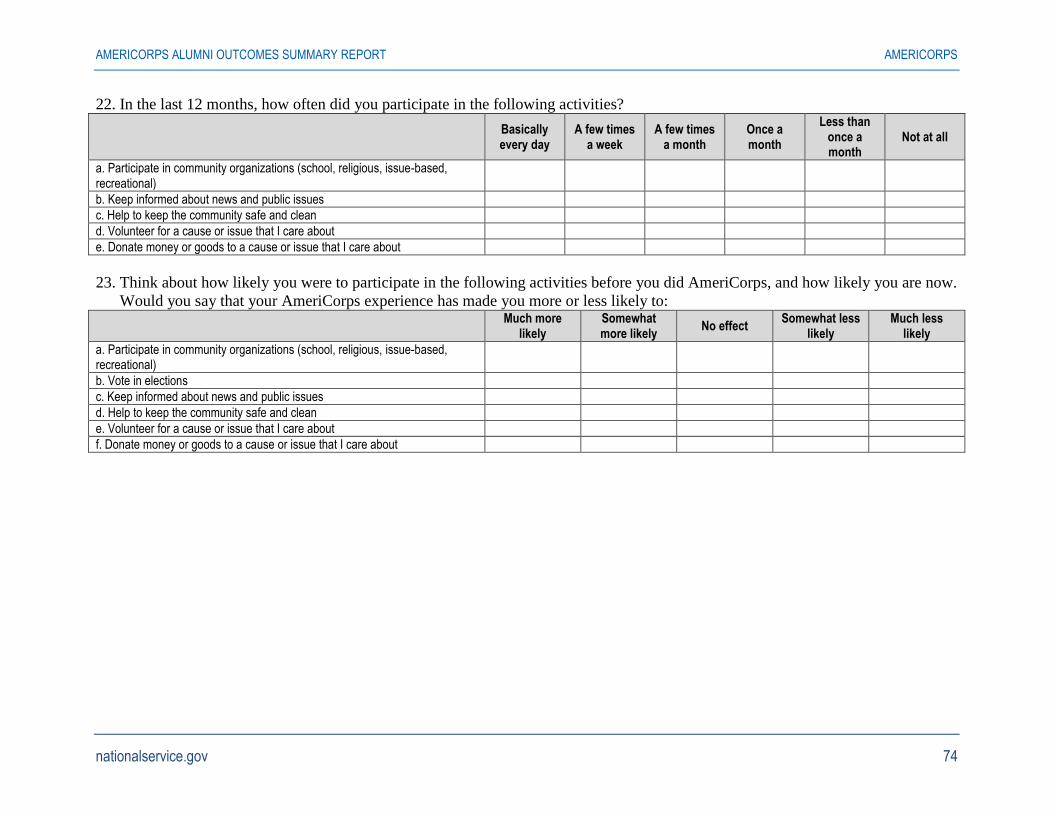
AMERICORPS ALUMNI OUTCOMES SUMMARY REPORT AMERICORPS
nationalservice.gov 74
22. In the last 12 months, how often did you participate in the following activities?
Basically every day
A few times a week
A few times a month
Once a month
Less than once a month
Not at all
a. Participate in community organizations (school, religious, issue-based, recreational)
b. Keep informed about news and public issues
c. Help to keep the community safe and clean
d. Volunteer for a cause or issue that I care about
e. Donate money or goods to a cause or issue that I care about
23. Think about how likely you were to participate in the following activities before you did AmeriCorps, and how likely you are now.
Would you say that your AmeriCorps experience has made you more or less likely to:
Much more
likely Somewhat more likely
No effect Somewhat less
likely Much less
likely
a. Participate in community organizations (school, religious, issue-based, recreational)
b. Vote in elections
c. Keep informed about news and public issues
d. Help to keep the community safe and clean
e. Volunteer for a cause or issue that I care about
f. Donate money or goods to a cause or issue that I care about
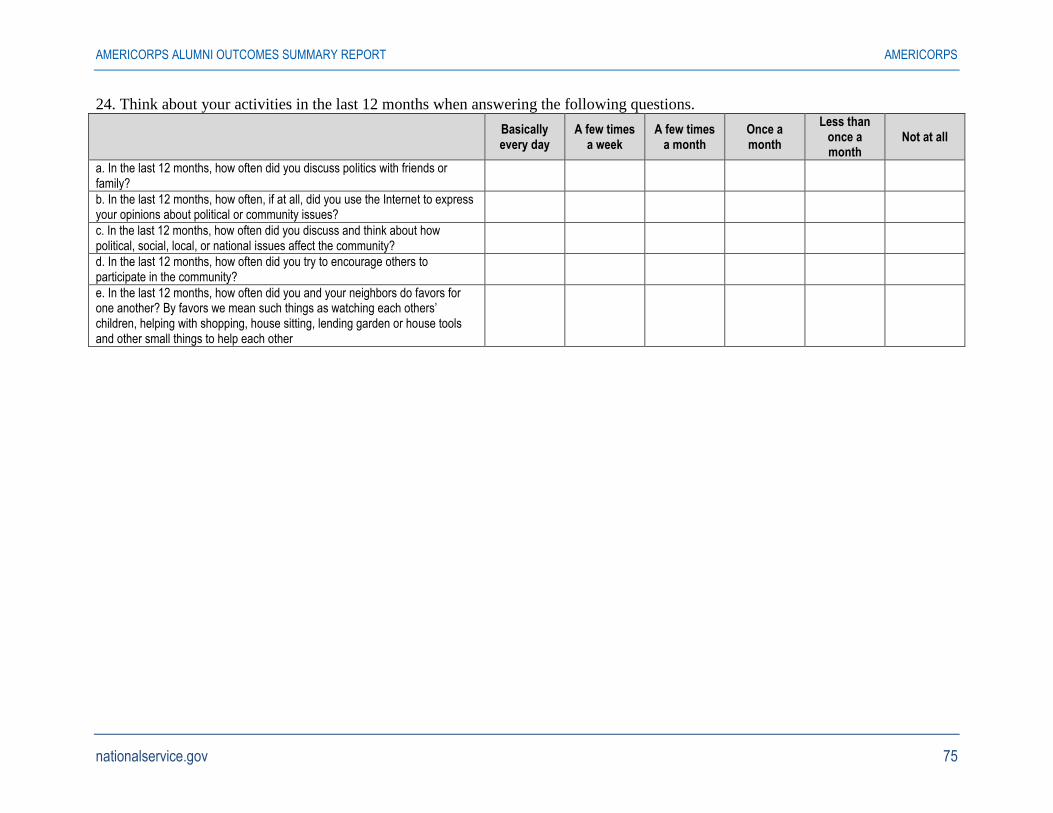
AMERICORPS ALUMNI OUTCOMES SUMMARY REPORT AMERICORPS
nationalservice.gov 75
24. Think about your activities in the last 12 months when answering the following questions.
Basically every day
A few times a week
A few times a month
Once a month
Less than once a month
Not at all
a. In the last 12 months, how often did you discuss politics with friends or family?
b. In the last 12 months, how often, if at all, did you use the Internet to express your opinions about political or community issues?
c. In the last 12 months, how often did you discuss and think about how political, social, local, or national issues affect the community?
d. In the last 12 months, how often did you try to encourage others to participate in the community?
e. In the last 12 months, how often did you and your neighbors do favors for one another? By favors we mean such things as watching each others’ children, helping with shopping, house sitting, lending garden or house tools and other small things to help each other

AMERICORPS ALUMNI OUTCOMES SUMMARY REPORT AMERICORPS
nationalservice.gov 76
25. In the last 12 months, have you boycotted a product or service because of the social or
political values of the company that provides it?
Yes
No
Don't Know
26. Generally speaking, would you say that you can trust all the people, most of the people, some
of the people, or none of the people in your neighborhood?
All of the people
Most of the people
Some of the people
None of the people
27. For each of the following institutions, would you say you have a great deal of confidence,
only some confidence, hardly any confidence, or no confidence at all in them to do what is
right?
A great deal of
confidence Some confidence
Hardly any confidence
No confidence at all
a. Corporations
b. The Media
c. Public schools
28. Were you registered to vote in the last presidential election?
Yes
No
No, was not eligible to vote
Don't Know
29. Did you vote in the last presidential election?
Yes
No
Don't Know
30. How often did you vote in the last 12 months?
I voted in all elections offered in my district.
I voted in some elections offered in my district.
I did not vote in any elections offered in my district.
No elections were offered in my district in the last 12 months.
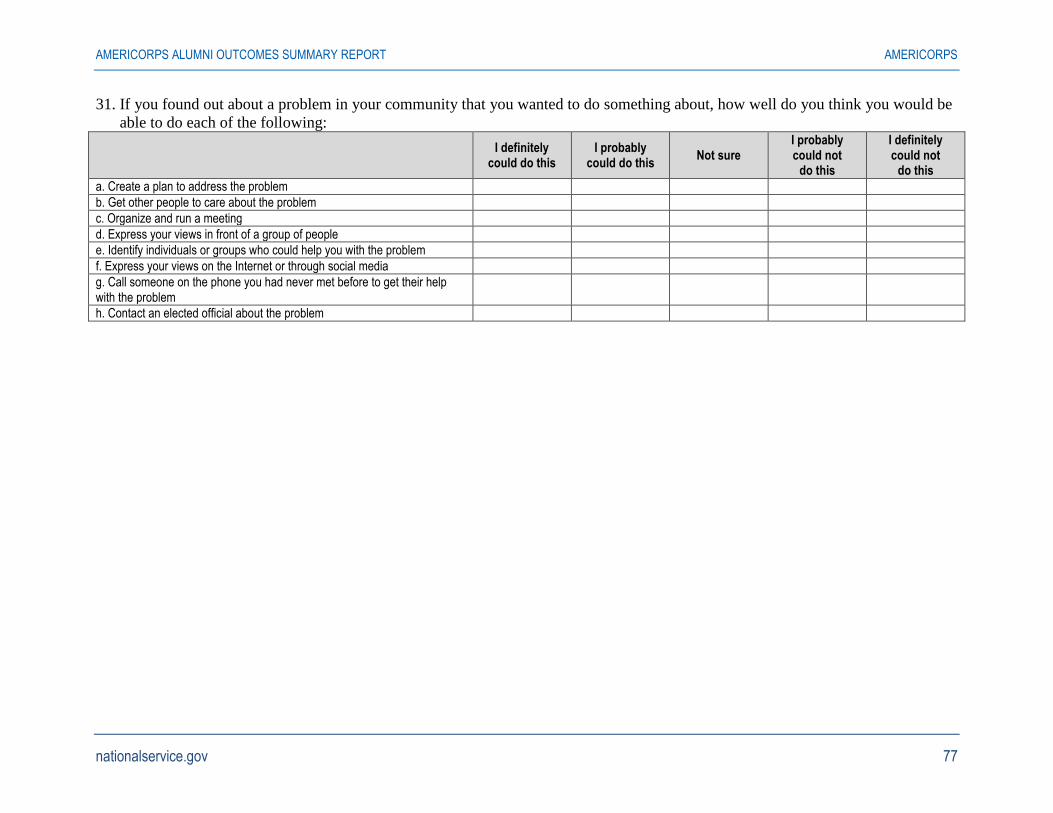
AMERICORPS ALUMNI OUTCOMES SUMMARY REPORT AMERICORPS
nationalservice.gov 77
31. If you found out about a problem in your community that you wanted to do something about, how well do you think you would be
able to do each of the following:
I definitely
could do this I probably
could do this Not sure
I probably could not
do this
I definitely could not
do this
a. Create a plan to address the problem
b. Get other people to care about the problem
c. Organize and run a meeting
d. Express your views in front of a group of people
e. Identify individuals or groups who could help you with the problem
f. Express your views on the Internet or through social media
g. Call someone on the phone you had never met before to get their help with the problem
h. Contact an elected official about the problem
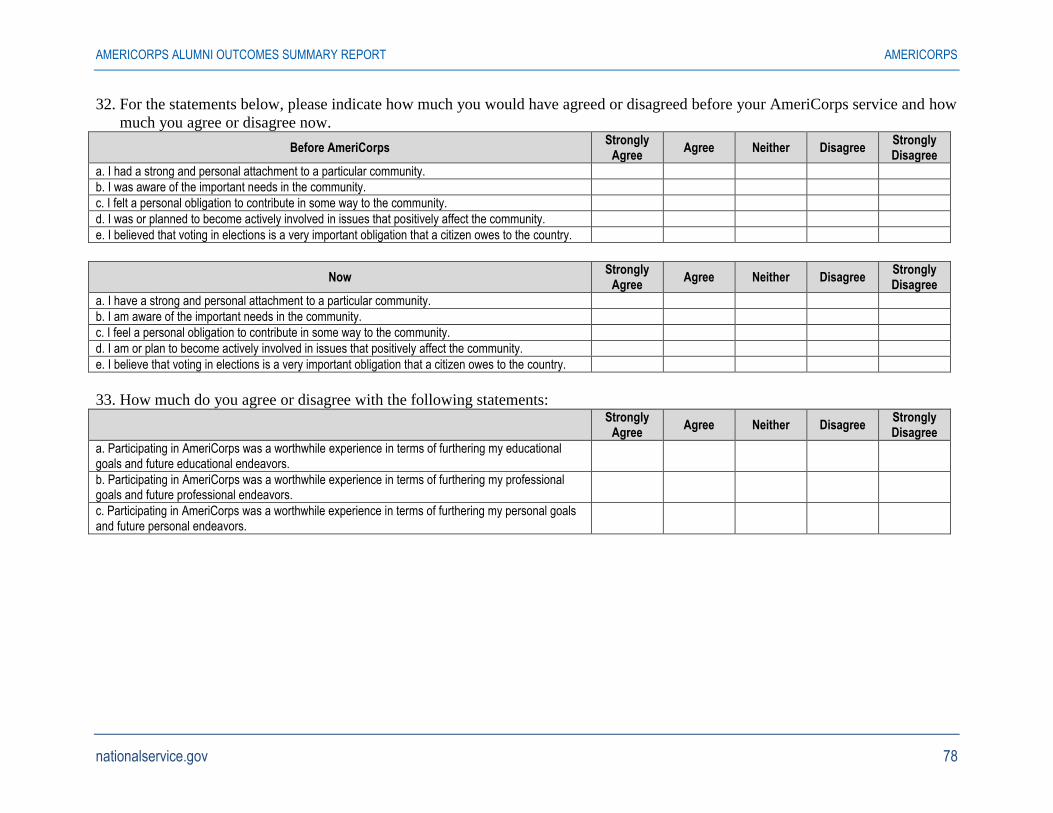
AMERICORPS ALUMNI OUTCOMES SUMMARY REPORT AMERICORPS
nationalservice.gov 78
32. For the statements below, please indicate how much you would have agreed or disagreed before your AmeriCorps service and how
much you agree or disagree now.
Before AmeriCorps Strongly
Agree Agree Neither Disagree
Strongly Disagree
a. I had a strong and personal attachment to a particular community.
b. I was aware of the important needs in the community.
c. I felt a personal obligation to contribute in some way to the community.
d. I was or planned to become actively involved in issues that positively affect the community.
e. I believed that voting in elections is a very important obligation that a citizen owes to the country.
Now Strongly
Agree Agree Neither Disagree
Strongly Disagree
a. I have a strong and personal attachment to a particular community.
b. I am aware of the important needs in the community.
c. I feel a personal obligation to contribute in some way to the community.
d. I am or plan to become actively involved in issues that positively affect the community.
e. I believe that voting in elections is a very important obligation that a citizen owes to the country.
33. How much do you agree or disagree with the following statements:
Strongly
Agree Agree Neither Disagree
Strongly Disagree
a. Participating in AmeriCorps was a worthwhile experience in terms of furthering my educational goals and future educational endeavors.
b. Participating in AmeriCorps was a worthwhile experience in terms of furthering my professional goals and future professional endeavors.
c. Participating in AmeriCorps was a worthwhile experience in terms of furthering my personal goals and future personal endeavors.
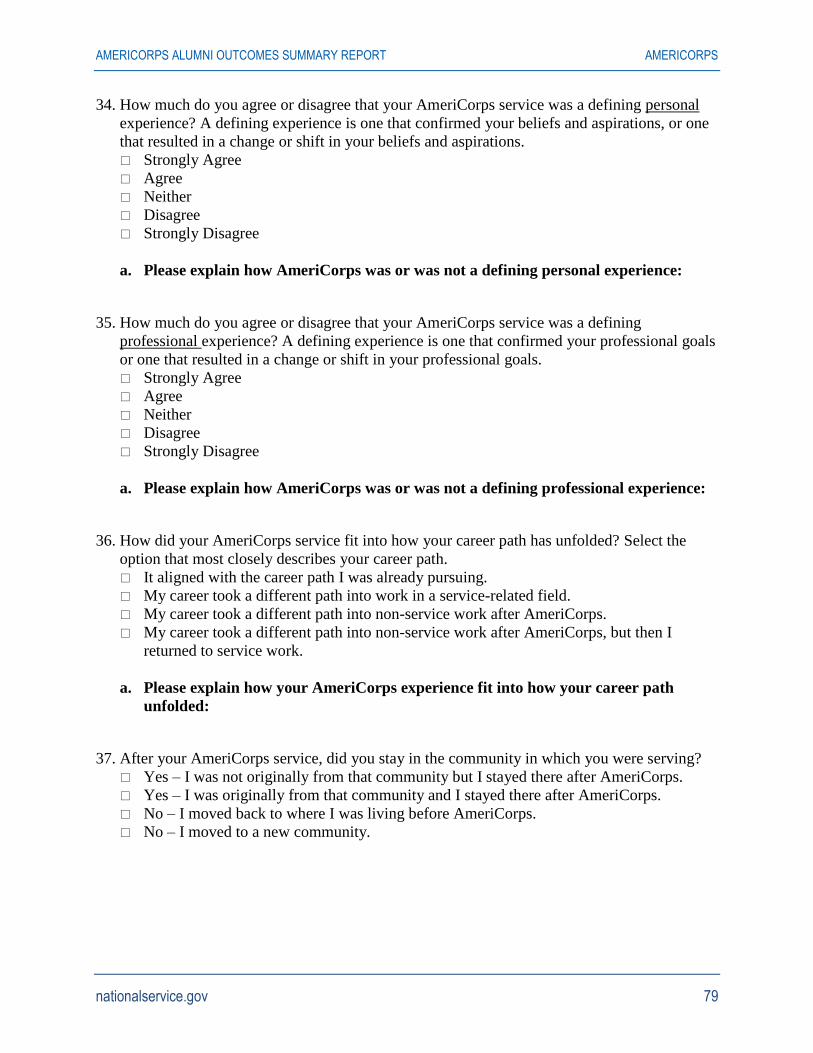
AMERICORPS ALUMNI OUTCOMES SUMMARY REPORT AMERICORPS
nationalservice.gov 79
34. How much do you agree or disagree that your AmeriCorps service was a defining personal
experience? A defining experience is one that confirmed your beliefs and aspirations, or one
that resulted in a change or shift in your beliefs and aspirations.
Strongly Agree
Agree
Neither
Disagree
Strongly Disagree
a. Please explain how AmeriCorps was or was not a defining personal experience:
35. How much do you agree or disagree that your AmeriCorps service was a defining
professional experience? A defining experience is one that confirmed your professional goals
or one that resulted in a change or shift in your professional goals.
Strongly Agree
Agree
Neither
Disagree
Strongly Disagree
a. Please explain how AmeriCorps was or was not a defining professional experience:
36. How did your AmeriCorps service fit into how your career path has unfolded? Select the
option that most closely describes your career path.
It aligned with the career path I was already pursuing.
My career took a different path into work in a service-related field.
My career took a different path into non-service work after AmeriCorps.
My career took a different path into non-service work after AmeriCorps, but then I
returned to service work.
a. Please explain how your AmeriCorps experience fit into how your career path
unfolded:
37. After your AmeriCorps service, did you stay in the community in which you were serving?
Yes – I was not originally from that community but I stayed there after AmeriCorps.
Yes – I was originally from that community and I stayed there after AmeriCorps.
No – I moved back to where I was living before AmeriCorps.
No – I moved to a new community.
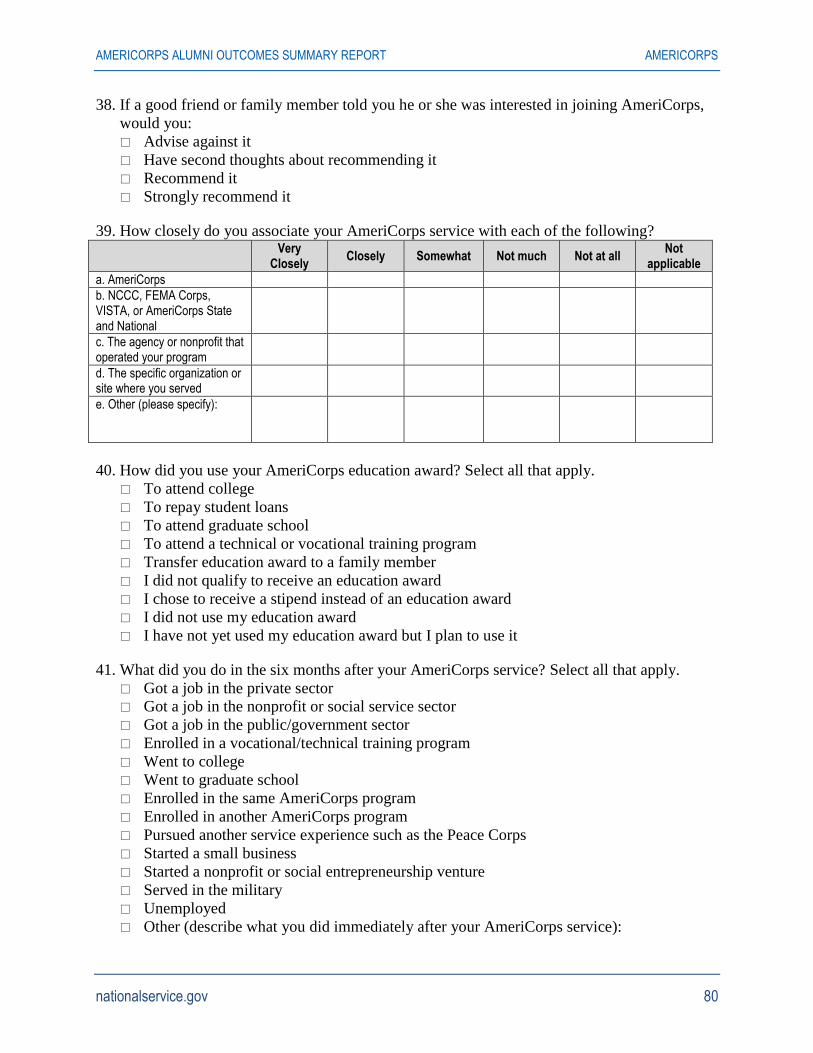
AMERICORPS ALUMNI OUTCOMES SUMMARY REPORT AMERICORPS
nationalservice.gov 80
38. If a good friend or family member told you he or she was interested in joining AmeriCorps,
would you:
Advise against it
Have second thoughts about recommending it
Recommend it
Strongly recommend it
39. How closely do you associate your AmeriCorps service with each of the following?
Very
Closely Closely Somewhat Not much Not at all
Not applicable
a. AmeriCorps
b. NCCC, FEMA Corps, VISTA, or AmeriCorps State and National
c. The agency or nonprofit that operated your program
d. The specific organization or site where you served
e. Other (please specify):
40. How did you use your AmeriCorps education award? Select all that apply.
To attend college
To repay student loans
To attend graduate school
To attend a technical or vocational training program
Transfer education award to a family member
I did not qualify to receive an education award
I chose to receive a stipend instead of an education award
I did not use my education award
I have not yet used my education award but I plan to use it
41. What did you do in the six months after your AmeriCorps service? Select all that apply.
Got a job in the private sector
Got a job in the nonprofit or social service sector
Got a job in the public/government sector
Enrolled in a vocational/technical training program
Went to college
Went to graduate school
Enrolled in the same AmeriCorps program
Enrolled in another AmeriCorps program
Pursued another service experience such as the Peace Corps
Started a small business
Started a nonprofit or social entrepreneurship venture
Served in the military
Unemployed
Other (describe what you did immediately after your AmeriCorps service):
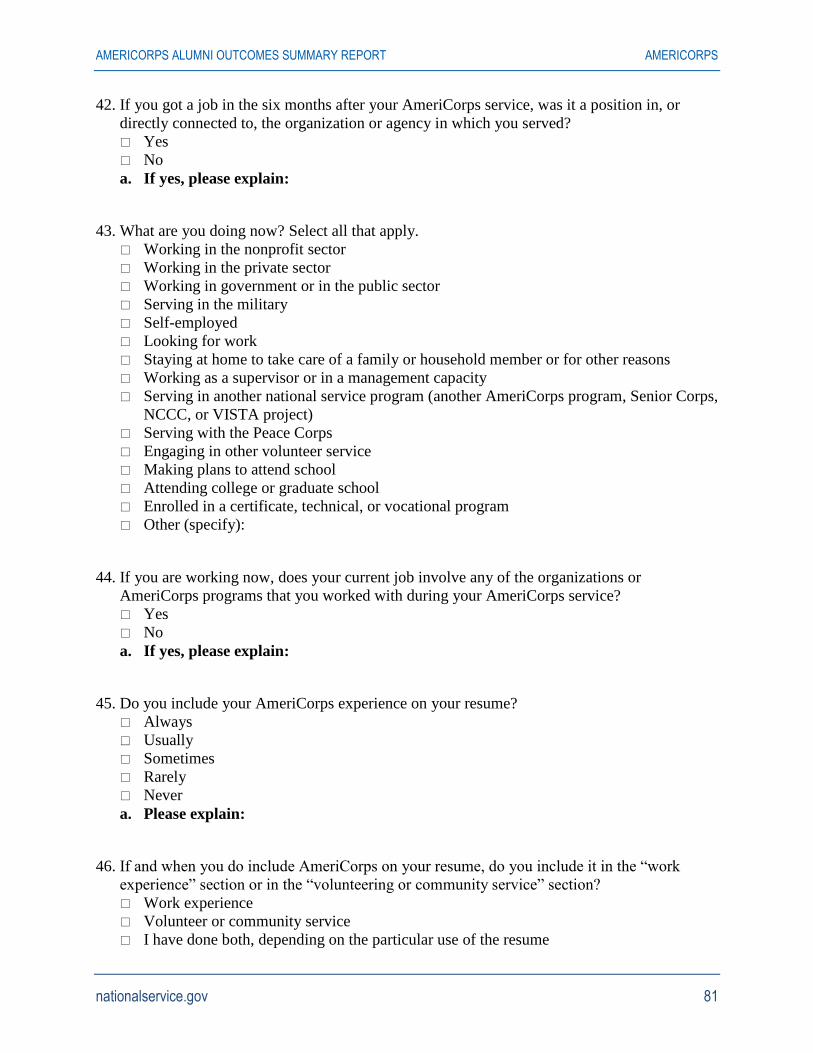
AMERICORPS ALUMNI OUTCOMES SUMMARY REPORT AMERICORPS
nationalservice.gov 81
42. If you got a job in the six months after your AmeriCorps service, was it a position in, or
directly connected to, the organization or agency in which you served?
Yes
No
a. If yes, please explain:
43. What are you doing now? Select all that apply.
Working in the nonprofit sector
Working in the private sector
Working in government or in the public sector
Serving in the military
Self-employed
Looking for work
Staying at home to take care of a family or household member or for other reasons
Working as a supervisor or in a management capacity
Serving in another national service program (another AmeriCorps program, Senior Corps,
NCCC, or VISTA project)
Serving with the Peace Corps
Engaging in other volunteer service
Making plans to attend school
Attending college or graduate school
Enrolled in a certificate, technical, or vocational program
Other (specify):
44. If you are working now, does your current job involve any of the organizations or
AmeriCorps programs that you worked with during your AmeriCorps service?
Yes
No
a. If yes, please explain:
45. Do you include your AmeriCorps experience on your resume?
Always
Usually
Sometimes
Rarely
Never
a. Please explain:
46. If and when you do include AmeriCorps on your resume, do you include it in the “work
experience” section or in the “volunteering or community service” section?
Work experience
Volunteer or community service
I have done both, depending on the particular use of the resume
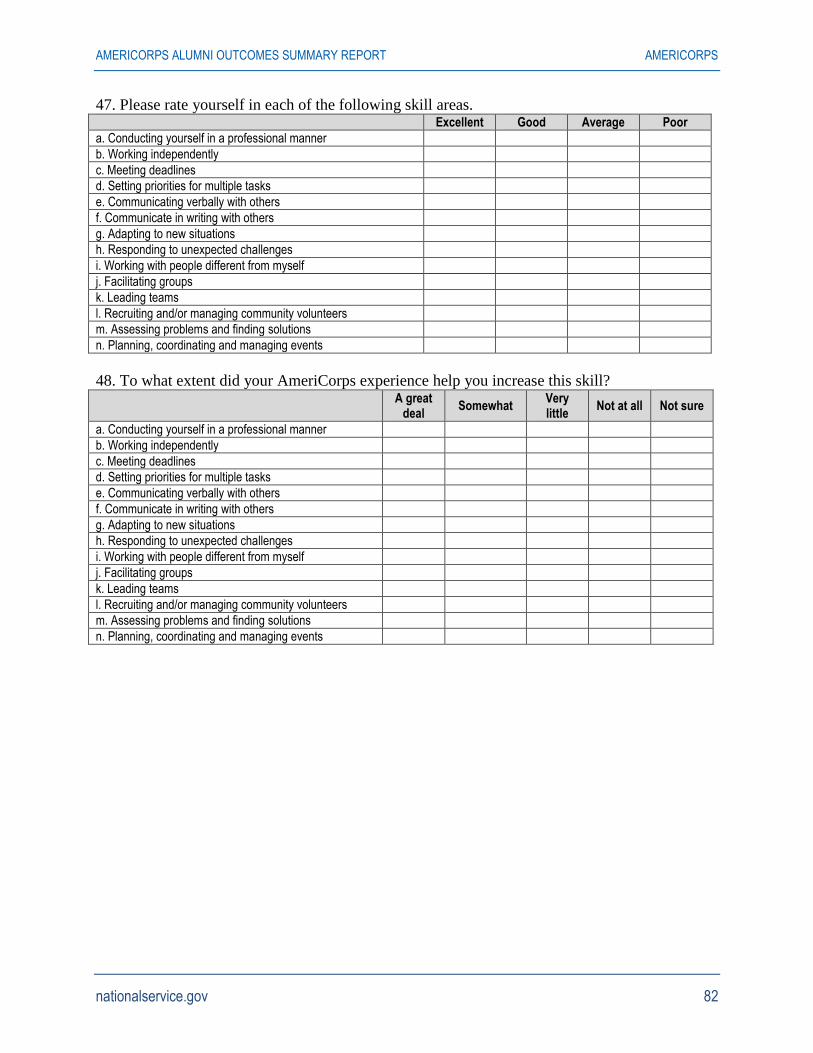
AMERICORPS ALUMNI OUTCOMES SUMMARY REPORT AMERICORPS
nationalservice.gov 82
47. Please rate yourself in each of the following skill areas. Excellent Good Average Poor
a. Conducting yourself in a professional manner
b. Working independently
c. Meeting deadlines
d. Setting priorities for multiple tasks
e. Communicating verbally with others
f. Communicate in writing with others
g. Adapting to new situations
h. Responding to unexpected challenges
i. Working with people different from myself
j. Facilitating groups
k. Leading teams
l. Recruiting and/or managing community volunteers
m. Assessing problems and finding solutions
n. Planning, coordinating and managing events
48. To what extent did your AmeriCorps experience help you increase this skill?
A great
deal Somewhat
Very little
Not at all Not sure
a. Conducting yourself in a professional manner
b. Working independently
c. Meeting deadlines
d. Setting priorities for multiple tasks
e. Communicating verbally with others
f. Communicate in writing with others
g. Adapting to new situations
h. Responding to unexpected challenges
i. Working with people different from myself
j. Facilitating groups
k. Leading teams
l. Recruiting and/or managing community volunteers
m. Assessing problems and finding solutions
n. Planning, coordinating and managing events
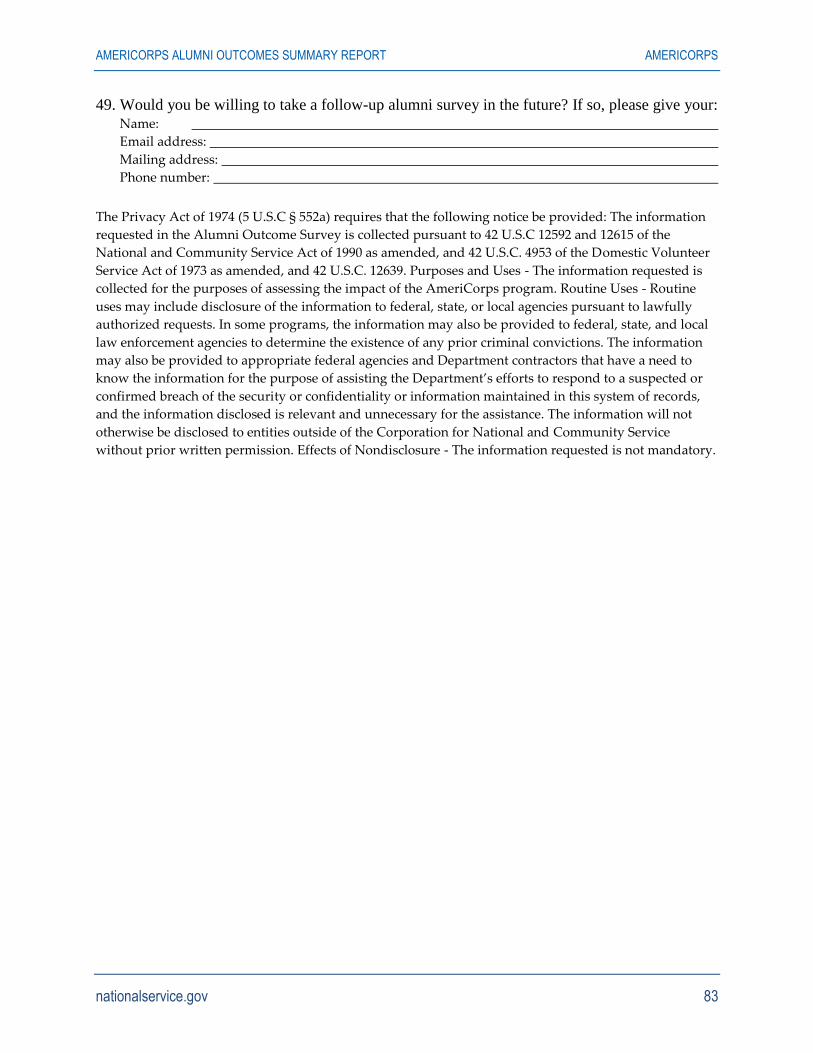
AMERICORPS ALUMNI OUTCOMES SUMMARY REPORT AMERICORPS
nationalservice.gov 83
49. Would you be willing to take a follow-up alumni survey in the future? If so, please give your: Name:
Email address:
Mailing address:
Phone number:
The Privacy Act of 1974 (5 U.S.C § 552a) requires that the following notice be provided: The information
requested in the Alumni Outcome Survey is collected pursuant to 42 U.S.C 12592 and 12615 of the
National and Community Service Act of 1990 as amended, and 42 U.S.C. 4953 of the Domestic Volunteer
Service Act of 1973 as amended, and 42 U.S.C. 12639. Purposes and Uses - The information requested is
collected for the purposes of assessing the impact of the AmeriCorps program. Routine Uses - Routine
uses may include disclosure of the information to federal, state, or local agencies pursuant to lawfully
authorized requests. In some programs, the information may also be provided to federal, state, and local
law enforcement agencies to determine the existence of any prior criminal convictions. The information
may also be provided to appropriate federal agencies and Department contractors that have a need to
know the information for the purpose of assisting the Department’s efforts to respond to a suspected or
confirmed breach of the security or confidentiality or information maintained in this system of records,
and the information disclosed is relevant and unnecessary for the assistance. The information will not
otherwise be disclosed to entities outside of the Corporation for National and Community Service
without prior written permission. Effects of Nondisclosure - The information requested is not mandatory.
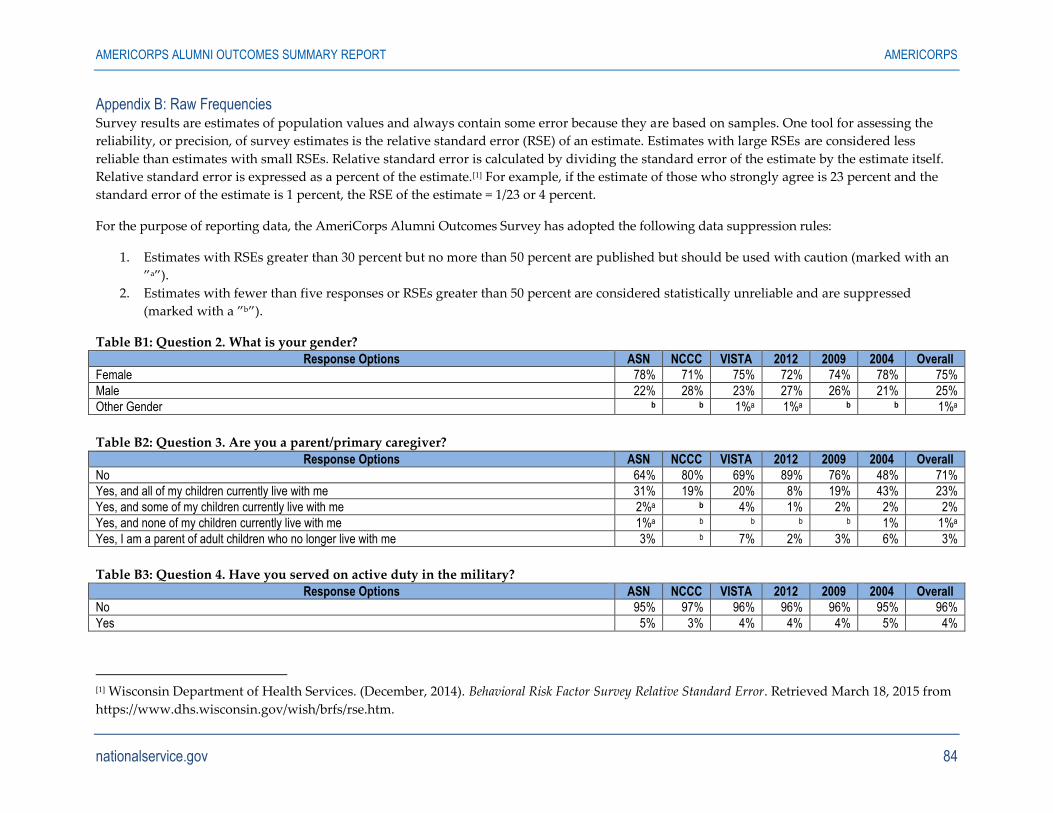
AMERICORPS ALUMNI OUTCOMES SUMMARY REPORT AMERICORPS
nationalservice.gov 84
Appendix B: Raw Frequencies Survey results are estimates of population values and always contain some error because they are based on samples. One tool for assessing the
reliability, or precision, of survey estimates is the relative standard error (RSE) of an estimate. Estimates with large RSEs are considered less
reliable than estimates with small RSEs. Relative standard error is calculated by dividing the standard error of the estimate by the estimate itself.
Relative standard error is expressed as a percent of the estimate.[1] For example, if the estimate of those who strongly agree is 23 percent and the
standard error of the estimate is 1 percent, the RSE of the estimate = 1/23 or 4 percent.
For the purpose of reporting data, the AmeriCorps Alumni Outcomes Survey has adopted the following data suppression rules:
1. Estimates with RSEs greater than 30 percent but no more than 50 percent are published but should be used with caution (marked with an
”a”).
2. Estimates with fewer than five responses or RSEs greater than 50 percent are considered statistically unreliable and are suppressed
(marked with a ”b”).
Table B1: Question 2. What is your gender?
Response Options ASN NCCC VISTA 2012 2009 2004 Overall
Female 78% 71% 75% 72% 74% 78% 75%
Male 22% 28% 23% 27% 26% 21% 25%
Other Gender b b 1%a 1%a b b 1%a
Table B2: Question 3. Are you a parent/primary caregiver?
Response Options ASN NCCC VISTA 2012 2009 2004 Overall
No 64% 80% 69% 89% 76% 48% 71%
Yes, and all of my children currently live with me 31% 19% 20% 8% 19% 43% 23%
Yes, and some of my children currently live with me 2%a b 4% 1% 2% 2% 2%
Yes, and none of my children currently live with me 1%a b b b b 1% 1%a
Yes, I am a parent of adult children who no longer live with me 3% b 7% 2% 3% 6% 3%
Table B3: Question 4. Have you served on active duty in the military?
Response Options ASN NCCC VISTA 2012 2009 2004 Overall
No 95% 97% 96% 96% 96% 95% 96%
Yes 5% 3% 4% 4% 4% 5% 4%
[1] Wisconsin Department of Health Services. (December, 2014). Behavioral Risk Factor Survey Relative Standard Error. Retrieved March 18, 2015 from
https://www.dhs.wisconsin.gov/wish/brfs/rse.htm.
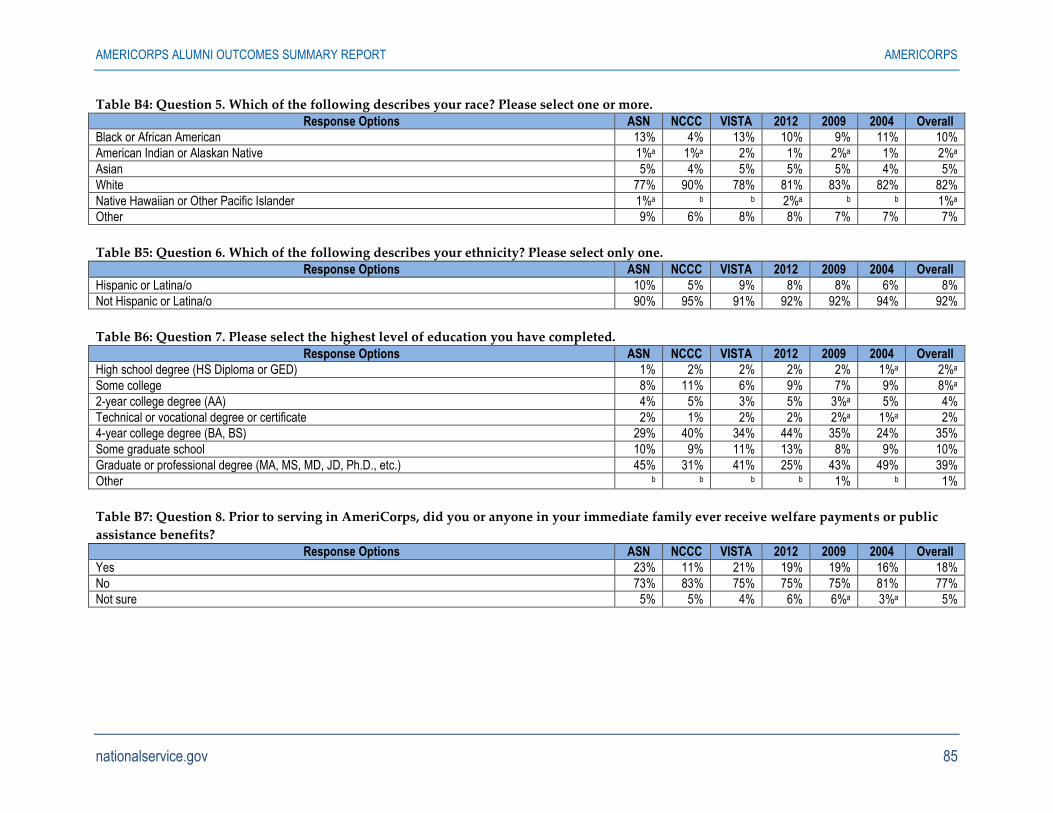
AMERICORPS ALUMNI OUTCOMES SUMMARY REPORT AMERICORPS
nationalservice.gov 85
Table B4: Question 5. Which of the following describes your race? Please select one or more.
Response Options ASN NCCC VISTA 2012 2009 2004 Overall
Black or African American 13% 4% 13% 10% 9% 11% 10%
American Indian or Alaskan Native 1%a 1%a 2% 1% 2%a 1% 2%a
Asian 5% 4% 5% 5% 5% 4% 5%
White 77% 90% 78% 81% 83% 82% 82%
Native Hawaiian or Other Pacific Islander 1%a b b 2%a b b 1%a
Other 9% 6% 8% 8% 7% 7% 7%
Table B5: Question 6. Which of the following describes your ethnicity? Please select only one. Response Options ASN NCCC VISTA 2012 2009 2004 Overall
Hispanic or Latina/o 10% 5% 9% 8% 8% 6% 8%
Not Hispanic or Latina/o 90% 95% 91% 92% 92% 94% 92%
Table B6: Question 7. Please select the highest level of education you have completed.
Response Options ASN NCCC VISTA 2012 2009 2004 Overall
High school degree (HS Diploma or GED) 1% 2% 2% 2% 2% 1%a 2%a
Some college 8% 11% 6% 9% 7% 9% 8%a
2-year college degree (AA) 4% 5% 3% 5% 3%a 5% 4%
Technical or vocational degree or certificate 2% 1% 2% 2% 2%a 1%a 2%
4-year college degree (BA, BS) 29% 40% 34% 44% 35% 24% 35%
Some graduate school 10% 9% 11% 13% 8% 9% 10%
Graduate or professional degree (MA, MS, MD, JD, Ph.D., etc.) 45% 31% 41% 25% 43% 49% 39%
Other b b b b 1% b 1%
Table B7: Question 8. Prior to serving in AmeriCorps, did you or anyone in your immediate family ever receive welfare payments or public
assistance benefits?
Response Options ASN NCCC VISTA 2012 2009 2004 Overall
Yes 23% 11% 21% 19% 19% 16% 18%
No 73% 83% 75% 75% 75% 81% 77%
Not sure 5% 5% 4% 6% 6%a 3%a 5%
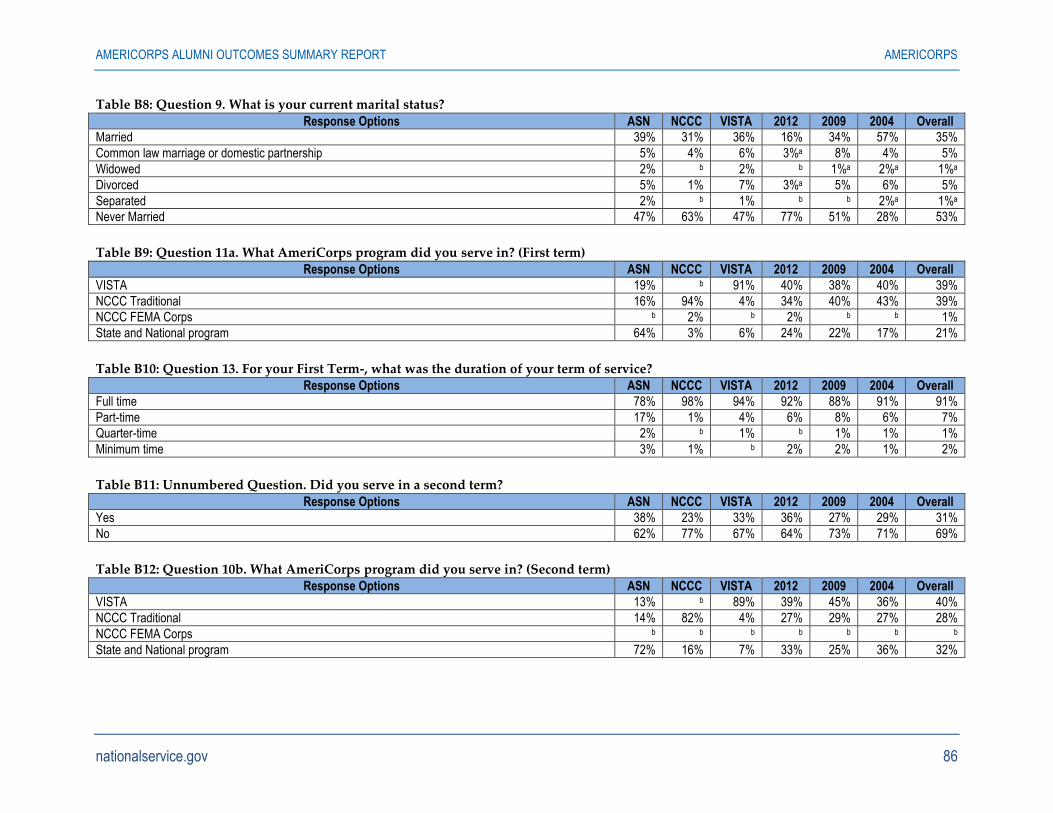
AMERICORPS ALUMNI OUTCOMES SUMMARY REPORT AMERICORPS
nationalservice.gov 86
Table B8: Question 9. What is your current marital status?
Response Options ASN NCCC VISTA 2012 2009 2004 Overall
Married 39% 31% 36% 16% 34% 57% 35%
Common law marriage or domestic partnership 5% 4% 6% 3%a 8% 4% 5%
Widowed 2% b 2% b 1%a 2%a 1%a
Divorced 5% 1% 7% 3%a 5% 6% 5%
Separated 2% b 1% b b 2%a 1%a
Never Married 47% 63% 47% 77% 51% 28% 53%
Table B9: Question 11a. What AmeriCorps program did you serve in? (First term) Response Options ASN NCCC VISTA 2012 2009 2004 Overall
VISTA 19% b 91% 40% 38% 40% 39%
NCCC Traditional 16% 94% 4% 34% 40% 43% 39%
NCCC FEMA Corps b 2% b 2% b b 1%
State and National program 64% 3% 6% 24% 22% 17% 21%
Table B10: Question 13. For your First Term-, what was the duration of your term of service? Response Options ASN NCCC VISTA 2012 2009 2004 Overall
Full time 78% 98% 94% 92% 88% 91% 91%
Part-time 17% 1% 4% 6% 8% 6% 7%
Quarter-time 2% b 1% b 1% 1% 1%
Minimum time 3% 1% b 2% 2% 1% 2%
Table B11: Unnumbered Question. Did you serve in a second term?
Response Options ASN NCCC VISTA 2012 2009 2004 Overall
Yes 38% 23% 33% 36% 27% 29% 31%
No 62% 77% 67% 64% 73% 71% 69%
Table B12: Question 10b. What AmeriCorps program did you serve in? (Second term) Response Options ASN NCCC VISTA 2012 2009 2004 Overall
VISTA 13% b 89% 39% 45% 36% 40%
NCCC Traditional 14% 82% 4% 27% 29% 27% 28%
NCCC FEMA Corps b b b b b b b
State and National program 72% 16% 7% 33% 25% 36% 32%
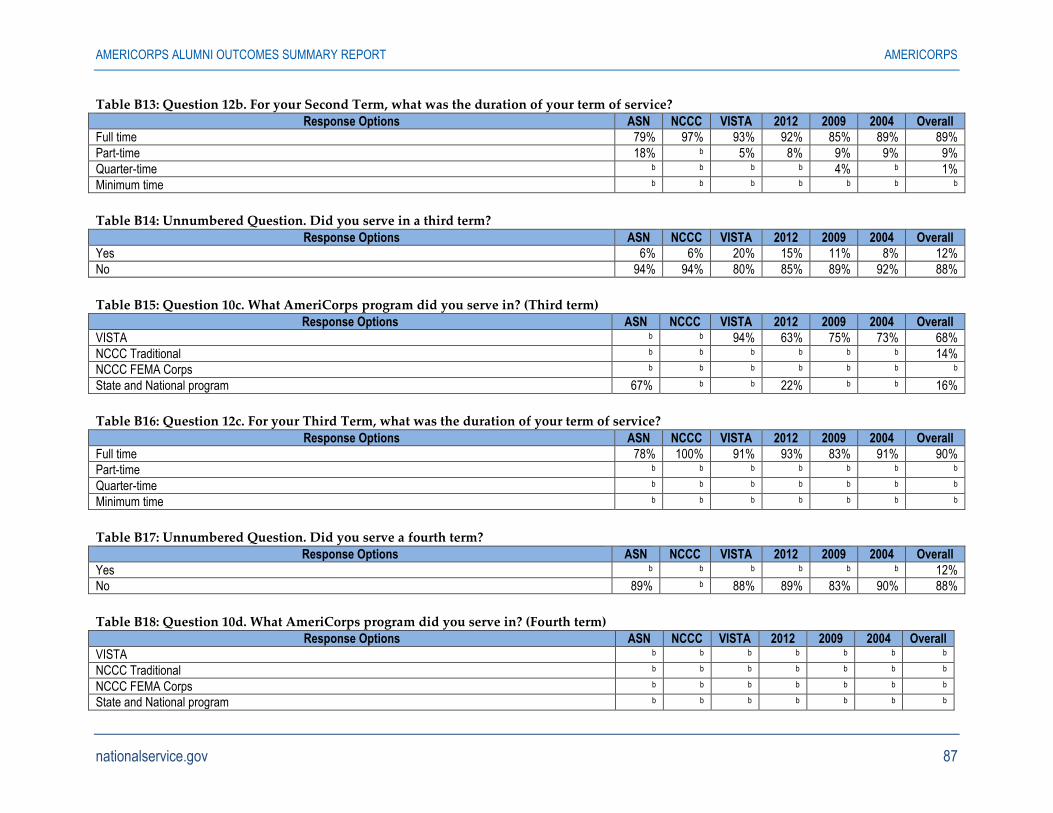
AMERICORPS ALUMNI OUTCOMES SUMMARY REPORT AMERICORPS
nationalservice.gov 87
Table B13: Question 12b. For your Second Term, what was the duration of your term of service?
Response Options ASN NCCC VISTA 2012 2009 2004 Overall
Full time 79% 97% 93% 92% 85% 89% 89%
Part-time 18% b 5% 8% 9% 9% 9%
Quarter-time b b b b 4% b 1%
Minimum time b b b b b b b
Table B14: Unnumbered Question. Did you serve in a third term?
Response Options ASN NCCC VISTA 2012 2009 2004 Overall
Yes 6% 6% 20% 15% 11% 8% 12%
No 94% 94% 80% 85% 89% 92% 88%
Table B15: Question 10c. What AmeriCorps program did you serve in? (Third term)
Response Options ASN NCCC VISTA 2012 2009 2004 Overall
VISTA b b 94% 63% 75% 73% 68%
NCCC Traditional b b b b b b 14%
NCCC FEMA Corps b b b b b b b
State and National program 67% b b 22% b b 16%
Table B16: Question 12c. For your Third Term, what was the duration of your term of service?
Response Options ASN NCCC VISTA 2012 2009 2004 Overall
Full time 78% 100% 91% 93% 83% 91% 90%
Part-time b b b b b b b
Quarter-time b b b b b b b
Minimum time b b b b b b b
Table B17: Unnumbered Question. Did you serve a fourth term?
Response Options ASN NCCC VISTA 2012 2009 2004 Overall
Yes b b b b b b 12%
No 89% b 88% 89% 83% 90% 88%
Table B18: Question 10d. What AmeriCorps program did you serve in? (Fourth term) Response Options ASN NCCC VISTA 2012 2009 2004 Overall
VISTA b b b b b b b
NCCC Traditional b b b b b b b
NCCC FEMA Corps b b b b b b b
State and National program b b b b b b b
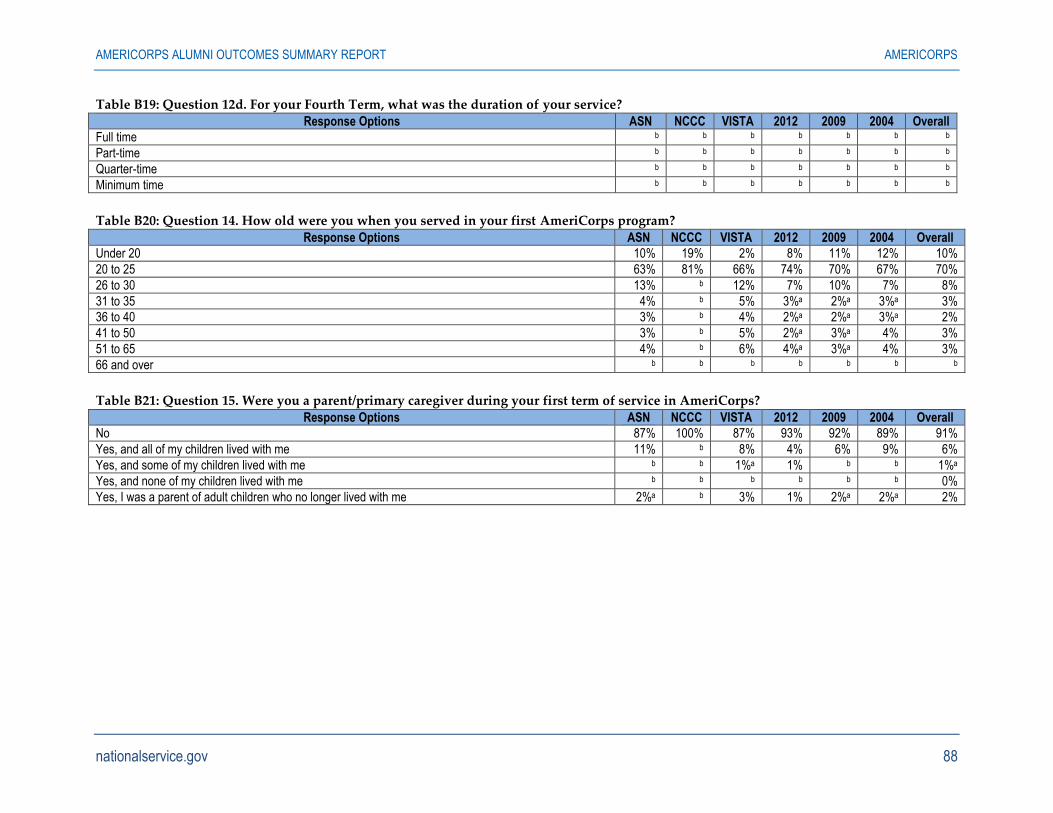
AMERICORPS ALUMNI OUTCOMES SUMMARY REPORT AMERICORPS
nationalservice.gov 88
Table B19: Question 12d. For your Fourth Term, what was the duration of your service?
Response Options ASN NCCC VISTA 2012 2009 2004 Overall
Full time b b b b b b b
Part-time b b b b b b b
Quarter-time b b b b b b b
Minimum time b b b b b b b
Table B20: Question 14. How old were you when you served in your first AmeriCorps program?
Response Options ASN NCCC VISTA 2012 2009 2004 Overall
Under 20 10% 19% 2% 8% 11% 12% 10%
20 to 25 63% 81% 66% 74% 70% 67% 70%
26 to 30 13% b 12% 7% 10% 7% 8%
31 to 35 4% b 5% 3%a 2%a 3%a 3%
36 to 40 3% b 4% 2%a 2%a 3%a 2%
41 to 50 3% b 5% 2%a 3%a 4% 3%
51 to 65 4% b 6% 4%a 3%a 4% 3%
66 and over b b b b b b b
Table B21: Question 15. Were you a parent/primary caregiver during your first term of service in AmeriCorps?
Response Options ASN NCCC VISTA 2012 2009 2004 Overall
No 87% 100% 87% 93% 92% 89% 91%
Yes, and all of my children lived with me 11% b 8% 4% 6% 9% 6%
Yes, and some of my children lived with me b b 1%a 1% b b 1%a
Yes, and none of my children lived with me b b b b b b 0%
Yes, I was a parent of adult children who no longer lived with me 2%a b 3% 1% 2%a 2%a 2%
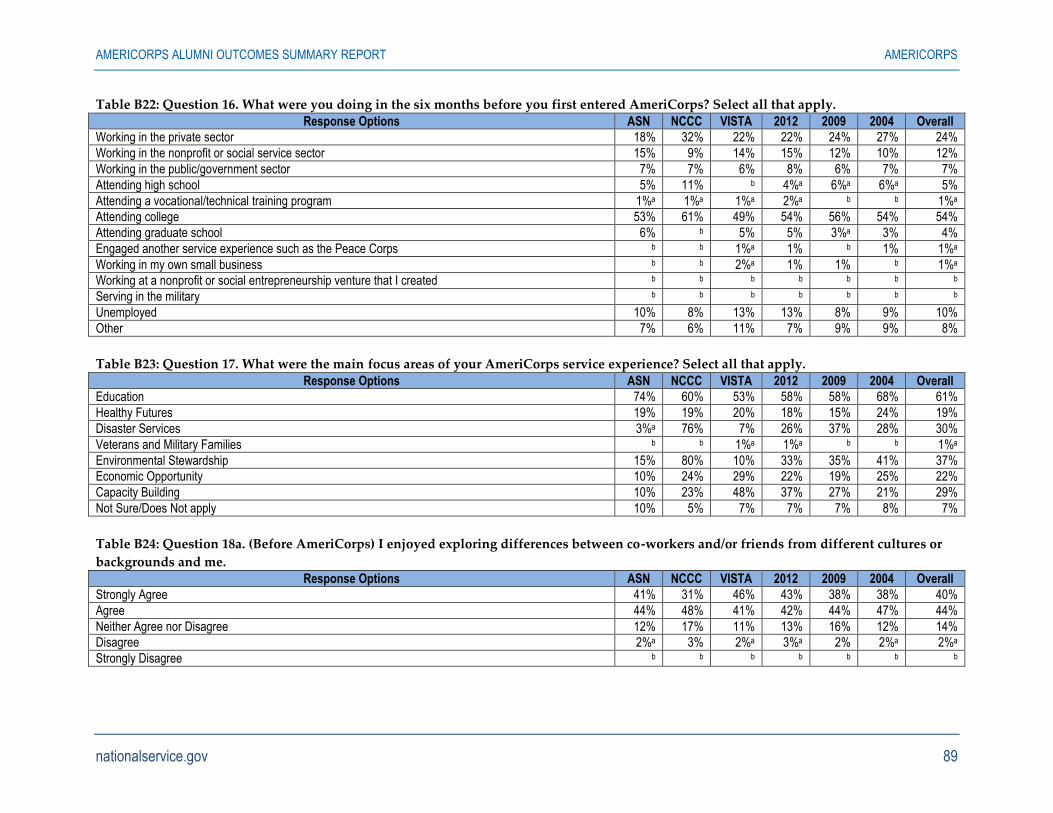
AMERICORPS ALUMNI OUTCOMES SUMMARY REPORT AMERICORPS
nationalservice.gov 89
Table B22: Question 16. What were you doing in the six months before you first entered AmeriCorps? Select all that apply.
Response Options ASN NCCC VISTA 2012 2009 2004 Overall
Working in the private sector 18% 32% 22% 22% 24% 27% 24%
Working in the nonprofit or social service sector 15% 9% 14% 15% 12% 10% 12%
Working in the public/government sector 7% 7% 6% 8% 6% 7% 7%
Attending high school 5% 11% b 4%a 6%a 6%a 5%
Attending a vocational/technical training program 1%a 1%a 1%a 2%a b b 1%a
Attending college 53% 61% 49% 54% 56% 54% 54%
Attending graduate school 6% b 5% 5% 3%a 3% 4%
Engaged another service experience such as the Peace Corps b b 1%a 1% b 1% 1%a
Working in my own small business b b 2%a 1% 1% b 1%a
Working at a nonprofit or social entrepreneurship venture that I created b b b b b b b
Serving in the military b b b b b b b
Unemployed 10% 8% 13% 13% 8% 9% 10%
Other 7% 6% 11% 7% 9% 9% 8%
Table B23: Question 17. What were the main focus areas of your AmeriCorps service experience? Select all that apply.
Response Options ASN NCCC VISTA 2012 2009 2004 Overall
Education 74% 60% 53% 58% 58% 68% 61%
Healthy Futures 19% 19% 20% 18% 15% 24% 19%
Disaster Services 3%a 76% 7% 26% 37% 28% 30%
Veterans and Military Families b b 1%a 1%a b b 1%a
Environmental Stewardship 15% 80% 10% 33% 35% 41% 37%
Economic Opportunity 10% 24% 29% 22% 19% 25% 22%
Capacity Building 10% 23% 48% 37% 27% 21% 29%
Not Sure/Does Not apply 10% 5% 7% 7% 7% 8% 7%
Table B24: Question 18a. (Before AmeriCorps) I enjoyed exploring differences between co-workers and/or friends from different cultures or
backgrounds and me. Response Options ASN NCCC VISTA 2012 2009 2004 Overall
Strongly Agree 41% 31% 46% 43% 38% 38% 40%
Agree 44% 48% 41% 42% 44% 47% 44%
Neither Agree nor Disagree 12% 17% 11% 13% 16% 12% 14%
Disagree 2%a 3% 2%a 3%a 2% 2%a 2%a
Strongly Disagree b b b b b b b
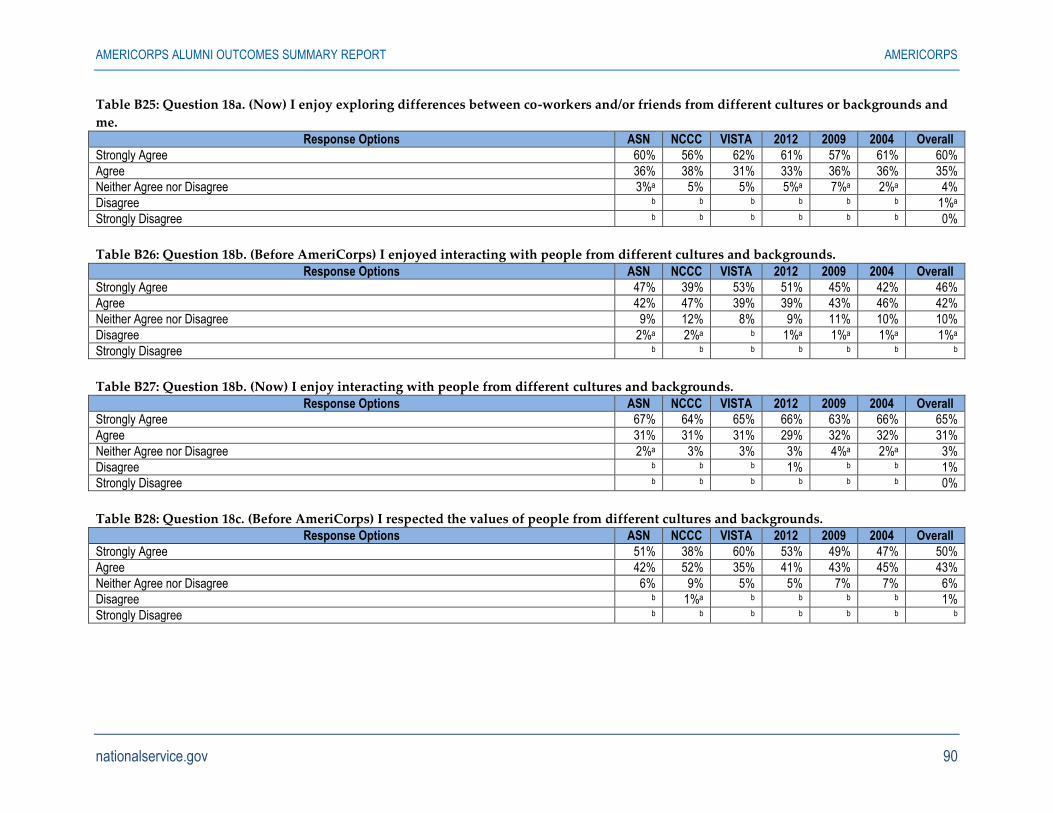
AMERICORPS ALUMNI OUTCOMES SUMMARY REPORT AMERICORPS
nationalservice.gov 90
Table B25: Question 18a. (Now) I enjoy exploring differences between co-workers and/or friends from different cultures or backgrounds and
me.
Response Options ASN NCCC VISTA 2012 2009 2004 Overall
Strongly Agree 60% 56% 62% 61% 57% 61% 60%
Agree 36% 38% 31% 33% 36% 36% 35%
Neither Agree nor Disagree 3%a 5% 5% 5%a 7%a 2%a 4%
Disagree b b b b b b 1%a
Strongly Disagree b b b b b b 0%
Table B26: Question 18b. (Before AmeriCorps) I enjoyed interacting with people from different cultures and backgrounds.
Response Options ASN NCCC VISTA 2012 2009 2004 Overall
Strongly Agree 47% 39% 53% 51% 45% 42% 46%
Agree 42% 47% 39% 39% 43% 46% 42%
Neither Agree nor Disagree 9% 12% 8% 9% 11% 10% 10%
Disagree 2%a 2%a b 1%a 1%a 1%a 1%a
Strongly Disagree b b b b b b b
Table B27: Question 18b. (Now) I enjoy interacting with people from different cultures and backgrounds.
Response Options ASN NCCC VISTA 2012 2009 2004 Overall
Strongly Agree 67% 64% 65% 66% 63% 66% 65%
Agree 31% 31% 31% 29% 32% 32% 31%
Neither Agree nor Disagree 2%a 3% 3% 3% 4%a 2%a 3%
Disagree b b b 1% b b 1%
Strongly Disagree b b b b b b 0%
Table B28: Question 18c. (Before AmeriCorps) I respected the values of people from different cultures and backgrounds. Response Options ASN NCCC VISTA 2012 2009 2004 Overall
Strongly Agree 51% 38% 60% 53% 49% 47% 50%
Agree 42% 52% 35% 41% 43% 45% 43%
Neither Agree nor Disagree 6% 9% 5% 5% 7% 7% 6%
Disagree b 1%a b b b b 1%
Strongly Disagree b b b b b b b
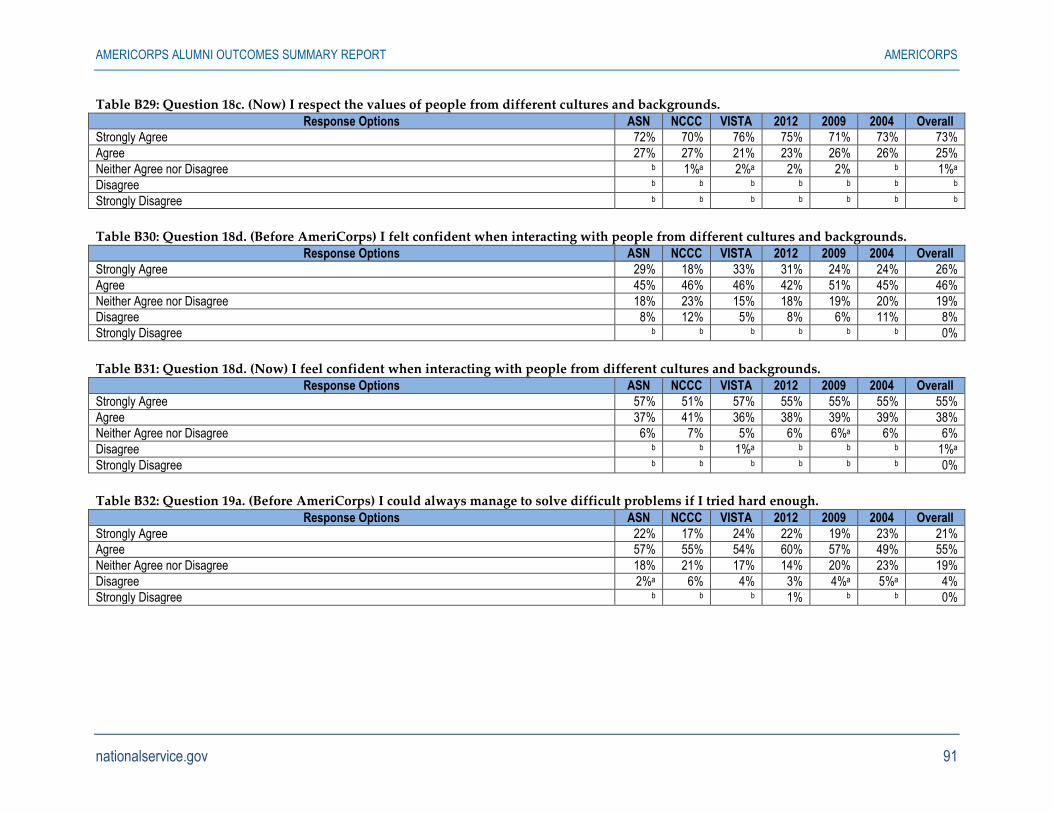
AMERICORPS ALUMNI OUTCOMES SUMMARY REPORT AMERICORPS
nationalservice.gov 91
Table B29: Question 18c. (Now) I respect the values of people from different cultures and backgrounds.
Response Options ASN NCCC VISTA 2012 2009 2004 Overall
Strongly Agree 72% 70% 76% 75% 71% 73% 73%
Agree 27% 27% 21% 23% 26% 26% 25%
Neither Agree nor Disagree b 1%a 2%a 2% 2% b 1%a
Disagree b b b b b b b
Strongly Disagree b b b b b b b
Table B30: Question 18d. (Before AmeriCorps) I felt confident when interacting with people from different cultures and backgrounds. Response Options ASN NCCC VISTA 2012 2009 2004 Overall
Strongly Agree 29% 18% 33% 31% 24% 24% 26%
Agree 45% 46% 46% 42% 51% 45% 46%
Neither Agree nor Disagree 18% 23% 15% 18% 19% 20% 19%
Disagree 8% 12% 5% 8% 6% 11% 8%
Strongly Disagree b b b b b b 0%
Table B31: Question 18d. (Now) I feel confident when interacting with people from different cultures and backgrounds. Response Options ASN NCCC VISTA 2012 2009 2004 Overall
Strongly Agree 57% 51% 57% 55% 55% 55% 55%
Agree 37% 41% 36% 38% 39% 39% 38%
Neither Agree nor Disagree 6% 7% 5% 6% 6%a 6% 6%
Disagree b b 1%a b b b 1%a
Strongly Disagree b b b b b b 0%
Table B32: Question 19a. (Before AmeriCorps) I could always manage to solve difficult problems if I tried hard enough.
Response Options ASN NCCC VISTA 2012 2009 2004 Overall
Strongly Agree 22% 17% 24% 22% 19% 23% 21%
Agree 57% 55% 54% 60% 57% 49% 55%
Neither Agree nor Disagree 18% 21% 17% 14% 20% 23% 19%
Disagree 2%a 6% 4% 3% 4%a 5%a 4%
Strongly Disagree b b b 1% b b 0%
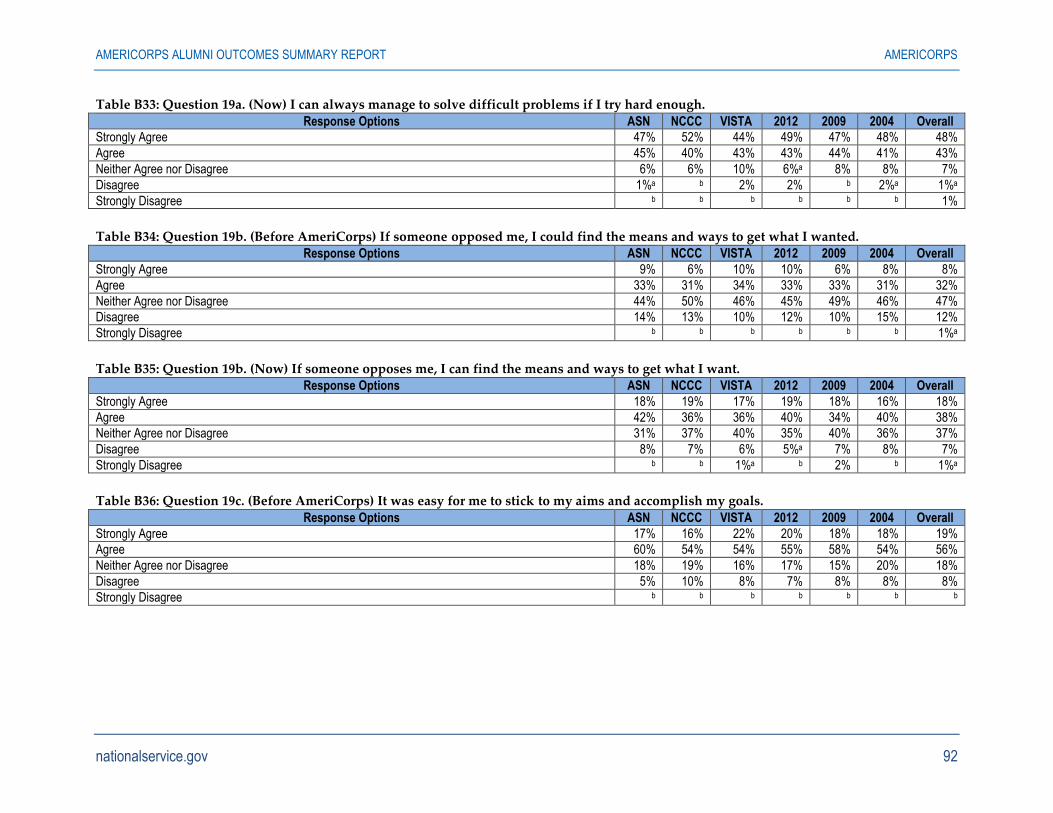
AMERICORPS ALUMNI OUTCOMES SUMMARY REPORT AMERICORPS
nationalservice.gov 92
Table B33: Question 19a. (Now) I can always manage to solve difficult problems if I try hard enough.
Response Options ASN NCCC VISTA 2012 2009 2004 Overall
Strongly Agree 47% 52% 44% 49% 47% 48% 48%
Agree 45% 40% 43% 43% 44% 41% 43%
Neither Agree nor Disagree 6% 6% 10% 6%a 8% 8% 7%
Disagree 1%a b 2% 2% b 2%a 1%a
Strongly Disagree b b b b b b 1%
Table B34: Question 19b. (Before AmeriCorps) If someone opposed me, I could find the means and ways to get what I wanted. Response Options ASN NCCC VISTA 2012 2009 2004 Overall
Strongly Agree 9% 6% 10% 10% 6% 8% 8%
Agree 33% 31% 34% 33% 33% 31% 32%
Neither Agree nor Disagree 44% 50% 46% 45% 49% 46% 47%
Disagree 14% 13% 10% 12% 10% 15% 12%
Strongly Disagree b b b b b b 1%a
Table B35: Question 19b. (Now) If someone opposes me, I can find the means and ways to get what I want. Response Options ASN NCCC VISTA 2012 2009 2004 Overall
Strongly Agree 18% 19% 17% 19% 18% 16% 18%
Agree 42% 36% 36% 40% 34% 40% 38%
Neither Agree nor Disagree 31% 37% 40% 35% 40% 36% 37%
Disagree 8% 7% 6% 5%a 7% 8% 7%
Strongly Disagree b b 1%a b 2% b 1%a
Table B36: Question 19c. (Before AmeriCorps) It was easy for me to stick to my aims and accomplish my goals.
Response Options ASN NCCC VISTA 2012 2009 2004 Overall
Strongly Agree 17% 16% 22% 20% 18% 18% 19%
Agree 60% 54% 54% 55% 58% 54% 56%
Neither Agree nor Disagree 18% 19% 16% 17% 15% 20% 18%
Disagree 5% 10% 8% 7% 8% 8% 8%
Strongly Disagree b b b b b b b
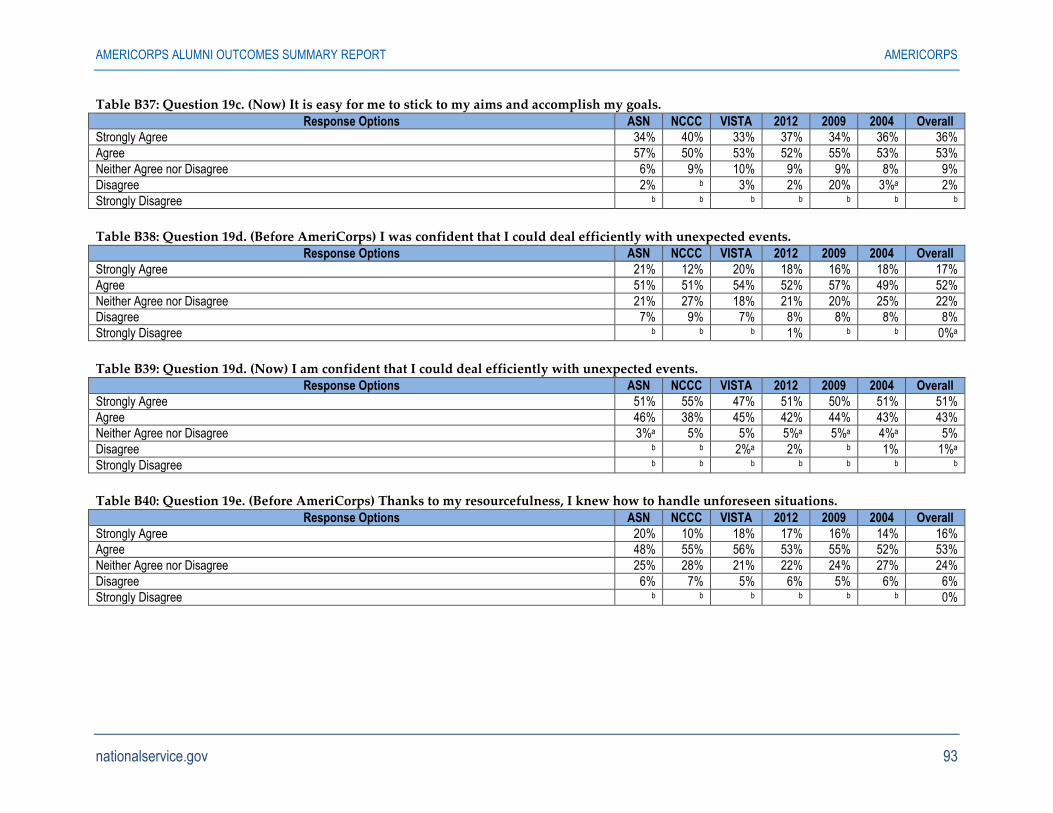
AMERICORPS ALUMNI OUTCOMES SUMMARY REPORT AMERICORPS
nationalservice.gov 93
Table B37: Question 19c. (Now) It is easy for me to stick to my aims and accomplish my goals.
Response Options ASN NCCC VISTA 2012 2009 2004 Overall
Strongly Agree 34% 40% 33% 37% 34% 36% 36%
Agree 57% 50% 53% 52% 55% 53% 53%
Neither Agree nor Disagree 6% 9% 10% 9% 9% 8% 9%
Disagree 2% b 3% 2% 20% 3%a 2%
Strongly Disagree b b b b b b b
Table B38: Question 19d. (Before AmeriCorps) I was confident that I could deal efficiently with unexpected events. Response Options ASN NCCC VISTA 2012 2009 2004 Overall
Strongly Agree 21% 12% 20% 18% 16% 18% 17%
Agree 51% 51% 54% 52% 57% 49% 52%
Neither Agree nor Disagree 21% 27% 18% 21% 20% 25% 22%
Disagree 7% 9% 7% 8% 8% 8% 8%
Strongly Disagree b b b 1% b b 0%a
Table B39: Question 19d. (Now) I am confident that I could deal efficiently with unexpected events. Response Options ASN NCCC VISTA 2012 2009 2004 Overall
Strongly Agree 51% 55% 47% 51% 50% 51% 51%
Agree 46% 38% 45% 42% 44% 43% 43%
Neither Agree nor Disagree 3%a 5% 5% 5%a 5%a 4%a 5%
Disagree b b 2%a 2% b 1% 1%a
Strongly Disagree b b b b b b b
Table B40: Question 19e. (Before AmeriCorps) Thanks to my resourcefulness, I knew how to handle unforeseen situations.
Response Options ASN NCCC VISTA 2012 2009 2004 Overall
Strongly Agree 20% 10% 18% 17% 16% 14% 16%
Agree 48% 55% 56% 53% 55% 52% 53%
Neither Agree nor Disagree 25% 28% 21% 22% 24% 27% 24%
Disagree 6% 7% 5% 6% 5% 6% 6%
Strongly Disagree b b b b b b 0%
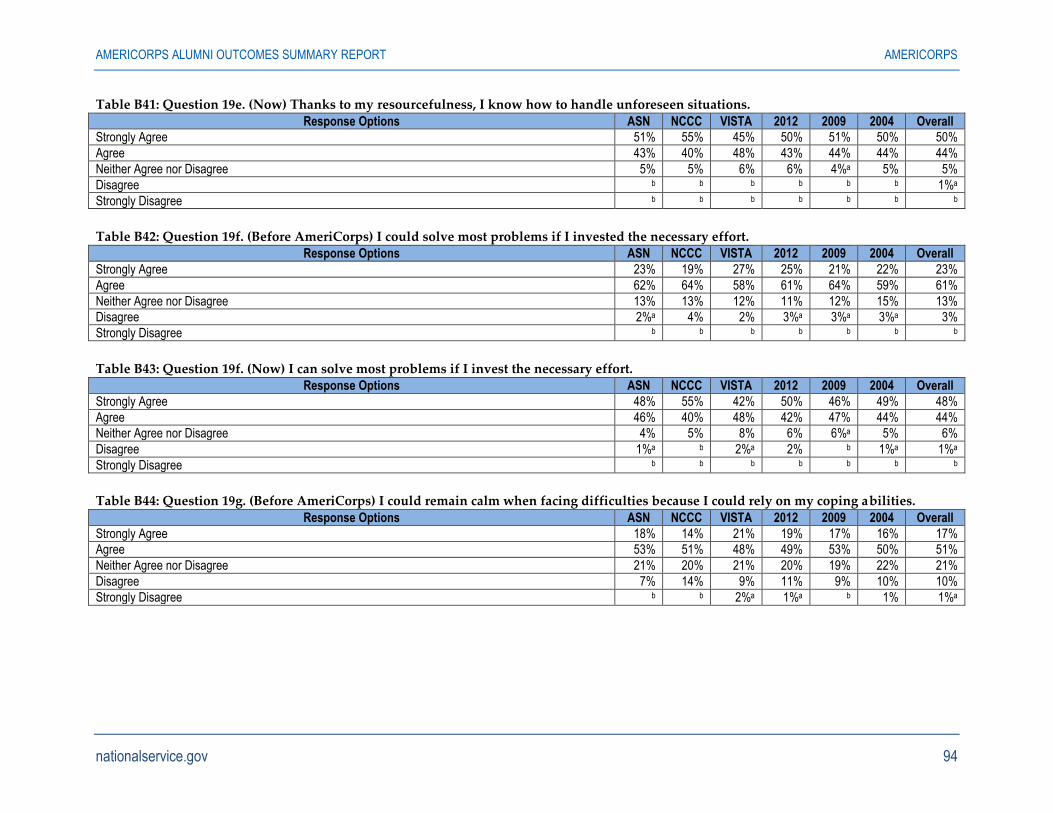
AMERICORPS ALUMNI OUTCOMES SUMMARY REPORT AMERICORPS
nationalservice.gov 94
Table B41: Question 19e. (Now) Thanks to my resourcefulness, I know how to handle unforeseen situations.
Response Options ASN NCCC VISTA 2012 2009 2004 Overall
Strongly Agree 51% 55% 45% 50% 51% 50% 50%
Agree 43% 40% 48% 43% 44% 44% 44%
Neither Agree nor Disagree 5% 5% 6% 6% 4%a 5% 5%
Disagree b b b b b b 1%a
Strongly Disagree b b b b b b b
Table B42: Question 19f. (Before AmeriCorps) I could solve most problems if I invested the necessary effort. Response Options ASN NCCC VISTA 2012 2009 2004 Overall
Strongly Agree 23% 19% 27% 25% 21% 22% 23%
Agree 62% 64% 58% 61% 64% 59% 61%
Neither Agree nor Disagree 13% 13% 12% 11% 12% 15% 13%
Disagree 2%a 4% 2% 3%a 3%a 3%a 3%
Strongly Disagree b b b b b b b
Table B43: Question 19f. (Now) I can solve most problems if I invest the necessary effort. Response Options ASN NCCC VISTA 2012 2009 2004 Overall
Strongly Agree 48% 55% 42% 50% 46% 49% 48%
Agree 46% 40% 48% 42% 47% 44% 44%
Neither Agree nor Disagree 4% 5% 8% 6% 6%a 5% 6%
Disagree 1%a b 2%a 2% b 1%a 1%a
Strongly Disagree b b b b b b b
Table B44: Question 19g. (Before AmeriCorps) I could remain calm when facing difficulties because I could rely on my coping abilities.
Response Options ASN NCCC VISTA 2012 2009 2004 Overall
Strongly Agree 18% 14% 21% 19% 17% 16% 17%
Agree 53% 51% 48% 49% 53% 50% 51%
Neither Agree nor Disagree 21% 20% 21% 20% 19% 22% 21%
Disagree 7% 14% 9% 11% 9% 10% 10%
Strongly Disagree b b 2%a 1%a b 1% 1%a

AMERICORPS ALUMNI OUTCOMES SUMMARY REPORT AMERICORPS
nationalservice.gov 95
Table B45: Question 19g. (Now) I can remain calm when facing difficulties because I can rely on my coping abilities.
Response Options ASN NCCC VISTA 2012 2009 2004 Overall
Strongly Agree 43% 44% 40% 42% 43% 42% 42%
Agree 50% 47% 47% 47% 49% 48% 48%
Neither Agree nor Disagree 6% 7% 11% 10% 7% 7% 8%
Disagree b 2%a 2%a b b 2%a 1%a
Strongly Disagree b b b b b b b
Table B46: Question19h. (Before AmeriCorps) When I was confronted with a problem, I could usually find several solutions. Response Options ASN NCCC VISTA 2012 2009 2004 Overall
Strongly Agree 17% 11% 19% 16% 17% 14% 16%
Agree 57% 59% 57% 59% 57% 57% 58%
Neither Agree nor Disagree 20% 23% 20% 20% 20% 24% 21%
Disagree 5% 7% 3% 5%a 5% 5% 5%
Strongly Disagree b b b b b b b
Table B47: Question 19h. (Now) When I am confronted with a problem, I can usually find several solutions. Response Options ASN NCCC VISTA 2012 2009 2004 Overall
Strongly Agree 42% 41% 36% 37% 40% 42% 40%
Agree 51% 50% 54% 54% 51% 50% 52%
Neither Agree nor Disagree 7% 8% 9% 9% 8% 7% 8%
Disagree b b b b b b 1%
Strongly Disagree b b b b b b b
Table B48: Question 19i. (Before AmeriCorps) If I was in trouble, I could usually think of a solution.
Response Options ASN NCCC VISTA 2012 2009 2004 Overall
Strongly Agree 18% 14% 19% 19% 16% 15% 17%
Agree 62% 64% 62% 60% 64% 64% 63%
Neither Agree nor Disagree 18% 18% 17% 18% 17% 17% 18%
Disagree 2%a 4% 2%a 2%a 3% 2%a 2%a
Strongly Disagree b b b b b b b
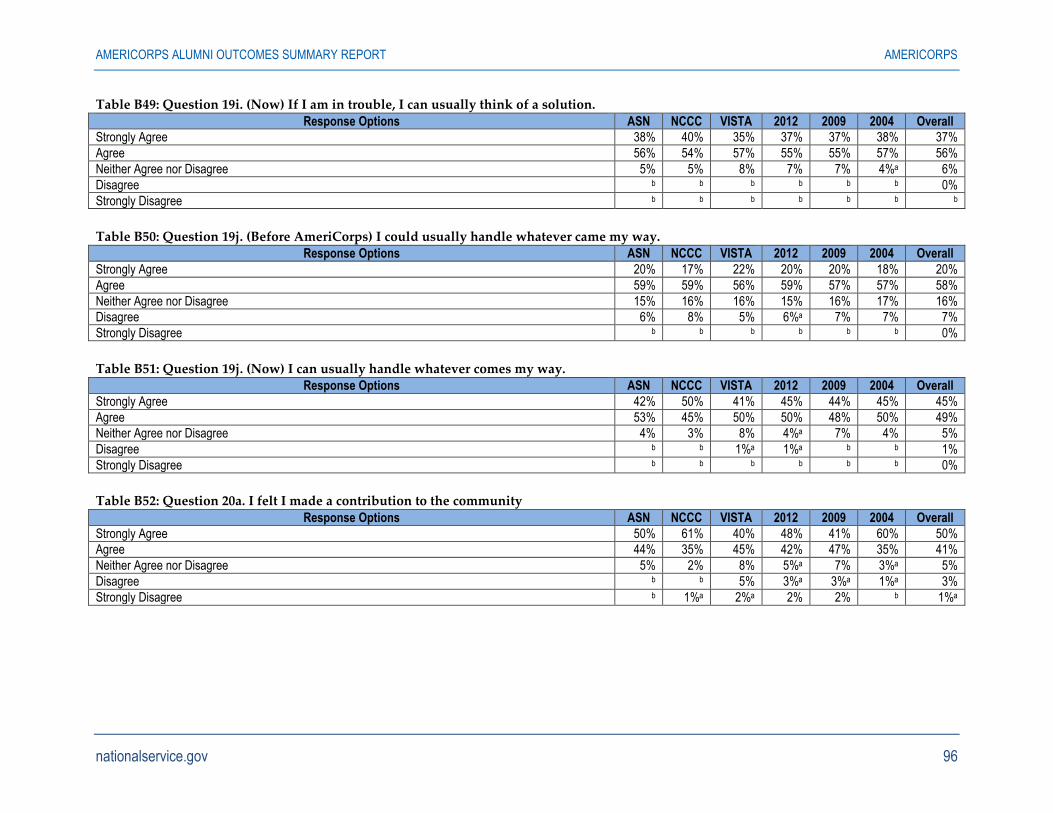
AMERICORPS ALUMNI OUTCOMES SUMMARY REPORT AMERICORPS
nationalservice.gov 96
Table B49: Question 19i. (Now) If I am in trouble, I can usually think of a solution.
Response Options ASN NCCC VISTA 2012 2009 2004 Overall
Strongly Agree 38% 40% 35% 37% 37% 38% 37%
Agree 56% 54% 57% 55% 55% 57% 56%
Neither Agree nor Disagree 5% 5% 8% 7% 7% 4%a 6%
Disagree b b b b b b 0%
Strongly Disagree b b b b b b b
Table B50: Question 19j. (Before AmeriCorps) I could usually handle whatever came my way. Response Options ASN NCCC VISTA 2012 2009 2004 Overall
Strongly Agree 20% 17% 22% 20% 20% 18% 20%
Agree 59% 59% 56% 59% 57% 57% 58%
Neither Agree nor Disagree 15% 16% 16% 15% 16% 17% 16%
Disagree 6% 8% 5% 6%a 7% 7% 7%
Strongly Disagree b b b b b b 0%
Table B51: Question 19j. (Now) I can usually handle whatever comes my way. Response Options ASN NCCC VISTA 2012 2009 2004 Overall
Strongly Agree 42% 50% 41% 45% 44% 45% 45%
Agree 53% 45% 50% 50% 48% 50% 49%
Neither Agree nor Disagree 4% 3% 8% 4%a 7% 4% 5%
Disagree b b 1%a 1%a b b 1%
Strongly Disagree b b b b b b 0%
Table B52: Question 20a. I felt I made a contribution to the community
Response Options ASN NCCC VISTA 2012 2009 2004 Overall
Strongly Agree 50% 61% 40% 48% 41% 60% 50%
Agree 44% 35% 45% 42% 47% 35% 41%
Neither Agree nor Disagree 5% 2% 8% 5%a 7% 3%a 5%
Disagree b b 5% 3%a 3%a 1%a 3%
Strongly Disagree b 1%a 2%a 2% 2% b 1%a
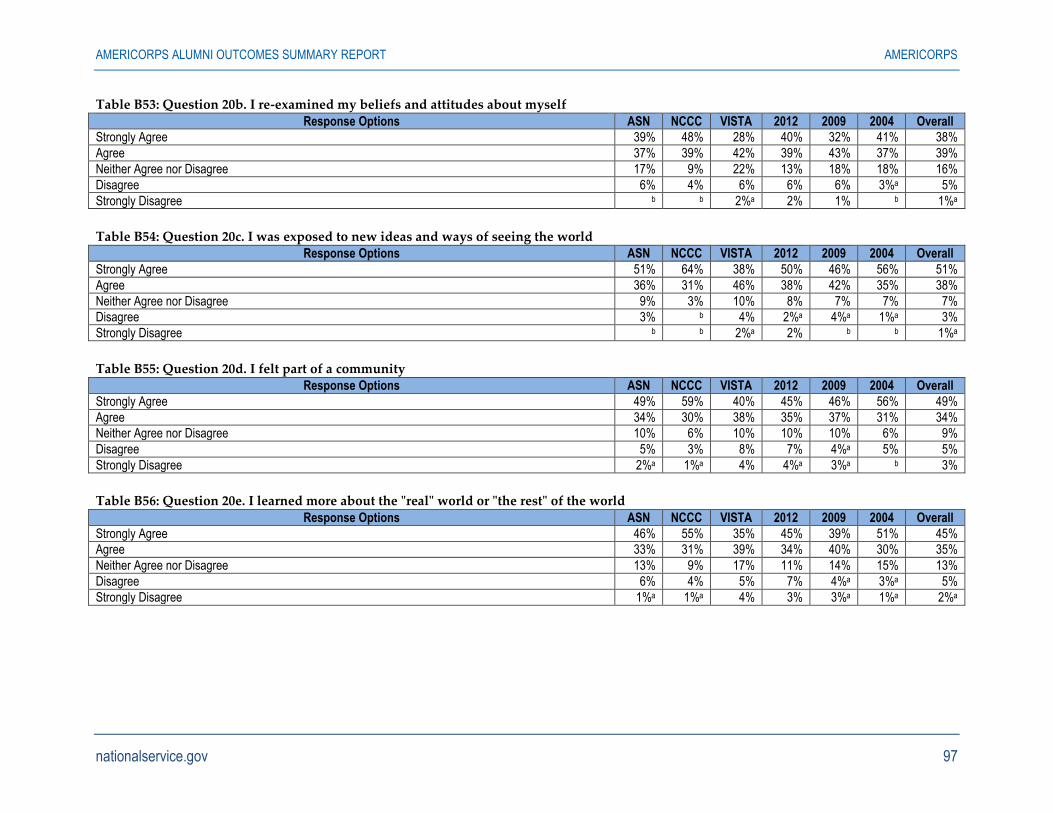
AMERICORPS ALUMNI OUTCOMES SUMMARY REPORT AMERICORPS
nationalservice.gov 97
Table B53: Question 20b. I re-examined my beliefs and attitudes about myself
Response Options ASN NCCC VISTA 2012 2009 2004 Overall
Strongly Agree 39% 48% 28% 40% 32% 41% 38%
Agree 37% 39% 42% 39% 43% 37% 39%
Neither Agree nor Disagree 17% 9% 22% 13% 18% 18% 16%
Disagree 6% 4% 6% 6% 6% 3%a 5%
Strongly Disagree b b 2%a 2% 1% b 1%a
Table B54: Question 20c. I was exposed to new ideas and ways of seeing the world Response Options ASN NCCC VISTA 2012 2009 2004 Overall
Strongly Agree 51% 64% 38% 50% 46% 56% 51%
Agree 36% 31% 46% 38% 42% 35% 38%
Neither Agree nor Disagree 9% 3% 10% 8% 7% 7% 7%
Disagree 3% b 4% 2%a 4%a 1%a 3%
Strongly Disagree b b 2%a 2% b b 1%a
Table B55: Question 20d. I felt part of a community Response Options ASN NCCC VISTA 2012 2009 2004 Overall
Strongly Agree 49% 59% 40% 45% 46% 56% 49%
Agree 34% 30% 38% 35% 37% 31% 34%
Neither Agree nor Disagree 10% 6% 10% 10% 10% 6% 9%
Disagree 5% 3% 8% 7% 4%a 5% 5%
Strongly Disagree 2%a 1%a 4% 4%a 3%a b 3%
Table B56: Question 20e. I learned more about the "real" world or "the rest" of the world
Response Options ASN NCCC VISTA 2012 2009 2004 Overall
Strongly Agree 46% 55% 35% 45% 39% 51% 45%
Agree 33% 31% 39% 34% 40% 30% 35%
Neither Agree nor Disagree 13% 9% 17% 11% 14% 15% 13%
Disagree 6% 4% 5% 7% 4%a 3%a 5%
Strongly Disagree 1%a 1%a 4% 3% 3%a 1%a 2%a
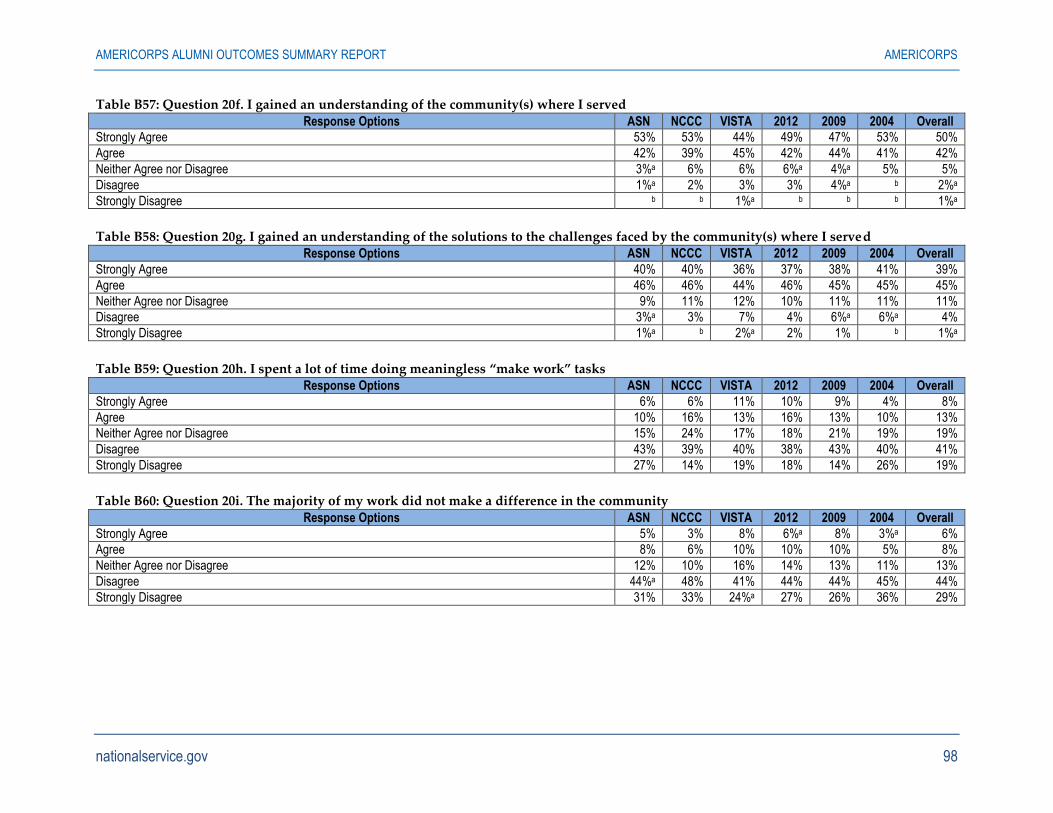
AMERICORPS ALUMNI OUTCOMES SUMMARY REPORT AMERICORPS
nationalservice.gov 98
Table B57: Question 20f. I gained an understanding of the community(s) where I served
Response Options ASN NCCC VISTA 2012 2009 2004 Overall
Strongly Agree 53% 53% 44% 49% 47% 53% 50%
Agree 42% 39% 45% 42% 44% 41% 42%
Neither Agree nor Disagree 3%a 6% 6% 6%a 4%a 5% 5%
Disagree 1%a 2% 3% 3% 4%a b 2%a
Strongly Disagree b b 1%a b b b 1%a
Table B58: Question 20g. I gained an understanding of the solutions to the challenges faced by the community(s) where I served Response Options ASN NCCC VISTA 2012 2009 2004 Overall
Strongly Agree 40% 40% 36% 37% 38% 41% 39%
Agree 46% 46% 44% 46% 45% 45% 45%
Neither Agree nor Disagree 9% 11% 12% 10% 11% 11% 11%
Disagree 3%a 3% 7% 4% 6%a 6%a 4%
Strongly Disagree 1%a b 2%a 2% 1% b 1%a
Table B59: Question 20h. I spent a lot of time doing meaningless “make work” tasks Response Options ASN NCCC VISTA 2012 2009 2004 Overall
Strongly Agree 6% 6% 11% 10% 9% 4% 8%
Agree 10% 16% 13% 16% 13% 10% 13%
Neither Agree nor Disagree 15% 24% 17% 18% 21% 19% 19%
Disagree 43% 39% 40% 38% 43% 40% 41%
Strongly Disagree 27% 14% 19% 18% 14% 26% 19%
Table B60: Question 20i. The majority of my work did not make a difference in the community
Response Options ASN NCCC VISTA 2012 2009 2004 Overall
Strongly Agree 5% 3% 8% 6%a 8% 3%a 6%
Agree 8% 6% 10% 10% 10% 5% 8%
Neither Agree nor Disagree 12% 10% 16% 14% 13% 11% 13%
Disagree 44%a 48% 41% 44% 44% 45% 44%
Strongly Disagree 31% 33% 24%a 27% 26% 36% 29%
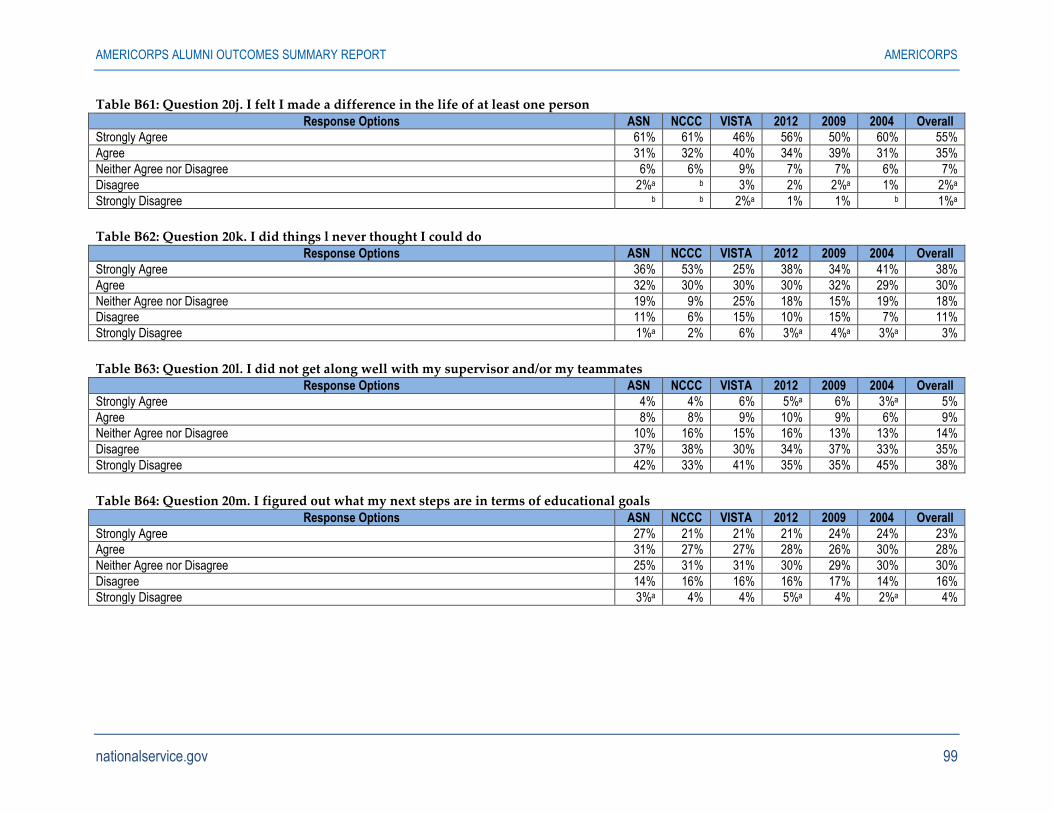
AMERICORPS ALUMNI OUTCOMES SUMMARY REPORT AMERICORPS
nationalservice.gov 99
Table B61: Question 20j. I felt I made a difference in the life of at least one person
Response Options ASN NCCC VISTA 2012 2009 2004 Overall
Strongly Agree 61% 61% 46% 56% 50% 60% 55%
Agree 31% 32% 40% 34% 39% 31% 35%
Neither Agree nor Disagree 6% 6% 9% 7% 7% 6% 7%
Disagree 2%a b 3% 2% 2%a 1% 2%a
Strongly Disagree b b 2%a 1% 1% b 1%a
Table B62: Question 20k. I did things l never thought I could do Response Options ASN NCCC VISTA 2012 2009 2004 Overall
Strongly Agree 36% 53% 25% 38% 34% 41% 38%
Agree 32% 30% 30% 30% 32% 29% 30%
Neither Agree nor Disagree 19% 9% 25% 18% 15% 19% 18%
Disagree 11% 6% 15% 10% 15% 7% 11%
Strongly Disagree 1%a 2% 6% 3%a 4%a 3%a 3%
Table B63: Question 20l. I did not get along well with my supervisor and/or my teammates Response Options ASN NCCC VISTA 2012 2009 2004 Overall
Strongly Agree 4% 4% 6% 5%a 6% 3%a 5%
Agree 8% 8% 9% 10% 9% 6% 9%
Neither Agree nor Disagree 10% 16% 15% 16% 13% 13% 14%
Disagree 37% 38% 30% 34% 37% 33% 35%
Strongly Disagree 42% 33% 41% 35% 35% 45% 38%
Table B64: Question 20m. I figured out what my next steps are in terms of educational goals
Response Options ASN NCCC VISTA 2012 2009 2004 Overall
Strongly Agree 27% 21% 21% 21% 24% 24% 23%
Agree 31% 27% 27% 28% 26% 30% 28%
Neither Agree nor Disagree 25% 31% 31% 30% 29% 30% 30%
Disagree 14% 16% 16% 16% 17% 14% 16%
Strongly Disagree 3%a 4% 4% 5%a 4% 2%a 4%

AMERICORPS ALUMNI OUTCOMES SUMMARY REPORT AMERICORPS
nationalservice.gov 100
Table B65: Question 20n. I figured out what my next steps are in terms of career/professional goals
Response Options ASN NCCC VISTA 2012 2009 2004 Overall
Strongly Agree 29% 22% 29% 28% 24% 28% 27%
Agree 36% 36% 36% 38% 35% 35% 36%
Neither Agree nor Disagree 21% 24% 22% 20% 26% 21% 22%
Disagree 11% 14% 10% 10% 11% 14% 12%
Strongly Disagree 3%a 4% 4% 4%a 4%a 2%a 3%
Table B66: Question 20o. I felt defeated by the scope of the problems I worked on Response Options ASN NCCC VISTA 2012 2009 2004 Overall
Strongly Agree 5% 2% 6% 5% 5%a 2%a 4%
Agree 11% 5% 10% 11% 9% 5% 8%
Neither Agree nor Disagree 16% 16% 22% 18% 18% 19% 18%
Disagree 41% 49% 39% 43% 48% 39% 43%
Strongly Disagree 27% 28% 23% 24% 20% 34% 26%
Table B67: Question 20p. I re-examined my beliefs and attitudes about other people Response Options ASN NCCC VISTA 2012 2009 2004 Overall
Strongly Agree 23% 31% 17% 23% 20% 28% 24%
Agree 43% 43% 41% 44% 45% 39% 43%
Neither Agree nor Disagree 23% 18% 28% 22% 24% 23% 23%
Disagree 8% 6% 9% 8% 8% 7% 8%
Strongly Disagree 3%a 2%a 4% 3%a 3%a 3%a 3%
Table B68: Question 21. All things considered, how do you feel about your overall AmeriCorps service experience?
Response Options ASN NCCC VISTA 2012 2009 2004 Overall
Very Satisfied 55% 69% 43% 49% 52% 66% 56%
Satisfied 33% 24% 38% 37% 33% 25% 32%
Neither Satisfied Nor Dissatisfied 6% 3% 8% 6% 6%a 5% 6%
Dissatisfied 3%a 2% 6%a 4%a 5%a 3%a 4%
Very Dissatisfied 2%a 2% 5% 4%a 4%a 1% 3%

AMERICORPS ALUMNI OUTCOMES SUMMARY REPORT AMERICORPS
nationalservice.gov 101
Table B69: Question 22a. In the last 12 months, how often did you …Participate in community organizations (school, religious, issue-based,
recreational)
Response Options ASN NCCC VISTA 2012 2009 2004 Overall
Basically every day 23% 18% 20% 20% 20% 20% 20%
A few times a week 20% 14% 19% 17% 17% 19% 17%
A few times a month 22% 22% 22% 23% 22% 21% 22%
Once a month 11% 13% 11% 11% 10% 14% 12%
Less than once a month 15% 22% 15% 19% 18% 16% 18%
Not at all 8% 11% 13% 10% 12% 11% 11%
Table B70: Question 22b. In the last 12 months, how often did you …Keep informed about news and public issues
Response Options ASN NCCC VISTA 2012 2009 2004 Overall
Basically every day 56% 47% 65% 53% 57% 60% 56%
A few times a week 23% 36% 24% 29% 28% 26% 28%
A few times a month 17% 9% 7% 12% 9% 9% 10%
Once a month 2%a 5% 2%a 3%a 3%a 3%a 3%
Less than once a month b 2% b 2%a 2% 1% 1%a
Not at all b b b 1% b b 1%a
Table B71: Question 22c. In the last 12 months, how often did you …Help to keep the community safe and clean Response Options ASN NCCC VISTA 2012 2009 2004 Overall
Basically every day 19% 17% 19% 17% 18% 21% 18%
A few times a week 20% 15% 14% 16% 18% 13% 16%
A few times a month 21% 16% 18% 21% 17% 16% 18%
Once a month 9% 12% 11% 9% 11% 12% 11%
Less than once a month 20% 24% 22% 22% 21% 22% 22%
Not at all 11% 16% 16% 14% 15% 16% 15%
Table B72: Question 22d. In the last 12 months, how often did you …Volunteer for a cause or issue that I care about
Response Options ASN NCCC VISTA 2012 2009 2004 Overall
Basically every day 10% 7% 8% 11% 7% 6% 8%
A few times a week 13% 8% 14% 12% 11% 12% 12%
A few times a month 24% 19% 23% 23% 22% 20% 22%
Once a month 13% 18% 14% 15% 16% 15% 15%
Less than once a month 26% 31% 25% 25% 28% 29% 27%
Not at all 14% 16% 17% 14% 16% 18% 16%
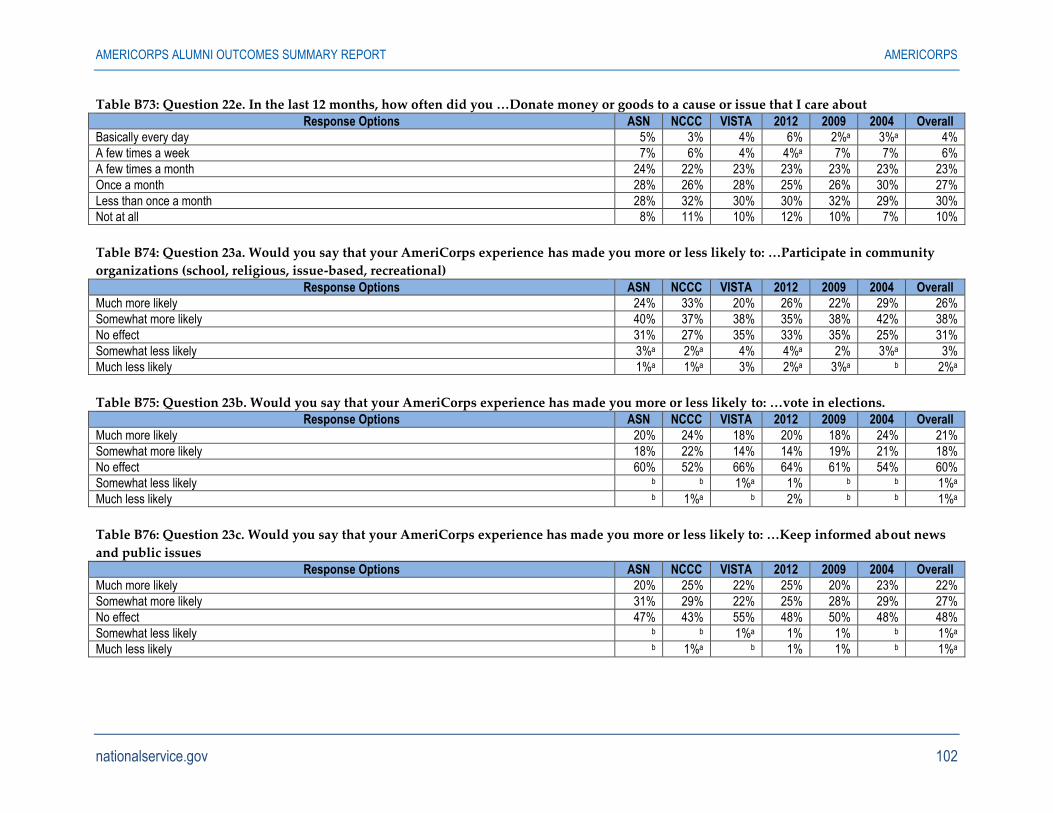
AMERICORPS ALUMNI OUTCOMES SUMMARY REPORT AMERICORPS
nationalservice.gov 102
Table B73: Question 22e. In the last 12 months, how often did you …Donate money or goods to a cause or issue that I care about
Response Options ASN NCCC VISTA 2012 2009 2004 Overall
Basically every day 5% 3% 4% 6% 2%a 3%a 4%
A few times a week 7% 6% 4% 4%a 7% 7% 6%
A few times a month 24% 22% 23% 23% 23% 23% 23%
Once a month 28% 26% 28% 25% 26% 30% 27%
Less than once a month 28% 32% 30% 30% 32% 29% 30%
Not at all 8% 11% 10% 12% 10% 7% 10%
Table B74: Question 23a. Would you say that your AmeriCorps experience has made you more or less likely to: …Participate in community
organizations (school, religious, issue-based, recreational)
Response Options ASN NCCC VISTA 2012 2009 2004 Overall
Much more likely 24% 33% 20% 26% 22% 29% 26%
Somewhat more likely 40% 37% 38% 35% 38% 42% 38%
No effect 31% 27% 35% 33% 35% 25% 31%
Somewhat less likely 3%a 2%a 4% 4%a 2% 3%a 3%
Much less likely 1%a 1%a 3% 2%a 3%a b 2%a
Table B75: Question 23b. Would you say that your AmeriCorps experience has made you more or less likely to: …vote in elections. Response Options ASN NCCC VISTA 2012 2009 2004 Overall
Much more likely 20% 24% 18% 20% 18% 24% 21%
Somewhat more likely 18% 22% 14% 14% 19% 21% 18%
No effect 60% 52% 66% 64% 61% 54% 60%
Somewhat less likely b b 1%a 1% b b 1%a
Much less likely b 1%a b 2% b b 1%a
Table B76: Question 23c. Would you say that your AmeriCorps experience has made you more or less likely to: …Keep informed about news
and public issues Response Options ASN NCCC VISTA 2012 2009 2004 Overall
Much more likely 20% 25% 22% 25% 20% 23% 22%
Somewhat more likely 31% 29% 22% 25% 28% 29% 27%
No effect 47% 43% 55% 48% 50% 48% 48%
Somewhat less likely b b 1%a 1% 1% b 1%a
Much less likely b 1%a b 1% 1% b 1%a

AMERICORPS ALUMNI OUTCOMES SUMMARY REPORT AMERICORPS
nationalservice.gov 103
Table B77: Question 23d. Would you say that your AmeriCorps experience has made you more or less likely to: …Help to keep the community
safe and clean
Response Options ASN NCCC VISTA 2012 2009 2004 Overall
Much more likely 19% 29% 17% 23% 20% 23% 22%
Somewhat more likely 40% 42% 31% 35% 36% 41% 37%
No effect 39% 27% 48% 39% 42% 34% 38%
Somewhat less likely 1%a 1%a 2%a 2%a b 2%a 2%a
Much less likely b 1%a 2%a 2% b 1%a 1%a
Table B78: Question 23e. Would you say that your AmeriCorps experience has made you more or less likely to: …Volunteer for a cause or
issue that I care about Response Options ASN NCCC VISTA 2012 2009 2004 Overall
Much more likely 30% 38% 25% 33% 30% 30% 31%
Somewhat more likely 38% 39% 35% 33% 38% 42% 37%
No effect 28% 21% 34% 30% 28% 25% 28%
Somewhat less likely 2%a 1%a 5% 3%a 3%a 2%a 3%
Much less likely b b 1%a b 2% b 1%a
Table B79: Question 23f. Would you say that your AmeriCorps experience has made you more or less likely to: …Donate money or goods to a
cause or issue that I care about Response Options ASN NCCC VISTA 2012 2009 2004 Overall
Much more likely 21% 24% 18% 23% 18% 21% 21%
Somewhat more likely 35% 36% 34% 29% 35% 41% 35%
No effect 40% 38% 42% 43% 42% 35% 40%
Somewhat less likely 2%a 1%a 3% 3%a 2%a 2% 2%
Much less likely 1%a 1%a 2%a 2%a 3%a b 2%a
Table B80: Question 24a. In the last 12 months, how often did you discuss politics with friends or family? Response Options ASN NCCC VISTA 2012 2009 2004 Overall
Basically every day 19% 13% 20% 17% 16% 18% 17%
A few times a week 36% 28% 37% 34% 34% 33% 34%
A few times a month 22% 32% 25% 26% 26% 27% 26%
Once a month 8% 10% 6% 8% 9% 7% 8%
Less than once a month 10% 13% 9% 10% 11% 10% 10%
Not at all 6% 5% 3% 5%a 5%a 5% 5%
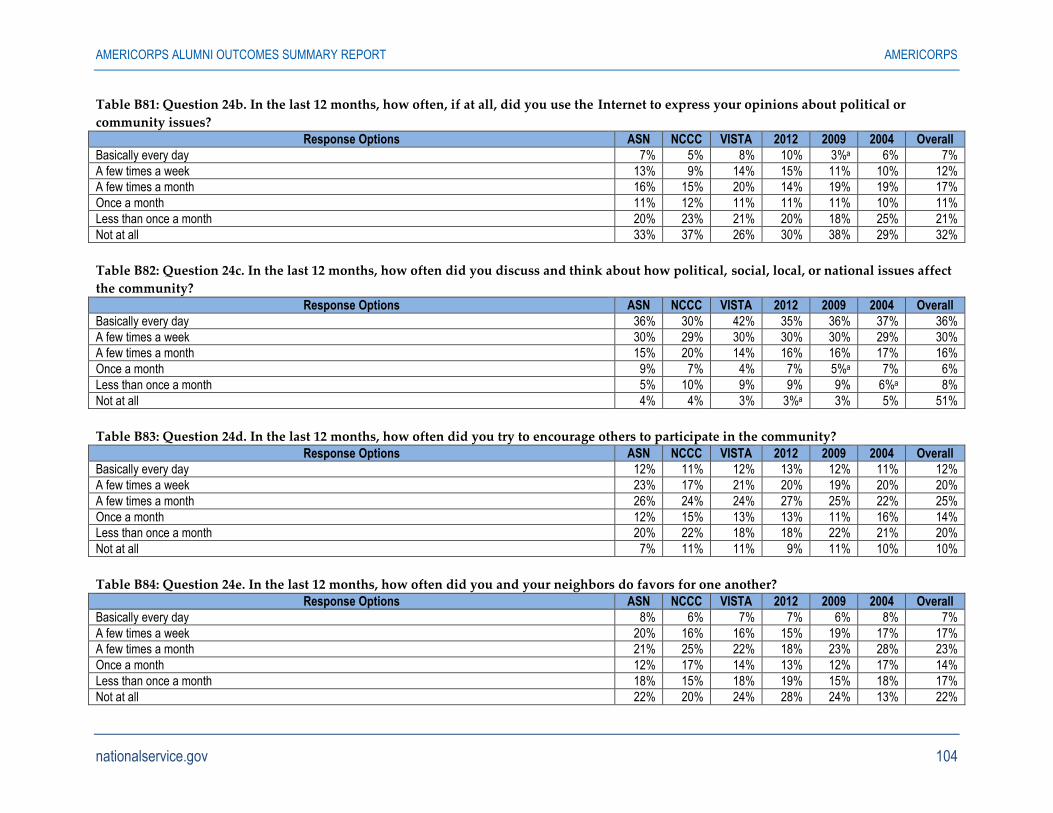
AMERICORPS ALUMNI OUTCOMES SUMMARY REPORT AMERICORPS
nationalservice.gov 104
Table B81: Question 24b. In the last 12 months, how often, if at all, did you use the Internet to express your opinions about political or
community issues?
Response Options ASN NCCC VISTA 2012 2009 2004 Overall
Basically every day 7% 5% 8% 10% 3%a 6% 7%
A few times a week 13% 9% 14% 15% 11% 10% 12%
A few times a month 16% 15% 20% 14% 19% 19% 17%
Once a month 11% 12% 11% 11% 11% 10% 11%
Less than once a month 20% 23% 21% 20% 18% 25% 21%
Not at all 33% 37% 26% 30% 38% 29% 32%
Table B82: Question 24c. In the last 12 months, how often did you discuss and think about how political, social, local, or national issues affect
the community?
Response Options ASN NCCC VISTA 2012 2009 2004 Overall
Basically every day 36% 30% 42% 35% 36% 37% 36%
A few times a week 30% 29% 30% 30% 30% 29% 30%
A few times a month 15% 20% 14% 16% 16% 17% 16%
Once a month 9% 7% 4% 7% 5%a 7% 6%
Less than once a month 5% 10% 9% 9% 9% 6%a 8%
Not at all 4% 4% 3% 3%a 3% 5% 51%
Table B83: Question 24d. In the last 12 months, how often did you try to encourage others to participate in the community?
Response Options ASN NCCC VISTA 2012 2009 2004 Overall
Basically every day 12% 11% 12% 13% 12% 11% 12%
A few times a week 23% 17% 21% 20% 19% 20% 20%
A few times a month 26% 24% 24% 27% 25% 22% 25%
Once a month 12% 15% 13% 13% 11% 16% 14%
Less than once a month 20% 22% 18% 18% 22% 21% 20%
Not at all 7% 11% 11% 9% 11% 10% 10%
Table B84: Question 24e. In the last 12 months, how often did you and your neighbors do favors for one another?
Response Options ASN NCCC VISTA 2012 2009 2004 Overall
Basically every day 8% 6% 7% 7% 6% 8% 7%
A few times a week 20% 16% 16% 15% 19% 17% 17%
A few times a month 21% 25% 22% 18% 23% 28% 23%
Once a month 12% 17% 14% 13% 12% 17% 14%
Less than once a month 18% 15% 18% 19% 15% 18% 17%
Not at all 22% 20% 24% 28% 24% 13% 22%
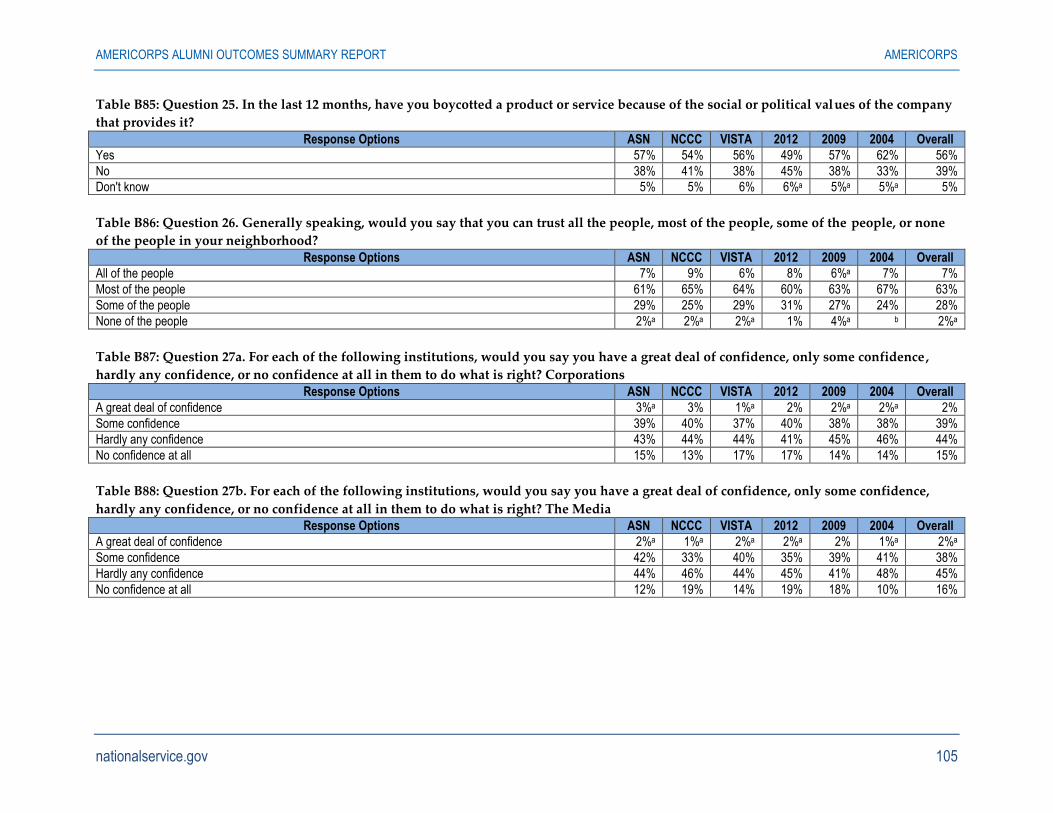
AMERICORPS ALUMNI OUTCOMES SUMMARY REPORT AMERICORPS
nationalservice.gov 105
Table B85: Question 25. In the last 12 months, have you boycotted a product or service because of the social or political values of the company
that provides it?
Response Options ASN NCCC VISTA 2012 2009 2004 Overall
Yes 57% 54% 56% 49% 57% 62% 56%
No 38% 41% 38% 45% 38% 33% 39%
Don't know 5% 5% 6% 6%a 5%a 5%a 5%
Table B86: Question 26. Generally speaking, would you say that you can trust all the people, most of the people, some of the people, or none
of the people in your neighborhood?
Response Options ASN NCCC VISTA 2012 2009 2004 Overall
All of the people 7% 9% 6% 8% 6%a 7% 7%
Most of the people 61% 65% 64% 60% 63% 67% 63%
Some of the people 29% 25% 29% 31% 27% 24% 28%
None of the people 2%a 2%a 2%a 1% 4%a b 2%a
Table B87: Question 27a. For each of the following institutions, would you say you have a great deal of confidence, only some confidence,
hardly any confidence, or no confidence at all in them to do what is right? Corporations
Response Options ASN NCCC VISTA 2012 2009 2004 Overall
A great deal of confidence 3%a 3% 1%a 2% 2%a 2%a 2%
Some confidence 39% 40% 37% 40% 38% 38% 39%
Hardly any confidence 43% 44% 44% 41% 45% 46% 44%
No confidence at all 15% 13% 17% 17% 14% 14% 15%
Table B88: Question 27b. For each of the following institutions, would you say you have a great deal of confidence, only some confidence,
hardly any confidence, or no confidence at all in them to do what is right? The Media Response Options ASN NCCC VISTA 2012 2009 2004 Overall
A great deal of confidence 2%a 1%a 2%a 2%a 2% 1%a 2%a
Some confidence 42% 33% 40% 35% 39% 41% 38%
Hardly any confidence 44% 46% 44% 45% 41% 48% 45%
No confidence at all 12% 19% 14% 19% 18% 10% 16%
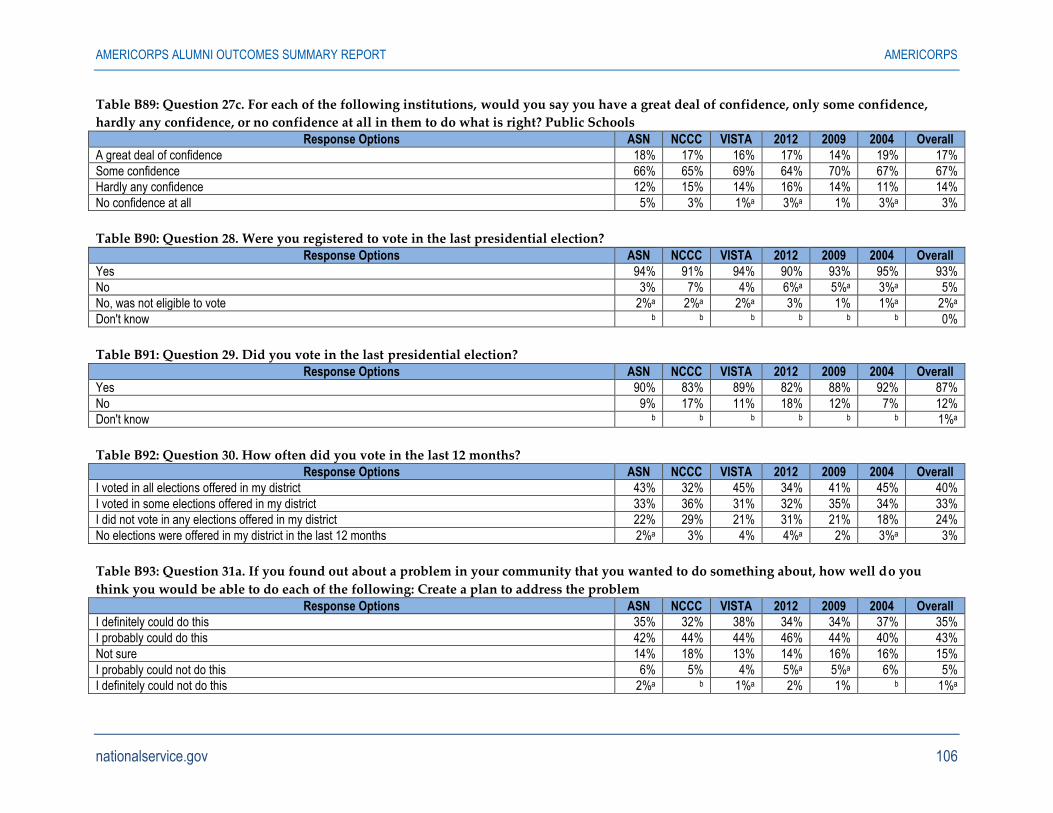
AMERICORPS ALUMNI OUTCOMES SUMMARY REPORT AMERICORPS
nationalservice.gov 106
Table B89: Question 27c. For each of the following institutions, would you say you have a great deal of confidence, only some confidence,
hardly any confidence, or no confidence at all in them to do what is right? Public Schools
Response Options ASN NCCC VISTA 2012 2009 2004 Overall
A great deal of confidence 18% 17% 16% 17% 14% 19% 17%
Some confidence 66% 65% 69% 64% 70% 67% 67%
Hardly any confidence 12% 15% 14% 16% 14% 11% 14%
No confidence at all 5% 3% 1%a 3%a 1% 3%a 3%
Table B90: Question 28. Were you registered to vote in the last presidential election?
Response Options ASN NCCC VISTA 2012 2009 2004 Overall
Yes 94% 91% 94% 90% 93% 95% 93%
No 3% 7% 4% 6%a 5%a 3%a 5%
No, was not eligible to vote 2%a 2%a 2%a 3% 1% 1%a 2%a
Don't know b b b b b b 0%
Table B91: Question 29. Did you vote in the last presidential election?
Response Options ASN NCCC VISTA 2012 2009 2004 Overall
Yes 90% 83% 89% 82% 88% 92% 87%
No 9% 17% 11% 18% 12% 7% 12%
Don't know b b b b b b 1%a
Table B92: Question 30. How often did you vote in the last 12 months? Response Options ASN NCCC VISTA 2012 2009 2004 Overall
I voted in all elections offered in my district 43% 32% 45% 34% 41% 45% 40%
I voted in some elections offered in my district 33% 36% 31% 32% 35% 34% 33%
I did not vote in any elections offered in my district 22% 29% 21% 31% 21% 18% 24%
No elections were offered in my district in the last 12 months 2%a 3% 4% 4%a 2% 3%a 3%
Table B93: Question 31a. If you found out about a problem in your community that you wanted to do something about, how well do you
think you would be able to do each of the following: Create a plan to address the problem
Response Options ASN NCCC VISTA 2012 2009 2004 Overall
I definitely could do this 35% 32% 38% 34% 34% 37% 35%
I probably could do this 42% 44% 44% 46% 44% 40% 43%
Not sure 14% 18% 13% 14% 16% 16% 15%
I probably could not do this 6% 5% 4% 5%a 5%a 6% 5%
I definitely could not do this 2%a b 1%a 2% 1% b 1%a
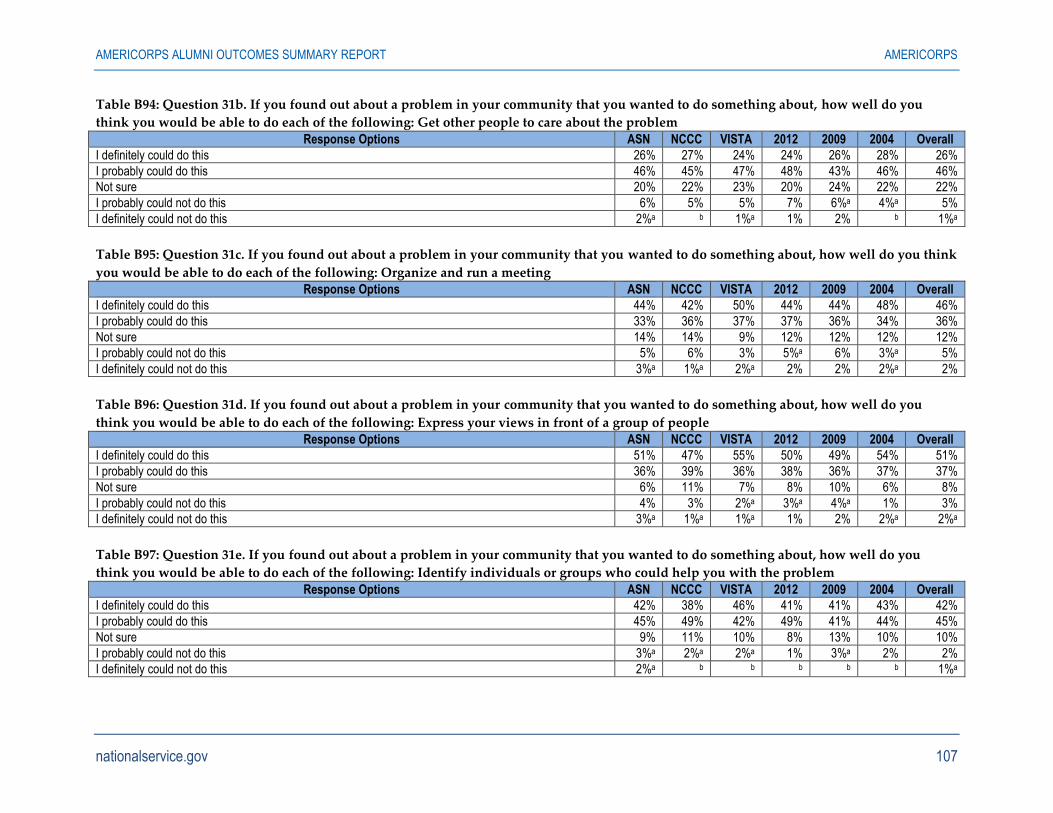
AMERICORPS ALUMNI OUTCOMES SUMMARY REPORT AMERICORPS
nationalservice.gov 107
Table B94: Question 31b. If you found out about a problem in your community that you wanted to do something about, how well do you
think you would be able to do each of the following: Get other people to care about the problem
Response Options ASN NCCC VISTA 2012 2009 2004 Overall
I definitely could do this 26% 27% 24% 24% 26% 28% 26%
I probably could do this 46% 45% 47% 48% 43% 46% 46%
Not sure 20% 22% 23% 20% 24% 22% 22%
I probably could not do this 6% 5% 5% 7% 6%a 4%a 5%
I definitely could not do this 2%a b 1%a 1% 2% b 1%a
Table B95: Question 31c. If you found out about a problem in your community that you wanted to do something about, how well do you think
you would be able to do each of the following: Organize and run a meeting Response Options ASN NCCC VISTA 2012 2009 2004 Overall
I definitely could do this 44% 42% 50% 44% 44% 48% 46%
I probably could do this 33% 36% 37% 37% 36% 34% 36%
Not sure 14% 14% 9% 12% 12% 12% 12%
I probably could not do this 5% 6% 3% 5%a 6% 3%a 5%
I definitely could not do this 3%a 1%a 2%a 2% 2% 2%a 2%
Table B96: Question 31d. If you found out about a problem in your community that you wanted to do something about, how well do you
think you would be able to do each of the following: Express your views in front of a group of people Response Options ASN NCCC VISTA 2012 2009 2004 Overall
I definitely could do this 51% 47% 55% 50% 49% 54% 51%
I probably could do this 36% 39% 36% 38% 36% 37% 37%
Not sure 6% 11% 7% 8% 10% 6% 8%
I probably could not do this 4% 3% 2%a 3%a 4%a 1% 3%
I definitely could not do this 3%a 1%a 1%a 1% 2% 2%a 2%a
Table B97: Question 31e. If you found out about a problem in your community that you wanted to do something about, how well do you
think you would be able to do each of the following: Identify individuals or groups who could help you with the problem
Response Options ASN NCCC VISTA 2012 2009 2004 Overall
I definitely could do this 42% 38% 46% 41% 41% 43% 42%
I probably could do this 45% 49% 42% 49% 41% 44% 45%
Not sure 9% 11% 10% 8% 13% 10% 10%
I probably could not do this 3%a 2%a 2%a 1% 3%a 2% 2%
I definitely could not do this 2%a b b b b b 1%a
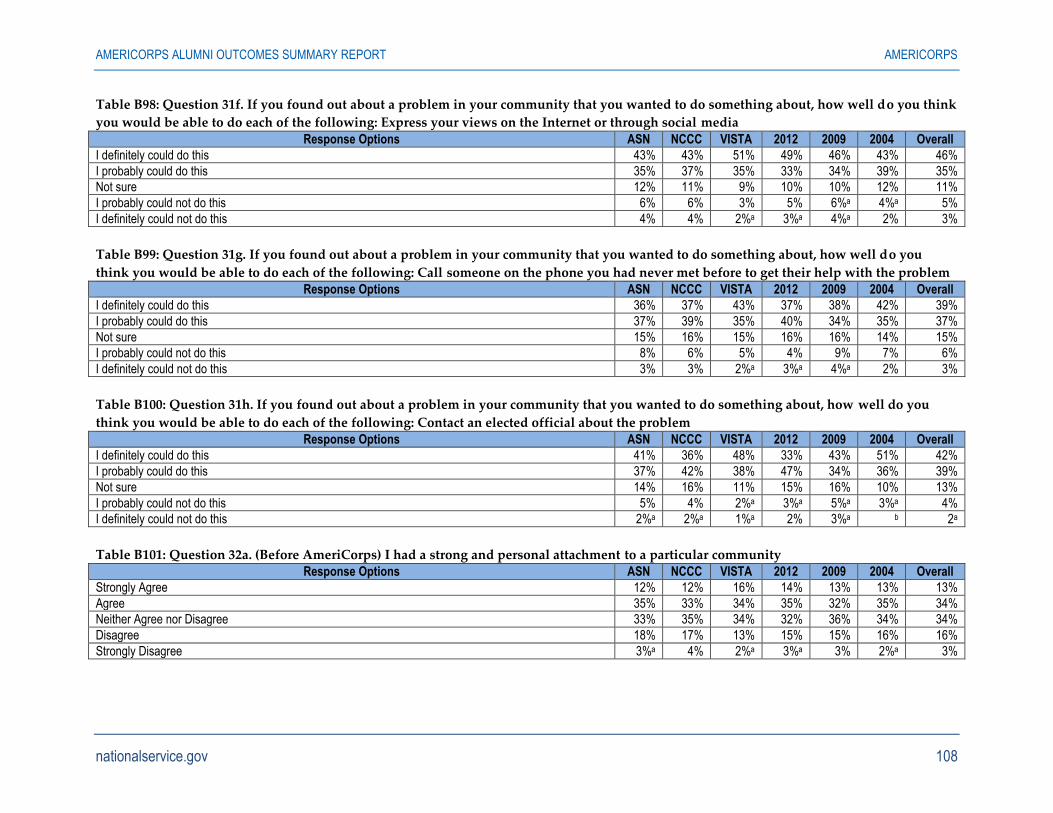
AMERICORPS ALUMNI OUTCOMES SUMMARY REPORT AMERICORPS
nationalservice.gov 108
Table B98: Question 31f. If you found out about a problem in your community that you wanted to do something about, how well do you think
you would be able to do each of the following: Express your views on the Internet or through social media
Response Options ASN NCCC VISTA 2012 2009 2004 Overall
I definitely could do this 43% 43% 51% 49% 46% 43% 46%
I probably could do this 35% 37% 35% 33% 34% 39% 35%
Not sure 12% 11% 9% 10% 10% 12% 11%
I probably could not do this 6% 6% 3% 5% 6%a 4%a 5%
I definitely could not do this 4% 4% 2%a 3%a 4%a 2% 3%
Table B99: Question 31g. If you found out about a problem in your community that you wanted to do something about, how well do you
think you would be able to do each of the following: Call someone on the phone you had never met before to get their help with the problem Response Options ASN NCCC VISTA 2012 2009 2004 Overall
I definitely could do this 36% 37% 43% 37% 38% 42% 39%
I probably could do this 37% 39% 35% 40% 34% 35% 37%
Not sure 15% 16% 15% 16% 16% 14% 15%
I probably could not do this 8% 6% 5% 4% 9% 7% 6%
I definitely could not do this 3% 3% 2%a 3%a 4%a 2% 3%
Table B100: Question 31h. If you found out about a problem in your community that you wanted to do something about, how well do you
think you would be able to do each of the following: Contact an elected official about the problem Response Options ASN NCCC VISTA 2012 2009 2004 Overall
I definitely could do this 41% 36% 48% 33% 43% 51% 42%
I probably could do this 37% 42% 38% 47% 34% 36% 39%
Not sure 14% 16% 11% 15% 16% 10% 13%
I probably could not do this 5% 4% 2%a 3%a 5%a 3%a 4%
I definitely could not do this 2%a 2%a 1%a 2% 3%a b 2a
Table B101: Question 32a. (Before AmeriCorps) I had a strong and personal attachment to a particular community Response Options ASN NCCC VISTA 2012 2009 2004 Overall
Strongly Agree 12% 12% 16% 14% 13% 13% 13%
Agree 35% 33% 34% 35% 32% 35% 34%
Neither Agree nor Disagree 33% 35% 34% 32% 36% 34% 34%
Disagree 18% 17% 13% 15% 15% 16% 16%
Strongly Disagree 3%a 4% 2%a 3%a 3% 2%a 3%
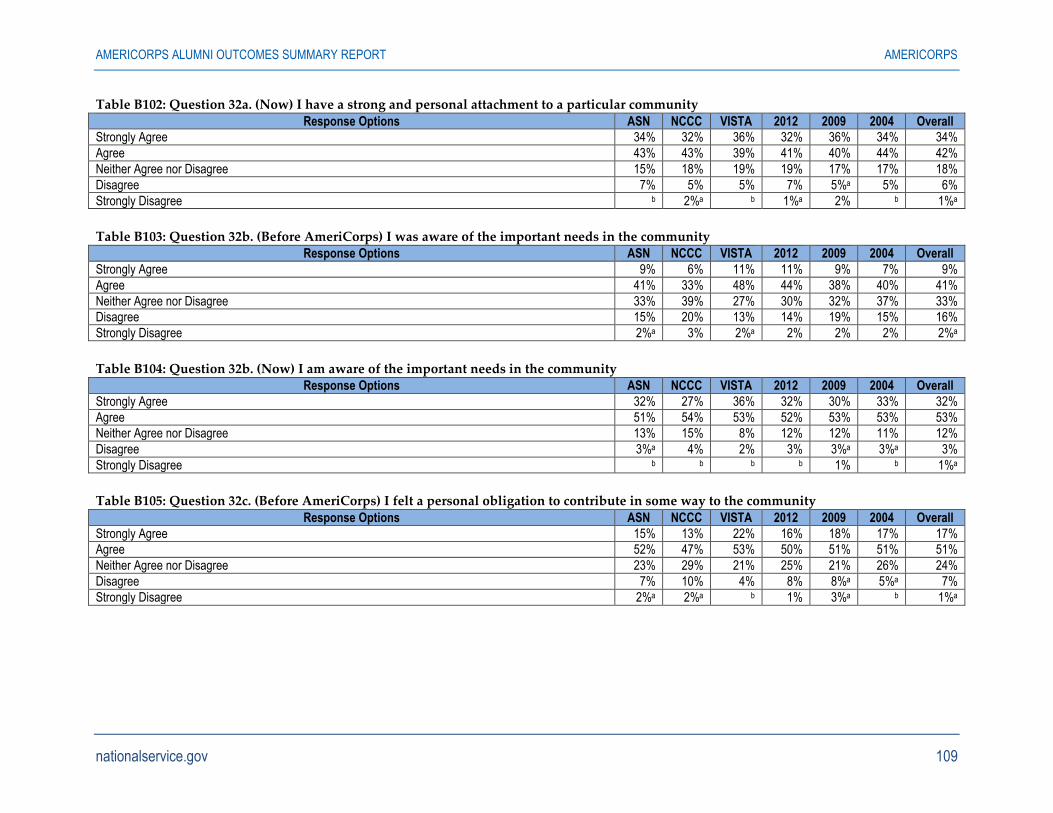
AMERICORPS ALUMNI OUTCOMES SUMMARY REPORT AMERICORPS
nationalservice.gov 109
Table B102: Question 32a. (Now) I have a strong and personal attachment to a particular community
Response Options ASN NCCC VISTA 2012 2009 2004 Overall
Strongly Agree 34% 32% 36% 32% 36% 34% 34%
Agree 43% 43% 39% 41% 40% 44% 42%
Neither Agree nor Disagree 15% 18% 19% 19% 17% 17% 18%
Disagree 7% 5% 5% 7% 5%a 5% 6%
Strongly Disagree b 2%a b 1%a 2% b 1%a
Table B103: Question 32b. (Before AmeriCorps) I was aware of the important needs in the community Response Options ASN NCCC VISTA 2012 2009 2004 Overall
Strongly Agree 9% 6% 11% 11% 9% 7% 9%
Agree 41% 33% 48% 44% 38% 40% 41%
Neither Agree nor Disagree 33% 39% 27% 30% 32% 37% 33%
Disagree 15% 20% 13% 14% 19% 15% 16%
Strongly Disagree 2%a 3% 2%a 2% 2% 2% 2%a
Table B104: Question 32b. (Now) I am aware of the important needs in the community Response Options ASN NCCC VISTA 2012 2009 2004 Overall
Strongly Agree 32% 27% 36% 32% 30% 33% 32%
Agree 51% 54% 53% 52% 53% 53% 53%
Neither Agree nor Disagree 13% 15% 8% 12% 12% 11% 12%
Disagree 3%a 4% 2% 3% 3%a 3%a 3%
Strongly Disagree b b b b 1% b 1%a
Table B105: Question 32c. (Before AmeriCorps) I felt a personal obligation to contribute in some way to the community
Response Options ASN NCCC VISTA 2012 2009 2004 Overall
Strongly Agree 15% 13% 22% 16% 18% 17% 17%
Agree 52% 47% 53% 50% 51% 51% 51%
Neither Agree nor Disagree 23% 29% 21% 25% 21% 26% 24%
Disagree 7% 10% 4% 8% 8%a 5%a 7%
Strongly Disagree 2%a 2%a b 1% 3%a b 1%a
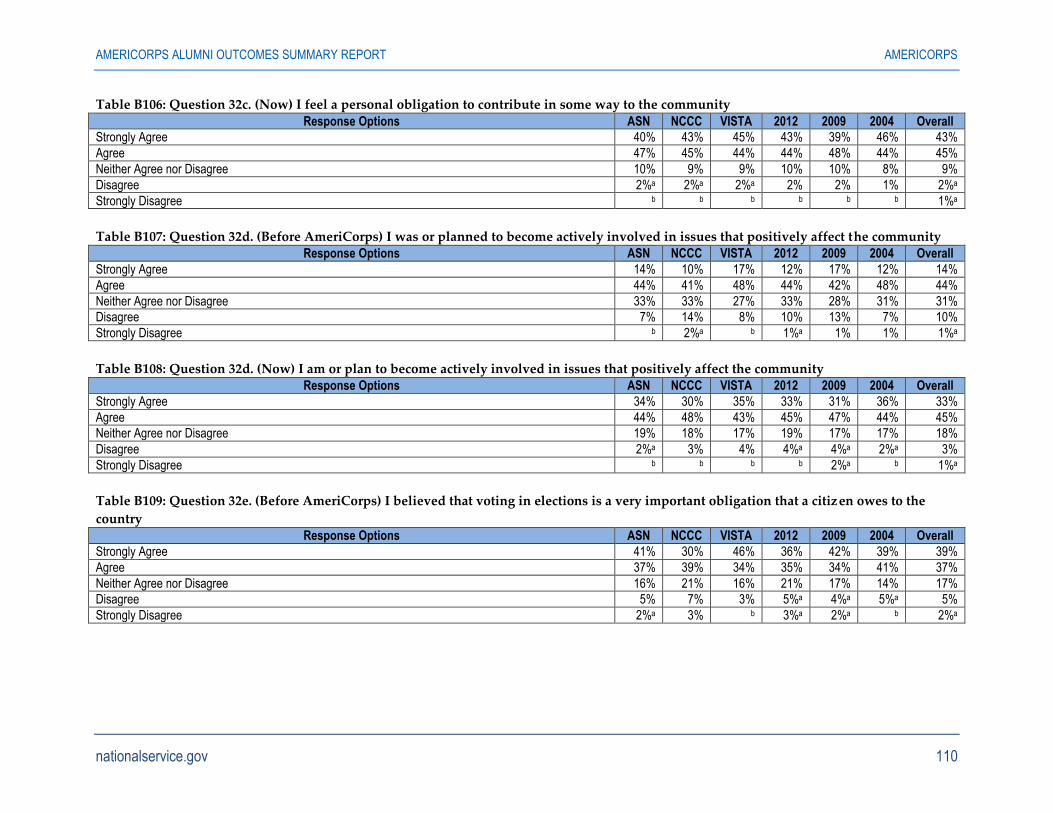
AMERICORPS ALUMNI OUTCOMES SUMMARY REPORT AMERICORPS
nationalservice.gov 110
Table B106: Question 32c. (Now) I feel a personal obligation to contribute in some way to the community
Response Options ASN NCCC VISTA 2012 2009 2004 Overall
Strongly Agree 40% 43% 45% 43% 39% 46% 43%
Agree 47% 45% 44% 44% 48% 44% 45%
Neither Agree nor Disagree 10% 9% 9% 10% 10% 8% 9%
Disagree 2%a 2%a 2%a 2% 2% 1% 2%a
Strongly Disagree b b b b b b 1%a
Table B107: Question 32d. (Before AmeriCorps) I was or planned to become actively involved in issues that positively affect the community Response Options ASN NCCC VISTA 2012 2009 2004 Overall
Strongly Agree 14% 10% 17% 12% 17% 12% 14%
Agree 44% 41% 48% 44% 42% 48% 44%
Neither Agree nor Disagree 33% 33% 27% 33% 28% 31% 31%
Disagree 7% 14% 8% 10% 13% 7% 10%
Strongly Disagree b 2%a b 1%a 1% 1% 1%a
Table B108: Question 32d. (Now) I am or plan to become actively involved in issues that positively affect the community Response Options ASN NCCC VISTA 2012 2009 2004 Overall
Strongly Agree 34% 30% 35% 33% 31% 36% 33%
Agree 44% 48% 43% 45% 47% 44% 45%
Neither Agree nor Disagree 19% 18% 17% 19% 17% 17% 18%
Disagree 2%a 3% 4% 4%a 4%a 2%a 3%
Strongly Disagree b b b b 2%a b 1%a
Table B109: Question 32e. (Before AmeriCorps) I believed that voting in elections is a very important obligation that a citizen owes to the
country Response Options ASN NCCC VISTA 2012 2009 2004 Overall
Strongly Agree 41% 30% 46% 36% 42% 39% 39%
Agree 37% 39% 34% 35% 34% 41% 37%
Neither Agree nor Disagree 16% 21% 16% 21% 17% 14% 17%
Disagree 5% 7% 3% 5%a 4%a 5%a 5%
Strongly Disagree 2%a 3% b 3%a 2%a b 2%a
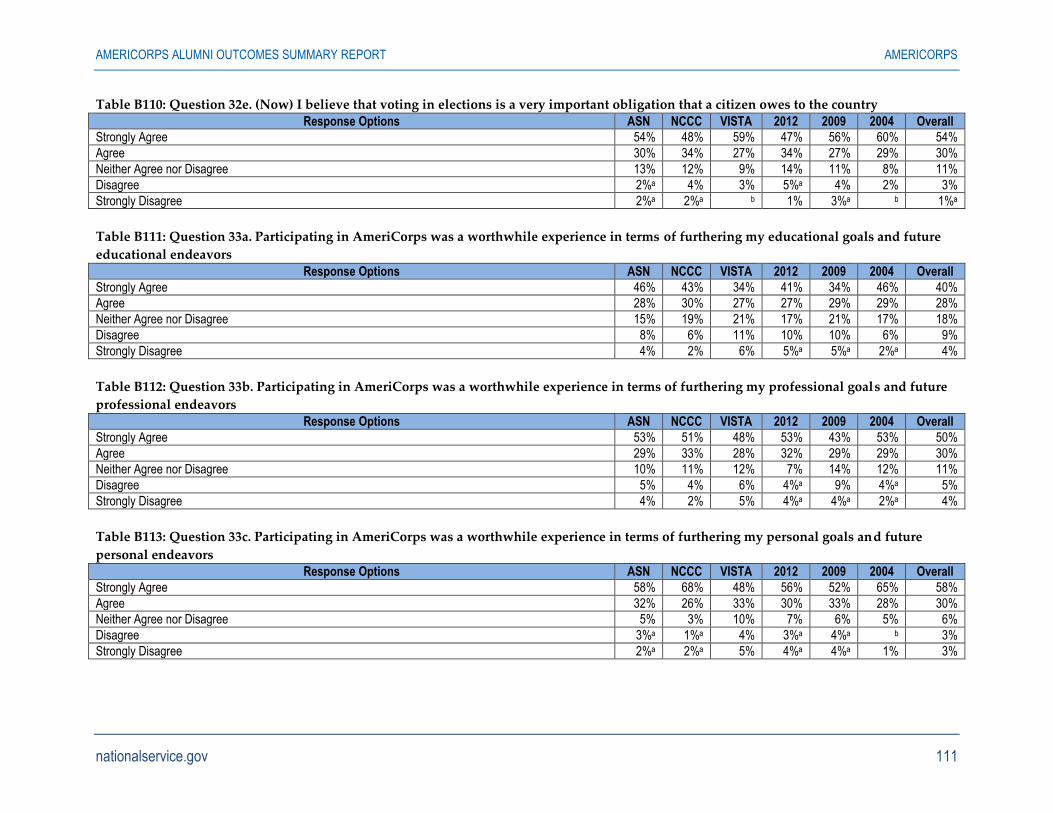
AMERICORPS ALUMNI OUTCOMES SUMMARY REPORT AMERICORPS
nationalservice.gov 111
Table B110: Question 32e. (Now) I believe that voting in elections is a very important obligation that a citizen owes to the country
Response Options ASN NCCC VISTA 2012 2009 2004 Overall
Strongly Agree 54% 48% 59% 47% 56% 60% 54%
Agree 30% 34% 27% 34% 27% 29% 30%
Neither Agree nor Disagree 13% 12% 9% 14% 11% 8% 11%
Disagree 2%a 4% 3% 5%a 4% 2% 3%
Strongly Disagree 2%a 2%a b 1% 3%a b 1%a
Table B111: Question 33a. Participating in AmeriCorps was a worthwhile experience in terms of furthering my educational goals and future
educational endeavors
Response Options ASN NCCC VISTA 2012 2009 2004 Overall
Strongly Agree 46% 43% 34% 41% 34% 46% 40%
Agree 28% 30% 27% 27% 29% 29% 28%
Neither Agree nor Disagree 15% 19% 21% 17% 21% 17% 18%
Disagree 8% 6% 11% 10% 10% 6% 9%
Strongly Disagree 4% 2% 6% 5%a 5%a 2%a 4%
Table B112: Question 33b. Participating in AmeriCorps was a worthwhile experience in terms of furthering my professional goals and future
professional endeavors
Response Options ASN NCCC VISTA 2012 2009 2004 Overall
Strongly Agree 53% 51% 48% 53% 43% 53% 50%
Agree 29% 33% 28% 32% 29% 29% 30%
Neither Agree nor Disagree 10% 11% 12% 7% 14% 12% 11%
Disagree 5% 4% 6% 4%a 9% 4%a 5%
Strongly Disagree 4% 2% 5% 4%a 4%a 2%a 4%
Table B113: Question 33c. Participating in AmeriCorps was a worthwhile experience in terms of furthering my personal goals and future
personal endeavors Response Options ASN NCCC VISTA 2012 2009 2004 Overall
Strongly Agree 58% 68% 48% 56% 52% 65% 58%
Agree 32% 26% 33% 30% 33% 28% 30%
Neither Agree nor Disagree 5% 3% 10% 7% 6% 5% 6%
Disagree 3%a 1%a 4% 3%a 4%a b 3%
Strongly Disagree 2%a 2%a 5% 4%a 4%a 1% 3%
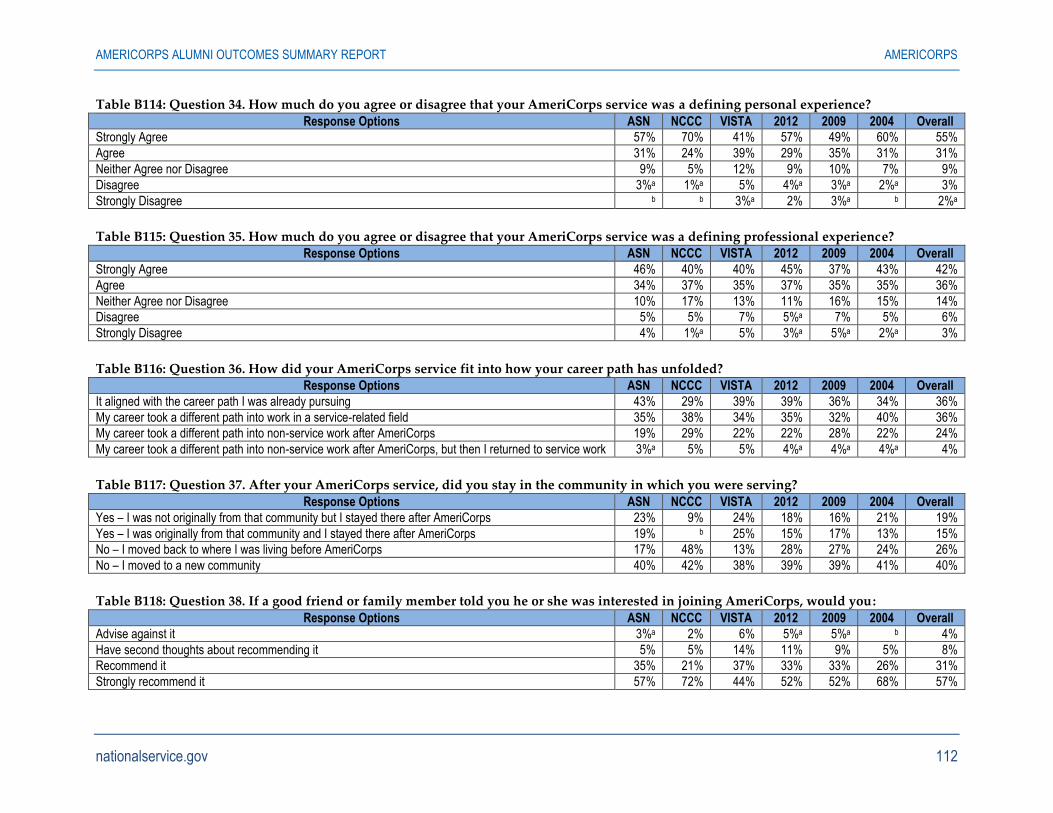
AMERICORPS ALUMNI OUTCOMES SUMMARY REPORT AMERICORPS
nationalservice.gov 112
Table B114: Question 34. How much do you agree or disagree that your AmeriCorps service was a defining personal experience?
Response Options ASN NCCC VISTA 2012 2009 2004 Overall
Strongly Agree 57% 70% 41% 57% 49% 60% 55%
Agree 31% 24% 39% 29% 35% 31% 31%
Neither Agree nor Disagree 9% 5% 12% 9% 10% 7% 9%
Disagree 3%a 1%a 5% 4%a 3%a 2%a 3%
Strongly Disagree b b 3%a 2% 3%a b 2%a
Table B115: Question 35. How much do you agree or disagree that your AmeriCorps service was a defining professional experience? Response Options ASN NCCC VISTA 2012 2009 2004 Overall
Strongly Agree 46% 40% 40% 45% 37% 43% 42%
Agree 34% 37% 35% 37% 35% 35% 36%
Neither Agree nor Disagree 10% 17% 13% 11% 16% 15% 14%
Disagree 5% 5% 7% 5%a 7% 5% 6%
Strongly Disagree 4% 1%a 5% 3%a 5%a 2%a 3%
Table B116: Question 36. How did your AmeriCorps service fit into how your career path has unfolded? Response Options ASN NCCC VISTA 2012 2009 2004 Overall
It aligned with the career path I was already pursuing 43% 29% 39% 39% 36% 34% 36%
My career took a different path into work in a service-related field 35% 38% 34% 35% 32% 40% 36%
My career took a different path into non-service work after AmeriCorps 19% 29% 22% 22% 28% 22% 24%
My career took a different path into non-service work after AmeriCorps, but then I returned to service work 3%a 5% 5% 4%a 4%a 4%a 4%
Table B117: Question 37. After your AmeriCorps service, did you stay in the community in which you were serving?
Response Options ASN NCCC VISTA 2012 2009 2004 Overall
Yes – I was not originally from that community but I stayed there after AmeriCorps 23% 9% 24% 18% 16% 21% 19%
Yes – I was originally from that community and I stayed there after AmeriCorps 19% b 25% 15% 17% 13% 15%
No – I moved back to where I was living before AmeriCorps 17% 48% 13% 28% 27% 24% 26%
No – I moved to a new community 40% 42% 38% 39% 39% 41% 40%
Table B118: Question 38. If a good friend or family member told you he or she was interested in joining AmeriCorps, would you:
Response Options ASN NCCC VISTA 2012 2009 2004 Overall
Advise against it 3%a 2% 6% 5%a 5%a b 4%
Have second thoughts about recommending it 5% 5% 14% 11% 9% 5% 8%
Recommend it 35% 21% 37% 33% 33% 26% 31%
Strongly recommend it 57% 72% 44% 52% 52% 68% 57%
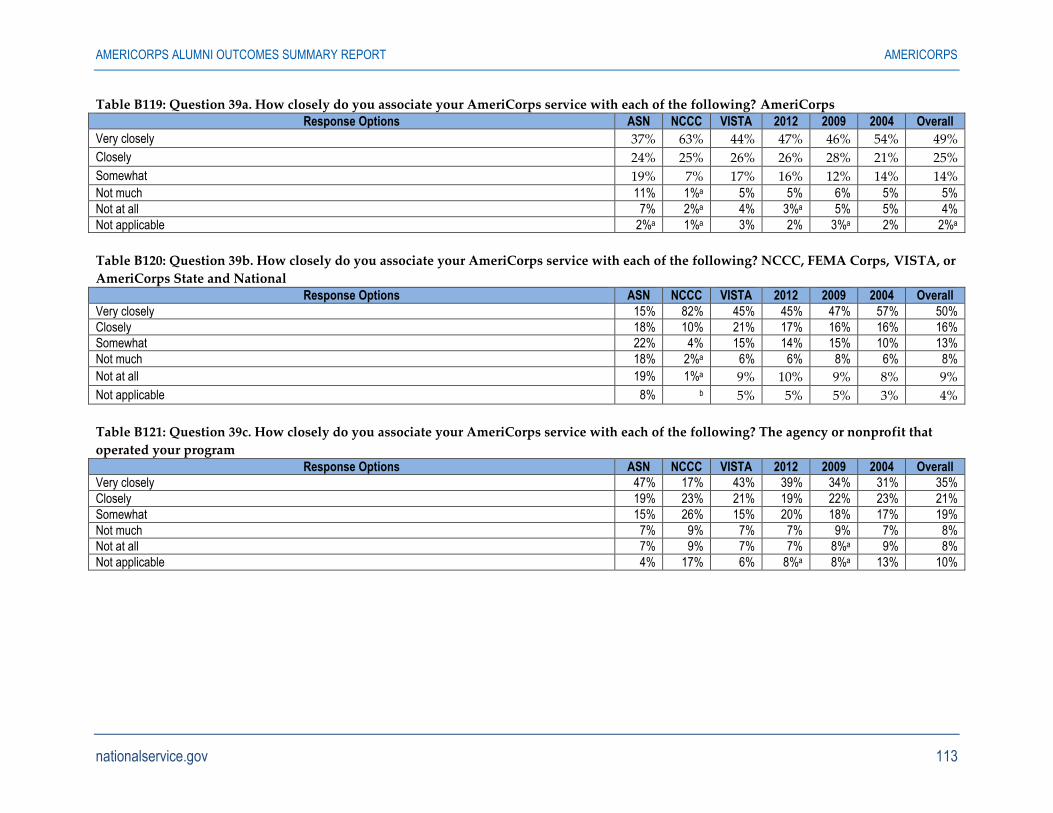
AMERICORPS ALUMNI OUTCOMES SUMMARY REPORT AMERICORPS
nationalservice.gov 113
Table B119: Question 39a. How closely do you associate your AmeriCorps service with each of the following? AmeriCorps
Response Options ASN NCCC VISTA 2012 2009 2004 Overall
Very closely 37% 63% 44% 47% 46% 54% 49%
Closely 24% 25% 26% 26% 28% 21% 25%
Somewhat 19% 7% 17% 16% 12% 14% 14% Not much 11% 1%a 5% 5% 6% 5% 5%
Not at all 7% 2%a 4% 3%a 5% 5% 4%
Not applicable 2%a 1%a 3% 2% 3%a 2% 2%a
Table B120: Question 39b. How closely do you associate your AmeriCorps service with each of the following? NCCC, FEMA Corps, VISTA, or
AmeriCorps State and National
Response Options ASN NCCC VISTA 2012 2009 2004 Overall
Very closely 15% 82% 45% 45% 47% 57% 50%
Closely 18% 10% 21% 17% 16% 16% 16%
Somewhat 22% 4% 15% 14% 15% 10% 13%
Not much 18% 2%a 6% 6% 8% 6% 8%
Not at all 19% 1%a 9% 10% 9% 8% 9%
Not applicable 8% b 5% 5% 5% 3% 4%
Table B121: Question 39c. How closely do you associate your AmeriCorps service with each of the following? The agency or nonprofit that
operated your program
Response Options ASN NCCC VISTA 2012 2009 2004 Overall
Very closely 47% 17% 43% 39% 34% 31% 35%
Closely 19% 23% 21% 19% 22% 23% 21%
Somewhat 15% 26% 15% 20% 18% 17% 19%
Not much 7% 9% 7% 7% 9% 7% 8%
Not at all 7% 9% 7% 7% 8%a 9% 8%
Not applicable 4% 17% 6% 8%a 8%a 13% 10%
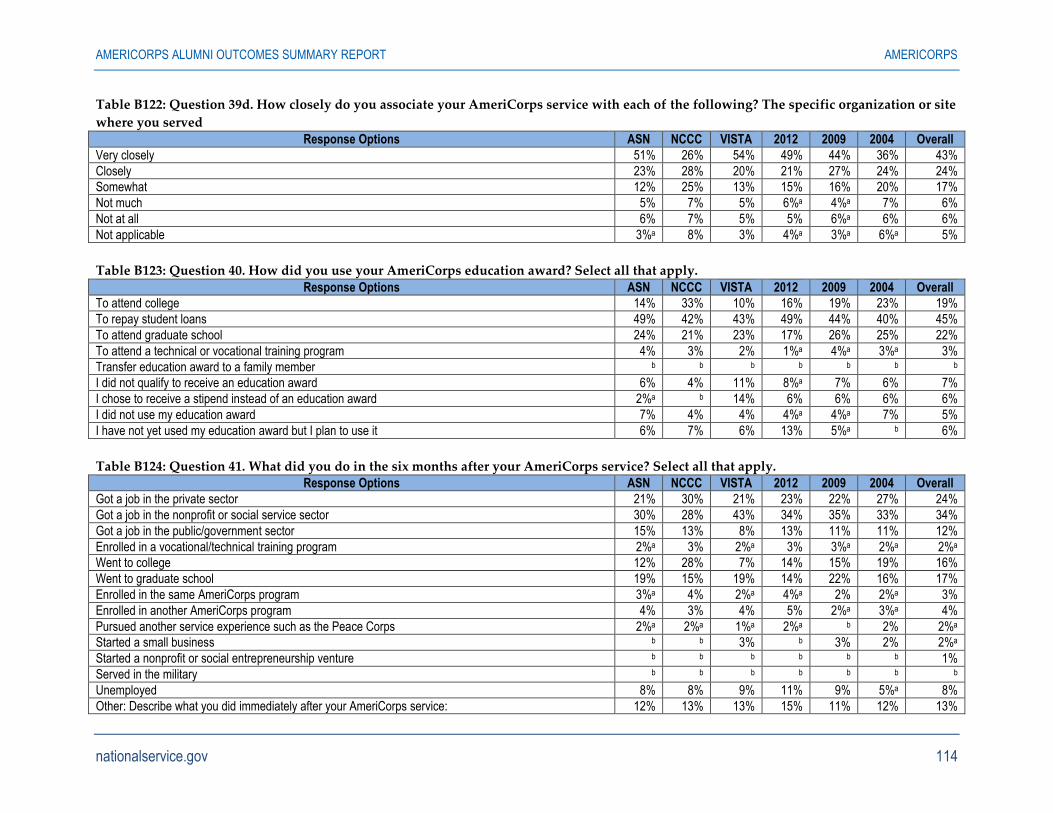
AMERICORPS ALUMNI OUTCOMES SUMMARY REPORT AMERICORPS
nationalservice.gov 114
Table B122: Question 39d. How closely do you associate your AmeriCorps service with each of the following? The specific organization or site
where you served
Response Options ASN NCCC VISTA 2012 2009 2004 Overall
Very closely 51% 26% 54% 49% 44% 36% 43%
Closely 23% 28% 20% 21% 27% 24% 24%
Somewhat 12% 25% 13% 15% 16% 20% 17%
Not much 5% 7% 5% 6%a 4%a 7% 6%
Not at all 6% 7% 5% 5% 6%a 6% 6%
Not applicable 3%a 8% 3% 4%a 3%a 6%a 5%
Table B123: Question 40. How did you use your AmeriCorps education award? Select all that apply.
Response Options ASN NCCC VISTA 2012 2009 2004 Overall
To attend college 14% 33% 10% 16% 19% 23% 19%
To repay student loans 49% 42% 43% 49% 44% 40% 45%
To attend graduate school 24% 21% 23% 17% 26% 25% 22%
To attend a technical or vocational training program 4% 3% 2% 1%a 4%a 3%a 3%
Transfer education award to a family member b b b b b b b
I did not qualify to receive an education award 6% 4% 11% 8%a 7% 6% 7%
I chose to receive a stipend instead of an education award 2%a b 14% 6% 6% 6% 6%
I did not use my education award 7% 4% 4% 4%a 4%a 7% 5%
I have not yet used my education award but I plan to use it 6% 7% 6% 13% 5%a b 6%
Table B124: Question 41. What did you do in the six months after your AmeriCorps service? Select all that apply. Response Options ASN NCCC VISTA 2012 2009 2004 Overall
Got a job in the private sector 21% 30% 21% 23% 22% 27% 24%
Got a job in the nonprofit or social service sector 30% 28% 43% 34% 35% 33% 34%
Got a job in the public/government sector 15% 13% 8% 13% 11% 11% 12%
Enrolled in a vocational/technical training program 2%a 3% 2%a 3% 3%a 2%a 2%a
Went to college 12% 28% 7% 14% 15% 19% 16%
Went to graduate school 19% 15% 19% 14% 22% 16% 17%
Enrolled in the same AmeriCorps program 3%a 4% 2%a 4%a 2% 2%a 3%
Enrolled in another AmeriCorps program 4% 3% 4% 5% 2%a 3%a 4%
Pursued another service experience such as the Peace Corps 2%a 2%a 1%a 2%a b 2% 2%a
Started a small business b b 3% b 3% 2% 2%a
Started a nonprofit or social entrepreneurship venture b b b b b b 1%
Served in the military b b b b b b b
Unemployed 8% 8% 9% 11% 9% 5%a 8%
Other: Describe what you did immediately after your AmeriCorps service: 12% 13% 13% 15% 11% 12% 13%
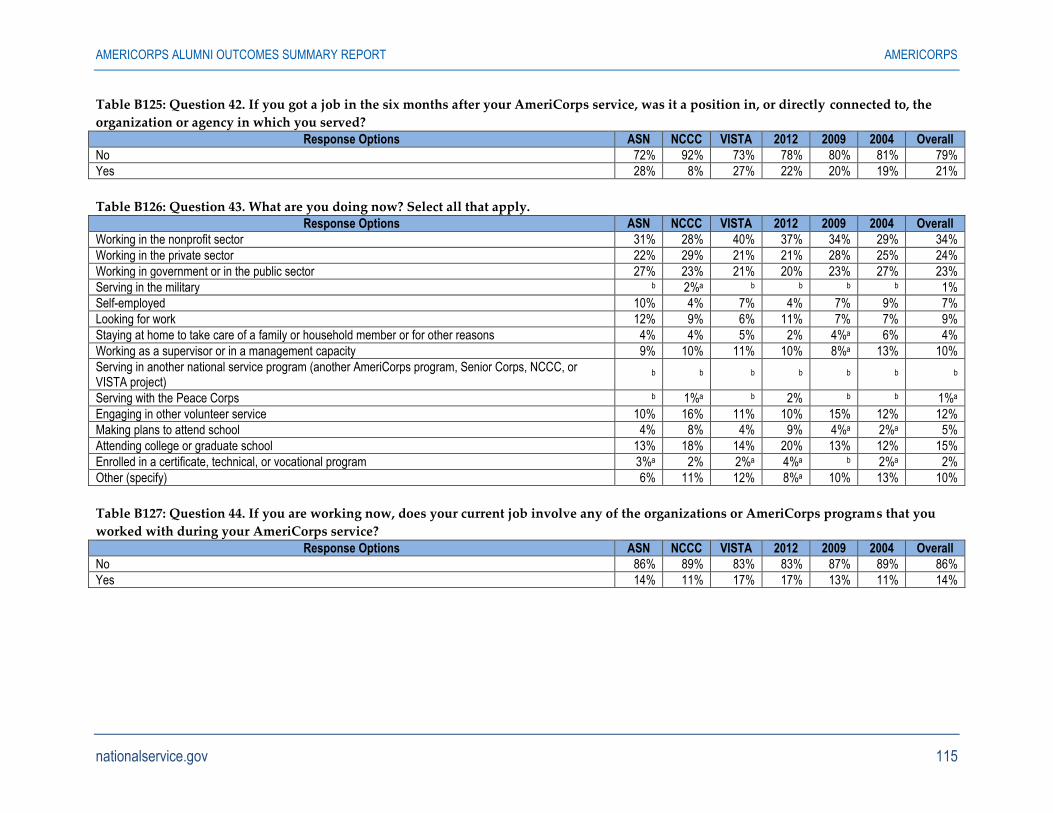
AMERICORPS ALUMNI OUTCOMES SUMMARY REPORT AMERICORPS
nationalservice.gov 115
Table B125: Question 42. If you got a job in the six months after your AmeriCorps service, was it a position in, or directly connected to, the
organization or agency in which you served?
Response Options ASN NCCC VISTA 2012 2009 2004 Overall
No 72% 92% 73% 78% 80% 81% 79%
Yes 28% 8% 27% 22% 20% 19% 21%
Table B126: Question 43. What are you doing now? Select all that apply. Response Options ASN NCCC VISTA 2012 2009 2004 Overall
Working in the nonprofit sector 31% 28% 40% 37% 34% 29% 34%
Working in the private sector 22% 29% 21% 21% 28% 25% 24%
Working in government or in the public sector 27% 23% 21% 20% 23% 27% 23%
Serving in the military b 2%a b b b b 1%
Self-employed 10% 4% 7% 4% 7% 9% 7%
Looking for work 12% 9% 6% 11% 7% 7% 9%
Staying at home to take care of a family or household member or for other reasons 4% 4% 5% 2% 4%a 6% 4%
Working as a supervisor or in a management capacity 9% 10% 11% 10% 8%a 13% 10%
Serving in another national service program (another AmeriCorps program, Senior Corps, NCCC, or VISTA project)
b b b b b b b
Serving with the Peace Corps b 1%a b 2% b b 1%a
Engaging in other volunteer service 10% 16% 11% 10% 15% 12% 12%
Making plans to attend school 4% 8% 4% 9% 4%a 2%a 5%
Attending college or graduate school 13% 18% 14% 20% 13% 12% 15%
Enrolled in a certificate, technical, or vocational program 3%a 2% 2%a 4%a b 2%a 2%
Other (specify) 6% 11% 12% 8%a 10% 13% 10%
Table B127: Question 44. If you are working now, does your current job involve any of the organizations or AmeriCorps programs that you
worked with during your AmeriCorps service?
Response Options ASN NCCC VISTA 2012 2009 2004 Overall
No 86% 89% 83% 83% 87% 89% 86%
Yes 14% 11% 17% 17% 13% 11% 14%
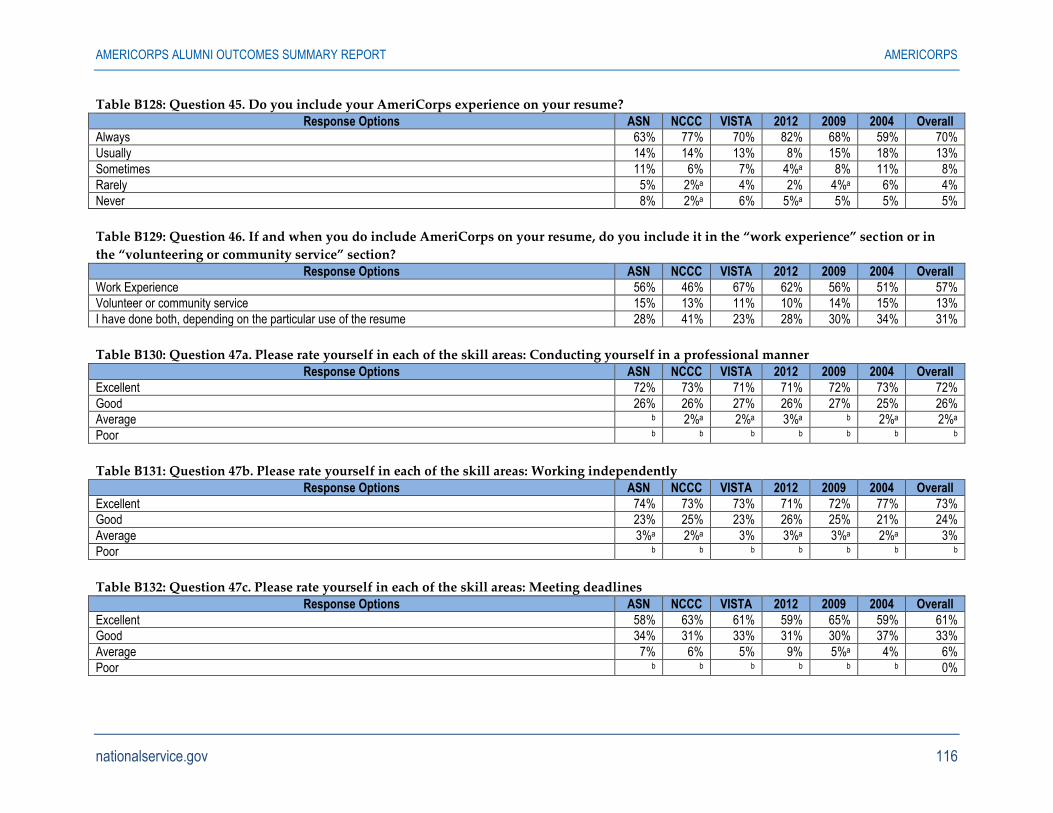
AMERICORPS ALUMNI OUTCOMES SUMMARY REPORT AMERICORPS
nationalservice.gov 116
Table B128: Question 45. Do you include your AmeriCorps experience on your resume?
Response Options ASN NCCC VISTA 2012 2009 2004 Overall
Always 63% 77% 70% 82% 68% 59% 70%
Usually 14% 14% 13% 8% 15% 18% 13%
Sometimes 11% 6% 7% 4%a 8% 11% 8%
Rarely 5% 2%a 4% 2% 4%a 6% 4%
Never 8% 2%a 6% 5%a 5% 5% 5%
Table B129: Question 46. If and when you do include AmeriCorps on your resume, do you include it in the “work experience” section or in
the “volunteering or community service” section?
Response Options ASN NCCC VISTA 2012 2009 2004 Overall
Work Experience 56% 46% 67% 62% 56% 51% 57%
Volunteer or community service 15% 13% 11% 10% 14% 15% 13%
I have done both, depending on the particular use of the resume 28% 41% 23% 28% 30% 34% 31%
Table B130: Question 47a. Please rate yourself in each of the skill areas: Conducting yourself in a professional manner
Response Options ASN NCCC VISTA 2012 2009 2004 Overall
Excellent 72% 73% 71% 71% 72% 73% 72%
Good 26% 26% 27% 26% 27% 25% 26%
Average b 2%a 2%a 3%a b 2%a 2%a
Poor b b b b b b b
Table B131: Question 47b. Please rate yourself in each of the skill areas: Working independently
Response Options ASN NCCC VISTA 2012 2009 2004 Overall
Excellent 74% 73% 73% 71% 72% 77% 73%
Good 23% 25% 23% 26% 25% 21% 24%
Average 3%a 2%a 3% 3%a 3%a 2%a 3%
Poor b b b b b b b
Table B132: Question 47c. Please rate yourself in each of the skill areas: Meeting deadlines
Response Options ASN NCCC VISTA 2012 2009 2004 Overall
Excellent 58% 63% 61% 59% 65% 59% 61%
Good 34% 31% 33% 31% 30% 37% 33%
Average 7% 6% 5% 9% 5%a 4% 6%
Poor b b b b b b 0%
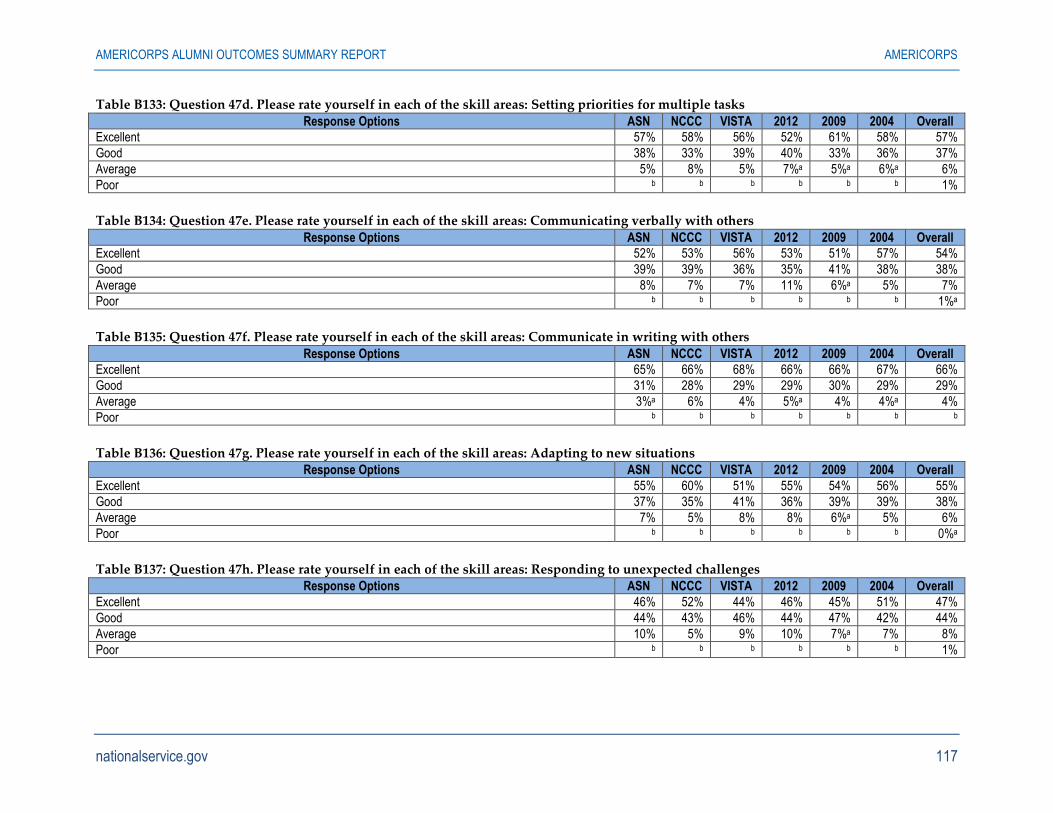
AMERICORPS ALUMNI OUTCOMES SUMMARY REPORT AMERICORPS
nationalservice.gov 117
Table B133: Question 47d. Please rate yourself in each of the skill areas: Setting priorities for multiple tasks
Response Options ASN NCCC VISTA 2012 2009 2004 Overall
Excellent 57% 58% 56% 52% 61% 58% 57%
Good 38% 33% 39% 40% 33% 36% 37%
Average 5% 8% 5% 7%a 5%a 6%a 6%
Poor b b b b b b 1%
Table B134: Question 47e. Please rate yourself in each of the skill areas: Communicating verbally with others
Response Options ASN NCCC VISTA 2012 2009 2004 Overall
Excellent 52% 53% 56% 53% 51% 57% 54%
Good 39% 39% 36% 35% 41% 38% 38%
Average 8% 7% 7% 11% 6%a 5% 7%
Poor b b b b b b 1%a
Table B135: Question 47f. Please rate yourself in each of the skill areas: Communicate in writing with others
Response Options ASN NCCC VISTA 2012 2009 2004 Overall
Excellent 65% 66% 68% 66% 66% 67% 66%
Good 31% 28% 29% 29% 30% 29% 29%
Average 3%a 6% 4% 5%a 4% 4%a 4%
Poor b b b b b b b
Table B136: Question 47g. Please rate yourself in each of the skill areas: Adapting to new situations Response Options ASN NCCC VISTA 2012 2009 2004 Overall
Excellent 55% 60% 51% 55% 54% 56% 55%
Good 37% 35% 41% 36% 39% 39% 38%
Average 7% 5% 8% 8% 6%a 5% 6%
Poor b b b b b b 0%a
Table B137: Question 47h. Please rate yourself in each of the skill areas: Responding to unexpected challenges Response Options ASN NCCC VISTA 2012 2009 2004 Overall
Excellent 46% 52% 44% 46% 45% 51% 47%
Good 44% 43% 46% 44% 47% 42% 44%
Average 10% 5% 9% 10% 7%a 7% 8%
Poor b b b b b b 1%
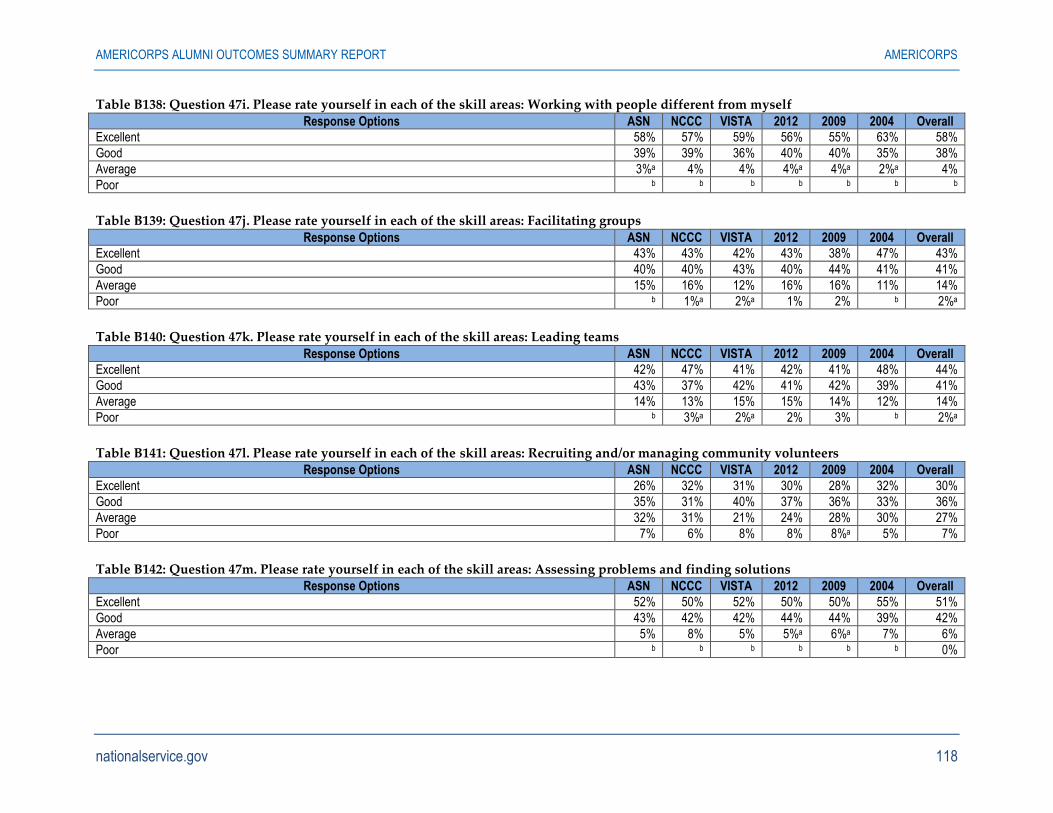
AMERICORPS ALUMNI OUTCOMES SUMMARY REPORT AMERICORPS
nationalservice.gov 118
Table B138: Question 47i. Please rate yourself in each of the skill areas: Working with people different from myself
Response Options ASN NCCC VISTA 2012 2009 2004 Overall
Excellent 58% 57% 59% 56% 55% 63% 58%
Good 39% 39% 36% 40% 40% 35% 38%
Average 3%a 4% 4% 4%a 4%a 2%a 4%
Poor b b b b b b b
Table B139: Question 47j. Please rate yourself in each of the skill areas: Facilitating groups
Response Options ASN NCCC VISTA 2012 2009 2004 Overall
Excellent 43% 43% 42% 43% 38% 47% 43%
Good 40% 40% 43% 40% 44% 41% 41%
Average 15% 16% 12% 16% 16% 11% 14%
Poor b 1%a 2%a 1% 2% b 2%a
Table B140: Question 47k. Please rate yourself in each of the skill areas: Leading teams
Response Options ASN NCCC VISTA 2012 2009 2004 Overall
Excellent 42% 47% 41% 42% 41% 48% 44%
Good 43% 37% 42% 41% 42% 39% 41%
Average 14% 13% 15% 15% 14% 12% 14%
Poor b 3%a 2%a 2% 3% b 2%a
Table B141: Question 47l. Please rate yourself in each of the skill areas: Recruiting and/or managing community volunteers Response Options ASN NCCC VISTA 2012 2009 2004 Overall
Excellent 26% 32% 31% 30% 28% 32% 30%
Good 35% 31% 40% 37% 36% 33% 36%
Average 32% 31% 21% 24% 28% 30% 27%
Poor 7% 6% 8% 8% 8%a 5% 7%
Table B142: Question 47m. Please rate yourself in each of the skill areas: Assessing problems and finding solutions Response Options ASN NCCC VISTA 2012 2009 2004 Overall
Excellent 52% 50% 52% 50% 50% 55% 51%
Good 43% 42% 42% 44% 44% 39% 42%
Average 5% 8% 5% 5%a 6%a 7% 6%
Poor b b b b b b 0%
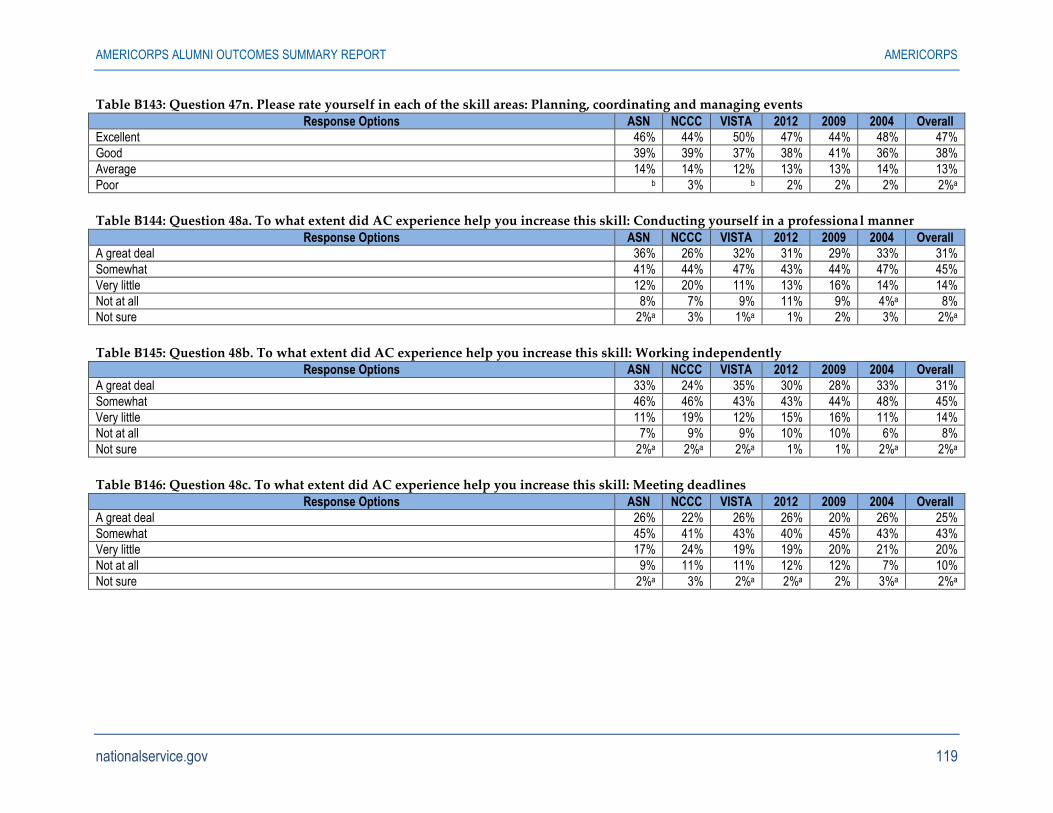
AMERICORPS ALUMNI OUTCOMES SUMMARY REPORT AMERICORPS
nationalservice.gov 119
Table B143: Question 47n. Please rate yourself in each of the skill areas: Planning, coordinating and managing events
Response Options ASN NCCC VISTA 2012 2009 2004 Overall
Excellent 46% 44% 50% 47% 44% 48% 47%
Good 39% 39% 37% 38% 41% 36% 38%
Average 14% 14% 12% 13% 13% 14% 13%
Poor b 3% b 2% 2% 2% 2%a
Table B144: Question 48a. To what extent did AC experience help you increase this skill: Conducting yourself in a professional manner
Response Options ASN NCCC VISTA 2012 2009 2004 Overall
A great deal 36% 26% 32% 31% 29% 33% 31%
Somewhat 41% 44% 47% 43% 44% 47% 45%
Very little 12% 20% 11% 13% 16% 14% 14%
Not at all 8% 7% 9% 11% 9% 4%a 8%
Not sure 2%a 3% 1%a 1% 2% 3% 2%a
Table B145: Question 48b. To what extent did AC experience help you increase this skill: Working independently Response Options ASN NCCC VISTA 2012 2009 2004 Overall
A great deal 33% 24% 35% 30% 28% 33% 31%
Somewhat 46% 46% 43% 43% 44% 48% 45%
Very little 11% 19% 12% 15% 16% 11% 14%
Not at all 7% 9% 9% 10% 10% 6% 8%
Not sure 2%a 2%a 2%a 1% 1% 2%a 2%a
Table B146: Question 48c. To what extent did AC experience help you increase this skill: Meeting deadlines
Response Options ASN NCCC VISTA 2012 2009 2004 Overall
A great deal 26% 22% 26% 26% 20% 26% 25%
Somewhat 45% 41% 43% 40% 45% 43% 43%
Very little 17% 24% 19% 19% 20% 21% 20%
Not at all 9% 11% 11% 12% 12% 7% 10%
Not sure 2%a 3% 2%a 2%a 2% 3%a 2%a
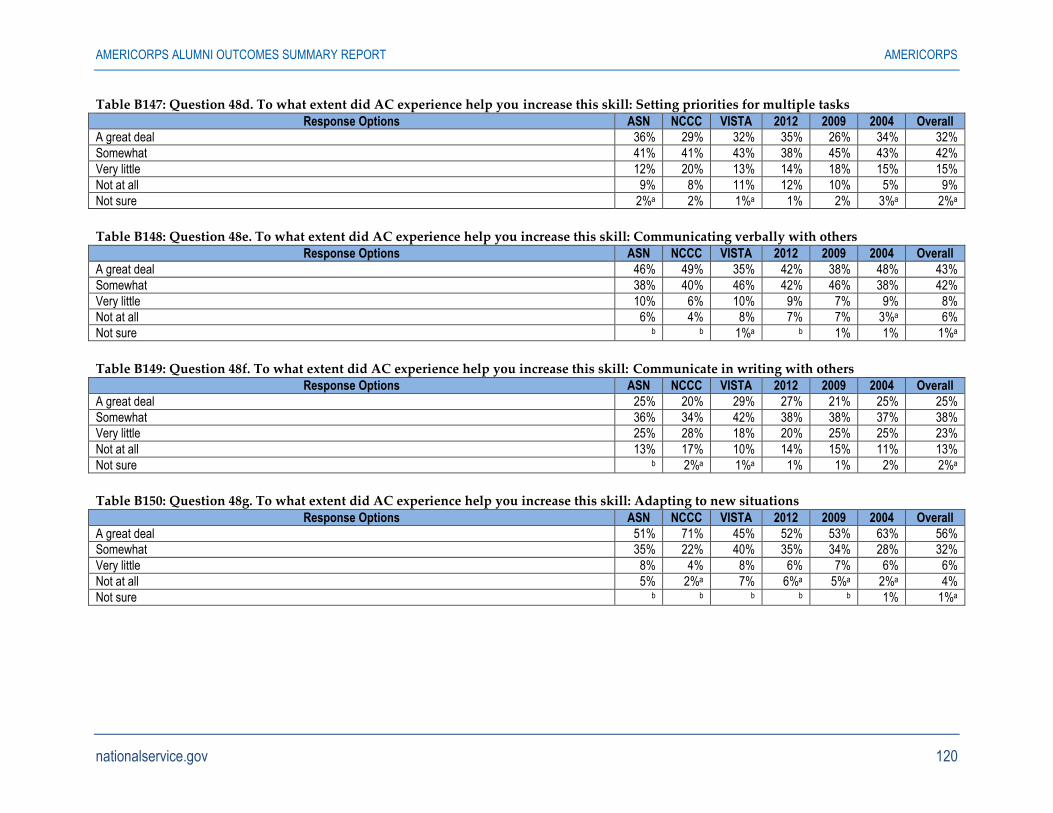
AMERICORPS ALUMNI OUTCOMES SUMMARY REPORT AMERICORPS
nationalservice.gov 120
Table B147: Question 48d. To what extent did AC experience help you increase this skill: Setting priorities for multiple tasks
Response Options ASN NCCC VISTA 2012 2009 2004 Overall
A great deal 36% 29% 32% 35% 26% 34% 32%
Somewhat 41% 41% 43% 38% 45% 43% 42%
Very little 12% 20% 13% 14% 18% 15% 15%
Not at all 9% 8% 11% 12% 10% 5% 9%
Not sure 2%a 2% 1%a 1% 2% 3%a 2%a
Table B148: Question 48e. To what extent did AC experience help you increase this skill: Communicating verbally with others Response Options ASN NCCC VISTA 2012 2009 2004 Overall
A great deal 46% 49% 35% 42% 38% 48% 43%
Somewhat 38% 40% 46% 42% 46% 38% 42%
Very little 10% 6% 10% 9% 7% 9% 8%
Not at all 6% 4% 8% 7% 7% 3%a 6%
Not sure b b 1%a b 1% 1% 1%a
Table B149: Question 48f. To what extent did AC experience help you increase this skill: Communicate in writing with others Response Options ASN NCCC VISTA 2012 2009 2004 Overall
A great deal 25% 20% 29% 27% 21% 25% 25%
Somewhat 36% 34% 42% 38% 38% 37% 38%
Very little 25% 28% 18% 20% 25% 25% 23%
Not at all 13% 17% 10% 14% 15% 11% 13%
Not sure b 2%a 1%a 1% 1% 2% 2%a
Table B150: Question 48g. To what extent did AC experience help you increase this skill: Adapting to new situations
Response Options ASN NCCC VISTA 2012 2009 2004 Overall
A great deal 51% 71% 45% 52% 53% 63% 56%
Somewhat 35% 22% 40% 35% 34% 28% 32%
Very little 8% 4% 8% 6% 7% 6% 6%
Not at all 5% 2%a 7% 6%a 5%a 2%a 4%
Not sure b b b b b 1% 1%a
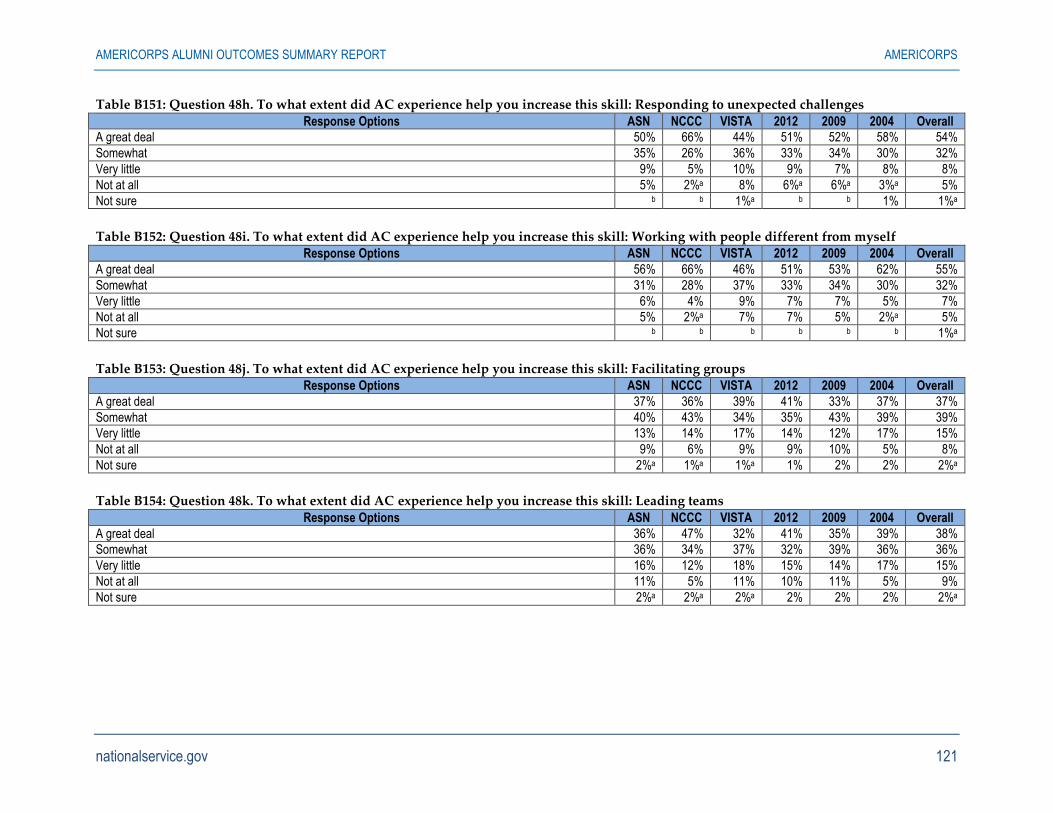
AMERICORPS ALUMNI OUTCOMES SUMMARY REPORT AMERICORPS
nationalservice.gov 121
Table B151: Question 48h. To what extent did AC experience help you increase this skill: Responding to unexpected challenges
Response Options ASN NCCC VISTA 2012 2009 2004 Overall
A great deal 50% 66% 44% 51% 52% 58% 54%
Somewhat 35% 26% 36% 33% 34% 30% 32%
Very little 9% 5% 10% 9% 7% 8% 8%
Not at all 5% 2%a 8% 6%a 6%a 3%a 5%
Not sure b b 1%a b b 1% 1%a
Table B152: Question 48i. To what extent did AC experience help you increase this skill: Working with people different from myself Response Options ASN NCCC VISTA 2012 2009 2004 Overall
A great deal 56% 66% 46% 51% 53% 62% 55%
Somewhat 31% 28% 37% 33% 34% 30% 32%
Very little 6% 4% 9% 7% 7% 5% 7%
Not at all 5% 2%a 7% 7% 5% 2%a 5%
Not sure b b b b b b 1%a
Table B153: Question 48j. To what extent did AC experience help you increase this skill: Facilitating groups Response Options ASN NCCC VISTA 2012 2009 2004 Overall
A great deal 37% 36% 39% 41% 33% 37% 37%
Somewhat 40% 43% 34% 35% 43% 39% 39%
Very little 13% 14% 17% 14% 12% 17% 15%
Not at all 9% 6% 9% 9% 10% 5% 8%
Not sure 2%a 1%a 1%a 1% 2% 2% 2%a
Table B154: Question 48k. To what extent did AC experience help you increase this skill: Leading teams
Response Options ASN NCCC VISTA 2012 2009 2004 Overall
A great deal 36% 47% 32% 41% 35% 39% 38%
Somewhat 36% 34% 37% 32% 39% 36% 36%
Very little 16% 12% 18% 15% 14% 17% 15%
Not at all 11% 5% 11% 10% 11% 5% 9%
Not sure 2%a 2%a 2%a 2% 2% 2% 2%a
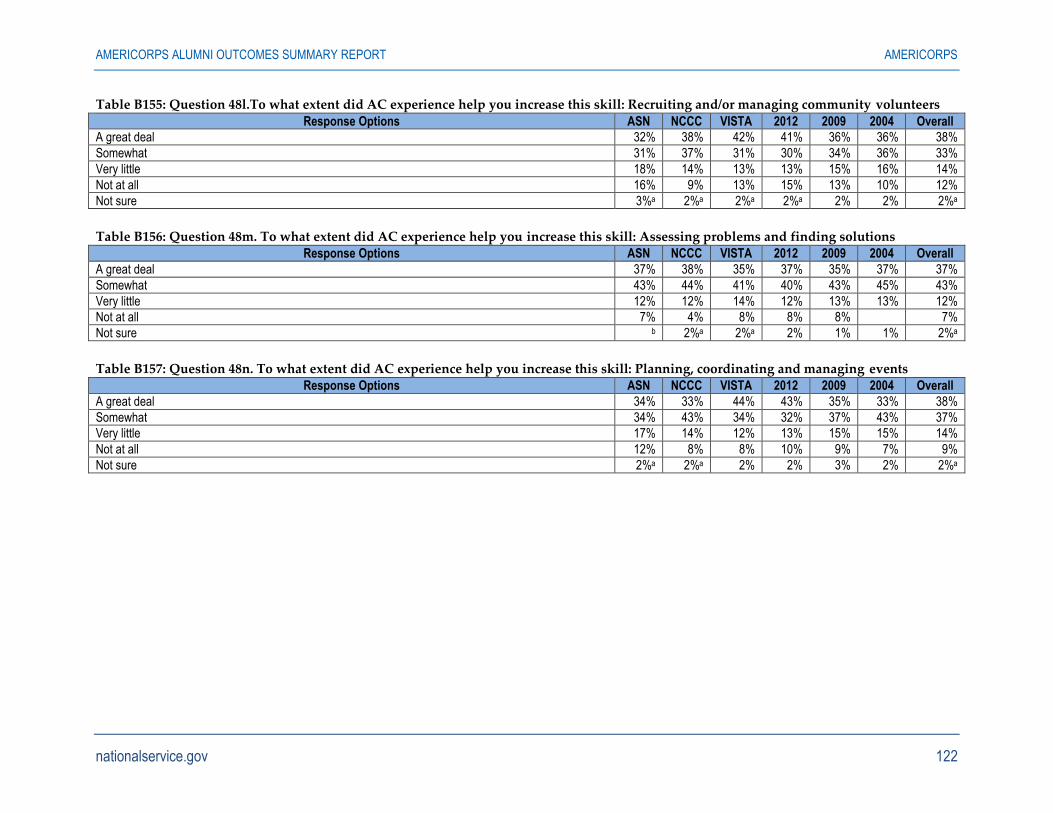
AMERICORPS ALUMNI OUTCOMES SUMMARY REPORT AMERICORPS
nationalservice.gov 122
Table B155: Question 48l.To what extent did AC experience help you increase this skill: Recruiting and/or managing community volunteers
Response Options ASN NCCC VISTA 2012 2009 2004 Overall
A great deal 32% 38% 42% 41% 36% 36% 38%
Somewhat 31% 37% 31% 30% 34% 36% 33%
Very little 18% 14% 13% 13% 15% 16% 14%
Not at all 16% 9% 13% 15% 13% 10% 12%
Not sure 3%a 2%a 2%a 2%a 2% 2% 2%a
Table B156: Question 48m. To what extent did AC experience help you increase this skill: Assessing problems and finding solutions Response Options ASN NCCC VISTA 2012 2009 2004 Overall
A great deal 37% 38% 35% 37% 35% 37% 37%
Somewhat 43% 44% 41% 40% 43% 45% 43%
Very little 12% 12% 14% 12% 13% 13% 12%
Not at all 7% 4% 8% 8% 8% 7%
Not sure b 2%a 2%a 2% 1% 1% 2%a
Table B157: Question 48n. To what extent did AC experience help you increase this skill: Planning, coordinating and managing events Response Options ASN NCCC VISTA 2012 2009 2004 Overall
A great deal 34% 33% 44% 43% 35% 33% 38%
Somewhat 34% 43% 34% 32% 37% 43% 37%
Very little 17% 14% 12% 13% 15% 15% 14%
Not at all 12% 8% 8% 10% 9% 7% 9%
Not sure 2%a 2%a 2% 2% 3% 2% 2%a

AMERICORPS ALUMNI OUTCOMES SUMMARY REPORT AMERICORPS
nationalservice.gov 123
Appendix C: Weighted Frequencies Survey results are estimates of population values and always contain some error because they are based on samples. One tool for assessing the
reliability, or precision, of survey estimates is the relative standard error (RSE) of an estimate. Estimates with large RSEs are considered less
reliable than estimates with small RSEs. Relative standard error is calculated by dividing the standard error of the estimate by the estimate itself.
Relative standard error is expressed as a percent of the estimate.[1] For example, if the estimate of those who strongly agree is 23 percent and the
standard error of the estimate is 1 percent, the RSE of the estimate = 1/23 or 4 percent.
For the purpose of reporting data, the AmeriCorps Alumni Outcomes Survey has adopted the following data suppression rules:
1. Estimates with RSEs greater than 30 percent but no more than 50 percent are published but should be used with caution (marked with an
”a”).
2. Estimates with fewer than five responses or RSEs greater than 50 percent are considered statistically unreliable and are suppressed
(marked with a ”b”).
Table C1: Question 2. What is your gender?
Response Options ASN NCCC VISTA 2012 2009 2004 Overall
Female 77% 71% 76% 75% 77% 80% 77%
Male 23% 28% 23% 24% 23% 20% 23%
Other Gender b b 1%a 0%a b b 0%a
Table C2: Question 3. Are you a parent/primary caregiver?
Response Options ASN NCCC VISTA 2012 2009 2004 Overall
No 69% 80% 67% 84% 69% 42% 69%
Yes, and all of my children currently live with me 26% 20% 22% 12% 23% 49% 25%
Yes, and some of my children currently live with me 2%a 0% 4% 1% 4% 2% 2%
Yes, and none of my children currently live with me 1%a b b b b 2% 1%a
Yes, I am a parent of adult children who no longer live with me 3% b 7% 2% 4% 5% 3%
Table C3: Question 4. Have you served on active duty in the military?
Response Options ASN NCCC VISTA 2012 2009 2004 Overall
No 95% 97% 96% 95% 96% 95% 95%
Yes 5% 3% 4% 5% 4% 5% 5%
[1] Wisconsin Department of Health Services. (December, 2014). Behavioral Risk Factor Survey Relative Standard Error. Retrieved March 18, 2015 from
https://www.dhs.wisconsin.gov/wish/brfs/rse.htm.

AMERICORPS ALUMNI OUTCOMES SUMMARY REPORT AMERICORPS
nationalservice.gov 124
Table C4: Question 5. Which of the following describes your race? Please select one or more.
Response Options ASN NCCC VISTA 2012 2009 2004 Overall
Black or African American 13% 4% 14% 12% 12% 14% 13%
American Indian or Alaskan Native 1%a 1%a 2% 1% 2%a 1% 2%a
Asian 5% 4% 5% 5% 5% 5% 5%
White 78% 90% 77% 80% 77% 76% 78%
Native Hawaiian or Other Pacific Islander 1%a b b 2%a b b 1%a
Other 9% 6% 7% 8% 9% 8% 8%
Table C5: Question 6. Which of the following describes your ethnicity? Please select only one. Response Options ASN NCCC VISTA 2012 2009 2004 Overall
Hispanic or Latina/o 10% 4% 8% 9% 11% 8% 9%
Not Hispanic or Latina/o 90% 96% 92% 91% 89% 92% 90%
Table C6: Question 7. Please select the highest level of education you have completed.
Response Options ASN NCCC VISTA 2012 2009 2004 Overall
High school degree (HS Diploma or GED) 1% 2% 2% 1% 1% 2%a 1%a
Some college 8% 12% 7% 5% 9% 11% 8%a
2-year college degree (AA) 4% 5% 4% 5% 3%a 5% 4%
Technical or vocational degree or certificate 2% 1% 2% 1% 3%a 2%a 2%
4-year college degree (BA, BS) 30% 40% 33% 39% 28% 22% 31%
Some graduate school 10% 9% 11% 15% 7% 7% 10%
Graduate or professional degree (MA, MS, MD, JD, Ph.D., etc.) 43% 29% 42% 33% 48% 52% 43%
Other b b b b 1% b 1%
Table C7: Question 8. Prior to serving in AmeriCorps, did you or anyone in your immediate family ever receive welfare payments or public
assistance benefits?
Response Options ASN NCCC VISTA 2012 2009 2004 Overall
Yes 23% 11% 21% 22% 25% 19% 22%
No 72% 84% 75% 72% 70% 78% 73%
Not sure 5% 5% 4% 6% 5%a 3%a 5%
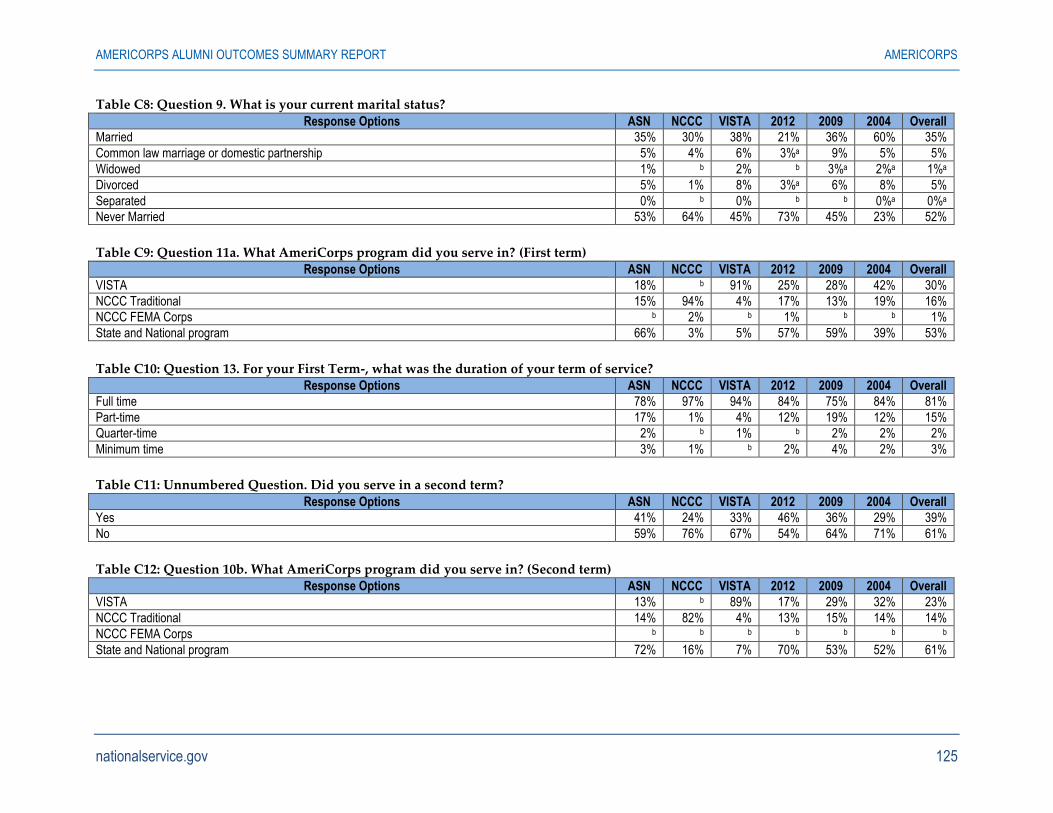
AMERICORPS ALUMNI OUTCOMES SUMMARY REPORT AMERICORPS
nationalservice.gov 125
Table C8: Question 9. What is your current marital status?
Response Options ASN NCCC VISTA 2012 2009 2004 Overall
Married 35% 30% 38% 21% 36% 60% 35%
Common law marriage or domestic partnership 5% 4% 6% 3%a 9% 5% 5%
Widowed 1% b 2% b 3%a 2%a 1%a
Divorced 5% 1% 8% 3%a 6% 8% 5%
Separated 0% b 0% b b 0%a 0%a
Never Married 53% 64% 45% 73% 45% 23% 52%
Table C9: Question 11a. What AmeriCorps program did you serve in? (First term) Response Options ASN NCCC VISTA 2012 2009 2004 Overall
VISTA 18% b 91% 25% 28% 42% 30%
NCCC Traditional 15% 94% 4% 17% 13% 19% 16%
NCCC FEMA Corps b 2% b 1% b b 1%
State and National program 66% 3% 5% 57% 59% 39% 53%
Table C10: Question 13. For your First Term-, what was the duration of your term of service? Response Options ASN NCCC VISTA 2012 2009 2004 Overall
Full time 78% 97% 94% 84% 75% 84% 81%
Part-time 17% 1% 4% 12% 19% 12% 15%
Quarter-time 2% b 1% b 2% 2% 2%
Minimum time 3% 1% b 2% 4% 2% 3%
Table C11: Unnumbered Question. Did you serve in a second term?
Response Options ASN NCCC VISTA 2012 2009 2004 Overall
Yes 41% 24% 33% 46% 36% 29% 39%
No 59% 76% 67% 54% 64% 71% 61%
Table C12: Question 10b. What AmeriCorps program did you serve in? (Second term) Response Options ASN NCCC VISTA 2012 2009 2004 Overall
VISTA 13% b 89% 17% 29% 32% 23%
NCCC Traditional 14% 82% 4% 13% 15% 14% 14%
NCCC FEMA Corps b b b b b b b
State and National program 72% 16% 7% 70% 53% 52% 61%
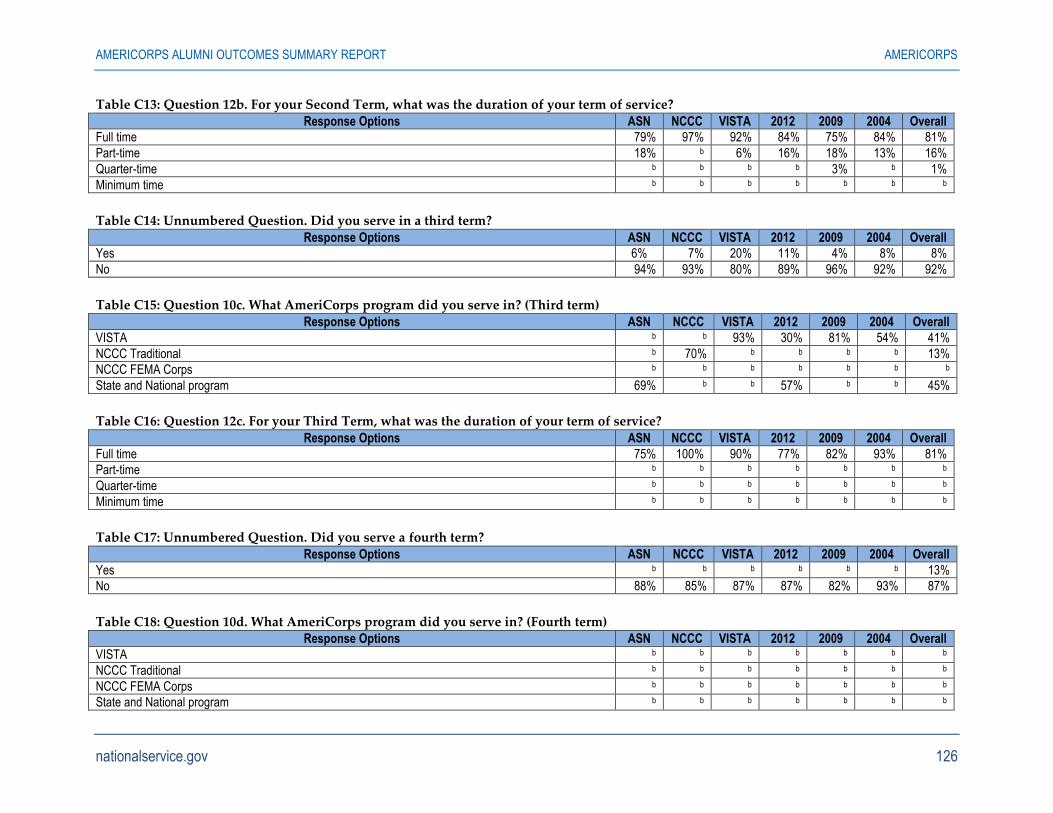
AMERICORPS ALUMNI OUTCOMES SUMMARY REPORT AMERICORPS
nationalservice.gov 126
Table C13: Question 12b. For your Second Term, what was the duration of your term of service?
Response Options ASN NCCC VISTA 2012 2009 2004 Overall
Full time 79% 97% 92% 84% 75% 84% 81%
Part-time 18% b 6% 16% 18% 13% 16%
Quarter-time b b b b 3% b 1%
Minimum time b b b b b b b
Table C14: Unnumbered Question. Did you serve in a third term?
Response Options ASN NCCC VISTA 2012 2009 2004 Overall
Yes 6% 7% 20% 11% 4% 8% 8%
No 94% 93% 80% 89% 96% 92% 92%
Table C15: Question 10c. What AmeriCorps program did you serve in? (Third term)
Response Options ASN NCCC VISTA 2012 2009 2004 Overall
VISTA b b 93% 30% 81% 54% 41%
NCCC Traditional b 70% b b b b 13%
NCCC FEMA Corps b b b b b b b
State and National program 69% b b 57% b b 45%
Table C16: Question 12c. For your Third Term, what was the duration of your term of service?
Response Options ASN NCCC VISTA 2012 2009 2004 Overall
Full time 75% 100% 90% 77% 82% 93% 81%
Part-time b b b b b b b
Quarter-time b b b b b b b
Minimum time b b b b b b b
Table C17: Unnumbered Question. Did you serve a fourth term?
Response Options ASN NCCC VISTA 2012 2009 2004 Overall
Yes b b b b b b 13%
No 88% 85% 87% 87% 82% 93% 87%
Table C18: Question 10d. What AmeriCorps program did you serve in? (Fourth term) Response Options ASN NCCC VISTA 2012 2009 2004 Overall
VISTA b b b b b b b
NCCC Traditional b b b b b b b
NCCC FEMA Corps b b b b b b b
State and National program b b b b b b b
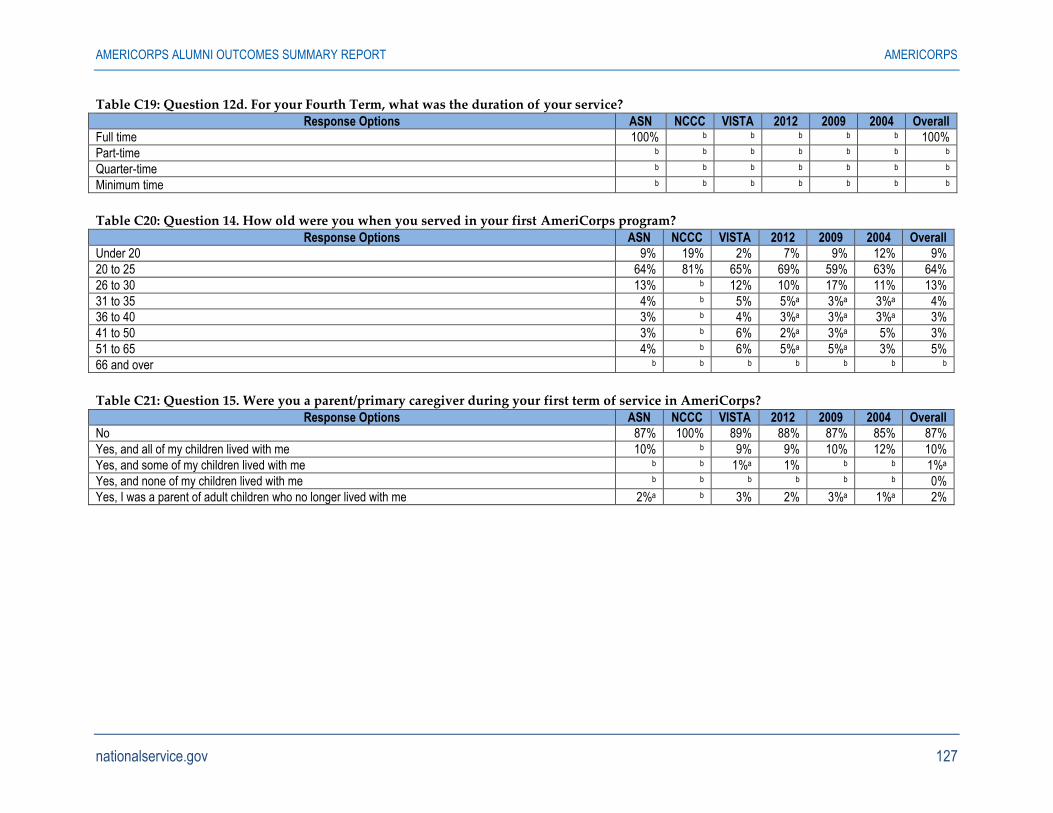
AMERICORPS ALUMNI OUTCOMES SUMMARY REPORT AMERICORPS
nationalservice.gov 127
Table C19: Question 12d. For your Fourth Term, what was the duration of your service?
Response Options ASN NCCC VISTA 2012 2009 2004 Overall
Full time 100% b b b b b 100%
Part-time b b b b b b b
Quarter-time b b b b b b b
Minimum time b b b b b b b
Table C20: Question 14. How old were you when you served in your first AmeriCorps program?
Response Options ASN NCCC VISTA 2012 2009 2004 Overall
Under 20 9% 19% 2% 7% 9% 12% 9%
20 to 25 64% 81% 65% 69% 59% 63% 64%
26 to 30 13% b 12% 10% 17% 11% 13%
31 to 35 4% b 5% 5%a 3%a 3%a 4%
36 to 40 3% b 4% 3%a 3%a 3%a 3%
41 to 50 3% b 6% 2%a 3%a 5% 3%
51 to 65 4% b 6% 5%a 5%a 3% 5%
66 and over b b b b b b b
Table C21: Question 15. Were you a parent/primary caregiver during your first term of service in AmeriCorps?
Response Options ASN NCCC VISTA 2012 2009 2004 Overall
No 87% 100% 89% 88% 87% 85% 87%
Yes, and all of my children lived with me 10% b 9% 9% 10% 12% 10%
Yes, and some of my children lived with me b b 1%a 1% b b 1%a
Yes, and none of my children lived with me b b b b b b 0%
Yes, I was a parent of adult children who no longer lived with me 2%a b 3% 2% 3%a 1%a 2%

AMERICORPS ALUMNI OUTCOMES SUMMARY REPORT AMERICORPS
nationalservice.gov 128
Table C22: Question 16. What were you doing in the six months before you first entered AmeriCorps? Select all that apply.
Response Options ASN NCCC VISTA 2012 2009 2004 Overall
Working in the private sector 18% 32% 23% 19% 19% 20% 19%
Working in the nonprofit or social service sector 15% 9% 14% 18% 14% 11% 15%
Working in the public/government sector 7% 8% 6% 8% 7% 7% 7%
Attending high school 4% 11% b 4%a 4%a 4%a 4%
Attending a vocational/technical training program 1%a 2%a 1%a 1%a b b 1%a
Attending college 54% 61% 49% 56% 50% 51% 53%
Attending graduate school 6% b 4% 6% 5%a 5% 5%
Engaged another service experience such as the Peace Corps b b 1%a 1% b 1% 1%a
Working in my own small business b b 2%a 2% 1% b 1%a
Working at a nonprofit or social entrepreneurship venture that I created b b b b b b b
Serving in the military b b b b b b b
Unemployed 9% 8% 12% 7% 9% 13% 9%
Other 7% 7% 11% 5% 9% 9% 7%
Table C23: Question 17. What were the main focus areas of your AmeriCorps service experience? Select all that apply.
Response Options ASN NCCC VISTA 2012 2009 2004 Overall
Education 75% 61% 54% 76% 68% 65% 71%
Healthy Futures 18% 19% 20% 17% 16% 23% 18%
Disaster Services 3%a 74% 7% 5% 6% 7% 6%
Veterans and Military Families b b 1%a 0%a b b 1%a
Environmental Stewardship 16% 81% 10% 16% 18% 17% 17%
Economic Opportunity 10% 24% 29% 13% 13% 16% 14%
Capacity Building 11% 23% 46% 21% 17% 12% 18%
Not Sure/Does Not apply 9% 6% 7% 7% 9% 12% 8%
Table C24: Question 18a. (Before AmeriCorps) I enjoyed exploring differences between co-workers and/or friends from different cultures or
backgrounds and me. Response Options ASN NCCC VISTA 2012 2009 2004 Overall
Strongly Agree 41% 31% 46% 44% 35% 45% 41%
Agree 44% 48% 41% 39% 51% 43% 44%
Neither Agree nor Disagree 13% 17% 12% 13% 14% 10% 13%
Disagree 2%a 3% 2%a 3%a 0% 2%a 2%a
Strongly Disagree b b b b b b b
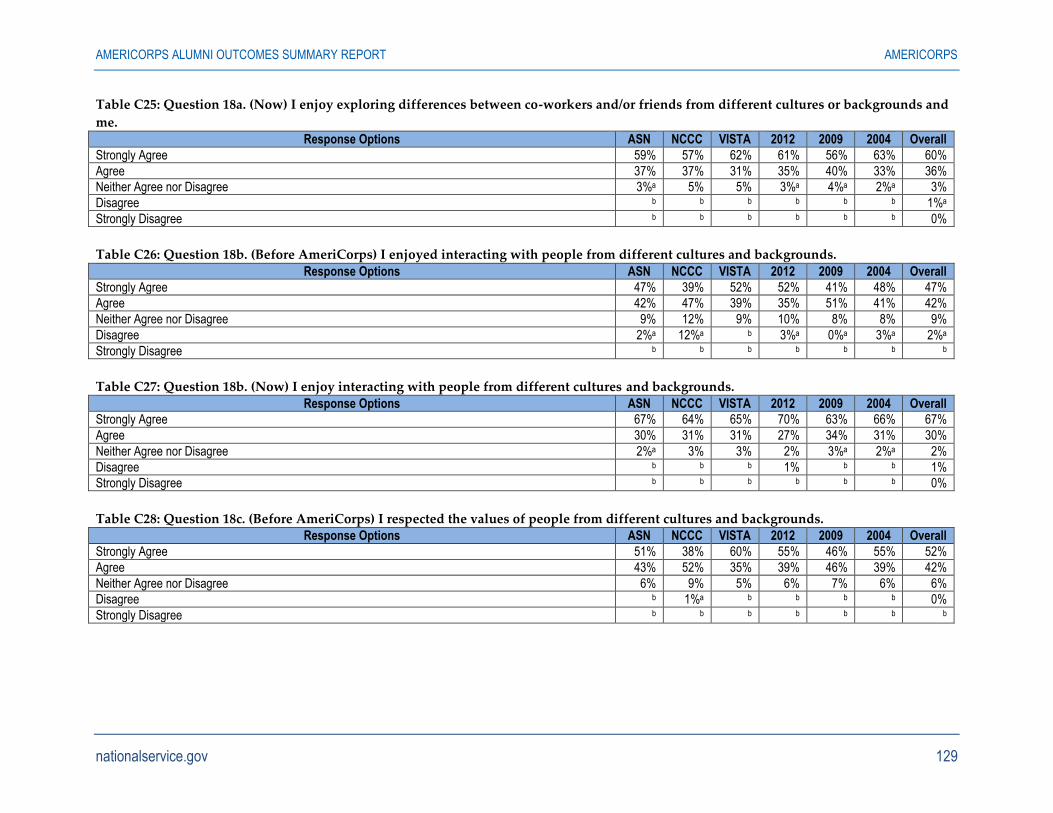
AMERICORPS ALUMNI OUTCOMES SUMMARY REPORT AMERICORPS
nationalservice.gov 129
Table C25: Question 18a. (Now) I enjoy exploring differences between co-workers and/or friends from different cultures or backgrounds and
me.
Response Options ASN NCCC VISTA 2012 2009 2004 Overall
Strongly Agree 59% 57% 62% 61% 56% 63% 60%
Agree 37% 37% 31% 35% 40% 33% 36%
Neither Agree nor Disagree 3%a 5% 5% 3%a 4%a 2%a 3%
Disagree b b b b b b 1%a
Strongly Disagree b b b b b b 0%
Table C26: Question 18b. (Before AmeriCorps) I enjoyed interacting with people from different cultures and backgrounds.
Response Options ASN NCCC VISTA 2012 2009 2004 Overall
Strongly Agree 47% 39% 52% 52% 41% 48% 47%
Agree 42% 47% 39% 35% 51% 41% 42%
Neither Agree nor Disagree 9% 12% 9% 10% 8% 8% 9%
Disagree 2%a 12%a b 3%a 0%a 3%a 2%a
Strongly Disagree b b b b b b b
Table C27: Question 18b. (Now) I enjoy interacting with people from different cultures and backgrounds.
Response Options ASN NCCC VISTA 2012 2009 2004 Overall
Strongly Agree 67% 64% 65% 70% 63% 66% 67%
Agree 30% 31% 31% 27% 34% 31% 30%
Neither Agree nor Disagree 2%a 3% 3% 2% 3%a 2%a 2%
Disagree b b b 1% b b 1%
Strongly Disagree b b b b b b 0%
Table C28: Question 18c. (Before AmeriCorps) I respected the values of people from different cultures and backgrounds. Response Options ASN NCCC VISTA 2012 2009 2004 Overall
Strongly Agree 51% 38% 60% 55% 46% 55% 52%
Agree 43% 52% 35% 39% 46% 39% 42%
Neither Agree nor Disagree 6% 9% 5% 6% 7% 6% 6%
Disagree b 1%a b b b b 0%
Strongly Disagree b b b b b b b
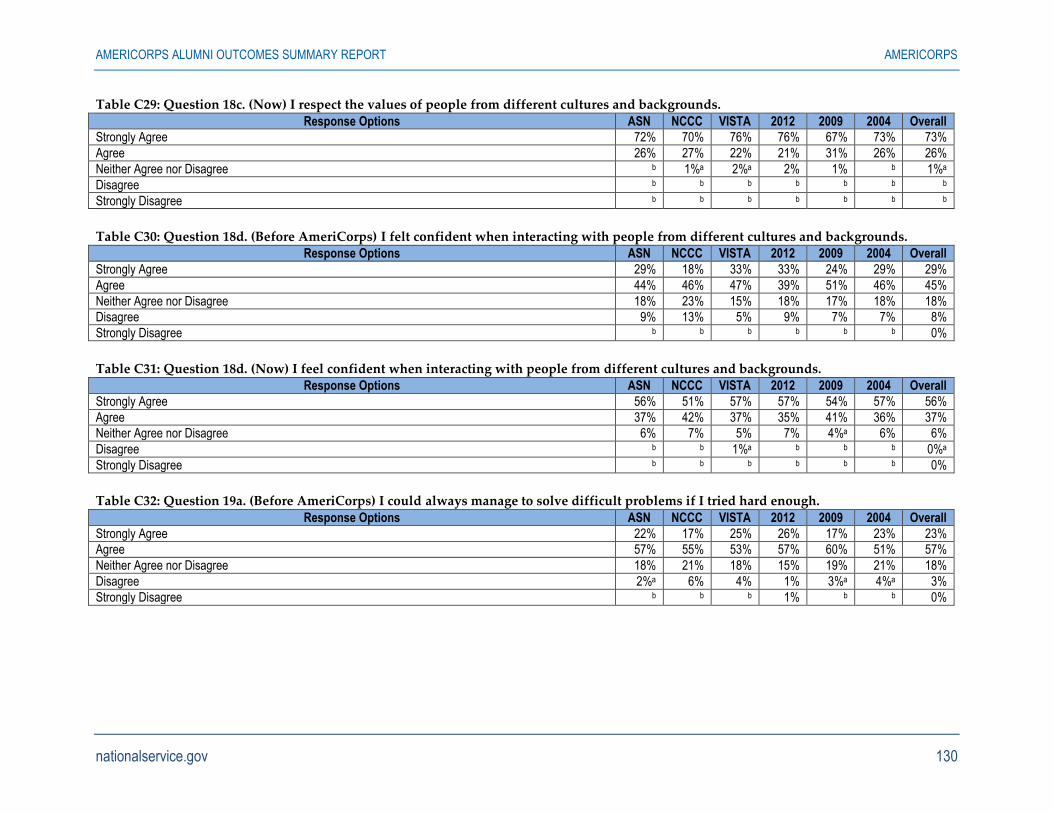
AMERICORPS ALUMNI OUTCOMES SUMMARY REPORT AMERICORPS
nationalservice.gov 130
Table C29: Question 18c. (Now) I respect the values of people from different cultures and backgrounds.
Response Options ASN NCCC VISTA 2012 2009 2004 Overall
Strongly Agree 72% 70% 76% 76% 67% 73% 73%
Agree 26% 27% 22% 21% 31% 26% 26%
Neither Agree nor Disagree b 1%a 2%a 2% 1% b 1%a
Disagree b b b b b b b
Strongly Disagree b b b b b b b
Table C30: Question 18d. (Before AmeriCorps) I felt confident when interacting with people from different cultures and backgrounds. Response Options ASN NCCC VISTA 2012 2009 2004 Overall
Strongly Agree 29% 18% 33% 33% 24% 29% 29%
Agree 44% 46% 47% 39% 51% 46% 45%
Neither Agree nor Disagree 18% 23% 15% 18% 17% 18% 18%
Disagree 9% 13% 5% 9% 7% 7% 8%
Strongly Disagree b b b b b b 0%
Table C31: Question 18d. (Now) I feel confident when interacting with people from different cultures and backgrounds. Response Options ASN NCCC VISTA 2012 2009 2004 Overall
Strongly Agree 56% 51% 57% 57% 54% 57% 56%
Agree 37% 42% 37% 35% 41% 36% 37%
Neither Agree nor Disagree 6% 7% 5% 7% 4%a 6% 6%
Disagree b b 1%a b b b 0%a
Strongly Disagree b b b b b b 0%
Table C32: Question 19a. (Before AmeriCorps) I could always manage to solve difficult problems if I tried hard enough.
Response Options ASN NCCC VISTA 2012 2009 2004 Overall
Strongly Agree 22% 17% 25% 26% 17% 23% 23%
Agree 57% 55% 53% 57% 60% 51% 57%
Neither Agree nor Disagree 18% 21% 18% 15% 19% 21% 18%
Disagree 2%a 6% 4% 1% 3%a 4%a 3%
Strongly Disagree b b b 1% b b 0%
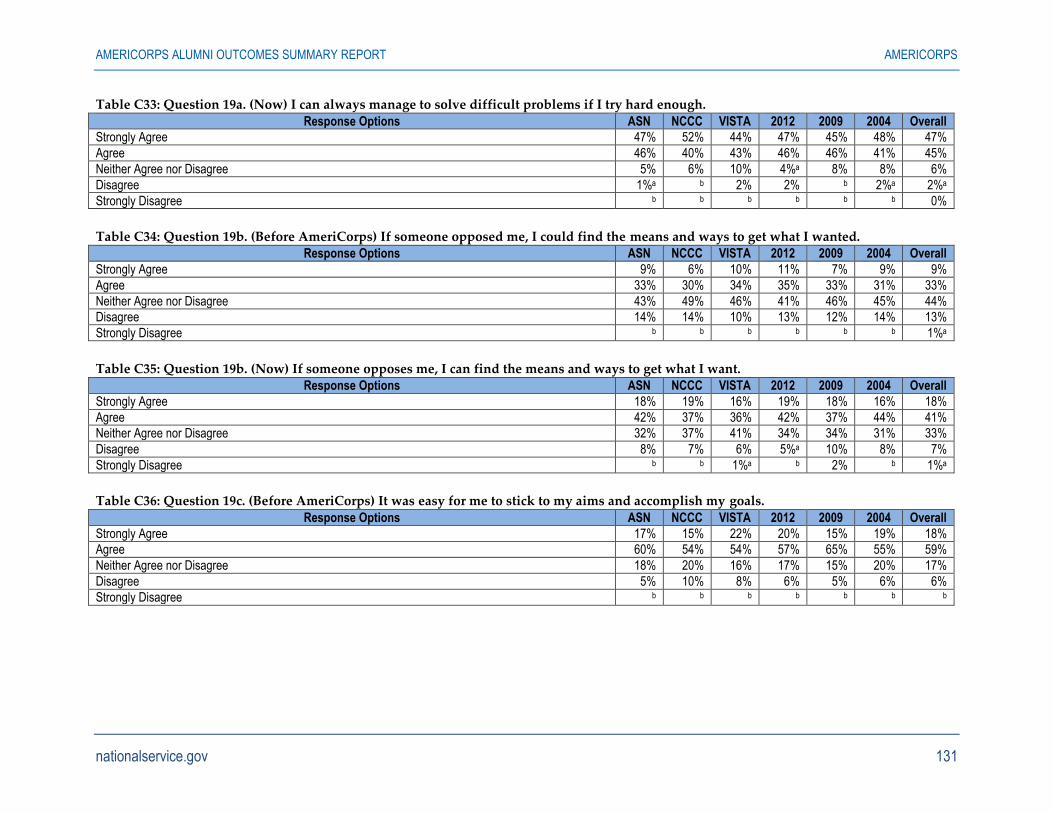
AMERICORPS ALUMNI OUTCOMES SUMMARY REPORT AMERICORPS
nationalservice.gov 131
Table C33: Question 19a. (Now) I can always manage to solve difficult problems if I try hard enough.
Response Options ASN NCCC VISTA 2012 2009 2004 Overall
Strongly Agree 47% 52% 44% 47% 45% 48% 47%
Agree 46% 40% 43% 46% 46% 41% 45%
Neither Agree nor Disagree 5% 6% 10% 4%a 8% 8% 6%
Disagree 1%a b 2% 2% b 2%a 2%a
Strongly Disagree b b b b b b 0%
Table C34: Question 19b. (Before AmeriCorps) If someone opposed me, I could find the means and ways to get what I wanted. Response Options ASN NCCC VISTA 2012 2009 2004 Overall
Strongly Agree 9% 6% 10% 11% 7% 9% 9%
Agree 33% 30% 34% 35% 33% 31% 33%
Neither Agree nor Disagree 43% 49% 46% 41% 46% 45% 44%
Disagree 14% 14% 10% 13% 12% 14% 13%
Strongly Disagree b b b b b b 1%a
Table C35: Question 19b. (Now) If someone opposes me, I can find the means and ways to get what I want. Response Options ASN NCCC VISTA 2012 2009 2004 Overall
Strongly Agree 18% 19% 16% 19% 18% 16% 18%
Agree 42% 37% 36% 42% 37% 44% 41%
Neither Agree nor Disagree 32% 37% 41% 34% 34% 31% 33%
Disagree 8% 7% 6% 5%a 10% 8% 7%
Strongly Disagree b b 1%a b 2% b 1%a
Table C36: Question 19c. (Before AmeriCorps) It was easy for me to stick to my aims and accomplish my goals.
Response Options ASN NCCC VISTA 2012 2009 2004 Overall
Strongly Agree 17% 15% 22% 20% 15% 19% 18%
Agree 60% 54% 54% 57% 65% 55% 59%
Neither Agree nor Disagree 18% 20% 16% 17% 15% 20% 17%
Disagree 5% 10% 8% 6% 5% 6% 6%
Strongly Disagree b b b b b b b

AMERICORPS ALUMNI OUTCOMES SUMMARY REPORT AMERICORPS
nationalservice.gov 132
Table C37: Question 19c. (Now) It is easy for me to stick to my aims and accomplish my goals.
Response Options ASN NCCC VISTA 2012 2009 2004 Overall
Strongly Agree 35% 39% 33% 39% 30% 34% 35%
Agree 56% 50% 54% 52% 59% 57% 56%
Neither Agree nor Disagree 7% 10% 10% 7% 8% 6% 7%
Disagree 2%a b 3% 2% 3% 3%a 2%
Strongly Disagree b b b b b b b
Table C38: Question 19d. (Before AmeriCorps) I was confident that I could deal efficiently with unexpected events. Response Options ASN NCCC VISTA 2012 2009 2004 Overall
Strongly Agree 21% 12% 21% 22% 19% 21% 21%
Agree 51% 51% 54% 52% 52% 49% 51%
Neither Agree nor Disagree 21% 27% 18% 19% 21% 22% 21%
Disagree 7% 9% 7% 6% 8% 8% 7%
Strongly Disagree b b b 0% b b 0%a
Table C39: Question 19d. (Now) I am confident that I could deal efficiently with unexpected events. Response Options ASN NCCC VISTA 2012 2009 2004 Overall
Strongly Agree 52% 55% 47% 54% 48% 49% 51%
Agree 45% 38% 45% 43% 48% 45% 45%
Neither Agree nor Disagree 3%a 5% 5% 2%a 4%a 4%a 3%
Disagree b b 2%a 1% b 2% 1%a
Strongly Disagree b b b b b b b
Table C40: Question 19e. (Before AmeriCorps) Thanks to my resourcefulness, I knew how to handle unforeseen situations.
Response Options ASN NCCC VISTA 2012 2009 2004 Overall
Strongly Agree 21% 11% 19% 21% 21% 17% 20%
Agree 48% 54% 56% 51% 45% 51% 49%
Neither Agree nor Disagree 24% 28% 21% 21% 26% 26% 24%
Disagree 6% 7% 5% 6% 7% 5% 6%
Strongly Disagree b b b b b b 1%
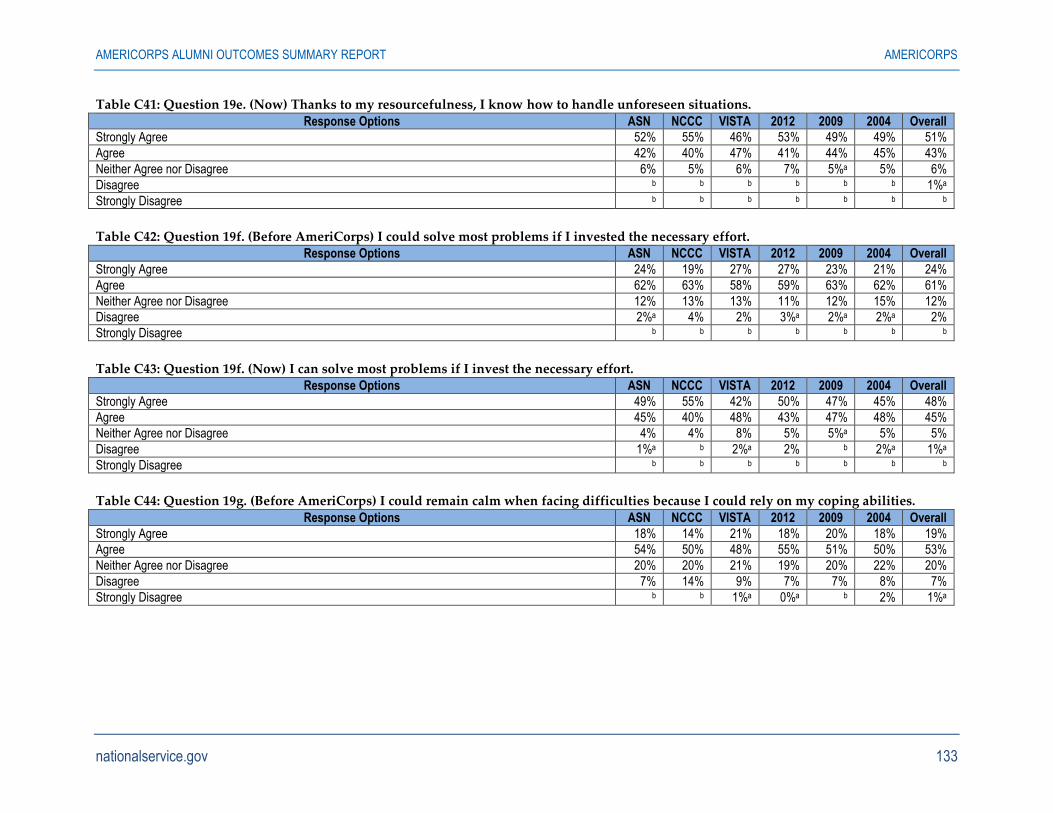
AMERICORPS ALUMNI OUTCOMES SUMMARY REPORT AMERICORPS
nationalservice.gov 133
Table C41: Question 19e. (Now) Thanks to my resourcefulness, I know how to handle unforeseen situations.
Response Options ASN NCCC VISTA 2012 2009 2004 Overall
Strongly Agree 52% 55% 46% 53% 49% 49% 51%
Agree 42% 40% 47% 41% 44% 45% 43%
Neither Agree nor Disagree 6% 5% 6% 7% 5%a 5% 6%
Disagree b b b b b b 1%a
Strongly Disagree b b b b b b b
Table C42: Question 19f. (Before AmeriCorps) I could solve most problems if I invested the necessary effort. Response Options ASN NCCC VISTA 2012 2009 2004 Overall
Strongly Agree 24% 19% 27% 27% 23% 21% 24%
Agree 62% 63% 58% 59% 63% 62% 61%
Neither Agree nor Disagree 12% 13% 13% 11% 12% 15% 12%
Disagree 2%a 4% 2% 3%a 2%a 2%a 2%
Strongly Disagree b b b b b b b
Table C43: Question 19f. (Now) I can solve most problems if I invest the necessary effort. Response Options ASN NCCC VISTA 2012 2009 2004 Overall
Strongly Agree 49% 55% 42% 50% 47% 45% 48%
Agree 45% 40% 48% 43% 47% 48% 45%
Neither Agree nor Disagree 4% 4% 8% 5% 5%a 5% 5%
Disagree 1%a b 2%a 2% b 2%a 1%a
Strongly Disagree b b b b b b b
Table C44: Question 19g. (Before AmeriCorps) I could remain calm when facing difficulties because I could rely on my coping abilities.
Response Options ASN NCCC VISTA 2012 2009 2004 Overall
Strongly Agree 18% 14% 21% 18% 20% 18% 19%
Agree 54% 50% 48% 55% 51% 50% 53%
Neither Agree nor Disagree 20% 20% 21% 19% 20% 22% 20%
Disagree 7% 14% 9% 7% 7% 8% 7%
Strongly Disagree b b 1%a 0%a b 2% 1%a
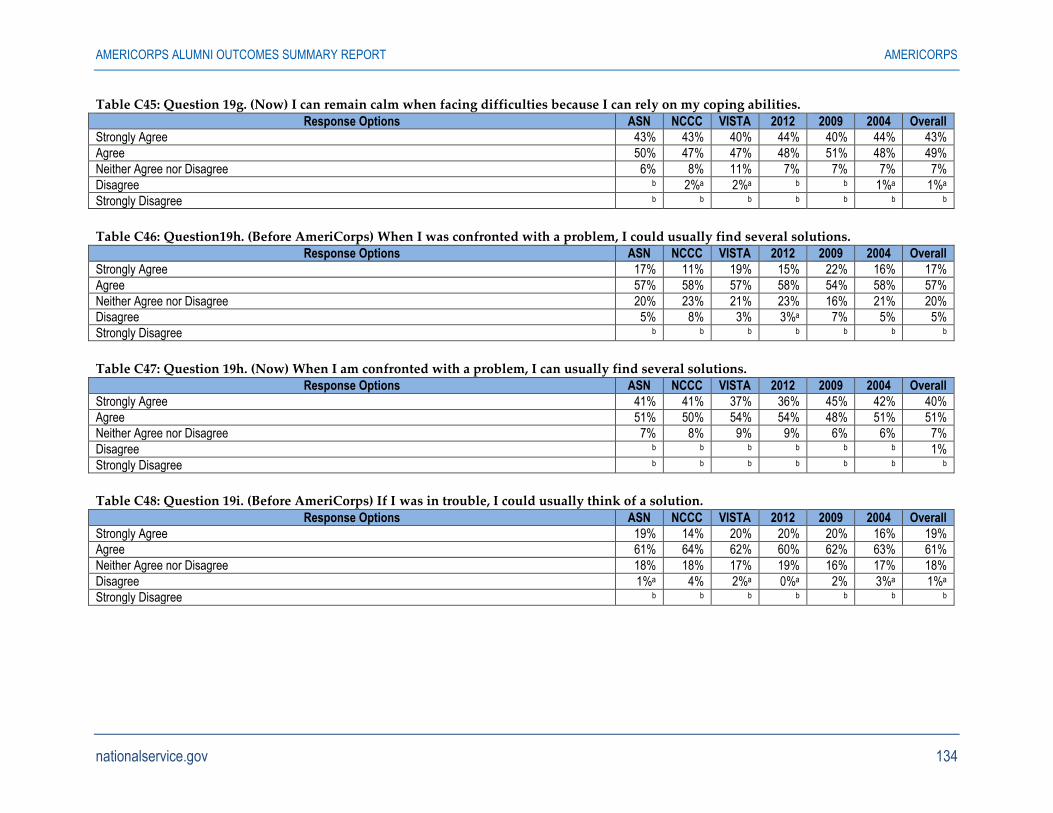
AMERICORPS ALUMNI OUTCOMES SUMMARY REPORT AMERICORPS
nationalservice.gov 134
Table C45: Question 19g. (Now) I can remain calm when facing difficulties because I can rely on my coping abilities.
Response Options ASN NCCC VISTA 2012 2009 2004 Overall
Strongly Agree 43% 43% 40% 44% 40% 44% 43%
Agree 50% 47% 47% 48% 51% 48% 49%
Neither Agree nor Disagree 6% 8% 11% 7% 7% 7% 7%
Disagree b 2%a 2%a b b 1%a 1%a
Strongly Disagree b b b b b b b
Table C46: Question19h. (Before AmeriCorps) When I was confronted with a problem, I could usually find several solutions. Response Options ASN NCCC VISTA 2012 2009 2004 Overall
Strongly Agree 17% 11% 19% 15% 22% 16% 17%
Agree 57% 58% 57% 58% 54% 58% 57%
Neither Agree nor Disagree 20% 23% 21% 23% 16% 21% 20%
Disagree 5% 8% 3% 3%a 7% 5% 5%
Strongly Disagree b b b b b b b
Table C47: Question 19h. (Now) When I am confronted with a problem, I can usually find several solutions. Response Options ASN NCCC VISTA 2012 2009 2004 Overall
Strongly Agree 41% 41% 37% 36% 45% 42% 40%
Agree 51% 50% 54% 54% 48% 51% 51%
Neither Agree nor Disagree 7% 8% 9% 9% 6% 6% 7%
Disagree b b b b b b 1%
Strongly Disagree b b b b b b b
Table C48: Question 19i. (Before AmeriCorps) If I was in trouble, I could usually think of a solution.
Response Options ASN NCCC VISTA 2012 2009 2004 Overall
Strongly Agree 19% 14% 20% 20% 20% 16% 19%
Agree 61% 64% 62% 60% 62% 63% 61%
Neither Agree nor Disagree 18% 18% 17% 19% 16% 17% 18%
Disagree 1%a 4% 2%a 0%a 2% 3%a 1%a
Strongly Disagree b b b b b b b

AMERICORPS ALUMNI OUTCOMES SUMMARY REPORT AMERICORPS
nationalservice.gov 135
Table C49: Question 19i. (Now) If I am in trouble, I can usually think of a solution.
Response Options ASN NCCC VISTA 2012 2009 2004 Overall
Strongly Agree 39% 40% 35% 37% 40% 37% 38%
Agree 55% 54% 57% 55% 52% 60% 55%
Neither Agree nor Disagree 6% 5% 7% 8% 7% 2%a 6%
Disagree b b b b b b 1%
Strongly Disagree b b b b b b b
Table C50: Question 19j. (Before AmeriCorps) I could usually handle whatever came my way. Response Options ASN NCCC VISTA 2012 2009 2004 Overall
Strongly Agree 21% 17% 22% 20% 23% 18% 21%
Agree 59% 59% 56% 61% 56% 57% 58%
Neither Agree nor Disagree 14% 16% 16% 14% 13% 18% 14%
Disagree 6% 8% 5% 5%a 7% 6% 6%
Strongly Disagree b b b b b b 1%
Table C51: Question 19j. (Now) I can usually handle whatever comes my way. Response Options ASN NCCC VISTA 2012 2009 2004 Overall
Strongly Agree 43% 50% 41% 45% 41% 41% 43%
Agree 53% 46% 50% 52% 51% 53% 52%
Neither Agree nor Disagree 4% 3% 8% 3%a 6% 5% 5%
Disagree b b 1%a 0%a b b 1%
Strongly Disagree b b b b b b 0%
Table C52: Question 20a. I felt I made a contribution to the community
Response Options ASN NCCC VISTA 2012 2009 2004 Overall
Strongly Agree 48% 61% 40% 49% 41% 55% 48%
Agree 44% 34% 45% 44% 48% 40% 44%
Neither Agree nor Disagree 5% 2% 8% 5%a 7% 3%a 5%
Disagree b b 5% 2%a 3%a 1%a 2%
Strongly Disagree b 1%a 2%a 1% 1% b 0%a

AMERICORPS ALUMNI OUTCOMES SUMMARY REPORT AMERICORPS
nationalservice.gov 136
Table C53: Question 20b. I re-examined my beliefs and attitudes about myself
Response Options ASN NCCC VISTA 2012 2009 2004 Overall
Strongly Agree 39% 48% 28% 40% 31% 39% 37%
Agree 37% 38% 42% 37% 40% 37% 38%
Neither Agree nor Disagree 16% 9% 23% 13% 20% 21% 17%
Disagree 7% 4% 6% 8% 7% 3%a 7%
Strongly Disagree b b 2%a 2% 2% b 1%a
Table C54: Question 20c. I was exposed to new ideas and ways of seeing the world Response Options ASN NCCC VISTA 2012 2009 2004 Overall
Strongly Agree 51% 65% 38% 51% 45% 51% 49%
Agree 36% 31% 47% 37% 41% 36% 38%
Neither Agree nor Disagree 9% 3% 10% 8% 7% 10% 9%
Disagree 3% b 4% 2%a 6%a 2%a 3%
Strongly Disagree b b 1%a 1% b b 1%a
Table C55: Question 20d. I felt part of a community Response Options ASN NCCC VISTA 2012 2009 2004 Overall
Strongly Agree 48% 59% 40% 46% 43% 54% 47%
Agree 35% 30% 38% 35% 38% 32% 35%
Neither Agree nor Disagree 10% 6% 10% 10% 11% 9% 10%
Disagree 5% 4% 8% 6% 5%a 5% 5%
Strongly Disagree 2%a 1%a 4% 3%a 3%a b 3%
Table C56: Question 20e. I learned more about the "real" world or "the rest" of the world
Response Options ASN NCCC VISTA 2012 2009 2004 Overall
Strongly Agree 45% 55% 35% 44% 40% 48% 44%
Agree 33% 30% 39% 34% 37% 30% 34%
Neither Agree nor Disagree 13% 9% 17% 11% 14% 17% 14%
Disagree 7% 4% 5% 9% 5%a 4%a 6%
Strongly Disagree 2%a 1%a 4% 1% 4%a 1%a 2%a
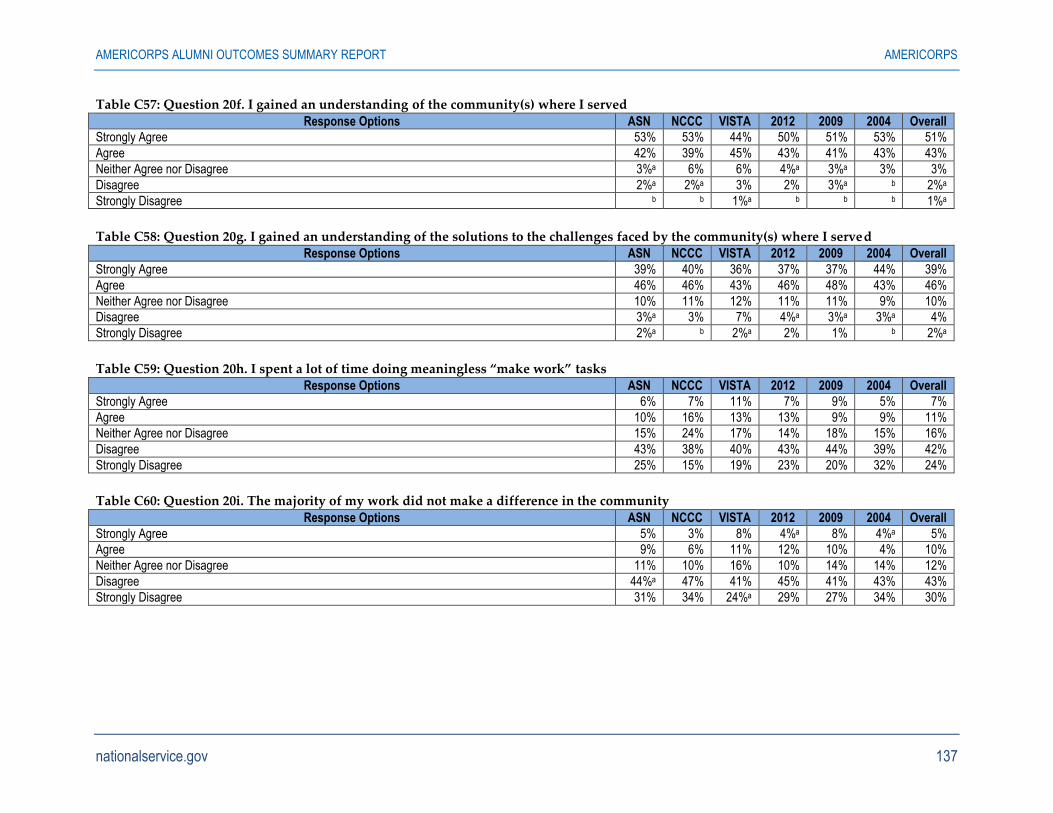
AMERICORPS ALUMNI OUTCOMES SUMMARY REPORT AMERICORPS
nationalservice.gov 137
Table C57: Question 20f. I gained an understanding of the community(s) where I served
Response Options ASN NCCC VISTA 2012 2009 2004 Overall
Strongly Agree 53% 53% 44% 50% 51% 53% 51%
Agree 42% 39% 45% 43% 41% 43% 43%
Neither Agree nor Disagree 3%a 6% 6% 4%a 3%a 3% 3%
Disagree 2%a 2%a 3% 2% 3%a b 2%a
Strongly Disagree b b 1%a b b b 1%a
Table C58: Question 20g. I gained an understanding of the solutions to the challenges faced by the community(s) where I served Response Options ASN NCCC VISTA 2012 2009 2004 Overall
Strongly Agree 39% 40% 36% 37% 37% 44% 39%
Agree 46% 46% 43% 46% 48% 43% 46%
Neither Agree nor Disagree 10% 11% 12% 11% 11% 9% 10%
Disagree 3%a 3% 7% 4%a 3%a 3%a 4%
Strongly Disagree 2%a b 2%a 2% 1% b 2%a
Table C59: Question 20h. I spent a lot of time doing meaningless “make work” tasks Response Options ASN NCCC VISTA 2012 2009 2004 Overall
Strongly Agree 6% 7% 11% 7% 9% 5% 7%
Agree 10% 16% 13% 13% 9% 9% 11%
Neither Agree nor Disagree 15% 24% 17% 14% 18% 15% 16%
Disagree 43% 38% 40% 43% 44% 39% 42%
Strongly Disagree 25% 15% 19% 23% 20% 32% 24%
Table C60: Question 20i. The majority of my work did not make a difference in the community
Response Options ASN NCCC VISTA 2012 2009 2004 Overall
Strongly Agree 5% 3% 8% 4%a 8% 4%a 5%
Agree 9% 6% 11% 12% 10% 4% 10%
Neither Agree nor Disagree 11% 10% 16% 10% 14% 14% 12%
Disagree 44%a 47% 41% 45% 41% 43% 43%
Strongly Disagree 31% 34% 24%a 29% 27% 34% 30%
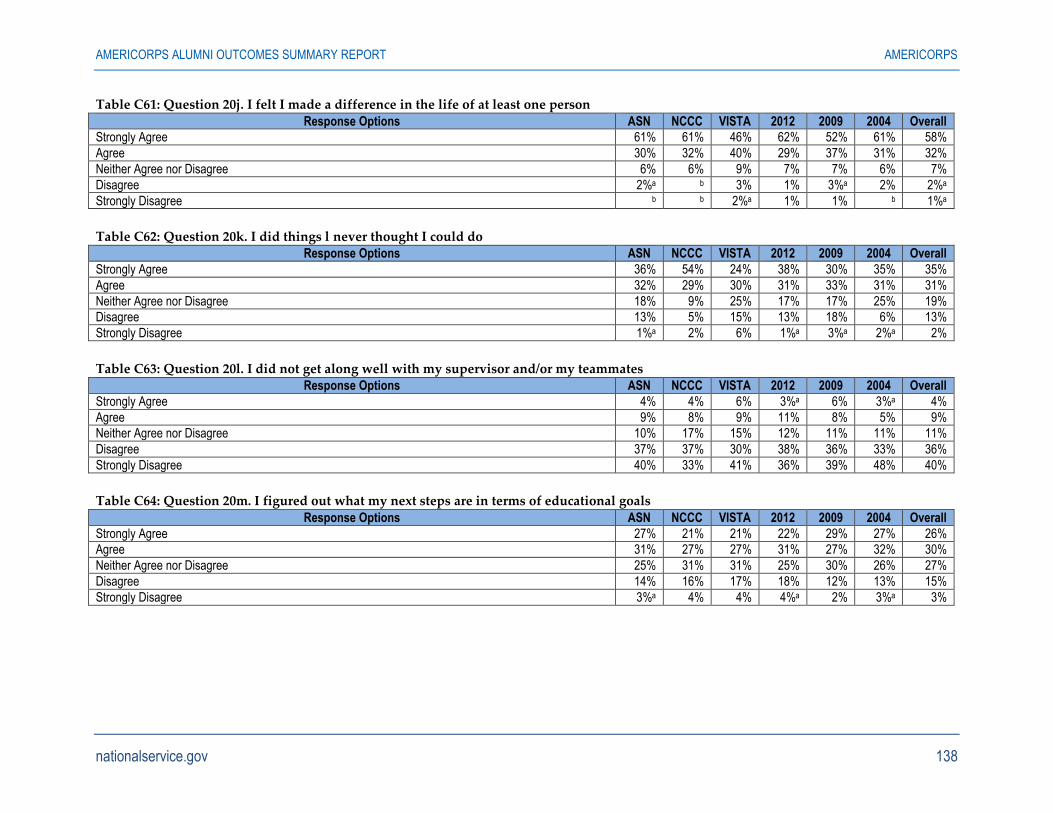
AMERICORPS ALUMNI OUTCOMES SUMMARY REPORT AMERICORPS
nationalservice.gov 138
Table C61: Question 20j. I felt I made a difference in the life of at least one person
Response Options ASN NCCC VISTA 2012 2009 2004 Overall
Strongly Agree 61% 61% 46% 62% 52% 61% 58%
Agree 30% 32% 40% 29% 37% 31% 32%
Neither Agree nor Disagree 6% 6% 9% 7% 7% 6% 7%
Disagree 2%a b 3% 1% 3%a 2% 2%a
Strongly Disagree b b 2%a 1% 1% b 1%a
Table C62: Question 20k. I did things l never thought I could do Response Options ASN NCCC VISTA 2012 2009 2004 Overall
Strongly Agree 36% 54% 24% 38% 30% 35% 35%
Agree 32% 29% 30% 31% 33% 31% 31%
Neither Agree nor Disagree 18% 9% 25% 17% 17% 25% 19%
Disagree 13% 5% 15% 13% 18% 6% 13%
Strongly Disagree 1%a 2% 6% 1%a 3%a 2%a 2%
Table C63: Question 20l. I did not get along well with my supervisor and/or my teammates Response Options ASN NCCC VISTA 2012 2009 2004 Overall
Strongly Agree 4% 4% 6% 3%a 6% 3%a 4%
Agree 9% 8% 9% 11% 8% 5% 9%
Neither Agree nor Disagree 10% 17% 15% 12% 11% 11% 11%
Disagree 37% 37% 30% 38% 36% 33% 36%
Strongly Disagree 40% 33% 41% 36% 39% 48% 40%
Table C64: Question 20m. I figured out what my next steps are in terms of educational goals
Response Options ASN NCCC VISTA 2012 2009 2004 Overall
Strongly Agree 27% 21% 21% 22% 29% 27% 26%
Agree 31% 27% 27% 31% 27% 32% 30%
Neither Agree nor Disagree 25% 31% 31% 25% 30% 26% 27%
Disagree 14% 16% 17% 18% 12% 13% 15%
Strongly Disagree 3%a 4% 4% 4%a 2% 3%a 3%
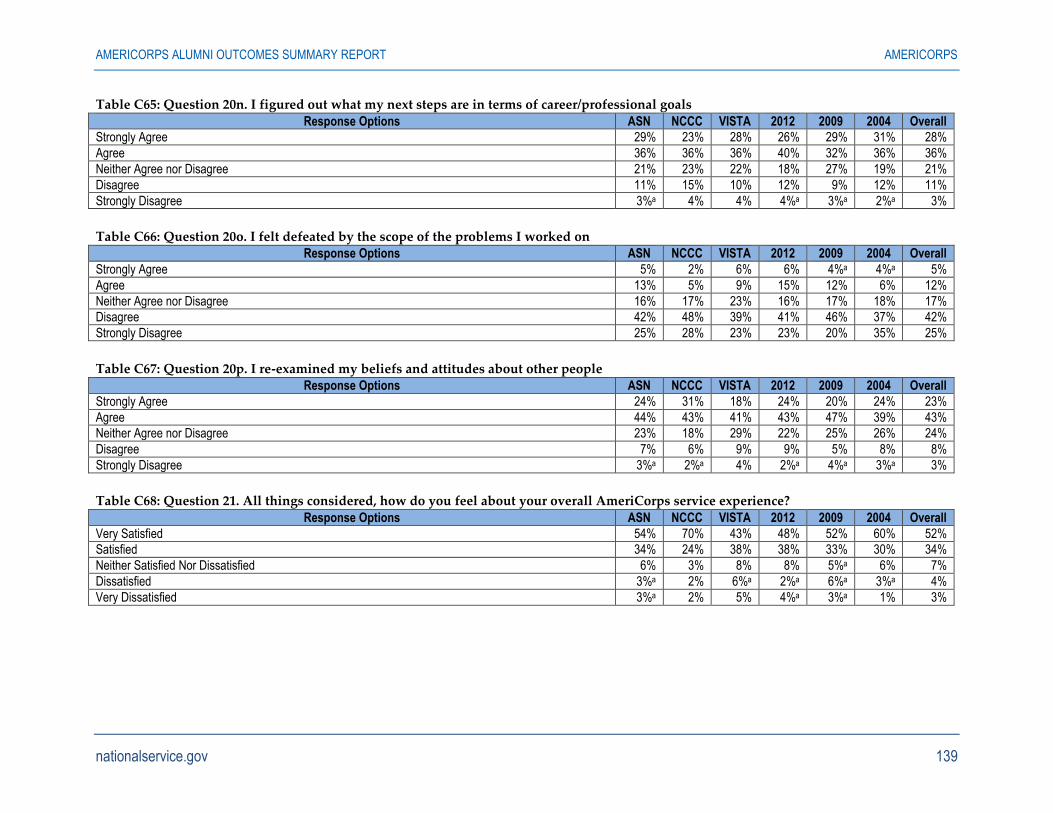
AMERICORPS ALUMNI OUTCOMES SUMMARY REPORT AMERICORPS
nationalservice.gov 139
Table C65: Question 20n. I figured out what my next steps are in terms of career/professional goals
Response Options ASN NCCC VISTA 2012 2009 2004 Overall
Strongly Agree 29% 23% 28% 26% 29% 31% 28%
Agree 36% 36% 36% 40% 32% 36% 36%
Neither Agree nor Disagree 21% 23% 22% 18% 27% 19% 21%
Disagree 11% 15% 10% 12% 9% 12% 11%
Strongly Disagree 3%a 4% 4% 4%a 3%a 2%a 3%
Table C66: Question 20o. I felt defeated by the scope of the problems I worked on Response Options ASN NCCC VISTA 2012 2009 2004 Overall
Strongly Agree 5% 2% 6% 6% 4%a 4%a 5%
Agree 13% 5% 9% 15% 12% 6% 12%
Neither Agree nor Disagree 16% 17% 23% 16% 17% 18% 17%
Disagree 42% 48% 39% 41% 46% 37% 42%
Strongly Disagree 25% 28% 23% 23% 20% 35% 25%
Table C67: Question 20p. I re-examined my beliefs and attitudes about other people Response Options ASN NCCC VISTA 2012 2009 2004 Overall
Strongly Agree 24% 31% 18% 24% 20% 24% 23%
Agree 44% 43% 41% 43% 47% 39% 43%
Neither Agree nor Disagree 23% 18% 29% 22% 25% 26% 24%
Disagree 7% 6% 9% 9% 5% 8% 8%
Strongly Disagree 3%a 2%a 4% 2%a 4%a 3%a 3%
Table C68: Question 21. All things considered, how do you feel about your overall AmeriCorps service experience?
Response Options ASN NCCC VISTA 2012 2009 2004 Overall
Very Satisfied 54% 70% 43% 48% 52% 60% 52%
Satisfied 34% 24% 38% 38% 33% 30% 34%
Neither Satisfied Nor Dissatisfied 6% 3% 8% 8% 5%a 6% 7%
Dissatisfied 3%a 2% 6%a 2%a 6%a 3%a 4%
Very Dissatisfied 3%a 2% 5% 4%a 3%a 1% 3%
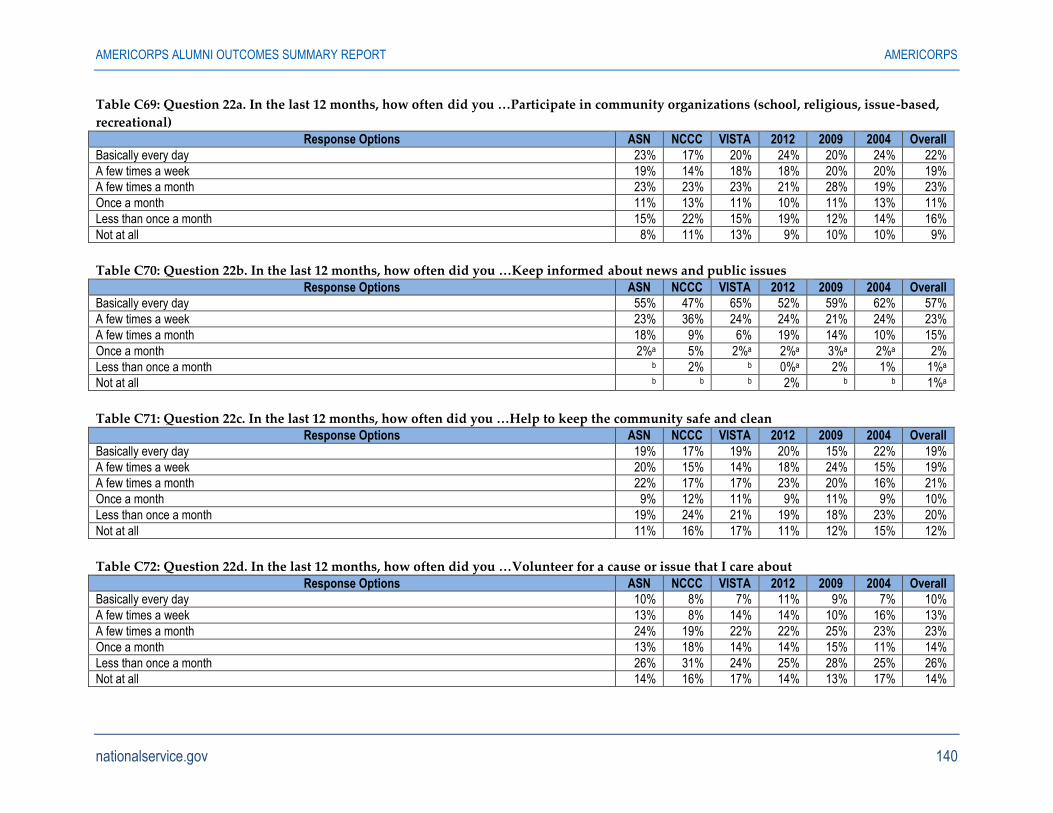
AMERICORPS ALUMNI OUTCOMES SUMMARY REPORT AMERICORPS
nationalservice.gov 140
Table C69: Question 22a. In the last 12 months, how often did you …Participate in community organizations (school, religious, issue-based,
recreational)
Response Options ASN NCCC VISTA 2012 2009 2004 Overall
Basically every day 23% 17% 20% 24% 20% 24% 22%
A few times a week 19% 14% 18% 18% 20% 20% 19%
A few times a month 23% 23% 23% 21% 28% 19% 23%
Once a month 11% 13% 11% 10% 11% 13% 11%
Less than once a month 15% 22% 15% 19% 12% 14% 16%
Not at all 8% 11% 13% 9% 10% 10% 9%
Table C70: Question 22b. In the last 12 months, how often did you …Keep informed about news and public issues
Response Options ASN NCCC VISTA 2012 2009 2004 Overall
Basically every day 55% 47% 65% 52% 59% 62% 57%
A few times a week 23% 36% 24% 24% 21% 24% 23%
A few times a month 18% 9% 6% 19% 14% 10% 15%
Once a month 2%a 5% 2%a 2%a 3%a 2%a 2%
Less than once a month b 2% b 0%a 2% 1% 1%a
Not at all b b b 2% b b 1%a
Table C71: Question 22c. In the last 12 months, how often did you …Help to keep the community safe and clean Response Options ASN NCCC VISTA 2012 2009 2004 Overall
Basically every day 19% 17% 19% 20% 15% 22% 19%
A few times a week 20% 15% 14% 18% 24% 15% 19%
A few times a month 22% 17% 17% 23% 20% 16% 21%
Once a month 9% 12% 11% 9% 11% 9% 10%
Less than once a month 19% 24% 21% 19% 18% 23% 20%
Not at all 11% 16% 17% 11% 12% 15% 12%
Table C72: Question 22d. In the last 12 months, how often did you …Volunteer for a cause or issue that I care about
Response Options ASN NCCC VISTA 2012 2009 2004 Overall
Basically every day 10% 8% 7% 11% 9% 7% 10%
A few times a week 13% 8% 14% 14% 10% 16% 13%
A few times a month 24% 19% 22% 22% 25% 23% 23%
Once a month 13% 18% 14% 14% 15% 11% 14%
Less than once a month 26% 31% 24% 25% 28% 25% 26%
Not at all 14% 16% 17% 14% 13% 17% 14%
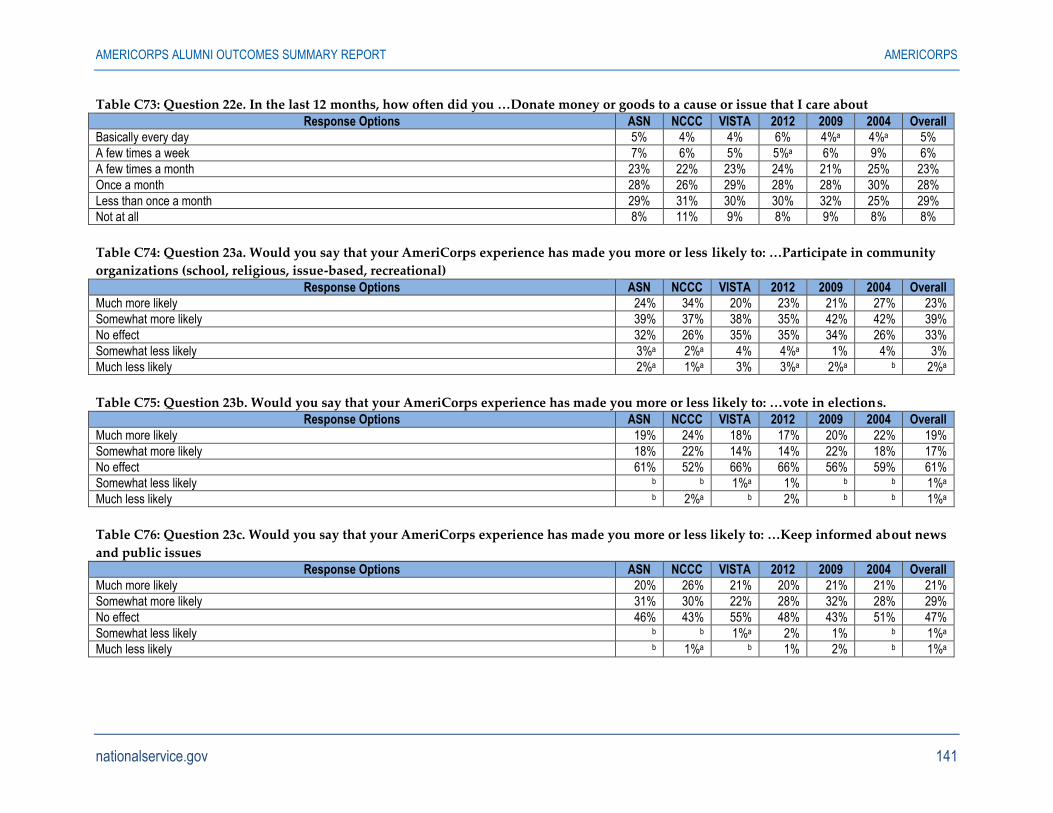
AMERICORPS ALUMNI OUTCOMES SUMMARY REPORT AMERICORPS
nationalservice.gov 141
Table C73: Question 22e. In the last 12 months, how often did you …Donate money or goods to a cause or issue that I care about
Response Options ASN NCCC VISTA 2012 2009 2004 Overall
Basically every day 5% 4% 4% 6% 4%a 4%a 5%
A few times a week 7% 6% 5% 5%a 6% 9% 6%
A few times a month 23% 22% 23% 24% 21% 25% 23%
Once a month 28% 26% 29% 28% 28% 30% 28%
Less than once a month 29% 31% 30% 30% 32% 25% 29%
Not at all 8% 11% 9% 8% 9% 8% 8%
Table C74: Question 23a. Would you say that your AmeriCorps experience has made you more or less likely to: …Participate in community
organizations (school, religious, issue-based, recreational)
Response Options ASN NCCC VISTA 2012 2009 2004 Overall
Much more likely 24% 34% 20% 23% 21% 27% 23%
Somewhat more likely 39% 37% 38% 35% 42% 42% 39%
No effect 32% 26% 35% 35% 34% 26% 33%
Somewhat less likely 3%a 2%a 4% 4%a 1% 4% 3%
Much less likely 2%a 1%a 3% 3%a 2%a b 2%a
Table C75: Question 23b. Would you say that your AmeriCorps experience has made you more or less likely to: …vote in elections. Response Options ASN NCCC VISTA 2012 2009 2004 Overall
Much more likely 19% 24% 18% 17% 20% 22% 19%
Somewhat more likely 18% 22% 14% 14% 22% 18% 17%
No effect 61% 52% 66% 66% 56% 59% 61%
Somewhat less likely b b 1%a 1% b b 1%a
Much less likely b 2%a b 2% b b 1%a
Table C76: Question 23c. Would you say that your AmeriCorps experience has made you more or less likely to: …Keep informed about news
and public issues Response Options ASN NCCC VISTA 2012 2009 2004 Overall
Much more likely 20% 26% 21% 20% 21% 21% 21%
Somewhat more likely 31% 30% 22% 28% 32% 28% 29%
No effect 46% 43% 55% 48% 43% 51% 47%
Somewhat less likely b b 1%a 2% 1% b 1%a
Much less likely b 1%a b 1% 2% b 1%a
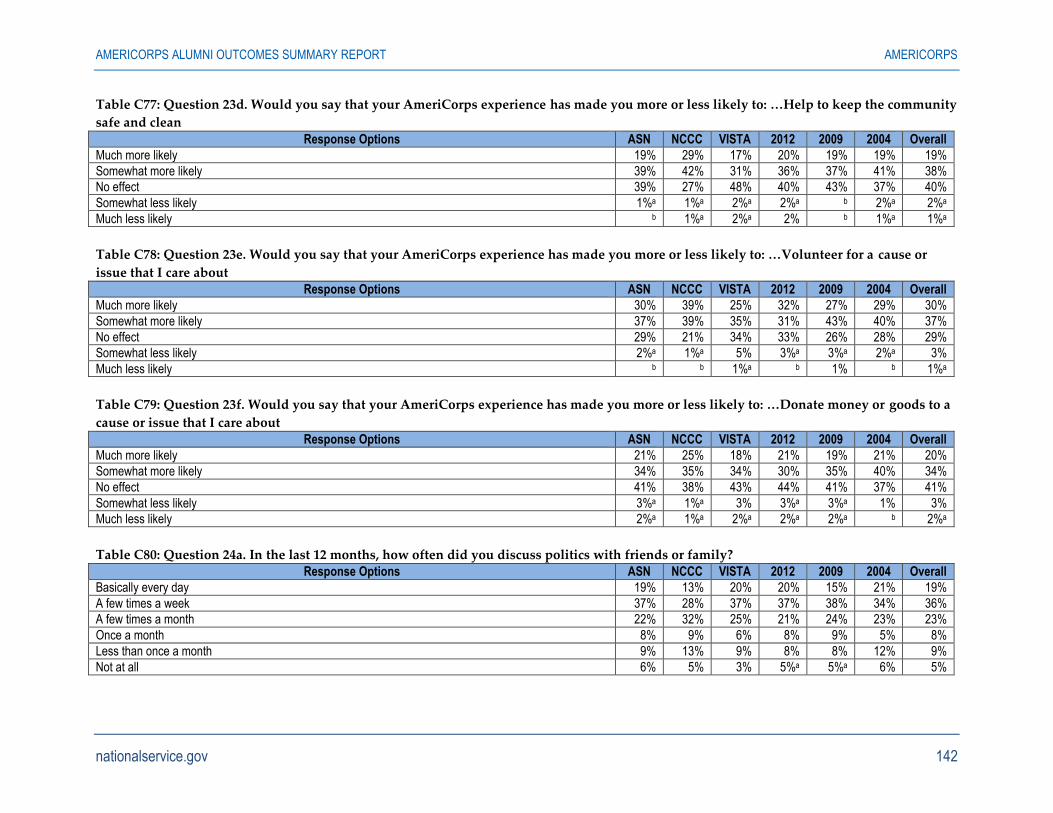
AMERICORPS ALUMNI OUTCOMES SUMMARY REPORT AMERICORPS
nationalservice.gov 142
Table C77: Question 23d. Would you say that your AmeriCorps experience has made you more or less likely to: …Help to keep the community
safe and clean
Response Options ASN NCCC VISTA 2012 2009 2004 Overall
Much more likely 19% 29% 17% 20% 19% 19% 19%
Somewhat more likely 39% 42% 31% 36% 37% 41% 38%
No effect 39% 27% 48% 40% 43% 37% 40%
Somewhat less likely 1%a 1%a 2%a 2%a b 2%a 2%a
Much less likely b 1%a 2%a 2% b 1%a 1%a
Table C78: Question 23e. Would you say that your AmeriCorps experience has made you more or less likely to: …Volunteer for a cause or
issue that I care about Response Options ASN NCCC VISTA 2012 2009 2004 Overall
Much more likely 30% 39% 25% 32% 27% 29% 30%
Somewhat more likely 37% 39% 35% 31% 43% 40% 37%
No effect 29% 21% 34% 33% 26% 28% 29%
Somewhat less likely 2%a 1%a 5% 3%a 3%a 2%a 3%
Much less likely b b 1%a b 1% b 1%a
Table C79: Question 23f. Would you say that your AmeriCorps experience has made you more or less likely to: …Donate money or goods to a
cause or issue that I care about Response Options ASN NCCC VISTA 2012 2009 2004 Overall
Much more likely 21% 25% 18% 21% 19% 21% 20%
Somewhat more likely 34% 35% 34% 30% 35% 40% 34%
No effect 41% 38% 43% 44% 41% 37% 41%
Somewhat less likely 3%a 1%a 3% 3%a 3%a 1% 3%
Much less likely 2%a 1%a 2%a 2%a 2%a b 2%a
Table C80: Question 24a. In the last 12 months, how often did you discuss politics with friends or family? Response Options ASN NCCC VISTA 2012 2009 2004 Overall
Basically every day 19% 13% 20% 20% 15% 21% 19%
A few times a week 37% 28% 37% 37% 38% 34% 36%
A few times a month 22% 32% 25% 21% 24% 23% 23%
Once a month 8% 9% 6% 8% 9% 5% 8%
Less than once a month 9% 13% 9% 8% 8% 12% 9%
Not at all 6% 5% 3% 5%a 5%a 6% 5%
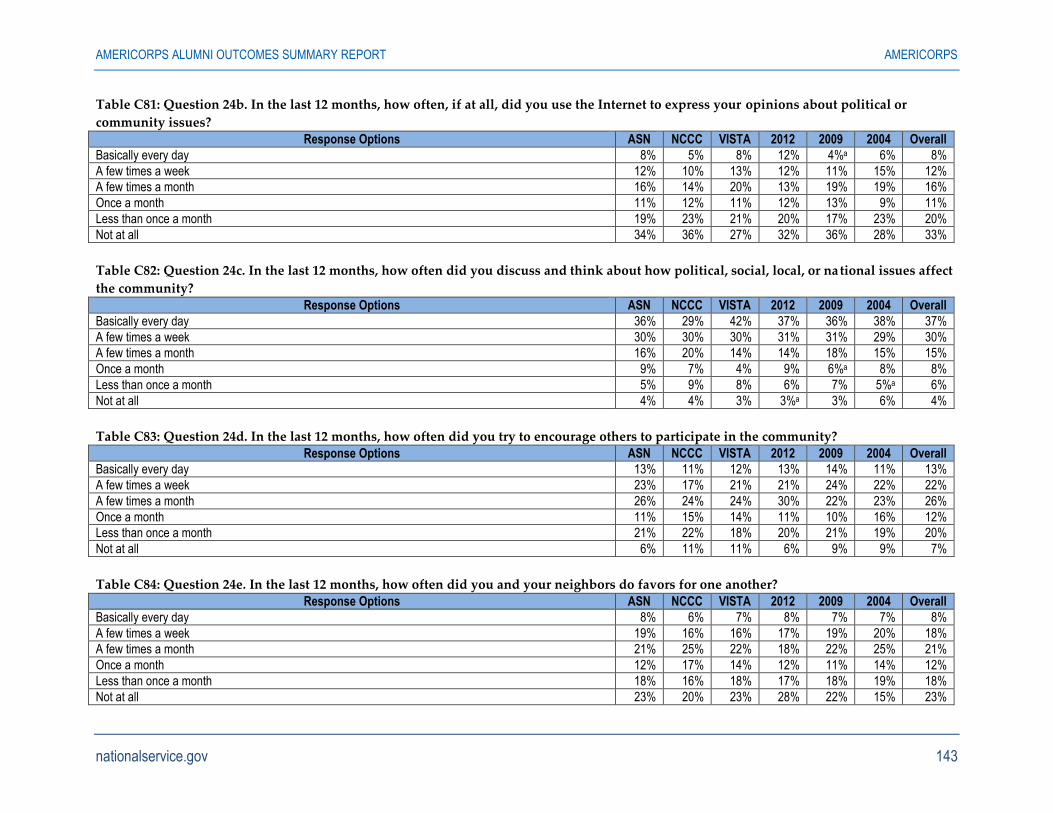
AMERICORPS ALUMNI OUTCOMES SUMMARY REPORT AMERICORPS
nationalservice.gov 143
Table C81: Question 24b. In the last 12 months, how often, if at all, did you use the Internet to express your opinions about political or
community issues?
Response Options ASN NCCC VISTA 2012 2009 2004 Overall
Basically every day 8% 5% 8% 12% 4%a 6% 8%
A few times a week 12% 10% 13% 12% 11% 15% 12%
A few times a month 16% 14% 20% 13% 19% 19% 16%
Once a month 11% 12% 11% 12% 13% 9% 11%
Less than once a month 19% 23% 21% 20% 17% 23% 20%
Not at all 34% 36% 27% 32% 36% 28% 33%
Table C82: Question 24c. In the last 12 months, how often did you discuss and think about how political, social, local, or national issues affect
the community?
Response Options ASN NCCC VISTA 2012 2009 2004 Overall
Basically every day 36% 29% 42% 37% 36% 38% 37%
A few times a week 30% 30% 30% 31% 31% 29% 30%
A few times a month 16% 20% 14% 14% 18% 15% 15%
Once a month 9% 7% 4% 9% 6%a 8% 8%
Less than once a month 5% 9% 8% 6% 7% 5%a 6%
Not at all 4% 4% 3% 3%a 3% 6% 4%
Table C83: Question 24d. In the last 12 months, how often did you try to encourage others to participate in the community?
Response Options ASN NCCC VISTA 2012 2009 2004 Overall
Basically every day 13% 11% 12% 13% 14% 11% 13%
A few times a week 23% 17% 21% 21% 24% 22% 22%
A few times a month 26% 24% 24% 30% 22% 23% 26%
Once a month 11% 15% 14% 11% 10% 16% 12%
Less than once a month 21% 22% 18% 20% 21% 19% 20%
Not at all 6% 11% 11% 6% 9% 9% 7%
Table C84: Question 24e. In the last 12 months, how often did you and your neighbors do favors for one another?
Response Options ASN NCCC VISTA 2012 2009 2004 Overall
Basically every day 8% 6% 7% 8% 7% 7% 8%
A few times a week 19% 16% 16% 17% 19% 20% 18%
A few times a month 21% 25% 22% 18% 22% 25% 21%
Once a month 12% 17% 14% 12% 11% 14% 12%
Less than once a month 18% 16% 18% 17% 18% 19% 18%
Not at all 23% 20% 23% 28% 22% 15% 23%
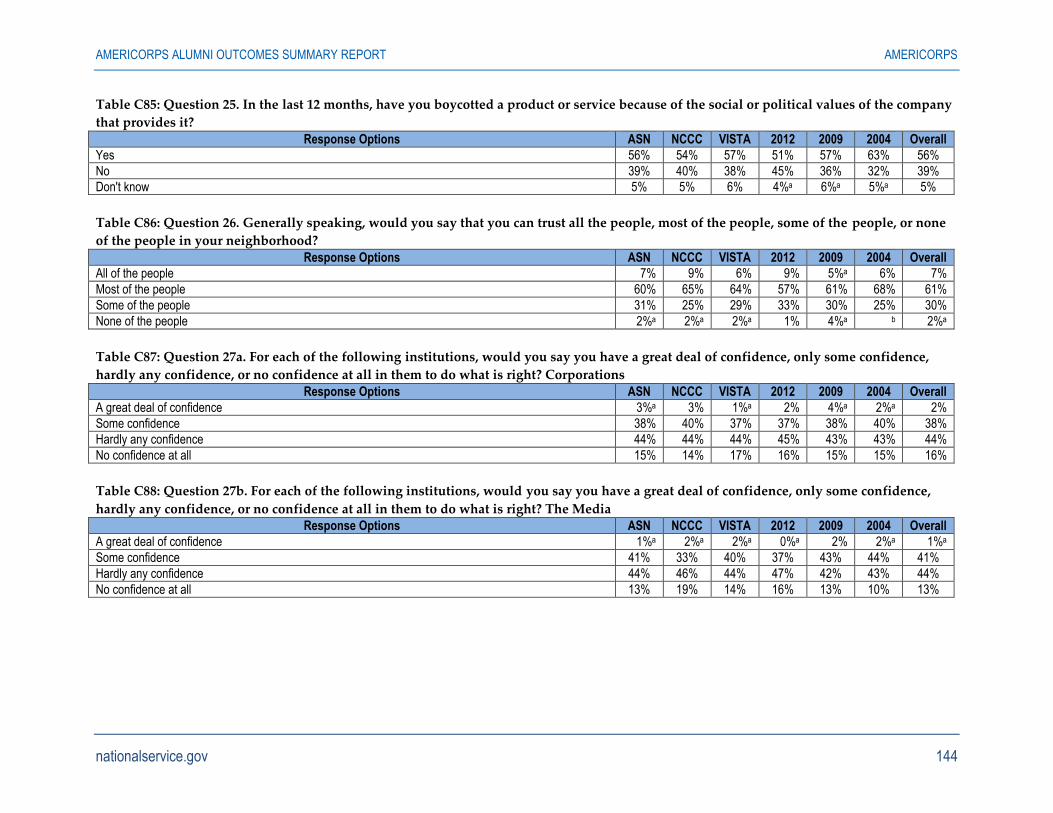
AMERICORPS ALUMNI OUTCOMES SUMMARY REPORT AMERICORPS
nationalservice.gov 144
Table C85: Question 25. In the last 12 months, have you boycotted a product or service because of the social or political values of the company
that provides it?
Response Options ASN NCCC VISTA 2012 2009 2004 Overall
Yes 56% 54% 57% 51% 57% 63% 56%
No 39% 40% 38% 45% 36% 32% 39%
Don't know 5% 5% 6% 4%a 6%a 5%a 5%
Table C86: Question 26. Generally speaking, would you say that you can trust all the people, most of the people, some of the people, or none
of the people in your neighborhood?
Response Options ASN NCCC VISTA 2012 2009 2004 Overall
All of the people 7% 9% 6% 9% 5%a 6% 7%
Most of the people 60% 65% 64% 57% 61% 68% 61%
Some of the people 31% 25% 29% 33% 30% 25% 30%
None of the people 2%a 2%a 2%a 1% 4%a b 2%a
Table C87: Question 27a. For each of the following institutions, would you say you have a great deal of confidence, only some confidence,
hardly any confidence, or no confidence at all in them to do what is right? Corporations
Response Options ASN NCCC VISTA 2012 2009 2004 Overall
A great deal of confidence 3%a 3% 1%a 2% 4%a 2%a 2%
Some confidence 38% 40% 37% 37% 38% 40% 38%
Hardly any confidence 44% 44% 44% 45% 43% 43% 44%
No confidence at all 15% 14% 17% 16% 15% 15% 16%
Table C88: Question 27b. For each of the following institutions, would you say you have a great deal of confidence, only some confidence,
hardly any confidence, or no confidence at all in them to do what is right? The Media Response Options ASN NCCC VISTA 2012 2009 2004 Overall
A great deal of confidence 1%a 2%a 2%a 0%a 2% 2%a 1%a
Some confidence 41% 33% 40% 37% 43% 44% 41%
Hardly any confidence 44% 46% 44% 47% 42% 43% 44%
No confidence at all 13% 19% 14% 16% 13% 10% 13%
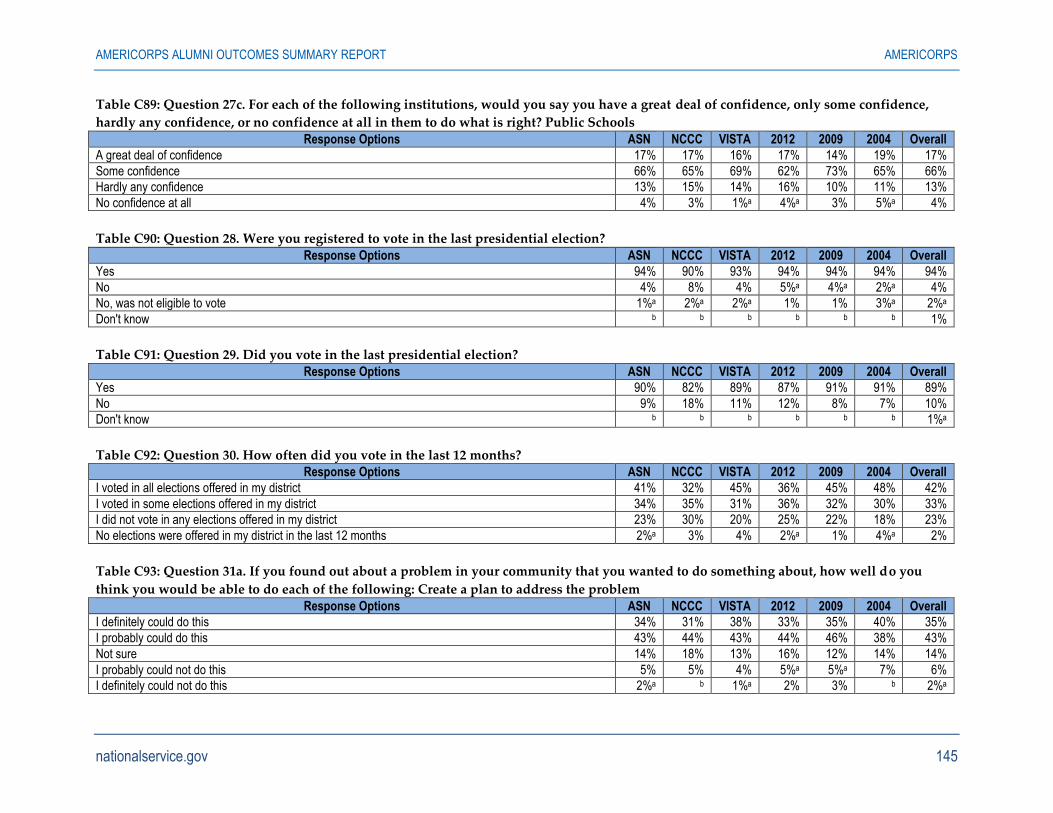
AMERICORPS ALUMNI OUTCOMES SUMMARY REPORT AMERICORPS
nationalservice.gov 145
Table C89: Question 27c. For each of the following institutions, would you say you have a great deal of confidence, only some confidence,
hardly any confidence, or no confidence at all in them to do what is right? Public Schools
Response Options ASN NCCC VISTA 2012 2009 2004 Overall
A great deal of confidence 17% 17% 16% 17% 14% 19% 17%
Some confidence 66% 65% 69% 62% 73% 65% 66%
Hardly any confidence 13% 15% 14% 16% 10% 11% 13%
No confidence at all 4% 3% 1%a 4%a 3% 5%a 4%
Table C90: Question 28. Were you registered to vote in the last presidential election?
Response Options ASN NCCC VISTA 2012 2009 2004 Overall
Yes 94% 90% 93% 94% 94% 94% 94%
No 4% 8% 4% 5%a 4%a 2%a 4%
No, was not eligible to vote 1%a 2%a 2%a 1% 1% 3%a 2%a
Don't know b b b b b b 1%
Table C91: Question 29. Did you vote in the last presidential election?
Response Options ASN NCCC VISTA 2012 2009 2004 Overall
Yes 90% 82% 89% 87% 91% 91% 89%
No 9% 18% 11% 12% 8% 7% 10%
Don't know b b b b b b 1%a
Table C92: Question 30. How often did you vote in the last 12 months? Response Options ASN NCCC VISTA 2012 2009 2004 Overall
I voted in all elections offered in my district 41% 32% 45% 36% 45% 48% 42%
I voted in some elections offered in my district 34% 35% 31% 36% 32% 30% 33%
I did not vote in any elections offered in my district 23% 30% 20% 25% 22% 18% 23%
No elections were offered in my district in the last 12 months 2%a 3% 4% 2%a 1% 4%a 2%
Table C93: Question 31a. If you found out about a problem in your community that you wanted to do something about, how well do you
think you would be able to do each of the following: Create a plan to address the problem
Response Options ASN NCCC VISTA 2012 2009 2004 Overall
I definitely could do this 34% 31% 38% 33% 35% 40% 35%
I probably could do this 43% 44% 43% 44% 46% 38% 43%
Not sure 14% 18% 13% 16% 12% 14% 14%
I probably could not do this 5% 5% 4% 5%a 5%a 7% 6%
I definitely could not do this 2%a b 1%a 2% 3% b 2%a
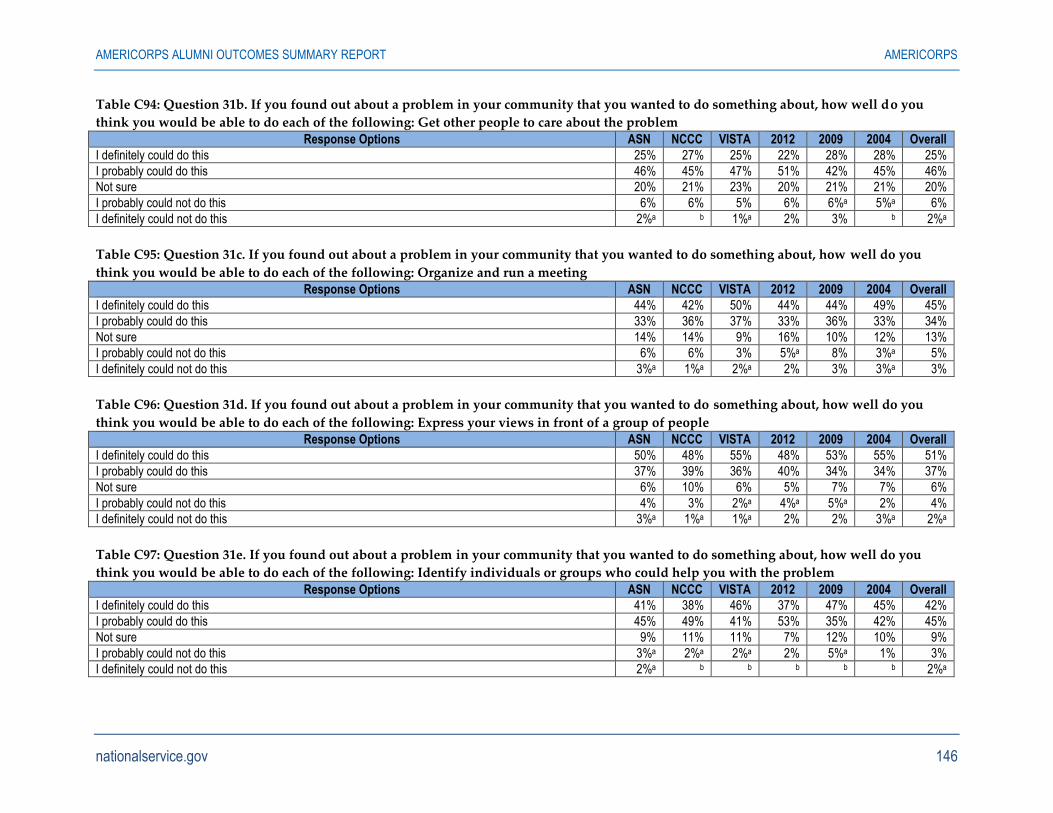
AMERICORPS ALUMNI OUTCOMES SUMMARY REPORT AMERICORPS
nationalservice.gov 146
Table C94: Question 31b. If you found out about a problem in your community that you wanted to do something about, how well do you
think you would be able to do each of the following: Get other people to care about the problem
Response Options ASN NCCC VISTA 2012 2009 2004 Overall
I definitely could do this 25% 27% 25% 22% 28% 28% 25%
I probably could do this 46% 45% 47% 51% 42% 45% 46%
Not sure 20% 21% 23% 20% 21% 21% 20%
I probably could not do this 6% 6% 5% 6% 6%a 5%a 6%
I definitely could not do this 2%a b 1%a 2% 3% b 2%a
Table C95: Question 31c. If you found out about a problem in your community that you wanted to do something about, how well do you
think you would be able to do each of the following: Organize and run a meeting Response Options ASN NCCC VISTA 2012 2009 2004 Overall
I definitely could do this 44% 42% 50% 44% 44% 49% 45%
I probably could do this 33% 36% 37% 33% 36% 33% 34%
Not sure 14% 14% 9% 16% 10% 12% 13%
I probably could not do this 6% 6% 3% 5%a 8% 3%a 5%
I definitely could not do this 3%a 1%a 2%a 2% 3% 3%a 3%
Table C96: Question 31d. If you found out about a problem in your community that you wanted to do something about, how well do you
think you would be able to do each of the following: Express your views in front of a group of people Response Options ASN NCCC VISTA 2012 2009 2004 Overall
I definitely could do this 50% 48% 55% 48% 53% 55% 51%
I probably could do this 37% 39% 36% 40% 34% 34% 37%
Not sure 6% 10% 6% 5% 7% 7% 6%
I probably could not do this 4% 3% 2%a 4%a 5%a 2% 4%
I definitely could not do this 3%a 1%a 1%a 2% 2% 3%a 2%a
Table C97: Question 31e. If you found out about a problem in your community that you wanted to do something about, how well do you
think you would be able to do each of the following: Identify individuals or groups who could help you with the problem
Response Options ASN NCCC VISTA 2012 2009 2004 Overall
I definitely could do this 41% 38% 46% 37% 47% 45% 42%
I probably could do this 45% 49% 41% 53% 35% 42% 45%
Not sure 9% 11% 11% 7% 12% 10% 9%
I probably could not do this 3%a 2%a 2%a 2% 5%a 1% 3%
I definitely could not do this 2%a b b b b b 2%a
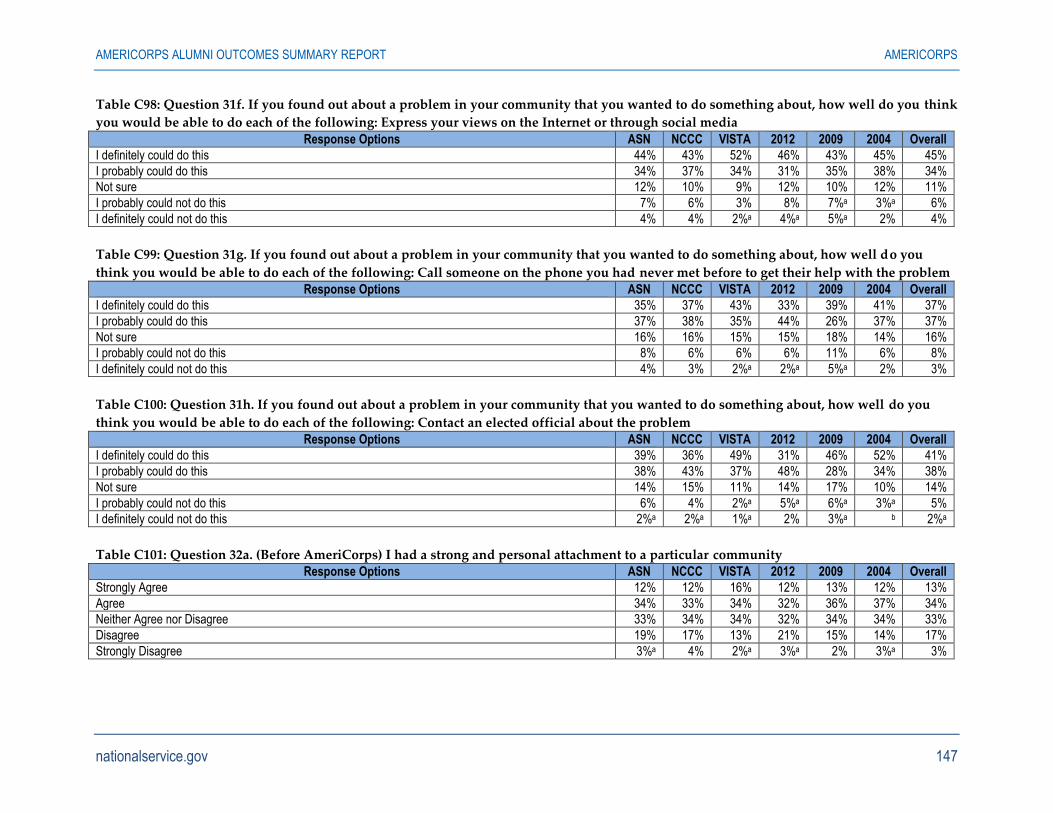
AMERICORPS ALUMNI OUTCOMES SUMMARY REPORT AMERICORPS
nationalservice.gov 147
Table C98: Question 31f. If you found out about a problem in your community that you wanted to do something about, how well do you think
you would be able to do each of the following: Express your views on the Internet or through social media
Response Options ASN NCCC VISTA 2012 2009 2004 Overall
I definitely could do this 44% 43% 52% 46% 43% 45% 45%
I probably could do this 34% 37% 34% 31% 35% 38% 34%
Not sure 12% 10% 9% 12% 10% 12% 11%
I probably could not do this 7% 6% 3% 8% 7%a 3%a 6%
I definitely could not do this 4% 4% 2%a 4%a 5%a 2% 4%
Table C99: Question 31g. If you found out about a problem in your community that you wanted to do something about, how well do you
think you would be able to do each of the following: Call someone on the phone you had never met before to get their help with the problem Response Options ASN NCCC VISTA 2012 2009 2004 Overall
I definitely could do this 35% 37% 43% 33% 39% 41% 37%
I probably could do this 37% 38% 35% 44% 26% 37% 37%
Not sure 16% 16% 15% 15% 18% 14% 16%
I probably could not do this 8% 6% 6% 6% 11% 6% 8%
I definitely could not do this 4% 3% 2%a 2%a 5%a 2% 3%
Table C100: Question 31h. If you found out about a problem in your community that you wanted to do something about, how well do you
think you would be able to do each of the following: Contact an elected official about the problem Response Options ASN NCCC VISTA 2012 2009 2004 Overall
I definitely could do this 39% 36% 49% 31% 46% 52% 41%
I probably could do this 38% 43% 37% 48% 28% 34% 38%
Not sure 14% 15% 11% 14% 17% 10% 14%
I probably could not do this 6% 4% 2%a 5%a 6%a 3%a 5%
I definitely could not do this 2%a 2%a 1%a 2% 3%a b 2%a
Table C101: Question 32a. (Before AmeriCorps) I had a strong and personal attachment to a particular community Response Options ASN NCCC VISTA 2012 2009 2004 Overall
Strongly Agree 12% 12% 16% 12% 13% 12% 13%
Agree 34% 33% 34% 32% 36% 37% 34%
Neither Agree nor Disagree 33% 34% 34% 32% 34% 34% 33%
Disagree 19% 17% 13% 21% 15% 14% 17%
Strongly Disagree 3%a 4% 2%a 3%a 2% 3%a 3%
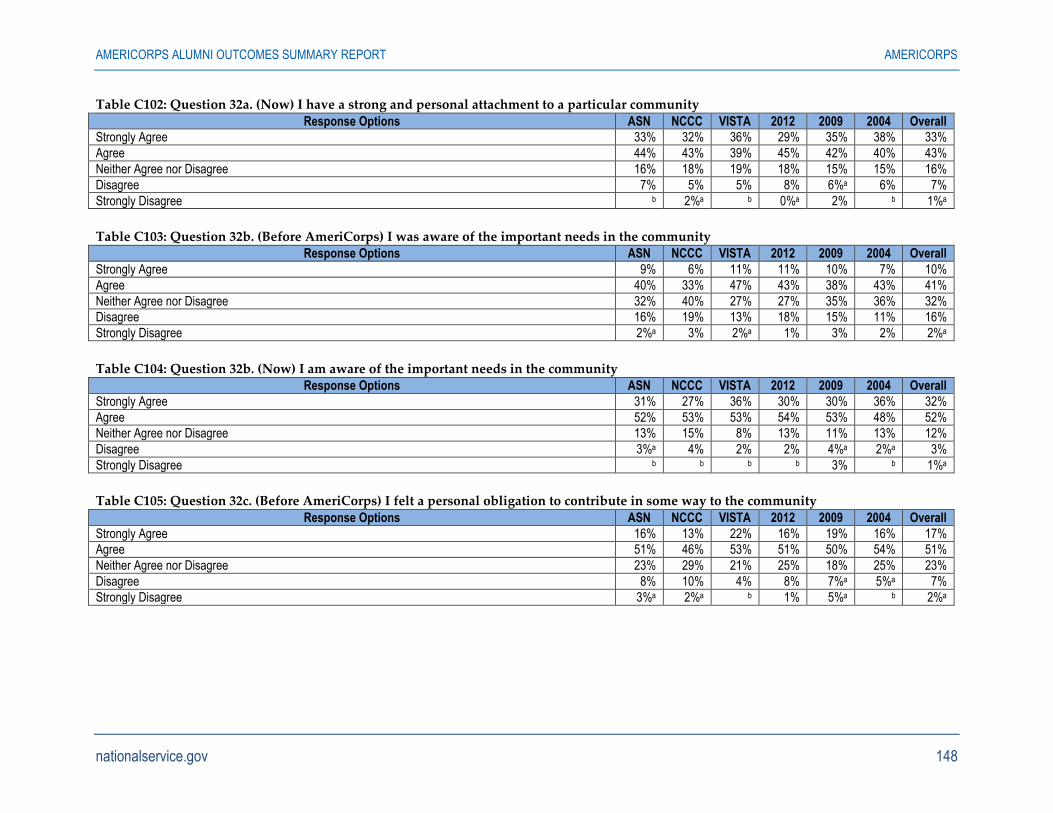
AMERICORPS ALUMNI OUTCOMES SUMMARY REPORT AMERICORPS
nationalservice.gov 148
Table C102: Question 32a. (Now) I have a strong and personal attachment to a particular community
Response Options ASN NCCC VISTA 2012 2009 2004 Overall
Strongly Agree 33% 32% 36% 29% 35% 38% 33%
Agree 44% 43% 39% 45% 42% 40% 43%
Neither Agree nor Disagree 16% 18% 19% 18% 15% 15% 16%
Disagree 7% 5% 5% 8% 6%a 6% 7%
Strongly Disagree b 2%a b 0%a 2% b 1%a
Table C103: Question 32b. (Before AmeriCorps) I was aware of the important needs in the community Response Options ASN NCCC VISTA 2012 2009 2004 Overall
Strongly Agree 9% 6% 11% 11% 10% 7% 10%
Agree 40% 33% 47% 43% 38% 43% 41%
Neither Agree nor Disagree 32% 40% 27% 27% 35% 36% 32%
Disagree 16% 19% 13% 18% 15% 11% 16%
Strongly Disagree 2%a 3% 2%a 1% 3% 2% 2%a
Table C104: Question 32b. (Now) I am aware of the important needs in the community Response Options ASN NCCC VISTA 2012 2009 2004 Overall
Strongly Agree 31% 27% 36% 30% 30% 36% 32%
Agree 52% 53% 53% 54% 53% 48% 52%
Neither Agree nor Disagree 13% 15% 8% 13% 11% 13% 12%
Disagree 3%a 4% 2% 2% 4%a 2%a 3%
Strongly Disagree b b b b 3% b 1%a
Table C105: Question 32c. (Before AmeriCorps) I felt a personal obligation to contribute in some way to the community
Response Options ASN NCCC VISTA 2012 2009 2004 Overall
Strongly Agree 16% 13% 22% 16% 19% 16% 17%
Agree 51% 46% 53% 51% 50% 54% 51%
Neither Agree nor Disagree 23% 29% 21% 25% 18% 25% 23%
Disagree 8% 10% 4% 8% 7%a 5%a 7%
Strongly Disagree 3%a 2%a b 1% 5%a b 2%a
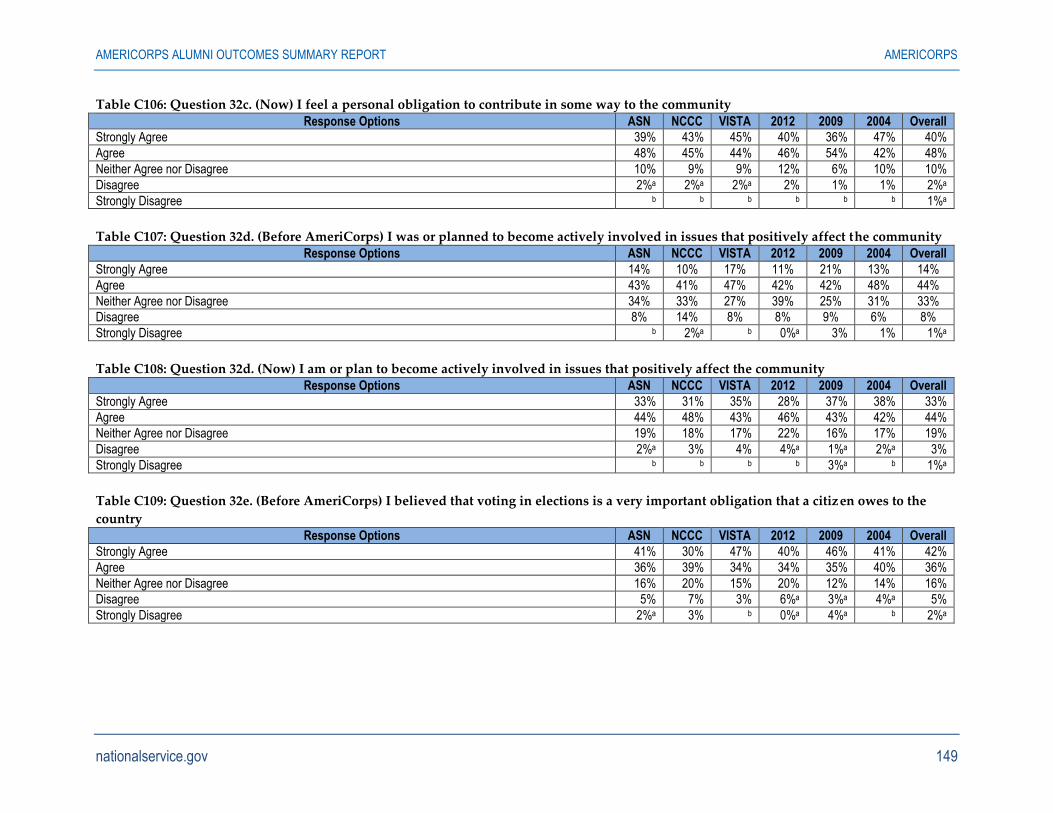
AMERICORPS ALUMNI OUTCOMES SUMMARY REPORT AMERICORPS
nationalservice.gov 149
Table C106: Question 32c. (Now) I feel a personal obligation to contribute in some way to the community
Response Options ASN NCCC VISTA 2012 2009 2004 Overall
Strongly Agree 39% 43% 45% 40% 36% 47% 40%
Agree 48% 45% 44% 46% 54% 42% 48%
Neither Agree nor Disagree 10% 9% 9% 12% 6% 10% 10%
Disagree 2%a 2%a 2%a 2% 1% 1% 2%a
Strongly Disagree b b b b b b 1%a
Table C107: Question 32d. (Before AmeriCorps) I was or planned to become actively involved in issues that positively affect the community Response Options ASN NCCC VISTA 2012 2009 2004 Overall
Strongly Agree 14% 10% 17% 11% 21% 13% 14%
Agree 43% 41% 47% 42% 42% 48% 44%
Neither Agree nor Disagree 34% 33% 27% 39% 25% 31% 33%
Disagree 8% 14% 8% 8% 9% 6% 8%
Strongly Disagree b 2%a b 0%a 3% 1% 1%a
Table C108: Question 32d. (Now) I am or plan to become actively involved in issues that positively affect the community Response Options ASN NCCC VISTA 2012 2009 2004 Overall
Strongly Agree 33% 31% 35% 28% 37% 38% 33%
Agree 44% 48% 43% 46% 43% 42% 44%
Neither Agree nor Disagree 19% 18% 17% 22% 16% 17% 19%
Disagree 2%a 3% 4% 4%a 1%a 2%a 3%
Strongly Disagree b b b b 3%a b 1%a
Table C109: Question 32e. (Before AmeriCorps) I believed that voting in elections is a very important obligation that a citizen owes to the
country Response Options ASN NCCC VISTA 2012 2009 2004 Overall
Strongly Agree 41% 30% 47% 40% 46% 41% 42%
Agree 36% 39% 34% 34% 35% 40% 36%
Neither Agree nor Disagree 16% 20% 15% 20% 12% 14% 16%
Disagree 5% 7% 3% 6%a 3%a 4%a 5%
Strongly Disagree 2%a 3% b 0%a 4%a b 2%a
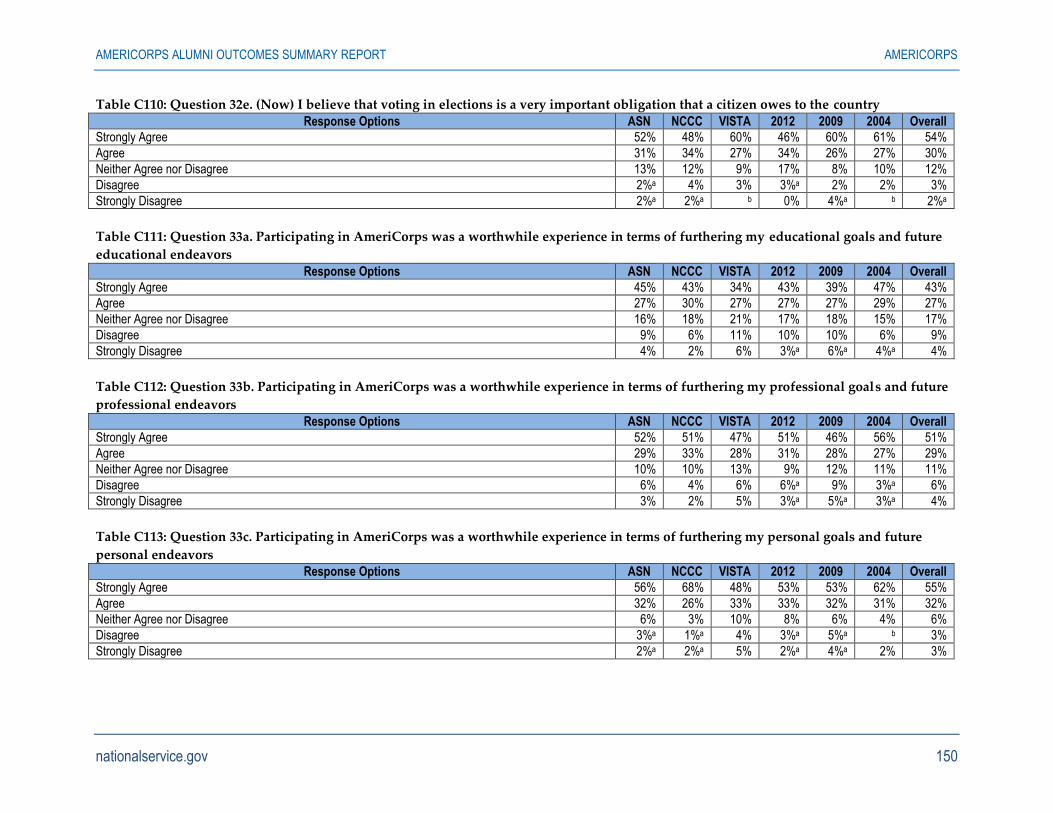
AMERICORPS ALUMNI OUTCOMES SUMMARY REPORT AMERICORPS
nationalservice.gov 150
Table C110: Question 32e. (Now) I believe that voting in elections is a very important obligation that a citizen owes to the country
Response Options ASN NCCC VISTA 2012 2009 2004 Overall
Strongly Agree 52% 48% 60% 46% 60% 61% 54%
Agree 31% 34% 27% 34% 26% 27% 30%
Neither Agree nor Disagree 13% 12% 9% 17% 8% 10% 12%
Disagree 2%a 4% 3% 3%a 2% 2% 3%
Strongly Disagree 2%a 2%a b 0% 4%a b 2%a
Table C111: Question 33a. Participating in AmeriCorps was a worthwhile experience in terms of furthering my educational goals and future
educational endeavors
Response Options ASN NCCC VISTA 2012 2009 2004 Overall
Strongly Agree 45% 43% 34% 43% 39% 47% 43%
Agree 27% 30% 27% 27% 27% 29% 27%
Neither Agree nor Disagree 16% 18% 21% 17% 18% 15% 17%
Disagree 9% 6% 11% 10% 10% 6% 9%
Strongly Disagree 4% 2% 6% 3%a 6%a 4%a 4%
Table C112: Question 33b. Participating in AmeriCorps was a worthwhile experience in terms of furthering my professional goals and future
professional endeavors
Response Options ASN NCCC VISTA 2012 2009 2004 Overall
Strongly Agree 52% 51% 47% 51% 46% 56% 51%
Agree 29% 33% 28% 31% 28% 27% 29%
Neither Agree nor Disagree 10% 10% 13% 9% 12% 11% 11%
Disagree 6% 4% 6% 6%a 9% 3%a 6%
Strongly Disagree 3% 2% 5% 3%a 5%a 3%a 4%
Table C113: Question 33c. Participating in AmeriCorps was a worthwhile experience in terms of furthering my personal goals and future
personal endeavors Response Options ASN NCCC VISTA 2012 2009 2004 Overall
Strongly Agree 56% 68% 48% 53% 53% 62% 55%
Agree 32% 26% 33% 33% 32% 31% 32%
Neither Agree nor Disagree 6% 3% 10% 8% 6% 4% 6%
Disagree 3%a 1%a 4% 3%a 5%a b 3%
Strongly Disagree 2%a 2%a 5% 2%a 4%a 2% 3%
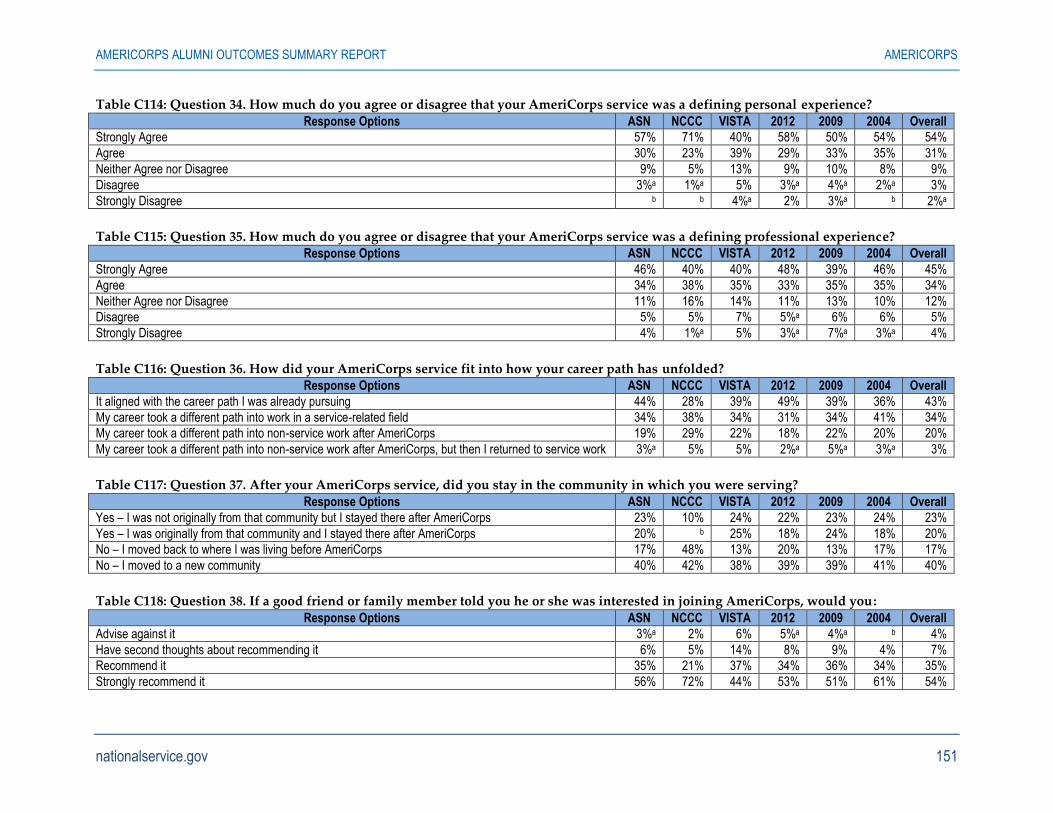
AMERICORPS ALUMNI OUTCOMES SUMMARY REPORT AMERICORPS
nationalservice.gov 151
Table C114: Question 34. How much do you agree or disagree that your AmeriCorps service was a defining personal experience?
Response Options ASN NCCC VISTA 2012 2009 2004 Overall
Strongly Agree 57% 71% 40% 58% 50% 54% 54%
Agree 30% 23% 39% 29% 33% 35% 31%
Neither Agree nor Disagree 9% 5% 13% 9% 10% 8% 9%
Disagree 3%a 1%a 5% 3%a 4%a 2%a 3%
Strongly Disagree b b 4%a 2% 3%a b 2%a
Table C115: Question 35. How much do you agree or disagree that your AmeriCorps service was a defining professional experience? Response Options ASN NCCC VISTA 2012 2009 2004 Overall
Strongly Agree 46% 40% 40% 48% 39% 46% 45%
Agree 34% 38% 35% 33% 35% 35% 34%
Neither Agree nor Disagree 11% 16% 14% 11% 13% 10% 12%
Disagree 5% 5% 7% 5%a 6% 6% 5%
Strongly Disagree 4% 1%a 5% 3%a 7%a 3%a 4%
Table C116: Question 36. How did your AmeriCorps service fit into how your career path has unfolded? Response Options ASN NCCC VISTA 2012 2009 2004 Overall
It aligned with the career path I was already pursuing 44% 28% 39% 49% 39% 36% 43%
My career took a different path into work in a service-related field 34% 38% 34% 31% 34% 41% 34%
My career took a different path into non-service work after AmeriCorps 19% 29% 22% 18% 22% 20% 20%
My career took a different path into non-service work after AmeriCorps, but then I returned to service work 3%a 5% 5% 2%a 5%a 3%a 3%
Table C117: Question 37. After your AmeriCorps service, did you stay in the community in which you were serving?
Response Options ASN NCCC VISTA 2012 2009 2004 Overall
Yes – I was not originally from that community but I stayed there after AmeriCorps 23% 10% 24% 22% 23% 24% 23%
Yes – I was originally from that community and I stayed there after AmeriCorps 20% b 25% 18% 24% 18% 20%
No – I moved back to where I was living before AmeriCorps 17% 48% 13% 20% 13% 17% 17%
No – I moved to a new community 40% 42% 38% 39% 39% 41% 40%
Table C118: Question 38. If a good friend or family member told you he or she was interested in joining AmeriCorps, would you:
Response Options ASN NCCC VISTA 2012 2009 2004 Overall
Advise against it 3%a 2% 6% 5%a 4%a b 4%
Have second thoughts about recommending it 6% 5% 14% 8% 9% 4% 7%
Recommend it 35% 21% 37% 34% 36% 34% 35%
Strongly recommend it 56% 72% 44% 53% 51% 61% 54%
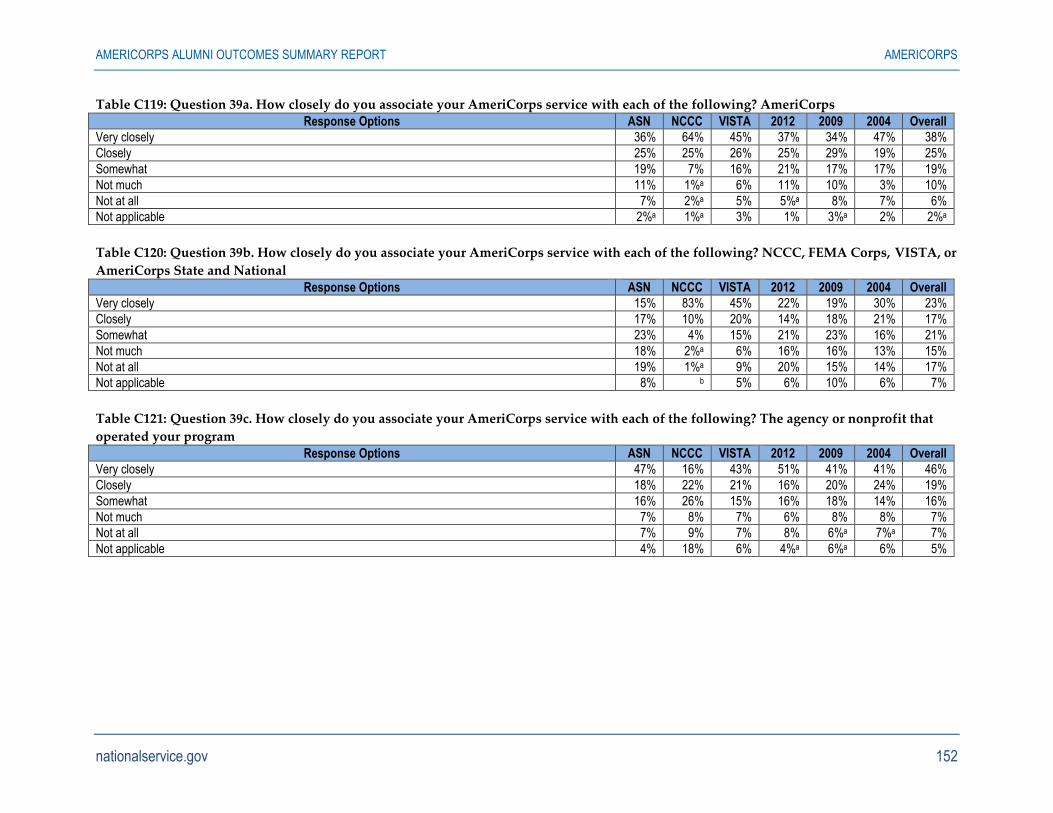
AMERICORPS ALUMNI OUTCOMES SUMMARY REPORT AMERICORPS
nationalservice.gov 152
Table C119: Question 39a. How closely do you associate your AmeriCorps service with each of the following? AmeriCorps
Response Options ASN NCCC VISTA 2012 2009 2004 Overall
Very closely 36% 64% 45% 37% 34% 47% 38%
Closely 25% 25% 26% 25% 29% 19% 25%
Somewhat 19% 7% 16% 21% 17% 17% 19%
Not much 11% 1%a 6% 11% 10% 3% 10%
Not at all 7% 2%a 5% 5%a 8% 7% 6%
Not applicable 2%a 1%a 3% 1% 3%a 2% 2%a
Table C120: Question 39b. How closely do you associate your AmeriCorps service with each of the following? NCCC, FEMA Corps, VISTA, or
AmeriCorps State and National
Response Options ASN NCCC VISTA 2012 2009 2004 Overall
Very closely 15% 83% 45% 22% 19% 30% 23%
Closely 17% 10% 20% 14% 18% 21% 17%
Somewhat 23% 4% 15% 21% 23% 16% 21%
Not much 18% 2%a 6% 16% 16% 13% 15%
Not at all 19% 1%a 9% 20% 15% 14% 17%
Not applicable 8% b 5% 6% 10% 6% 7%
Table C121: Question 39c. How closely do you associate your AmeriCorps service with each of the following? The agency or nonprofit that
operated your program
Response Options ASN NCCC VISTA 2012 2009 2004 Overall
Very closely 47% 16% 43% 51% 41% 41% 46%
Closely 18% 22% 21% 16% 20% 24% 19%
Somewhat 16% 26% 15% 16% 18% 14% 16%
Not much 7% 8% 7% 6% 8% 8% 7%
Not at all 7% 9% 7% 8% 6%a 7%a 7%
Not applicable 4% 18% 6% 4%a 6%a 6% 5%
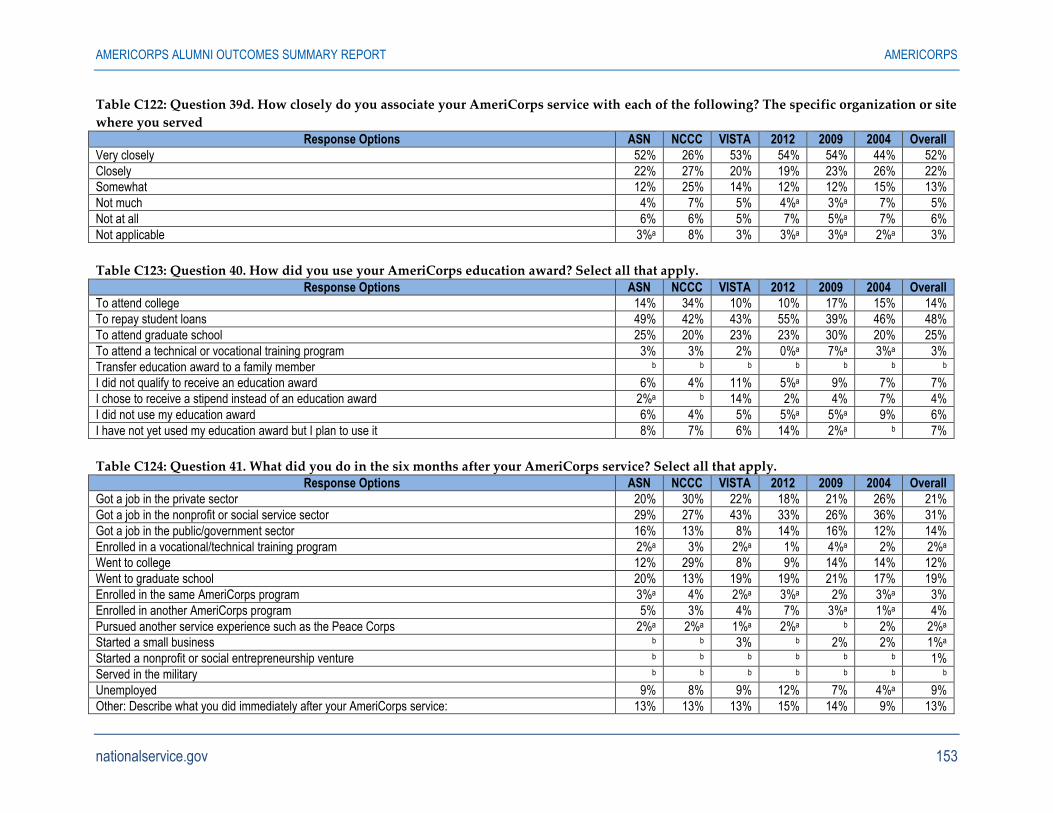
AMERICORPS ALUMNI OUTCOMES SUMMARY REPORT AMERICORPS
nationalservice.gov 153
Table C122: Question 39d. How closely do you associate your AmeriCorps service with each of the following? The specific organization or site
where you served
Response Options ASN NCCC VISTA 2012 2009 2004 Overall
Very closely 52% 26% 53% 54% 54% 44% 52%
Closely 22% 27% 20% 19% 23% 26% 22%
Somewhat 12% 25% 14% 12% 12% 15% 13%
Not much 4% 7% 5% 4%a 3%a 7% 5%
Not at all 6% 6% 5% 7% 5%a 7% 6%
Not applicable 3%a 8% 3% 3%a 3%a 2%a 3%
Table C123: Question 40. How did you use your AmeriCorps education award? Select all that apply.
Response Options ASN NCCC VISTA 2012 2009 2004 Overall
To attend college 14% 34% 10% 10% 17% 15% 14%
To repay student loans 49% 42% 43% 55% 39% 46% 48%
To attend graduate school 25% 20% 23% 23% 30% 20% 25%
To attend a technical or vocational training program 3% 3% 2% 0%a 7%a 3%a 3%
Transfer education award to a family member b b b b b b b
I did not qualify to receive an education award 6% 4% 11% 5%a 9% 7% 7%
I chose to receive a stipend instead of an education award 2%a b 14% 2% 4% 7% 4%
I did not use my education award 6% 4% 5% 5%a 5%a 9% 6%
I have not yet used my education award but I plan to use it 8% 7% 6% 14% 2%a b 7%
Table C124: Question 41. What did you do in the six months after your AmeriCorps service? Select all that apply. Response Options ASN NCCC VISTA 2012 2009 2004 Overall
Got a job in the private sector 20% 30% 22% 18% 21% 26% 21%
Got a job in the nonprofit or social service sector 29% 27% 43% 33% 26% 36% 31%
Got a job in the public/government sector 16% 13% 8% 14% 16% 12% 14%
Enrolled in a vocational/technical training program 2%a 3% 2%a 1% 4%a 2% 2%a
Went to college 12% 29% 8% 9% 14% 14% 12%
Went to graduate school 20% 13% 19% 19% 21% 17% 19%
Enrolled in the same AmeriCorps program 3%a 4% 2%a 3%a 2% 3%a 3%
Enrolled in another AmeriCorps program 5% 3% 4% 7% 3%a 1%a 4%
Pursued another service experience such as the Peace Corps 2%a 2%a 1%a 2%a b 2% 2%a
Started a small business b b 3% b 2% 2% 1%a
Started a nonprofit or social entrepreneurship venture b b b b b b 1%
Served in the military b b b b b b b
Unemployed 9% 8% 9% 12% 7% 4%a 9%
Other: Describe what you did immediately after your AmeriCorps service: 13% 13% 13% 15% 14% 9% 13%
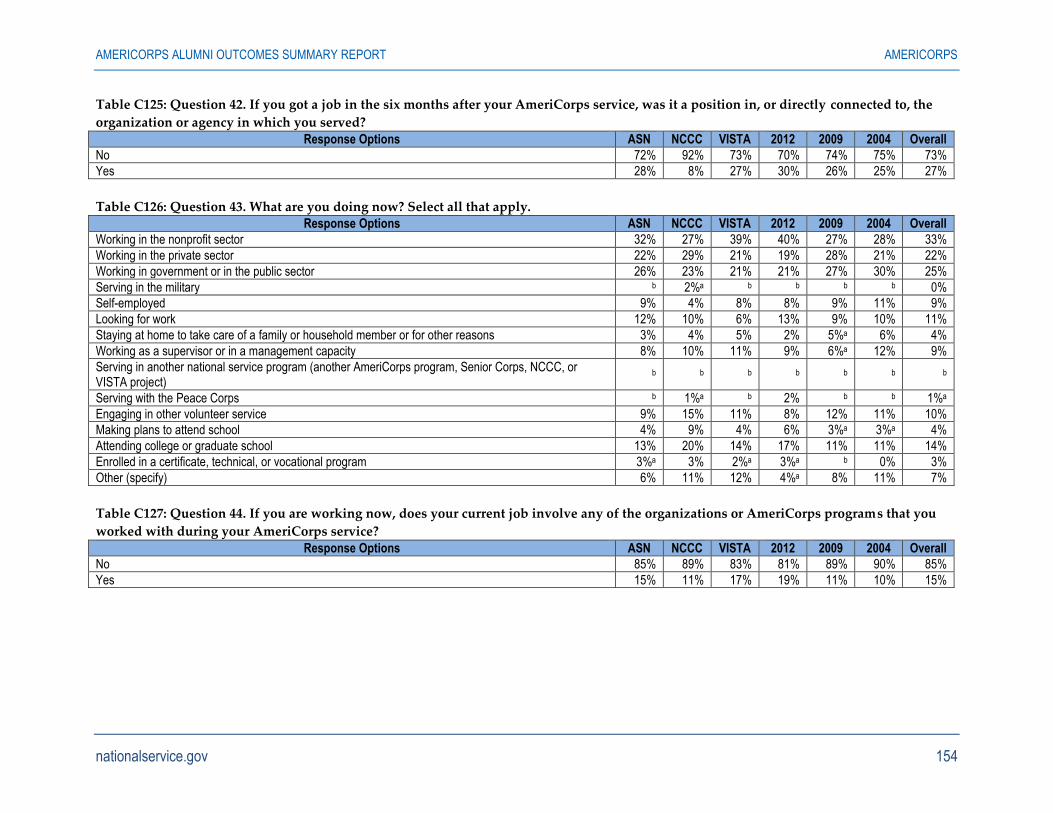
AMERICORPS ALUMNI OUTCOMES SUMMARY REPORT AMERICORPS
nationalservice.gov 154
Table C125: Question 42. If you got a job in the six months after your AmeriCorps service, was it a position in, or directly connected to, the
organization or agency in which you served?
Response Options ASN NCCC VISTA 2012 2009 2004 Overall
No 72% 92% 73% 70% 74% 75% 73%
Yes 28% 8% 27% 30% 26% 25% 27%
Table C126: Question 43. What are you doing now? Select all that apply. Response Options ASN NCCC VISTA 2012 2009 2004 Overall
Working in the nonprofit sector 32% 27% 39% 40% 27% 28% 33%
Working in the private sector 22% 29% 21% 19% 28% 21% 22%
Working in government or in the public sector 26% 23% 21% 21% 27% 30% 25%
Serving in the military b 2%a b b b b 0%
Self-employed 9% 4% 8% 8% 9% 11% 9%
Looking for work 12% 10% 6% 13% 9% 10% 11%
Staying at home to take care of a family or household member or for other reasons 3% 4% 5% 2% 5%a 6% 4%
Working as a supervisor or in a management capacity 8% 10% 11% 9% 6%a 12% 9%
Serving in another national service program (another AmeriCorps program, Senior Corps, NCCC, or VISTA project)
b b b b b b b
Serving with the Peace Corps b 1%a b 2% b b 1%a
Engaging in other volunteer service 9% 15% 11% 8% 12% 11% 10%
Making plans to attend school 4% 9% 4% 6% 3%a 3%a 4%
Attending college or graduate school 13% 20% 14% 17% 11% 11% 14%
Enrolled in a certificate, technical, or vocational program 3%a 3% 2%a 3%a b 0% 3%
Other (specify) 6% 11% 12% 4%a 8% 11% 7%
Table C127: Question 44. If you are working now, does your current job involve any of the organizations or AmeriCorps programs that you
worked with during your AmeriCorps service?
Response Options ASN NCCC VISTA 2012 2009 2004 Overall
No 85% 89% 83% 81% 89% 90% 85%
Yes 15% 11% 17% 19% 11% 10% 15%
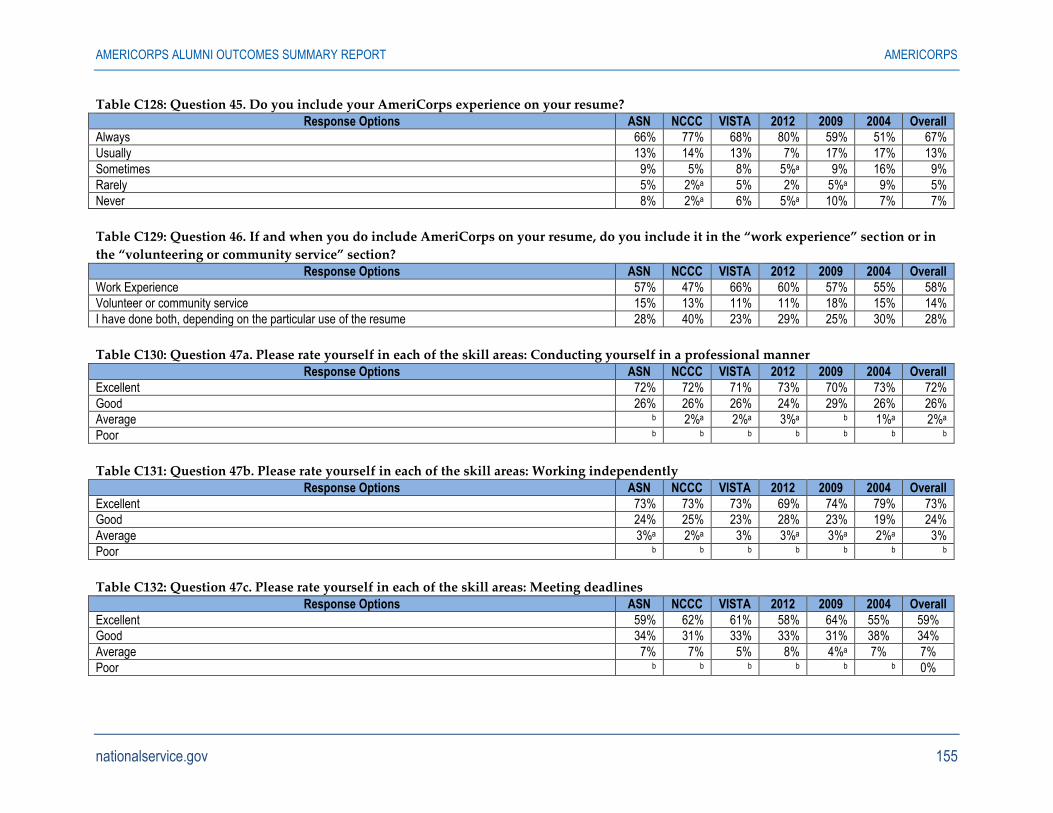
AMERICORPS ALUMNI OUTCOMES SUMMARY REPORT AMERICORPS
nationalservice.gov 155
Table C128: Question 45. Do you include your AmeriCorps experience on your resume?
Response Options ASN NCCC VISTA 2012 2009 2004 Overall
Always 66% 77% 68% 80% 59% 51% 67%
Usually 13% 14% 13% 7% 17% 17% 13%
Sometimes 9% 5% 8% 5%a 9% 16% 9%
Rarely 5% 2%a 5% 2% 5%a 9% 5%
Never 8% 2%a 6% 5%a 10% 7% 7%
Table C129: Question 46. If and when you do include AmeriCorps on your resume, do you include it in the “work experience” section or in
the “volunteering or community service” section?
Response Options ASN NCCC VISTA 2012 2009 2004 Overall
Work Experience 57% 47% 66% 60% 57% 55% 58%
Volunteer or community service 15% 13% 11% 11% 18% 15% 14%
I have done both, depending on the particular use of the resume 28% 40% 23% 29% 25% 30% 28%
Table C130: Question 47a. Please rate yourself in each of the skill areas: Conducting yourself in a professional manner
Response Options ASN NCCC VISTA 2012 2009 2004 Overall
Excellent 72% 72% 71% 73% 70% 73% 72%
Good 26% 26% 26% 24% 29% 26% 26%
Average b 2%a 2%a 3%a b 1%a 2%a
Poor b b b b b b b
Table C131: Question 47b. Please rate yourself in each of the skill areas: Working independently
Response Options ASN NCCC VISTA 2012 2009 2004 Overall
Excellent 73% 73% 73% 69% 74% 79% 73%
Good 24% 25% 23% 28% 23% 19% 24%
Average 3%a 2%a 3% 3%a 3%a 2%a 3%
Poor b b b b b b b
Table C132: Question 47c. Please rate yourself in each of the skill areas: Meeting deadlines
Response Options ASN NCCC VISTA 2012 2009 2004 Overall
Excellent 59% 62% 61% 58% 64% 55% 59%
Good 34% 31% 33% 33% 31% 38% 34%
Average 7% 7% 5% 8% 4%a 7% 7%
Poor b b b b b b 0%
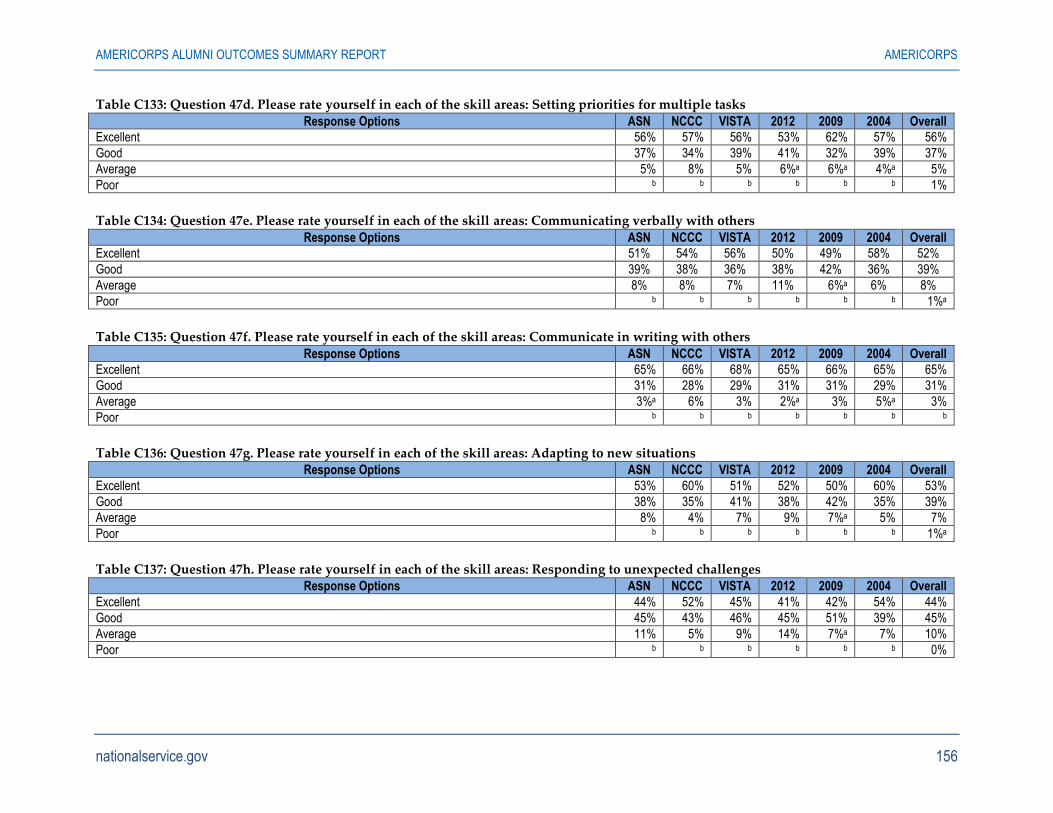
AMERICORPS ALUMNI OUTCOMES SUMMARY REPORT AMERICORPS
nationalservice.gov 156
Table C133: Question 47d. Please rate yourself in each of the skill areas: Setting priorities for multiple tasks
Response Options ASN NCCC VISTA 2012 2009 2004 Overall
Excellent 56% 57% 56% 53% 62% 57% 56%
Good 37% 34% 39% 41% 32% 39% 37%
Average 5% 8% 5% 6%a 6%a 4%a 5%
Poor b b b b b b 1%
Table C134: Question 47e. Please rate yourself in each of the skill areas: Communicating verbally with others
Response Options ASN NCCC VISTA 2012 2009 2004 Overall
Excellent 51% 54% 56% 50% 49% 58% 52%
Good 39% 38% 36% 38% 42% 36% 39%
Average 8% 8% 7% 11% 6%a 6% 8%
Poor b b b b b b 1%a
Table C135: Question 47f. Please rate yourself in each of the skill areas: Communicate in writing with others
Response Options ASN NCCC VISTA 2012 2009 2004 Overall
Excellent 65% 66% 68% 65% 66% 65% 65%
Good 31% 28% 29% 31% 31% 29% 31%
Average 3%a 6% 3% 2%a 3% 5%a 3%
Poor b b b b b b b
Table C136: Question 47g. Please rate yourself in each of the skill areas: Adapting to new situations Response Options ASN NCCC VISTA 2012 2009 2004 Overall
Excellent 53% 60% 51% 52% 50% 60% 53%
Good 38% 35% 41% 38% 42% 35% 39%
Average 8% 4% 7% 9% 7%a 5% 7%
Poor b b b b b b 1%a
Table C137: Question 47h. Please rate yourself in each of the skill areas: Responding to unexpected challenges Response Options ASN NCCC VISTA 2012 2009 2004 Overall
Excellent 44% 52% 45% 41% 42% 54% 44%
Good 45% 43% 46% 45% 51% 39% 45%
Average 11% 5% 9% 14% 7%a 7% 10%
Poor b b b b b b 0%
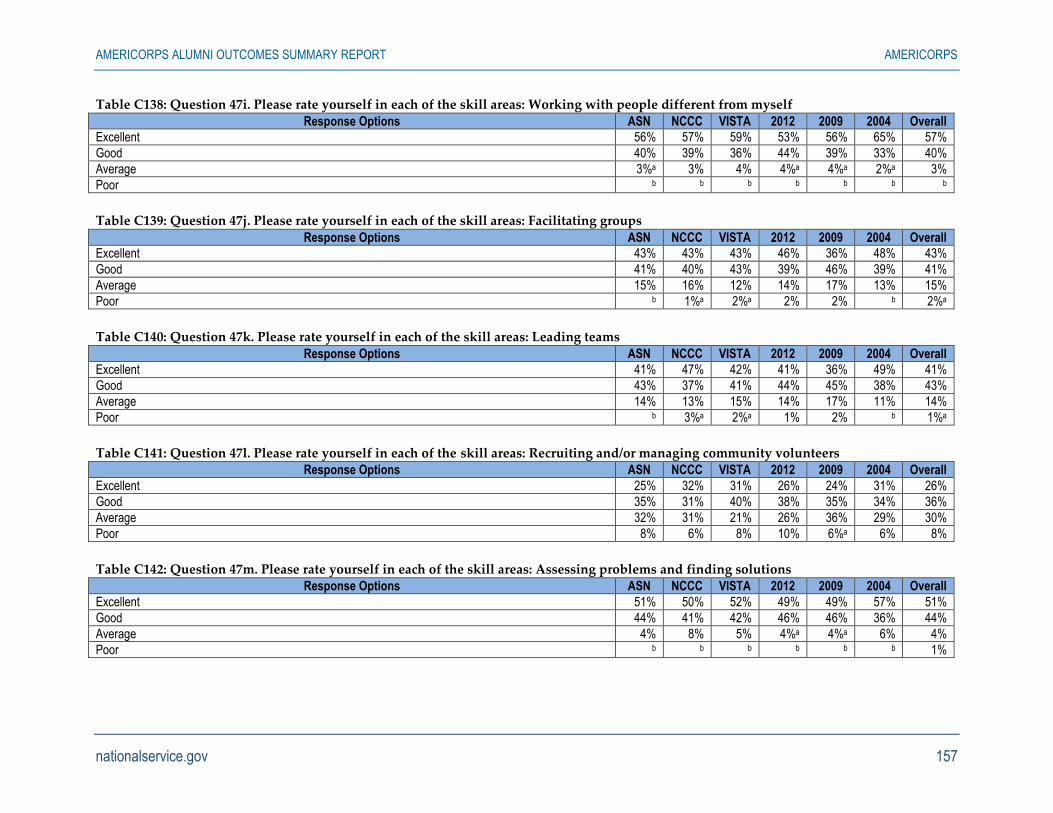
AMERICORPS ALUMNI OUTCOMES SUMMARY REPORT AMERICORPS
nationalservice.gov 157
Table C138: Question 47i. Please rate yourself in each of the skill areas: Working with people different from myself
Response Options ASN NCCC VISTA 2012 2009 2004 Overall
Excellent 56% 57% 59% 53% 56% 65% 57%
Good 40% 39% 36% 44% 39% 33% 40%
Average 3%a 3% 4% 4%a 4%a 2%a 3%
Poor b b b b b b b
Table C139: Question 47j. Please rate yourself in each of the skill areas: Facilitating groups
Response Options ASN NCCC VISTA 2012 2009 2004 Overall
Excellent 43% 43% 43% 46% 36% 48% 43%
Good 41% 40% 43% 39% 46% 39% 41%
Average 15% 16% 12% 14% 17% 13% 15%
Poor b 1%a 2%a 2% 2% b 2%a
Table C140: Question 47k. Please rate yourself in each of the skill areas: Leading teams
Response Options ASN NCCC VISTA 2012 2009 2004 Overall
Excellent 41% 47% 42% 41% 36% 49% 41%
Good 43% 37% 41% 44% 45% 38% 43%
Average 14% 13% 15% 14% 17% 11% 14%
Poor b 3%a 2%a 1% 2% b 1%a
Table C141: Question 47l. Please rate yourself in each of the skill areas: Recruiting and/or managing community volunteers Response Options ASN NCCC VISTA 2012 2009 2004 Overall
Excellent 25% 32% 31% 26% 24% 31% 26%
Good 35% 31% 40% 38% 35% 34% 36%
Average 32% 31% 21% 26% 36% 29% 30%
Poor 8% 6% 8% 10% 6%a 6% 8%
Table C142: Question 47m. Please rate yourself in each of the skill areas: Assessing problems and finding solutions Response Options ASN NCCC VISTA 2012 2009 2004 Overall
Excellent 51% 50% 52% 49% 49% 57% 51%
Good 44% 41% 42% 46% 46% 36% 44%
Average 4% 8% 5% 4%a 4%a 6% 4%
Poor b b b b b b 1%

AMERICORPS ALUMNI OUTCOMES SUMMARY REPORT AMERICORPS
nationalservice.gov 158
Table C143: Question 47n. Please rate yourself in each of the skill areas: Planning, coordinating and managing events
Response Options ASN NCCC VISTA 2012 2009 2004 Overall
Excellent 45% 43% 50% 48% 42% 49% 46%
Good 39% 39% 36% 35% 45% 36% 39%
Average 14% 14% 12% 15% 12% 14% 14%
Poor b 3% b 2% 1% 1% 1%a
Table C144: Question 48a. To what extent did AC experience help you increase this skill: Conducting yourself in a professional manner
Response Options ASN NCCC VISTA 2012 2009 2004 Overall
A great deal 35% 26% 32% 34% 31% 38% 34%
Somewhat 42% 44% 48% 44% 41% 43% 43%
Very little 12% 20% 11% 10% 16% 11% 12%
Not at all 9% 7% 8% 10% 9% 5%a 9%
Not sure 2%a 3% 1%a 2% 2% 2% 2%a
Table C145: Question 48b. To what extent did AC experience help you increase this skill: Working independently
Response Options ASN NCCC VISTA 2012 2009 2004 Overall
A great deal 32% 24% 34% 30% 32% 38% 32%
Somewhat 46% 46% 43% 47% 42% 47% 45%
Very little 12% 19% 12% 13% 15% 8% 12%
Not at all 8% 9% 9% 9% 10% 5% 8%
Not sure 2%a 2%a 2%a 2% 1% 2%a 2%a
Table C146: Question 48c. To what extent did AC experience help you increase this skill: Meeting deadlines Response Options ASN NCCC VISTA 2012 2009 2004 Overall
A great deal 26% 22% 26% 26% 23% 28% 26%
Somewhat 45% 40% 43% 43% 48% 43% 45%
Very little 17% 23% 19% 18% 16% 19% 18%
Not at all 10% 11% 11% 10% 12% 8% 10%
Not sure 2%a 3% 2%a 3%a 1% 2%a 2%a

AMERICORPS ALUMNI OUTCOMES SUMMARY REPORT AMERICORPS
nationalservice.gov 159
Table C147: Question 48d. To what extent did AC experience help you increase this skill: Setting priorities for multiple tasks
Response Options ASN NCCC VISTA 2012 2009 2004 Overall
A great deal 36% 30% 32% 39% 28% 37% 35%
Somewhat 41% 41% 43% 37% 46% 43% 41%
Very little 12% 20% 13% 11% 15% 13% 12%
Not at all 9% 8% 10% 11% 10% 6% 9%
Not sure 2%a 2% 1%a 2% 1% 2%a 2%a
Table C148: Question 48e. To what extent did AC experience help you increase this skill: Communicating verbally with others Response Options ASN NCCC VISTA 2012 2009 2004 Overall
A great deal 44% 49% 35% 42% 36% 51% 42%
Somewhat 39% 39% 46% 42% 44% 34% 40%
Very little 10% 6% 10% 9% 11% 10% 10%
Not at all 6% 4% 8% 6% 8% 4%a 6%
Not sure b b 1%a b 1% 1% 1%a
Table C149: Question 48f. To what extent did AC experience help you increase this skill: Communicate in writing with others Response Options ASN NCCC VISTA 2012 2009 2004 Overall
A great deal 25% 20% 28% 26% 22% 28% 25%
Somewhat 36% 34% 42% 38% 36% 37% 37%
Very little 25% 27% 18% 23% 25% 24% 24%
Not at all 13% 17% 10% 12% 15% 10% 13%
Not sure b 2%a 1%a 2% 1% 1% 1%a
Table C150: Question 48g. To what extent did AC experience help you increase this skill: Adapting to new situations
Response Options ASN NCCC VISTA 2012 2009 2004 Overall
A great deal 50% 71% 45% 49% 44% 59% 50%
Somewhat 36% 22% 40% 37% 40% 30% 36%
Very little 8% 4% 8% 7% 8% 8% 8%
Not at all 5% 2%a 6% 5%a 7%a 2%a 5%
Not sure b b b b b 1% 1%a
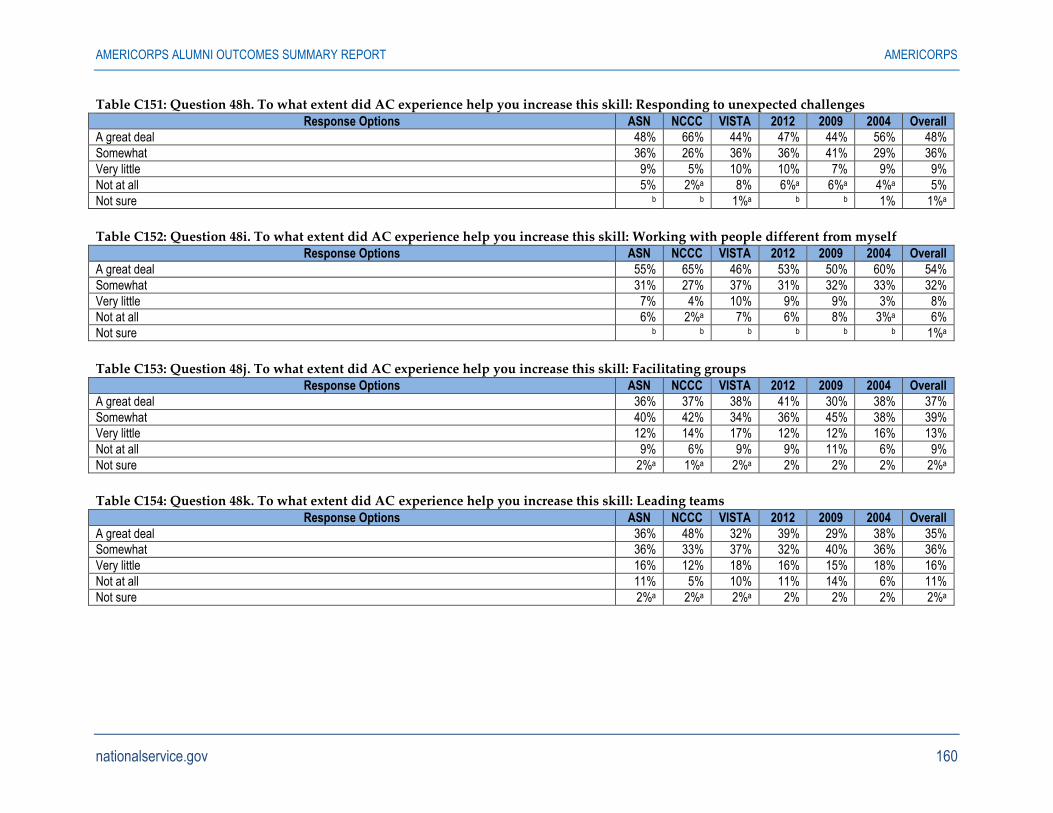
AMERICORPS ALUMNI OUTCOMES SUMMARY REPORT AMERICORPS
nationalservice.gov 160
Table C151: Question 48h. To what extent did AC experience help you increase this skill: Responding to unexpected challenges
Response Options ASN NCCC VISTA 2012 2009 2004 Overall
A great deal 48% 66% 44% 47% 44% 56% 48%
Somewhat 36% 26% 36% 36% 41% 29% 36%
Very little 9% 5% 10% 10% 7% 9% 9%
Not at all 5% 2%a 8% 6%a 6%a 4%a 5%
Not sure b b 1%a b b 1% 1%a
Table C152: Question 48i. To what extent did AC experience help you increase this skill: Working with people different from myself Response Options ASN NCCC VISTA 2012 2009 2004 Overall
A great deal 55% 65% 46% 53% 50% 60% 54%
Somewhat 31% 27% 37% 31% 32% 33% 32%
Very little 7% 4% 10% 9% 9% 3% 8%
Not at all 6% 2%a 7% 6% 8% 3%a 6%
Not sure b b b b b b 1%a
Table C153: Question 48j. To what extent did AC experience help you increase this skill: Facilitating groups Response Options ASN NCCC VISTA 2012 2009 2004 Overall
A great deal 36% 37% 38% 41% 30% 38% 37%
Somewhat 40% 42% 34% 36% 45% 38% 39%
Very little 12% 14% 17% 12% 12% 16% 13%
Not at all 9% 6% 9% 9% 11% 6% 9%
Not sure 2%a 1%a 2%a 2% 2% 2% 2%a
Table C154: Question 48k. To what extent did AC experience help you increase this skill: Leading teams
Response Options ASN NCCC VISTA 2012 2009 2004 Overall
A great deal 36% 48% 32% 39% 29% 38% 35%
Somewhat 36% 33% 37% 32% 40% 36% 36%
Very little 16% 12% 18% 16% 15% 18% 16%
Not at all 11% 5% 10% 11% 14% 6% 11%
Not sure 2%a 2%a 2%a 2% 2% 2% 2%a
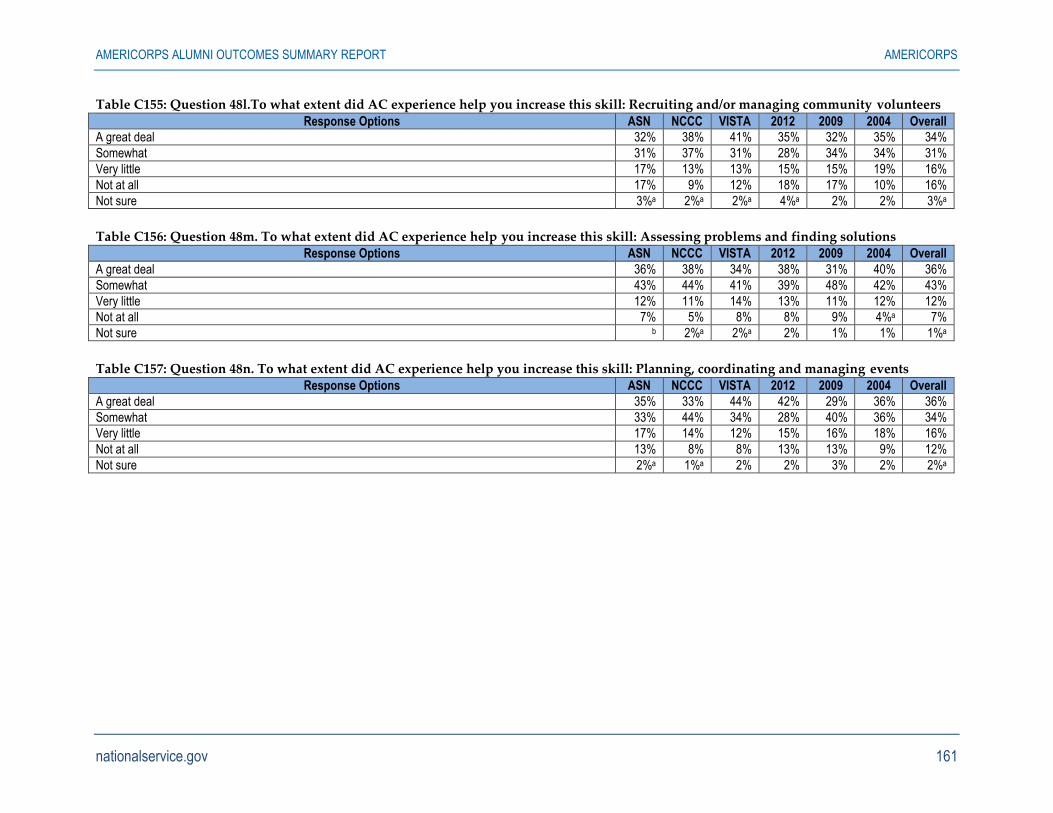
AMERICORPS ALUMNI OUTCOMES SUMMARY REPORT AMERICORPS
nationalservice.gov 161
Table C155: Question 48l.To what extent did AC experience help you increase this skill: Recruiting and/or managing community volunteers
Response Options ASN NCCC VISTA 2012 2009 2004 Overall
A great deal 32% 38% 41% 35% 32% 35% 34%
Somewhat 31% 37% 31% 28% 34% 34% 31%
Very little 17% 13% 13% 15% 15% 19% 16%
Not at all 17% 9% 12% 18% 17% 10% 16%
Not sure 3%a 2%a 2%a 4%a 2% 2% 3%a
Table C156: Question 48m. To what extent did AC experience help you increase this skill: Assessing problems and finding solutions Response Options ASN NCCC VISTA 2012 2009 2004 Overall
A great deal 36% 38% 34% 38% 31% 40% 36%
Somewhat 43% 44% 41% 39% 48% 42% 43%
Very little 12% 11% 14% 13% 11% 12% 12%
Not at all 7% 5% 8% 8% 9% 4%a 7%
Not sure b 2%a 2%a 2% 1% 1% 1%a
Table C157: Question 48n. To what extent did AC experience help you increase this skill: Planning, coordinating and managing events Response Options ASN NCCC VISTA 2012 2009 2004 Overall
A great deal 35% 33% 44% 42% 29% 36% 36%
Somewhat 33% 44% 34% 28% 40% 36% 34%
Very little 17% 14% 12% 15% 16% 18% 16%
Not at all 13% 8% 8% 13% 13% 9% 12%
Not sure 2%a 1%a 2% 2% 3% 2% 2%a
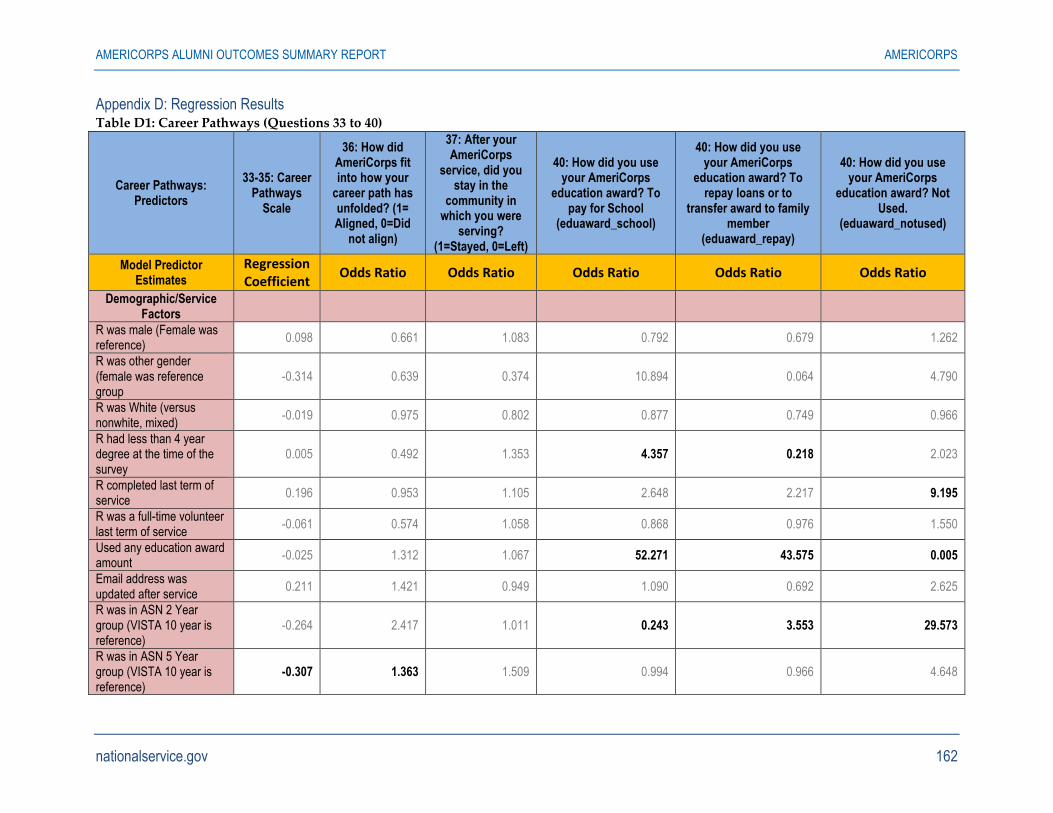
AMERICORPS ALUMNI OUTCOMES SUMMARY REPORT AMERICORPS
nationalservice.gov 162
Appendix D: Regression Results Table D1: Career Pathways (Questions 33 to 40)
Career Pathways: Predictors
33-35: Career Pathways
Scale
36: How did AmeriCorps fit into how your
career path has unfolded? (1= Aligned, 0=Did
not align)
37: After your AmeriCorps
service, did you stay in the
community in which you were
serving? (1=Stayed, 0=Left)
40: How did you use your AmeriCorps
education award? To pay for School
(eduaward_school)
40: How did you use your AmeriCorps
education award? To repay loans or to
transfer award to family member
(eduaward_repay)
40: How did you use your AmeriCorps
education award? Not Used.
(eduaward_notused)
Model Predictor Estimates
Regression Coefficient
Odds Ratio Odds Ratio Odds Ratio Odds Ratio Odds Ratio
Demographic/Service Factors
R was male (Female was reference)
0.098 0.661 1.083 0.792 0.679 1.262
R was other gender (female was reference group
-0.314 0.639 0.374 10.894 0.064 4.790
R was White (versus nonwhite, mixed)
-0.019 0.975 0.802 0.877 0.749 0.966
R had less than 4 year degree at the time of the survey
0.005 0.492 1.353 4.357 0.218 2.023
R completed last term of service
0.196 0.953 1.105 2.648 2.217 9.195
R was a full-time volunteer last term of service
-0.061 0.574 1.058 0.868 0.976 1.550
Used any education award amount
-0.025 1.312 1.067 52.271 43.575 0.005
Email address was updated after service
0.211 1.421 0.949 1.090 0.692 2.625
R was in ASN 2 Year group (VISTA 10 year is reference)
-0.264 2.417 1.011 0.243 3.553 29.573
R was in ASN 5 Year group (VISTA 10 year is reference)
-0.307 1.363 1.509 0.994 0.966 4.648
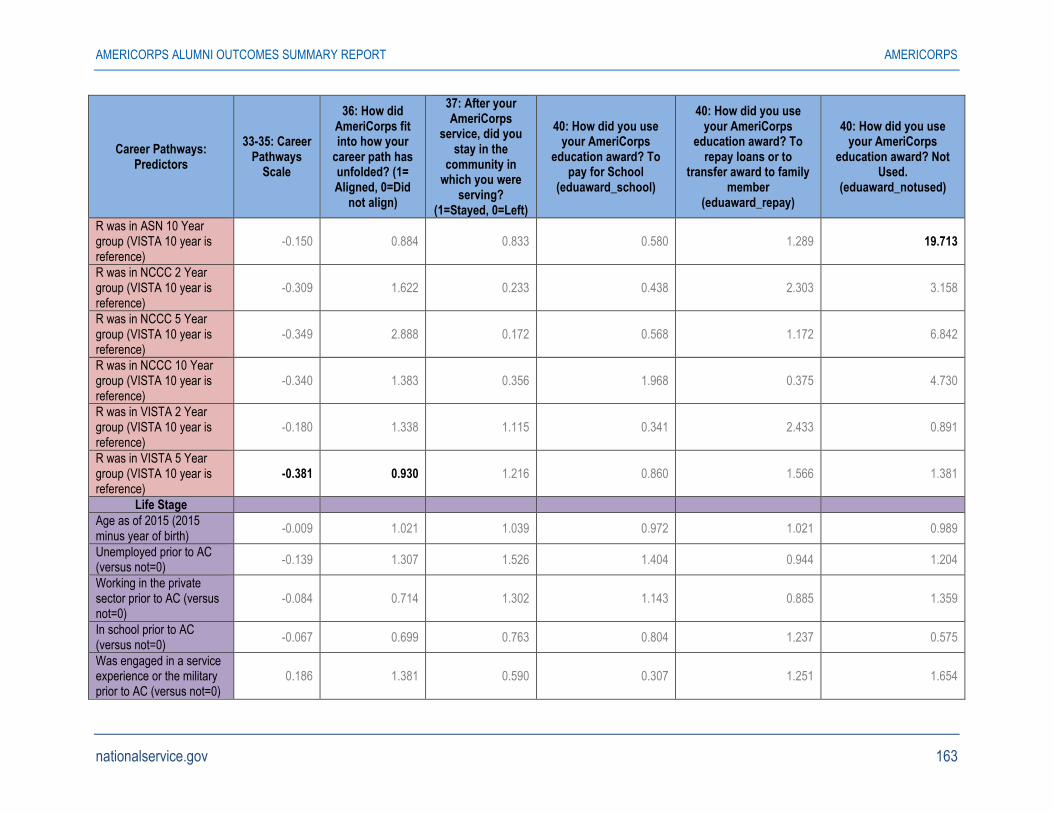
AMERICORPS ALUMNI OUTCOMES SUMMARY REPORT AMERICORPS
nationalservice.gov 163
Career Pathways: Predictors
33-35: Career Pathways
Scale
36: How did AmeriCorps fit into how your
career path has unfolded? (1= Aligned, 0=Did
not align)
37: After your AmeriCorps
service, did you stay in the
community in which you were
serving? (1=Stayed, 0=Left)
40: How did you use your AmeriCorps
education award? To pay for School
(eduaward_school)
40: How did you use your AmeriCorps
education award? To repay loans or to
transfer award to family member
(eduaward_repay)
40: How did you use your AmeriCorps
education award? Not Used.
(eduaward_notused)
R was in ASN 10 Year group (VISTA 10 year is reference)
-0.150 0.884 0.833 0.580 1.289 19.713
R was in NCCC 2 Year group (VISTA 10 year is reference)
-0.309 1.622 0.233 0.438 2.303 3.158
R was in NCCC 5 Year group (VISTA 10 year is reference)
-0.349 2.888 0.172 0.568 1.172 6.842
R was in NCCC 10 Year group (VISTA 10 year is reference)
-0.340 1.383 0.356 1.968 0.375 4.730
R was in VISTA 2 Year group (VISTA 10 year is reference)
-0.180 1.338 1.115 0.341 2.433 0.891
R was in VISTA 5 Year group (VISTA 10 year is reference)
-0.381 0.930 1.216 0.860 1.566 1.381
Life Stage
Age as of 2015 (2015 minus year of birth)
-0.009 1.021 1.039 0.972 1.021 0.989
Unemployed prior to AC (versus not=0)
-0.139 1.307 1.526 1.404 0.944 1.204
Working in the private sector prior to AC (versus not=0)
-0.084 0.714 1.302 1.143 0.885 1.359
In school prior to AC (versus not=0)
-0.067 0.699 0.763 0.804 1.237 0.575
Was engaged in a service experience or the military prior to AC (versus not=0)
0.186 1.381 0.590 0.307 1.251 1.654
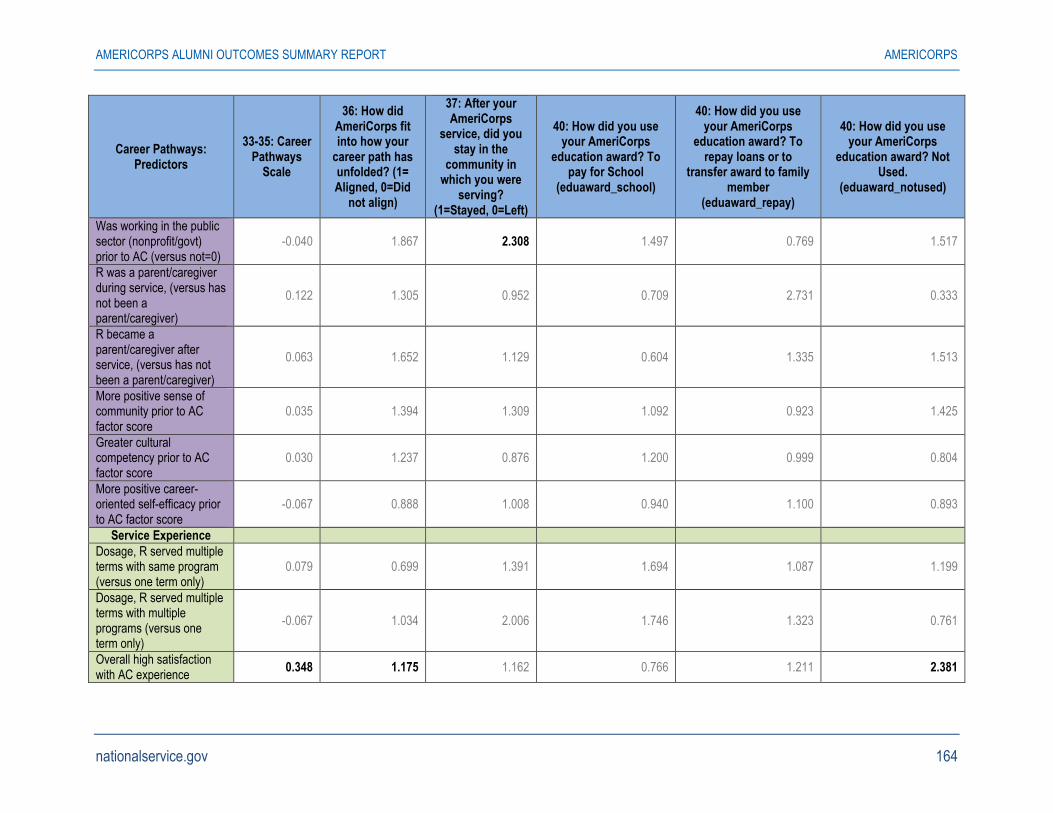
AMERICORPS ALUMNI OUTCOMES SUMMARY REPORT AMERICORPS
nationalservice.gov 164
Career Pathways: Predictors
33-35: Career Pathways
Scale
36: How did AmeriCorps fit into how your
career path has unfolded? (1= Aligned, 0=Did
not align)
37: After your AmeriCorps
service, did you stay in the
community in which you were
serving? (1=Stayed, 0=Left)
40: How did you use your AmeriCorps
education award? To pay for School
(eduaward_school)
40: How did you use your AmeriCorps
education award? To repay loans or to
transfer award to family member
(eduaward_repay)
40: How did you use your AmeriCorps
education award? Not Used.
(eduaward_notused)
Was working in the public sector (nonprofit/govt) prior to AC (versus not=0)
-0.040 1.867 2.308 1.497 0.769 1.517
R was a parent/caregiver during service, (versus has not been a parent/caregiver)
0.122 1.305 0.952 0.709 2.731 0.333
R became a parent/caregiver after service, (versus has not been a parent/caregiver)
0.063 1.652 1.129 0.604 1.335 1.513
More positive sense of community prior to AC factor score
0.035 1.394 1.309 1.092 0.923 1.425
Greater cultural competency prior to AC factor score
0.030 1.237 0.876 1.200 0.999 0.804
More positive career-oriented self-efficacy prior to AC factor score
-0.067 0.888 1.008 0.940 1.100 0.893
Service Experience
Dosage, R served multiple terms with same program (versus one term only)
0.079 0.699 1.391 1.694 1.087 1.199
Dosage, R served multiple terms with multiple programs (versus one term only)
-0.067 1.034 2.006 1.746 1.323 0.761
Overall high satisfaction with AC experience
0.348 1.175 1.162 0.766 1.211 2.381
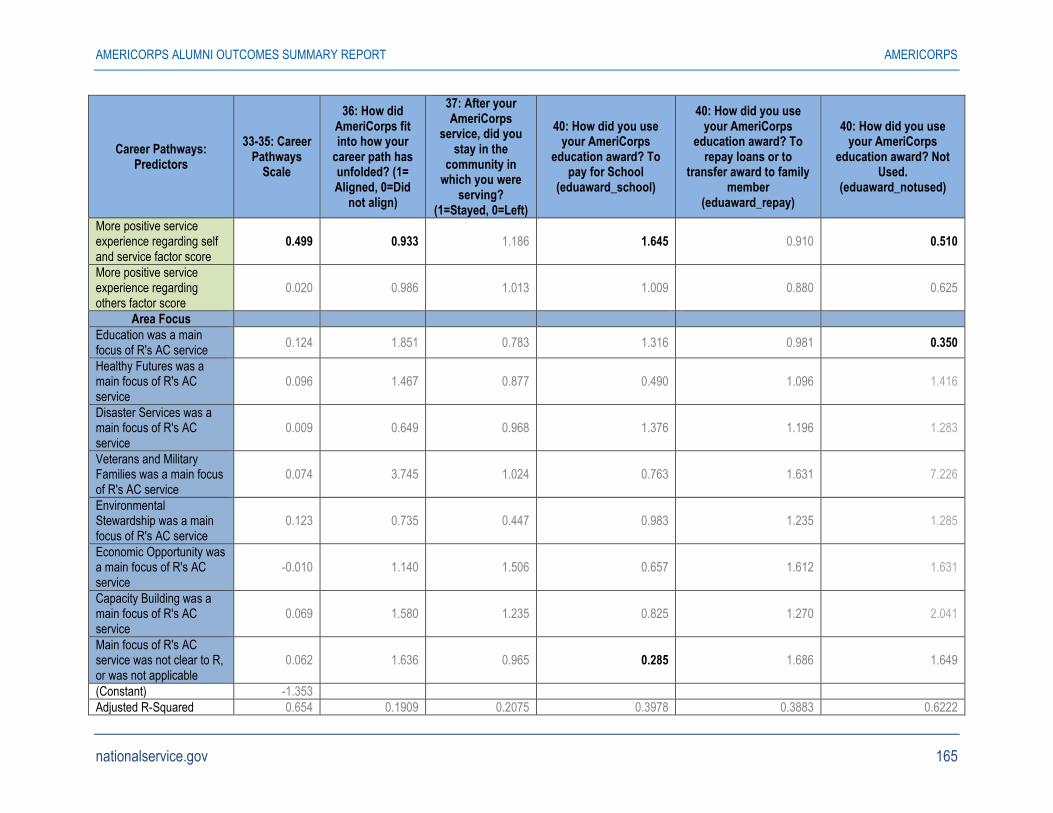
AMERICORPS ALUMNI OUTCOMES SUMMARY REPORT AMERICORPS
nationalservice.gov 165
Career Pathways: Predictors
33-35: Career Pathways
Scale
36: How did AmeriCorps fit into how your
career path has unfolded? (1= Aligned, 0=Did
not align)
37: After your AmeriCorps
service, did you stay in the
community in which you were
serving? (1=Stayed, 0=Left)
40: How did you use your AmeriCorps
education award? To pay for School
(eduaward_school)
40: How did you use your AmeriCorps
education award? To repay loans or to
transfer award to family member
(eduaward_repay)
40: How did you use your AmeriCorps
education award? Not Used.
(eduaward_notused)
More positive service experience regarding self and service factor score
0.499 0.933 1.186 1.645 0.910 0.510
More positive service experience regarding others factor score
0.020 0.986 1.013 1.009 0.880 0.625
Area Focus
Education was a main focus of R's AC service
0.124 1.851 0.783 1.316 0.981 0.350
Healthy Futures was a main focus of R's AC service
0.096 1.467 0.877 0.490 1.096 1.416
Disaster Services was a main focus of R's AC service
0.009 0.649 0.968 1.376 1.196 1.283
Veterans and Military Families was a main focus of R's AC service
0.074 3.745 1.024 0.763 1.631 7.226
Environmental Stewardship was a main focus of R's AC service
0.123 0.735 0.447 0.983 1.235 1.285
Economic Opportunity was a main focus of R's AC service
-0.010 1.140 1.506 0.657 1.612 1.631
Capacity Building was a main focus of R's AC service
0.069 1.580 1.235 0.825 1.270 2.041
Main focus of R's AC service was not clear to R, or was not applicable
0.062 1.636 0.965 0.285 1.686 1.649
(Constant) -1.353
Adjusted R-Squared 0.654 0.1909 0.2075 0.3978 0.3883 0.6222

AMERICORPS ALUMNI OUTCOMES SUMMARY REPORT AMERICORPS
nationalservice.gov 166
Table D2: Career Pathways (Questions 41 to 42)
Career Pathways: Predictors
41: What did you do in the six
months after your AmeriCorps
service? Unemployed.
41: What did you do in the six
months after your AmeriCorps
service? Working in the Private
Sector
41: What did you do in the six
months after your AmeriCorps
service? Continuing Education
41: What did you do in the six
months after your AmeriCorps
service? Service Experience
41: What did you do in the six months after your
AmeriCorps service? Working in the
Public/Government Sector
42. If you got a job in the six months after
your AmeriCorps service, was it a
position in, or directly connected to, the
organization or agency in which you served?
(1=Yes, 0=No)
Model Predictor Estimates
Regression Coefficient
Regression Coefficient
Regression Coefficient
Regression Coefficient
Regression Coefficient
Regression Coefficient
Demographic/Service Factors
R was male (Female was reference)
0.730 1.235 0.623 0.716 1.145 2.160
R was other gender (female was reference group
<0.001 <0.001 0.976 2.644 0.529 4.248
R was White (versus nonwhite, mixed)
1.376 2.061 0.865 1.152 1.316 0.900
R had less than 4 year degree at the time of the survey
1.593 1.060 7.413 0.452 0.652 0.319
R completed last term of service
3.148 0.817 1.800 0.623 0.935 2.702
R was a full-time volunteer last term of service
0.605 0.567 0.677 0.574 2.298 2.167
Used any education award amount
0.629 0.738 2.049 0.712 1.165 0.992
Email address was updated after service
0.407 1.104 0.461 1.102 2.219 1.591
R was in ASN 2 Year group (VISTA 10 year is reference)
3.124 0.291 0.868 1.765 1.091 0.984
R was in ASN 5 Year group (VISTA 10 year is reference)
1.299 0.380 1.818 1.561 0.904 0.799
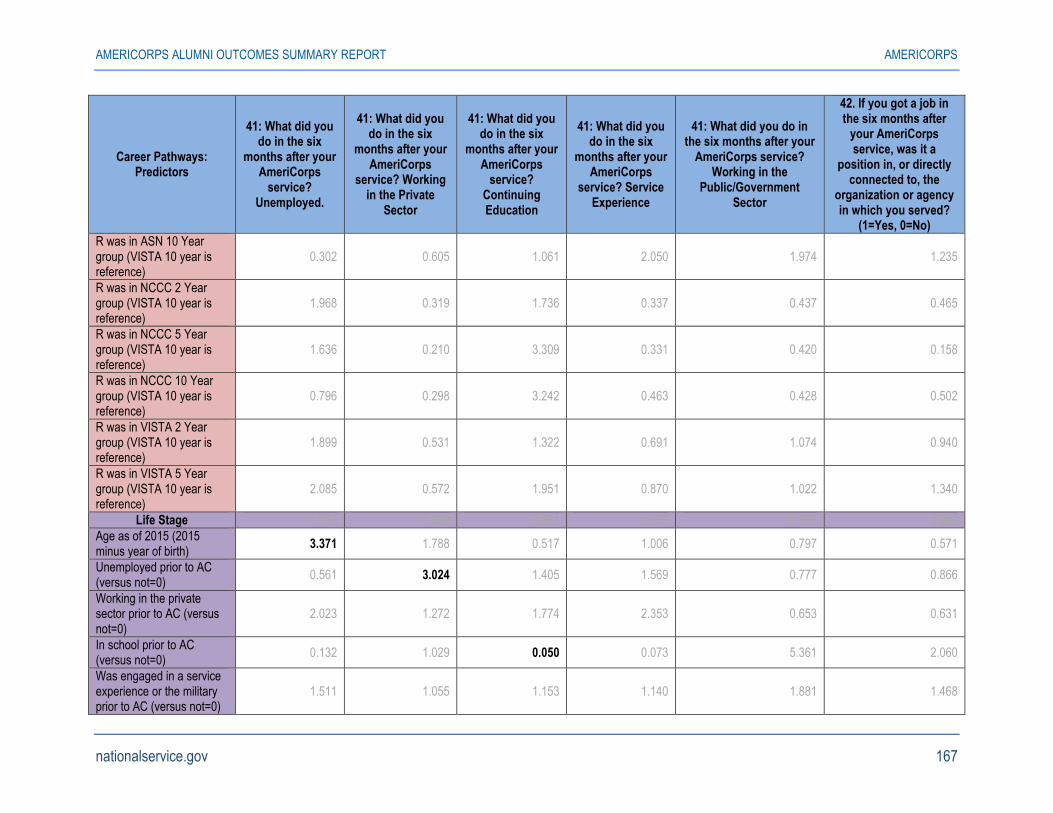
AMERICORPS ALUMNI OUTCOMES SUMMARY REPORT AMERICORPS
nationalservice.gov 167
Career Pathways: Predictors
41: What did you do in the six
months after your AmeriCorps
service? Unemployed.
41: What did you do in the six
months after your AmeriCorps
service? Working in the Private
Sector
41: What did you do in the six
months after your AmeriCorps
service? Continuing Education
41: What did you do in the six
months after your AmeriCorps
service? Service Experience
41: What did you do in the six months after your
AmeriCorps service? Working in the
Public/Government Sector
42. If you got a job in the six months after
your AmeriCorps service, was it a
position in, or directly connected to, the
organization or agency in which you served?
(1=Yes, 0=No)
R was in ASN 10 Year group (VISTA 10 year is reference)
0.302 0.605 1.061 2.050 1.974 1.235
R was in NCCC 2 Year group (VISTA 10 year is reference)
1.968 0.319 1.736 0.337 0.437 0.465
R was in NCCC 5 Year group (VISTA 10 year is reference)
1.636 0.210 3.309 0.331 0.420 0.158
R was in NCCC 10 Year group (VISTA 10 year is reference)
0.796 0.298 3.242 0.463 0.428 0.502
R was in VISTA 2 Year group (VISTA 10 year is reference)
1.899 0.531 1.322 0.691 1.074 0.940
R was in VISTA 5 Year group (VISTA 10 year is reference)
2.085 0.572 1.951 0.870 1.022 1.340
Life Stage 1.013 1.000 0.961 0.953 0.986 0.986
Age as of 2015 (2015 minus year of birth)
3.371 1.788 0.517 1.006 0.797 0.571
Unemployed prior to AC (versus not=0)
0.561 3.024 1.405 1.569 0.777 0.866
Working in the private sector prior to AC (versus not=0)
2.023 1.272 1.774 2.353 0.653 0.631
In school prior to AC (versus not=0)
0.132 1.029 0.050 0.073 5.361 2.060
Was engaged in a service experience or the military prior to AC (versus not=0)
1.511 1.055 1.153 1.140 1.881 1.468
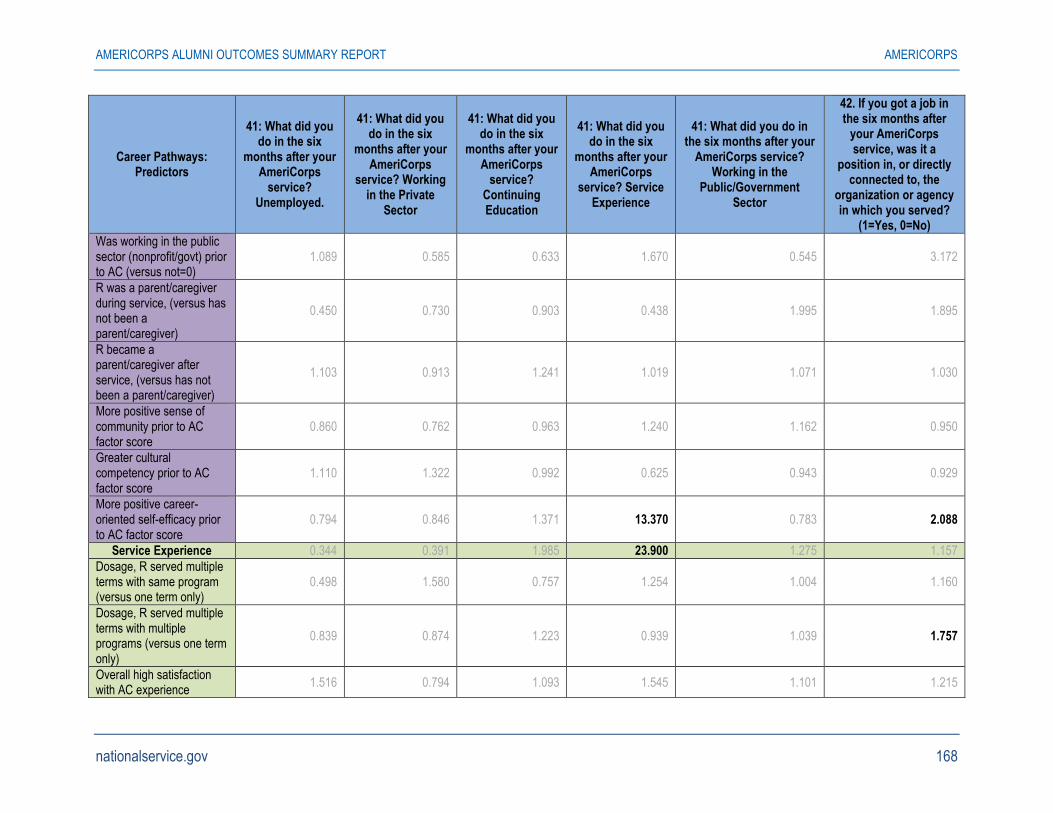
AMERICORPS ALUMNI OUTCOMES SUMMARY REPORT AMERICORPS
nationalservice.gov 168
Career Pathways: Predictors
41: What did you do in the six
months after your AmeriCorps
service? Unemployed.
41: What did you do in the six
months after your AmeriCorps
service? Working in the Private
Sector
41: What did you do in the six
months after your AmeriCorps
service? Continuing Education
41: What did you do in the six
months after your AmeriCorps
service? Service Experience
41: What did you do in the six months after your
AmeriCorps service? Working in the
Public/Government Sector
42. If you got a job in the six months after
your AmeriCorps service, was it a
position in, or directly connected to, the
organization or agency in which you served?
(1=Yes, 0=No)
Was working in the public sector (nonprofit/govt) prior to AC (versus not=0)
1.089 0.585 0.633 1.670 0.545 3.172
R was a parent/caregiver during service, (versus has not been a parent/caregiver)
0.450 0.730 0.903 0.438 1.995 1.895
R became a parent/caregiver after service, (versus has not been a parent/caregiver)
1.103 0.913 1.241 1.019 1.071 1.030
More positive sense of community prior to AC factor score
0.860 0.762 0.963 1.240 1.162 0.950
Greater cultural competency prior to AC factor score
1.110 1.322 0.992 0.625 0.943 0.929
More positive career-oriented self-efficacy prior to AC factor score
0.794 0.846 1.371 13.370 0.783 2.088
Service Experience 0.344 0.391 1.985 23.900 1.275 1.157
Dosage, R served multiple terms with same program (versus one term only)
0.498 1.580 0.757 1.254 1.004 1.160
Dosage, R served multiple terms with multiple programs (versus one term only)
0.839 0.874 1.223 0.939 1.039 1.757
Overall high satisfaction with AC experience
1.516 0.794 1.093 1.545 1.101 1.215
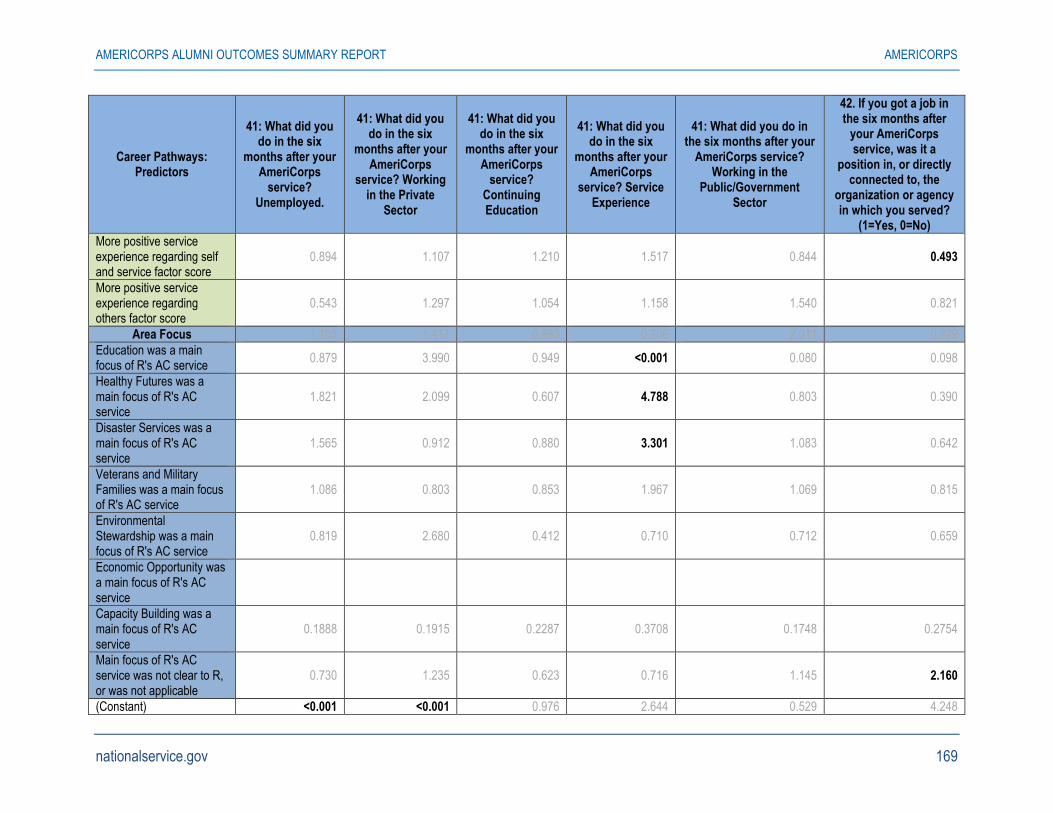
AMERICORPS ALUMNI OUTCOMES SUMMARY REPORT AMERICORPS
nationalservice.gov 169
Career Pathways: Predictors
41: What did you do in the six
months after your AmeriCorps
service? Unemployed.
41: What did you do in the six
months after your AmeriCorps
service? Working in the Private
Sector
41: What did you do in the six
months after your AmeriCorps
service? Continuing Education
41: What did you do in the six
months after your AmeriCorps
service? Service Experience
41: What did you do in the six months after your
AmeriCorps service? Working in the
Public/Government Sector
42. If you got a job in the six months after
your AmeriCorps service, was it a
position in, or directly connected to, the
organization or agency in which you served?
(1=Yes, 0=No)
More positive service experience regarding self and service factor score
0.894 1.107 1.210 1.517 0.844 0.493
More positive service experience regarding others factor score
0.543 1.297 1.054 1.158 1.540 0.821
Area Focus 1.103 1.417 0.883 0.706 2.011 0.829
Education was a main focus of R's AC service
0.879 3.990 0.949 <0.001 0.080 0.098
Healthy Futures was a main focus of R's AC service
1.821 2.099 0.607 4.788 0.803 0.390
Disaster Services was a main focus of R's AC service
1.565 0.912 0.880 3.301 1.083 0.642
Veterans and Military Families was a main focus of R's AC service
1.086 0.803 0.853 1.967 1.069 0.815
Environmental Stewardship was a main focus of R's AC service
0.819 2.680 0.412 0.710 0.712 0.659
Economic Opportunity was a main focus of R's AC service
Capacity Building was a main focus of R's AC service
0.1888 0.1915 0.2287 0.3708 0.1748 0.2754
Main focus of R's AC service was not clear to R, or was not applicable
0.730 1.235 0.623 0.716 1.145 2.160
(Constant) <0.001 <0.001 0.976 2.644 0.529 4.248
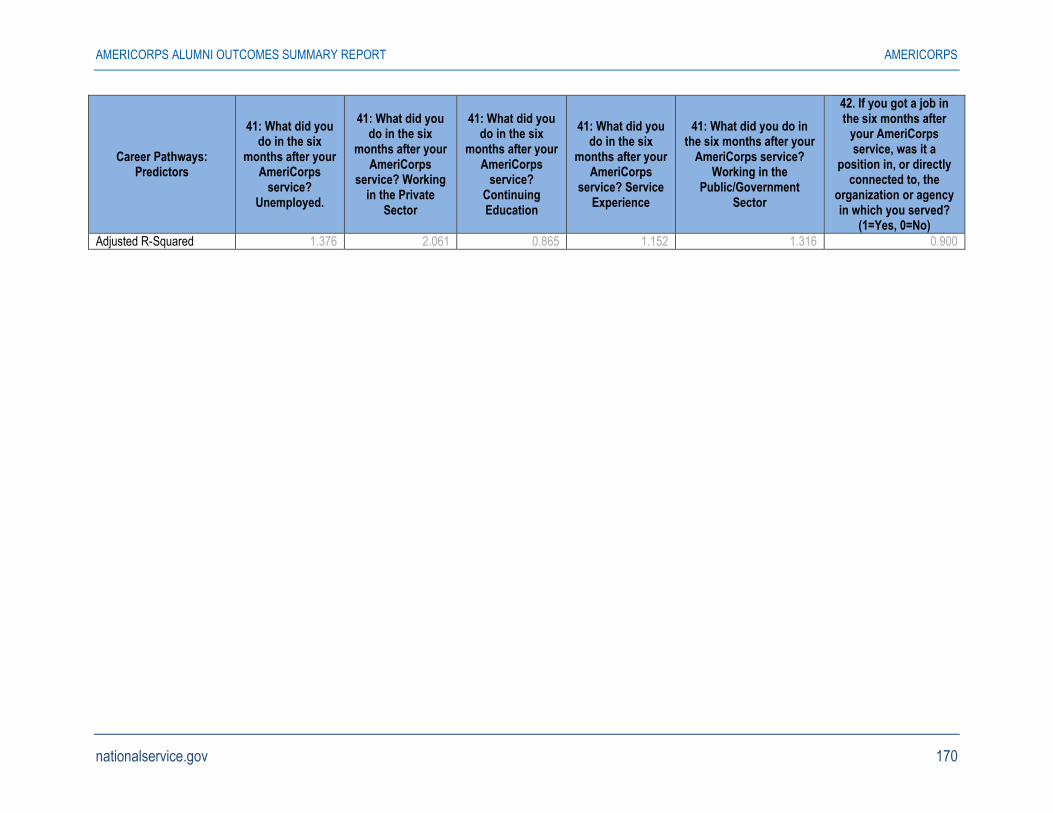
AMERICORPS ALUMNI OUTCOMES SUMMARY REPORT AMERICORPS
nationalservice.gov 170
Career Pathways: Predictors
41: What did you do in the six
months after your AmeriCorps
service? Unemployed.
41: What did you do in the six
months after your AmeriCorps
service? Working in the Private
Sector
41: What did you do in the six
months after your AmeriCorps
service? Continuing Education
41: What did you do in the six
months after your AmeriCorps
service? Service Experience
41: What did you do in the six months after your
AmeriCorps service? Working in the
Public/Government Sector
42. If you got a job in the six months after
your AmeriCorps service, was it a
position in, or directly connected to, the
organization or agency in which you served?
(1=Yes, 0=No)
Adjusted R-Squared 1.376 2.061 0.865 1.152 1.316 0.900
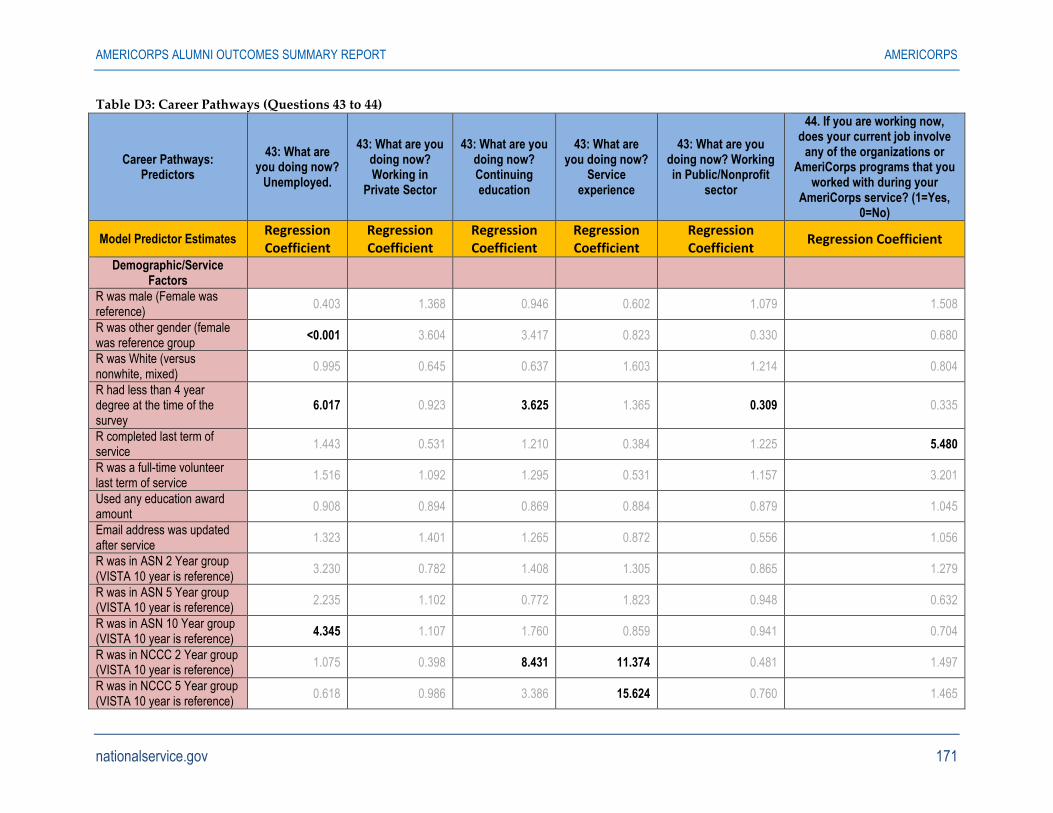
AMERICORPS ALUMNI OUTCOMES SUMMARY REPORT AMERICORPS
nationalservice.gov 171
Table D3: Career Pathways (Questions 43 to 44)
Career Pathways: Predictors
43: What are you doing now?
Unemployed.
43: What are you doing now? Working in
Private Sector
43: What are you doing now? Continuing education
43: What are you doing now?
Service experience
43: What are you doing now? Working in Public/Nonprofit
sector
44. If you are working now, does your current job involve
any of the organizations or AmeriCorps programs that you
worked with during your AmeriCorps service? (1=Yes,
0=No)
Model Predictor Estimates Regression Coefficient
Regression Coefficient
Regression Coefficient
Regression Coefficient
Regression Coefficient
Regression Coefficient
Demographic/Service Factors
R was male (Female was reference)
0.403 1.368 0.946 0.602 1.079 1.508
R was other gender (female was reference group
<0.001 3.604 3.417 0.823 0.330 0.680
R was White (versus nonwhite, mixed)
0.995 0.645 0.637 1.603 1.214 0.804
R had less than 4 year degree at the time of the survey
6.017 0.923 3.625 1.365 0.309 0.335
R completed last term of service
1.443 0.531 1.210 0.384 1.225 5.480
R was a full-time volunteer last term of service
1.516 1.092 1.295 0.531 1.157 3.201
Used any education award amount
0.908 0.894 0.869 0.884 0.879 1.045
Email address was updated after service
1.323 1.401 1.265 0.872 0.556 1.056
R was in ASN 2 Year group (VISTA 10 year is reference)
3.230 0.782 1.408 1.305 0.865 1.279
R was in ASN 5 Year group (VISTA 10 year is reference)
2.235 1.102 0.772 1.823 0.948 0.632
R was in ASN 10 Year group (VISTA 10 year is reference)
4.345 1.107 1.760 0.859 0.941 0.704
R was in NCCC 2 Year group (VISTA 10 year is reference)
1.075 0.398 8.431 11.374 0.481 1.497
R was in NCCC 5 Year group (VISTA 10 year is reference)
0.618 0.986 3.386 15.624 0.760 1.465
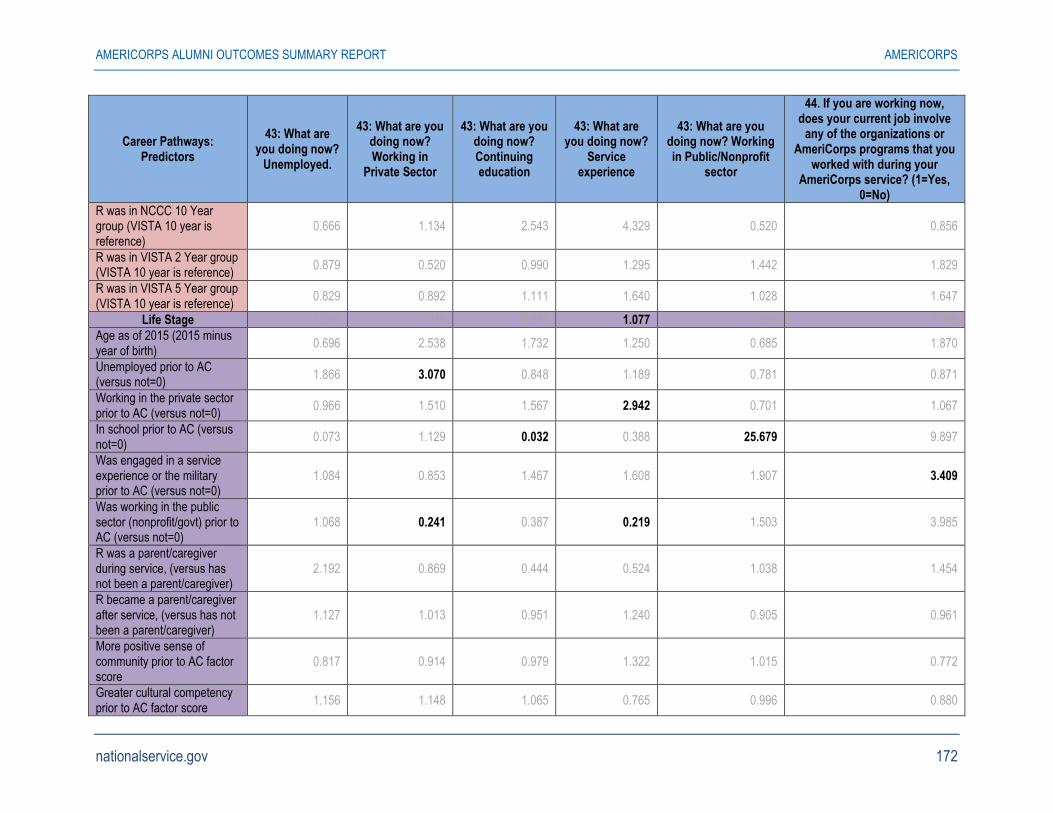
AMERICORPS ALUMNI OUTCOMES SUMMARY REPORT AMERICORPS
nationalservice.gov 172
Career Pathways: Predictors
43: What are you doing now?
Unemployed.
43: What are you doing now? Working in
Private Sector
43: What are you doing now? Continuing education
43: What are you doing now?
Service experience
43: What are you doing now? Working in Public/Nonprofit
sector
44. If you are working now, does your current job involve
any of the organizations or AmeriCorps programs that you
worked with during your AmeriCorps service? (1=Yes,
0=No)
R was in NCCC 10 Year group (VISTA 10 year is reference)
0.666 1.134 2.543 4.329 0.520 0.856
R was in VISTA 2 Year group (VISTA 10 year is reference)
0.879 0.520 0.990 1.295 1.442 1.829
R was in VISTA 5 Year group (VISTA 10 year is reference)
0.829 0.892 1.111 1.640 1.028 1.647
Life Stage 1.006 1.010 0.984 1.077 0.976 1.008
Age as of 2015 (2015 minus year of birth)
0.696 2.538 1.732 1.250 0.685 1.870
Unemployed prior to AC (versus not=0)
1.866 3.070 0.848 1.189 0.781 0.871
Working in the private sector prior to AC (versus not=0)
0.966 1.510 1.567 2.942 0.701 1.067
In school prior to AC (versus not=0)
0.073 1.129 0.032 0.388 25.679 9.897
Was engaged in a service experience or the military prior to AC (versus not=0)
1.084 0.853 1.467 1.608 1.907 3.409
Was working in the public sector (nonprofit/govt) prior to AC (versus not=0)
1.068 0.241 0.387 0.219 1.503 3.985
R was a parent/caregiver during service, (versus has not been a parent/caregiver)
2.192 0.869 0.444 0.524 1.038 1.454
R became a parent/caregiver after service, (versus has not been a parent/caregiver)
1.127 1.013 0.951 1.240 0.905 0.961
More positive sense of community prior to AC factor score
0.817 0.914 0.979 1.322 1.015 0.772
Greater cultural competency prior to AC factor score
1.156 1.148 1.065 0.765 0.996 0.880
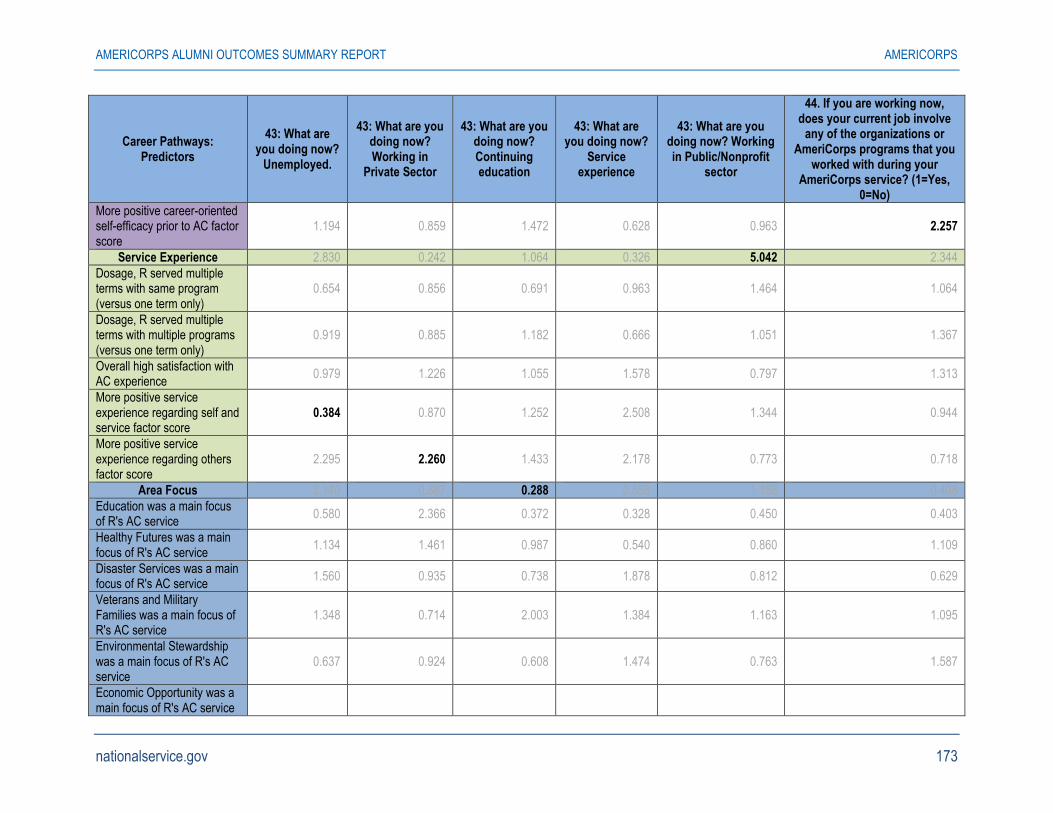
AMERICORPS ALUMNI OUTCOMES SUMMARY REPORT AMERICORPS
nationalservice.gov 173
Career Pathways: Predictors
43: What are you doing now?
Unemployed.
43: What are you doing now? Working in
Private Sector
43: What are you doing now? Continuing education
43: What are you doing now?
Service experience
43: What are you doing now? Working in Public/Nonprofit
sector
44. If you are working now, does your current job involve
any of the organizations or AmeriCorps programs that you
worked with during your AmeriCorps service? (1=Yes,
0=No)
More positive career-oriented self-efficacy prior to AC factor score
1.194 0.859 1.472 0.628 0.963 2.257
Service Experience 2.830 0.242 1.064 0.326 5.042 2.344
Dosage, R served multiple terms with same program (versus one term only)
0.654 0.856 0.691 0.963 1.464 1.064
Dosage, R served multiple terms with multiple programs (versus one term only)
0.919 0.885 1.182 0.666 1.051 1.367
Overall high satisfaction with AC experience
0.979 1.226 1.055 1.578 0.797 1.313
More positive service experience regarding self and service factor score
0.384 0.870 1.252 2.508 1.344 0.944
More positive service experience regarding others factor score
2.295 2.260 1.433 2.178 0.773 0.718
Area Focus 2.140 0.887 0.288 0.558 1.156 0.408
Education was a main focus of R's AC service
0.580 2.366 0.372 0.328 0.450 0.403
Healthy Futures was a main focus of R's AC service
1.134 1.461 0.987 0.540 0.860 1.109
Disaster Services was a main focus of R's AC service
1.560 0.935 0.738 1.878 0.812 0.629
Veterans and Military Families was a main focus of R's AC service
1.348 0.714 2.003 1.384 1.163 1.095
Environmental Stewardship was a main focus of R's AC service
0.637 0.924 0.608 1.474 0.763 1.587
Economic Opportunity was a main focus of R's AC service
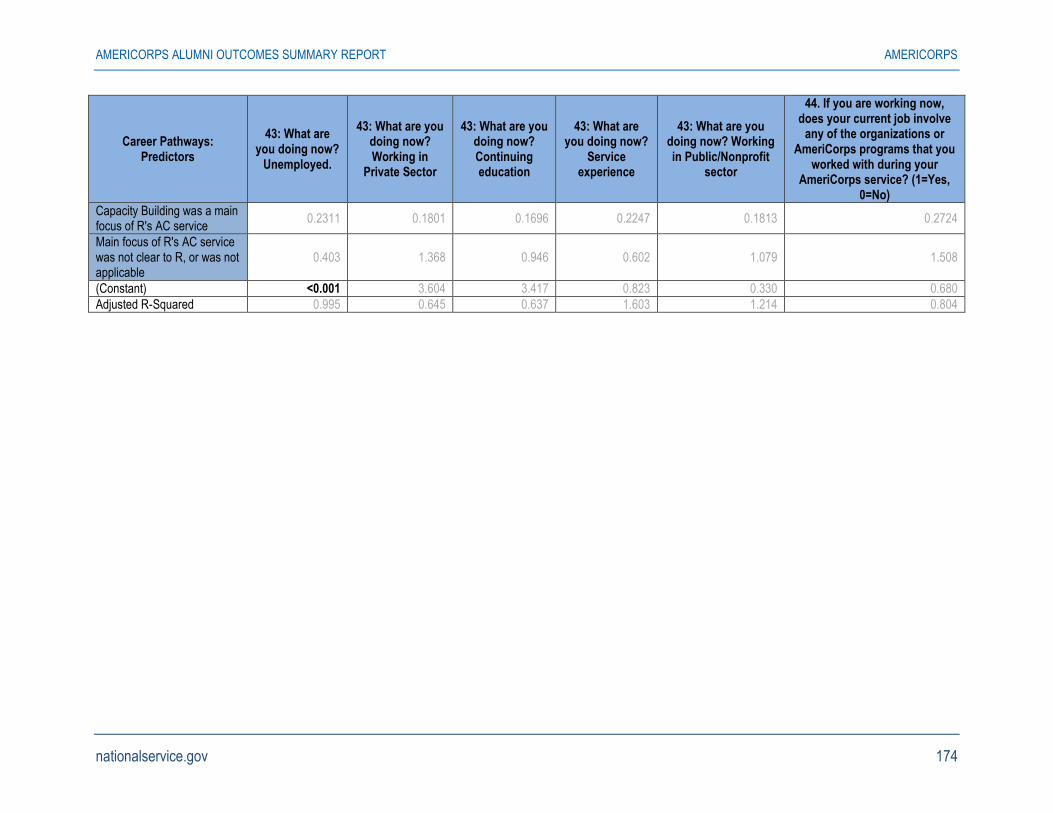
AMERICORPS ALUMNI OUTCOMES SUMMARY REPORT AMERICORPS
nationalservice.gov 174
Career Pathways: Predictors
43: What are you doing now?
Unemployed.
43: What are you doing now? Working in
Private Sector
43: What are you doing now? Continuing education
43: What are you doing now?
Service experience
43: What are you doing now? Working in Public/Nonprofit
sector
44. If you are working now, does your current job involve
any of the organizations or AmeriCorps programs that you
worked with during your AmeriCorps service? (1=Yes,
0=No)
Capacity Building was a main focus of R's AC service
0.2311 0.1801 0.1696 0.2247 0.1813 0.2724
Main focus of R's AC service was not clear to R, or was not applicable
0.403 1.368 0.946 0.602 1.079 1.508
(Constant) <0.001 3.604 3.417 0.823 0.330 0.680
Adjusted R-Squared 0.995 0.645 0.637 1.603 1.214 0.804

AMERICORPS ALUMNI OUTCOMES SUMMARY REPORT AMERICORPS
nationalservice.gov 175
Table D4: Career Pathways (Questions 45 to 46)
Career Pathways: Predictors
45. Do you include your AmeriCorps
experience on your resume? (1=Always
to 5=Never)
46: If and when you do include AmeriCorps on your resume, do
you include it in the “work experience” section or in the “volunteering or community service” section? Work only
46: If and when you do include AmeriCorps on your resume, do
you include it in the “work experience” section or in the “volunteering or community
service” section? Volunteer only
46: If and when you do include AmeriCorps on your resume, do
you include it in the “work experience” section or in the “volunteering or community
service” section? Both work and volunteer
Model Predictor Estimates Odds Ratio Regression Coefficient Regression Coefficient Regression Coefficient Demographic/Service
Factors
R was male (Female was reference)
0.007 1.648 1.381 0.500
R was other gender (female was reference group
-1.071 0.280 6.238 0.941
R was White (versus nonwhite, mixed)
0.317 1.528 0.325 1.173
R had less than 4 year degree at the time of the survey
0.202 0.473 1.796 1.334
R completed last term of service
0.116 0.620 0.805 2.234
R was a full-time volunteer last term of service
0.654 1.648 0.418 1.088
Used any education award amount
0.195 1.297 0.477 1.182
Email address was updated after service
-0.028 1.113 1.496 0.718
R was in ASN 2 Year group (VISTA 10 year is reference)
0.395 0.829 0.749 1.251
R was in ASN 5 Year group (VISTA 10 year is reference)
-0.038 0.797 1.359 0.965
R was in ASN 10 Year group (VISTA 10 year is reference)
-0.156 1.021 1.039 1.025
R was in NCCC 2 Year group (VISTA 10 year is reference)
0.243 0.979 0.861 0.819
R was in NCCC 5 Year group (VISTA 10 year is reference)
0.179 0.720 1.849 0.792
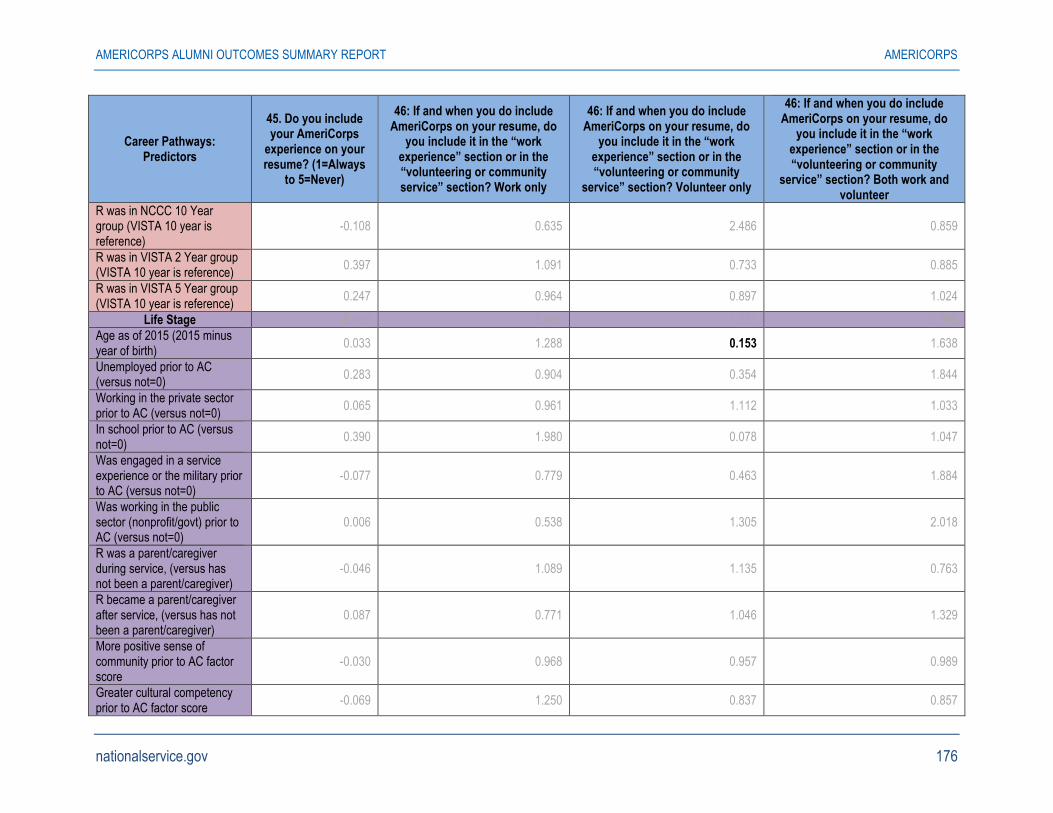
AMERICORPS ALUMNI OUTCOMES SUMMARY REPORT AMERICORPS
nationalservice.gov 176
Career Pathways: Predictors
45. Do you include your AmeriCorps
experience on your resume? (1=Always
to 5=Never)
46: If and when you do include AmeriCorps on your resume, do
you include it in the “work experience” section or in the “volunteering or community service” section? Work only
46: If and when you do include AmeriCorps on your resume, do
you include it in the “work experience” section or in the “volunteering or community
service” section? Volunteer only
46: If and when you do include AmeriCorps on your resume, do
you include it in the “work experience” section or in the “volunteering or community
service” section? Both work and volunteer
R was in NCCC 10 Year group (VISTA 10 year is reference)
-0.108 0.635 2.486 0.859
R was in VISTA 2 Year group (VISTA 10 year is reference)
0.397 1.091 0.733 0.885
R was in VISTA 5 Year group (VISTA 10 year is reference)
0.247 0.964 0.897 1.024
Life Stage -0.009 0.987 1.033 0.990
Age as of 2015 (2015 minus year of birth)
0.033 1.288 0.153 1.638
Unemployed prior to AC (versus not=0)
0.283 0.904 0.354 1.844
Working in the private sector prior to AC (versus not=0)
0.065 0.961 1.112 1.033
In school prior to AC (versus not=0)
0.390 1.980 0.078 1.047
Was engaged in a service experience or the military prior to AC (versus not=0)
-0.077 0.779 0.463 1.884
Was working in the public sector (nonprofit/govt) prior to AC (versus not=0)
0.006 0.538 1.305 2.018
R was a parent/caregiver during service, (versus has not been a parent/caregiver)
-0.046 1.089 1.135 0.763
R became a parent/caregiver after service, (versus has not been a parent/caregiver)
0.087 0.771 1.046 1.329
More positive sense of community prior to AC factor score
-0.030 0.968 0.957 0.989
Greater cultural competency prior to AC factor score
-0.069 1.250 0.837 0.857
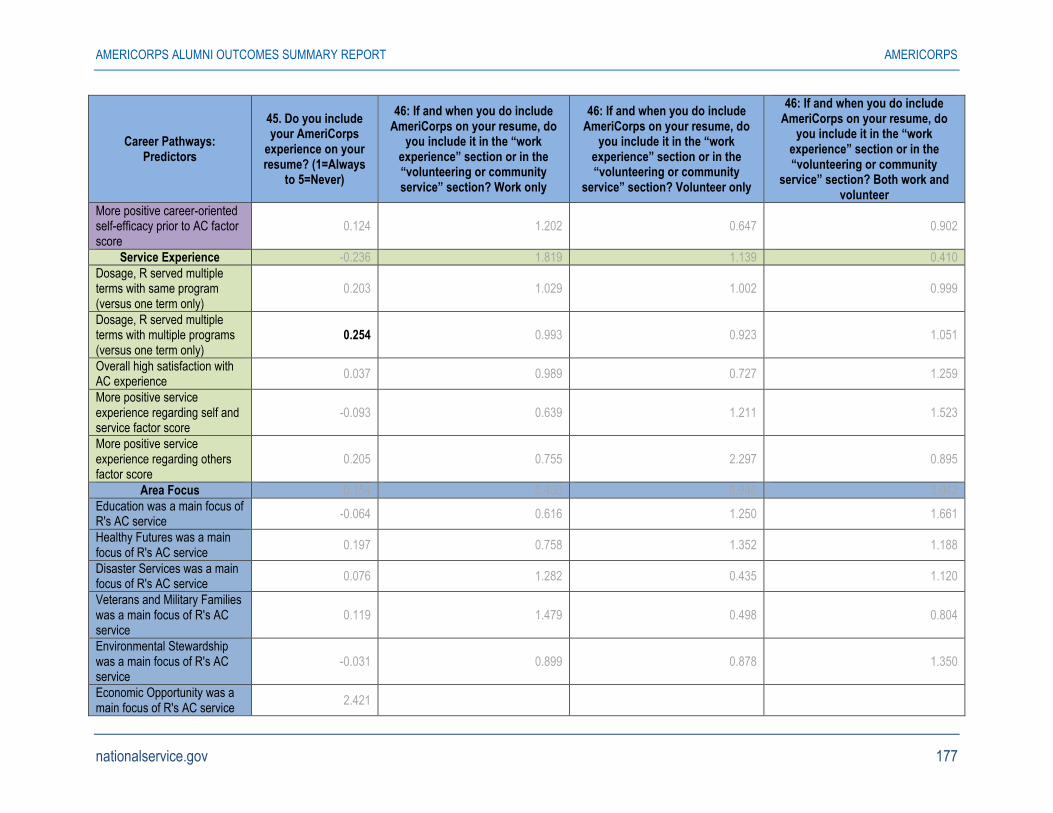
AMERICORPS ALUMNI OUTCOMES SUMMARY REPORT AMERICORPS
nationalservice.gov 177
Career Pathways: Predictors
45. Do you include your AmeriCorps
experience on your resume? (1=Always
to 5=Never)
46: If and when you do include AmeriCorps on your resume, do
you include it in the “work experience” section or in the “volunteering or community service” section? Work only
46: If and when you do include AmeriCorps on your resume, do
you include it in the “work experience” section or in the “volunteering or community
service” section? Volunteer only
46: If and when you do include AmeriCorps on your resume, do
you include it in the “work experience” section or in the “volunteering or community
service” section? Both work and volunteer
More positive career-oriented self-efficacy prior to AC factor score
0.124 1.202 0.647 0.902
Service Experience -0.236 1.819 1.139 0.410
Dosage, R served multiple terms with same program (versus one term only)
0.203 1.029 1.002 0.999
Dosage, R served multiple terms with multiple programs (versus one term only)
0.254 0.993 0.923 1.051
Overall high satisfaction with AC experience
0.037 0.989 0.727 1.259
More positive service experience regarding self and service factor score
-0.093 0.639 1.211 1.523
More positive service experience regarding others factor score
0.205 0.755 2.297 0.895
Area Focus -0.154 0.450 0.946 3.042
Education was a main focus of R's AC service
-0.064 0.616 1.250 1.661
Healthy Futures was a main focus of R's AC service
0.197 0.758 1.352 1.188
Disaster Services was a main focus of R's AC service
0.076 1.282 0.435 1.120
Veterans and Military Families was a main focus of R's AC service
0.119 1.479 0.498 0.804
Environmental Stewardship was a main focus of R's AC service
-0.031 0.899 0.878 1.350
Economic Opportunity was a main focus of R's AC service
2.421

AMERICORPS ALUMNI OUTCOMES SUMMARY REPORT AMERICORPS
nationalservice.gov 178
Career Pathways: Predictors
45. Do you include your AmeriCorps
experience on your resume? (1=Always
to 5=Never)
46: If and when you do include AmeriCorps on your resume, do
you include it in the “work experience” section or in the “volunteering or community service” section? Work only
46: If and when you do include AmeriCorps on your resume, do
you include it in the “work experience” section or in the “volunteering or community
service” section? Volunteer only
46: If and when you do include AmeriCorps on your resume, do
you include it in the “work experience” section or in the “volunteering or community
service” section? Both work and volunteer
Capacity Building was a main focus of R's AC service
0.2833 0.1743 0.291 0.1519
Main focus of R's AC service was not clear to R, or was not applicable
0.007 1.648 1.381 0.500
(Constant) -1.071 0.280 6.238 0.941
Adjusted R-Squared 0.317 1.528 0.325 1.173
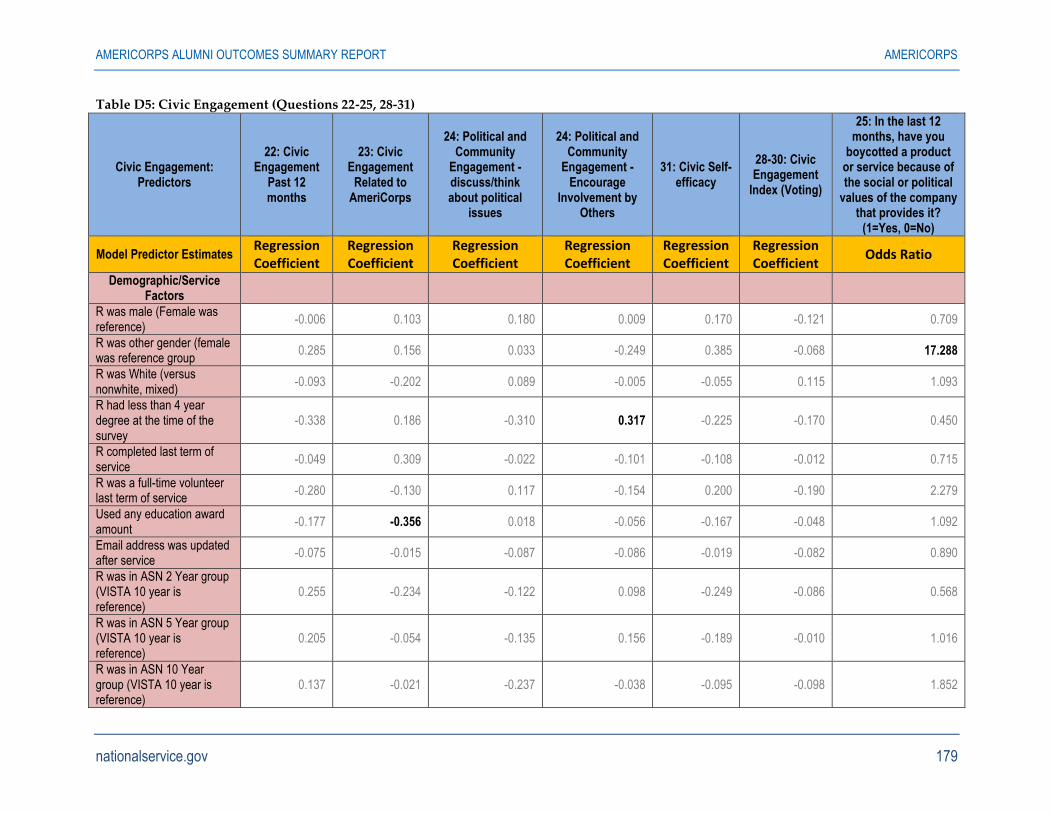
AMERICORPS ALUMNI OUTCOMES SUMMARY REPORT AMERICORPS
nationalservice.gov 179
Table D5: Civic Engagement (Questions 22-25, 28-31)
Civic Engagement: Predictors
22: Civic Engagement
Past 12 months
23: Civic Engagement
Related to AmeriCorps
24: Political and Community
Engagement - discuss/think about political
issues
24: Political and Community
Engagement - Encourage
Involvement by Others
31: Civic Self-efficacy
28-30: Civic Engagement
Index (Voting)
25: In the last 12 months, have you
boycotted a product or service because of the social or political
values of the company that provides it?
(1=Yes, 0=No)
Model Predictor Estimates Regression Coefficient
Regression Coefficient
Regression Coefficient
Regression Coefficient
Regression Coefficient
Regression Coefficient
Odds Ratio
Demographic/Service Factors
R was male (Female was reference)
-0.006 0.103 0.180 0.009 0.170 -0.121 0.709
R was other gender (female was reference group
0.285 0.156 0.033 -0.249 0.385 -0.068 17.288
R was White (versus nonwhite, mixed)
-0.093 -0.202 0.089 -0.005 -0.055 0.115 1.093
R had less than 4 year degree at the time of the survey
-0.338 0.186 -0.310 0.317 -0.225 -0.170 0.450
R completed last term of service
-0.049 0.309 -0.022 -0.101 -0.108 -0.012 0.715
R was a full-time volunteer last term of service
-0.280 -0.130 0.117 -0.154 0.200 -0.190 2.279
Used any education award amount
-0.177 -0.356 0.018 -0.056 -0.167 -0.048 1.092
Email address was updated after service
-0.075 -0.015 -0.087 -0.086 -0.019 -0.082 0.890
R was in ASN 2 Year group (VISTA 10 year is reference)
0.255 -0.234 -0.122 0.098 -0.249 -0.086 0.568
R was in ASN 5 Year group (VISTA 10 year is reference)
0.205 -0.054 -0.135 0.156 -0.189 -0.010 1.016
R was in ASN 10 Year group (VISTA 10 year is reference)
0.137 -0.021 -0.237 -0.038 -0.095 -0.098 1.852
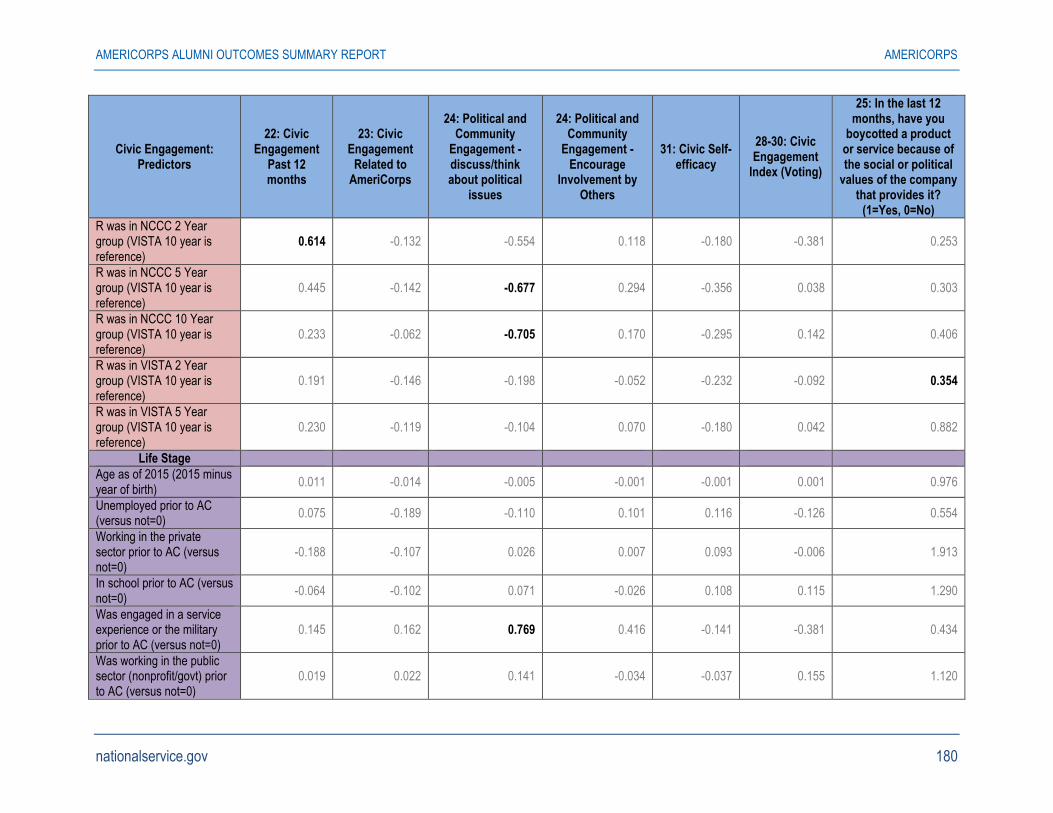
AMERICORPS ALUMNI OUTCOMES SUMMARY REPORT AMERICORPS
nationalservice.gov 180
Civic Engagement: Predictors
22: Civic Engagement
Past 12 months
23: Civic Engagement
Related to AmeriCorps
24: Political and Community
Engagement - discuss/think about political
issues
24: Political and Community
Engagement - Encourage
Involvement by Others
31: Civic Self-efficacy
28-30: Civic Engagement
Index (Voting)
25: In the last 12 months, have you
boycotted a product or service because of the social or political
values of the company that provides it?
(1=Yes, 0=No)
R was in NCCC 2 Year group (VISTA 10 year is reference)
0.614 -0.132 -0.554 0.118 -0.180 -0.381 0.253
R was in NCCC 5 Year group (VISTA 10 year is reference)
0.445 -0.142 -0.677 0.294 -0.356 0.038 0.303
R was in NCCC 10 Year group (VISTA 10 year is reference)
0.233 -0.062 -0.705 0.170 -0.295 0.142 0.406
R was in VISTA 2 Year group (VISTA 10 year is reference)
0.191 -0.146 -0.198 -0.052 -0.232 -0.092 0.354
R was in VISTA 5 Year group (VISTA 10 year is reference)
0.230 -0.119 -0.104 0.070 -0.180 0.042 0.882
Life Stage
Age as of 2015 (2015 minus year of birth)
0.011 -0.014 -0.005 -0.001 -0.001 0.001 0.976
Unemployed prior to AC (versus not=0)
0.075 -0.189 -0.110 0.101 0.116 -0.126 0.554
Working in the private sector prior to AC (versus not=0)
-0.188 -0.107 0.026 0.007 0.093 -0.006 1.913
In school prior to AC (versus not=0)
-0.064 -0.102 0.071 -0.026 0.108 0.115 1.290
Was engaged in a service experience or the military prior to AC (versus not=0)
0.145 0.162 0.769 0.416 -0.141 -0.381 0.434
Was working in the public sector (nonprofit/govt) prior to AC (versus not=0)
0.019 0.022 0.141 -0.034 -0.037 0.155 1.120
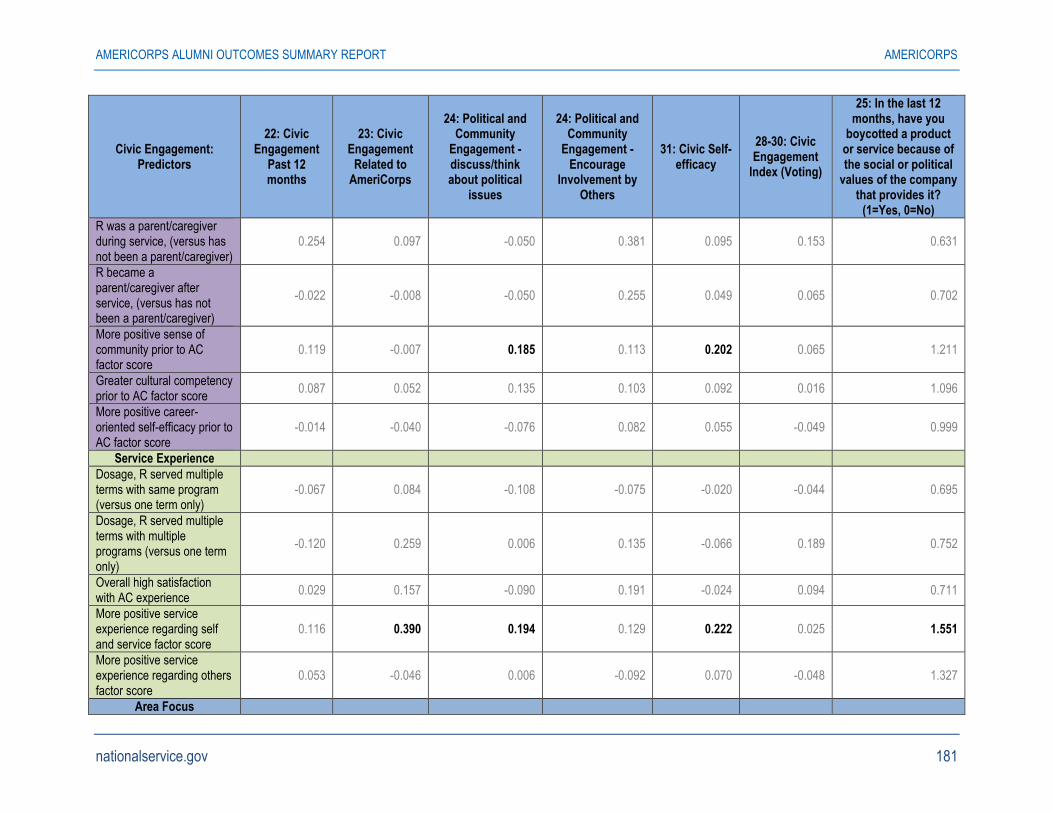
AMERICORPS ALUMNI OUTCOMES SUMMARY REPORT AMERICORPS
nationalservice.gov 181
Civic Engagement: Predictors
22: Civic Engagement
Past 12 months
23: Civic Engagement
Related to AmeriCorps
24: Political and Community
Engagement - discuss/think about political
issues
24: Political and Community
Engagement - Encourage
Involvement by Others
31: Civic Self-efficacy
28-30: Civic Engagement
Index (Voting)
25: In the last 12 months, have you
boycotted a product or service because of the social or political
values of the company that provides it?
(1=Yes, 0=No)
R was a parent/caregiver during service, (versus has not been a parent/caregiver)
0.254 0.097 -0.050 0.381 0.095 0.153 0.631
R became a parent/caregiver after service, (versus has not been a parent/caregiver)
-0.022 -0.008 -0.050 0.255 0.049 0.065 0.702
More positive sense of community prior to AC factor score
0.119 -0.007 0.185 0.113 0.202 0.065 1.211
Greater cultural competency prior to AC factor score
0.087 0.052 0.135 0.103 0.092 0.016 1.096
More positive career-oriented self-efficacy prior to AC factor score
-0.014 -0.040 -0.076 0.082 0.055 -0.049 0.999
Service Experience
Dosage, R served multiple terms with same program (versus one term only)
-0.067 0.084 -0.108 -0.075 -0.020 -0.044 0.695
Dosage, R served multiple terms with multiple programs (versus one term only)
-0.120 0.259 0.006 0.135 -0.066 0.189 0.752
Overall high satisfaction with AC experience
0.029 0.157 -0.090 0.191 -0.024 0.094 0.711
More positive service experience regarding self and service factor score
0.116 0.390 0.194 0.129 0.222 0.025 1.551
More positive service experience regarding others factor score
0.053 -0.046 0.006 -0.092 0.070 -0.048 1.327
Area Focus
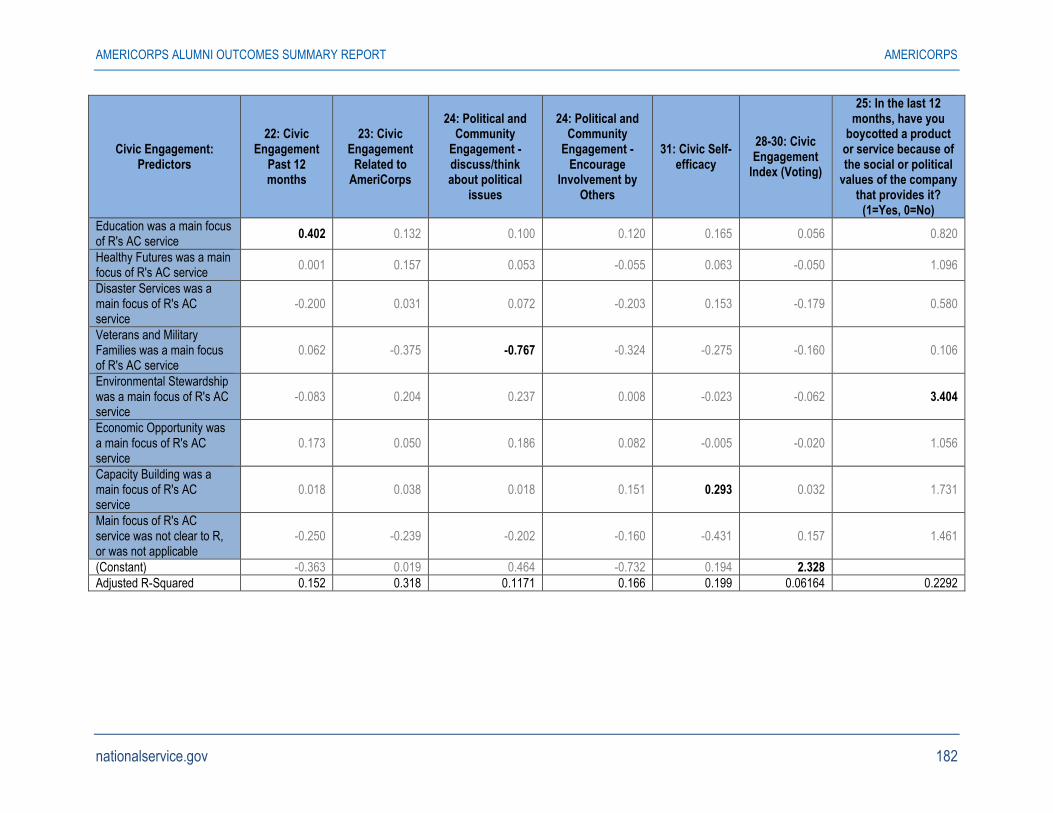
AMERICORPS ALUMNI OUTCOMES SUMMARY REPORT AMERICORPS
nationalservice.gov 182
Civic Engagement: Predictors
22: Civic Engagement
Past 12 months
23: Civic Engagement
Related to AmeriCorps
24: Political and Community
Engagement - discuss/think about political
issues
24: Political and Community
Engagement - Encourage
Involvement by Others
31: Civic Self-efficacy
28-30: Civic Engagement
Index (Voting)
25: In the last 12 months, have you
boycotted a product or service because of the social or political
values of the company that provides it?
(1=Yes, 0=No)
Education was a main focus of R's AC service
0.402 0.132 0.100 0.120 0.165 0.056 0.820
Healthy Futures was a main focus of R's AC service
0.001 0.157 0.053 -0.055 0.063 -0.050 1.096
Disaster Services was a main focus of R's AC service
-0.200 0.031 0.072 -0.203 0.153 -0.179 0.580
Veterans and Military Families was a main focus of R's AC service
0.062 -0.375 -0.767 -0.324 -0.275 -0.160 0.106
Environmental Stewardship was a main focus of R's AC service
-0.083 0.204 0.237 0.008 -0.023 -0.062 3.404
Economic Opportunity was a main focus of R's AC service
0.173 0.050 0.186 0.082 -0.005 -0.020 1.056
Capacity Building was a main focus of R's AC service
0.018 0.038 0.018 0.151 0.293 0.032 1.731
Main focus of R's AC service was not clear to R, or was not applicable
-0.250 -0.239 -0.202 -0.160 -0.431 0.157 1.461
(Constant) -0.363 0.019 0.464 -0.732 0.194 2.328
Adjusted R-Squared 0.152 0.318 0.1171 0.166 0.199 0.06164 0.2292
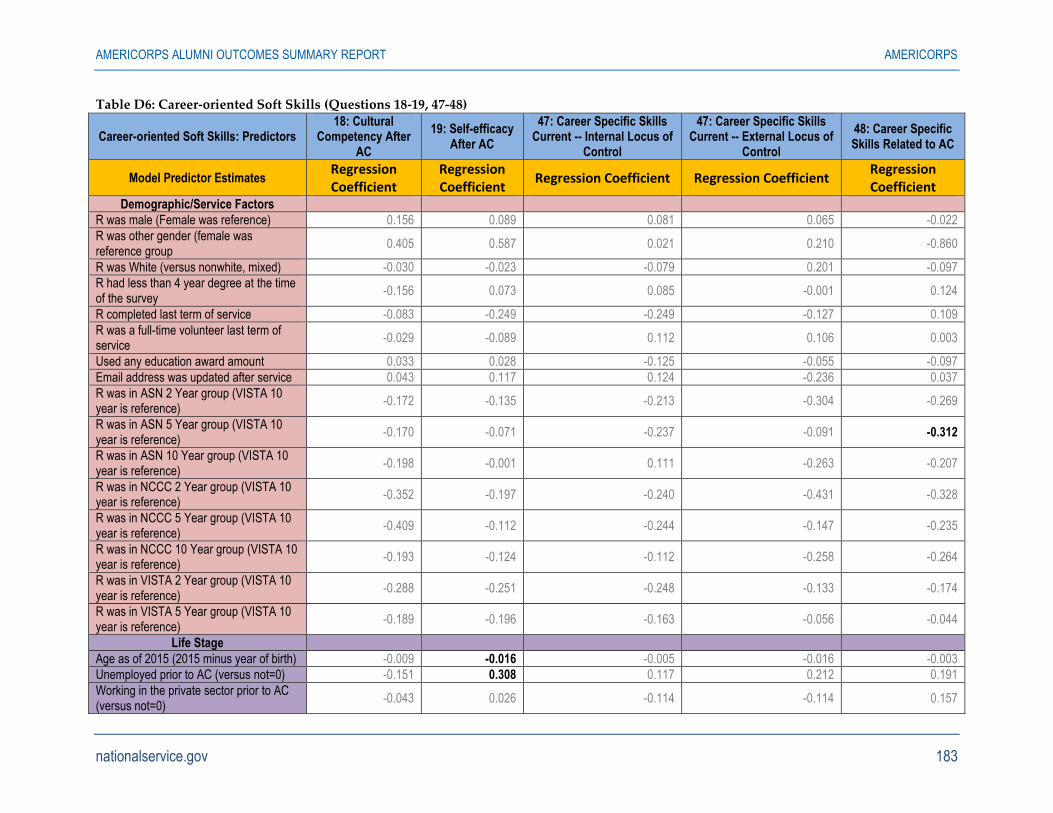
AMERICORPS ALUMNI OUTCOMES SUMMARY REPORT AMERICORPS
nationalservice.gov 183
Table D6: Career-oriented Soft Skills (Questions 18-19, 47-48)
Career-oriented Soft Skills: Predictors 18: Cultural
Competency After AC
19: Self-efficacy After AC
47: Career Specific Skills Current -- Internal Locus of
Control
47: Career Specific Skills Current -- External Locus of
Control
48: Career Specific Skills Related to AC
Model Predictor Estimates Regression Coefficient
Regression Coefficient
Regression Coefficient Regression Coefficient Regression Coefficient
Demographic/Service Factors
R was male (Female was reference) 0.156 0.089 0.081 0.065 -0.022
R was other gender (female was reference group
0.405 0.587 0.021 0.210 -0.860
R was White (versus nonwhite, mixed) -0.030 -0.023 -0.079 0.201 -0.097
R had less than 4 year degree at the time of the survey
-0.156 0.073 0.085 -0.001 0.124
R completed last term of service -0.083 -0.249 -0.249 -0.127 0.109
R was a full-time volunteer last term of service
-0.029 -0.089 0.112 0.106 0.003
Used any education award amount 0.033 0.028 -0.125 -0.055 -0.097
Email address was updated after service 0.043 0.117 0.124 -0.236 0.037
R was in ASN 2 Year group (VISTA 10 year is reference)
-0.172 -0.135 -0.213 -0.304 -0.269
R was in ASN 5 Year group (VISTA 10 year is reference)
-0.170 -0.071 -0.237 -0.091 -0.312
R was in ASN 10 Year group (VISTA 10 year is reference)
-0.198 -0.001 0.111 -0.263 -0.207
R was in NCCC 2 Year group (VISTA 10 year is reference)
-0.352 -0.197 -0.240 -0.431 -0.328
R was in NCCC 5 Year group (VISTA 10 year is reference)
-0.409 -0.112 -0.244 -0.147 -0.235
R was in NCCC 10 Year group (VISTA 10 year is reference)
-0.193 -0.124 -0.112 -0.258 -0.264
R was in VISTA 2 Year group (VISTA 10 year is reference)
-0.288 -0.251 -0.248 -0.133 -0.174
R was in VISTA 5 Year group (VISTA 10 year is reference)
-0.189 -0.196 -0.163 -0.056 -0.044
Life Stage
Age as of 2015 (2015 minus year of birth) -0.009 -0.016 -0.005 -0.016 -0.003
Unemployed prior to AC (versus not=0) -0.151 0.308 0.117 0.212 0.191
Working in the private sector prior to AC (versus not=0)
-0.043 0.026 -0.114 -0.114 0.157
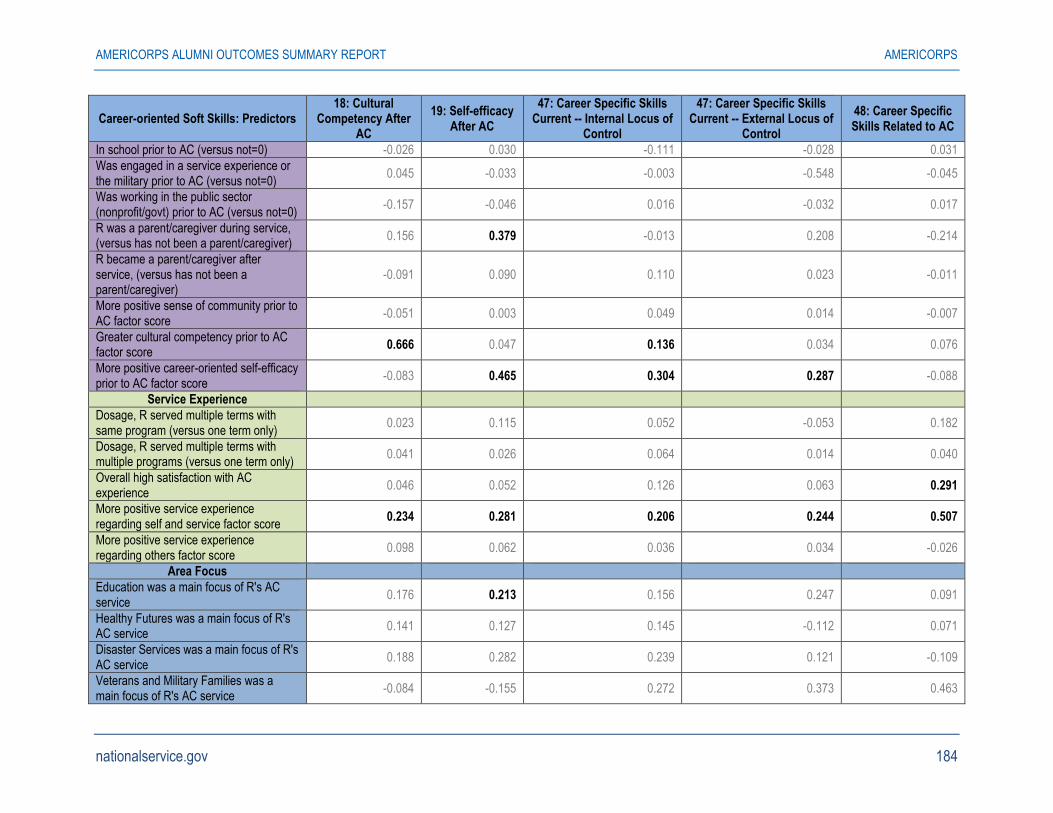
AMERICORPS ALUMNI OUTCOMES SUMMARY REPORT AMERICORPS
nationalservice.gov 184
Career-oriented Soft Skills: Predictors 18: Cultural
Competency After AC
19: Self-efficacy After AC
47: Career Specific Skills Current -- Internal Locus of
Control
47: Career Specific Skills Current -- External Locus of
Control
48: Career Specific Skills Related to AC
In school prior to AC (versus not=0) -0.026 0.030 -0.111 -0.028 0.031
Was engaged in a service experience or the military prior to AC (versus not=0)
0.045 -0.033 -0.003 -0.548 -0.045
Was working in the public sector (nonprofit/govt) prior to AC (versus not=0)
-0.157 -0.046 0.016 -0.032 0.017
R was a parent/caregiver during service, (versus has not been a parent/caregiver)
0.156 0.379 -0.013 0.208 -0.214
R became a parent/caregiver after service, (versus has not been a parent/caregiver)
-0.091 0.090 0.110 0.023 -0.011
More positive sense of community prior to AC factor score
-0.051 0.003 0.049 0.014 -0.007
Greater cultural competency prior to AC factor score
0.666 0.047 0.136 0.034 0.076
More positive career-oriented self-efficacy prior to AC factor score
-0.083 0.465 0.304 0.287 -0.088
Service Experience
Dosage, R served multiple terms with same program (versus one term only)
0.023 0.115 0.052 -0.053 0.182
Dosage, R served multiple terms with multiple programs (versus one term only)
0.041 0.026 0.064 0.014 0.040
Overall high satisfaction with AC experience
0.046 0.052 0.126 0.063 0.291
More positive service experience regarding self and service factor score
0.234 0.281 0.206 0.244 0.507
More positive service experience regarding others factor score
0.098 0.062 0.036 0.034 -0.026
Area Focus
Education was a main focus of R's AC service
0.176 0.213 0.156 0.247 0.091
Healthy Futures was a main focus of R's AC service
0.141 0.127 0.145 -0.112 0.071
Disaster Services was a main focus of R's AC service
0.188 0.282 0.239 0.121 -0.109
Veterans and Military Families was a main focus of R's AC service
-0.084 -0.155 0.272 0.373 0.463
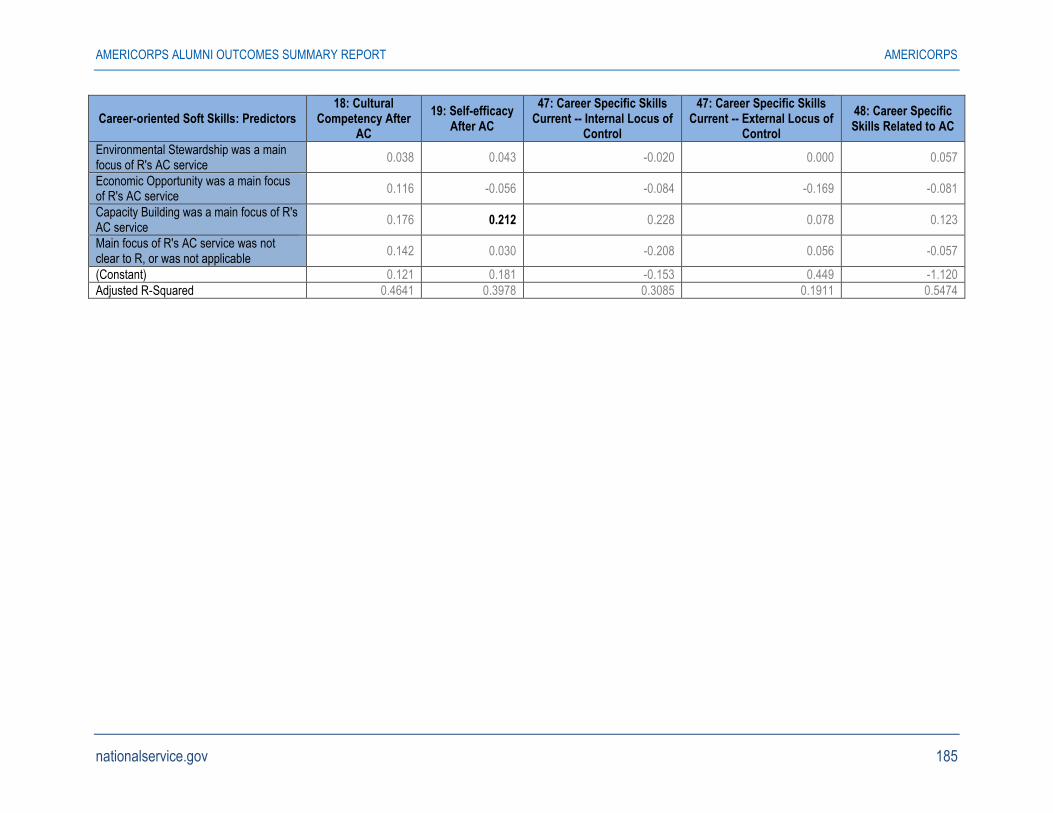
AMERICORPS ALUMNI OUTCOMES SUMMARY REPORT AMERICORPS
nationalservice.gov 185
Career-oriented Soft Skills: Predictors 18: Cultural
Competency After AC
19: Self-efficacy After AC
47: Career Specific Skills Current -- Internal Locus of
Control
47: Career Specific Skills Current -- External Locus of
Control
48: Career Specific Skills Related to AC
Environmental Stewardship was a main focus of R's AC service
0.038 0.043 -0.020 0.000 0.057
Economic Opportunity was a main focus of R's AC service
0.116 -0.056 -0.084 -0.169 -0.081
Capacity Building was a main focus of R's AC service
0.176 0.212 0.228 0.078 0.123
Main focus of R's AC service was not clear to R, or was not applicable
0.142 0.030 -0.208 0.056 -0.057
(Constant) 0.121 0.181 -0.153 0.449 -1.120
Adjusted R-Squared 0.4641 0.3978 0.3085 0.1911 0.5474
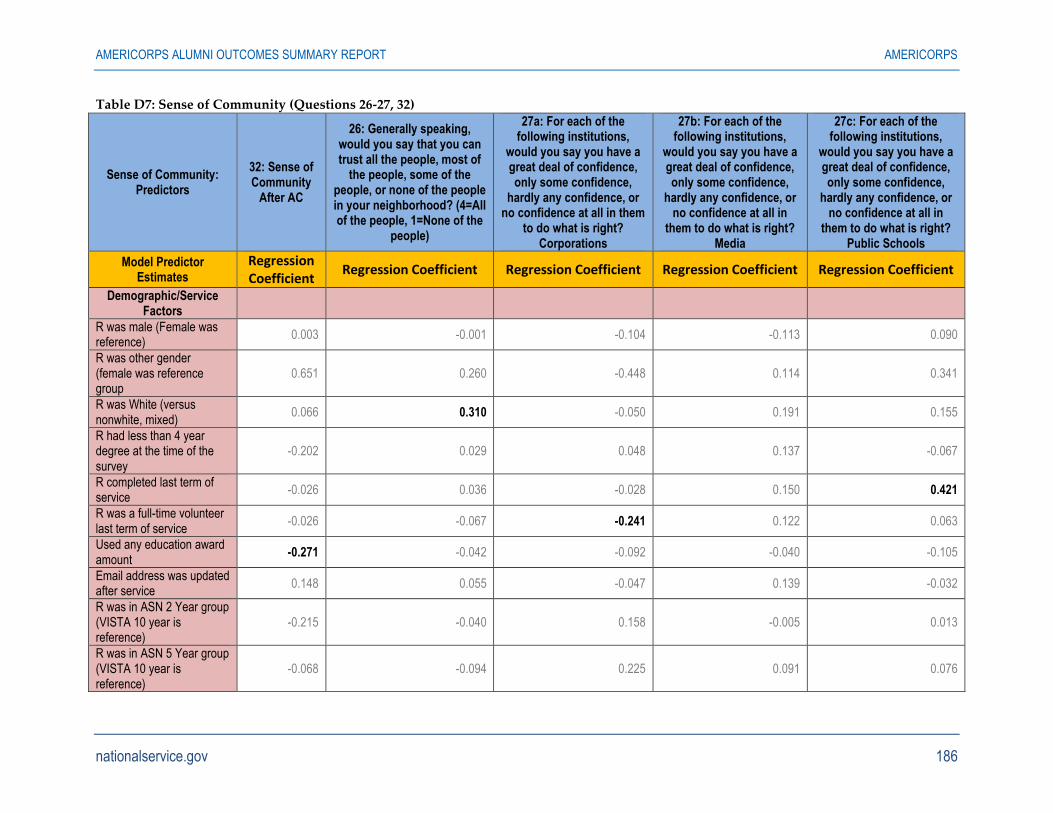
AMERICORPS ALUMNI OUTCOMES SUMMARY REPORT AMERICORPS
nationalservice.gov 186
Table D7: Sense of Community (Questions 26-27, 32)
Sense of Community: Predictors
32: Sense of Community
After AC
26: Generally speaking, would you say that you can trust all the people, most of
the people, some of the people, or none of the people in your neighborhood? (4=All of the people, 1=None of the
people)
27a: For each of the following institutions,
would you say you have a great deal of confidence, only some confidence,
hardly any confidence, or no confidence at all in them
to do what is right? Corporations
27b: For each of the following institutions,
would you say you have a great deal of confidence, only some confidence,
hardly any confidence, or no confidence at all in
them to do what is right? Media
27c: For each of the following institutions,
would you say you have a great deal of confidence, only some confidence,
hardly any confidence, or no confidence at all in
them to do what is right? Public Schools
Model Predictor Estimates
Regression Coefficient
Regression Coefficient Regression Coefficient Regression Coefficient Regression Coefficient
Demographic/Service Factors
R was male (Female was reference)
0.003 -0.001 -0.104 -0.113 0.090
R was other gender (female was reference group
0.651 0.260 -0.448 0.114 0.341
R was White (versus nonwhite, mixed)
0.066 0.310 -0.050 0.191 0.155
R had less than 4 year degree at the time of the survey
-0.202 0.029 0.048 0.137 -0.067
R completed last term of service
-0.026 0.036 -0.028 0.150 0.421
R was a full-time volunteer last term of service
-0.026 -0.067 -0.241 0.122 0.063
Used any education award amount
-0.271 -0.042 -0.092 -0.040 -0.105
Email address was updated after service
0.148 0.055 -0.047 0.139 -0.032
R was in ASN 2 Year group (VISTA 10 year is reference)
-0.215 -0.040 0.158 -0.005 0.013
R was in ASN 5 Year group (VISTA 10 year is reference)
-0.068 -0.094 0.225 0.091 0.076
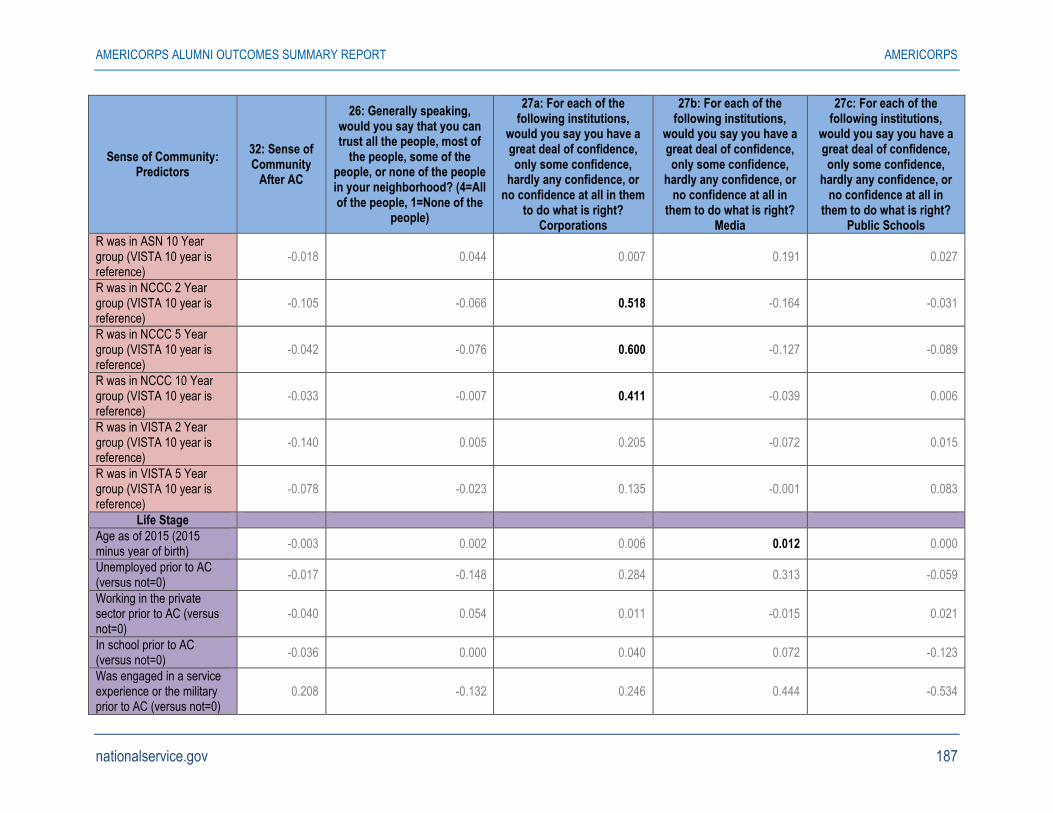
AMERICORPS ALUMNI OUTCOMES SUMMARY REPORT AMERICORPS
nationalservice.gov 187
Sense of Community: Predictors
32: Sense of Community
After AC
26: Generally speaking, would you say that you can trust all the people, most of
the people, some of the people, or none of the people in your neighborhood? (4=All of the people, 1=None of the
people)
27a: For each of the following institutions,
would you say you have a great deal of confidence, only some confidence,
hardly any confidence, or no confidence at all in them
to do what is right? Corporations
27b: For each of the following institutions,
would you say you have a great deal of confidence, only some confidence,
hardly any confidence, or no confidence at all in
them to do what is right? Media
27c: For each of the following institutions,
would you say you have a great deal of confidence, only some confidence,
hardly any confidence, or no confidence at all in
them to do what is right? Public Schools
R was in ASN 10 Year group (VISTA 10 year is reference)
-0.018 0.044 0.007 0.191 0.027
R was in NCCC 2 Year group (VISTA 10 year is reference)
-0.105 -0.066 0.518 -0.164 -0.031
R was in NCCC 5 Year group (VISTA 10 year is reference)
-0.042 -0.076 0.600 -0.127 -0.089
R was in NCCC 10 Year group (VISTA 10 year is reference)
-0.033 -0.007 0.411 -0.039 0.006
R was in VISTA 2 Year group (VISTA 10 year is reference)
-0.140 0.005 0.205 -0.072 0.015
R was in VISTA 5 Year group (VISTA 10 year is reference)
-0.078 -0.023 0.135 -0.001 0.083
Life Stage
Age as of 2015 (2015 minus year of birth)
-0.003 0.002 0.006 0.012 0.000
Unemployed prior to AC (versus not=0)
-0.017 -0.148 0.284 0.313 -0.059
Working in the private sector prior to AC (versus not=0)
-0.040 0.054 0.011 -0.015 0.021
In school prior to AC (versus not=0)
-0.036 0.000 0.040 0.072 -0.123
Was engaged in a service experience or the military prior to AC (versus not=0)
0.208 -0.132 0.246 0.444 -0.534
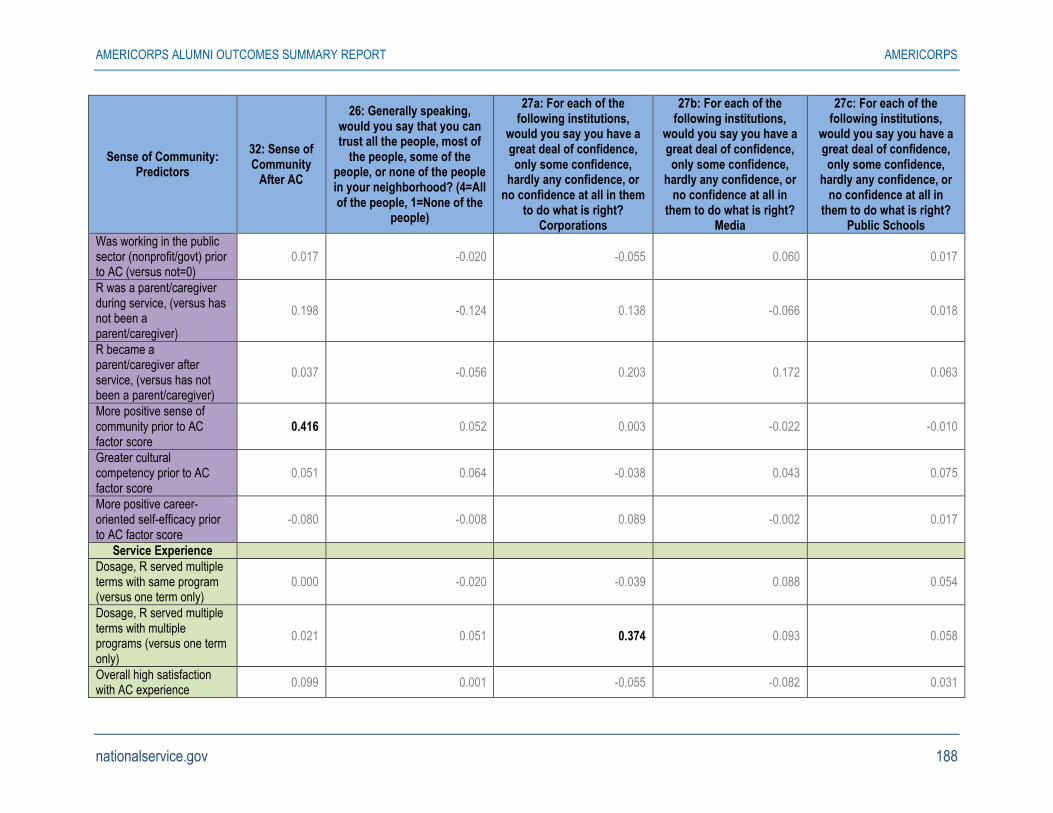
AMERICORPS ALUMNI OUTCOMES SUMMARY REPORT AMERICORPS
nationalservice.gov 188
Sense of Community: Predictors
32: Sense of Community
After AC
26: Generally speaking, would you say that you can trust all the people, most of
the people, some of the people, or none of the people in your neighborhood? (4=All of the people, 1=None of the
people)
27a: For each of the following institutions,
would you say you have a great deal of confidence, only some confidence,
hardly any confidence, or no confidence at all in them
to do what is right? Corporations
27b: For each of the following institutions,
would you say you have a great deal of confidence, only some confidence,
hardly any confidence, or no confidence at all in
them to do what is right? Media
27c: For each of the following institutions,
would you say you have a great deal of confidence, only some confidence,
hardly any confidence, or no confidence at all in
them to do what is right? Public Schools
Was working in the public sector (nonprofit/govt) prior to AC (versus not=0)
0.017 -0.020 -0.055 0.060 0.017
R was a parent/caregiver during service, (versus has not been a parent/caregiver)
0.198 -0.124 0.138 -0.066 0.018
R became a parent/caregiver after service, (versus has not been a parent/caregiver)
0.037 -0.056 0.203 0.172 0.063
More positive sense of community prior to AC factor score
0.416 0.052 0.003 -0.022 -0.010
Greater cultural competency prior to AC factor score
0.051 0.064 -0.038 0.043 0.075
More positive career-oriented self-efficacy prior to AC factor score
-0.080 -0.008 0.089 -0.002 0.017
Service Experience
Dosage, R served multiple terms with same program (versus one term only)
0.000 -0.020 -0.039 0.088 0.054
Dosage, R served multiple terms with multiple programs (versus one term only)
0.021 0.051 0.374 0.093 0.058
Overall high satisfaction with AC experience
0.099 0.001 -0.055 -0.082 0.031
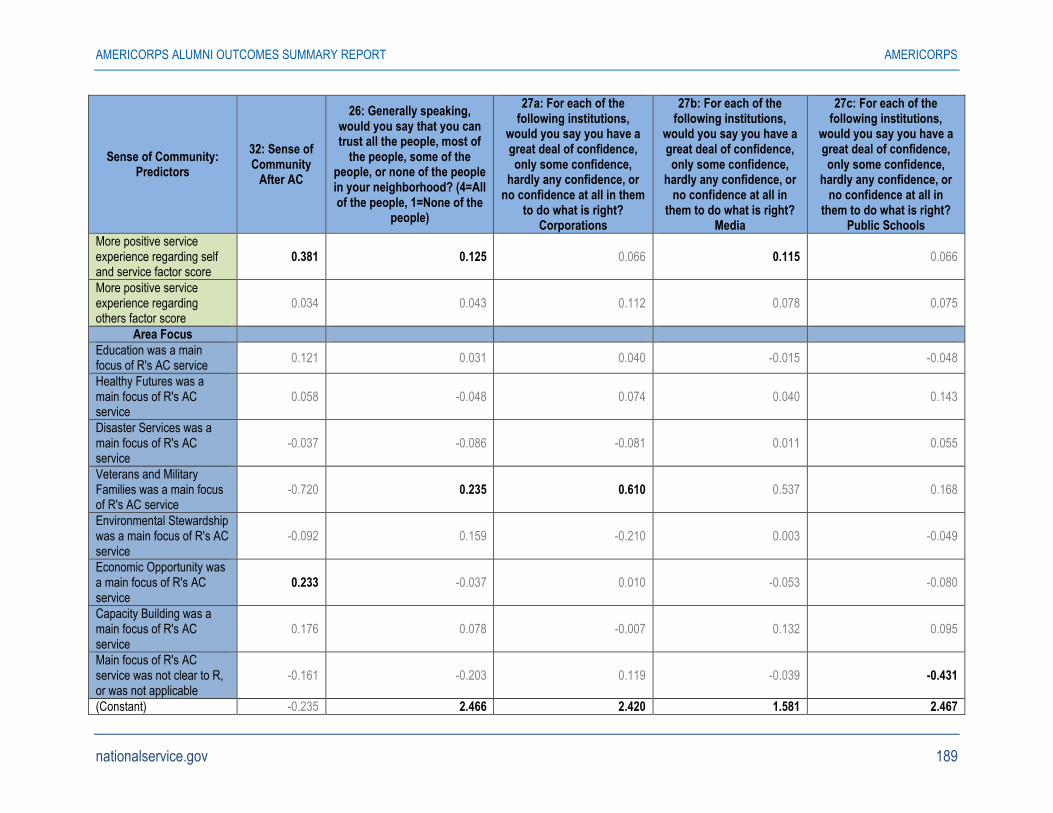
AMERICORPS ALUMNI OUTCOMES SUMMARY REPORT AMERICORPS
nationalservice.gov 189
Sense of Community: Predictors
32: Sense of Community
After AC
26: Generally speaking, would you say that you can trust all the people, most of
the people, some of the people, or none of the people in your neighborhood? (4=All of the people, 1=None of the
people)
27a: For each of the following institutions,
would you say you have a great deal of confidence, only some confidence,
hardly any confidence, or no confidence at all in them
to do what is right? Corporations
27b: For each of the following institutions,
would you say you have a great deal of confidence, only some confidence,
hardly any confidence, or no confidence at all in
them to do what is right? Media
27c: For each of the following institutions,
would you say you have a great deal of confidence, only some confidence,
hardly any confidence, or no confidence at all in
them to do what is right? Public Schools
More positive service experience regarding self and service factor score
0.381 0.125 0.066 0.115 0.066
More positive service experience regarding others factor score
0.034 0.043 0.112 0.078 0.075
Area Focus
Education was a main focus of R's AC service
0.121 0.031 0.040 -0.015 -0.048
Healthy Futures was a main focus of R's AC service
0.058 -0.048 0.074 0.040 0.143
Disaster Services was a main focus of R's AC service
-0.037 -0.086 -0.081 0.011 0.055
Veterans and Military Families was a main focus of R's AC service
-0.720 0.235 0.610 0.537 0.168
Environmental Stewardship was a main focus of R's AC service
-0.092 0.159 -0.210 0.003 -0.049
Economic Opportunity was a main focus of R's AC service
0.233 -0.037 0.010 -0.053 -0.080
Capacity Building was a main focus of R's AC service
0.176 0.078 -0.007 0.132 0.095
Main focus of R's AC service was not clear to R, or was not applicable
-0.161 -0.203 0.119 -0.039 -0.431
(Constant) -0.235 2.466 2.420 1.581 2.467
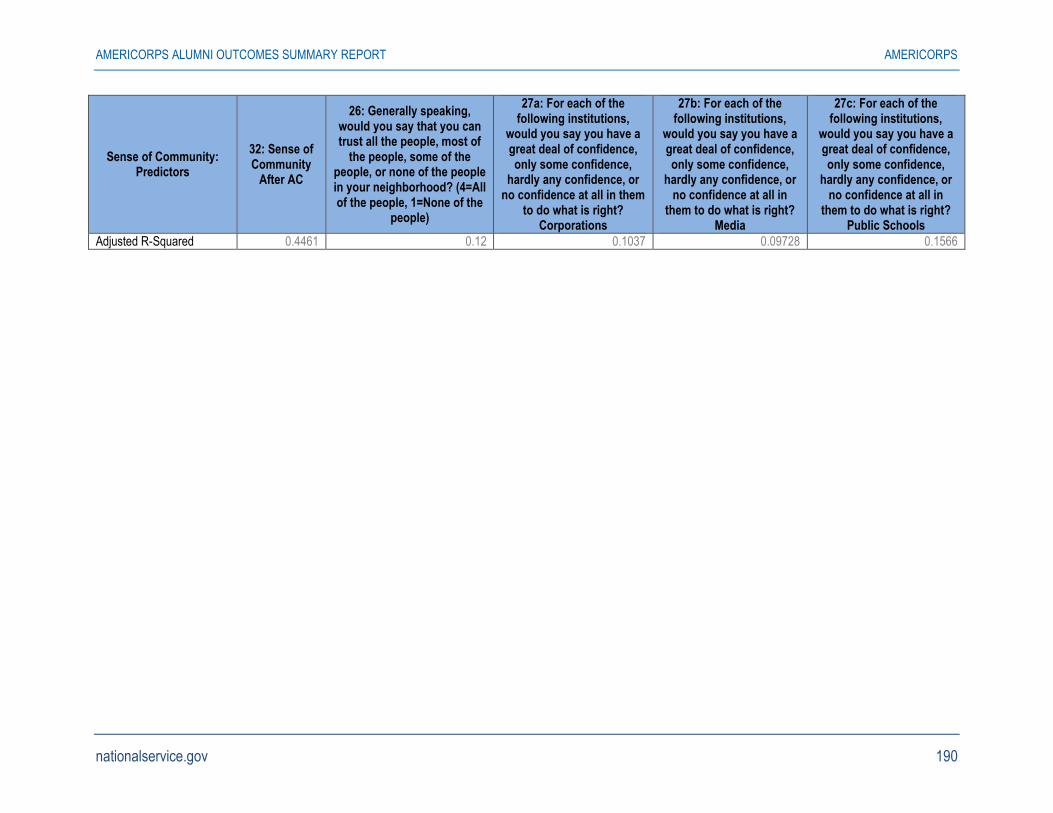
AMERICORPS ALUMNI OUTCOMES SUMMARY REPORT AMERICORPS
nationalservice.gov 190
Sense of Community: Predictors
32: Sense of Community
After AC
26: Generally speaking, would you say that you can trust all the people, most of
the people, some of the people, or none of the people in your neighborhood? (4=All of the people, 1=None of the
people)
27a: For each of the following institutions,
would you say you have a great deal of confidence, only some confidence,
hardly any confidence, or no confidence at all in them
to do what is right? Corporations
27b: For each of the following institutions,
would you say you have a great deal of confidence, only some confidence,
hardly any confidence, or no confidence at all in
them to do what is right? Media
27c: For each of the following institutions,
would you say you have a great deal of confidence, only some confidence,
hardly any confidence, or no confidence at all in
them to do what is right? Public Schools
Adjusted R-Squared 0.4461 0.12 0.1037 0.09728 0.1566